Embed Size (px)
Citation preview
IJCSNS International Journal of Computer Science and Network Security, VOL.11 No.2, February 2011
80
Manuscript received February 5, 2011 Manuscript revised February 20, 2011
To judge what color the subject watched by color effect on
brain activity
Huiran Zhang†, and Zheng Tang††
Graduate School of Innovative Life Science, University of Toyama,Toyama, 930-8555 Japan
Summary Moods are known to be changed by color. In order to observe the activity of the brain with the color stimulus, the event-related potential (ERP) and electroencephalogram (EEG) images are used to be analyzed. The ERP and EEG of alpha brainwave could be considered whether the person is under relaxation. In the other hand, the beta brainwave means the people represent arousal. In this paper, based on experiment data, we analyze the brain responses which come from color stimuli. The result gives us a measure to estimate the color stimulus. Key words: color stimulus, alpha brainwave, beta brainwave, event-related potential (ERP), electroencephalogram (EEG)
1. Introduction
Color is a fundamental aspect of human perception. It has been known that color also affect human`s spirit. Some researchers have proposed that red enhances cognitive task performance as compared with blue or green [1, 2]; others have shown exactly the opposite [3, 4]. The moods and behaviors can be changed by the colors [1]. In some researches, red is made linking to the highest level of hazard and also the highest level of compliance [5, 6]. In contrast, blue is often associated with openness, peace, and tranquility [e.g., ocean and sky [7]]. Because of this, different color has been shown to have different associations within the cognitive domain. From the physiological view, the brain activities are changed by color [3]. Color can activate an avoidance (versus approach) motivation and subsequently can enhance performance on detail-oriented (versus creative) cognitive tasks [8], so color give us different results of the brain activities changing [9, 10]. In the last years, the researchers wanted to find out how to conclude what colors the people get from the brain activities. Generally, we used the electrodes on visual area (V1, V2, and V3) to get the brain activities. Most researches focused on the beginning of stimulus happened. The brain has responses between 100ms and 500ms after the stimulus happened (visual response latency) [10, 11, 12]. In this work, we would like to talk about the brain activities during the stimulus started for a long time (>1s, in general, it is well
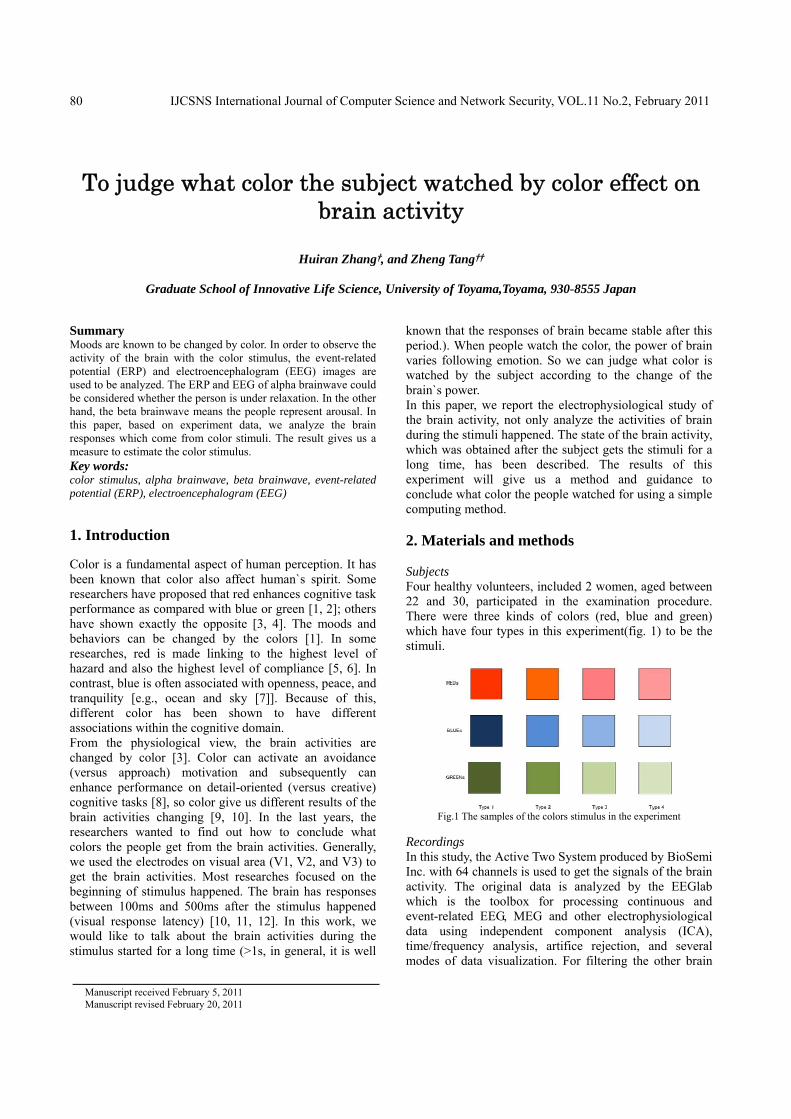
known that the responses of brain became stable after this period.). When people watch the color, the power of brain varies following emotion. So we can judge what color is watched by the subject according to the change of the brain`s power. In this paper, we report the electrophysiological study of the brain activity, not only analyze the activities of brain during the stimuli happened. The state of the brain activity, which was obtained after the subject gets the stimuli for a long time, has been described. The results of this experiment will give us a method and guidance to conclude what color the people watched for using a simple computing method. 2. Materials and methods Subjects Four healthy volunteers, included 2 women, aged between 22 and 30, participated in the examination procedure. There were three kinds of colors (red, blue and green) which have four types in this experiment(fig. 1) to be the stimuli.
Fig.1 The samples of the colors stimulus in the experiment
Recordings In this study, the Active Two System produced by BioSemi Inc. with 64 channels is used to get the signals of the brain activity. The original data is analyzed by the EEGlab which is the toolbox for processing continuous and event-related EEG, MEG and other electrophysiological data using independent component analysis (ICA), time/frequency analysis, artifice rejection, and several modes of data visualization. For filtering the other brain
IJCSNS International Journal of Computer Science and Network Security, VOL.11 No.2, February 2011
81
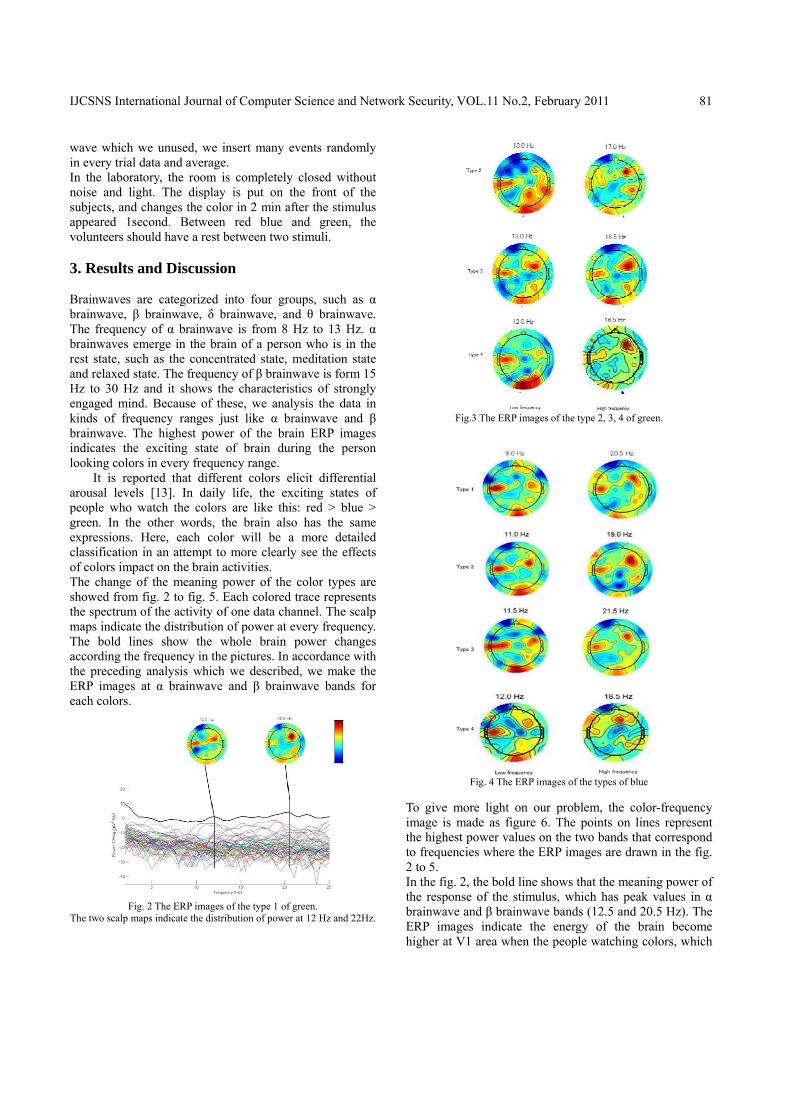
wave which we unused, we insert many events randomly in every trial data and average. In the laboratory, the room is completely closed without noise and light. The display is put on the front of the subjects, and changes the color in 2 min after the stimulus appeared 1second. Between red blue and green, the volunteers should have a rest between two stimuli. 3. Results and Discussion Brainwaves are categorized into four groups, such as α brainwave, β brainwave, δ brainwave, and θ brainwave. The frequency of α brainwave is from 8 Hz to 13 Hz. α brainwaves emerge in the brain of a person who is in the rest state, such as the concentrated state, meditation state and relaxed state. The frequency of β brainwave is form 15 Hz to 30 Hz and it shows the characteristics of strongly engaged mind. Because of these, we analysis the data in kinds of frequency ranges just like α brainwave and β brainwave. The highest power of the brain ERP images indicates the exciting state of brain during the person looking colors in every frequency range. It is reported that different colors elicit differential arousal levels [13]. In daily life, the exciting states of people who watch the colors are like this: red > blue > green. In the other words, the brain also has the same expressions. Here, each color will be a more detailed classification in an attempt to more clearly see the effects of colors impact on the brain activities. The change of the meaning power of the color types are showed from fig. 2 to fig. 5. Each colored trace represents the spectrum of the activity of one data channel. The scalp maps indicate the distribution of power at every frequency. The bold lines show the whole brain power changes according the frequency in the pictures. In accordance with the preceding analysis which we described, we make the ERP images at α brainwave and β brainwave bands for each colors.
Fig. 2 The ERP images of the type 1 of green.
The two scalp maps indicate the distribution of power at 12 Hz and 22Hz.
Fig.3 The ERP images of the type 2, 3, 4 of green.
Fig. 4 The ERP images of the types of blue
To give more light on our problem, the color-frequency image is made as figure 6. The points on lines represent the highest power values on the two bands that correspond to frequencies where the ERP images are drawn in the fig. 2 to 5. In the fig. 2, the bold line shows that the meaning power of the response of the stimulus, which has peak values in α brainwave and β brainwave bands (12.5 and 20.5 Hz). The ERP images indicate the energy of the brain become higher at V1 area when the people watching colors, which
IJCSNS International Journal of Computer Science and Network Security, VOL.11 No.2, February 2011
82
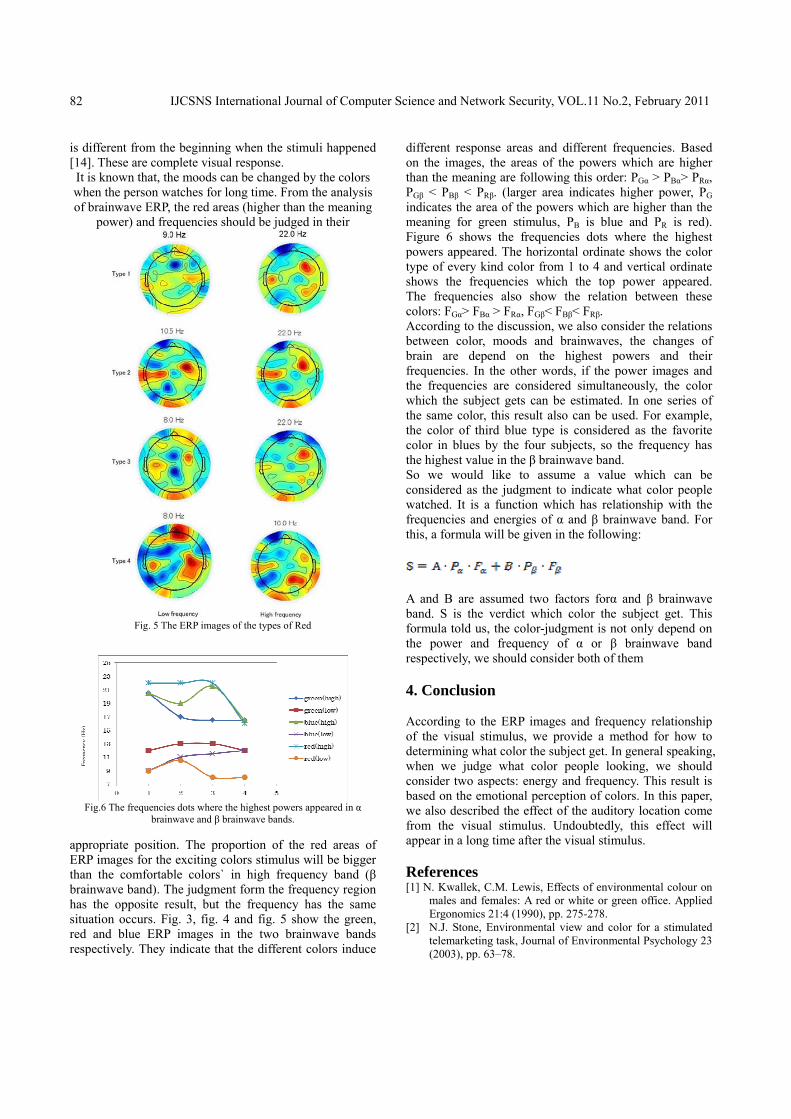
is different from the beginning when the stimuli happened [14]. These are complete visual response. It is known that, the moods can be changed by the colors when the person watches for long time. From the analysis of brainwave ERP, the red areas (higher than the meaning
power) and frequencies should be judged in their
Fig. 5 The ERP images of the types of Red
Fig.6 The frequencies dots where the highest powers appeared in α
brainwave and β brainwave bands.
appropriate position. The proportion of the red areas of ERP images for the exciting colors stimulus will be bigger than the comfortable colors` in high frequency band (β brainwave band). The judgment form the frequency region has the opposite result, but the frequency has the same situation occurs. Fig. 3, fig. 4 and fig. 5 show the green, red and blue ERP images in the two brainwave bands respectively. They indicate that the different colors induce
different response areas and different frequencies. Based on the images, the areas of the powers which are higher than the meaning are following this order: PGα > PBα> PRα, PGβ < PBβ < PRβ. (larger area indicates higher power, PG indicates the area of the powers which are higher than the meaning for green stimulus, PB is blue and PR is red). Figure 6 shows the frequencies dots where the highest powers appeared. The horizontal ordinate shows the color type of every kind color from 1 to 4 and vertical ordinate shows the frequencies which the top power appeared. The frequencies also show the relation between these colors: FGα> FBα > FRα, FGβ< FBβ< FRβ. According to the discussion, we also consider the relations between color, moods and brainwaves, the changes of brain are depend on the highest powers and their frequencies. In the other words, if the power images and the frequencies are considered simultaneously, the color which the subject gets can be estimated. In one series of the same color, this result also can be used. For example, the color of third blue type is considered as the favorite color in blues by the four subjects, so the frequency has the highest value in the β brainwave band. So we would like to assume a value which can be considered as the judgment to indicate what color people watched. It is a function which has relationship with the frequencies and energies of α and β brainwave band. For this, a formula will be given in the following:
A and B are assumed two factors forα and β brainwave band. S is the verdict which color the subject get. This formula told us, the color-judgment is not only depend on the power and frequency of α or β brainwave band respectively, we should consider both of them 4. Conclusion According to the ERP images and frequency relationship of the visual stimulus, we provide a method for how to determining what color the subject get. In general speaking, when we judge what color people looking, we should consider two aspects: energy and frequency. This result is based on the emotional perception of colors. In this paper, we also described the effect of the auditory location come from the visual stimulus. Undoubtedly, this effect will appear in a long time after the visual stimulus. References [1] N. Kwallek, C.M. Lewis, Effects of environmental colour on
males and females: A red or white or green office. Applied Ergonomics 21:4 (1990), pp. 275-278.
[2] N.J. Stone, Environmental view and color for a stimulated telemarketing task, Journal of Environmental Psychology 23 (2003), pp. 63–78.
Freq
uenc
y(H
z)
IJCSNS International Journal of Computer Science and Network Security, VOL.11 No.2, February 2011
83
[3] Andrew J. Elliota, Markus A. Maier, Arlen C. Moller, Ron Friedman, Jörg Meinhardt, Color and Psychological Functioning: The Effect of Red on Performance Attainment. Journal of Experimental Psychology: General.136:1 (2007), pp.154-168.
[4] Soldat, A. S., Sinclair, R. C., Mark, M. M. Color as an environmental processing cue: External affective cues can directly affect processing strategy without affecting mood. Social Cognition, 15 (1997), pp. 55–71.
[5] Braun, C.C., Silver, N.C. Interaction of signal word and colour on warning labels:differences in perceived hazard and behavioural compliance. Ergonomics, 38:11 (1995). pp.2207-2220.
[6] D.J. Williams and J.M. Noyes, How does our perception of risk influence decision-making? Implications for the design of risk information. Theor Issues Ergon Sci 8 (1) (2007), pp. 1–35.
[7] N. Kaya and H.H. Epps, Relationship between color and emotion: a study of college students, Coll. Stud. J. 38 (2004), pp. 396–405.
[8] Ravi Mehta, Rui Zhu, Blue or Red? Exploring the Effect of Color on Cognitive Task Performances, Science 323:5918 (2009), pp. 1226-1229
[9] B.N. Cuthbert, H.T. Schupp, M.M. Bradley, N. Birbaumer, P.J. Lang, Brain potentials in affective picture processing: covariation with autonomic arousal and affective report. Biol. Psychol. 52 (2000), pp.95–111.
[10] J. Polich, A. Kok, Cognitive and biological determinants of P300: an integrative review. Biol. Psychol. 41 (1995), 103–146.
[11] M.G. Manolas et al., Differences in human visual evoked potentials during the perception of colour as revealed by bootstrap method to compare cortical activity. A prospective study. Neuroscience Letters 270 (1999), pp. 21-24
[12] Maya E. Cano , Quetzal A. Class, John Polich, Affective valence, stimulus attributes, and P300: Color vs. black/white and normal vs. scrambled images, International Journal of Psychophysiology 71 (2009), pp. 17–24
[13] P. Valdez, A. Mehrabian, Effects of color on emotions. J. Exp. Psychol. Gen. 123(1994), pp.394–409.
[14] F. Perrin, J. Pernier, O. Bertrand, M.H. Giard and J.F. Echallier, Mapping of scalp potentials by surface spline interpolation. Electroenceph. clin. Neurophysiol. 66 (1987), pp. 75–81.
Huiran Zhang received the B.S.degree from Shanghai University, Shanghai, China in 2005 and the M.S. degree from University of Toyama, Toyama, Japan in 2008. From 2008, he is working toward the Ph. D at University of Toyama, Toyama, Japan. His main research interest includes brainwave response under the visual and auditory stimuli, intellectual information technology and neural networks.
Zheng Tang received the B.S.degree from Zhejiang University, Zhejiang, China in 1982 and an M.S. degree and a D.E. degree from Tshinghua University, Beijing, China in 1984 and 1988, respectively. From 1998 to 1989, he was an Instructor in the Institute of Microelectronics at Tshinhua University. From 1990 to 1999, he was an Associate Professor
in the Department of Electrical and Electronic Engineering, Miyazaki University, Miyazaki, Japan. In 2000, he joined University of Toyama, Toyama, Japan, where he is currently a Professor in the Department of Intellectual Information Systems. His current research interests included intellectual information technology, neural networks, and optimizations.