Embed Size (px)
Citation preview
Unit #19 : Functions of Many Variables, and Vectors in R2 and R3
Goals:
• To introduce tangent planes for functions of two variables.
• To consider functions of more than two variables and their level surfaces.
• To study the differential of a function and its interpretation as the linear ap-proximation of measurement error.
• To learn about vectors.
Local Linearity and the Tangent Plane - 1
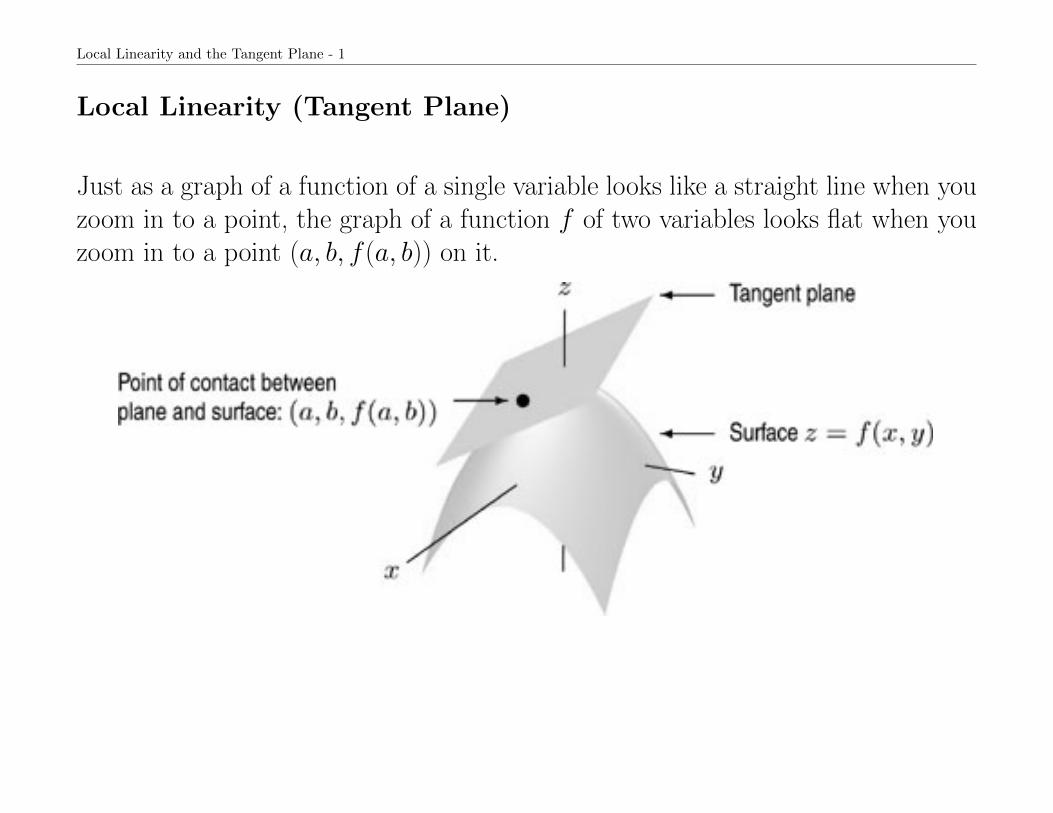
Local Linearity (Tangent Plane)
Just as a graph of a function of a single variable looks like a straight line when youzoom in to a point, the graph of a function f of two variables looks flat when youzoom in to a point (a, b, f (a, b)) on it.
Local Linearity and the Tangent Plane - 2
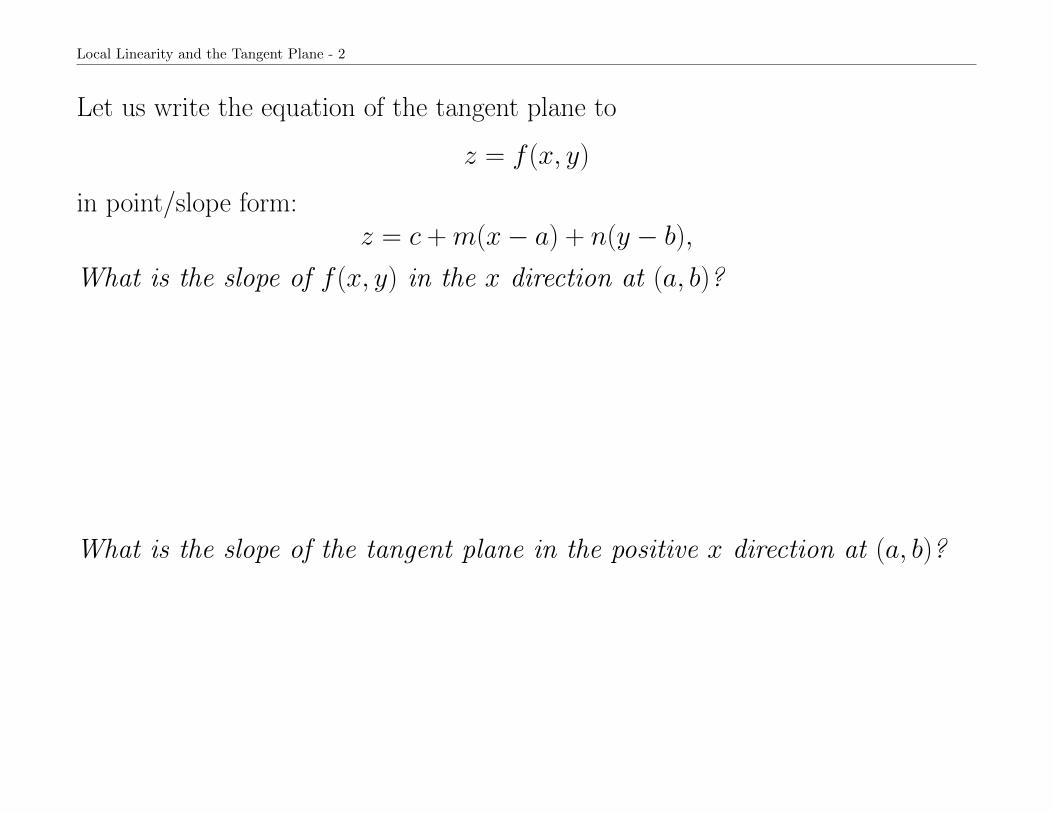
Let us write the equation of the tangent plane to
z = f (x, y)
in point/slope form:z = c + m(x− a) + n(y − b),
What is the slope of f (x, y) in the x direction at (a, b)?
What is the slope of the tangent plane in the positive x direction at (a, b)?
Local Linearity and the Tangent Plane - 3
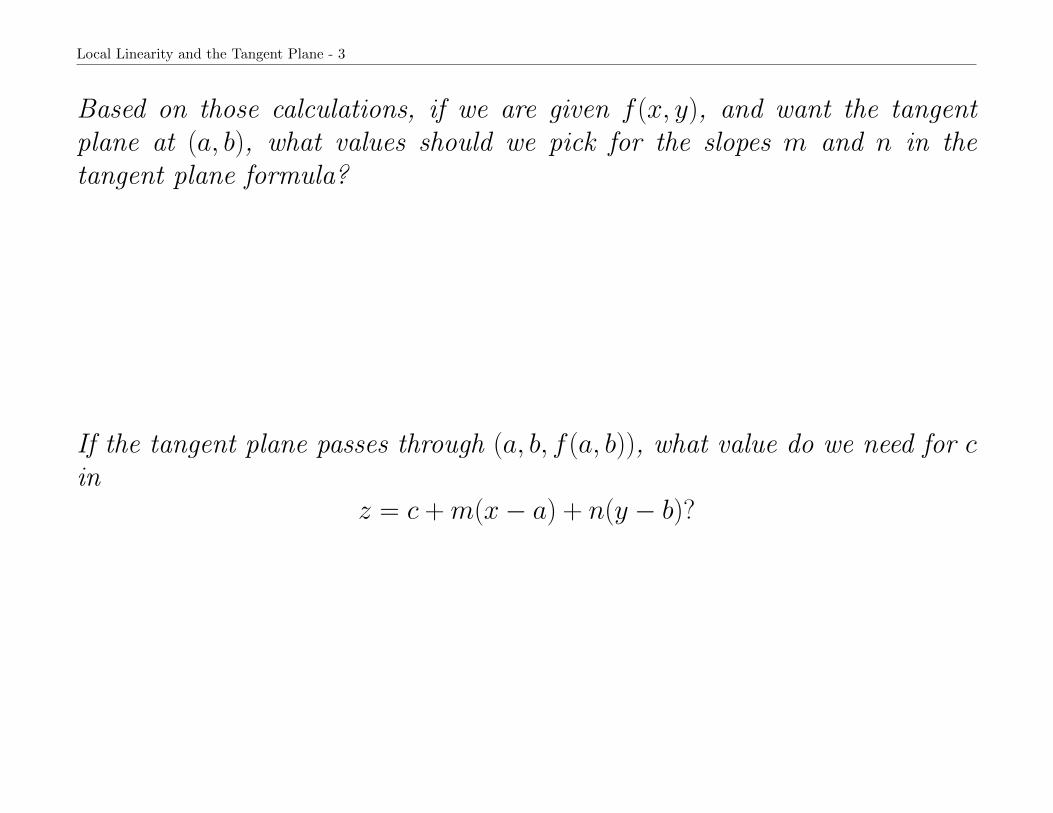
Based on those calculations, if we are given f (x, y), and want the tangentplane at (a, b), what values should we pick for the slopes m and n in thetangent plane formula?
If the tangent plane passes through (a, b, f (a, b)), what value do we need for cin
z = c + m(x− a) + n(y − b)?
Local Linearity and the Tangent Plane - 4
Tangent PlaneThe plane tangent to z = f (x, y) at the point (x, y) = (a, b) is defined by
z = f (a, b) + fx(a, b)(x− a) + fy(a, b)(y − b)
This can be used to define the local linear approximation to f (x, y) at points (x, y)near (a, b):
f (x, y) ≈ f (a, b) + fx(a, b)(x− a) + fy(a, b)(y − b)
Note the similarity of the right hand side of a tangent line formula for single variablefunctions.
Local Linearity and the Tangent Plane - 5
An alternate form of this same relationship is
∆f ≈ fx(a, b)∆x + fy(a, b)∆y
We will use these two forms interchangeably, depending on whether we want tocalculate local changes in f (x, y), or the estimated values of f (x, y).
Tangent Plane Examples - 1
Tangent Plane Examples
Example: What is the equation of the tangent plane to the graph of thefunction f (x, y) = 3xey/2 at (1, 2, 3e)?
Tangent Plane Examples - 2
Use your answer to the preceding question to find an approximate value forf (0.95, 2.03) and use a calculator to check the accuracy of your answer.
Tangent Plane Examples - 3
Example: Let f (x, y) =1
2 + x2 − 2x + y2. Find the points on the graph
where the tangent plane is parallel to the (x, y)-plane (i.e. horizontal).
Tangent Plane Examples - 4
f (x, y) =1
2 + x2 − 2x + y2
Tangent Plane Examples - 5
f (x, y) =1
2 + x2 − 2x + y2
Sketch what the surface might look like near this/these points.
Functions of More Than Two Variables - 1
Functions of More Than Two Variables
Example: (Temperature in a room) To specify a point in a room, you mustspecify three coordinates (x, y, z). So, the temperature is a function of threevariables: T = T (x, y, z).
What is another variable that we could potentially include in this function,that would make temperature a function of four variables?
Pictures for a Function of Three Variables
To picture f (x, y, z) by means of a graph is not very useful. The graph would haveto have the following definition:
{(x, y, z, w) : w = f (x, y, z)} .
That is, it would be a set in 4–dimensional space, which is not something we candirectly visualize.
However, we can make use of the analogue of the contour diagram.
Suppose we pick a constant C and collect all the points (x, y, z) for which f (x, y, z) =C. In general, this gives a surface called a level surface. By sketching a numberof level surfaces, we can get a sense of the function f .
Functions of More Than Two Variables - 2
Example (Steam Heating) Queen’s University is heated by steam which isdistributed to the buildings via underground pipes.Depict the level surfaces for the temperature function near the steam pipeunder Agnes Benidickson Field.
Functions of More Than Two Variables - 3
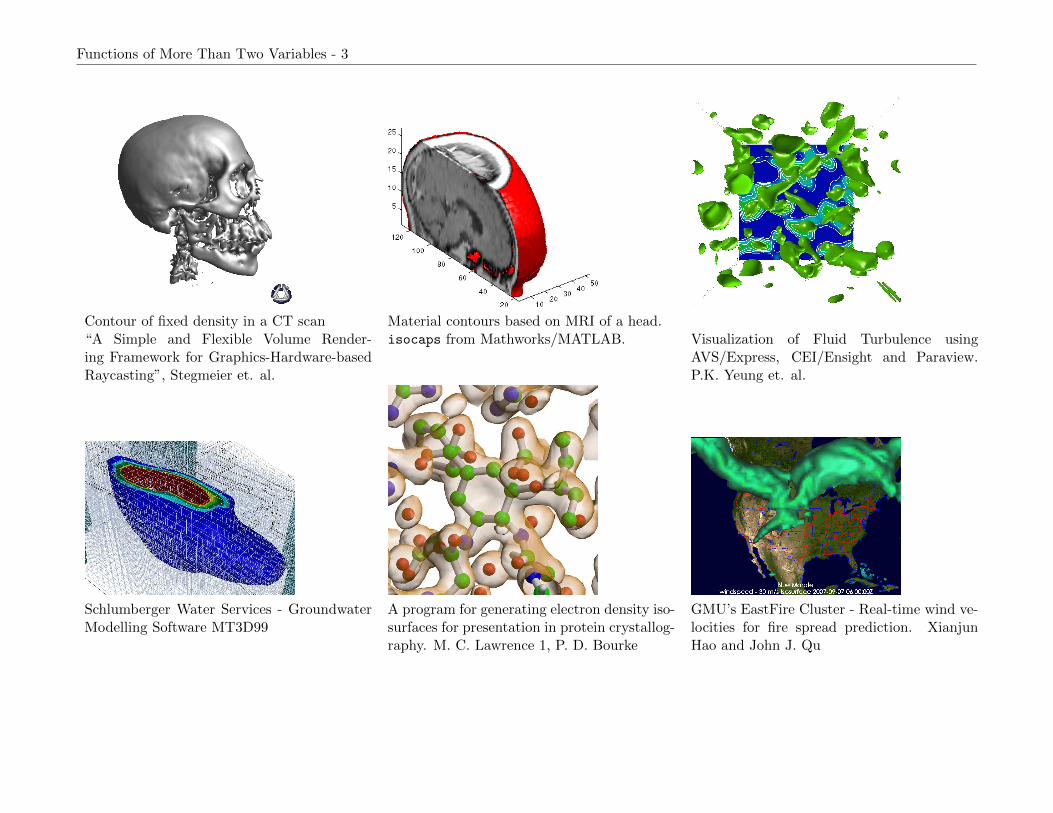
Contour of fixed density in a CT scan Material contours based on MRI of a head.“A Simple and Flexible Volume Render-ing Framework for Graphics-Hardware-basedRaycasting”, Stegmeier et. al.
isocaps from Mathworks/MATLAB. Visualization of Fluid Turbulence usingAVS/Express, CEI/Ensight and Paraview.P.K. Yeung et. al.
Schlumberger Water Services - GroundwaterModelling Software MT3D99
A program for generating electron density iso-surfaces for presentation in protein crystallog-raphy. M. C. Lawrence 1, P. D. Bourke
GMU’s EastFire Cluster - Real-time wind ve-locities for fire spread prediction. XianjunHao and John J. Qu
Partial Derivatives in Higher Dimensions - 1
Partial Derivatives in Higher Dimensions
General Partial Derivatives
In general, for a function of several variables f (x1, . . . , xn), the partial derivative∂f
∂xi(x1, . . . , xn)
is the derivative obtained by holding all other variables fixed.
If f (x, y, z) = xeyz + z2 cos(x2y), find∂f
∂z.
Partial Derivatives in Higher Dimensions - 2
If g(x, y, z) =x2y + 3yezy
2x, find
∂g
∂y.
If h(x, y, z) = sin(xy) + xz3, find∂h
∂x(0, 2, 3).
Local Linearity for a Function of Three Variables - 1
Local Linearity for a Function of Three Variables
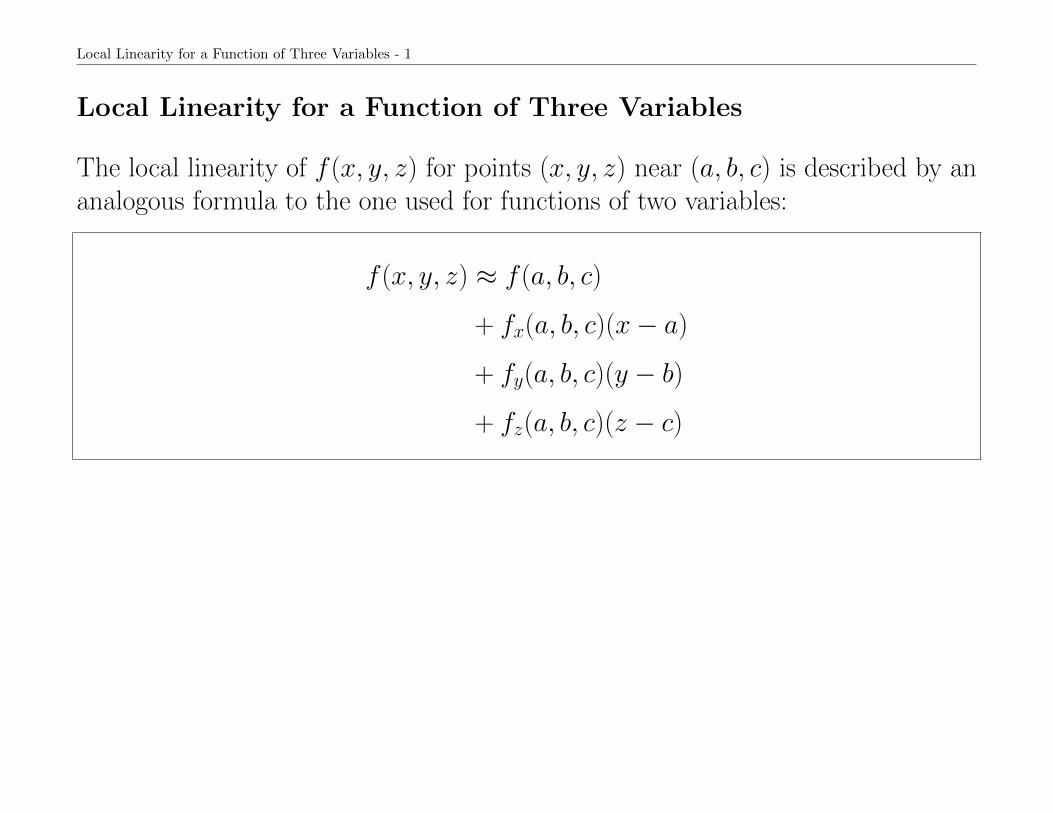
The local linearity of f (x, y, z) for points (x, y, z) near (a, b, c) is described by ananalogous formula to the one used for functions of two variables:
f (x, y, z) ≈ f (a, b, c)
+ fx(a, b, c)(x− a)
+ fy(a, b, c)(y − b)
+ fz(a, b, c)(z − c)
Local Linearity for a Function of Three Variables - 2
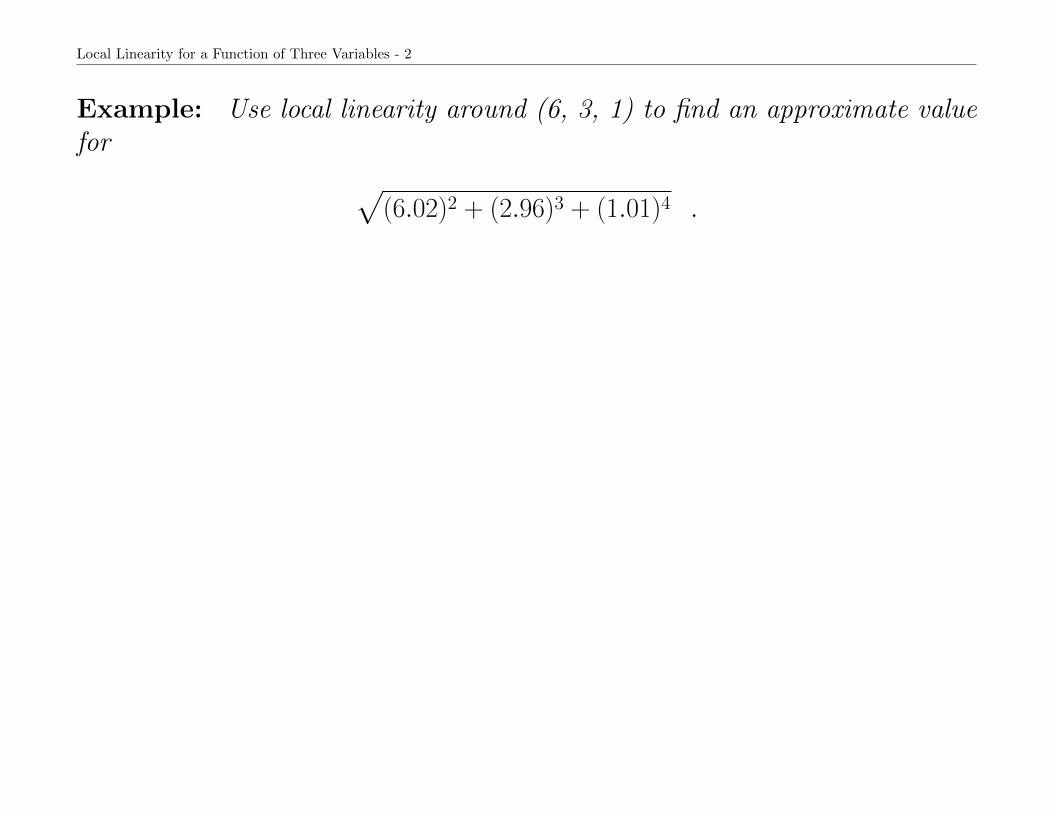
Example: Use local linearity around (6, 3, 1) to find an approximate valuefor √
(6.02)2 + (2.96)3 + (1.01)4 .
Local Linearity for a Function of Three Variables - 3 √(6.02)2 + (2.96)3 + (1.01)4
The Differential - 1
The Differential
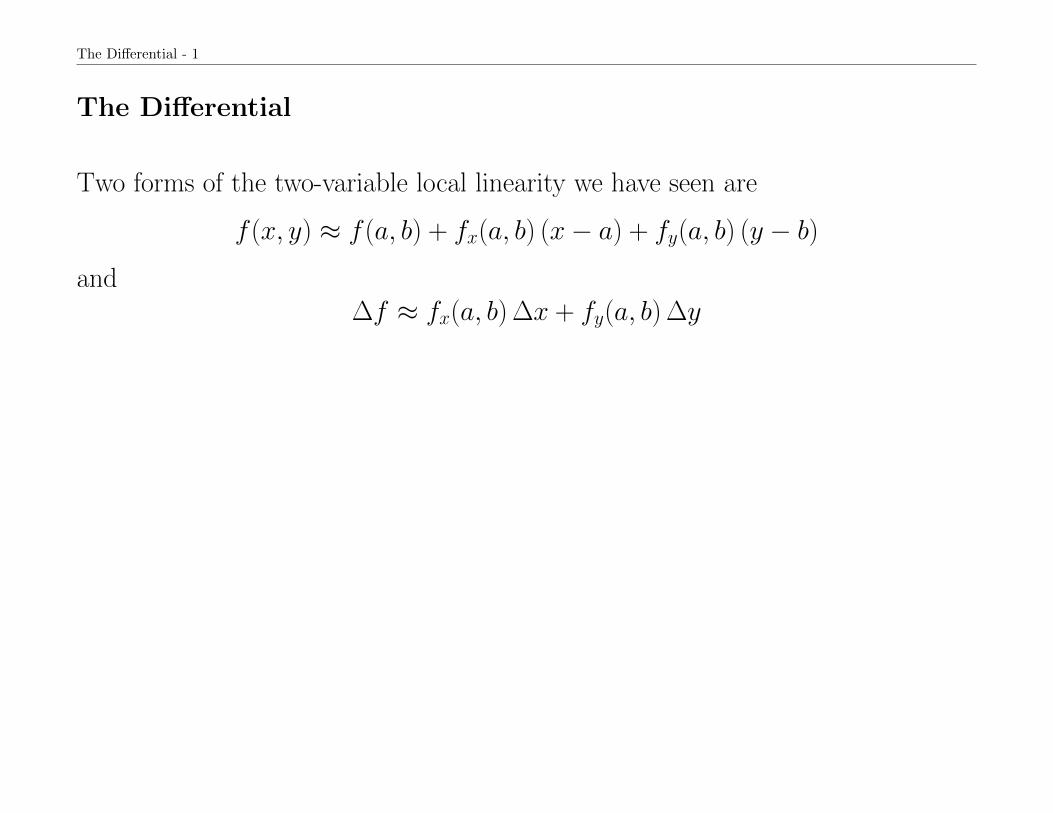
Two forms of the two-variable local linearity we have seen are
f (x, y) ≈ f (a, b) + fx(a, b) (x− a) + fy(a, b) (y − b)
and∆f ≈ fx(a, b) ∆x + fy(a, b) ∆y
The Differential - 2
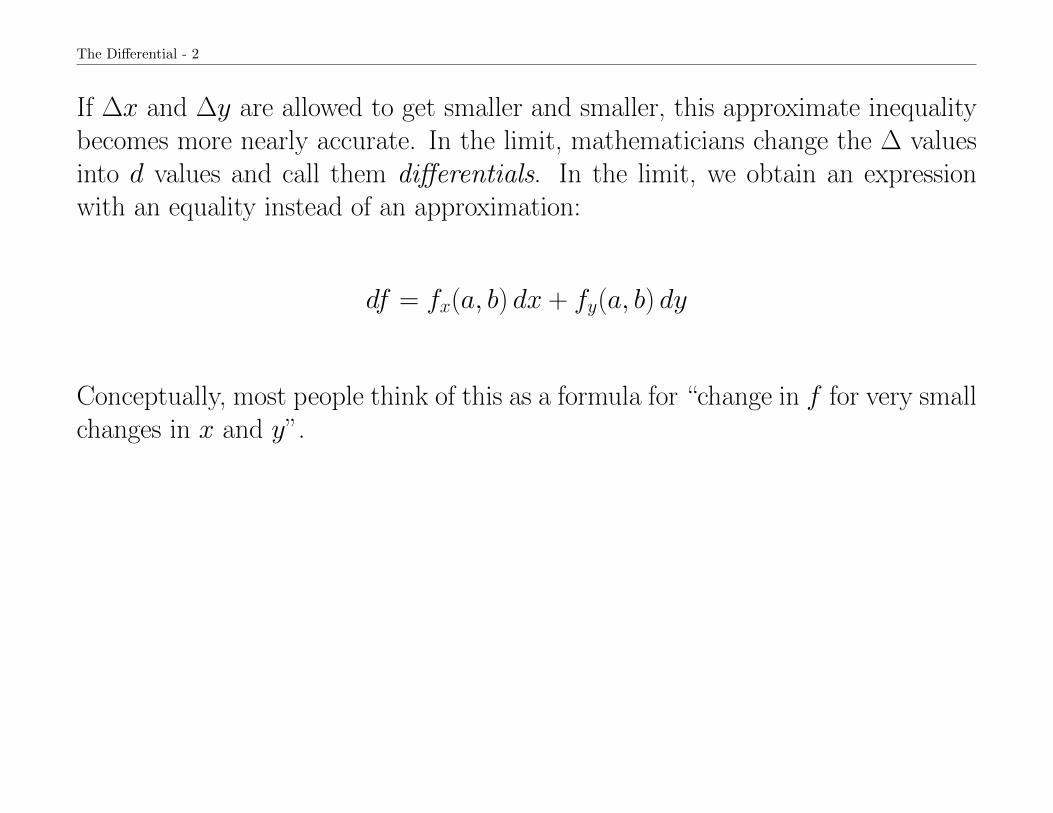
If ∆x and ∆y are allowed to get smaller and smaller, this approximate inequalitybecomes more nearly accurate. In the limit, mathematicians change the ∆ valuesinto d values and call them differentials. In the limit, we obtain an expressionwith an equality instead of an approximation:
df = fx(a, b) dx + fy(a, b) dy
Conceptually, most people think of this as a formula for “change in f for very smallchanges in x and y”.
The Differential - 3
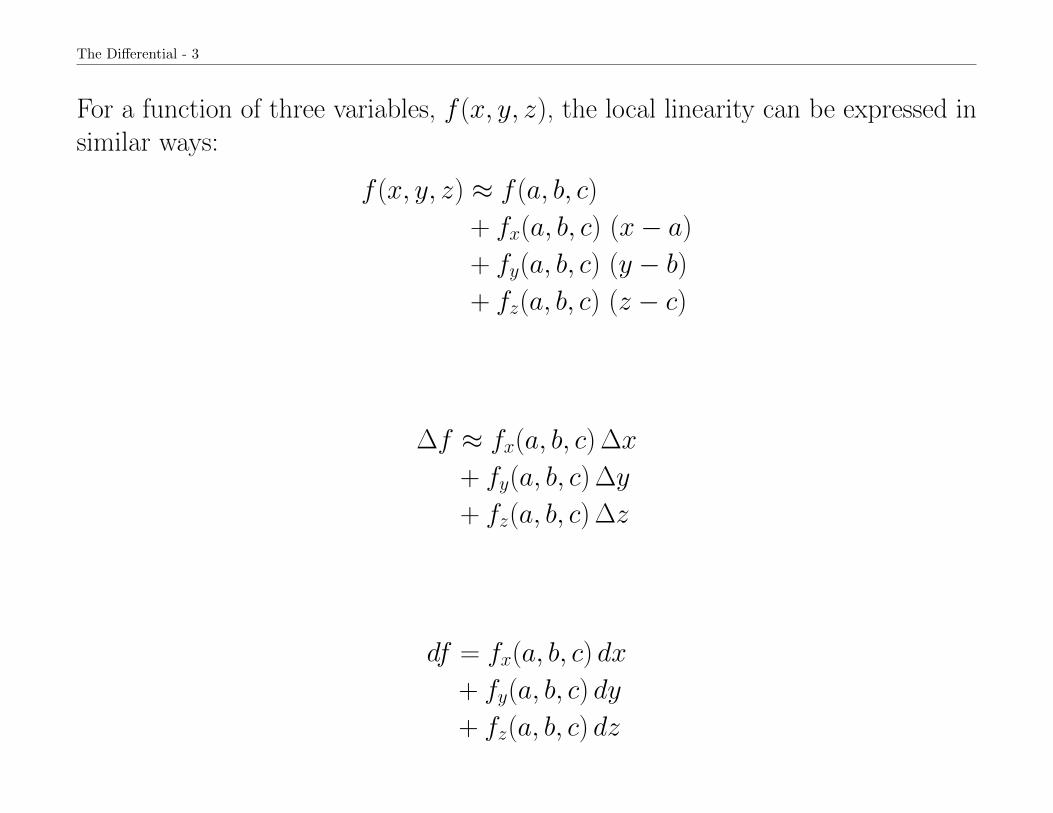
For a function of three variables, f (x, y, z), the local linearity can be expressed insimilar ways:
f (x, y, z) ≈ f (a, b, c)
+ fx(a, b, c) (x− a)
+ fy(a, b, c) (y − b)
+ fz(a, b, c) (z − c)
∆f ≈ fx(a, b, c) ∆x
+ fy(a, b, c) ∆y
+ fz(a, b, c) ∆z
df = fx(a, b, c) dx
+ fy(a, b, c) dy
+ fz(a, b, c) dz
Using Linearity/Differentials for Estimates of Error Bounds - 1
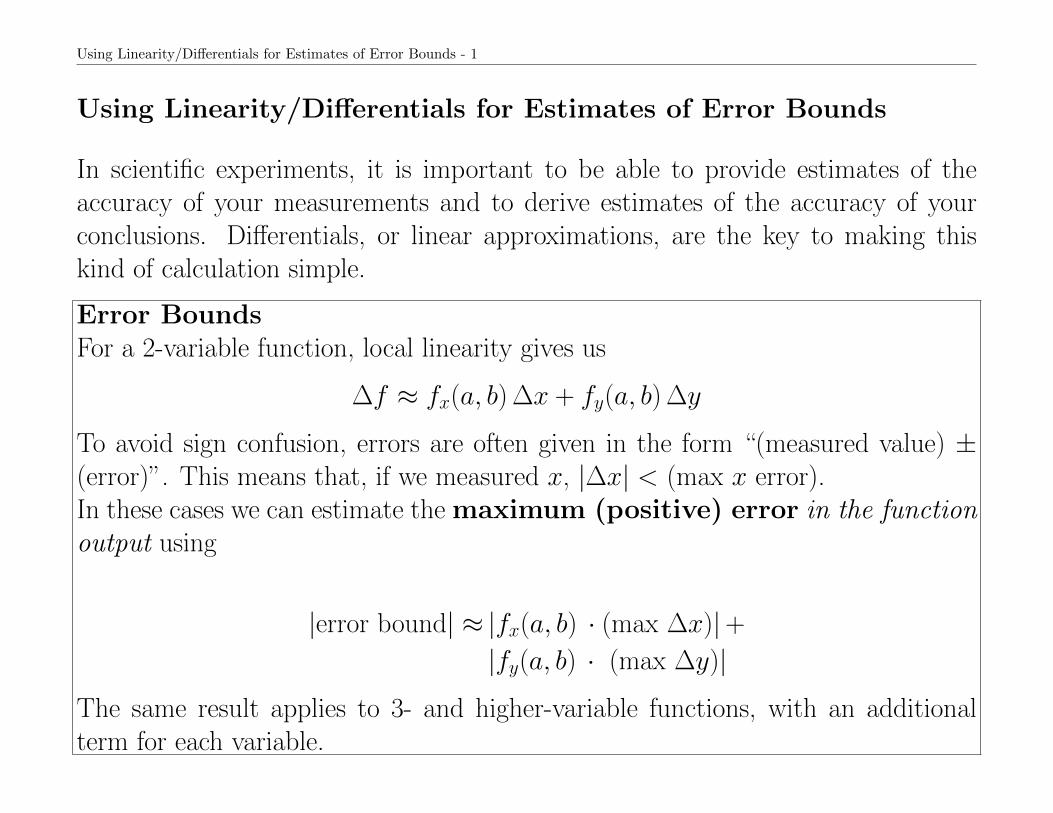
Using Linearity/Differentials for Estimates of Error Bounds
In scientific experiments, it is important to be able to provide estimates of theaccuracy of your measurements and to derive estimates of the accuracy of yourconclusions. Differentials, or linear approximations, are the key to making thiskind of calculation simple.
Error BoundsFor a 2-variable function, local linearity gives us
∆f ≈ fx(a, b) ∆x + fy(a, b) ∆y
To avoid sign confusion, errors are often given in the form “(measured value) ±(error)”. This means that, if we measured x, |∆x| < (max x error).In these cases we can estimate the maximum (positive) error in the functionoutput using
|error bound| ≈ |fx(a, b) · (max ∆x)|+|fy(a, b) · (max ∆y)|
The same result applies to 3- and higher-variable functions, with an additionalterm for each variable.
Using Linearity/Differentials for Estimates of Error Bounds - 2
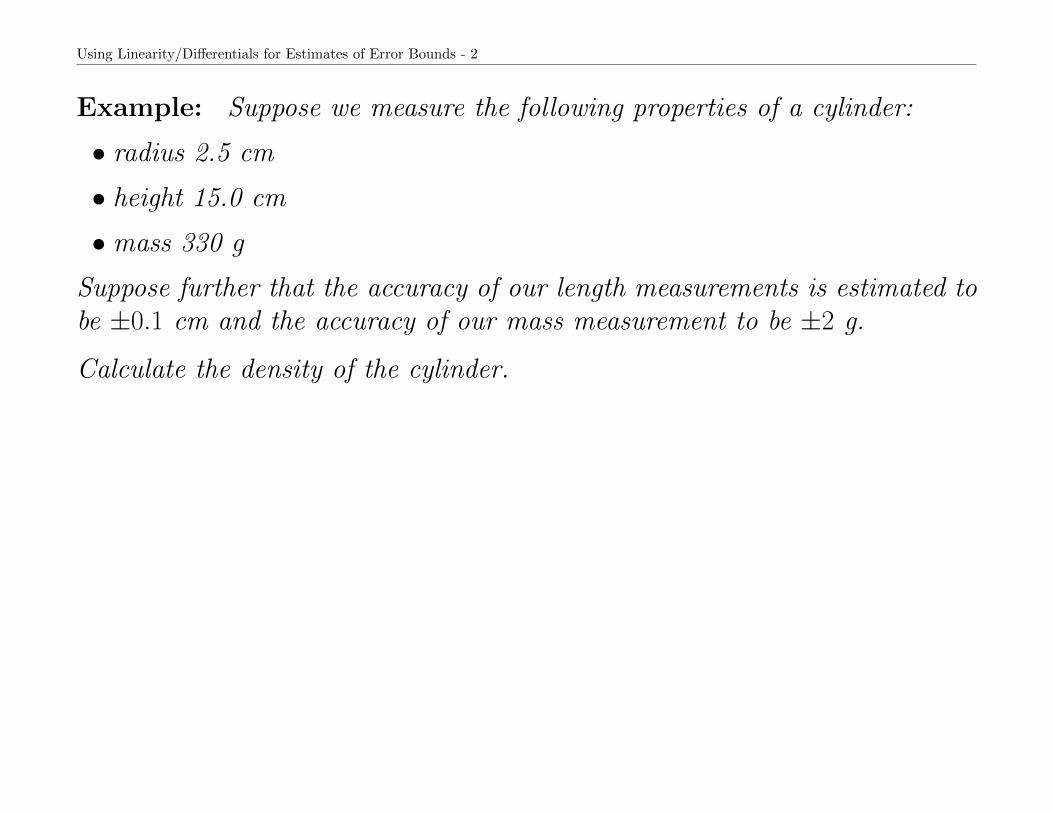
Example: Suppose we measure the following properties of a cylinder:
• radius 2.5 cm
• height 15.0 cm
• mass 330 g
Suppose further that the accuracy of our length measurements is estimated tobe ±0.1 cm and the accuracy of our mass measurement to be ±2 g.
Calculate the density of the cylinder.
Using Linearity/Differentials for Estimates of Error Bounds - 3
Now estimate the error bound in the density value you just computed. Includeunits.
Using Linearity/Differentials for Estimates of Error Bounds - 4
If ∆a is the error made in a measurement (or calculation) of a quantity a, then the
ratio∆a
ais often referred to as the relative error. If we multiply it by 100, as
in∆a
a× 100, we get the percentage error.
Suppose f (x, y, z) = xmynzp. Show that the following formula for relativeerror is correct. ∣∣∣∣∆f
f
∣∣∣∣ ≤ ∣∣∣∣m∆x
x
∣∣∣∣ +
∣∣∣∣n∆y
y
∣∣∣∣ +
∣∣∣∣p∆z
z
∣∣∣∣(CAUTION: This relative error formula only holds for functions that havethis special form!)
Vectors - 1
Vectors
We have seen that partial derivatives of a multi-variate function let us compute theslope of a surface in the x and y directions. However, we can also define a slopeor steepness if we choose to move in an arbitrary direction. To do that kind ofcomputation, we will need to introduce notation for arbitrary (x, y) directions.We will find the vector representation very helpful in this regard.
Vectors
A vector is a quantity that has both magnitude and direction.Velocity and force are examples of vector quantities.
Scalars
Quantities that have magnitude only are called scalars.Length and volume are examples of scalar quantities.
Vectors - 2
It is often convenient to use arrows to represent vector quantities. The lengthof the arrow corresponds to the magnitude of the vector and the direction of thearrow tells you the direction of the vector. A natural question to ask is “does itmatter where the vector is located”? The answer to this question is that it doesnot matter. Two arrows that have the same direction and magnitude are tworepresentations of the same vector.
Vectors - 3
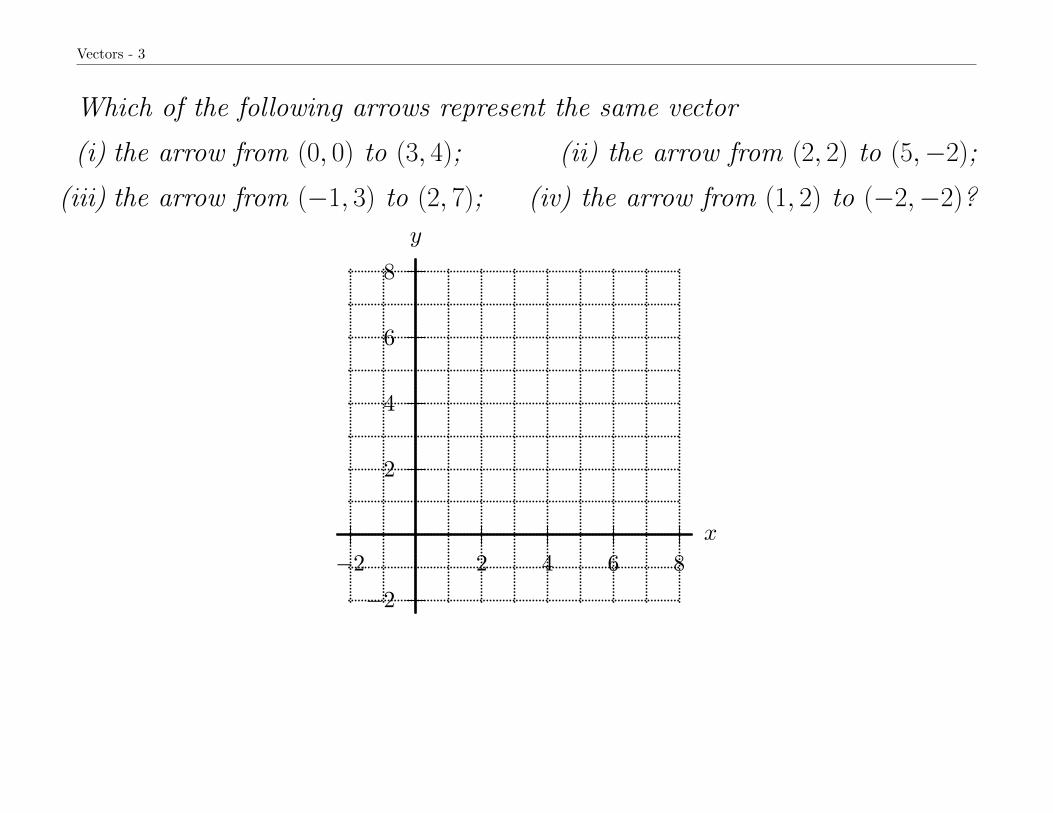
Which of the following arrows represent the same vector
(i) the arrow from (0, 0) to (3, 4); (ii) the arrow from (2, 2) to (5,−2);
(iii) the arrow from (−1, 3) to (2, 7); (iv) the arrow from (1, 2) to (−2,−2)?
2
4
6
8
−2
2 4 6 8−2
x
y
Vectors - 4
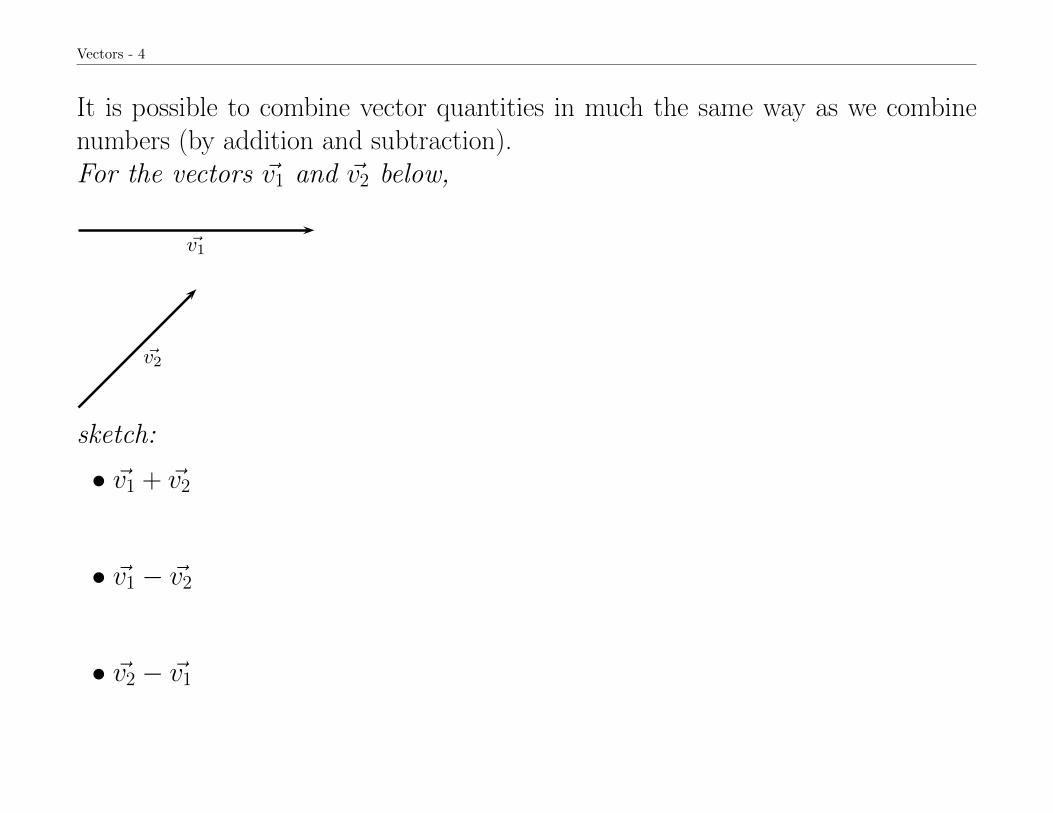
It is possible to combine vector quantities in much the same way as we combinenumbers (by addition and subtraction).For the vectors ~v1 and ~v2 below,
~v1
~v2
sketch:
• ~v1 + ~v2
• ~v1 − ~v2
• ~v2 − ~v1
Vectors - 5
Sketch the vectors (~v1 − ~v1), and (~v2 − ~v2).
The result of these last two differences is called the zero vector. It is a vectorwith zero length, and is the only vector for which we can assign no direction.
Vector Components and Magnitudes - 1
Vector Components and Magnitudes
To manipulate vectors without needing to draw arrows, we need a symbolic rep-resentation for them. One of the most useful representations is the componentform of a vector.
Vector Components and Magnitudes - 2
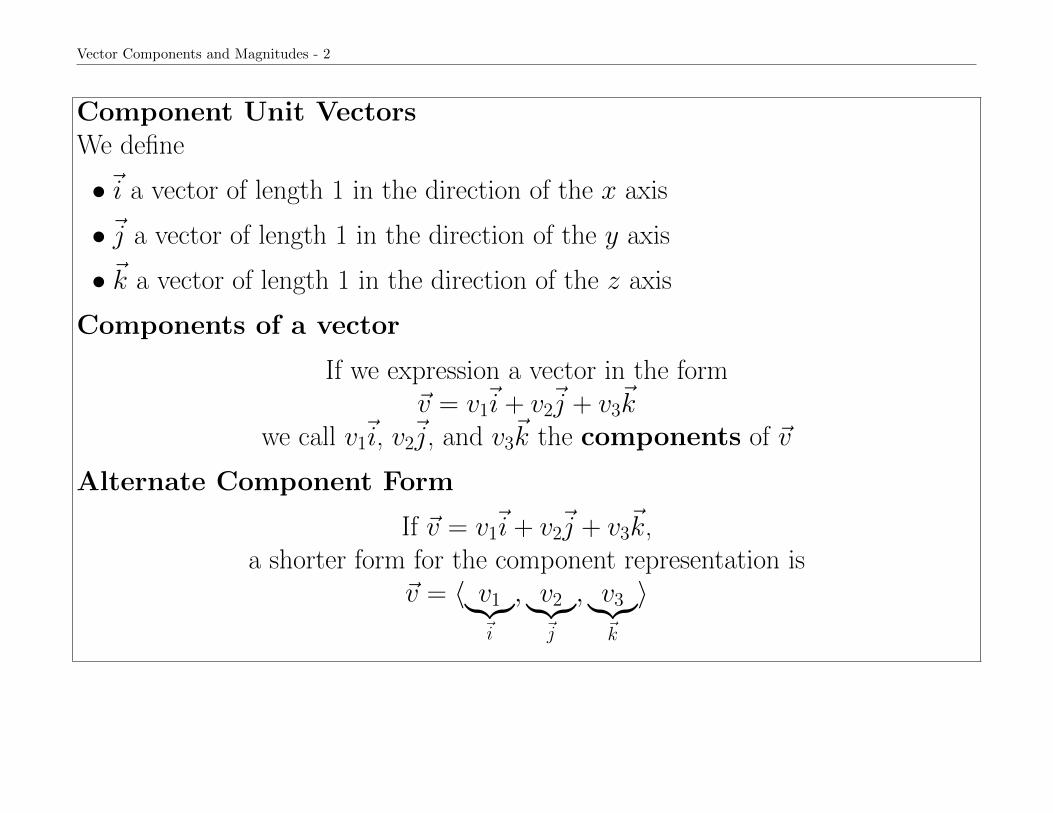
Component Unit VectorsWe define
•~i a vector of length 1 in the direction of the x axis
• ~j a vector of length 1 in the direction of the y axis
• ~k a vector of length 1 in the direction of the z axis
Components of a vector
If we expression a vector in the form~v = v1~i + v2~j + v3~k
we call v1~i, v2~j, and v3~k the components of ~v
Alternate Component Form
If ~v = v1~i + v2~j + v3~k,a shorter form for the component representation is
~v = 〈 v1︸︷︷︸~i
, v2︸︷︷︸~j
, v3︸︷︷︸~k
〉
Vector Components and Magnitudes - 3
Note: sometimes mathematicians and other scientists use different bracket shapes
~v = [v1, v2, v3] or ~v = (v1, v2, v3)
to indicate that the set of values represents a vector, rather than a point. We willcontinue to use either the vector components, ~i, ~j and ~k, or angled parentheses,‘〈’ and ‘〉’.
Vector Components and Magnitudes - 4
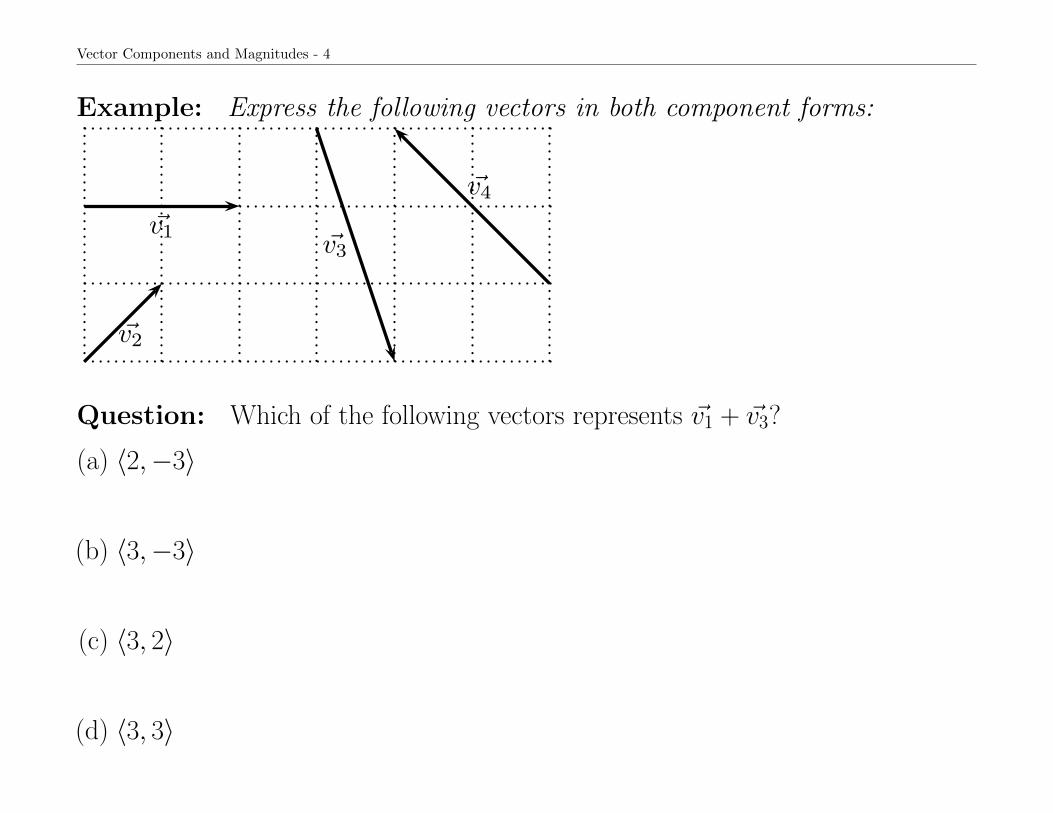
Example: Express the following vectors in both component forms:
~v1
~v2
~v3
~v4
Question: Which of the following vectors represents ~v1 + ~v3?
(a) 〈2,−3〉
(b) 〈3,−3〉
(c) 〈3, 2〉
(d) 〈3, 3〉
Vector Components and Magnitudes - 5
~v1
~v2
~v3
~v4
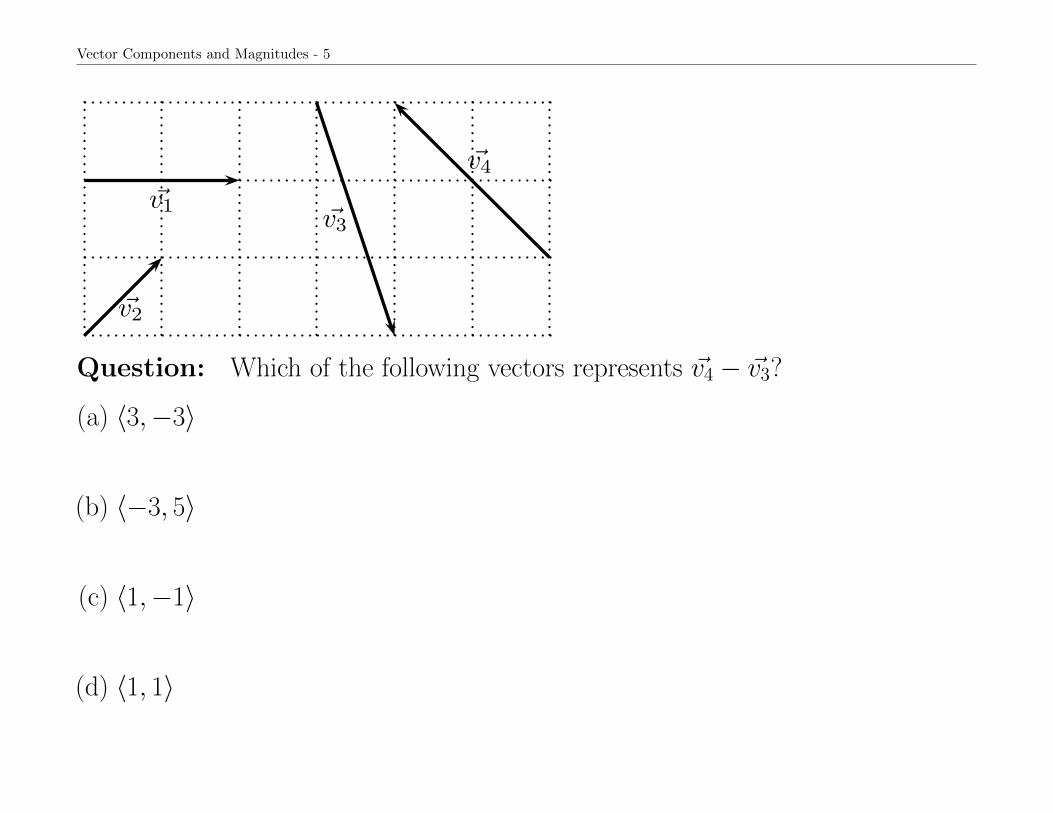
Question: Which of the following vectors represents ~v4 − ~v3?
(a) 〈3,−3〉
(b) 〈−3, 5〉
(c) 〈1,−1〉
(d) 〈1, 1〉
Vector Components and Magnitudes - 6
Magnitude or Length From Components
If ~v = v1~i + v2~j
The length of a vector ||~v|| =√v21 + v22
In 3 dimensions, where ~v = v1~i + v2~j + v3~k,
||~v|| =√v21 + v22 + v23
How long is the vector 〈2,−3〉?(a) -1
(b)√
5
(c)√
13
(d) 13
Parallel Vectors - 1
Parallel Vectors
It is often important to know whether two vectors are parallel to each other, thatis that they point along the same line, but might have different magnitudes.Example: Are the vectors ~v = 〈1,−2〉 and ~w = 〈2,−4〉 parallel?
Without drawing them, how can we determine that the vectors ~v = 〈1,−2〉and ~w = 〈2,−5〉 are not parallel?
Parallel Vectors - 2
Parallel VectorsTwo vectors, ~v and ~u, are parallel to one another if there exists a scalar multiplierc such that
~v = c ~u.
Example: Show that the vector 〈3, 4, 5〉 is not parallel to 〈1, 2, 3〉.
Vector Applications - 1
Vector Applications
Example: An airplane sets itself on a heading due east, at an air speed of600 km/hr. It has a tail-wind of 80 km/h from the north-west. What is theplane’s net velocity vector relative to the ground?
Vector Applications - 2
Example: An airplane is flying at an airspeed of 800 km/hr, in winds thatare blowing from the south at a speed of 50 km/hr. In what direction shouldthe plane head to end up going due east, relative to the ground?