Embed Size (px)
Citation preview

AMIR HEIMAN and EITAN MULLER*
One of the major ways that manufacturers decrease the uncertainty that is involved in making a choice between competing brands of experi- ence goods is through demonstrations of their new products. The authors investigate the issue of the length of a demonstration and, in particular, provide answers to the following three questions: What is the optimal length of a demonstration? Does the optimal length vary between differ- ent products? Does the optimal length vary between different con- sumers? They analyze 225 cases from the motor vehicle industry and 46 cases from the computer industry with regard to number and length of demonstrations offered and relate the findings to their theoretical model. The empirical results yield strong support for their theory. They also find that most firms offered a longer demonstration than needed and failed to use an appropriate segmentation technique for optimizing the
demonstration with respect to different consumer groups.
Using Demonstration to Increase New
Product Acceptance: Controlling
Demonstration Time
The uncertainty involved in making a choice between competing brands on the basis of incomplete information in- creases in the case of experience goods. With such goods, consumers can be sure that the specific attributes of the product match their subjective expectations only after pur- chase. Uncertainty reduces consumers' willingness to pay for a product and impedes the diffusion of new brands. In the case of high-quality products, both consumer and pro- ducer have an incentive to reduce uncertainty about the product's performance. Classic economic literature suggests that consumers use signals such as advertising or brand name to identify product quality and refine their choice. Many other methods can be used to reduce uncertainty over time. One of these is word of mouth, whereby an indepen- dent source reveals the true characteristics of the product. To create the critical mass needed to ensure successful adoption of a product, the producer can reduce the product's price at the beginning of the adoption process (see Mahajan, Muller, and Bass 1990).
This inherent uncertainty about the characteristics of a new product results in a risk premium that the consumer as-
*Amir Heiman is a visiting scholar, Walter A. Haas School of Business, University of California. Eitan Muller is Professor of Marketing, Recanati Graduate School of Business Administration, Tel Aviv University. The authors thank Moshe Givon, Vijay Mahajan, Russell Winer, David Aaker, Debu Purohit, and four anonymous JMR reviewers for their thoughtful sug- gestions and comments on an earlier version of this article.
Journal of Marketing Research Vol. XXXIII (November 1996), 422-430
sociates with the product. To reduce this perceived risk pre- mium, the producer can offer a warranty or an extended ser- vice contract (ESC) on the product. Both a warranty and ESC might serve as credible signals about the quality of the product and are particularly suitable for consumers with higher than average risk aversion (Padmanabhan and Rao 1993). Warranty and ESC, however, offer protection only from technical failure, and the consumer still must bear the cost of failure due to mismatch with subjective needs.
One of the major ways that manufacturers decrease un- certainty is through demonstrations of their new products. The demonstration helps familiarize the public with the product's characteristics and decreases customers' resis- tance to sales efforts.
Automobile producers in the United States and Europe fre- quently use demonstrations to introduce new products to the market. Computer hardware manufacturers such as Hewlett Packard and Olivetti use this strategy with their peripheral equipment. The consumer's purchase probability varies with the length of the demonstration. Nevertheless, many firms of- fering demonstrations do so without knowing the exact shape of this probability function. They therefore tend to manipu- late their control variables-length of demonstration time and number of demonstrations offered-with suboptimal effect.
Our aim is to investigate the issue of the length of a demon- stration and, in particular, provide answers to the following three questions: What is the optimal length of a demonstra- tion? Does the optimal length vary between different products? Does the optimal length vary between different consumers?
422
I
I
This content downloaded from 128.122.186.36 on Mon, 9 Feb 2015 12:31:46 PMAll use subject to JSTOR Terms and Conditions
Demonstration Time
In the empirical section, we analyze 225 cases from the motor vehicle industry and 46 cases from the computer in- dustry with regard to number and length of demonstrations offered and relate the findings to our theoretical model. The empirical results yield strong support for our theory. We al- so find that most firms offered a longer demonstration than needed and failed to use an appropriate segmentation tech- nique for optimizing the demonstration with respect to dif- ferent consumer groups.
The article is organized as follows: In the next section, we discuss the main methods of reducing consumer uncertainty with respect to the product's performance and the role of prod- uct demonstration in relation to our three main product groups. We next construct a model of consumer reaction to demon- stration length and discuss and model the influence of product type on purchasing probability. We then present the empirical analysis. Finally, we conclude with managerial implications.
SAMPLING, DEMONSTRATION, AND CONSUMER UNCERTAINTY
The process by which consumers learn about products' qualities has been analyzed in the marketing literature from several points of view. Nelson (1970, 1974) and Zeithaml (1988) identify two categories of products: learning and/or experience products and search products. The qualities of search products can be discovered before purchase; learning products, however, must be purchased and used before their qualities become apparent. Darby and Karni (1973) add another category-credence products. These are goods whose characteristics cannot be discovered by consumers even after purchase; knowledge of the product is subjective and based on credence. In the case of experience products, the consumer discounts the new product's expected utility. Consumers deduct a risk premium from their expected util- ity or from their reservation price (see Kalish 1985; Kalish and Sen 1986; Roberts and Urban 1988).
Consumers may use external signals, such as price, brand name, and advertising, to gain more information about an experience product. They interpret advertising or price as signals of higher quality, (Jacoby, Szybillo, and Busato- Schach 1977; Milgrom and Roberts 1986; Nelson 1970, 1974). Consumers also may rely on the price mechanism to explain price differentiation, with higher prices possibly constituting predictors for high-quality products (see Gerst- ner 1985; Monroe 1973; Monroe and Dodds 1988; Monroe and Petroshives 1981; Narasimhan and Sen 1992; Rao and Monroe 1989; Tellis and Wernerfelt 1988).
In addition to advertising and price (acting as signals), product demonstration, sampling, and money-back guaran- tees all provide information and help reduce consumer un- certainty. Samples are units of a product that are distributed free to consumers either directly or by mail. The main pur- pose of samples is to promote the product and accelerate its adoption in the marketplace (see Jain, Mahajan, and Muller 1995). Money-back guarantees enable the consumer to gain experience with the product and assess its quality (see Scott, Gerstner, and Hagerty 1994). Unlike demonstration, money- back guarantees are valid, conditional on buying the prod- uct. Product demonstrations enable the consumer to experi- ence the product (or service) without commitment to pur- chase. Several researchers have proposed demonstration as a tactical promotion tool. The main advantage of demonstra- tion is the psychological phenomenon known as foot in the
door: Accepting the demonstration offer often induces the consumer to make the more significant decision to purchase the product (see Freedman and Fraser 1966; Pliner et al. 1974; Scott 1976).
An important difference between samples and demonstra- tion is that samples pertain to consumable goods, whereas durable goods are demonstrated. Some of the results of this study, such as the optimal number of demonstrations, could be applied to sampling, whereas other results that pertain to the length of demonstrations are not applicable to sampling.
There are four basic types of demonstration, which are categorized according to the location of the demonstration and the operator of the demonstrated good:
1. Dealer's showroom/salesperson's demonstration: The sales representative demonstrates the product in the dealer's show- room, using equipment and features specially designed for the purpose. The main disadvantages of this demonstration mode are that (a) consumers cannot experience their ability to oper- ate the product and thus may be unduly influenced by the skills of the operator and (b) the product is operated in a lab- oratory environment, and the consumer is unable to assess the performance of the product in a real-life situation.
2. Dealer's showroom/consumer's demonstration: The con- sumer personally tries out the product in the dealer's show- room. Here the customer gains experience and additional in- formation about his or her ability to operate the product but still lacks information about the product's performance in the real environment. The main advantage of this mode of demon- stration is its interactive nature. The salesperson can relate in real time to the consumer's concerns as these concerns are be- ing revealed throughout the demonstration process.
3. Consumer's office/salesperson's demonstration: The con- sumer can check if the product fits his or her future needs and special environment. For example, the consumer can verify that a printer fits in with existing hardware and software. This method of testing the product is preferable to testing it in the dealer's showroom, because it may perform differently in dif- ferent settings. For example, the performance of an audio sys- tem varies with the size of the room and the type of furniture. This method of demonstration retains the disadvantage that the consumer may be influenced by the operator's skills.
4. Consumer's office/consumer's demonstration: The consumer tests the product in its future operating environment and di- rectly observes whether it fits his or her particular needs and personal characteristics. One of the main advantages of this type of demonstration happens in the case of multiple users. If two persons or all family members are involved in the decision process of purchasing a new car, a demonstration would be helpful in persuading all potential users. The same holds with respect to multiple users with different needs of a new printer.
In the empirical section of our study, we apply our model to the fourth demonstration mode, but in principle it may be applied to any of the four categories. In our discussion of the managerial implications, we describe how the different demonstrations would be employed with the different prod- uct categories.
CONSUMER BEHAVIOR AND RECLASSIFICATION OF EXPERIENCE PRODUCTS
The firm determines the time of demonstration and the number of potential customers to receive a demonstration. Some products are offered for demonstration and others are not (length of demonstration time equals zero). The con- sumers optimize their expected utility with the given demonstration time and the given price. The optimization
423
This content downloaded from 128.122.186.36 on Mon, 9 Feb 2015 12:31:46 PMAll use subject to JSTOR Terms and Conditions

JOURNAL OF MARKETING RESEARCH, NOVEMBER 1996
process concludes with the decision whether to buy the product after the demonstration. We assume that the cost to the consumer of participating in the demonstration is small relative to the risk of purchasing a product that does not meet his or her expectations. This assumption implies that the consumer makes use of all the time allocated to him or her.
The consumer derives utility from consumption of the products' attributes. If the product meets the consumer's ex- pectations, thereby fulfilling his or her needs, we define the product as high quality (the reverse holds for low-quality products). The consumer has certain beliefs about the proba- bility that the product will meet his or her needs. These beliefs are the outcome of prior information about the level of the product's attributes. This information may be derived by word of mouth, by advertising, or from independent sources. These beliefs may be compatible with the producer's information about the product's performance. From prior experience based on customer surveys, the producer knows the propor- tion of consumers whose expectations are met by the product. When the producer knows that the consumers' evaluation of the product is unrealistically low, the producer and the con- sumer will be better off after the demonstration. The con- sumer tries the product and concludes that its performance af- ter purchase will be the same as during the demonstration.
We further assume that the consumer has made the initial decision to purchase the product provided it is of high qual- ity. Therefore, the probability of buying the product after re- ceiving a demonstration is equal to the probability of pre- dicting that the product is of high quality.
Consumers have some prior beliefs about the level of the different attributes. During the process of demonstration, the consumer learns about the actual level of these attributes. If the overall new levels of attributes are higher than the prior overall levels of these attributes, then the probability of pre- dicting the product to be of high quality increases. Therefore, a demonstration will increase the probability of purchase if the producer knows that the consumer's predemonstration evaluation of the product is lower than its real value (see the Appendix for a formal model summarizing our assumptions).
Next, we propose a reclassification of experience goods (Nelson 1970, 1974) according to the time needed to learn about the level of the product's attributes. We assume that the time needed by the consumer to learn about the perfor- mance of the different attributes of the product varies from one attribute to another. For example, a potential buyer needs only a few minutes to learn about the interior design of the car, its operation (ease of use attribute), the starting system (mechanical attribute), and the acceleration perfor- mance (sporty attribute). Gaining sufficient knowledge about other attributes, such as the ergonomics of the seats (e.g., how do I feel after a long drive) or how the engine per- forms when hot, requires more time, and usually takes be- tween four and six hours of driving. To check ease of start- ing in the morning, the consumer must wait until the next morning (14 to 24 hours of demonstration). Some attributes, such as wear of the timing belt, can be checked only after 50
lIt could be argued that the actual time used, rather than the length of demonstration offered by the firm, is the variable that influences purchase probability. However, the empirical results of this study did not vary when we used intensity measures, such as mile driven, instead of length of demonstration time.
Table 1 CLASSIFICATION OF EXPERIENCE GOODS AND
CONSUMER'S LEARNING SPEED
High-Level Attributes
Low-Level Attributes Fast Learning Slow Learning
Fast Learning Functional Undemonstrable Slow Learning Play Time
to 60 thousand miles (two to three years of experience). It is obvious that the demonstration cannot supply consumers with full information about all the attributes levels. Howev- er, after receiving a demonstration, the consumer has far more information than beforehand. Furthermore, we con- clude that the longer the demonstration, the more informa- tion is gained by the consumer. Although the time needed to learn about the different attributes is a continuum, we refer only to the extreme cases of fast learning and slow learning. Similarly, the level of each (positive) attribute is designated as low or high.
Different products entail different learning modes. To learn about the product, the consumer must check the per- formance of the product's attributes. To ascertain the level of each attribute, he or she often must create the appropriate test conditions. Some products can be tested attribute by at- tribute without the consumer needing to invest time in cre- ating the exogenous test environment. In such cases, the time needed to examine the product is merely the learning time. An example of this type of product is a printer; the consumer can check the speed or quality of the printing sim- ply by replacing the font and trying different software. Oth- er products, however, require the setting up of test condi- tions. For example, to check the performance of a car engine under strain, a person must drive to a mountain. Hence, the time invested is the time needed to drive to the mountain plus the time spent testing the car on the mountain. Each positive attribute can be of a high or low level and can be learned rapidly or slowly. We thus have four categories, as is shown in Table 1.
Linking consumer behavior to the classification of the products enables us to model the variation of the probabili- ty function shape within the product type.
Play products. High-level attributes are discovered faster than low-level attributes, which may lead the consumers to erroneously evaluate the product quality as high. Additional demonstration time enables the consumers to learn about the low-level attributes and thus corrects their prediction. To return to our example, a car may have superior road performance, which becomes evident to the consumer after a relatively short drive. If the demonstration ends at this point, he or she will consider the product to be of high quality. Extending the demonstration may reveal that the seats are uncomfortable and cause backache. After the initial demonstration period, product evaluation is thus favorable and purchasing probability is relatively high. As the demonstration continues, low-level attributes are discovered, and the consumer updates his or her impressions, modifying his or her predictions of the product's value, and therefore reducing the probability of purchase.
Functional products. The consumer can control the attributes to be checked by quickly creating the special environment that reflects the performance of these
424
This content downloaded from 128.122.186.36 on Mon, 9 Feb 2015 12:31:46 PMAll use subject to JSTOR Terms and Conditions
Demonstration Time
attributes. The time needed to evaluate the attributes is fairly short, and the consumer's discovery rate of the level of the attributes (high or low) is therefore fast. During the course of a relatively short demonstration, the consumer can discern most of the product's qualities. Extending the demonstration will not provide much additional information. Audio equipment is a good example of this category. The consumer can quickly learn about most of the attributes that can be checked during a demonstration and as a result can predict if the audio system fits his or her needs. The consumer can play different disks and assess the performance of the product-jazz to check the bass quality, classical music to test the quality of the receiver, and so on. Because high-level and low-level attributes have the same probability of being revealed over a given period of time, we can assume that the probability of purchase would increase as the demonstration time is extended if the consumer's prior evaluation is lower than that of the producer, and vice versa. We also can assume that because the learning process is relatively fast, the purchasing probability is a concave function of time.
Time products. A consumer's learning is slow for both low- and high-level attributes. Additional demonstration time slowly reveals more product characteristics. Industrial and/or business software affords a good example: To leam, the consumer must be somewhat knowledgeable, and the learning process is thus slow. A potential customer of graphics software, for example, will want to know about the speed of creating a picture and about the graphics feature. To learn about these attributes he or she must invest time in learning how to operate this software. As a result, we can assume that the purchasing probability as a function of time is S-shaped. The firm can reduce the time needed to learn about some attributes by employing salespersons who have experience with the product. The use of a salesperson creates a new demonstration type, because consumers lose the opportunity of gaining hands-on experience but save the learning time required to operate the product.
Undemonstrable products. Low-level attributes are discovered quickly, whereas high-level attributes are discovered more slowly. Because the consumer can terminate the demonstration at any time and because his or her time is presumably costly, such products do not lend themselves to demonstration. An example of this type of product is most of the word processing software. The ease of use attribute of this software is usually a low-level attribute, whereas the professional features are often high level. As a result, many consumers withdraw from the learning process when they realize the difficulty involved in learning how to operate the software.
Our classification bears some similarity to that of Wein- berger, Leland, and Brody (1994), who classify products ac- cording to two forms of data processing-functional tools versus expressive toys-and according to the level of risk. Examples of high-risk functional tools, which are relevant to our study, are appliances, automobile tires, and insurance. Examples of high-risk expressive toys are fashion goods, hair coloring, cars, and jewelry. In our empirical section, we show that cars exhibit characteristics of play products and printers display attributes of functional products. Categorization of additional products is an empirical issue that is beyond the scope of this study, though we can conjecture that toys, jour-
nals, and professional services are play products, whereas some industrial products, such as plotters, calculators, and personal computers, are functional products. Finally, soft- ware, and especially industrial software such as CAD/CAM, presumably belongs to the time products category.
EMPIRICAL TEST
Our main hypotheses are as follows (the formal maxi- mization model that leads to these hypotheses is presented in the Appendix):
HI: The purchasing probability following demonstration of products belonging to the play product category has an in- verted U-shaped function.
H2: If there are two (or more) consumer segments differentiat- ed by their a priori product knowledge, then those with greater product knowledge will reach the maximum of the purchasing probability function after a shorter demonstra- tion time.
H3: In the play product category, when there are more than two segments that differ in their level of a priori product knowl- edge, the aggregate buying probability function may have more than one maximum. The number of maxima will not exceed the number of consumer segments.
H4: In the functional product category, purchasing probability is a concave increasing function of demonstration time if the consumer's predemonstration evaluation of the probability of the product being of high quality is lower than its true value.
We illustrate our model with examples of a play product and a functional product.
Play Product: Lancia Thema.
During 1991-1992, the distributor of Lancia vehicles decided to use demonstration to promote sales of the Lancia Thema in Israel. At the time, the price of the car in Israel was approximately $33,000, and it was targeted at high-income groups, particularly corporate executives. The Lancia Thema, a medium-sized luxury car with a high-performance sports car design, had an image problem because of the poor reputation of some Italian cars in Israel-especially the Alfa Sud in the early 1980s. The Lancia Thema was popular in Italy and in some other European countries, and the sole Israeli distributor decided that demonstration could over- come at least some of the image problem. All demonstra- tions were offered at the distributor's main branch, located in Tel Aviv. Other branches did not offer these cars for sale or demonstration. At the time, the only car for which demon- stration was being offered was the Peugeot 605. Other dis- tributors offered either no demonstration or a short demon- stration that let the potential customer drive the car for less than ten minutes, accompanied by a salesperson. The Lancia Thema demonstration was offered by the distributor's mar- keting department to 225 customers who had been identified in personal interviews as having serious intentions to buy.
The duration of demonstration was not correlated with purchase intention. We performed a correlation test be- tween the time allocated to each consumer and the evalua- tion of the sales representative regarding the customer's buying decision and found no correlation between these two variables. The length of time allocated to the selected potential consumers varied fortuitously, depending on when the previous demonstration had ended and how much time
425
This content downloaded from 128.122.186.36 on Mon, 9 Feb 2015 12:31:46 PMAll use subject to JSTOR Terms and Conditions
JOURNAL OF MARKETING RESEARCH, NOVEMBER 1996
the next candidate had at his or her disposal; thus, one con- sumer received less then one hour's demonstration and an- other was given 48 hours. The customers with a firm inten- tion to buy were randomly distributed with regard to their prior knowledge of the product, but the distributor did not use this variable to allocate the length of demonstration time.
Functional Products: Hewlett Packard Printers.
During 1985-1992, Hewlett Packard's (HP) Israeli importer and all four HP dealers offered demonstrations only to business customers, because they estimated the profit from multi-unit purchase to be higher with business customers.
As in the previous example, the choice of which customer to receive a demonstration was based on an interview to as- sess purchase intention. Only firms with a serious intention to purchase and a purchasing potential of at least one print- er were offered a demonstration. Length of demonstration was random and was not correlated with purchasing inten- tion but with the extent of the organization's computer re- sources. Larger organizations thus received more demon- stration time. Because the size of the firm is not correlated to the intention to buy or the level of prior knowledge, the length or demonstration can be analyzed as a random vari- able. Potential customers had a printer installed at their place of business and received basic instruction in its use. The printer was then left for an allotted period of time, at the end of which the salesperson returned and the customer made the purchasing decision.
All the potential customers were interviewed before a demonstration was offered by the salesperson, who assessed the customer's level of prior knowledge according to the na- ture and number of questions about the product. The cus- tomer's source of information could have been a conversa- tion with a friend, conversations with people who already owned the product, or advertising.
In-depth interviews with both Lancia Thema salespersons and potential customers and with the HP representatives and customers revealed that almost all the potential customers estimated the probability of failure of the demonstrated product to be higher than that known to the seller from pre- vious experience.
The following two variables are worth considering before proceeding with the empirical analysis. The first is the men- tal cost to the consumer of returning the product after the demonstration without buying it. The second is the propen- sity of some consumers to use a demonstration without any intention to purchase the product, that is, they simply want to enjoy the product for a while. Almost all the in-depth in- terviews we performed with 30 consumers and 20 marketing and sales managers indicated that for the products sampled (cars and printers) the cost of making a mistake was consid- ered to far outweigh the mental cost; hence, consumers felt no guilt about returning the product without buying it. The in-depth interviews also showed that some consumers used the demonstration without any intention to buy the product. Although a salesperson interviewed every potential cus- tomer for approximately 45 minutes before making an offer of demonstration and believed he or she could identify free- riders in advance, we found two cases of customers using the car demonstration and three cases of customers using the printer demonstration without any intention to buy. Exclu-
Table 2 LANCIA THEMA-INVERTED U-SHAPED PURCHASING
PROBABILITY: CONSUMERS WITHOUT PRIOR INFORMATION
Demonstration Time No Yes Total Probability
I hour or less 27 8 35 .23 1 to 12 hours 39 20 59 .34 24 hours 17 18 35 .51 More than 24 hours 37 18 55 .33
Total 120 64 184 .35
Table 3 LANCIA THEMA-INVERTED U-SHAPED PURCHASING
PROBABILITY: CONSUMERS WITH PRIOR INFORMATION
Demonstration Time No Yes Total Probability
I hour or less 4 2 6 .33 1 to 2 hours 3 12 15 .8 2 to 12 hours 3 7 10 .7 24 hours 3 5 8 .63 More than 24 hours 2 0 2 0.0
Total 15 26 41 .63
sion of these five cases did not have any significant changes in the results.2
We tested HI using a demonstration offered for Lancia Thema cars. Customers were divided into four groups, in which the stratifying variable was the length of demonstra- tion. The purchase probability was calculated as the number of customers who purchased the car after the demonstration as a percentage of the total number of demonstrations over a given period. Following H3, we analyzed the data after di- viding the customers into segments according to the sales- person's assessment of their prior product knowledge. The results for the group without prior knowledge of the product are presented in Table 2.
The chi-square test value of 6.59 is equivalent to a 91% confidence level, which indicates that the difference be- tween the cells is significant. The Z test reveals whether the difference between the maximum and the two adjacent points is significant. The results of the Z test are 1.676 be- tween the 1-to- 12-hours cells and the 24-hours cells (p < .1); and 1.778 between the 24-hours cells and the more-than-24- hours cells (p < .08). The results provide some measure of support for our hypothesis that the purchasing probability is an inverted U-shaped function.
Next, we analyzed the group with serious intentions of buying and with prior product knowledge about the product. In this group, 41 demonstrations were offered. The results are presented in Table 3.
The omega S value of 9.13 is equivalent to a 95% confi- dence level. Because we had more than one cell with less than five observations, we had to use the omega S test to as- sess the significance of the difference between the cells. Again, the Z test indicates that the difference between the
2One exception is the elimination of the two cases in the Lancia Thema case. In this case the difference between the cell of 24 hours and the cell of more than 24 hours became nonsignificant. This result is due to the nature of the dichotomous measure and the small number of observations in each cell.
426
This content downloaded from 128.122.186.36 on Mon, 9 Feb 2015 12:31:46 PMAll use subject to JSTOR Terms and Conditions
Demonstration Time
maximum and the two adjacent points is significant for 1- hour and l-to-2-hours cells (Z = 2.13) but is not for this cell and the following cell (Z = .56, or 1.32 if we aggregate the two following cells).
The insignificant Z test is due to the nature of the di- chotomous measure and the relatively small number of ob- servations in each cell. The maximum effect is reached after one to two hours of demonstration. Longer demonstrations reduce the purchase probability. The probability function is again concave and inverted U-shaped.
H2 states that if there are two (or more) consumer seg- ments with different levels of product knowledge, then those who are better acquainted with the product before the demonstration will reach the maximum of the probability function sooner than the others. The difference in the time needed to reach the maximum of the buying probability function can be calculated from Tables 2 and 3. The time re- quired is twenty-four hours for the group without prior knowledge, and two hours for the group with prior knowl- edge. This difference is significant at the 95% level and in- dicates that if the salesperson can identify the amount of pri- or information the potential consumer has before offering a demonstration, he or she can safely offer a shorter demon- stration to people with prior information than to those with- out prior information.
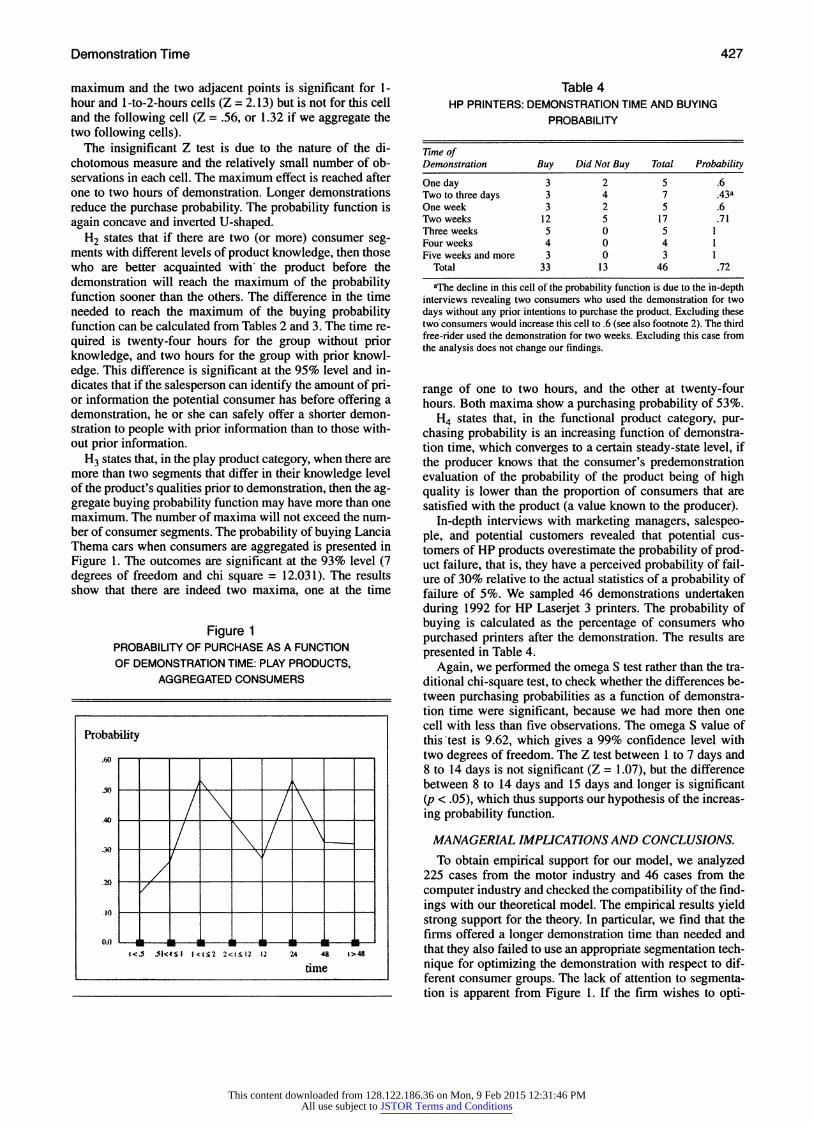
H3 states that, in the play product category, when there are more than two segments that differ in their knowledge level of the product's qualities prior to demonstration, then the ag- gregate buying probability function may have more than one maximum. The number of maxima will not exceed the num- ber of consumer segments. The probability of buying Lancia Thema cars when consumers are aggregated is presented in Figure 1. The outcomes are significant at the 93% level (7 degrees of freedom and chi square = 12.031). The results show that there are indeed two maxima, one at the time
Figure 1 PROBABILITY OF PURCHASE AS A FUNCTION OF DEMONSTRATION TIME: PLAY PRODUCTS,
AGGREGATED CONSUMERS
Probability
.60
.40
.30
.20
.10
0.0 :p : " 6 '
t<3 .31<tSI }<t:2 2<t512 2 24 48 t>i4
time
Table 4 HP PRINTERS: DEMONSTRATION TIME AND BUYING
PROBABILITY
Time of Demonstration Buy Did Not Buy Total Probability
One day 3 2 5 .6 Two to three days 3 4 7 .43a One week 3 2 5 .6 Two weeks 12 5 17 .71 Three weeks 5 0 5 1 Four weeks 4 0 4 1 Five weeks and more 3 0 3 1
Total 33 13 46 .72
aThe decline in this cell of the probability function is due to the in-depth interviews revealing two consumers who used the demonstration for two days without any prior intentions to purchase the product. Excluding these two consumers would increase this cell to .6 (see also footnote 2). The third free-rider used the demonstration for two weeks. Excluding this case from the analysis does not change our findings.
range of one to two hours, and the other at twenty-four hours. Both maxima show a purchasing probability of 53%.
H4 states that, in the functional product category, pur- chasing probability is an increasing function of demonstra- tion time, which converges to a certain steady-state level, if the producer knows that the consumer's predemonstration evaluation of the probability of the product being of high quality is lower than the proportion of consumers that are satisfied with the product (a value known to the producer).
In-depth interviews with marketing managers, salespeo- ple, and potential customers revealed that potential cus- tomers of HP products overestimate the probability of prod- uct failure, that is, they have a perceived probability of fail- ure of 30% relative to the actual statistics of a probability of failure of 5%. We sampled 46 demonstrations undertaken during 1992 for HP Laserjet 3 printers. The probability of buying is calculated as the percentage of consumers who purchased printers after the demonstration. The results are presented in Table 4.
Again, we performed the omega S test rather than the tra- ditional chi-square test, to check whether the differences be- tween purchasing probabilities as a function of demonstra- tion time were significant, because we had more then one cell with less than five observations. The omega S value of this test is 9.62, which gives a 99% confidence level with two degrees of freedom. The Z test between 1 to 7 days and 8 to 14 days is not significant (Z = 1.07), but the difference between 8 to 14 days and 15 days and longer is significant (p < .05), which thus supports our hypothesis of the increas- ing probability function.
MANAGERIAL IMPLICATIONS AND CONCLUSIONS.
To obtain empirical support for our model, we analyzed 225 cases from the motor industry and 46 cases from the computer industry and checked the compatibility of the find- ings with our theoretical model. The empirical results yield strong support for the theory. In particular, we find that the firms offered a longer demonstration time than needed and that they also failed to use an appropriate segmentation tech- nique for optimizing the demonstration with respect to dif- ferent consumer groups. The lack of attention to segmenta- tion is apparent from Figure 1. If the firm wishes to opti-
427
This content downloaded from 128.122.186.36 on Mon, 9 Feb 2015 12:31:46 PMAll use subject to JSTOR Terms and Conditions

JOURNAL OF MARKETING RESEARCH, NOVEMBER 1996
mally allocate demonstration time to its potential customers, examining Figure 1, which relates the likelihood of purchase to the actual demonstration time, would leave the firm per- plexed, because this graph has two maxima. By conducting a meaningful segmentation, based on prior knowledge and familiarity of the consumer with the product and the subject matter, the firm can deduce the likelihood of purchase for the two segments and ascertain an optimal demonstration time for each segment.
We can postulate how different types of demonstration would apply to the different product groups. We suggest that a product with a slow rate of discovery of both high-level and low-level attributes should be demonstrated with the help of a salesperson to shorten the learning process. Func- tional products, whose high- and low-level attributes are learned quickly, can be demonstrated at the dealer's show- room for most of the potential customers. Only demanding customers who are extremely sensitive to quality or have high risk aversion should be offered a demonstration in their homes or offices after receiving a demonstration at the deal- er's showroom. Products belonging to the functional group category should be demonstrated differently at their differ- ent life-cycle stages: At the beginning of their life-cycle, more demonstrations should be offered in the customer's of- fice or home, whereas at the maturity stage, the proportion of demonstrations at the dealer's showroom should increase.
Finally, we concentrate on the phenomenon of product demonstration and do not consider the interactions between product demonstration, product sampling, and warranty. We believe that this constitutes an interesting avenue for further research.
APPENDIX
The Formal Model, Propositions, and Proofs
The consumer derives utility from wealth, W, and product of quality, Z. The consumer's total utility is U(W,Z). The product is an experience good of any of the first three cate- gories of Table 1. The price of the product of quality Z is R. After buying and using the product, there are two possible states of nature:
1. Si: the product is of high quality. 2. S2: the product is of low quality.
The interpretation of high and low quality includes match or mismatch of the product's performance with the con- sumers needs. Define the quality of Z at Sl as Z,. The prob- ability of Si is defined as p(S1). The quality of Z at S2 is Z2. The probability of S2 is p(S2), where p(S2) = 1 - p(S).
The expected utility of the consumer (calculated by the producer) if the product is purchased by the consumer is as follows:
p(Si)U(W - R, Zi) + p(S2)U(W - R, Z2)
If the consumer has perfect information about the product prior to buying it, he or she will not purchase the product knowing that it is of low quality, and will buy the product with probability of 1 if he or she knows the product is of high quality. Demonstration supplies the consumer with imperfect information; that is, the consumer might erro- neously predict the product to be of high quality, though
eventually it is of low quality, and vice versa. We define the state in which the potential consumer predicts after demon- stration that the product is of high quality as yl (and a pre- diction of low quality is defined as Y2). If we define t as time of demonstration, then yl will occur with probability of p(yl,t) and Y2 will occur with probability p(y2,t).
The conditional probability of predicting the product's qualities after demonstration is P(yi | Sj,t). It is the condi- tional probability that the consumer predicts after demon- stration that the product is of quality i (i = 1 is high quality and i = 2 is low quality) when the product is indeed of j qual- ity (j = 1 is high quality and j = 2 is low quality) and demon- stration time is t.
We calculate the probabilities by using Bayes' Theorem when the total probability of predicting that the product is of high quality is
P(Y , t) = p(Si)p(yl I SI, t) + p(S2)p(y I S2, t).
The probability of predicting that the product is of low qual- ity is
P(Y2, t) = (Si)P(Y2 I S, t) + p(S2)p(y2 I S2, t).
A consumer who predicts the product to be of high quality assumes that
p(SI I yl, t)U(W - R, Zi) + p(S2 I yl, t)U(W - R, Z2) > U(W).
Therefore, the probability of purchase, pr(t) is equal to the probability of predicting the product to be of high quality, that is,
pr(t) = p(Sl)p(y I S,t) + p(S2)p(y I S2,t).
The marginal probability of predicting that the product is of high (low) quality when the product is of high (low) quality is positive or negative according to the product categorization.
Proposition 1. The probability of purchase, pr(t) of play products will first increase with more demonstration time and then decrease, that is, the probability function has an inverted U shape.
Proof of Proposition 1. Define tl according to the following equation and let t2 be the point when p(yl | Sl,t)' approaches 0 and p(yl I S2,t)' < 0:
at time t < tl,p(yi I S,t < ti)' >0, p(y IlS2,t < ti)' >0,
at time t>tl,p(y I Sl,t>t)' > 0, p(yIS2,t>t)' <0.
The change in the probability of buying in response to addi- tional demonstration time is
pr(t)' = p(Sl)p(yl I S, t)' + p(S2)p(y I S2, t)'.
Placing the qualities of the product category into the previ- ous equation, we find that for demonstration time with length less than tl, we have the following:
p(Si)p(y I Sl,t < tl)' > 0, p(S2)p(y I S2,t < tO)' > 0,
hence,
pr(t)' > 0.
If we add more demonstration time we find that at time t > tl, there exist t2, where
428
This content downloaded from 128.122.186.36 on Mon, 9 Feb 2015 12:31:46 PMAll use subject to JSTOR Terms and Conditions

Demonstration Time
p(ll I SI,t > t2) -> 0,p(yl I SI,t > t2) <0.
Hence
p(SI)p(yl I Si, t > t2)- p(S2)p(y2 I S2,t > t2) < 0,
hence,
pr(t I t > t2)' < 0.
Proposition 2. The probability of purchase, pr(t) of func- tional and time products, behaves in the following manner:
a. If, before the demonstration, the consumer's a priori evalua- tion of the probability of the product as high quality is lower than the real value (known by the producer), then the buying probability will be an increasing concave function of time.
b. If, before the demonstration, the consumer's a priori evalua- tion of the probability of the product as high quality is higher than the real value, then the buying probability will be a de- creasing concave function of time.
The slope of the function will depend on the rate of the dis- covery of the attributes.
Proof of Proposition 2. Assume that before demonstration the producer knows that p(sl) > p(yl,t = 0). Let T the time interval be
limtT p(yl I Sl,t -> T) = 1 limt-T P(Y2 1 S2,t -> T) = 1.
At t = 0 we know that
p(yl,t = 0) = p(Si)p(yl I Sl,t = 0)
+ p(S2)p(y I S2, t = 0) < p(S).
When t approaches T then
limt_Tp(y1, t->T) = p(S )p(yI I S l,t-T)
+ P(S2)P(Y I S2,t->T)
= p(Si)p(yl I SI,t->T)
+ p(S2) - p(S2)p(y2 I S2,t-rT) = p(S1) + (S2) - (S2)
= p(S).
Hence, for every t in the interval [0,T),
p(y1,t) = P(SI)p(y I Sl,t)+ p(S2)p(Yl I S2,t) < p(SI).
Differentiation of the buying probability, p(yl,t) with respect to demonstration time yields
p'(y, t) = p(Si)p(yl I S, t)'- p(S2)p(Y2 1 S2, t).
Next, we assume that there exists an interval (tl,t2), where
p(S2)p(y2 I S2,t)' > p(SI)p(y I Si,t)'.
In this interval (t,t2) the following holds: p(y1,t)' < 0. Hence, the difference, p(Sl) - p(yl,t), increases. At the time of the demonstration, t approaches T and the difference, p(S ) - p(y ,t), approaches zero. Therefore, in the interval (t2,T) it follows that p(yl,t)' > 0. This reversal in the sign of the first derivative is contrary to our assumption that p(yl,t) is a monotonic function of t. Therefore, the first derivative is positive in the entire interval [0,T).
Next, we check the sign of the second derivative, by choosing a such that 0 < a < 1. In addition, we choose any
two points on the time axis t1, t2 such that tI < t2. From the concavity of p(yi | Sj,t) we know that
p(Si)p[yl I Si,atl +(1 -a)t2] > ap(Si)p(yl I Si,tl)
+(1- a)p(S)p(yl I SI, t2);
p(S2)p[Y I S2,a tl +(1 - a) t2] > p(S2)p(yl I S2, tl)
+(l - )p(S2)p(y I S2, t2).
Summing the two inequalities we get
p(S)p[y I S, a tl +( - a)t2] + P(s2)P[Yl IS2, a t +(l- a) t2]
> a[p(Si)p(yl I Si, tl) + p(S2)p(yl I S2, ti)]
+ (l - a)[p(S )p(yl I Sl, t2) + P(Y I S2, t2)]
Thus,
pr[a tl + (1 - a) t2l > apr(tl) + (1 - a)pr(t2).
Hence, pr(t)" < 0. With a long time of demonstration, the probability of pur-
chasing the demonstrated product converges to
Iimt-o p(Si)p(yj I S1)' + p(S2)p(yl I S2
= p(Si) I + p(S2) 0= p(Si).
Proposition 3. If there are two groups of consumers, one with prior knowledge of the product and the other without prior knowledge, then the firm has to invest less time in the group with prior knowledge than in the group without prior knowledge.
Proof of Proposition 3. Let p(ylj,t) define the probability that a member of segment j (j = 1 consumers with prior knowledge, j = 2 consumers without prior knowledge) would predict that the product is of high quality. We assume that consumers of both segments (the one with prior information and the one without prior information) are identical except in their prior knowledge. In particular, they have the same learning function and are interested in the same features.
Before demonstration, the manufacturer knows that
p(Si)> p(yjlt = 0),j = 1,2.
The segment with prior knowledge has more knowledge about the product than the second segment; therefore, the gap between their prediction and the actual situation is smaller than the gap of the segment without prior informa- tion. Formally,
P(yll,t = 0)> p(y12,t = 0).
There exist t' (t' > 0) such that
p(y,t = 0) =p(tl2, t=t').
For the segment with prior information, if the time need- ed to reach the maximum of the purchasing probability function is tl*, then the demonstration time needed to reach the maximum for the group without prior information is t2*, which is the equivalent to tI* + t'.
The relationship between the propositions and the hy- potheses are as follows: Hl is based on Proposition 1. H2 is based on Proposition 3. H3 is based on Propositions 1 and 3. H4 is based on Proposition 2a.
429
This content downloaded from 128.122.186.36 on Mon, 9 Feb 2015 12:31:46 PMAll use subject to JSTOR Terms and Conditions

JOURNAL OF MARKETING RESEARCH, NOVEMBER 1996
REFERENCES
Darby, M. R and E. Karni (1973), "Free Competition and the Optimal Amount of Fraud," Journal of Law and Economics, 16, 67-86.
Freedman, J. L. and S. C. Fraser (1966), "Compliance Without Pressure: The Foot in the Door Technique," Journal of Person- ality and Social Psychology, 18 (April), 195-202.
Gerstner, Eitan (1985), " Do Higher Prices Signal Higher Quali- ty?" Journal of Marketing Research, 22 (May), 209-15.
Jacoby, J., G. J. Szybillo, and J. Busato-Schach (1977), "Informa- tion Acquisition Behavior in Brand Choice Situations," Journal of Consumer Research, 3 (March), 209-15.
Jain, Dipak, Vijay Mahajan, and Eitan Muller (1995), "Determination of Optimal Product Sampling for the Diffusion of a New Product," Journal of Product Innovation Management, 12, 124-35.
Kalish, Shlomo (1985), "A New Product Adoption Model With Pricing and Uncertainty," Management Science, 31 (December), 1569-85
and Subrata K. Sen (1986), "Diffusion Models and the Marketing Mix for Single Products" in Innovation Diffusion Models of New Products Acceptance, Vijay Mahajan and Yoram Wind, eds. Cambridge, MA: Ballinger Publishing Company, 87-116.
Mahajan Vijay, Eitan Muller, and Frank Bass (1990), "New Prod- uct Diffusion Models in Marketing: A Review and Directions for Research," Journal of Marketing, 54 (January), 1-26.
Milgrom, Paul and John Roberts (1986), "Price and Advertising Signals of Product Quality," Journal of Political Economy, 94 (August), 786-831.
Monroe, Kent B. (1973), "Buyers' Subjective Perception of Price" Journal of Marketing Research, 10 (February), 70-80.
and William B. Dodds (1988), "A Research for Establish- ing the Validity of the Price Quality Relationship," Journal of the Academy of Marketing Science, 16 (Spring), 151-168.
and Susan M. Petroshives (1981), "Buyers' Perceptions of Price: An Update of the Evidence," in Perspectives in Consumer
Behavior, 3d ed., Harold Kassarjian and Thomas S. Robertson, eds. Glenview, IL: Scott, Foresman and Company, 43-55.
Narasimhan, Chakravarthi and Subrata K. Sen (1992), "Measuring Quality Perceptions," Marketing Letters, 3 (2), 147-56.
Nelson, Philip (1970), "Information and Consumer Behavior," Journal of Political Economy, 78, 311-29.
(1974), "Advertising as Information," Journal of Political Economy, 82, 729-54.
Padmanabhan, V. and Ram R. Rao (1993), "Warranty Policy and Extended Service Contracts: Theory and an Application to Au- tomobiles," Marketing Science, 12 (Summer), 230-47.
Pliner, P., H. Hart, J. Kohl, and D. Saari. (1974), "Compliance Without Pressure: Some Further Data on the Foot in The Door Technique," Journal of Experimental Social Psychology, 10, (January), 17-22.
Rao, Ashay R. and Kent B. Monroe, (1989), " The Effect of Price, Brand Name, and Store Name on Buyer's Perception of Product Quality: An Integrative Review," Journal of Marketing Re- search, 26 (August), 351-57.
Roberts, John H. and Glen L. Urban (1988), "Modeling Multiat- tribute Utility, Risk, and Belief Dynamics for New Consumer Durable Brand Choice," Management Science, 34 (February), 167-85
Scott, Carol A. (1976), "The Effects of Trial and Incentives on Re- peat Purchase Behavior," Journal of Marketing Research, 13 (August), 263-69.
Scott, Davis, Eitan Gerstner, and Michael Hagerty (1994), "Money Back Guarantees: Helping Market Experience Goods," working paper, University of California at Davis.
Tellis, Gerard J. and Birger Wernerfelt (1987), "Competitive Price and Quality Under Asymmetric Information," Marketing Sci- ence, 6 (Summer), 240-53.
Weinberger, M. G., B. Leland, and F. Brody (1994), Effective Ra- dio Advertising. New York: Lexington Books.
Zeithaml, Valarie A. (1988), "Consumer Perception of Price, Qual- ity, and Value: A Means-End Model and Synthesis of Evidence," Journal of Marketing, 52 (July), 2-22.
430
This content downloaded from 128.122.186.36 on Mon, 9 Feb 2015 12:31:46 PMAll use subject to JSTOR Terms and Conditions