Embed Size (px)
Citation preview

Prof. Martin Curley, Jim Kenneally
Using the IT-CMF to improve IT Capability and Value Creation: An Intel IT Case Study

Prof. Martin Curley, VP – Intel Corporation, Director – Intel Labs Europe, Co-Director – Innovation Value Institute
Jim Kenneally, Principal Investigator – Intel Labs Europe, Research Fellow – Innovation Value Institute
Keywords: Information Technology Management, IT-CMF, Business Value, Design Pattern, IT Capability Maturity Framework, Intel Corporation
1. An original version of this paper was first published in 15th IEEE International Enterprise Distributed Object Computing Conference, Conference Proceedings pp. 107-115, 2011. Copyright clearance received from IEEE for this publication.

The case study illustrates how the IT-CMF was used to measure capability improvements and provide intelligence on prioritizing improvement recommendations. The paper also discusses how practices contained within the IT-CMF helped articulate a business value improvement whilst more traditional metrics of IT performance may have not have represented.
Many people have argued that IT as a profession is like the cobblers children who have no shoes (Curley, 2004)[1] (Betz, 2006) [2] in that IT serves the business well in terms of using IT for business transformation whilst it is poor in using IT to manage itself.
CIOs are continually faced with challenges such as cost reduction pressure, the need to demonstrate continuing value, increased complexity, need for better agility, mounting security threats and so on. In this context CIOs have to deliver service excellence, support usage excellence and innovate all at the same time. Without a common framework or management practice body of knowledge (BoK) each CIO effectively has to devise their own solutions.
This paper briefly reviews the IT Capability Maturity Framework™ (IT-CMF™) (Curley 2007, 2008)[3, 4], Curley and Kenneally (2009, 2010)[4] whose development was originally spearheaded by Intel. The goal of the IT-CMF is to help provide a generally reusable solution to this commonly recurring problem of having to manage many conflicting challenges.
IT-CMF OverviewThe IT CMF can provide a way to help manage and solve the previously described complex and competing pressures, providing maturity roadmaps for value provisioning by the IT organization.
We define IT capability as the focused strategic deployment of IT resources and competencies in support of the organization’s goals – in summary, it is what the IT organization can collectively do for the enterprise. For the IT-CMF, critical capabilities (CCs) represent the key activities and procedures that must be defined and mastered to enable an IT organization to plan, deliver and run IT solutions, and to measure the business value outcomes of the IT organizational initiatives and daily activities.
Each CC refers to a specific set of integrated activities – leveraging behaviour, actions, methods and metrics in order to deliver specific outcomes in support of value creation. Critical capabilities (CCs) can be utilized to improve the maturity states and the overall IT capability of the organization.
Intel helped drive the development of the IT-CMF as our expected benefits included an integrated and holistic approach to IT management developed by an industry led consortium, standardised assessment tools, benchmarking capabilities and opportunities for sharing of best practices for defining improvement roadmaps.
Intel IT Organization – Case Study ContextIn 2006 the Intel CEO Paul Otellini introduced a new strategic initiative called SET (Structure and Efficiency Teams) with a goal of efficiency and taking $2–3 billion out of Intel costs to improve Intel’s bottom line. Intel IT was one of the first organizations to align and embrace this strategy; and the CIO introduced early redeployments and cost reductions to deliver IT’s share of this overall cost reduction goal.
In response to the corporate SET initiative, Intel IT was one of the first organizations to introduce cost reductions. Given the people intensity of IT organizations, it was inevitable that there was a significant reduction in IT personnel with a total reduction of circa 24% from 7,500 to 5,700 IT employees, between 2006 and 2008 inclusive. In parallel the total IT Budget and IT Budget as a percentage of revenue were decreased as shown in Figure 1.
Figure 1: Intel IT Budget and IT Employees
This case study describes how IT Capability Maturity Framework (IT-CMF) was used between 2007-2009 to help Intel IT navigate and track progress on IT capability improvement and value contribution from IT, whilst negotiating a strategic transition for the IT organization which involved significant downsizing and budget reduction.
Using the IT-CMF to improve IT Capability and Value Creation: An Intel IT Case Study
IT Budget IT Employees
IT Budget % of Revenue
-4%
3.66%
$ %
3.25%3.12%
7,500
2006 2007 2008 2006 2007 2008
6,500
-13%
-12%
Intel IT undertook a structure and e�ciency transformation (SET) initative during this period
5,700
-6%
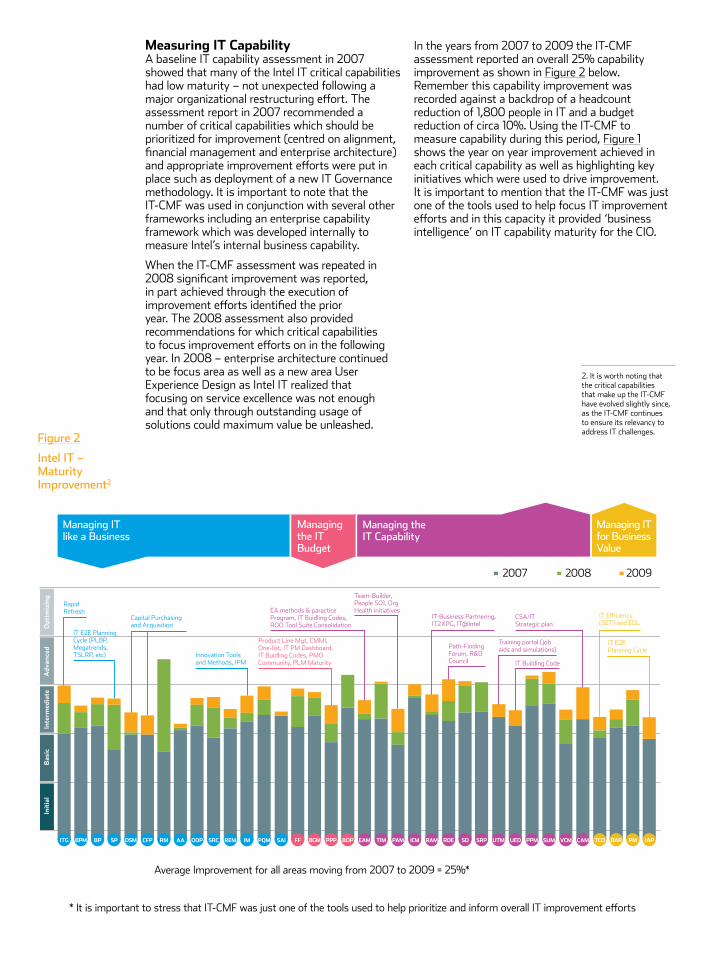
Measuring IT CapabilityA baseline IT capability assessment in 2007 showed that many of the Intel IT critical capabilities had low maturity – not unexpected following a major organizational restructuring effort. The assessment report in 2007 recommended a number of critical capabilities which should be prioritized for improvement (centred on alignment, financial management and enterprise architecture) and appropriate improvement efforts were put in place such as deployment of a new IT Governance methodology. It is important to note that the IT-CMF was used in conjunction with several other frameworks including an enterprise capability framework which was developed internally to measure Intel’s internal business capability.
When the IT-CMF assessment was repeated in 2008 significant improvement was reported, in part achieved through the execution of improvement efforts identified the prior year. The 2008 assessment also provided recommendations for which critical capabilities to focus improvement efforts on in the following year. In 2008 – enterprise architecture continued to be focus area as well as a new area User Experience Design as Intel IT realized that focusing on service excellence was not enough and that only through outstanding usage of solutions could maximum value be unleashed.
In the years from 2007 to 2009 the IT-CMF assessment reported an overall 25% capability improvement as shown in Figure 2 below. Remember this capability improvement was recorded against a backdrop of a headcount reduction of 1,800 people in IT and a budget reduction of circa 10%. Using the IT-CMF to measure capability during this period, Figure 1 shows the year on year improvement achieved in each critical capability as well as highlighting key initiatives which were used to drive improvement. It is important to mention that the IT-CMF was just one of the tools used to help focus IT improvement efforts and in this capacity it provided ‘business intelligence’ on IT capability maturity for the CIO.
Figure 2
Intel IT – Maturity Improvement2
Init
ial
Inte
rmed
iate
Ad
van
ced
Op
tim
izin
g
Managing IT like a Business
Managing the IT Budget
Managing the IT Capability
Managing IT for Business Value
ITG BPM BP SP DSM CFP RM AA ODP SRC IM PQM SAIREM EAM TIM PAM ICM RAM RDE SD SRP UTM UED PPM SUM VCM CAMFF BGM PPP BOP TCO BAR PM IAP
2007 2008 2009
Rapid Refresh
Average Improvement for all areas moving from 2007 to 2009 = 25%*
* It is important to stress that IT-CMF was just one of the tools used to help prioritize and inform overall IT improvement eorts
Bas
ic
IT E2E Planning Cycle (PLBP, Megatrends, TSLRP, etc)
Capital Purchasing and Acquisition
Innovation Tools and Methods, IPM
EA methods & paractice Program, IT Buidling Codes, ROO Tool Suite Consolidation
Team-Builder, People SO1, Org Health initiatives
IT-Business Partnering, IT2XPG, IT@Intel
Training portal (job aids and simulations)
IT Building Code
IT E�ciency (SET) and EDL
IT E2E Planning Cycle
Path-Finding Forum, R&D Council
Product Line Mgt, CMMI, One-list, IT PM Dashboard, IT Buidling Codes, PMO Community, PLM Maturity
CSA/IT Strategic plan
2. It is worth noting that the critical capabilities that make up the IT-CMF have evolved slightly since, as the IT-CMF continues to ensure its relevancy to address IT challenges.
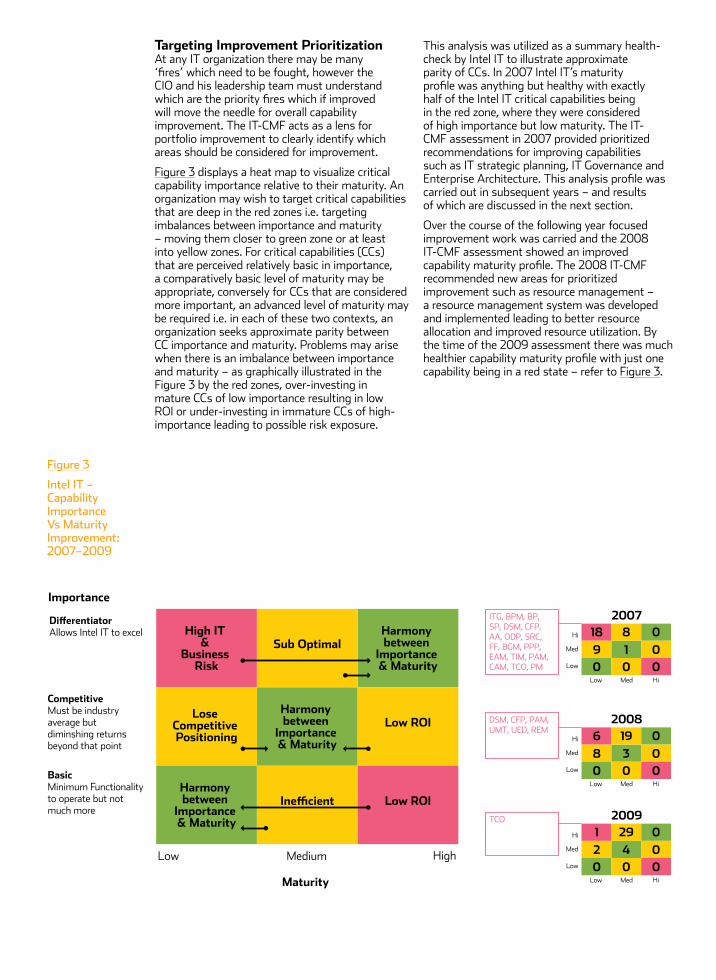
Targeting Improvement PrioritizationAt any IT organization there may be many ‘fires’ which need to be fought, however the CIO and his leadership team must understand which are the priority fires which if improved will move the needle for overall capability improvement. The IT-CMF acts as a lens for portfolio improvement to clearly identify which areas should be considered for improvement.
Figure 3 displays a heat map to visualize critical capability importance relative to their maturity. An organization may wish to target critical capabilities that are deep in the red zones i.e. targeting imbalances between importance and maturity – moving them closer to green zone or at least into yellow zones. For critical capabilities (CCs) that are perceived relatively basic in importance, a comparatively basic level of maturity may be appropriate, conversely for CCs that are considered more important, an advanced level of maturity may be required i.e. in each of these two contexts, an organization seeks approximate parity between CC importance and maturity. Problems may arise when there is an imbalance between importance and maturity – as graphically illustrated in the Figure 3 by the red zones, over-investing in mature CCs of low importance resulting in low ROI or under-investing in immature CCs of high-importance leading to possible risk exposure.
This analysis was utilized as a summary health-check by Intel IT to illustrate approximate parity of CCs. In 2007 Intel IT’s maturity profile was anything but healthy with exactly half of the Intel IT critical capabilities being in the red zone, where they were considered of high importance but low maturity. The IT-CMF assessment in 2007 provided prioritized recommendations for improving capabilities such as IT strategic planning, IT Governance and Enterprise Architecture. This analysis profile was carried out in subsequent years – and results of which are discussed in the next section.
Over the course of the following year focused improvement work was carried and the 2008 IT-CMF assessment showed an improved capability maturity profile. The 2008 IT-CMF recommended new areas for prioritized improvement such as resource management – a resource management system was developed and implemented leading to better resource allocation and improved resource utilization. By the time of the 2009 assessment there was much healthier capability maturity profile with just one capability being in a red state – refer to Figure 3.
Figure 3
Intel IT – Capability Importance Vs Maturity Improvement: 2007–2009
Harmony between
Importance & Maturity
Ine�cient Low ROI
Lose Competitive Positioning
High IT &
Business Risk
Harmony between
Importance & Maturity
Low ROI
Sub OptimalHarmony between
Importance & Maturity
Importance
Medium
Maturity
2007
HighLow
Low Med Hi
Low
Med
Hi
BasicMinimum Functionalityto operate but notmuch more
CompetitiveMust be industry average but diminshing returns beyond that point
DierentiatorAllows Intel IT to excel 18 8 0
00
10
90
ITG, BPM, BP, SP, DSM, CFP, AA, ODP, SRC, FF, BGM, PPP, EAM, TIM, PAM, CAM, TCO, PM
2008
Low Med Hi
Low
Med
Hi 6 19 000
30
80
DSM, CFP, PAM, UMT, UED, REM
2009
Low Med Hi
Low
Med
Hi 1 29 000
40
20
TCO

A key outcome of the 2006-2009 transformation was that Intel IT was able to move from a reactive organization to a proactive organization, with the CIO able to focus on making IT a strategic partner or indeed a corporate core competency, rather than having to focus on cost cutting and fire fighting. Whilst there was still some imbalance between the maturity and importance of Intel IT’s critical capabilities, as indicated by the number of capabilities in a yellow state, i.e. high importance and medium maturity, it is clear that by 2009 Intel IT’s capability maturity had stabilized significantly and this created the opportunity for Intel IT to become a more proactive IT organization, beginning to shift strategic focus to boosting business capability while continuing to maintaining or improve IT capability.
Looking forward, the 2009 Intel IT assessment recommended focused improvement efforts in five areas, Business Planning (BP), Enterprise Architecture Management (EAM), User Experience Design (UED), Services Provisioning (SRP) and Relationship Assessment Management (RAM). These areas were recommended for improvement following a review of the mapping between the gap between desired and actual maturity and rated importance of each critical capability i.e. by analysing the Importance Vs Maturity Gap.
This represented an evolution on the previously discussed analysis lens (Importance Vs Current Maturity) as many CCs had stabilized significantly over a number of time periods, a more acute analysis was considered to inform future CC selections for maturity improvement intervention. Figure 4 illustrates that the top-right quadrant should be the initial focus area i.e. those critical capabilities that are the most important and have the largest maturity gap (i.e. between current and future). Overlaying the organizational objectives may create dependencies across certain critical capabilities or neutralize them.
Figure 4 shows that seven areas appeared in the top right hand quadrant of the prioritization – just five of these were picked for prioritization as the rate of improvement of the IT Governance was deemed to be satisfactory that no additional improvement efforts were required beyond those already planned. Another area, User Management and Training was not specifically prioritized for improvement as the focus for improvement was on User Experience Design.
Tolerable StragglersLesser Importance / Lesser Maturity Gap
ExploreLesser Importance / Greater Maturity Gap
Primary Focus AreaGreater Importance / Greater Maturity Gap
Business
Budget
Capability
Value
0.50 0.75 1.00 1.25 1.50
OpportunityGreater Importance / Lesser Maturity Gap
High
Low
AA
BP
BPM
CFP
SRC
PQM
DSM
IM
AA
ITG
ODP
RM
SAI
REM
SP
CAM
VCM
ICM
EAM
PAM
PPM
RAMRDE
SRP
SD
SUM
TIM
UED
UTM
BGM
BOP
FF
PPP
BAR
IAP
PMTCO
Top Focus Areas = Business Planning, Enterprise Architecture, User-Experience Design, Service Provisioning ad Relationship Asset Management
Maturity Gap
Impo
rtan
ce
Priorities
Figure 4
Critical Capability Prioritization

IT Organizational ImpactIn the context of this case study a key question to be answered is whether the reported IT capability improvement actually translated into improved IT performance and value contribution. By examining key performance and business value metrics, it is evident that Intel IT achieved a higher ‘conversion effectiveness’ with improved IT capability leading to improved performance and business value results. Practices that Intel IT have used for Managing IT for Business Value have been described in several publications including (Curley, 2004)[1]; (Sward, 2007)[6]; (Curley & Kenneally, 2007)[7]. These practices enabled Intel IT first measure the business value contribution of IT and then improve it.
In particular Curley and Kenneally (2007)[7] describe ‘future yield’ as a measure of yield and indeed conversion effectiveness of IT. Future Yield is the future business value generated by IT, divided by the current budget of IT. (Not all CFOs may find this a useful measure, and indeed many IT organizations may not be in a position to reliably calculate the future value contribution of IT).
Intel IT’s experience in setting up an IT Business Value Program and then inculcating key business value practices into standard ‘modus operandi’ meant that this was a meaningful measure of IT’s conversion effectiveness or ability to convert IT budget into future value. Of course it should be recognized that much of the value that comes from IT spend is in keeping the business running.
Figure 5 shows that both IT effectiveness and value contribution improved. A key efficiency and effectiveness indicator includes the contact resolution rate for employee calls achieved by Intel’s technical assistance centres. Despite the significant headcount and budget reduction, the contact resolution rate was improved and more significantly the cost per incident was reduced by more than 30% over the case study period. This reduction in cost per incident was a combination of several factors including improved processes and productivity in the technical assistance centres including the usage of more self-help approaches (Baldwin and Curley, 2007)[8]. The net result was improved business value capability and improved service.
Figure 5
Intel IT – Effectiveness
Service Desk
Contact Resolution Rate %*Cost per Incident $
-5%
93%
30
25
20
15
10
5
0
100
90
80
70
60
50
40
30
20
10
0
$ %
95% 95%
2006 2007 2008
Intel IT measures the value returned to Intel in the form of top-line growthand bottom-line improvements through an agreed business value methodology
* % Incodents resolved within Level 1 Support** Future Yield = forward looking Present Value of IT Investmentsdivided by the total IT budget*** Forward-looking business value for selected investments
-26%
$17
$23$25
Business Value Program
Future Yield**Business Value ***
+3%+4%
100%
1,400,000
1,300,000
1,200,000
1,100,000
1,000,000
900,000
800,000
700,000
600,000
500,000
400,000
300,000
200,000
100,000
0
120
100
80
60
40
20
0
$%
106%
119%
2006 2007 2008
$1.4m$1.34m$1.3m

Despite the headcount and budget reduction and the elimination of many lower value adding activities, Intel IT continued to operate its business value measurement area which by this time was an integral part of the IT finance processes for all large projects. Figure 5 shows that the new business value contribution grew to $1,400,000 and the IT yield grew to 119% by 2008 – being a function of increased business value and lower IT budget.
A measure of IT efficiency can be gauged from looking at an IT efficiency index and the data shown in the chart below. As shown in Figure 6 despite reduced headcount and budget, the volume of key services supported grew, in part supported by leveraging Moore’s law and in part by continued improvement in Intel IT.
In conjunction with the previous performance data, a value assessment instrument (Ross and Weill, 2006)[9] was utilized. It evaluates the importance of four particular goals and IT’s influence on the following key variables
/// Cost Effective Use of IT
/// Revenue Growth
/// Asset Utilization
/// Business Flexibility
Audio Conferencing (millions of minutes per month)
Instant Messaging Users (thousands)
Email Accounts (thousands)
Email Messages (million per month)
Intel Sites
LAN Portal (thousands)
WLAN Tra�c (terabytes per month)
Backup Data Stored (terabytes per month)
A proxy for the IT e�ciency of an IT organisations in the ratio of change
in the scope or scale of the IT services delivered relative to the total IT budget
39 70 95 137 144258
467
812
35 34 81 121 148 150
464
2,183
4,784
80 122 143 146381
1,587
3,232
2006 2007 2008
Figure 6
Intel IT – Efficiency

These indicators are rolled up to give an overall score out of 100. Figure 7 demonstrated a circa 30% improvement over the same time period.
One of the key metrics often tracked by CFO’s and CIO’s is the IT spending per employee. If this metric had just been used as a measure of IT productivity it would have unfairly positioned Intel IT’s performance. Whilst Intel IT reduced costs and employees significantly, Intel overall reduced its workforce by nearly 20,000 employees and consequently the IT spending per employee increased as shown in Figure 8.
While Intel has a stated goal of investing less than 3% of company revenues in IT and has been actively managing towards this, the impact of the global economic downturn on company revenues has had an adverse impact on a relative IT spending comparison against a decline in company revenue mark – refer to Figure 9.
Many of the traditional metrics continue to be important on what and where IT spends its budget (remember you have to start at the bottom of the maturity curve before moving up); however, we seek to fully represent both IT efficiency and value delivery as discussed in previous sections. Business demands more from IT than cost control, they need competitiveness enabled by a mature IT capability.
In summary, the net result of the transformation was both improved IT effectiveness and efficiency, improved IT conversion effectiveness and increased business value.
ConclusionThis paper has briefly described the IT-CMF, representing a generally reusable solution to commonly recurring problems, assisting CIOs to manage many challenges simultaneously. The case study describes how the IT-CMF help baseline, benchmark and inform focused improvements of Intel IT’s capability and value contribution. The net result was that despite significant budget and headcount costs, Intel IT actually improved its overall capability by 25% and increased its conversion effectiveness by 19%3 - when traditional IT financial metrics would have failed to appreciate. Through the transition from 2007 to 2009, Intel IT was able to move from being a reactive to a proactive IT organization with a key focus on creating business value. The Intel IT annual performance report of 2009 (Intel IT, 2009) [10] demonstrated strong overall performance and that IT was well positioned to help Intel succeed in the future.
+17%
2006 2007 2008
+13%
7163
54
2006
Spen
ding
in U
S D
olla
rs
Num
ber o
f Em
ploy
ees
2007 2008
$13,633$12,940
2009
$14,026$12,010
$15,000
12,000
9,000
6,000
3,000
0
$95,000
76,000
57,000
38,000
19,000
0
94,10086,300 83,900
78,900
2006
IT S
pend
ing
2007 2008
3.28%3.25%
2009
3.42%3.66%
4%
3%
2%
1%
0%
Figure 7
Assessed Value Performance of IT
Figure 8
IT Spending Per Employee
Figure 9
IT Spending Against Revenue
3. It is important to stress that the IT-CMF was just one of the tools used to help prioritize and inform overall IT improvement efforts at Intel IT.

AcknowledgmentThe authors acknowledge the contribution of Intel IT employees who contributed to the development and deployment of the IT-CMF at Intel. Also, thanks are due to Intel IT’s Chris Peters and Ilene Aginsky for their review of the original paper[11], of which this paper summarises.
References1 Curley, Martin, Managing IT for
Business Value, Intel Press, 2004
2 Betz, Charles, Architecture and Patterns for IT Service Management, Resource Management and Governance Morgan Kaufmann, 2006
3 Curley, Martin, ‘Introducing an IT Capability Maturity Framework’, in Cardos, J, Cordeiro, J and Filipe, J, (Editors) Proceedings of the Ninth International Conference on Enterprise Information Systems, Madeira, Springer, 2007
4 Curley, Martin (2008). The IT Capability Maturity Framework. PhD Dissertation, National University of Ireland, Maynooth
5 Curley, Martin and Kenneally, Jim, The IT Capability Maturity Framework, Innovation Value Institute, National University of Ireland, Maynooth, 2009, 2010
6 Sward, David, Measuring IT for Business Value, Intel Press, 2007
7 Curley, M; Kenneally, J, ‘Methods and Metrics to improve the Yield of IT using the IT-CMF – an Intel Case Study,’ Exploring Quantifiable IT Yields, 2007. EQUITY ‘07. IEEE International Conference on, vol, no, pp.27–38, 19-21 March 2007
8 Baldwin, E. and Curley, M, Managing IT Innovation for Business Value. Intel Press, 2007
9 Ross, JW, Weill, P, and Robertson, D, Enterprise Architecture as Strategy: Creating a Foundation for Business Execution (Harvard Business Press), 2006
10 Intel IT, IT Annual Performance Report; Delivering IT Business Value, Intel Corporation, 2009
11 Curley, Martin; Kenneally, Jim; (2011), ‘Using the IT Capability Maturity Framework to Improve IT Capability and Value Creation: An Intel IT Case Study’, 15th IEEE International Enterprise Distributed Object Computing Conference, Conference Proceedings pp. 107–115, 2011


www.ivi.ie