Embed Size (px)
Citation preview

To immerse or not?Experimenting with two
virtual retail environmentsSavvas Papagiannidis
Newcastle University Business School, Newcastle upon Tyne, UKEleonora Pantano
The Business School, Middlesex University, London, UKEric W.K. See-To
Department of Industrial and Systems Engineering,Hong Kong Polytechnic University, Kowloon, Hong Kong
Charles DennisThe Business School, Middlesex University, London, UK, and
Michael BourlakisCranfield School of Management, Cranfield University, Cranfield, UK
AbstractPurpose – The purpose of this paper is to examine the determinants of users’ simulated experience in avirtual store and to show the subsequent impact of that experience on engagement. The outcome of thatengagement is examined in relation to enjoyment, satisfaction and purchase intentions.Design/methodology/approach – The method comprised an experiment comparing users’ perceptionsof a standard 2D online clothing store with an enhanced, immersive one that aimed to provide shopping valueapproaching that of a traditional store by using a 3D experience where participants wore special glassesand a data glove.Findings – Results demonstrate the major role of telepresence components in simulated experience andthe critical role of that experience, along with hedonic and utilitarian values, in engagement. Purchaseintention is influenced by satisfaction, which is in turn influenced by enjoyment and engagement.Engagement in turn is influenced by utilitarian and hedonic value and the experience of productsimulation or telepresence, which is composed of control, colour and graphics vividness, and 3Dauthenticity. In the immersive, 3D environment, experience is more associated with engagement andenjoyment, leading to greater purchase intention. The immersive, 3D environment, thus, has thepotential to rival traditional shopping in terms of experience, resulting in higher sales for retailers andsatisfaction for consumers.Originality/value – This work has evaluated a robust model of purchase intention and demonstrated it tohold not only in a 3D environment on a conventional computer platform, but also in an immersive one, whereparticipants wear special glasses and a data glove.Keywords Simulation, Online shopping, E-commerce (B2B/B2C/B2G/G2C), Virtual worldPaper type Research paper
Information Technology & PeopleVol. 30 No. 1, 2017
pp. 163-188Emerald Publishing Limited
0959-3845DOI 10.1108/ITP-03-2015-0069
Received 31 March 2015Revised 31 January 2016
Accepted 8 February 2016
The current issue and full text archive of this journal is available on Emerald Insight at:www.emeraldinsight.com/0959-3845.htm
© Savvas Papagiannidis, Eleonora Pantano, Eric See-To, Charles Dennis, Michael Bourlakis. Publishedby Emerald Publishing Limited. This article is published under the Creative Commons Attribution (CCBY 4.0) licence. Anyone may reproduce, distribute, translate and create derivative works of this article(for both commercial & non-commercial purposes), subject to full attribution to the original publicationand authors. The full terms of this licence may be seen at http://creativecommons.org/licences/by/4.0/legalcodeThe work described in this paper was partially supported by a grant from the Department of
Industrial and Systems Engineering, Hong Kong Polytechnic University, Hong Kong, China(Project No. G-YBE4).
163
Virtual retailenvironments

1. IntroductionTraditional store retailers have long used retail “atmosphere” or environment stimulus cues,such as colour, music and aroma, to influence consumers’ shopping behaviour (Mehrabian andRussell, 1974). In recent years, several disruptive patterns have dramatically changed the retailindustry, while pushing traditional retailing to evolve in terms of structure (Pantano, 2014).e-Retailers are using atmospherics to compensate for the lack of a physical environment,including graphics, visuals, audio, colour, video (Dennis et al., 2009; Eroglu et al., 2003) and,centrally to this study, three-dimensional (3D) virtual reality, which we term the “immersiveretail environment” (Laria and Pantano, 2012). In this scenario, Bourlakis et al. (2009) identifiedmetaverse retailing as an evolution of electronic retailing, representing a shift from a productorientation to a consumer experience orientation. User experience in retail settings emergesfrom the interactions consumers have with a product, environment and retailer, and it has aholistic nature involving cognitive, affective, emotional, social and physical responses to theretail environment (Verhoef et al., 2009). This experience might be influenced by both elementsunder retailer control (e.g. assortment, price, layout, etc.) and other factors that cannot bemanaged by retailers (e.g. shopping motivations, etc.). The adoption of technologies mightinfluence these factors and encourage consumers to shop online.
Advances in information technology empower consumers with efficient new tools forevaluating the products online, while providing realistic, engaging online shopping experienceswhere consumers directly interact with products without direct employee assistance (Blazquez,2014). Hence, even the e-commerce environment is able to provide new virtual and excitingexperiences for consumers with consequences for brick-and-mortar stores. A new challengearises in this new competitive scenario, which is the need to rethink the in-store shoppingexperience through the support of technologies, by providing innovative advances intouch-points including the integration of online tools and automatic systems (i.e. self-serviceand recommendation technologies). Moreover, recent advances in technology also provide newtools for enhancing consumers’ shopping experiences by integrating virtual worlds withintraditional brick-and-mortar stores. Nonetheless, there is still scope for further research intoretailing in virtual worlds (Lee and Domina, 2013) which has so far been primarily concernedwith shopping of virtual rather than real-world products (Guo and Barnes, 2011).
In this research, we build upon recently published work by Papagiannidis et al. (2013)that examines a number of ways of modelling the determinants of users’ simulatedexperience in a virtual store and the impact of engagement, enjoyment and satisfaction aswell as purchase intentions. We expand this work by adopting the suggested optimummodel (Papagiannidis et al., 2013) and extending the context to an immersive 3D retailstore environment enabled by virtual reality technology, where participants wearspecial glasses and a data glove. The impact of technology factors, and the subsequentsimulated retail experiences on user engagement and enjoyment are compared andcontrasted for the two different resolutions for each of the environments. Given that thelocus of customer value is shifting from product and service to experience and interaction(Prahalad and Ramaswamy, 2004), such a comparison is important as it cannot beassumed that access via different technologies to the same virtual space will producethe same result. Overall, we aim to test current theory by cross-analysing and extending theapplication of a specific model within two virtual retail environments (2D vs 3D desktopenvironments). Our work fills a gap in the contemporary literature by testing a theoretical,integrative model which takes into account a range of attributes (e.g. hedonic value, utilitarianvalue, etc.) leading to simulated experience and, in turn, it examines their impact on variousoutcomes including purchase intention. Hence, our key contribution is the provision of atheoretical path which maps consumer behaviour in relation to various attributes andexamines the process leading to purchase intention. By cross-analysing this integrativemodel/theoretical path within two virtual retail environments (the second – immersive
164
ITP30,1

3D-being a recent and novel one), we aim to provide new theoretical and practical insights intoimmersive environments and make a key contribution to this field of study.
The paper continues by presenting the relevant literature review and the model adopted.It will then discuss the methodology followed, especially when it came to using stereoscopictools for 3D visualisation. Following this, we present the results of the experiments anddiscuss the implications for theory and practice.
2. Literature reviewAlthough 3D-based retail environments can potentially operate as stand-alone systems, it isonly through virtual worlds that they have become more prominent as the latter extendedtheir reach and importance. Social virtual worlds are immersive, persistent, shared, computer-mediated 3D environments, designed for real-time social interaction (in the context of varyingapplications such as education or business) and entertainment, where the users arerepresented by individual avatars (Bartle, 2004; Zhou et al., 2011). These worlds extend ourphysical universe by adding new dimensions and domains for economic, social and leisureactivities (Papagiannidis et al., 2008). Not surprisingly, among these activities shopping, invarious forms and shapes depending on the world’s theme, features high in user preferences.Virtual commodities can act in essentially the same social roles as material goods, with usersconsuming virtual goods in order to express themselves and their identities, establish a socialstatus, mark group membership, etc. (Lehdonvirta et al., 2009). Virtual retailing oftenresembles the traditional approaches, but is not bound by them and can go beyond them.When conduits between the real and the virtual exist, retailers are encouraged to considersuch worlds as potential interfaces for their online arms. For instance in Second Life, one of thewell-known social virtual worlds, it is possible to exchange real money for Linden dollars andpurchase virtual good with them and vice versa. Many real organisations have entered suchworlds, which first raised questions about the similarities and differences of the delivery ofretailing in virtual worlds, in the bricks-and-mortar world, and on the internet and secondwhether retailing in virtual worlds would ever scale to become a future 3D platform forelectronic commerce (Messinger et al., 2009). A few have even attempted to integrate theiroffline operations with the virtual world ones (Papagiannidis and Bourlakis, 2010).
Accessing such 3D worlds was achieved through a flat interface, i.e. a computer monitor,which did not offer a 3D perspective and interaction. With technology rapidly advancingone could envisage that it is only a matter of time until virtual worlds can be experienced ina truly 3D manner. This could in turn enhance user engagement and immersion.For example, televisions that support 3D viewing using appropriate glasses can now befound in consumers’ living rooms. This transition can significantly alter user behaviour,which has typically been studied in the context of the established virtual worlds (see e.g.Barnes et al., 2015; Domina et al., 2012; Gadalla et al., 2013; Krasonikolakis et al., 2014).Studying the differences between these two approaches is important in appreciating thepotential changes technological advances and retail innovations can result in. This hassignificant implications as novel, exciting and engaging shopping experiences canpositively affect consumer buying behaviour (Pantano and Naccarato, 2010). In fact, theretail industry is witnessing constant changes prompted by the continuous progress ininformation and communication technologies. For instance, augmented reality and haptictechnologies, social networks, mobile technologies and multichannel environments highlightthe heterogeneity of the innovative systems to be introduced for enhancing the retailprocess, and in turn, they deliver new stimuli while providing innovative sensorialexperiences able to communicate and promote products, services, and firms (Demirkan andSpohrer, 2014; Kaplan, 2012; Kushwaha and Shankar, 2013; Pantano and Viassone, 2015).Hence, these innovations can be viewed as enablers of change that have dramaticallymodified the retail landscape (Hopping, 2000; Pantano, 2014); they are able to provide new
165
Virtual retailenvironments

entertaining experiences for consumers, while integrating leisure, technologies and retailestablishments (Demirkan and Spohrer, 2014; Jones, 1999; Pantano and Viassone, 2015;Poncin and Mimoun, 2014). Consumers show an increasing desire to have a more engagingexperience while shopping. This implies that the consumers have high level of expectationstowards technology-based innovations able to support them (utilitarian value) whileentertaining them (hedonic value). Hassouneh and Brengman (2011) found that users had anoverall positive perception when it came to use a virtual world such as Second Life forshopping, concluding that this was not though just attributed to the virtual worlds’characteristics but also to the fictitious possibilities offered by such worlds. Consequentlysuch positive perception may not apply if the user is looking to purchase products for real use.
In the next section, we present our conceptual model for studying user expectationsand overall experience and how they affect shopping intentions. We also undertake acomparison between a 2D and a 3D retail environment in order to examine the relativeimportance of space and interactivity.
Conceptual model and hypothesesThe term “telepresence” was introduced by Minsky (1980), indicating the degree to which auser feels “transported” via a virtual “tele-porting system”. More recently, the termtelepresence has been used to describe the sense of being “transported” by a newtechnology. Hence, this construct describes the sense of presence within an interactiveenvironment, and it is often used as an antecedent of user experience (Sukoco andWu, 2011).Fiore, Kim and Lee (2005) propose three key determinants of telepresence: “the ability tocontrol the relationship of one’s senses to the stimulus” (control), “the ability to modify thestimulus” in order increase the realism and excitement of the experience (colour andgraphics vividness) and finally “the extent to which online sensory informationapproximates the real world stimulus” (3D authenticity), which refers to the degree towhich the virtual environment may imitate the real one for products and services. Similarly,Sheridan (1992) suggests that virtual model technology will involve all three determinants,while Sukoco and Wu (2011) based the telepresence concept on control and interactivity.Previous research found evidence that behavioural control (or controllability), in otherwords users’ confidence, is their ability to use a certain technology, serves as the basis forthe individual’s intention to use a certain system (Hernandez et al., 2009; Kim et al., 2011).Vividness might affect users’ emotional states, by providing hedonic pleasure to users,reducing their anxiety in using the technology, perhaps leading to increased time spentonline and repeat visits (Shih, 1998; Koufaris, 2002). Finally, there is authenticity.As frequently demonstrated in the tourism industry, virtual reality has the potential toprovide virtual experiences that consumers may accept as substitutes for real products(Guttentag, 2010; Dennis and Jayawardhena, 2010). Past studies on consumer behaviour havefurther emphasised the trade-off between utilitarian value and hedonic value emerging inshopping experience, with the balance potentially influencing the purchase intention (Olsenand Skallerud, 2011; Fiore and Kim, 2007). Utilitarian values characterize consumers who tendto employ cognitive processing for achieving the shopping purpose; thus, these values helpconsumers to save time, reduce effort while shopping (e.g. when comparing or choosing a certainproduct) (Fiore, Kim and Lee, 2005; Dennis et al., 2010). On the other hand, hedonic valuesconcern the emotional state emerging from the experience, and may include all elements thatcause a state of pleasure, such as colour, graphics, animation and other design elements(Coursaris et al., 2008; Al-Qeisi et al., 2014; Vila and Kuster, 2011). In other words, hedonic valuesemerge from fun, enjoyment, entertainment and excitement while interacting with the virtualenvironment, whereas the overall virtual experiences engage consumers and influence theirpurchasing behaviour (Fiore, Jin and Kim, 2005). In the specific context of this current study,prior research reports the influence of hedonic aspects while consumers interact with products
166
ITP30,1

in virtual environments developed for apparel shopping (Kim and Forsythe, 2007). Findingsreveal that consumers’ positive attitudes are elicited by both utilitarian and hedonic valueemerging from the use of the technology, emphasising that when consumers use a technologydesigned to provide hedonic benefits, they tend to have hedonic motivations rather thanutilitarian ones. The idea of “engagement” has been reported in several contexts includingpsychology, computer science and sociology over the last decade. In particular, engagementconsists of a psychological state including involvement and effective usage of cognitivecapabilities, as well as creativity (Mollen and Wilson, 2010). Engagement can be classified intotwo different levels: low and high (Vorderer, 1992). For instance, a user interacting with aproduct in a real environment involves a high level of engagement, while someone just watchingthe user interacting with the products has a low level of engagement. Verhagen et al. (2015) havefound that cognitive, social integrative and hedonic benefits appear to be significant in theirinfluence on customer engagement intentions when it comes to virtual customer environments.
Although some technology-oriented perspectives consider shopping media simply ascold information systems, rather than as immersive, hedonic environments, the currenttrend is to develop new technologies that are able to provide immersive and engagingexperiences. Consumers may live through these highly interactive, realistic interfaces,which can make such interfaces key elements for influencing consumers in the direction ofbuying products with strong hedonic attributes (Childers et al., 2001). Of course, hedonic andutilitarian experiences do not necessarily exclude one another; thus, the new retailenvironment might elicit both types of experience in different ways. The model developedfor this paper (Figure 1) proposes that the dimensions of telepresence, such as control,3D authenticity, colour and graphics vividness positively impact on a user’s experience and,in turn, along with utilitarian and hedonic values, positively affect engagement.
Previous studies have investigated to what extent a simulated experience supports thelearning process, enriches shopping activity and improves overall experience, consumers’satisfaction and loyalty (Algharabat and Dennis, 2010b; Pantano and Servidio, 2012).A high level of telepresence encourages consumers to believe that they are more informedabout a certain product, by eliciting more positive behaviours towards it (Mollen andWilson, 2010). To achieve this goal, it is important to provide highly interactive virtualenvironments (Steuer, 1992), by substituting the actual experience of the products with theopportunity to interact with the product virtually. Thus, the virtual route can frequentlyoffer more options than can be provided in the real context. For example, the virtual
Colourvividness
Graphicsvividness
3Dauthenticity
Engagement
Control
Hedonicvalue
Utilitarianvalue
Simulatedexperience
Enjoyment
SatisfactionPurchaseintention
Source: Papagiannidis et al. (2013)
Figure 1.Conceptual model
167
Virtual retailenvironments

context can allow users to directly interrogate the product about the manufacturingprocess or visualise the raw materials, etc. (Fiore, Kim and Lee, 2005). Prior researchdemonstrates that interactive marketing supports consumer’s decision-making processes,improves consumer relationships and facilitates the development of more efficientcustomised marketing strategies (Yoo et al., 2010). On the other hand, the rich environmentand audio-visual stimuli that 3D worlds offer can be a distraction for users whenattempting to complete tasks (Nah et al., 2011).
In the current model, simulated experience serves as an intermediate variable betweentelepresence factors and user engagement. Thus, as technology develops, the performanceof telepresence elements such as control and graphics improves. As a consequence, theimportance of those elements decreases, despite their important role in the effectiveness ofsimulation. Recent studies demonstrate greater effects of 3D product visualisation onconsumers’ attitudes as compared to the effects of traditional 2D internet advertising(Lee, 2012). Current advances in 3D graphics provide new tools for enhancing the realism ofvirtual experience and make it more similar to the real one. This is achieved by reducing theperceptual distance between the real and the virtual scenarios, developing an efficient matchbetween physical and the digital stores (Laria and Pantano, 2012; Houliez, 2010), byenhancing the sense of being in the environment while interacting with it (Parke, 2005).Amongst other advantages, 3D retail stores add emotional expressiveness (Gadalla et al.,2013) and can enhance social experience (Mäntymäki and Salo, 2011; Verhagen et al., 2012).3D virtual experiences allow consumers to view products from different perspectives, anglesand distances, as well as explore the different functions and feature of available products( Jiang and Benbasat, 2004) with benefits for positive evaluations of the product. Similarly,the vividness of graphics positively stimulates the user’s sensory perceptions through anincreased level of interactivity (Cheng et al., 2014), by supporting mental imagery formation(Choi and Taylor, 2014), with benefits for consumers’ potential to remember products andgain confidence in the online shopping process (Lee, 2012). Hence, the quality of graphicsenhances the realism of the experience and the feeling of interaction within the realenvironment, while the high level of controllability provides users with a customised andcomfortable experience, which may be able to reduce the constraints associated with thelack of physical contact with the product. The quality of the virtual experience, prompted bythe quality of visual effects and functionalities (i.e. high level of interactivity), pushes usersto a psychological state where they perceive the environment as authentic (Malliet, 2006).Authenticity is a subjective concept, which users may perceive differently accordingly to thecontext and their personal attitudes towards the technology. Thus, authenticity is linked touser acceptance of the virtual experience (Guttentag, 2010). Accordingly, it is based on apsychological state in which the virtual environment and objects are perceived by users asactual (Algharabat and Dennis, 2011). To achieve this perception, the technology needs to beable to mimic or simulate the experience in the bricks-and-mortar environment, in otherwords to provide an authentic (virtual) reproduction of the offline experience. Hence, theconcept of 3D authenticity relates directly to the users’ daily lives, depending on the abilityof virtual environment to describe something real (Malliet, 2006). Summarizing thesearguments, we propose the following hypotheses:
H1(a-d). Higher levels of (a) control, (b) colour vividness, (c) graphics vividness and (d)3D authenticity will be directly associated with increased levels of simulationexperience.
H1e. Higher levels of simulation experience will be directly associated with increasedengagement with the simulated retail environment.
H1f. Utilitarian experience will be directly associated with increased engagement withthe simulated retail environment.
168
ITP30,1

H1g. Hedonic experience will be directly associated with increased engagement with thesimulated retail environment.
Flow theory suggests that user experience, engagement and enjoyment might beantecedents of satisfaction, with the main goal of modern retail environments is to createsuperior consumer experiences (Verhoef et al., 2009). Flow is defined as “the state in whichpeople are so intensely involved in an activity that nothing else seems to matter; theexperience itself is so enjoyable that people will do it even at great cost, for the sheer sake ofdoing it” (Csikszentmihalyi, 1990, p. 4). This differs from the concept of telepresence, used inthe preliminary stage of our model, as telepresence refers to the feeling of being there(a feeling of immersion within the environment) (Weibel and Wissmath, 2011), whereasflow refers to the feeling of being involved in an action, engagement and enjoyment(Ghani and Deshpande, 1994). Past studies exploited these constructs in several fields(Bakker et al., 2011; Handelsman et al., 2005; Hu and Hui, 2012). Engagement and enjoymentcan be produced by the characteristics of the website, such as telepresence and simulatedexperience. In the context of social virtual worlds, flow has been found to significantly affectintentions to purchase, but telepresence did not do so (Animesh et al., 2011).
In turn, engagement is a driver for enjoyment and consumer satisfaction. Prior studieshave empirically highlighted engagement as an antecedent of user satisfaction (Hu and Hui,2012; Kim et al., 2013). The effectiveness of virtual environments is associated withenjoyment and entertainment, which are in turn positively correlated with user satisfaction(Pantano and Servidio, 2012; Kim and Forsythe, 2007). Also, past research found that socialvirtual worlds’ continuance intentions depended on user satisfaction, which is in turn afunction of utilitarian, hedonic and social benefits (Zhou et al., 2012, 2014; Verhagen et al.,2011). Starting from the key role of consumer satisfaction in building and maintainingloyalty (Yoo et al., 2010), end-user satisfaction emerges as the basic element of everyuser-system interaction, acting as a performance measure of the system (Van Vugt et al.,2009). Much prior research focusses on hedonic and utilitarian shopping values as shoppingmotivations and the value of shopping experience, yet little attention to date has been paidto the outcomes of shopping value in terms of consumers’ behaviour ( Jones et al., 2006).To fill this gap, our research provides an integrated framework of analysis of the entireprocess, mapping consumer behaviour from a new experience in the virtual environment tothe final purchase intention. Given the experimental setup of our study, purchase intentionrefers to the overall intention of participants to buy the products on offer (in our caseapparel) after they have experienced the virtual environment. Several studies investigatingboth online and offline retail settings reveal the strong causal relationship betweenconsumer satisfaction (and experience) and the subsequent purchase intention (e.g. Croninet al., 2000; Yang and Wu, 2009; Hausman and Siekpe, 2009). The proposed relationships areillustrated schematically in Figure 1. Based on the above, we hypothesise that:
H2. Engagement will be directly associated with increased enjoyment derived from thesimulated retail environment.
H3. Enjoyment will be directly associated with increased satisfaction with the simulatedretail environment.
H4. Engagement will be directly associated with satisfaction with the simulated retailenvironment.
H5. Satisfaction with the simulated retail environment will be directly associated withintention to purchase.
It has long been known that shopping is not just about obtaining tangible products but alsoenjoyment and pleasure (Martineau, 1958), and that an enjoyable shopping experience is
169
Virtual retailenvironments

often reflected in higher shopper satisfaction and spending (e.g. Donovan et al., 1994; Jones,1999). This is the basis of the “retail theatre” concept, where “[…] the experience revolvesaround the customer as if he or she were a critical component of a grand theatrical fantasy”(Healy et al., 2007, p. 756). Healy et al. (2007) also note that retail theatre concerns thedynamic element of an experiential environment (as with the immersive 3D environment inour virtual retail store), where a human interacts with aspects of the environment.Therefore, we expect that an immersive 3D environment will create higher levels ofengagement, enjoyment and satisfaction, leading to greater purchase intention:
H6. For consumers experiencing an immersive 3D environment, there will be a greaterinfluence of (a) simulated experience on engagement, (b) engagement on enjoyment,(c) enjoyment on satisfaction and (d) satisfaction on purchase intention than forthose exposed to the 2D desktop.
3. MethodA new virtual retail environment was developed for this study, offering more of a high levelof presence prompted by the realistic interface and 3D graphics, enhancing the feeling ofimmersion in the system. The first phase of the study was to create a 3D virtual desktopapplication, which has been further compared with an immersive 3D application.
The 3D model of the building containing the store, which was created by an architecturalCAD software programme, with the objects being imported and modified through 3Dmodelling software in order to develop the basic features for the 3D real-time simulation andthe effective store. The 3D modelling software made it possible to identify and set the basicobjects’material and related features, which were better defined in the subsequent step throughthe simulation software for the recognition of the optical characteristics of the objects, such asshadows, reflections, α blending for transparency or bumpmapping. Therefore, a more realisticenvironment was developed through the render-mapping technique, which consisted of thegeneration of ray-traced images used as textures. Afterwards, the illumination was defined,thus, it was possible to set up the rendering engine parameters and apply the render-mapproperty to the objects. In this way, the ray-tracing engine created the images on which all theoptical effects were mapped. The images have a 4,096× 4,096 pixels resolution in PNG formatand contain each single face shading property of the object. In addition to the shadows, most ofray-traced effects were pre-computed, such as ambient occlusion and global illumination. Theseimages were applied to the 3D objects within the real-time environment in order to achieve agood final rendering. The environment could be accessed and browsed through a joystick.
To show the effect of immersion on consumer behaviour, we also created an immersiveenvironment that would overcome the traditional boundaries of desktop applications(such as the limited input devices, the unrealistic interaction through joysticks, etc.).The immersive store was modelled starting from a basic planimetric map of the virtual storeincluding two floors (Plate 1). Objects were created on the basis of standard primitives, andthen refined through additional tools. This procedure makes it possible to achieve a betteroutcome, in terms of the limited number of required polygons while keeping the maximumcontrol of the 3D object topology. The added emphasis on the characteristics of objects interms of materials and surfaces improves the realism of the final models, with emphasis onlighting and colour. The visual effects of such objects were further defined includingtransparency, reflections or bump mapping for the multi textured layered materials. Thestore featured transparent stairs, a lift (with transparent walls and door), and a few boothslaid out as partitions, shelves and corridors that users can explore, as in a physical store.The final outcome is a realistic model loaded into the stereoscopic system. Quest3D softwareallows the effective development of the real-time application, as well as the programming ofthe whole virtual environment through a building-blocks paradigm.
170
ITP30,1
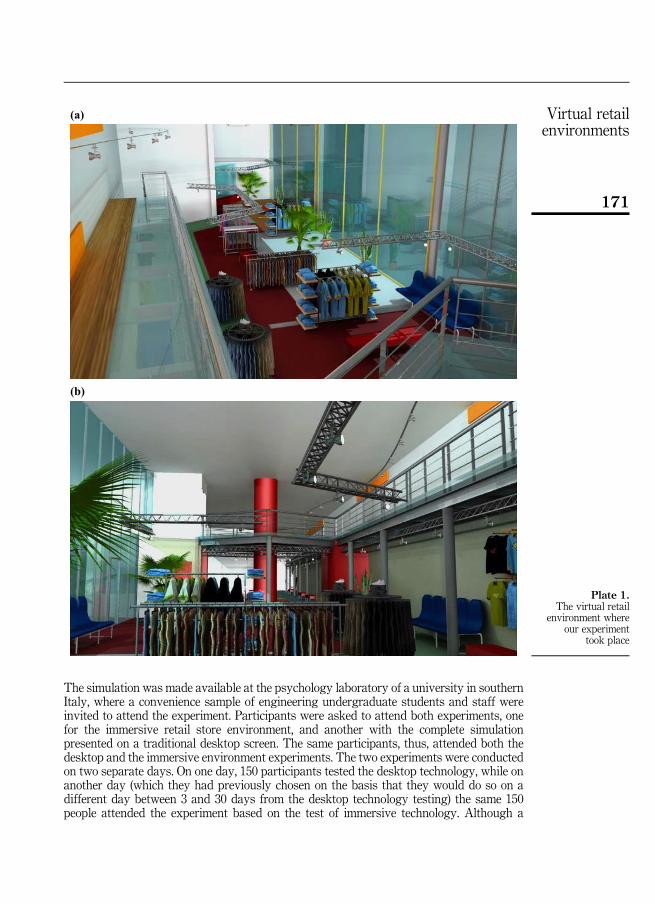
The simulation was made available at the psychology laboratory of a university in southernItaly, where a convenience sample of engineering undergraduate students and staff wereinvited to attend the experiment. Participants were asked to attend both experiments, onefor the immersive retail store environment, and another with the complete simulationpresented on a traditional desktop screen. The same participants, thus, attended both thedesktop and the immersive environment experiments. The two experiments were conductedon two separate days. On one day, 150 participants tested the desktop technology, while onanother day (which they had previously chosen on the basis that they would do so on adifferent day between 3 and 30 days from the desktop technology testing) the same 150people attended the experiment based on the test of immersive technology. Although a
(a)
(b)
Plate 1.The virtual retail
environment whereour experiment
took place
171
Virtual retailenvironments

factorial design may have been more effective, this arrangement was adopted given that weonly had a single immersive experimental setup and participants’ availability wasconstrained by inelastic commitments. Similarly, the order and time between the two runswas driven by the pragmatic scope imposed by the availability of the 3D setup.
The sample consisted of 59 females and 91 males. The greater number of males arisesfrom the composition of the engineering department, but also reflects the likely compositionof innovator consumers with a new online shopping technology (Dennis et al., 2009). In all,85 per cent were aged between 21 and 30 and all had at least high school education.In all, 96 per cent were students, appropriate as they are more representative of onlineshopping customers than are the general population (Alsajjan and Dennis, 2010).
Participants were asked to explore the immersive store by wearing special glassesequipped with polarised lenses (for correct 3D visualisation) and a data glove (for browsingthe environment) and fill in a questionnaire about their experience. They were not representedin the virtual world by avatars in order to guarantee a more realistic experience, given that theavatar’s personality may not necessarily mirror that of the user (Lin and Wang, 2013).Participants were further invited to undertake the tasks assigned. They were first introducedinto a virtual bookstore in order to familiarise themselves with the 3D environment, functionsand interaction modality, under the guidance of an experienced researcher. Next, participantsautonomously explored a fashion retail store under two different graphic resolution modes(low and high), in order to elicit whether different graphic resolutions might influenceconsumers’ perception of the simulation experience. The high resolution version featured2,048× 768 dpi horizontal split resolution, while the low one 1,280× 720. Thus, the experimentwas set in two different environments providing differing qualities of graphics. Eachparticipant could complete the following tasks in about ten minutes: go to the upper floor(choosing lift or stairs according to personal preference), find a particular T-shirt among thosein the available collection and pick one that they would like to buy, choose a pair of jeans,reach the fitting room (without trying them on), approach the relaxing area for a quick rest.Participants were then asked to complete the same questionnaire after the virtual explorationof the environment under the two different graphic resolutions.
Similarly, the desktop-based and immersion-based presentations used identicalresolutions and functionalities. The desktop simulation allows consumers to visualise theenvironment through a traditional display (rather than the large screen used forthe immersive system), and to browse the environment through a joystick. In contrast to theimmersion-based presentation, the desktop version does not require the user to wear anydata glove or special glasses with polarised lenses.
So both environments are 3D, but the modalities of interaction and the quality of graphicsand realism change totally. The processes of the experiments are presented in Table I.
4. ResultsThe following results have been generated using the partial least square (PLS) approach.Since the model in this study is a synthesis of earlier work, the literature suggests that PLSis a better approach compared with other SEM tools (Chin et al., 2003; Gefen et al., 2000;Reinartz et al., 2009). In this study, we used SmartPLS Version 2.0 (Ringle et al., 2005) toconduct the analyses including validity measures (Henseler et al., 2008). Tables II and IIIpresent the descriptive statistics of indicators, composite reliability, Cronbach’s α, andstandardised factor loadings. All our constructs were measured using a seven-pointLikert scale. All standardised factor loadings are significant, most of the factor loadings arehigher than 0.6, which is considered high (Hair et al., 1998), and the other three factorloadings are higher than 0.4, which is acceptable (Raubenheimer, 2004), indicatingconvergent validity. The composite reliabilities, and Cronbach’s α of the constructs are alllarger than the 0.7 threshold, indicating acceptable reliability (Boudreau et al., 2001).
172
ITP30,1

Tables IV and V report the descriptive statistics of constructs and the correlations betweenthem. The average variances extracted (AVEs) and correlations were used to assessdiscriminant validity. All the AVEs were found to be above 0.5, indicating that more than halfof the variance observed in the items used was accounted for by their hypothesised constructs(Hair et al., 1998). All squared correlations are lower than the corresponding AVEs, implyingacceptable discriminant validity. Nevertheless, Kock (2015) demonstrates that even whendiscriminant validity is satisfactory, common methods bias (CMB) can still be an issue andrecommends a full collinearity assessment. Kock and Lynn (2012) recommend an uppervariance inflation factor (VIF) threshold of five for SEMmodels of this type. The highest VIF is4.20 and we accordingly conclude that CMB is not an issue in our model.
Empirical results for both immersive and desktop groupsWe adopted the PLS SEM for hypothesis testing. PLS does not generate as many goodness-of fit indices as covariance-based SEM does (Hu and Bentler, 1999). The percentage of varianceexplained is indicated by the R2 as a measure of the overall model fit (Henseler et al., 2008).One-tailed t-tests were used to test the significance of each of the path coefficients. The sampleconsists of two conditions. The first is the “immersive” environment, where 150 peopleinteracted with the 3D setup. The other is the “desktop” environment, in which 150 people usedthe desktop screen. Figure 2 shows the path coefficients generated from the desktopenvironment and Figure 3 shows the path coefficients generated from the immersiveenvironment. All path coefficients are presented on the respective arrows, and the figures in thecircle are the R2. All path coefficients are significant at the 1 per cent level.H1-H6 are supported.For the desktop environment, the three constructs (simulated experience, hedonic value andutilitarian value) explain 26 per cent of engagement. Engagement further explains33 per cent of the enjoyment and 50 per cent of satisfaction. Finally, the satisfaction levelaccounts for 22 per cent of purchase intention. For the immersive environment, thesimulated experience, hedonic value and utilitarian value explain half of the variance inengagement. Engagement explains 57 per cent of enjoyment and 27 per cent of satisfaction.More than half of the purchase intention (52 per cent) is explained by satisfaction.
Multi-group comparisonWe analysed the resolution difference and immersion environment difference by conductingmulti-group comparisons. The data are first divided into four groups: the “immersive” group
Group 1 Group 2 Group 3 Group 4
Scenarios Desktop high Desktop low Immersive high Immersive lowResolution 2,048× 768 dpi 1,280× 720 dpi 2,048× 768 dpi 1,280× 720 dpiTime duration First day A different day between 3 to 30 days
after testing desktop technologyTotal Time for completing all tasks About 10 minutes About 10 minutesTask 1 Browse the environment A briefing that introduced the
virtual bookstore to enable subjectsto familiarise themselves with the 3Dscenario
Task 2 Go to the upper floorTask 3 Find a particular T-shirtTask 4 Choose a pair of jeansTask 5 Reach the fitting roomTask 6 Approach the relaxing areaTask 7 Fill in the questionnaire
Table I.Experiment processes
173
Virtual retailenvironments

with high resolution (immerse high), the “immersive” group with low resolution (immerselow), the “desktop” group with high resolution (desk high) and the “desktop” group with lowresolution (desk low). Each of the four groups has 150 data points. The resolutiondifferences are compared between desktop high and desktop low (Tables IV and V), andbetween immerse high and immerse low (Table VI). Then, the full data set is divided into“immersive” and “desktop” group, with each group containing 300 data points, and the pathcoefficients are compared between these two larger groups (Table VII).
Construct Items Mean SDCompositereliability
Cronbach’sα
Standardisedfactor loading
3D authenticity(Algharabat and Dennis, 2010a)
3DAuth1 5.87 0.88 0.98 0.973 0.973DAuth2 5.83 0.91 0.993DAuth3 5.82 0.91 0.983DAuth4 5.80 0.95 0.90
Engagement (Ghani, 1995)a EN1 2.26 0.96 0.92 0.876 0.73EN2 2.01 0.86 0.94EN3 2.01 0.85 0.95EN4 2.10 1.04 0.82
Colour vividness(Fiore, Kim and Lee, 2005b;Klein, 2003; Steuer, 1992)
Colour1 6.31 0.90 0.99 0.984 0.97Colour2 6.29 0.80 0.99Colour3 6.29 0.80 0.99
Control (Liu and Shrum, 2002;Mcmillan and Hwang, 2002;Song and Zinkhan, 2008)
Con1 5.95 1.18 1.00 0.998 1.00Con2 5.95 1.18 1.00Con3 5.93 1.19 0.99Con4 5.95 1.18 1.00Con5 5.96 1.19 1.00
Enjoyment (Ghani, 1995)a Enjoy1 2.28 1.10 0.87 0.794 0.76Enjoy2 2.24 1.02 0.80Enjoy3 2.25 0.99 0.83Enjoy4 2.30 1.06 0.76
Graphics vividness(Fiore, Kim and Lee, 2005b;Klein, 2003; Steuer, 1992)
Graph1 6.28 0.80 1.00 0.997 0.99Graph2 6.27 0.79 1.00Graph3 6.26 0.80 1.00
Hedonic value(Babin et al., 1994)
Hed1 4.89 1.44 0.94 0.906 0.67Hed2 5.47 1.20 0.96Hed3 5.52 1.16 0.97Hed4 5.50 1.17 0.96
Purchase intention(Fiore, Kim and Lee, 2005b)
PI1 5.85 0.99 0.89 0.829 0.83PI2 5.49 1.14 0.88PI3 5.38 1.21 0.88PI4 5.72 1.27 0.68
Satisfaction(Bhattacherjee, 2001)
Sat1 5.96 0.83 0.92 0.870 0.74Sat2 6.00 0.65 0.93Sat3 5.95 0.64 0.94Sat4 5.95 0.72 0.81
Utilitarian value(Fiore, Kim and Lee, 2005b)
Uti1 5.66 1.00 0.98 0.971 0.98Uti2 5.67 0.99 0.98Uti3 5.67 0.99 0.99Uti4 5.59 1.05 0.89
Simulated experience 3D authenticity 5.83 0.91 0.96 0.953 0.74Graphic 6.27 0.80 0.91Colour vividness 6.30 0.83 0.92Control 5.95 1.19 0.67
Note: aReverse coded
Table II.Measurementproperties ofindicators fordesktop group
174
ITP30,1

Tables VI-VIII present the evaluation results of the structural model. The bootstrap analysis isused to assess the differences between groups. In each iteration, the number of cases is setequal to the specific sample size (Sarstedt et al., 2011). The bootstrap iteration was set equal to1,000 (Chin, 1998; Chin and Dibbern, 2010) and 5,000 (Sarstedt et al., 2011) (also tested with thebootstrap iteration equal to 2,000 to assess whether they are in agreement).
As reported in Tables VII-VIII, the comparisons between desk low and desk high,and between immerse low and immerse high, do not show any significant difference
Construct Items Mean SDCompositereliability
Cronbach’sα
Standardisedfactor loading
3D authenticity (Algharabatand Dennis, 2010a)
3DAuth1 5.38 1.51 0.95 0.926 0.643DAuth2 5.63 1.17 0.613DAuth3 5.40 1.47 0.653DAuth4 5.38 1.51 0.64
Engagement (Ghani, 1995)a EN1 2.82 1.34 0.99 0.988 0.73EN2 2.84 1.35 0.73EN3 2.82 1.33 0.74EN4 2.85 1.35 0.72
Colour vividness(Fiore, Kim and Lee, 2005b;Klein, 2003; Steuer, 1992)
Colour1 5.46 1.42 0.99 0.990 0.70Colour2 5.50 1.40 0.71Colour3 5.52 1.40 0.71
Control (Liu and Shrum, 2002;Mcmillan and Hwang, 2002;Song and Zinkhan, 2008)
Con1 5.58 1.31 0.97 0.951 0.74Con2 5.58 1.29 0.76Con3 5.59 1.27 0.77Con4 5.61 1.26 0.77Con5 5.51 1.33 0.52
Enjoyment (Ghani, 1995)a Enjoy1 2.91 1.42 0.96 0.944 0.58Enjoy2 2.79 1.54 0.62Enjoy3 2.78 1.58 0.60Enjoy4 2.74 1.58 0.62
Graphics vividness(Fiore, Kim and Lee, 2005b;Klein, 2003; Steuer, 1992)
Graph1 5.52 1.39 1.00 0.996 0.72Graph2 5.50 1.40 0.72Graph3 5.50 1.41 0.71
Hedonic value(Babin et al., 1994)
Hed1 5.16 1.54 0.99 0.984 0.63Hed2 5.23 1.53 0.64Hed3 5.22 1.52 0.64Hed4 5.29 1.50 0.65
Purchase Intention(Fiore, Kim and Lee, 2005b)
PI1 4.39 1.45 0.97 0.958 0.67PI2 4.37 1.46 0.67PI3 4.39 1.48 0.66PI4 4.84 1.55 0.55
Satisfaction(Bhattacherjee, 2001)
Sat1 4.65 1.49 0.99 0.985 0.64Sat2 4.76 1.41 0.70Sat3 4.76 1.43 0.69Sat4 4.74 1.43 0.69
Utilitarian value(Fiore, Kim and Lee, 2005b)
Uti1 4.63 1.55 0.99 0.990 0.64Uti2 4.62 1.55 0.64Uti3 4.63 1.55 0.64Uti4 4.63 1.60 0.61
Simulated experience 3D Authenticity 5.45 1.43 0.96 0.959 0.80Graphic 5.51 1.40 0.94ColourVividness
5.49 1.40 0.93
Control 5.57 1.29 0.73Note: aReverse coded
Table III.Measurementproperties ofindicators for
immersive group
175
Virtual retailenvironments

(all the p-values are larger than 0.1). This demonstrates that the resolution will not bea confounding factor in our experiments, or in other words, the resolution we have chosenis sufficiently good. The comparison between the combined groups “immersive” and“desktop” shows significant differences with respect to several paths. Control has a
Control
Hedonicvalue
Colourvividness
Graphicsvividness
3Dauthenticity
Utilitarianvalue
0.198***
0.222***
0.283***
0.276***
0.399*** 0.245***
0.577***
0.429*** 0.471***
0.357***
0.275***
EngagementSimulatedexperience
Enjoyment
SatisfactionPurchaseintention
R2=0.22R2=0.26
R2=0.33
R2=0.49
Notes: ns, not significant. *,**,***Significant at 10, 5, 1 per cent level, respectively
Figure 2.Empirical result fromdesktop data
Mean SD 3D Col. Con. Eng. Enj. Gra. Hed. PI Sat. Sim. Uti.
3D authenticity 5.83 1.43 (0.93)Colour 6.30 1.40 0.22 (0.97)Control 5.95 1.29 0.09 0.33 (0.99)Engagement 2.10 1.34 0.16 0.09 0.04 (0.75)Enjoyment 2.27 1.53 0.41 0.14 0.05 0.33 (0.62)Graphic 6.27 1.40 0.20 0.94 0.29 0.12 0.14 (0.99)Hedonic value 5.35 1.52 0.09 0.07 0.01 0.15 0.37 0.08 (0.81)Purchase intention 5.61 1.50 0.11 0.04 0.01 0.17 0.19 0.06 0.17 (0.68)Satisfaction 5.97 1.44 0.23 0.19 0.09 0.40 0.37 0.19 0.18 0.22 (0.74)Simulated experience 6.05 1.00 0.41 0.84 0.62 0.14 0.22 0.81 0.08 0.06 0.24 (0.63)Utilitarian value 5.65 1.56 0.39 0.09 0.03 0.15 0.27 0.10 0.17 0.34 0.21 0.17 (0.93)Note: Values on diagonal are AVEs, whilst those below the diagonal are squared correlations
Table IV.Measurementproperties ofconstructs fordesktop group
Mean SD 3D Col. Con. Eng. Enj. Gra. Hed. PI Sat. Sim. Uti.
3D authenticity 5.45 1.43 (0.82)Colour 5.49 1.40 0.37 (0.98)Control 5.57 1.29 0.28 0.31 (0.85)Engagement 2.83 1.34 0.38 0.38 0.19 (0.97)Enjoyment 2.81 1.53 0.54 0.38 0.21 0.57 (0.86)Graphic 5.51 1.40 0.39 0.98 0.33 0.39 0.38 (0.99)Hedonic value 5.23 1.52 0.70 0.36 0.20 0.41 0.74 0.36 (0.95)Purchase intention 4.50 1.50 0.23 0.20 0.03 0.15 0.26 0.20 0.26 (0.89)Satisfaction 4.73 1.44 0.20 0.19 0.06 0.22 0.25 0.19 0.24 0.52 (0.96)Simulated experience 5.51 1.36 0.63 0.84 0.62 0.44 0.49 0.86 0.51 0.20 0.21 (0.64)Utilitarian value 4.63 1.56 0.17 0.16 0.11 0.15 0.16 0.16 0.16 0.30 0.34 0.20 (0.97)Note: Values on diagonal are AVEs, whilst those below the diagonal are squared correlations
Table V.Measurementproperties ofconstructs forimmersive group
176
ITP30,1

significantly higher loading on simulated experience for the desktop environment (0.399)than for the immersive environment (0.315) at the 1 per cent significance level. In contrast,simulated experience has a higher impact on engagement for the immersive environment(0.402) than the desktop environment (0.222) (but only at the 10 per cent level).
Immerselow
Immersehigh
p-value(iteration¼ )
Path PathGroup
difference 1,000 2,000 5,000
3D authenticity→ simulated experience 0.272 0.288 0.015 0.546 0.580 0.593Engagement→ enjoyment 0.745 0.774 0.029 0.727 0.720 0.711Engagement→ satisfaction −0.241 −0.201 0.040 0.762 0.804 0.815Colour vividness→ simulated experience 0.283 0.290 0.006 0.766 0.748 0.756Control→ simulated experience 0.319 0.312 −0.006 0.881 0.815 0.819Enjoyment→ satisfaction −0.276 −0.382 −0.107 0.484 0.542 0.544Graphic vividness→ simulated experience 0.281 0.294 0.014 0.574 0.532 0.531Hedonic value → engagement −0.268 −0.362 −0.094 0.482 0.497 0.489Satisfaction→ purchase intention 0.719 0.722 0.003 0.979 0.991 0.990Simulated experience→ engagement −0.473 −0.338 0.134 0.262 0.289 0.283Utilitarian value→ engagement −0.063 −0.088 −0.025 0.762 0.781 0.763
Table VII.Group comparison
between immerse highresolution andimmerse low
resolution
Desk low Desk high p-value (iteration¼ )Path Path Group difference 1,000 2,000 5,000
3D authenticity→ simulated experience 0.271 0.275 0.004 0.946 0.944 0.943Engagement→ enjoyment 0.581 0.595 0.015 0.861 0.859 0.856Engagement→ satisfaction −0.420 −0.462 −0.042 0.752 0.744 0.749Colour vividness→ simulated experience 0.278 0.274 −0.005 0.849 0.847 0.850Control→ simulated experience 0.399 0.396 −0.003 0.953 0.953 0.953Enjoyment→ satisfaction −0.364 −0.338 0.026 0.828 0.825 0.825Graphic vividness→ simulated experience 0.285 0.281 −0.004 0.863 0.861 0.863Hedonic value→ engagement −0.221 −0.294 −0.073 0.546 0.550 0.552Satisfaction→ purchase intention 0.477 0.486 0.009 0.895 0.895 0.894Simulated experience→ engagement −0.228 −0.226 0.001 0.938 0.937 0.937Utilitarian value→ engagement −0.214 −0.186 0.028 0.817 0.813 0.814
Table VI.Group comparison
between desktop highresolution attempt anddesktop low resolution
Hedonicvalue
Control
0.317***
0.285***
0.316***
0.404***
0.285***
0.282*** 0.076***
0.219*** 0.720***
0.756*** 0.331***Colourvividness
Graphicsvividness
3Dauthenticity
Utilitarianvalue
EngagementSimulatedexperience
Enjoyment
SatisfactionPurchaseintention
R2=0.52R2=0.50 R2=0.27
R2=0.57
Notes: ns, not significant. *,**,***Significant at 10, 5, 1 per cent level, respectively
Figure 3.Empirical results from
immersive data
177
Virtual retailenvironments

The immersive environment also has a higher loading on the path between “engagement”and “enjoyment” at the 5 per cent significance level. Finally, satisfaction has a larger effecton purchase intention in the immersive environment (0.716) than the desktop environment(0.474) at the 1 per cent significance level. The average value of constructs in eachcomparative group for different scenarios is shown in Table IX.
5. DiscussionOur work has filled a key gap in the literature by testing a theoretical, integrative model anddeveloping a theoretical path which maps consumer behaviour leading to purchaseintention. A cross-analysis of this integrative model/theoretical path within two virtual retailenvironments provided numerous theoretical and managerial insights for immersiveenvironments, making a major contribution to this field of study.
Specifically, the findings support the conceptual model, extending Papagiannidis et al.’s(2013) work to the context of an immersive 3D retail store environment enabled by virtualreality technology, where participants wear special glasses and a data glove. Our modelpredicts that telepresence (control, colour vividness, graphic vividness and 3D authenticity)has positive effects on simulated experience (H1a-d, respectively), which in turn positivelyaffects engagement (H1e). The results support past work (Fiore, Kim and Lee, 2005; Fiore andKim, 2007; Song and Zinkhan, 2008) indicating that control plays a role in building userengagement. The findings also confirm prior studies by Shih (1998), Fiore, Jin and Kim (2005),Fiore, Kim and Lee (2005) and Steuer (1992) that colourful, vivid graphics create higher levels
Construct Desktop high Desktop low Immersive high Immersive low Desktop Immersive
Control(5) 5.945 5.945 5.616 5.533 5.945 5.575Colour vividness(3) 6.309 6.282 5.662 5.322 6.296 5.492Graph vividness (3) 6.282 6.256 5.684 5.329 6.269 5.5073D authenticity(4) 5.858 5.805 5.568 5.327 5.832 5.448Enjoyment(4) 2.258 2.277 2.672 2.935 2.268 2.803Engagement(3) 2.789 2.802 3.718 3.838 2.796 3.778Satisfaction(4) 6.008 5.922 4.775 4.683 5.965 4.729Hedonic value(4) 5.368 5.322 5.278 5.168 5.345 5.223Utilitarian value(4) 5.673 5.622 4.662 4.593 5.648 4.628Purchase intention(4) 5.767 5.453 4.628 4.363 5.610 4.496
Table IX.Average score ofconstructs fordifferent scenarios
Immersive Desktop p-value (iteration¼ )Path Path
Groupdifference 1,000 2,000 5,000
3D authenticity→ simulated experience 0.282 0.275 −0.007 0.794 0.789 0.792Engagement→ enjoyment 0.756 0.577 −0.179 0.028** 0.027** 0.027**Engagement→ satisfaction −0.219 −0.430 −0.211 0.125 0.126 0.130Colour vividness→ simulated experience 0.285 0.276 −0.009 0.702 0.701 0.701Control→ simulated experience 0.317 0.399 0.082 0.003*** 0.003*** 0.003***Enjoyment→ satisfaction −0.331 −0.357 −0.026 0.853 0.853 0.854Graphic vividness→ simulatedexperience 0.285 0.283 −0.001 0.949 0.950 0.949Hedonic value→ engagement −0.316 −0.245 0.072 0.539 0.547 0.546Satisfaction→ purchase intention 0.720 0.471 −0.249 0.000*** 0.001*** 0.001***Simulated experience→ engagement −0.404 −0.222 0.182 0.068* 0.067* 0.069*Utilitarian value→ engagement −0.076 −0.198 −0.122 0.187 0.183 0.182Notes: *po0.1; **po0.05; ***po0.01
Table VIII.Group comparisonbetween theimmersive group andthe desktop group
178
ITP30,1

of user engagement. The results are in line with studies by Algharabat and Dennis (2010b)supporting the role of 3D authenticity in user engagement. Through engagement, thetelepresence components, along with utilitarian value (H1f) and hedonic value (H1g),indirectly positively influence the enjoyment a user derives from experiencing the simulatedretail environment (H2). This finding confirms previous studies, for example, by Ghani (1995),as well as past work in relation to flow theory (Turkay and Adinolf, 2010; D’alba et al., 2011;Mollen and Wilson, 2010; Oulasvirta et al., 2005; Ghani and Deshpande, 1994). Similarly, bothenjoyment (H3) and engagement (H4) positively influence user satisfaction with the simulatedretail environment, a finding that corresponds with previous work by Van Vugt et al. (2006;2009) and Sylaiou et al. (2010) on virtual environments. In turn, satisfaction from experiencingthe simulated retail environment influences the intention to purchase the clothing iteminvolved (H5). This finding is consistent with many past marketing studies that haveexamined the link between satisfaction and purchase intention for various contexts(e.g. Hausman and Siekpe, 2009; Fiore, Jin and Kim, 2005; Fiore, Kim and Lee, 2005 in onlineenvironments). Overall, the findings confirm the role of simulation in encouraging users toengage more with products and services in virtual environments and to improve theirexperience (e.g. Algharabat and Dennis, 2010b). Resolution, when sufficiently high, has littleimpact on this psychological process, confirming previous findings by Papagiannidis et al.(2013). The results can be interpreted as meaning that, provided a minimum standard isreached, authenticity is less dependent on the quality of the graphics or other ICT factors butmore perhaps on the degree to which the users can relate to the experience, as operationalisedin this study by the degree of immersion.
Offering multiple ways that are customisable in order to communicate product andservice information can help not only engage customers more, but even create additionalrevenues streams (Lowe et al., 2013). Consequently, understanding the impact change to aninterface can have becomes very important. The results of the comparison between theimmersive and desktop environments indicate significant differences on several paths.Higher control has less impact on simulated experience for the immersive environment thanfor the desktop. This difference may be because when an immersive environment isavailable, people pay much more attention to the visual aspects and the authenticity(i.e. colour vividness, graphic vividness and 3D authenticity), while control becomes lessimportant. Similarly, simulated experience has significantly higher impact on engagementin the immersive environment. Notably, in the immersive environment, half of the varianceof engagement is explained by simulated experience, hedonic value, utilitarian value; theimpact of simulated experience is significantly higher than for the desktop environment(H6a). This is unsurprising, since the simulated experience in front of an immersive screenbetter resembles reality, reducing the negative impact of using an artificial system. There isalso a difference between the two environments in terms of the effects of attentionalinvolvement on enjoyment: engagement in the immersive environment explains perceivedenjoyment better (H6b). This may be because the participants in the immersive environmentexperience something novel and the enjoyment mainly comes from the involvement thatthey had seldom experienced previously. In comparison, participants in the desktopenvironment sought enjoyment from other dimensions since they were more familiar withvirtual stores on computer screens. Contrary to the expectation, the influence of enjoymenton satisfaction is greater for participants in the desktop environment than for participantsin the immersive environment, although the difference is not significant (H6c notsupported). Participants may have been expecting an enjoyable experience from theimmersive environment; and therefore, may have adjusted expected standards ofsatisfaction upwards accordingly. They may still perceive the 3D environment as beingat the developmental stage and further technical and operational improvements arerequired. Finally, the purchase intention of participants in the immersive environment is
179
Virtual retailenvironments
more related to the satisfaction from the virtual store (H6d). The reason may be thatparticipants can connect the experience in the virtual store to the experience in a real storemore easily in the immersive environment.
6. Conclusions, managerial implications and future researchThis work has evaluated a robust model of purchase intention and demonstrated it to hold(for clothing purchases) not only in a 3D environment on a conventional computer platformbut also in an immersive one, where participants wear special glasses and a data glove.Purchase intention is influenced by satisfaction, which is in turn influenced by enjoymentand engagement. Engagement in turn is influenced by utilitarian and hedonic value and theexperience of product simulation or telepresence, which is composed of control, 3Dauthenticity, colour and graphics vividness.
Traditional in-store shopping can stimulate pleasure, enjoyment and excitement(Hart et al., 2014) whilst online shopping has been said to offer little experience value(Mathwick et al., 2001). However, more recent research suggests that shoppers also seek outrecreational, enjoyable aspects of online shopping (Fiore, Jin and Kim, 2005; Konus et al.,2008). This study draws attention to the important differences between the two onlineenvironments, in that in the immersive environment, experience is more associated withengagement and enjoyment, leading to a greater purchase intention. The immersive, 3Denvironment, thus, has the potential to rival traditional shopping in terms of experience,resulting in higher sales for the retailers and satisfaction for the consumers. Moreimportantly, these new environments (including the immersive one) differ radically fromother, traditional shopping channels. Based on work by Alba et al. (1997), Childers et al.(2001, p. 515) argue that this is due to “the absence of the actual experience of visiting thestore and physically examining a product prior to purchase”. It is evident, then, that we areexperiencing fundamental and revolutionary changes in relation to shopping channels andconsumer behaviour.
Overall, this work has generated many implications for marketing theory. The firstrelates to the retail theatre concept (see Healy et al., 2007), which our study extends to thevirtual world by active and continuous engagement via 3D and an immersive environment,where participants wear special glasses and a data glove, which creates an unforgettableretail experience. The retail experience could be further developed by, for example,facilitating the shopper’s co-creation value (Kohler et al., 2011), e.g. by customising theproduct in terms of colour and size or even the retail space itself. Further, users could getinvolved with testing new clothing products and concepts within the virtual store and couldprovide their experience and views back to the retailer. For example, users could providetheir views about a new virtual store layout and whether its design corresponds well withthe merchandising (and products) on sale. The importance of experience has been noted inthe past in both the marketing (experiential marketing, see Schmitt, 1999) and retailing(experiential retailing, see Kim, 2001) domains but limited work has been done in relation tovirtual worlds from the retail marketing perspective. In our experiment we have onlyexamined one aspect of the user experience, relating to the interaction between the user andthe virtual retail environment. Retail theatre and co-creation of value would be even moreeffective if users interacted with either other human actors, such as shop assistants andother customers, or computer-generated ones, such as avatars. Retailers need to be strategicwhen assigning virtual identities to consumers or assistants as they can influence consumerbehaviour in different ways (Yoo et al., 2015).
Building on the principle of the immersive environment, live interactions with storeemployees and other customers could provide a more lively and realistic retail experiencethat could be compared with electronic versions of the same roles, for example, using
180
ITP30,1

avatars. In addition, future research could potentially compare conventional web-basedapplications vs virtual world-based applications for the same retailer and product types,examining the relative importance of purchase decision-making factors. Future studiescould examine whether virtual retailing is significantly affected by differences inconsumers’ cultures and whether there are any differences between demographic groupings(e.g. age, income, socioeconomic status, etc.). The latter research will be very usefulconsidering that our research focussed on a specific consumer segment, the student market.Future research could also examine consumer behaviour in these 3D environments asconsumers operate nowadays as “inexperienced” shoppers here due to the new, original andinnovative retail atmosphere presented to them ( Jin, 2009). This also calls for a futurelongitudinal study which will revisit this work and test whether new results are generatedand whether the immersive environment has become more “accepted” and, therefore,participants feel more “experienced” with it. The above indicates possible future researchareas where we could test our conceptual framework further. It also presents an excellentopportunity to shed further light on the application of the retail theatre concept in relation tonon-traditional environments such as virtual ones.
This work has generated numerous managerial implications. First, it has become clearthat immersive environments present an innovative tool facilitating a new retail store modelbased on relevant technologies. These environments can provide excellent platforms forretail managers to test various marketing strategies including new product development,promotions, store atmospherics, etc. In this vein, immersive environments can become amajor link in a multichannel strategy where various shopping channels will operate in anintegrated fashion. Immersive environments are a market niche nowadays but they have apromising future and companies need to incorporate the above within their strategies.Managers could make use of models like the one proposed when employing these immersiveenvironments with the ultimate aim of influencing consumers’ future product purchases.However, managers need to be aware that the consumers may nowadays have highexpectations from these immersive environments and, therefore, they will need to adjust andfactor this in when setting up relevant strategies.
To conclude, this paper has highlighted the role of immersive environments for retailers’current and future marketing strategies and we hope that attention will be paid to ourrecommendations.
References
Alba, J., Lynch, J., Weitz, B., Janiszewski, C., Lutz, R. and Sawyer, A. et al. (1997), “Interactive homeshopping: consumer, retailer and manufacturer incentives to participate in electronicmarketplaces”, Journal of Marketing, Vol. 61 No. 3, pp. 38-53.
Algharabat, R. and Dennis, C. (2010a), “3D product authenticity model for online retail: an invarianceanalysis”, International Journal of Business Science & Applied Management, Vol. 5 No. 3, pp. 14-30.
Algharabat, R. and Dennis, C. (2010b), “Using authentic 3D product visualisation for an electrical onlineretailer”, Journal of Customer Behaviour, Vol. 9 No. 2, pp. 97-115.
Algharabat, R. and Dennis, C. (2011), “Modelling the impact of 3D authenticity and 3D telepresenceon behavioural intention for an online retailer”, in Dirk, M., Thomas, R., Peter, S., Hanna, S.K.and Bernhard, S. (Eds), European Retail Research, Gabler Verlag, Wiesbaden, pp. 93-109,doi: 10.1007/978-3-8349-6147-1_4.
Al-Qeisi, K., Dennis, C., Jayawardhena, C. and Alamanos, E. (2014), “Website design quality andusage behaviour: an application of the UTAUT model”, Journal of Business Research, Vol. 67No. 11, pp. 2282-2290.
Alsajjan, B. and Dennis, C. (2010), “Internet banking acceptance model: a cross-market examination”,Journal of Business Research, Vol. 63, pp. 957-963.
181
Virtual retailenvironments

Animesh, A., Pinsonneault, A., Sung-Byung, Y. and Wonseok, O. (2011), “An odyssey into virtualworlds: exploring the impacts of technological and spatial environments on intention topurchase virtual products”, MIS Quarterly, Vol. 35 No. 3, pp. 789-810.
Babin, B.J., Darden, W.R. and Griffin, M. (1994), “Work and/or fun: measuring hedonic and utilitarianshopping value”, Journal of Consumer Research, Vol. 20 No. 4, pp. 644-656.
Bakker, A.B., Albrecht, S.L. and Leiter, M.P. (2011), “Work engagement: further reflections on the stateof play”, European Journal of Work and Organizational Psychology, Vol. 20 No. 1, pp. 74-88.
Barnes, S.J., Mattsson, J. and Hartley, N. (2015), “Assessing the value of real-life brands in virtualworlds”, Technological Forecasting and Social Change, Vol. 92, March, pp. 12-24.
Bartle, R. (2004), Designing Virtual Worlds, New Riders, Berkeley, CA.
Bhattacherjee, A. (2001), “Understanding information systems continuance: an expectation-confirmation model”, MIS Quarterly, Vol. 25 No. 3, pp. 351-370.
Blazquez, M. (2014), “Fashion shopping in multichannel retail: the role of technology in enhancing thecustomer experience”, International Journal of Electronic Commerce, Vol. 18 No. 4, pp. 97-116.
Boudreau, M.C., Gefen, D. and Straub, D.W. (2001), “Validation in information systems research:a state-of-the-art assessment”, MIS Quarterly, Vol. 25 No. 1, pp. 1-15.
Bourlakis, M., Papagiannidis, S. and Li, F. (2009), “Retail spatial evolution: paving the way fromtraditional to metaverse retailing”, Electronic Commerce Research, Vol. 9 No. 1, pp. 135-148.
Cheng, L.K., Chieng, M.-H. and Chieng, W.H. (2014), “Measuring virtual experience in athree-dimensional virtual reality interactive simulator environment: a structural equationmodelling approach”, Virtual Reality, Vol. 18 No. 3, pp. 173-188.
Childers, T.L., Carr, C.L., Peck, J. and Carson, S. (2001), “Hedonic and utilitarian motivations for onlineretail shopping behavior”, Journal of Retailing, Vol. 77 No. 4, pp. 511-535.
Chin, W.W. (1998), “The partial least squares approach to structural equation modeling”, in Hoyle, R.H.(Ed.), Modern Methods for Business Research, Lawrence Erlbaum, Mahwah, NJ, pp. 295-336.
Chin, W.W. and Dibbern, J. (2010), “An introduction to a permutation based procedure for multi-group PLSanalysis: results of tests of differences on simulated data and a cross cultural analysis of thesourcing of information system services between Germany and the USA”, in Vinzi, V.E., Chin,W.W.,Henseler, J. andWang, H. (Eds),Handbook of Partial Least Squares, Springer, Berlin and Heidelberg.
Chin, W.W., Marcolin, B.L. and Newsted, P.R. (2003), “A partial least squares latent variable modelingapproach for measuring interaction effects: results from a Monte Carlo simulation study and anelectronic-mail emotion/adoption study”, Information Systems Research, Vol. 14 No. 2, pp. 189-217.
Choi, Y.K. and Taylor, C.R. (2014), “How do 3-dimensional images promote products on the internet?”,Journal of Business Research, Vol. 67 No. 10, pp. 2164-2170.
Coursaris, C., Swierenga, S.J. and Watrall, E. (2008), “An empirical investigation of color temperatureand gender effects on web aesthetics”, Journal of Usability Studies, Vol. 3 No. 3, pp. 103-117.
Cronin, J.J., Brady, M.K. and Hult, G.T.M. (2000), “Assessing the effects of quality, value and customersatisfaction on consumer behavioural intentions in service environments”, Journal of Retailing,Vol. 76 No. 2, pp. 193-218.
Csikszentmihalyi, M. (1990), Flow: The Psychology of Optimal Experience, Harper & Row,New York, NY.
D’alba, A., Najmi, A., Gratch, J. and Bigenho, C. (2011), “Virtual learning environments. the oLTECx:a study of participant attitudes and experiences”, International Journal of Gaming andComputer-Mediated Simulations, Vol. 3 No. 1, pp. 33-50.
Demirkan, H. and Spohrer, J. (2014), “Developing a framework to improve virtual shopping in digitalmalls with intelligent self-service systems”, Journal of Retailing and Consumer Services, Vol. 21No. 5, pp. 860-868.
Dennis, C. and Jayawardhena, C. (2010), “Antecedents of internet shopping intentions and themoderating effects of substitutability”, International Review of Retail, Distribution andConsumer Research, Vol. 20 Nos 9-10, pp. 411-430.
182
ITP30,1

Dennis, C., Jayawardhena, C., Merrilees, W. andWright, L.T. (2009), “e-Consumer behaviour”, EuropeanJournal of Marketing, Vol. 43 Nos 9/10, pp. 1121-1139.
Dennis, C., Morgan, A., Wright, L.T. and Jayawardhena, C. (2010), “The influence of social e-shoppingin enhancing young women’s online shopping behaviour”, Journal of Customer Behaviour,Vol. 9 No. 2, pp. 151-174.
Domina, T., Lee, S.-E. and Macgillivray, M. (2012), “Understanding factors affecting consumerintention to shop in a virtual world”, Journal of Retailing and Consumer Services, Vol. 19 No. 6,pp. 613-620.
Donovan, R.J., Rossiter, J.R., Marcoolyn, G. and Nesdale, A. (1994), “Store atmosphere and purchasingbehaviour”, Journal of Retailing, Vol. 70 No. 3, pp. 283-294.
Eroglu, S.A., Macleit, K.A. and Davis, L.M. (2003), “Empirical testing of a model of online storeatmospherics and shopper responses”, Psychology and Marketing, Vol. 20 No. 2, pp. 139-150.
Fiore, A.M. and Kim, J. (2007), “An integrative framework capturing experiential and utilitarianshopping experience”, International Journal of Retail and Distribution Management, Vol. 35No. 6, pp. 421-442.
Fiore, A.M., Jin, H.J. and Kim, J. (2005), “For fun and profit: hedonic value from image interactivity andresponses toward an online store”, Psychology & Marketing, Vol. 22 No. 8, pp. 669-694.
Fiore, A.M., Kim, J. and Lee, H.H. (2005), “Effect of image interactivity technology on consumerresponses toward the online retailer”, Journal of Interactive Marketing, Vol. 19 No. 3, pp. 38-53.
Gadalla, E., Keeling, K. and Abosag, I. (2013), “Metaverse-retail service quality: a future frameworkfor retail service quality in the 3D internet”, Journal of Marketing Management, Vol. 29Nos 13-14, pp. 1493-1517.
Gefen, D., Straub, D. and Boudreau, M.-C. (2000), “Structural equation modeling and regression:guidelines for research practice”, Communications of the Association for InformationSystems, Vol. 4, Article 7.
Ghani, J.A. (1995), “Flow in human computer interactions: test of a model”, in Carey, J. (Ed.), HumanFactors in Information Systems: Emerging Theoretical Bases, Ablex Publishing Corporation, NJ.
Ghani, J.A. and Deshpande, S.P. (1994), “Task characteristics and the experience of optimal flow inhuman-computer interaction”, Journal of Psychology, Vol. 128 No. 4, pp. 381-391.
Guo, Y. and Barnes, S. (2011), “Purchase behavior in virtual worlds: an empirical investigation insecond life”, Information & Management, Vol. 48 No. 2, pp. 303-312.
Guttentag, D.A. (2010), “Virtual reality: applications and implications for tourism”, TourismManagement, Vol. 31 No. 5, pp. 637-651.
Hair, J.F., Anderson, R.E., Tatham, R.L. and Black, W.C. (1998), Multivariate Data Analysis,Prentice-Hall, Upper Saddle River, NJ.
Handelsman, M.M., Briggs, W.L., Sullivan, N. and Towler, A. (2005), “A measure of college studentcourse engagement”, Journal of Educational Research, Vol. 98 No. 3, pp. 184-191.
Hart, C., Stachow, G., Rafiq, M. and Laing, A. (2014), “Customer experience of town centres”, ESRCreport, Loughborough University, Loughborough.
Hassouneh, D. and Brengman, M. (2011), “Shopping in virtual worlds: perceptions, motivations, andbehavior”, Journal of Electronic Commerce Research, Vol. 12 No. 4, pp. 320-335.
Hausman, A.V. and Siekpe, J.S. (2009), “The effect of web interface features on consumer onlinepurchase intentions”, Journal of Business Research, Vol. 62 No. 1, pp. 5-13.
Healy, M.J., Beverland, M.B., Oppewal, H. and Sands, S. (2007), “Understanding retail experiences – thecase for ethnography”, International Journal of Market Research, Vol. 49 No. 6, pp. 751-778.
Henseler, J., Ringle, C.M. and Sinkovics, R.R. (2008), “The use of partial least squares path modeling ininternational marketing”, in Sinkovics, R.R. and Ghauri, P.N. (Eds), New Challenges toInternational Marketing, Emerald Group Publishing Limited, pp. 277-319.
183
Virtual retailenvironments
Hernandez, B., Jimenez, J. and Martin, M.J. (2009), “The impact of self-efficacy, ease of use andusefulness on e-purchasing: an analysis of experienced e-shoppers”, Interacting with Computers,Vol. 21 Nos 1-2, pp. 146-156.
Hopping, D. (2000), “Technology in retail”, Technology in Society, Vol. 22 No. 1, pp. 63-74.
Houliez, C. (2010), “Branding places or branding spatial practices? Retail spaces in the age of mixedrealities”, Place Branding and Public Diplomacy, Vol. 6 No. 2, pp. 87-96.
Hu, L. and Bentler, P.M. (1999), “Cutoff criteria for fit indexes in covariance structure analysis:conventional criteria versus new alternatives”, Structural Equation Modeling, Vol. 6 No. 1,pp. 1-55.
Hu, P.J.H. and Hui, W. (2012), “Examining the role of learning engagement in technology-mediatedlearning and its effects on learning effectiveness and satisfaction”, Decision Support Systems,Vol. 53 No. 4, pp. 782-792.
Jiang, Z. and Benbasat, I. (2004), “Virtual product experience: effects of visual and functional control ofproducts on perceived diagnosticity and flow in electronic shopping”, Journal of ManagementInformation Systems, Vol. 21 No. 3, pp. 111-147.
Jin, S.A.A. (2009), “The roles of modality richness and involvement in shopping behaviour in 3D virtualstores”, Journal of Interactive Marketing, Vol. 23, pp. 234-246.
Jones, M.A. (1999), “Entertaining shopping experiences: an exploratory investigation”, Journal ofRetailing and Consumer Services, Vol. 6 No. 3, pp. 129-139.
Jones, M.A., Reynolds, K.E. and Arnold, M.J. (2006), “Hedonic and utilitarian shopping value:investigating differential effects on retail outcomes”, Journal of Business Research, Vol. 59 No. 9,pp. 974-981.
Kaplan, A.M. (2012), “If you love something, let it go mobile: mobile marketing and mobile social media4� 4”, Business Horizons, Vol. 55 No. 2, pp. 129-139.
Kim, J. and Forsythe, S. (2007), “Hedonic usage of product virtualisation technologies in onlineapparel shopping”, International Journal of Retail & Distribution Management, Vol. 35 No. 6,pp. 502-514.
Kim, K.K., Shin, H.K. and Kim, B. (2011), “The role of psychological traits and social factors in usingnew mobile communication services”, Electronic Commerce Research and Applications, Vol. 10No. 4, pp. 408-417.
Kim, Y.H., Kim, D.J. and Wachter, K. (2013), “A study of mobile user engagement (MoEN): engagementmotivations, perceived value, satisfaction, and continued engagement intention”, DecisionSupport Systems, Vol. 56, December, pp. 361-370.
Kim, Y.K. (2001), “Experiential retailing: an interdisciplinary approach to success in domestic andinternational retailing”, Journal of Retailing and Consumer Services, Vol. 8 No. 5, pp. 287-289.
Klein, L.R. (2003), “Creating virtual product experiences: the role of telepresence”, Journal of InteractiveMarketing, Vol. 17 No. 1, pp. 41-55.
Kock, N. (2015), “Common method bias in PLS-SEM: a full collinearity assessment approach”,International Journal of e-Collaboration, Vol. 11 No. 4, pp. 1-10.
Kock, N. and Lynn, G.S. (2012), “Lateral collinearity and misleading results in variance-based SEM: anillustration and recommendations”, Journal of the Association for Information Systems, Vol. 13No. 7, pp. 546-580.
Kohler, T., Fueller, J., Matzler, K. and Stieger, D. (2011), “Co-creation in virtual worlds: the design of theuser experience”, MIS Quarterly, Vol. 35 No. 3, pp. 773-788.
Konus, U., Verhoef, P.C. and Neslin, S.A. (2008), “Multichannel shopper segments and their covariates”,Journal of Retailing, Vol. 84 No. 4, pp. 398-413.
Koufaris, M. (2002), “Applying the technology acceptance model and flow theory to online consumerbehaviour”, Information Systems Research, Vol. 13 No. 2, pp. 205-223.
Krasonikolakis, I., Vrechopoulos, A. and Pouloudi, A. (2014), “Store selection criteria and salesprediction in virtual worlds”, Information & Management, Vol. 51 No. 6, pp. 641-652.
184
ITP30,1

Kushwaha, T. and Shankar, V. (2013), “Are multichannel customers really more valuable?The moderating role of product category characteristics”, Journal of Marketing, Vol. 77 No. 4,pp. 67-85.
Laria, G. and Pantano, E. (2012), “Introduction of innovative retail systems based on immersiveenvironments”, International Journal of Digital Content Technology and its Application, Vol. 6No. 2, pp. 248-254.
Lee, K.Y. (2012), “Consumer processing of virtual experience in e-commerce: a test of an integratedframework”, Computers in Human Behavior, Vol. 28, November, pp. 2134-2142.
Lee, S.E. and Domina, T. (2013), “Shopping in a virtual world: an analysis of young users’ experiences”,The International Journal of Technology, Knowledge, and Society, Vol. 8 No. 4, pp. 13-24.
Lehdonvirta, V., Wilska, T.-A. and Johnson, M. (2009), “Virtual consumerism”, Information,Communication & Society, Vol. 12 No. 7, pp. 1059-1079.
Lin, H. andWang, H. (2013), “Avatar creation in virtual worlds: behaviors and motivations”, Computersin Human Behavior, Vol. 34 No. 34, pp. 213-218.
Liu, Y. and Shrum, L.J. (2002), “What is interactivity and is it always such a good thing? Implications ofdefinition, person and situation for the influence of interactivity on advertising effectiveness”,Journal of Advertising, Vol. 31 No. 4, pp. 53-64.
Lowe, B., De Souza-Monteiro, D. and Fraser, I. (2013), “Nutritional labelling information: utilisation ofnew technologies”, Journal of Marketing Management, Vol. 29 Nos 11-12, pp. 1337-1366.
Mcmillan, S.J. and Hwang, J.S. (2002), “Measures of perceived interactivity: an exploration of the role ofdirection of communication, user control, and time in shaping perceptions of interactivity”,Journal of Advertising, Vol. 31 No. 3, pp. 29-42.
Malliet, S. (2006), “An exploration of adolescents’ perception of videogame realism”, Learning, Mediaand Technology, Vol. 31 No. 4, pp. 377-394.
Mäntymäki, M. and Salo, J. (2011), “Teenagers in social virtual worlds: continuous use and purchasingbehavior in Habbo Hotel”, Computers in Human Behavior, Vol. 27 No. 6, pp. 2088-2097.
Martineau, P. (1958), “The personality of the retail store”, Harvard Business Review, Vol. 36,January/Feburary, pp. 47-55.
Mathwick, C., Malhotra, N. and Rigdon, E. (2001), “Experiential value: conceptualization, measurementand application in the catalog and internet shopping environment”, Journal of Retailing, Vol. 77No. 1, pp. 39-56.
Mehrabian, A. and Russell, J.A. (1974), An Approach to Environmental Psychology, MIT Press,Cambridge, MA.
Messinger, P.R., Stroulia, E., Lyons, K., Bone, M., Niu, R.H., Smirnov, K. and Perelgut, S. (2009), “Virtualworlds – past, present, and future: new directions in social computing”, Decision SupportSystems, Vol. 47 No. 3, pp. 204-228.
Minsky, M. (1980), “Tele-presence”, Omni, pp. 45-51, available at: http://web.media.mit.edu/~minsky/papers/Telepresence.html (accessed 15 January 2015).
Mollen, A. and Wilson, H. (2010), “Engagement, telepresence and interactivity in online consumerexperience; reconciling scholastic and managerial perspectives”, Journal of Business Research,Vol. 63 Nos 9-10, pp. 919-925.
Nah, F.F.-H., Eschenbrenner, B. and Dewester, D. (2011), “Enhancing brand equity through flowand telepresence: a comparison of 2D and 3D virtual worlds”, MIS Quarterly, Vol. 35 No. 3,pp. 731-347.
Olsen, S.O. and Skallerud, K. (2011), “Retail attributes’ differential effects on utilitarian versus hedonicshopping value”, Journal of Consumer Marketing, Vol. 28 No. 7, pp. 532-539.
Oulasvirta, A., Tamminen, S., Roto, V. and Kuorelahti, J. (2005), “Interaction in 4-second bursts: thefragmented nature of attentional resources in mobile HCI”, SIGCHI Conference on HumanFactors in Computing Systems, Portland, OR.
185
Virtual retailenvironments

Pantano, E. (2014), “Innovation drivers in retail industry”, Journal of Information Management, Vol. 34No. 3, pp. 344-350.
Pantano, E. and Naccarato, G. (2010), “Entertainment in retailing: the role of advanced technologies”,Journal of Retailing and Consumer Services, Vol. 17 No. 3, pp. 200-204.
Pantano, E. and Servidio, R. (2012), “Modeling innovative points of sales through virtual andimmersive technologies”, Journal of Retailing and Consumer Services, Vol. 19 No. 3,pp. 279-286.
Pantano, E. and Viassone, M. (2015), “Engaging consumers on new integrated multichannel retailsettings: challenges for retailers”, Journal of Retailing and Consumer Services, Vol. 25, July,pp. 106-114.
Papagiannidis, S. and Bourlakis, M. (2010), “Staging the new retail drama: at a metaverse near you!”,Journal of Virtual Worlds Research, Vol. 5 No. 2, pp. 3-17.
Papagiannidis, S., Bourlakis, M.A. and Li, F. (2008), “Making real money in virtual worlds: MMORPGsand emerging business opportunities, challenges and ethical implications in metaverses”,Technological Forecasting and Social Change, Vol. 75 No. 5, pp. 610-622.
Papagiannidis, S., Pantano, E., See-To, E. and Bourlakis, M. (2013), “Modelling the determinants of asimulated experience in a virtual retail store and users’ product purchasing intentions”, Journalof Marketing Management, Vol. 29 Nos 13-14, pp. 1462-1492.
Parke, F.I. (2005), “Lower cost spatially immersive visualization for human environments”, Landscapeand Urban Planning, Vol. 73 Nos 2-3, pp. 234-243.
Poncin, I. and Mimoun, M.S.B. (2014), “The impact of ‘e-atmospherics’ on physical stores”, Journal ofRetailing and Consumer Services, Vol. 21 No. 5, pp. 851-859.
Prahalad, C.K. and Ramaswamy, V. (2004), “Co-creation experiences: the next practice in valuecreation”, Journal of Interactive Marketing, Vol. 18 No. 3, pp. 5-14.
Raubenheimer, J.E. (2004), “An item selection procedure to maximize scale reliability and validity”,South African Journal of Industrial Psychology, Vol. 30 No. 4, pp. 59-64.
Reinartz, W., Haenlein, M. and Henseler, J. (2009), “An empirical comparison of the efficacy ofcovariance-based and variance-based SEM”, International Journal of Research in Marketing,Vol. 26 No. 4, pp. 332-344.
Ringle, C.M., Wende, S. and Will, A. (2005), “SmartPLS 2.0 (beta)”, available at: www.smartpls.de(accessed 1 February 2015).
Sarstedt, M., Henseler, J. and Ringle, C.M. (2011), “Multigroup analysis in partial least squares (PLS)path modeling: alternative methods and empirical results”, in Sarstedt, M., Schwaiger, M. andTaylor, C.R. (Eds),Measurement and Research Methods in International Marketing, (Advances inInternational Marketing), Vol. 22, Emerald Group Publishing Limited, pp. 195-218.
Schmitt, B. (1999), “Experiential marketing”, Journal of Marketing Management, Vol. 15 Nos 1-3,pp. 53-67.
Sheridan, T.B. (1992), “Musings on telepresence and virtual presence”, Presence, Vol. 1 No. 1, pp. 120-126.
Shih, C. (1998), “Conceptualising consumer experiences in cyberspace”, European Journal of Marketing,Vol. 32 Nos 7-8, pp. 655-663.
Song, J.H. and Zinkhan, G.M. (2008), “Determinants of perceived web site interactivity”, Journal ofMarketing Research, Vol. 72 No. 2, pp. 99-113.
Steuer, J. (1992), “Defining virtual reality: dimensions determining telepresence”, Journal ofCommunication, Vol. 42 No. 4, pp. 73-93.
Sukoco, B.M. andWu, W.Y. (2011), “The effects of advergames on consumer telepresence and attitudes:a comparison of products with search and experience”, Expert Systems with Applications, Vol. 38No. 6, pp. 7396-7406.
Sylaiou, S., Mania, K., Karoulis, A. and White, M. (2010), “Exploring the relationship between presenceand enjoyment in a virtual museum”, International Journal of Human-Computer Studies, Vol. 68No. 5, pp. 243-253.
186
ITP30,1

Turkay, S. and Adinolf, S. (2010), “Free to be me: a survey study on customization with World ofWarcraft and City of Heroes/Villains players”, Procedia Social and Behavioral Sciences, Vol. 2No. 2, pp. 1840-1845.
Van Vugt, H.C., Hoorn, J.F. and Konijn, E.A. (2009), “Interactive engagement with embodies agents:an empirically validated framework”, Computer Animation and Virtual Worlds, Vol. 20 Nos 2-3,pp. 195-204.
Van Vugt, H.C., Konijn, E.A., Hoorn, J.F., Keur, I. and Eliens, A. (2006), “Realism is not all! userengagement with task-related interface characters”, Interacting with Computers, Vol. 19 No. 2,pp. 267-280.
Verhagen, T., Swen, E., Feldberg, F. and Merikivi, J. (2015), “ Benefitting from virtual customerenvironments: an empirical study of customer engagement”, Computers in Human Behavior,Vol. 48, July, pp. 340-357.
Verhagen, T., Feldberg, F., Hooff, B.V.D., Meents, S. and Merikivi, J. (2011), “Satisfaction with virtualworlds: an integrated model of experiential value”, Information and Management, Vol. 48 No. 6,pp. 201-207.
Verhagen, T., Feldberg, F., Van Den Hooff, B., Meents, S. and Merikivi, J. (2012), “Understanding users’motivations to engage in virtual worlds: a multipurpose model and empirical testing”,Computers in Human Behavior, Vol. 28 No. 2, pp. 484-495.
Verhoef, P.C., Lemon, K.N., Parasuraman, A., Roggeveen, A., Tsiros, M. and Schlesinger, L.A. (2009),“Customer experience creation: determinants, dynamics and management studies”, Journal ofRetailing, Vol. 85 No. 1, pp. 31-41.
Vila, N. and Kuster, I. (2011), “Consumer feelings and behaviours towards well designed websites”,Information Management, Vol. 48 Nos 4/5, pp. 166-177.
Vorderer, P. (1992), Watching Television as Action: Reception of TV Movies from the Perspective ofMotivational Psychology, Edition Sigma, Berlin.
Weibel, D. and Wissmath, B. (2011), “Immersion in computer games: the role of spatial presenceand flow”, International Journal of Computer Games Technology, Vol. 2011, Article ID 282345,pp. 1-14.
Yang, H.E. and Wu, C.C. (2009), “Effects of image interactivity technology adoption on e-shoppers’behavioural intentions with risk as moderator”, Production Planning & Control, Vol. 20 No. 4,pp. 370-382.
Yoo, S.-C., Peña, J.F. and Drumwright, M.E. (2015), “Virtual shopping and unconscious persuasion: thepriming effects of avatar age and consumers’ age discrimination on purchasing and prosocialbehaviors”, Computers in Human Behavior, Vol. 48, July, pp. 62-71.
Yoo, W.S., Lee, Y. and Park, J. (2010), “The role of interactivity in e-tailing: creating value andincreasing satisfaction”, Journal of Retailing and Consumer Services, Vol. 17 No. 2, pp. 89-96.
Zhou, Z., Jin, X.-L. and Fang, Y. (2014), “Moderating role of gender in the relationships betweenperceived benefits and satisfaction in social virtual world continuance”, Decision SupportSystems, Vol. 65, September, pp. 69-79.
Zhou, Z., Fang, Y., Vogel, D.R., Jin, X.-L. and Zhang, X. (2012), “Attracted to or locked in? Predictingcontinuance intention in social virtual world services”, Journal of Management InformationSystems, Vol. 29 No. 1, pp. 273-306.
Zhou, Z., Jin, X.-L., Vogel, D.R., Fang, Y. and Chen, X. (2011), “Individual motivations and demographicdifferences in social virtual world uses: an exploratory investigation in second life”, InternationalJournal of Information Management, Vol. 31 No. 3, pp. 261-271.
About the authorsSavvas Papagiannidis is the David Goldman Professor of Innovation and Enterprise in the NewcastleUniversity Business School, UK. His work has been published in several academic journals and presentedat the international conferences. His research interests mainly revolve around electronic business and itsvarious sub-domains. More specifically, his research aims to inform our understanding of how e-business
187
Virtual retailenvironments

technologies affect the social and business environment, organisational strategies and business models,and how these are implemented in terms of functional innovations. His work puts strong emphasis oninnovation, new value creation and the exploitation of entrepreneurial opportunities, within the context ofdifferent industries. Savvas Papagiannidis is the corresponding author and can be contacted at: [email protected]
Eleonora Pantano is a Lecturer in Marketing at the Middlesex University of London, UK. Prior tojoining Middlesex in February 2015, she was post doc a Research Fellow at the University of Calabria,Italy and a Researcher at the Technical University of Eindhoven, The Netherlands. She holds a PhD in“Psychology of Programming and Artificial Intelligence” and a Master’s Degree in BusinessEngineering. Her research activities explore marketing management and mainly relate to consumersattitude and acceptance towards new technology-based retail settings, and how business and retailmodels are implemented in terms of innovation and technology management. Her findings appear innumerous international journals such as Journal of Marketing Management, International Journal ofInformation Management, and Journal of Retailing and Consumer Services (she was also a Guest Editorof two special issues for this journal and got the Certificate of Excellence in Reviewing for 2013).
Eric W.K. See-To is an Assistant Professor at the Department of Industrial and SystemsEngineering, Hong Kong Polytechnic University, and currently an Associate Editor of ElectronicCommerce Research. Prior to the current appointment, Eric served as a Senior Lecturer in the BusinessSchool, University of Newcastle upon Tyne, UK and as a Lecturer in the Department of ManagementScience, Lancaster University Management School, UK. His current projects include application of textmining techniques to financial valuation of innovation and intangible assets, and analysis of onlineopinions and sentiments with social network and data mining. Eric’s research focusses on practicalapplications of business intelligence and knowledge mining. His work has been published ininternational and top-tier journals such as Journal of Management Information Systems ( JMIS),Research Policy,Technological Forecasting and Social Change, Electronic Commerce Research, ElectronicMarkets, Information Systems Frontiers, and Journal of Electronic Commerce Research.
Charles Dennis is a Professor of Marketing and Retailing at The Business School, MiddlesexUniversity, UK and an Associate Editor (Retailing) of the European Journal of Marketing. His mainteaching and research area is (e-)retail and consumer behaviour – the vital final link of the marketingprocess. Charles is a Chartered Marketer, elected as a Fellow of the Chartered Institute of Marketing forhelping to modernise the teaching of the discipline. Charles was awarded the Vice Chancellor’s Award forTeaching Excellence for improving the interactive student learning experience at the Brunel University.Charles has published in journals such as Journal of Business Research and European Journal ofMarketing. Books include Marketing the e-Business, (1st and 2nd editions) ( joint-authored with Dr LisaHarris); the research monograph (combined textbook) e-Retailing (Routledge) and China LogisticsPublishing House; and research monograph Objects of Desire: Consumer Behaviour in Shopping CentreChoice (Palgrave). His research into shopping styles has received extensive coverage in the popular mediaincluding TV appearances with Sir Trevor McDonald OBE and Adrian Edmondson.
Professor Michael Bourlakis is a Logistics and Supply Chain Management Expert at the CranfieldSchool of Management, Cranfield University, UK, where he is also the Director of the Demand ChainManagement Community and the Head of the Supply Chain Research Centre. Michael has a particularinterest in food and retail supply chains and the role of sustainability, e-business and consumerbehaviour in relation to supply chains. He has published extensively in these areas generating morethan 200 publications including 50 journal papers. He is also a Member of the European TechnologyPlatform (Food for Life, European Commission) and he has secured more than 20 research grantsfunded by various leading bodies (e.g. EPSRC, TSB, EU FVI, EUFVII, Horizon2020).
For instructions on how to order reprints of this article, please visit our website:www.emeraldgrouppublishing.com/licensing/reprints.htmOr contact us for further details: [email protected]
188
ITP30,1