Embed Size (px)
Citation preview
CHAIR Malcolm Brodie DIRECTORS Kurt Alberts Suzanne Anton Derek Corrigan Marvin Hunt Peter Ladner Sam Sullivan Joe Trasolini Richard Walton Dianne Watts Maxine Wilson Scott Young CEO Pat Jacobsen
To: GVTA Board of Directors From: Sheri Plewes, Vice President, Capital Management and Engineering and Project Director, Evergreen Light Rail Transit Project Date: October 12, 2006 Subject: Evergreen Line Project Definition Phase – Business Case and Preferred Preliminary Design Staff Recommendation: That the GVTA Board: A. Receives, for information, the report entitled “Evergreen Line Light Rail Transit
Project – Project Definition Phase Business Case”; B. Approves the Preferred Preliminary Design, as described in the report; C. Approves additional funding of $16 million ($12.5 million from the PMC
Municipal Integration Fund included in the 2001 Capital Program and $3.5 million from the 2006 Capital Program) for the detailed design for Project 0508 – Evergreen Line Project Definition Phase, for a total project budget of $59 million, consisting of $8 million for preliminary design and public consultation ($6 million GVTA and $2 million Province), $35 million for property acquisition and $16 million for detailed design; and
D. Directs staff to request additional funding from the provincial and federal governments to close the funding gap of $400 million, with the intention of having full project funding in place by April 2007.
PURPOSE The purpose of this report is to provide the Board with: A summary of the Project Definition Phase Business Case; A description of the Preferred Preliminary Design and current capital and
operating cost estimates; Status of funding and funding strategy; and Next steps.
- 2 -
BACKGROUND The population growth in the Northeast Sector is putting pressure on the existing transportation infrastructure – infrastructure that is critical to the region’s economic growth and environmental sustainability. Without an efficient transportation network, the region will face increasing traffic congestion that will restrict the movement of people and goods, deter commercial development and investment, threaten air quality and reduce the overall appeal of the area for both residents and tourists. The province, TransLink and the Greater Vancouver Gateway Council have developed a comprehensive program of investments in transit, road, marine and rail infrastructure, including the Evergreen Line. Together, these programs will help alleviate congestion, provide travel time savings and increase transportation choice. The Evergreen Line is one of these investments. The Evergreen Line is an important link within the regional transit network that will provide increased transportation choice with convenient connections to the local area bus network, the SkyTrain system, and West Coast Express. The investment in the Evergreen Line will increase transportation choice in the northeast sector by providing an alternative mode of travel to the single-occupant vehicle and will support land-use strategies of the Livable Region Strategic Plan (LRSP), as well as continued goods movement in the corridor and air quality objectives of the Air Quality Management Plan. In the fall of 2004, the GVTA completed studies regarding the provision of rapid transit in the northeast sector. The investigation was completed in two phases: Phase 1 – Conceptual and Feasibility Study and Phase 2 – Evaluation of Rapid Transit Alternatives. The studies provided preliminary functional designs for several alignments and technologies and evaluated each of these options using key criteria such as transportation benefits, urban development, environmental and ease of implementation (Multiple Account Evaluation). In October 2004, the Board Approved in Principle a predominantly surface based light rail transit (LRT) line with a funding envelope of $800M, including $170M of Provincial funding, based on a conceptual phase cost estimate of 670M ($2003) including interest during construction. At its meeting on December 8, 2004, the Board approved the Essential Elements for the Coquitlam Light Rail Transit Line. The essential project elements outline the design principles for the Evergreen Line and define the design parameters for a successful LRT system. The report also outlined a potential design and construction schedule with revenue service commencing at the end of 2009. The Board also directed staff to proceed with the next stage of the project.
- 3 -
As part of the 2004 Capital Program, Approval in Principle for the Project Definition Phase was received in December 2003. Specific Project Approval for the Project Definition Phase was approved by the Board in March 2005 with a budget of $5M, including a $2M contribution from the Province and a $3M contribution from the GVTA. In December 2005, the Coquitlam Light Rail Transit Line was renamed the Evergreen Light Rail Transit Line, as approved by the Board after a public “Name Your Line” Contest. In March 2006, the Board approved a budget of $35M for the strategic acquisition of properties for the Evergreen Line Light Rail Transit Project, as required, to protect the corridor and to minimize ultimate property acquisition costs. A project update was provided to the Board in May 2006. At that time, the Board approved additional funding of $3M to permit the continuation of design work and additional public consultation for the Evergreen Line Project Definition Phase. This increased the total budget for the Project Definition phase to $43M including $35M for property acquisition and $8M for preliminary design and public consultation, comprised of a $6M GVTA contribution and a $2M contribution from the Province. A project update was provided to the Board in July 2006. At that time, the Board approved a revised in-service date of September 2011, given the advantages of extending the detailed design and construction schedule and the high risk associated with meeting the December 2009 in-service date. Since March 2005, the Project Team has been working towards a Preferred Preliminary Design for the project based on technical information, dialogue with municipalities and public input. TransLink has been actively seeking input from the public through a series of open houses. The open houses provide an opportunity to: Provide information so that the public is able to maintain an understanding and
awareness of the project; Solicit input from a broad range of citizens and interests to identify design,
construction and operational concerns and opportunities for enhancement and mitigation; and,
Report back throughout the preliminary design phase of the Evergreen Line. In October 2006, TransLink held its fourth series of open houses along the Evergreen corridor to provide information to the public regarding the Preferred Preliminary Design, answer questions and receive feedback. This most recent series helped to build upon input received at the first three series held in November/December 2005, March/April 2006 and June 2006.
- 4 -
PROJECT DEFINITION PHASE The objectives of the Project Definition Phase are to: • Complete the preliminary design based on technical, municipal and public input,
using the Essential Elements as the framework; • Identify property requirements; • Update the cost estimate; • Update the Multiple Account Evaluation; • Update the detailed design and construction schedule; • Identify risk and develop risk mitigation measures; and • Develop the funding strategy. A business case has been prepared in response to the provincial and federal requirements for requests for infrastructure funding. The business case compiles and summarizes the technical and financial work that has been completed in the Project Definition Phase.
BUSINESS CASE SUMMARY The full business case is presented in the attached report “Evergreen Line – Project Definition Phase Business Case”. The following highlights the key information and findings of the report. The Challenge Greater Vancouver is in an enviable position in North America and the world. It has a thriving economy, driven in part by growing trade and its role as a Gateway to the whole Pacific Rim, a clean environment and a quality of life that is second to none. However, maintaining these advantages will require transportation investment, as neither the strong economy nor the quality of life can be taken for granted in an urban region with little room for land expansion and congested key corridors. In some cases transportation investments will be directed at roads such as the Province’s Gateway Program or TransLink’s Golden Ears Bridge. Both of these projects will greatly assist the region in improving the movement of people and goods. However, transit investments are also needed both to spur appropriate high density development activity and to free up road space for goods movement on the whole regional road network. With Greater Vancouver’s population growth forecast to continue over the next three decades, adding nearly one million more people to cities and roads that are already at capacity, we face a growing need to invest in transportation infrastructure. These investments should support economic development, be cost effective and encourage population and employment growth in areas that do not place pressure on the Lower Mainland’s agricultural lands. In addition they should lead to improved air quality, and be able to support the efficient movement of goods and people now and into the future.
- 5 -
IMPROVING THE MOVEMENT OF PEOPLE AND GOODS Significant road and transit projects involving all levels of government have been initiated in the past few years to begin to respond to this challenge. Federal and provincial funding has facilitated improvements to the Sea to Sky Highway, the Border Infrastructure Projects, and the planned $3 billion dollar investment in road and bridge improvements included in the Gateway Program. These are just a few of the projects designed to benefit the provincial economy by improving the movement of goods, services and people throughout the region. Regional and municipal governments have been active as well. TransLink is currently constructing the Golden Ears Bridge to provide a much-needed link across the Fraser River between Langley and Surrey on the south side, and Maple Ridge and Pitt Meadows on the north side. TransLink is also investing in road infrastructure throughout the region by committing $236M toward eight significant projects on the regional Major Road Network. The federal, provincial and municipal governments and TransLink have also been supportive of rapid transit initiatives in Greater Vancouver, but the true value of these investments cannot be fully realized until the rapid transit network is completed, providing quick and reliable travel to most parts of the region. Both the Canada Line, expected to open in 2009, and the Millennium Line, which opened in 2002 demonstrate the provincial and federal governments’ commitment to rapid transit improvements to date. In the early 1990s there were many significant planning initiatives. As a result of the regional Creating Our Future dialogue, two major plans emerged. The first was the joint Provincial/Regional 1993 Transport 2021 Long-Range Transportation Plan that called for a network of rapid transit linking regional town centres in Richmond, Vancouver, Surrey, Coquitlam, New Westminster and Burnaby. The output from Transport 2021 became one of the cornerstones of the Greater Vancouver Regional District’s (GVRD) 1996 Livable Region Strategic Plan (LRSP), which laid the foundation for managing growth in the region. In 1996 this plan was also approved by the Province as a regional growth strategy. In support of the LRSP, TransLink is committing funds to transit expansion while the municipalities align their Official Community Plans (OCP) to meet the LRSP growth management objectives. A central objective is to increase transportation choice by completing the rapid transit network to serve existing demand and act as a catalyst for increased development in areas designated for growth. As individuals choose to use the new rapid transit infrastructure, there is a resulting reduction in traffic on the region’s roads, creating road space for the movement of goods and services which rely on the entire network of roads. With 90 percent of most peak time regional highway trips being commuters, travel alternatives are essential.
- 6 -
Within this context, TransLink is working to complete the rapid transit network that was foreseen in the joint Provincial/Regional Transport 2021 plan as being in place by 2006. The Evergreen Light Rail Transit (LRT) Line in the region’s Northeast Sector will extend the reach of the rapid transit network and directly serve the cities of Burnaby, Port Moody and Coquitlam and significantly improve traffic flow for both goods and general traffic throughout the region. THE NORTHEAST SECTOR The Northeast Sector is among the region’s fastest growing areas. Population growth has outpaced the regional average, growing 125% since 1976 versus 85% for the GVRD. This trend is expected to continue. The GVRD forecasts the Northeast Sector population will grow to approximately 288,000 people by 2021, which represents a 46% increase from 2001. By comparison, the GVRD expects the regional population to increase by 25% over the same time period. Traffic growth in Greater Vancouver’s Northeast Sector is among the highest in the region. For example, recent studies show traffic on North Road in Coquitlam has increased by 10.3% since 1996 versus a regional average increase of 6.7%. With this traffic growth, travel times have been increasing and are becoming less reliable and less predictable, directly impacting both the cost of moving goods and the efficiency with which the shippers and receivers of goods can function. Extending the Rapid Transit Network The Evergreen LRT Line provides a cost-effective solution to stimulate concentrated regional development and address the immediate and future capacity constraints that limit economic growth in the region. An 11.2 kilometre, 12-station alignment that is largely at-grade and runs north from the Lougheed Town Centre SkyTrain station in Burnaby to an eastern terminus at Douglas College in Coquitlam, the Evergreen Line features stations located at key points along the alignment. These strategically located stations provide convenient access to a number of activity centres and potential development sites within the corridor. The line also provides convenient connections to other transit services including SkyTrain, West Coast Express and the local bus network. LRT, although new to the Lower Mainland, is a well-proven transit mode that has been introduced in many similar-sized cities around the world, not just for its transportation benefits, but also as a catalyst for focusing new and higher density mixed-use development clustered around new transit stations.
- 7 -
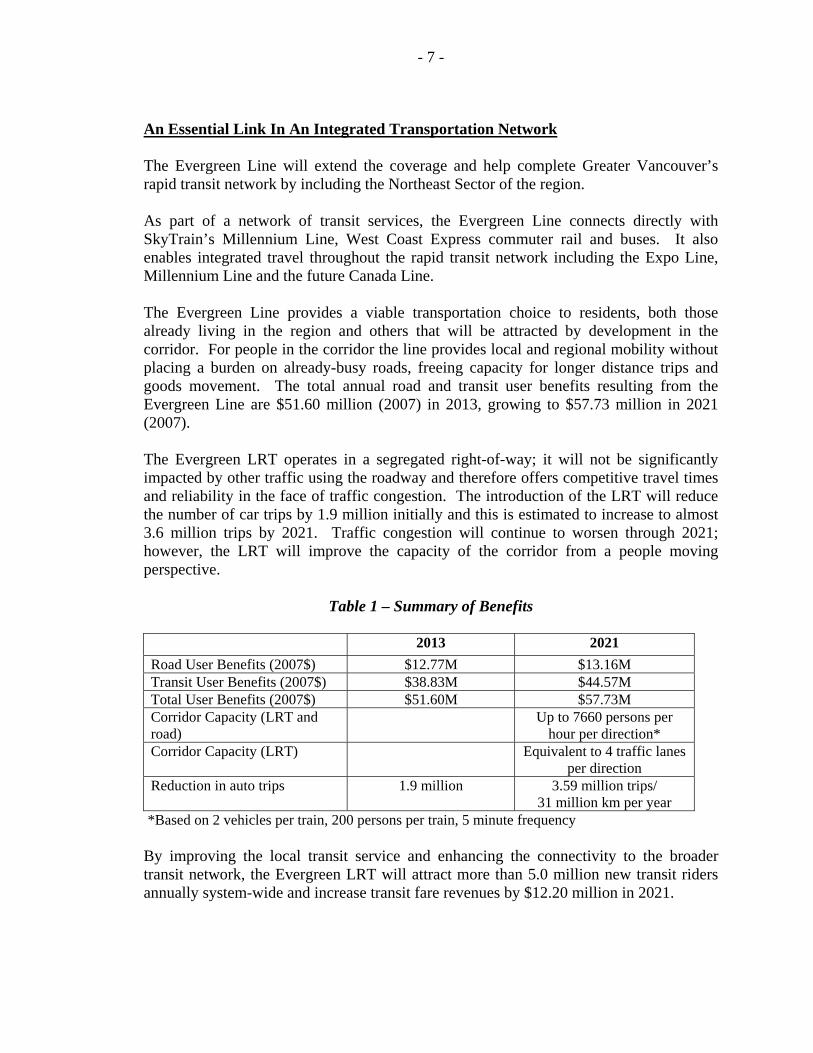
An Essential Link In An Integrated Transportation Network The Evergreen Line will extend the coverage and help complete Greater Vancouver’s rapid transit network by including the Northeast Sector of the region. As part of a network of transit services, the Evergreen Line connects directly with SkyTrain’s Millennium Line, West Coast Express commuter rail and buses. It also enables integrated travel throughout the rapid transit network including the Expo Line, Millennium Line and the future Canada Line. The Evergreen Line provides a viable transportation choice to residents, both those already living in the region and others that will be attracted by development in the corridor. For people in the corridor the line provides local and regional mobility without placing a burden on already-busy roads, freeing capacity for longer distance trips and goods movement. The total annual road and transit user benefits resulting from the Evergreen Line are $51.60 million (2007) in 2013, growing to $57.73 million in 2021 (2007). The Evergreen LRT operates in a segregated right-of-way; it will not be significantly impacted by other traffic using the roadway and therefore offers competitive travel times and reliability in the face of traffic congestion. The introduction of the LRT will reduce the number of car trips by 1.9 million initially and this is estimated to increase to almost 3.6 million trips by 2021. Traffic congestion will continue to worsen through 2021; however, the LRT will improve the capacity of the corridor from a people moving perspective.
Table 1 – Summary of Benefits 2013 2021 Road User Benefits (2007$) $12.77M $13.16M Transit User Benefits (2007$) $38.83M $44.57M Total User Benefits (2007$) $51.60M $57.73M Corridor Capacity (LRT and road)
Up to 7660 persons per hour per direction*
Corridor Capacity (LRT) Equivalent to 4 traffic lanes per direction
Reduction in auto trips 1.9 million 3.59 million trips/ 31 million km per year
*Based on 2 vehicles per train, 200 persons per train, 5 minute frequency By improving the local transit service and enhancing the connectivity to the broader transit network, the Evergreen LRT will attract more than 5.0 million new transit riders annually system-wide and increase transit fare revenues by $12.20 million in 2021.
- 8 -
The Evergreen LRT Line will enhance the people moving capacity of the Northeast Sector corridor. The system design capacity of the LRT in 2021 is equivalent to 8 additional traffic lanes, preserving existing road lanes and adjacent land for development. Given topographical constraints and development along the corridor, expanding the roadway beyond two additional lanes is not feasible and would not supply the additional capacity required to address congestion. The Evergreen Line is one of the investments that has been identified by the province, the region and gateway industries to alleviate congestion, provide travel time savings and increase transportation choice to improve the movement of people and goods in the region. Cost Effective The Project Definition Phase of the Evergreen Line included further technical work and consultation to better define the project. The estimated capital costs have been updated to reflect the current design and market conditions. The estimated capital cost for the proposed Evergreen LRT Line is $970 million (2007) or $86.2 million per kilometre. The Evergreen Line compares favourably to other LRT systems in North America, as identified in the benchmarking survey. The Evergreen Line capital costs, the ridership numbers and the station spacing are consistent with other North American LRT systems. The Evergreen Line has relatively higher costs and lower passenger numbers than many European systems (not unexpected given higher European population densities and more compact city design) but still falls within the range of European systems. It is expected that the Evergreen Line will recover about 95% of its annual operating costs in 2013 and, by 2021, revenues and savings are expected to exceed annual operating costs. An Operations and Maintenance Centre is required for the Evergreen LRT Line and will be the first light rail vehicle facility in the Lower Mainland. This one-time investment will support future extensions to the LRT system. Creates Employment and Generates Tax Revenues The construction of the Evergreen Line will generate some 6,860 person-years of direct, indirect and induced employment in British Columbia providing estimated federal and provincial tax revenues of $27 and $37 million respectively. The operation and maintenance of the Evergreen Line will generate employment from on-board operations and from the Operations and Maintenance Centre (OMC) functions. Employment created from the on-going operations and maintenance of the Evergreen Line is equivalent to 121 full-time positions including 93 direct and 28 indirect jobs.
- 9 -
Supports Future Growth The Evergreen Line supports growth in a sustainable manner providing the ability to cost-effectively add capacity to move more people through the corridor as demand increases. The new LRT line provides the transportation infrastructure to enable the municipalities to achieve growth management objectives that are otherwise unattainable. Local municipalities have structured their Official Community Plans based on the availability of an intermediate capacity transit line. The line supports regional and municipal growth management strategies that help limit the impacts of growth on the environment and sustain the livability of the region. Supports Wider Regional Environmental Objectives The Evergreen Line reduces vehicle travel in the lower Fraser Valley by an estimated 31 million km per year by 2021. This results in Common Air Contaminants (CACs), such as carbon monoxide, nitrogen dioxide, ozone and particulate matter, being reduced by 355.5 tonnes per year, of which 43.5 tonnes are smog-forming pollutants. The 355.5 tonnes per year total represents a 0.5% reduction of CACs in the Northeast Sector. Based on the estimated reduction in vehicle km driven following the introduction of the Evergreen Line, and allowing for the need to generate electricity to power the LRT system, the estimated net reduction of Greenhouse Gas (GHG) emissions in 2021 is 10,592 tonnes. This net reduction in GHG represents a 0.03% reduction in the estimated total GHG production in the Lower Fraer valley in 2021. The amount of tree canopy along the corridor will be more than doubled. The line runs through an existing transportation corridor, therefore, the effect on waterways and green zones is minimal. Supported In Its Community The Evergreen Line LRT has been developed through extensive community and stakeholder consultation at all phases. It has been identified from a set of alternative alignments and technologies as the most supportable and beneficial for the existing communities to achieve their share of regional development. A 40% expansion of the region’s rail rapid transit network with the Canada Line between Vancouver, Richmond and the airport, and the Evergreen Light rail line from Coquitlam Centre and Port Moody to Lougheed Town Centre SkyTrain station enjoys 94% support from people across the region as a project of importance to Greater Vancouver, according to an April 17, 2006 Ipsos Reid public opinion survey.
- 10 -
The Right Solution A Multiple Account Evaluation (MAE) report was prepared to provide an update of the MAE presented in the March 2004 Alternatives Study, which compared alternative routes and technologies for the proposed rapid transit line connecting Lougheed Town Centre and Coquitlam Town Centre. The updated MAE compares the Evergreen Line’s LRT system and alignment to three alternative technologies, conventional bus, bus rapid transit (BRT) and SkyTrain, along the same alignment. The benefit-cost ratio of the project is 1.15 and the Net Present Value is $143.46 million, based on the incremental present value of capital and operating costs and the incremental present value of revenues, savings and transportation user benefits through to 2041. Bus Rapid Transit (BRT), as a result of having the lowest capital investment, has the most favourable overall Project NPV and benefit-cost ratio. However, by 2021, the system is operating at full capacity with no practical means for expansion to meet the longer term ridership needs of the region. BRT is an interim solution and investment in rail will be required prior to 2021 to realize the transportation and economic objectives for the region. Both LRT and SkyTrain, although more capital cost intensive compared to BRT, will provide a reliable rapid transit service to the Northeast Sector for the long term. Rail systems strongly support long-term economic development, primarily because they are more permanent and will therefore attract more commercial and residential development. LRT has a lower capital cost than SkyTrain and superior customer features while SkyTrain generates greater ridership and travel benefits. However, the additional capital cost of $300 million for SkyTrain is a significant factor favouring LRT. These capital cost savings can be used for other projects that are also required to address the region’s transportation needs. Risk As part of the Project Definition Phase work, the project team is developing a risk registry for all phases of the Evergreen Line project – design, procurement, construction and operations. The risk registry includes a detailed listing of project and operational risks along with strategies to manage and mitigate these risks. This document is updated at key stages throughout the project implementation. The risks include the following main categories: • Management • Property • Regulatory Approvals • Financial • Design/ Engineering • Ridership
- 11 -
PREFERRED PRELIMINARY DESIGN For planning and design purposes, the alignment was divided into five segments based on municipal boundaries, construction methods, and the urban fabric or character of the adjacent neighbourhood. These segments are illustrated in the Open House materials provided as an appendix to this document: • Segment 1 – North Road • Segment 2 – Clarke Road • Segment 3 – St. Johns Street • Segment 4 – Barnet Highway • Segment 5 – Pinetree Way Design decisions leading to the selection of a preferred design, including the alignment and station locations, have been based on technical analysis as well as input from the public, municipalities and other stakeholders. The preferred design within each segment is described later in this Section. Design Principles Working towards the goal of the Evergreen Line, to increase transportation choice in the Northeast Sector and the region while providing significant economic, environmental and social benefits, the design set out to achieve the following principles: • Transportation – The Evergreen Line is the basis for developing a transportation
network to increase choice and support a reduction in auto use. • Urban Development – The Evergreen Line should support the creation of
complete communities and a compact region. It should support existing development and “city-shaping.”
• People – The Evergreen Line should support the creation of identifiable, and
vibrant, pedestrian friendly communities with a fully accessible system with station areas as focal points.
• Economics – The Evergreen Line should be cost effective and contribute to
economic vitality of the community and support a good business environment. • Environment – The Evergreen Line should support environmental sustainability
and ensure that the design meets wide environmental objectives.
- 12 -
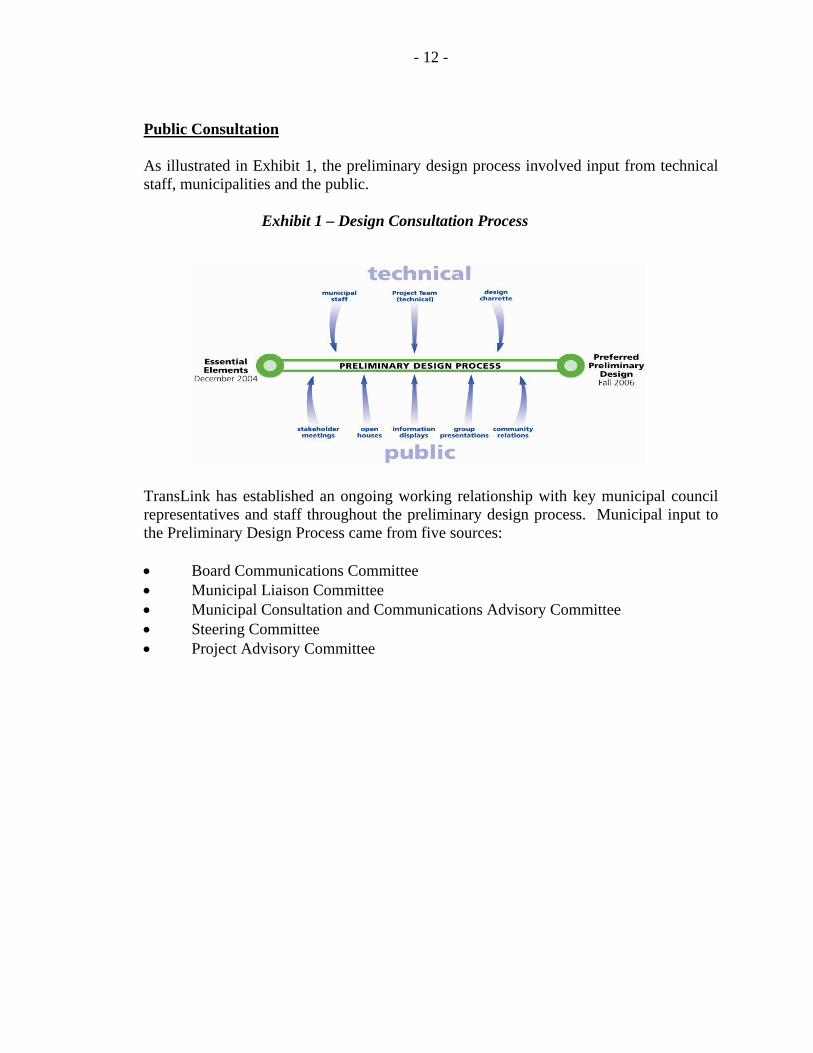
Public Consultation As illustrated in Exhibit 1, the preliminary design process involved input from technical staff, municipalities and the public.
Exhibit 1 – Design Consultation Process TransLink has established an ongoing working relationship with key municipal council representatives and staff throughout the preliminary design process. Municipal input to the Preliminary Design Process came from five sources: • Board Communications Committee • Municipal Liaison Committee • Municipal Consultation and Communications Advisory Committee • Steering Committee • Project Advisory Committee
- 13 -
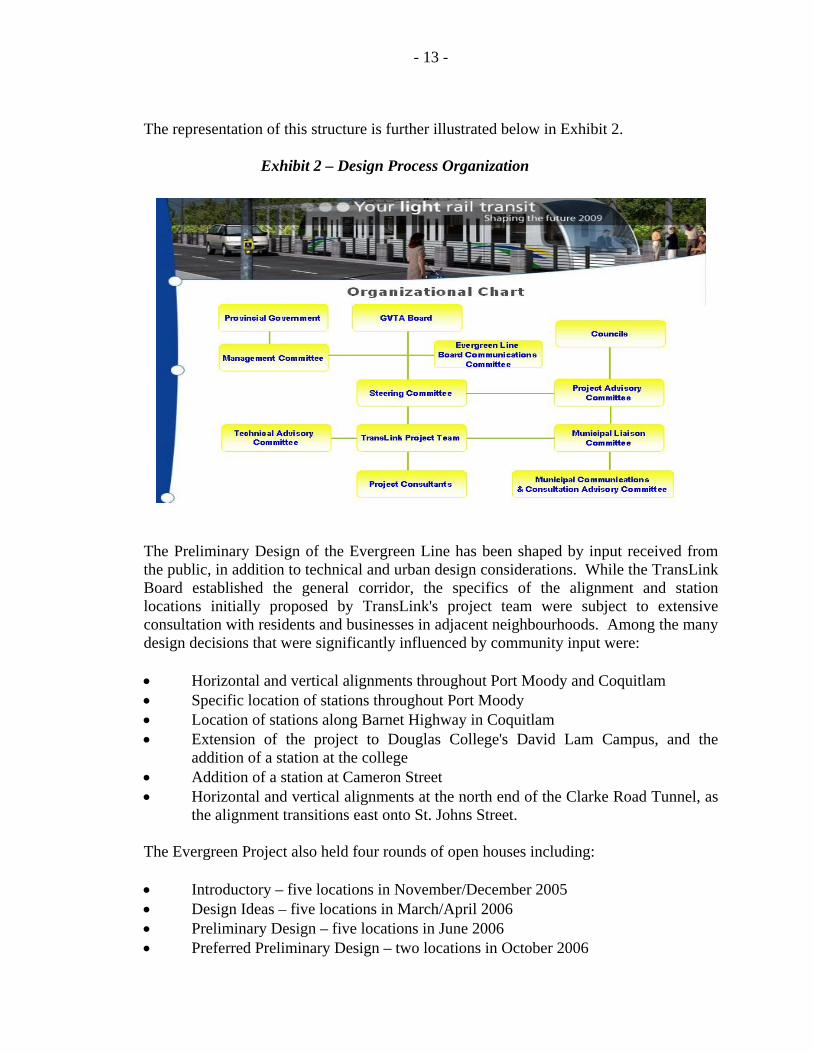
The representation of this structure is further illustrated below in Exhibit 2.
Exhibit 2 – Design Process Organization The Preliminary Design of the Evergreen Line has been shaped by input received from the public, in addition to technical and urban design considerations. While the TransLink Board established the general corridor, the specifics of the alignment and station locations initially proposed by TransLink's project team were subject to extensive consultation with residents and businesses in adjacent neighbourhoods. Among the many design decisions that were significantly influenced by community input were: • Horizontal and vertical alignments throughout Port Moody and Coquitlam • Specific location of stations throughout Port Moody • Location of stations along Barnet Highway in Coquitlam • Extension of the project to Douglas College's David Lam Campus, and the
addition of a station at the college • Addition of a station at Cameron Street • Horizontal and vertical alignments at the north end of the Clarke Road Tunnel, as
the alignment transitions east onto St. Johns Street. The Evergreen Project also held four rounds of open houses including: • Introductory – five locations in November/December 2005 • Design Ideas – five locations in March/April 2006 • Preliminary Design – five locations in June 2006 • Preferred Preliminary Design – two locations in October 2006
- 14 -
Residents are informed of these events via mail outs (27,000 letters sent to residents and businesses 500 meters on either side of the Line), approximately 1,500 emails and letters to individuals on project data base, TransLink website and Buzzer1, and advertisements in local newspapers. Over 2000 people attended the first three rounds of Open Houses (Round One – 750; Round Two – 725; Round Three – 575). Alignment Overview At Lougheed Town Centre, the Evergreen Line features an elevated station integrated with the Lougheed Town Centre SkyTrain Station. From this station, the line remains elevated, passing over Austin Avenue and heading north along the centre of North Road, touching down to street-level just south of Cochrane Street. A station will be located at Cameron Street. The alignment then continues at street-level in a centre median with the next station located in front of the existing Burquitlam Plaza. This location has been identified as a mixed use (retail and residential) Transit-Oriented Development, with activity concentrated around the new station. Beyond this station the alignment crosses Como Lake Avenue and then enters a 2 km tunnel on Clarke Road near Morrison Avenue, emerging in Port Moody at the bottom of the hill, in the centre of Clarke Road west of Barnet/Albert Street. From the Port Moody tunnel portal, the Evergreen Line continues eastbound at street-level along the centre of St. Johns Street, with stations located at Albert Street/Barnet Highway (at the tunnel portal) serving the local neighbourhood, Port Moody Secondary School and nearby development sites; Moody Street, serving the historic district and Moody Elementary School and providing an interchange with West Coast Express and local buses; Buller Street, serving the local neighbourhood including Moody Middle School, and the new residential development accessed by the pedestrian overpass; and Ioco Road serving existing and planned developments such as Newport Village and Eagle Ridge hospital. From the Ioco Road intersection, the Evergreen Line continues at street-level in a centre median along Barnet Highway, with a station located at Lansdowne. Provision for a future station is also made at Falcon. Beyond Lansdowne Station, the line drops below grade, continuing to Coquitlam Exchange, a major transit interchange and Park & Ride facility linking the Evergreen Line with a wide range of local bus services and West Coast Express. A below grade, open-air, terraced station is located on the northern edge of the Coquitlam Exchange site. 1 A bi-weekly on-board TransLink publication that informs transit customers about transit-related issues such as new and changed services, public consultation events, fare information, and policy reminders. More than one million copies of the Buzzer are distributed each year.
- 15 -
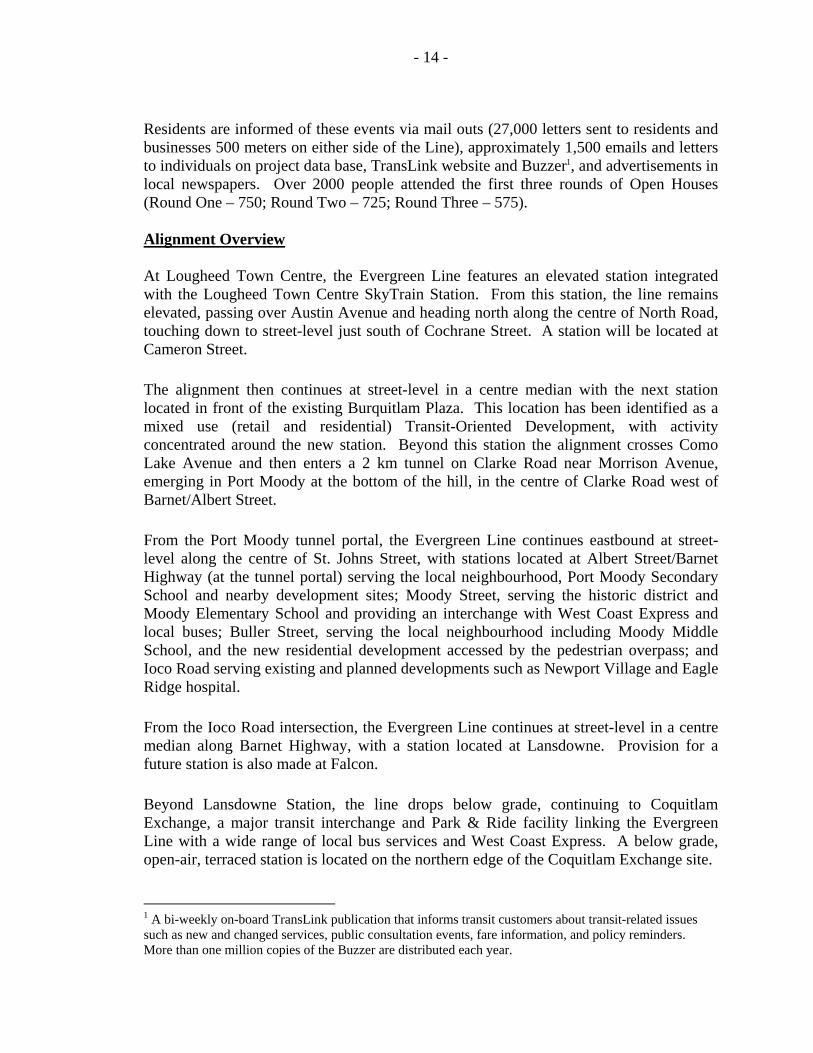
The Evergreen Line then continues under the Lougheed Highway/Pinetree Way intersection, returning to street-level just south of Anson Road in the centre of Pinetree Way and terminates at Douglas College. Stations are located at Lincoln, Civic Centre/Guildford and Douglas College. Segment 1 – North Road This southern most segment of the Evergreen Line extends from the Lougheed Town Centre SkyTrain Station to North Road/Foster Avenue. The alignment within this segment is elevated and integrated with the Lougheed Town Centre SkyTrain Station. From this transfer point, the alignment heads northeast over Austin Avenue before transitioning to the centre of North Road where it returns to street-level just south of Cochrane Avenue and operates in a centre median north to Foster Avenue. This preferred design for this segment of the Evergreen Line includes two stations, an elevated station at the Lougheed Town Centre SkyTrain Station and an at-grade station on North Road at Cameron Street.
Exhibit 3 –Lougheed Town Centre
- 16 -
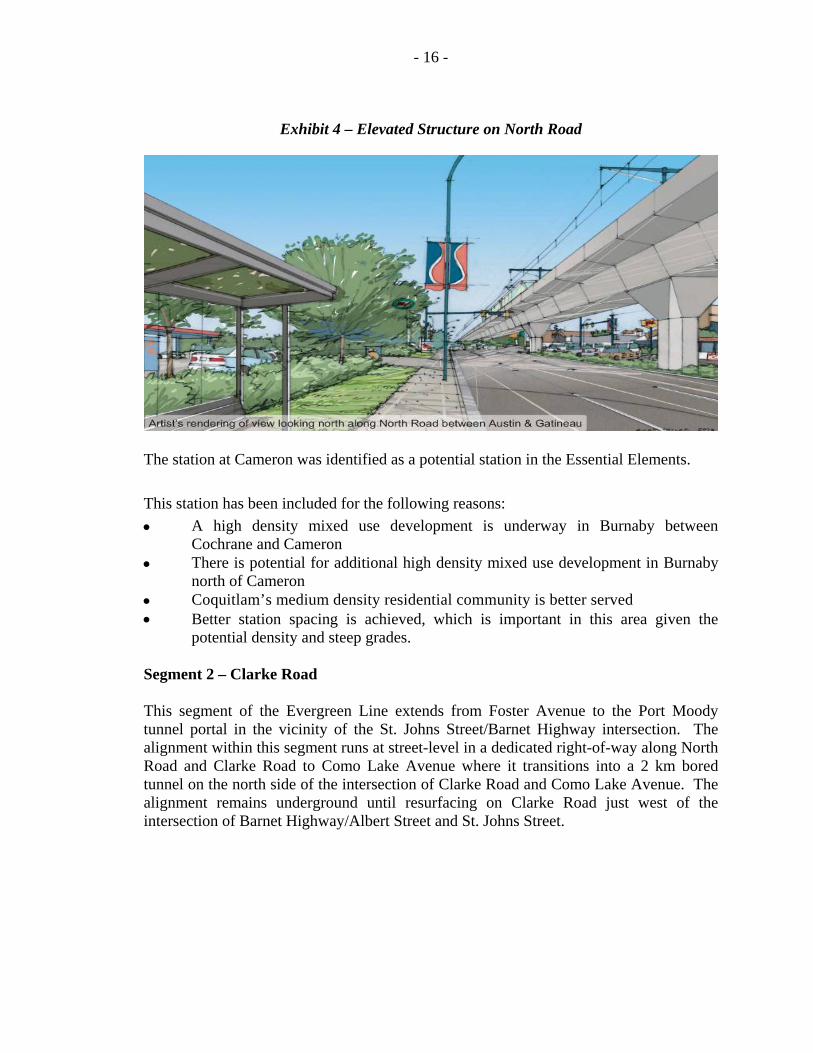
Exhibit 4 – Elevated Structure on North Road The station at Cameron was identified as a potential station in the Essential Elements. This station has been included for the following reasons: • A high density mixed use development is underway in Burnaby between
Cochrane and Cameron • There is potential for additional high density mixed use development in Burnaby
north of Cameron • Coquitlam’s medium density residential community is better served • Better station spacing is achieved, which is important in this area given the
potential density and steep grades. Segment 2 – Clarke Road This segment of the Evergreen Line extends from Foster Avenue to the Port Moody tunnel portal in the vicinity of the St. Johns Street/Barnet Highway intersection. The alignment within this segment runs at street-level in a dedicated right-of-way along North Road and Clarke Road to Como Lake Avenue where it transitions into a 2 km bored tunnel on the north side of the intersection of Clarke Road and Como Lake Avenue. The alignment remains underground until resurfacing on Clarke Road just west of the intersection of Barnet Highway/Albert Street and St. Johns Street.
- 17 -
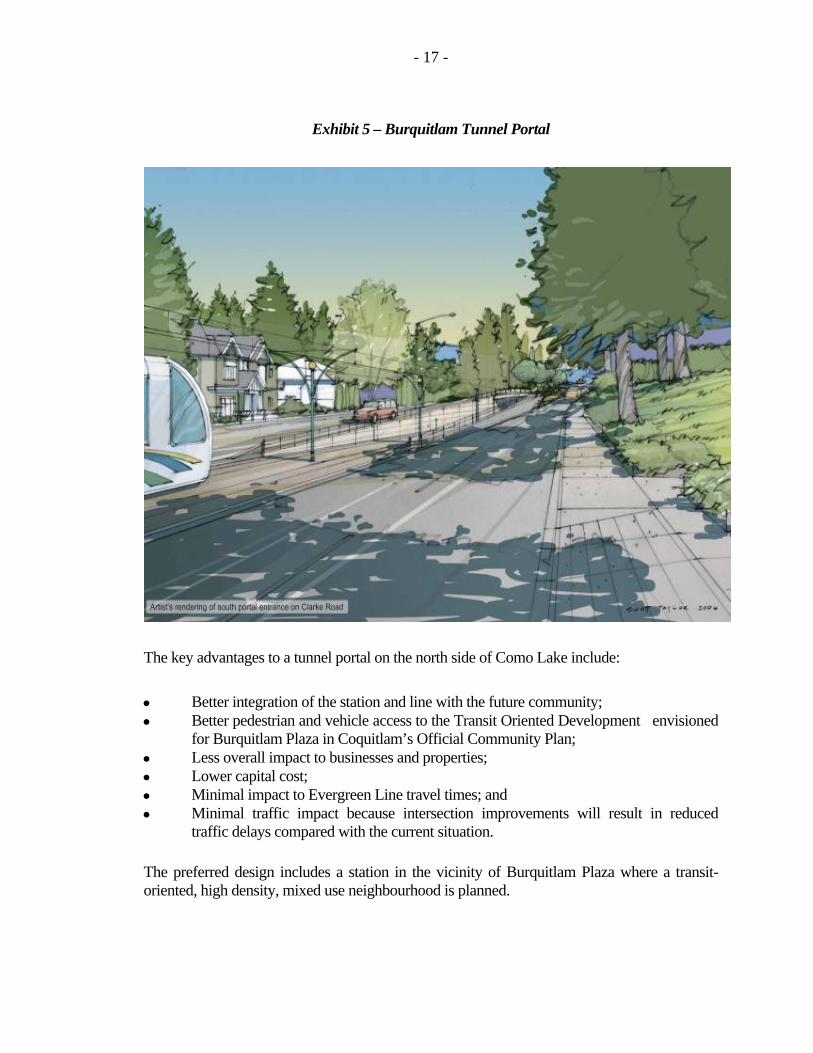
Exhibit 5 – Burquitlam Tunnel Portal The key advantages to a tunnel portal on the north side of Como Lake include: • Better integration of the station and line with the future community; • Better pedestrian and vehicle access to the Transit Oriented Development envisioned
for Burquitlam Plaza in Coquitlam’s Official Community Plan; • Less overall impact to businesses and properties; • Lower capital cost; • Minimal impact to Evergreen Line travel times; and • Minimal traffic impact because intersection improvements will result in reduced
traffic delays compared with the current situation. The preferred design includes a station in the vicinity of Burquitlam Plaza where a transit-oriented, high density, mixed use neighbourhood is planned.
- 18 -
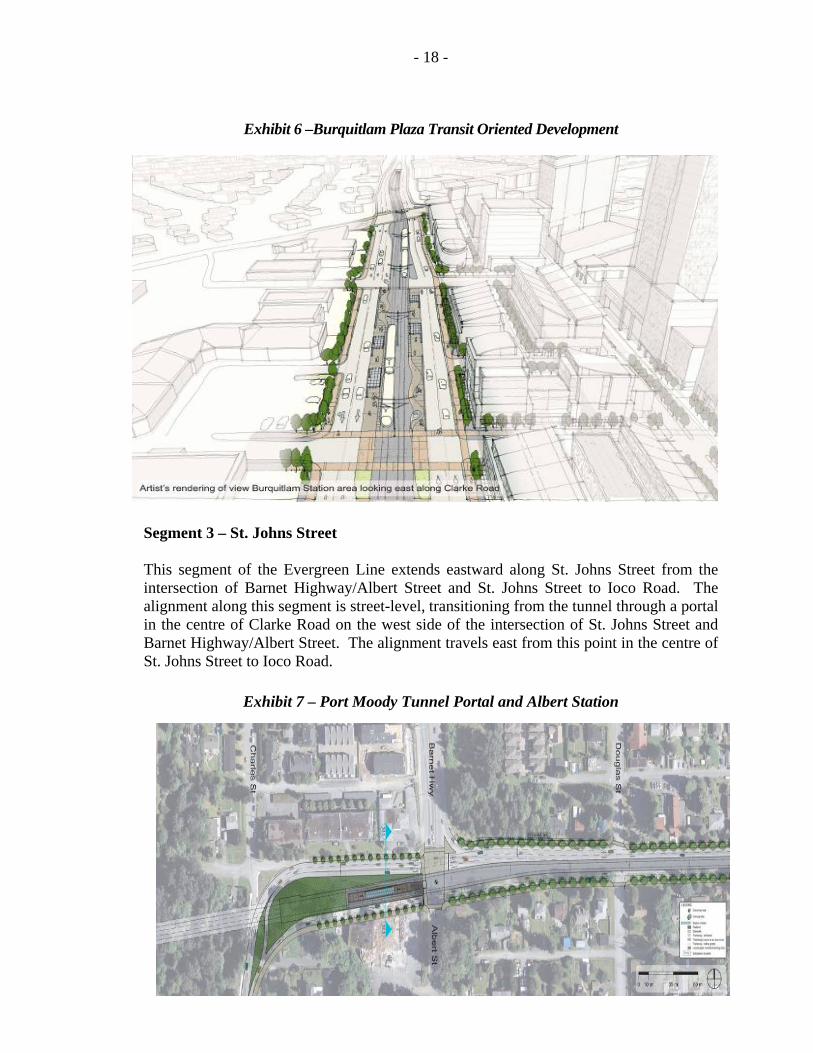
Exhibit 6 –Burquitlam Plaza Transit Oriented Development Segment 3 – St. Johns Street This segment of the Evergreen Line extends eastward along St. Johns Street from the intersection of Barnet Highway/Albert Street and St. Johns Street to Ioco Road. The alignment along this segment is street-level, transitioning from the tunnel through a portal in the centre of Clarke Road on the west side of the intersection of St. Johns Street and Barnet Highway/Albert Street. The alignment travels east from this point in the centre of St. Johns Street to Ioco Road.
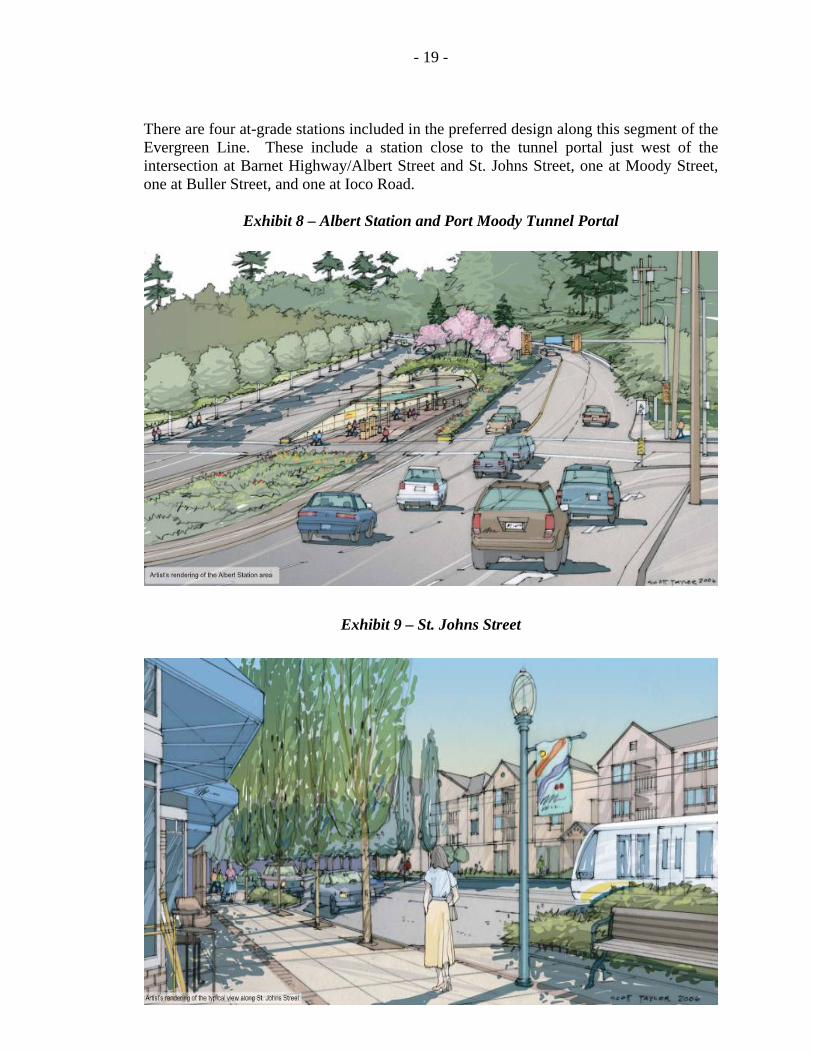
Exhibit 7 – Port Moody Tunnel Portal and Albert Station
- 19 -
There are four at-grade stations included in the preferred design along this segment of the Evergreen Line. These include a station close to the tunnel portal just west of the intersection at Barnet Highway/Albert Street and St. Johns Street, one at Moody Street, one at Buller Street, and one at Ioco Road.
Exhibit 8 – Albert Station and Port Moody Tunnel Portal
Exhibit 9 – St. Johns Street
- 20 -
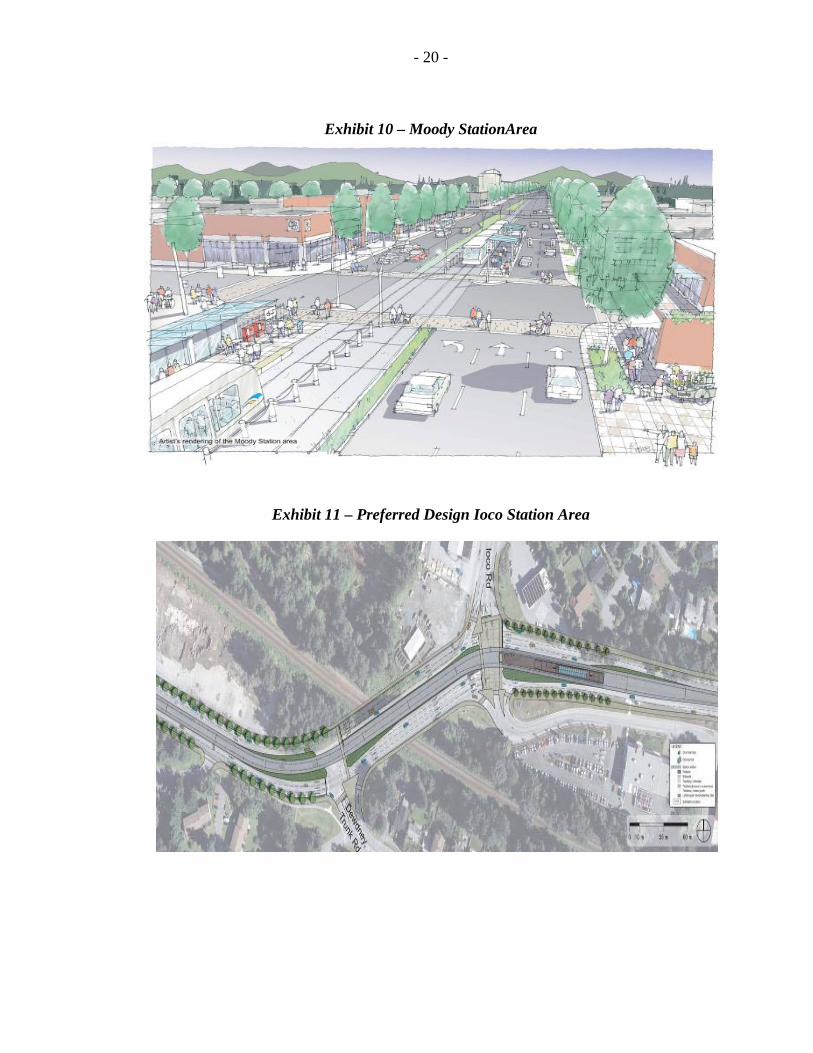
Exhibit 10 – Moody StationArea
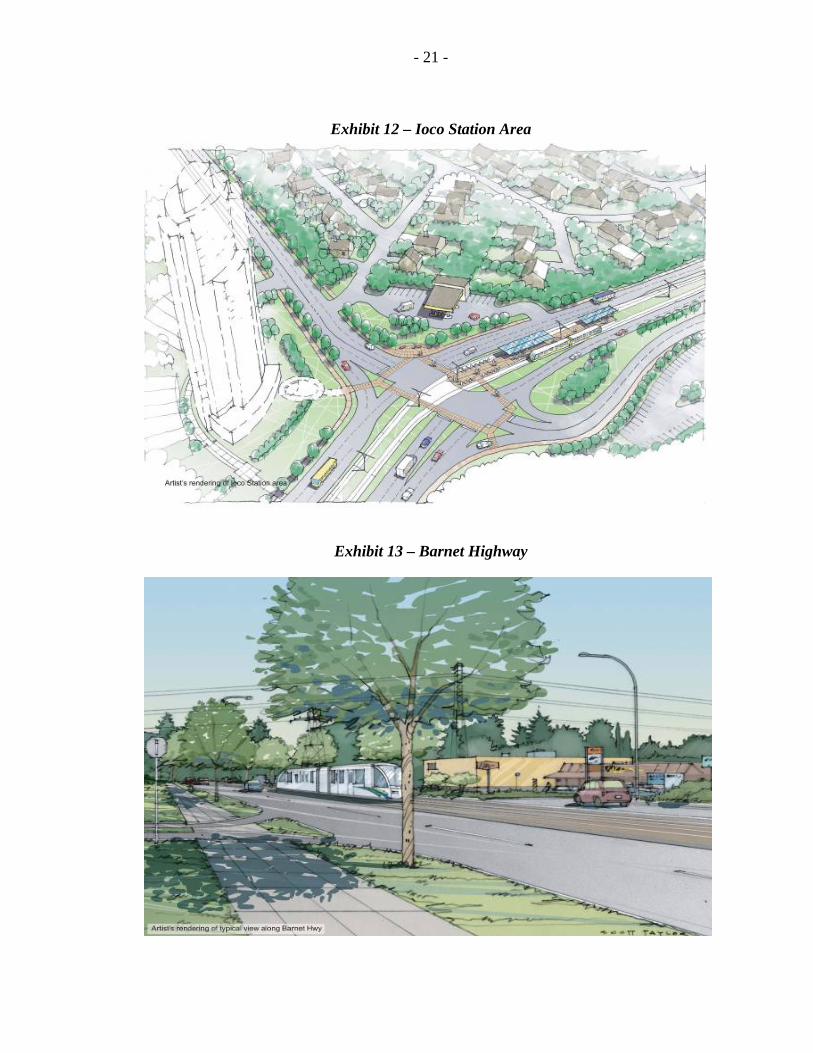
Exhibit 11 – Preferred Design Ioco Station Area
- 21 -
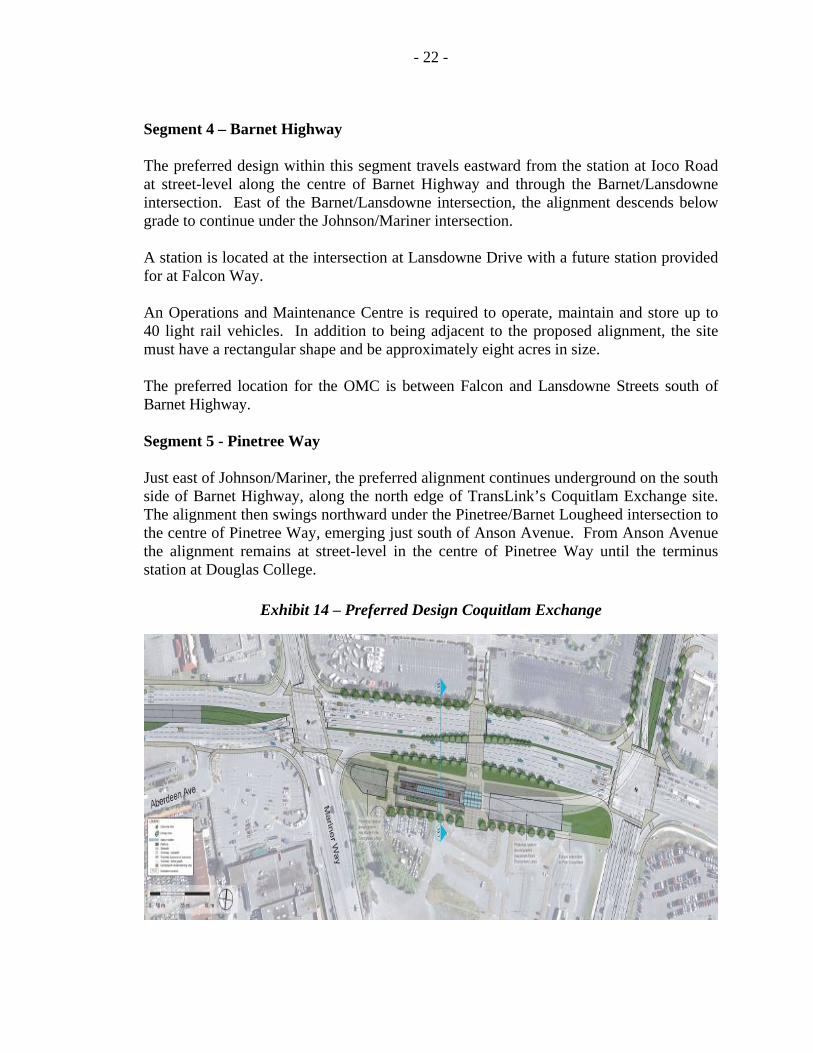
Exhibit 12 – Ioco Station Area
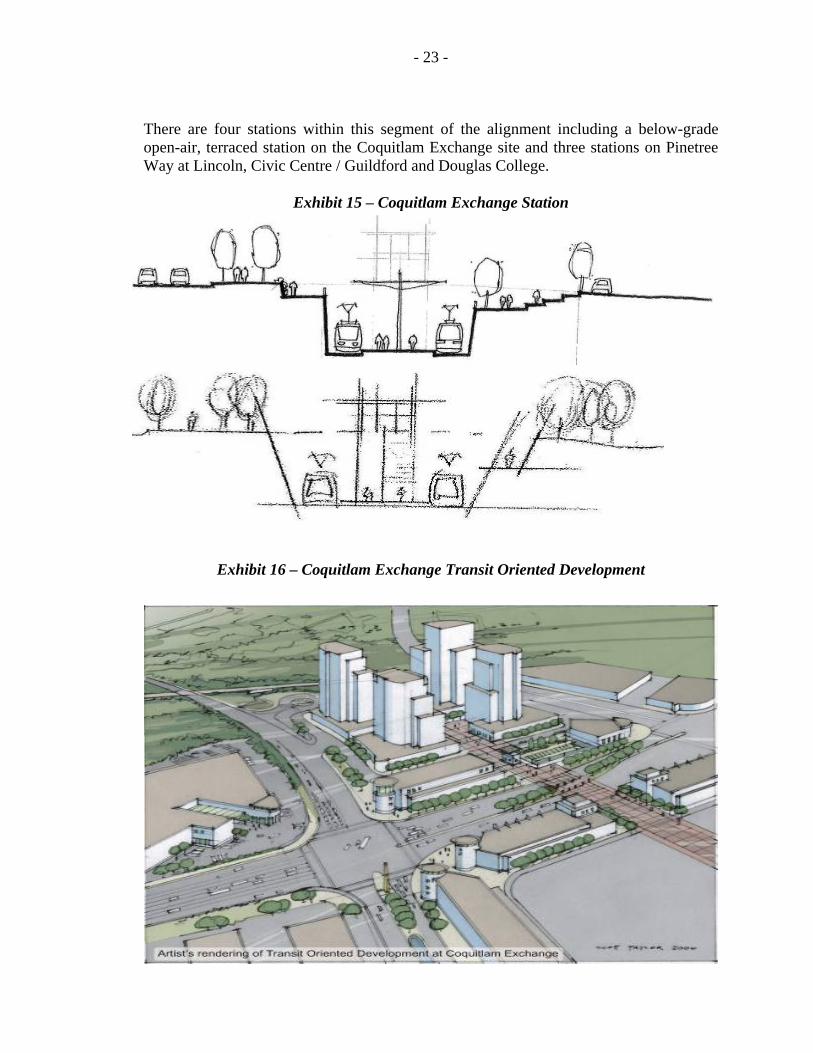
Exhibit 13 – Barnet Highway
- 22 -
Segment 4 – Barnet Highway The preferred design within this segment travels eastward from the station at Ioco Road at street-level along the centre of Barnet Highway and through the Barnet/Lansdowne intersection. East of the Barnet/Lansdowne intersection, the alignment descends below grade to continue under the Johnson/Mariner intersection. A station is located at the intersection at Lansdowne Drive with a future station provided for at Falcon Way. An Operations and Maintenance Centre is required to operate, maintain and store up to 40 light rail vehicles. In addition to being adjacent to the proposed alignment, the site must have a rectangular shape and be approximately eight acres in size. The preferred location for the OMC is between Falcon and Lansdowne Streets south of Barnet Highway. Segment 5 - Pinetree Way Just east of Johnson/Mariner, the preferred alignment continues underground on the south side of Barnet Highway, along the north edge of TransLink’s Coquitlam Exchange site. The alignment then swings northward under the Pinetree/Barnet Lougheed intersection to the centre of Pinetree Way, emerging just south of Anson Avenue. From Anson Avenue the alignment remains at street-level in the centre of Pinetree Way until the terminus station at Douglas College.
Exhibit 14 – Preferred Design Coquitlam Exchange
- 23 -
There are four stations within this segment of the alignment including a below-grade open-air, terraced station on the Coquitlam Exchange site and three stations on Pinetree Way at Lincoln, Civic Centre / Guildford and Douglas College.
Exhibit 15 – Coquitlam Exchange Station Exhibit X – Coquitlam Exchange Transit Oriented Development
Exhibit 16 – Coquitlam Exchange Transit Oriented Development
- 24 -
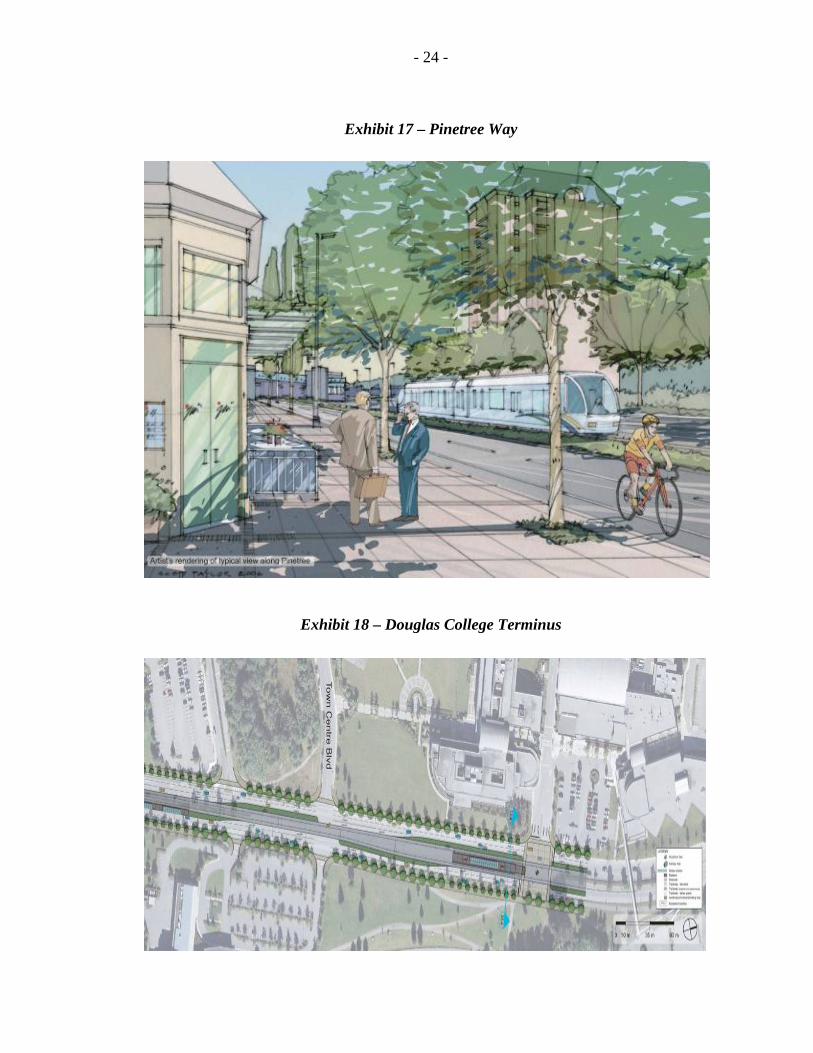
Exhibit 17 – Pinetree Way
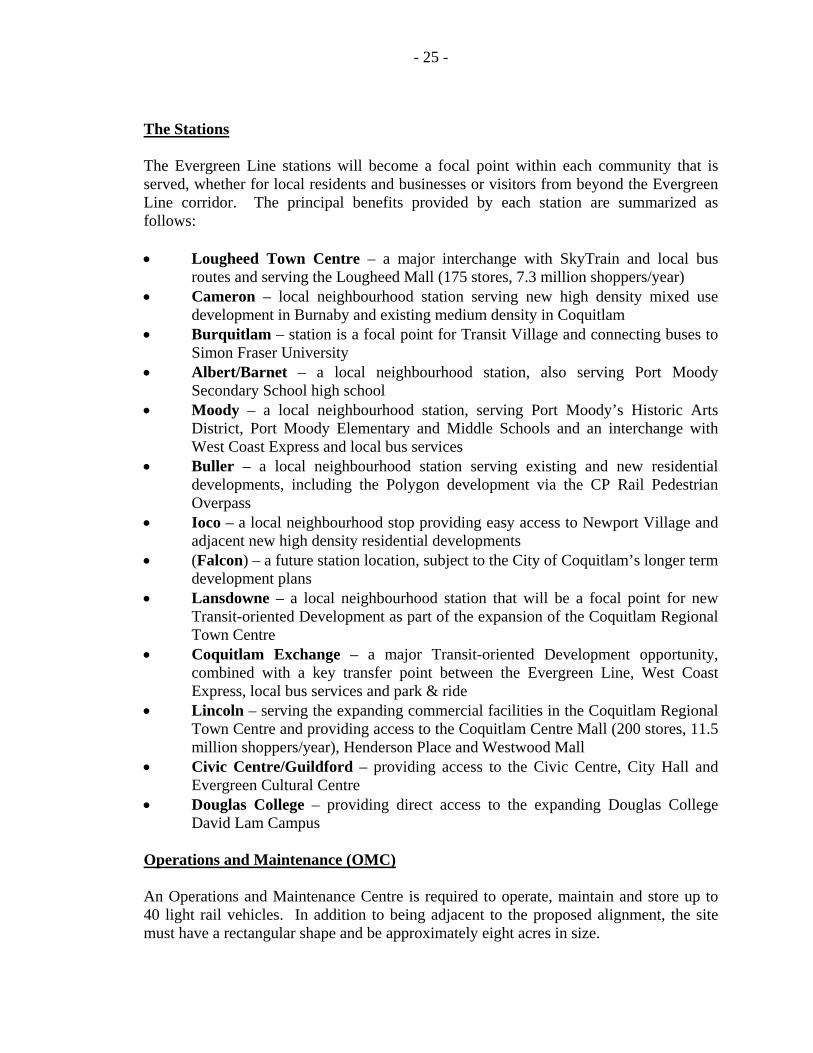
Exhibit 18 – Douglas College Terminus
- 25 -
The Stations The Evergreen Line stations will become a focal point within each community that is served, whether for local residents and businesses or visitors from beyond the Evergreen Line corridor. The principal benefits provided by each station are summarized as follows: • Lougheed Town Centre – a major interchange with SkyTrain and local bus
routes and serving the Lougheed Mall (175 stores, 7.3 million shoppers/year) • Cameron – local neighbourhood station serving new high density mixed use
development in Burnaby and existing medium density in Coquitlam • Burquitlam – station is a focal point for Transit Village and connecting buses to
Simon Fraser University • Albert/Barnet – a local neighbourhood station, also serving Port Moody
Secondary School high school • Moody – a local neighbourhood station, serving Port Moody’s Historic Arts
District, Port Moody Elementary and Middle Schools and an interchange with West Coast Express and local bus services
• Buller – a local neighbourhood station serving existing and new residential developments, including the Polygon development via the CP Rail Pedestrian Overpass
• Ioco – a local neighbourhood stop providing easy access to Newport Village and adjacent new high density residential developments
• (Falcon) – a future station location, subject to the City of Coquitlam’s longer term development plans
• Lansdowne – a local neighbourhood station that will be a focal point for new Transit-oriented Development as part of the expansion of the Coquitlam Regional Town Centre
• Coquitlam Exchange – a major Transit-oriented Development opportunity, combined with a key transfer point between the Evergreen Line, West Coast Express, local bus services and park & ride
• Lincoln – serving the expanding commercial facilities in the Coquitlam Regional Town Centre and providing access to the Coquitlam Centre Mall (200 stores, 11.5 million shoppers/year), Henderson Place and Westwood Mall
• Civic Centre/Guildford – providing access to the Civic Centre, City Hall and Evergreen Cultural Centre
• Douglas College – providing direct access to the expanding Douglas College David Lam Campus
Operations and Maintenance (OMC) An Operations and Maintenance Centre is required to operate, maintain and store up to 40 light rail vehicles. In addition to being adjacent to the proposed alignment, the site must have a rectangular shape and be approximately eight acres in size.
- 26 -
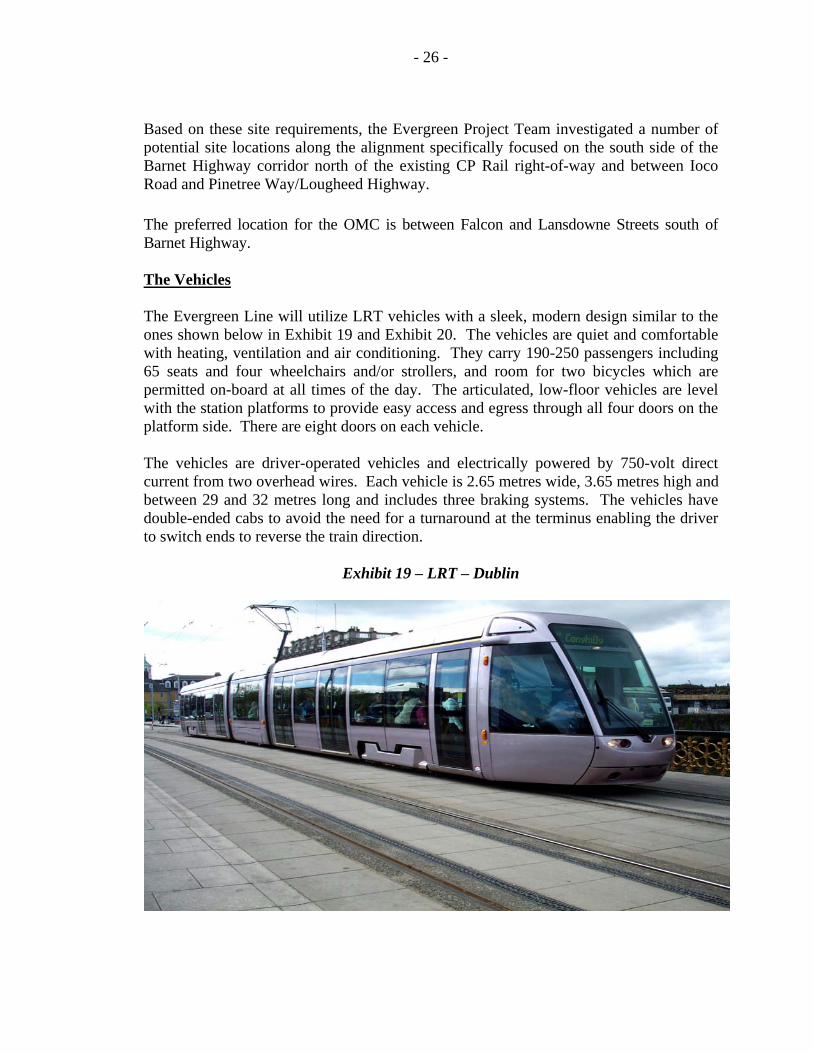
Based on these site requirements, the Evergreen Project Team investigated a number of potential site locations along the alignment specifically focused on the south side of the Barnet Highway corridor north of the existing CP Rail right-of-way and between Ioco Road and Pinetree Way/Lougheed Highway. The preferred location for the OMC is between Falcon and Lansdowne Streets south of Barnet Highway. The Vehicles The Evergreen Line will utilize LRT vehicles with a sleek, modern design similar to the ones shown below in Exhibit 19 and Exhibit 20. The vehicles are quiet and comfortable with heating, ventilation and air conditioning. They carry 190-250 passengers including 65 seats and four wheelchairs and/or strollers, and room for two bicycles which are permitted on-board at all times of the day. The articulated, low-floor vehicles are level with the station platforms to provide easy access and egress through all four doors on the platform side. There are eight doors on each vehicle. The vehicles are driver-operated vehicles and electrically powered by 750-volt direct current from two overhead wires. Each vehicle is 2.65 metres wide, 3.65 metres high and between 29 and 32 metres long and includes three braking systems. The vehicles have double-ended cabs to avoid the need for a turnaround at the terminus enabling the driver to switch ends to reverse the train direction.
Exhibit 19 – LRT – Dublin
- 27 -
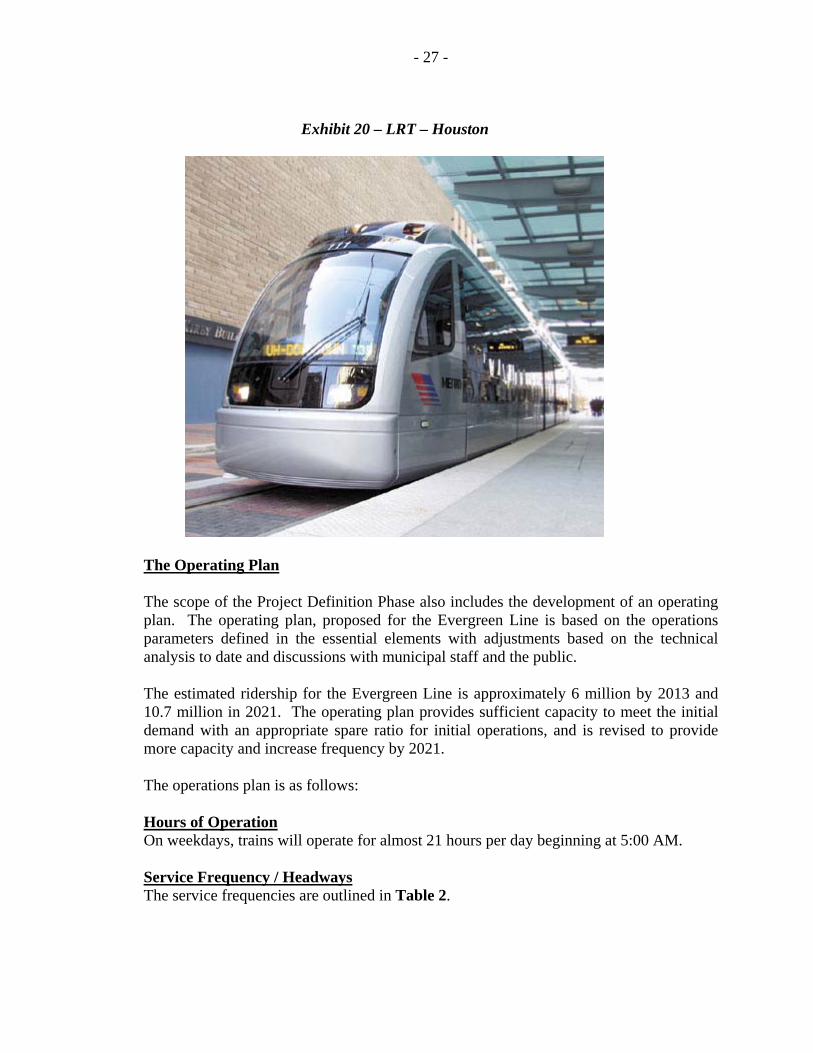
Exhibit 20 – LRT – Houston
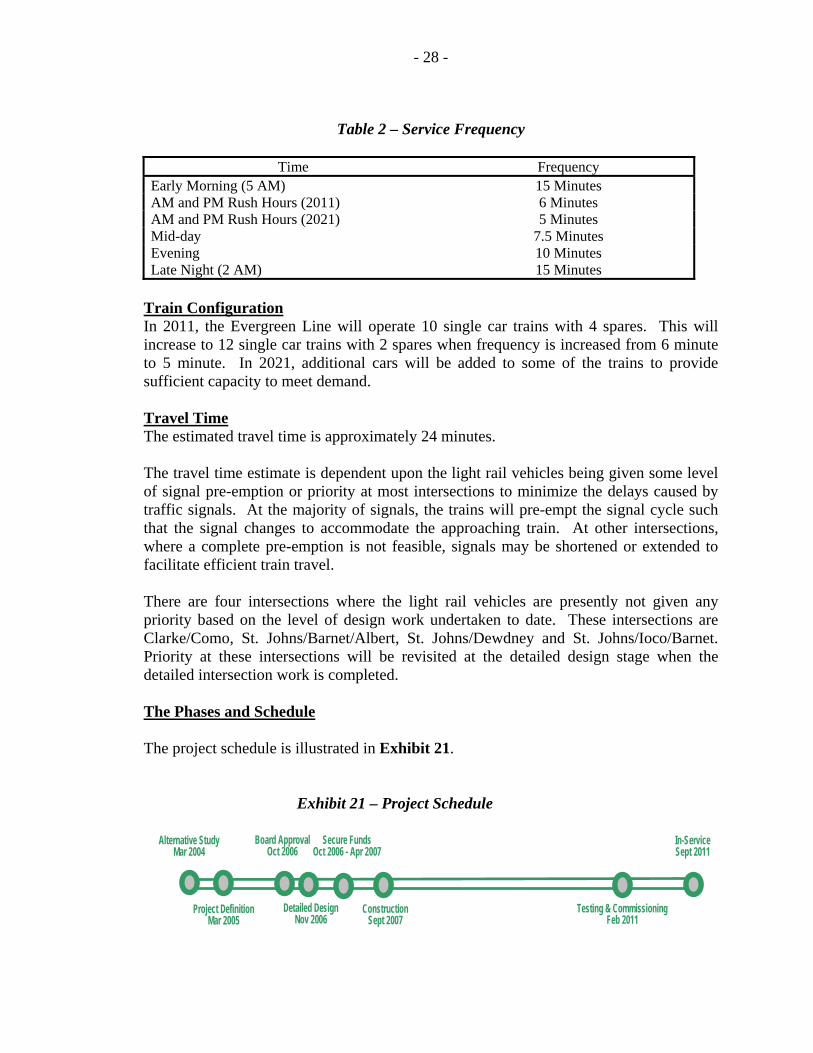
The Operating Plan The scope of the Project Definition Phase also includes the development of an operating plan. The operating plan, proposed for the Evergreen Line is based on the operations parameters defined in the essential elements with adjustments based on the technical analysis to date and discussions with municipal staff and the public. The estimated ridership for the Evergreen Line is approximately 6 million by 2013 and 10.7 million in 2021. The operating plan provides sufficient capacity to meet the initial demand with an appropriate spare ratio for initial operations, and is revised to provide more capacity and increase frequency by 2021. The operations plan is as follows: Hours of Operation On weekdays, trains will operate for almost 21 hours per day beginning at 5:00 AM. Service Frequency / Headways The service frequencies are outlined in Table 2.
- 28 -
Table 2 – Service Frequency
Time Frequency Early Morning (5 AM) 15 Minutes AM and PM Rush Hours (2011) 6 Minutes AM and PM Rush Hours (2021) 5 Minutes Mid-day 7.5 Minutes Evening 10 Minutes Late Night (2 AM) 15 Minutes
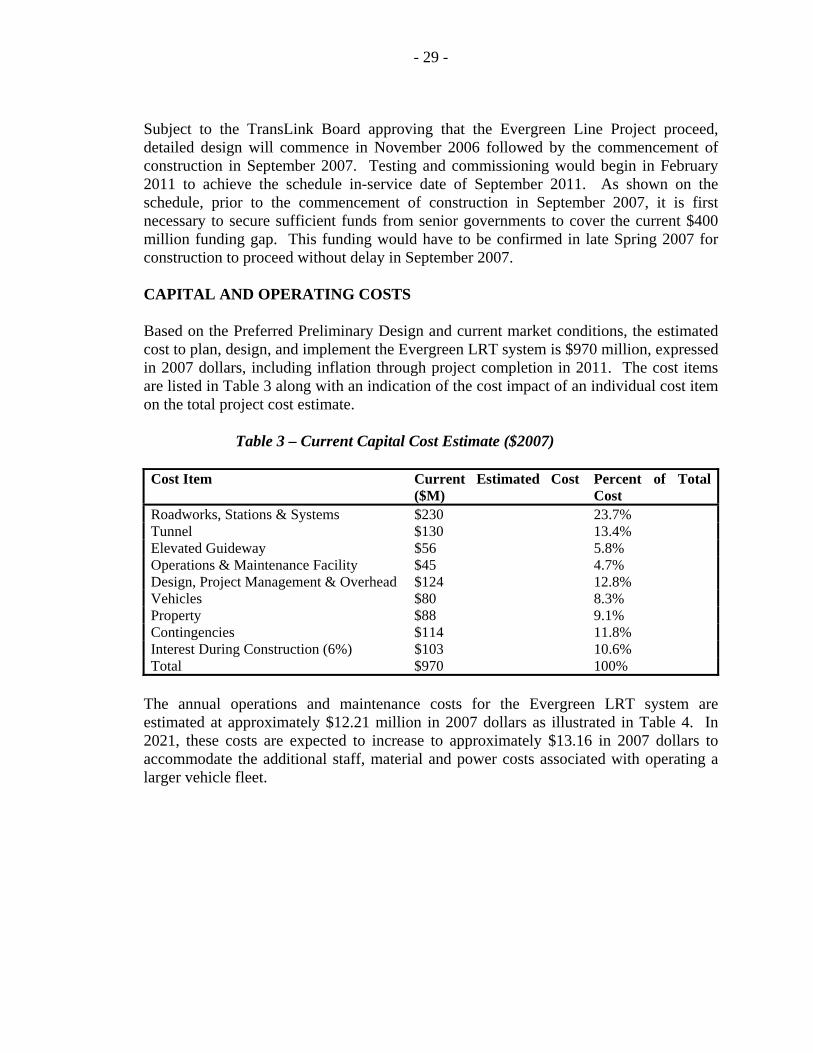
Train Configuration In 2011, the Evergreen Line will operate 10 single car trains with 4 spares. This will increase to 12 single car trains with 2 spares when frequency is increased from 6 minute to 5 minute. In 2021, additional cars will be added to some of the trains to provide sufficient capacity to meet demand. Travel Time The estimated travel time is approximately 24 minutes. The travel time estimate is dependent upon the light rail vehicles being given some level of signal pre-emption or priority at most intersections to minimize the delays caused by traffic signals. At the majority of signals, the trains will pre-empt the signal cycle such that the signal changes to accommodate the approaching train. At other intersections, where a complete pre-emption is not feasible, signals may be shortened or extended to facilitate efficient train travel. There are four intersections where the light rail vehicles are presently not given any priority based on the level of design work undertaken to date. These intersections are Clarke/Como, St. Johns/Barnet/Albert, St. Johns/Dewdney and St. Johns/Ioco/Barnet. Priority at these intersections will be revisited at the detailed design stage when the detailed intersection work is completed. The Phases and Schedule The project schedule is illustrated in Exhibit 21.
Exhibit 21 – Project Schedule
Board ApprovalOct 2006
Detailed DesignNov 2006
ConstructionSept 2007
Testing & CommissioningFeb 2011
In-ServiceSept 2011
Secure FundsOct 2006 - Apr 2007
Project DefinitionMar 2005
Alternative StudyMar 2004
- 29 -
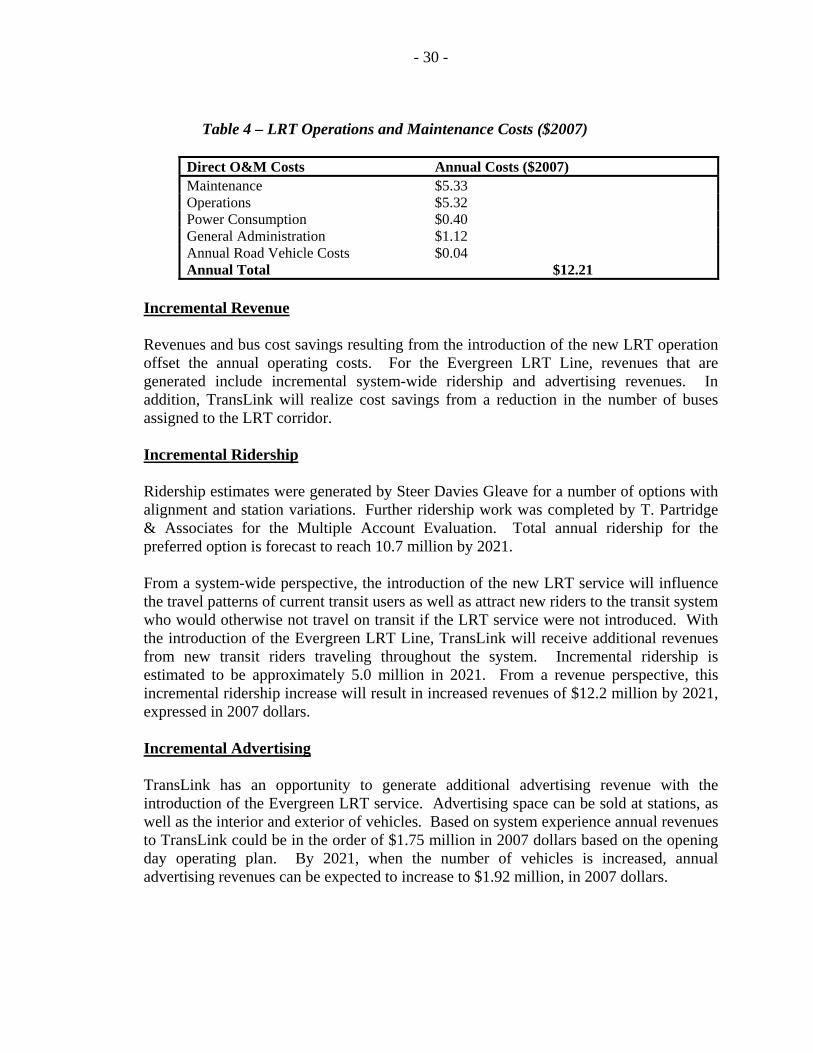
Subject to the TransLink Board approving that the Evergreen Line Project proceed, detailed design will commence in November 2006 followed by the commencement of construction in September 2007. Testing and commissioning would begin in February 2011 to achieve the schedule in-service date of September 2011. As shown on the schedule, prior to the commencement of construction in September 2007, it is first necessary to secure sufficient funds from senior governments to cover the current $400 million funding gap. This funding would have to be confirmed in late Spring 2007 for construction to proceed without delay in September 2007. CAPITAL AND OPERATING COSTS Based on the Preferred Preliminary Design and current market conditions, the estimated cost to plan, design, and implement the Evergreen LRT system is $970 million, expressed in 2007 dollars, including inflation through project completion in 2011. The cost items are listed in Table 3 along with an indication of the cost impact of an individual cost item on the total project cost estimate.
Table 3 – Current Capital Cost Estimate ($2007) Cost Item Current Estimated Cost
($M) Percent of Total Cost
Roadworks, Stations & Systems $230 23.7% Tunnel $130 13.4% Elevated Guideway $56 5.8% Operations & Maintenance Facility $45 4.7% Design, Project Management & Overhead $124 12.8% Vehicles $80 8.3% Property $88 9.1% Contingencies $114 11.8% Interest During Construction (6%) $103 10.6% Total $970 100%
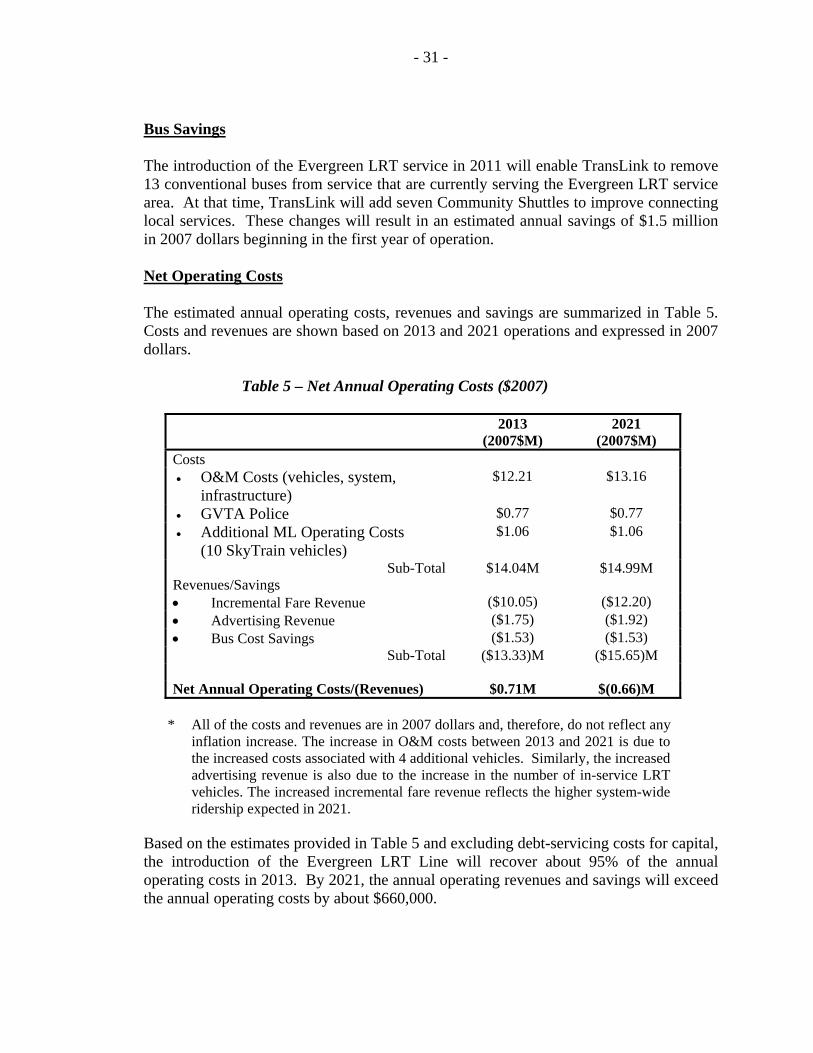
The annual operations and maintenance costs for the Evergreen LRT system are estimated at approximately $12.21 million in 2007 dollars as illustrated in Table 4. In 2021, these costs are expected to increase to approximately $13.16 in 2007 dollars to accommodate the additional staff, material and power costs associated with operating a larger vehicle fleet.
- 30 -
Table 4 – LRT Operations and Maintenance Costs ($2007)
Direct O&M Costs Annual Costs ($2007) Maintenance $5.33 Operations $5.32 Power Consumption $0.40 General Administration $1.12 Annual Road Vehicle Costs $0.04 Annual Total $12.21
Incremental Revenue Revenues and bus cost savings resulting from the introduction of the new LRT operation offset the annual operating costs. For the Evergreen LRT Line, revenues that are generated include incremental system-wide ridership and advertising revenues. In addition, TransLink will realize cost savings from a reduction in the number of buses assigned to the LRT corridor. Incremental Ridership Ridership estimates were generated by Steer Davies Gleave for a number of options with alignment and station variations. Further ridership work was completed by T. Partridge & Associates for the Multiple Account Evaluation. Total annual ridership for the preferred option is forecast to reach 10.7 million by 2021. From a system-wide perspective, the introduction of the new LRT service will influence the travel patterns of current transit users as well as attract new riders to the transit system who would otherwise not travel on transit if the LRT service were not introduced. With the introduction of the Evergreen LRT Line, TransLink will receive additional revenues from new transit riders traveling throughout the system. Incremental ridership is estimated to be approximately 5.0 million in 2021. From a revenue perspective, this incremental ridership increase will result in increased revenues of $12.2 million by 2021, expressed in 2007 dollars. Incremental Advertising TransLink has an opportunity to generate additional advertising revenue with the introduction of the Evergreen LRT service. Advertising space can be sold at stations, as well as the interior and exterior of vehicles. Based on system experience annual revenues to TransLink could be in the order of $1.75 million in 2007 dollars based on the opening day operating plan. By 2021, when the number of vehicles is increased, annual advertising revenues can be expected to increase to $1.92 million, in 2007 dollars.
- 31 -
Bus Savings The introduction of the Evergreen LRT service in 2011 will enable TransLink to remove 13 conventional buses from service that are currently serving the Evergreen LRT service area. At that time, TransLink will add seven Community Shuttles to improve connecting local services. These changes will result in an estimated annual savings of $1.5 million in 2007 dollars beginning in the first year of operation. Net Operating Costs The estimated annual operating costs, revenues and savings are summarized in Table 5. Costs and revenues are shown based on 2013 and 2021 operations and expressed in 2007 dollars.
Table 5 – Net Annual Operating Costs ($2007)
2013 (2007$M)
2021 (2007$M)
Costs • O&M Costs (vehicles, system,
infrastructure) $12.21 $13.16
• GVTA Police $0.77 $0.77 • Additional ML Operating Costs
(10 SkyTrain vehicles) $1.06 $1.06
Sub-Total $14.04M $14.99M Revenues/Savings • Incremental Fare Revenue ($10.05) ($12.20) • Advertising Revenue ($1.75) ($1.92) • Bus Cost Savings ($1.53) ($1.53)
Sub-Total ($13.33)M ($15.65)M Net Annual Operating Costs/(Revenues) $0.71M $(0.66)M
* All of the costs and revenues are in 2007 dollars and, therefore, do not reflect any
inflation increase. The increase in O&M costs between 2013 and 2021 is due to the increased costs associated with 4 additional vehicles. Similarly, the increased advertising revenue is also due to the increase in the number of in-service LRT vehicles. The increased incremental fare revenue reflects the higher system-wide ridership expected in 2021.
Based on the estimates provided in Table 5 and excluding debt-servicing costs for capital, the introduction of the Evergreen LRT Line will recover about 95% of the annual operating costs in 2013. By 2021, the annual operating revenues and savings will exceed the annual operating costs by about $660,000.
- 32 -
FUNDING Within the context of regional growth and more specifically growth in the Northeast Sector, the Business Case for the Evergreen Line illustrates the need for a transportation solution to the challenges associated with this growth and demonstrates that the proposed LRT represents the most balanced, cost-effective solution amongst other transit and non-transit alternatives. As the regional transportation authority, TransLink's current Three-Year Plan and 10 Year Outlook identified a commitment of $400 million to the development of the Evergreen Line. The provincial government has committed another $170 million. Based on a capital cost estimate of $970 million, a $400 million funding gap remains. The Evergreen Line cannot proceed without additional funding. In order to meet the proposed in-service date of September 2011, the current schedule highlights the period between October 2006 and April 2007 to secure additional funds. Additional senior government funds will be required before construction can commence. NEXT STEPS The next steps for the project are as follows: • Proceed with detailed design of Preferred Preliminary Design so that construction
can proceed in the fall 2007 and revenue service can begin in September 2011; • Proceed with the Environmental Assessment application and property acquisition;
and • Request additional funding from the provincial and federal governments. CONCLUSION Within the context of regional growth and more specifically growth in the Northeast Sector, the Business Case for the Evergreen Line illustrates the need for a transportation solution to the challenges associated with this growth and demonstrates that the proposed LRT represents the most balanced, cost-effective solution amongst other transit and non-transit alternatives. The Preferred Preliminary Design provides a design solution that balances the project goal and principles based on technical work, and municipal and public input. Based on the above, staff recommends: • Approval of the Preferred Preliminary Design, as described in this report; • Approval of additional funding of $16 million ($12.5 million from the PMC
Municipal Integration Fund included in the 2001 Capital Program and $3.5 million from the 2006 Capital Program) for the detailed design for Project 0308 – Evergreen Line Project Definition Phase, for a total project budget of $59 million,
- 33 -
consisting of $8 million for preliminary design and public consultation ($6 million GVTA and $2 million Province), $35 million for property acquisition and $16 million for detailed design; and
• Requesting additional funding from the provincial and federal governments to close the funding gap of $400 million, with the intention of having full project funding in place by April 2007.
Evergreen Light Rail Transit Project Project Definition Phase
Business Case
October 12, 2006
Prepared by:
TransLink 1600 –4720 Kingsway
Burnaby, B.C. V5H 4N2
Evergreen Light Rail Transit Project Project Definition Phase – Business Case October 12, 2006
TABLE OF CONTENTS
EXECUTIVE SUMMARY ................................................................................................ 1
THE CHALLENGE.............................................................................................................. 1 Improving The Movement Of People and Goods....................................................... 1 The Northeast Sector................................................................................................... 2
EXTENDING THE RAPID TRANSIT NETWORK .................................................................... 3 An Essential Link In An Integrated Transportation Network..................................... 3 The Evergreen Line Is Cost-Effective ........................................................................ 4 Supports Future Growth.............................................................................................. 5 Supports Wider Regional Environmental Objectives ................................................. 5 The Right Solution...................................................................................................... 6
WORKING TOGETHER TO KEEP THE PROVINCE MOVING ................................................... 7
1 PROBLEM DEFINITION...................................................................................... 8
1.1 THE CHALLENGE.................................................................................................. 8 1.2 THE OWNER......................................................................................................... 9 1.3 THE MUNICIPALITIES ......................................................................................... 10
1.3.1 City of Coquitlam ......................................................................................... 10 1.3.2 City of Port Moody ....................................................................................... 10
1.4 THE BACKGROUND ............................................................................................ 11 1.5 THE NEED .......................................................................................................... 13 1.6 THE TEAM.......................................................................................................... 13
2 BACKGROUND .................................................................................................. 15
2.1 GREATER VANCOUVER REGIONAL DISTRICT (GVRD) ...................................... 15 2.2 REGIONAL GROWTH .......................................................................................... 15 2.3 TRAFFIC CONGESTION ....................................................................................... 21
2.3.1 Traffic Growth and Pattern ........................................................................... 21 2.3.2 Evergreen Line Corridor ............................................................................... 22 2.3.3 Northeast Corridor Network ......................................................................... 23
2.4 OFFICIAL COMMUNITY PLANS (OCP)................................................................ 23 2.4.1 City of Coquitlam ......................................................................................... 23 2.4.2 City of Port Moody ....................................................................................... 24 2.4.3 CITY OF BURNABY................................................................................... 25
2.5 ACTIVITY CENTRES............................................................................................ 25 2.5.1 Douglas College............................................................................................ 25 2.5.2 Simon Fraser University (SFU) .................................................................... 26 2.5.3 Coquitlam College ........................................................................................ 26 2.5.4 Schools.......................................................................................................... 26 2.5.5 Community, Recreation and Cultural Centres .............................................. 27 2.5.6 Shopping Malls ............................................................................................. 28
2.6 COMMUNITY SUPPORT....................................................................................... 28
3 POTENTIAL SOCIETAL BENEFITS................................................................. 29
i
Evergreen Light Rail Transit Project Project Definition Phase – Business Case October 12, 2006
3.1 ECONOMIC BENEFITS ......................................................................................... 29 3.1.1 Employment.................................................................................................. 29 3.1.2 Taxes ............................................................................................................. 29
3.2 ROAD USER BENEFITS ........................................................................................ 30 3.3 TRANSIT USER BENEFITS ................................................................................... 31 3.4 SUPPORTS FUTURE GROWTH.................................................................... 32 3.5 ENVIRONMENTAL............................................................................................... 34 3.6 SUPPORTS SENIOR GOVERNMENT INITIATIVES.................................. 35
4 OPTION GENERATION ..................................................................................... 36
4.1 INTRODUCTION .................................................................................................. 36 4.2 ALTERNATIVES STUDY ...................................................................................... 36 4.3 STATUS QUO...................................................................................................... 38 4.4 PROJECT DEFINITION PHASE OPTIONS ............................................................... 39 4.5 ALTERNATIVES TO TRANSIT .............................................................................. 40
5 PROJECT DESCRIPTION................................................................................... 40
5.1 DESIGN PRINCIPLES ........................................................................................... 40 5.2 PUBLIC CONSULTATION ..................................................................................... 41 5.3 THE ALIGNMENT................................................................................................ 43
5.3.1 Overview....................................................................................................... 43 5.4 THE VEHICLES ................................................................................................... 47 5.5 THE OPERATING PLAN ....................................................................................... 49 5.6 THE PHASES AND SCHEDULE ............................................................................. 50 5.7 THE COSTS......................................................................................................... 50 5.8 INCREMENTAL REVENUE ................................................................................... 51
5.8.1 Incremental Ridership................................................................................... 52 5.8.2 Incremental Advertising................................................................................ 52 5.8.3 Bus savings ................................................................................................... 52 5.8.4 Net Operating Costs...................................................................................... 52
5.9 FUNDING............................................................................................................ 53
6 MULTIPLE ACCOUNT EVALUATION ........................................................... 52
6.1 INTRODUCTION .................................................................................................. 52 6.2 EVALUATION METHODOLOGY ........................................................................... 52
6.2.1 Transportation Account ................................................................................ 53 6.2.2 Urban Development Account ....................................................................... 53 6.2.3 Environmental Account ................................................................................ 53 6.2.4 Social Account .............................................................................................. 53 6.2.5 Ease of Implementation Account.................................................................. 54
6.3 MAE SUMMARY ............................................................................................... 54 6.4 KEY FINDINGS............................................................................................... 57
7 BENCHMARKING.............................................................................................. 58
7.1 PURPOSE ............................................................................................................ 58 7.2 INTERNAL BENCHMARKING ............................................................................... 58
ii
Evergreen Light Rail Transit Project Project Definition Phase – Business Case October 12, 2006
7.3 EXTERNAL BENCHMARKING .............................................................................. 61
8 RISK / SENSITIVITY ANALYSIS ..................................................................... 65
8.1 SENSITIVITY ANALYSIS...................................................................................... 65 8.2 RISK................................................................................................................... 65
9 PROJECT IMPLEMENTATION......................................................................... 67
9.1 PROJECT SCOPE.................................................................................................. 67 9.2 PROJECT SCHEDULE........................................................................................... 67 9.3 PROJECT BUDGET .............................................................................................. 69
9.3.1 Capital Budget .............................................................................................. 69 9.3.2 Operations Budget ........................................................................................ 69
9.4 PROJECT CASH FLOW......................................................................................... 70
10 ADVANCEMENT OF FEDERAL AND PROVINCIAL TRANSPORTATION STRATEGIES AND PLANS ............................................................................... 71
11 CONCLUSIONS / RECOMMENDATIONS....................................................... 72
APPENDICES .................................................................................................................. 76
LIST OF EXHIBITS
EXHIBIT 1-1 – REGIONAL POPULATION GROWTH ................................................................................... 9 EXHIBIT 1-2 – CURRENT AND PLANNED RAPID TRANSIT...................................................................... 12 EXHIBIT 2-1- GVRD POPULATION GROWTH ........................................................................................ 16 EXHIBIT 2-2 – REGIONAL POPULATION GROWTH ................................................................................. 17 EXHIBIT 2-3 – NORTHEAST SECTOR POPULATION GROWTH FORECAST ............................................... 18 EXHIBIT 2-4 – NORTHEAST SECTOR EMPLOYMENT GROWTH FORECAST............................................. 18 EXHIBIT 2-5 – CONCENTRATING GROWTH AROUND SKYTRAIN........................................................... 19 EXHIBIT 2-6 – POPULATION DENSITY AROUND SKYTRAIN .................................................................. 20 EXHIBIT 2-7 – POPULATION DENSITY AROUND TOWN CENTRES.......................................................... 20 EXHIBIT 4-1 –ALTERNATIVE CORRIDORS AND TECHNOLOGIES............................................................ 37 EXHIBIT 5-1 – DESIGN CONSULTATION PROCESS ................................................................................. 41 EXHIBIT 5-2 – DESIGN PROCESS ORGANIZATION.................................................................................. 42 EXHIBIT 5-3 – LRT - DUBLIN ............................................................................................................... 48 EXHIBIT 5-4 – LRT - HOUSTON ............................................................................................................ 48 EXHIBIT 5-5 – PROJECT SCHEDULE....................................................................................................... 50 EXHIBIT 9-1 – PROJECT SCHEDULE....................................................................................................... 68 EXHIBIT 9-2 – DRAFT PROJECT WORK SCHEDULE................................................................................ 68
iii
Evergreen Light Rail Transit Project Project Definition Phase – Business Case October 12, 2006
LIST OF TABLES
TABLE 2-1– PERCENT CHANGES IN TRAFFIC COUNT TOTALS ACROSS REGIONAL SCREENLINES, ....... 21 TABLE 2-2 – EAST-WEST LINKS ........................................................................................................... 22 TABLE 4-1 – 97B-LINE.......................................................................................................................... 39 TABLE 5-1 – SERVICE FREQUENCY ....................................................................................................... 49 TABLE 5-2 – CURRENT CAPITAL COST ESTIMATE ($2007) ................................................................... 51 TABLE 5-3 – LRT OPERATIONS AND MAINTENANCE COSTS ................................................................ 51 TABLE 5-4 – NET ANNUAL OPERATING COSTS ($2007) ....................................................................... 53 TABLE 5-5 – CURRENT UNFUNDED COSTS............................................................................................ 53 TABLE 6-1 – UPDATED MAE – EVALUATION SUMMARY ..................................................................... 55 TABLE 6-2 – BENEFIT COST RATIO AND NPV COMPARISON................................................................ 56 TABLE 7-1 – INTERNAL BENCHMARKING COMPARISON ....................................................................... 60 TABLE 7-2 – EXTERNAL BENCHMARKING SUMMARY........................................................................... 62 TABLE 9-1 – LRT OPERATIONS AND MAINTENANCE COSTS ($2007)................................................... 69 TABLE 9-2 – NET ANNUAL OPERATING COSTS ($2007) ....................................................................... 70 TABLE 9-3 – ANNUAL PROJECT CASH FLOW ($’000)............................................................................ 70
iv
Evergreen Light Rail Transit Project Project Definition Phase – Business Case October 12, 2006
EXECUTIVE SUMMARY THE CHALLENGE Greater Vancouver is in an enviable position in North America and the world. It has a thriving economy, driven in part by growing trade and its role as a Gateway to the whole Pacific Rim, a clean environment and a quality of life that is second to none. However, maintaining these advantages will require transportation investment, as neither the strong economy nor the quality of life can be taken for granted in an urban region with little room for land expansion and congested key corridors. In some cases transportation investments will be directed at roads such as the Province’s Gateway Program or TransLink’s Golden Ears Bridge. Both of these projects will greatly assist the region in improving the movement of people and goods. However, transit investments are also needed both to spur appropriate high density development activity and to free up road space for goods movement on the whole regional road network. With Greater Vancouver’s population growth forecast to continue over the next three decades, adding nearly one million more people to cities and roads that are already at capacity, we face a growing need to invest in transportation infrastructure. These investments should support economic development, be cost effective and encourage population and employment growth in areas that do not place pressure on the Lower Mainland’s agricultural lands. In addition they should lead to improved air quality, and be able to support the efficient movement of goods and people now and into the future. Improving The Movement Of People and Goods Significant road and transit projects involving all levels of government have been initiated in the past few years to begin to respond to this challenge. Federal and provincial funding has facilitated improvements to the Sea to Sky Highway, the Border Infrastructure Projects, and the planned $3 billion dollar investment in road and bridge improvements included in the Gateway Program. These are just a few of the projects designed to benefit the provincial economy by improving the movement of goods, services and people throughout the region. Regional and municipal governments have been active as well. TransLink is currently constructing the Golden Ears Bridge to provide a much-needed link across the Fraser River between Langley and Surrey on the south side, and Maple Ridge and Pitt Meadows on the north side. TransLink is also investing in road infrastructure throughout the region by committing $236M toward eight significant projects on the regional Major Road Network.
Executive Summary Page 1
Evergreen Light Rail Transit Project Project Definition Phase – Business Case October 12, 2006
The federal, provincial and municipal governments and TransLink have also been supportive of rapid transit initiatives in Greater Vancouver, but the true value of these investments cannot be fully realized until the rapid transit network is completed, providing quick and reliable travel to most parts of the region. Both the Canada Line, expected to open in 2009, and the Millennium Line, which opened in 2002 demonstrate the provincial and federal governments’ commitment to rapid transit improvements to date. In the early 1990s there were many significant planning initiatives. As a result of the regional Creating Our Future dialogue, two major plans emerged. The first was the joint Provincial/Regional 1993 Transport 2021 Long-Range Transportation Plan that called for a network of rapid transit linking regional town centres in Richmond, Vancouver, Surrey, Coquitlam, New Westminster and Burnaby. The output from Transport 2021 became one of the cornerstones of the Greater Vancouver Regional District’s (GVRD) 1996 Livable Region Strategic Plan (LRSP), which laid the foundation for managing growth in the region. In 1996 this plan was also approved by the Province as a regional growth strategy. In support of the LRSP, TransLink is committing funds to transit expansion while the municipalities align their Official Community Plans (OCP) to meet the LRSP growth management objectives. A central objective is to increase transportation choice by completing the rapid transit network to serve existing demand and act as a catalyst for increased development in areas designated for growth. As individuals choose to use the new rapid transit infrastructure, there is a resulting reduction in traffic on the region’s roads, creating road space for the movement of goods and services which rely on the entire network of roads. With 90 percent of most peak time regional highway trips being commuters, travel alternatives are essential. Within this context, TransLink is working to complete the rapid transit network that was foreseen in the joint Provincial/Regional Transport 2021 plan as being in place by 2006. The Evergreen Light Rail Transit (LRT) Line in the region’s Northeast Sector will extend the reach of the rapid transit network and directly serve the cities of Burnaby, Port Moody and Coquitlam and significantly improve traffic flow for both goods and general traffic throughout the region. The Northeast Sector The Northeast Sector is among the region’s fastest growing areas. Population growth has outpaced the regional average, growing 125% since 1976 versus 85% for the GVRD. This trend is expected to continue. The GVRD forecasts the Northeast Sector population will grow to approximately 288,000 people by 2021, which represents a 46% increase from 2001. By comparison, the GVRD expects the regional population to increase by 25% over the same time period.
Executive Summary Page 2
Evergreen Light Rail Transit Project Project Definition Phase – Business Case October 12, 2006
Traffic growth in Greater Vancouver’s Northeast Sector is among the highest in the region. For example, recent studies show traffic on North Road in Coquitlam has increased by 10.3% since 1996 versus a regional average increase of 6.7%. With this traffic growth, travel times have been increasing and are becoming less reliable and less predictable, directly impacting both the cost of moving goods and the efficiency with which the shippers and receivers of goods can function. EXTENDING THE RAPID TRANSIT NETWORK The Evergreen LRT Line provides a cost-effective solution to stimulate concentrated regional development and address the immediate and future capacity constraints that limit economic growth in the region. An 11.2 kilometre, 12-station alignment that is largely at-grade and runs north from the Lougheed Town Centre SkyTrain station in Burnaby to an eastern terminus at Douglas College in Coquitlam, the Evergreen Line features stations located at key points along the alignment. These strategically located stations provide convenient access to a number of activity centres and potential development sites within the corridor. The line also provides convenient connections to other transit services including SkyTrain, West Coast Express and the local bus network. LRT, although new to the Lower Mainland, is a well-proven transit mode that has been introduced in many similar-sized cities around the world, not just for its transportation benefits, but also as a catalyst for focusing new and higher density mixed-use development clustered around new transit stations. An Essential Link In An Integrated Transportation Network The Evergreen Line will extend the coverage and help complete Greater Vancouver’s rapid transit network by including the Northeast Sector of the region. As part of a network of transit services, the Evergreen Line connects directly with SkyTrain’s Millennium Line, West Coast Express commuter rail and buses. It also enables integrated travel throughout the rapid transit network including the Expo Line, Millennium Line and the future Canada Line. The Evergreen Line provides a viable transportation choice to residents, both those already living in the region and others that will be attracted by development in the corridor. For people in the corridor the line provides local and regional mobility without placing a burden on already-busy roads, freeing capacity for longer distance trips and goods movement. The total annual road and transit user benefits resulting from the Evergreen Line are $51.60 million (2007) in 2013, growing to $57.73 million in 2021 (2007).
Executive Summary Page 3
Evergreen Light Rail Transit Project Project Definition Phase – Business Case October 12, 2006
The Evergreen LRT operates in a segregated right-of-way; it will not be significantly impacted by other traffic using the roadway and therefore offers competitive travel times and reliability in the face of traffic congestion. The introduction of the LRT will reduce the number of car trips by 1.9 million initially and this is estimated to increase to almost 3.6 million trips by 2021. Traffic congestion will continue to worsen through 2021; however, the LRT will improve the capacity of the corridor from a people moving perspective. By improving the local transit service and enhancing the connectivity to the broader transit network, the Evergreen LRT will attract more than 5.0 million new transit riders annually system-wide and increase transit fare revenues by $12.20 million in 2021. The Evergreen LRT Line will enhance the people moving capacity of the Northeast Sector corridor. The system design capacity of the LRT in 2021 is equivalent to 8 additional traffic lanes, preserving existing road lanes and adjacent land for development. Given topographical constraints and development along the corridor, expanding the roadway beyond two additional lanes is not feasible and would not supply the additional capacity required to address congestion. The Evergreen Line is one of the investments that has been identified by the province, the region and gateway industries to alleviate congestion, provide travel time savings and increase transportation choice to improve the movement of people and goods in the region. The Evergreen Line Is Cost-Effective The Project Definition Phase of the Evergreen Line included further technical work and consultation to better define the project. The estimated capital costs have been updated to reflect the current design and market conditions. The estimated capital cost for the proposed Evergreen LRT Line is $970 million (2007) or $86.2 million per kilometre. The Evergreen Line compares favourably to other LRT systems in North America, as identified in the benchmarking survey. The Evergreen Line capital costs, the ridership numbers and the station spacing are consistent with other North American LRT systems. The Evergreen Line has relatively higher costs and lower passenger numbers than many European systems (not unexpected given higher European population densities and more compact city design) but still falls within the range of European systems. It is expected that the Evergreen Line will recover about 95% of its annual operating costs in 2013 and, by 2021, revenues and savings are expected to exceed annual operating costs. An Operations and Maintenance Centre is required for the Evergreen LRT Line and will be the first light rail vehicle facility in the Lower Mainland. This one-time investment will support future extensions to the LRT system.
Executive Summary Page 4
Evergreen Light Rail Transit Project Project Definition Phase – Business Case October 12, 2006
Creates Employment and Generates Tax Revenues The construction of the Evergreen Line will generate some 6,860 person-years of direct, indirect and induced employment in British Columbia providing estimated federal and provincial tax revenues of $27 and $37 million respectively. The operation and maintenance of the Evergreen Line will generate employment from on-board operations and from the Operations and Maintenance Centre (OMC) functions. Employment created from the on-going operations and maintenance of the Evergreen Line is equivalent to 121 full-time positions including 93 direct and 28 indirect jobs. Supports Future Growth The Evergreen Line supports growth in a sustainable manner providing the ability to cost-effectively add capacity to move more people through the corridor as demand increases. The new LRT line provides the transportation infrastructure to enable the municipalities to achieve growth management objectives that are otherwise unattainable. Local municipalities have structured their Official Community Plans based on the availability of an intermediate capacity transit line. The line supports regional and municipal growth management strategies that help limit the impacts of growth on the environment and sustain the livability of the region. Supports Wider Regional Environmental Objectives The Evergreen Line reduces vehicle travel in the lower Fraser Valley by an estimated 31 million km per year by 2021. This results in Common Air Contaminants (CACs), such as carbon monoxide, nitrogen dioxide, ozone and particulate matter, being reduced by 355.5 tonnes per year, of which 43.5 tonnes are smog-forming pollutants. The 355.5 tonnes per year total represents a 0.5% reduction of CACs in the Northeast Sector. Based on the estimated reduction in vehicle km driven following the introduction of the Evergreen Line, and allowing for the need to generate electricity to power the LRT system, the estimated net reduction of Greenhouse Gas (GHG) emissions in 2021 is 10,592 tonnes. This net reduction in GHG represents a 0.03% reduction in the estimated total GHG production in the Lower Fraer valley in 2021. The amount of tree canopy along the corridor will be more than doubled. The line runs through an existing transportation corridor, therefore, the effect on waterways and green zones is minimal.
Executive Summary Page 5
Evergreen Light Rail Transit Project Project Definition Phase – Business Case October 12, 2006
Supported In Its Community The Evergreen Line LRT has been developed through extensive community and stakeholder consultation at all phases. It has been identified from a set of alternative alignments and technologies as the most supportable and beneficial for the existing communities to achieve their share of regional development. A 40% expansion of the region’s rail rapid transit network with the Canada Line between Vancouver, Richmond and the airport, and the Evergreen Light rail line from Coquitlam Centre and Port Moody to Lougheed Town Centre SkyTrain station enjoys 94% support from people across the region as a project of importance to Greater Vancouver, according to an April 17, 2006 Ipsos Reid public opinion survey. The Right Solution A Multiple Account Evaluation (MAE) report was prepared to provide an update of the MAE presented in the March 2004 Alternatives Study, which compared alternative routes and technologies for the proposed rapid transit line connecting Lougheed Town Centre and Coquitlam Town Centre. The updated MAE compares the Evergreen Line’s LRT system and alignment to three alternative technologies, conventional bus, bus rapid transit (BRT) and SkyTrain, along the same alignment. The benefit-cost ratio of the project is 1.15 and the Net Present Value is $143.46 million, based on the incremental present value of capital and operating costs and the incremental present value of revenues, savings and transportation user benefits through to 2041. Bus Rapid Transit (BRT), as a result of having the lowest capital investment, has the most favourable overall Project NPV and benefit-cost ratio. However, by 2021, the system is operating at full capacity with no practical means for expansion to meet the longer term ridership needs of the region. BRT is an interim solution and investment in rail will be required prior to 2021 to realize the transportation and economic objectives for the region. Both LRT and SkyTrain, although more capital cost intensive compared to BRT, will provide a reliable rapid transit service to the Northeast Sector for the long term. Rail systems strongly support long-term economic development, primarily because they are more permanent and will therefore attract more commercial and residential development. LRT has a lower capital cost than SkyTrain and superior customer features while SkyTrain generates greater ridership and travel benefits. However, the additional capital cost of $300 million for SkyTrain is a significant factor favouring LRT. These capital cost savings can be used for other projects that are also required to address the region’s transportation needs.
Executive Summary Page 6
Evergreen Light Rail Transit Project Project Definition Phase – Business Case October 12, 2006
WORKING TOGETHER TO KEEP THE PROVINCE MOVING Within the context of regional growth and more specifically growth in the Northeast Sector, this document illustrates the need for a transportation solution to the challenges associated with this growth and demonstrates that the proposed LRT represents the most balanced, cost-effective solution amongst other transit and non-transit alternatives. TransLink's current Three-Year Plan and 10 Year Outlook identifiy a commitment of $400 million to the development of the Evergreen Line. The provincial government has committed another $170 million. Based on a capital cost estimate of $970 million, a $400 million funding gap remains. The Evergreen Line cannot proceed without additional funding. In order to meet the proposed in-service date of September 2011, the current schedule highlights the period between October 2006 and April 2007 to secure additional funds. Additional senior government funds will be required before construction can commence.
Executive Summary Page 7
Evergreen Light Rail Transit Project Project Definition Phase – Business Case October 12, 2006
1 PROBLEM DEFINITION 1.1 THE CHALLENGE The population of the Greater Vancouver Regional District (GVRD) has increased by eighty-five percent over the past three decades to a current population of more than 2.1 million. This trend is expected to continue with the regional population estimated to surpass 2.6 million by 2021. The current and anticipated growth is adding pressure to the regional transportation network as traffic volumes build and congestion increases. In addition to these transportation challenges, municipalities within the GVRD also face the problem of accommodating an ever growing population. To address these challenges, new transportation infrastructure must be built that accommodates and manages growth in a cost-effective manner and addresses regional congestion pressures while leveraging the economic development opportunities afforded by this growth. While expanding the region’s road and bridge network is a critical component of the transportation solution, the expansion of the regional transit system is also an essential element, offering the ability to dramatically increase the capacity of an existing transportation corridor while providing people with an alternative to the vehicle. Transit expansion is also a critical component in the GVRD Livable Region Strategic Plan (LRSP)1. Anticipating the need to manage this growth, the LRSP established growth targets for municipalities to help distribute the growth across the GVRD while facilitating the creation of a compact metropolitan region and protecting green zones. However, without the aid of transit to promote higher density developments, many municipalities will be unable to continue to meet their growth targets over the long term.
1 Livable Region Strategic Plan, Greater Vancouver Regional District, 1996
Section 1 – Problem Definition Page 8
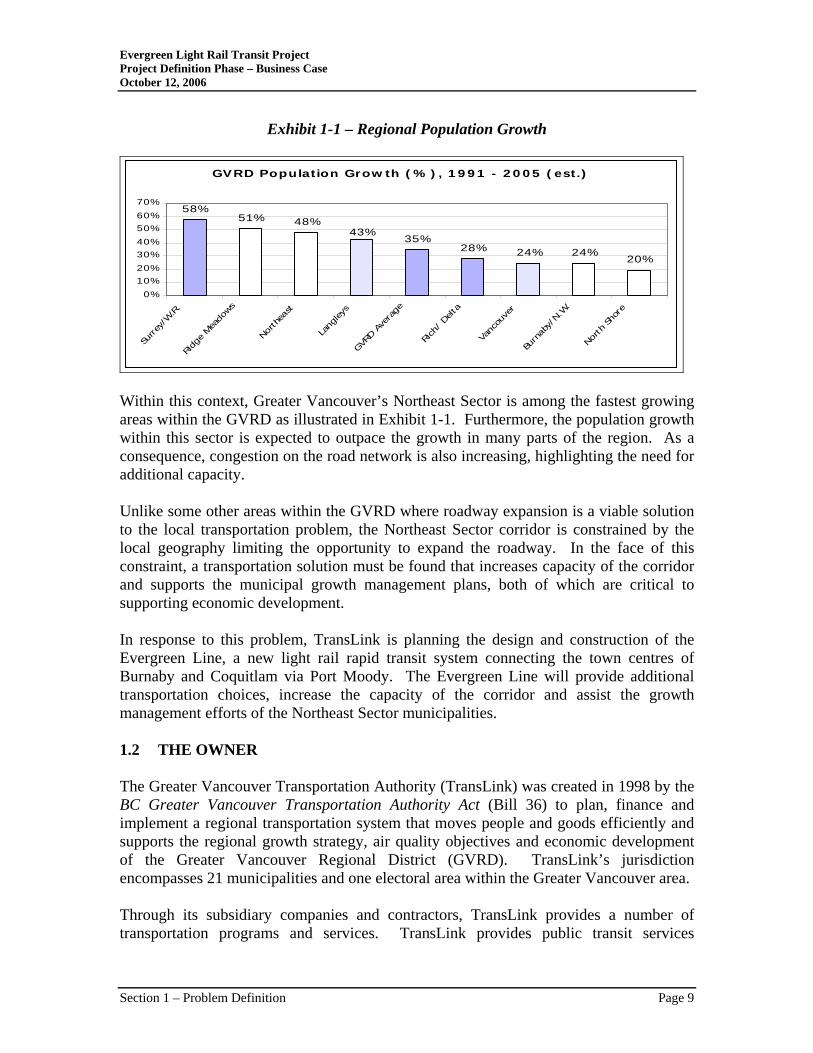
Evergreen Light Rail Transit Project Project Definition Phase – Business Case October 12, 2006
Exhibit 1-1 – Regional Population Growth
GVRD Population Grow th ( % ) , 1 9 9 1 - 2 0 0 5 ( est.)
58%51% 48%
35%28% 24% 24%
20%
43%
0%10%20%30%40%50%60%70%
Surre
y/W.R.
Ridg
e Mea
dows
North
east
Lang
leys
GVRD A
vera
ge
Rich
/ Delt
a
Vanc
ouve
r
Burn
aby/
N.W.
North
Sho
re
Within this context, Greater Vancouver’s Northeast Sector is among the fastest growing areas within the GVRD as illustrated in Exhibit 1-1. Furthermore, the population growth within this sector is expected to outpace the growth in many parts of the region. As a consequence, congestion on the road network is also increasing, highlighting the need for additional capacity. Unlike some other areas within the GVRD where roadway expansion is a viable solution to the local transportation problem, the Northeast Sector corridor is constrained by the local geography limiting the opportunity to expand the roadway. In the face of this constraint, a transportation solution must be found that increases capacity of the corridor and supports the municipal growth management plans, both of which are critical to supporting economic development. In response to this problem, TransLink is planning the design and construction of the Evergreen Line, a new light rail rapid transit system connecting the town centres of Burnaby and Coquitlam via Port Moody. The Evergreen Line will provide additional transportation choices, increase the capacity of the corridor and assist the growth management efforts of the Northeast Sector municipalities. 1.2 THE OWNER The Greater Vancouver Transportation Authority (TransLink) was created in 1998 by the BC Greater Vancouver Transportation Authority Act (Bill 36) to plan, finance and implement a regional transportation system that moves people and goods efficiently and supports the regional growth strategy, air quality objectives and economic development of the Greater Vancouver Regional District (GVRD). TransLink’s jurisdiction encompasses 21 municipalities and one electoral area within the Greater Vancouver area. Through its subsidiary companies and contractors, TransLink provides a number of transportation programs and services. TransLink provides public transit services
Section 1 – Problem Definition Page 9
Evergreen Light Rail Transit Project Project Definition Phase – Business Case October 12, 2006
including Bus, Seabus, SkyTrain, West Coast Express and HandyDART. TransLink also owns and operates three bridges in the region, the Pattullo, Knight and Westham Island Bridges, and supports the Albion ferry service and the AirCare program as well as Transportation Demand Management initiatives that promote transportation alternatives such as cycling and carpooling. In partnership with municipalities and other agencies, TransLink also helps fund the maintenance, rehabilitation and improvements of the Major Road Network within the GVRD. A Board of Directors comprising 12 municipal and 3 provincial government representatives governs TransLink. Municipal Mayors and Councillors are appointed by the GVRD for 12 of the 15 Board positions. The 3 provincial representatives are appointed by the provincial government. 1.3 THE MUNICIPALITIES 1.3.1 CITY OF COQUITLAM At present, Coquitlam has a population of approximately 115,000 people. Historically, Coquitlam has been primarily a residential area with amenities and businesses catering to the regional population. The population profile for Coquitlam is comparable to the average for the GVRD in terms of age and educational demographics. Seventy-five percent of Coquitlam residents work outside Coquitlam. Coquitlam Centre Mall is one of the largest regional shopping centres in British Columbia and some 19.3% of Coquitlam’s labour force is employed in wholesale and retail trade as compared to 16.4% for the GVRD as a whole. Coquitlam Town Centre has become one of the most rapidly developing regional town centres in the GVRD partly as a result of the new City Hall civic complex, Douglas College’s David Lam campus, the Evergreen Cultural Centre, the Pinetree Community Centre and nearby recreational facilities. 1.3.2 CITY OF PORT MOODY Port Moody is a community of approximately 28,500 people located 20 kilometres east of Vancouver at the head of Burrard Inlet. As the original west coast terminus of the Canadian Pacific Railroad, Port Moody’s traditional industrial sectors have included a deep-sea bulk loading terminal, two petrochemical distribution operations, a large wood products manufacturer, and a thermal electric generating station. Port Moody has become a vibrant cultural centre with numerous festivals and events and the development or refurbishing of cultural facilities, including the old Port Moody City Hall built in 1914, which has now been transformed into the Port Moody Arts Centre. Compared to the GVRD average, Port Moody residents are younger, earn higher incomes and are more likely to have received some post-secondary education. Eighty-six percent of Port Moody residents have their regular place of employment outside Port Moody.
Section 1 – Problem Definition Page 10
Evergreen Light Rail Transit Project Project Definition Phase – Business Case October 12, 2006
CITY OF BURNABY The City of Burnaby has a population of over 200,000 people making it the third largest municipality in the GVRD behind Vancouver and Surrey with populations approximately at 550,000 and 350,000 people respectively. As a large urban centre, Burnaby’s economic base is well diversified with major employers including Simon Fraser University, the BC Institute of Technology, the City of Burnaby, the GVRD, and various large private sector companies such as TELUS, Electronic Arts, Ballard Power Systems, and Rogers AT&T Wireless. 1.4 THE BACKGROUND The concept of an intermediate capacity rapid transit line connecting town centres at Lougheed and Coquitlam is supported by a long history of transportation planning in the Greater Vancouver area. When the provincial government created TransLink in 1998, a key reason for doing so was to develop a transportation system that was integrated with the growth strategy of the GVRD. That strategy, the Livable Region Strategic Plan (LRSP), aims to manage sustainable growth while preserving the region’s environment and quality of life. The LRSP, adopted by the GVRD Board in 1996, set out four fundamental strategies including: • Protect the Green Zone • Build Complete Communities • Achieve a Compact Metropolitan Region • Increase Transportation Choice The LRSP and its companion documents, the Transport 2021 Long and Medium-Range Transportation Plan, identify an Intermediate Capacity Transit System (ICTS) to support regional town centre development, increase transportation choice, encourage transit use, and shape the pattern of growth. The Transport 2021 Medium-Range Plan identified three corridors that warranted ICTS service by 2006 although the Plan acknowledges that the availability of funding, amongst other factors, will influence the extent to which this goal can be achieved. The ICTS corridors included: • Central Broadway to Lougheed Town Centre • New Westminster to Coquitlam Regional Town Centre • Richmond to Downtown Vancouver The Central Broadway to Lougheed Town Centre and New Westminster to Coquitlam Regional Town Centre lines became known as the ‘T’-Line, due to its physical appearance in the shape of a modified ‘T’. In 1995, the Province and the GVRD agreed that the ‘T’-Line was to be a Light Rail Transit (LRT) rather than SkyTrain technology. However, in 1998 the provincial government decided to construct the Millennium Line,
Section 1 – Problem Definition Page 11
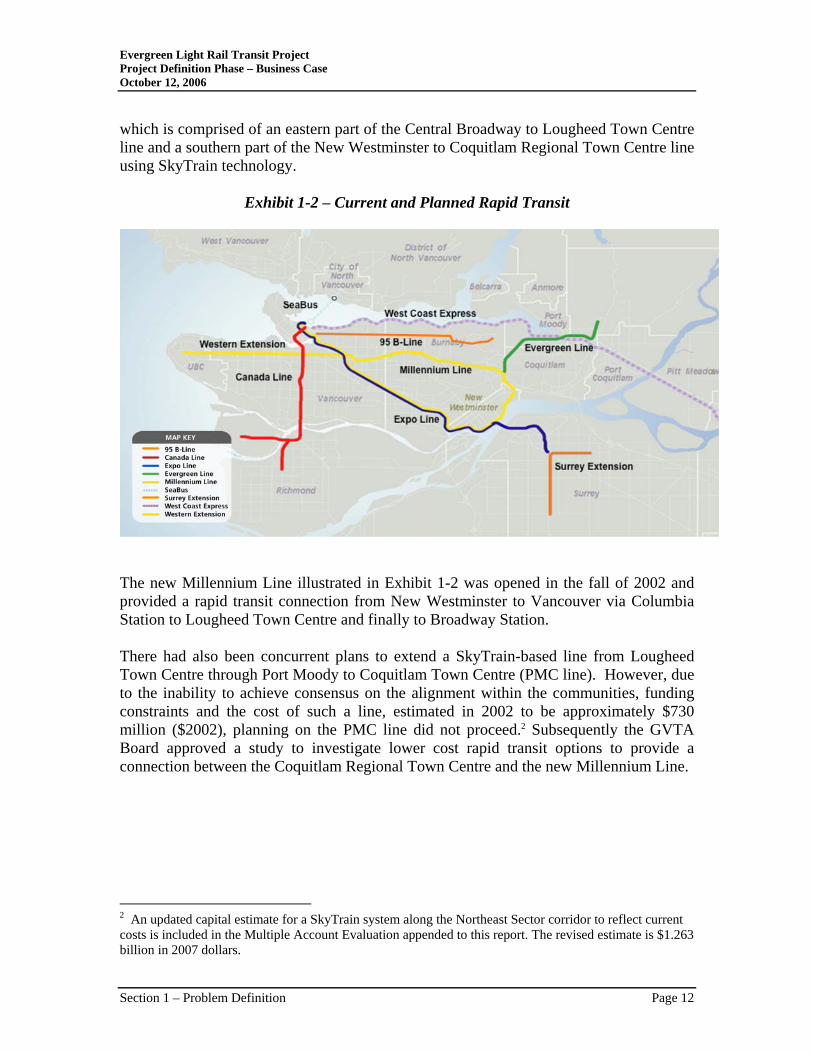
Evergreen Light Rail Transit Project Project Definition Phase – Business Case October 12, 2006
which is comprised of an eastern part of the Central Broadway to Lougheed Town Centre line and a southern part of the New Westminster to Coquitlam Regional Town Centre line using SkyTrain technology.
Exhibit 1-2 – Current and Planned Rapid Transit
The new Millennium Line illustrated in Exhibit 1-2 was opened in the fall of 2002 and provided a rapid transit connection from New Westminster to Vancouver via Columbia Station to Lougheed Town Centre and finally to Broadway Station. There had also been concurrent plans to extend a SkyTrain-based line from Lougheed Town Centre through Port Moody to Coquitlam Town Centre (PMC line). However, due to the inability to achieve consensus on the alignment within the communities, funding constraints and the cost of such a line, estimated in 2002 to be approximately $730 million ($2002), planning on the PMC line did not proceed.2 Subsequently the GVTA Board approved a study to investigate lower cost rapid transit options to provide a connection between the Coquitlam Regional Town Centre and the new Millennium Line.
2 An updated capital estimate for a SkyTrain system along the Northeast Sector corridor to reflect current costs is included in the Multiple Account Evaluation appended to this report. The revised estimate is $1.263 billion in 2007 dollars.
Section 1 – Problem Definition Page 12
Evergreen Light Rail Transit Project Project Definition Phase – Business Case October 12, 2006
1.5 THE NEED The actual and forecast population growth in the GVRD is adding pressure to the regional transportation network highlighting the need for additional infrastructure. At the same time, municipalities throughout the GVRD are taking steps to accommodate growing numbers of people. Without additional infrastructure to support the municipal growth management plans however, this will be difficult for many municipalities to achieve. Within this regional context, the Northeast Sector is one of the fastest growing areas in the GVRD with annual population increasing 125% between 1976 and 2005 versus a growth rate of 85% for the GRVD over the same period. The dramatic population growth in the Northeast Sector over the last three decades has increased the demand for both residential and commercial development in local municipalities and placed additional pressure on the current transportation infrastructure. In addition to local area residents, the corridor is also a primary thoroughfare for travel to Vancouver from points east, including Port Coquitlam, Pitt Meadows and Maple Ridge, all of which are experiencing strong population growth. As a consequence, the current transportation infrastructure is carrying an increasing volume of traffic, adding to the level of congestion and highlighting the need for additional capacity along the proposed Evergreen Line corridor. In an effort to improve the transportation in the area, a section of Barnet Highway running northwest from Port Moody to Vancouver was expanded to include a peak hour peak direction HOV lane to improve traffic flow along the corridor while encouraging alternatives to the single occupancy vehicle. Beyond this roadway improvement, however, opportunities to manage congestion are limited. The transporation corridor in Port Moody is bordered by the Burrard Inlet to the north and Miller Ravine to the south. These geographic constraints combined with the existing development along both sides of the entire corridor limit the scope and ability to expand the transportation corridor. As a consequence, in the absence of expanded capacity offered by the Evergreen Line, the municipalities will likely be unable to achieve their growth management targets while residents and commuters face an ongoing problem with traffic congestion and limited transporation options. 1.6 THE TEAM In addition to the efforts of TransLink staff and staff from the municipalities, the Evergreen Project Team included a multi-disciplinary team of consultants. This team was responsible for all of the work undertaken during the Project Definition Phase. The consultants are:
Section 1 – Problem Definition Page 13
Evergreen Light Rail Transit Project Project Definition Phase – Business Case October 12, 2006
• Anthony Steadman & Associates, Quantity Surveyor • Context Research, Consultation and Communications • Delcan Corporation, Light Rail Vehicles and System Design, Traffic and
Transportation • Gannett Fleming, Procurement Analysis • Gartner Lee, Environmental • Golder Associates, Tunneling and Geotechnical • Hatch Mott MacDonald, Tunneling and Geotechnical • LTK Engineering, Light Rail Vehicles and System Design • N.D. Lea, Civil and Urban Design • Noble Scheduling Corporation, Scheduling • PTV America, Traffic and Transportation • Steer Davies Gleave, Ridership Forecasts • T. Partridge & Associates, Ridership Forecasts • VIA Architecture, Civil and Urban Design
Section 1 – Problem Definition Page 14
Evergreen Light Rail Transit Project Project Definition Phase – Business Case October 12, 2006
2 BACKGROUND 2.1 GREATER VANCOUVER REGIONAL DISTRICT (GVRD) The GVRD is a partnership of 21 municipalities and one electoral area in the lower Fraser Valley. The GVRD is mandated by Part 25 of the BC Municipal Act to develop and implement a regional strategic plan to protect the quality of life in the region, and to deliver services in an efficient and cost-effective manner. The LRSP, adopted by the GVRD Board of Directors and deemed to be a regional growth strategy by the BC Minister of Municipal Affairs in 1996, builds on earlier regional plans and expresses a broad vision of regional growth management for the member municipalities. Four fundamental and interdependent strategies drive the LRSP’s approach to growth management in the region: protect the green zone, build complete communities, achieve a compact metropolitan region and increase transportation choice. The LRSP outlines several transportation choice policies including a policy to plan and implement a transit-oriented and automobile-restrained transportation system for the region based on intermediate capacity transit facilities within identified corridors. The LRSP’s Regional Transit System illustrates the identified conceptual corridors for intermediate capacity transit systems, including a conceptual route from New Westminster Regional Town Centre via Lougheed Municipal Town Centre and Port Moody Municipal Town Centre to the Coquitlam Regional Town Centre. The Lougheed to Coquitlam portion of this conceptual route roughly coincides with the proposed Evergreen Line route. The 1993 Transport 2021 Report indicated an expectation that a Coquitlam-New Westminster intermediate capacity transit system would be in place by 2006 to support the LRSP. The Millennium SkyTrain line provided a portion of this connection (Lougheed to New Westminster) and the Evergreen Line would complete the link to Coquitlam Town Centre. 2.2 REGIONAL GROWTH The GVRD has experienced significant population growth over the last several years and this is expected to continue into the future3. The GVRD developed the LRSP in the early 1990’s to address some of the challenges associated with the expected growth. A key component of the LRSP is the establishment of Growth Concentration Areas to manage growth and encourage a more compact metropolitan region. In doing so, the LRSP aims to minimize the costs to provide community services for a growing population and to protect green space.
3 Demographic information provided by Pierce Lefebvre Consulting.
Section 2 – Background Page 15
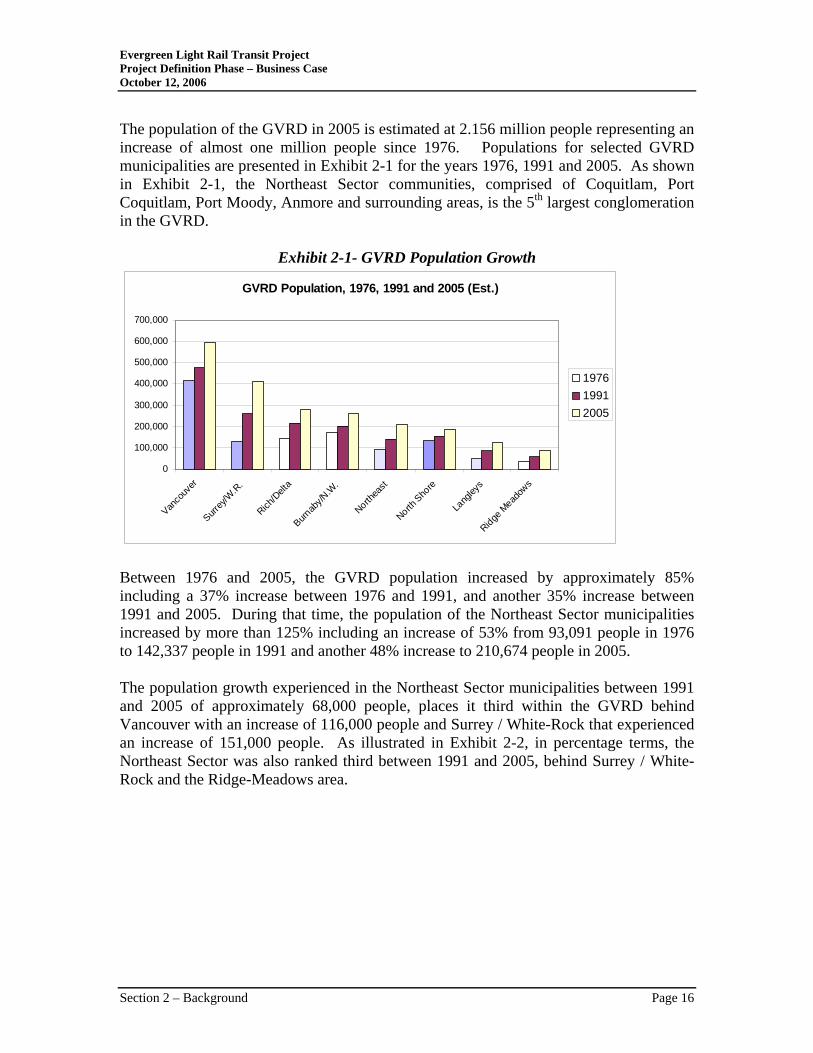
Evergreen Light Rail Transit Project Project Definition Phase – Business Case October 12, 2006
The population of the GVRD in 2005 is estimated at 2.156 million people representing an increase of almost one million people since 1976. Populations for selected GVRD municipalities are presented in Exhibit 2-1 for the years 1976, 1991 and 2005. As shown in Exhibit 2-1, the Northeast Sector communities, comprised of Coquitlam, Port Coquitlam, Port Moody, Anmore and surrounding areas, is the 5th largest conglomeration in the GVRD.
Exhibit 2-1- GVRD Population Growth
GVRD Population, 1976, 1991 and 2005 (Est.)
0
100,000
200,000
300,000
400,000
500,000
600,000
700,000
Vanco
uver
Surrey
/W.R
.
Rich/D
elta
Burnab
y/N.W
.
Northea
st
North Sho
re
Lang
leys
Ridge M
eadow
s
197619912005
Between 1976 and 2005, the GVRD population increased by approximately 85% including a 37% increase between 1976 and 1991, and another 35% increase between 1991 and 2005. During that time, the population of the Northeast Sector municipalities increased by more than 125% including an increase of 53% from 93,091 people in 1976 to 142,337 people in 1991 and another 48% increase to 210,674 people in 2005. The population growth experienced in the Northeast Sector municipalities between 1991 and 2005 of approximately 68,000 people, places it third within the GVRD behind Vancouver with an increase of 116,000 people and Surrey / White-Rock that experienced an increase of 151,000 people. As illustrated in Exhibit 2-2, in percentage terms, the Northeast Sector was also ranked third between 1991 and 2005, behind Surrey / White-Rock and the Ridge-Meadows area.
Section 2 – Background Page 16
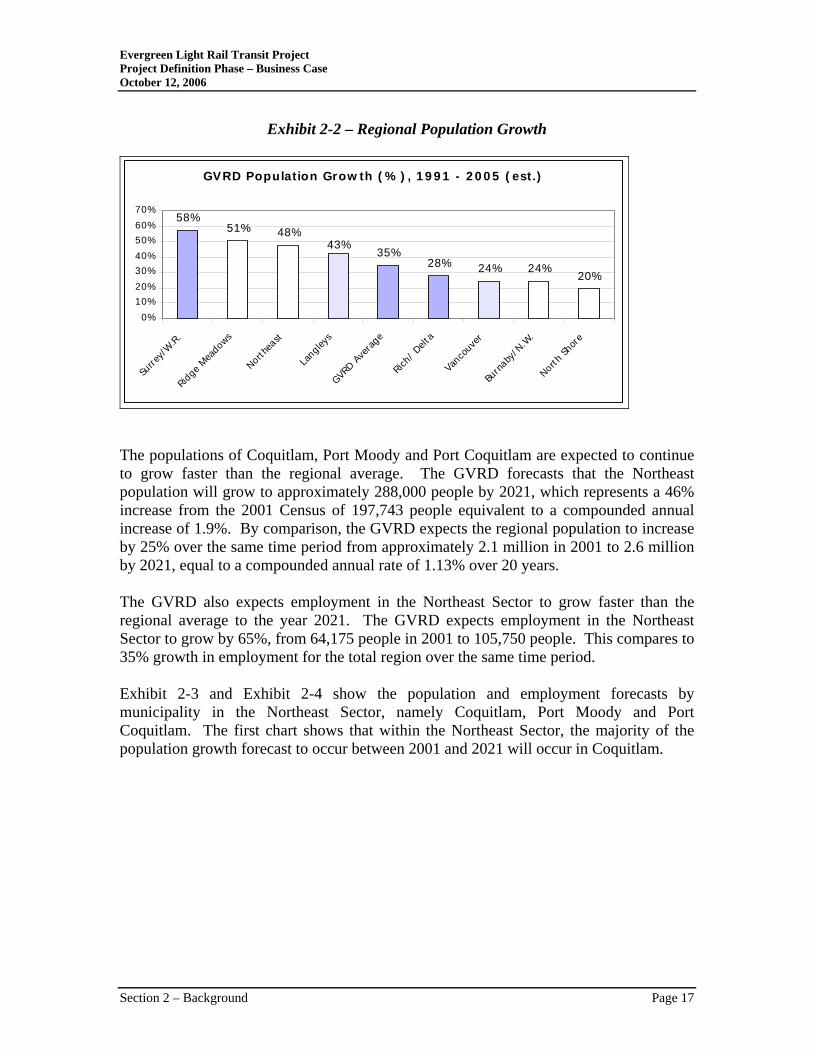
Evergreen Light Rail Transit Project Project Definition Phase – Business Case October 12, 2006
Exhibit 2-2 – Regional Population Growth
GVRD Population Grow th ( % ) , 1 9 9 1 - 2 0 0 5 ( est.)
58%51% 48%
35%28% 24% 24%
20%
43%
0%10%20%30%40%50%60%70%
Surre
y/W.R.
Ridge Mea
dows
Nort hea
st
Langley
s
GVRD Ave
rage
Rich/ D
elta
Vanco
uver
Burn
aby/ N
.W.
Nort h Sh
ore
The populations of Coquitlam, Port Moody and Port Coquitlam are expected to continue to grow faster than the regional average. The GVRD forecasts that the Northeast population will grow to approximately 288,000 people by 2021, which represents a 46% increase from the 2001 Census of 197,743 people equivalent to a compounded annual increase of 1.9%. By comparison, the GVRD expects the regional population to increase by 25% over the same time period from approximately 2.1 million in 2001 to 2.6 million by 2021, equal to a compounded annual rate of 1.13% over 20 years. The GVRD also expects employment in the Northeast Sector to grow faster than the regional average to the year 2021. The GVRD expects employment in the Northeast Sector to grow by 65%, from 64,175 people in 2001 to 105,750 people. This compares to 35% growth in employment for the total region over the same time period. Exhibit 2-3 and Exhibit 2-4 show the population and employment forecasts by municipality in the Northeast Sector, namely Coquitlam, Port Moody and Port Coquitlam. The first chart shows that within the Northeast Sector, the majority of the population growth forecast to occur between 2001 and 2021 will occur in Coquitlam.
Section 2 – Background Page 17
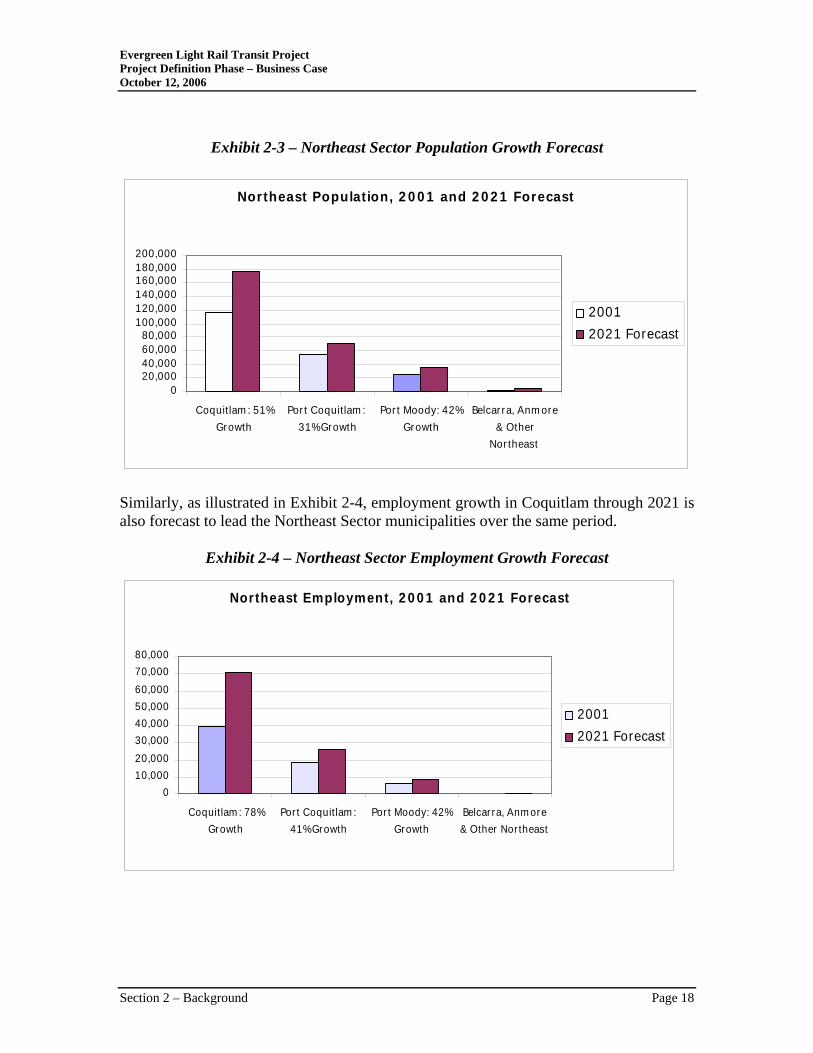
Evergreen Light Rail Transit Project Project Definition Phase – Business Case October 12, 2006
Exhibit 2-3 – Northeast Sector Population Growth Forecast
Northeast Population, 2 0 0 1 and 2 0 2 1 Forecast
020,00040,00060,00080,000
100,000120,000140,000160,000180,000200,000
Coquitlam : 51%Growth
Por t Coquitlam : 31% Growth
Por t Moody: 42%Growth
Belcar ra, Anm ore& Other
Nor theast
20012021 Forecast
Similarly, as illustrated in Exhibit 2-4, employment growth in Coquitlam through 2021 is also forecast to lead the Northeast Sector municipalities over the same period.
Exhibit 2-4 – Northeast Sector Employment Growth Forecast
Northeast Employment, 2 0 0 1 and 2 0 2 1 Forecast
010,00020,00030,00040,00050,00060,00070,00080,000
Coquit lam : 78%Growth
Por t Coquit lam :41% Growth
Por t Moody: 42%Growth
Belcar ra, Anm ore& Other Nor theast
20012021 Forecast
Section 2 – Background Page 18
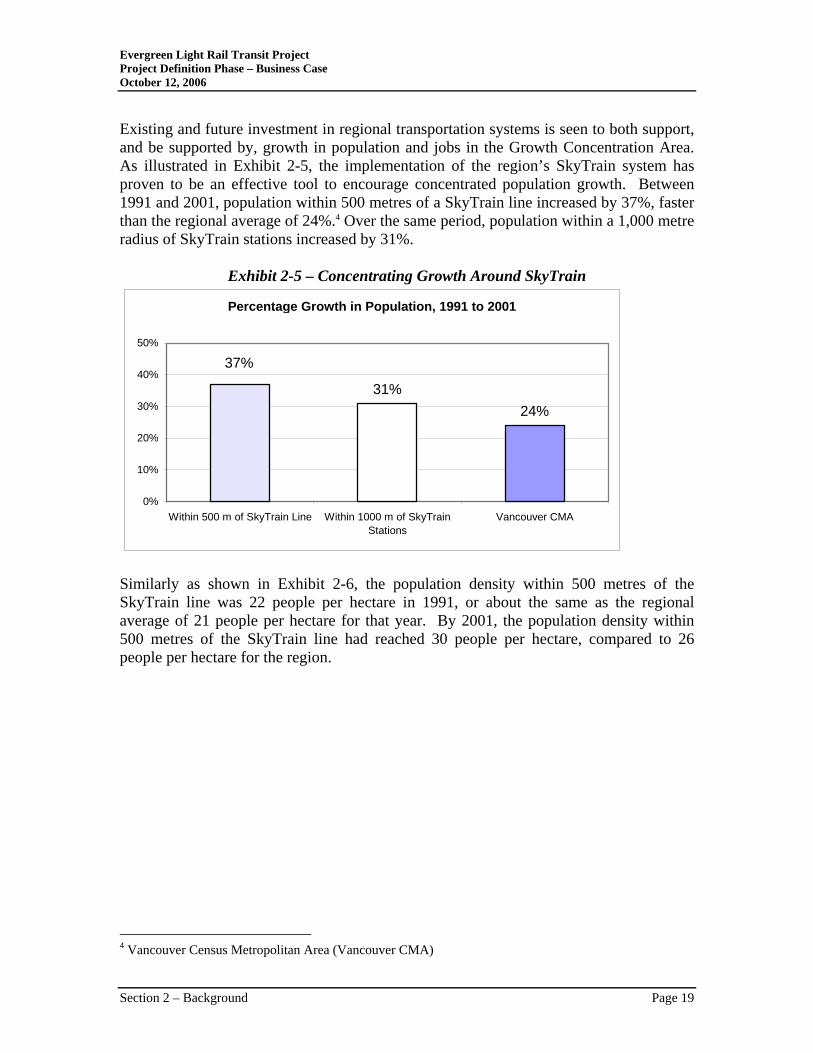
Evergreen Light Rail Transit Project Project Definition Phase – Business Case October 12, 2006
Existing and future investment in regional transportation systems is seen to both support, and be supported by, growth in population and jobs in the Growth Concentration Area. As illustrated in Exhibit 2-5, the implementation of the region’s SkyTrain system has proven to be an effective tool to encourage concentrated population growth. Between 1991 and 2001, population within 500 metres of a SkyTrain line increased by 37%, faster than the regional average of 24%.4 Over the same period, population within a 1,000 metre radius of SkyTrain stations increased by 31%.
Exhibit 2-5 – Concentrating Growth Around SkyTrain
Percentage Growth in Population, 1991 to 2001
31%24%
37%
0%
10%
20%
30%
40%
50%
Within 500 m of SkyTrain Line Within 1000 m of SkyTrainStations
Vancouver CMA
Similarly as shown in Exhibit 2-6, the population density within 500 metres of the SkyTrain line was 22 people per hectare in 1991, or about the same as the regional average of 21 people per hectare for that year. By 2001, the population density within 500 metres of the SkyTrain line had reached 30 people per hectare, compared to 26 people per hectare for the region.
4 Vancouver Census Metropolitan Area (Vancouver CMA)
Section 2 – Background Page 19
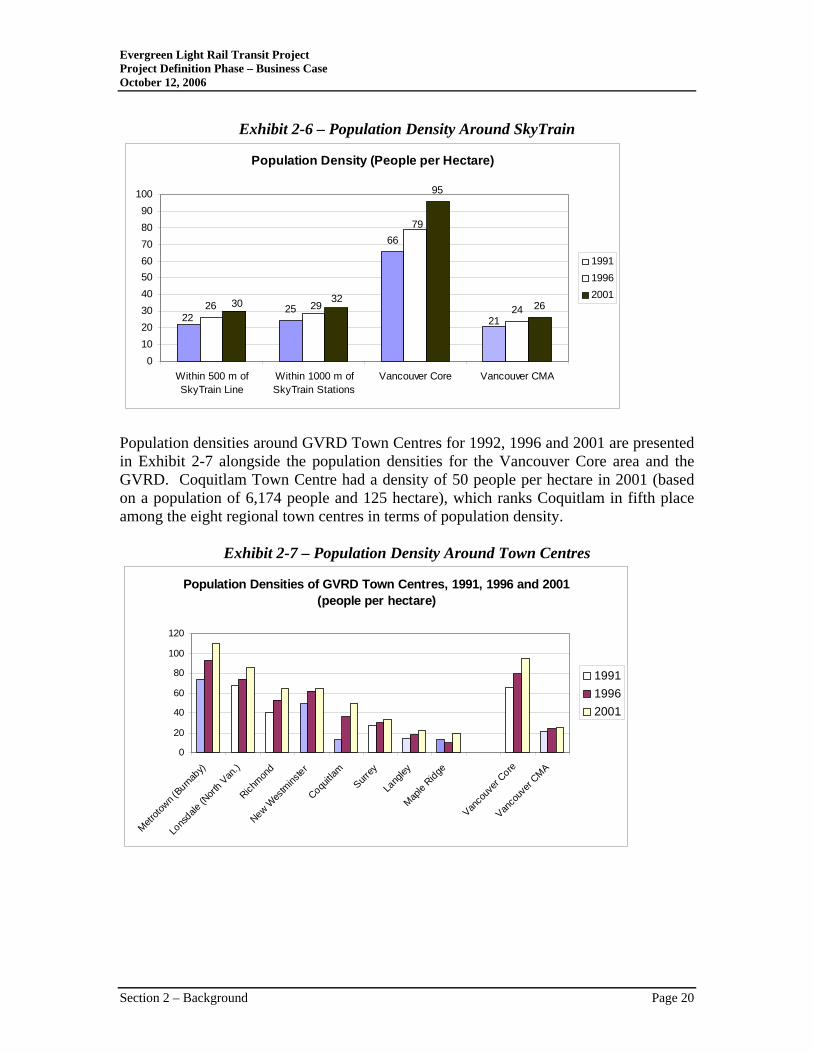
Evergreen Light Rail Transit Project Project Definition Phase – Business Case October 12, 2006
Exhibit 2-6 – Population Density Around SkyTrain
Population Density (People per Hectare)
25
66
26 24
95
262122
29
79
3230
0102030405060708090
100
Within 500 m ofSkyTrain Line
Within 1000 m ofSkyTrain Stations
Vancouver Core Vancouver CMA
199119962001
Population densities around GVRD Town Centres for 1992, 1996 and 2001 are presented in Exhibit 2-7 alongside the population densities for the Vancouver Core area and the GVRD. Coquitlam Town Centre had a density of 50 people per hectare in 2001 (based on a population of 6,174 people and 125 hectare), which ranks Coquitlam in fifth place among the eight regional town centres in terms of population density.
Exhibit 2-7 – Population Density Around Town Centres
Population Densities of GVRD Town Centres, 1991, 1996 and 2001 (people per hectare)
0
20
40
60
80
100
120
Metroto
wn (Burna
by)
Lons
dale (N
orth Van
.)
Richmon
d
New Wes
tmins
ter
Coquitla
mSurr
ey
Lang
ley
Maple
Ridge
Vanco
uver
Core
Vanco
uver
CMA
199119962001
Section 2 – Background Page 20
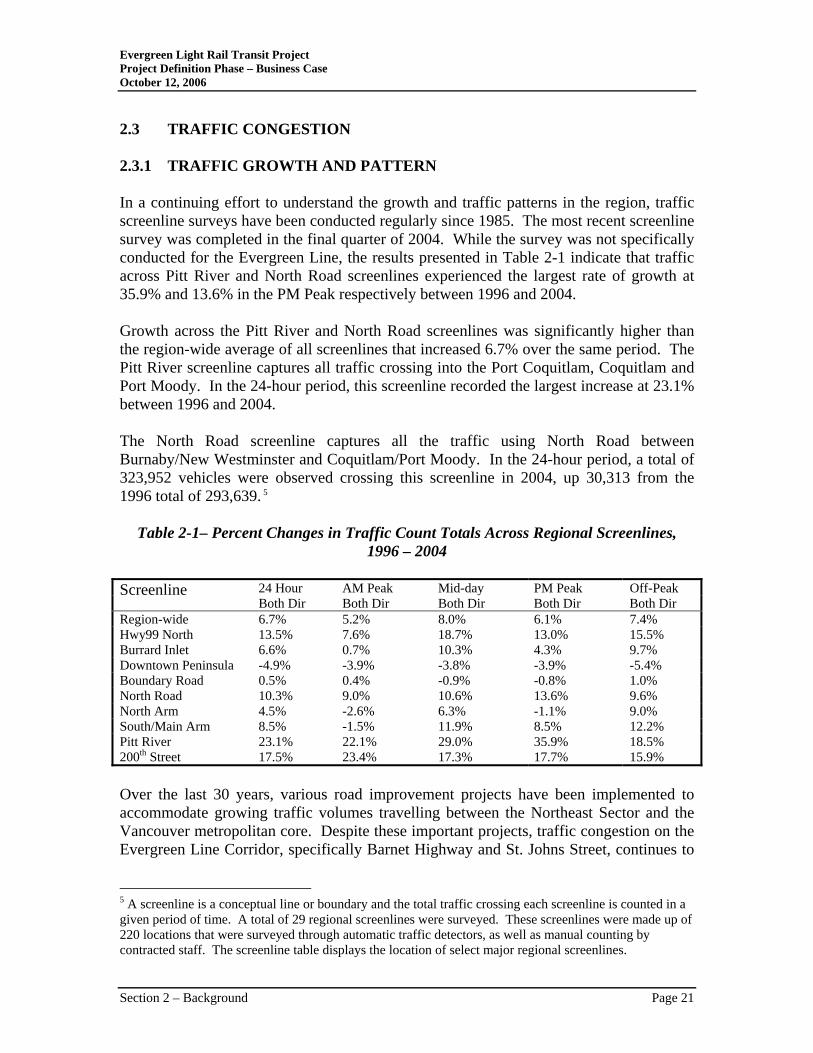
Evergreen Light Rail Transit Project Project Definition Phase – Business Case October 12, 2006
2.3 TRAFFIC CONGESTION 2.3.1 TRAFFIC GROWTH AND PATTERN In a continuing effort to understand the growth and traffic patterns in the region, traffic screenline surveys have been conducted regularly since 1985. The most recent screenline survey was completed in the final quarter of 2004. While the survey was not specifically conducted for the Evergreen Line, the results presented in Table 2-1 indicate that traffic across Pitt River and North Road screenlines experienced the largest rate of growth at 35.9% and 13.6% in the PM Peak respectively between 1996 and 2004. Growth across the Pitt River and North Road screenlines was significantly higher than the region-wide average of all screenlines that increased 6.7% over the same period. The Pitt River screenline captures all traffic crossing into the Port Coquitlam, Coquitlam and Port Moody. In the 24-hour period, this screenline recorded the largest increase at 23.1% between 1996 and 2004. The North Road screenline captures all the traffic using North Road between Burnaby/New Westminster and Coquitlam/Port Moody. In the 24-hour period, a total of 323,952 vehicles were observed crossing this screenline in 2004, up 30,313 from the 1996 total of 293,639. 5
Table 2-1– Percent Changes in Traffic Count Totals Across Regional Screenlines,
1996 – 2004
24 Hour AM Peak Mid-day PM Peak Off-Peak Screenline Both Dir Both Dir Both Dir Both Dir Both Dir
Region-wide 6.7% 5.2% 8.0% 6.1% 7.4% Hwy99 North 13.5% 7.6% 18.7% 13.0% 15.5% Burrard Inlet 6.6% 0.7% 10.3% 4.3% 9.7% Downtown Peninsula -4.9% -3.9% -3.8% -3.9% -5.4% Boundary Road 0.5% 0.4% -0.9% -0.8% 1.0% North Road 10.3% 9.0% 10.6% 13.6% 9.6% North Arm 4.5% -2.6% 6.3% -1.1% 9.0% South/Main Arm 8.5% -1.5% 11.9% 8.5% 12.2% Pitt River 23.1% 22.1% 29.0% 35.9% 18.5% 200th Street 17.5% 23.4% 17.3% 17.7% 15.9% Over the last 30 years, various road improvement projects have been implemented to accommodate growing traffic volumes travelling between the Northeast Sector and the Vancouver metropolitan core. Despite these important projects, traffic congestion on the Evergreen Line Corridor, specifically Barnet Highway and St. Johns Street, continues to
5 A screenline is a conceptual line or boundary and the total traffic crossing each screenline is counted in a given period of time. A total of 29 regional screenlines were surveyed. These screenlines were made up of 220 locations that were surveyed through automatic traffic detectors, as well as manual counting by contracted staff. The screenline table displays the location of select major regional screenlines.
Section 2 – Background Page 21
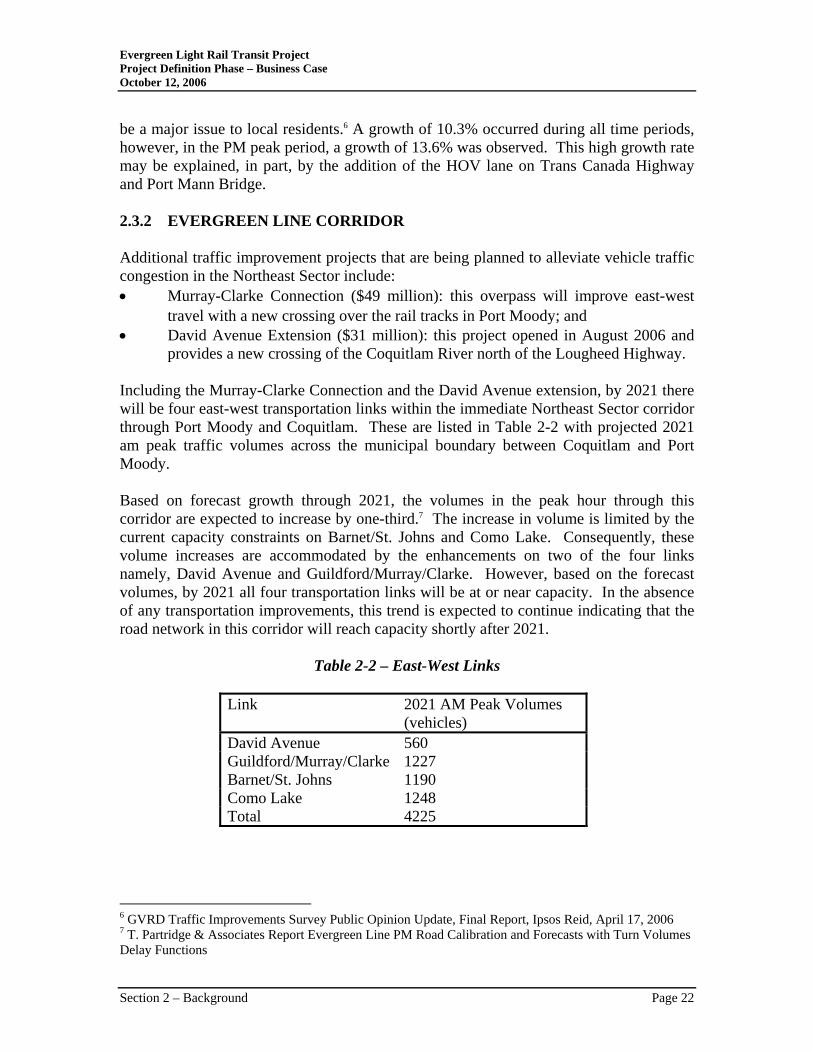
Evergreen Light Rail Transit Project Project Definition Phase – Business Case October 12, 2006
be a major issue to local residents.6 A growth of 10.3% occurred during all time periods, however, in the PM peak period, a growth of 13.6% was observed. This high growth rate may be explained, in part, by the addition of the HOV lane on Trans Canada Highway and Port Mann Bridge. 2.3.2 EVERGREEN LINE CORRIDOR Additional traffic improvement projects that are being planned to alleviate vehicle traffic congestion in the Northeast Sector include: • Murray-Clarke Connection ($49 million): this overpass will improve east-west
travel with a new crossing over the rail tracks in Port Moody; and • David Avenue Extension ($31 million): this project opened in August 2006 and
provides a new crossing of the Coquitlam River north of the Lougheed Highway. Including the Murray-Clarke Connection and the David Avenue extension, by 2021 there will be four east-west transportation links within the immediate Northeast Sector corridor through Port Moody and Coquitlam. These are listed in Table 2-2 with projected 2021 am peak traffic volumes across the municipal boundary between Coquitlam and Port Moody. Based on forecast growth through 2021, the volumes in the peak hour through this corridor are expected to increase by one-third.7 The increase in volume is limited by the current capacity constraints on Barnet/St. Johns and Como Lake. Consequently, these volume increases are accommodated by the enhancements on two of the four links namely, David Avenue and Guildford/Murray/Clarke. However, based on the forecast volumes, by 2021 all four transportation links will be at or near capacity. In the absence of any transportation improvements, this trend is expected to continue indicating that the road network in this corridor will reach capacity shortly after 2021.
Table 2-2 – East-West Links
Link 2021 AM Peak Volumes (vehicles)
David Avenue 560 Guildford/Murray/Clarke 1227 Barnet/St. Johns 1190 Como Lake 1248 Total 4225
6 GVRD Traffic Improvements Survey Public Opinion Update, Final Report, Ipsos Reid, April 17, 2006 7 T. Partridge & Associates Report Evergreen Line PM Road Calibration and Forecasts with Turn Volumes Delay Functions
Section 2 – Background Page 22
Evergreen Light Rail Transit Project Project Definition Phase – Business Case October 12, 2006
From a motorist’s perspective, an increase in traffic volume equates to travel time delays. With the volumes increasing as indicated in the table, motorists will experience a dramatic increase in length of travel delays. As an example, a local analysis of the intersection delays through the Barnet / St. Johns corridor was undertaken to determine the current vehicle delay time.8 According to the analysis, this corridor is currently at capacity and vehicles are experiencing an average delay of 23 seconds per vehicle. Based on projected volumes to 2021, and in the absence of LRT, delays in this corridor are expected to almost triple to 64 seconds average delay per vehicle. In other words, in 2021, the end-to-end trip time from Lougheed Mall to Coquitlam Centre via this corridor would be on average about 37 minutes as compared 25 minutes currently. This example is an indication of the effects that can be anticipated throughout the Northeast corridor on the other links mention above. As development continues, the delays will increase to unacceptable levels beyond 2021 for all the four major links in the east-west direction in this corridor. 2.3.3 NORTHEAST CORRIDOR NETWORK Given the geography of Port Moody, bounded to the north by the Burrard Inlet and the south by geographic escarpment, and the existing development along the entire corridor, opportunities to expand the capacity of the existing roads or build additional roadways to meet the long-term needs of the region are extremely limited. In most areas, it is only possible to accommodate an additional lane per direction, which would provide additional capacity of between 700 to 1100 vehicles per hour per direction or between 910 to 1430 persons per lane. 2.4 OFFICIAL COMMUNITY PLANS (OCP) Long-term planning visions for the areas containing the proposed Evergreen Line are expressed through the GVRD LRSP (1996), the City of Coquitlam OCP (2002), the City of Port Moody OCP (2000) and the City of Burnaby OCP (1998). Each of these plans envisions a rapid transit corridor that is generally consistent with the currently planned Evergreen Line horizontal alignment. 2.4.1 CITY OF COQUITLAM The City of Coquitlam OCP, adopted in March of 2002, provides a broad planning vision for land use and service delivery across the city, and incorporates specific area plans developed for particular neighbourhoods or areas within the city. The Coquitlam OCP anticipates, and provides, some direction to accommodate, a SkyTrain rapid transit line along a corridor very similar to the proposed Evergreen LRT Line. The Regional Context Statement within the plan indicates how the Coquitlam OCP conforms to objectives of the LRSP, including intent and measures to accommodate an increasing
8 Delcan Corporation, Intersection Analysis
Section 2 – Background Page 23
Evergreen Light Rail Transit Project Project Definition Phase – Business Case October 12, 2006
share of the region’s population and employment growth. It is noted in the planning document however, that the City’s support for, and ultimate ability to achieve, a rate of growth higher than the metropolitan region, is contingent on appropriate regional-scale transportation facilities being put in place in time to support such growth including a rapid transit system from Coquitlam’s Town Centre with reasonably direct connections to other regional town centres. The significant growth experienced by the city and the importance of this corridor to serving, sustaining and managing this growth is evident in the statistics provided by the City Planning Division:
• Of the City's 650,640 m2 of total commercial floor space, 244,460 m2 (38% of the total) was added between 1995-2005.
• Projected (2006-2021) commercial floor space, including office, is estimated at 251,000 m2.
• 40% of the City's total population growth between 1991-2005 occurred in the Regional Town Centre.
• Approximately 60% of the City's future population growth is anticipated to occur along the LRT corridor including North and Clarke Roads and within the Regional Town Centre.
• Approximately 50% of the City's future employment growth is anticipated to occur along the LRT corridor.
2.4.2 CITY OF PORT MOODY The City of Port Moody OCP, adopted in November 2000, is currently in the early stages of a substantial review. The existing OCP provides a broad overall planning vision for development and service delivery for the City of Port Moody, as well as specific neighbourhood plans at a finer scale. Maintaining and capitalizing on Port Moody’s extensive community heritage assets is a strong theme of the OCP, particularly in respect of the Moody Centre neighbourhood. In a section titled “Responding to the Challenge of a Changing Urban Region”9 the consistency of the OCP with objectives of the GVRD’s Liveable Region Strategic Plan is discussed, including intent and measures to accommodate a share of the region’s population and job growth. The City of Port Moody OCP identifies infrastructure needs that must be provided to realize Port Moody’s growth potential in support of the GVRD’s LRSP, including rapid transit. The OCP discusses traffic problems created by large volumes of traffic running through the geographically constrained south shore of Port Moody, and transportation projects the City will pursue to deal with the problems, including planning for the routing of rapid transit through Port Moody to Coquitlam Centre. To accomplish this, the OCP recognizes the need to work with provincial and regional agencies and neighbouring municipalities in determining an acceptable rapid transit alignment through the City so as to mitigate the impact on local residents, the natural environment and heritage resources.
9 City of Port Moody. 2005, pp. 12 - 14
Section 2 – Background Page 24
Evergreen Light Rail Transit Project Project Definition Phase – Business Case October 12, 2006
2.4.3 CITY OF BURNABY Burnaby is divided into four quadrants, with a town centre serviced by rapid transit established within each quadrant. Burnaby Metrotown, in the southwest quadrant, is one of the four town centres, but ranks above the other three in the development hierarchy in that it also functions as the ‘regional’ town centre in Burnaby. The northeast quadrant includes Lougheed Town Centre, the proposed western terminus of the Evergreen Line, as its compact community focal point. The Millennium SkyTrain line currently services Lougheed Town Centre and Brentwood Town Centre, while Burnaby Metrotown and Edmonds Town Centre are serviced by the Expo SkyTrain line. The City of Burnaby OCP, adopted in 1998, provides broad citywide policy and direction to guide the city’s growth to 2006 and beyond. It is expected that the Burnaby OCP will be reviewed and updated after the completion of the current review of the GVRD region-wide strategic plan. The Lougheed Town Centre Plan does not officially recommend, but indicates, a preliminary light rail transit alignment. The station site is surrounded by a Core Area of land parcels designated for various high density uses. 2.5 ACTIVITY CENTRES There are 12 stations along the 11.2 km Evergreen Line providing access to a number of activity centres immediately adjacent and beyond via planned connections to other transit services including the local bus network, SkyTrain and West Coast Express. Significant among the key activity centres accessible via the Evergreen Line are the local post secondary institutions including Douglas College, Simon Fraser University and Coquitlam College. Students are an important market for transit services and together, these three campuses comprise between 25,000 and 30,000 students and staff. 2.5.1 DOUGLAS COLLEGE The eastern terminus of the Evergreen Line will be on Pinetree Way near the David Lam Campus of Douglas College. Douglas College offers mainly two-year academic and job entry programs, and a limited number of baccalaureate degree programs, at three campuses in the Lower Mainland (New Westminster, Coquitlam and Maple Ridge). In excess of 3,000 students receive at least part of their education at the David Lam Campus in Coquitlam, or 18% of the approximately 17,000 students enrolled at Douglas College each year. The Coquitlam campus is currently expanding with an estimated increase of 2000 to 3000 students expected over the next few years. With the Evergreen Line, the David Lam campus would be linked by rapid transit to the main Douglas College campus in New Westminster near New Westminster SkyTrain station. Douglas College is
Section 2 – Background Page 25
Evergreen Light Rail Transit Project Project Definition Phase – Business Case October 12, 2006
currently not included in the U-Pass program, however, with the implementation of the LRT, TransLink would consider implementation of the U-Pass at the school.10
2.5.2 SIMON FRASER UNIVERSITY (SFU) SFU has a main campus on Burnaby Mountain, and two satellite campuses, one in downtown Vancouver and one in Surrey. Approximately 2000 staff and faculty work at the Burnaby campus with a student population in excess of 20,000 people. The UniverCity developments on SFU property are currently under construction. When complete they will provide up to 10,000 residents on Burnaby Mountain. The first phase, expected to be ready in 2006, is a high rise/townhouse development and includes approximately 1000 units. Burquitlam Station on the Evergreen Line offers an additional rapid transit link to SFU with TransLink planning to have a shuttle service to SFU from that station. SFU is already partially served by SkyTrain with a shuttle from the Production Way-University station on the Millennium Line to SFU, but the Evergreen Line will provide a more direct link to SFU from the northeast via a bus from the Burquitlam plaza area. SFU students participate in the U-Pass program and UniverCity residents are eligible to purchase a Community Transit Card to help promote the use of transit to and from SFU. 2.5.3 COQUITLAM COLLEGE Coquitlam College is a private college established in 1982 offering two-year university transfer courses as well as language courses mainly to foreign students. Located on Brookmere Ave. just east of North Road between Austin Road and Cochrane near the existing Lougheed SkyTrain Station, it has between 1,000 and 1,500 students. Coquitlam College students and staff using the Evergreen Line would likely use either Lougheed Station or the Cameron St. Station. 2.5.4 SCHOOLS In addition to the post secondary schools, there are also secondary and elementary schools that are in close proximity to the Evergreen Line that may benefit from enhanced public transit access for both staff and students. Schools within the closest proximity include:
10 The UPASS Program currently allows for students at UBC and SFU to participate in the program. This means that every student at each institution pays a set fee regardless of whether they use transit or not. By sharing the cost of the program through the entire student population, it reduces the cost of the program and allows students access to the transit system at an affordable rate. The intent is to expose students to the benefits of using transit so that in the long-term, when they are capable of making a transportation choice at the full value that a large percentage will choose transit.
Section 2 – Background Page 26
Evergreen Light Rail Transit Project Project Definition Phase – Business Case October 12, 2006
• Moody Elementary School • Moody Middle School • Port Moody Secondary • Pinetree Secondary School 2.5.5 COMMUNITY, RECREATION AND CULTURAL CENTRES The Evergreen Line also provides access to a number of community, recreation and cultural centres located within a reasonable distance from an LRT station. These include: • The Port Moody Arts Centre, and Blackberry Gallery at the corner of Kyle Street
and St. Johns Street is located in the Old City Hall built in 1914. The site also includes the Kyle Seniors Centre.
• The Port Moody Heritage Town Centre consists of a heritage precinct comprised
of various heritage and character buildings, small shops and the Queens Street Plaza that hosts the Saturday farmers’ market on Queens Street just north of St. Johns Street, between Spring Street and Clarke during the summer months.
• Port Moody City Hall complex is not immediately adjacent to the Evergreen Line,
but it will be within walking distance of the proposed Ioco Station. In addition to City Hall, it includes the Inlet Theatre and the library. North of that site is the Port Moody Lounge, curling rink and arena. An expansion including an Olympic size ice rink, a gymnasium and other facilities is currently under construction adjacent to City Hall.
• Coquitlam City Hall Civic Complex is located at the southwest corner of
Guildford Way and Pinetree Way. The site also includes the City’s new Public Safety building and library. Across Guildford Way, between Guildford and Town Centre Boulevard is the City Centre Aquatic Complex. The Pinetree Community Centre is located immediately north of the Douglas College Campus.
• The Evergreen Cultural Centre, at the northeast corner of Guildford Way and
Pinetree Way includes a theatre, a rehearsal hall, spacious lobby and three-studio art gallery.
• Across from Douglas College, on the east side of Pinetree Way is the Town
Centre Park, which includes Lafarge Lake, a sports stadium, a running track, and various sports fields including an artificial turf field.
• There are many parks in the vicinity of the Evergreen Line including Inlet Park
and Chineside Park in Port Moody, and Town Centre Park, Dacre Park (south side of CP Rail Line), Coronation Park, and Eagle Ridge Park in Coquitlam.
Section 2 – Background Page 27
Evergreen Light Rail Transit Project Project Definition Phase – Business Case October 12, 2006
2.5.6 SHOPPING MALLS The Evergreen Line will provide a rapid transit link between the Lougheed Centre Mall and Coquitlam Centre Mall, Henderson Place and Westwood Mall. • Lougheed Centre Mall has approximately 175 stores and services, an annual
traffic of 7.3 million shoppers per year. There are approximately 1500 people employed at the mall.
• Coquitlam Centre Mall is located on 57 hectares of land on Barnet Highway
between Johnson St. and Pinetree Way. Traffic is reported at 11.5 million shoppers in 2004, up from 7.8 million in 2000. Over 200 stores and services employ approximately 2700 people. There are 4,500 parking spaces.
There are other substantial shopping centres across Pinetree Way from Coquitlam Centre Mall including Henderson Place and Westwood Mall, which would also be served by the Evergreen alignment. As well, the Evergreen Line provides convenient access to Burquitlam Plaza, Coquitlam Plaza, Eagle Ridge Place, and Pinetree Village. Shopping malls are large trip generators within the communities or regions they serve. Little information is readily available on the modal split for patrons but without rapid transit service; one would expect most shoppers to arrive by automobile. Metropolis at Metrotown in Burnaby has been accessible by SkyTrain since 1986, and the City of Burnaby reports that over 30% of shoppers to Metrotown now arrive by public transit. Metropolis at Metrotown is a regional shopping centre with over 470 stores and services, with annual traffic of 25 million shoppers, and 8,500 parking spaces. 2.6 COMMUNITY SUPPORT Residents in the Northeast Sector of the GVRD, and municipalities along the Evergreen Line support the general concept and alignment of the project. In June 2004, on behalf of TransLink, Ipsos-Reid carried out a random survey of 1,500 Northeast Sector residents from the communities of Coquitlam, Port Coquitlam, Port Moody, Anmore/Belcarra, Northeast Burnaby, Maillardville and New Westminster/Sapperton. Survey results show that 92% of residents supported proceeding with the project as then conceived. In addition, 95% of the respondents believed the project were important to Greater Vancouver, 94% indicated it was important to the northeast Sector, and 77% indicated that it was important to them personally.11
11 Northeast Sector Rapid Transit Alternatives, Ipsos-Reid, August 2004
Section 2 – Background Page 28
Evergreen Light Rail Transit Project Project Definition Phase – Business Case October 12, 2006
The 2004 survey asked the participants to comment on the technologies that should be used for the Evergreen Line, namely SkyTrain, LRT, Guided Light Transit (GLT), and Diesel Multiple Units (DMU). Some 74% of survey participants preferred SkyTrain technology, and 70% preferred the LRT technology. Local governments of the four municipalities that are primarily influenced by the Evergreen Line have endorsed the proposed corridor and technology. In the fall of 2004, the mayors of the four municipalities (Burnaby, Coquitlam, Port Coquitlam, and Port Moody) expressed their support of the project. Together these municipalities represent a population of 561,000 people. Not all of the communities were supportive of the rapid transit project regardless of the technology employed. Port Moody and its residents rejected the concept of an elevated guideway through Port Moody in a citywide referendum held in April 2004. Community and resident support for the Evergreen project was re-affirmed at open houses that were conducted throughout the Project Definition Phase culminating in June 2006. A summary of comments from these open houses indicated that most participants were supportive of the concept of a rapid transit line extending from Lougheed Town Centre to Port Moody and Coquitlam City centre, and were interested in light rail transit technology.12
12 Summary Report: June 2006 Preferred Preliminary Design Open Houses Draft July 20, 2006 Context Research Ltd., Vancouver, BC
Section 2 – Background Page 29
Evergreen Light Rail Transit Project Project Definition Phase – Business Case October 12, 2006
3 POTENTIAL SOCIETAL BENEFITS An 11.2 kilometre, 12-station alignment that is largely at-grade and runs north from the Lougheed SkyTrain station in Burnaby to an eastern terminus at Douglas College in Coquitlam, the Evergreen Line features stations located at key points along the alignment providing convenient access to a number of activity centres and potential development sites within the corridor. The line also provides convenient connections to other transit services including SkyTrain, West Coast Express and the local bus network. The Evergreen LRT Line provides a cost-effective solution to stimulate concentrated regional development and address the immediate and future transportation capacity constraints that limit economic growth in the region. The capital cost of the project is estimated at $970 million (2007). It is expected that the Evergreen Line will recover about 95% of its annual operating costs in 2013 and, by 2021, revenues and savings are expected to exceed annual operating costs. The benefit-cost ratio of the project is 1.15 and the Net Present Value is $143.46 million, based on the incremental present value of capital and operating costs and the incremental present value of revenues, savings and transportation user benefits through to 2041. 3.1 ECONOMIC BENEFITS 3.1.1 EMPLOYMENT Construction of the project will generate an estimated 6,860 person years of direct, indirect and induced employment in BC.13
The operation and maintenance of the Evergreen Line will generate employment from on-board staff/operations and from the Operations and Maintenance Centre (OMC) functions. Employment created from the on-going operations and maintenance of the Evergreen Line is equivalent to121 full-time positions including 93 direct and 28 indirect jobs. 3.1.2 TAXES The construction of the Evergreen Line will provide Gross Domestic Product (GDP) impacts of some $391 million. Construction activities will also generate federal taxes of $27 million and provincial taxes of $37 million, including all direct, indirect and induced impacts. Federal and provincial income taxes and municipal property taxes will also be generated through the on-going operations of the line and the OMC.
13 Pierce Lefebvre Consulting
Section 3 – Potential Societal Benefits Page 29
Evergreen Light Rail Transit Project Project Definition Phase – Business Case October 12, 2006
3.2 ROAD USER BENEFITS The Evergreen Line provides a viable transportation choice to residents, both those already living in the region and others that will be attracted by development in the corridor. For people in the corridor the line provides local and regional mobility without placing a burden on already-busy roads, freeing capacity for longer distance trips and goods movement. The Evergreen Line operates in a segregated right-of-way and is therefore not subjected to the problems associated with congestion. The introduction of the LRT will reduce the number of car trips by 1.9 million following a short ramp-up period and this number is estimated to increase to almost 3.6 million trips by 2021.14 Despite this fact, the growth in traffic volumes is expected to outweigh this reduction such that congestion will continue to worsen through 2021. The introduction of the LRT however, will improve the capacity of the corridor from a people and goods movement perspective. The total annual road user benefits resulting from the Evergreen Line are $12.77 million (2007) in 2013, growing to $13.16 million in 2021 (2007)15. With this traffic growth, travel times have been increasing and are becoming less reliable and less predictable, directly impacting both the cost of moving goods and the efficiency with which the shippers and receivers of goods can function. The Evergreen Line will increase the capacity of the corridor to move people. The addition of one vehicle traffic lane per direction along the Evergreen Line corridor will increase the capacity of the corridor to between 700 and 1100 vehicles per hour per direction. This equates to between 910 and 1430 persons per lane. By contrast, the additional transportation capacity that will be provided within the existing corridor through the implementation of the proposed Evergreen LRT system will be significantly more, using the equivalent of one traffic lane width in each direction. The capacity is sufficient to meet the immediate demand and can easily be expanded to accommodate future demand by utilizing longer trains or adding more trains. The 2021 system design capacity of the proposed LRT system is up to 4800 people per hour per direction16. By comparison, in order to provide an equivalent capacity through roadway expansion, a minimum of 4 new lanes would be required by 2021 in each direction. In other words, St. Johns Street in Port Moody would have to be expanded from the current 4-lane cross-section to a 12-lane cross-section. While it is true that the LRT adds an additional mode of traffic in an already busy corridor, it also provides benefits to the corridor for general vehicular traffic. As mentioned previously the signal system will be reconfigured to facilitate the inclusion of the LRT. As such the signal system will be integrated with the LRT system signal operations requiring more advance computer hardware and software. The result will be an organized approach for the vehicles traveling along and crossing this corridor via the 14 T. Partridge and Associates, 2006 15 T. Partridge and Associates, 2006 16 Based on the 2021 system design capacity (12-2 car trains at 5-minute headways)
Section 3 – Potential Societal Benefits Page 30
Evergreen Light Rail Transit Project Project Definition Phase – Business Case October 12, 2006
use of intelligent intersection signalization. This is most evident along the St. Johns corridor where there is no communication amongst the sparsely spaced traffic signals. In addition, an intelligent signals network also provides a safer condition for all modes of traffic with relatively small impacts to the auto throughput of the corridor. For example, all the crossing traffic, including pedestrians, will be concentrated at signalized intersections, removing the risk of potentially serious accidents arising from errors in judgment without controlled crossings. The LRT project will affect the geometry of the intersections along the entire corridor. The intersection configurations will be redesigned and upgraded to accommodate the trackway and existing traffic movements and volumes. Specifically, Como Lake/Clarke and Ioco/Barnet intersections will be upgraded in provide a higher level of service with the LRT. Como Lake/Clarke intersection will be upgraded with the addition of a dedicated southbound to westbound right turn lane and an eastbound to northbound left turn lane resulting in a double left turn to satisfy the AM and PM peaks respectively. Similarly, the Ioco/Barnet intersection will be redesigned and upgraded to include an additional eastbound to northbound left turn lane. The resulting double left turn lane will address the PM peak volumes. 3.3 TRANSIT USER BENEFITS The Evergreen Line will extend the coverage and help complete Greater Vancouver’s rapid transit network by including the Northeast Sector of the region. As part of a network of transit services, the Evergreen Line connects directly with SkyTrain’s Millennium Line and West Coast Express commuter rail. It also enables integrated travel throughout the network including the Expo Line, Millennium Line and the future Canada Line. The introduction of the Evergreen Line will influence the travel patterns of current transit users as well as attract new riders to the system who would otherwise not travel on transit if the LRT service were not introduced. With the addition of the Evergreen Line, improvements to the local transit service, enhancing the connectivity to the broader transit network, and improving Millennium Line service, system-wide ridership will increase by about 5.0 million new transit trips annually and transit fare revenues will increase by $12.20 million (2007) by 202117. Regional transit modal split will increase by 0.4%, from 13.8% to 14.2%. The introduction of the Evergreen Line will immediately improve the travel time for current transit riders by about 11 minutes in the peak hour. Based on the numbers of current transit riders and the estimated time savings associated with the new LRT service
17 Based on 5 minute frequency, 3 minute frequency on Millennium Line and constrained capacity on WCE
Section 3 – Potential Societal Benefits Page 31
Evergreen Light Rail Transit Project Project Definition Phase – Business Case October 12, 2006
along the northeast corridor, the annual transit user benefits resulting from the Evergreen Line are $38.83 million (2007) in 2013, growing to $44.57 million in 2021 (2007)18. Transit users will also benefit from a more frequent, reliable, accessible and comfortable service. 3.4 SUPPORTS FUTURE GROWTH The Evergreen Line supports growth in a sustainable manner providing the ability to cost-effectively add capacity to move more people through the corridor as demand increases. The line supports regional and municipal growth management strategies that help limit the impacts of growth on the environment and sustain the livability of the region. The Evergreen Line will support the creation of complete communities and a compact region, support existing development and contribute to “city shaping” by stimulating future concentrated and mixed use development. The new LRT line provides the transportation infrastructure to enable the municipalities to achieve growth management objectives that are otherwise unattainable. Local municipalities have structured their Official Community Plans based on the availability of an intermediate capacity transit line. The implementation of the Evergreen Line provides an excellent opportunity to assist municipalities in their efforts to encourage economic development by supporting higher density transit-oriented developments along the corridor. These developments support opportunities for local residents to live near their place of work, therefore reducing their reliance on the automobile and alleviating demand on the regional transportation network and freeing up capacity for longer-distance trips and goods movement. Transit-oriented Development (TOD) principles have been developed and applied over the last twenty years to a series of new transit systems, particularly in North America. The techniques involve partnerships between the transit agency, local municipalities and private sector developers to design new developments clustered around transit stations. These are commonly of a more diverse mixed use (retail/commercial/residential) and higher density than would otherwise be the case in the absence of transit. The addition of a transit station generates a concentration of movement that adds vitality to the TOD with the increased activity commonly leading to improvements in local business and increases in land and property values. The application of TOD techniques can act as a catalyst to accelerate the rate of development and also encourage higher value and higher density development. This “Smart Growth” approach is consistent with the compact region requirements of the LRSP.
18 T. Partridge and Associates, 2006
Section 3 – Potential Societal Benefits Page 32
Evergreen Light Rail Transit Project Project Definition Phase – Business Case October 12, 2006
The following areas support significant future TOD opportunities: • Lougheed Town Centre – A major new interchange between the Evergreen Line
and the SkyTrain network with potential for an increased density of commercial development.
• Cameron Street – The Evergreen Line station will act as a catalyst for further high
density commercial and residential development in this area. • Burquitlam Transit Village – The existing Burquitlam Plaza is recognized by
Coquitlam to be a major opportunity to introduce a new mixed-use development focused on the Evergreen Line station.
• Moody Street – This Evergreen Line station will act as a catalyst for further 2-3
storey commercial/residential development in this area. • Coquitlam Exchange – This station will become a major transfer point linking the
Evergreen Line, West Coast Express services, local buses, and park & ride. The station is being designed to maximize the amount of development land on the Coquitlam Exchange site to allow a TOD to be taken forward. The ridership model does not assume TOD at this location and therefore, additional ridership and revenue can be expected if development proceeds.
• Coquitlam Regional Town Centre – A new “downtown” is envisaged for
Coquitlam and this will be supported by the Evergreen Line and three new stations at Lincoln, Civic Centre/Guildford and Douglas College.
The significant growth experienced by the City of Coquitlam and the importance of this corridor to serving, sustaining and managing this growth is evident in the statistics provided by the City Planning Division:
• Of the City's 650,640 m2 of total commercial floor space, 244,460 m2 (38% of the total) was added between 1995-2005.
• Projected (2006-2021) commercial floor space, including office, is estimated at 251,000 m2.
• 40% of the City's total population growth between 1991-2005 occurred in the Regional Town Centre.
• Approximately 60% of the City's future population growth is anticipated to occur along the LRT corridor including North and Clarke Roads and within the Regional Town Centre.
• Approximately 50% of the City's future employment growth is anticipated to occur along the LRT corridor.
Section 3 – Potential Societal Benefits Page 33
Evergreen Light Rail Transit Project Project Definition Phase – Business Case October 12, 2006
The Evergreen Line is critical to the City of Coquitlam achieving this development potential and the associated economic benefits. The Line provides transportation capacity required to support development and acts as a catalyst for revitalizing business and residential areas.
3.5 ENVIRONMENTAL Though it is not a requirement, TransLink has “opted in” to the B.C. Environmental Review Process under the BC Environmental Assessment Act. The project will be reviewed by provincial and federal government agencies through an environmental assessment process facilitated by the BC Environmental Assessment Office (BCEAO). The process is open to the full participation of stakeholders and the general public. The assessment will identify all of the potential environmental, economic, social, heritage and health impacts, and define how they will be mitigated through project design. Areas of study for the impact assessment include: • Contaminated sites • Socio-economic and community impacts • Climate/air change, i.e. air quality during construction and operation • Noise during construction and operation • Geotechnical, i.e. slope stability, groundwater • Biophysical- terrestrial and aquatic, i.e. tree removal • Archaeology, traditional use and heritage • Electric and magnetic field emissions The results from these studies will be compiled into a single document titled “Application for Environmental Assessment Certificate”. Members of the public, First Nations and stakeholders will be given an opportunity to review the study findings during a comment period determined by the BCEAO. During this time TransLink will hold consultation activities in order to provide an opportunity for public review and comment. The environmental work for the permit application is currently underway. Many of the quantitative benefits of the Evergreen Line are not available until this work is complete. However, the following discusses the environmental benefits of the Evergreen Line. The Evergreen Line reduces vehicle travel in the lower Fraser Valley by an estimated 31 million km per year by 2021. This results in Common Air Contaminants (CACs), such as carbon monoxide, nitrogen dioxide, ozone and particulate matter, being reduced by 355.5 tonnes per year, of which 43.5 tonnes are smog-forming pollutants. The 355.5 tonnes per year total represents a 0.5% reduction of CACs in the Northeast Sector.
Section 3 – Potential Societal Benefits Page 34
Evergreen Light Rail Transit Project Project Definition Phase – Business Case October 12, 2006
Based on the estimated reduction in vehicle km driven following the introduction of the Evergreen Line, and allowing for the need to generate electricity to power the LRT system, the estimated net reduction of Greenhouse Gas (GHG) emissions in 2021 is 10,592 tonnes. This net reduction in GHG represents a 0.03% reduction in the estimated total GHG production in the Lower Fraer valley in 2021. The amount of tree canopy along the corridor will be more than doubled. The line runs through an existing transportation corridor, therefore, the effect on waterways and green zones is minimal. 3.6 SUPPORTS SENIOR GOVERNMENT INITIATIVES The Evergreen Line is one of the investments that has been identified by the province, the region and gateway industries as part of the Gateway Program to alleviate congestion, provide travel time savings and increase transportation choice to improve the movement of people and goods in the region.
Section 3 – Potential Societal Benefits Page 35
Evergreen Light Rail Transit Project Project Definition Phase – Business Case October 12, 2006
4 OPTION GENERATION 4.1 INTRODUCTION The introduction of a rapid transit system to serve Port Moody and Coquitlam Town Centre was envisioned as part of the GVRD, LRSP and supporting document, Transportation 2021 Medium-Range Transportation Plan in the mid 1990’s. Specifically, the LRSP vision called for a connection between New Westminster and the Coquitlam Regional Town Centre. In 2000 and 2001 the provincial government constructed the Millennium Line, which is comprised of an eastern part of the Central Broadway to Lougheed Town Centre line and a southern part of the New Westminster to Coquitlam Regional Town Centre line. This left only the northern section of the line between Lougheed Town Centre and Coquitlam Town Centre. 4.2 ALTERNATIVES STUDY In 2003, the TransLink Board called for a comprehensive study to assess the options to complete the northern section of the line to connect Lougheed Town Centre and Coquitlam Town Centre. As requested by the TransLink Board, this rapid transit alternatives study was to be overseen by a Steering Committee comprised of both TransLink and GVRD staff.19
The study examined possible corridor as well as rapid transit technologies. Two corridors were considered; namely, • Northwest Corridor – This corridor runs north from Lougheed Town Centre via
North Road and Clarke Road, through Port Moody to Coquitlam Town Centre. • Southwest Corridor – This corridor extended from Braid or Sapperton SkyTrain
stations via Lougheed Highway and the CP Rail corridor to Coquitlam Town Centre.
Within each of these corridors different alignments were examined based on the feasibility and appropriateness for the type of technology being considered. Alignments along the southern route followed Lougheed Highway and the rail corridor while alignments considered for the northern route included a combination of the CP Rail corridor, St. Johns and Barnet, as well as Guildford Way.
19 Northeast Sector Transit Alternatives Project, Phase 2 – Evaluation of Rapid Transit Alternatives, Executive Summary, IBI Group, March 31, 2004
Section 4 – Option Generation Page 36
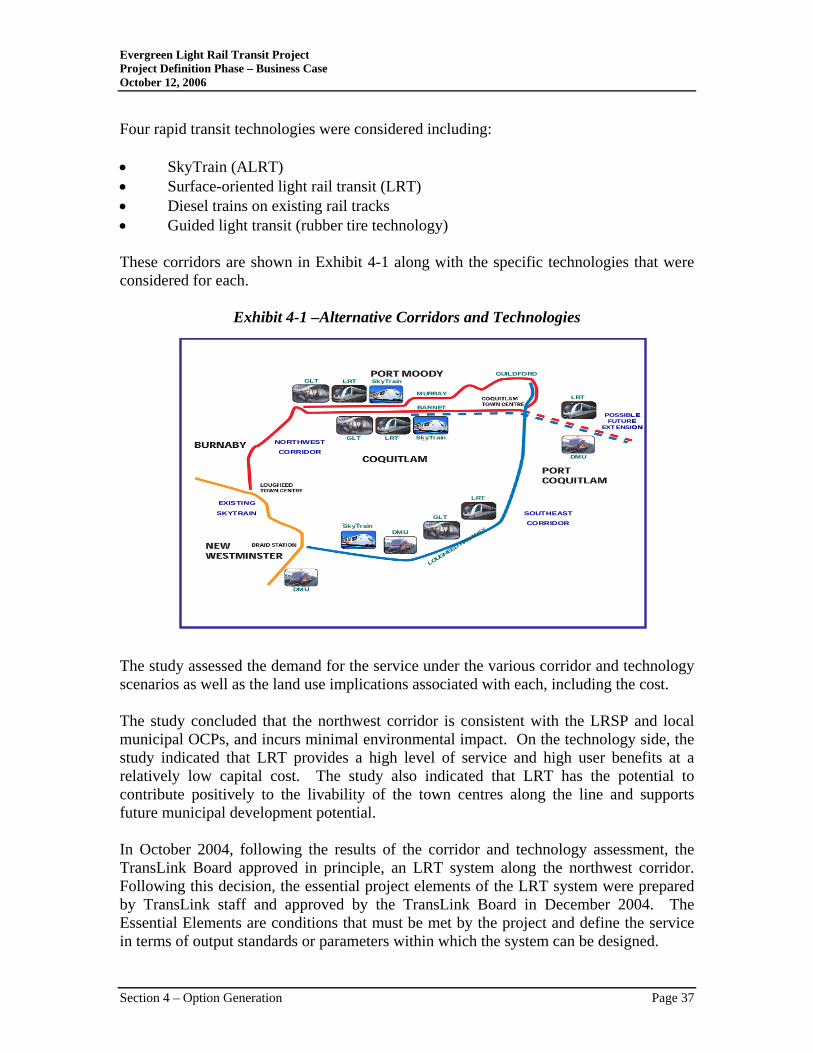
Evergreen Light Rail Transit Project Project Definition Phase – Business Case October 12, 2006
Four rapid transit technologies were considered including: • SkyTrain (ALRT) • Surface-oriented light rail transit (LRT) • Diesel trains on existing rail tracks • Guided light transit (rubber tire technology) These corridors are shown in Exhibit 4-1 along with the specific technologies that were considered for each.
Exhibit 4-1 –Alternative Corridors and Technologies
NORTHWEST
CORRIDOR
EXISTING
SKYTRAIN
POSSIBLE FUTURE
EXTENSION
SOUTHEAST
CORRIDOR
GUILDFORD
MURRAY
LOUGHEED HIGHWAY
BARNET
GLT LRT
GLT LRT SkyTrain
SkyTrain
LRT
GLT
DMU
DMU
DMU
LRT
SkyTrain
NORTHWEST
CORRIDOR
EXISTING
SKYTRAIN
POSSIBLE FUTURE
EXTENSION
SOUTHEAST
CORRIDOR
GUILDFORD
MURRAY
LOUGHEED HIGHWAY
BARNET
GLT LRT
GLT LRT SkyTrain
SkyTrain
LRT
GLT
DMU
DMU
DMU
LRT
SkyTrain
The study assessed the demand for the service under the various corridor and technology scenarios as well as the land use implications associated with each, including the cost. The study concluded that the northwest corridor is consistent with the LRSP and local municipal OCPs, and incurs minimal environmental impact. On the technology side, the study indicated that LRT provides a high level of service and high user benefits at a relatively low capital cost. The study also indicated that LRT has the potential to contribute positively to the livability of the town centres along the line and supports future municipal development potential. In October 2004, following the results of the corridor and technology assessment, the TransLink Board approved in principle, an LRT system along the northwest corridor. Following this decision, the essential project elements of the LRT system were prepared by TransLink staff and approved by the TransLink Board in December 2004. The Essential Elements are conditions that must be met by the project and define the service in terms of output standards or parameters within which the system can be designed.
Section 4 – Option Generation Page 37
Evergreen Light Rail Transit Project Project Definition Phase – Business Case October 12, 2006
In March 2005, the TransLink Board approved funding for the Evergreen Project Definition Phase with a budget of $5 million, including a $2 million contribution from the Province. Two of the main objectives of this phase included the completion of the preliminary design of the preferred alignment and the preparation of revised cost estimate. The preferred design and project cost estimates are discussed in Section 5 of this report. 4.3 STATUS QUO The rapid transit alternatives study did not explicitly compare the alternative options to the status quo. In 2002, TransLink introduced the 97 B-Line bus service along the corridor to offer an enhanced level of service with more competitive travel times as compared to the local bus service. With the long-term plan to implement rapid transit along the corridor, the frequent service provided by the 97 B-Line helps to build transit ridership and establish the transit corridor. When the Evergreen Line opens in 2011, the 97 B-Line service will be discontinued. At present the 97 B-Line provides service from Coquitlam Centre to Lougheed Town Centre via Guildford Way resulting in a slightly longer route than is proposed for LRT between Douglas College and Lougheed Town Centre via Coquitlam Town Centre and along the Barnet/St. Johns corridor. The operating characteristics are summarized in Table 4-1. 97 B-Line service operates in mixed traffic and does not receive any signal priority, making it subject to traffic congestion, as is reflected in the peak-hour travel time variations shown in the table. The current peak hour capacity, with service every 7.5 minutes, is 425 passengers per hour or 850 passengers for both directions. Adding buses could increase the capacity somewhat, but with limited benefits for a number of reasons: buses continue to be subject to the same delays noted above; service becomes inefficient as buses cluster causing excessive crowding in leading buses and underutilization in following buses; and, delays resulting from buses competing for space at bus stops.
Section 4 – Option Generation Page 38
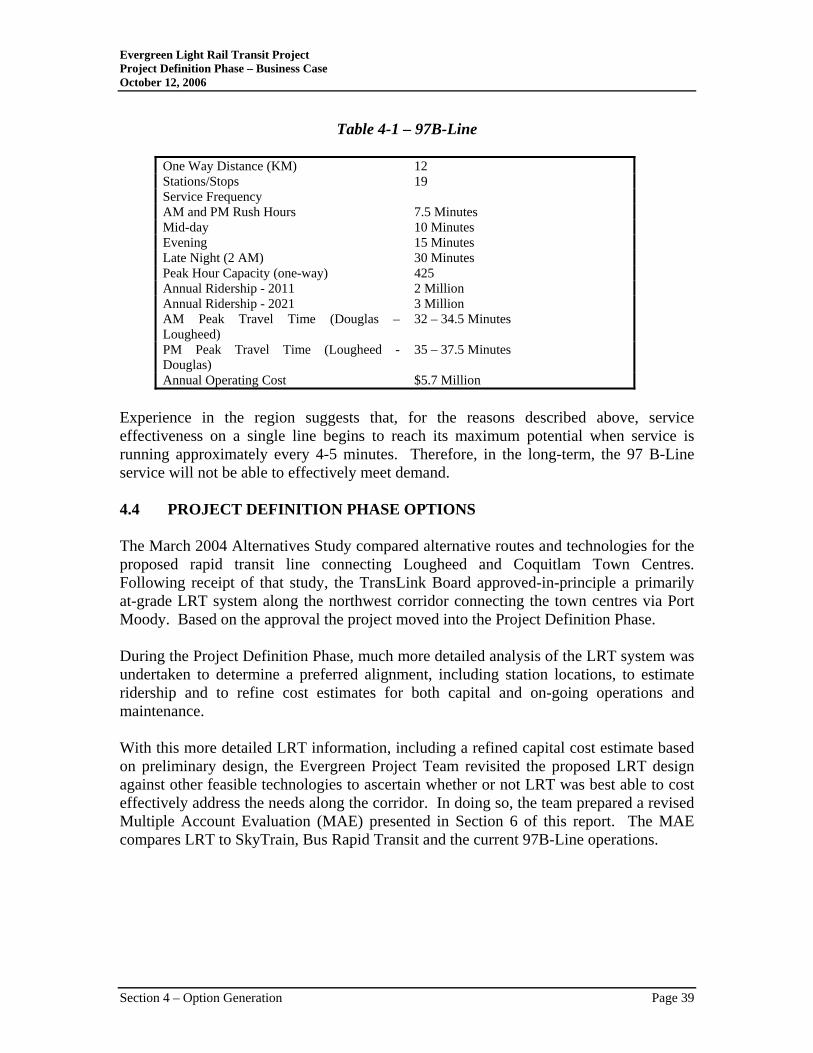
Evergreen Light Rail Transit Project Project Definition Phase – Business Case October 12, 2006
Table 4-1 – 97B-Line
One Way Distance (KM) 12 Stations/Stops 19 Service Frequency AM and PM Rush Hours 7.5 Minutes Mid-day 10 Minutes Evening 15 Minutes Late Night (2 AM) 30 Minutes Peak Hour Capacity (one-way) 425 Annual Ridership - 2011 2 Million Annual Ridership - 2021 3 Million AM Peak Travel Time (Douglas – Lougheed)
32 – 34.5 Minutes
PM Peak Travel Time (Lougheed - Douglas)
35 – 37.5 Minutes
Annual Operating Cost $5.7 Million Experience in the region suggests that, for the reasons described above, service effectiveness on a single line begins to reach its maximum potential when service is running approximately every 4-5 minutes. Therefore, in the long-term, the 97 B-Line service will not be able to effectively meet demand. 4.4 PROJECT DEFINITION PHASE OPTIONS The March 2004 Alternatives Study compared alternative routes and technologies for the proposed rapid transit line connecting Lougheed and Coquitlam Town Centres. Following receipt of that study, the TransLink Board approved-in-principle a primarily at-grade LRT system along the northwest corridor connecting the town centres via Port Moody. Based on the approval the project moved into the Project Definition Phase. During the Project Definition Phase, much more detailed analysis of the LRT system was undertaken to determine a preferred alignment, including station locations, to estimate ridership and to refine cost estimates for both capital and on-going operations and maintenance. With this more detailed LRT information, including a refined capital cost estimate based on preliminary design, the Evergreen Project Team revisited the proposed LRT design against other feasible technologies to ascertain whether or not LRT was best able to cost effectively address the needs along the corridor. In doing so, the team prepared a revised Multiple Account Evaluation (MAE) presented in Section 6 of this report. The MAE compares LRT to SkyTrain, Bus Rapid Transit and the current 97B-Line operations.
Section 4 – Option Generation Page 39
Evergreen Light Rail Transit Project Project Definition Phase – Business Case October 12, 2006
4.5 ALTERNATIVES TO TRANSIT The proposed LRT system will increase the capacity of the corridor without diminishing the current road capacity and, in doing so, will support municipal and regional efforts to manage growth, support economic development and address increasing traffic congestion. Given the geography of Port Moody, bounded to the north by the Burrard Inlet and the south by the Miller Ravine, and existing development along the corridor, opportunities to expand the capacity of the existing roads or build additional roadways to meet the long-term needs of the region are extremely limited. As a result, adding additional roadway width was not included in the evaluation of viable options. In addition to this physical constraint, adding traffic lanes to address congestion does not support the GVRD’s regional objectives to protect green zones, build complete communities, achieve a compact metropolitan region and increase transportation choice.
Section 4 – Option Generation Page 40
Evergreen Light Rail Transit Project Project Definition Phase – Business Case October 12, 2006
5 PROJECT DESCRIPTION For planning and design purposes, the alignment was divided into five segments based on municipal boundaries, construction methods, and the urban fabric or character of the adjacent neighbourhood. These segments are illustrated in the Open House materials provided as an appendix to this document: • Segment 1 – North Road • Segment 2 – Clarke Road • Segment 3 – St. Johns Street • Segment 4 – Barnet Highway • Segment 5 – Pinetree Way Design decisions leading to the selection of a preferred design, including the alignment and station locations, have been based on technical analysis as well as input from the public, municipalities and other stakeholders. The preferred design within each segment is described later in this Section. 5.1 DESIGN PRINCIPLES Working towards the goal of the Evergreen Line, to increase transportation choice in the Northeast Sector and the region while providing significant economic, environmental and social benefits, the design set out to achieve the following principles: • Transportation – The Evergreen Line is the basis for developing a transportation
network to increase choice and support a reduction in auto use. • Urban Development – The Evergreen Line should support the creation of
complete communities and a compact region. It should support existing development and “city-shaping.”
• People – The Evergreen Line should support the creation of identifiable, and
vibrant, pedestrian friendly communities with a fully accessible system with station areas as focal points.
• Economics – The Evergreen Line should be cost effective and contribute to
economic vitality of the community and support a good business environment. • Environment – The Evergreen Line should support environmental sustainability
and ensure that the design meets wide environmental objectives.
Section 5 – Project Description Page 40
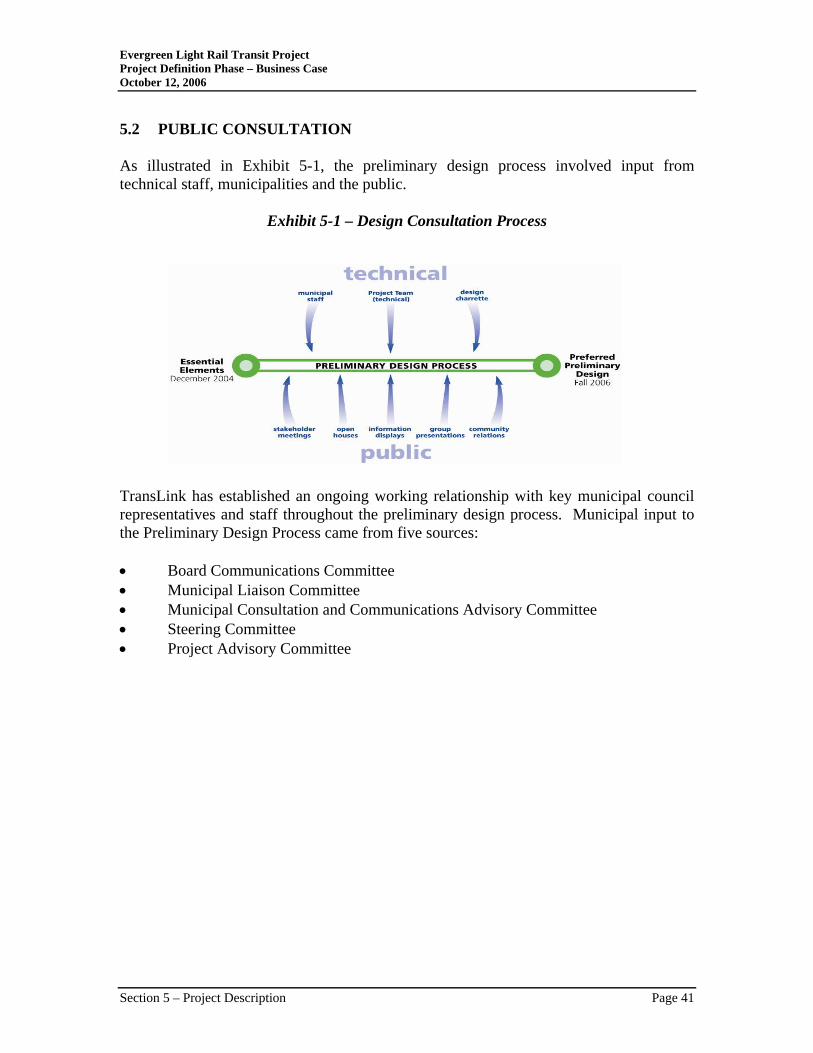
Evergreen Light Rail Transit Project Project Definition Phase – Business Case October 12, 2006
5.2 PUBLIC CONSULTATION As illustrated in Exhibit 5-1, the preliminary design process involved input from technical staff, municipalities and the public.
Exhibit 5-1 – Design Consultation Process TransLink has established an ongoing working relationship with key municipal council representatives and staff throughout the preliminary design process. Municipal input to the Preliminary Design Process came from five sources: • Board Communications Committee • Municipal Liaison Committee • Municipal Consultation and Communications Advisory Committee • Steering Committee • Project Advisory Committee
Section 5 – Project Description Page 41
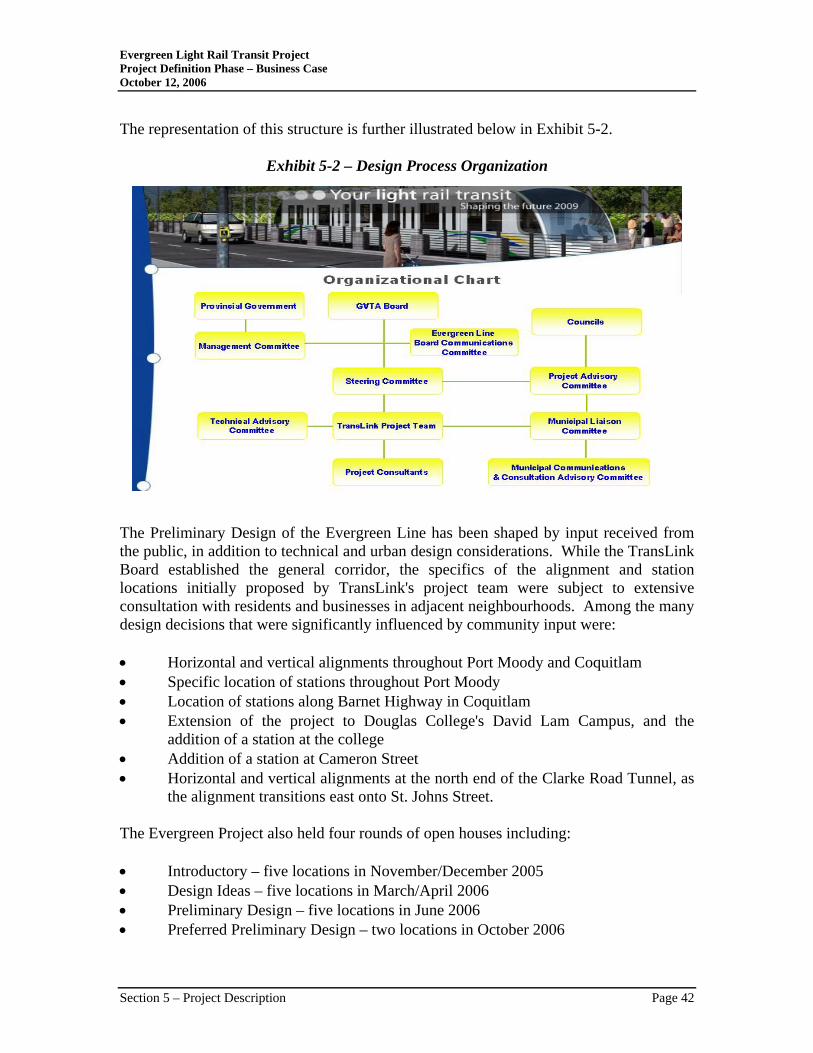
Evergreen Light Rail Transit Project Project Definition Phase – Business Case October 12, 2006
The representation of this structure is further illustrated below in Exhibit 5-2.
Exhibit 5-2 – Design Process Organization The Preliminary Design of the Evergreen Line has been shaped by input received from the public, in addition to technical and urban design considerations. While the TransLink Board established the general corridor, the specifics of the alignment and station locations initially proposed by TransLink's project team were subject to extensive consultation with residents and businesses in adjacent neighbourhoods. Among the many design decisions that were significantly influenced by community input were: • Horizontal and vertical alignments throughout Port Moody and Coquitlam • Specific location of stations throughout Port Moody • Location of stations along Barnet Highway in Coquitlam • Extension of the project to Douglas College's David Lam Campus, and the
addition of a station at the college • Addition of a station at Cameron Street • Horizontal and vertical alignments at the north end of the Clarke Road Tunnel, as
the alignment transitions east onto St. Johns Street. The Evergreen Project also held four rounds of open houses including: • Introductory – five locations in November/December 2005 • Design Ideas – five locations in March/April 2006 • Preliminary Design – five locations in June 2006 • Preferred Preliminary Design – two locations in October 2006
Section 5 – Project Description Page 42
Evergreen Light Rail Transit Project Project Definition Phase – Business Case October 12, 2006
Residents are informed of these events via mail outs (27,000 letters sent to residents and businesses 500 meters on either side of the Line), approximately 1,500 emails and letters to individuals on project data base, TransLink website and Buzzer20, and advertisements in local newspapers. Over 2000 people attended the first three rounds of Open Houses (Round One – 750; Round Two – 725; Round Three – 575). 5.3 THE ALIGNMENT 5.3.1 OVERVIEW At Lougheed Town Centre, the Evergreen Line features an elevated station integrated with the Lougheed Town Centre SkyTrain Station. From this station, the line remains elevated, passing over Austin Avenue and heading north along the centre of North Road, touching down to street-level just south of Cochrane Street. A station will be located at Cameron Street. The alignment then continues at street-level in a centre median with the next station located in front of the existing Burquitlam Plaza. This location has been identified as a mixed use (retail and residential) Transit-Oriented Development, with activity concentrated around the new station. Beyond this station the alignment crosses Como Lake Avenue and then enters a 2 km tunnel on Clarke Road near Morrison Avenue, emerging in Port Moody at the bottom of the hill, in the centre of Clarke Road west of Barnet/Albert Street. From the Port Moody tunnel portal, the Evergreen Line continues eastbound at street-level along the centre of St. Johns Street, with stations located at Albert Street/Barnet Highway (at the tunnel portal) serving the local neighbourhood, Port Moody Secondary School and nearby development sites; Moody Street, serving the historic district and Moody Elementary School and providing an interchange with West Coast Express and local buses; Buller Street, serving the local neighbourhood including Moody Middle School, and the new residential development accessed by the pedestrian overpass; and Ioco Road serving existing and planned developments such as Newport Village and Eagle Ridge hospital. From the Ioco Road intersection, the Evergreen Line continues at street-level in a centre median along Barnet Highway, with a station located at Lansdowne. Provision for a future station is also made at Falcon. Beyond Lansdowne Station, the line drops below grade, continuing to Coquitlam Exchange, a major transit interchange and Park & Ride facility linking the Evergreen Line with a wide range of local bus services and West Coast Express. A below grade, open-air, terraced station is located on the northern edge of the Coquitlam Exchange site. 20 A bi-weekly on-board TransLink publication that informs transit customers about transit-related issues such as new and changed services, public consultation events, fare information, and policy reminders. More than one million copies of the Buzzer are distributed each year.
Section 5 – Project Description Page 43
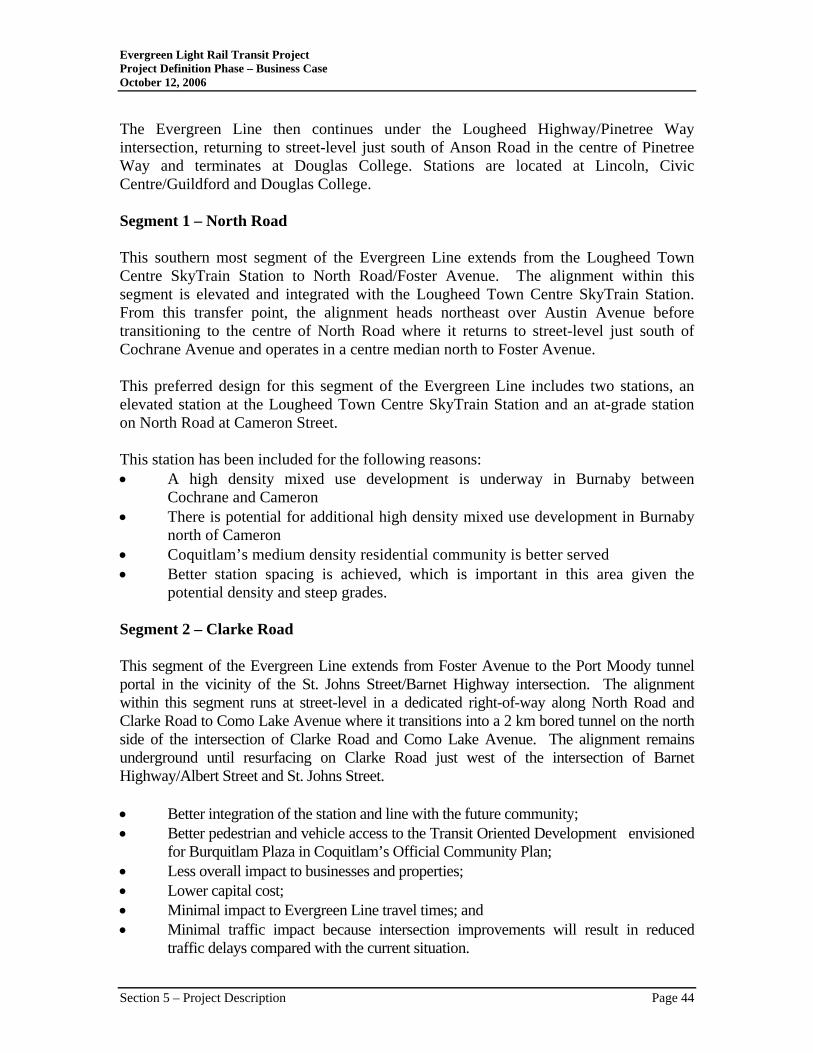
Evergreen Light Rail Transit Project Project Definition Phase – Business Case October 12, 2006
The Evergreen Line then continues under the Lougheed Highway/Pinetree Way intersection, returning to street-level just south of Anson Road in the centre of Pinetree Way and terminates at Douglas College. Stations are located at Lincoln, Civic Centre/Guildford and Douglas College. Segment 1 – North Road This southern most segment of the Evergreen Line extends from the Lougheed Town Centre SkyTrain Station to North Road/Foster Avenue. The alignment within this segment is elevated and integrated with the Lougheed Town Centre SkyTrain Station. From this transfer point, the alignment heads northeast over Austin Avenue before transitioning to the centre of North Road where it returns to street-level just south of Cochrane Avenue and operates in a centre median north to Foster Avenue. This preferred design for this segment of the Evergreen Line includes two stations, an elevated station at the Lougheed Town Centre SkyTrain Station and an at-grade station on North Road at Cameron Street. This station has been included for the following reasons: • A high density mixed use development is underway in Burnaby between
Cochrane and Cameron • There is potential for additional high density mixed use development in Burnaby
north of Cameron • Coquitlam’s medium density residential community is better served • Better station spacing is achieved, which is important in this area given the
potential density and steep grades. Segment 2 – Clarke Road This segment of the Evergreen Line extends from Foster Avenue to the Port Moody tunnel portal in the vicinity of the St. Johns Street/Barnet Highway intersection. The alignment within this segment runs at street-level in a dedicated right-of-way along North Road and Clarke Road to Como Lake Avenue where it transitions into a 2 km bored tunnel on the north side of the intersection of Clarke Road and Como Lake Avenue. The alignment remains underground until resurfacing on Clarke Road just west of the intersection of Barnet Highway/Albert Street and St. Johns Street. • Better integration of the station and line with the future community; • Better pedestrian and vehicle access to the Transit Oriented Development envisioned
for Burquitlam Plaza in Coquitlam’s Official Community Plan; • Less overall impact to businesses and properties; • Lower capital cost; • Minimal impact to Evergreen Line travel times; and • Minimal traffic impact because intersection improvements will result in reduced
traffic delays compared with the current situation.
Section 5 – Project Description Page 44
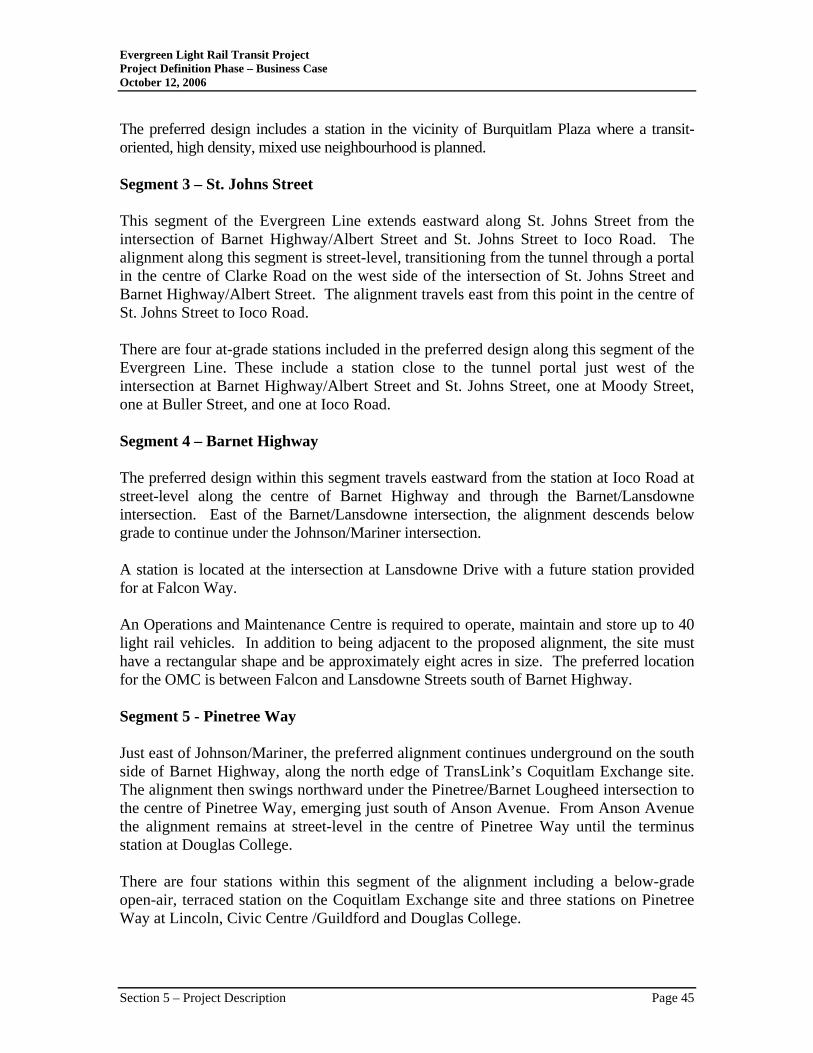
Evergreen Light Rail Transit Project Project Definition Phase – Business Case October 12, 2006
The preferred design includes a station in the vicinity of Burquitlam Plaza where a transit-oriented, high density, mixed use neighbourhood is planned. Segment 3 – St. Johns Street This segment of the Evergreen Line extends eastward along St. Johns Street from the intersection of Barnet Highway/Albert Street and St. Johns Street to Ioco Road. The alignment along this segment is street-level, transitioning from the tunnel through a portal in the centre of Clarke Road on the west side of the intersection of St. Johns Street and Barnet Highway/Albert Street. The alignment travels east from this point in the centre of St. Johns Street to Ioco Road. There are four at-grade stations included in the preferred design along this segment of the Evergreen Line. These include a station close to the tunnel portal just west of the intersection at Barnet Highway/Albert Street and St. Johns Street, one at Moody Street, one at Buller Street, and one at Ioco Road. Segment 4 – Barnet Highway The preferred design within this segment travels eastward from the station at Ioco Road at street-level along the centre of Barnet Highway and through the Barnet/Lansdowne intersection. East of the Barnet/Lansdowne intersection, the alignment descends below grade to continue under the Johnson/Mariner intersection. A station is located at the intersection at Lansdowne Drive with a future station provided for at Falcon Way. An Operations and Maintenance Centre is required to operate, maintain and store up to 40 light rail vehicles. In addition to being adjacent to the proposed alignment, the site must have a rectangular shape and be approximately eight acres in size. The preferred location for the OMC is between Falcon and Lansdowne Streets south of Barnet Highway. Segment 5 - Pinetree Way Just east of Johnson/Mariner, the preferred alignment continues underground on the south side of Barnet Highway, along the north edge of TransLink’s Coquitlam Exchange site. The alignment then swings northward under the Pinetree/Barnet Lougheed intersection to the centre of Pinetree Way, emerging just south of Anson Avenue. From Anson Avenue the alignment remains at street-level in the centre of Pinetree Way until the terminus station at Douglas College. There are four stations within this segment of the alignment including a below-grade open-air, terraced station on the Coquitlam Exchange site and three stations on Pinetree Way at Lincoln, Civic Centre /Guildford and Douglas College.
Section 5 – Project Description Page 45
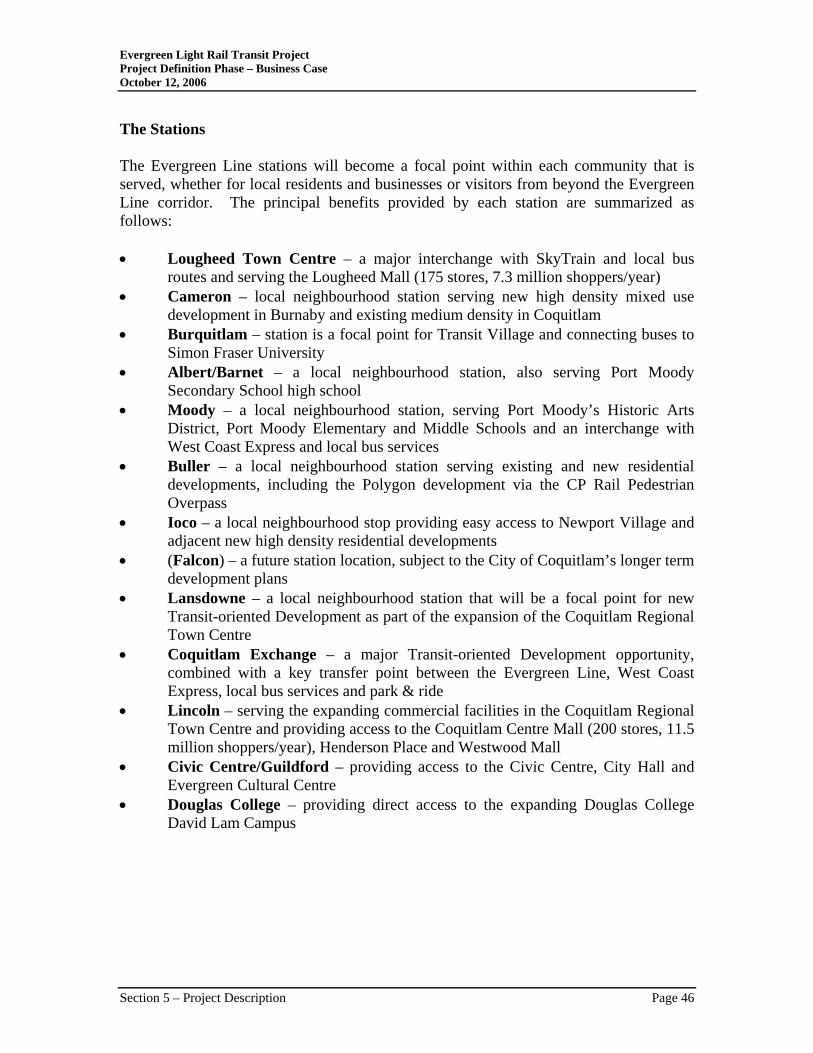
Evergreen Light Rail Transit Project Project Definition Phase – Business Case October 12, 2006
The Stations The Evergreen Line stations will become a focal point within each community that is served, whether for local residents and businesses or visitors from beyond the Evergreen Line corridor. The principal benefits provided by each station are summarized as follows: • Lougheed Town Centre – a major interchange with SkyTrain and local bus
routes and serving the Lougheed Mall (175 stores, 7.3 million shoppers/year) • Cameron – local neighbourhood station serving new high density mixed use
development in Burnaby and existing medium density in Coquitlam • Burquitlam – station is a focal point for Transit Village and connecting buses to
Simon Fraser University • Albert/Barnet – a local neighbourhood station, also serving Port Moody
Secondary School high school • Moody – a local neighbourhood station, serving Port Moody’s Historic Arts
District, Port Moody Elementary and Middle Schools and an interchange with West Coast Express and local bus services
• Buller – a local neighbourhood station serving existing and new residential developments, including the Polygon development via the CP Rail Pedestrian Overpass
• Ioco – a local neighbourhood stop providing easy access to Newport Village and adjacent new high density residential developments
• (Falcon) – a future station location, subject to the City of Coquitlam’s longer term development plans
• Lansdowne – a local neighbourhood station that will be a focal point for new Transit-oriented Development as part of the expansion of the Coquitlam Regional Town Centre
• Coquitlam Exchange – a major Transit-oriented Development opportunity, combined with a key transfer point between the Evergreen Line, West Coast Express, local bus services and park & ride
• Lincoln – serving the expanding commercial facilities in the Coquitlam Regional Town Centre and providing access to the Coquitlam Centre Mall (200 stores, 11.5 million shoppers/year), Henderson Place and Westwood Mall
• Civic Centre/Guildford – providing access to the Civic Centre, City Hall and Evergreen Cultural Centre
• Douglas College – providing direct access to the expanding Douglas College David Lam Campus
Section 5 – Project Description Page 46
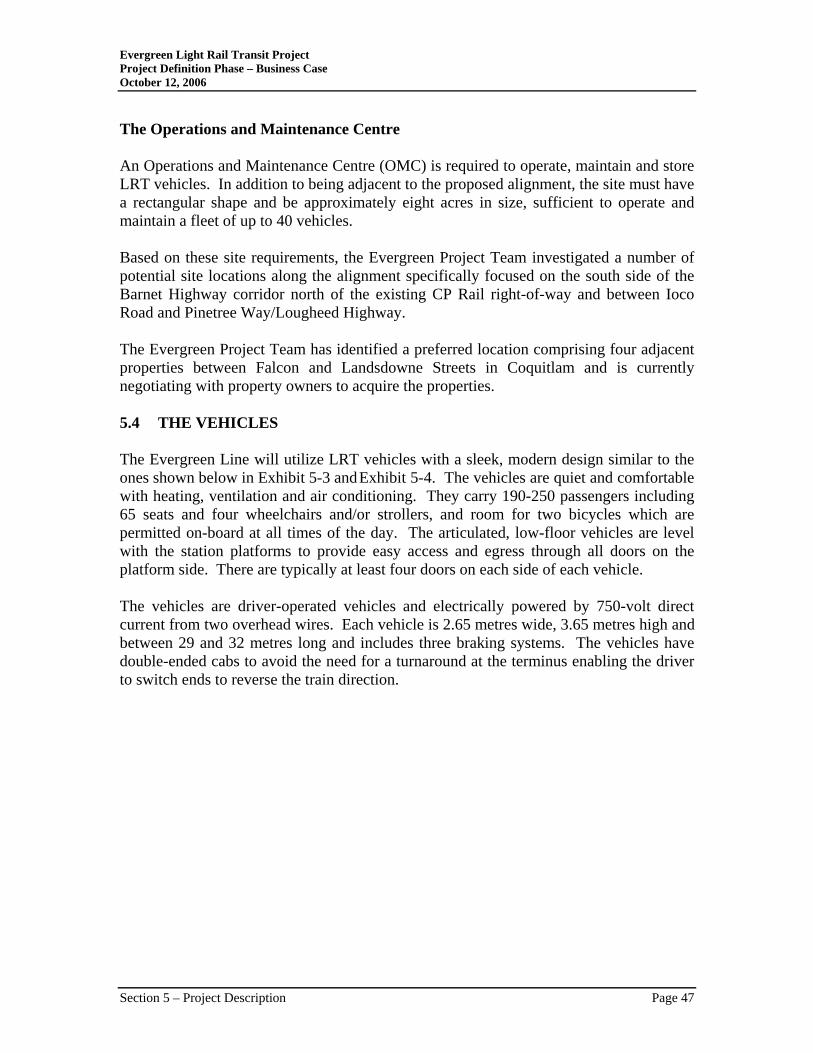
Evergreen Light Rail Transit Project Project Definition Phase – Business Case October 12, 2006
The Operations and Maintenance Centre An Operations and Maintenance Centre (OMC) is required to operate, maintain and store LRT vehicles. In addition to being adjacent to the proposed alignment, the site must have a rectangular shape and be approximately eight acres in size, sufficient to operate and maintain a fleet of up to 40 vehicles. Based on these site requirements, the Evergreen Project Team investigated a number of potential site locations along the alignment specifically focused on the south side of the Barnet Highway corridor north of the existing CP Rail right-of-way and between Ioco Road and Pinetree Way/Lougheed Highway. The Evergreen Project Team has identified a preferred location comprising four adjacent properties between Falcon and Landsdowne Streets in Coquitlam and is currently negotiating with property owners to acquire the properties. 5.4 THE VEHICLES The Evergreen Line will utilize LRT vehicles with a sleek, modern design similar to the ones shown below in Exhibit 5-3 and Exhibit 5-4. The vehicles are quiet and comfortable with heating, ventilation and air conditioning. They carry 190-250 passengers including 65 seats and four wheelchairs and/or strollers, and room for two bicycles which are permitted on-board at all times of the day. The articulated, low-floor vehicles are level with the station platforms to provide easy access and egress through all doors on the platform side. There are typically at least four doors on each side of each vehicle. The vehicles are driver-operated vehicles and electrically powered by 750-volt direct current from two overhead wires. Each vehicle is 2.65 metres wide, 3.65 metres high and between 29 and 32 metres long and includes three braking systems. The vehicles have double-ended cabs to avoid the need for a turnaround at the terminus enabling the driver to switch ends to reverse the train direction.
Section 5 – Project Description Page 47
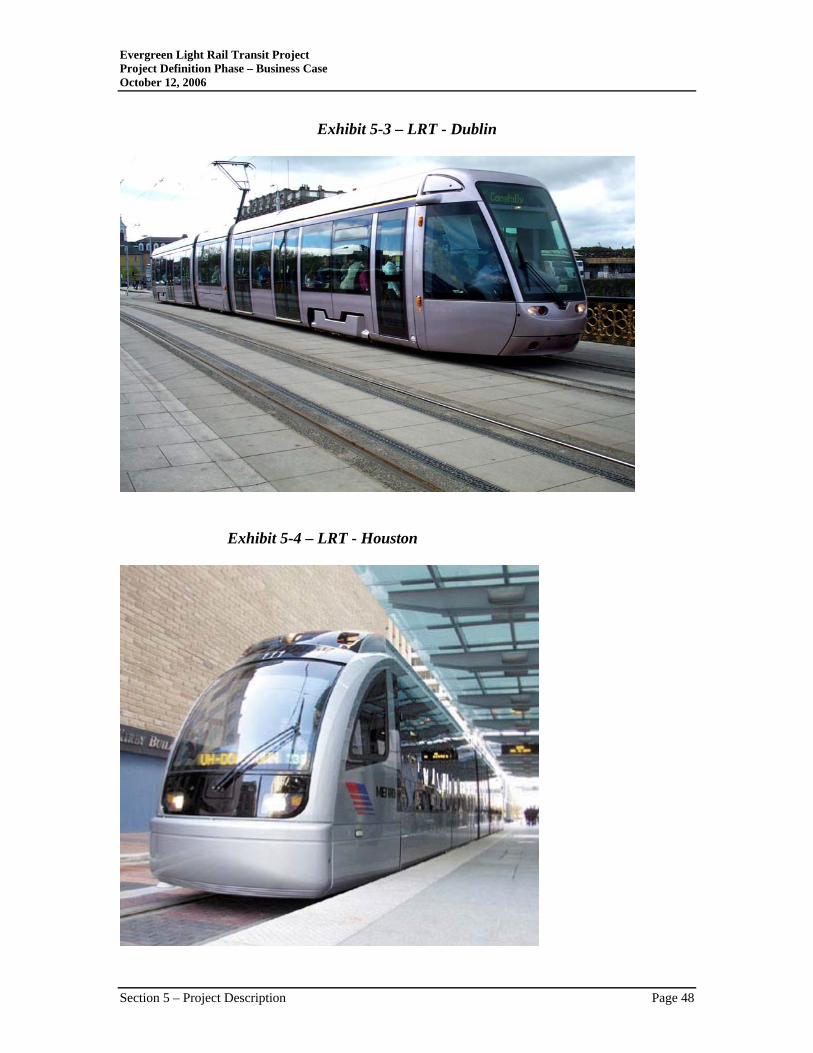
Evergreen Light Rail Transit Project Project Definition Phase – Business Case October 12, 2006
Exhibit 5-3 – LRT - Dublin
Exhibit 5-4 – LRT - Houston
Section 5 – Project Description Page 48
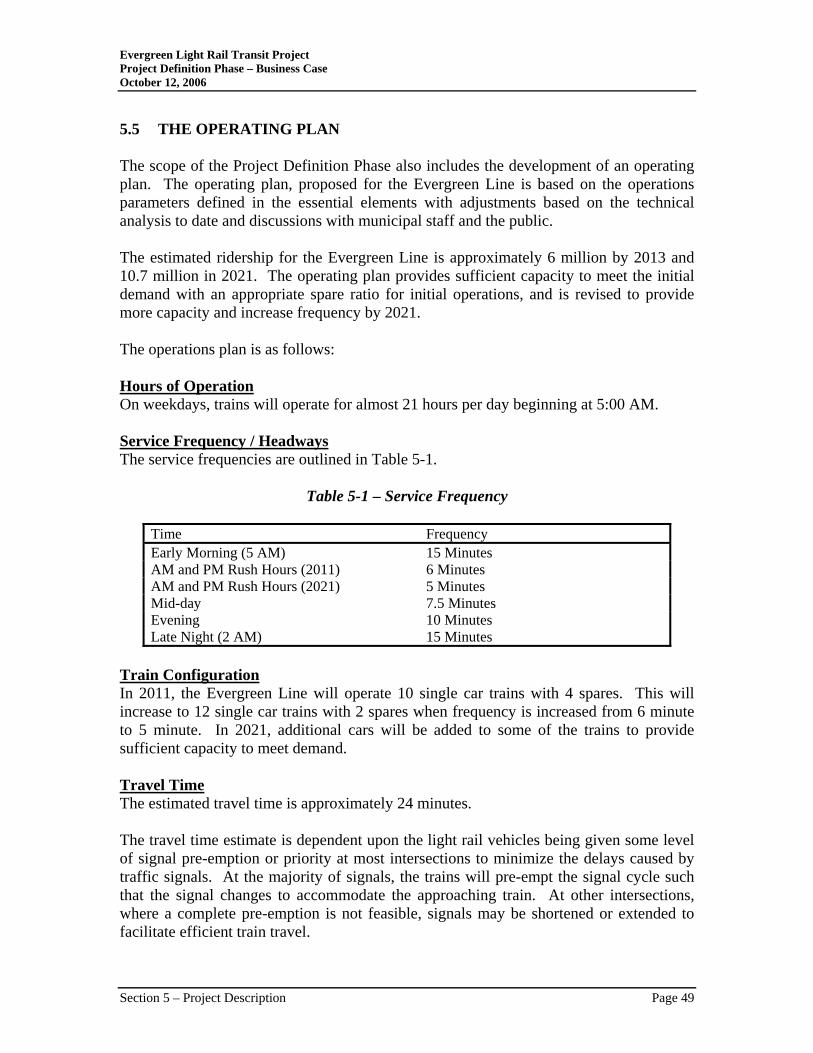
Evergreen Light Rail Transit Project Project Definition Phase – Business Case October 12, 2006
5.5 THE OPERATING PLAN The scope of the Project Definition Phase also includes the development of an operating plan. The operating plan, proposed for the Evergreen Line is based on the operations parameters defined in the essential elements with adjustments based on the technical analysis to date and discussions with municipal staff and the public. The estimated ridership for the Evergreen Line is approximately 6 million by 2013 and 10.7 million in 2021. The operating plan provides sufficient capacity to meet the initial demand with an appropriate spare ratio for initial operations, and is revised to provide more capacity and increase frequency by 2021. The operations plan is as follows: Hours of Operation On weekdays, trains will operate for almost 21 hours per day beginning at 5:00 AM. Service Frequency / Headways The service frequencies are outlined in Table 5-1.
Table 5-1 – Service Frequency
Time Frequency Early Morning (5 AM) 15 Minutes AM and PM Rush Hours (2011) 6 Minutes AM and PM Rush Hours (2021) 5 Minutes Mid-day 7.5 Minutes Evening 10 Minutes Late Night (2 AM) 15 Minutes
Train Configuration In 2011, the Evergreen Line will operate 10 single car trains with 4 spares. This will increase to 12 single car trains with 2 spares when frequency is increased from 6 minute to 5 minute. In 2021, additional cars will be added to some of the trains to provide sufficient capacity to meet demand. Travel Time The estimated travel time is approximately 24 minutes. The travel time estimate is dependent upon the light rail vehicles being given some level of signal pre-emption or priority at most intersections to minimize the delays caused by traffic signals. At the majority of signals, the trains will pre-empt the signal cycle such that the signal changes to accommodate the approaching train. At other intersections, where a complete pre-emption is not feasible, signals may be shortened or extended to facilitate efficient train travel.
Section 5 – Project Description Page 49
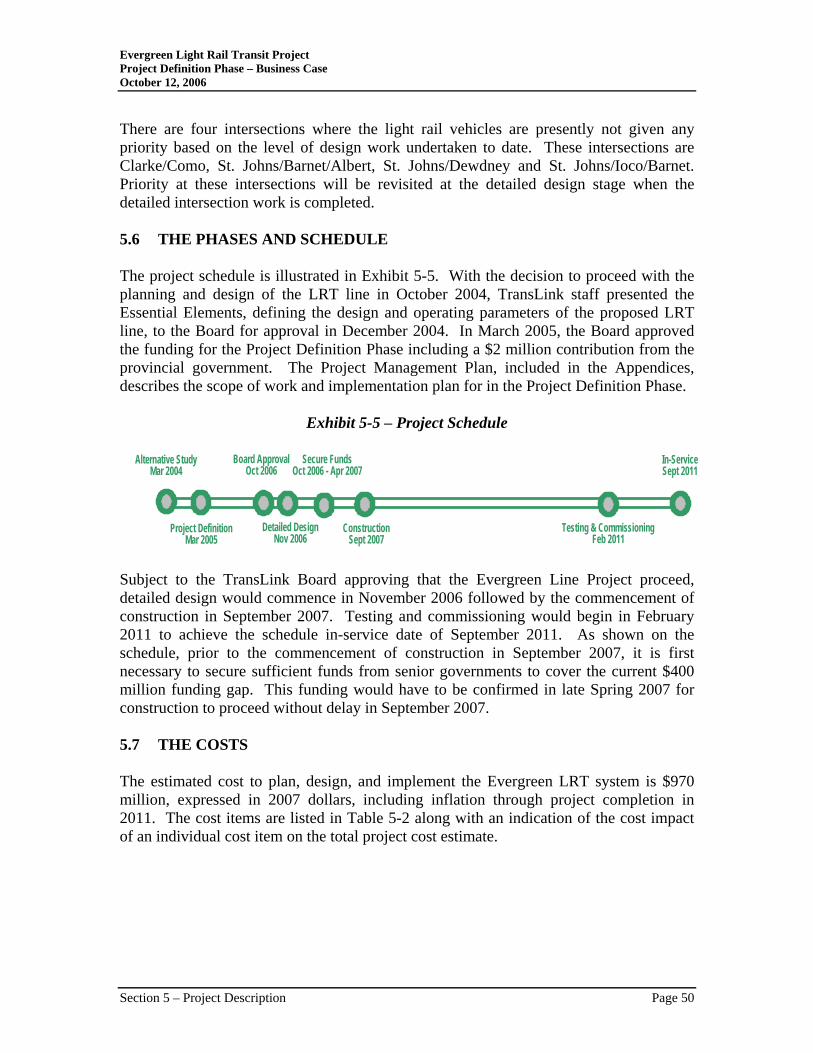
Evergreen Light Rail Transit Project Project Definition Phase – Business Case October 12, 2006
There are four intersections where the light rail vehicles are presently not given any priority based on the level of design work undertaken to date. These intersections are Clarke/Como, St. Johns/Barnet/Albert, St. Johns/Dewdney and St. Johns/Ioco/Barnet. Priority at these intersections will be revisited at the detailed design stage when the detailed intersection work is completed. 5.6 THE PHASES AND SCHEDULE The project schedule is illustrated in Exhibit 5-5. With the decision to proceed with the planning and design of the LRT line in October 2004, TransLink staff presented the Essential Elements, defining the design and operating parameters of the proposed LRT line, to the Board for approval in December 2004. In March 2005, the Board approved the funding for the Project Definition Phase including a $2 million contribution from the provincial government. The Project Management Plan, included in the Appendices, describes the scope of work and implementation plan for in the Project Definition Phase.
Exhibit 5-5 – Project Schedule
Board ApprovalOct 2006
Detailed DesignNov 2006
ConstructionSept 2007
Testing & CommissioningFeb 2011
In-ServiceSept 2011
Secure FundsOct 2006 - Apr 2007
Project DefinitionMar 2005
Alternative StudyMar 2004
Subject to the TransLink Board approving that the Evergreen Line Project proceed, detailed design would commence in November 2006 followed by the commencement of construction in September 2007. Testing and commissioning would begin in February 2011 to achieve the schedule in-service date of September 2011. As shown on the schedule, prior to the commencement of construction in September 2007, it is first necessary to secure sufficient funds from senior governments to cover the current $400 million funding gap. This funding would have to be confirmed in late Spring 2007 for construction to proceed without delay in September 2007. 5.7 THE COSTS The estimated cost to plan, design, and implement the Evergreen LRT system is $970 million, expressed in 2007 dollars, including inflation through project completion in 2011. The cost items are listed in Table 5-2 along with an indication of the cost impact of an individual cost item on the total project cost estimate.
Section 5 – Project Description Page 50
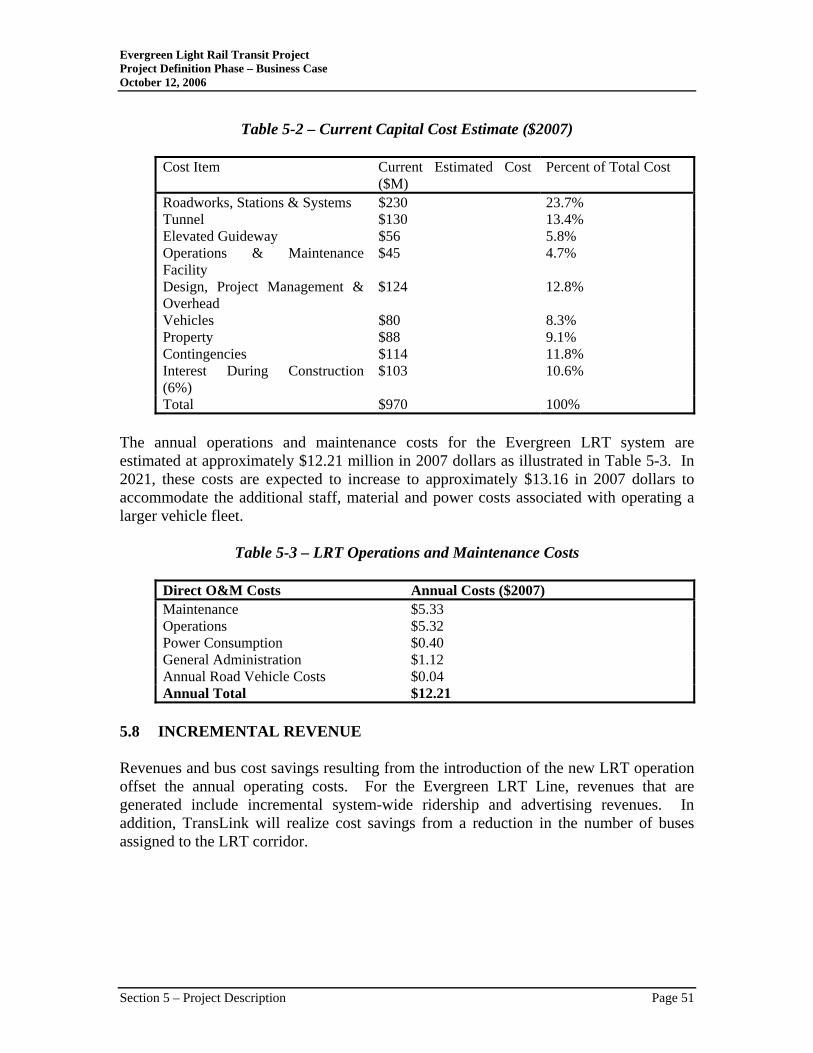
Evergreen Light Rail Transit Project Project Definition Phase – Business Case October 12, 2006
Table 5-2 – Current Capital Cost Estimate ($2007)
Cost Item Current Estimated Cost ($M)
Percent of Total Cost
Roadworks, Stations & Systems $230 23.7% Tunnel $130 13.4% Elevated Guideway $56 5.8% Operations & Maintenance Facility
$45 4.7%
Design, Project Management & Overhead
$124 12.8%
Vehicles $80 8.3% Property $88 9.1% Contingencies $114 11.8% Interest During Construction (6%)
$103 10.6%
Total $970 100% The annual operations and maintenance costs for the Evergreen LRT system are estimated at approximately $12.21 million in 2007 dollars as illustrated in Table 5-3. In 2021, these costs are expected to increase to approximately $13.16 in 2007 dollars to accommodate the additional staff, material and power costs associated with operating a larger vehicle fleet.
Table 5-3 – LRT Operations and Maintenance Costs
Direct O&M Costs Annual Costs ($2007) Maintenance $5.33 Operations $5.32 Power Consumption $0.40 General Administration $1.12 Annual Road Vehicle Costs $0.04 Annual Total $12.21
5.8 INCREMENTAL REVENUE Revenues and bus cost savings resulting from the introduction of the new LRT operation offset the annual operating costs. For the Evergreen LRT Line, revenues that are generated include incremental system-wide ridership and advertising revenues. In addition, TransLink will realize cost savings from a reduction in the number of buses assigned to the LRT corridor.
Section 5 – Project Description Page 51
Evergreen Light Rail Transit Project Project Definition Phase – Business Case October 12, 2006
5.8.1 INCREMENTAL RIDERSHIP Ridership estimates were generated by Steer Davies Gleave for a number of options with alignment and station variations21. Further ridership work was completed by T. Partridge & Associates for the Multiple Account Evaluation. Total annual ridership for the preferred option is forecast to reach 10.7 million by 2021. From a system-wide perspective, the introduction of the new LRT service will influence the travel patterns of current transit users as well as attract new riders to the transit system who would otherwise not travel on transit if the LRT service were not introduced. With the introduction of the Evergreen LRT Line, TransLink will receive additional revenues from new transit riders traveling throughout the system. Incremental ridership is estimated to be approximately 5.0 million in 2021. From a revenue perspective, this incremental ridership increase will result in increased revenues of $12.2 million by 2021, expressed in 2007 dollars. 5.8.2 INCREMENTAL ADVERTISING TransLink has an opportunity to generate additional advertising revenue with the introduction of the Evergreen LRT service. Advertising space can be sold at stations, as well as the interior and exterior of vehicles. Based on system experience annual revenues to TransLink could be in the order of $1.75 million in 2007 dollars based on the opening day operating plan. By 2021, when the number of vehicles is increased, annual advertising revenues can be expected to increase to $1.92 million, in 2007 dollars. 5.8.3 BUS SAVINGS The introduction of the Evergreen LRT service in 2011 will enable TransLink to remove 13 conventional buses from service that are currently serving the Evergreen LRT service area. At that time, TransLink will add seven Community Shuttles to improve connecting local services. These changes will result in an estimated annual savings of $1.5 million in 2007 dollars beginning in the first year of operation. 5.8.4 NET OPERATING COSTS The estimated annual operating costs, revenues and savings are summarized in Table 5–4. Costs and revenues are shown based on 2013 and 2021 operations and expressed in 2007 dollars.
21 “Evergreen Light Rail Transit Project, Ridership Analysis, Final Report,” Steer Davies Gleave, September 2006.
Section 5 – Project Description Page 52
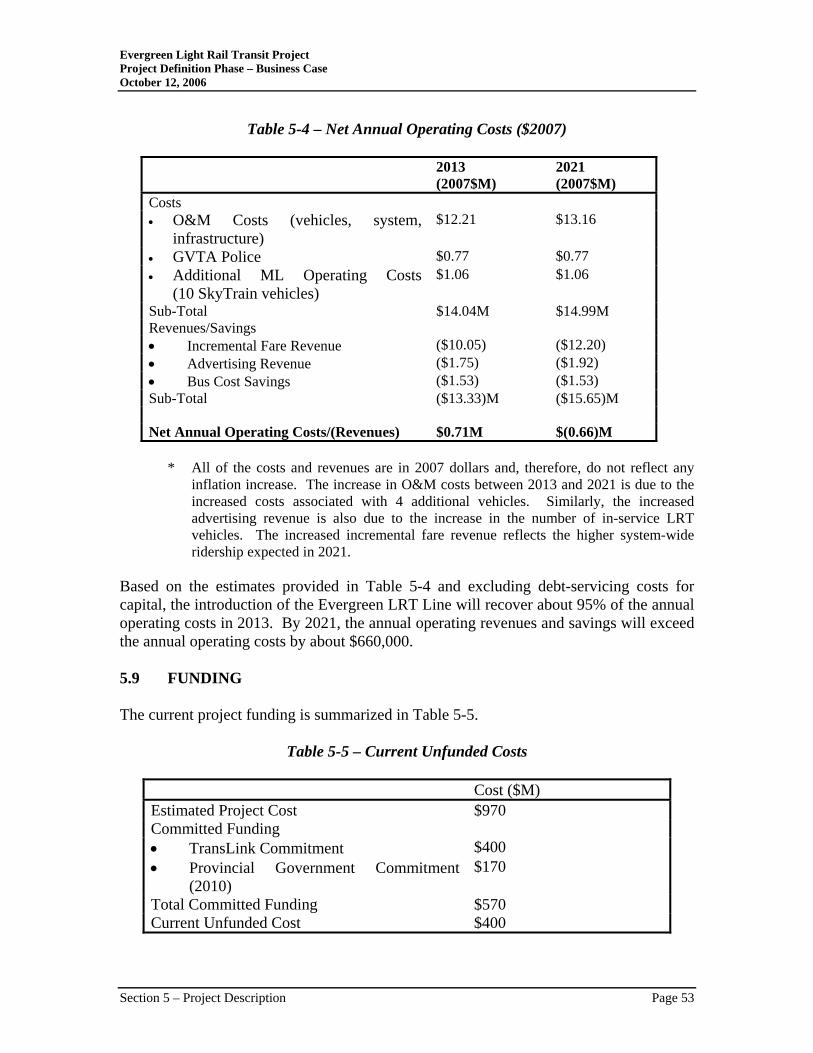
Evergreen Light Rail Transit Project Project Definition Phase – Business Case October 12, 2006
Table 5-4 – Net Annual Operating Costs ($2007)
2013 (2007$M)
2021 (2007$M)
Costs • O&M Costs (vehicles, system,
infrastructure) $12.21 $13.16
• GVTA Police $0.77 $0.77 • Additional ML Operating Costs
(10 SkyTrain vehicles) $1.06 $1.06
Sub-Total $14.04M $14.99M Revenues/Savings • Incremental Fare Revenue ($10.05) ($12.20) • Advertising Revenue ($1.75) ($1.92) • Bus Cost Savings ($1.53) ($1.53) Sub-Total ($13.33)M ($15.65)M Net Annual Operating Costs/(Revenues) $0.71M $(0.66)M
* All of the costs and revenues are in 2007 dollars and, therefore, do not reflect any
inflation increase. The increase in O&M costs between 2013 and 2021 is due to the increased costs associated with 4 additional vehicles. Similarly, the increased advertising revenue is also due to the increase in the number of in-service LRT vehicles. The increased incremental fare revenue reflects the higher system-wide ridership expected in 2021.
Based on the estimates provided in Table 5-4 and excluding debt-servicing costs for capital, the introduction of the Evergreen LRT Line will recover about 95% of the annual operating costs in 2013. By 2021, the annual operating revenues and savings will exceed the annual operating costs by about $660,000. 5.9 FUNDING The current project funding is summarized in Table 5-5.
Table 5-5 – Current Unfunded Costs
Cost ($M) Estimated Project Cost $970 Committed Funding • TransLink Commitment $400 • Provincial Government Commitment
(2010) $170
Total Committed Funding $570 Current Unfunded Cost $400
Section 5 – Project Description Page 53
Evergreen Light Rail Transit Project Project Definition Phase – Business Case October 12, 2006
Opportunities may exist for TransLink to partner with municipalities or local developers to rezone and redevelop lands along the alignment currently owned by TransLink. Any additional revenue generated through these partnerships could be used to reduce the current funding gap. For example, TransLink currently owns a 14 acre parcel, the Coquitlam Exchange site which has high potential for Transit Oriented Development. Based on Coquitlam’s support of this site as TOD, revenue could be realized by TransLink with the development of this site. The design of the Evergreen Line will meet all applicable municipal, provincial and federal regulatory obligations related to construction of roadway infrastructure and systems operations of the train.
Section 5 – Project Description Page 54
Evergreen Light Rail Transit Project Project Definition Phase – Business Case October 12, 2006
6 MULTIPLE ACCOUNT EVALUATION 6.1 INTRODUCTION A Multiple Account Evaluation (MAE) report was prepared by the project team to provide an update of the MAE presented in the Technical Report of the Northeast Sector Rapid Transit Alternatives Project, titled Phase 2 – Evaluation of Rapid Transit Alternatives dated March 31, 2004. The 2004 MAE report compared alternative routes and technologies for the proposed rapid transit line connecting Lougheed Town Centre and Coquitlam Town Centre. This MAE update is not intended to re-evaluate the entire set of routes and technologies assessed as part of the previous study. As the preferred technology, the LRT option has been further defined during the Project Definition Phase, through completion of the preliminary design, detailed technical analysis, and extensive consultations with municipalities and the public. The MAE update compares the currently proposed Evergreen LRT system and alignment to three alternative technologies broadly following the same alignment as the preferred (LRT) alignment. The results of the updated MAE are summarized below. The complete MAE report is provided as an appendix to this document. 6.2 EVALUATION METHODOLOGY The updated MAE compared the following four technologies: 1. SkyTrain 2. LRT 3. Bus Rapid Transit 4. 97 B-Line bus service Based on the key findings of the 2004 MAE, the most promising technology alternatives were SkyTrain, LRT, and GLT. DMU was the lowest ranked of the alternatives explored, with the lowest level of service, the highest capital cost, and the lowest benefit/cost ratio. For this MAE update, DMU will not be considered. The GLT option has been replaced with Bus Rapid Transit (BRT). With the exception of the B-Line technology, these alternatives assume the same corridor. The baseline B-Line service is assumed to continue serving the corridor currently served by the 97 B-Line, which reaches Coquitlam Centre via Guildford Way.
Section 6 – Multiple Account Evaluation Page 52
Evergreen Light Rail Transit Project Project Definition Phase – Business Case October 12, 2006
The accounts for the updated MAE are equivalent to those used in the 2004 MAE, and are as follows: 6.2.1 TRANSPORTATION ACCOUNT This account includes considerations in the following areas: • Financial – including incremental direct and indirect capital costs, annual
operating and maintenance costs, rehabilitation costs, additional Millennium Line operating costs, and residual value of assets
• Financial benefits – including incremental fare revenues, advertising revenues, bus savings, user and other owner benefits
• Customer Features – comfort and accessibility on-board and at stations, system reliability
• System Performance – travel speeds and vehicle headways, ridership (system-specific and system-wide), system capacities, connectivity/ease of transfers
6.2.2 URBAN DEVELOPMENT ACCOUNT This account includes considerations in the following areas: • Bicycle and pedestrian environment • Stations supporting desired development • Support of the LRSP and Municipal Official Community Plans 6.2.3 ENVIRONMENTAL ACCOUNT This account includes considerations in the following areas: • Emissions Reduction – system vehicle technology and reduced auto usage • Environmental Impacts – green zone • Long-Term Noise Impacts 6.2.4 SOCIAL ACCOUNT This account includes considerations in the following areas: • Socio-economic – safety, personal security (actual and perceived), visual impacts
and community integration, economic development, municipal, community and business support
• Long Term Community Impacts – Reduction in vehicle delay, impacts on
alternate arterial routes, access to properties, on-street parking, regional mode split
Section 6 – Multiple Account Evaluation Page 53
Evergreen Light Rail Transit Project Project Definition Phase – Business Case October 12, 2006
6.2.5 EASE OF IMPLEMENTATION ACCOUNT This accounts includes considerations in the following areas: • Construction Impacts/Risks – Impacts to residents/businesses/traffic, schedule
certainty, vehicle procurement, property acquisition, testing, commissioning and integration, regulatory approvals
• Implementation Risks – Operator recruitment, training and procedures For each of the above accounts, comparisons were made to rate each of the LRT, SkyTrain and BRT technologies against the 97 B-Line, considered ‘status-quo’ service in the Northeast Sector. Costs and ridership figures are shown as incremental to the B-Line, and the qualitative comparisons are made with the B-Line being the ‘neutral’ option. The MAE provides a useful tool to assess the relative comparisons of the alternative technologies, however, it is not necessarily the sole consideration for decision-making. It is also important to note the following: • The four options have not been developed to the same extent:
o B-Line is based on actual data for the existing 97 B-Line service o LRT is based on work completed during the 18-month Project Definition
phase including preliminary design of the system and extensive ridership modeling
o BRT and SkyTrain were based on conceptual design levels only; • The qualitative outcomes are based on an overall balance of one or more specific
considerations; • The qualitative outcomes are high-level comparisons between technologies based
on order-of-magnitude differences; therefore, relatively minor differences in the technologies may not be reflected; and
• Ranking of technology options is provided for each Account assuming an approximately equal weight for each sub-account. An overall ranking of the technology options is not provided.
6.3 MAE SUMMARY The results of the MAE are presented in the following table. Given the number of factors considered under the Transportation Account, the results have been subdivided to better illustrate differences among the technologies. For each account, or sub-account, the alternatives are ranked, ranging from 1 (the best) to 3 (poorest).
Section 6 – Multiple Account Evaluation Page 54
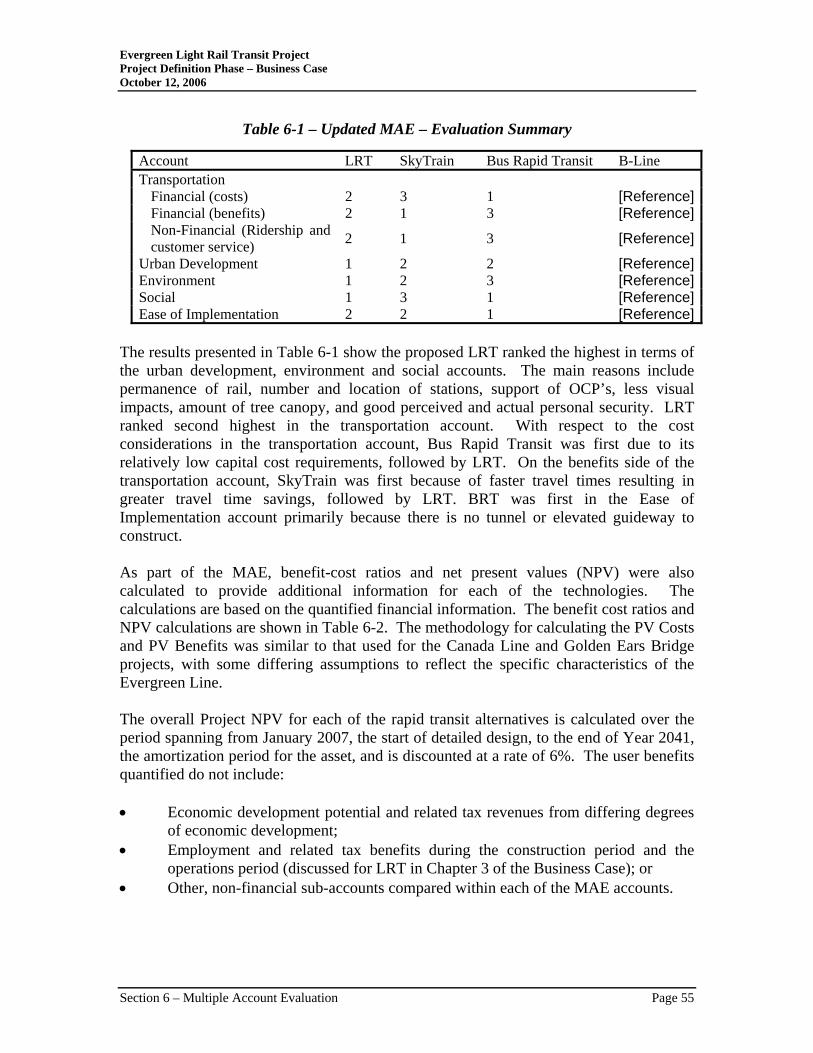
Evergreen Light Rail Transit Project Project Definition Phase – Business Case October 12, 2006
Table 6-1 – Updated MAE – Evaluation Summary
Account LRT SkyTrain Bus Rapid Transit B-Line Transportation
Financial (costs) 2 3 1 [Reference]Financial (benefits) 2 1 3 [Reference]Non-Financial (Ridership and customer service) 2 1 3 [Reference]
Urban Development 1 2 2 [Reference]Environment 1 2 3 [Reference]Social 1 3 1 [Reference]Ease of Implementation 2 2 1 [Reference]
The results presented in Table 6-1 show the proposed LRT ranked the highest in terms of the urban development, environment and social accounts. The main reasons include permanence of rail, number and location of stations, support of OCP’s, less visual impacts, amount of tree canopy, and good perceived and actual personal security. LRT ranked second highest in the transportation account. With respect to the cost considerations in the transportation account, Bus Rapid Transit was first due to its relatively low capital cost requirements, followed by LRT. On the benefits side of the transportation account, SkyTrain was first because of faster travel times resulting in greater travel time savings, followed by LRT. BRT was first in the Ease of Implementation account primarily because there is no tunnel or elevated guideway to construct. As part of the MAE, benefit-cost ratios and net present values (NPV) were also calculated to provide additional information for each of the technologies. The calculations are based on the quantified financial information. The benefit cost ratios and NPV calculations are shown in Table 6-2. The methodology for calculating the PV Costs and PV Benefits was similar to that used for the Canada Line and Golden Ears Bridge projects, with some differing assumptions to reflect the specific characteristics of the Evergreen Line. The overall Project NPV for each of the rapid transit alternatives is calculated over the period spanning from January 2007, the start of detailed design, to the end of Year 2041, the amortization period for the asset, and is discounted at a rate of 6%. The user benefits quantified do not include: • Economic development potential and related tax revenues from differing degrees
of economic development; • Employment and related tax benefits during the construction period and the
operations period (discussed for LRT in Chapter 3 of the Business Case); or • Other, non-financial sub-accounts compared within each of the MAE accounts.
Section 6 – Multiple Account Evaluation Page 55
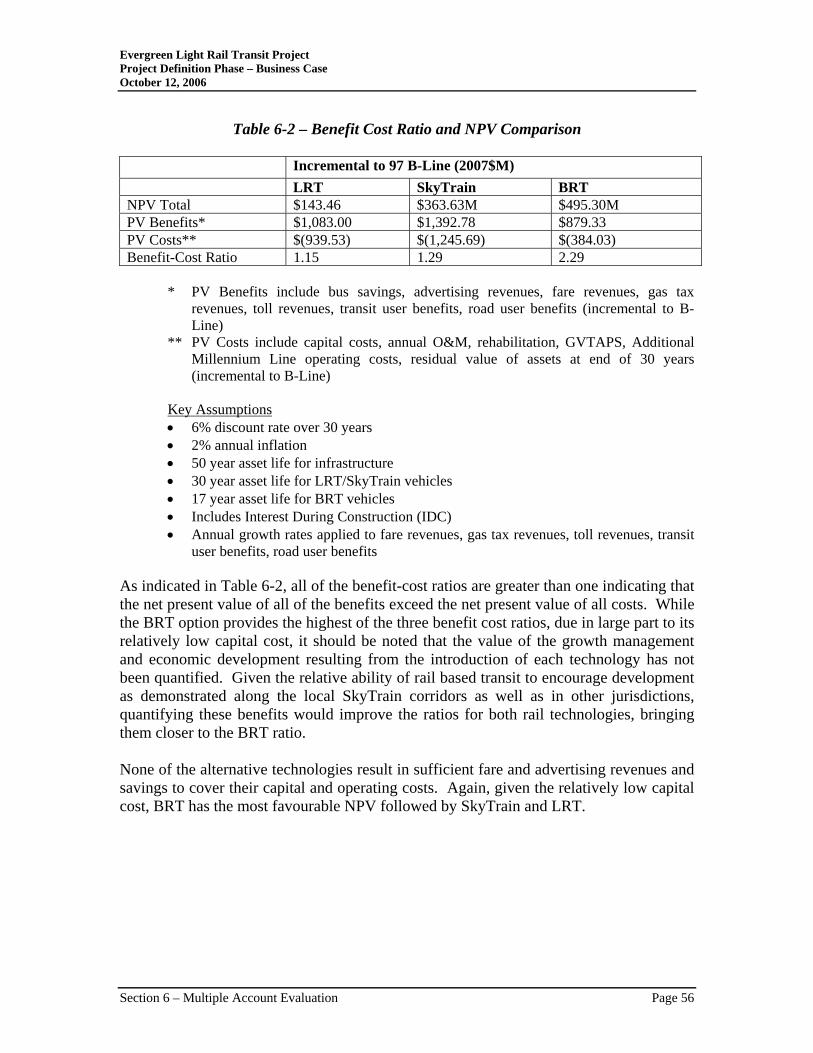
Evergreen Light Rail Transit Project Project Definition Phase – Business Case October 12, 2006
Table 6-2 – Benefit Cost Ratio and NPV Comparison Incremental to 97 B-Line (2007$M) LRT SkyTrain BRT NPV Total $143.46 $363.63M $495.30M PV Benefits* $1,083.00 $1,392.78 $879.33 PV Costs** $(939.53) $(1,245.69) $(384.03) Benefit-Cost Ratio 1.15 1.29 2.29
* PV Benefits include bus savings, advertising revenues, fare revenues, gas tax
revenues, toll revenues, transit user benefits, road user benefits (incremental to B-Line)
** PV Costs include capital costs, annual O&M, rehabilitation, GVTAPS, Additional Millennium Line operating costs, residual value of assets at end of 30 years (incremental to B-Line)
Key Assumptions • 6% discount rate over 30 years • 2% annual inflation • 50 year asset life for infrastructure • 30 year asset life for LRT/SkyTrain vehicles • 17 year asset life for BRT vehicles • Includes Interest During Construction (IDC) • Annual growth rates applied to fare revenues, gas tax revenues, toll revenues, transit
user benefits, road user benefits As indicated in Table 6-2, all of the benefit-cost ratios are greater than one indicating that the net present value of all of the benefits exceed the net present value of all costs. While the BRT option provides the highest of the three benefit cost ratios, due in large part to its relatively low capital cost, it should be noted that the value of the growth management and economic development resulting from the introduction of each technology has not been quantified. Given the relative ability of rail based transit to encourage development as demonstrated along the local SkyTrain corridors as well as in other jurisdictions, quantifying these benefits would improve the ratios for both rail technologies, bringing them closer to the BRT ratio. None of the alternative technologies result in sufficient fare and advertising revenues and savings to cover their capital and operating costs. Again, given the relatively low capital cost, BRT has the most favourable NPV followed by SkyTrain and LRT.
Section 6 – Multiple Account Evaluation Page 56
Evergreen Light Rail Transit Project Project Definition Phase – Business Case October 12, 2006
6.4 KEY FINDINGS Bus Rapid Transit (BRT), as a result of having the lowest capital investment, has the most favourable overall Project NPV and benefit-cost ratio. However, by 2021, the system is operating at full capacity with no practical means for expansion to meet the longer term ridership needs of the region. BRT is an interim solution and investment in rail will be required prior to 2021 to realize the transportation and economic objectives for the region. Both LRT and SkyTrain, although more capital cost intensive compared to BRT, will provide a reliable rapid transit service to the Northeast Sector for the long term. Rail systems strongly support long-term economic development, primarily because they are more permanent and will therefore attract more commercial and residential development. LRT has a lower capital cost than SkyTrain and superior customer features while SkyTrain generates greater ridership and travel benefits. However, the additional capital cost of $300 million for SkyTrain is a significant factor favouring LRT. These capital cost savings can be used for other projects that are also required to address the region’s transportation needs.
Section 6 – Multiple Account Evaluation Page 57
Evergreen Light Rail Transit Project Project Definition Phase – Business Case October 12, 2006
7 BENCHMARKING 7.1 PURPOSE When complete, the Evergreen Line will be Greater Vancouver’s fourth rail-based rapid transit line, adding to the current Expo and Millennium Lines that comprise the SkyTrain system as well as the upcoming Canada Line scheduled to open in 2009. Although it is difficult to make a direct comparison between rapid transit systems and particularly, systems operating in different jurisdictions, an internal and external benchmarking study was undertaken to provide some context for the Evergreen Line to compare the planned service characteristics and estimated costs of the Evergreen Line to systems that are in operation today. The internal benchmarking study provides a comparison of the Evergreen Line, utilizing LRT technology, to the existing and planned ALRT systems, namely, the Expo, Millennium and Canada Lines.An external benchmarking exercise was also undertaken to compare the proposed Evergreen LRT to other LRT systems currently operating in North America and Europe. 7.2 INTERNAL BENCHMARKING Rapid transit was first introduced to Greater Vancouver in 1986 with the opening of the first phase of the Expo SkyTrain (ALRT) Line, which provided rapid transit service between Waterfront and New Westminster station. Subsequent phases in 1989, 1990 and 1994 extended the Expo Line eastward to the current terminus at King George station in Surrey. The Expo Line is a largely grade separated system, approximately 29 kilometres long, currently serving more than 51 million passengers per year. Ridership is expected to increase to 62 million by 2021. In 2001, the SkyTrain network was expanded with the addition of the Millennium Line providing a connection between Vancouver and New Westminster via the Broadway-Lougheed corridor with convenient transfer points to the Expo Line at Broadway-Commercial and Columbia stations. When it first opened, the Millennium Line extended service from a tie-in at the Expo Line’s Columbia station in New Westminster to a western terminus at Commercial Drive station in Vancouver. In 2006, the Millennium Line was extended westward to a new terminus station at Vancouver Community College. The Millennium Line is also a largely grade separated alignment, approximately 21 kilometres in length and currently serving an estimated 14 million passengers per year. Ridership is expected to increase to 28 million by 2021.
Section 7 – Benchmarking Page 58
Evergreen Light Rail Transit Project Project Definition Phase – Business Case October 12, 2006
In 2005, TransLink awarded a concession agreement for the design, construction, and operation of the Canada Line. The new line is currently under construction and will provide automated rapid transit rail service from Waterfront station in downtown Vancouver to Richmond City Centre station in Richmond and the Vancouver International Airport. The Canada Line is a mostly grade separated alignment operating in tunnel from downtown Vancouver to the vicinity of 57th Avenue at Cambie Street. South from 57th Avenue the alignment transitions to an elevated guideway with a bridge crossing of the Fraser River. The Canada Line is scheduled to begin service in 2009 and by 2021 is anticipated to carry some 43 million passengers annually. The proposed Evergreen Line is an LRT line that connects Lougheed Town Centre in Burnaby with Coquitlam Town Centre in Coquitlam via Port Moody. The alignment is 11.2 kilometres in length and is mostly at-grade with some short grade separated sections and a two kilometre deep bore tunneled section. For the most part, the LRT vehicles will operate at-grade in the centre of the roadway with signal priority being given where possible to aide travel times and increase the efficiency and competitiveness of the system. The Evergreen Line is planned to be in-service in September 2011 with ridership growing to 10.7 million passengers in 2021.
Section 7 – Benchmarking Page 59
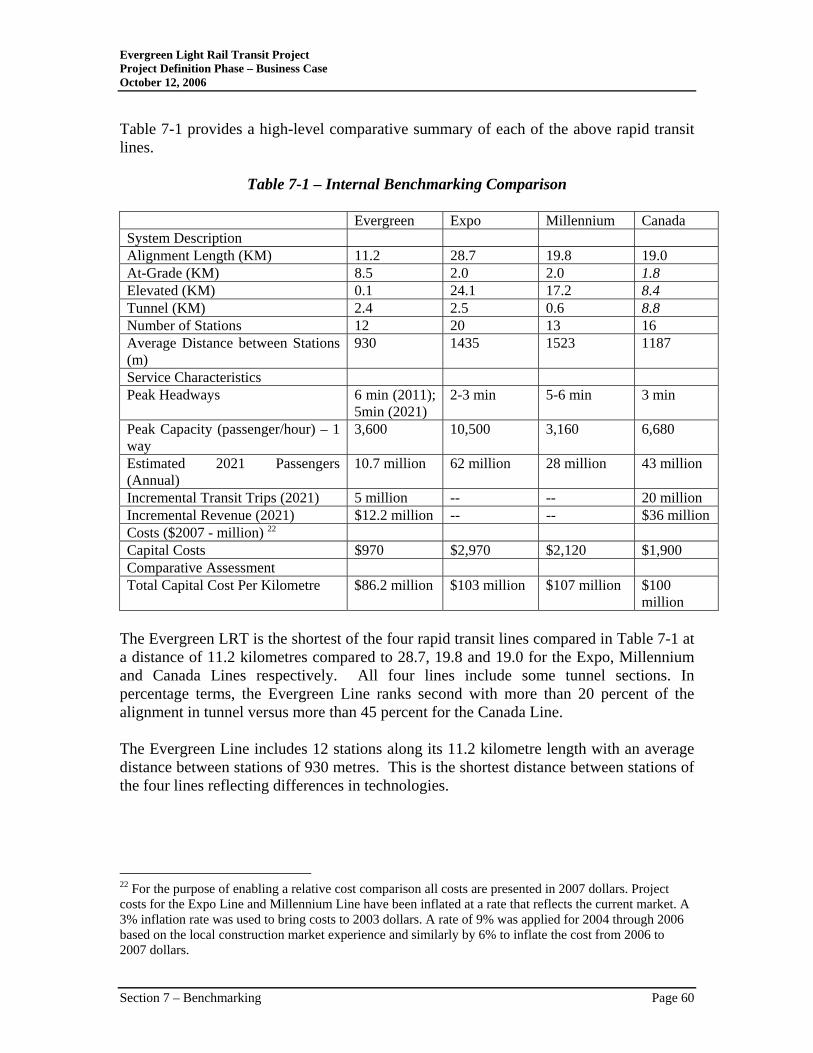
Evergreen Light Rail Transit Project Project Definition Phase – Business Case October 12, 2006
Table 7-1 provides a high-level comparative summary of each of the above rapid transit lines.
Table 7-1 – Internal Benchmarking Comparison Evergreen Expo Millennium Canada System Description Alignment Length (KM) 11.2 28.7 19.8 19.0 At-Grade (KM) 8.5 2.0 2.0 1.8 Elevated (KM) 0.1 24.1 17.2 8.4 Tunnel (KM) 2.4 2.5 0.6 8.8 Number of Stations 12 20 13 16 Average Distance between Stations (m)
930 1435 1523 1187
Service Characteristics Peak Headways 6 min (2011);
5min (2021) 2-3 min 5-6 min 3 min
Peak Capacity (passenger/hour) – 1 way
3,600 10,500 3,160 6,680
Estimated 2021 Passengers (Annual)
10.7 million 62 million 28 million 43 million
Incremental Transit Trips (2021) 5 million -- -- 20 million Incremental Revenue (2021) $12.2 million -- -- $36 million Costs ($2007 - million) 22 Capital Costs $970 $2,970 $2,120 $1,900 Comparative Assessment Total Capital Cost Per Kilometre $86.2 million $103 million $107 million $100
million The Evergreen LRT is the shortest of the four rapid transit lines compared in Table 7-1 at a distance of 11.2 kilometres compared to 28.7, 19.8 and 19.0 for the Expo, Millennium and Canada Lines respectively. All four lines include some tunnel sections. In percentage terms, the Evergreen Line ranks second with more than 20 percent of the alignment in tunnel versus more than 45 percent for the Canada Line. The Evergreen Line includes 12 stations along its 11.2 kilometre length with an average distance between stations of 930 metres. This is the shortest distance between stations of the four lines reflecting differences in technologies.
22 For the purpose of enabling a relative cost comparison all costs are presented in 2007 dollars. Project costs for the Expo Line and Millennium Line have been inflated at a rate that reflects the current market. A 3% inflation rate was used to bring costs to 2003 dollars. A rate of 9% was applied for 2004 through 2006 based on the local construction market experience and similarly by 6% to inflate the cost from 2006 to 2007 dollars.
Section 7 – Benchmarking Page 60
Evergreen Light Rail Transit Project Project Definition Phase – Business Case October 12, 2006
From a ridership perspective, the Evergreen Line is not expected to carry the same volumes of people carried on the other three lines. In 2021, the Evergreen Line is expected to carry some 10.7 million passengers compared to 43 million on the Canada Line and 62 million and 28 million on the Expo and Millennium Lines respectively. 23
Among the four lines, the Evergreen has the lowest capital cost for the entire line as well as the lowest capital cost per kilometre. 7.3 EXTERNAL BENCHMARKING LRT schemes operate around the world and vary widely in their characteristics. There is no standard specification, or indeed a consistent definition of an LRT system. In particular, some LRT systems have characteristics in common with metros (such as fully segregated operation and railway signaling) or with conventional trams or streetcars (such as operation in mixed traffic and simple curbside stops). In addition, there are a few diesel-powered operations. However, the key features of typical modern LRT systems are that: • Vehicles are driven manually on line-of-sight; • Vehicles obey traffic signals although some degree of priority is generally
provided; • A significant amount of the route is segregated from other traffic; • Stations are more elaborate and prominent than traditional bus stops, and
generally provide step-free access to the vehicle; • Power is obtained from an overhead contact wire; and • A high quality of design is adopted throughout the system. Within this broad definition there are many systems worldwide, varying in their technical characteristics and design parameters but almost all are intended as a high quality mode capable of attracting car users to transit. Information was collected on a number of LRT systems in operation in Europe and North America to enable a benchmarking comparison with the proposed Evergreen Line24. The systems used for this comparison included: • Canada: Calgary and Edmonton; • USA: Baltimore, Buffalo, Dallas, Denver, Houston, Los Angeles, Sacramento, St.
Louis, San Diego and Salt Lake City;
23 2021 ridership forecasts for the Expo, Millennium and Canada Lines assume that the Evergreen Line is part of the network. 24 The external benchmarking exercise was undertaken by Steer Davies Gleave and is included as a section in their September 2006 report entitled “Evergreen Light Rail Transit Project, Ridership Analysis, Final Report”.
Section 7 – Benchmarking Page 61
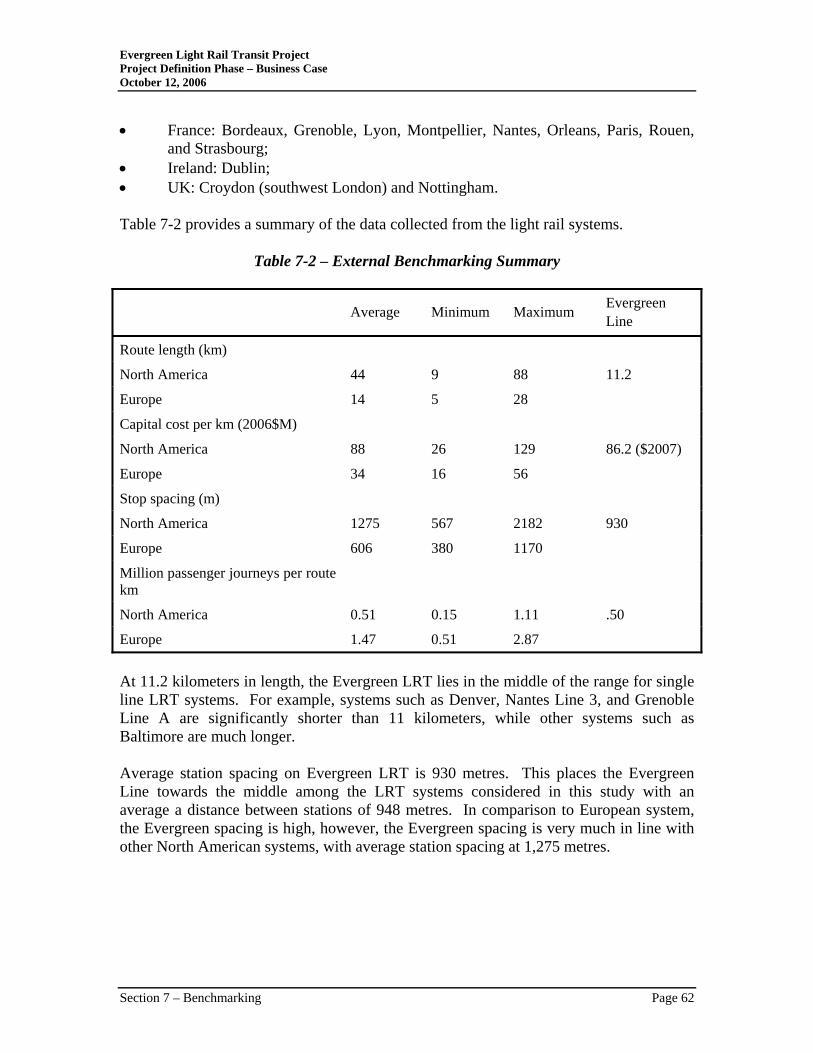
Evergreen Light Rail Transit Project Project Definition Phase – Business Case October 12, 2006
• France: Bordeaux, Grenoble, Lyon, Montpellier, Nantes, Orleans, Paris, Rouen, and Strasbourg;
• Ireland: Dublin; • UK: Croydon (southwest London) and Nottingham. Table 7-2 provides a summary of the data collected from the light rail systems.
Table 7-2 – External Benchmarking Summary Average Minimum Maximum Evergreen
Line
Route length (km)
North America 44 9 88 11.2
Europe 14 5 28
Capital cost per km (2006$M)
North America 88 26 129 86.2 ($2007)
Europe 34 16 56
Stop spacing (m)
North America 1275 567 2182 930
Europe 606 380 1170
Million passenger journeys per route km
North America 0.51 0.15 1.11 .50
Europe 1.47 0.51 2.87
At 11.2 kilometers in length, the Evergreen LRT lies in the middle of the range for single line LRT systems. For example, systems such as Denver, Nantes Line 3, and Grenoble Line A are significantly shorter than 11 kilometers, while other systems such as Baltimore are much longer. Average station spacing on Evergreen LRT is 930 metres. This places the Evergreen Line towards the middle among the LRT systems considered in this study with an average a distance between stations of 948 metres. In comparison to European system, the Evergreen spacing is high, however, the Evergreen spacing is very much in line with other North American systems, with average station spacing at 1,275 metres.
Section 7 – Benchmarking Page 62
Evergreen Light Rail Transit Project Project Definition Phase – Business Case October 12, 2006
The estimated cost for the Evergreen Line is $970 million in 2007 dollars. This equates to approximately $86.2 million per route kilometre. When compared against other LRT systems, this cost is similar to the average cost per kilometre of the other North American systems ($89.8M/km) but more than the average European system of $34.7 million per kilometre25. The estimated passengers journeys per route kilometre for the Evergreen Line is forecast to be 0.5 million. This is consistent with other North American systems. Careful consideration needs to be taken when drawing conclusions from any benchmarking exercise, as it is very difficult to make comparisons on an exactly ‘like-for-like’ basis. Cities and systems will all vary slightly due to the density of the population, the surrounding transport network, the opportunity for segregated running and topographical/geographical constraints. However, the analysis presented above does indicate that the Evergreen LRT line has: • Capital costs (costs per route kilometre) that are on par with other North
American LRT systems; • Ridership numbers (per route kilometre) that are very similar to other North
American systems; • A station spacing/design that matches those of other North American systems;
and • Relatively higher costs and lower passenger numbers than European systems. While there are lessons that can be learned from European LRT design, in particular the integration with other transportation modes and urban design, a direct comparison of against these systems is not balanced due to the higher population densities and more compact nature of European city design.
25 The numbers presented in the external benchmarking table are is 2006 dollars. To facilitate the comparison with the Evergreen Line estimate the average cost per route kilometre for the North American and European systems have been inflated by 2 percent.
Section 7 – Benchmarking Page 63
Evergreen Light Rail Transit Project Project Definition Phase – Business Case October 12, 2006
8 RISK / SENSITIVITY ANALYSIS 8.1 SENSITIVITY ANALYSIS An analysis was undertaken as part of the Multiple Account Analysis to determine the sensitivity of the benefit-cost ratio and NPV estimates to variations in the discount rate and capital costs. The results of the analysis are summarized in the MAE. The sensitiviy analysis results do not alter the conclusions of the MAE. 8.2 RISK As part of the Project Definition Phase work, the project team is developing a risk registry for all phases of the Evergreen Line project – design, procurement, construction and operations. The risk registry includes a detailed listing of project and operational risks along with strategies to manage and mitigate these risks. This document is updated at key stages throughout the project implementation. The risks include the following main categories: • Management • Property • Regulatory Approvals • Financial • Design/ Engineering • Ridership
Section 8 – Risk/Sensitivity Analysis Page 65
Evergreen Light Rail Transit Project Project Definition Phase – Business Case October 12, 2006
9 PROJECT IMPLEMENTATION 9.1 PROJECT SCOPE Pending a decision by the TransLink Board to proceed with the Detailed Design Phase, TransLink will establish a Project Team to coordinate and manage all aspects of the implementation from the completion of the detailed design through to in-service operations. Before moving from design to construction it will be necessary to secure necessary funding to cover the cost of the project. Based on the ability of TransLink to secure funding, the scope of work required for the implementation will include a number of work elements. Work Elements • Tunnel • Vehicle • Operations and Maintenance Centre • Utilities (Hydro, TELUS / Municipal) • Roadwork • Trackwork • Systems • Structures (Elevated Guideway) • Testing and Commissioning In addition to these work elements, the Project Team will also coordinate and manage the following project components. Tasks associated with the construction would again be subject to TransLink securing project funds. Detailed Design • Property Acquisition • Environmental Certification Requirements • Communications, Consultation and Marketing Construction • Communications, Consultation and Marketing • BC Safety Authority approvals • Budget and Scheduling 9.2 PROJECT SCHEDULE The Project Team will initiate the scheduled design activities following the decision by the TransLink Board in October 2006 to proceed with the Evergreen LRT Detailed Design Phase. As shown on the high-level schedule in Exhibit 9-1, the work elements required to complete the detailed design will begin in November 2006 followed by the
Section 9 – Project Implementation Page 67
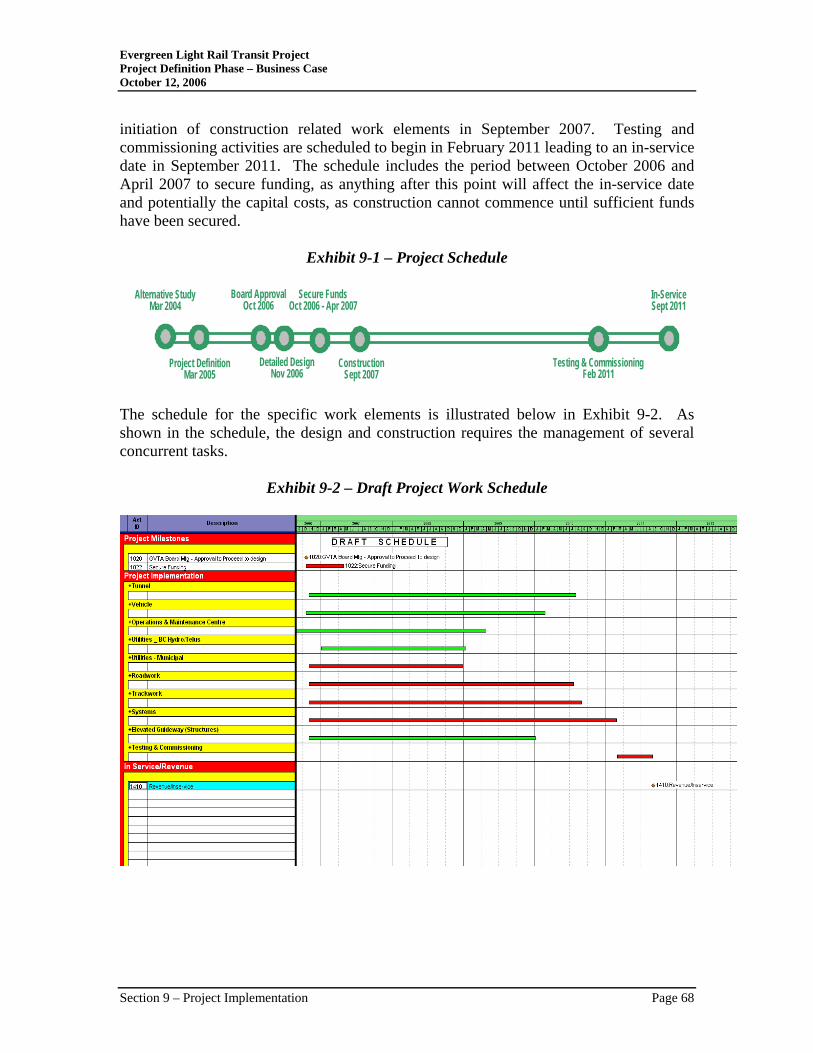
Evergreen Light Rail Transit Project Project Definition Phase – Business Case October 12, 2006
initiation of construction related work elements in September 2007. Testing and commissioning activities are scheduled to begin in February 2011 leading to an in-service date in September 2011. The schedule includes the period between October 2006 and April 2007 to secure funding, as anything after this point will affect the in-service date and potentially the capital costs, as construction cannot commence until sufficient funds have been secured.
Exhibit 9-1 – Project Schedule
Board ApprovalOct 2006
Detailed DesignNov 2006
ConstructionSept 2007
Testing & CommissioningFeb 2011
In-ServiceSept 2011
Secure FundsOct 2006 - Apr 2007
Project DefinitionMar 2005
Alternative StudyMar 2004
The schedule for the specific work elements is illustrated below in Exhibit 9-2. As shown in the schedule, the design and construction requires the management of several concurrent tasks.
Exhibit 9-2 – Draft Project Work Schedule
Section 9 – Project Implementation Page 68
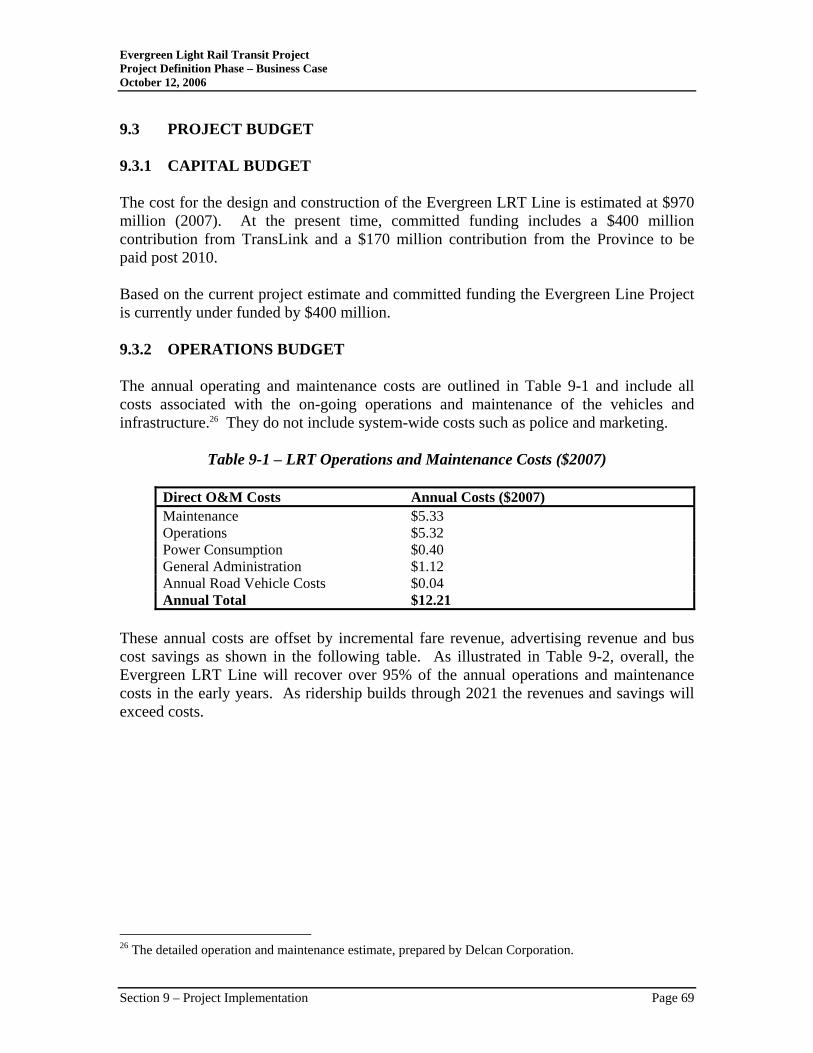
Evergreen Light Rail Transit Project Project Definition Phase – Business Case October 12, 2006
9.3 PROJECT BUDGET 9.3.1 CAPITAL BUDGET The cost for the design and construction of the Evergreen LRT Line is estimated at $970 million (2007). At the present time, committed funding includes a $400 million contribution from TransLink and a $170 million contribution from the Province to be paid post 2010. Based on the current project estimate and committed funding the Evergreen Line Project is currently under funded by $400 million. 9.3.2 OPERATIONS BUDGET The annual operating and maintenance costs are outlined in Table 9-1 and include all costs associated with the on-going operations and maintenance of the vehicles and infrastructure.26 They do not include system-wide costs such as police and marketing.
Table 9-1 – LRT Operations and Maintenance Costs ($2007)
Direct O&M Costs Annual Costs ($2007) Maintenance $5.33 Operations $5.32 Power Consumption $0.40 General Administration $1.12 Annual Road Vehicle Costs $0.04 Annual Total $12.21
These annual costs are offset by incremental fare revenue, advertising revenue and bus cost savings as shown in the following table. As illustrated in Table 9-2, overall, the Evergreen LRT Line will recover over 95% of the annual operations and maintenance costs in the early years. As ridership builds through 2021 the revenues and savings will exceed costs.
26 The detailed operation and maintenance estimate, prepared by Delcan Corporation.
Section 9 – Project Implementation Page 69
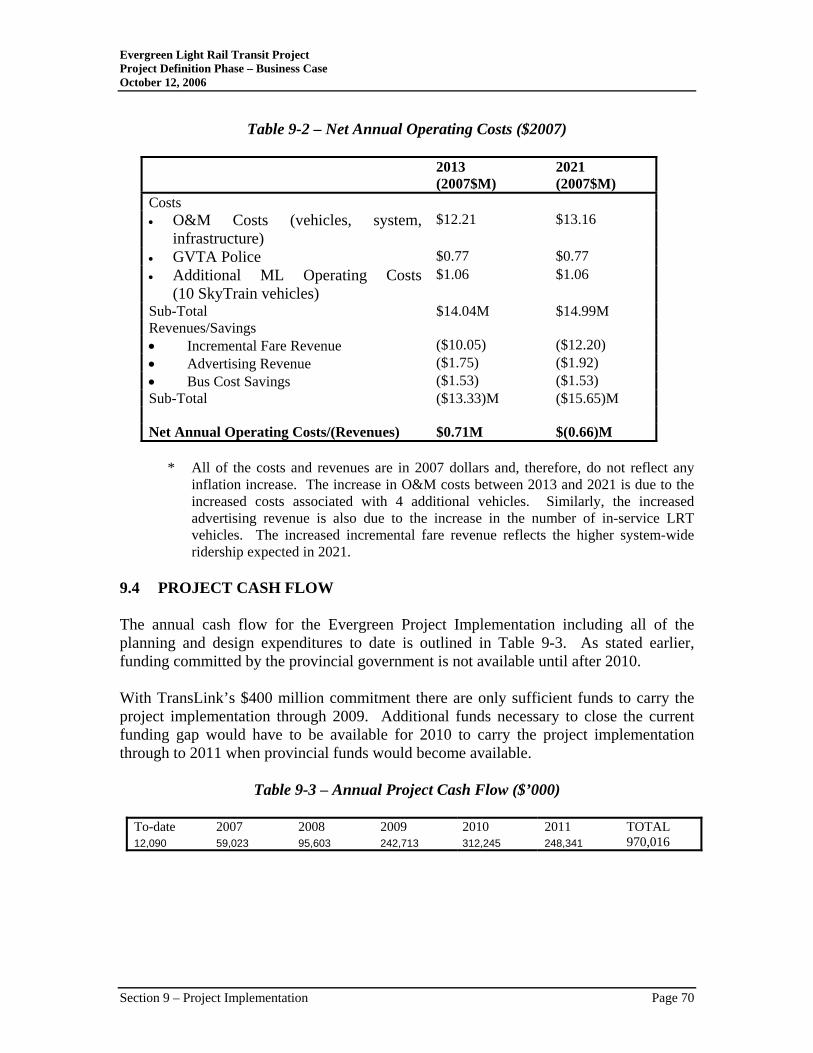
Evergreen Light Rail Transit Project Project Definition Phase – Business Case October 12, 2006
Table 9-2 – Net Annual Operating Costs ($2007)
2013 (2007$M)
2021 (2007$M)
Costs • O&M Costs (vehicles, system,
infrastructure) $12.21 $13.16
• GVTA Police $0.77 $0.77 • Additional ML Operating Costs
(10 SkyTrain vehicles) $1.06 $1.06
Sub-Total $14.04M $14.99M Revenues/Savings • Incremental Fare Revenue ($10.05) ($12.20) • Advertising Revenue ($1.75) ($1.92) • Bus Cost Savings ($1.53) ($1.53) Sub-Total ($13.33)M ($15.65)M Net Annual Operating Costs/(Revenues) $0.71M $(0.66)M
* All of the costs and revenues are in 2007 dollars and, therefore, do not reflect any
inflation increase. The increase in O&M costs between 2013 and 2021 is due to the increased costs associated with 4 additional vehicles. Similarly, the increased advertising revenue is also due to the increase in the number of in-service LRT vehicles. The increased incremental fare revenue reflects the higher system-wide ridership expected in 2021.
9.4 PROJECT CASH FLOW The annual cash flow for the Evergreen Project Implementation including all of the planning and design expenditures to date is outlined in Table 9-3. As stated earlier, funding committed by the provincial government is not available until after 2010. With TransLink’s $400 million commitment there are only sufficient funds to carry the project implementation through 2009. Additional funds necessary to close the current funding gap would have to be available for 2010 to carry the project implementation through to 2011 when provincial funds would become available.
Table 9-3 – Annual Project Cash Flow ($’000) To-date 2007 2008 2009 2010 2011 TOTAL 12,090 59,023 95,603 242,713 312,245 248,341 970,016
Section 9 – Project Implementation Page 70
Evergreen Light Rail Transit Project Project Definition Phase – Business Case October 12, 2006
10 ADVANCEMENT OF FEDERAL AND PROVINCIAL
TRANSPORTATION STRATEGIES AND PLANS The Evergreen Line is an electrically powered technology that does not produce harmful emissions. As such, the substitution of a diesel bus service with LRT will contribute to cleaner air and therefore support provincial and federal strategies to reduce air emissions. From a provincial perspective, the Evergreen Line leverages the provincial investments in the Millennium SkyTrain and Canada Lines by completing the rapid transit link from Lougheed Town Centre to Coquitlam Town Centre. With this extension, both the Millennium Line and Evergreen will support one another to maximize the growth management and ridership benefits associated with each line. Similarly, the Evergreen and Canada Lines will offer enhanced transit connections across a much broader transit system offering benefits for both lines. Within the Northeast Sector, the Evergreen Line provides a key linkage to the region's rapid transit network and could potentially convert many car-based municipal trips into transit trips. Actions that offer alternatives to driving and encourage more transit-oriented development can reduce road demand and delay the filling up of road space. In doing so, it both preserves and protects available road capacity to serve more strategic demands such as long-distance trips and support of regional gateways, as well as better accommodation of high-speed bus options from south of the Fraser. The Evergreen Line is also consistent with the thinking behind the federal initiatives including the Gas Tax Fund, the Public Transit Agreement, the Public Transit Capital Trust Fund and the Canada Strategic Infrastructure Fund.
Section 10 – Advancement of Federal and Provincial Transportation Strategies and Plans Page 71
Evergreen Light Rail Transit Project Project Definition Phase – Business Case October 12, 2006
11 CONCLUSIONS / RECOMMENDATIONS Greater Vancouver is in an enviable position in North America and the world. It has a thriving economy, driven in part by growing trade and its role as a Gateway to the whole Pacific Rim, a clean environment and a quality of life that is second to none. However, maintaining these advantages will require transportation investment, as neither the strong economy nor the quality of life can be taken for granted in an urban region with little room for land expansion and congested key corridors. With Greater Vancouver’s population growth forecast to continue over the next three decades, adding nearly one million more people to cities and roads that are already at capacity, we face a growing need to invest in transportation infrastructure. These investments should support economic development, be cost effective and encourage population and employment growth in areas that do not place pressure on the Lower Mainland’s agricultural lands. In addition they should lead to improved air quality, and be able to support the efficient movement of goods and people now and into the future. The Evergreen LRT Line provides a cost-effective solution to stimulate concentrated regional development and address the immediate and future capacity constraints that limit economic growth in the region. An 11.2 kilometre, 12-station alignment that is largely at-grade and runs north from the Lougheed Town Centre SkyTrain station in Burnaby to an eastern terminus at Douglas College in Coquitlam, the Evergreen Line features stations located at key points along the alignment. These strategically located stations provide convenient access to a number of activity centres and potential development sites within the corridor. The line also provides convenient connections to other transit services including SkyTrain, West Coast Express and the local bus network. LRT, although new to the Lower Mainland, is a well-proven transit mode that has been introduced in many similar-sized cities around the world, not just for its transportation benefits, but also as a catalyst for focusing new and higher density mixed-use development clustered around new transit stations. The Evergreen Line will extend the coverage and help complete Greater Vancouver’s rapid transit network by including the Northeast Sector of the region. As part of a network of transit services, the Evergreen Line connects directly with SkyTrain’s Millennium Line, West Coast Express commuter rail and buses. It also enables integrated travel throughout the rapid transit network including the Expo Line, Millennium Line and the future Canada Line.
Section 11 – Conclusions/Recommendations Page 72
Evergreen Light Rail Transit Project Project Definition Phase – Business Case October 12, 2006
The Evergreen Line provides a viable transportation choice to residents, both those already living in the region and others that will be attracted by development in the corridor. For people in the corridor the line provides local and regional mobility without placing a burden on already-busy roads, freeing capacity for longer distance trips and goods movement. The total annual road and transit user benefits resulting from the Evergreen Line are $51.60 million (2007) in 2013, growing to $57.73 million in 2021 (2007). The Evergreen LRT operates in a segregated right-of-way; it will not be significantly impacted by other traffic using the roadway and therefore offers competitive travel times and reliability in the face of traffic congestion. The introduction of the LRT will reduce the number of car trips by 1.9 million initially and this is estimated to increase to almost 3.6 million trips within a decade. Traffic congestion will continue to worsen through 2021; however, the LRT will improve the capacity of the corridor from a people moving perspective. By improving the local transit service and enhancing the connectivity to the broader transit network, the Evergreen LRT will attract more than 5.0 million new transit riders annually system-wide and increase transit fare revenues by $12.20 million in 2021. The Evergreen LRT Line will enhance the people moving capacity of the Northeast Sector corridor. The system design capacity of the LRT in 2021 is equivalent to 8 additional traffic lanes, preserving existing road lanes and adjacent land for development. Given topographical constraints and development along the corridor, expanding the roadway beyond two additional lanes is not feasible and would not supply the additional capacity required to address congestion. The Evergreen Line is one of the investments that has been identified by the province, the region and gateway industries to alleviate congestion, provide travel time savings and increase transportation choice to improve the movement of people and goods in the region. The Project Definition Phase of the Evergreen Line included further technical work and consultation to better define the project. The estimated capital costs have been updated to reflect the current design and market conditions. The estimated capital cost for the proposed Evergreen LRT Line is $970 million (2007) or $86.2 million per kilometre. The Evergreen Line compares favourably to other LRT systems in North America, as identified in the benchmarking survey. The Evergreen Line capital costs, the ridership numbers and the station spacing are consistent with other North American LRT systems. The Evergreen Line has relatively higher costs and lower passenger numbers than many European systems (not unexpected given higher European population densities and more compact city design) but still falls within the range of European systems.
Section 11 – Conclusions/Recommendations Page 73
Evergreen Light Rail Transit Project Project Definition Phase – Business Case October 12, 2006
It is expected that the Evergreen Line will recover about 95% of its annual operating costs in 2013 and, by 2021, revenues and savings are expected to exceed operating costs. The construction of the Evergreen Line will generate some 6,860 person-years of direct, indirect and induced employment in British Columbia providing estimated federal and provincial tax revenues of $27 and $37 million respectively. An Operations and Maintenance Centre is required for the Evergreen LRT Line and will be the first light rail vehicle facility in the Lower Mainland. This one-time investment will support future extensions to the LRT system. The operation and maintenance of the Evergreen Line will generate employment from on-board operations and from the Operations and Maintenance Centre (OMC) functions. Employment created from the on-going operations and maintenance of the Evergreen Line is equivalent to 121 full-time positions including 93 direct and 28 indirect jobs. The Evergreen Line supports growth in a sustainable manner providing the ability to cost-effectively add capacity to move more people through the corridor as demand increases. The new LRT line provides the transportation infrastructure to enable the municipalities to achieve growth management objectives that are otherwise unattainable. Local municipalities have structured their Official Community Plans based on the availability of an intermediate capacity transit line. The line supports regional and municipal growth management strategies that help limit the impacts of growth on the environment and sustain the livability of the region. The Evergreen Line reduces vehicle travel in the lower Fraser Valley by an estimated 31 million km per year by 2021. This results in Common Air Contaminants (CACs), such as carbon monoxide, nitrogen dioxide, ozone and particulate matter, being reduced by 355.5 tonnes per year, of which 43.5 tonnes are smog-forming pollutants. The 355.5 tonnes per year total represents a 0.5% reduction of CACs in the Northeast Sector. Based on the estimated reduction in vehicle km driven following the introduction of the Evergreen Line, and allowing for the need to generate electricity to power the LRT system, the estimated net reduction of Greenhouse Gas (GHG) emissions in 2021 is 10,592 tonnes. This net reduction in GHG represents a 0.03% reduction in the estimated total GHG production in the Lower Fraer valley in 2021. The amount of tree canopy along the corridor will be more than doubled. The line runs through an existing transportation corridor, therefore, the effect on waterways and green zones is minimal.
Section 11 – Conclusions/Recommendations Page 74
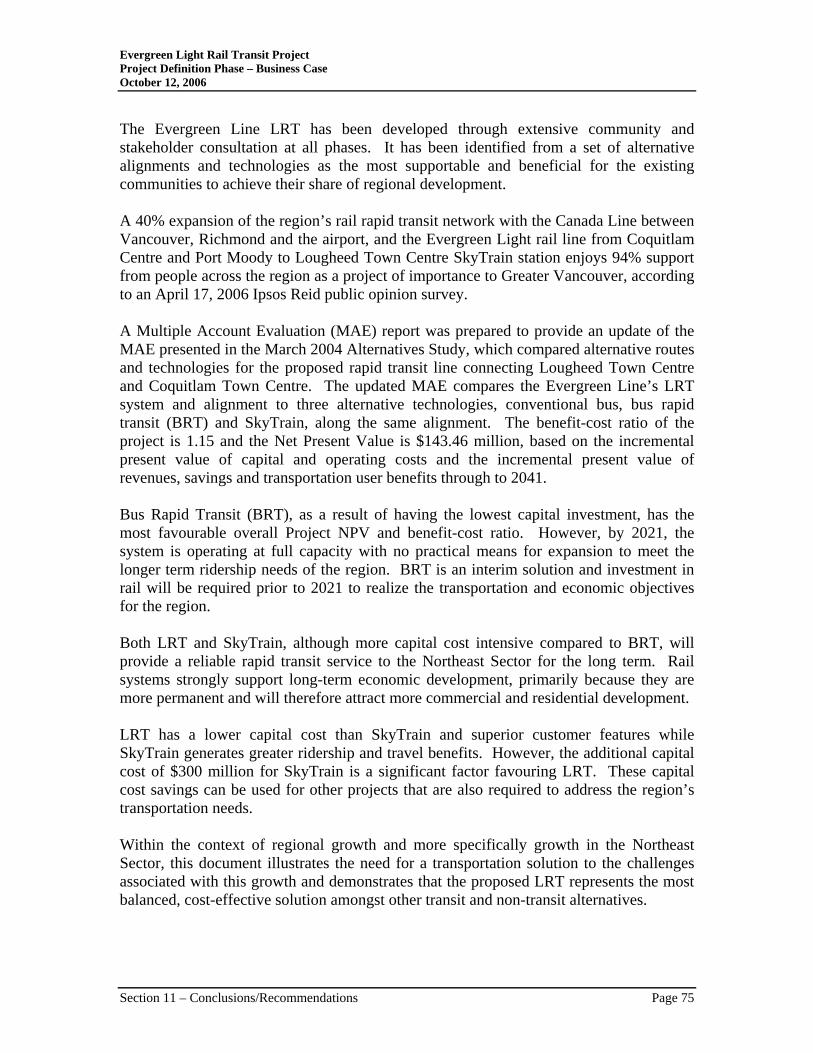
Evergreen Light Rail Transit Project Project Definition Phase – Business Case October 12, 2006
The Evergreen Line LRT has been developed through extensive community and stakeholder consultation at all phases. It has been identified from a set of alternative alignments and technologies as the most supportable and beneficial for the existing communities to achieve their share of regional development. A 40% expansion of the region’s rail rapid transit network with the Canada Line between Vancouver, Richmond and the airport, and the Evergreen Light rail line from Coquitlam Centre and Port Moody to Lougheed Town Centre SkyTrain station enjoys 94% support from people across the region as a project of importance to Greater Vancouver, according to an April 17, 2006 Ipsos Reid public opinion survey. A Multiple Account Evaluation (MAE) report was prepared to provide an update of the MAE presented in the March 2004 Alternatives Study, which compared alternative routes and technologies for the proposed rapid transit line connecting Lougheed Town Centre and Coquitlam Town Centre. The updated MAE compares the Evergreen Line’s LRT system and alignment to three alternative technologies, conventional bus, bus rapid transit (BRT) and SkyTrain, along the same alignment. The benefit-cost ratio of the project is 1.15 and the Net Present Value is $143.46 million, based on the incremental present value of capital and operating costs and the incremental present value of revenues, savings and transportation user benefits through to 2041. Bus Rapid Transit (BRT), as a result of having the lowest capital investment, has the most favourable overall Project NPV and benefit-cost ratio. However, by 2021, the system is operating at full capacity with no practical means for expansion to meet the longer term ridership needs of the region. BRT is an interim solution and investment in rail will be required prior to 2021 to realize the transportation and economic objectives for the region. Both LRT and SkyTrain, although more capital cost intensive compared to BRT, will provide a reliable rapid transit service to the Northeast Sector for the long term. Rail systems strongly support long-term economic development, primarily because they are more permanent and will therefore attract more commercial and residential development. LRT has a lower capital cost than SkyTrain and superior customer features while SkyTrain generates greater ridership and travel benefits. However, the additional capital cost of $300 million for SkyTrain is a significant factor favouring LRT. These capital cost savings can be used for other projects that are also required to address the region’s transportation needs. Within the context of regional growth and more specifically growth in the Northeast Sector, this document illustrates the need for a transportation solution to the challenges associated with this growth and demonstrates that the proposed LRT represents the most balanced, cost-effective solution amongst other transit and non-transit alternatives.
Section 11 – Conclusions/Recommendations Page 75
Evergreen Light Rail Transit Project Project Definition Phase – Business Case October 12, 2006
TransLink's current Three-Year Plan and 10 Year Outlook identifies a commitment of $400 million to the development of the Evergreen Line. The provincial government has committed another $170 million. Based on a capital cost estimate of $970 million, a $400 million funding gap remains. The Evergreen Line cannot proceed without additional funding. In order to meet the proposed in-service date of September 2011, the current schedule highlights the period between October 2006 and April 2007 to secure additional funds. Additional senior government funds will be required before construction can commence.
Section 11 – Conclusions/Recommendations Page 76
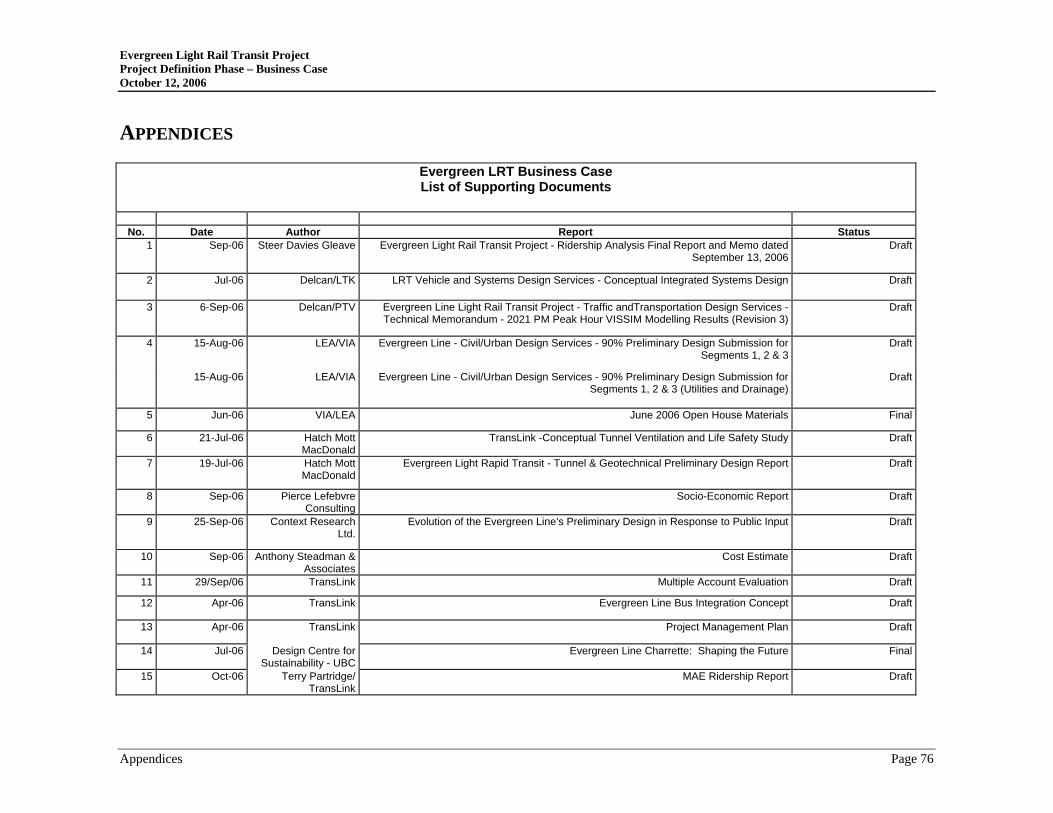
Evergreen Light Rail Transit Project Project Definition Phase – Business Case October 12, 2006
APPENDICES
Evergreen LRT Business Case List of Supporting Documents
No. Date Author Report Status
1 Sep-06 Steer Davies Gleave Evergreen Light Rail Transit Project - Ridership Analysis Final Report and Memo dated September 13, 2006
Draft
2 Jul-06 Delcan/LTK LRT Vehicle and Systems Design Services - Conceptual Integrated Systems Design Draft
3 6-Sep-06 Delcan/PTV Evergreen Line Light Rail Transit Project - Traffic andTransportation Design Services - Technical Memorandum - 2021 PM Peak Hour VISSIM Modelling Results (Revision 3)
Draft
4 15-Aug-06 LEA/VIA Evergreen Line - Civil/Urban Design Services - 90% Preliminary Design Submission for Segments 1, 2 & 3
Draft
15-Aug-06 LEA/VIA Evergreen Line - Civil/Urban Design Services - 90% Preliminary Design Submission for Segments 1, 2 & 3 (Utilities and Drainage)
Draft
5 Jun-06 VIA/LEA June 2006 Open House Materials Final
6 21-Jul-06 Hatch MottMacDonald
TransLink -Conceptual Tunnel Ventilation and Life Safety Study Draft
7 19-Jul-06 Hatch MottMacDonald
Evergreen Light Rapid Transit - Tunnel & Geotechnical Preliminary Design Report Draft
8 Sep-06 Pierce LefebvreConsulting
Socio-Economic Report Draft
9 25-Sep-06 Context ResearchLtd.
Evolution of the Evergreen Line's Preliminary Design in Response to Public Input Draft
10 Sep-06 Anthony Steadman & Associates
Cost Estimate Draft
11 29/Sep/06 TransLink Multiple Account Evaluation Draft
12 Apr-06 TransLink Evergreen Line Bus Integration Concept Draft
13 Apr-06 TransLink Project Management Plan Draft
14 Jul-06 Design Centre for Sustainability - UBC
Evergreen Line Charrette: Shaping the Future Final
15 Oct-06 Terry Partridge/TransLink
MAE Ridership Report Draft
Appendices Page 76
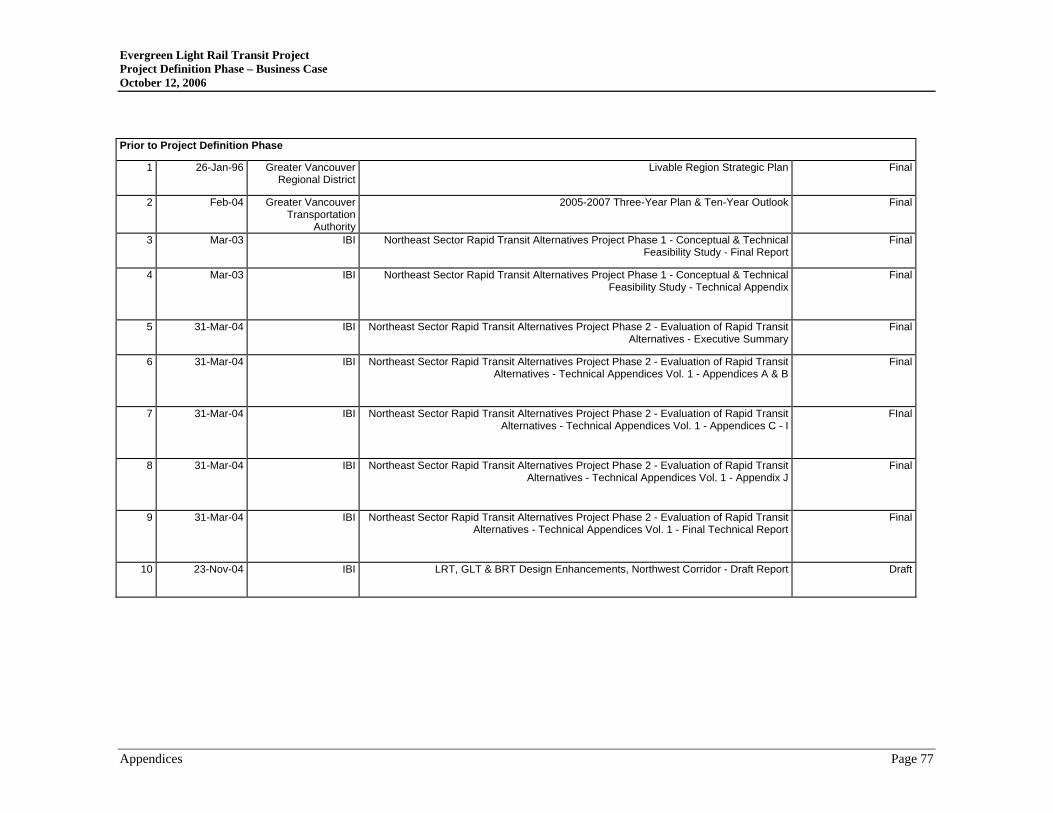
Evergreen Light Rail Transit Project Project Definition Phase – Business Case October 12, 2006
Prior to Project Definition Phase
1 26-Jan-96 Greater VancouverRegional District
Livable Region Strategic Plan Final
2 Feb-04 Greater VancouverTransportation
Authority
2005-2007 Three-Year Plan & Ten-Year Outlook Final
3 Mar-03 IBI Northeast Sector Rapid Transit Alternatives Project Phase 1 - Conceptual & Technical Feasibility Study - Final Report
Final
4 Mar-03 IBI Northeast Sector Rapid Transit Alternatives Project Phase 1 - Conceptual & Technical Feasibility Study - Technical Appendix
Final
5 31-Mar-04 IBI Northeast Sector Rapid Transit Alternatives Project Phase 2 - Evaluation of Rapid Transit Alternatives - Executive Summary
Final
6 31-Mar-04 IBI Northeast Sector Rapid Transit Alternatives Project Phase 2 - Evaluation of Rapid Transit Alternatives - Technical Appendices Vol. 1 - Appendices A & B
Final
7 31-Mar-04 IBI Northeast Sector Rapid Transit Alternatives Project Phase 2 - Evaluation of Rapid Transit Alternatives - Technical Appendices Vol. 1 - Appendices C - I
FInal
8 31-Mar-04 IBI Northeast Sector Rapid Transit Alternatives Project Phase 2 - Evaluation of Rapid Transit Alternatives - Technical Appendices Vol. 1 - Appendix J
Final
9 31-Mar-04 IBI Northeast Sector Rapid Transit Alternatives Project Phase 2 - Evaluation of Rapid Transit Alternatives - Technical Appendices Vol. 1 - Final Technical Report
Final
10 23-Nov-04 IBI LRT, GLT & BRT Design Enhancements, Northwest Corridor - Draft Report Draft
Appendices Page 77