Embed Size (px)
Citation preview
Managing for Results in America’s Great
City Schools
A Report of the Performance Measurement and Benchmarking Project
October 2012

z
Council of the Great City Schools
Page ii October 2012
© Council of the Great City Schools 2012, 2011, 2010, 2009, 2008, 2007, 2006.

Managing for Results in America’s Great City Schools
Performance Measurement and Benchmarking Project
October 2012 Page iii
To Members of the Council of the Great City Schools—
The Council of the Great City Schools is pleased to present Managing for Results in America’s Great City
Schools, 2012 to the membership and the public. The report is the product of the Performance Measurement
and Benchmarking Project that the Council began in 2002. The purpose of the project was and is to develop
performance measures that can improve the business operations of urban public school districts nationwide.
This year’s report includes data from 61 of the Council’s 67-member districts (91 percent) and provides a
fully tested set of Power Indicators that superintendents and school boards can use to assess the overall per-
formance of their district’s business operations. It also provides a set of what we call Essential Few Measures
that, along with the Power Indicators, can be used by chief executives to assess the performance of individual
departments and operations. Although not part of this written report, the project also provides a series of
basic key performance indicators that department heads can use to inform and improve performance on the
higher-level measures. In total, the project includes over 300 Key Performance Indicators (KPIs).
This report also provides an overview of the automated ActPoint® KPI performance management system,
which was developed in partnership with TransACT Communications, Inc. Act Point® KPI is a fully-
automated intelligence tool that allows districts to input raw data into smart on-line surveys; measure per-
formance on selected Key Performance Indicators; compare performance to peer groups; and manage results
for improved performance using the data-modeling tool. For the first time, the Council used the ActPoint®
KPI system to produce this year’s written report, Managing for Results in America’s Great City Schools, 2012.
This report also provides Case Studies of Best Practices that answer the question, “What are the effective man-
agement practices of top performing urban school districts that allow them to run effective financial and
business operations?” The intention of these case studies is to document practices underneath positive indi-
cators and to increase collaboration between executives of top-performing districts and districts striving to
improve their performance. Ultimately, we hope to enhance urban schools’ ability to learn from each other
and to better determine how large urban school systems work and what it takes to improve them.
The Performance Management and Benchmarking Project will continue to be one of the Council’s most im-
portant initiatives and one of the most innovative and promising developments in public education in many
years. The Council will continue to develop new performance measures that focus on the “value-added” prop-
osition of using data to spur accountability and improvement. We will be working with TransACT to ensure
that the automated system has the flexibility and functionality needed by school district executives. And we
will continue developing case studies that identify practices among top-performing districts that help explain
exemplary results.
Finally, we appreciate the continued guidance and support provided by Michael Eugene, Chief Operating Of-
ficer of the Orange County Public Schools; Don Kennedy, Chief Operations/Finance Officer of the Bridgeport
Public Schools; Fred Schmitt, retired Chief Financial Officer of the Norfolk Public Schools; Tom Ryan, retired
Chief Information Officer of the Albuquerque Public Schools; and the teams of urban school managers and
technical advisors. And we offer special thanks to Jonathon Lachlan-Haché, the Council’s Special Projects Spe-
cialist, who prepared this report. Thank you.
Michael Casserly Robert Carlson
Executive Director Director, Management Services
Council of the Great City Schools Council of the Great City Schools

z
Council of the Great City Schools
Page iv October 2012
Managing for Results in America’s Great City Schools
Performance Measurement and Benchmarking Project
October 2012 Page 1
Table of Contents Introduction ....................................................................................................................................................................... 5
Key Performance Indicators .......................................................................................................................................... 7
FINANCE .............................................................................................................................................................................................. 9
Accounts Payable ..................................................................................................................................................................... 11 AP Department Costs per $1,000 of AP Dollars Spent ........................................................................................................... 12 Cost Per Invoice ......................................................................................................................................................................................... 13 Number of Days to Process a Vendor Payment ......................................................................................................................... 14 Invoices Processed per FTE per Month .......................................................................................................................................... 15 Non-PO Invoices Processed per FTE per Month ........................................................................................................................ 16 PO Invoices Processed per FTE per Month................................................................................................................................... 17 Voided Checks per Total Checks ........................................................................................................................................................ 18
Cash Management .................................................................................................................................................................... 19 Fund Reserves as Percent of Total Revenue ................................................................................................................................ 20 Short-Term Loans per $1,000 Operating Expenditures ........................................................................................................ 21 Investment Earnings per $1,000 Revenue.................................................................................................................................... 22 Actual Investment Yield above/below Benchmark ................................................................................................................. 23 Weighted Average Yield ........................................................................................................................................................................ 24 Cash On Hand (Average Month-End) per $1,000 Revenue .................................................................................................. 25 Months below Target Liquidity Baseline ...................................................................................................................................... 26 Fund Reserves above/below District Policy (per $1,000 Revenue) ................................................................................ 27
Compensation ........................................................................................................................................................................... 29 Cost per $1,000 of Payroll Dollars Spent ...................................................................................................................................... 30 Cost per Pay Check ................................................................................................................................................................................... 31 Pay Checks Processed per FTE per Month ................................................................................................................................... 32 Percent Off-Cycle Payroll Checks Produced Annually ............................................................................................................ 33 Overtime Hours per Payroll Employee .......................................................................................................................................... 34 Payroll-To-District Staffing Ratio .................................................................................................................................................... 35 Payroll Managerial Cost per $1m of Payroll Dollars Spent ................................................................................................ 36 Personnel Record Self-Service Usage (All Types) ..................................................................................................................... 37
Financial Management ........................................................................................................................................................... 39 General Fund Balance Ratio – Unrestricted (GASB 54) ........................................................................................................ 40 General Fund Balance Ratio – Unreserved .................................................................................................................................. 41 General Fund Balance Ratio – Unreserved, Undesignated .................................................................................................. 42 Debt Service Burden per $1,000 Revenue .................................................................................................................................... 43 General Fund Revenues Efficiency (Final Amended Budget as a Percent of Actual) ............................................. 44 General Fund Expenditures Efficiency (Final Amended Budget as a Percent of Actual) ..................................... 45 General Fund Revenues Efficiency (Adopted/Approved Budget as a Percent of Actual) .................................... 46 General Fund Expenditures Efficiency (Adopted/Approved Budget as a Percent of Actual) ............................ 47
z
Council of the Great City Schools
Page 2 October 2012
Grants Management ................................................................................................................................................................ 49 Aging of Grants Receivables (Weighted Average) ................................................................................................................... 50 Grant Funded FTE Dependence ......................................................................................................................................................... 51 Lost Grant Funds per $1m Grant Revenue ................................................................................................................................... 52
Human Resources .................................................................................................................................................................... 53 Average Days to Fill Vacancy – Classroom Teachers ............................................................................................................. 54 Average Days to Fill Vacancy – Non-Teacher Non-Salaried Employees ...................................................................... 55 Average Days to Fill Vacancy – Non-Teacher Salaried Employees ................................................................................. 56 Turnover Rate – Classroom Teachers (Full-Time) .................................................................................................................. 57 Turnover Rate – Classroom Teachers (Part-Time) ................................................................................................................. 58 Turnover Rate – Non-Teacher Non-Salaried Employees ..................................................................................................... 59 Turnover Rate – Non-Teacher Salaried Employees ................................................................................................................ 60
Procurement .............................................................................................................................................................................. 61 Purchasing Department Costs per Procurement Dollar Spent.......................................................................................... 62 Cost Per Purchase Order ....................................................................................................................................................................... 63 Procurement Savings Ratio ................................................................................................................................................................. 64 Competitive Procurements Ratio ...................................................................................................................................................... 65 Strategic Sourcing Ratio ....................................................................................................................................................................... 66 P-Card Purchasing Ratio ...................................................................................................................................................................... 67 P-Card Transactions Ratio ................................................................................................................................................................... 68 Electronic Procurement Transactions Ratio .............................................................................................................................. 69 Procurement Administrative Lead Time – Formal Proposals (Days) ............................................................................ 70 Procurement Administrative Lead Time – Formal Sealed Bids (Days) ........................................................................ 71 Procurement Administrative Lead Time – Informal Proposals (Days) ......................................................................... 72 Certified Professional Procurement Staff Ratio ........................................................................................................................ 73
Risk Management..................................................................................................................................................................... 75 Cost of Risk per Student ......................................................................................................................................................................... 76 Annual Workers' Compensation Cost per Employee .............................................................................................................. 77 Average Cost per Workers' Compensation Claim ..................................................................................................................... 78 Workers' Compensation Lost Work Days per 1,000 Employees ....................................................................................... 79 Workers' Compensation Costs as Percentage of Payroll ...................................................................................................... 80 Average Cost per Liability Claim ...................................................................................................................................................... 81 Liability Claims per 1,000 Students ................................................................................................................................................. 82 Percent of Liability Claims Litigated .............................................................................................................................................. 83 Employee Incident Rate (Incidents/1,000 Employees) ......................................................................................................... 84 Employee Incident Rate (Incidents per 100,000 Work Hours) ......................................................................................... 85
OPERATIONS .................................................................................................................................................................................. 87
Food Services............................................................................................................................................................................. 89 Total Costs per Revenue ........................................................................................................................................................................ 90 Fund Balance as Percent of Revenue .............................................................................................................................................. 91 Breakfast Participation Rate .............................................................................................................................................................. 92 Lunch Participation Rate ..................................................................................................................................................................... 93 Food Costs per Revenue ......................................................................................................................................................................... 94 Labor Costs per Revenue ....................................................................................................................................................................... 95 Meals per Labor Hour............................................................................................................................................................................. 96 Elementary Breakfast Participation Rate.................................................................................................................................... 97 Elementary Lunch Participation Rate ........................................................................................................................................... 98 Secondary Breakfast Participation Rate ...................................................................................................................................... 99
Managing for Results in America’s Great City Schools
Performance Measurement and Benchmarking Project
October 2012 Page 3
Secondary Lunch Participation Rate ........................................................................................................................................... 100
Maintenance and Operations ............................................................................................................................................. 101 Custodial Cost per Square Foot ...................................................................................................................................................... 102 Custodial Cost per Student ................................................................................................................................................................ 103 Custodial Workload .............................................................................................................................................................................. 104 Maintenance Cost per Square Foot .............................................................................................................................................. 105 Maintenance Cost per Student ........................................................................................................................................................ 106 Work Order Completion Time (Days).......................................................................................................................................... 107 Utility Usage per Square Foot ......................................................................................................................................................... 108 M&O Expenditures as a Percent of General Fund Expenditures .................................................................................... 109 Custodial Supply Cost per Square Foot ....................................................................................................................................... 110 Water Usage per Square Foot ......................................................................................................................................................... 111 Percentage of District Buildings That Recycle........................................................................................................................ 112 Percentage of LEED Designed Buildings.................................................................................................................................... 113
Safety and Security ................................................................................................................................................................ 115 Safety and Security Expenditures as Percent of District General Fund Expenditures ........................................ 116 Percent of School Sites Requiring Employee ID Badges..................................................................................................... 117 Percent of Non-School Sites Requiring Employee ID Badges .......................................................................................... 118 Percent of School Sites Requiring Visitor ID Badges ........................................................................................................... 119 Percent of Non-School Sites Requiring Visitor ID Badges ................................................................................................. 120 Hours of Training per District Security and Law Enforcement Member .................................................................. 121 Hours of Training per District Security Member ................................................................................................................... 122 Hours of Training per District Law Enforcement Member .............................................................................................. 123 Arrests on School Sites per 1,000 Students ............................................................................................................................... 124 District Uniformed Personnel per 1,000 Students ................................................................................................................ 125 Percent of School Sites with Alarm Systems ............................................................................................................................ 126 Percent of Non-School Sites with Alarm Systems .................................................................................................................. 127
Transportation ........................................................................................................................................................................ 129 Transportation Cost per Rider ........................................................................................................................................................ 130 Cost per Total Mile Operated – All Buses ................................................................................................................................... 131 On-Time Performance – All Buses – Using </= 10 Minute Interval ............................................................................. 132 Daily Buses as Percent of Total Buses ......................................................................................................................................... 133 Average Age of Fleet (Years) ........................................................................................................................................................... 134 Fleet in Service ........................................................................................................................................................................................ 135 Daily Runs per Bus ................................................................................................................................................................................ 136 Cost Per District-Operated Bus ....................................................................................................................................................... 137 Cost Per Contractor-Operated Bus ............................................................................................................................................... 138 Turn Time to Place New Student On Bus (Days) – Non-SPED ........................................................................................ 139 Turn Time to Place New Student on Bus (Days) – SPED Student with IEP .............................................................. 140 Miles between Accidents .................................................................................................................................................................... 141 Miles between Preventable Accidents ......................................................................................................................................... 142 Bus Attendants/Monitors per Bus Run ....................................................................................................................................... 143 Buses per Mechanic .............................................................................................................................................................................. 144 Routes per Planner................................................................................................................................................................................ 145 Buses Equipped With GPS Technology ....................................................................................................................................... 146 Alternatively-Fueled Buses ............................................................................................................................................................... 147 District Fuel Cost As Percent of Retail - Diesel ........................................................................................................................ 148 District Fuel Cost As Percent of Retail – Gasoline ................................................................................................................. 149 Students (SPED) With Home Pick-Up .......................................................................................................................................... 150 District Bus Pass/Token Cost as Percent of Retail ................................................................................................................ 151
z
Council of the Great City Schools
Page 4 October 2012
INFORMATION TECHNOLOGY ................................................................................................................................................ 153
Information Technology ...................................................................................................................................................... 155 IT Expenditures per Student ............................................................................................................................................................ 156 IT Expenditures as Percent of General Fund Expenditures .............................................................................................. 157 IT Expenditures per District FTE ................................................................................................................................................... 158 Average Age of Computers ................................................................................................................................................................ 159 Ratio of Students to Computers ...................................................................................................................................................... 160 Bandwidth per Student ....................................................................................................................................................................... 161 Network (WAN) Cost per Student ................................................................................................................................................. 162 First Contact Resolution Rate.......................................................................................................................................................... 163 Help Desk Staffing Cost per Ticket ................................................................................................................................................ 164 Support Tier 2/3 Staffing Costs per Ticket ............................................................................................................................... 165 Number of Days Network Usage Exceeds 75% of Capacity ............................................................................................. 166 E-Mail System Downtime (in Minutes) ....................................................................................................................................... 167 ERP System Downtime (in Minutes) ............................................................................................................................................ 168 Finance System Downtime (in Minutes) .................................................................................................................................... 169 HR System Downtime (in Minutes) ............................................................................................................................................... 170 Payroll System Downtime (in Minutes) ...................................................................................................................................... 171 SIS System Downtime (in Minutes) ............................................................................................................................................... 172
Appendices .................................................................................................................................................................... 173
The Performance Management System ............................................................................................................................... 175
Case Studies of Best Practices ................................................................................................................................................. 183
Grants Management .............................................................................................................................................................. 185
Accounts Payable ................................................................................................................................................................... 199

Managing for Results in America’s Great City Schools
Performance Measurement and Benchmarking Project
October 2012 Page 5
Introduction
This report—Managing for Results in America’s Great City Schools, 2012—is the culmination of nearly 10
years of work by the Council of the Great City Schools and its members to develop performance measures that
can be used to improve business operations in urban public school districts nationwide. The Council and its
members knew that improving effectiveness and efficiency in urban school operations were critical to regain-
ing the public’s confidence in America’s Great City Schools.
The Council launched the Performance Measurement and Benchmarking Project in 2002 to achieve these ob-
jectives. The purposes of the project, developed during annual meetings of the Council’s Chief Financial Offic-
ers and Chief Operating Officers, were to—
Establish a common set of key performance indicators in a range of big-city school operations, including business services, finances, human resources, and technology.
Benchmark and compare the performance of the nation’s largest urban public school systems on these key performance indicators.
Use the results to improve operational performance in urban public schools.
Since its inception, the project has been led by two Council task forces operating under the aegis of the organ-
ization’s Board of Directors: the Task Force on Leadership, Governance, and Management, and the Task Force
on Finance. The project’s work has been conducted by a team of member-district managers and technical ad-
visors with extensive expertise in the following functional areas: business services (transportation, food ser-
vices, maintenance and operations, safety and security), budget and finance (accounts payable, financial man-
agement, grants management, risk management, compensation, procurement and cash management), infor-
mation technology, and human resources.
The project has used a sophisticated approach to collect, validate, and analyze school-system data. And it has
used a complex Six Sigma methodology to ensure the comparability, integrity, uniformity, reliability, and va-
lidity of data across school districts.
As this year’s report indicates, the Performance Management and Benchmarking Project has evolved and ma-
tured in three major areas. It now includes—
A fully-tested set of Key Performance Indicators (KPIs) designed to report performance at three levels:
Strategic and policy level – Power Indicators that can be used by superintendents and school boards to assess the overall performance of their district’s non-instructional operations.
z
Council of the Great City Schools
Page 6 Introduction October 2012
Management level – Essential Few Measures that, along with the Power Indicators, can be used by chief executives to assess the performance of individual departments and divisions.
Technical level – Performance Measures that can be used by department heads to drive the perfor-mance of the higher-level measures.
An automated Performance-Measurement System (ActPoint® KPI) with multiple features:
An on-line survey instrument for data collection,
Automated calculations and analyses of performance-indicator data,
Presentation of data on a dashboard and in a graphic format that compare member districts and their operations on uniform benchmarks,
Business Intelligence (BI) tools that allow districts to ask what/if questions and conduct data model-ing exercises to test and validate policy options to improve results, and
A reporting function that allows districts to customize reports for improved analysis.
Case Studies of Best Practices, which identify effective management practices of top-performing districts so other districts can improve.
Next Steps
The Performance Management and Benchmarking Project will continue to be one of the Council’s most im-
portant initiatives and one of the most innovative and promising developments in public education in many
years. It will also continue to be an essential tool for providing immediate strategic performance data, helping
executives identify areas in need of improvement, connecting districts to higher-performing peers, and plan-
ning and validating performance targets.
As the project moves forward, the Council will continue to develop new performance measures that focus on
the “value-added” proposition of using data to spur accountability; clarify goals and priorities; measure pro-
gress; enhance transparency; reduce vulnerability to negative press; and improve policy options. We will be
working with TransACT to ensure that the automated system has the flexibility and functionality needed by
school district executives. And we will also continue developing case studies to identify practices among top-
performing districts that help explain exemplary results.
Managing for Results in America’s Great City Schools
Performance Measurement and Benchmarking Project
October 2012 Page 7
Key Performance Indicators

Council of the Great City Schools
Page 8 Key Performance Indicators October 2012

Managing for Results in America’s Great City Schools
Performance Measurement and Benchmarking Project
October 2012 Page 9
FINANCE

Council of the Great City Schools
Page 10 Key Performance Indicators October 2012
Managing for Results in America’s Great City Schools
Performance Measurement and Benchmarking Project
October 2012 Accounts Payable Page 11
FIN
AN
CE
A
ccou
nts P
ay
ab
le
Accounts Payable
Performance metrics in Accounts Payable (AP) focus on the cost efficiency, productivity, and ser-
vice levels of invoice processing. Cost efficiency is represented most broadly by examining AP
Department Costs per $1,000 AP Dollars Spent, which evaluates the entire cost of the AP de-
partment against the total payout (spending) of accounts payable. This metric is supported by a
similar metric, Cost per Invoice, which looks at the number of invoices processed rather than
payout amounts.
Productivity is measured by looking at Invoices Processed per FTE per Month, and service levels
are captured, in part, by examining Number of Days to Process Vendor Payments. When com-
bined with the cost efficiency measures, district leaders have a baseline of information to deter-
mine whether their AP function:
Needs better automation to process invoices
Is overstaffed or has staff that is under-trained or under-qualified
Should revise internal controls to improve accuracy
Needs better oversight and reporting procedures relative to the head of finance
Z
Council of the Great City Schools
Page 12 Key Performance Indicators October 2012
FIN
AN
CE
A
cco
un
ts P
ay
ab
le
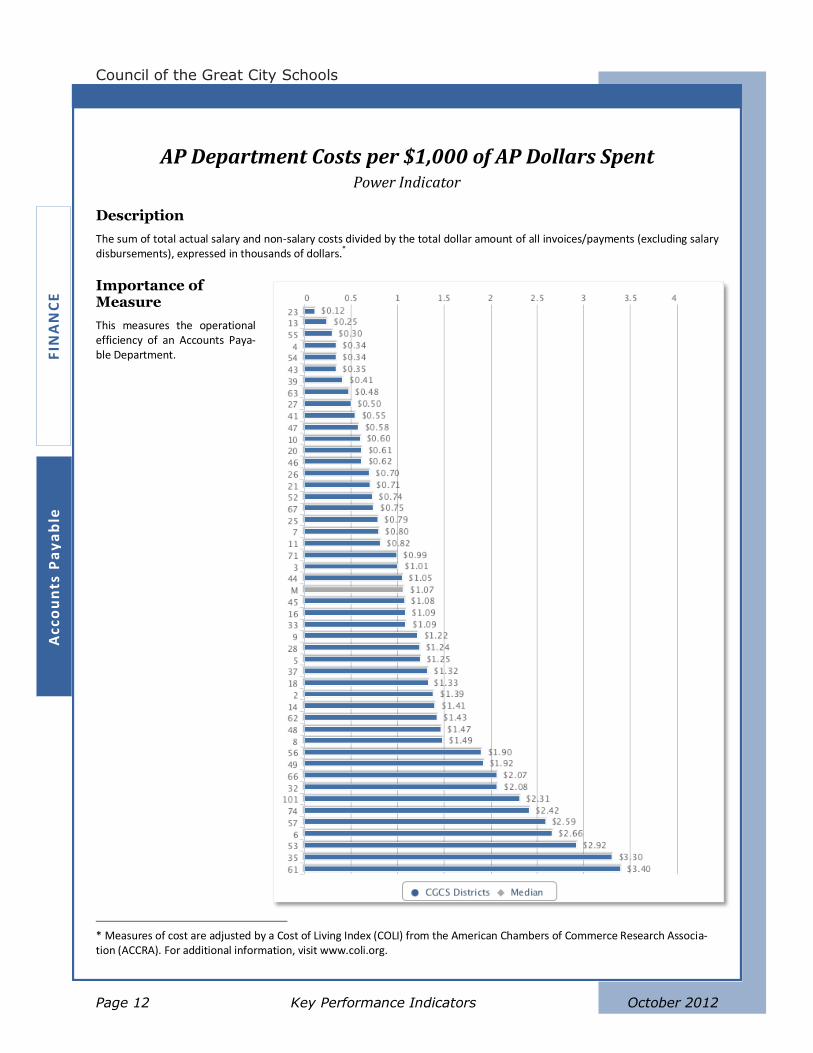
AP Department Costs per $1,000 of AP Dollars Spent Power Indicator
Description
The sum of total actual salary and non-salary costs divided by the total dollar amount of all invoices/payments (excluding salary disbursements), expressed in thousands of dollars.
*
Importance of Measure
This measures the operational efficiency of an Accounts Paya-ble Department.
* Measures of cost are adjusted by a Cost of Living Index (COLI) from the American Chambers of Commerce Research Associa-tion (ACCRA). For additional information, visit www.coli.org.
Managing for Results in America’s Great City Schools
Performance Measurement and Benchmarking Project
October 2012 Accounts Payable Page 13
FIN
AN
CE
A
cco
un
ts Pa
ya
ble
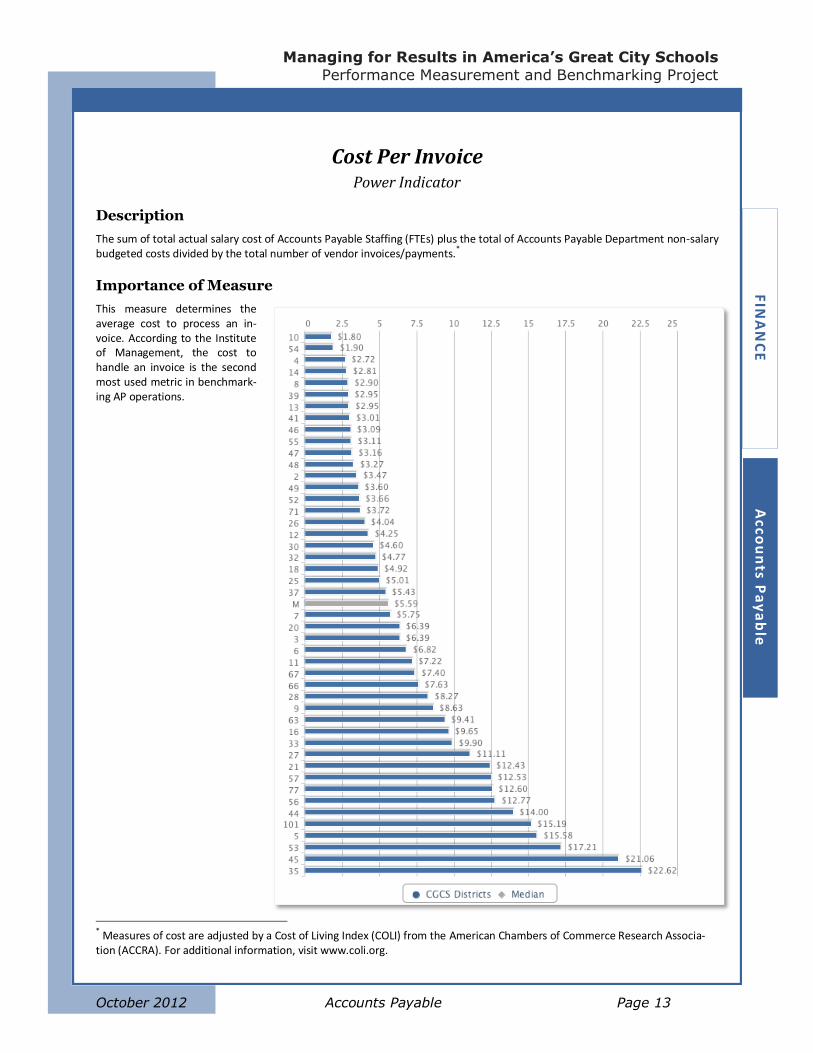
Cost Per Invoice Power Indicator
Description
The sum of total actual salary cost of Accounts Payable Staffing (FTEs) plus the total of Accounts Payable Department non-salary budgeted costs divided by the total number of vendor invoices/payments.
*
Importance of Measure
This measure determines the average cost to process an in-voice. According to the Institute of Management, the cost to handle an invoice is the second most used metric in benchmark-ing AP operations.
* Measures of cost are adjusted by a Cost of Living Index (COLI) from the American Chambers of Commerce Research Associa-tion (ACCRA). For additional information, visit www.coli.org.
Z
Council of the Great City Schools
Page 14 Key Performance Indicators October 2012
FIN
AN
CE
A
cco
un
ts P
ay
ab
le
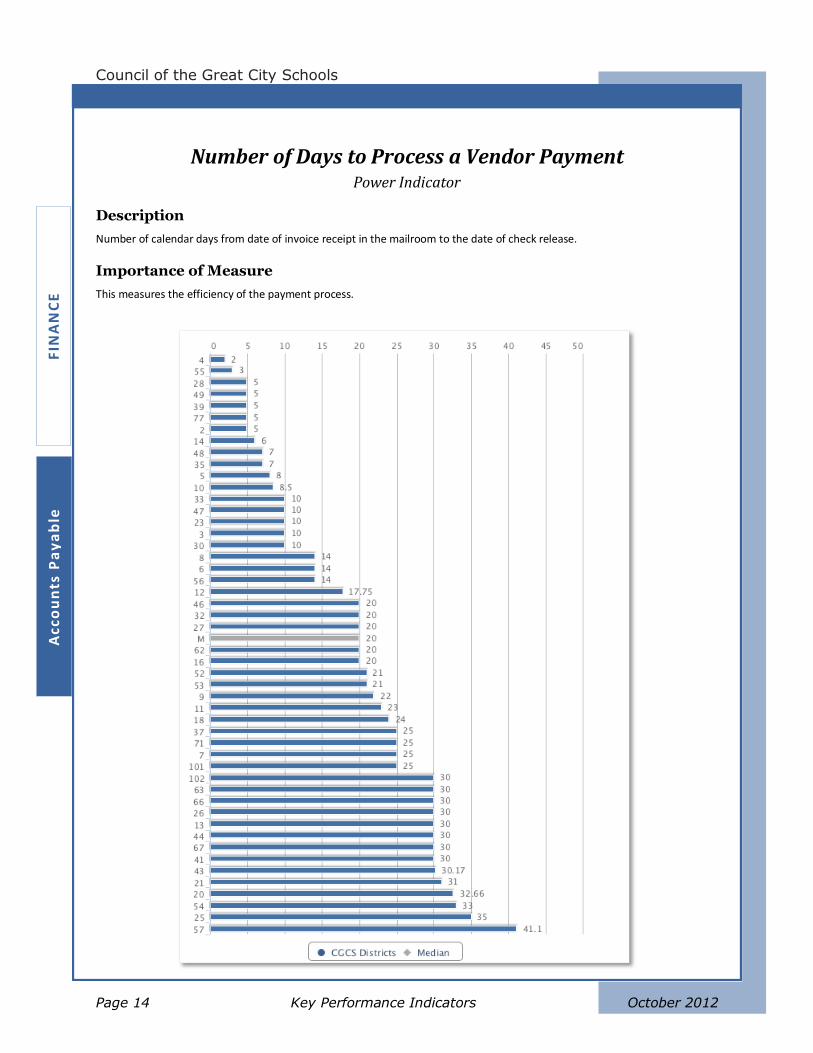
Number of Days to Process a Vendor Payment Power Indicator
Description
Number of calendar days from date of invoice receipt in the mailroom to the date of check release.
Importance of Measure
This measures the efficiency of the payment process.
Managing for Results in America’s Great City Schools
Performance Measurement and Benchmarking Project
October 2012 Accounts Payable Page 15
FIN
AN
CE
A
ccou
nts P
ay
ab
le
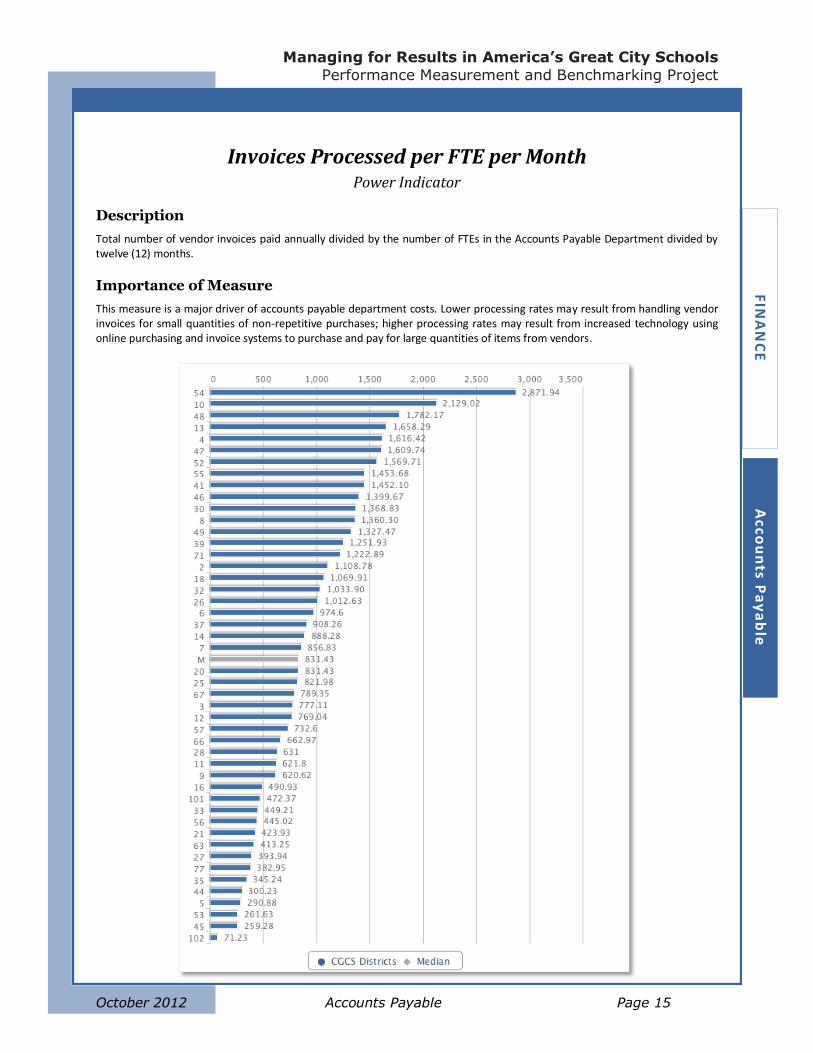
Invoices Processed per FTE per Month Power Indicator
Description
Total number of vendor invoices paid annually divided by the number of FTEs in the Accounts Payable Department divided by twelve (12) months.
Importance of Measure
This measure is a major driver of accounts payable department costs. Lower processing rates may result from handling vendor invoices for small quantities of non-repetitive purchases; higher processing rates may result from increased technology using online purchasing and invoice systems to purchase and pay for large quantities of items from vendors.
Z
Council of the Great City Schools
Page 16 Key Performance Indicators October 2012
FIN
AN
CE
A
cco
un
ts P
ay
ab
le
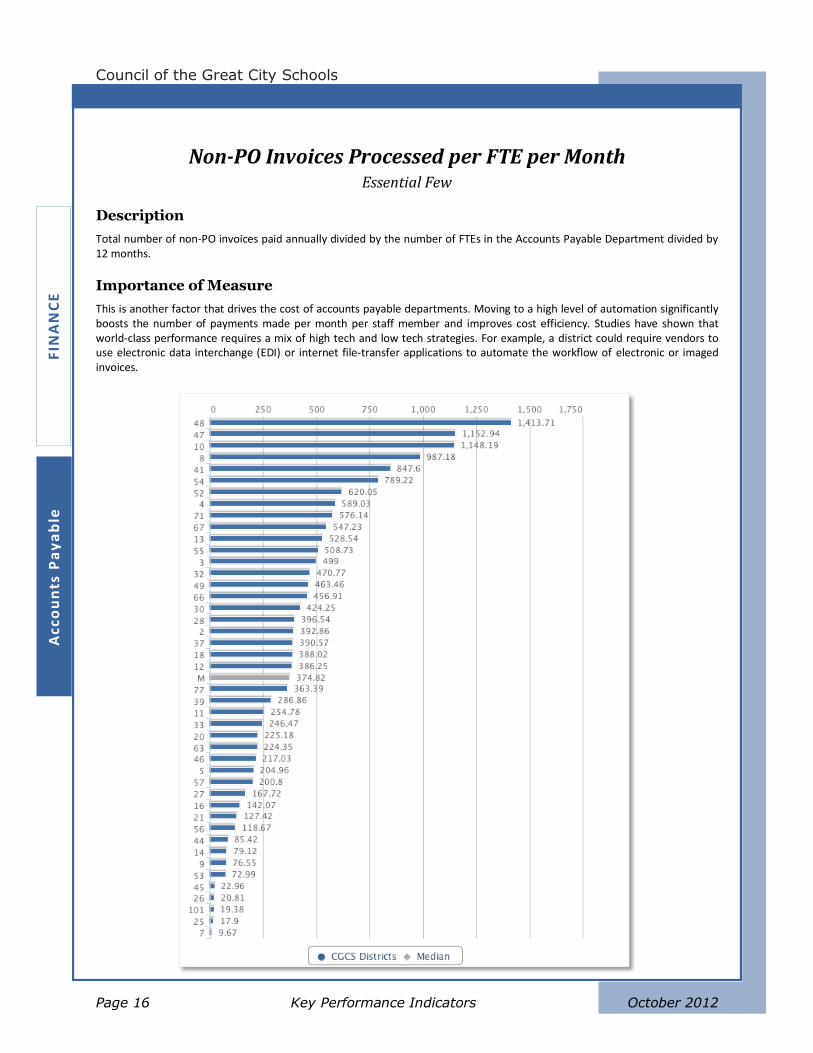
Non-PO Invoices Processed per FTE per Month Essential Few
Description
Total number of non-PO invoices paid annually divided by the number of FTEs in the Accounts Payable Department divided by 12 months.
Importance of Measure
This is another factor that drives the cost of accounts payable departments. Moving to a high level of automation significantly boosts the number of payments made per month per staff member and improves cost efficiency. Studies have shown that world-class performance requires a mix of high tech and low tech strategies. For example, a district could require vendors to use electronic data interchange (EDI) or internet file-transfer applications to automate the workflow of electronic or imaged invoices.
Managing for Results in America’s Great City Schools
Performance Measurement and Benchmarking Project
October 2012 Accounts Payable Page 17
FIN
AN
CE
A
ccou
nts P
ay
ab
le
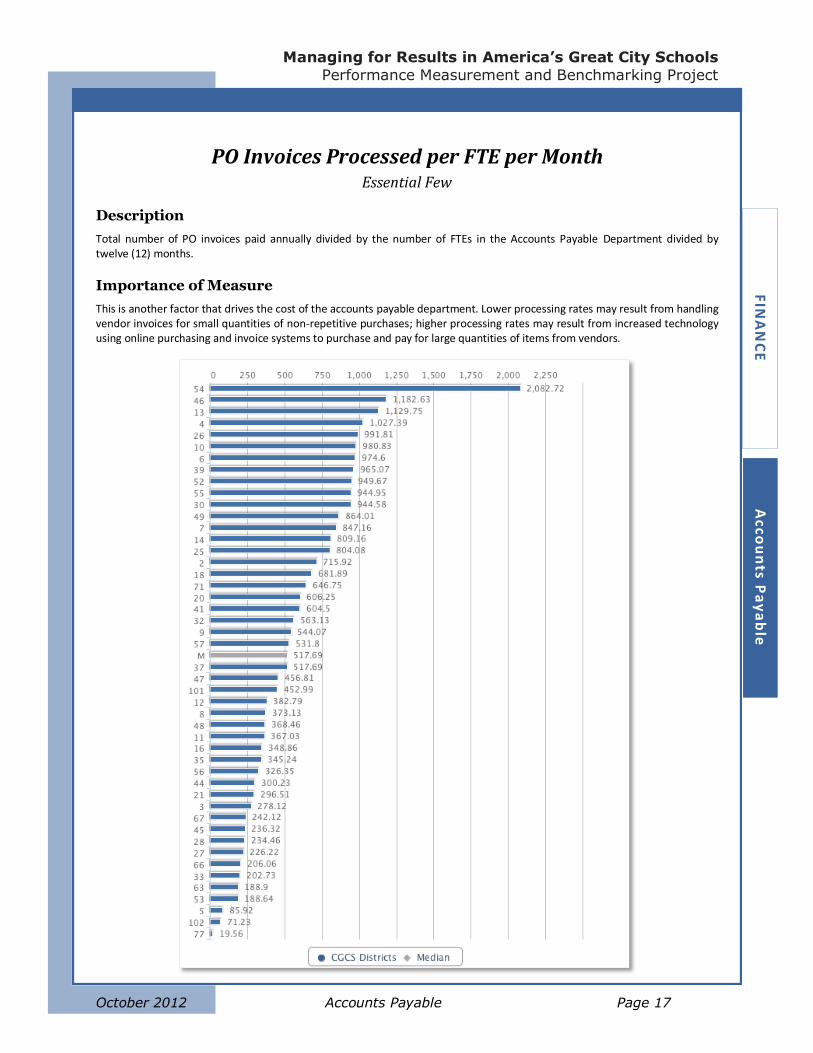
PO Invoices Processed per FTE per Month Essential Few
Description
Total number of PO invoices paid annually divided by the number of FTEs in the Accounts Payable Department divided by twelve (12) months.
Importance of Measure
This is another factor that drives the cost of the accounts payable department. Lower processing rates may result from handling vendor invoices for small quantities of non-repetitive purchases; higher processing rates may result from increased technology using online purchasing and invoice systems to purchase and pay for large quantities of items from vendors.
Z
Council of the Great City Schools
Page 18 Key Performance Indicators October 2012
FIN
AN
CE
A
cco
un
ts P
ay
ab
le
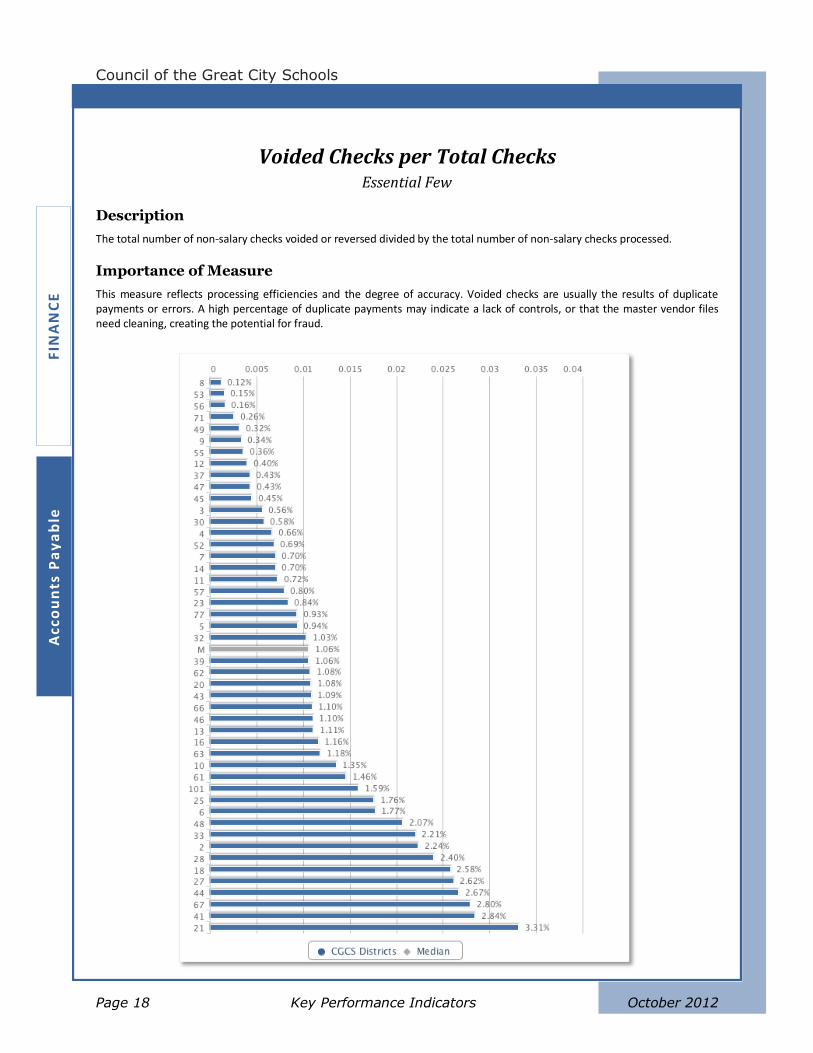
Voided Checks per Total Checks Essential Few
Description
The total number of non-salary checks voided or reversed divided by the total number of non-salary checks processed.
Importance of Measure
This measure reflects processing efficiencies and the degree of accuracy. Voided checks are usually the results of duplicate payments or errors. A high percentage of duplicate payments may indicate a lack of controls, or that the master vendor files need cleaning, creating the potential for fraud.

Managing for Results in America’s Great City Schools
Performance Measurement and Benchmarking Project
October 2012 Cash Management Page 19
FIN
AN
CE
C
ash
Ma
na
ge
me
nt
Cash Management
Cash management relies upon well-controlled cash-flow practices and adequate fund reserves.
Performance metrics that indicate healthy cash management include Cash On Hand (Average
Month-End) per $1,000 revenue; Months below Target Liquidity Level, and Fund Reserves as
Percent of Total Revenue.
When managed efficiently, these performance metrics will reduce the overall operational costs
of a district. Conversely, poor cash management may result in additional costs in the form of
short-term borrowing (represented by the metric Short-Term Loans per $1,000 Operating Ex-
penditures) and low investment yield (see Investment Earnings per $1,000 Revenue as well as
Actual Investment Yield above/below District Policy).
When evaluating cash-management performance, the following conditions should be considered
among the influencing factors:
Revenue inflows and expenditure outflows, and the accuracy of cash flow projections
School board and administrative policies requiring internal controls and transparency
Accounting standards
Borrowing eligibility and liquidity
State laws and regulations
Z
Council of the Great City Schools
Page 20 Key Performance Indicators October 2012
FIN
AN
CE
C
ash
Ma
na
ge
me
nt
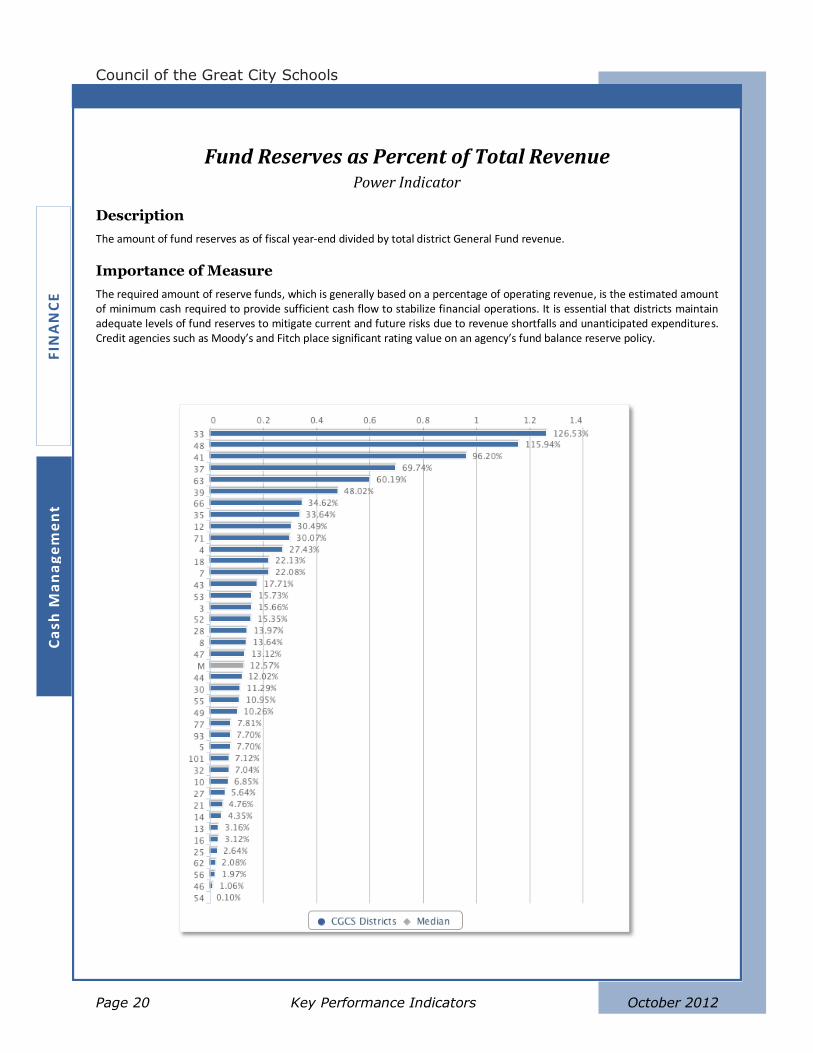
Fund Reserves as Percent of Total Revenue Power Indicator
Description
The amount of fund reserves as of fiscal year-end divided by total district General Fund revenue.
Importance of Measure
The required amount of reserve funds, which is generally based on a percentage of operating revenue, is the estimated amount of minimum cash required to provide sufficient cash flow to stabilize financial operations. It is essential that districts maintain adequate levels of fund reserves to mitigate current and future risks due to revenue shortfalls and unanticipated expenditures. Credit agencies such as Moody’s and Fitch place significant rating value on an agency’s fund balance reserve policy.
Managing for Results in America’s Great City Schools
Performance Measurement and Benchmarking Project
October 2012 Cash Management Page 21
FIN
AN
CE
C
ash
Ma
na
ge
me
nt
Short-Term Loans per $1,000 Operating Expenditures Power Indicator
Description
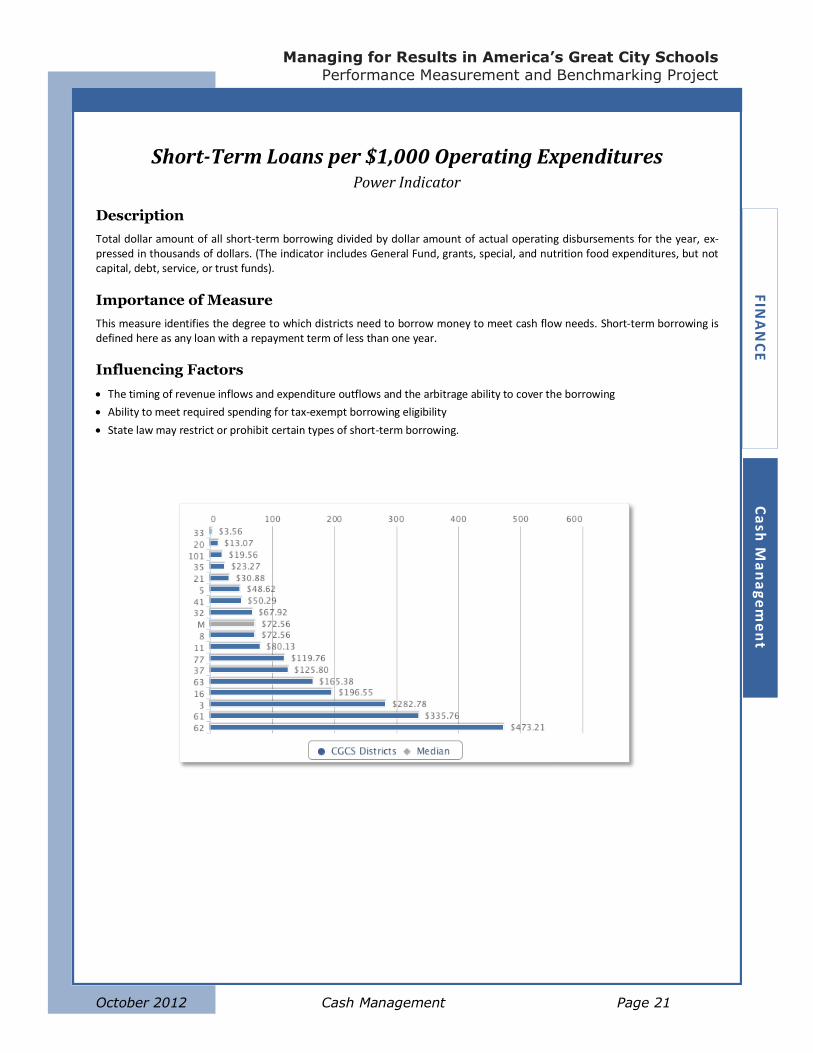
Total dollar amount of all short-term borrowing divided by dollar amount of actual operating disbursements for the year, ex-pressed in thousands of dollars. (The indicator includes General Fund, grants, special, and nutrition food expenditures, but not capital, debt, service, or trust funds).
Importance of Measure
This measure identifies the degree to which districts need to borrow money to meet cash flow needs. Short-term borrowing is defined here as any loan with a repayment term of less than one year.
Influencing Factors
The timing of revenue inflows and expenditure outflows and the arbitrage ability to cover the borrowing
Ability to meet required spending for tax-exempt borrowing eligibility
State law may restrict or prohibit certain types of short-term borrowing.

Z
Council of the Great City Schools
Page 22 Key Performance Indicators October 2012
FIN
AN
CE
C
ash
Ma
na
ge
me
nt
Investment Earnings per $1,000 Revenue Power Indicator
Description
General Fund investment earnings divided by total district General Fund revenue (expressed in thousands of dollars).
Importance of Measure
This measure analyzes the risk of the investments versus its projected returns.
Influencing Factors
Revenue types
Types of receipt percentages
Investments internal or external
Investment policy
Managing for Results in America’s Great City Schools
Performance Measurement and Benchmarking Project
October 2012 Cash Management Page 23
FIN
AN
CE
C
ash
Ma
na
ge
me
nt
Actual Investment Yield above/below Benchmark Power Indicator
Description
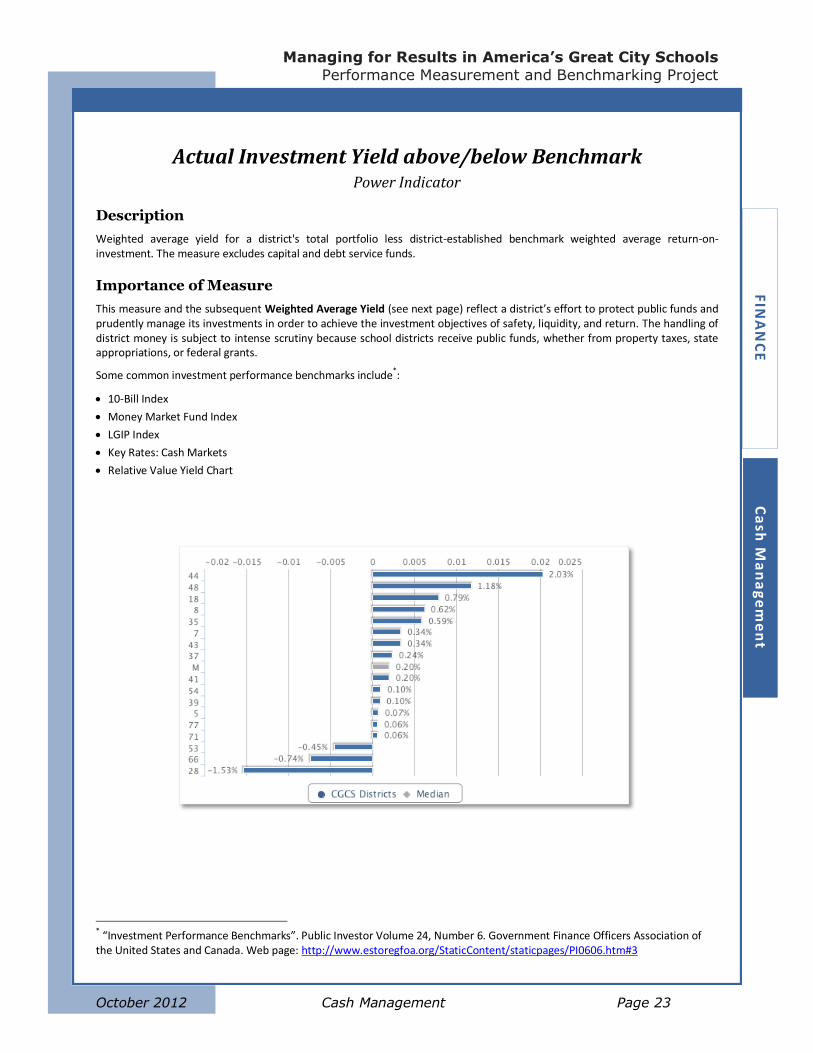
Weighted average yield for a district's total portfolio less district-established benchmark weighted average return-on-investment. The measure excludes capital and debt service funds.
Importance of Measure
This measure and the subsequent Weighted Average Yield (see next page) reflect a district’s effort to protect public funds and prudently manage its investments in order to achieve the investment objectives of safety, liquidity, and return. The handling of district money is subject to intense scrutiny because school districts receive public funds, whether from property taxes, state appropriations, or federal grants.
Some common investment performance benchmarks include*:
10-Bill Index
Money Market Fund Index
LGIP Index
Key Rates: Cash Markets
Relative Value Yield Chart
* “Investment Performance Benchmarks”. Public Investor Volume 24, Number 6. Government Finance Officers Association of the United States and Canada. Web page: http://www.estoregfoa.org/StaticContent/staticpages/PI0606.htm#3
Z
Council of the Great City Schools
Page 24 Key Performance Indicators October 2012
FIN
AN
CE
C
ash
Ma
na
ge
me
nt
Weighted Average Yield
Description
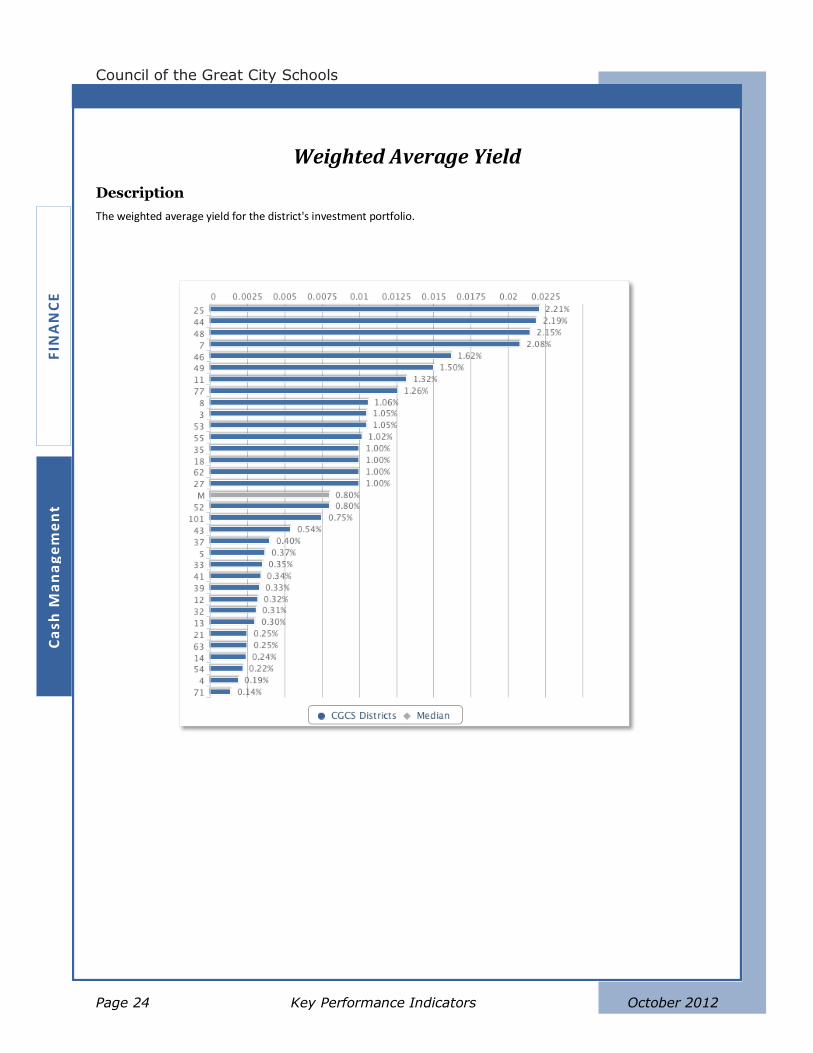
The weighted average yield for the district's investment portfolio.
Managing for Results in America’s Great City Schools
Performance Measurement and Benchmarking Project
October 2012 Cash Management Page 25
FIN
AN
CE
C
ash
Ma
na
ge
me
nt
Cash On Hand (Average Month-End) per $1,000 Revenue Essential Few
Description
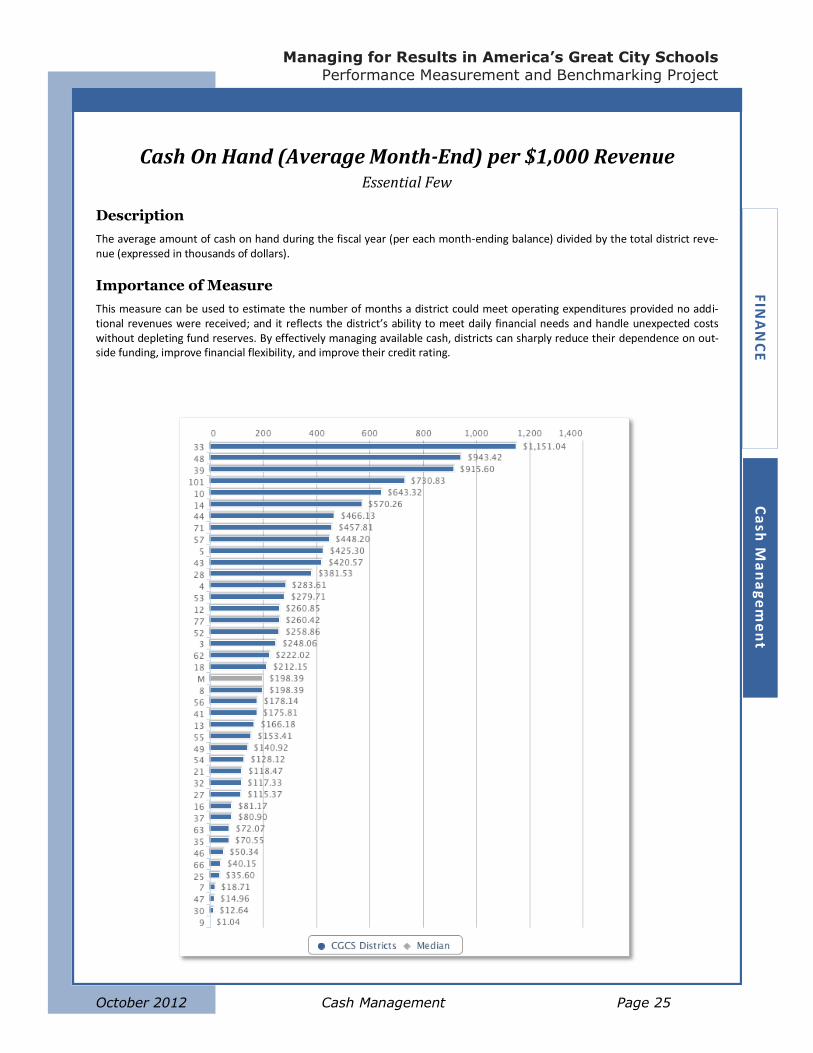
The average amount of cash on hand during the fiscal year (per each month-ending balance) divided by the total district reve-nue (expressed in thousands of dollars).
Importance of Measure
This measure can be used to estimate the number of months a district could meet operating expenditures provided no addi-tional revenues were received; and it reflects the district’s ability to meet daily financial needs and handle unexpected costs without depleting fund reserves. By effectively managing available cash, districts can sharply reduce their dependence on out-side funding, improve financial flexibility, and improve their credit rating.
Z
Council of the Great City Schools
Page 26 Key Performance Indicators October 2012
FIN
AN
CE
C
ash
Ma
na
ge
me
nt
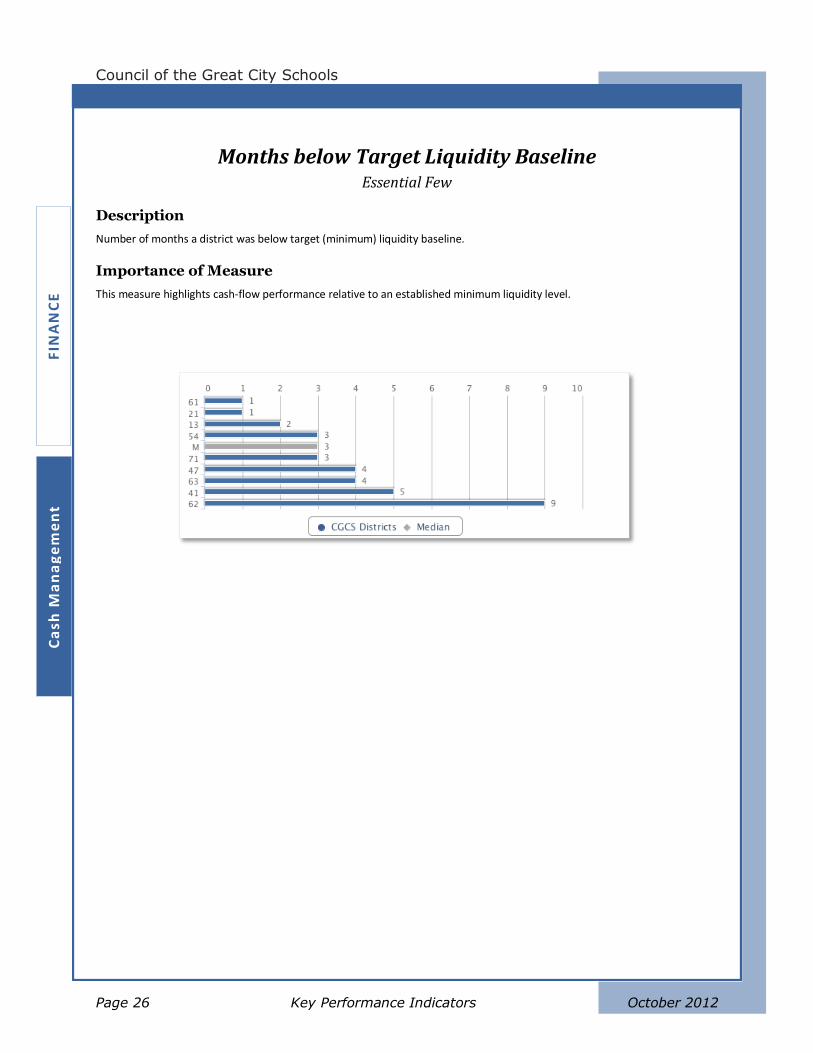
Months below Target Liquidity Baseline Essential Few
Description
Number of months a district was below target (minimum) liquidity baseline.
Importance of Measure
This measure highlights cash-flow performance relative to an established minimum liquidity level.
Managing for Results in America’s Great City Schools
Performance Measurement and Benchmarking Project
October 2012 Cash Management Page 27
FIN
AN
CE
C
ash
Ma
na
ge
me
nt
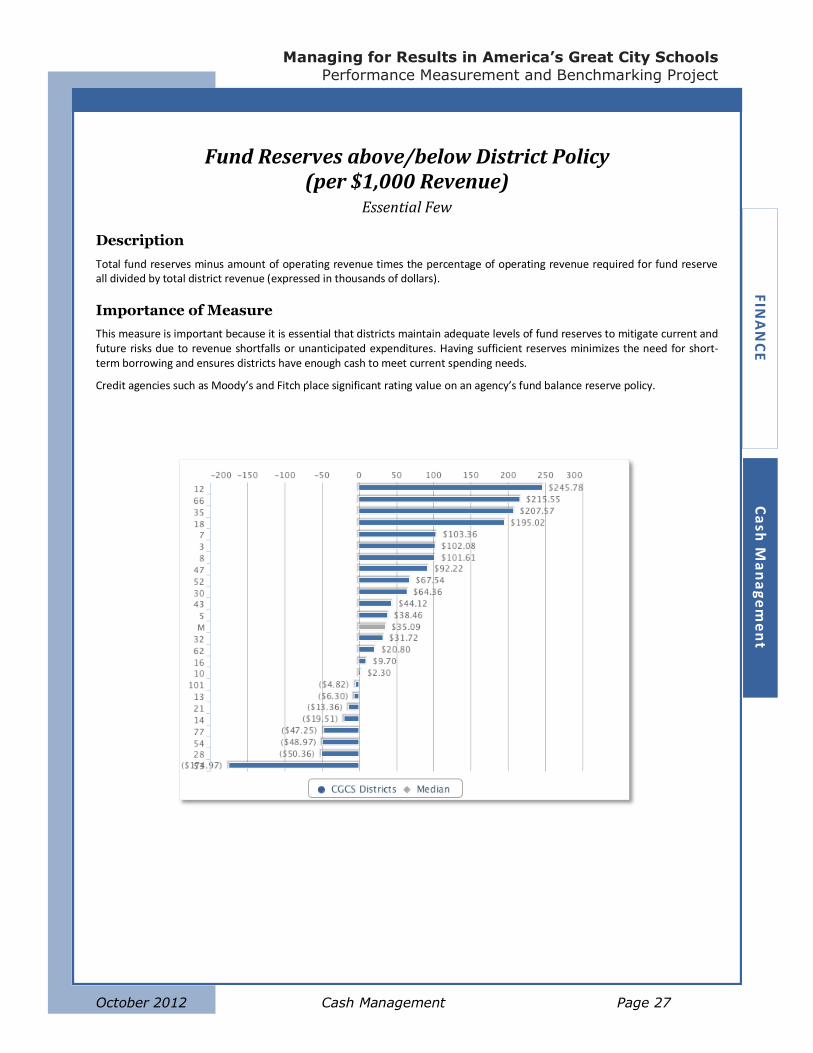
Fund Reserves above/below District Policy (per $1,000 Revenue)
Essential Few
Description
Total fund reserves minus amount of operating revenue times the percentage of operating revenue required for fund reserve all divided by total district revenue (expressed in thousands of dollars).
Importance of Measure
This measure is important because it is essential that districts maintain adequate levels of fund reserves to mitigate current and future risks due to revenue shortfalls or unanticipated expenditures. Having sufficient reserves minimizes the need for short-term borrowing and ensures districts have enough cash to meet current spending needs.
Credit agencies such as Moody’s and Fitch place significant rating value on an agency’s fund balance reserve policy.

Z
Council of the Great City Schools
Page 28 Key Performance Indicators October 2012
FIN
AN
CE
C
ash
Ma
na
ge
me
nt
Managing for Results in America’s Great City Schools
Performance Measurement and Benchmarking Project
October 2012 Compensation Page 29
FIN
AN
CE
C
om
pe
nsa
tion
Compensation
Performance metrics in compensation evaluate the cost efficiency and productivity of a Payroll
Department. Cost efficiency is broadly represented by two measures: Cost per Pay Check and
Cost per $1,000 Payroll Dollars Spent, both of which evaluate the total costs of a Payroll De-
partment relative to workload. Productivity is broadly demonstrated by Pay Checks Processed
per FTE per Month, which is also a cost driver of payroll.
Because compensation involves high volumes of regular and predictable transactions, most cost
efficiencies can be realized by expanding the use of existing tools such as employee direct-
deposit and employee self-service modules in their Enterprise Resource Planning (ERP) systems.
This is captured, in part, by measures of the Direct Deposit Participation Rate and Personnel
Record Self-Service Usage.
Conversely, districts that underutilize modern automation systems could see diminished Payroll
Accuracy Rates and increased W-2 Correction Rates (W-2c’s) due to the manual effort required,
as well as an excessive level of Overtime Hours per Payroll Employee. In addition, Percent of
Off-Cycle Payroll Checks may indicate lower productivity, as this may increase the workload of
the Payroll Department staff.
These service-level, productivity, and efficiency measures should be considered in combination,
and provide district leaders with baseline information to determine whether their payroll func-
tions:
Need better automation to improve accuracy and reduce workload
Should consider switching to software that is more accurate and efficient
Have problems with time management or workload management, or should have clear-
er policies around timelines
Have staff members that are under-skilled or under-trained
Should adopt a policy to increase direct deposits
Additionally, the following factors should be considered when evaluating performance levels:
Number of contracts requiring compliance
Frequency of payrolls
Complexity of state/local reporting requirements
Z
Council of the Great City Schools
Page 30 Key Performance Indicators October 2012
FIN
AN
CE
C
om
pe
nsa
tio
n
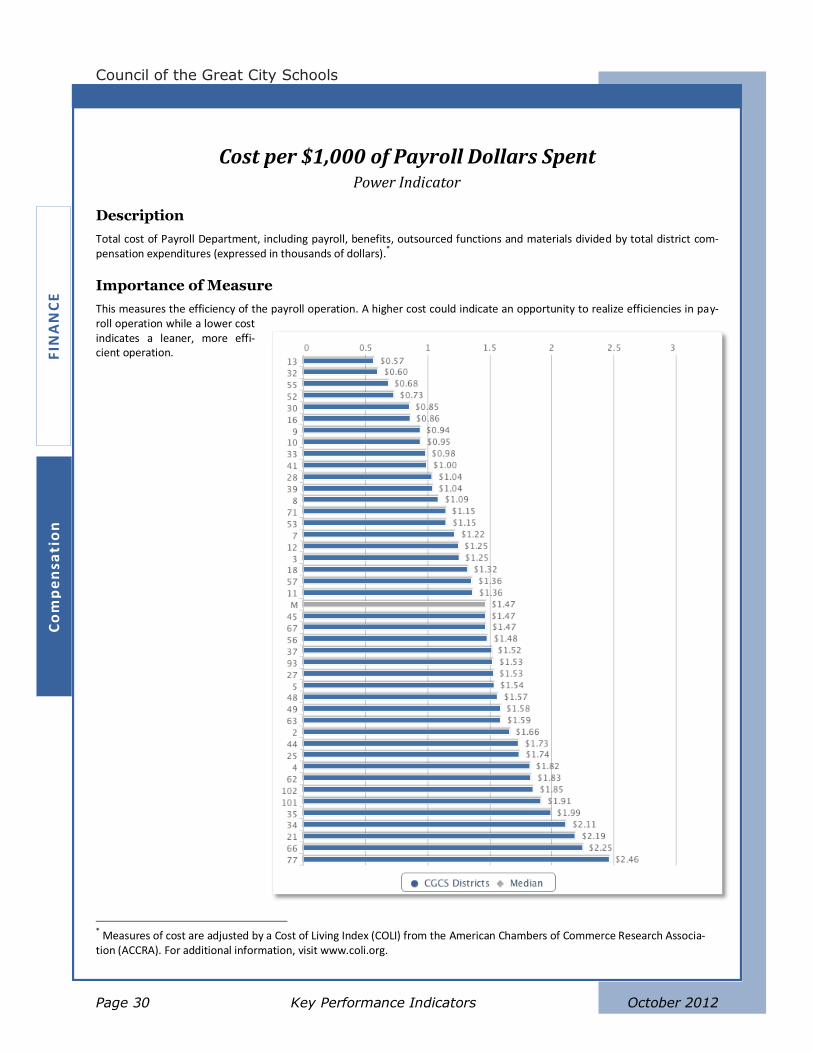
Cost per $1,000 of Payroll Dollars Spent Power Indicator
Description
Total cost of Payroll Department, including payroll, benefits, outsourced functions and materials divided by total district com-pensation expenditures (expressed in thousands of dollars).
*
Importance of Measure
This measures the efficiency of the payroll operation. A higher cost could indicate an opportunity to realize efficiencies in pay-roll operation while a lower cost indicates a leaner, more effi-cient operation.
* Measures of cost are adjusted by a Cost of Living Index (COLI) from the American Chambers of Commerce Research Associa-tion (ACCRA). For additional information, visit www.coli.org.
Managing for Results in America’s Great City Schools
Performance Measurement and Benchmarking Project
October 2012 Compensation Page 31
FIN
AN
CE
C
om
pe
nsa
tion
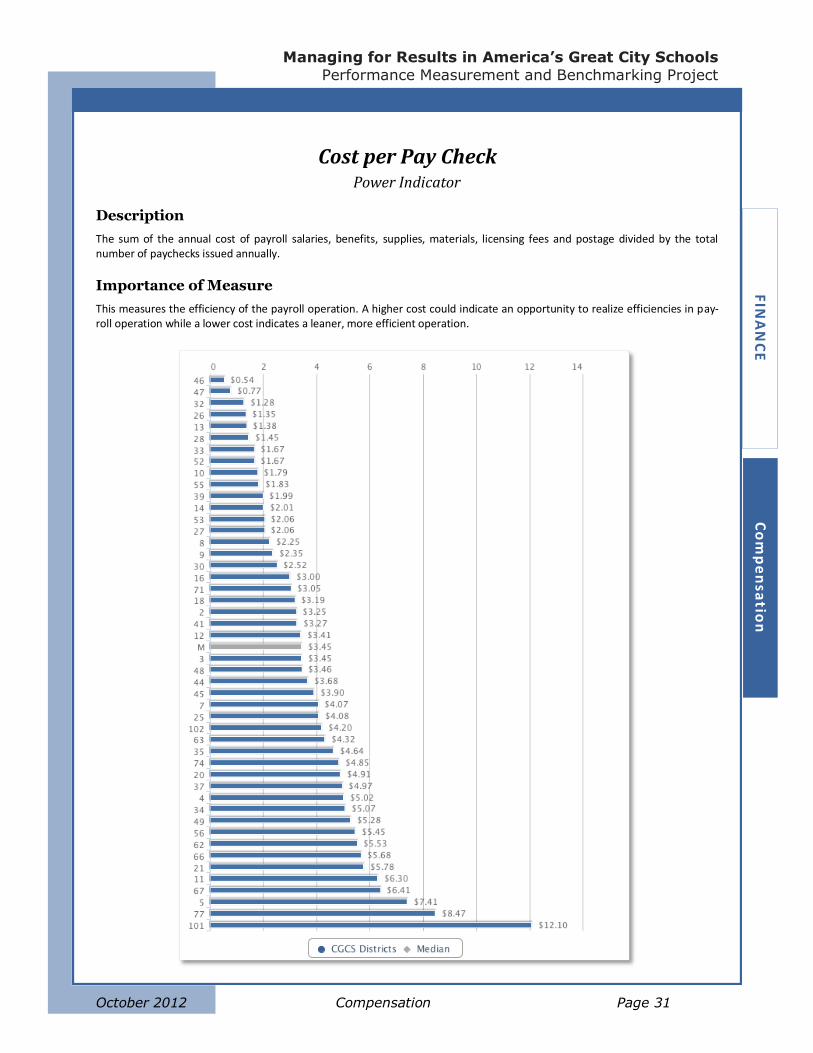
Cost per Pay Check Power Indicator
Description
The sum of the annual cost of payroll salaries, benefits, supplies, materials, licensing fees and postage divided by the total number of paychecks issued annually.
Importance of Measure
This measures the efficiency of the payroll operation. A higher cost could indicate an opportunity to realize efficiencies in pay-roll operation while a lower cost indicates a leaner, more efficient operation.
Z
Council of the Great City Schools
Page 32 Key Performance Indicators October 2012
FIN
AN
CE
C
om
pe
nsa
tio
n
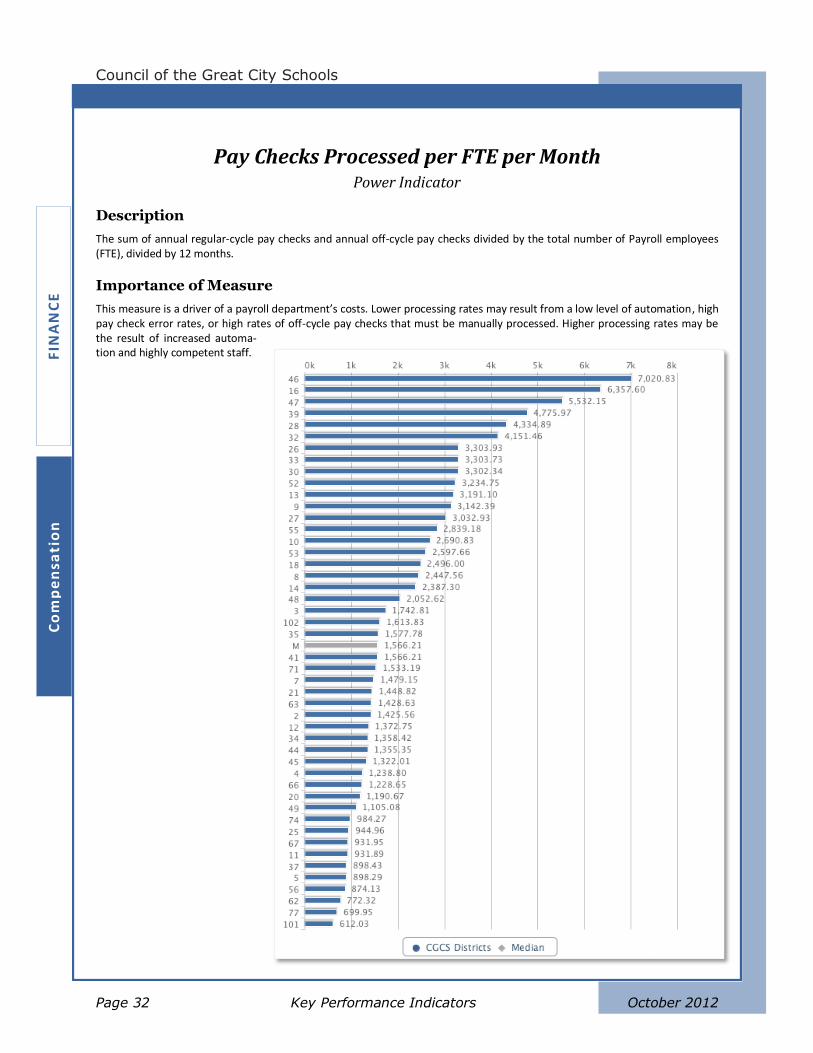
Pay Checks Processed per FTE per Month Power Indicator
Description
The sum of annual regular-cycle pay checks and annual off-cycle pay checks divided by the total number of Payroll employees (FTE), divided by 12 months.
Importance of Measure
This measure is a driver of a payroll department’s costs. Lower processing rates may result from a low level of automation, high pay check error rates, or high rates of off-cycle pay checks that must be manually processed. Higher processing rates may be the result of increased automa-tion and highly competent staff.
Managing for Results in America’s Great City Schools
Performance Measurement and Benchmarking Project
October 2012 Compensation Page 33
FIN
AN
CE
C
om
pe
nsa
tion
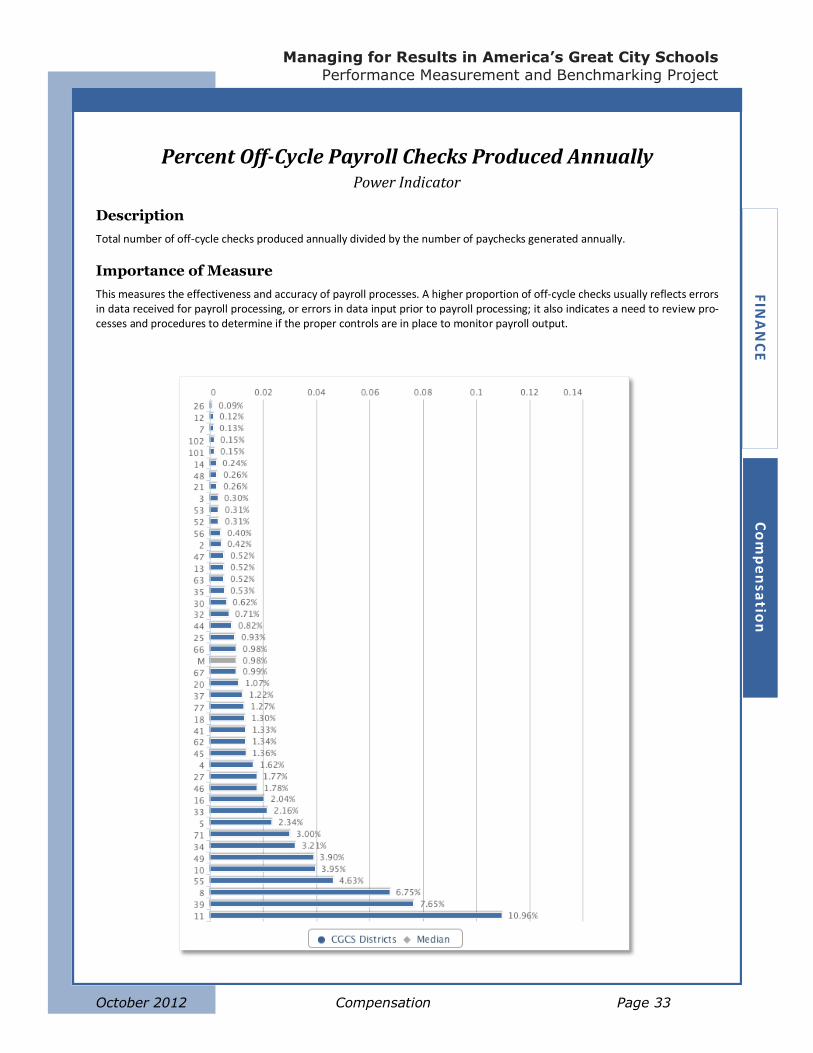
Percent Off-Cycle Payroll Checks Produced Annually Power Indicator
Description
Total number of off-cycle checks produced annually divided by the number of paychecks generated annually.
Importance of Measure
This measures the effectiveness and accuracy of payroll processes. A higher proportion of off-cycle checks usually reflects errors in data received for payroll processing, or errors in data input prior to payroll processing; it also indicates a need to review pro-cesses and procedures to determine if the proper controls are in place to monitor payroll output.
Z
Council of the Great City Schools
Page 34 Key Performance Indicators October 2012
FIN
AN
CE
C
om
pe
nsa
tio
n
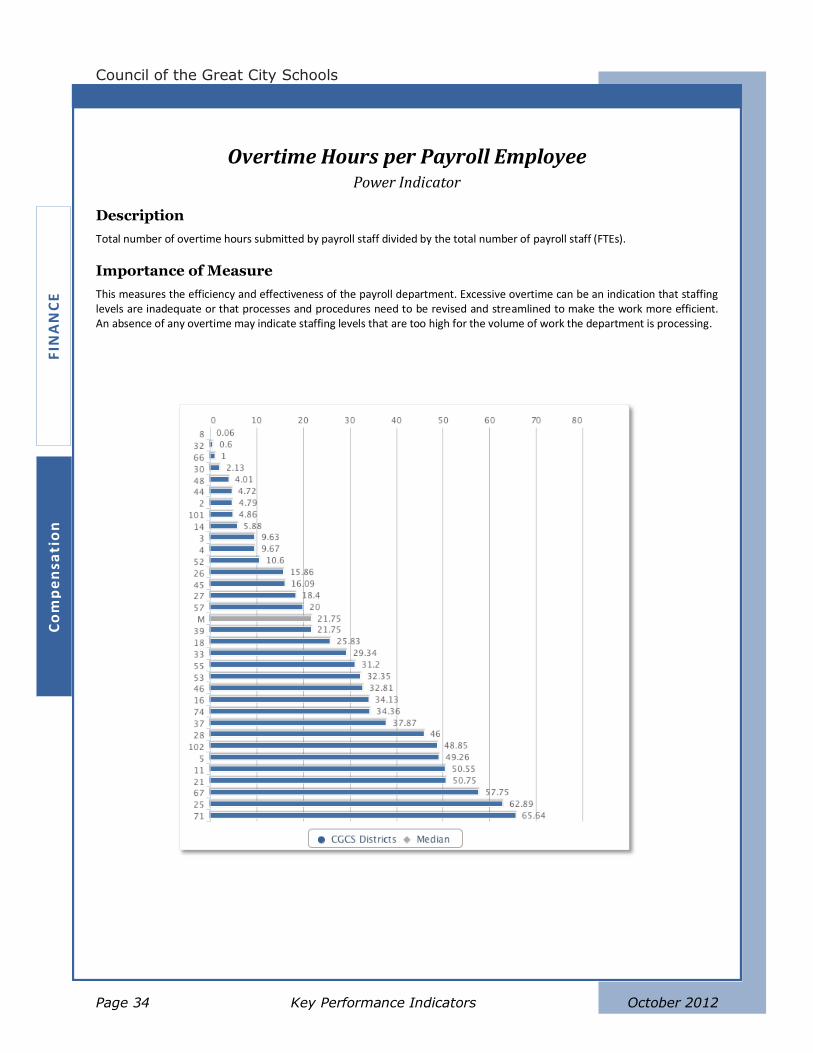
Overtime Hours per Payroll Employee Power Indicator
Description
Total number of overtime hours submitted by payroll staff divided by the total number of payroll staff (FTEs).
Importance of Measure
This measures the efficiency and effectiveness of the payroll department. Excessive overtime can be an indication that staffing levels are inadequate or that processes and procedures need to be revised and streamlined to make the work more efficient. An absence of any overtime may indicate staffing levels that are too high for the volume of work the department is processing.
Managing for Results in America’s Great City Schools
Performance Measurement and Benchmarking Project
October 2012 Compensation Page 35
FIN
AN
CE
C
om
pe
nsa
tion
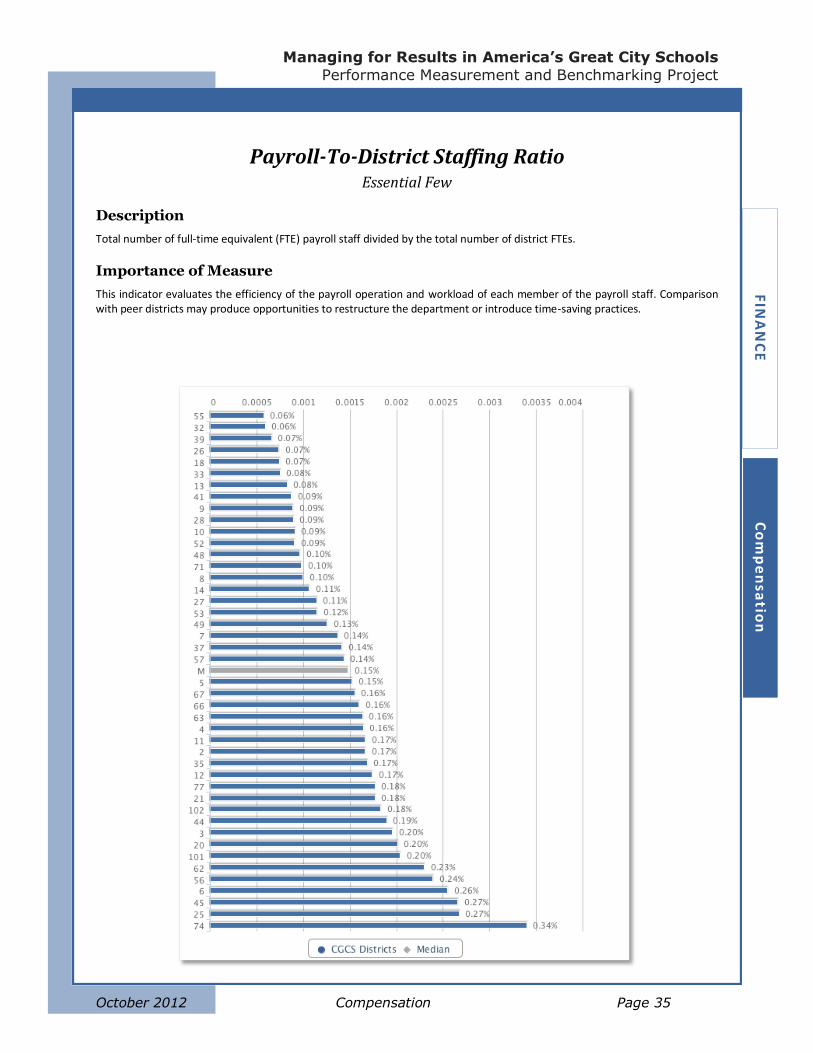
Payroll-To-District Staffing Ratio Essential Few
Description
Total number of full-time equivalent (FTE) payroll staff divided by the total number of district FTEs.
Importance of Measure
This indicator evaluates the efficiency of the payroll operation and workload of each member of the payroll staff. Comparison with peer districts may produce opportunities to restructure the department or introduce time-saving practices.
Z
Council of the Great City Schools
Page 36 Key Performance Indicators October 2012
FIN
AN
CE
C
om
pe
nsa
tio
n
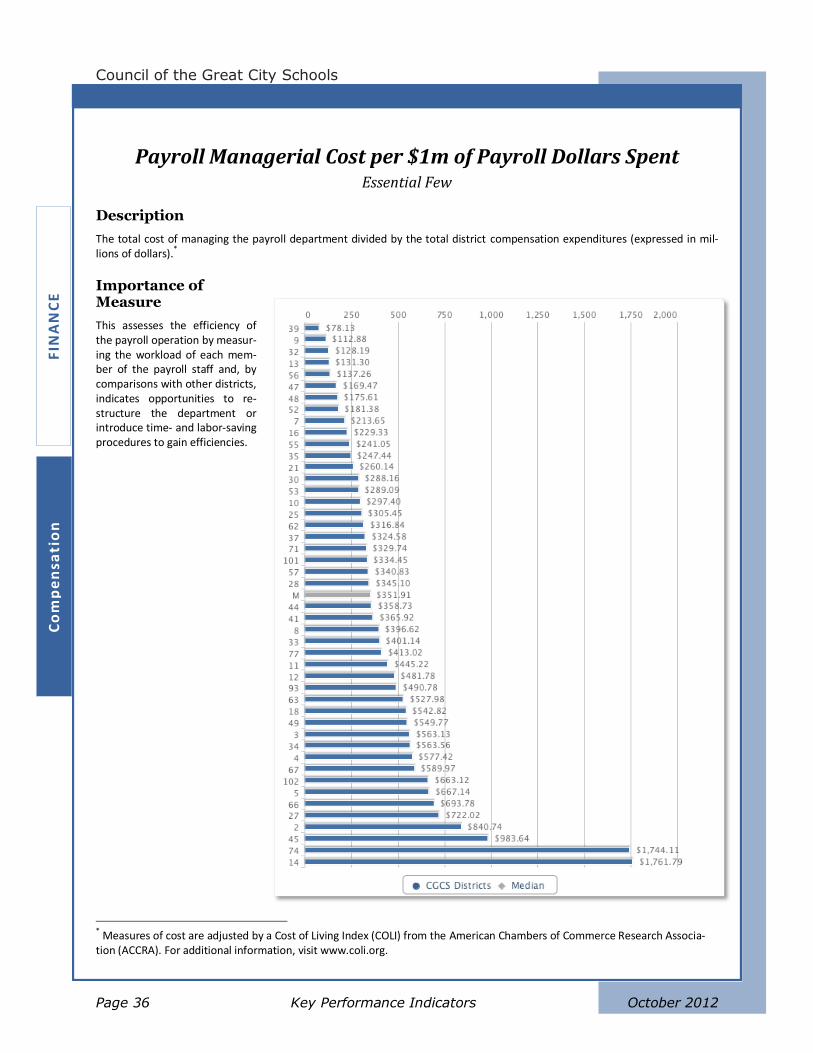
Payroll Managerial Cost per $1m of Payroll Dollars Spent Essential Few
Description
The total cost of managing the payroll department divided by the total district compensation expenditures (expressed in mil-lions of dollars).
*
Importance of Measure
This assesses the efficiency of the payroll operation by measur-ing the workload of each mem-ber of the payroll staff and, by comparisons with other districts, indicates opportunities to re-structure the department or introduce time- and labor-saving procedures to gain efficiencies.
* Measures of cost are adjusted by a Cost of Living Index (COLI) from the American Chambers of Commerce Research Associa-tion (ACCRA). For additional information, visit www.coli.org.
Managing for Results in America’s Great City Schools
Performance Measurement and Benchmarking Project
October 2012 Compensation Page 37
FIN
AN
CE
C
om
pe
nsa
tion
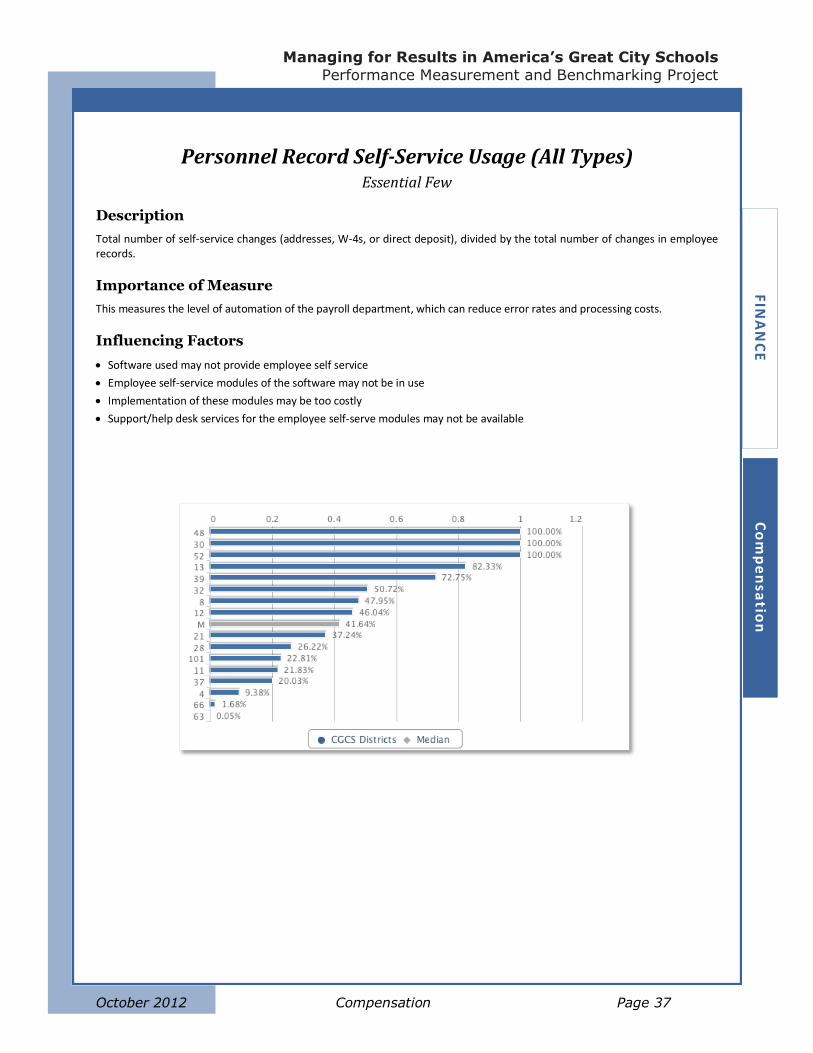
Personnel Record Self-Service Usage (All Types) Essential Few
Description
Total number of self-service changes (addresses, W-4s, or direct deposit), divided by the total number of changes in employee records.
Importance of Measure
This measures the level of automation of the payroll department, which can reduce error rates and processing costs.
Influencing Factors
Software used may not provide employee self service
Employee self-service modules of the software may not be in use
Implementation of these modules may be too costly
Support/help desk services for the employee self-serve modules may not be available
Z
Council of the Great City Schools
Page 38 Key Performance Indicators October 2012
FIN
AN
CE
C
om
pe
nsa
tio
n

Managing for Results in America’s Great City Schools
Performance Measurement and Benchmarking Project
October 2012 Financial Management Page 39
FIN
AN
CE
F
ina
ncia
l Ma
na
ge
me
nt
Financial Management
Performance metrics in financial management evaluate the overall financial health of a district,
as measured by its General Fund Balance Ratio and its Debt Service Burden per $1,000 Reve-
nue. They also measure a district’s practices in effective budgeting. These practices are broadly
represented by a district’s General Fund Revenues Efficiency and General Fund Expenditures Ef-
ficiency, which compare budgeted levels—in the adopted budget or final budget—to actual lev-
els of income and spending. A value close to 100% shows highly accurate budget forecasting.
Generally, leadership and governance factors are the starting point of good financial health:
School board and administrative policies and procedures
Budget development and management processes
Unreserved fund balance use policies and procedures
Operating funds definition
Additionally, other conditions and factors should be considered as a district evaluates its financial
health and forecast for the future:
Revenue experience, variability, and forecasts
Expenditure trends, volatility, and projections
Per capita income levels
Real-property values
Local retail sales and business receipts
Commercial acreage and business property market value
Changes in local employment base
Changes in residential development trends
Restrictions on legal reserves
Age of district infrastructure
Monitoring and reporting systems
Z
Council of the Great City Schools
Page 40 Key Performance Indicators October 2012
FIN
AN
CE
F
ina
nc
ial
Ma
na
ge
me
nt
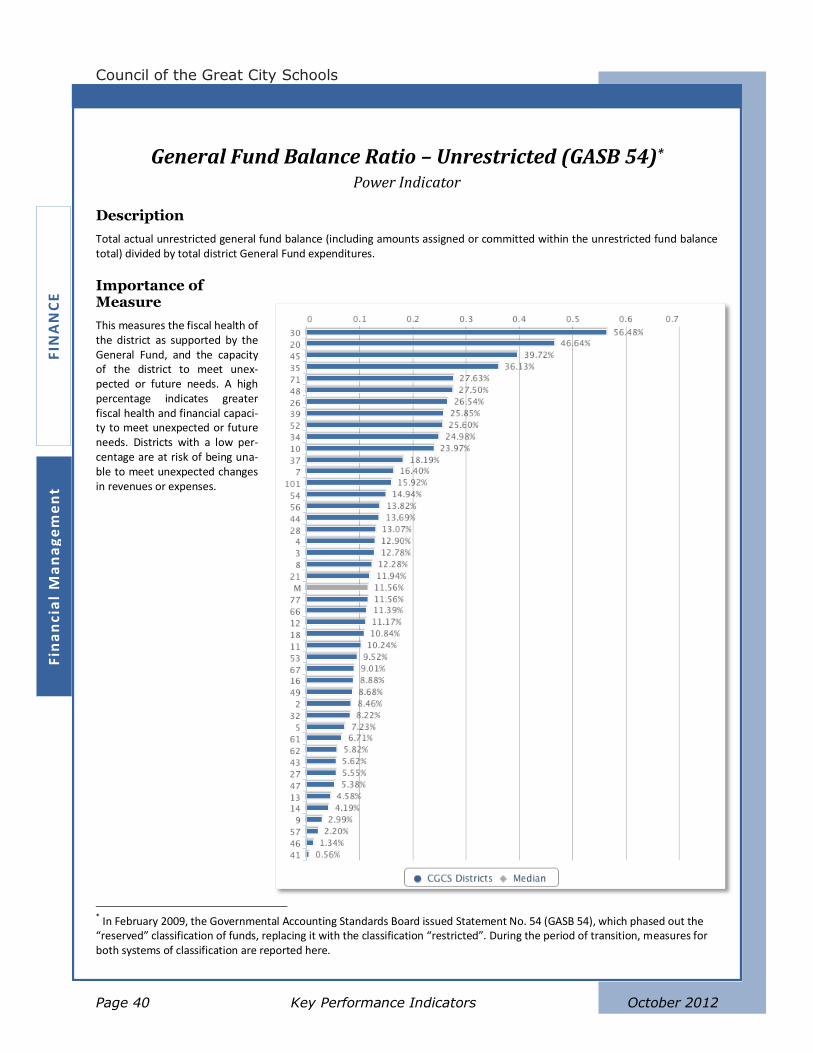
General Fund Balance Ratio – Unrestricted (GASB 54)* Power Indicator
Description
Total actual unrestricted general fund balance (including amounts assigned or committed within the unrestricted fund balance total) divided by total district General Fund expenditures.
Importance of Measure
This measures the fiscal health of the district as supported by the General Fund, and the capacity of the district to meet unex-pected or future needs. A high percentage indicates greater fiscal health and financial capaci-ty to meet unexpected or future needs. Districts with a low per-centage are at risk of being una-ble to meet unexpected changes in revenues or expenses.
* In February 2009, the Governmental Accounting Standards Board issued Statement No. 54 (GASB 54), which phased out the “reserved” classification of funds, replacing it with the classification “restricted”. During the period of transition, measures for both systems of classification are reported here.
Managing for Results in America’s Great City Schools
Performance Measurement and Benchmarking Project
October 2012 Financial Management Page 41
FIN
AN
CE
F
ina
ncia
l Ma
na
ge
me
nt
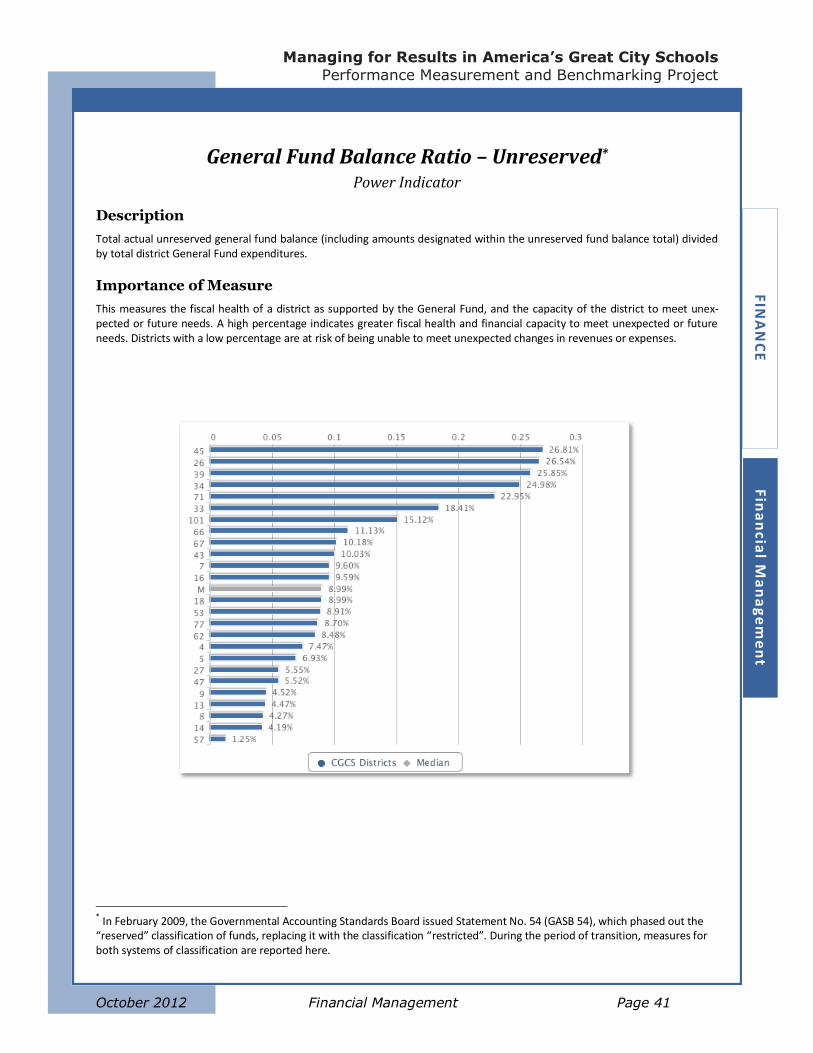
General Fund Balance Ratio – Unreserved* Power Indicator
Description
Total actual unreserved general fund balance (including amounts designated within the unreserved fund balance total) divided by total district General Fund expenditures.
Importance of Measure
This measures the fiscal health of a district as supported by the General Fund, and the capacity of the district to meet unex-pected or future needs. A high percentage indicates greater fiscal health and financial capacity to meet unexpected or future needs. Districts with a low percentage are at risk of being unable to meet unexpected changes in revenues or expenses.
* In February 2009, the Governmental Accounting Standards Board issued Statement No. 54 (GASB 54), which phased out the “reserved” classification of funds, replacing it with the classification “restricted”. During the period of transition, measures for both systems of classification are reported here.
Z
Council of the Great City Schools
Page 42 Key Performance Indicators October 2012
FIN
AN
CE
F
ina
nci
al
Ma
na
ge
me
nt
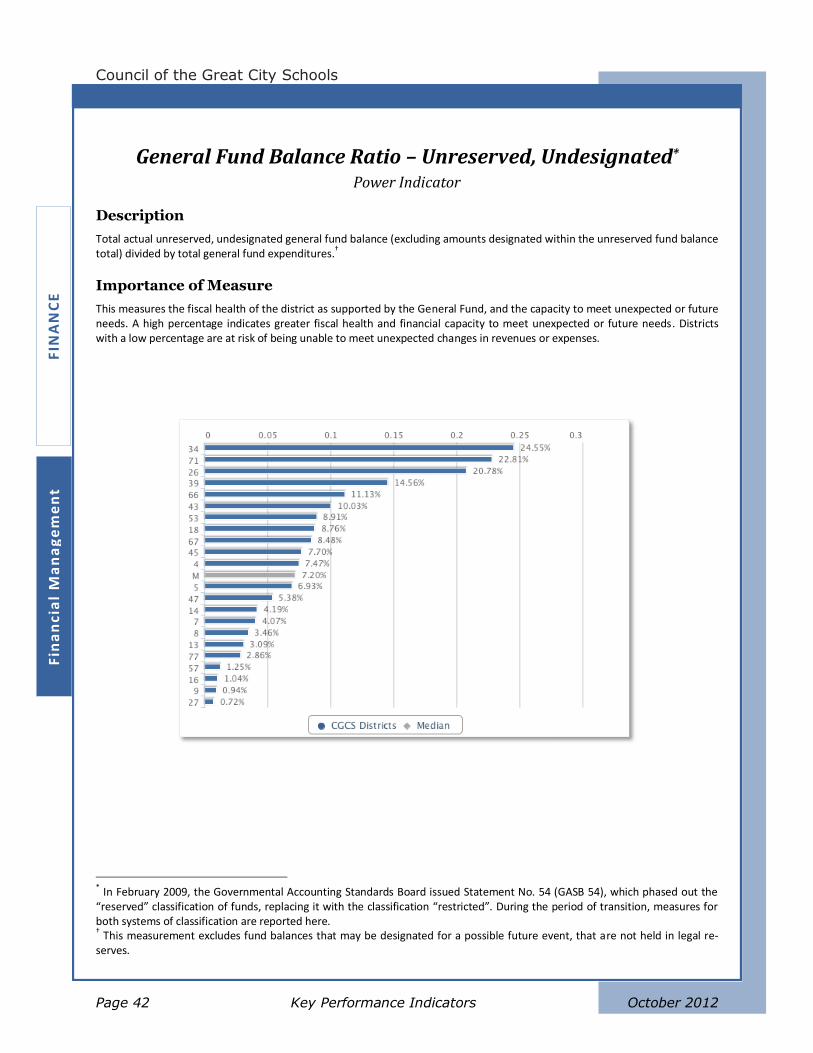
General Fund Balance Ratio – Unreserved, Undesignated* Power Indicator
Description
Total actual unreserved, undesignated general fund balance (excluding amounts designated within the unreserved fund balance total) divided by total general fund expenditures.
†
Importance of Measure
This measures the fiscal health of the district as supported by the General Fund, and the capacity to meet unexpected or future needs. A high percentage indicates greater fiscal health and financial capacity to meet unexpected or future needs. Districts with a low percentage are at risk of being unable to meet unexpected changes in revenues or expenses.
* In February 2009, the Governmental Accounting Standards Board issued Statement No. 54 (GASB 54), which phased out the
“reserved” classification of funds, replacing it with the classification “restricted”. During the period of transition, measures for both systems of classification are reported here. † This measurement excludes fund balances that may be designated for a possible future event, that are not held in legal re-serves.
Managing for Results in America’s Great City Schools
Performance Measurement and Benchmarking Project
October 2012 Financial Management Page 43
FIN
AN
CE
F
ina
ncia
l Ma
na
ge
me
nt
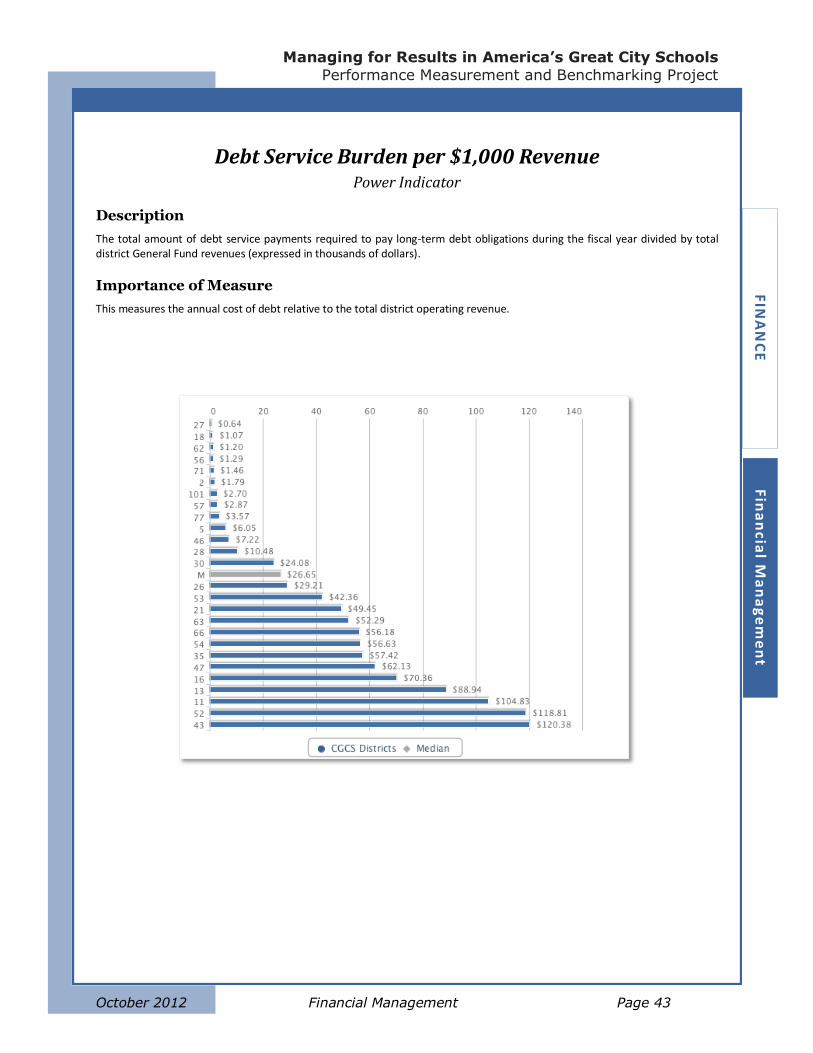
Debt Service Burden per $1,000 Revenue Power Indicator
Description
The total amount of debt service payments required to pay long-term debt obligations during the fiscal year divided by total district General Fund revenues (expressed in thousands of dollars).
Importance of Measure
This measures the annual cost of debt relative to the total district operating revenue.
Z
Council of the Great City Schools
Page 44 Key Performance Indicators October 2012
FIN
AN
CE
F
ina
nc
ial
Ma
na
ge
me
nt
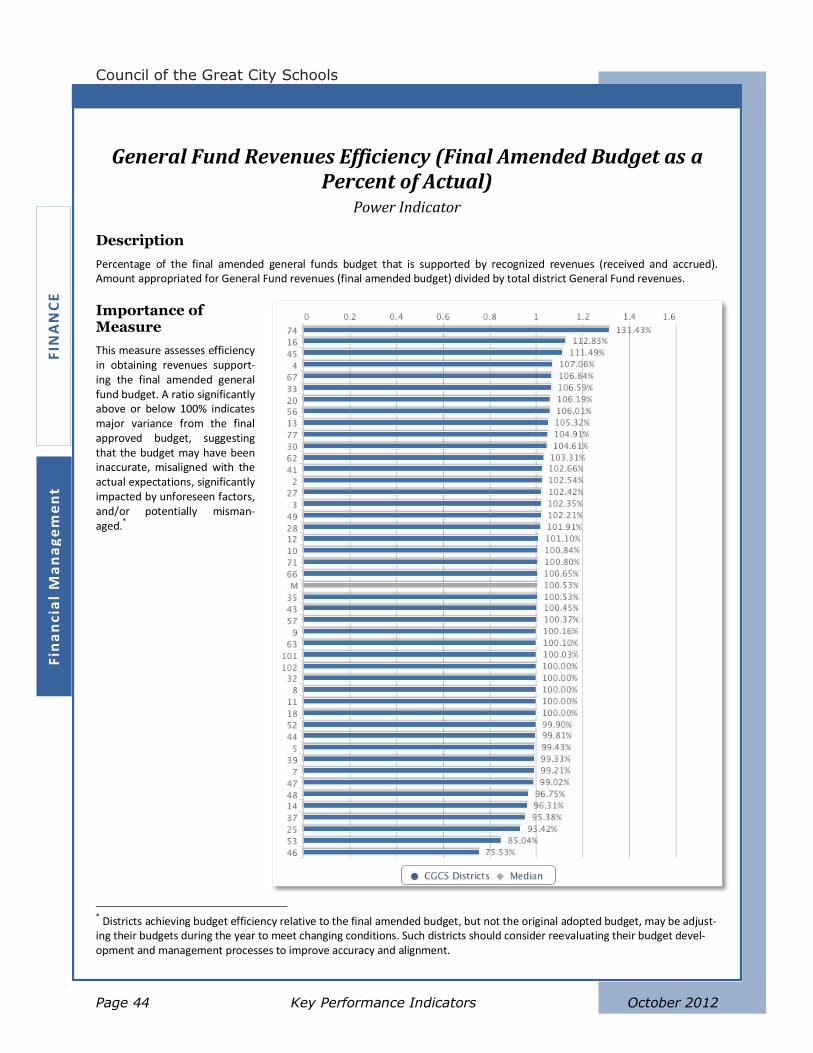
General Fund Revenues Efficiency (Final Amended Budget as a Percent of Actual)
Power Indicator
Description
Percentage of the final amended general funds budget that is supported by recognized revenues (received and accrued). Amount appropriated for General Fund revenues (final amended budget) divided by total district General Fund revenues.
Importance of Measure
This measure assesses efficiency in obtaining revenues support-ing the final amended general fund budget. A ratio significantly above or below 100% indicates major variance from the final approved budget, suggesting that the budget may have been inaccurate, misaligned with the actual expectations, significantly impacted by unforeseen factors, and/or potentially misman-aged.*
* Districts achieving budget efficiency relative to the final amended budget, but not the original adopted budget, may be adjust-ing their budgets during the year to meet changing conditions. Such districts should consider reevaluating their budget devel-opment and management processes to improve accuracy and alignment.
Managing for Results in America’s Great City Schools
Performance Measurement and Benchmarking Project
October 2012 Financial Management Page 45
FIN
AN
CE
F
ina
ncia
l Ma
na
ge
me
nt
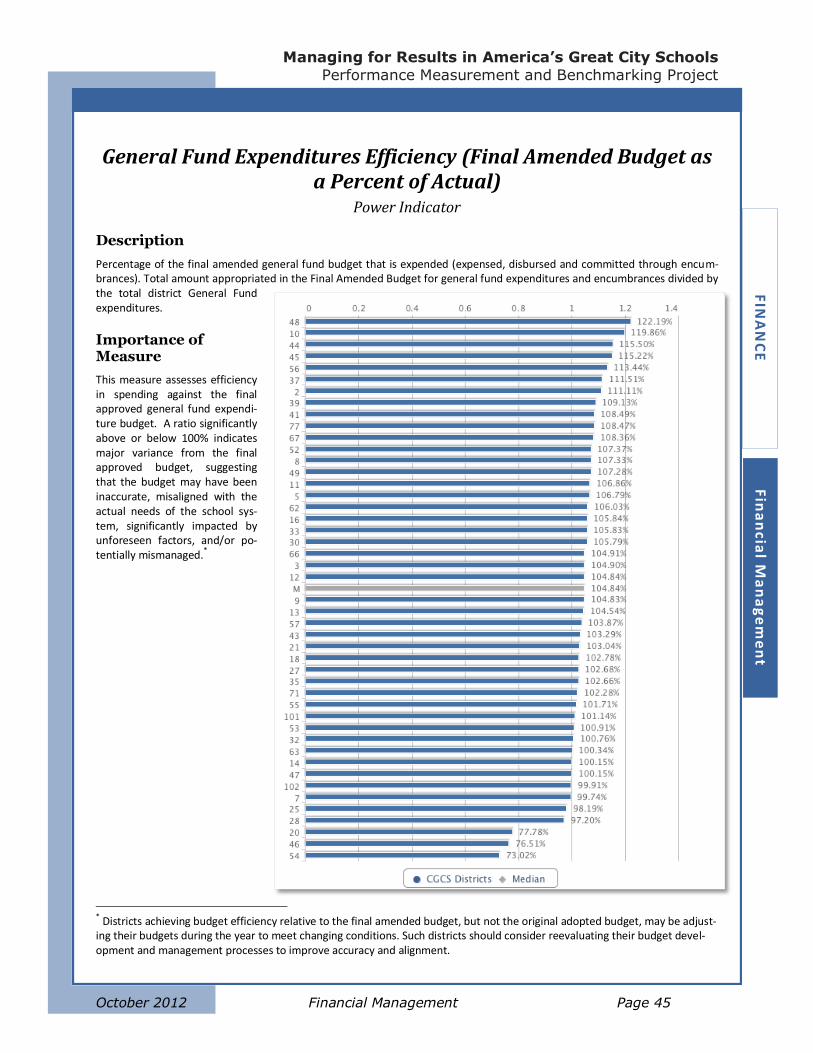
General Fund Expenditures Efficiency (Final Amended Budget as a Percent of Actual)
Power Indicator
Description
Percentage of the final amended general fund budget that is expended (expensed, disbursed and committed through encum-brances). Total amount appropriated in the Final Amended Budget for general fund expenditures and encumbrances divided by the total district General Fund expenditures.
Importance of Measure
This measure assesses efficiency in spending against the final approved general fund expendi-ture budget. A ratio significantly above or below 100% indicates major variance from the final approved budget, suggesting that the budget may have been inaccurate, misaligned with the actual needs of the school sys-tem, significantly impacted by unforeseen factors, and/or po-tentially mismanaged.*
* Districts achieving budget efficiency relative to the final amended budget, but not the original adopted budget, may be adjust-ing their budgets during the year to meet changing conditions. Such districts should consider reevaluating their budget devel-opment and management processes to improve accuracy and alignment.
Z
Council of the Great City Schools
Page 46 Key Performance Indicators October 2012
FIN
AN
CE
F
ina
nc
ial
Ma
na
ge
me
nt
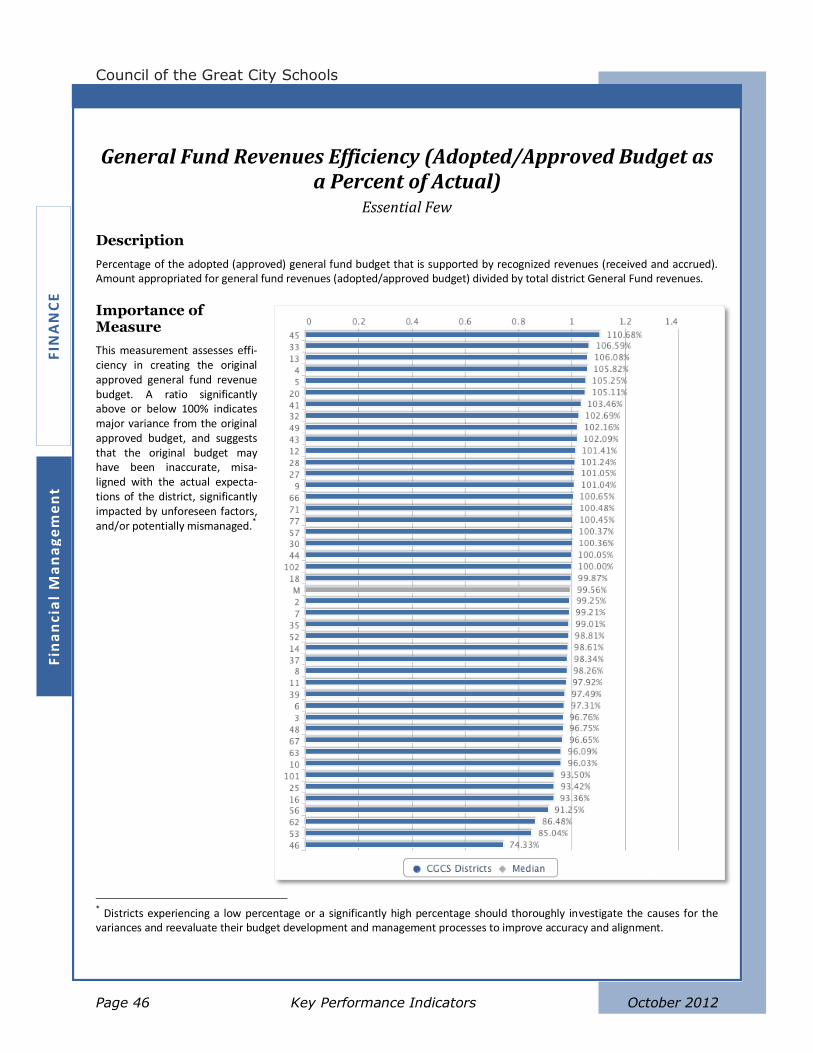
General Fund Revenues Efficiency (Adopted/Approved Budget as a Percent of Actual)
Essential Few
Description
Percentage of the adopted (approved) general fund budget that is supported by recognized revenues (received and accrued). Amount appropriated for general fund revenues (adopted/approved budget) divided by total district General Fund revenues.
Importance of Measure
This measurement assesses effi-ciency in creating the original approved general fund revenue budget. A ratio significantly above or below 100% indicates major variance from the original approved budget, and suggests that the original budget may have been inaccurate, misa-ligned with the actual expecta-tions of the district, significantly impacted by unforeseen factors, and/or potentially mismanaged.*
* Districts experiencing a low percentage or a significantly high percentage should thoroughly investigate the causes for the variances and reevaluate their budget development and management processes to improve accuracy and alignment.
Managing for Results in America’s Great City Schools
Performance Measurement and Benchmarking Project
October 2012 Financial Management Page 47
FIN
AN
CE
F
ina
ncia
l Ma
na
ge
me
nt
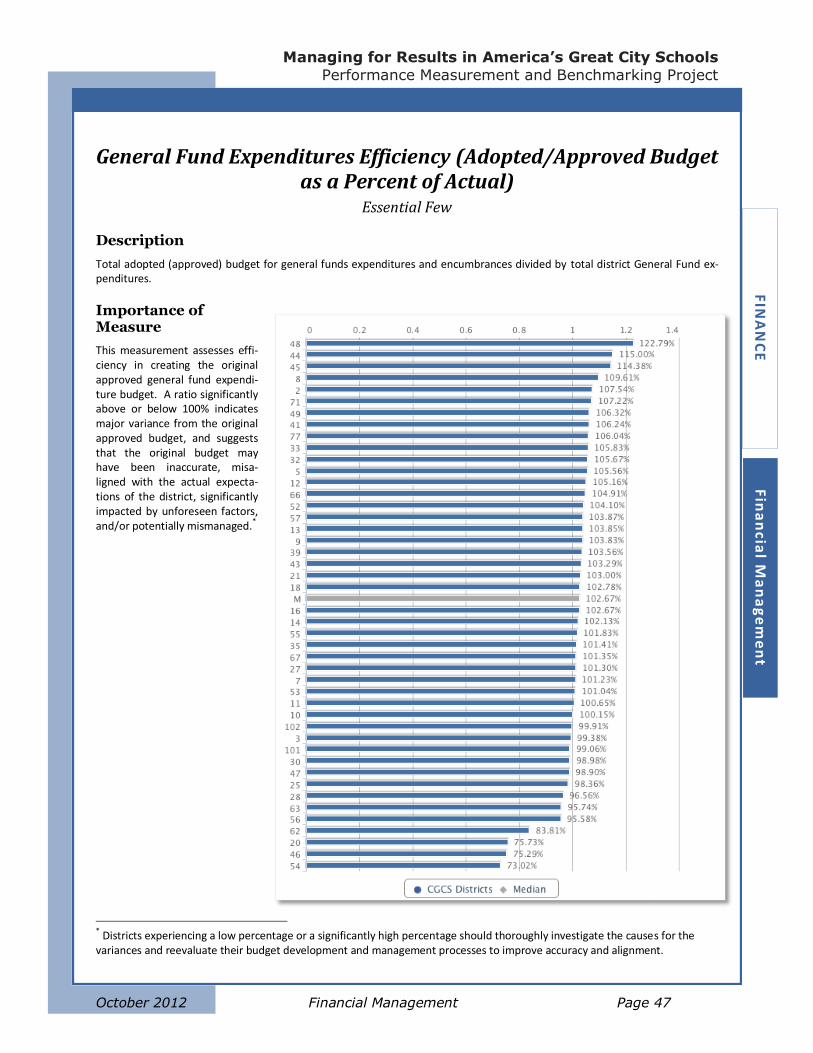
General Fund Expenditures Efficiency (Adopted/Approved Budget as a Percent of Actual)
Essential Few
Description
Total adopted (approved) budget for general funds expenditures and encumbrances divided by total district General Fund ex-penditures.
Importance of Measure
This measurement assesses effi-ciency in creating the original approved general fund expendi-ture budget. A ratio significantly above or below 100% indicates major variance from the original approved budget, and suggests that the original budget may have been inaccurate, misa-ligned with the actual expecta-tions of the district, significantly impacted by unforeseen factors, and/or potentially mismanaged.*
* Districts experiencing a low percentage or a significantly high percentage should thoroughly investigate the causes for the variances and reevaluate their budget development and management processes to improve accuracy and alignment.

Z
Council of the Great City Schools
Page 48 Key Performance Indicators October 2012
FIN
AN
CE
F
ina
nc
ial
Ma
na
ge
me
nt
Managing for Results in America’s Great City Schools
Performance Measurement and Benchmarking Project
October 2012 Grants Management Page 49
FIN
AN
CE
G
ran
ts Ma
na
ge
me
nt
Grants Management
Good performance in grants management is reflected in a few basic performance indicators.
Cash flow and availability of grant funds are primary concerns: Does the district spend all its
grant funds in the grant period? How quickly does the district process reimbursements? These
are addressed, in part, using the metrics Lost Grant Funds per $1m Grant Revenue and Aging of
Grants Receivables.
Grant-funded programming should also be considered an exposure to risk. Looking at levels of
Grant Funded FTE Dependence can guide a district to either:
a) Allocate enough fund reserves to insure themselves against possible shifts in funding
sources, or
b) Have an evaluation system in place that helps determine whether positions should be
continued beyond the term of a grant.
These metrics should give a basic sense of where a district might improve its performance in
grants management. Areas of improvement may include:
Monitoring and reporting systems
Escalation procedures to address timeliness
Administrative leadership style, decision-making process, and distribution of organiza-
tional authority
School board, and administrative policies and management processes
Procurement regulations and policies
Reserve funds to supplant the risks of high grant dependency
Z
Council of the Great City Schools
Page 50 Key Performance Indicators October 2012
FIN
AN
CE
G
ran
ts M
an
ag
em
en
t
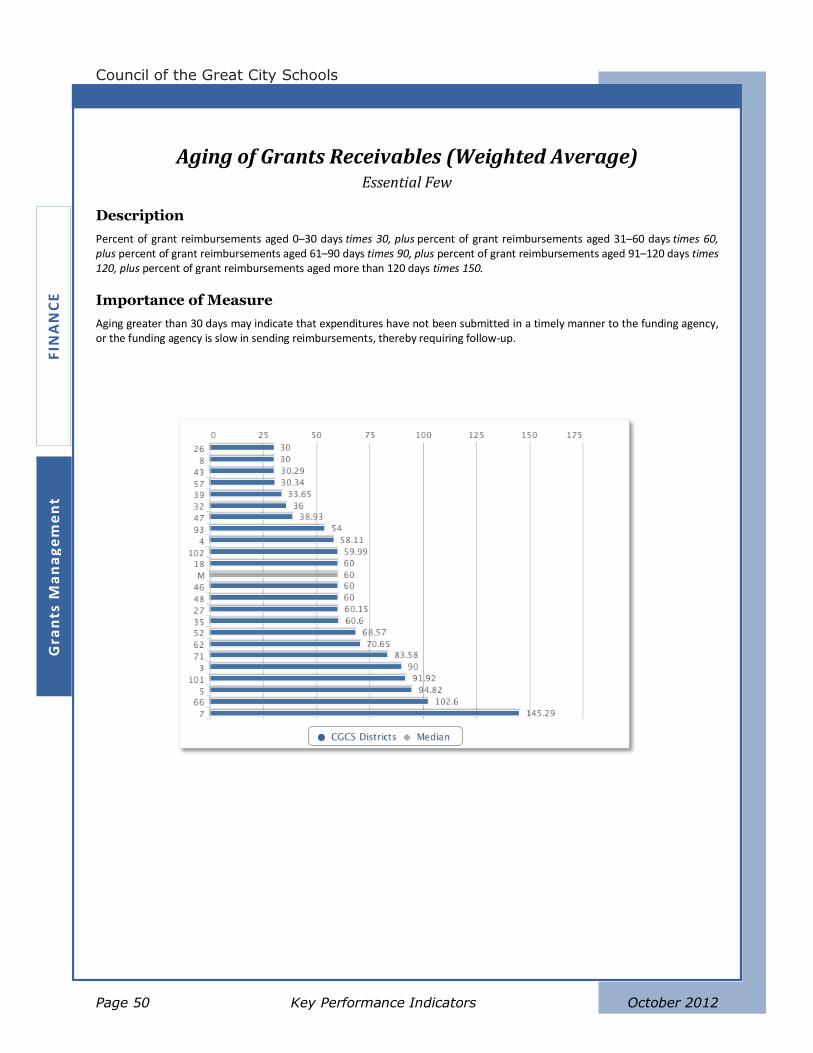
Aging of Grants Receivables (Weighted Average) Essential Few
Description
Percent of grant reimbursements aged 0–30 days times 30, plus percent of grant reimbursements aged 31–60 days times 60, plus percent of grant reimbursements aged 61–90 days times 90, plus percent of grant reimbursements aged 91–120 days times 120, plus percent of grant reimbursements aged more than 120 days times 150.
Importance of Measure
Aging greater than 30 days may indicate that expenditures have not been submitted in a timely manner to the funding agency, or the funding agency is slow in sending reimbursements, thereby requiring follow-up.
Managing for Results in America’s Great City Schools
Performance Measurement and Benchmarking Project
October 2012 Grants Management Page 51
FIN
AN
CE
G
ran
ts Ma
na
ge
me
nt
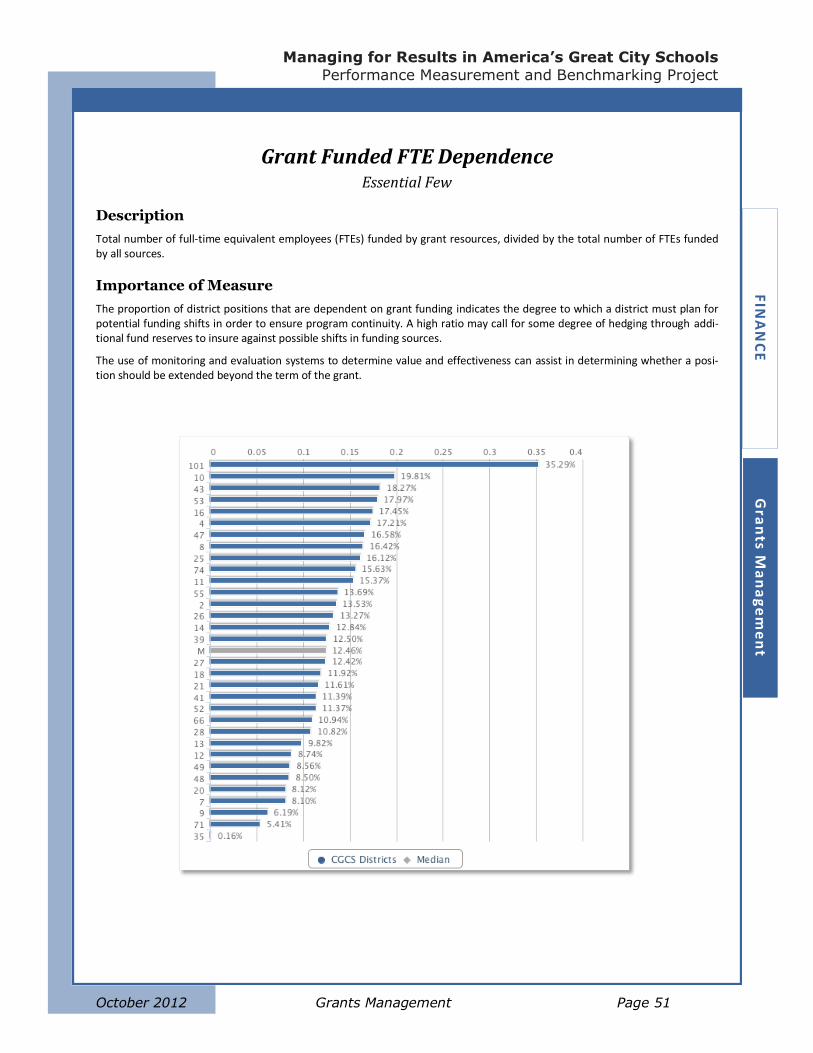
Grant Funded FTE Dependence Essential Few
Description
Total number of full-time equivalent employees (FTEs) funded by grant resources, divided by the total number of FTEs funded by all sources.
Importance of Measure
The proportion of district positions that are dependent on grant funding indicates the degree to which a district must plan for potential funding shifts in order to ensure program continuity. A high ratio may call for some degree of hedging through addi-tional fund reserves to insure against possible shifts in funding sources.
The use of monitoring and evaluation systems to determine value and effectiveness can assist in determining whether a posi-tion should be extended beyond the term of the grant.
Z
Council of the Great City Schools
Page 52 Key Performance Indicators October 2012
FIN
AN
CE
G
ran
ts M
an
ag
em
en
t
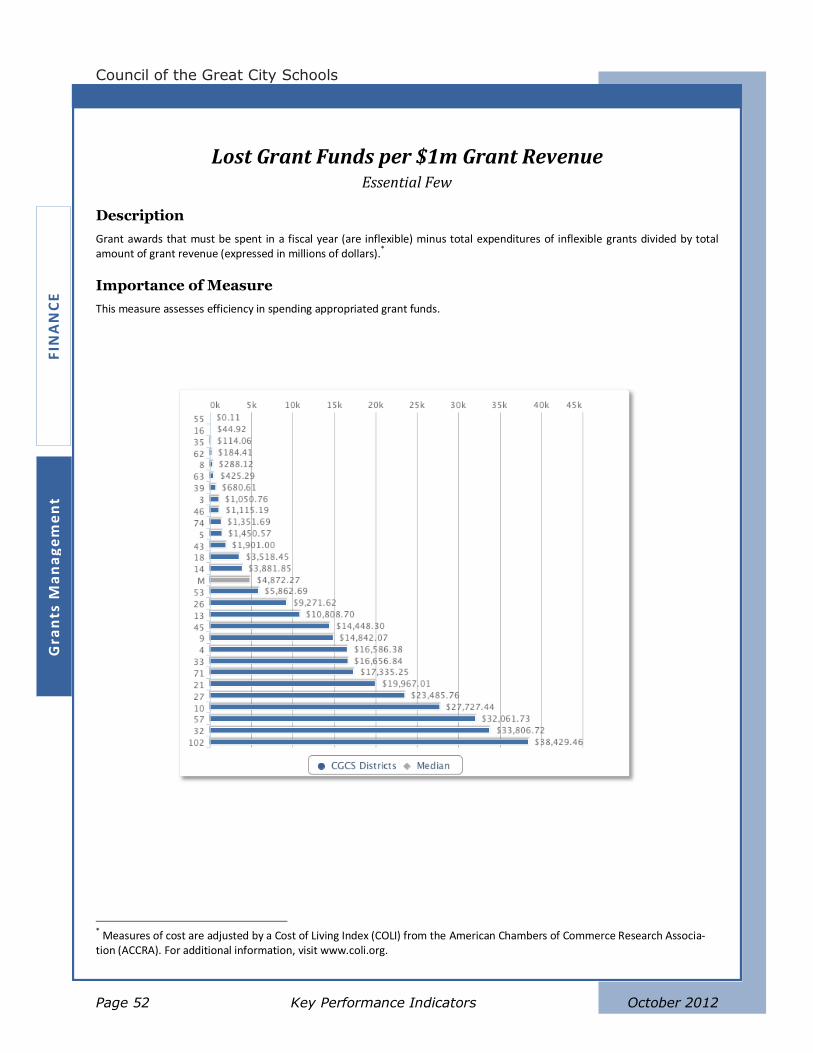
Lost Grant Funds per $1m Grant Revenue Essential Few
Description
Grant awards that must be spent in a fiscal year (are inflexible) minus total expenditures of inflexible grants divided by total amount of grant revenue (expressed in millions of dollars).
*
Importance of Measure
This measure assesses efficiency in spending appropriated grant funds.
* Measures of cost are adjusted by a Cost of Living Index (COLI) from the American Chambers of Commerce Research Associa-tion (ACCRA). For additional information, visit www.coli.org.

Managing for Results in America’s Great City Schools
Performance Measurement and Benchmarking Project
October 2012 Human Resources Page 53
FIN
AN
CE
H
um
an
Re
sou
rces
Human Resources
The overall performance of a district’s human-capital management can be broadly represented
with two basic measures: Turnover Rate and Average Days to Fill Vacancy. The factors that in-
fluence these measures, and that can guide improvement strategies, may include:
Identification of positions to be filled
Diverse pool of qualified applicants
Use of technology for application-approval process
Site-based hiring vs. central-office hiring process
Availability of interview team members
Effectiveness of recruiting efforts
Salary and benefits offered
Employee satisfaction and workplace environment
Availability of skills in local labor market
Personnel policies and practices
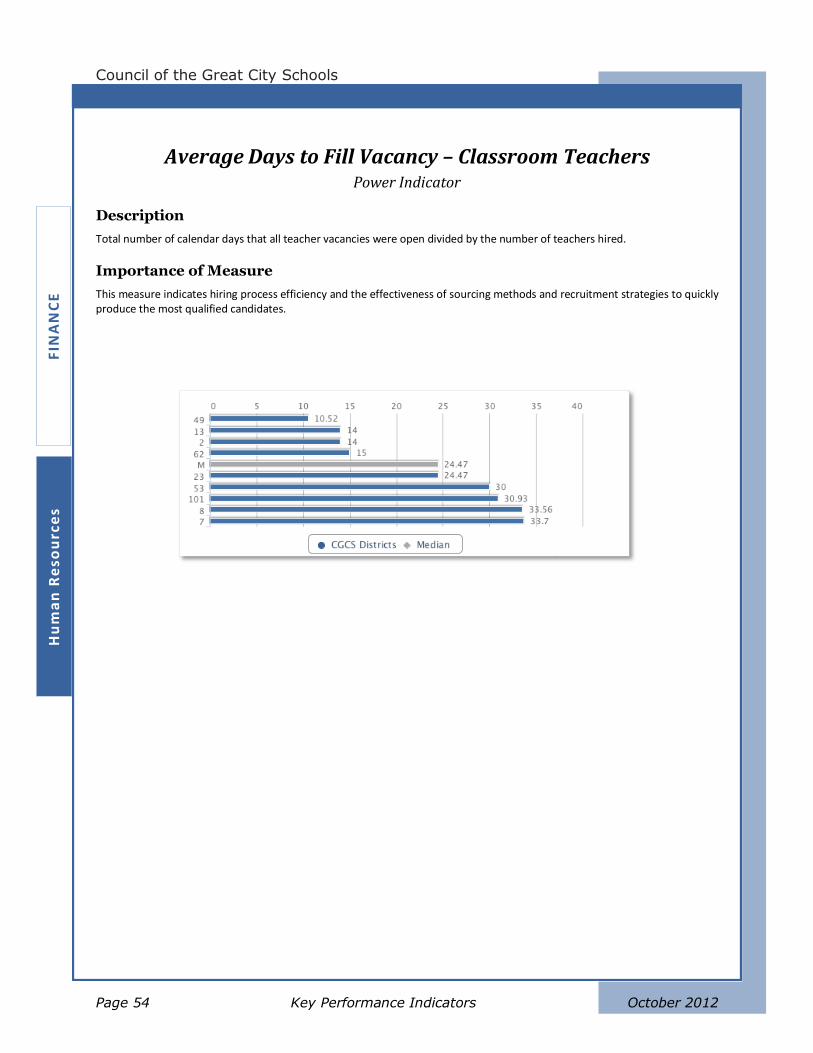
Z
Council of the Great City Schools
Page 54 Key Performance Indicators October 2012
FIN
AN
CE
H
um
an
Re
sou
rce
s
Average Days to Fill Vacancy – Classroom Teachers Power Indicator
Description
Total number of calendar days that all teacher vacancies were open divided by the number of teachers hired.
Importance of Measure
This measure indicates hiring process efficiency and the effectiveness of sourcing methods and recruitment strategies to quickly produce the most qualified candidates.
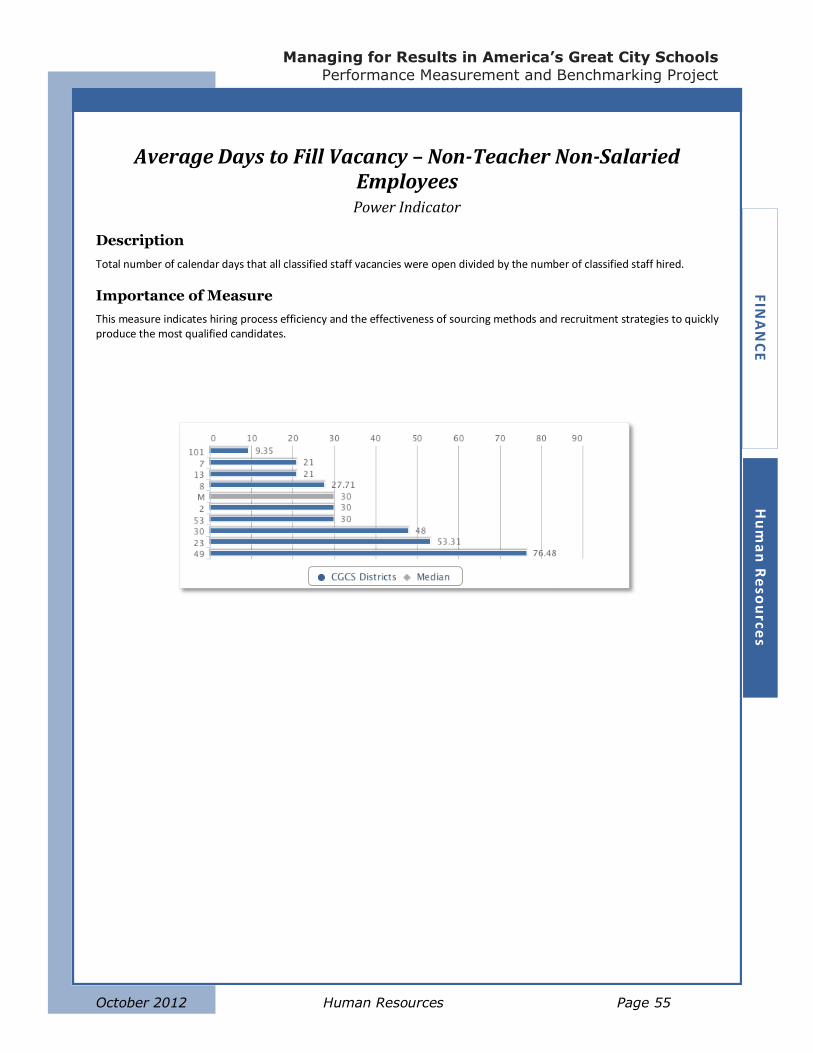
Managing for Results in America’s Great City Schools
Performance Measurement and Benchmarking Project
October 2012 Human Resources Page 55
FIN
AN
CE
H
um
an
Re
sou
rces
Average Days to Fill Vacancy – Non-Teacher Non-Salaried Employees Power Indicator
Description
Total number of calendar days that all classified staff vacancies were open divided by the number of classified staff hired.
Importance of Measure
This measure indicates hiring process efficiency and the effectiveness of sourcing methods and recruitment strategies to quickly produce the most qualified candidates.
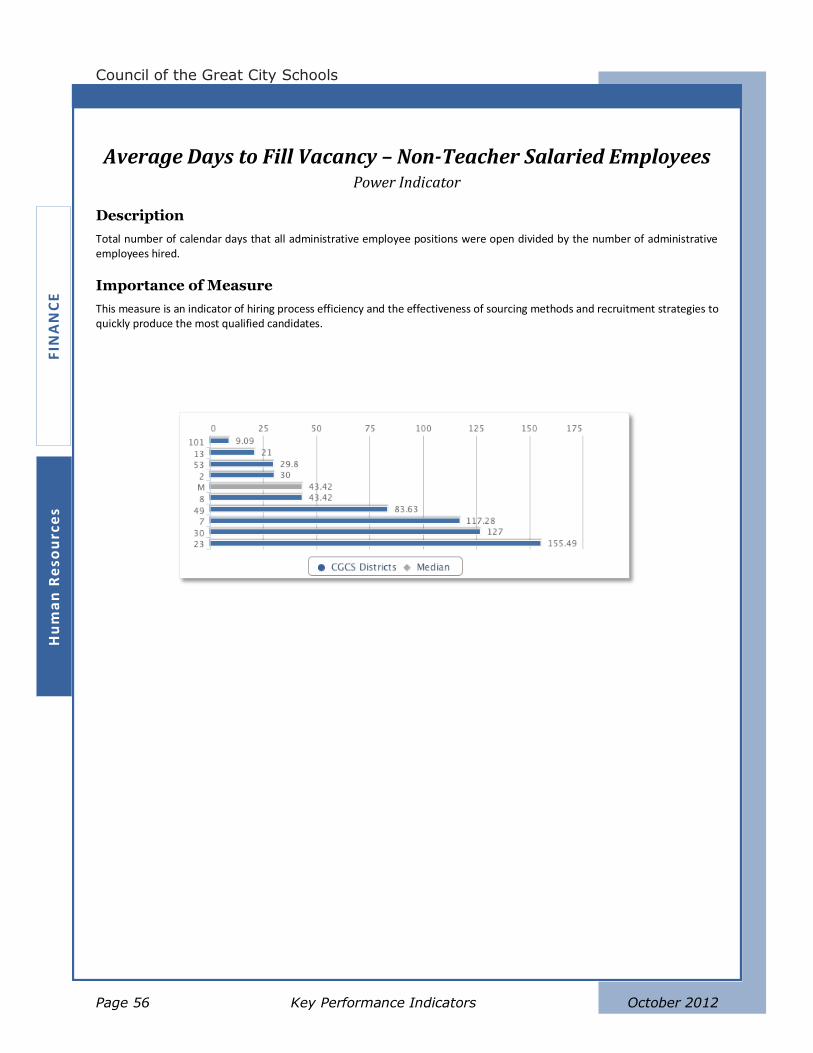
Z
Council of the Great City Schools
Page 56 Key Performance Indicators October 2012
FIN
AN
CE
H
um
an
Re
sou
rce
s
Average Days to Fill Vacancy – Non-Teacher Salaried Employees Power Indicator
Description
Total number of calendar days that all administrative employee positions were open divided by the number of administrative employees hired.
Importance of Measure
This measure is an indicator of hiring process efficiency and the effectiveness of sourcing methods and recruitment strategies to quickly produce the most qualified candidates.
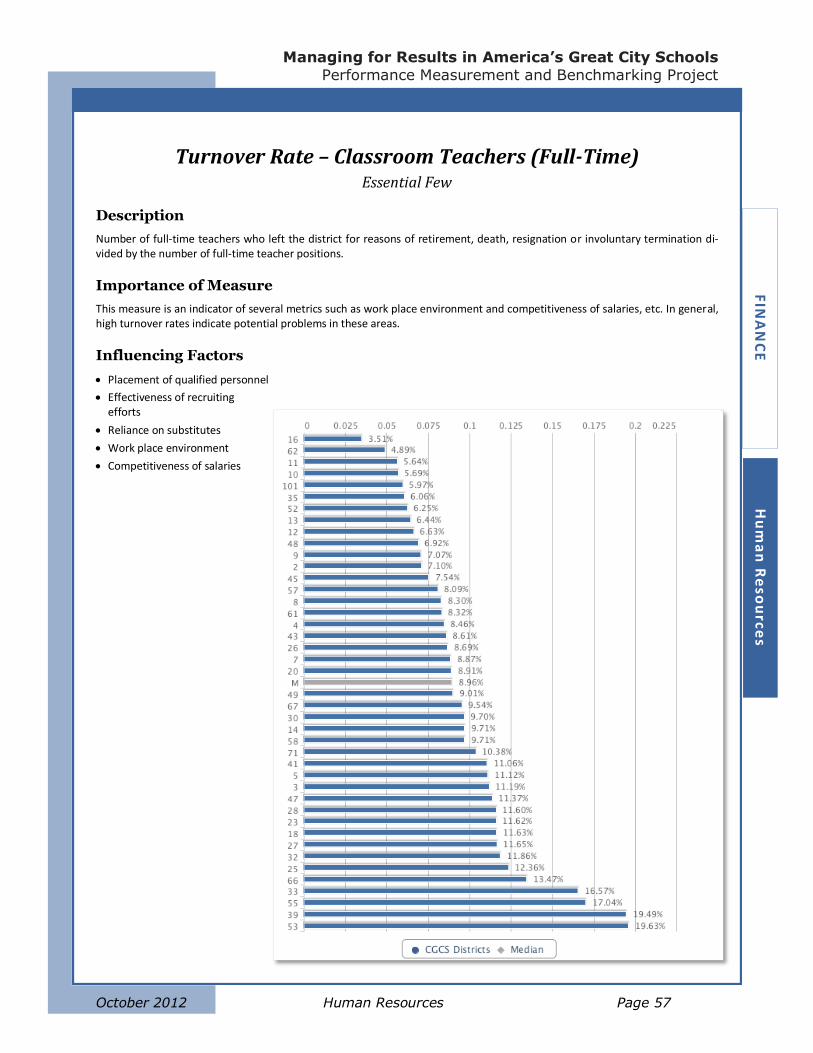
Managing for Results in America’s Great City Schools
Performance Measurement and Benchmarking Project
October 2012 Human Resources Page 57
FIN
AN
CE
H
um
an
Re
sou
rces
Turnover Rate – Classroom Teachers (Full-Time) Essential Few
Description
Number of full-time teachers who left the district for reasons of retirement, death, resignation or involuntary termination di-vided by the number of full-time teacher positions.
Importance of Measure
This measure is an indicator of several metrics such as work place environment and competitiveness of salaries, etc. In general, high turnover rates indicate potential problems in these areas.
Influencing Factors
Placement of qualified personnel
Effectiveness of recruiting efforts
Reliance on substitutes
Work place environment
Competitiveness of salaries
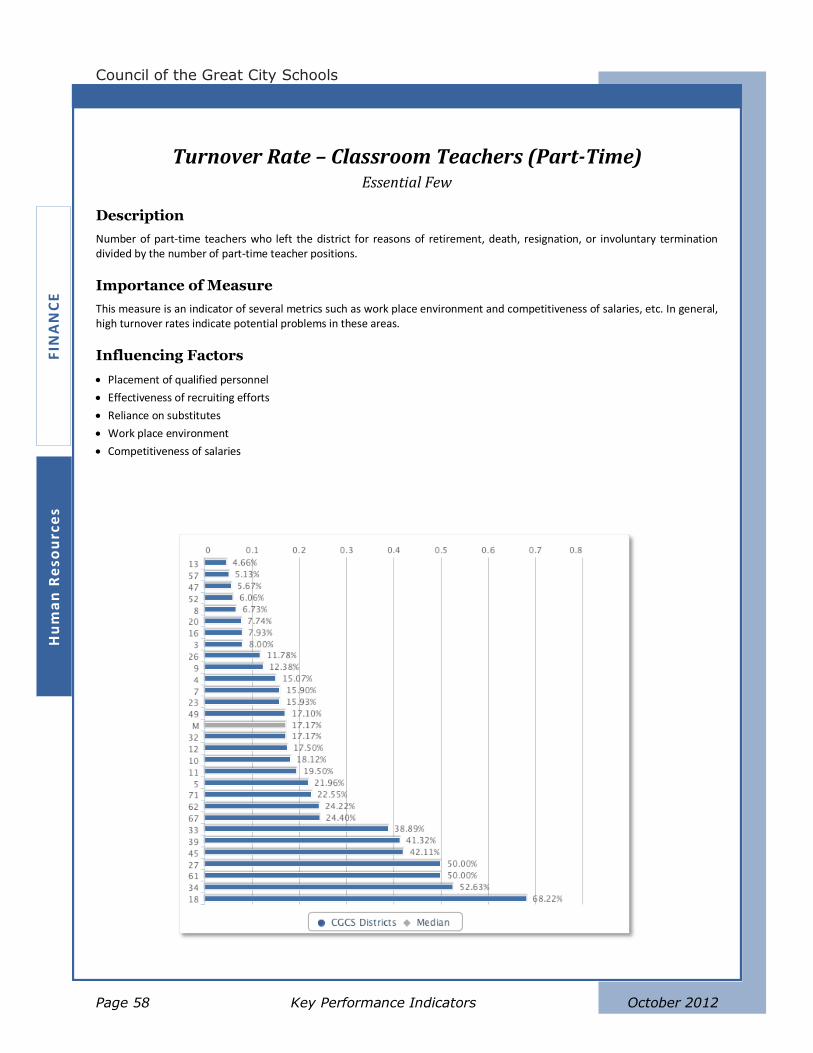
Z
Council of the Great City Schools
Page 58 Key Performance Indicators October 2012
FIN
AN
CE
H
um
an
Re
sou
rce
s
Turnover Rate – Classroom Teachers (Part-Time) Essential Few
Description
Number of part-time teachers who left the district for reasons of retirement, death, resignation, or involuntary termination divided by the number of part-time teacher positions.
Importance of Measure
This measure is an indicator of several metrics such as work place environment and competitiveness of salaries, etc. In general, high turnover rates indicate potential problems in these areas.
Influencing Factors
Placement of qualified personnel
Effectiveness of recruiting efforts
Reliance on substitutes
Work place environment
Competitiveness of salaries
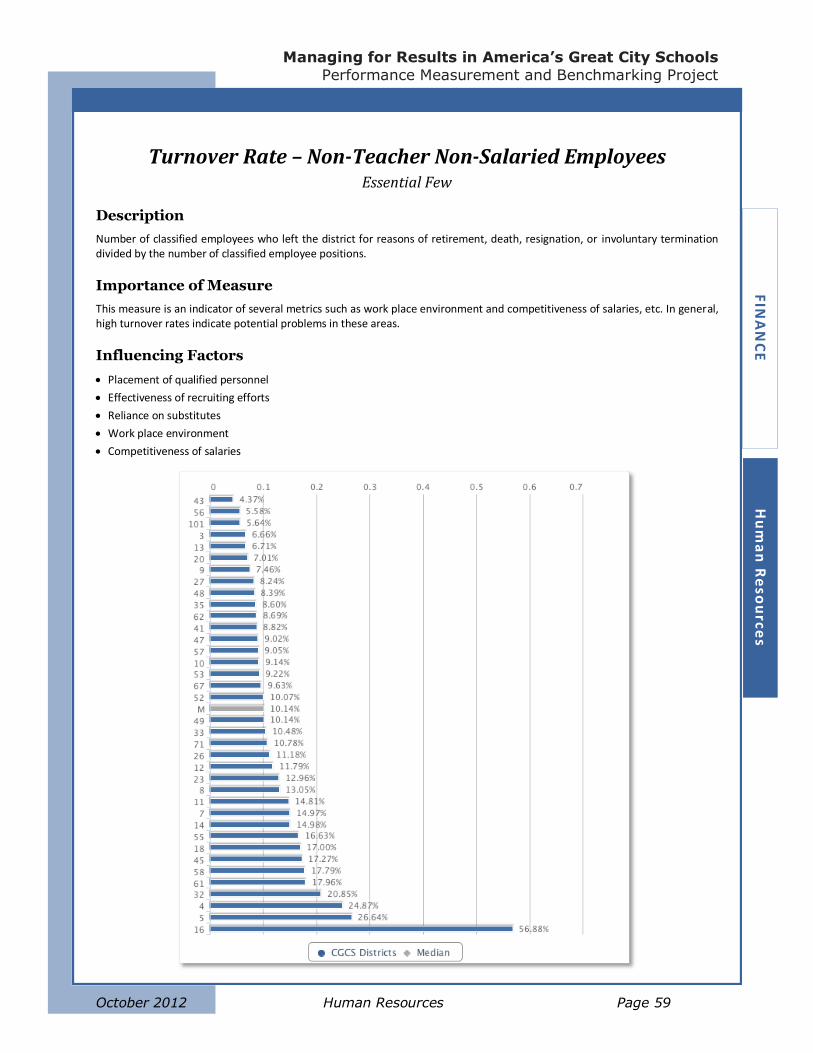
Managing for Results in America’s Great City Schools
Performance Measurement and Benchmarking Project
October 2012 Human Resources Page 59
FIN
AN
CE
H
um
an
Re
sou
rces
Turnover Rate – Non-Teacher Non-Salaried Employees Essential Few
Description
Number of classified employees who left the district for reasons of retirement, death, resignation, or involuntary termination divided by the number of classified employee positions.
Importance of Measure
This measure is an indicator of several metrics such as work place environment and competitiveness of salaries, etc. In general, high turnover rates indicate potential problems in these areas.
Influencing Factors
Placement of qualified personnel
Effectiveness of recruiting efforts
Reliance on substitutes
Work place environment
Competitiveness of salaries
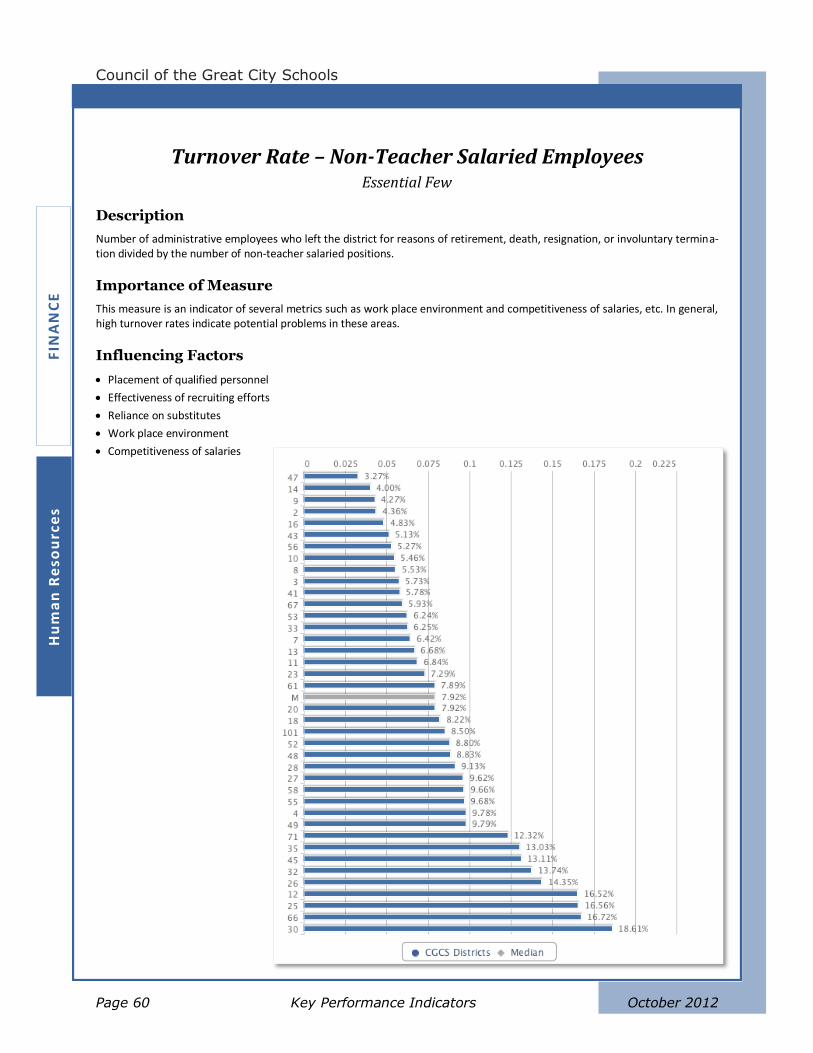
Z
Council of the Great City Schools
Page 60 Key Performance Indicators October 2012
FIN
AN
CE
H
um
an
Re
sou
rce
s
Turnover Rate – Non-Teacher Salaried Employees Essential Few
Description
Number of administrative employees who left the district for reasons of retirement, death, resignation, or involuntary termina-tion divided by the number of non-teacher salaried positions.
Importance of Measure
This measure is an indicator of several metrics such as work place environment and competitiveness of salaries, etc. In general, high turnover rates indicate potential problems in these areas.
Influencing Factors
Placement of qualified personnel
Effectiveness of recruiting efforts
Reliance on substitutes
Work place environment
Competitiveness of salaries
Managing for Results in America’s Great City Schools
Performance Measurement and Benchmarking Project
October 2012 Procurement Page 61
FIN
AN
CE
P
rocu
rem
en
t
Procurement
Procurement improvement strategies generally fall into two goal categories:
1. Increasing the level of cost savings, represented broadly by the Procurement Savings
Ratio.
2. Improving efficiency and decreasing costs of the Purchasing Department, represented
broadly by Cost per Purchase Order and Purchasing Department Costs per Procure-
ment Dollars Spent.
Measures that track progress toward the first goal include Competitive Procurements Ratio,
Strategic Sourcing Ratio, and Cooperative Purchasing Agreements Ratio. These measures reflect
practices that are generally shown to increase savings, and should be utilized to the fullest extent
practicable.
And Purchasing Department cost efficiency is generally improved through the effective automa-
tion of procurement spending. This is largely represented by the P-Card Transactions Ratio and
the Electronic Procurement Transactions Ratio.
Finally, metrics of a Procurement Department’s service levels, such as Procurement Administra-
tive Lead Time, should also be considered.
These metrics of procurement practices should provide district leaders with good baseline infor-
mation on how their district can improve its procurement function. The general influencing fac-
tors that can guide improvement strategies include:
Procurement policies, particularly those delegating purchase authority and P-Card usage
Utilization of technology to manage a high volume of low dollar transactions
e-Procurement and e-Catalog processes utilized by district
P-Card reconciliation software and P-Card database interface with a district’s ERP sys-
tem
Budget, purchasing, and audit controls, including P-card credit-limit controls on single
transactions and monthly limits
Utilization of blanket purchase agreements (BPAs)
Degree of requirement consolidation and standardization
Use of P-Cards on construction projects and paying large dollar vendors, e.g., utilities,
textbook publishers, food, technology projects
Number of highly complex procurements, especially construction
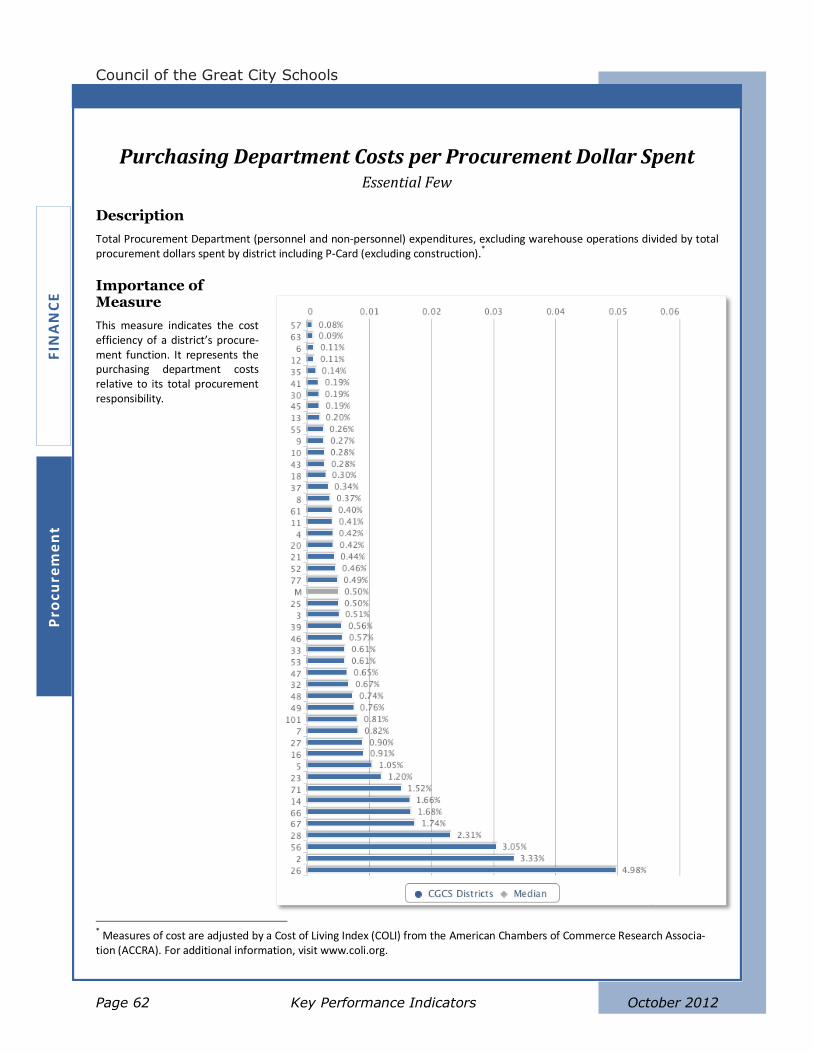
Z
Council of the Great City Schools
Page 62 Key Performance Indicators October 2012
FIN
AN
CE
P
rocu
rem
en
t
Purchasing Department Costs per Procurement Dollar Spent Essential Few
Description
Total Procurement Department (personnel and non-personnel) expenditures, excluding warehouse operations divided by total procurement dollars spent by district including P-Card (excluding construction).
*
Importance of Measure
This measure indicates the cost efficiency of a district’s procure-ment function. It represents the purchasing department costs relative to its total procurement responsibility.
* Measures of cost are adjusted by a Cost of Living Index (COLI) from the American Chambers of Commerce Research Associa-tion (ACCRA). For additional information, visit www.coli.org.
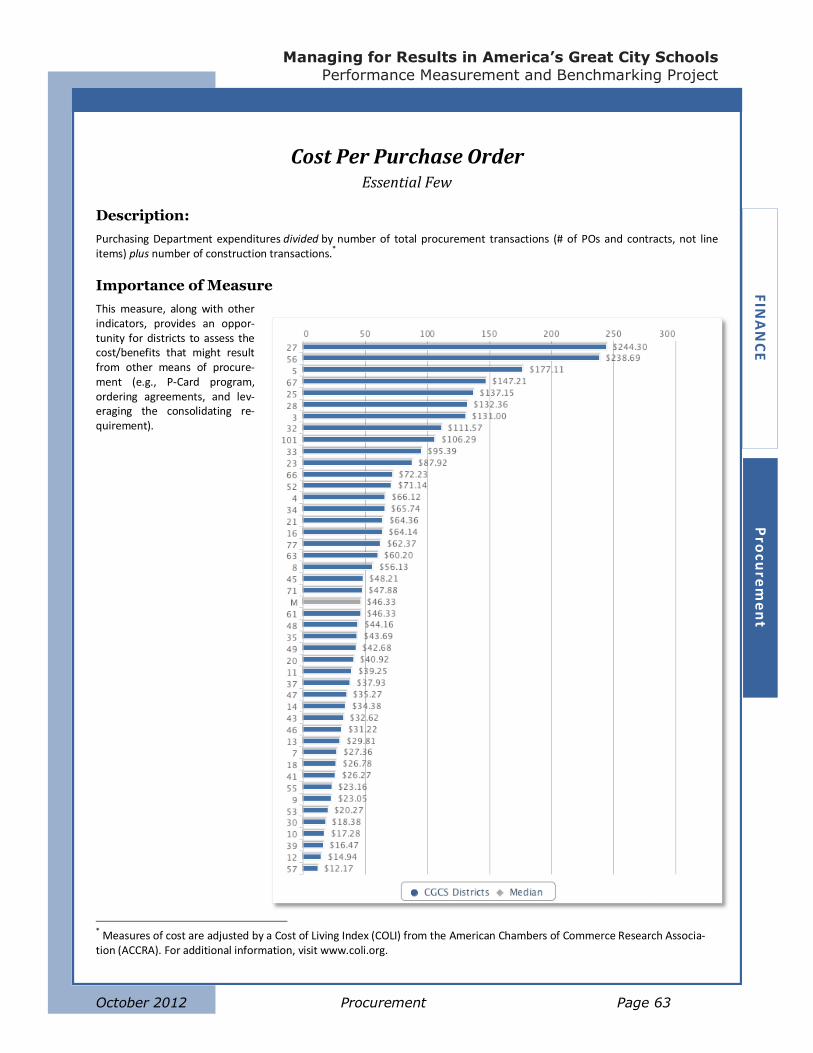
Managing for Results in America’s Great City Schools
Performance Measurement and Benchmarking Project
October 2012 Procurement Page 63
FIN
AN
CE
P
rocu
rem
en
t
Cost Per Purchase Order Essential Few
Description:
Purchasing Department expenditures divided by number of total procurement transactions (# of POs and contracts, not line items) plus number of construction transactions.
*
Importance of Measure
This measure, along with other indicators, provides an oppor-tunity for districts to assess the cost/benefits that might result from other means of procure-ment (e.g., P-Card program, ordering agreements, and lev-eraging the consolidating re-quirement).
* Measures of cost are adjusted by a Cost of Living Index (COLI) from the American Chambers of Commerce Research Associa-tion (ACCRA). For additional information, visit www.coli.org.
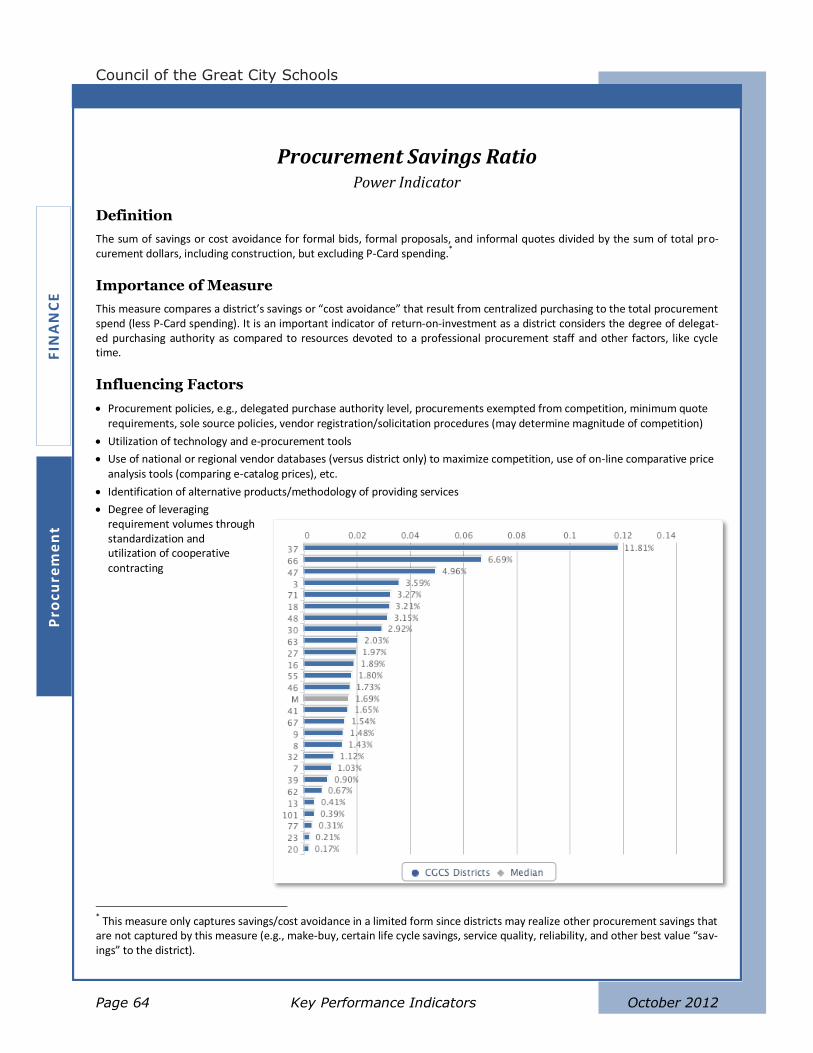
Z
Council of the Great City Schools
Page 64 Key Performance Indicators October 2012
FIN
AN
CE
P
rocu
rem
en
t
Procurement Savings Ratio Power Indicator
Definition
The sum of savings or cost avoidance for formal bids, formal proposals, and informal quotes divided by the sum of total pro-curement dollars, including construction, but excluding P-Card spending.
*
Importance of Measure
This measure compares a district’s savings or “cost avoidance” that result from centralized purchasing to the total procurement spend (less P-Card spending). It is an important indicator of return-on-investment as a district considers the degree of delegat-ed purchasing authority as compared to resources devoted to a professional procurement staff and other factors, like cycle time.
Influencing Factors
Procurement policies, e.g., delegated purchase authority level, procurements exempted from competition, minimum quote requirements, sole source policies, vendor registration/solicitation procedures (may determine magnitude of competition)
Utilization of technology and e-procurement tools
Use of national or regional vendor databases (versus district only) to maximize competition, use of on-line comparative price analysis tools (comparing e-catalog prices), etc.
Identification of alternative products/methodology of providing services
Degree of leveraging requirement volumes through standardization and utilization of cooperative contracting
* This measure only captures savings/cost avoidance in a limited form since districts may realize other procurement savings that are not captured by this measure (e.g., make-buy, certain life cycle savings, service quality, reliability, and other best value “sav-ings” to the district).
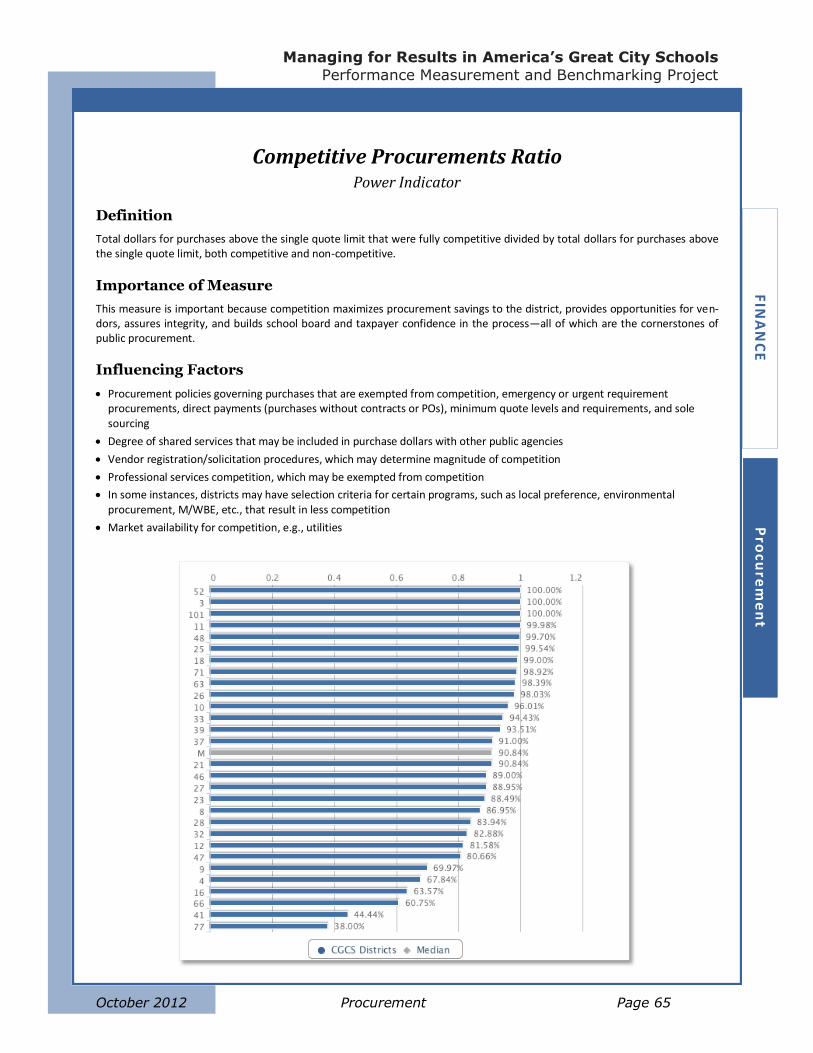
Managing for Results in America’s Great City Schools
Performance Measurement and Benchmarking Project
October 2012 Procurement Page 65
FIN
AN
CE
P
rocu
rem
en
t
Competitive Procurements Ratio Power Indicator
Definition
Total dollars for purchases above the single quote limit that were fully competitive divided by total dollars for purchases above the single quote limit, both competitive and non-competitive.
Importance of Measure
This measure is important because competition maximizes procurement savings to the district, provides opportunities for ven-dors, assures integrity, and builds school board and taxpayer confidence in the process—all of which are the cornerstones of public procurement.
Influencing Factors
Procurement policies governing purchases that are exempted from competition, emergency or urgent requirement procurements, direct payments (purchases without contracts or POs), minimum quote levels and requirements, and sole sourcing
Degree of shared services that may be included in purchase dollars with other public agencies
Vendor registration/solicitation procedures, which may determine magnitude of competition
Professional services competition, which may be exempted from competition
In some instances, districts may have selection criteria for certain programs, such as local preference, environmental procurement, M/WBE, etc., that result in less competition
Market availability for competition, e.g., utilities
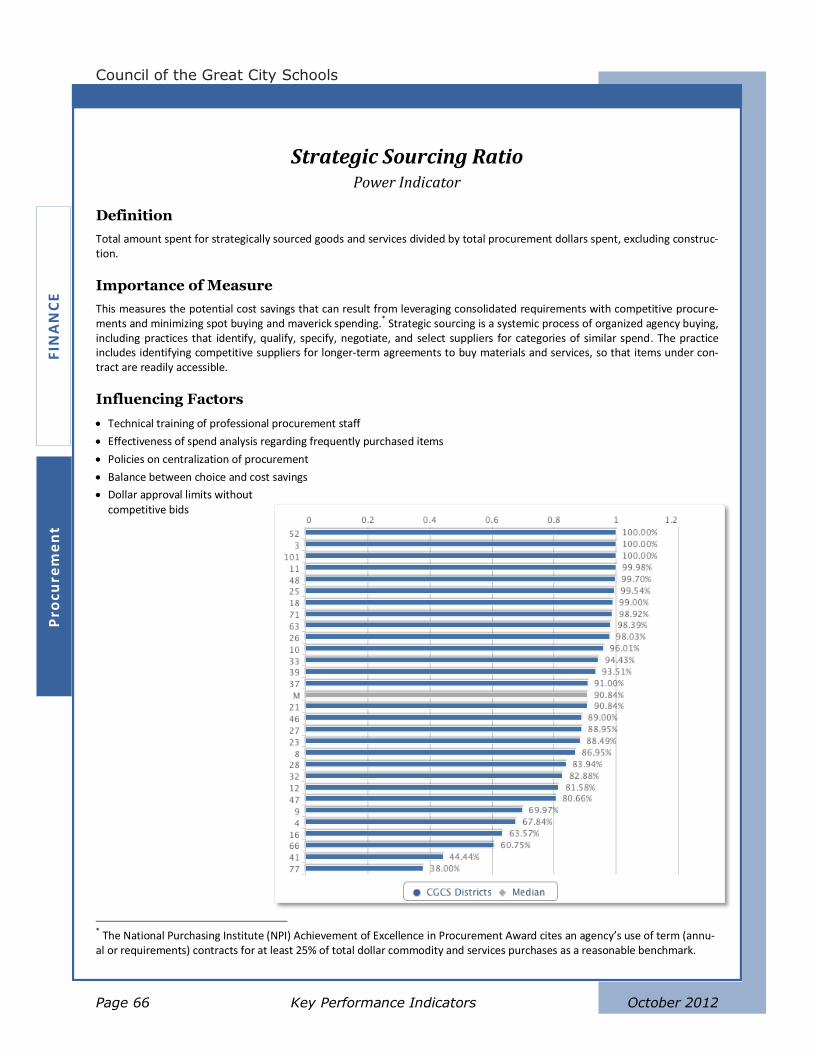
Z
Council of the Great City Schools
Page 66 Key Performance Indicators October 2012
FIN
AN
CE
P
rocu
rem
en
t
Strategic Sourcing Ratio Power Indicator
Definition
Total amount spent for strategically sourced goods and services divided by total procurement dollars spent, excluding construc-tion.
Importance of Measure
This measures the potential cost savings that can result from leveraging consolidated requirements with competitive procure-ments and minimizing spot buying and maverick spending.* Strategic sourcing is a systemic process of organized agency buying, including practices that identify, qualify, specify, negotiate, and select suppliers for categories of similar spend. The practice includes identifying competitive suppliers for longer-term agreements to buy materials and services, so that items under con-tract are readily accessible.
Influencing Factors
Technical training of professional procurement staff
Effectiveness of spend analysis regarding frequently purchased items
Policies on centralization of procurement
Balance between choice and cost savings
Dollar approval limits without competitive bids
* The National Purchasing Institute (NPI) Achievement of Excellence in Procurement Award cites an agency’s use of term (annu-al or requirements) contracts for at least 25% of total dollar commodity and services purchases as a reasonable benchmark.
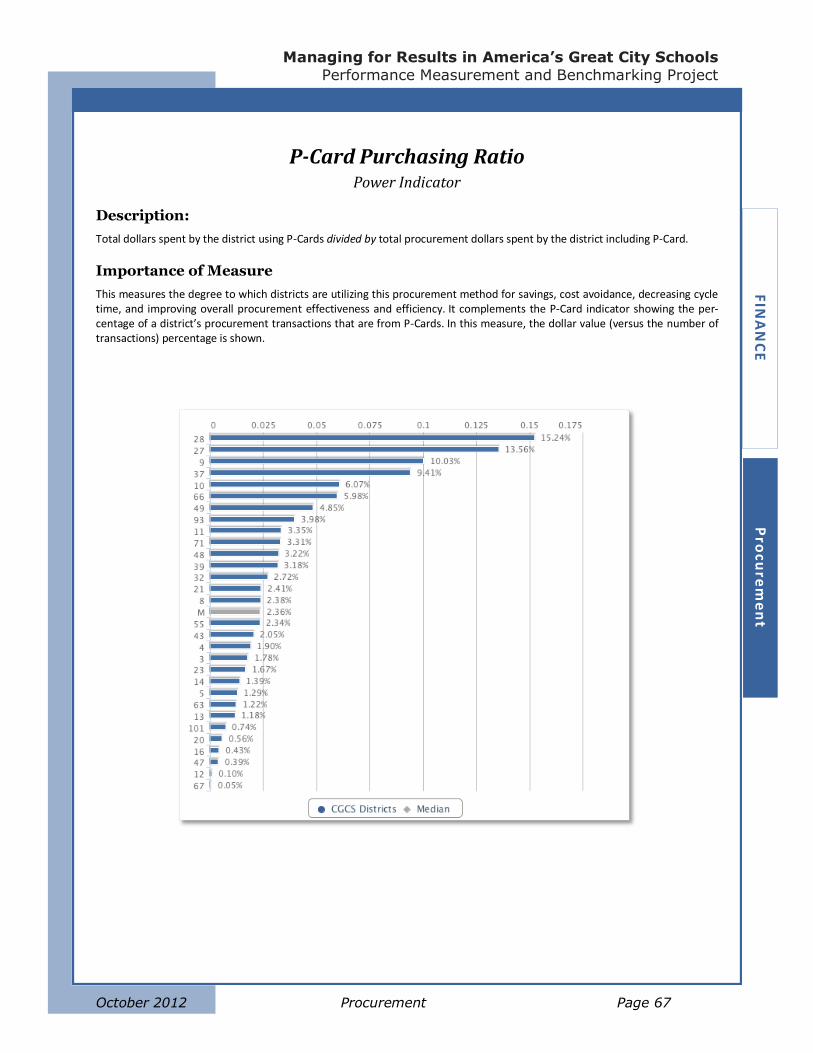
Managing for Results in America’s Great City Schools
Performance Measurement and Benchmarking Project
October 2012 Procurement Page 67
FIN
AN
CE
P
rocu
rem
en
t
P-Card Purchasing Ratio Power Indicator
Description:
Total dollars spent by the district using P-Cards divided by total procurement dollars spent by the district including P-Card.
Importance of Measure
This measures the degree to which districts are utilizing this procurement method for savings, cost avoidance, decreasing cycle time, and improving overall procurement effectiveness and efficiency. It complements the P-Card indicator showing the per-centage of a district’s procurement transactions that are from P-Cards. In this measure, the dollar value (versus the number of transactions) percentage is shown.
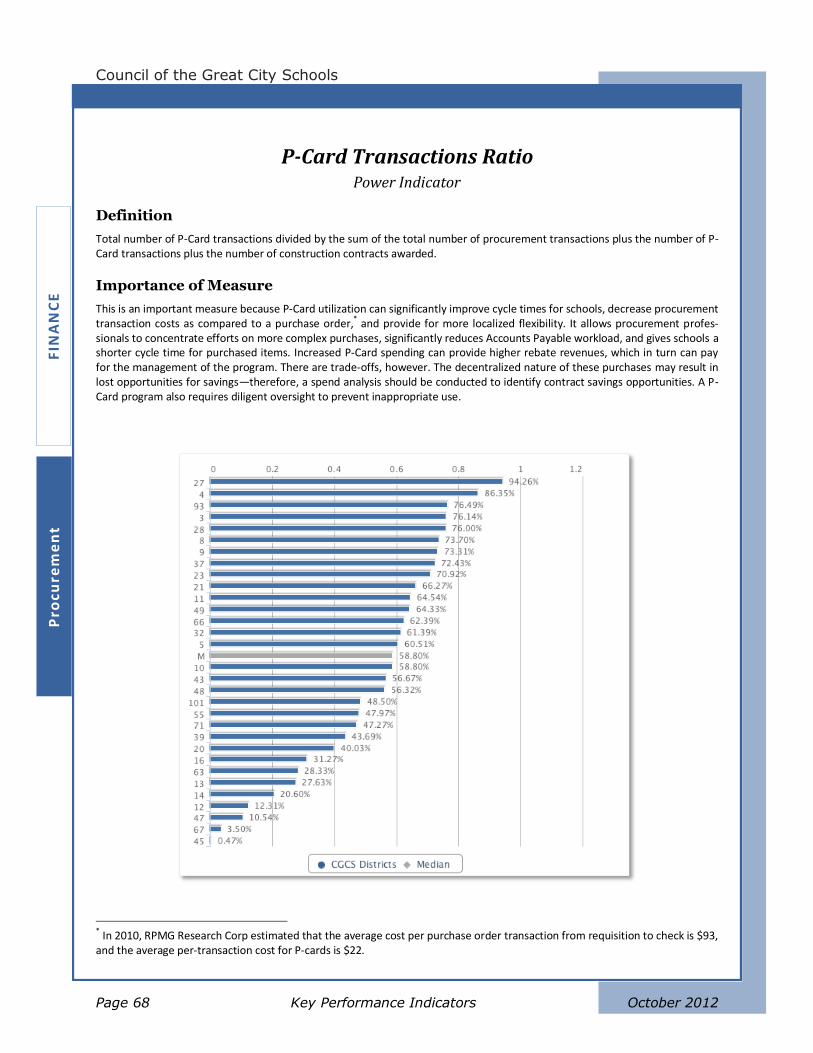
Z
Council of the Great City Schools
Page 68 Key Performance Indicators October 2012
FIN
AN
CE
P
rocu
rem
en
t
P-Card Transactions Ratio Power Indicator
Definition
Total number of P-Card transactions divided by the sum of the total number of procurement transactions plus the number of P-Card transactions plus the number of construction contracts awarded.
Importance of Measure
This is an important measure because P-Card utilization can significantly improve cycle times for schools, decrease procurement transaction costs as compared to a purchase order,* and provide for more localized flexibility. It allows procurement profes-sionals to concentrate efforts on more complex purchases, significantly reduces Accounts Payable workload, and gives schools a shorter cycle time for purchased items. Increased P-Card spending can provide higher rebate revenues, which in turn can pay for the management of the program. There are trade-offs, however. The decentralized nature of these purchases may result in lost opportunities for savings—therefore, a spend analysis should be conducted to identify contract savings opportunities. A P-Card program also requires diligent oversight to prevent inappropriate use.
* In 2010, RPMG Research Corp estimated that the average cost per purchase order transaction from requisition to check is $93, and the average per-transaction cost for P-cards is $22.
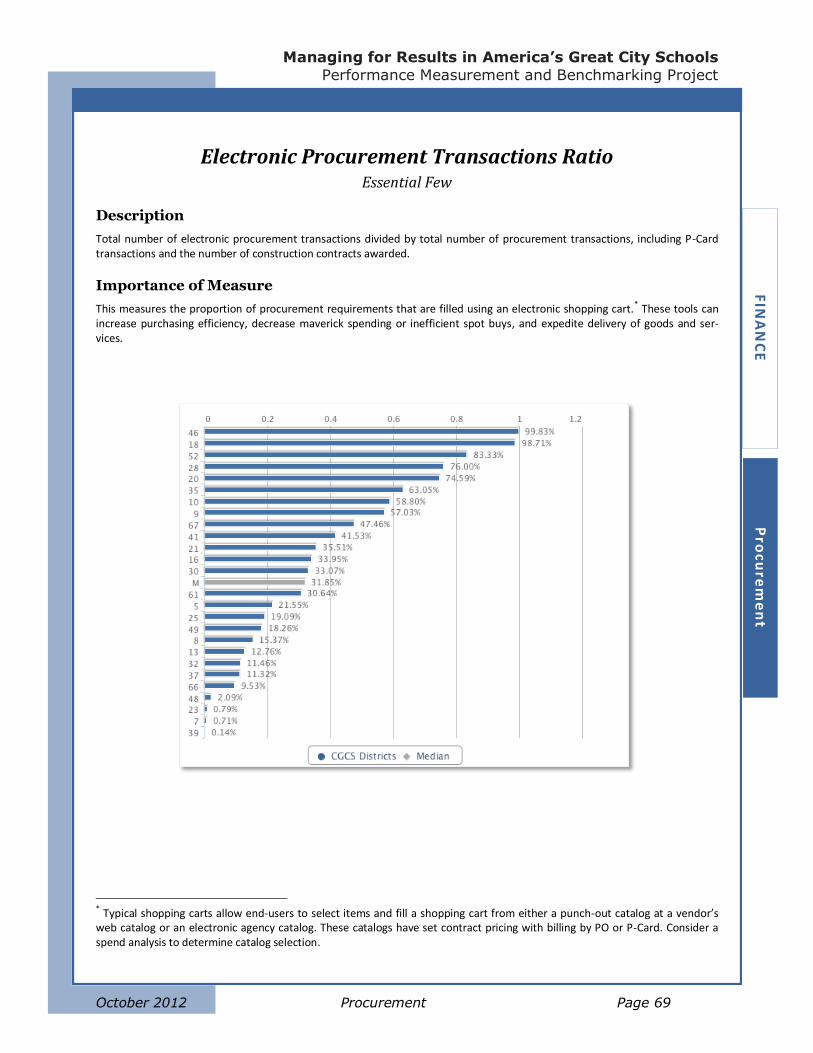
Managing for Results in America’s Great City Schools
Performance Measurement and Benchmarking Project
October 2012 Procurement Page 69
FIN
AN
CE
P
rocu
rem
en
t
Electronic Procurement Transactions Ratio Essential Few
Description
Total number of electronic procurement transactions divided by total number of procurement transactions, including P-Card transactions and the number of construction contracts awarded.
Importance of Measure
This measures the proportion of procurement requirements that are filled using an electronic shopping cart.* These tools can increase purchasing efficiency, decrease maverick spending or inefficient spot buys, and expedite delivery of goods and ser-vices.
* Typical shopping carts allow end-users to select items and fill a shopping cart from either a punch-out catalog at a vendor’s web catalog or an electronic agency catalog. These catalogs have set contract pricing with billing by PO or P-Card. Consider a spend analysis to determine catalog selection.
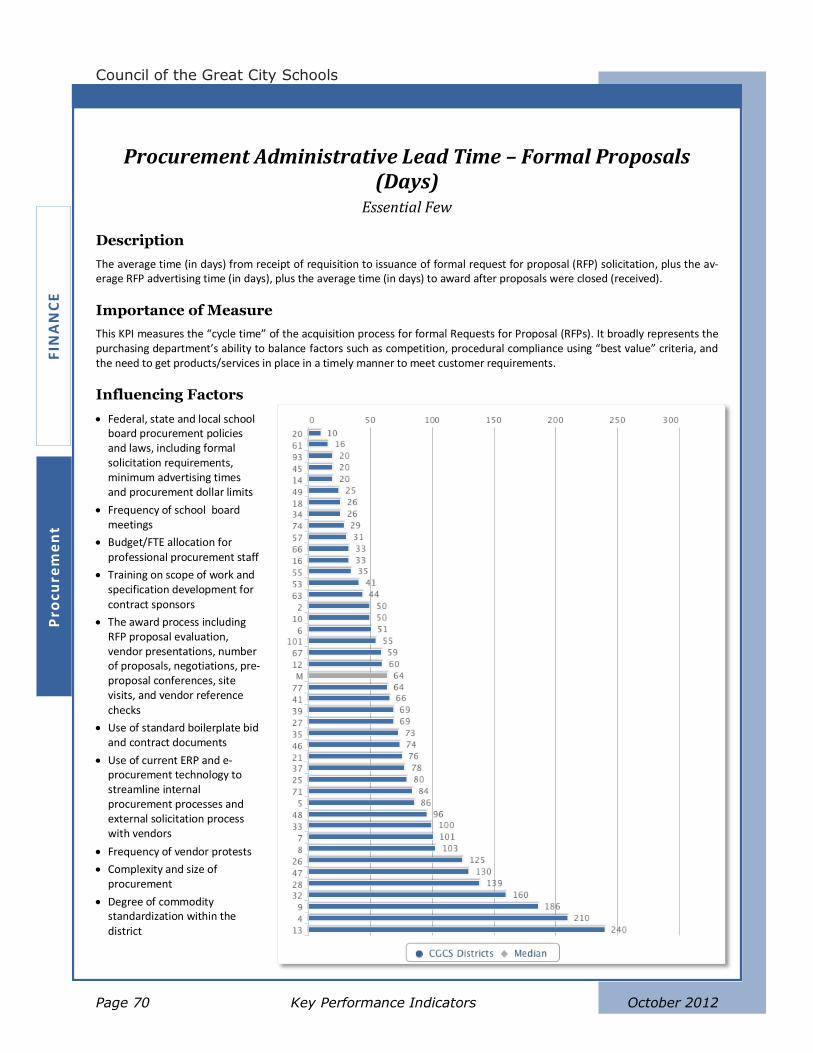
Z
Council of the Great City Schools
Page 70 Key Performance Indicators October 2012
FIN
AN
CE
P
rocu
rem
en
t
Procurement Administrative Lead Time – Formal Proposals (Days)
Essential Few
Description
The average time (in days) from receipt of requisition to issuance of formal request for proposal (RFP) solicitation, plus the av-erage RFP advertising time (in days), plus the average time (in days) to award after proposals were closed (received).
Importance of Measure
This KPI measures the “cycle time” of the acquisition process for formal Requests for Proposal (RFPs). It broadly represents the purchasing department’s ability to balance factors such as competition, procedural compliance using “best value” criteria, and the need to get products/services in place in a timely manner to meet customer requirements.
Influencing Factors
Federal, state and local school board procurement policies and laws, including formal solicitation requirements, minimum advertising times and procurement dollar limits
Frequency of school board meetings
Budget/FTE allocation for professional procurement staff
Training on scope of work and specification development for contract sponsors
The award process including RFP proposal evaluation, vendor presentations, number of proposals, negotiations, pre-proposal conferences, site visits, and vendor reference checks
Use of standard boilerplate bid and contract documents
Use of current ERP and e-procurement technology to streamline internal procurement processes and external solicitation process with vendors
Frequency of vendor protests
Complexity and size of procurement
Degree of commodity standardization within the district
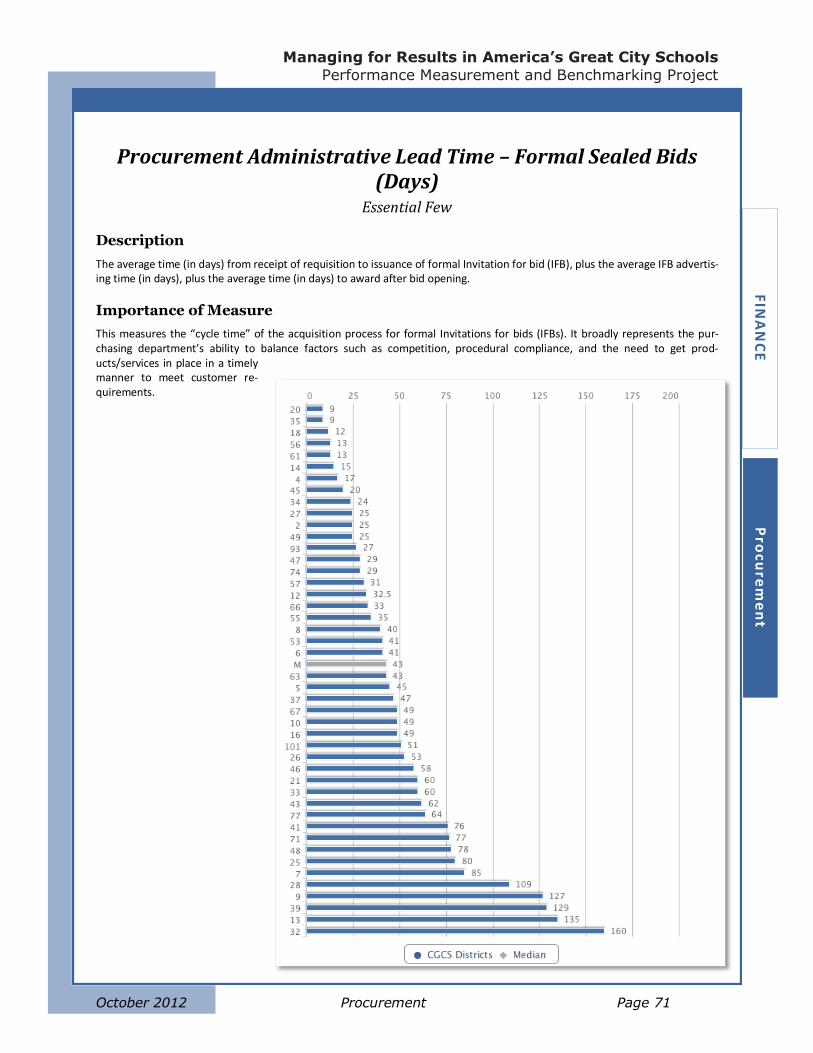
Managing for Results in America’s Great City Schools
Performance Measurement and Benchmarking Project
October 2012 Procurement Page 71
FIN
AN
CE
P
rocu
rem
en
t
Procurement Administrative Lead Time – Formal Sealed Bids (Days)
Essential Few
Description
The average time (in days) from receipt of requisition to issuance of formal Invitation for bid (IFB), plus the average IFB advertis-ing time (in days), plus the average time (in days) to award after bid opening.
Importance of Measure
This measures the “cycle time” of the acquisition process for formal Invitations for bids (IFBs). It broadly represents the pur-chasing department’s ability to balance factors such as competition, procedural compliance, and the need to get prod-ucts/services in place in a timely manner to meet customer re-quirements.
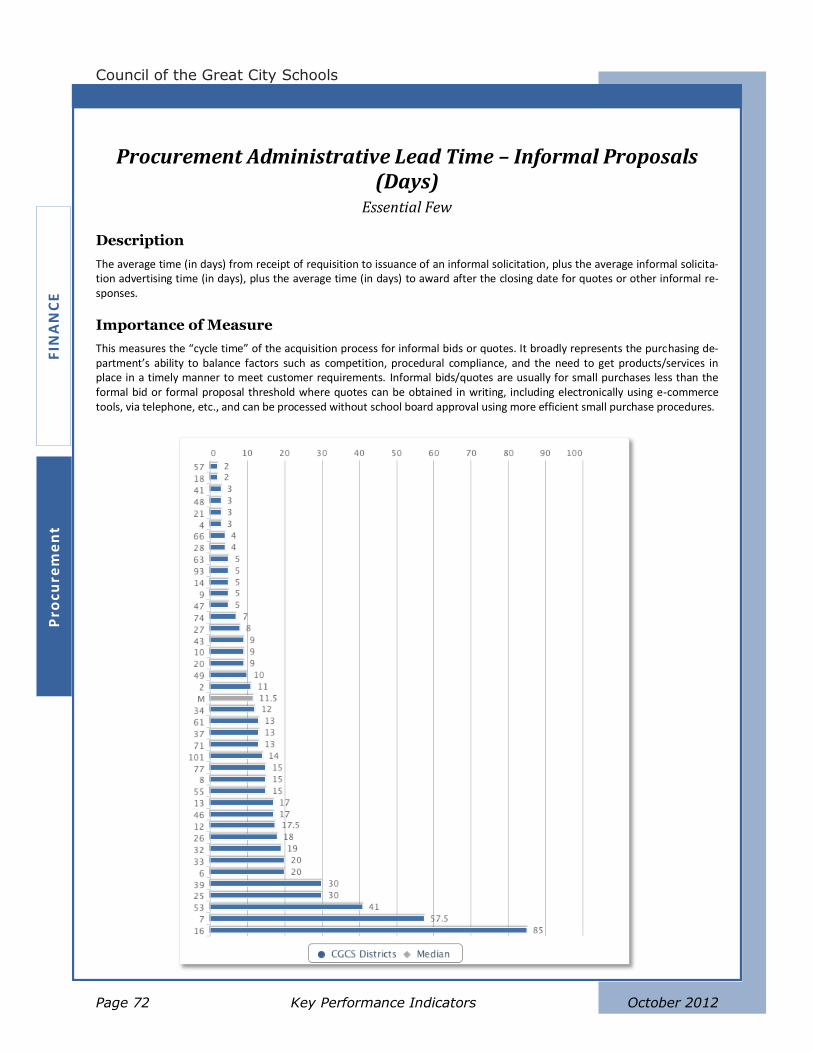
Z
Council of the Great City Schools
Page 72 Key Performance Indicators October 2012
FIN
AN
CE
P
rocu
rem
en
t
Procurement Administrative Lead Time – Informal Proposals (Days)
Essential Few
Description
The average time (in days) from receipt of requisition to issuance of an informal solicitation, plus the average informal solicita-tion advertising time (in days), plus the average time (in days) to award after the closing date for quotes or other informal re-sponses.
Importance of Measure
This measures the “cycle time” of the acquisition process for informal bids or quotes. It broadly represents the purchasing de-partment’s ability to balance factors such as competition, procedural compliance, and the need to get products/services in place in a timely manner to meet customer requirements. Informal bids/quotes are usually for small purchases less than the formal bid or formal proposal threshold where quotes can be obtained in writing, including electronically using e-commerce tools, via telephone, etc., and can be processed without school board approval using more efficient small purchase procedures.
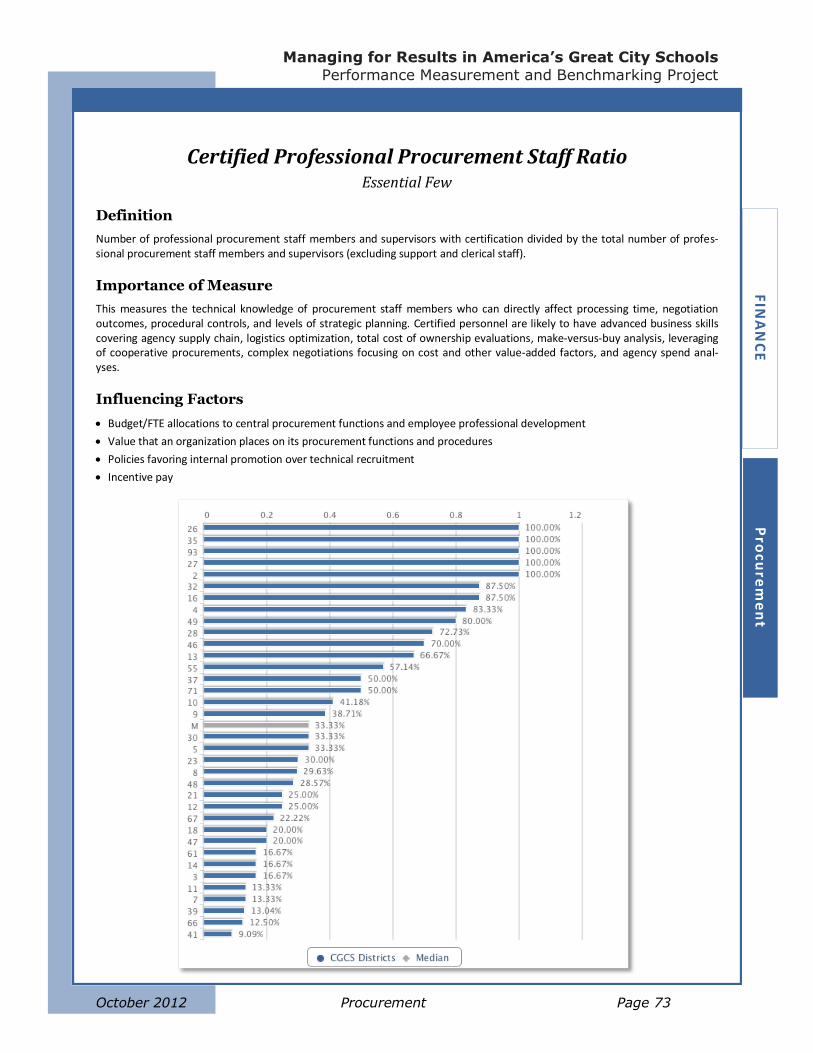
Managing for Results in America’s Great City Schools
Performance Measurement and Benchmarking Project
October 2012 Procurement Page 73
FIN
AN
CE
P
rocu
rem
en
t
Certified Professional Procurement Staff Ratio Essential Few
Definition
Number of professional procurement staff members and supervisors with certification divided by the total number of profes-sional procurement staff members and supervisors (excluding support and clerical staff).
Importance of Measure
This measures the technical knowledge of procurement staff members who can directly affect processing time, negotiation outcomes, procedural controls, and levels of strategic planning. Certified personnel are likely to have advanced business skills covering agency supply chain, logistics optimization, total cost of ownership evaluations, make-versus-buy analysis, leveraging of cooperative procurements, complex negotiations focusing on cost and other value-added factors, and agency spend anal-yses.
Influencing Factors
Budget/FTE allocations to central procurement functions and employee professional development
Value that an organization places on its procurement functions and procedures
Policies favoring internal promotion over technical recruitment
Incentive pay

Z
Council of the Great City Schools
Page 74 Key Performance Indicators October 2012
FIN
AN
CE
P
rocu
rem
en
t

Managing for Results in America’s Great City Schools
Performance Measurement and Benchmarking Project
October 2012 Risk Management Page 75
FIN
AN
CE
R
isk M
an
ag
em
en
t
Risk Management
Performance metrics in risk management evaluate the rate of incidents that could lead to claims
against the district, as well as the total cost of claims and insurance. The total cost is broadly con-
sidered by looking at the Cost of Risk per Student and Employee Incident Rate (expressed per
employee or per work hour). Together, they suggest the general risk levels of a district.
Broad measures of relative costs and levels of claims for both Workers’ Compensation and liabil-
ity will help district leaders understand their performance in risk management, which may give
cause for improvement strategies such as:
Searching for better medical management programs
Improving access to quality medical care
Providing benefits in a timely fashion
Conducting risk-factor analysis and prevention
Adopting policies that avoid litigation
Improving the reporting and tracking process for correcting hazardous conditions
Revising safety protocols/guidelines/employer policies
Improving injury investigations used to determine cause of injury
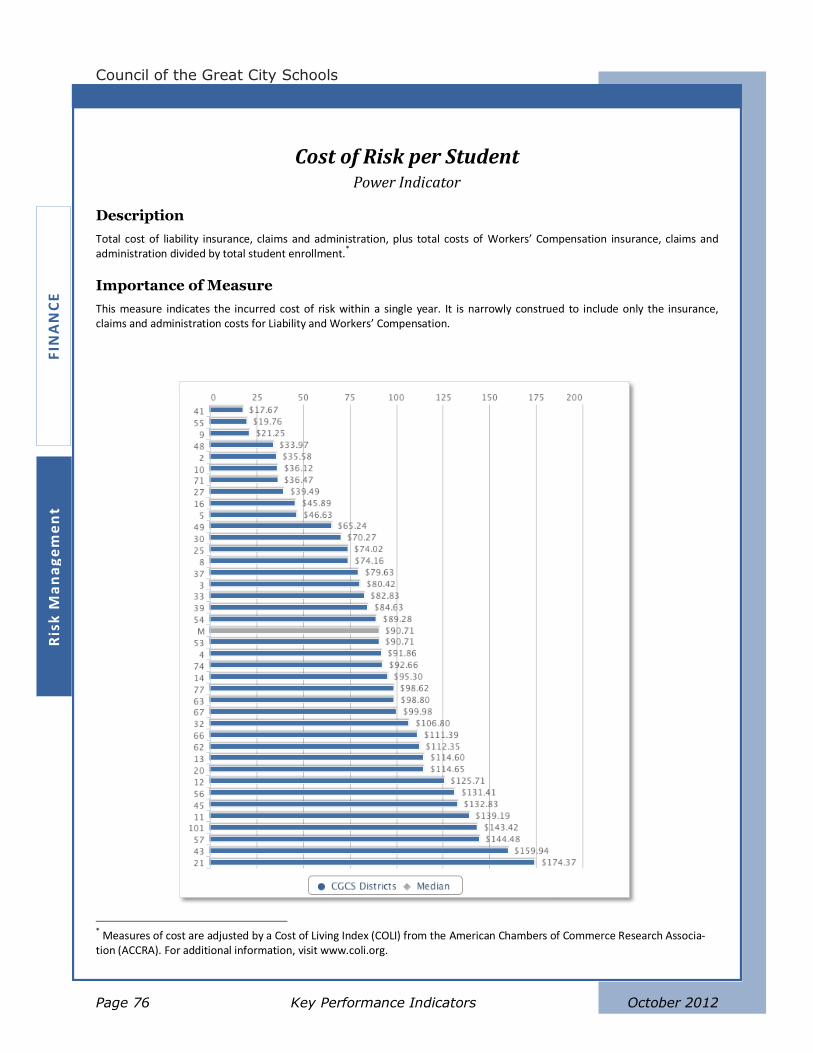
Z
Council of the Great City Schools
Page 76 Key Performance Indicators October 2012
FIN
AN
CE
R
isk
Ma
na
ge
me
nt
Cost of Risk per Student Power Indicator
Description
Total cost of liability insurance, claims and administration, plus total costs of Workers’ Compensation insurance, claims and administration divided by total student enrollment.
*
Importance of Measure
This measure indicates the incurred cost of risk within a single year. It is narrowly construed to include only the insurance, claims and administration costs for Liability and Workers’ Compensation.
* Measures of cost are adjusted by a Cost of Living Index (COLI) from the American Chambers of Commerce Research Associa-tion (ACCRA). For additional information, visit www.coli.org.
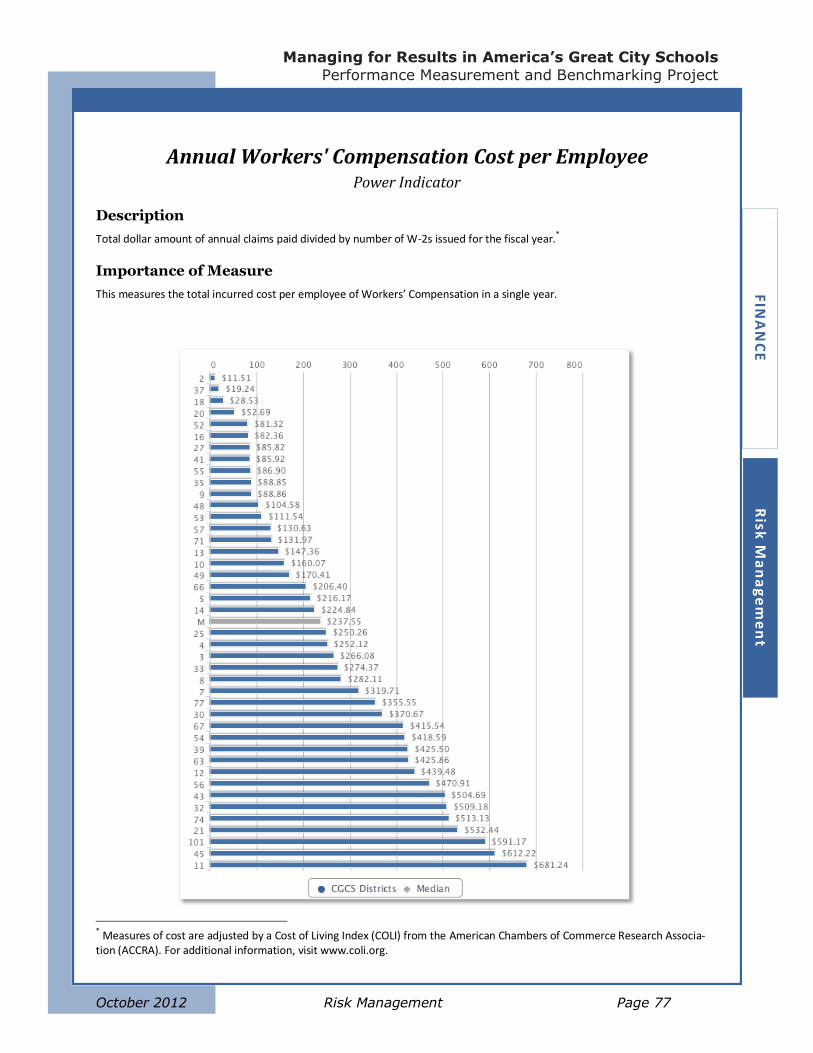
Managing for Results in America’s Great City Schools
Performance Measurement and Benchmarking Project
October 2012 Risk Management Page 77
FIN
AN
CE
R
isk M
an
ag
em
en
t
Annual Workers' Compensation Cost per Employee Power Indicator
Description
Total dollar amount of annual claims paid divided by number of W-2s issued for the fiscal year.*
Importance of Measure
This measures the total incurred cost per employee of Workers’ Compensation in a single year.
* Measures of cost are adjusted by a Cost of Living Index (COLI) from the American Chambers of Commerce Research Associa-tion (ACCRA). For additional information, visit www.coli.org.
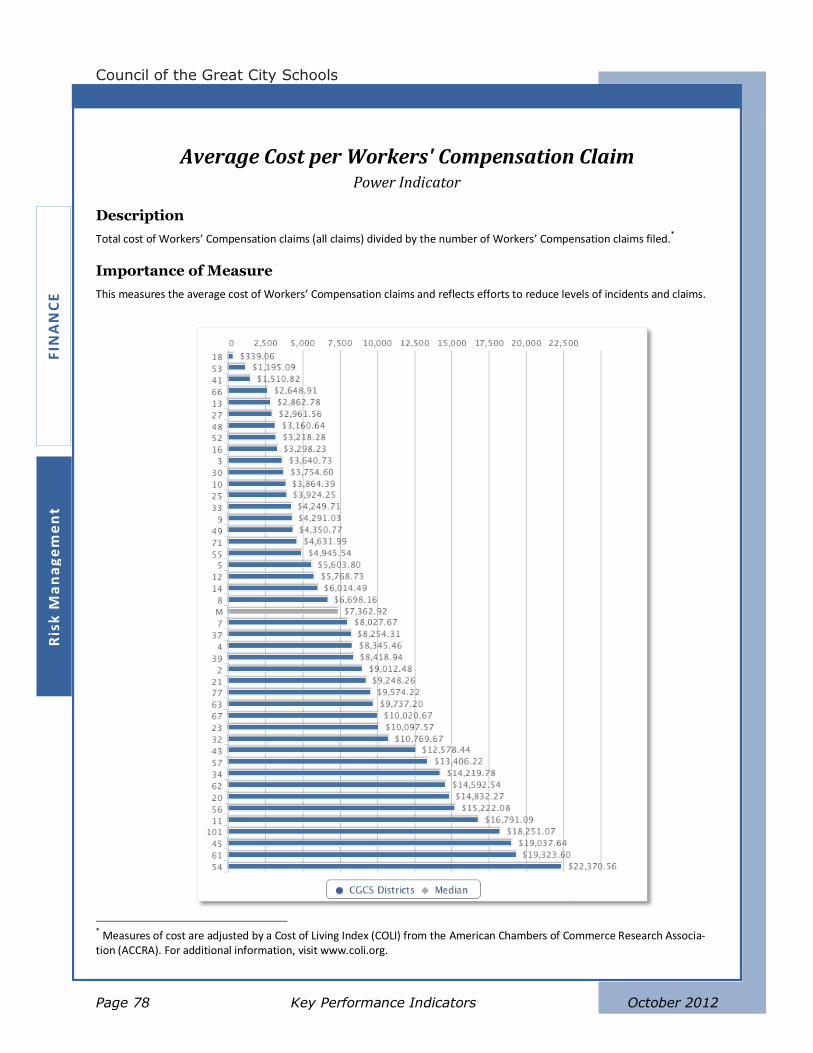
Z
Council of the Great City Schools
Page 78 Key Performance Indicators October 2012
FIN
AN
CE
R
isk
Ma
na
ge
me
nt
Average Cost per Workers' Compensation Claim Power Indicator
Description
Total cost of Workers’ Compensation claims (all claims) divided by the number of Workers’ Compensation claims filed.*
Importance of Measure
This measures the average cost of Workers’ Compensation claims and reflects efforts to reduce levels of incidents and claims.
* Measures of cost are adjusted by a Cost of Living Index (COLI) from the American Chambers of Commerce Research Associa-tion (ACCRA). For additional information, visit www.coli.org.
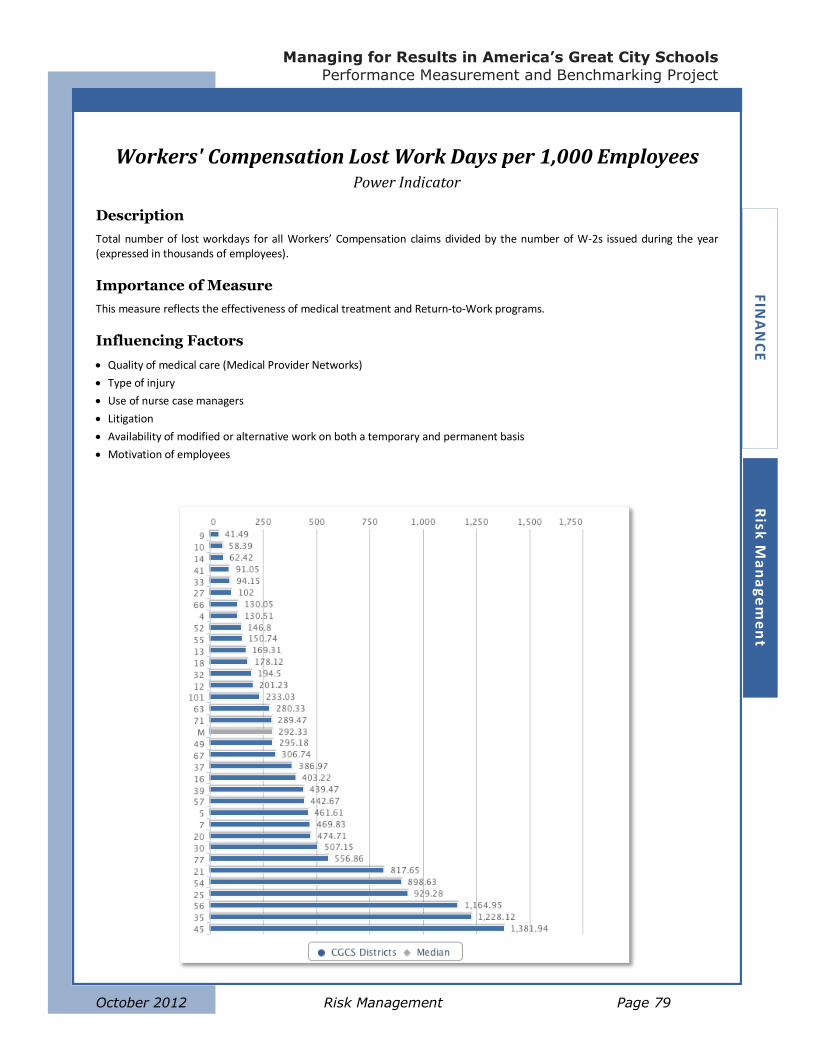
Managing for Results in America’s Great City Schools
Performance Measurement and Benchmarking Project
October 2012 Risk Management Page 79
FIN
AN
CE
R
isk M
an
ag
em
en
t
Workers' Compensation Lost Work Days per 1,000 Employees Power Indicator
Description
Total number of lost workdays for all Workers’ Compensation claims divided by the number of W-2s issued during the year (expressed in thousands of employees).
Importance of Measure
This measure reflects the effectiveness of medical treatment and Return-to-Work programs.
Influencing Factors
Quality of medical care (Medical Provider Networks)
Type of injury
Use of nurse case managers
Litigation
Availability of modified or alternative work on both a temporary and permanent basis
Motivation of employees
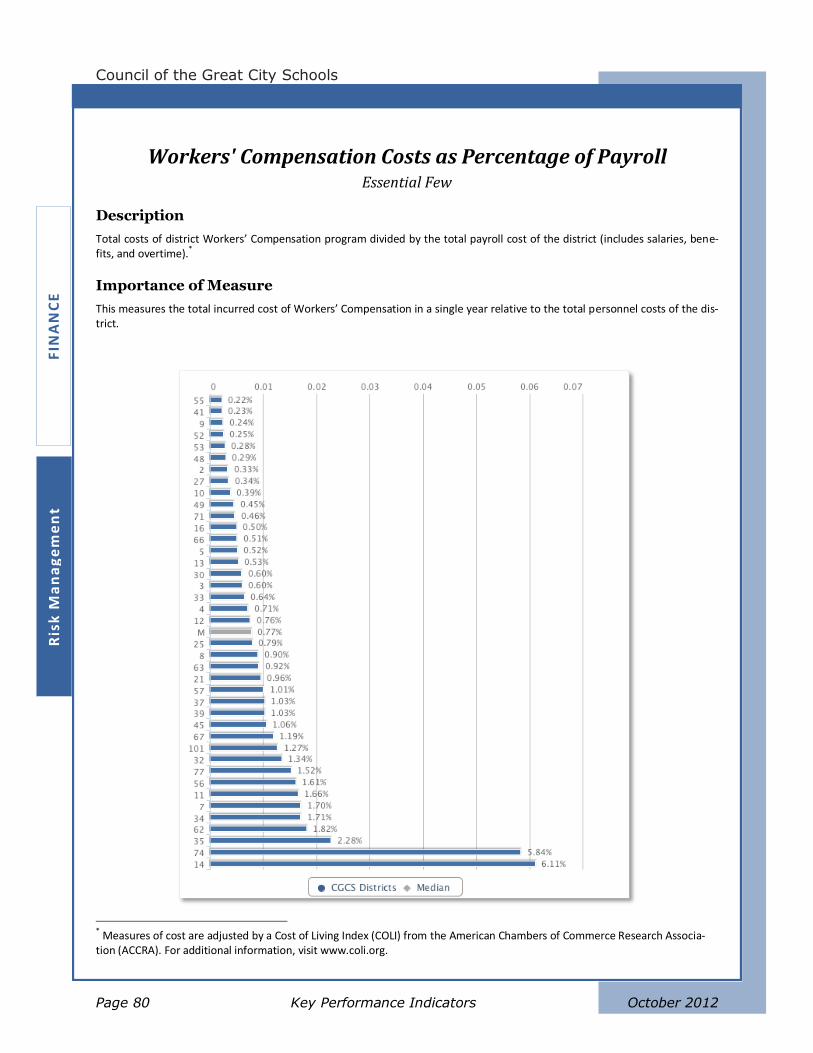
Z
Council of the Great City Schools
Page 80 Key Performance Indicators October 2012
FIN
AN
CE
R
isk
Ma
na
ge
me
nt
Workers' Compensation Costs as Percentage of Payroll Essential Few
Description
Total costs of district Workers’ Compensation program divided by the total payroll cost of the district (includes salaries, bene-fits, and overtime).
*
Importance of Measure
This measures the total incurred cost of Workers’ Compensation in a single year relative to the total personnel costs of the dis-trict.
* Measures of cost are adjusted by a Cost of Living Index (COLI) from the American Chambers of Commerce Research Associa-tion (ACCRA). For additional information, visit www.coli.org.
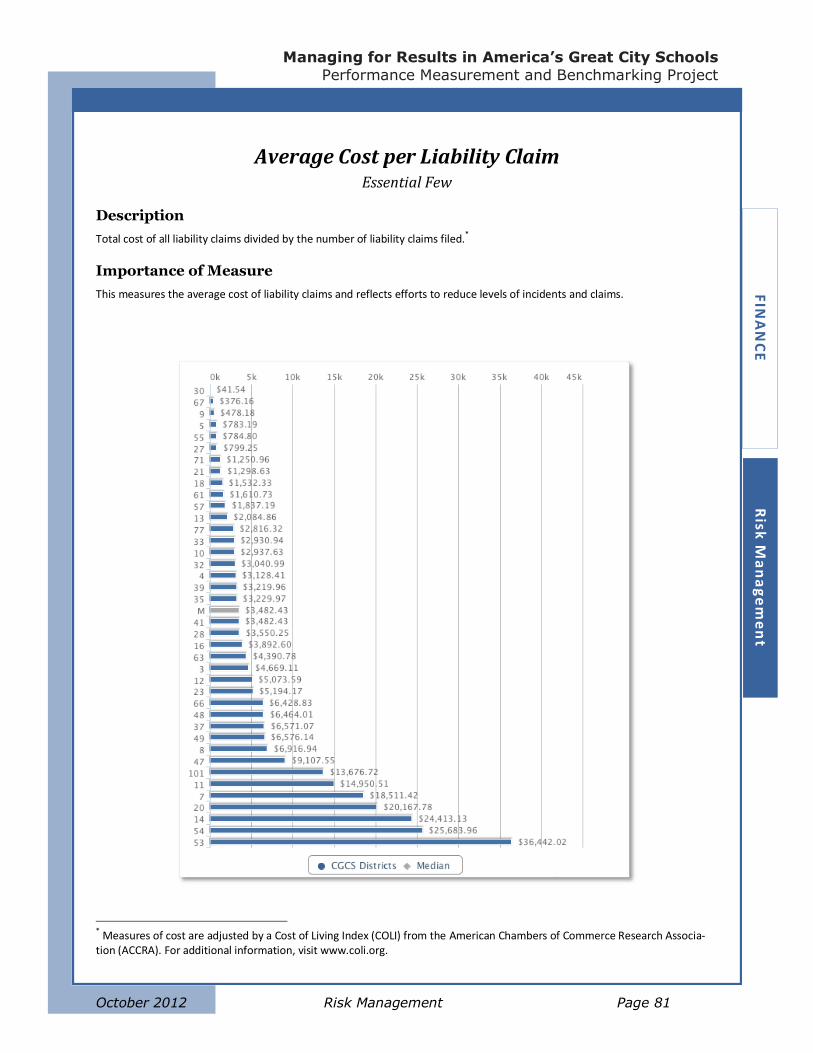
Managing for Results in America’s Great City Schools
Performance Measurement and Benchmarking Project
October 2012 Risk Management Page 81
FIN
AN
CE
R
isk M
an
ag
em
en
t
Average Cost per Liability Claim Essential Few
Description
Total cost of all liability claims divided by the number of liability claims filed.*
Importance of Measure
This measures the average cost of liability claims and reflects efforts to reduce levels of incidents and claims.
* Measures of cost are adjusted by a Cost of Living Index (COLI) from the American Chambers of Commerce Research Associa-tion (ACCRA). For additional information, visit www.coli.org.
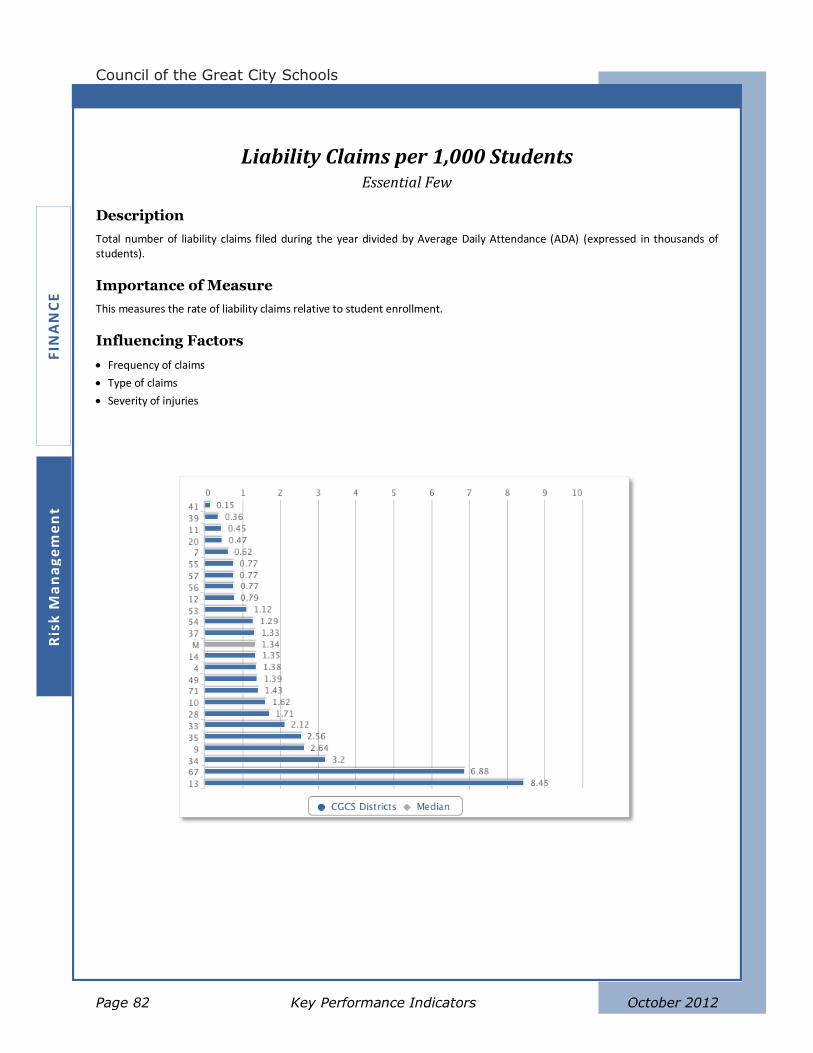
Z
Council of the Great City Schools
Page 82 Key Performance Indicators October 2012
FIN
AN
CE
R
isk
Ma
na
ge
me
nt
Liability Claims per 1,000 Students Essential Few
Description
Total number of liability claims filed during the year divided by Average Daily Attendance (ADA) (expressed in thousands of students).
Importance of Measure
This measures the rate of liability claims relative to student enrollment.
Influencing Factors
Frequency of claims
Type of claims
Severity of injuries
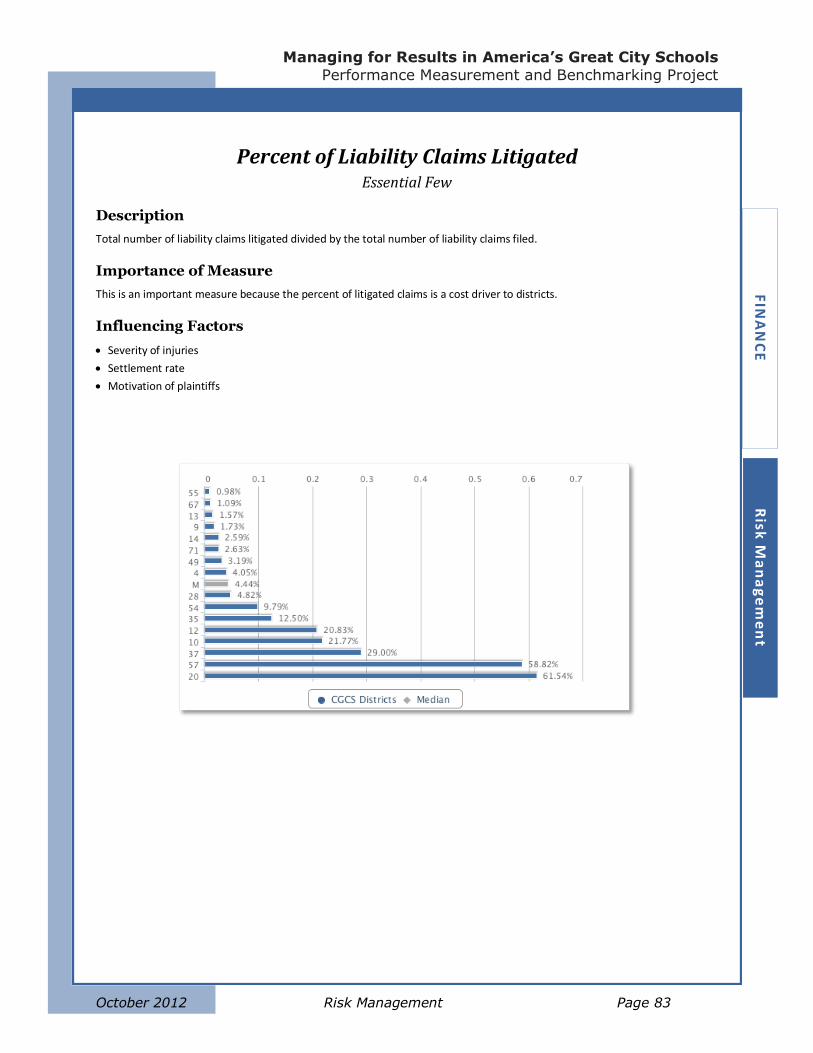
Managing for Results in America’s Great City Schools
Performance Measurement and Benchmarking Project
October 2012 Risk Management Page 83
FIN
AN
CE
R
isk M
an
ag
em
en
t
Percent of Liability Claims Litigated Essential Few
Description
Total number of liability claims litigated divided by the total number of liability claims filed.
Importance of Measure
This is an important measure because the percent of litigated claims is a cost driver to districts.
Influencing Factors
Severity of injuries
Settlement rate
Motivation of plaintiffs
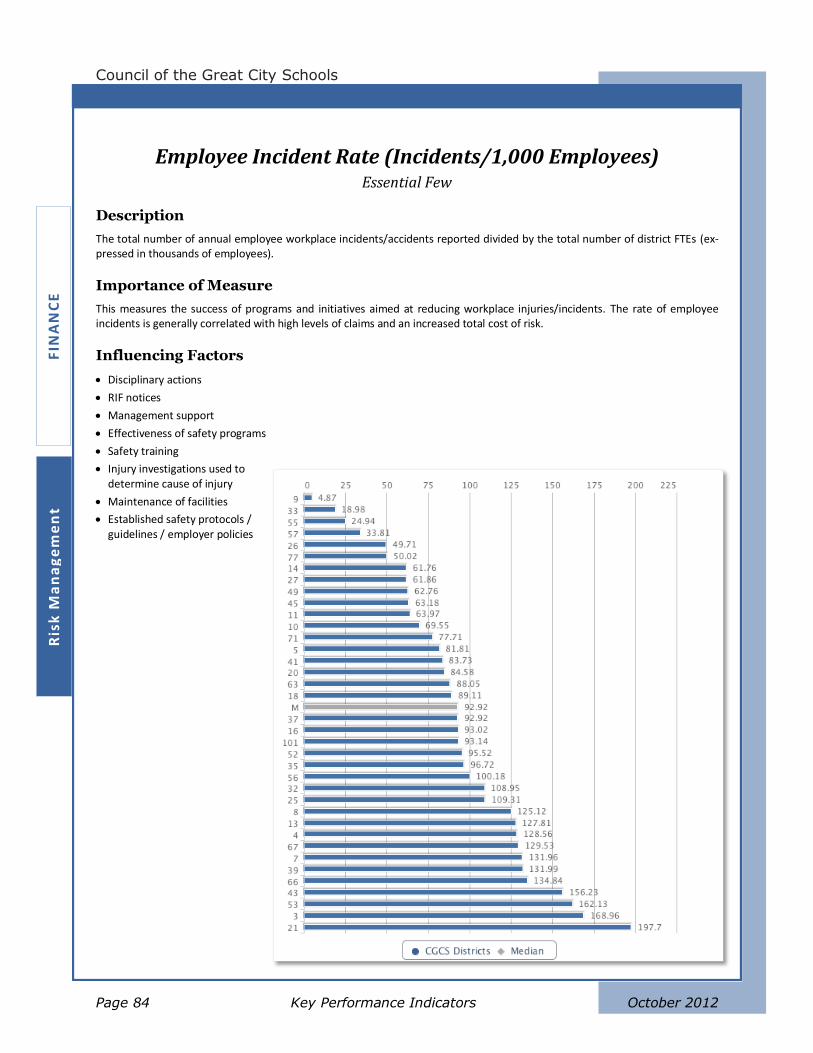
Z
Council of the Great City Schools
Page 84 Key Performance Indicators October 2012
FIN
AN
CE
R
isk
Ma
na
ge
me
nt
Employee Incident Rate (Incidents/1,000 Employees) Essential Few
Description
The total number of annual employee workplace incidents/accidents reported divided by the total number of district FTEs (ex-pressed in thousands of employees).
Importance of Measure
This measures the success of programs and initiatives aimed at reducing workplace injuries/incidents. The rate of employee incidents is generally correlated with high levels of claims and an increased total cost of risk.
Influencing Factors
Disciplinary actions
RIF notices
Management support
Effectiveness of safety programs
Safety training
Injury investigations used to determine cause of injury
Maintenance of facilities
Established safety protocols / guidelines / employer policies
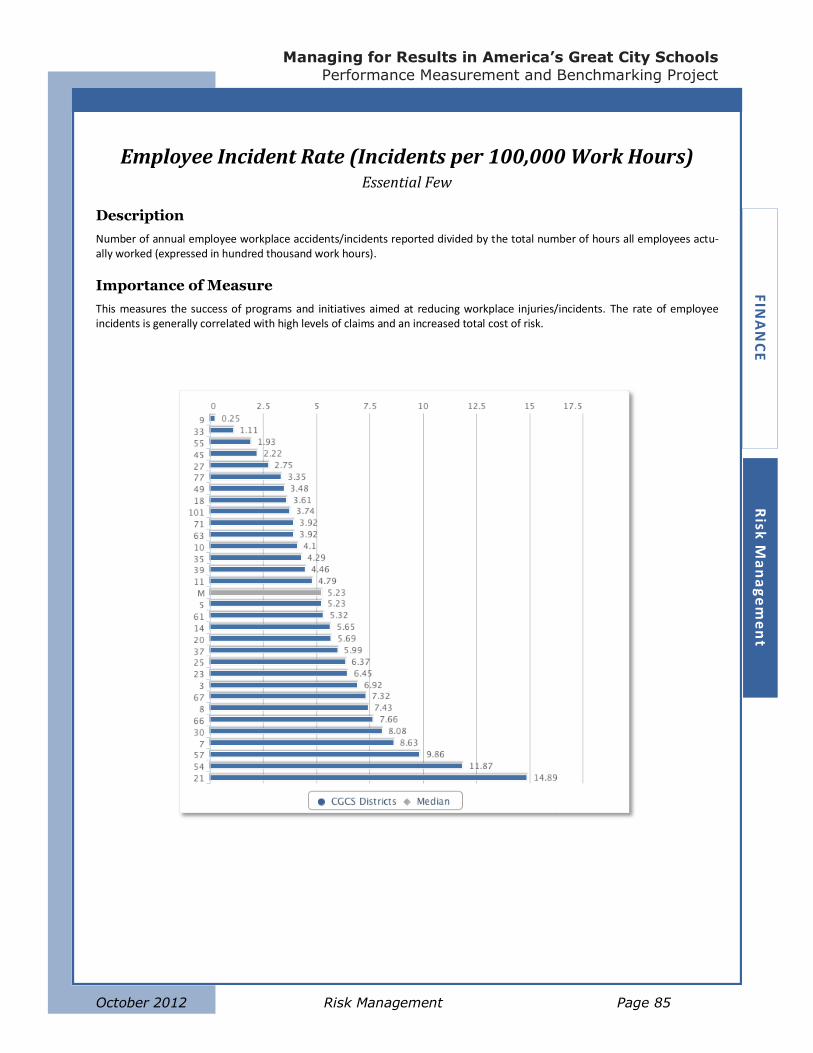
Managing for Results in America’s Great City Schools
Performance Measurement and Benchmarking Project
October 2012 Risk Management Page 85
FIN
AN
CE
R
isk M
an
ag
em
en
t
Employee Incident Rate (Incidents per 100,000 Work Hours) Essential Few
Description
Number of annual employee workplace accidents/incidents reported divided by the total number of hours all employees actu-ally worked (expressed in hundred thousand work hours).
Importance of Measure
This measures the success of programs and initiatives aimed at reducing workplace injuries/incidents. The rate of employee incidents is generally correlated with high levels of claims and an increased total cost of risk.

Council of the Great City Schools
Page 86 Key Performance Indicators October 2012

Managing for Results in America’s Great City Schools
Performance Measurement and Benchmarking Project
October 2012 Page 87
OPERATIONS

Council of the Great City Schools
Page 88 Key Performance Indicators October 2012
Managing for Results in America’s Great City Schools
Performance Measurement and Benchmarking Project
October 2012 Food Services Page 89
OP
ER
AT
ION
S
Fo
od
Se
rvice
s
Food Services
Performance metrics in food services measure the productivity, cost efficiency, and service levels
of a district’s nutritional services. Productivity is broadly represented by Meals per Labor Hour, a
standard measure of the industry. Cost efficiency can be determined by looking at Food Cost per
Revenue and Labor Cost per Revenue. Finally, a basic measure of service levels includes meal
participation rate (measured by Breakfast Participation Rate and Lunch Participation Rate, and
is further measured by looking at rates by grade spans.).
These measures should serve as diagnostic tools to gauge performance, as well as a guide for im-
provement. The importance and usefulness of each KPI is described under the “Importance of
Measure” and “Factors that Influence” sections of each indicator.
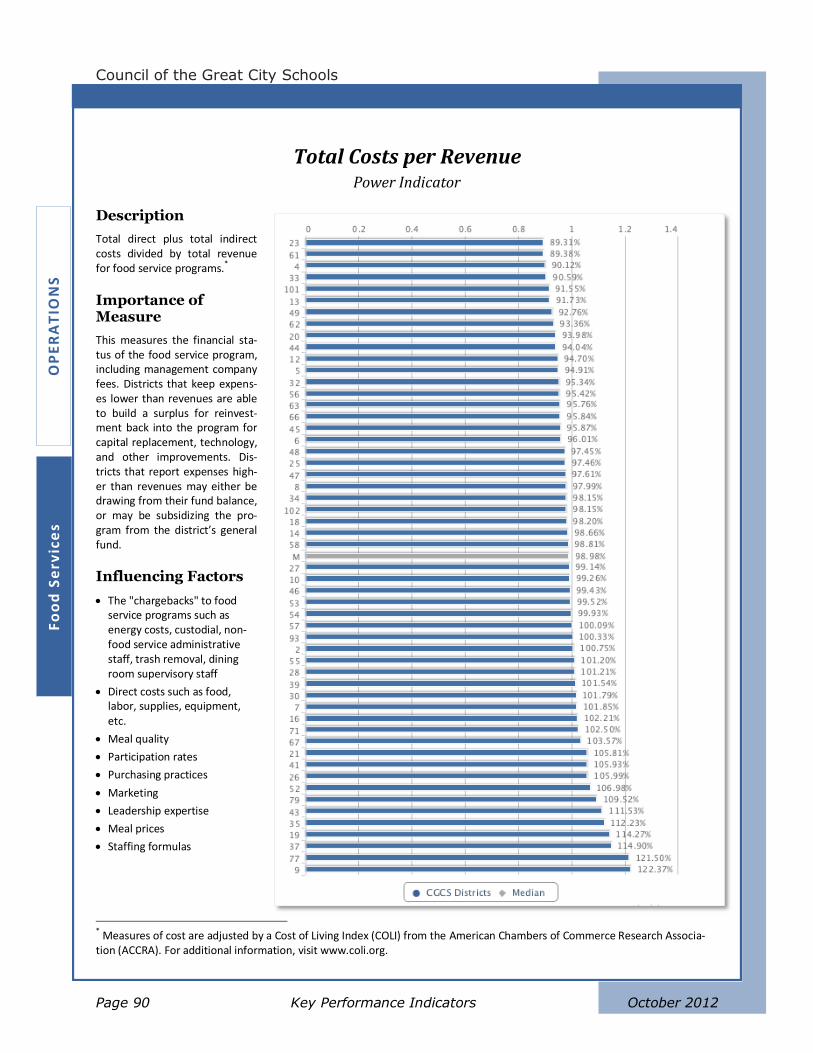
Council of the Great City Schools
Page 90 Key Performance Indicators October 2012
OP
ER
AT
ION
S
Fo
od
Se
rvic
es
Total Costs per Revenue Power Indicator
Description
Total direct plus total indirect costs divided by total revenue for food service programs.*
Importance of Measure
This measures the financial sta-tus of the food service program, including management company fees. Districts that keep expens-es lower than revenues are able to build a surplus for reinvest-ment back into the program for capital replacement, technology, and other improvements. Dis-tricts that report expenses high-er than revenues may either be drawing from their fund balance, or may be subsidizing the pro-gram from the district’s general fund.
Influencing Factors
The "chargebacks" to food service programs such as energy costs, custodial, non-food service administrative staff, trash removal, dining room supervisory staff
Direct costs such as food, labor, supplies, equipment, etc.
Meal quality
Participation rates
Purchasing practices
Marketing
Leadership expertise
Meal prices
Staffing formulas
* Measures of cost are adjusted by a Cost of Living Index (COLI) from the American Chambers of Commerce Research Associa-tion (ACCRA). For additional information, visit www.coli.org.
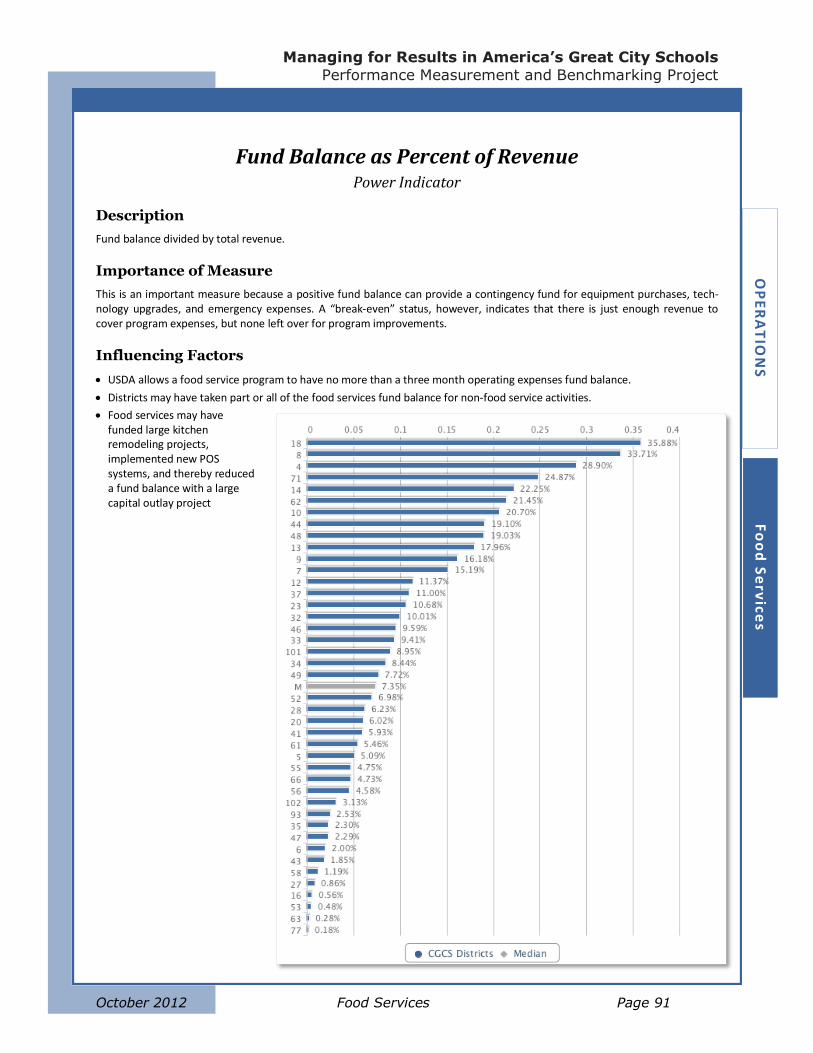
Managing for Results in America’s Great City Schools
Performance Measurement and Benchmarking Project
October 2012 Food Services Page 91
OP
ER
AT
ION
S
Fo
od
Se
rvice
s
Fund Balance as Percent of Revenue Power Indicator
Description
Fund balance divided by total revenue.
Importance of Measure
This is an important measure because a positive fund balance can provide a contingency fund for equipment purchases, tech-nology upgrades, and emergency expenses. A “break-even” status, however, indicates that there is just enough revenue to cover program expenses, but none left over for program improvements.
Influencing Factors
USDA allows a food service program to have no more than a three month operating expenses fund balance.
Districts may have taken part or all of the food services fund balance for non-food service activities.
Food services may have funded large kitchen remodeling projects, implemented new POS systems, and thereby reduced a fund balance with a large capital outlay project
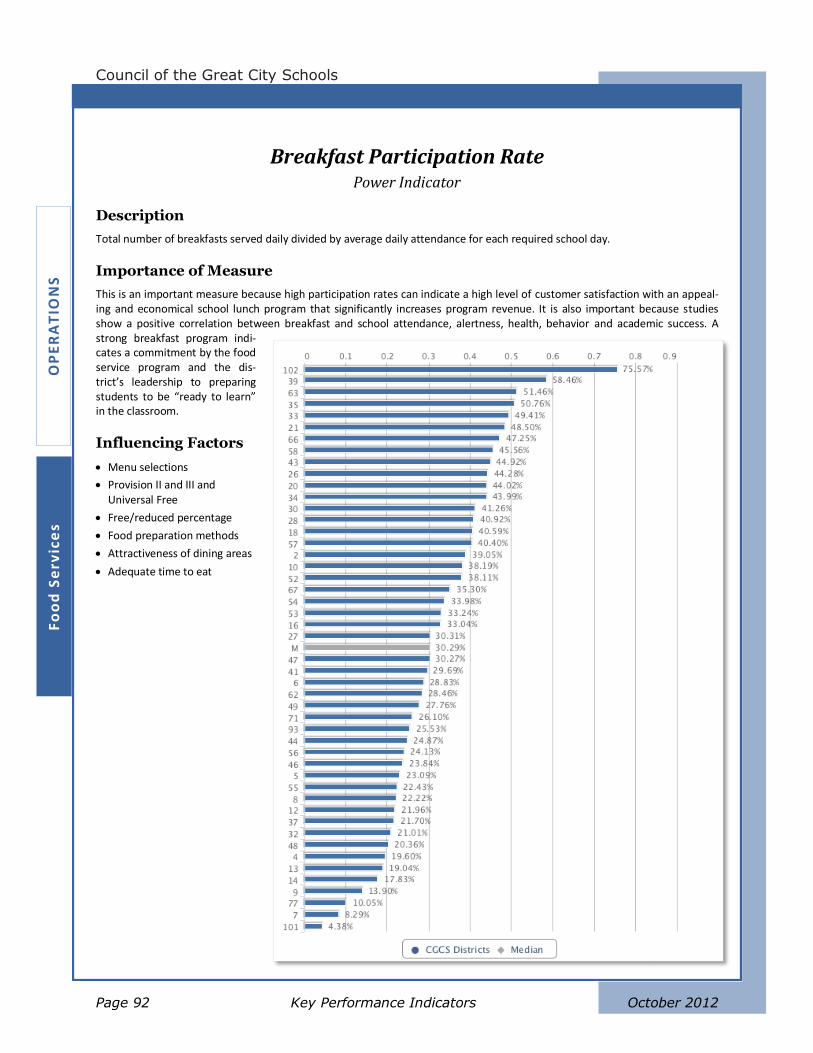
Council of the Great City Schools
Page 92 Key Performance Indicators October 2012
OP
ER
AT
ION
S
Fo
od
Se
rvic
es
Breakfast Participation Rate Power Indicator
Description
Total number of breakfasts served daily divided by average daily attendance for each required school day.
Importance of Measure
This is an important measure because high participation rates can indicate a high level of customer satisfaction with an appeal-ing and economical school lunch program that significantly increases program revenue. It is also important because studies show a positive correlation between breakfast and school attendance, alertness, health, behavior and academic success. A strong breakfast program indi-cates a commitment by the food service program and the dis-trict’s leadership to preparing students to be “ready to learn” in the classroom.
Influencing Factors
Menu selections
Provision II and III and Universal Free
Free/reduced percentage
Food preparation methods
Attractiveness of dining areas
Adequate time to eat
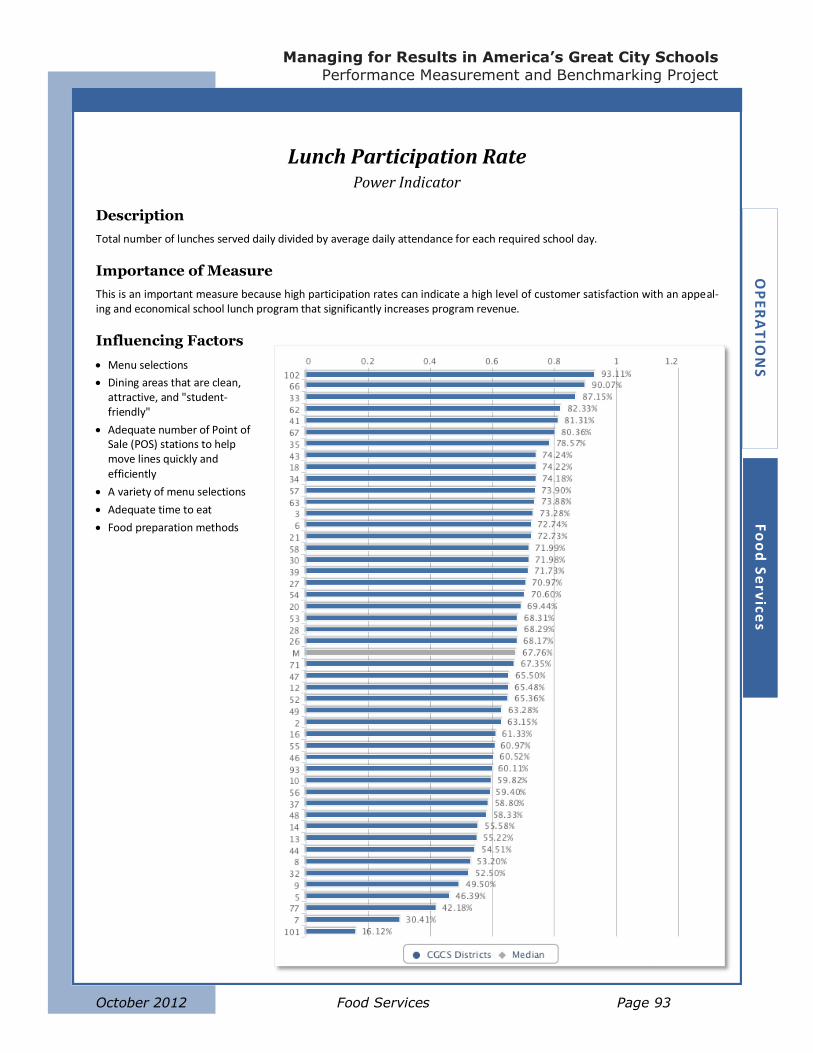
Managing for Results in America’s Great City Schools
Performance Measurement and Benchmarking Project
October 2012 Food Services Page 93
OP
ER
AT
ION
S
Fo
od
Se
rvice
s
Lunch Participation Rate Power Indicator
Description
Total number of lunches served daily divided by average daily attendance for each required school day.
Importance of Measure
This is an important measure because high participation rates can indicate a high level of customer satisfaction with an appeal-ing and economical school lunch program that significantly increases program revenue.
Influencing Factors
Menu selections
Dining areas that are clean, attractive, and "student-friendly"
Adequate number of Point of Sale (POS) stations to help move lines quickly and efficiently
A variety of menu selections
Adequate time to eat
Food preparation methods
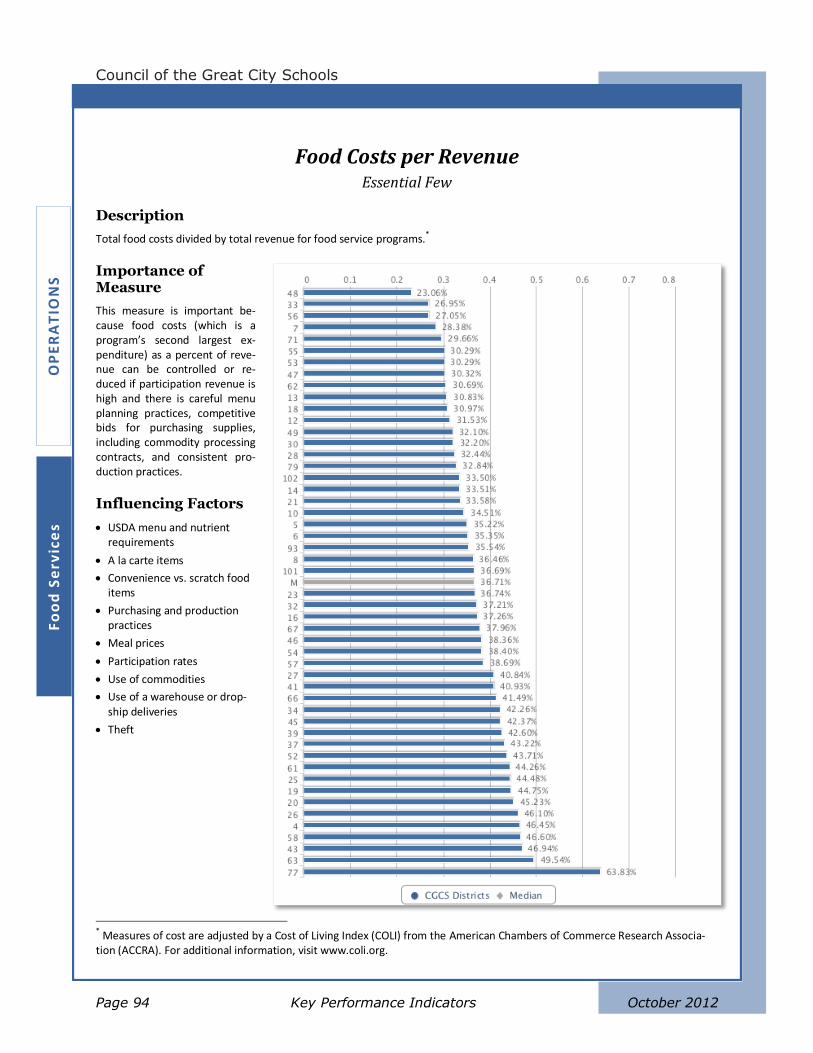
Council of the Great City Schools
Page 94 Key Performance Indicators October 2012
OP
ER
AT
ION
S
Fo
od
Se
rvic
es
Food Costs per Revenue Essential Few
Description
Total food costs divided by total revenue for food service programs.*
Importance of Measure
This measure is important be-cause food costs (which is a program’s second largest ex-penditure) as a percent of reve-nue can be controlled or re-duced if participation revenue is high and there is careful menu planning practices, competitive bids for purchasing supplies, including commodity processing contracts, and consistent pro-duction practices.
Influencing Factors
USDA menu and nutrient requirements
A la carte items
Convenience vs. scratch food items
Purchasing and production practices
Meal prices
Participation rates
Use of commodities
Use of a warehouse or drop-ship deliveries
Theft
* Measures of cost are adjusted by a Cost of Living Index (COLI) from the American Chambers of Commerce Research Associa-tion (ACCRA). For additional information, visit www.coli.org.
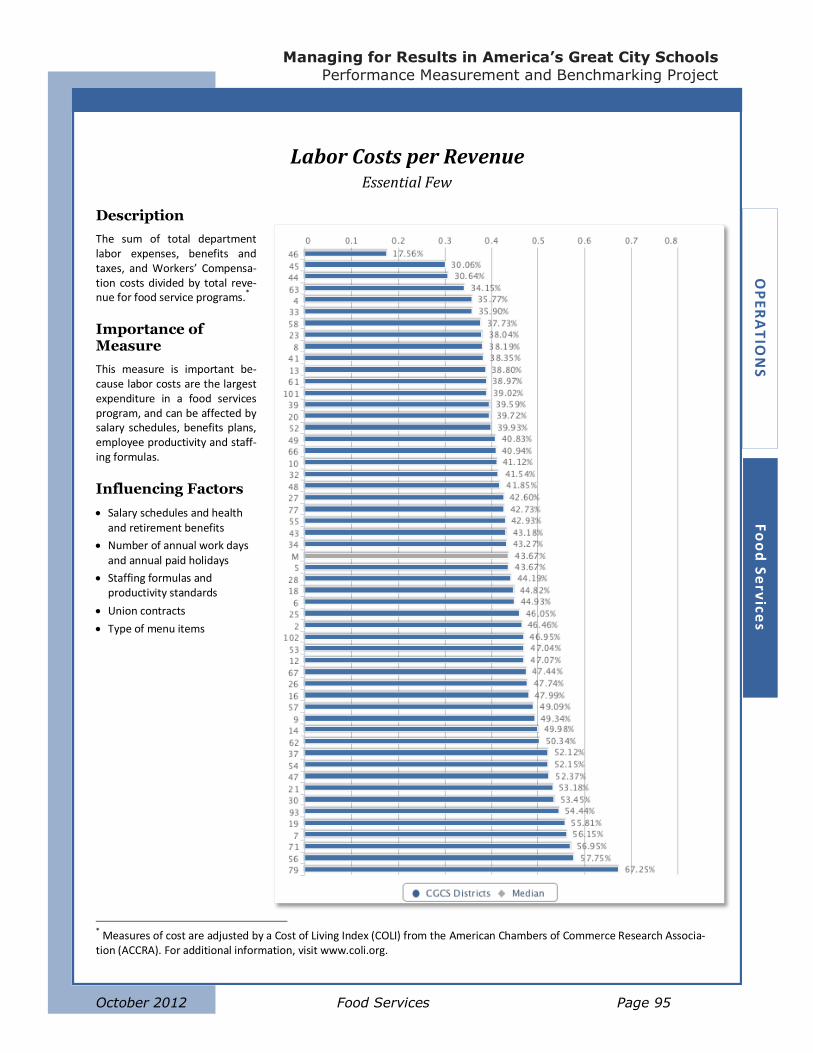
Managing for Results in America’s Great City Schools
Performance Measurement and Benchmarking Project
October 2012 Food Services Page 95
OP
ER
AT
ION
S
Fo
od
Se
rvice
s
Labor Costs per Revenue Essential Few
Description
The sum of total department labor expenses, benefits and taxes, and Workers’ Compensa-tion costs divided by total reve-nue for food service programs.*
Importance of Measure
This measure is important be-cause labor costs are the largest expenditure in a food services program, and can be affected by salary schedules, benefits plans, employee productivity and staff-ing formulas.
Influencing Factors
Salary schedules and health and retirement benefits
Number of annual work days and annual paid holidays
Staffing formulas and productivity standards
Union contracts
Type of menu items
* Measures of cost are adjusted by a Cost of Living Index (COLI) from the American Chambers of Commerce Research Associa-tion (ACCRA). For additional information, visit www.coli.org.
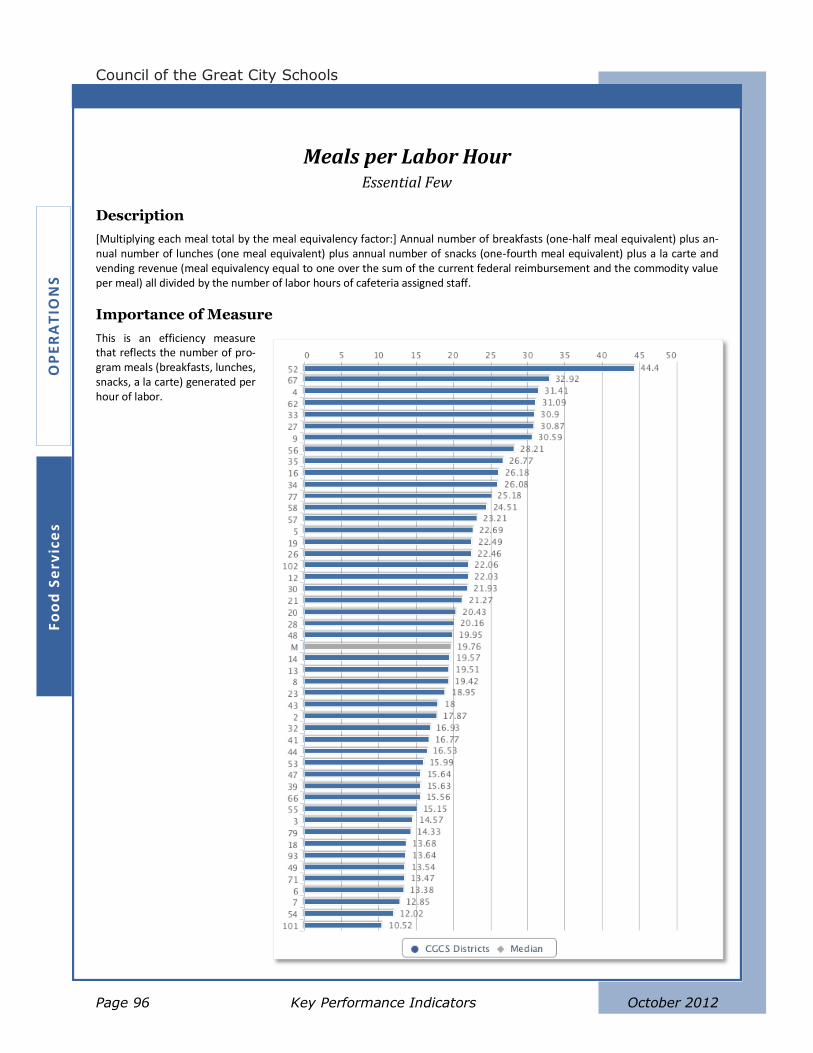
Council of the Great City Schools
Page 96 Key Performance Indicators October 2012
OP
ER
AT
ION
S
Fo
od
Se
rvic
es
Meals per Labor Hour Essential Few
Description
[Multiplying each meal total by the meal equivalency factor:] Annual number of breakfasts (one-half meal equivalent) plus an-nual number of lunches (one meal equivalent) plus annual number of snacks (one-fourth meal equivalent) plus a la carte and vending revenue (meal equivalency equal to one over the sum of the current federal reimbursement and the commodity value per meal) all divided by the number of labor hours of cafeteria assigned staff.
Importance of Measure
This is an efficiency measure that reflects the number of pro-gram meals (breakfasts, lunches, snacks, a la carte) generated per hour of labor.
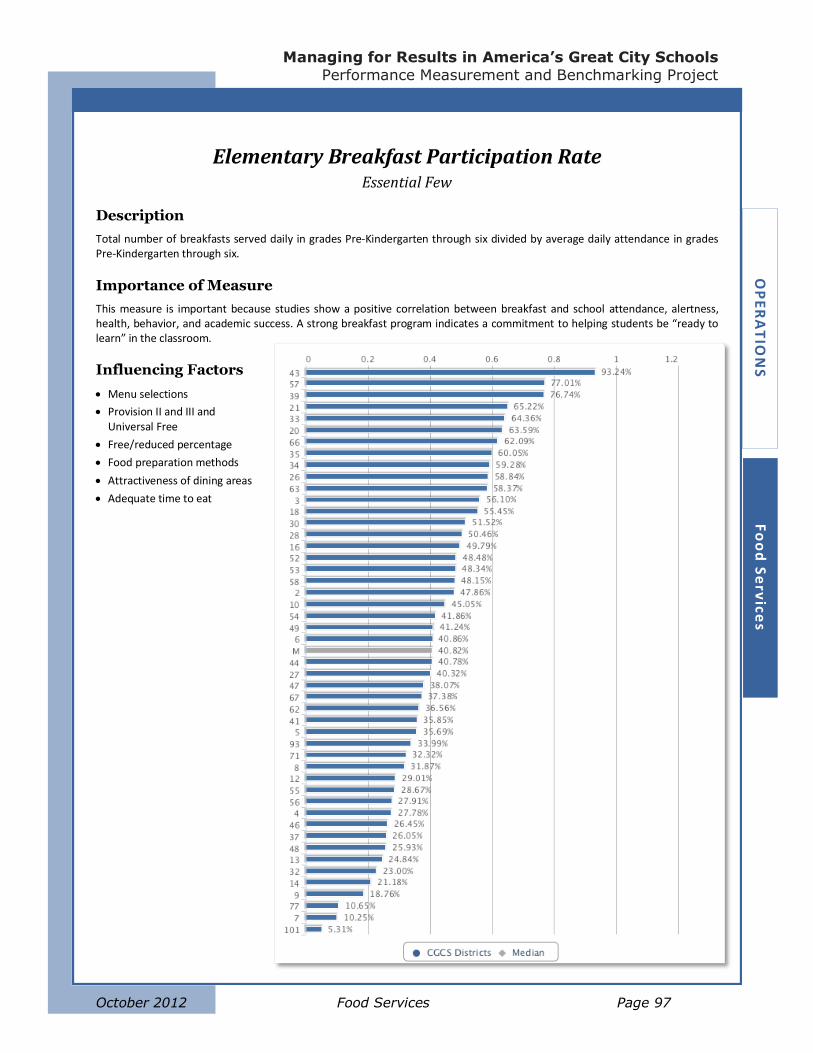
Managing for Results in America’s Great City Schools
Performance Measurement and Benchmarking Project
October 2012 Food Services Page 97
OP
ER
AT
ION
S
Fo
od
Se
rvice
s
Elementary Breakfast Participation Rate Essential Few
Description
Total number of breakfasts served daily in grades Pre-Kindergarten through six divided by average daily attendance in grades Pre-Kindergarten through six.
Importance of Measure
This measure is important because studies show a positive correlation between breakfast and school attendance, alertness, health, behavior, and academic success. A strong breakfast program indicates a commitment to helping students be “ready to learn” in the classroom.
Influencing Factors
Menu selections
Provision II and III and Universal Free
Free/reduced percentage
Food preparation methods
Attractiveness of dining areas
Adequate time to eat
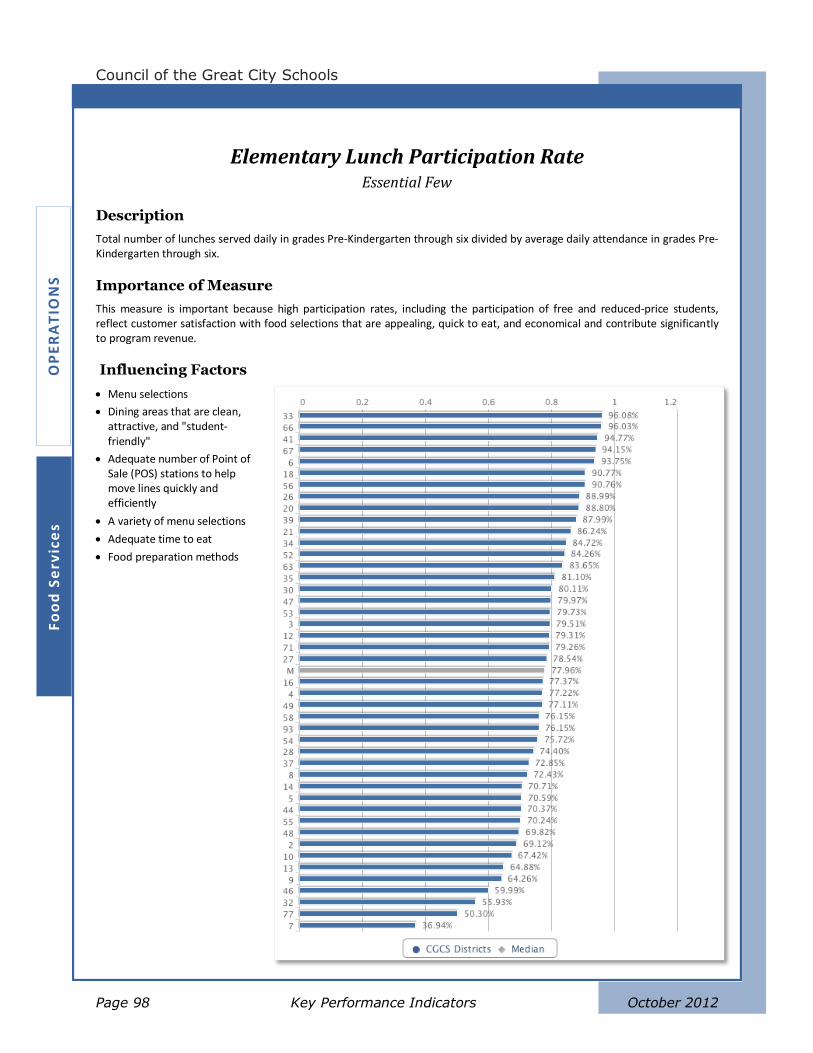
Council of the Great City Schools
Page 98 Key Performance Indicators October 2012
OP
ER
AT
ION
S
Fo
od
Se
rvic
es
Elementary Lunch Participation Rate Essential Few
Description
Total number of lunches served daily in grades Pre-Kindergarten through six divided by average daily attendance in grades Pre-Kindergarten through six.
Importance of Measure
This measure is important because high participation rates, including the participation of free and reduced-price students, reflect customer satisfaction with food selections that are appealing, quick to eat, and economical and contribute significantly to program revenue.
Influencing Factors
Menu selections
Dining areas that are clean, attractive, and "student-friendly"
Adequate number of Point of Sale (POS) stations to help move lines quickly and efficiently
A variety of menu selections
Adequate time to eat
Food preparation methods
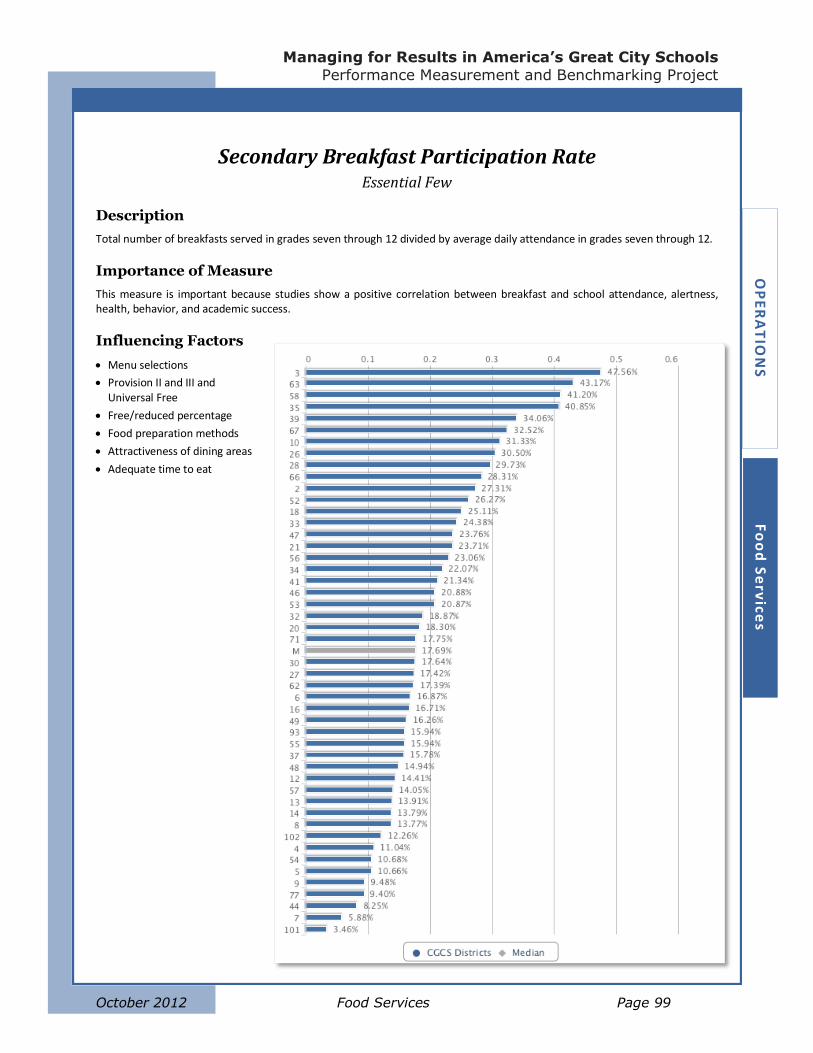
Managing for Results in America’s Great City Schools
Performance Measurement and Benchmarking Project
October 2012 Food Services Page 99
OP
ER
AT
ION
S
Fo
od
Se
rvice
s
Secondary Breakfast Participation Rate Essential Few
Description
Total number of breakfasts served in grades seven through 12 divided by average daily attendance in grades seven through 12.
Importance of Measure
This measure is important because studies show a positive correlation between breakfast and school attendance, alertness, health, behavior, and academic success.
Influencing Factors
Menu selections
Provision II and III and Universal Free
Free/reduced percentage
Food preparation methods
Attractiveness of dining areas
Adequate time to eat
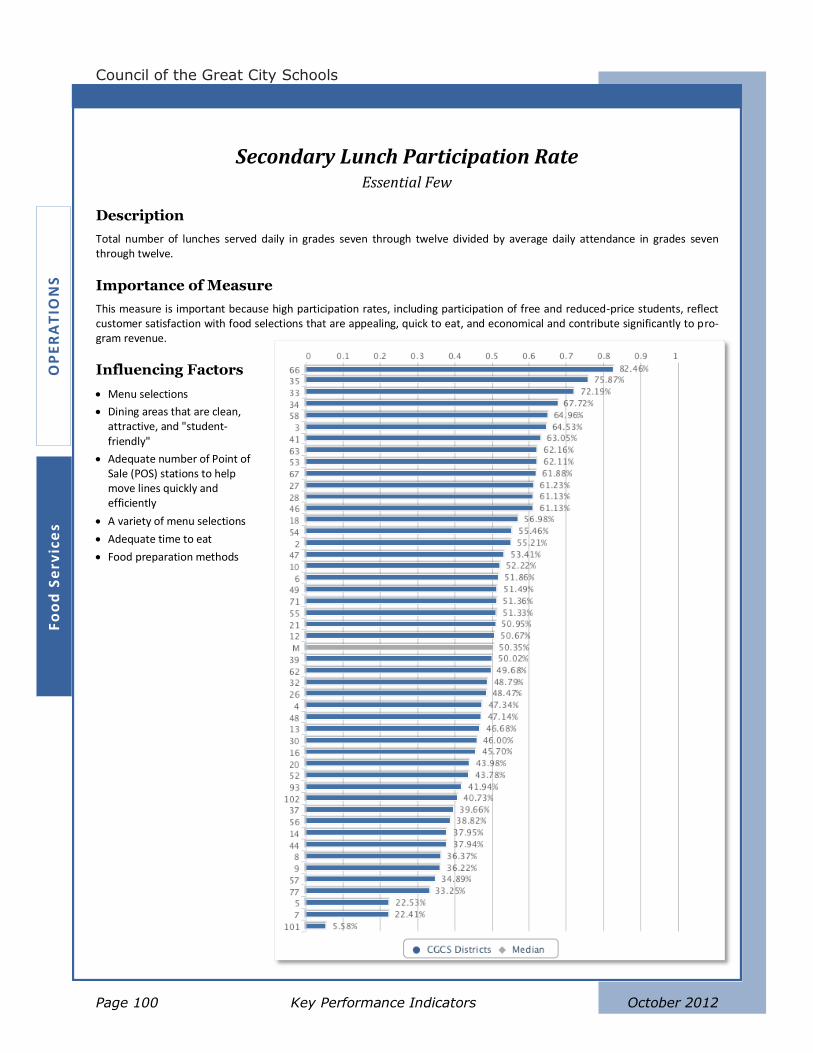
Council of the Great City Schools
Page 100 Key Performance Indicators October 2012
OP
ER
AT
ION
S
Fo
od
Se
rvic
es
Secondary Lunch Participation Rate Essential Few
Description
Total number of lunches served daily in grades seven through twelve divided by average daily attendance in grades seven through twelve.
Importance of Measure
This measure is important because high participation rates, including participation of free and reduced-price students, reflect customer satisfaction with food selections that are appealing, quick to eat, and economical and contribute significantly to pro-gram revenue.
Influencing Factors
Menu selections
Dining areas that are clean, attractive, and "student-friendly"
Adequate number of Point of Sale (POS) stations to help move lines quickly and efficiently
A variety of menu selections
Adequate time to eat
Food preparation methods
Managing for Results in America’s Great City Schools
Performance Measurement and Benchmarking Project
October 2012 Maintenance and Operations Page 101
OP
ER
AT
ION
S
Ma
inte
na
nce
an
d O
pe
ratio
ns
Maintenance and Operations
Performance metrics in maintenance and operations (M&O) assess the cost efficiency and ser-
vice levels of a district’s facilities management and labor. The areas of focus include custodial
work, maintenance work, utility usage, and environmental stewardship.
The overall service level of the maintenance and operations department is represented, in part,
by Work Order Completion Time (Days), which reflects the workflow management processes in
place; and overall cost efficiency is reflected by M&O Expenditures as Percent of General Fund.
The cost efficiency of custodial work is represented broadly by Custodial Workload and Custodial
Cost per Square Foot, where low workload combined with high cost per square feet would indi-
cate that cost savings can be realized by reducing the number of custodians. Additionally, the
relative cost of supplies can be considered by looking at Custodial Supply Cost per Square Foot.
Finally, the relative cost of utilities is represented by Utility Usage per Square Foot and Water
Usage per Square Foot.
These KPIs should give district leaders a general sense of where they are doing well and where
they can improve. The importance and usefulness of each KPI is described in the “Importance of
Measure” and “Factors that Influence” headings, which can be used to guide improvement strat-
egies.

Council of the Great City Schools
Page 102 Key Performance Indicators October 2012
OP
ER
AT
ION
S
Ma
inte
na
nc
e a
nd
Op
era
tio
ns
Custodial Cost per Square Foot Power Indicator
Description
Total custodial expenditures including labor, benefits, supplies and other expenditures divided by total district square footage.*
Importance of Measure
This measures the efficiency of custodial operations, which are affected not only by operational effectiveness, but also by labor costs, material and supply costs, supervisory overhead costs, and other factors.
Influencing Factors
Cost of labor
Cost of supplies and materials
Scope of duties assigned to custodians
Collective bargaining agreements
Size of schools
* Measures of cost are adjusted by a Cost of Living Index (COLI) from the American Chambers of Commerce Research Associa-tion (ACCRA). For additional information, visit www.coli.org.
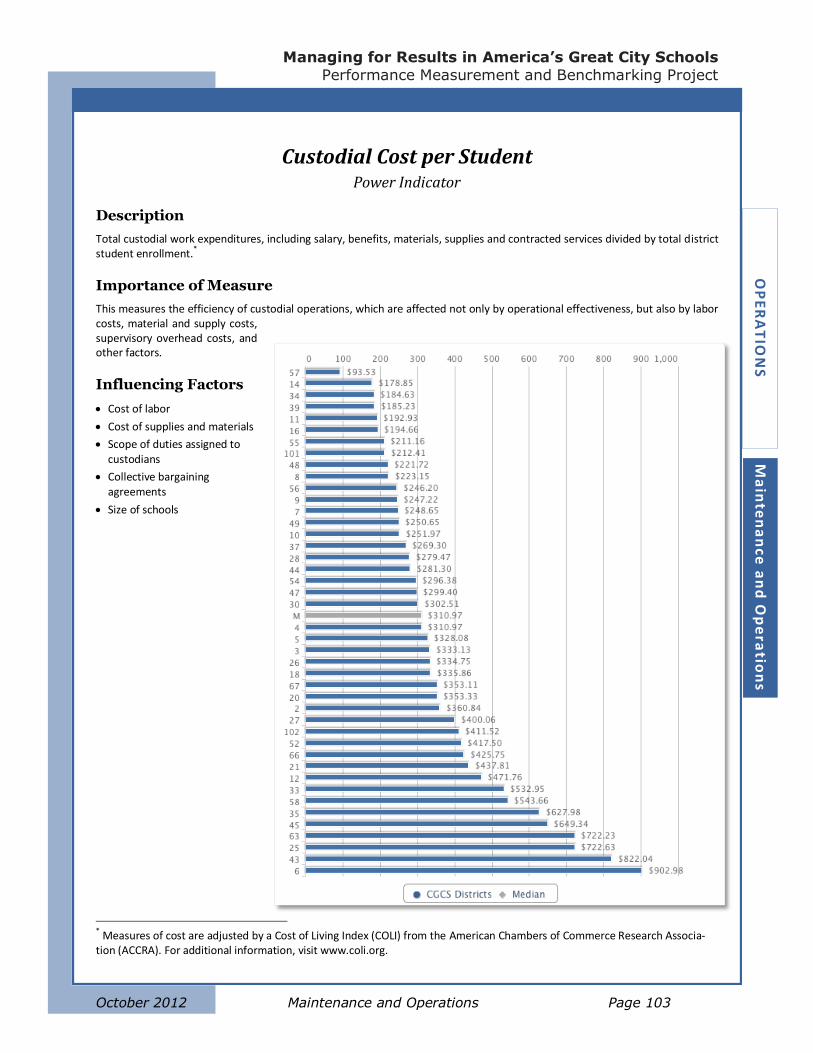
Managing for Results in America’s Great City Schools
Performance Measurement and Benchmarking Project
October 2012 Maintenance and Operations Page 103
OP
ER
AT
ION
S
Ma
inte
na
nce
an
d O
pe
ratio
ns
Custodial Cost per Student Power Indicator
Description
Total custodial work expenditures, including salary, benefits, materials, supplies and contracted services divided by total district student enrollment.
*
Importance of Measure
This measures the efficiency of custodial operations, which are affected not only by operational effectiveness, but also by labor costs, material and supply costs, supervisory overhead costs, and other factors.
Influencing Factors
Cost of labor
Cost of supplies and materials
Scope of duties assigned to custodians
Collective bargaining agreements
Size of schools
* Measures of cost are adjusted by a Cost of Living Index (COLI) from the American Chambers of Commerce Research Associa-tion (ACCRA). For additional information, visit www.coli.org.
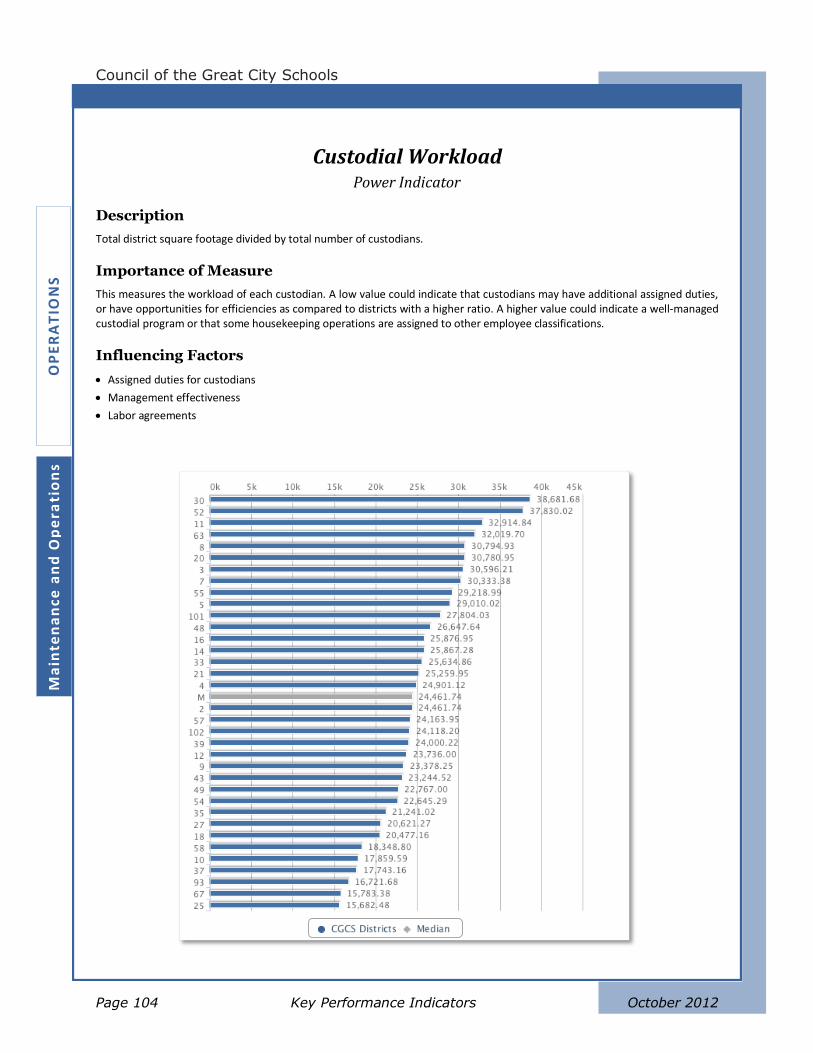
Council of the Great City Schools
Page 104 Key Performance Indicators October 2012
OP
ER
AT
ION
S
Ma
inte
na
nce
an
d O
pe
rati
on
s
Custodial Workload Power Indicator
Description
Total district square footage divided by total number of custodians.
Importance of Measure
This measures the workload of each custodian. A low value could indicate that custodians may have additional assigned duties, or have opportunities for efficiencies as compared to districts with a higher ratio. A higher value could indicate a well-managed custodial program or that some housekeeping operations are assigned to other employee classifications.
Influencing Factors
Assigned duties for custodians
Management effectiveness
Labor agreements
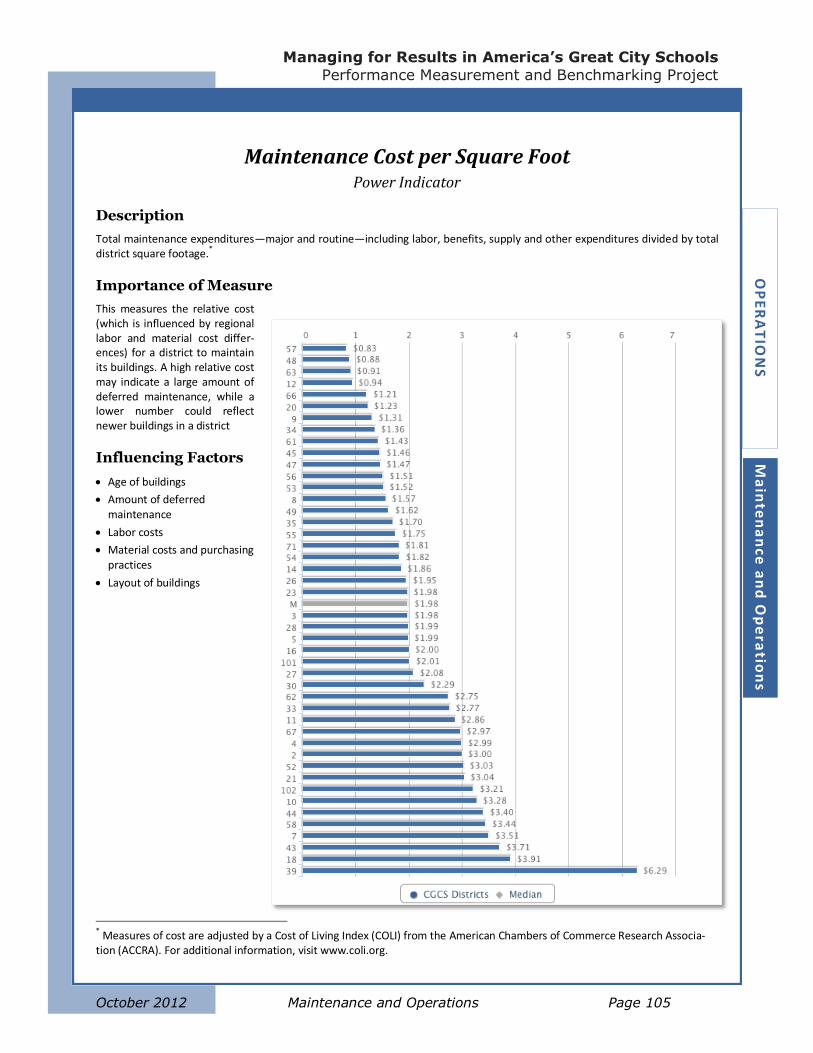
Managing for Results in America’s Great City Schools
Performance Measurement and Benchmarking Project
October 2012 Maintenance and Operations Page 105
OP
ER
AT
ION
S
Ma
inte
na
nce
an
d O
pe
ratio
ns
Maintenance Cost per Square Foot Power Indicator
Description
Total maintenance expenditures—major and routine—including labor, benefits, supply and other expenditures divided by total district square footage.
*
Importance of Measure
This measures the relative cost (which is influenced by regional labor and material cost differ-ences) for a district to maintain its buildings. A high relative cost may indicate a large amount of deferred maintenance, while a lower number could reflect newer buildings in a district
Influencing Factors
Age of buildings
Amount of deferred maintenance
Labor costs
Material costs and purchasing practices
Layout of buildings
* Measures of cost are adjusted by a Cost of Living Index (COLI) from the American Chambers of Commerce Research Associa-tion (ACCRA). For additional information, visit www.coli.org.
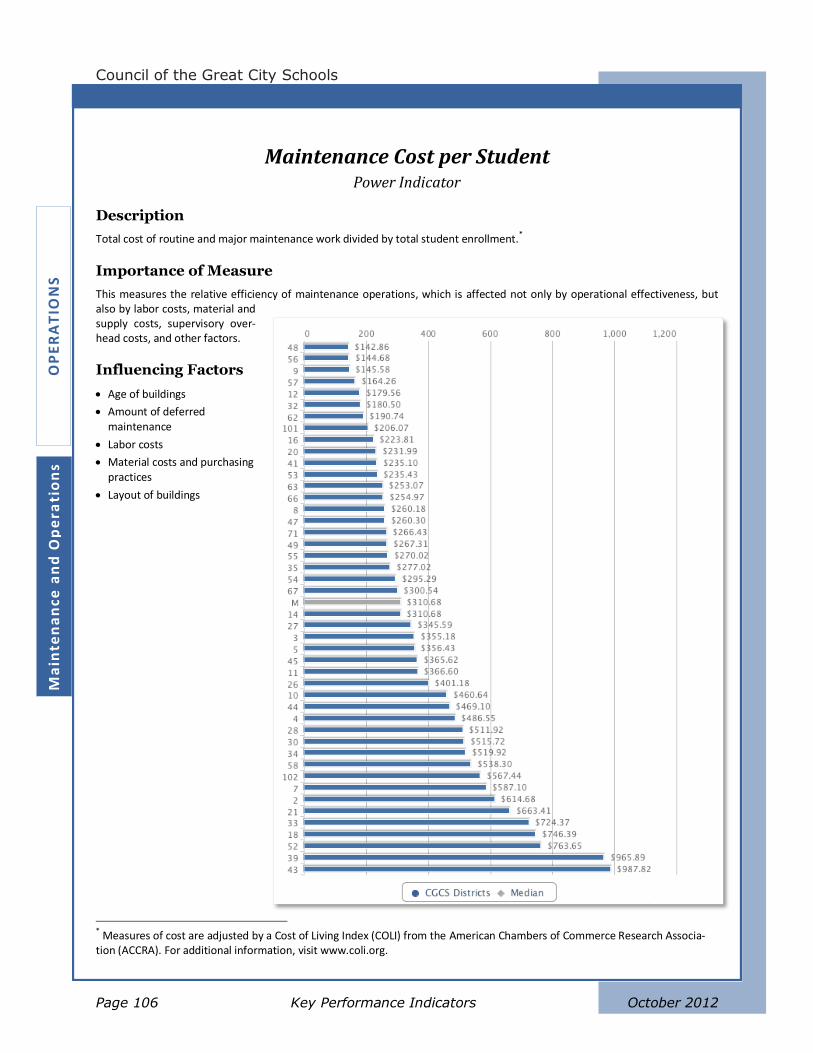
Council of the Great City Schools
Page 106 Key Performance Indicators October 2012
OP
ER
AT
ION
S
Ma
inte
na
nce
an
d O
pe
rati
on
s
Maintenance Cost per Student Power Indicator
Description
Total cost of routine and major maintenance work divided by total student enrollment.*
Importance of Measure
This measures the relative efficiency of maintenance operations, which is affected not only by operational effectiveness, but also by labor costs, material and supply costs, supervisory over-head costs, and other factors.
Influencing Factors
Age of buildings
Amount of deferred maintenance
Labor costs
Material costs and purchasing practices
Layout of buildings
* Measures of cost are adjusted by a Cost of Living Index (COLI) from the American Chambers of Commerce Research Associa-tion (ACCRA). For additional information, visit www.coli.org.
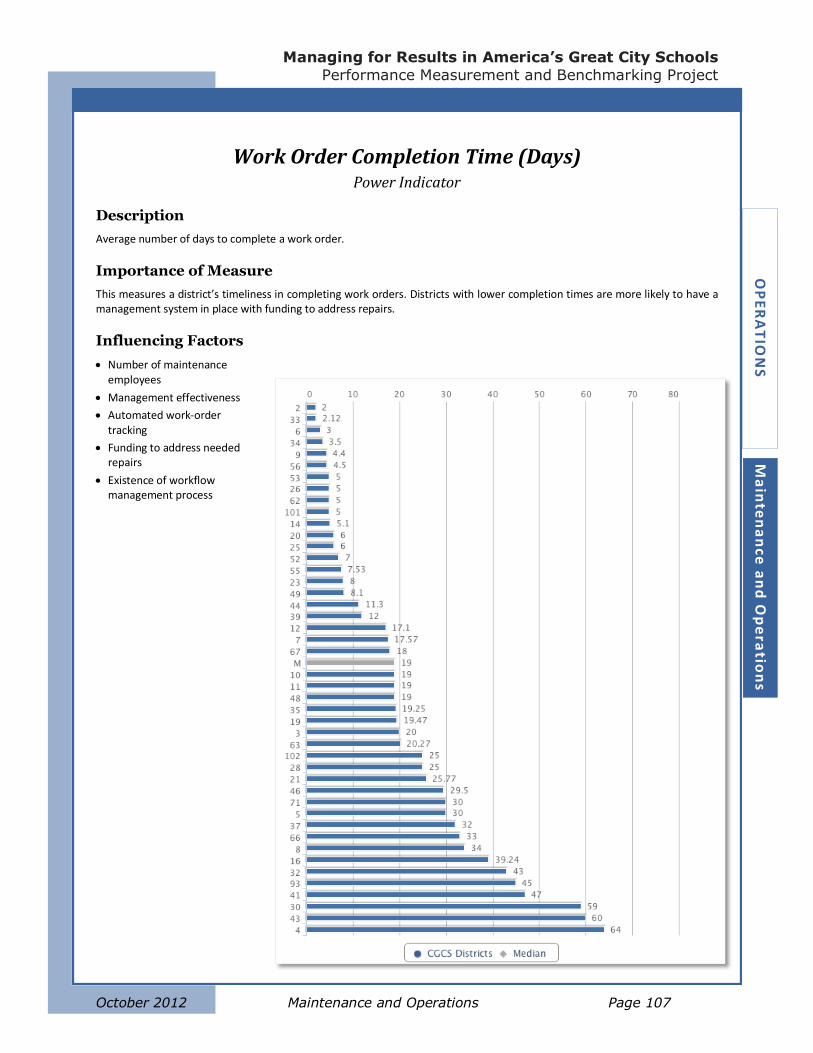
Managing for Results in America’s Great City Schools
Performance Measurement and Benchmarking Project
October 2012 Maintenance and Operations Page 107
OP
ER
AT
ION
S
Ma
inte
na
nce
an
d O
pe
ratio
ns
Work Order Completion Time (Days) Power Indicator
Description
Average number of days to complete a work order.
Importance of Measure
This measures a district’s timeliness in completing work orders. Districts with lower completion times are more likely to have a management system in place with funding to address repairs.
Influencing Factors
Number of maintenance employees
Management effectiveness
Automated work-order tracking
Funding to address needed repairs
Existence of workflow management process
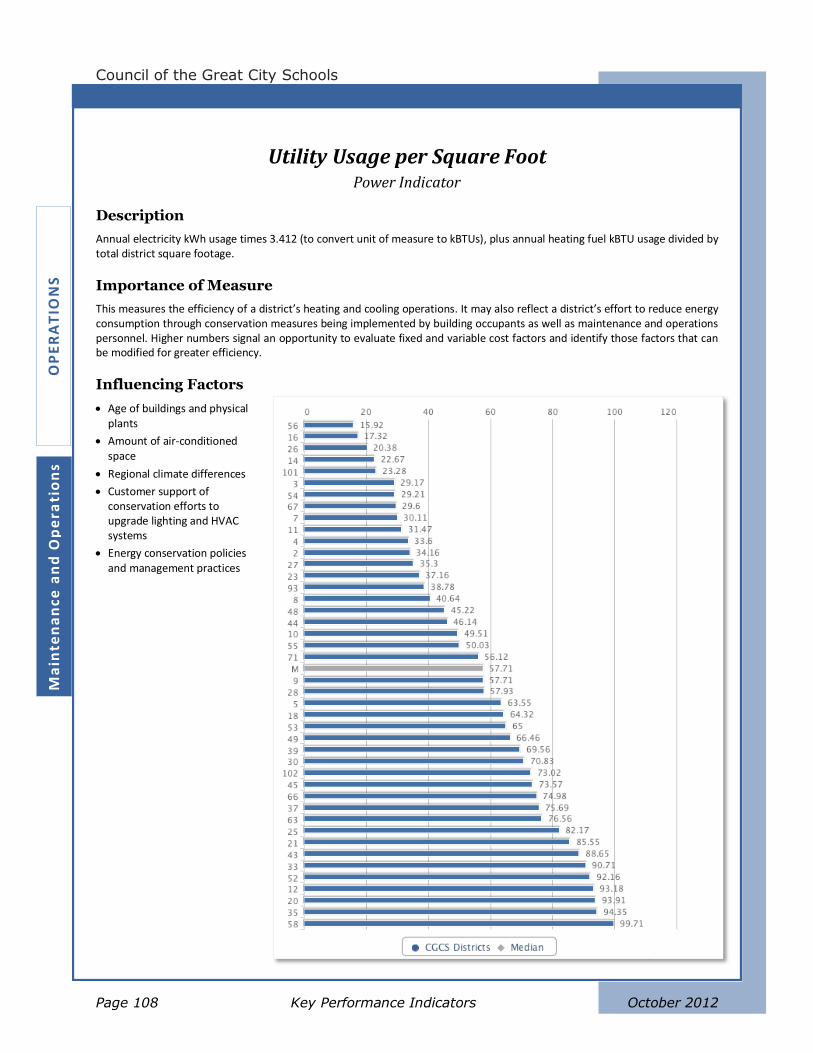
Council of the Great City Schools
Page 108 Key Performance Indicators October 2012
OP
ER
AT
ION
S
Ma
inte
na
nce
an
d O
pe
rati
on
s
Utility Usage per Square Foot Power Indicator
Description
Annual electricity kWh usage times 3.412 (to convert unit of measure to kBTUs), plus annual heating fuel kBTU usage divided by total district square footage.
Importance of Measure
This measures the efficiency of a district’s heating and cooling operations. It may also reflect a district’s effort to reduce energy consumption through conservation measures being implemented by building occupants as well as maintenance and operations personnel. Higher numbers signal an opportunity to evaluate fixed and variable cost factors and identify those factors that can be modified for greater efficiency.
Influencing Factors
Age of buildings and physical plants
Amount of air-conditioned space
Regional climate differences
Customer support of conservation efforts to upgrade lighting and HVAC systems
Energy conservation policies and management practices
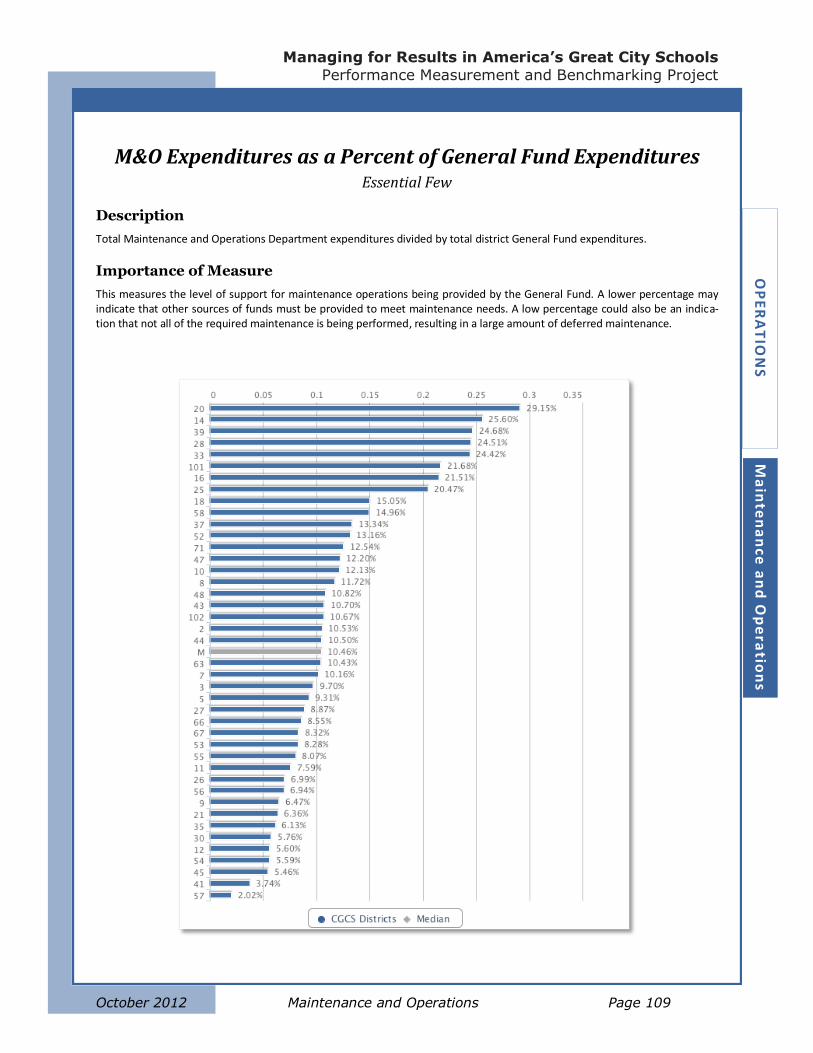
Managing for Results in America’s Great City Schools
Performance Measurement and Benchmarking Project
October 2012 Maintenance and Operations Page 109
OP
ER
AT
ION
S
Ma
inte
na
nce
an
d O
pe
ratio
ns
M&O Expenditures as a Percent of General Fund Expenditures Essential Few
Description
Total Maintenance and Operations Department expenditures divided by total district General Fund expenditures.
Importance of Measure
This measures the level of support for maintenance operations being provided by the General Fund. A lower percentage may indicate that other sources of funds must be provided to meet maintenance needs. A low percentage could also be an indica-tion that not all of the required maintenance is being performed, resulting in a large amount of deferred maintenance.
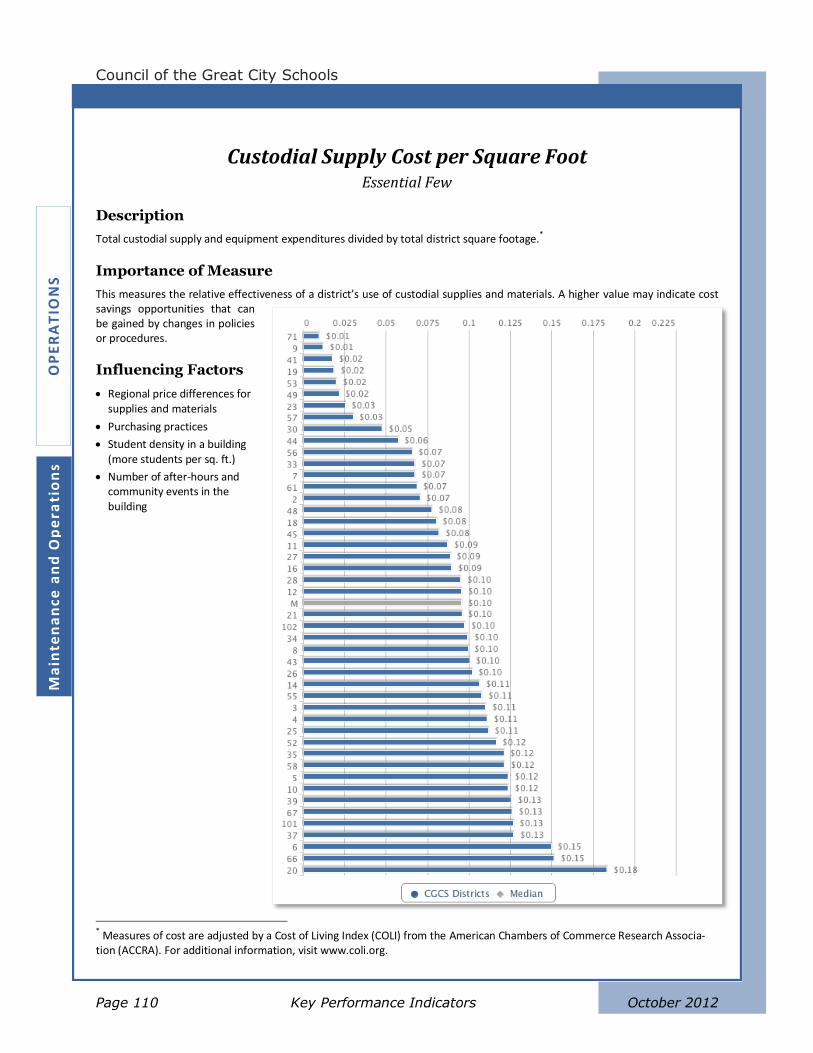
Council of the Great City Schools
Page 110 Key Performance Indicators October 2012
OP
ER
AT
ION
S
Ma
inte
na
nce
an
d O
pe
rati
on
s
Custodial Supply Cost per Square Foot Essential Few
Description
Total custodial supply and equipment expenditures divided by total district square footage.*
Importance of Measure
This measures the relative effectiveness of a district’s use of custodial supplies and materials. A higher value may indicate cost savings opportunities that can be gained by changes in policies or procedures.
Influencing Factors
Regional price differences for supplies and materials
Purchasing practices
Student density in a building (more students per sq. ft.)
Number of after-hours and community events in the building
* Measures of cost are adjusted by a Cost of Living Index (COLI) from the American Chambers of Commerce Research Associa-tion (ACCRA). For additional information, visit www.coli.org.
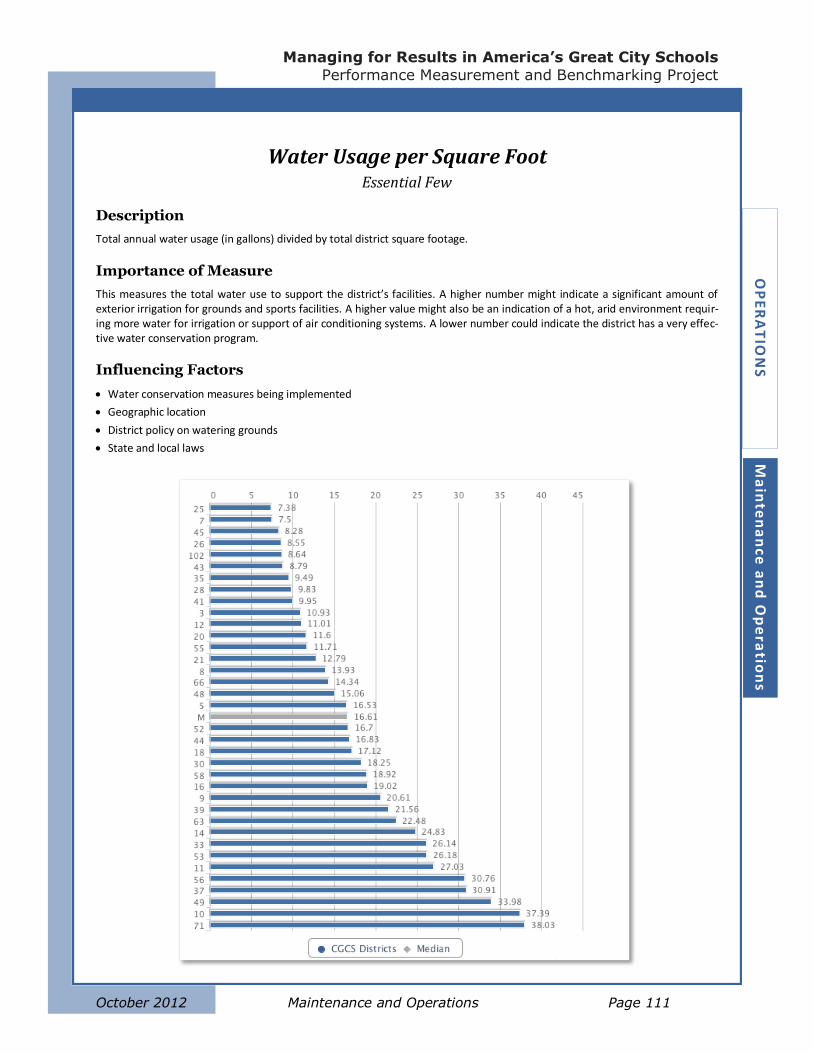
Managing for Results in America’s Great City Schools
Performance Measurement and Benchmarking Project
October 2012 Maintenance and Operations Page 111
OP
ER
AT
ION
S
Ma
inte
na
nce
an
d O
pe
ratio
ns
Water Usage per Square Foot Essential Few
Description
Total annual water usage (in gallons) divided by total district square footage.
Importance of Measure
This measures the total water use to support the district’s facilities. A higher number might indicate a significant amount of exterior irrigation for grounds and sports facilities. A higher value might also be an indication of a hot, arid environment requir-ing more water for irrigation or support of air conditioning systems. A lower number could indicate the district has a very effec-tive water conservation program.
Influencing Factors
Water conservation measures being implemented
Geographic location
District policy on watering grounds
State and local laws
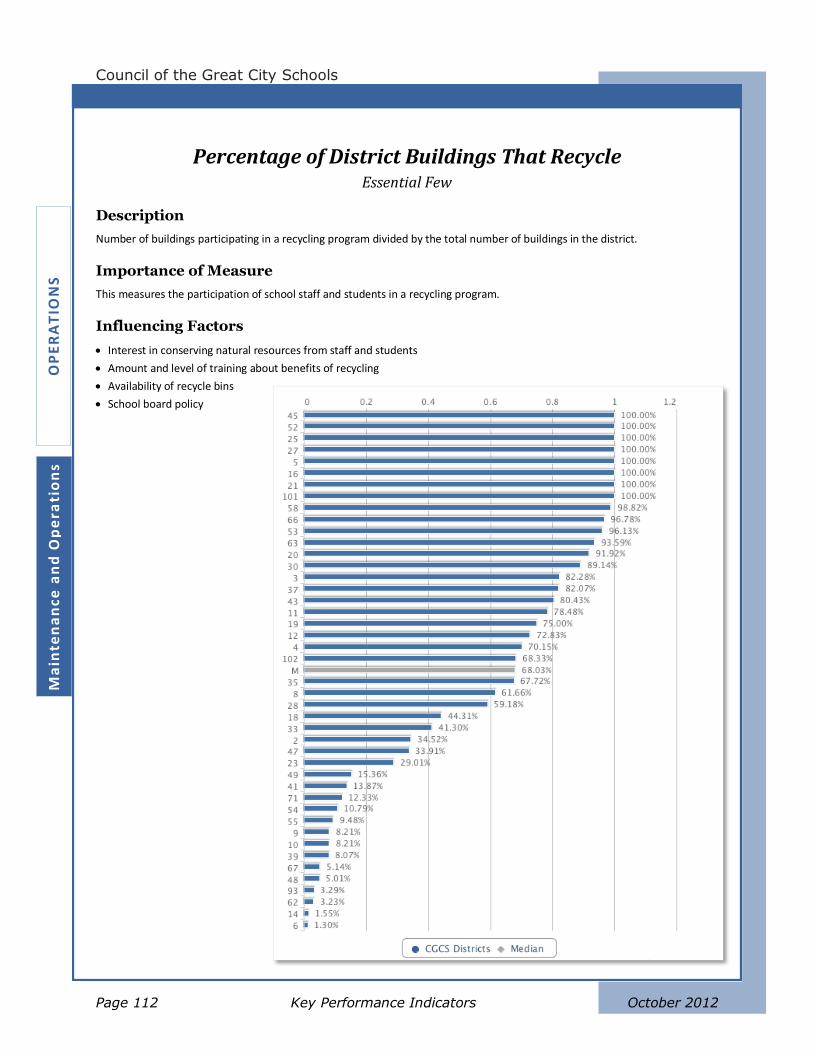
Council of the Great City Schools
Page 112 Key Performance Indicators October 2012
OP
ER
AT
ION
S
Ma
inte
na
nce
an
d O
pe
rati
on
s
Percentage of District Buildings That Recycle Essential Few
Description
Number of buildings participating in a recycling program divided by the total number of buildings in the district.
Importance of Measure
This measures the participation of school staff and students in a recycling program.
Influencing Factors
Interest in conserving natural resources from staff and students
Amount and level of training about benefits of recycling
Availability of recycle bins
School board policy
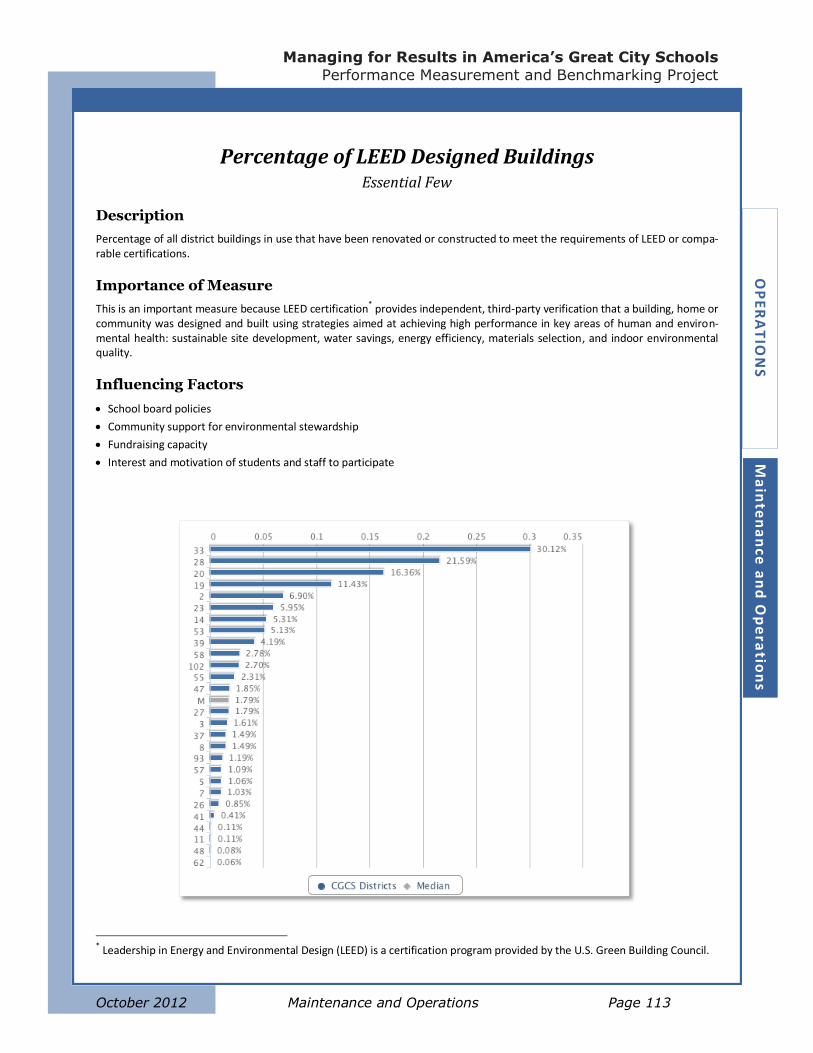
Managing for Results in America’s Great City Schools
Performance Measurement and Benchmarking Project
October 2012 Maintenance and Operations Page 113
OP
ER
AT
ION
S
Ma
inte
na
nce
an
d O
pe
ratio
ns
Percentage of LEED Designed Buildings Essential Few
Description
Percentage of all district buildings in use that have been renovated or constructed to meet the requirements of LEED or compa-rable certifications.
Importance of Measure
This is an important measure because LEED certification* provides independent, third-party verification that a building, home or community was designed and built using strategies aimed at achieving high performance in key areas of human and environ-mental health: sustainable site development, water savings, energy efficiency, materials selection, and indoor environmental quality.
Influencing Factors
School board policies
Community support for environmental stewardship
Fundraising capacity
Interest and motivation of students and staff to participate
* Leadership in Energy and Environmental Design (LEED) is a certification program provided by the U.S. Green Building Council.

Council of the Great City Schools
Page 114 Key Performance Indicators October 2012
OP
ER
AT
ION
S
Ma
inte
na
nce
an
d O
pe
rati
on
s

Managing for Results in America’s Great City Schools
Performance Measurement and Benchmarking Project
October 2012 Safety and Security Page 115
OP
ER
AT
ION
S
Sa
fety
an
d S
ecu
rity
Safety and Security
There are a number of performance metrics that can be used to determine a district’s relative
performance in the area of school safety. For instance, the use of ID badges and other methods
of access control are important parts of security, as are measures of use of alarm systems and
Expenditures as a Percent of General Fund. Additionally, personnel preparedness and capacity is
measured by looking at Hours of Training per District Security and Law Enforcement Member
and District Uniformed Personnel
Finally, Arrests on School Sites per 1,000 Students is a baseline measure of incidents in a district.
The following influencing factors are likely to apply to these measures:
Level of crime in the surrounding neighborhoods
Configuration of school (office, front desk, etc.) to make access control a possibility
Inclusion of security systems in a district’s construction and modernization program
Utilization of technology such as security cameras to offset the need for more staff
Documented need for additional safety and security staff—for example, documented
crime statistics and trends.
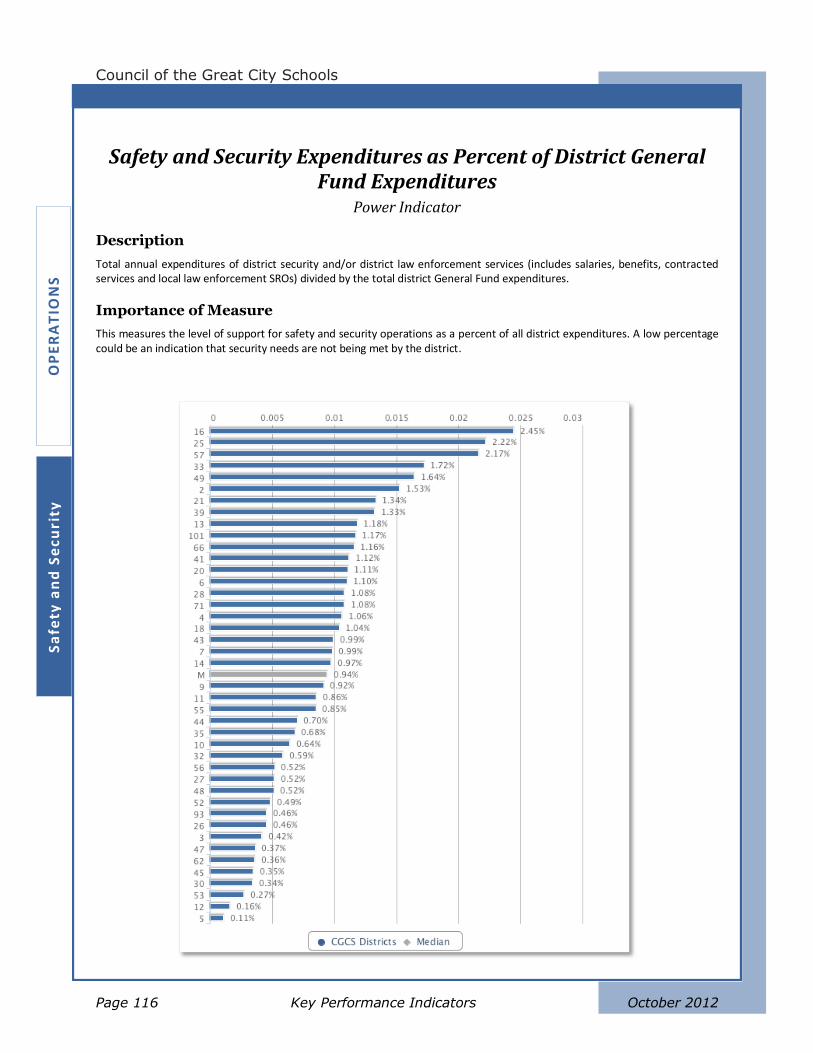
Council of the Great City Schools
Page 116 Key Performance Indicators October 2012
OP
ER
AT
ION
S
Sa
fety
an
d S
ecu
rity
Safety and Security Expenditures as Percent of District General Fund Expenditures
Power Indicator
Description
Total annual expenditures of district security and/or district law enforcement services (includes salaries, benefits, contracted services and local law enforcement SROs) divided by the total district General Fund expenditures.
Importance of Measure
This measures the level of support for safety and security operations as a percent of all district expenditures. A low percentage could be an indication that security needs are not being met by the district.
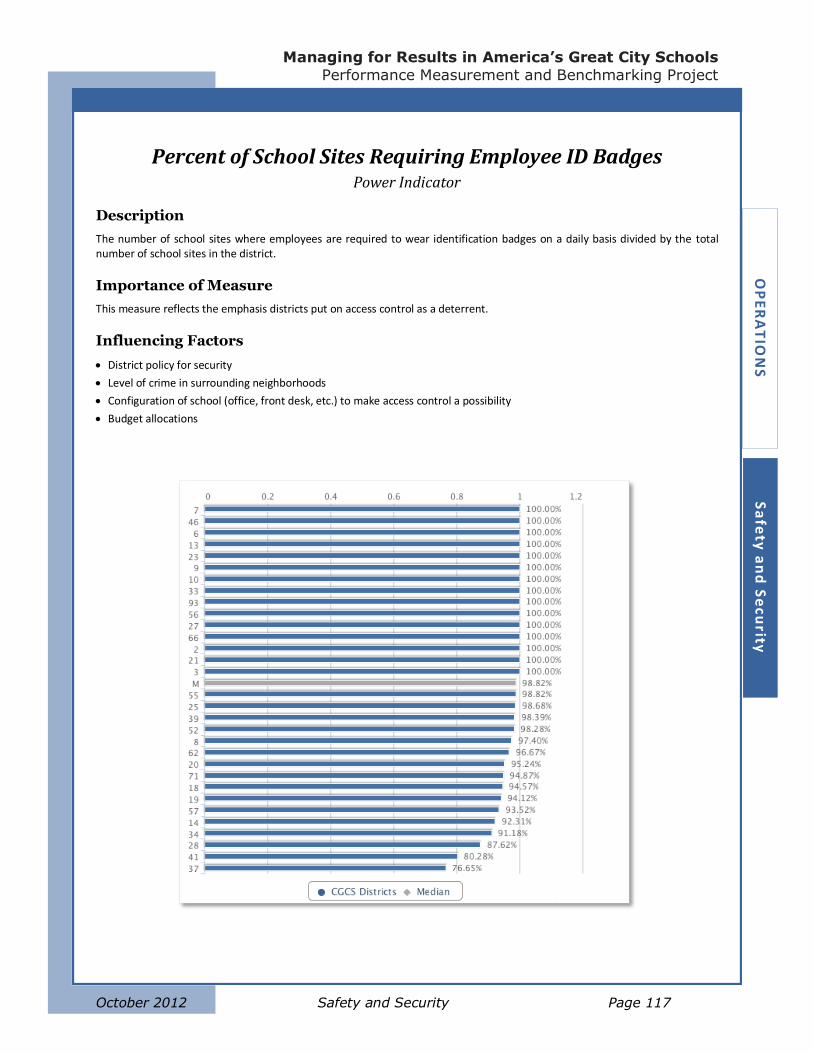
Managing for Results in America’s Great City Schools
Performance Measurement and Benchmarking Project
October 2012 Safety and Security Page 117
OP
ER
AT
ION
S
Sa
fety
an
d S
ecu
rity
Percent of School Sites Requiring Employee ID Badges Power Indicator
Description
The number of school sites where employees are required to wear identification badges on a daily basis divided by the total number of school sites in the district.
Importance of Measure
This measure reflects the emphasis districts put on access control as a deterrent.
Influencing Factors
District policy for security
Level of crime in surrounding neighborhoods
Configuration of school (office, front desk, etc.) to make access control a possibility
Budget allocations
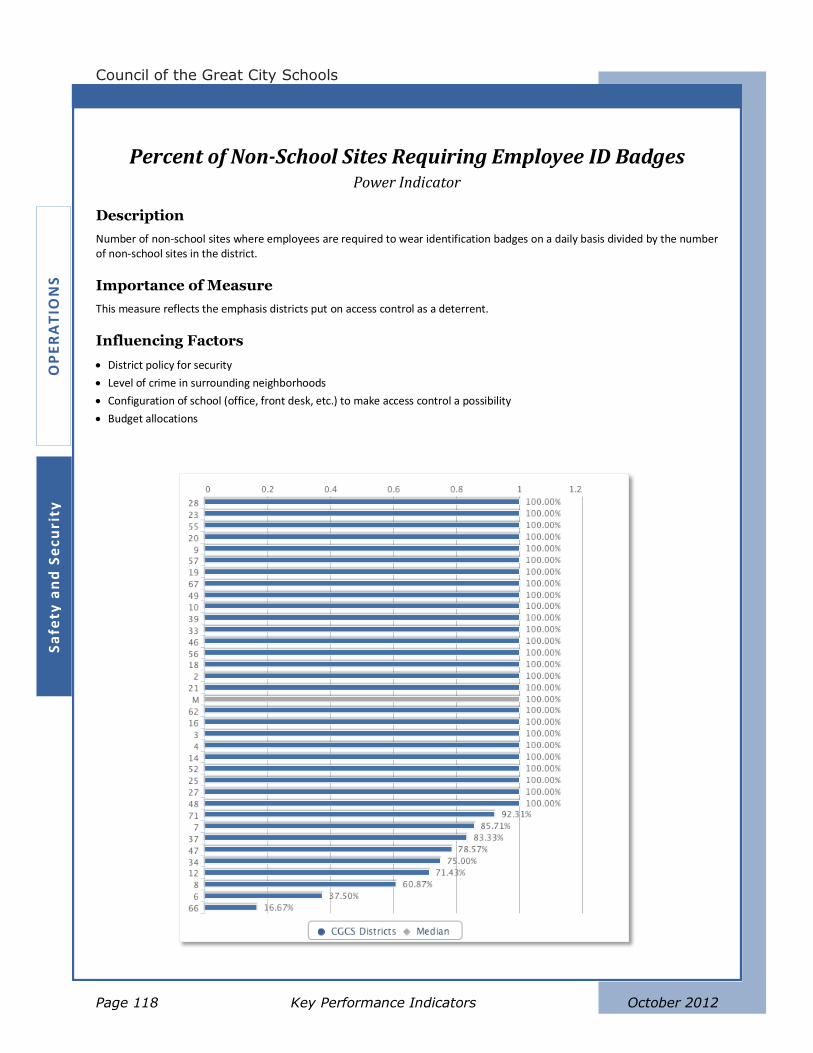
Council of the Great City Schools
Page 118 Key Performance Indicators October 2012
OP
ER
AT
ION
S
Sa
fety
an
d S
ecu
rity
Percent of Non-School Sites Requiring Employee ID Badges Power Indicator
Description
Number of non-school sites where employees are required to wear identification badges on a daily basis divided by the number of non-school sites in the district.
Importance of Measure
This measure reflects the emphasis districts put on access control as a deterrent.
Influencing Factors
District policy for security
Level of crime in surrounding neighborhoods
Configuration of school (office, front desk, etc.) to make access control a possibility
Budget allocations
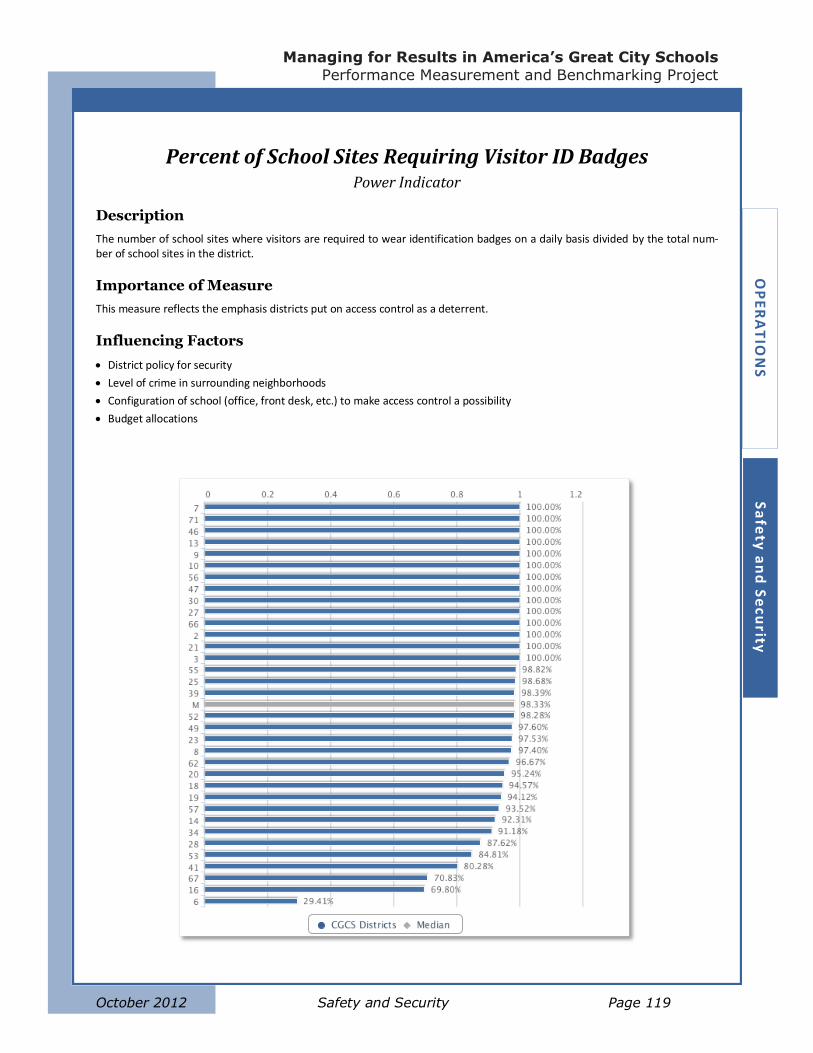
Managing for Results in America’s Great City Schools
Performance Measurement and Benchmarking Project
October 2012 Safety and Security Page 119
OP
ER
AT
ION
S
Sa
fety
an
d S
ecu
rity
Percent of School Sites Requiring Visitor ID Badges Power Indicator
Description
The number of school sites where visitors are required to wear identification badges on a daily basis divided by the total num-ber of school sites in the district.
Importance of Measure
This measure reflects the emphasis districts put on access control as a deterrent.
Influencing Factors
District policy for security
Level of crime in surrounding neighborhoods
Configuration of school (office, front desk, etc.) to make access control a possibility
Budget allocations
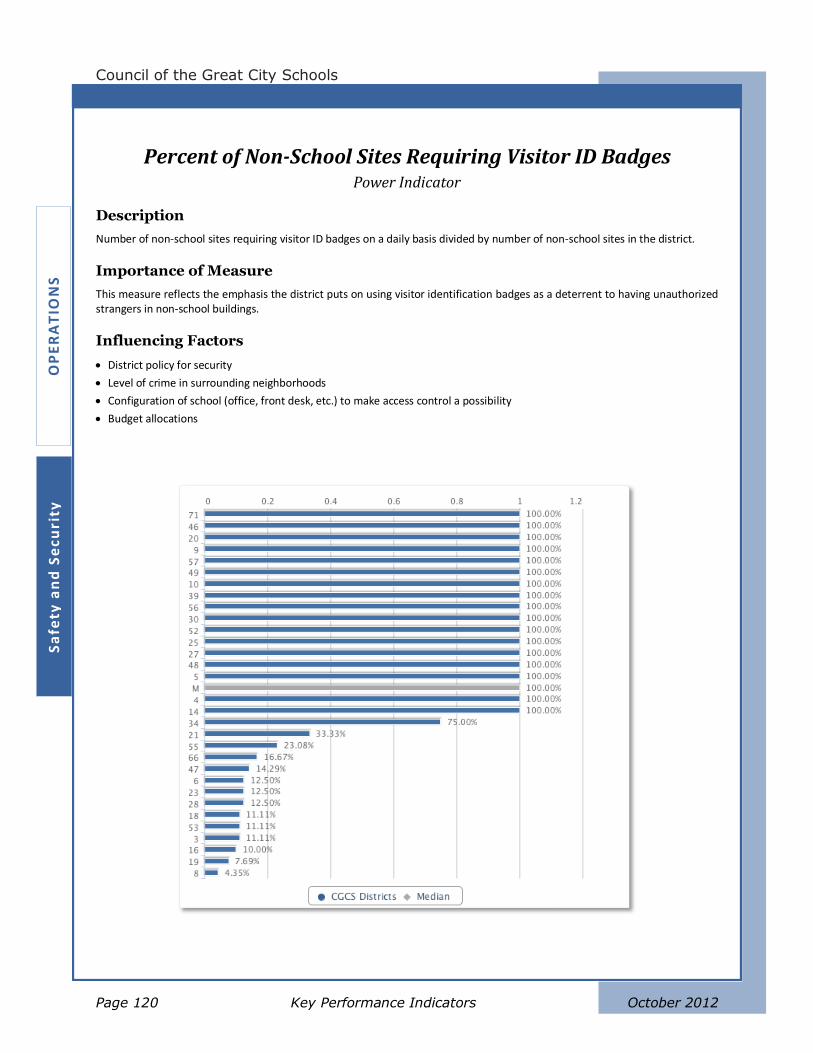
Council of the Great City Schools
Page 120 Key Performance Indicators October 2012
OP
ER
AT
ION
S
Sa
fety
an
d S
ecu
rity
Percent of Non-School Sites Requiring Visitor ID Badges Power Indicator
Description
Number of non-school sites requiring visitor ID badges on a daily basis divided by number of non-school sites in the district.
Importance of Measure
This measure reflects the emphasis the district puts on using visitor identification badges as a deterrent to having unauthorized strangers in non-school buildings.
Influencing Factors
District policy for security
Level of crime in surrounding neighborhoods
Configuration of school (office, front desk, etc.) to make access control a possibility
Budget allocations
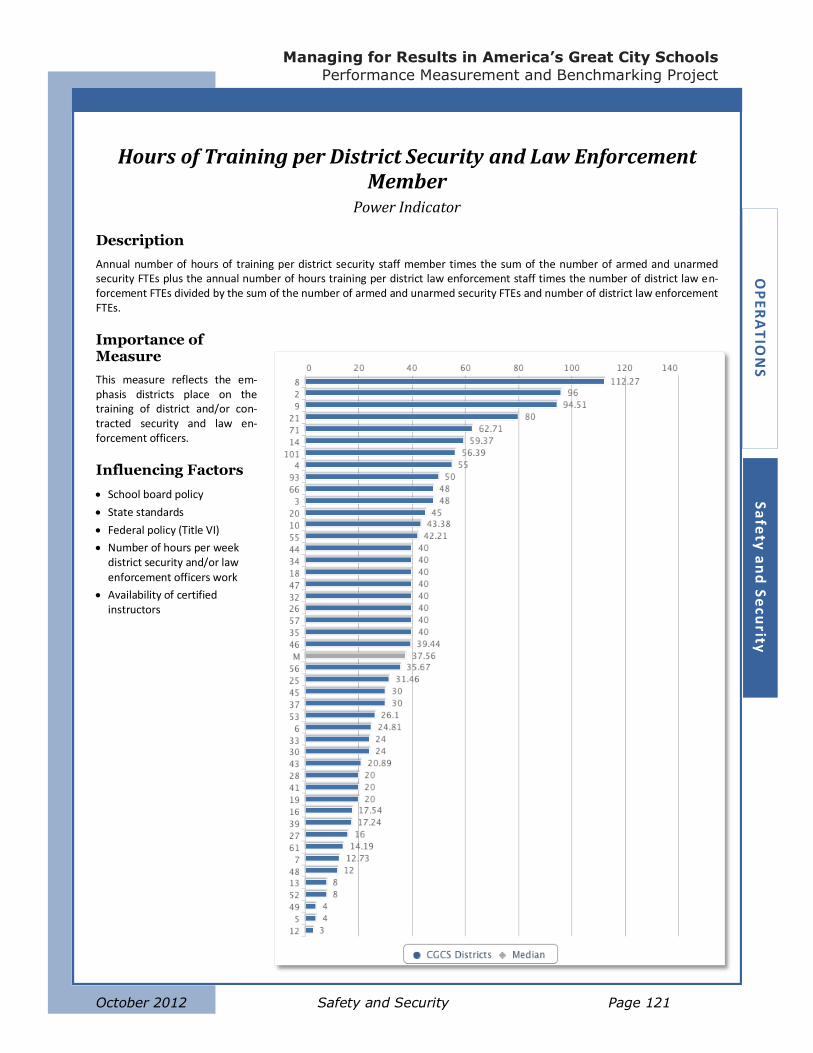
Managing for Results in America’s Great City Schools
Performance Measurement and Benchmarking Project
October 2012 Safety and Security Page 121
OP
ER
AT
ION
S
Sa
fety
an
d S
ecu
rity
Hours of Training per District Security and Law Enforcement Member
Power Indicator
Description
Annual number of hours of training per district security staff member times the sum of the number of armed and unarmed security FTEs plus the annual number of hours training per district law enforcement staff times the number of district law en-forcement FTEs divided by the sum of the number of armed and unarmed security FTEs and number of district law enforcement FTEs.
Importance of Measure
This measure reflects the em-phasis districts place on the training of district and/or con-tracted security and law en-forcement officers.
Influencing Factors
School board policy
State standards
Federal policy (Title VI)
Number of hours per week district security and/or law enforcement officers work
Availability of certified instructors
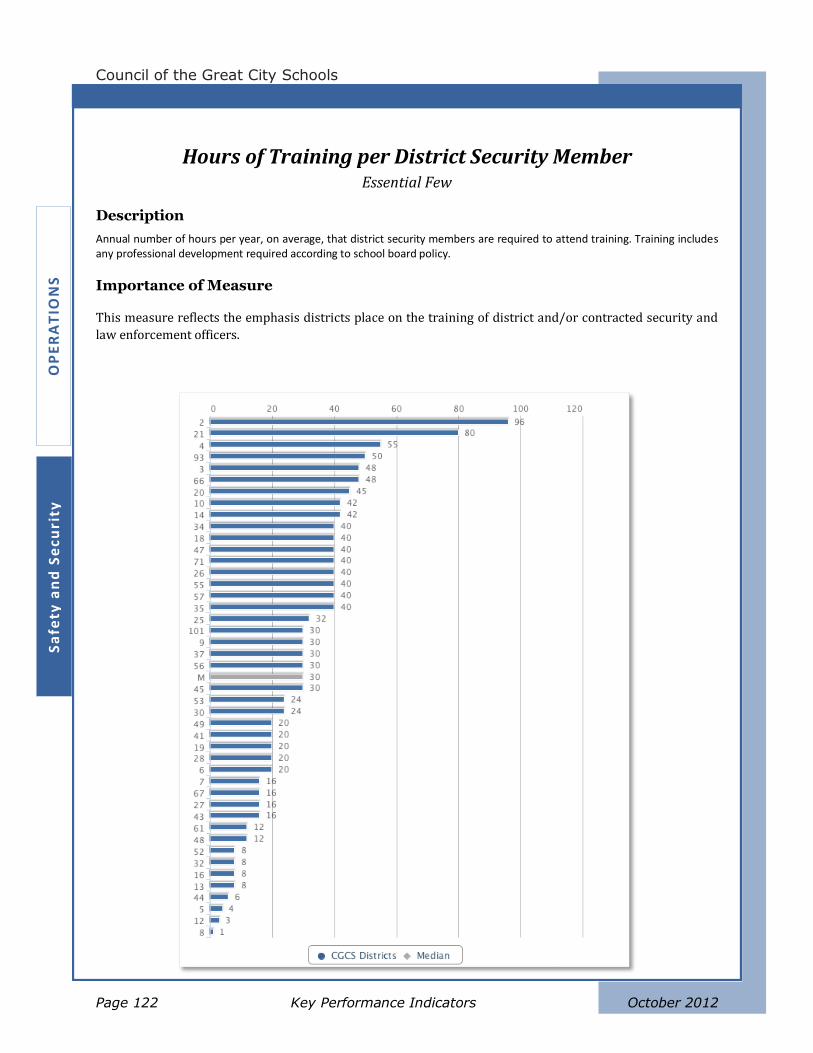
Council of the Great City Schools
Page 122 Key Performance Indicators October 2012
OP
ER
AT
ION
S
Sa
fety
an
d S
ecu
rity
Hours of Training per District Security Member Essential Few
Description
Annual number of hours per year, on average, that district security members are required to attend training. Training includes any professional development required according to school board policy.
Importance of Measure
This measure reflects the emphasis districts place on the training of district and/or contracted security and
law enforcement officers.
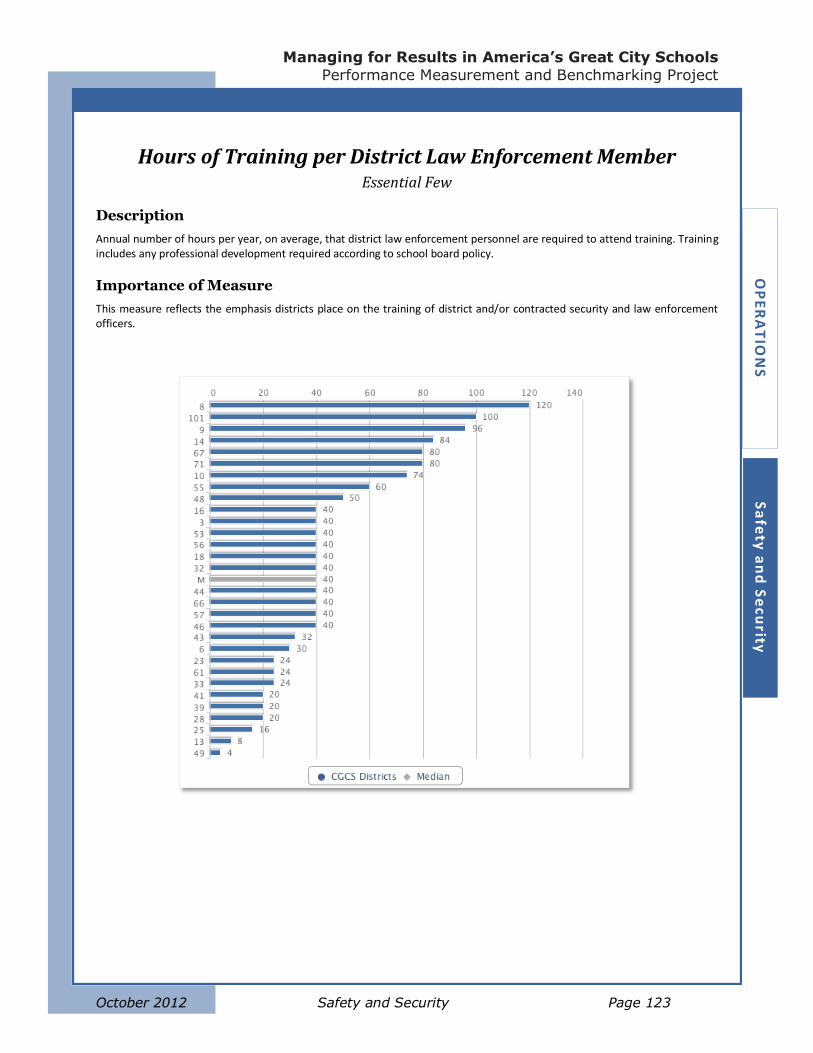
Managing for Results in America’s Great City Schools
Performance Measurement and Benchmarking Project
October 2012 Safety and Security Page 123
OP
ER
AT
ION
S
Sa
fety
an
d S
ecu
rity
Hours of Training per District Law Enforcement Member Essential Few
Description
Annual number of hours per year, on average, that district law enforcement personnel are required to attend training. Training includes any professional development required according to school board policy.
Importance of Measure
This measure reflects the emphasis districts place on the training of district and/or contracted security and law enforcement officers.
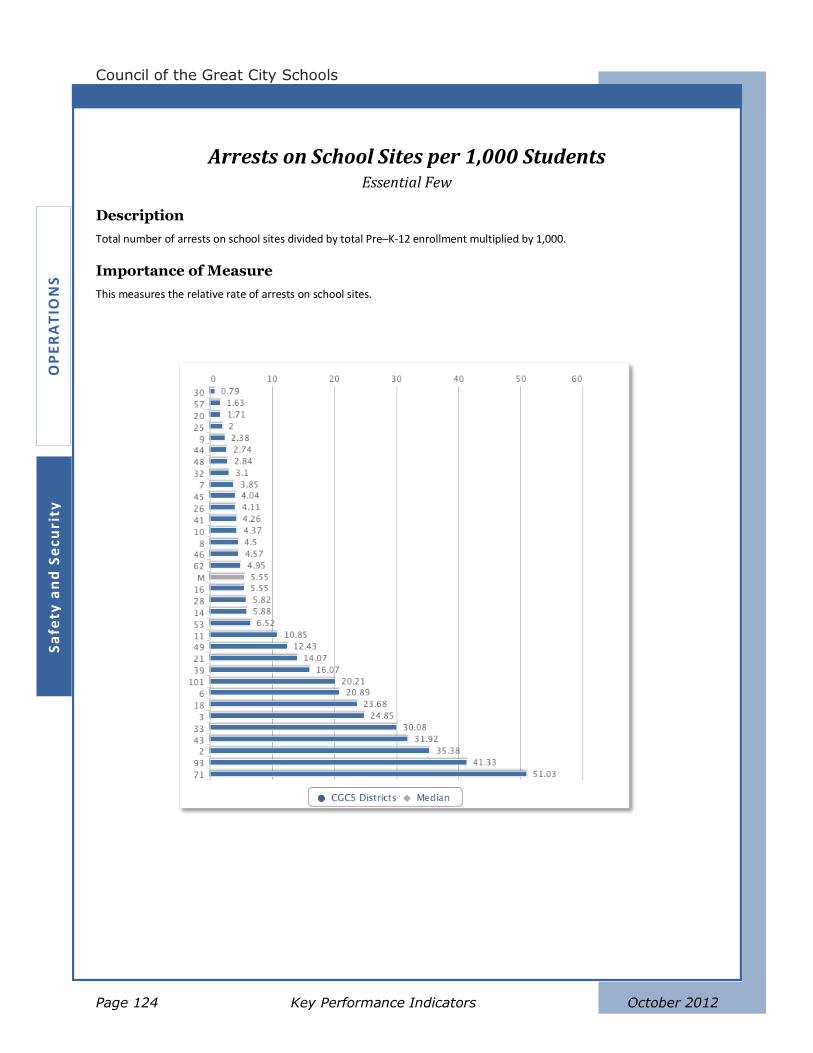
Council of the Great City Schools
Page 124 Key Performance Indicators October 2012
OP
ER
AT
ION
S
Sa
fety
an
d S
ecu
rity
Arrests on School Sites per 1,000 Students Essential Few
Description
Total number of arrests on school sites divided by total Pre–K-12 enrollment multiplied by 1,000.
Importance of Measure
This measures the relative rate of arrests on school sites.
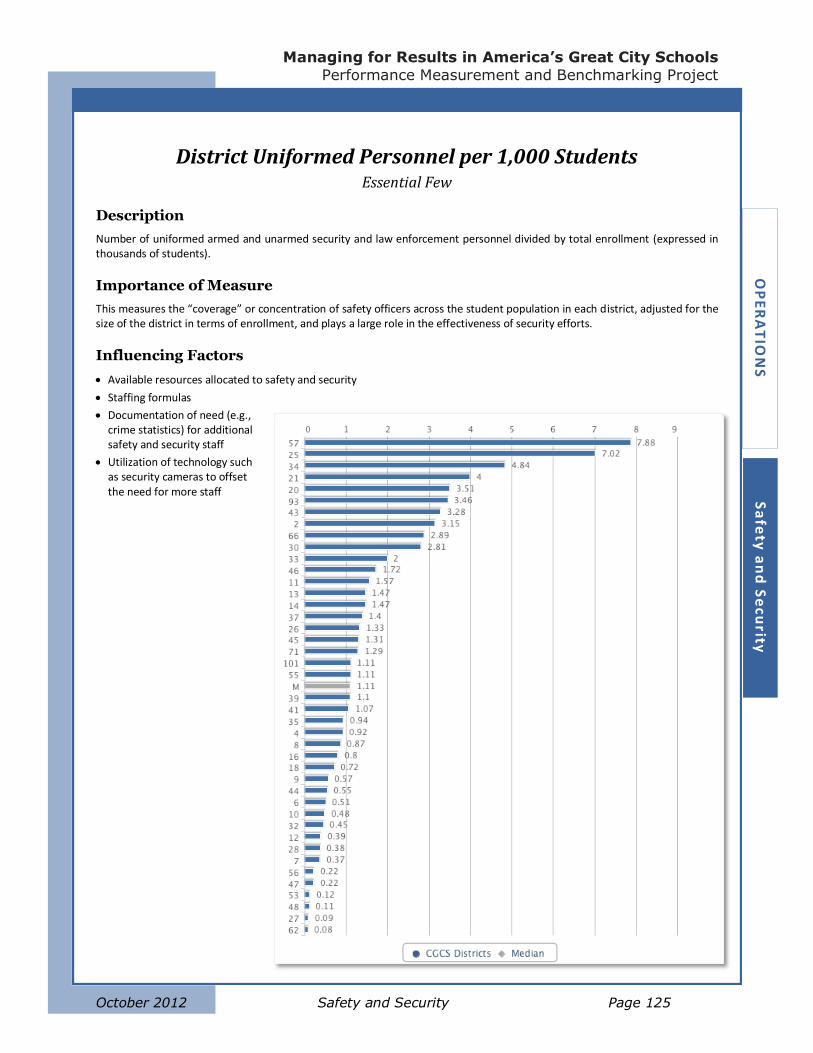
Managing for Results in America’s Great City Schools
Performance Measurement and Benchmarking Project
October 2012 Safety and Security Page 125
OP
ER
AT
ION
S
Sa
fety
an
d S
ecu
rity
District Uniformed Personnel per 1,000 Students Essential Few
Description
Number of uniformed armed and unarmed security and law enforcement personnel divided by total enrollment (expressed in thousands of students).
Importance of Measure
This measures the “coverage” or concentration of safety officers across the student population in each district, adjusted for the size of the district in terms of enrollment, and plays a large role in the effectiveness of security efforts.
Influencing Factors
Available resources allocated to safety and security
Staffing formulas
Documentation of need (e.g., crime statistics) for additional safety and security staff
Utilization of technology such as security cameras to offset the need for more staff
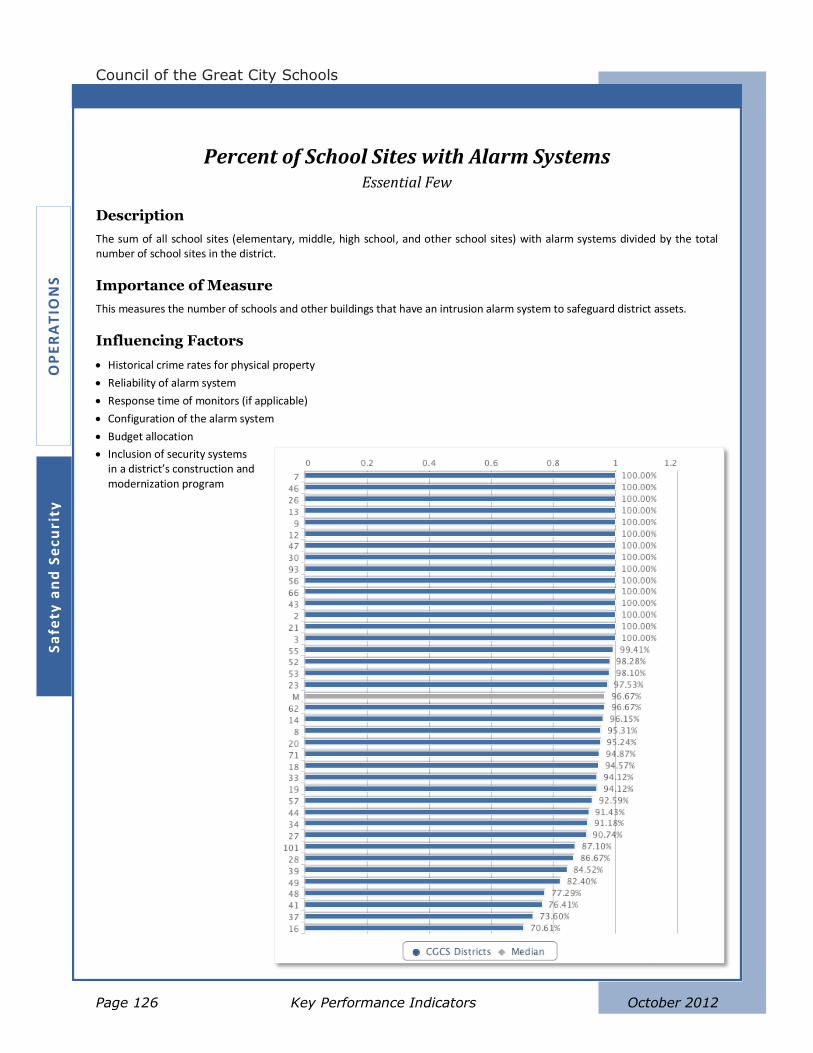
Council of the Great City Schools
Page 126 Key Performance Indicators October 2012
OP
ER
AT
ION
S
Sa
fety
an
d S
ecu
rity
Percent of School Sites with Alarm Systems Essential Few
Description
The sum of all school sites (elementary, middle, high school, and other school sites) with alarm systems divided by the total number of school sites in the district.
Importance of Measure
This measures the number of schools and other buildings that have an intrusion alarm system to safeguard district assets.
Influencing Factors
Historical crime rates for physical property
Reliability of alarm system
Response time of monitors (if applicable)
Configuration of the alarm system
Budget allocation
Inclusion of security systems in a district’s construction and modernization program
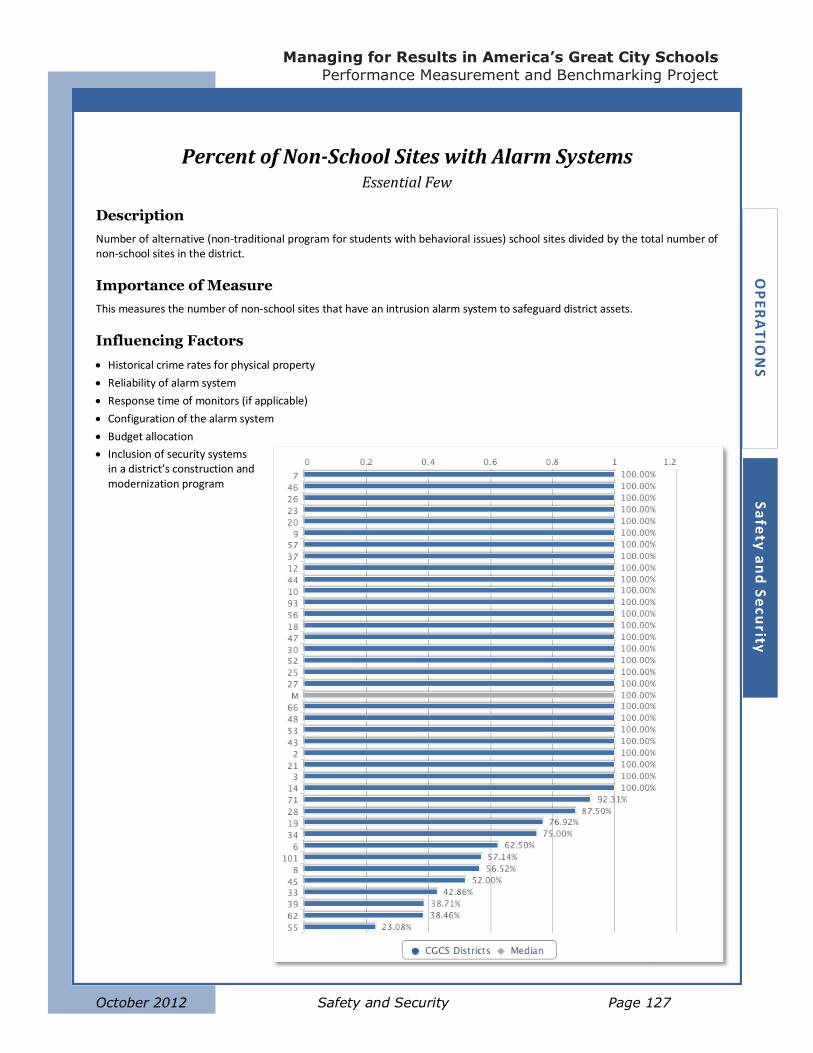
Managing for Results in America’s Great City Schools
Performance Measurement and Benchmarking Project
October 2012 Safety and Security Page 127
OP
ER
AT
ION
S
Sa
fety
an
d S
ecu
rity
Percent of Non-School Sites with Alarm Systems Essential Few
Description
Number of alternative (non-traditional program for students with behavioral issues) school sites divided by the total number of non-school sites in the district.
Importance of Measure
This measures the number of non-school sites that have an intrusion alarm system to safeguard district assets.
Influencing Factors
Historical crime rates for physical property
Reliability of alarm system
Response time of monitors (if applicable)
Configuration of the alarm system
Budget allocation
Inclusion of security systems in a district’s construction and modernization program

Council of the Great City Schools
Page 128 Key Performance Indicators October 2012
OP
ER
AT
ION
S
Sa
fety
an
d S
ec
uri
ty
Managing for Results in America’s Great City Schools
Performance Measurement and Benchmarking Project
October 2012 Transportation Page 129
OP
ER
AT
ION
S
Tra
nsp
orta
tion
Transportation
Performance metrics in transportation cover a broad range of factors that affect service levels
and cost efficiency. The broad summative measures are Cost per Total Mile Operated and
Transportation Cost per Rider, and the other measures include diagnostic tools to weed out inef-
ficiencies and excessive expenses. A key measure of efficiency is Daily Runs per Bus, which re-
flects the daily reuse of buses; and important service-level measures include On-Time Perfor-
mance and Turn Time to Place New Students.
Careful consideration of each measure and its impact on a district’s transportation services is vi-
tal to the improvement of performance.
General factors that influence transportation measures and improvement strategies include:
Types of transported programs served
Bell schedule
Effectiveness of the routing plan
Spare bus factor needed
Age of fleet
Driver wage and benefit structure and labor contracts
Maximum riding time allowed and earliest pickup time allowed
Enrollment projections and their impact on transported programs
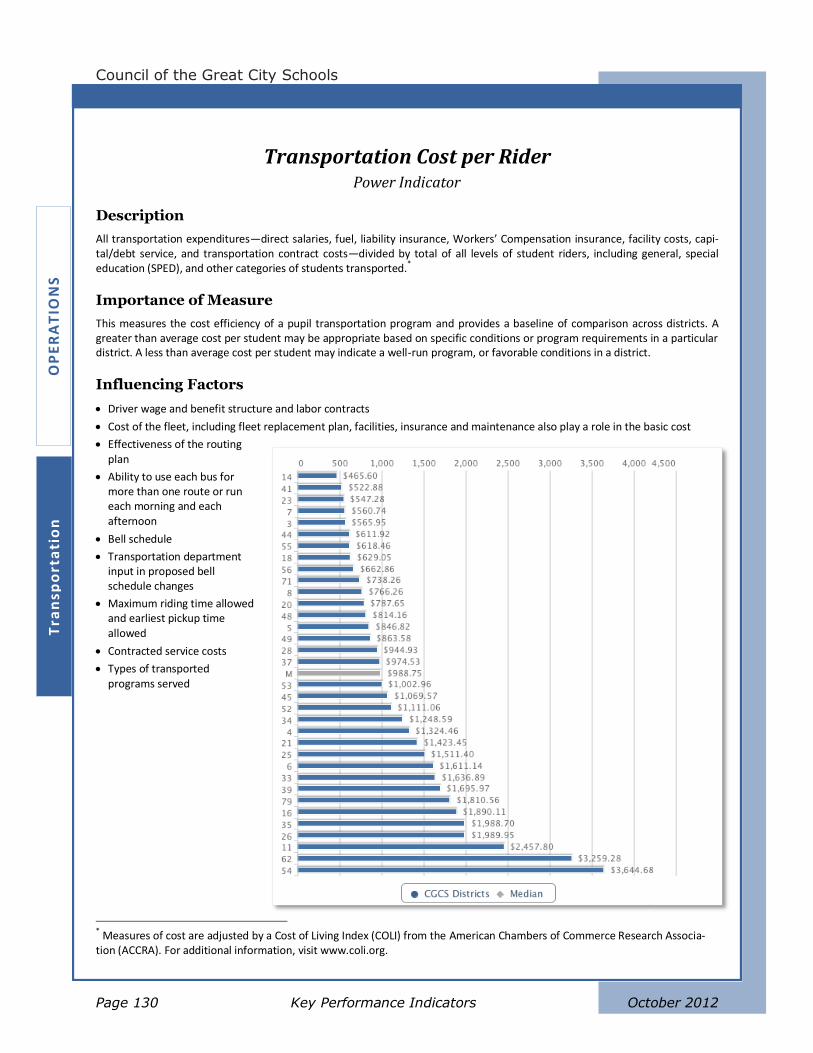
Council of the Great City Schools
Page 130 Key Performance Indicators October 2012
OP
ER
AT
ION
S
Tra
nsp
ort
ati
on
Transportation Cost per Rider Power Indicator
Description
All transportation expenditures—direct salaries, fuel, liability insurance, Workers’ Compensation insurance, facility costs, capi-tal/debt service, and transportation contract costs—divided by total of all levels of student riders, including general, special education (SPED), and other categories of students transported.*
Importance of Measure
This measures the cost efficiency of a pupil transportation program and provides a baseline of comparison across districts. A greater than average cost per student may be appropriate based on specific conditions or program requirements in a particular district. A less than average cost per student may indicate a well-run program, or favorable conditions in a district.
Influencing Factors
Driver wage and benefit structure and labor contracts
Cost of the fleet, including fleet replacement plan, facilities, insurance and maintenance also play a role in the basic cost
Effectiveness of the routing plan
Ability to use each bus for more than one route or run each morning and each afternoon
Bell schedule
Transportation department input in proposed bell schedule changes
Maximum riding time allowed and earliest pickup time allowed
Contracted service costs
Types of transported programs served
* Measures of cost are adjusted by a Cost of Living Index (COLI) from the American Chambers of Commerce Research Associa-tion (ACCRA). For additional information, visit www.coli.org.
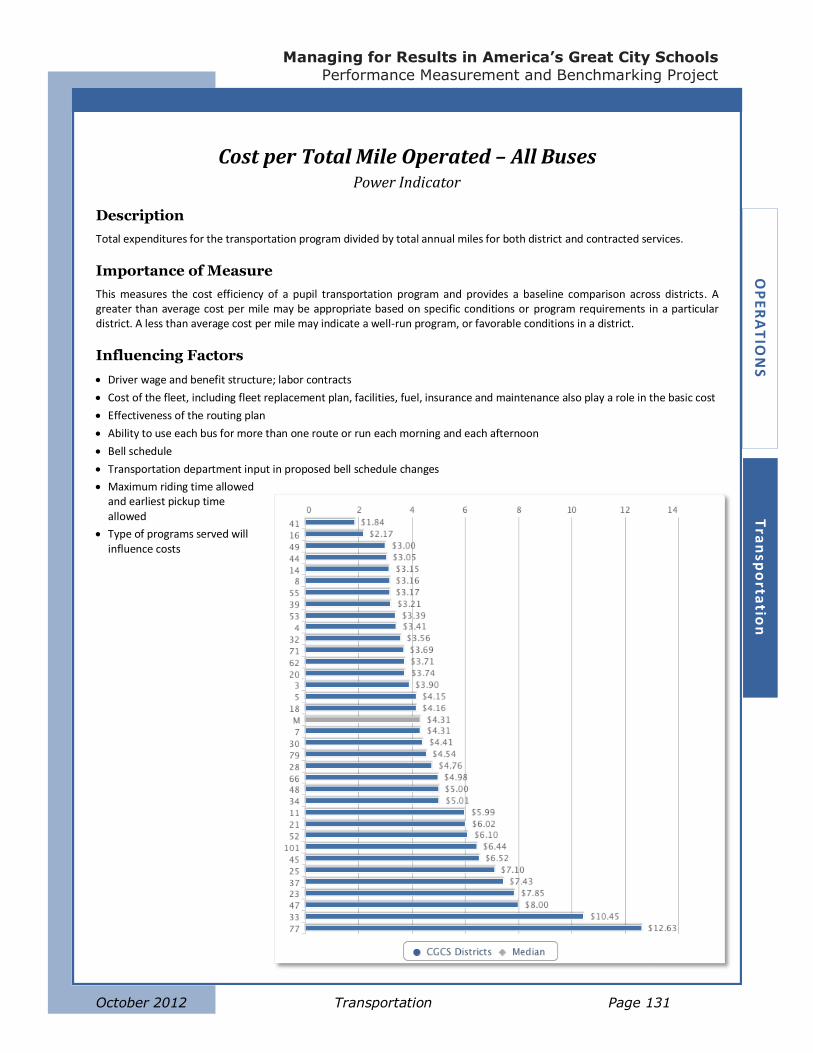
Managing for Results in America’s Great City Schools
Performance Measurement and Benchmarking Project
October 2012 Transportation Page 131
OP
ER
AT
ION
S
Tra
nsp
orta
tion
Cost per Total Mile Operated – All Buses Power Indicator
Description
Total expenditures for the transportation program divided by total annual miles for both district and contracted services.
Importance of Measure
This measures the cost efficiency of a pupil transportation program and provides a baseline comparison across districts. A greater than average cost per mile may be appropriate based on specific conditions or program requirements in a particular district. A less than average cost per mile may indicate a well-run program, or favorable conditions in a district.
Influencing Factors
Driver wage and benefit structure; labor contracts
Cost of the fleet, including fleet replacement plan, facilities, fuel, insurance and maintenance also play a role in the basic cost
Effectiveness of the routing plan
Ability to use each bus for more than one route or run each morning and each afternoon
Bell schedule
Transportation department input in proposed bell schedule changes
Maximum riding time allowed and earliest pickup time allowed
Type of programs served will influence costs

Council of the Great City Schools
Page 132 Key Performance Indicators October 2012
OP
ER
AT
ION
S
Tra
nsp
ort
ati
on
On-Time Performance – All Buses – Using </= 10 Minute Interval Power Indicator
Description
Total number of bus runs that did not arrive on-time—within ten minutes of the published time (including district and contract-ed bus services)—divided by the total number of annual runs (daily runs times number of school days).
Importance of Measure
This measures the level of success of the transportation service remaining on the published arrival schedule. Late arrival of stu-dents at schools causes disruption in classrooms and may preclude some students from having school-provided breakfast.
Influencing Factors
Automobile traffic
Accidents
Detours
Weather
Increased ridership
Mechanical breakdown
Unrealistic scheduling
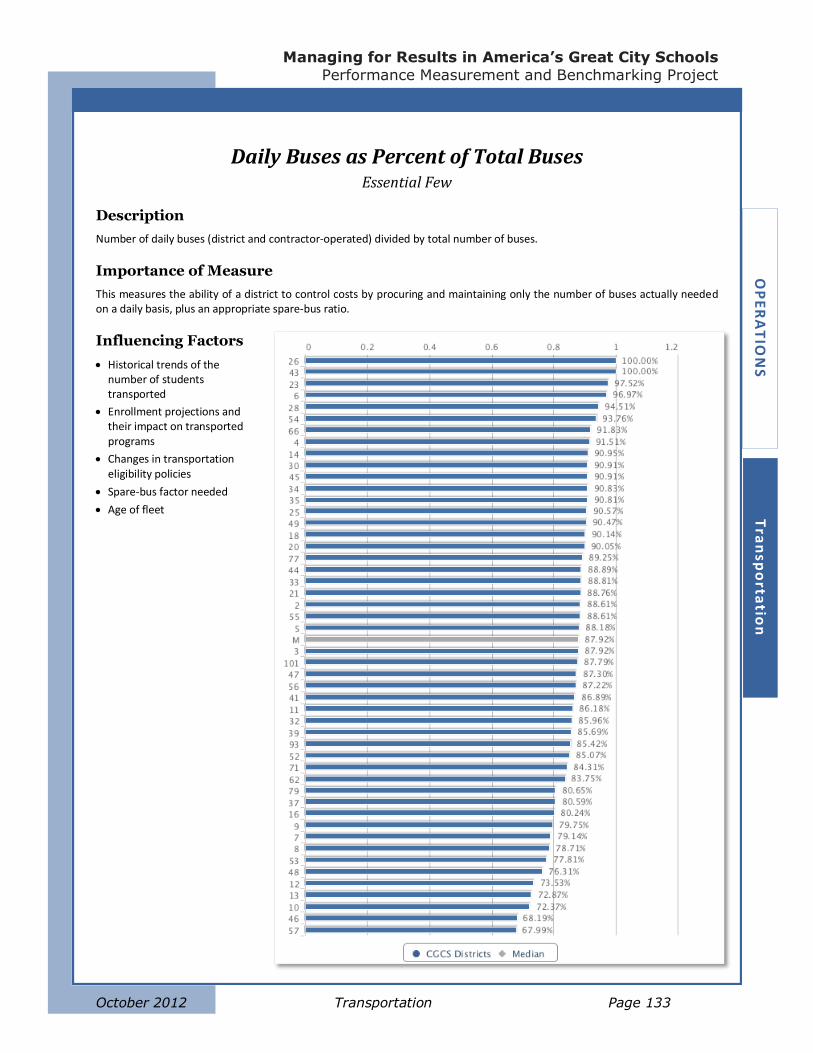
Managing for Results in America’s Great City Schools
Performance Measurement and Benchmarking Project
October 2012 Transportation Page 133
OP
ER
AT
ION
S
Tra
nsp
orta
tion
Daily Buses as Percent of Total Buses Essential Few
Description
Number of daily buses (district and contractor-operated) divided by total number of buses.
Importance of Measure
This measures the ability of a district to control costs by procuring and maintaining only the number of buses actually needed on a daily basis, plus an appropriate spare-bus ratio.
Influencing Factors
Historical trends of the number of students transported
Enrollment projections and their impact on transported programs
Changes in transportation eligibility policies
Spare-bus factor needed
Age of fleet
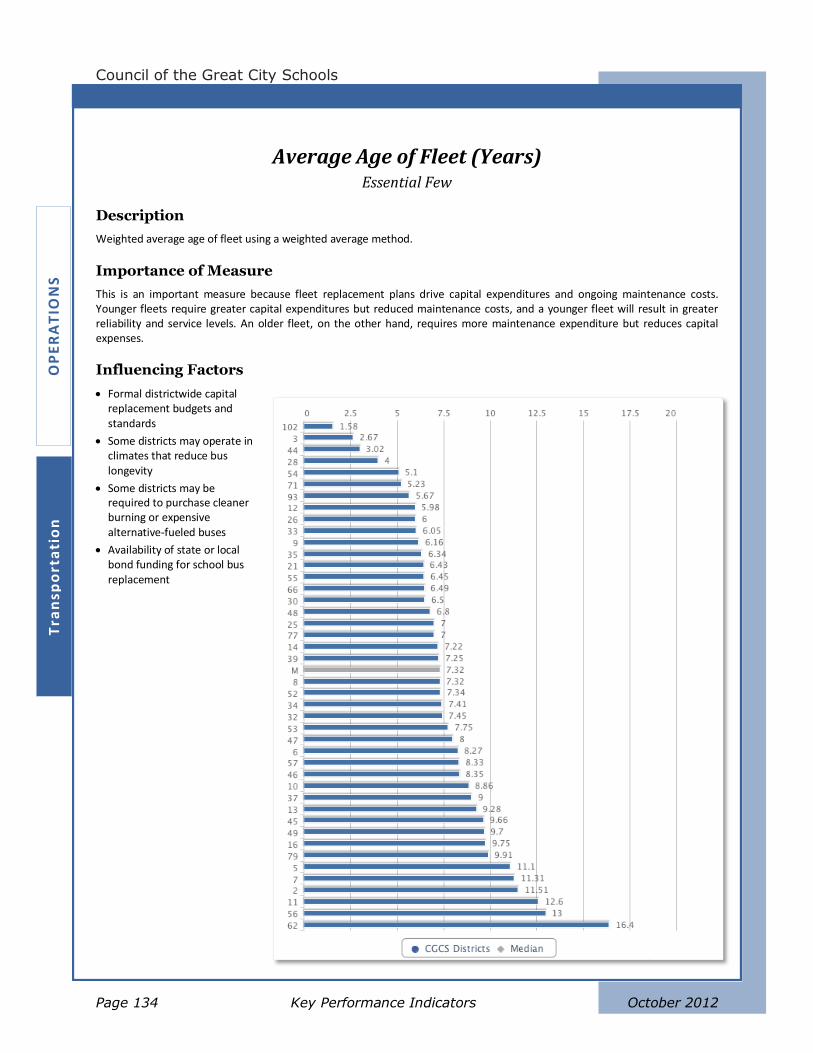
Council of the Great City Schools
Page 134 Key Performance Indicators October 2012
OP
ER
AT
ION
S
Tra
nsp
ort
ati
on
Average Age of Fleet (Years) Essential Few
Description
Weighted average age of fleet using a weighted average method.
Importance of Measure
This is an important measure because fleet replacement plans drive capital expenditures and ongoing maintenance costs. Younger fleets require greater capital expenditures but reduced maintenance costs, and a younger fleet will result in greater reliability and service levels. An older fleet, on the other hand, requires more maintenance expenditure but reduces capital expenses.
Influencing Factors
Formal districtwide capital replacement budgets and standards
Some districts may operate in climates that reduce bus longevity
Some districts may be required to purchase cleaner burning or expensive alternative-fueled buses
Availability of state or local bond funding for school bus replacement
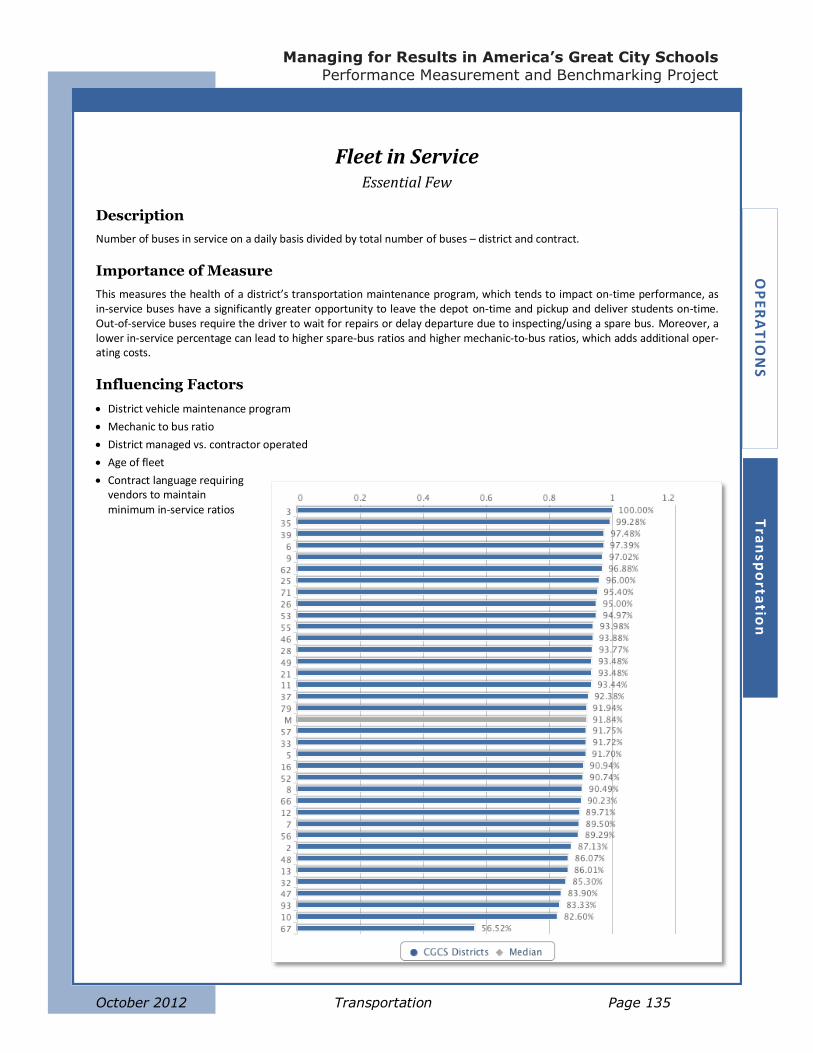
Managing for Results in America’s Great City Schools
Performance Measurement and Benchmarking Project
October 2012 Transportation Page 135
OP
ER
AT
ION
S
Tra
nsp
orta
tion
Fleet in Service Essential Few
Description
Number of buses in service on a daily basis divided by total number of buses – district and contract.
Importance of Measure
This measures the health of a district’s transportation maintenance program, which tends to impact on-time performance, as in-service buses have a significantly greater opportunity to leave the depot on-time and pickup and deliver students on-time. Out-of-service buses require the driver to wait for repairs or delay departure due to inspecting/using a spare bus. Moreover, a lower in-service percentage can lead to higher spare-bus ratios and higher mechanic-to-bus ratios, which adds additional oper-ating costs.
Influencing Factors
District vehicle maintenance program
Mechanic to bus ratio
District managed vs. contractor operated
Age of fleet
Contract language requiring vendors to maintain minimum in-service ratios
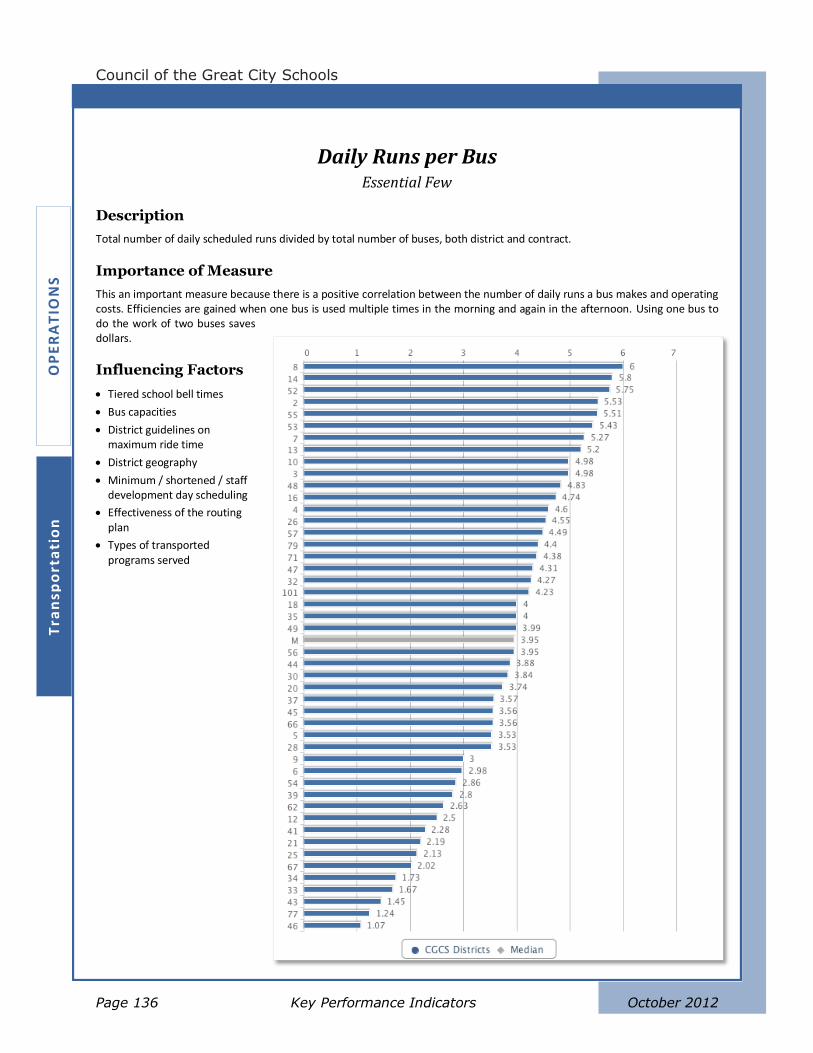
Council of the Great City Schools
Page 136 Key Performance Indicators October 2012
OP
ER
AT
ION
S
Tra
nsp
ort
ati
on
Daily Runs per Bus Essential Few
Description
Total number of daily scheduled runs divided by total number of buses, both district and contract.
Importance of Measure
This an important measure because there is a positive correlation between the number of daily runs a bus makes and operating costs. Efficiencies are gained when one bus is used multiple times in the morning and again in the afternoon. Using one bus to do the work of two buses saves dollars.
Influencing Factors
Tiered school bell times
Bus capacities
District guidelines on maximum ride time
District geography
Minimum / shortened / staff development day scheduling
Effectiveness of the routing plan
Types of transported programs served
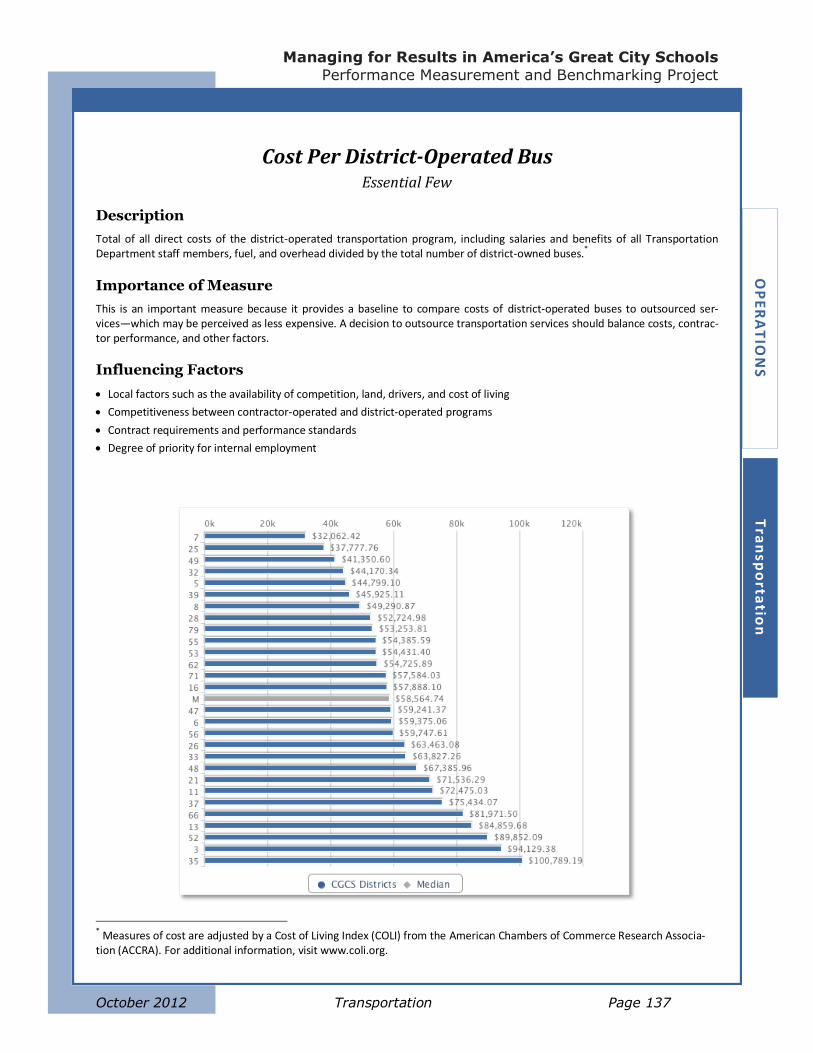
Managing for Results in America’s Great City Schools
Performance Measurement and Benchmarking Project
October 2012 Transportation Page 137
OP
ER
AT
ION
S
Tra
nsp
orta
tion
Cost Per District-Operated Bus Essential Few
Description
Total of all direct costs of the district-operated transportation program, including salaries and benefits of all Transportation Department staff members, fuel, and overhead divided by the total number of district-owned buses.
*
Importance of Measure
This is an important measure because it provides a baseline to compare costs of district-operated buses to outsourced ser-vices—which may be perceived as less expensive. A decision to outsource transportation services should balance costs, contrac-tor performance, and other factors.
Influencing Factors
Local factors such as the availability of competition, land, drivers, and cost of living
Competitiveness between contractor-operated and district-operated programs
Contract requirements and performance standards
Degree of priority for internal employment
* Measures of cost are adjusted by a Cost of Living Index (COLI) from the American Chambers of Commerce Research Associa-tion (ACCRA). For additional information, visit www.coli.org.
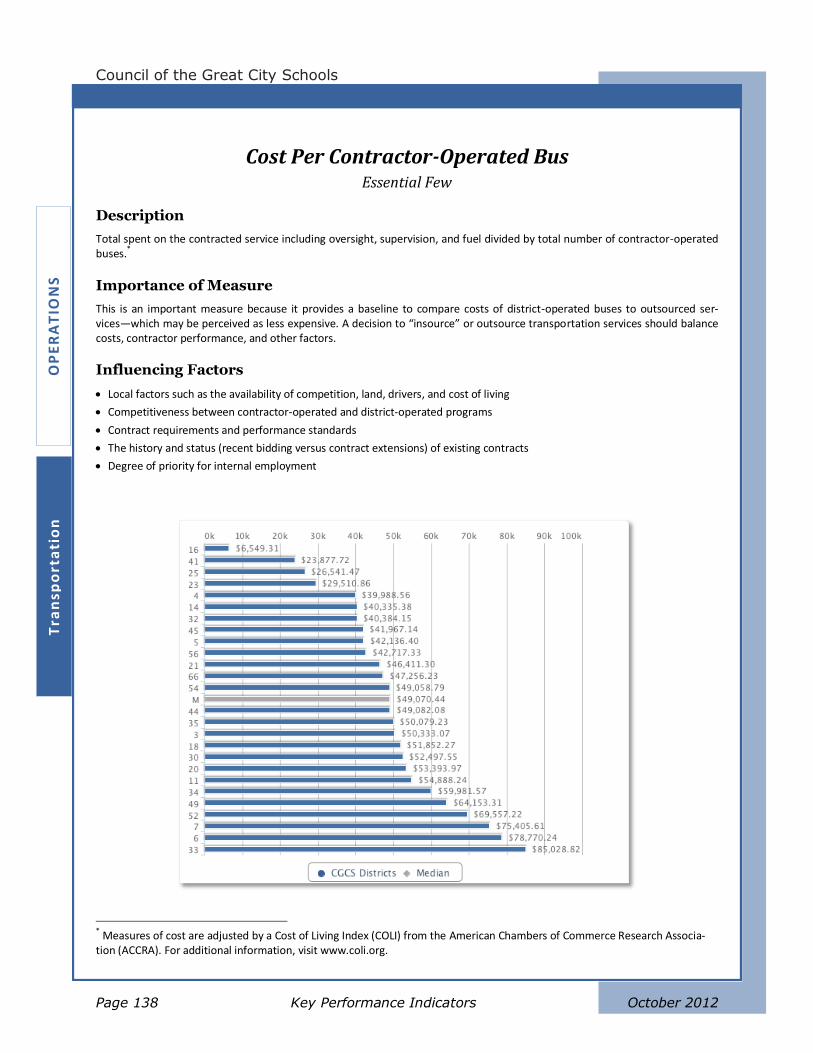
Council of the Great City Schools
Page 138 Key Performance Indicators October 2012
OP
ER
AT
ION
S
Tra
nsp
ort
ati
on
Cost Per Contractor-Operated Bus Essential Few
Description
Total spent on the contracted service including oversight, supervision, and fuel divided by total number of contractor-operated buses.
*
Importance of Measure
This is an important measure because it provides a baseline to compare costs of district-operated buses to outsourced ser-vices—which may be perceived as less expensive. A decision to “insource” or outsource transportation services should balance costs, contractor performance, and other factors.
Influencing Factors
Local factors such as the availability of competition, land, drivers, and cost of living
Competitiveness between contractor-operated and district-operated programs
Contract requirements and performance standards
The history and status (recent bidding versus contract extensions) of existing contracts
Degree of priority for internal employment
* Measures of cost are adjusted by a Cost of Living Index (COLI) from the American Chambers of Commerce Research Associa-tion (ACCRA). For additional information, visit www.coli.org.
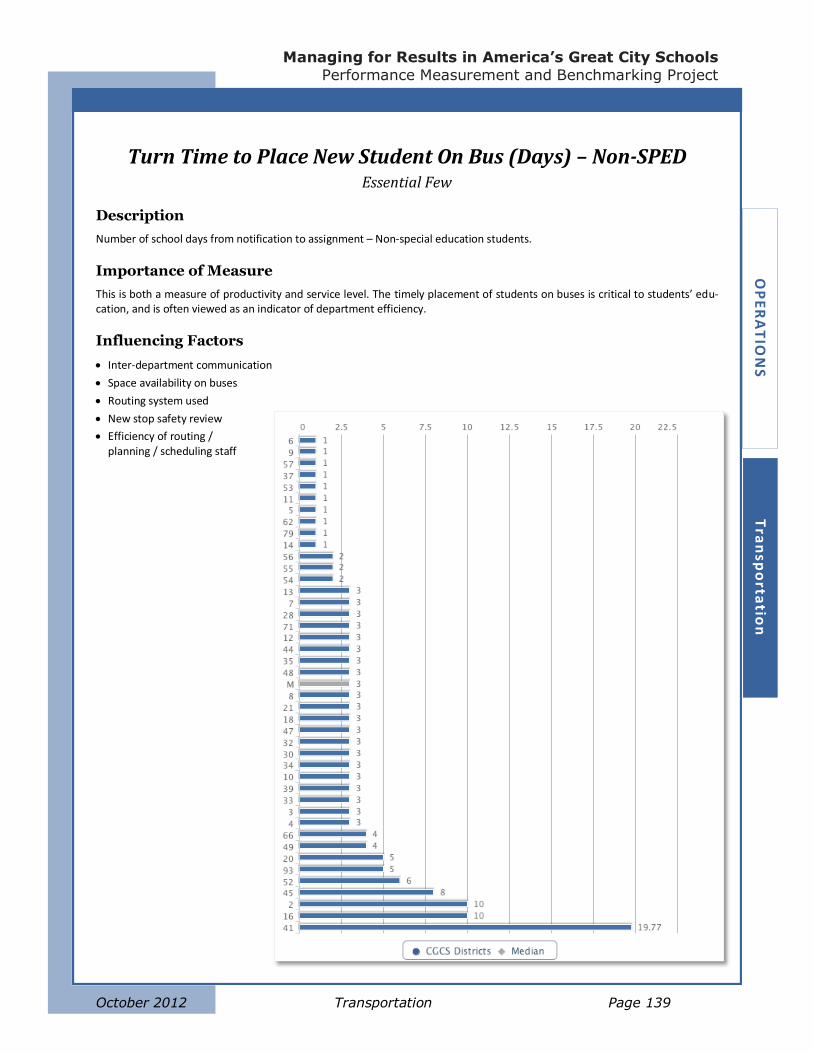
Managing for Results in America’s Great City Schools
Performance Measurement and Benchmarking Project
October 2012 Transportation Page 139
OP
ER
AT
ION
S
Tra
nsp
orta
tion
Turn Time to Place New Student On Bus (Days) – Non-SPED Essential Few
Description
Number of school days from notification to assignment – Non-special education students.
Importance of Measure
This is both a measure of productivity and service level. The timely placement of students on buses is critical to students’ edu-cation, and is often viewed as an indicator of department efficiency.
Influencing Factors
Inter-department communication
Space availability on buses
Routing system used
New stop safety review
Efficiency of routing / planning / scheduling staff
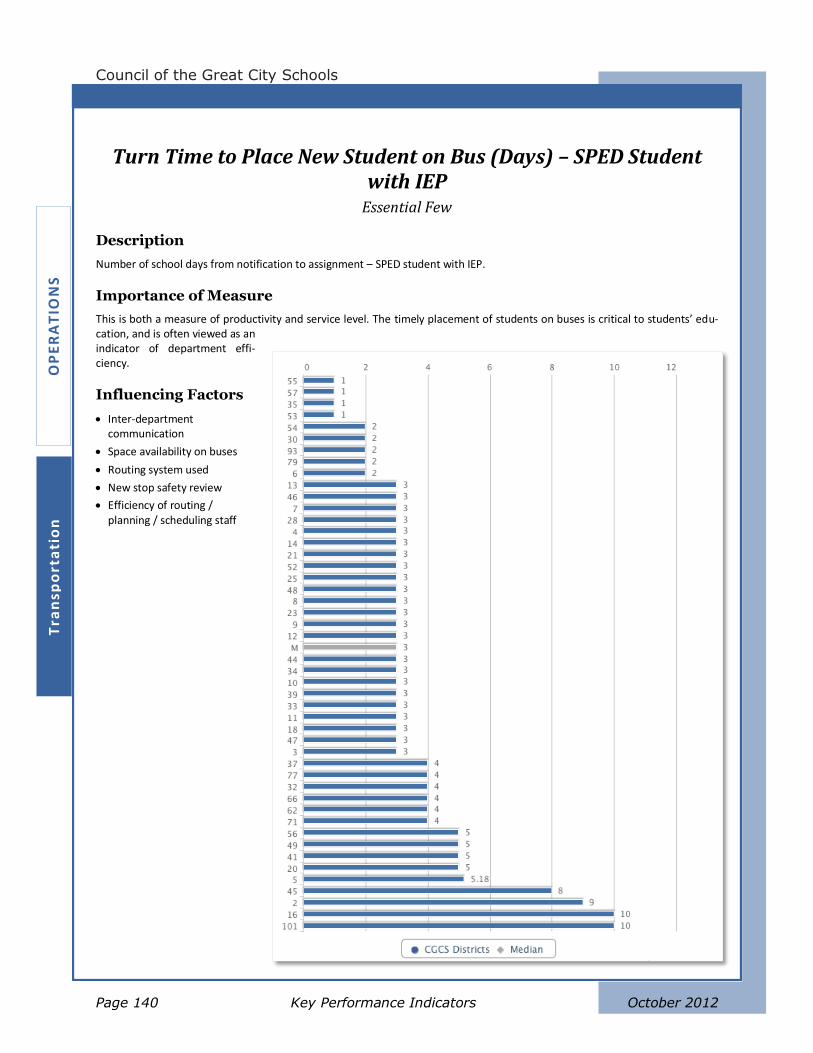
Council of the Great City Schools
Page 140 Key Performance Indicators October 2012
OP
ER
AT
ION
S
Tra
nsp
ort
ati
on
Turn Time to Place New Student on Bus (Days) – SPED Student with IEP
Essential Few
Description
Number of school days from notification to assignment – SPED student with IEP.
Importance of Measure
This is both a measure of productivity and service level. The timely placement of students on buses is critical to students’ edu-cation, and is often viewed as an indicator of department effi-ciency.
Influencing Factors
Inter-department communication
Space availability on buses
Routing system used
New stop safety review
Efficiency of routing / planning / scheduling staff
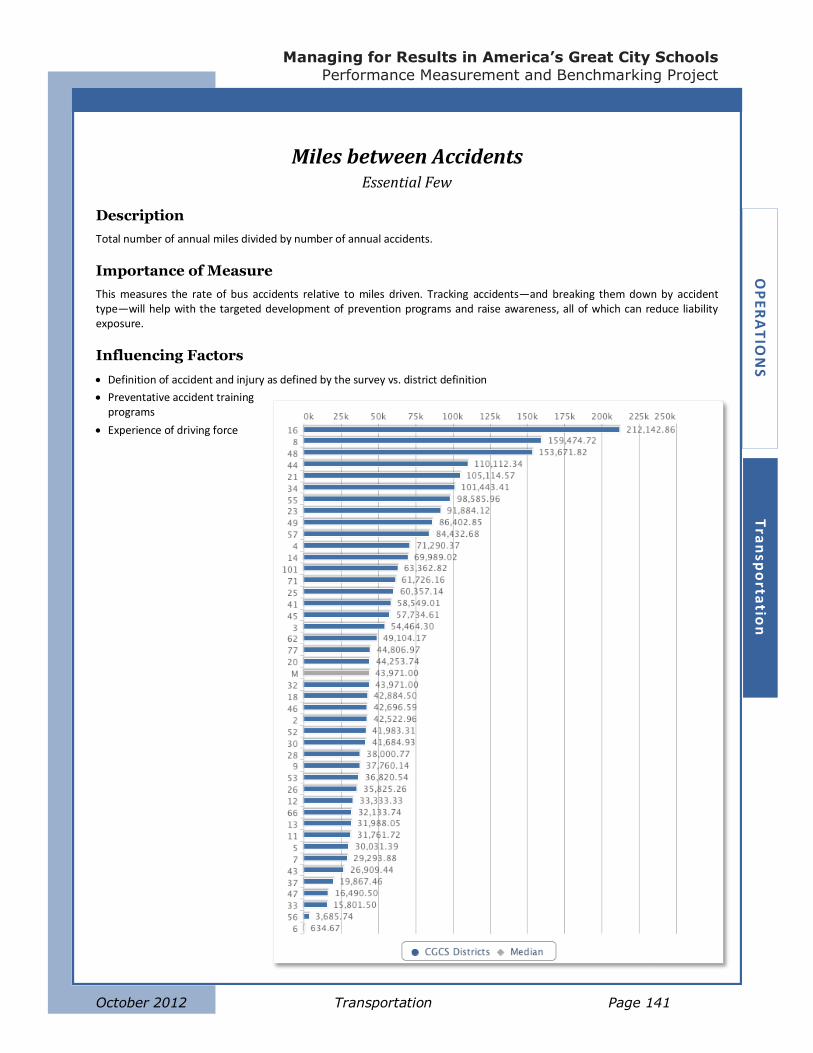
Managing for Results in America’s Great City Schools
Performance Measurement and Benchmarking Project
October 2012 Transportation Page 141
OP
ER
AT
ION
S
Tra
nsp
orta
tion
Miles between Accidents Essential Few
Description
Total number of annual miles divided by number of annual accidents.
Importance of Measure
This measures the rate of bus accidents relative to miles driven. Tracking accidents—and breaking them down by accident type—will help with the targeted development of prevention programs and raise awareness, all of which can reduce liability exposure.
Influencing Factors
Definition of accident and injury as defined by the survey vs. district definition
Preventative accident training programs
Experience of driving force
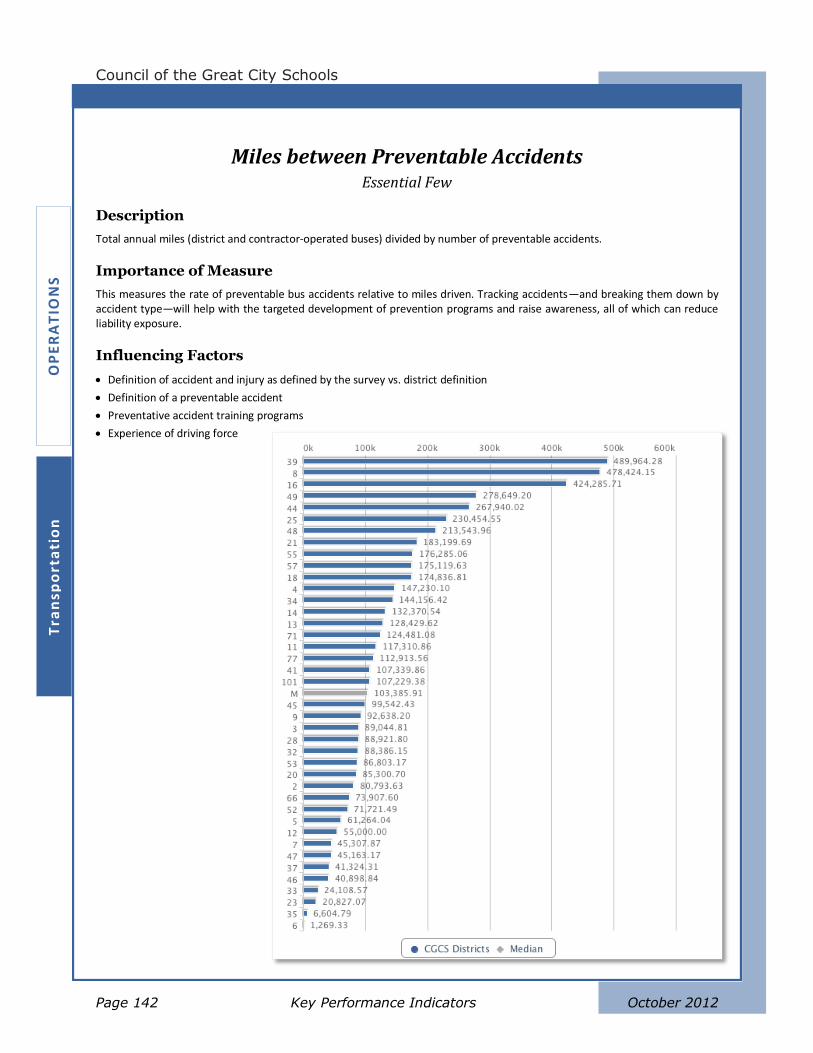
Council of the Great City Schools
Page 142 Key Performance Indicators October 2012
OP
ER
AT
ION
S
Tra
nsp
ort
ati
on
Miles between Preventable Accidents Essential Few
Description
Total annual miles (district and contractor-operated buses) divided by number of preventable accidents.
Importance of Measure
This measures the rate of preventable bus accidents relative to miles driven. Tracking accidents—and breaking them down by accident type—will help with the targeted development of prevention programs and raise awareness, all of which can reduce liability exposure.
Influencing Factors
Definition of accident and injury as defined by the survey vs. district definition
Definition of a preventable accident
Preventative accident training programs
Experience of driving force
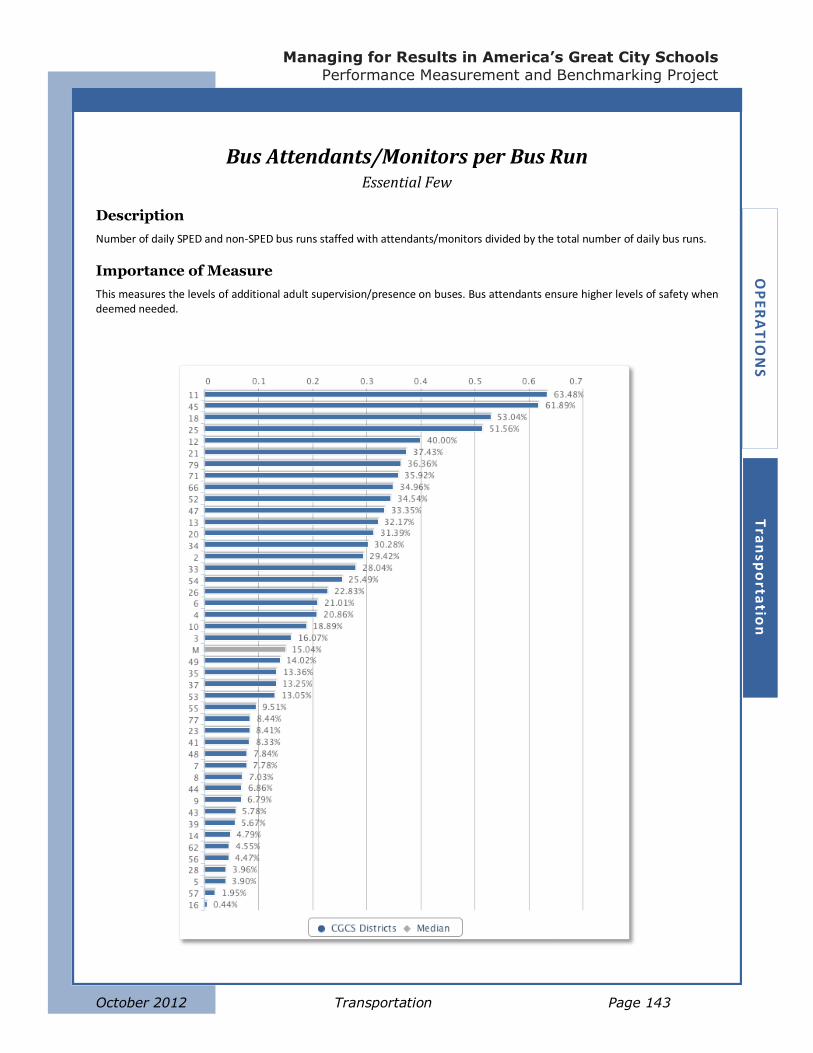
Managing for Results in America’s Great City Schools
Performance Measurement and Benchmarking Project
October 2012 Transportation Page 143
OP
ER
AT
ION
S
Tra
nsp
orta
tion
Bus Attendants/Monitors per Bus Run Essential Few
Description
Number of daily SPED and non-SPED bus runs staffed with attendants/monitors divided by the total number of daily bus runs.
Importance of Measure
This measures the levels of additional adult supervision/presence on buses. Bus attendants ensure higher levels of safety when deemed needed.
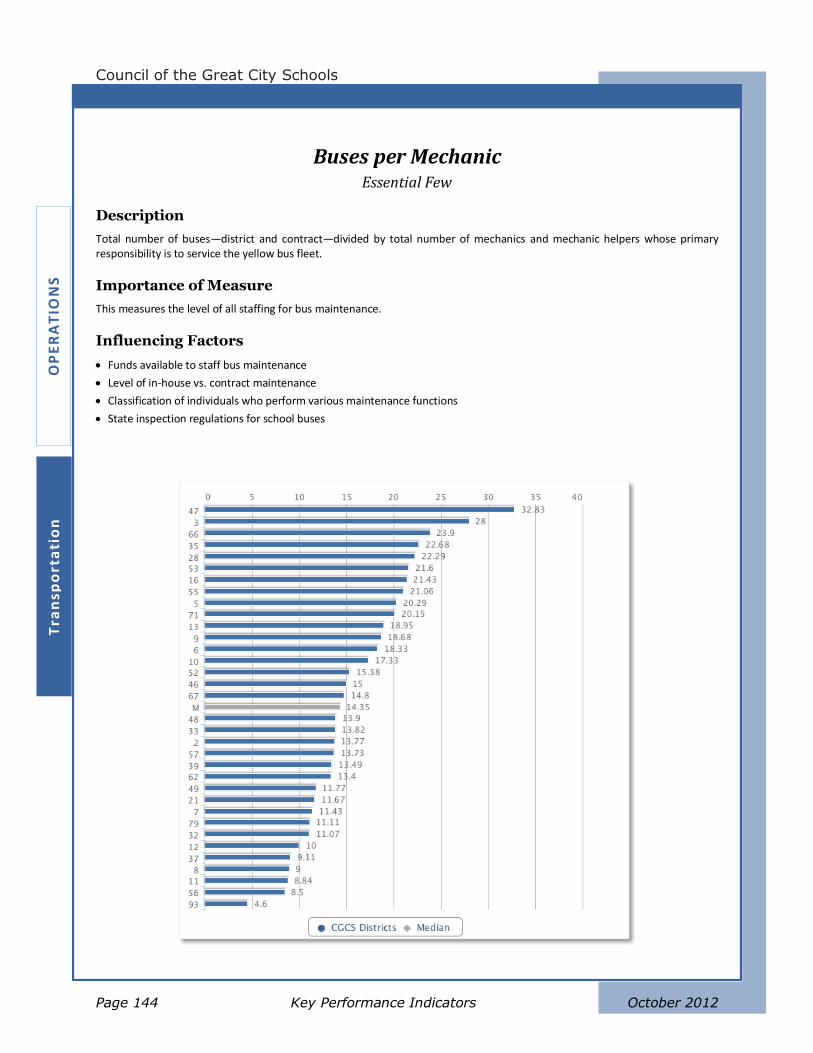
Council of the Great City Schools
Page 144 Key Performance Indicators October 2012
OP
ER
AT
ION
S
Tra
nsp
ort
ati
on
Buses per Mechanic Essential Few
Description
Total number of buses—district and contract—divided by total number of mechanics and mechanic helpers whose primary responsibility is to service the yellow bus fleet.
Importance of Measure
This measures the level of all staffing for bus maintenance.
Influencing Factors
Funds available to staff bus maintenance
Level of in-house vs. contract maintenance
Classification of individuals who perform various maintenance functions
State inspection regulations for school buses
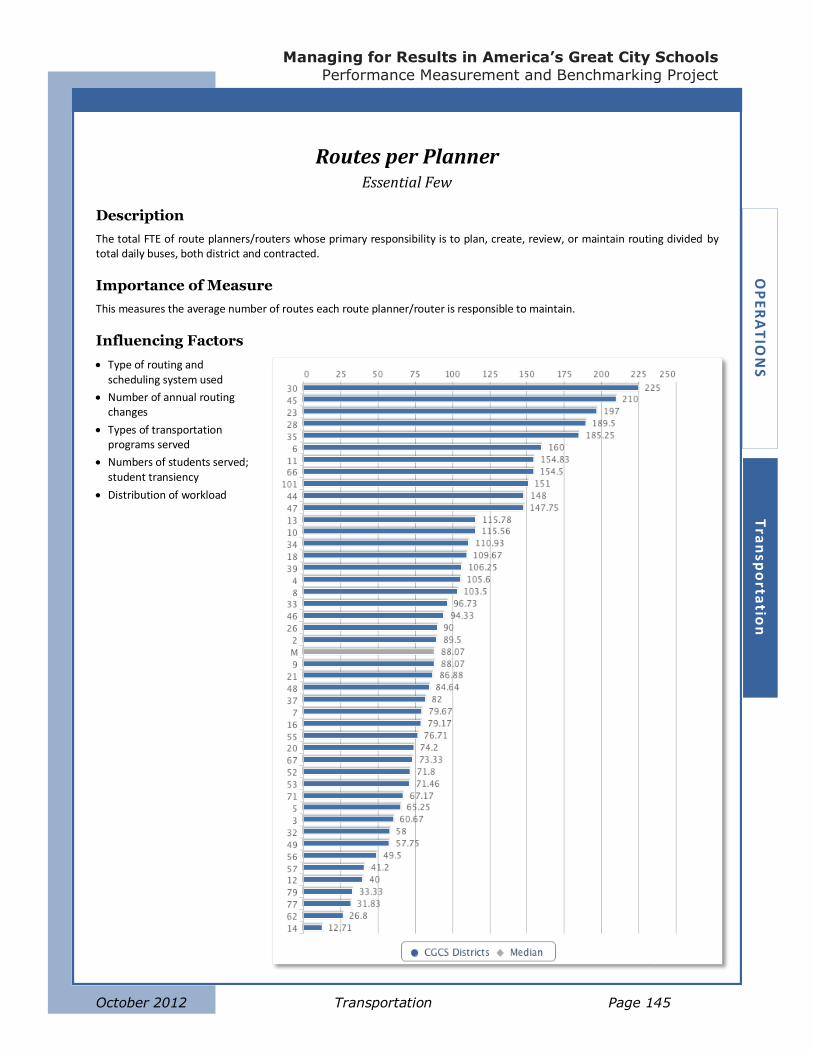
Managing for Results in America’s Great City Schools
Performance Measurement and Benchmarking Project
October 2012 Transportation Page 145
OP
ER
AT
ION
S
Tra
nsp
orta
tion
Routes per Planner Essential Few
Description
The total FTE of route planners/routers whose primary responsibility is to plan, create, review, or maintain routing divided by total daily buses, both district and contracted.
Importance of Measure
This measures the average number of routes each route planner/router is responsible to maintain.
Influencing Factors
Type of routing and scheduling system used
Number of annual routing changes
Types of transportation programs served
Numbers of students served; student transiency
Distribution of workload
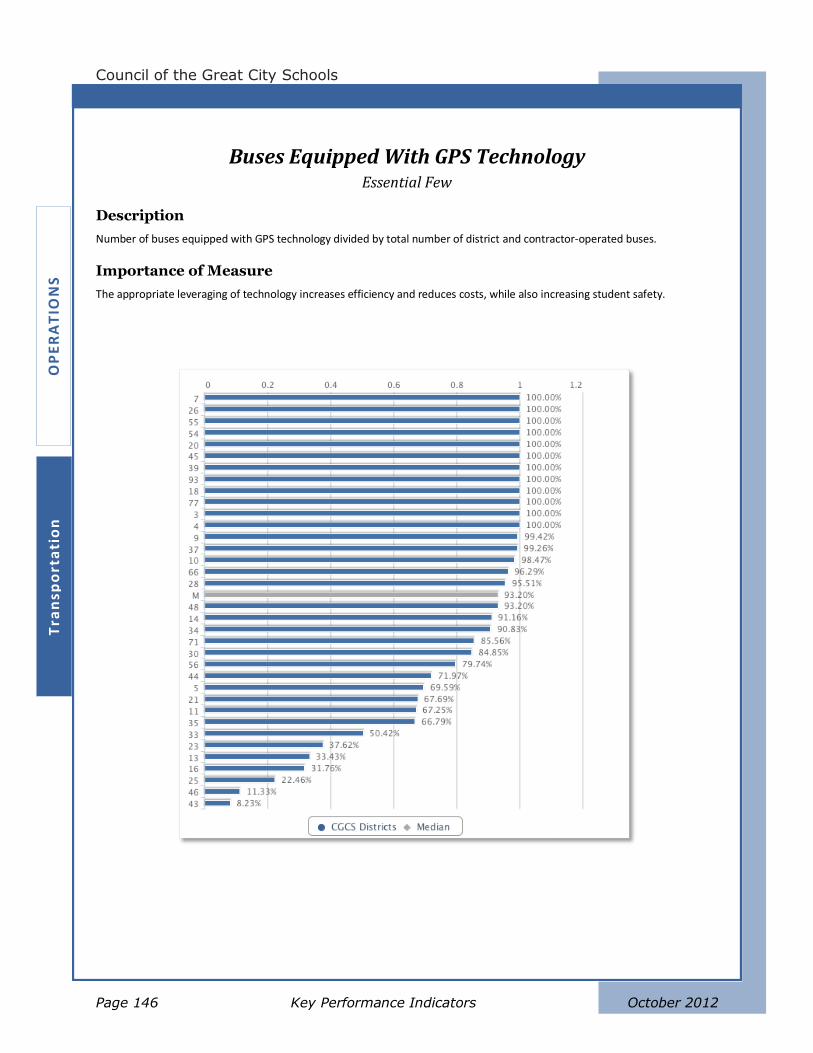
Council of the Great City Schools
Page 146 Key Performance Indicators October 2012
OP
ER
AT
ION
S
Tra
nsp
ort
ati
on
Buses Equipped With GPS Technology Essential Few
Description
Number of buses equipped with GPS technology divided by total number of district and contractor-operated buses.
Importance of Measure
The appropriate leveraging of technology increases efficiency and reduces costs, while also increasing student safety.
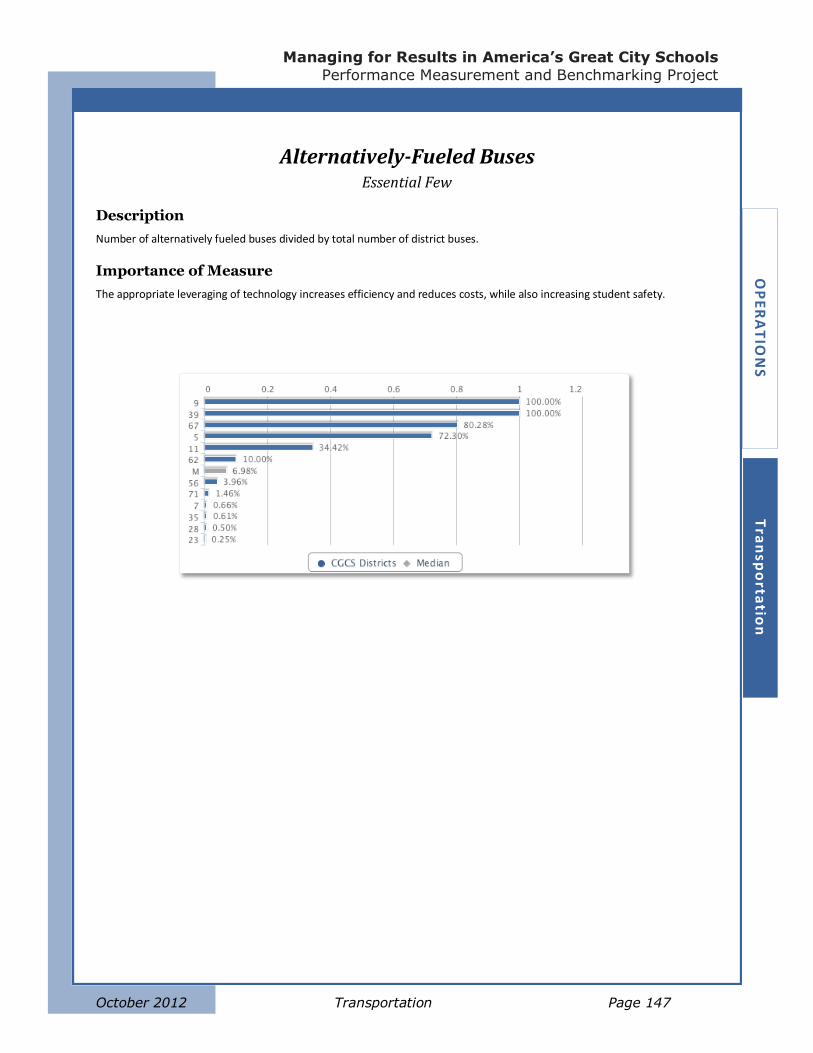
Managing for Results in America’s Great City Schools
Performance Measurement and Benchmarking Project
October 2012 Transportation Page 147
OP
ER
AT
ION
S
Tra
nsp
orta
tion
Alternatively-Fueled Buses Essential Few
Description
Number of alternatively fueled buses divided by total number of district buses.
Importance of Measure
The appropriate leveraging of technology increases efficiency and reduces costs, while also increasing student safety.
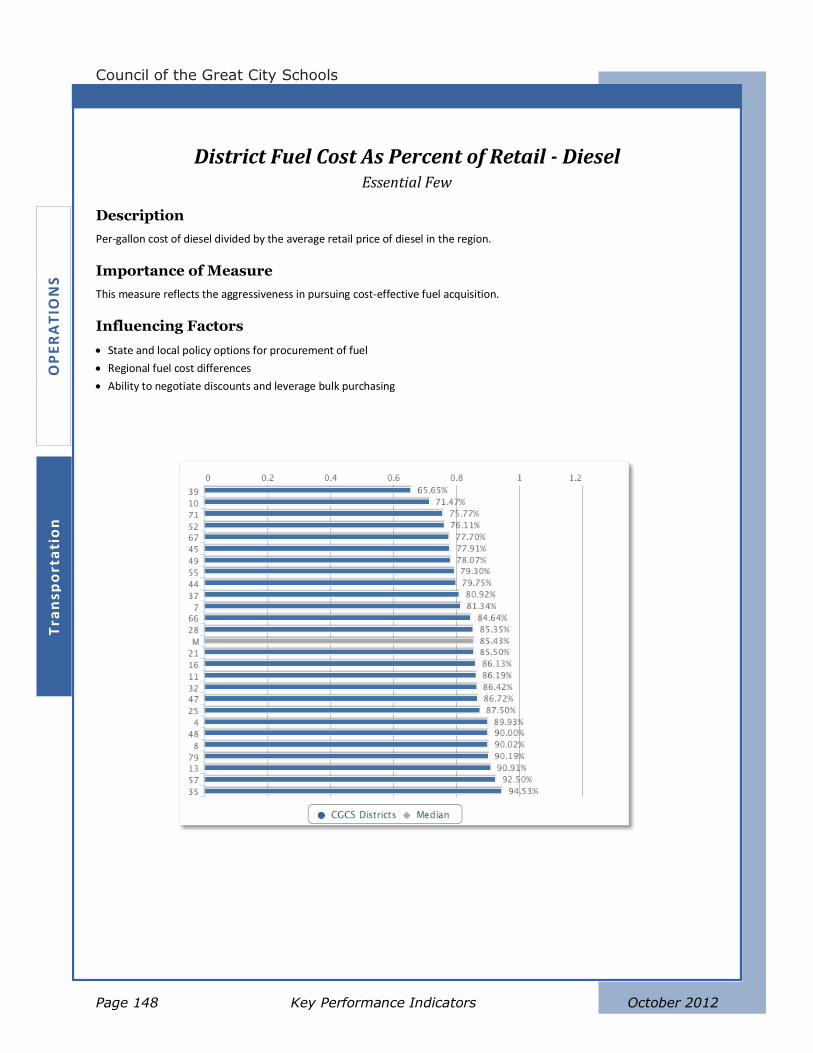
Council of the Great City Schools
Page 148 Key Performance Indicators October 2012
OP
ER
AT
ION
S
Tra
nsp
ort
ati
on
District Fuel Cost As Percent of Retail - Diesel Essential Few
Description
Per-gallon cost of diesel divided by the average retail price of diesel in the region.
Importance of Measure
This measure reflects the aggressiveness in pursuing cost-effective fuel acquisition.
Influencing Factors
State and local policy options for procurement of fuel
Regional fuel cost differences
Ability to negotiate discounts and leverage bulk purchasing
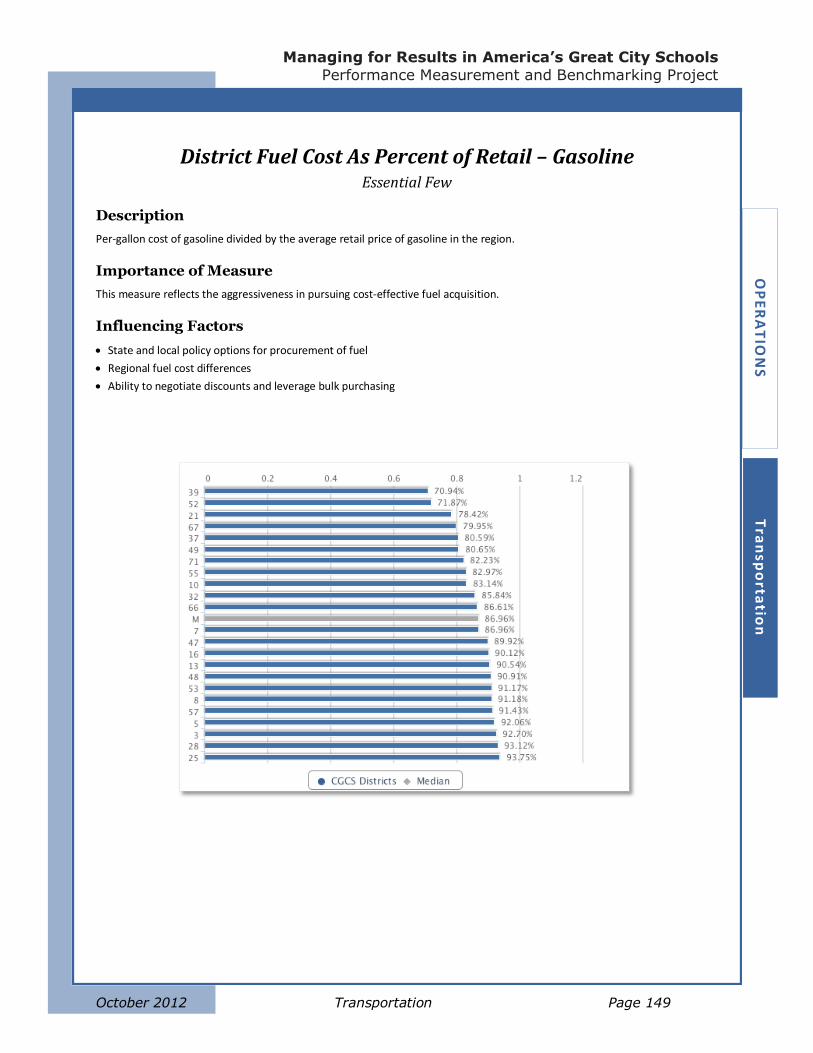
Managing for Results in America’s Great City Schools
Performance Measurement and Benchmarking Project
October 2012 Transportation Page 149
OP
ER
AT
ION
S
Tra
nsp
orta
tion
District Fuel Cost As Percent of Retail – Gasoline Essential Few
Description
Per-gallon cost of gasoline divided by the average retail price of gasoline in the region.
Importance of Measure
This measure reflects the aggressiveness in pursuing cost-effective fuel acquisition.
Influencing Factors
State and local policy options for procurement of fuel
Regional fuel cost differences
Ability to negotiate discounts and leverage bulk purchasing
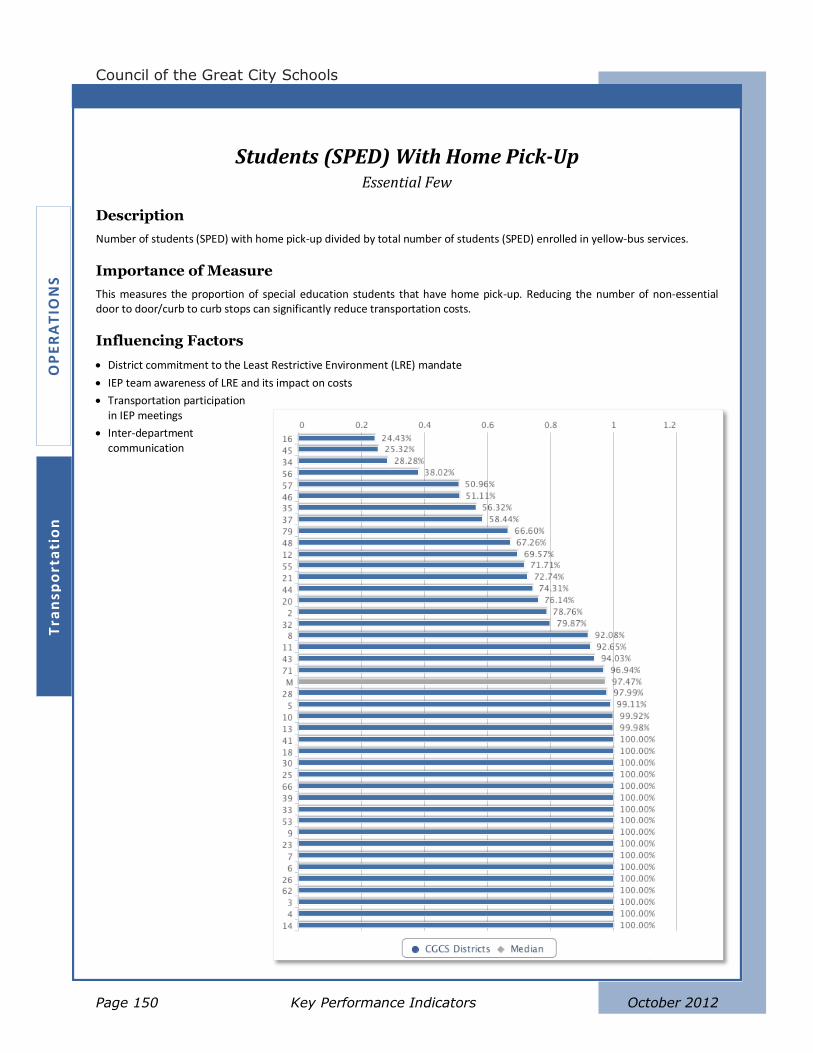
Council of the Great City Schools
Page 150 Key Performance Indicators October 2012
OP
ER
AT
ION
S
Tra
nsp
ort
ati
on
Students (SPED) With Home Pick-Up Essential Few
Description
Number of students (SPED) with home pick-up divided by total number of students (SPED) enrolled in yellow-bus services.
Importance of Measure
This measures the proportion of special education students that have home pick-up. Reducing the number of non-essential door to door/curb to curb stops can significantly reduce transportation costs.
Influencing Factors
District commitment to the Least Restrictive Environment (LRE) mandate
IEP team awareness of LRE and its impact on costs
Transportation participation in IEP meetings
Inter-department communication
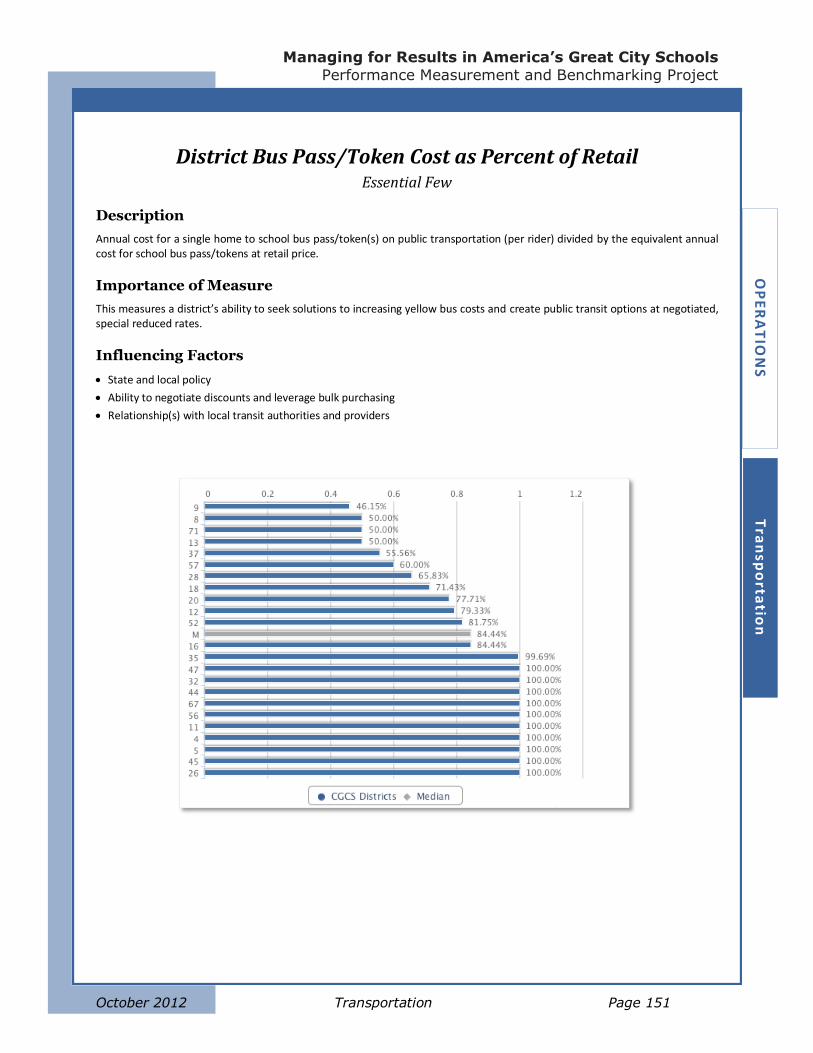
Managing for Results in America’s Great City Schools
Performance Measurement and Benchmarking Project
October 2012 Transportation Page 151
OP
ER
AT
ION
S
Tra
nsp
orta
tion
District Bus Pass/Token Cost as Percent of Retail Essential Few
Description
Annual cost for a single home to school bus pass/token(s) on public transportation (per rider) divided by the equivalent annual cost for school bus pass/tokens at retail price.
Importance of Measure
This measures a district’s ability to seek solutions to increasing yellow bus costs and create public transit options at negotiated, special reduced rates.
Influencing Factors
State and local policy
Ability to negotiate discounts and leverage bulk purchasing
Relationship(s) with local transit authorities and providers

Council of the Great City Schools
Page 152 Key Performance Indicators October 2012

Managing for results in America’s Great City Schools
Performance Measurement and Benchmarking Project
October 2012 Page 153
INFORMATION TECHNOLOGY

Council of the Great City Schools
Page 154 Key Performance Indicators October 2012

Managing for Results in America’s Great City Schools
Performance Measurement and Benchmarking Project
October 2012 Information Technology Page 155
Information Technology
Performance metrics in information technology (IT) assess the productivity, cost efficiency, and
service levels of the Information Technology Department. They generally fall under the following
categories:
a) Network services
b) Computers and devices
c) Help desk and break/fix technical support
d) Systems and software
Network-service measures examine such service-level indicators as Bandwidth per Student and
Number of Days Network Usage Exceeds 75% of Capacity and such cost-efficiency indicators as
Network (WAN) Cost per Student.
Measures of personal computers and devices include Average Age of Computers, which reflect
the refresh goals of a district, as well as Ratio of Students to Computers.
The cost effectiveness of technical support services such as the help desk and break/fix support
are measured by Help Desk Staffing Cost per Ticket and Support Tier 2/3 Staffing Costs per
Ticket.
Finally, the performance of systems and software is measured, in part, by the downtime of these
systems, as high rates of interruption are likely to adversely affect district end-users.
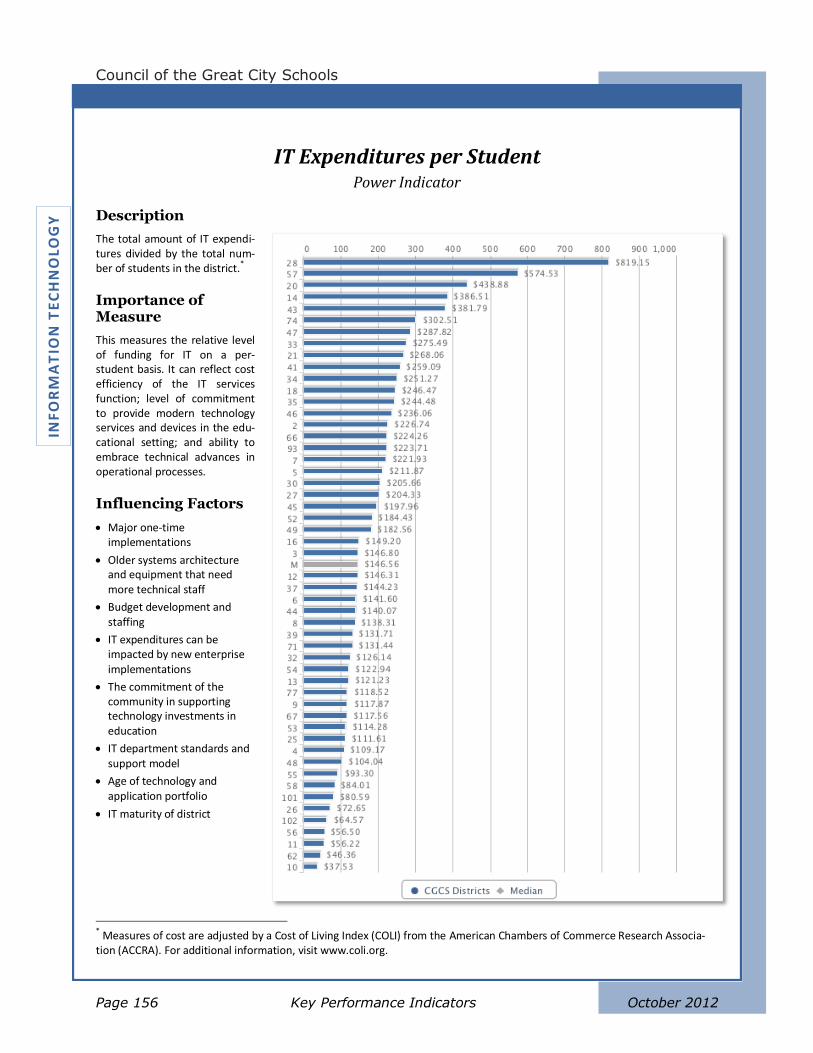
Council of the Great City Schools
Page 156 Key Performance Indicators October 2012
INF
OR
MA
TIO
N T
EC
HN
OLO
GY
IT Expenditures per Student Power Indicator
Description
The total amount of IT expendi-tures divided by the total num-ber of students in the district.*
Importance of Measure
This measures the relative level of funding for IT on a per-student basis. It can reflect cost efficiency of the IT services function; level of commitment to provide modern technology services and devices in the edu-cational setting; and ability to embrace technical advances in operational processes.
Influencing Factors
Major one-time implementations
Older systems architecture and equipment that need more technical staff
Budget development and staffing
IT expenditures can be impacted by new enterprise implementations
The commitment of the community in supporting technology investments in education
IT department standards and support model
Age of technology and application portfolio
IT maturity of district
* Measures of cost are adjusted by a Cost of Living Index (COLI) from the American Chambers of Commerce Research Associa-tion (ACCRA). For additional information, visit www.coli.org.
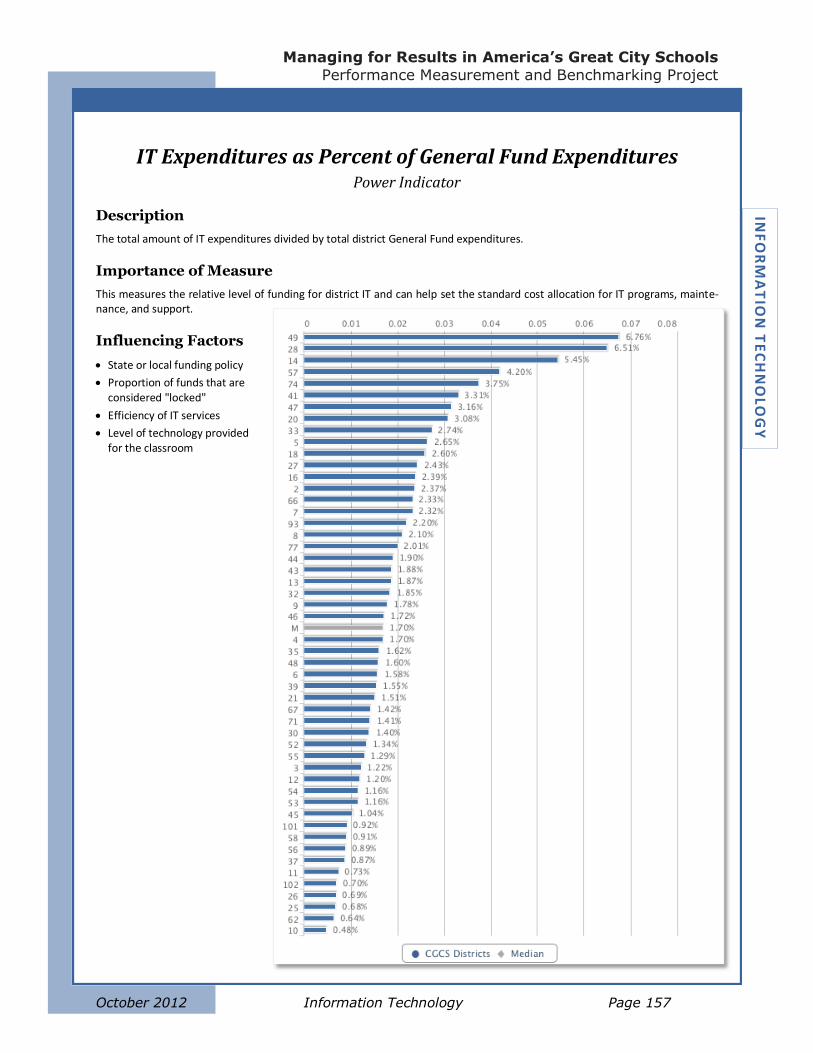
Managing for Results in America’s Great City Schools
Performance Measurement and Benchmarking Project
October 2012 Information Technology Page 157
INF
OR
MA
TIO
N T
EC
HN
OLO
GY
IT Expenditures as Percent of General Fund Expenditures Power Indicator
Description
The total amount of IT expenditures divided by total district General Fund expenditures.
Importance of Measure
This measures the relative level of funding for district IT and can help set the standard cost allocation for IT programs, mainte-nance, and support.
Influencing Factors
State or local funding policy
Proportion of funds that are considered "locked"
Efficiency of IT services
Level of technology provided for the classroom
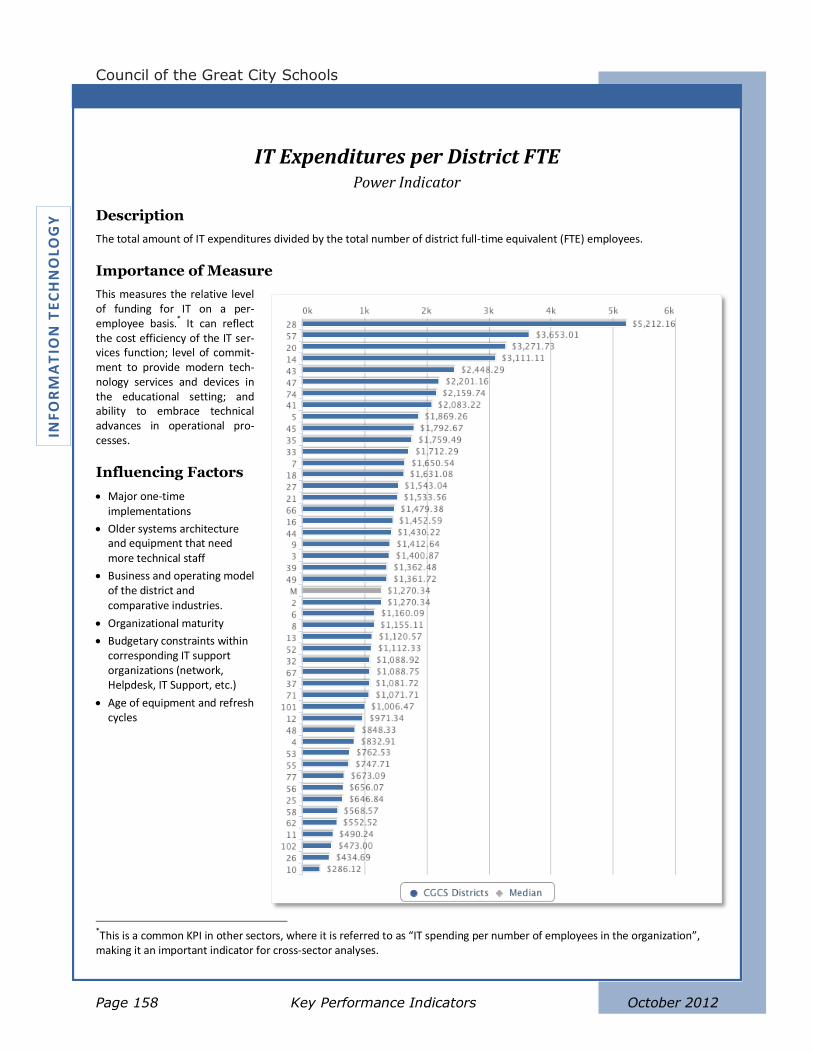
Council of the Great City Schools
Page 158 Key Performance Indicators October 2012
INF
OR
MA
TIO
N T
EC
HN
OLO
GY
IT Expenditures per District FTE Power Indicator
Description
The total amount of IT expenditures divided by the total number of district full-time equivalent (FTE) employees.
Importance of Measure
This measures the relative level of funding for IT on a per-employee basis.* It can reflect the cost efficiency of the IT ser-vices function; level of commit-ment to provide modern tech-nology services and devices in the educational setting; and ability to embrace technical advances in operational pro-cesses.
Influencing Factors
Major one-time implementations
Older systems architecture and equipment that need more technical staff
Business and operating model of the district and comparative industries.
Organizational maturity
Budgetary constraints within corresponding IT support organizations (network, Helpdesk, IT Support, etc.)
Age of equipment and refresh cycles
*This is a common KPI in other sectors, where it is referred to as “IT spending per number of employees in the organization”, making it an important indicator for cross-sector analyses.
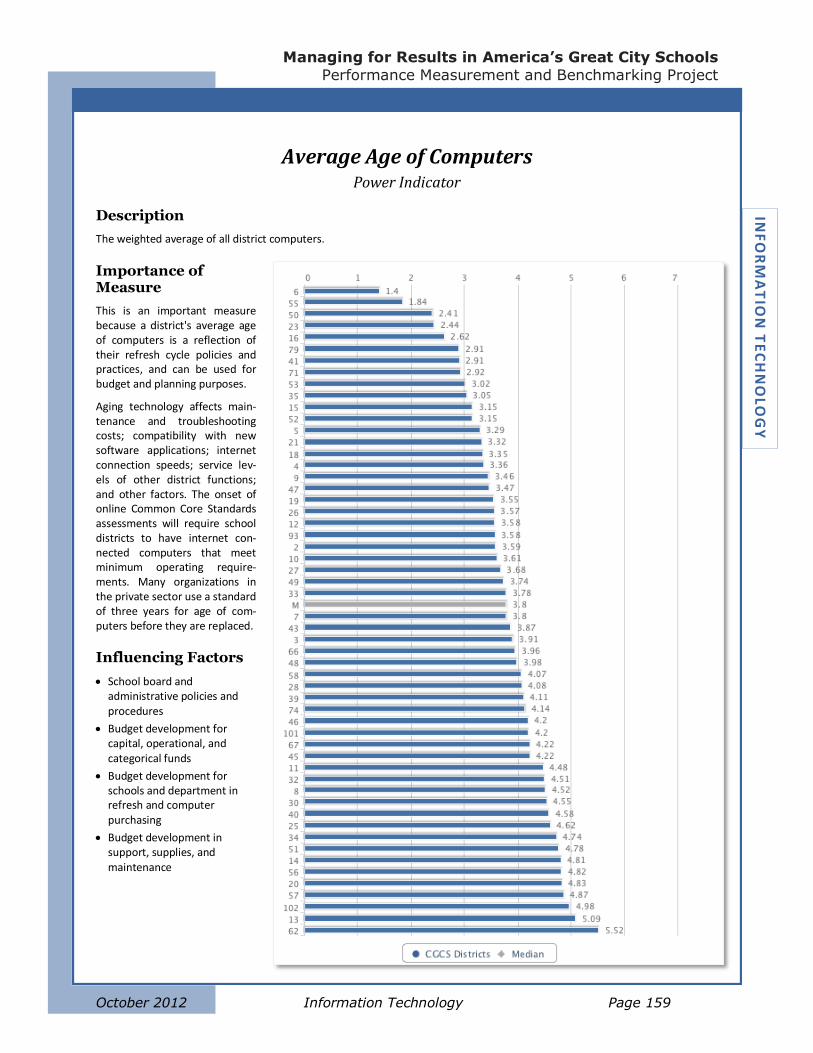
Managing for Results in America’s Great City Schools
Performance Measurement and Benchmarking Project
October 2012 Information Technology Page 159
INF
OR
MA
TIO
N T
EC
HN
OLO
GY
Average Age of Computers Power Indicator
Description
The weighted average of all district computers.
Importance of Measure
This is an important measure because a district's average age of computers is a reflection of their refresh cycle policies and practices, and can be used for budget and planning purposes.
Aging technology affects main-tenance and troubleshooting costs; compatibility with new software applications; internet connection speeds; service lev-els of other district functions; and other factors. The onset of online Common Core Standards assessments will require school districts to have internet con-nected computers that meet minimum operating require-ments. Many organizations in the private sector use a standard of three years for age of com-puters before they are replaced.
Influencing Factors
School board and administrative policies and procedures
Budget development for capital, operational, and categorical funds
Budget development for schools and department in refresh and computer purchasing
Budget development in support, supplies, and maintenance
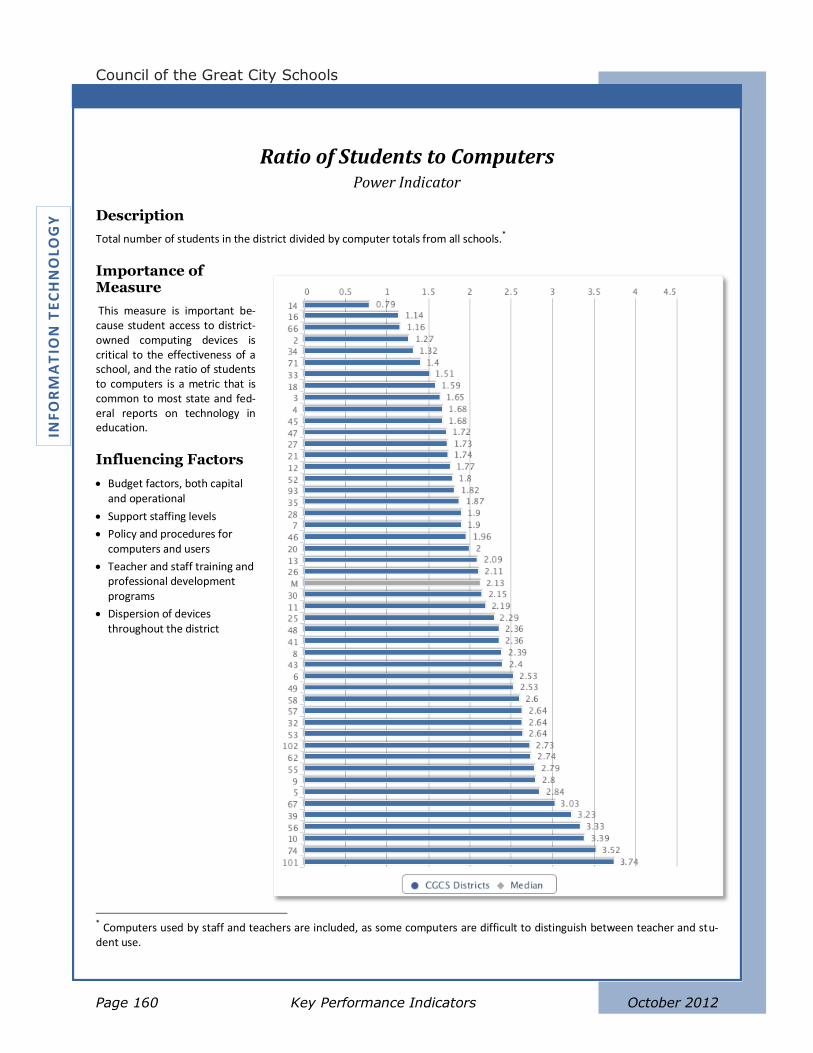
Council of the Great City Schools
Page 160 Key Performance Indicators October 2012
INF
OR
MA
TIO
N T
EC
HN
OLO
GY
Ratio of Students to Computers Power Indicator
Description
Total number of students in the district divided by computer totals from all schools.*
Importance of Measure
This measure is important be-cause student access to district-owned computing devices is critical to the effectiveness of a school, and the ratio of students to computers is a metric that is common to most state and fed-eral reports on technology in education.
Influencing Factors
Budget factors, both capital and operational
Support staffing levels
Policy and procedures for computers and users
Teacher and staff training and professional development programs
Dispersion of devices throughout the district
* Computers used by staff and teachers are included, as some computers are difficult to distinguish between teacher and stu-dent use.
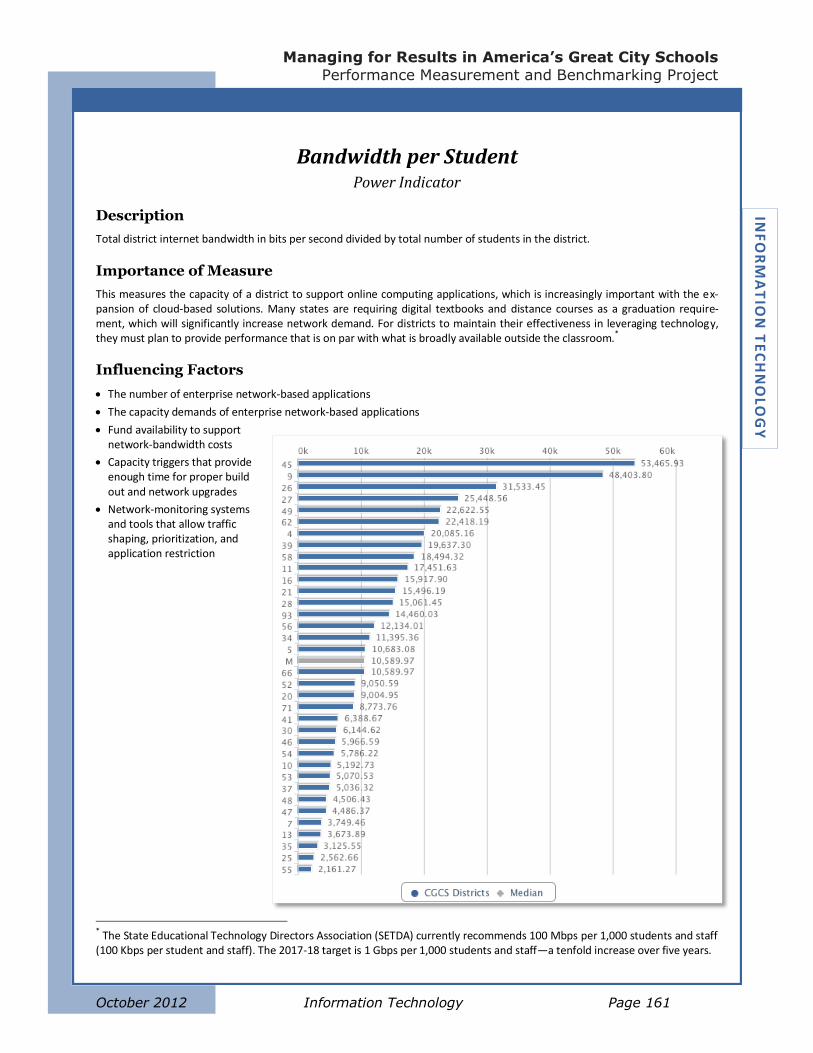
Managing for Results in America’s Great City Schools
Performance Measurement and Benchmarking Project
October 2012 Information Technology Page 161
INF
OR
MA
TIO
N T
EC
HN
OLO
GY
Bandwidth per Student Power Indicator
Description
Total district internet bandwidth in bits per second divided by total number of students in the district.
Importance of Measure
This measures the capacity of a district to support online computing applications, which is increasingly important with the ex-pansion of cloud-based solutions. Many states are requiring digital textbooks and distance courses as a graduation require-ment, which will significantly increase network demand. For districts to maintain their effectiveness in leveraging technology, they must plan to provide performance that is on par with what is broadly available outside the classroom.*
Influencing Factors
The number of enterprise network-based applications
The capacity demands of enterprise network-based applications
Fund availability to support network-bandwidth costs
Capacity triggers that provide enough time for proper build out and network upgrades
Network-monitoring systems and tools that allow traffic shaping, prioritization, and application restriction
* The State Educational Technology Directors Association (SETDA) currently recommends 100 Mbps per 1,000 students and staff (100 Kbps per student and staff). The 2017-18 target is 1 Gbps per 1,000 students and staff—a tenfold increase over five years.
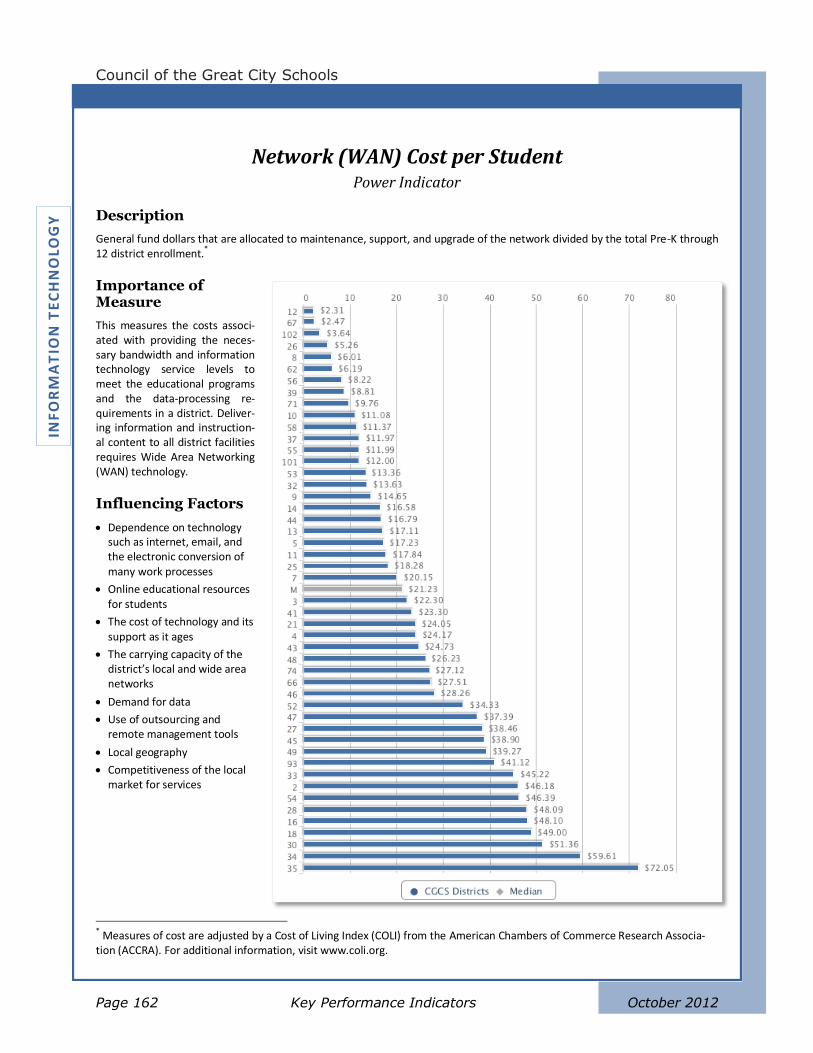
Council of the Great City Schools
Page 162 Key Performance Indicators October 2012
INF
OR
MA
TIO
N T
EC
HN
OLO
GY
Network (WAN) Cost per Student Power Indicator
Description
General fund dollars that are allocated to maintenance, support, and upgrade of the network divided by the total Pre-K through 12 district enrollment.
*
Importance of Measure
This measures the costs associ-ated with providing the neces-sary bandwidth and information technology service levels to meet the educational programs and the data-processing re-quirements in a district. Deliver-ing information and instruction-al content to all district facilities requires Wide Area Networking (WAN) technology.
Influencing Factors
Dependence on technology such as internet, email, and the electronic conversion of many work processes
Online educational resources for students
The cost of technology and its support as it ages
The carrying capacity of the district’s local and wide area networks
Demand for data
Use of outsourcing and remote management tools
Local geography
Competitiveness of the local market for services
* Measures of cost are adjusted by a Cost of Living Index (COLI) from the American Chambers of Commerce Research Associa-tion (ACCRA). For additional information, visit www.coli.org.
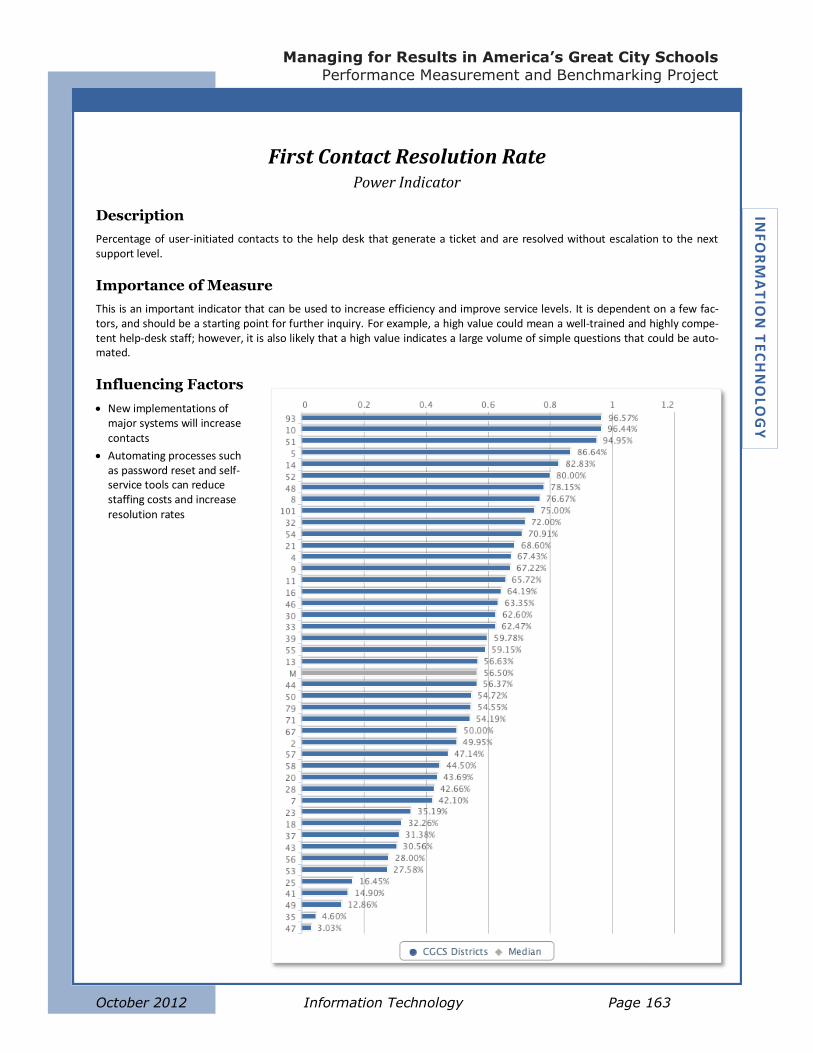
Managing for Results in America’s Great City Schools
Performance Measurement and Benchmarking Project
October 2012 Information Technology Page 163
INF
OR
MA
TIO
N T
EC
HN
OLO
GY
First Contact Resolution Rate Power Indicator
Description
Percentage of user-initiated contacts to the help desk that generate a ticket and are resolved without escalation to the next support level.
Importance of Measure
This is an important indicator that can be used to increase efficiency and improve service levels. It is dependent on a few fac-tors, and should be a starting point for further inquiry. For example, a high value could mean a well-trained and highly compe-tent help-desk staff; however, it is also likely that a high value indicates a large volume of simple questions that could be auto-mated.
Influencing Factors
New implementations of major systems will increase contacts
Automating processes such as password reset and self-service tools can reduce staffing costs and increase resolution rates
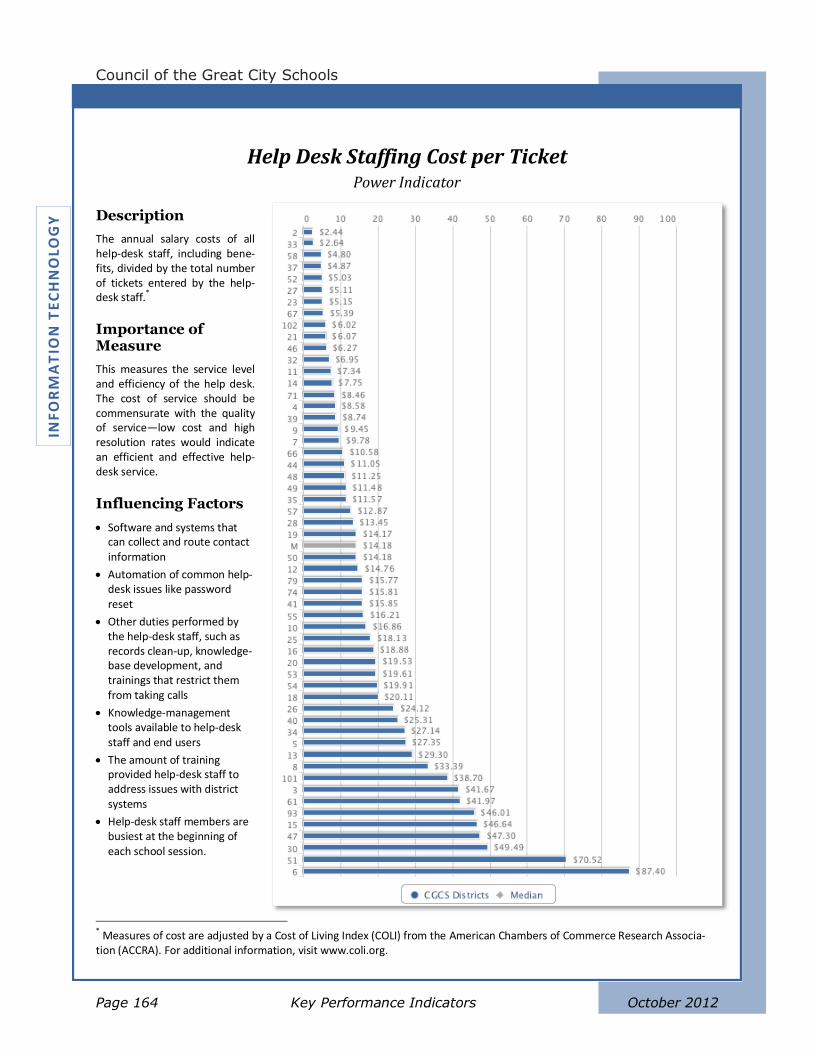
Council of the Great City Schools
Page 164 Key Performance Indicators October 2012
INF
OR
MA
TIO
N T
EC
HN
OLO
GY
Help Desk Staffing Cost per Ticket Power Indicator
Description
The annual salary costs of all help-desk staff, including bene-fits, divided by the total number of tickets entered by the help-desk staff.*
Importance of Measure
This measures the service level and efficiency of the help desk. The cost of service should be commensurate with the quality of service—low cost and high resolution rates would indicate an efficient and effective help-desk service.
Influencing Factors
Software and systems that can collect and route contact information
Automation of common help-desk issues like password reset
Other duties performed by the help-desk staff, such as records clean-up, knowledge-base development, and trainings that restrict them from taking calls
Knowledge-management tools available to help-desk staff and end users
The amount of training provided help-desk staff to address issues with district systems
Help-desk staff members are busiest at the beginning of each school session.
* Measures of cost are adjusted by a Cost of Living Index (COLI) from the American Chambers of Commerce Research Associa-tion (ACCRA). For additional information, visit www.coli.org.
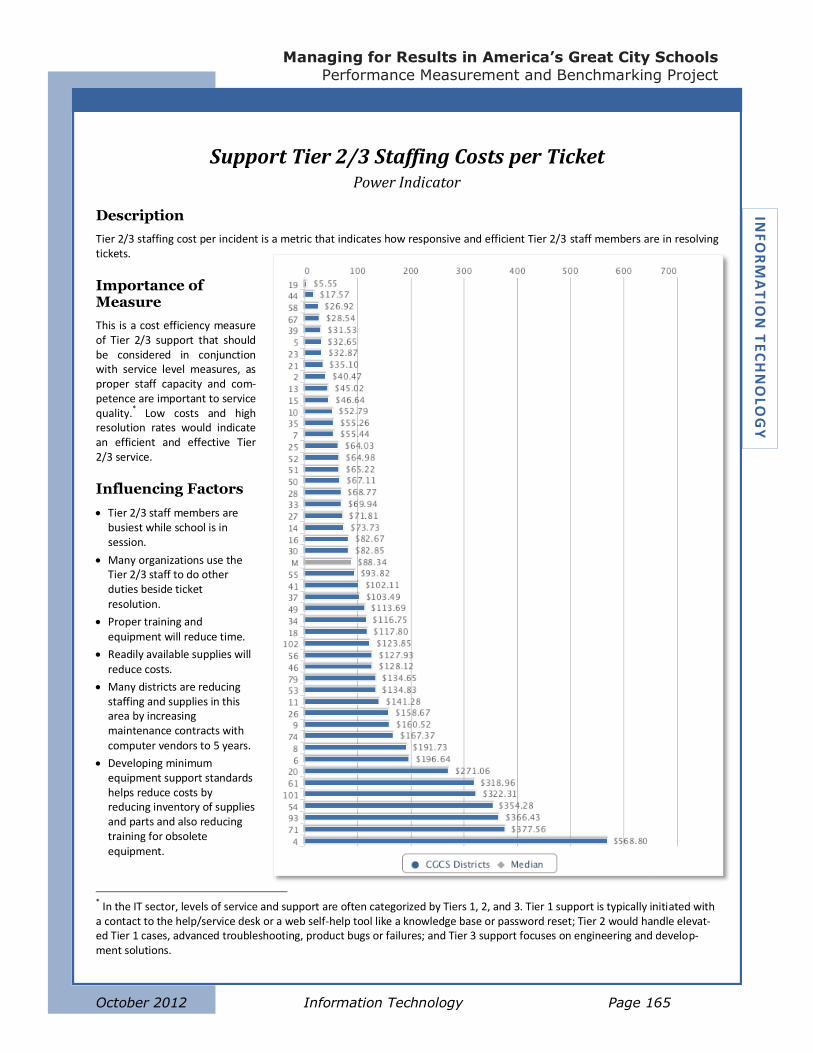
Managing for Results in America’s Great City Schools
Performance Measurement and Benchmarking Project
October 2012 Information Technology Page 165
INF
OR
MA
TIO
N T
EC
HN
OLO
GY
Support Tier 2/3 Staffing Costs per Ticket Power Indicator
Description
Tier 2/3 staffing cost per incident is a metric that indicates how responsive and efficient Tier 2/3 staff members are in resolving tickets.
Importance of Measure
This is a cost efficiency measure of Tier 2/3 support that should be considered in conjunction with service level measures, as proper staff capacity and com-petence are important to service quality.* Low costs and high resolution rates would indicate an efficient and effective Tier 2/3 service.
Influencing Factors
Tier 2/3 staff members are busiest while school is in session.
Many organizations use the Tier 2/3 staff to do other duties beside ticket resolution.
Proper training and equipment will reduce time.
Readily available supplies will reduce costs.
Many districts are reducing staffing and supplies in this area by increasing maintenance contracts with computer vendors to 5 years.
Developing minimum equipment support standards helps reduce costs by reducing inventory of supplies and parts and also reducing training for obsolete equipment.
* In the IT sector, levels of service and support are often categorized by Tiers 1, 2, and 3. Tier 1 support is typically initiated with a contact to the help/service desk or a web self-help tool like a knowledge base or password reset; Tier 2 would handle elevat-ed Tier 1 cases, advanced troubleshooting, product bugs or failures; and Tier 3 support focuses on engineering and develop-ment solutions.
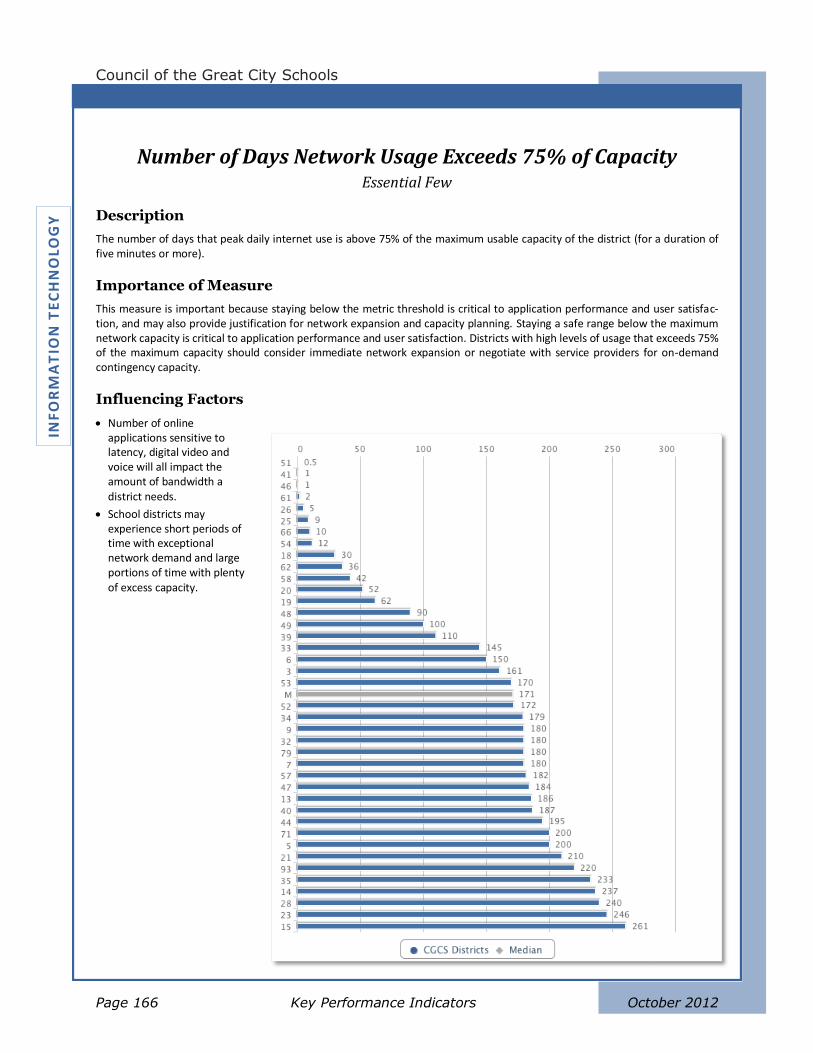
Council of the Great City Schools
Page 166 Key Performance Indicators October 2012
INF
OR
MA
TIO
N T
EC
HN
OLO
GY
Number of Days Network Usage Exceeds 75% of Capacity Essential Few
Description
The number of days that peak daily internet use is above 75% of the maximum usable capacity of the district (for a duration of five minutes or more).
Importance of Measure
This measure is important because staying below the metric threshold is critical to application performance and user satisfac-tion, and may also provide justification for network expansion and capacity planning. Staying a safe range below the maximum network capacity is critical to application performance and user satisfaction. Districts with high levels of usage that exceeds 75% of the maximum capacity should consider immediate network expansion or negotiate with service providers for on-demand contingency capacity.
Influencing Factors
Number of online applications sensitive to latency, digital video and voice will all impact the amount of bandwidth a district needs.
School districts may experience short periods of time with exceptional network demand and large portions of time with plenty of excess capacity.
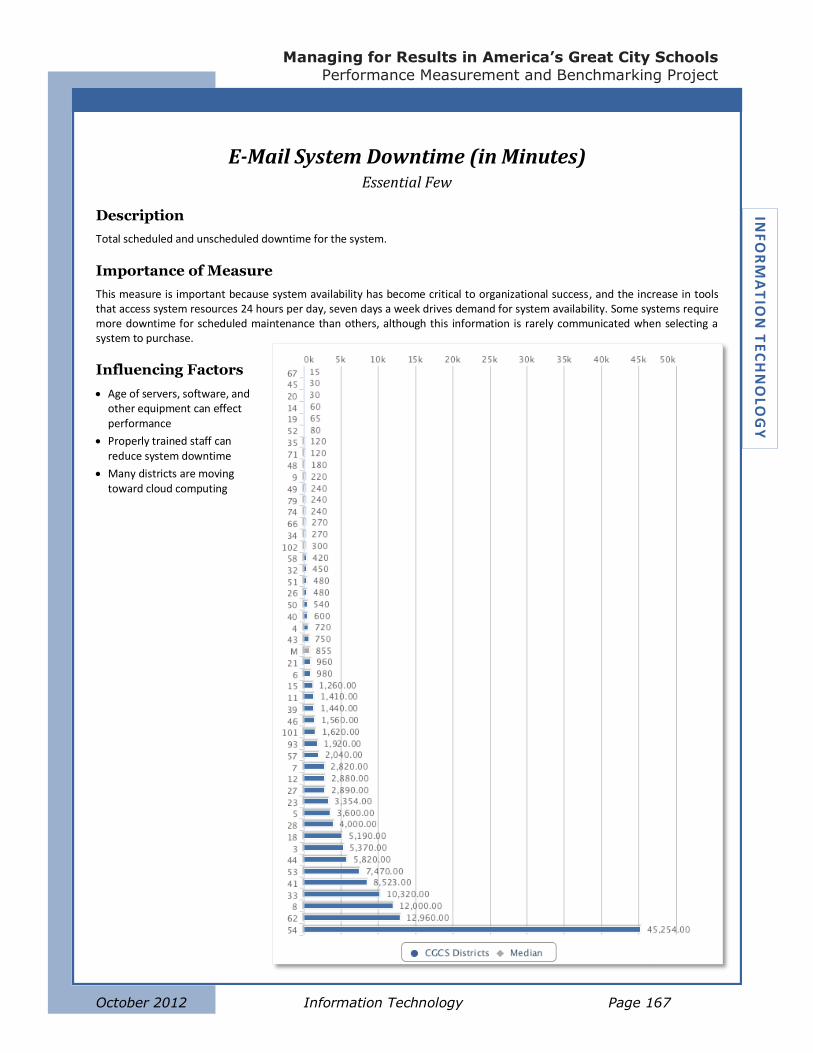
Managing for Results in America’s Great City Schools
Performance Measurement and Benchmarking Project
October 2012 Information Technology Page 167
INF
OR
MA
TIO
N T
EC
HN
OLO
GY
E-Mail System Downtime (in Minutes) Essential Few
Description
Total scheduled and unscheduled downtime for the system.
Importance of Measure
This measure is important because system availability has become critical to organizational success, and the increase in tools that access system resources 24 hours per day, seven days a week drives demand for system availability. Some systems require more downtime for scheduled maintenance than others, although this information is rarely communicated when selecting a system to purchase.
Influencing Factors
Age of servers, software, and other equipment can effect performance
Properly trained staff can reduce system downtime
Many districts are moving toward cloud computing
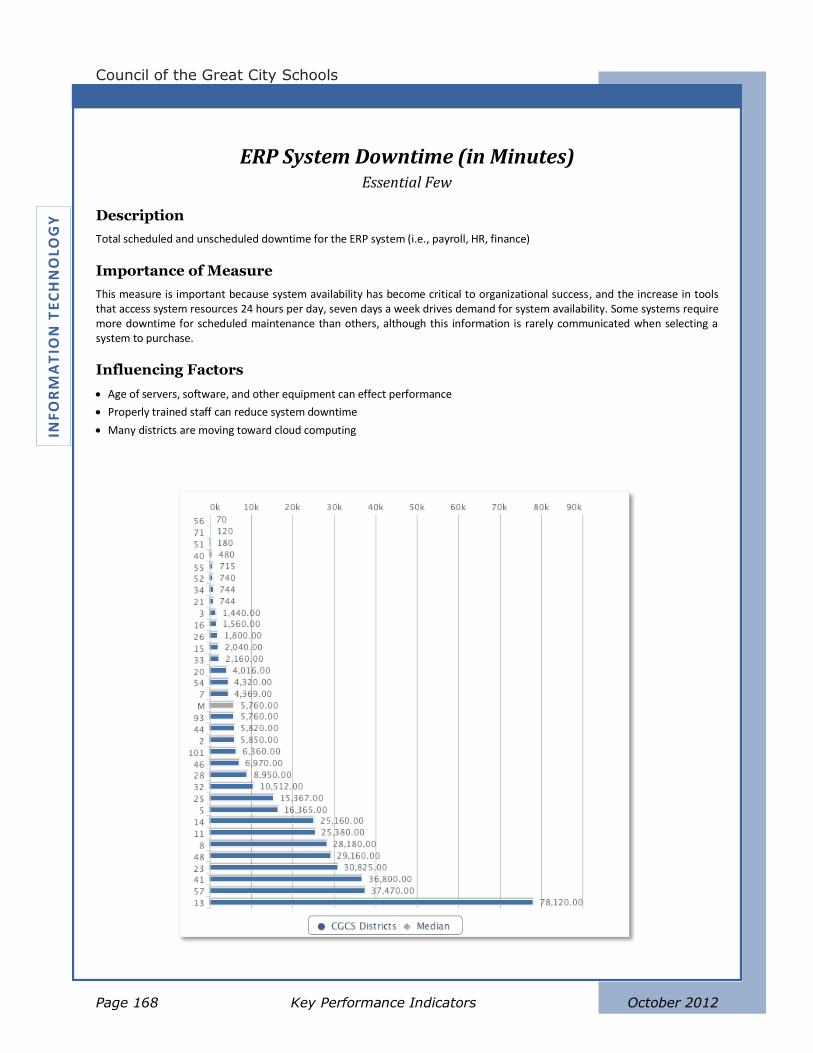
Council of the Great City Schools
Page 168 Key Performance Indicators October 2012
INF
OR
MA
TIO
N T
EC
HN
OLO
GY
ERP System Downtime (in Minutes) Essential Few
Description
Total scheduled and unscheduled downtime for the ERP system (i.e., payroll, HR, finance)
Importance of Measure
This measure is important because system availability has become critical to organizational success, and the increase in tools that access system resources 24 hours per day, seven days a week drives demand for system availability. Some systems require more downtime for scheduled maintenance than others, although this information is rarely communicated when selecting a system to purchase.
Influencing Factors
Age of servers, software, and other equipment can effect performance
Properly trained staff can reduce system downtime
Many districts are moving toward cloud computing
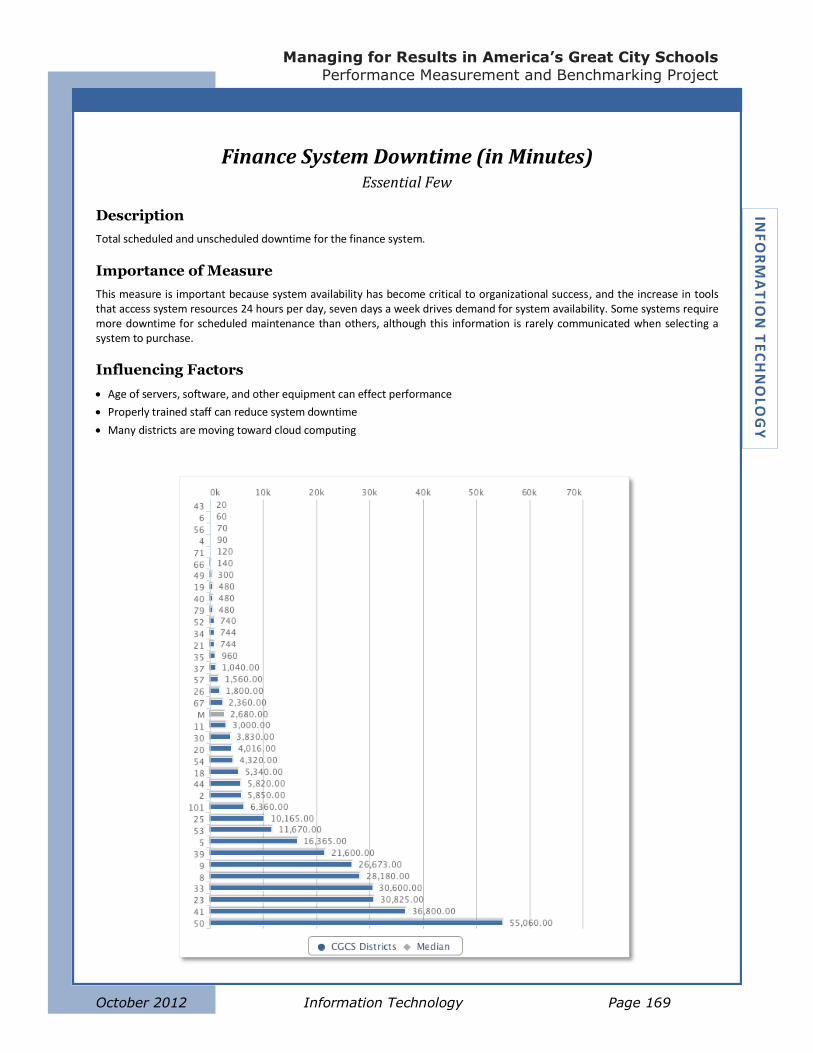
Managing for Results in America’s Great City Schools
Performance Measurement and Benchmarking Project
October 2012 Information Technology Page 169
INF
OR
MA
TIO
N T
EC
HN
OLO
GY
Finance System Downtime (in Minutes) Essential Few
Description
Total scheduled and unscheduled downtime for the finance system.
Importance of Measure
This measure is important because system availability has become critical to organizational success, and the increase in tools that access system resources 24 hours per day, seven days a week drives demand for system availability. Some systems require more downtime for scheduled maintenance than others, although this information is rarely communicated when selecting a system to purchase.
Influencing Factors
Age of servers, software, and other equipment can effect performance
Properly trained staff can reduce system downtime
Many districts are moving toward cloud computing
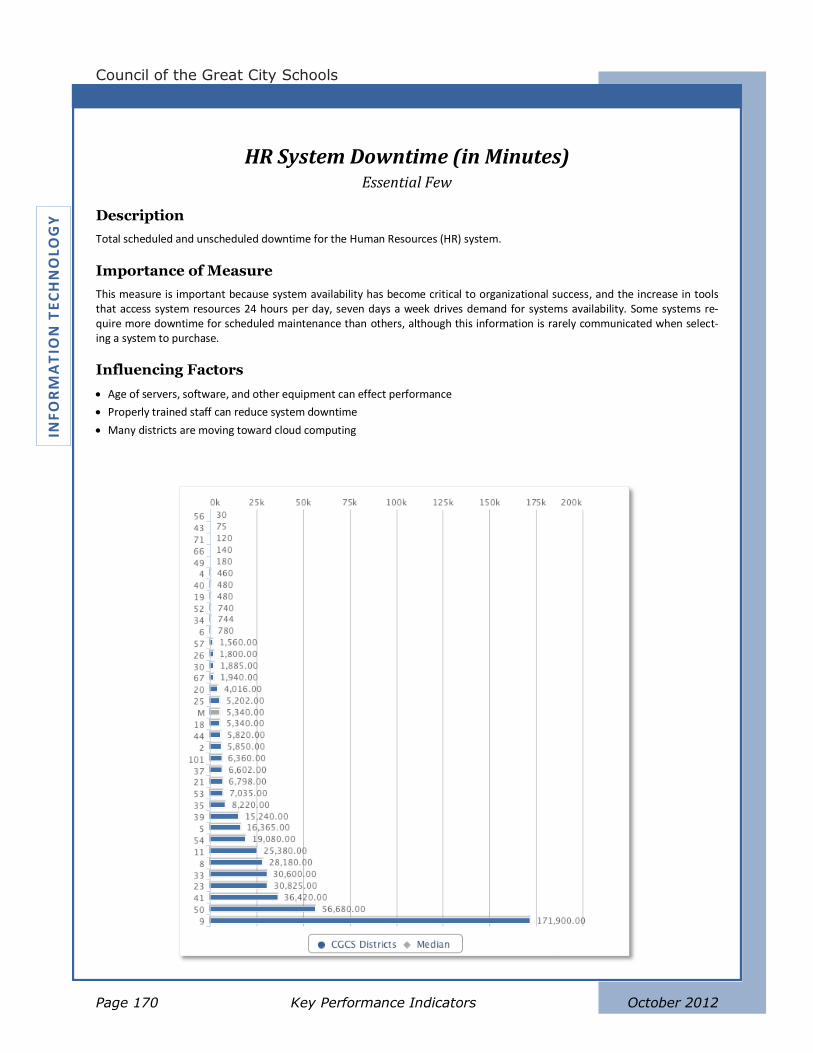
Council of the Great City Schools
Page 170 Key Performance Indicators October 2012
INF
OR
MA
TIO
N T
EC
HN
OLO
GY
HR System Downtime (in Minutes) Essential Few
Description
Total scheduled and unscheduled downtime for the Human Resources (HR) system.
Importance of Measure
This measure is important because system availability has become critical to organizational success, and the increase in tools that access system resources 24 hours per day, seven days a week drives demand for systems availability. Some systems re-quire more downtime for scheduled maintenance than others, although this information is rarely communicated when select-ing a system to purchase.
Influencing Factors
Age of servers, software, and other equipment can effect performance
Properly trained staff can reduce system downtime
Many districts are moving toward cloud computing

Managing for Results in America’s Great City Schools
Performance Measurement and Benchmarking Project
October 2012 Information Technology Page 171
INF
OR
MA
TIO
N T
EC
HN
OLO
GY
Payroll System Downtime (in Minutes) Essential Few
Description
Total scheduled and unscheduled downtime for the payroll system.
Importance of Measure
This measure is important because system availability has become critical to organizational success and the increase in tools that access system resources 24 hours per day, seven days a week drives demand for systems availability. Some systems re-quire more downtime for scheduled maintenance than others, although this information is rarely communicated when select-ing a system to purchase.
Influencing Factors
Age of servers, software, and other equipment can effect performance
Properly trained staff can reduce system downtime
Many districts are moving toward cloud computing
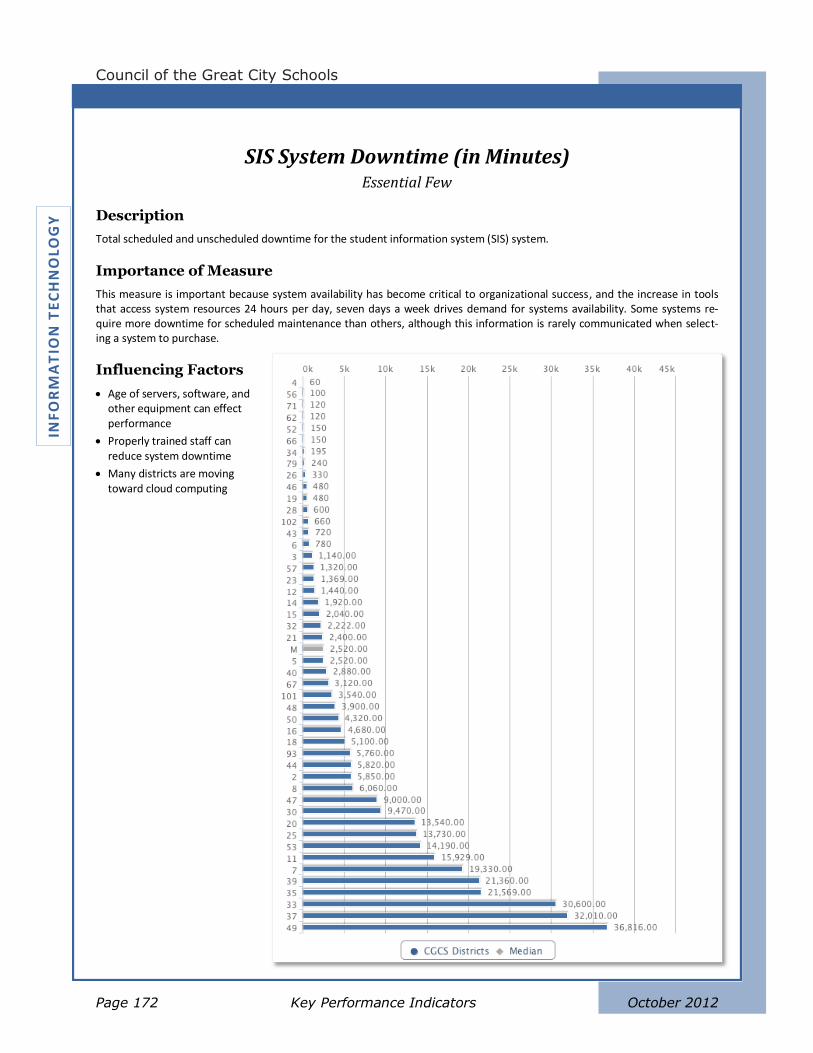
Council of the Great City Schools
Page 172 Key Performance Indicators October 2012
INF
OR
MA
TIO
N T
EC
HN
OLO
GY
SIS System Downtime (in Minutes) Essential Few
Description
Total scheduled and unscheduled downtime for the student information system (SIS) system.
Importance of Measure
This measure is important because system availability has become critical to organizational success, and the increase in tools that access system resources 24 hours per day, seven days a week drives demand for systems availability. Some systems re-quire more downtime for scheduled maintenance than others, although this information is rarely communicated when select-ing a system to purchase.
Influencing Factors
Age of servers, software, and other equipment can effect performance
Properly trained staff can reduce system downtime
Many districts are moving toward cloud computing
Managing for Results in America’s Great City Schools
Performance Measurement and Benchmarking Project
October 2012 Page 173
Appendices
z
Council of the Great City Schools
Page 174 Appendices October 2012
Managing for Results in America’s Great City Schools
Performance Measurement and Benchmarking Project
October 2012 The Performance Management System Page 175
The Performance Management
System
The Council has joined with TransACT Communications Inc. to automate the key performance indicators dis-
tricts can use to make rapid, high-value, high-impact decisions that “Move the Needle” on performance and
improve non-instructional operations in K–12 school districts.
The easy-to-use web-based performance management system (ActPoint® KPI) has multiple features that
include—
A fully-tested set of over 300 Key Performance Indicators (KPIs) designed by the Council of the Great City Schools and its members to report performance at three levels:
Strategic and policy level – Measures that can be reviewed by superintendents and school boards on a regular basis. Power indicators provide an important view of the overall performance of the non-instructional operations of school districts. The Power Indicators include 25 KPIs in Finance (includ-ing accounts payable, cash management, compensation, financial management, grants management, risk management and procurement); 23 KPIs in Operations (including food services, maintenance and operations, safety and security, and transportation); 10 KPIs in Information Technology (includ-ing general-technology information, help desk, and network operations); and 3 KPIs in Human Re-sources.
Management level – Measures that, along with the Power Indicators, can be regularly reviewed by chief executives to assess the performance of individual departments and divisions. The Essential Few Indicators include an additional 29 KPIs in Finance; 42 KPIs in Operations; 14 KPIs in Infor-mation Technology; and 4 KPIs Human Resources.
Technical level – Lower-level performance measures that can be regularly reviewed by department heads. These indicators are more likely to be “drivers” of performance of higher-level measures. The-se indicators include 72 KPIs in Finance; 107 KPIs in Operations; 4 KPIs in Information Technology; and 3 KPIs Human Resources.
The KPIs are presented with narratives that include metric definitions, why the measures are important, fac-tors that influence the measure and measure formulas. The narratives are intended to provide powerful guidance on each measure.
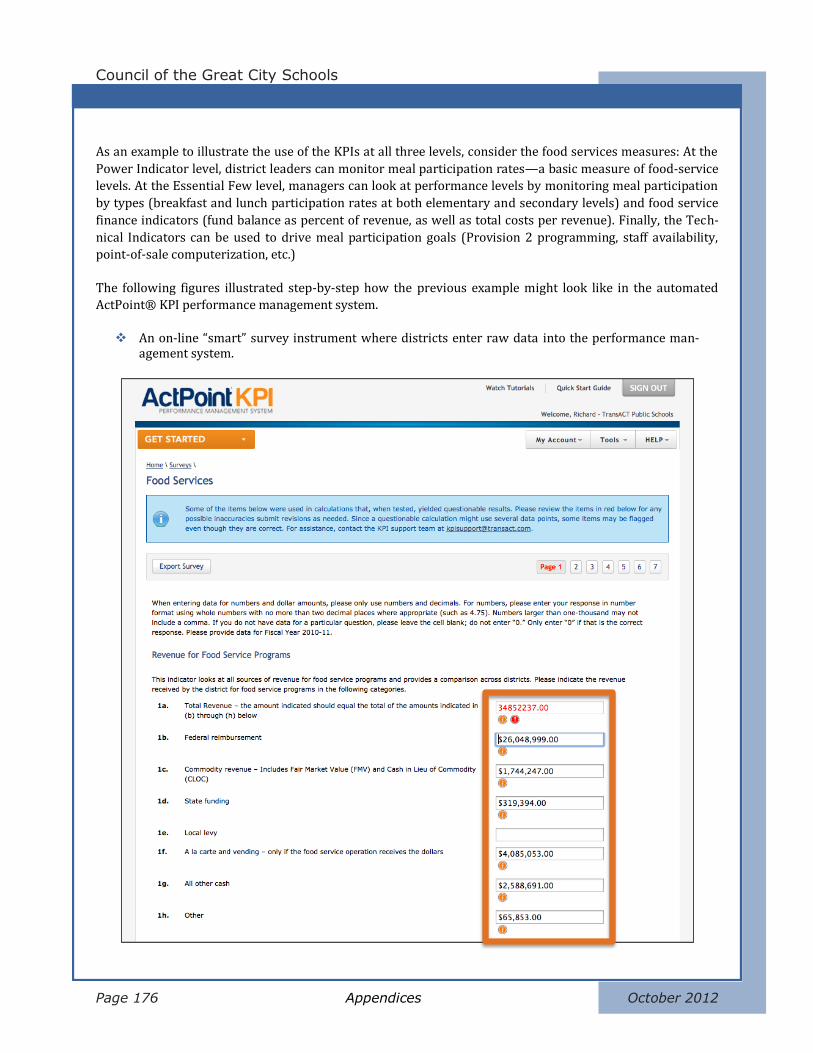
z
Council of the Great City Schools
Page 176 Appendices October 2012
As an example to illustrate the use of the KPIs at all three levels, consider the food services measures: At the
Power Indicator level, district leaders can monitor meal participation rates—a basic measure of food-service
levels. At the Essential Few level, managers can look at performance levels by monitoring meal participation
by types (breakfast and lunch participation rates at both elementary and secondary levels) and food service
finance indicators (fund balance as percent of revenue, as well as total costs per revenue). Finally, the Tech-
nical Indicators can be used to drive meal participation goals (Provision 2 programming, staff availability,
point-of-sale computerization, etc.)
The following figures illustrated step-by-step how the previous example might look like in the automated
ActPoint® KPI performance management system.
An on-line “smart” survey instrument where districts enter raw data into the performance man-agement system.
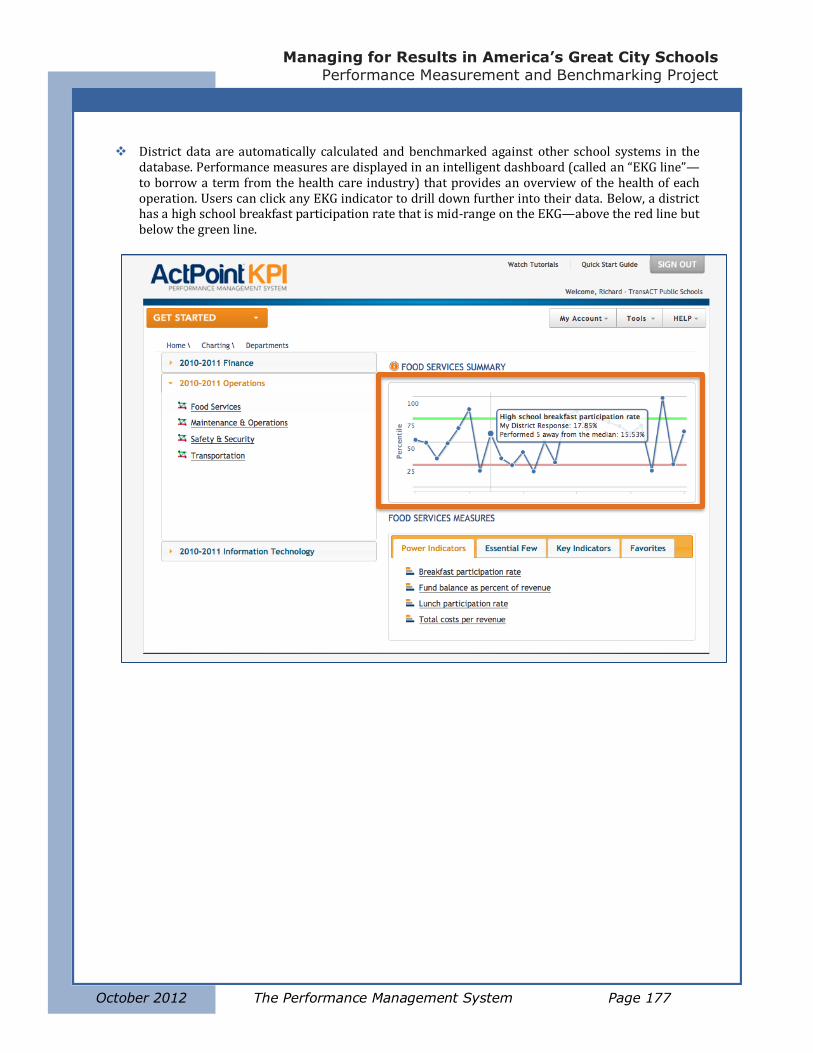
Managing for Results in America’s Great City Schools
Performance Measurement and Benchmarking Project
October 2012 The Performance Management System Page 177
District data are automatically calculated and benchmarked against other school systems in the database. Performance measures are displayed in an intelligent dashboard (called an “EKG line”—to borrow a term from the health care industry) that provides an overview of the health of each operation. Users can click any EKG indicator to drill down further into their data. Below, a district has a high school breakfast participation rate that is mid-range on the EKG—above the red line but below the green line.
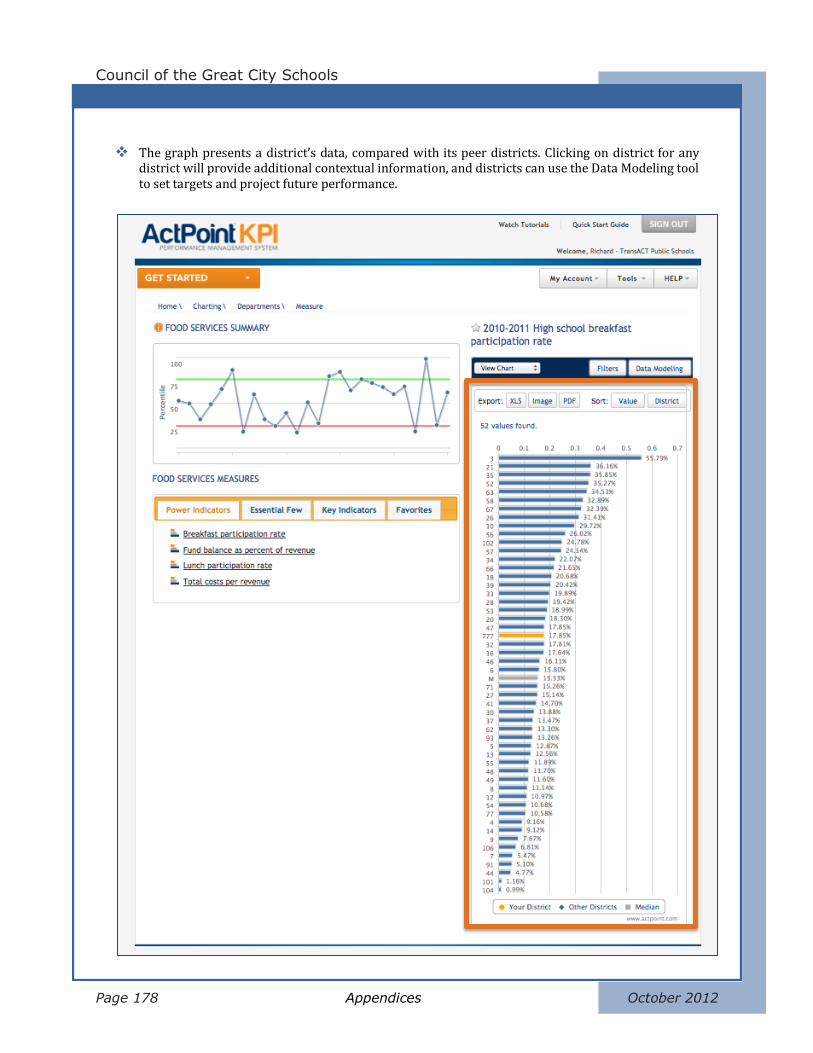
z
Council of the Great City Schools
Page 178 Appendices October 2012
The graph presents a district’s data, compared with its peer districts. Clicking on district for any district will provide additional contextual information, and districts can use the Data Modeling tool to set targets and project future performance.
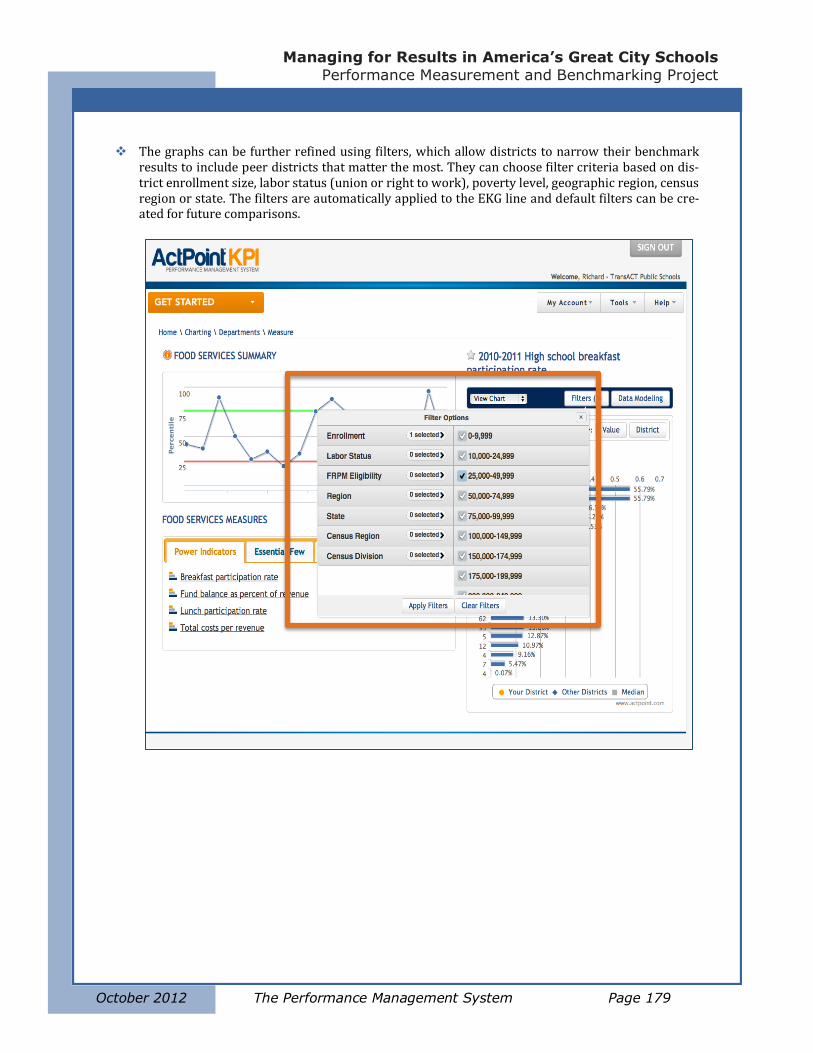
Managing for Results in America’s Great City Schools
Performance Measurement and Benchmarking Project
October 2012 The Performance Management System Page 179
The graphs can be further refined using filters, which allow districts to narrow their benchmark results to include peer districts that matter the most. They can choose filter criteria based on dis-trict enrollment size, labor status (union or right to work), poverty level, geographic region, census region or state. The filters are automatically applied to the EKG line and default filters can be cre-ated for future comparisons.
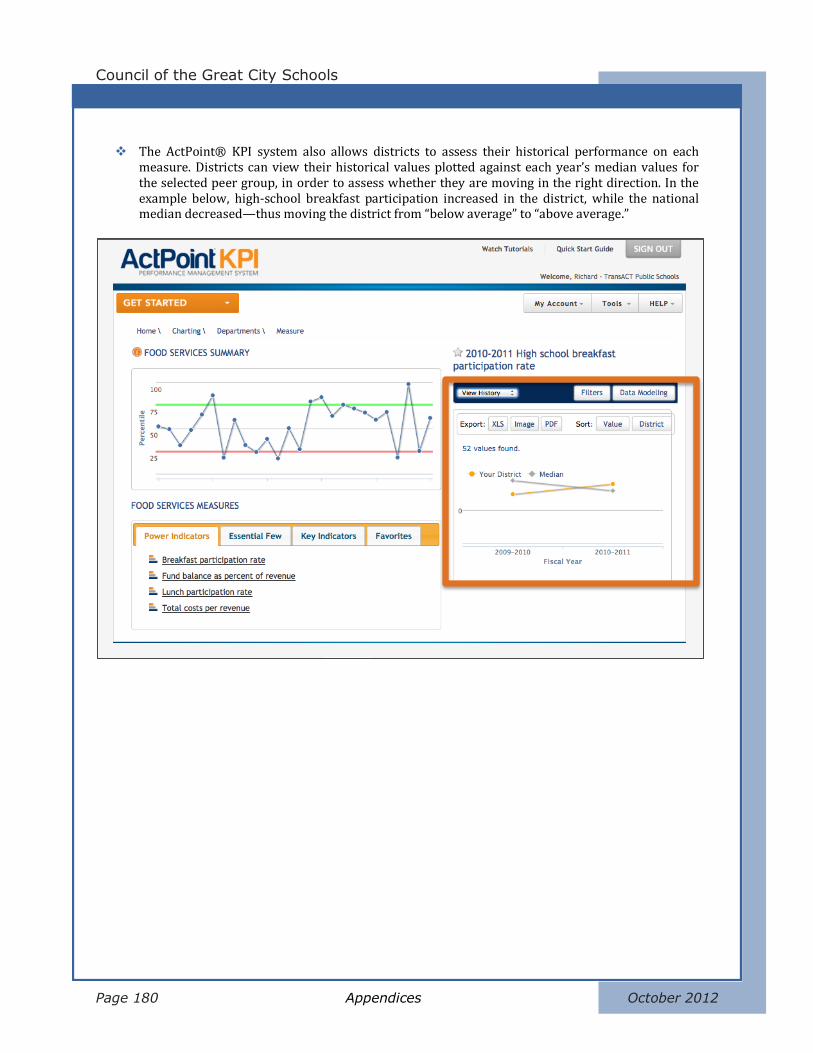
z
Council of the Great City Schools
Page 180 Appendices October 2012
The ActPoint® KPI system also allows districts to assess their historical performance on each measure. Districts can view their historical values plotted against each year’s median values for the selected peer group, in order to assess whether they are moving in the right direction. In the example below, high-school breakfast participation increased in the district, while the national median decreased—thus moving the district from “below average” to “above average.”
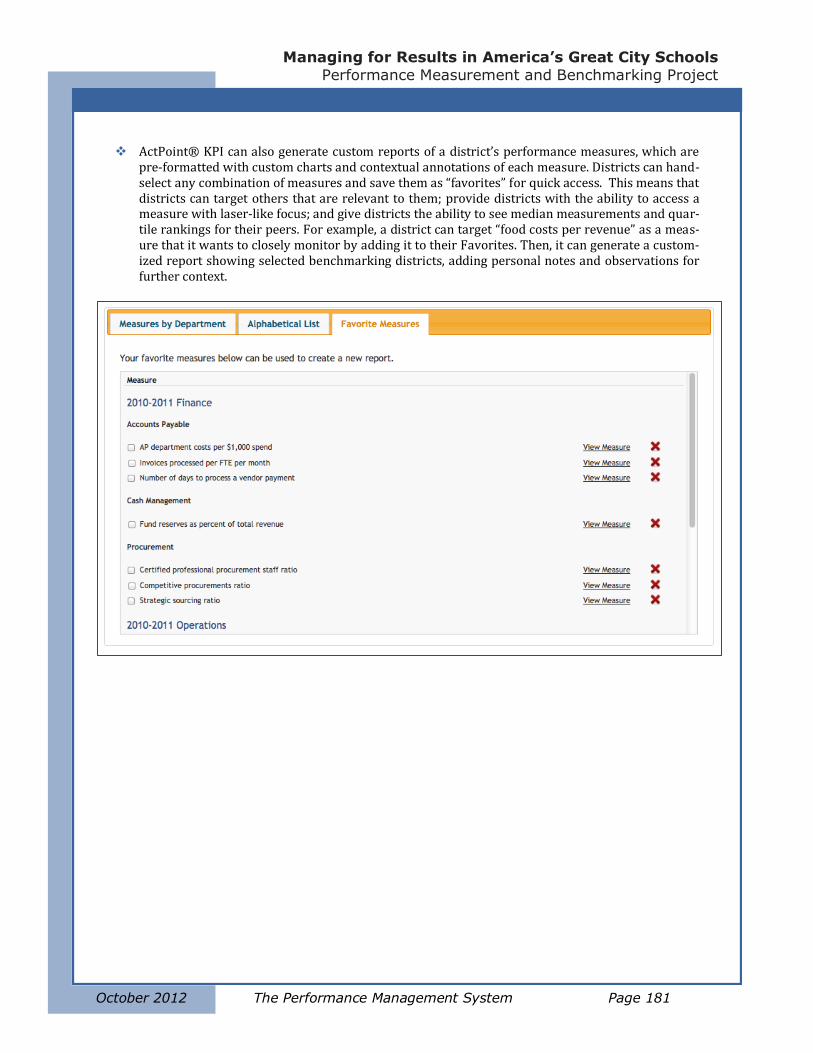
Managing for Results in America’s Great City Schools
Performance Measurement and Benchmarking Project
October 2012 The Performance Management System Page 181
ActPoint® KPI can also generate custom reports of a district’s performance measures, which are pre-formatted with custom charts and contextual annotations of each measure. Districts can hand-select any combination of measures and save them as “favorites” for quick access. This means that districts can target others that are relevant to them; provide districts with the ability to access a measure with laser-like focus; and give districts the ability to see median measurements and quar-tile rankings for their peers. For example, a district can target “food costs per revenue” as a meas-ure that it wants to closely monitor by adding it to their Favorites. Then, it can generate a custom-ized report showing selected benchmarking districts, adding personal notes and observations for further context.
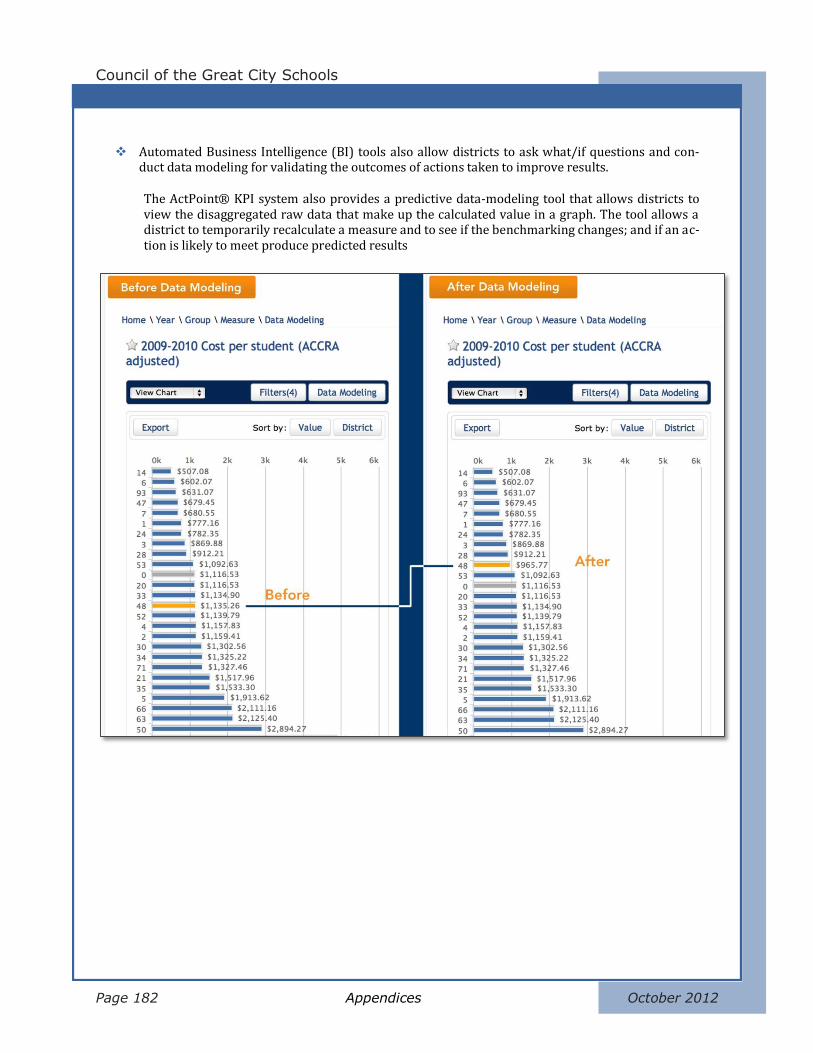
z
Council of the Great City Schools
Page 182 Appendices October 2012
Automated Business Intelligence (BI) tools also allow districts to ask what/if questions and con-duct data modeling for validating the outcomes of actions taken to improve results.
The ActPoint® KPI system also provides a predictive data-modeling tool that allows districts to view the disaggregated raw data that make up the calculated value in a graph. The tool allows a district to temporarily recalculate a measure and to see if the benchmarking changes; and if an ac-tion is likely to meet produce predicted results

Managing for Results in America’s Great City Schools
Performance Measurement and Benchmarking Project
October 2012 Page 183
Case Studies of Best Practices

z
Council of the Great City Schools
Page 184 Appendices – Case Studies of Best Practices October 2012

Managing for Results in America’s Great City Schools
Performance Measurement and Benchmarking Project
October 2012 Grants Management Page 185
C G C S C A S E S T U D Y
Grants Management Managing for Results in America’s Great City Schools:
A Case Study in Grants Management
October 2012
Aims and Objectives
As an industry, the business and operations components of K-12 edu-
cation have not historically operated with a common set of industry
standards for monitoring and benchmarking performance. The Council
of the Great City Schools addressed this need by initiating its Perfor-
mance Measurement and Benchmarking Project. The case study ele-
ment of the initiative is designed to answer the question, “What are
the effective management practices of top performing urban school
districts that allow them to run effective financial and business opera-
tions as measured by their Key Performance Indicators?” Once these
management practices are determined and documented, other districts across the nation can use them to analyze
and improve their practices. The intention is to increase collaboration between executives of top performing dis-
tricts and districts striving to improve their performance. Ultimately, this exchange should enable the industry to
build its knowledge about how large systems work and what it takes to improve them.
Key Performance Indicators for Grants Management
There are four key performance indicators (KPIs) that are considered to be “Power Indicators” and “Essential Few”
in the area of Grants Management. Additionally, there are six other basic KPIs shown below that help a district
assess its grants management operations.
Grant Spending Efficiency and Lost Grant Funds per $1M of Grant Revenue*
These KPIs assess efficiencies in spending appropriated grant funds by measuring the percentage of these re-
sources that are expended each school year, fiscal year or calendar year. A low percentage of grant spending or a
high percentage of unspent funds may indicate inefficient spending patterns. The factors that may influence these
* In previous years this Power Indicator was titled “Value of Unspent Funds Lost.” The indicator was changed to reflect the dif-ferences in the sizes of districts.
z
Council of the Great City Schools
Page 186 Appendices – Case Studies of Best Practices October 2012
measures include the timeliness of awards, administrative policies and procedures, budget development and man-
agement processes, monitoring and reporting systems, grant sources and program initiatives, and the complexity
of the grants.
Aging of Grants Receivables
This KPI assesses efficiencies in submitting grant-funded expenditures to the funding agencies or conversely effi-
ciencies in receiving reimbursements from the funding agencies on specified time intervals (in 30 days increments).
Aging of Grants Receivables may indicate that expenditures have not been submitted in a timely manner to the
funding agencies or the funding agencies are slow in sending reimbursements. In either case, the indicator can be
used to analyze the amount of money the funding agency owes a district. Factors that influence this measure in-
clude: funding agency reimbursement processes; levels of automation; complexity of the grants; billing frequency;
and payroll suspense.
Grant Funded FTE Dependence
This KPI indicates a district’s vulnerability to changes in grant funding by assessing the number of Full-Time Equiva-
lent (FTE) employees that are funded by grant resources. A high percentage on this measure may indicate a district
is at risk of losing a significant portion of its workforce if reductions in grant funds are realized. A higher percent-
age of FTE dependence may identify vulnerability to changes in grant funding. Factors influencing this measure
include program strategies and eligibility criteria.
Additional KPIs
Number of Budget Amendments for Grants Grant Application Success Rate Days of Delay for Accessing New Grant Awards
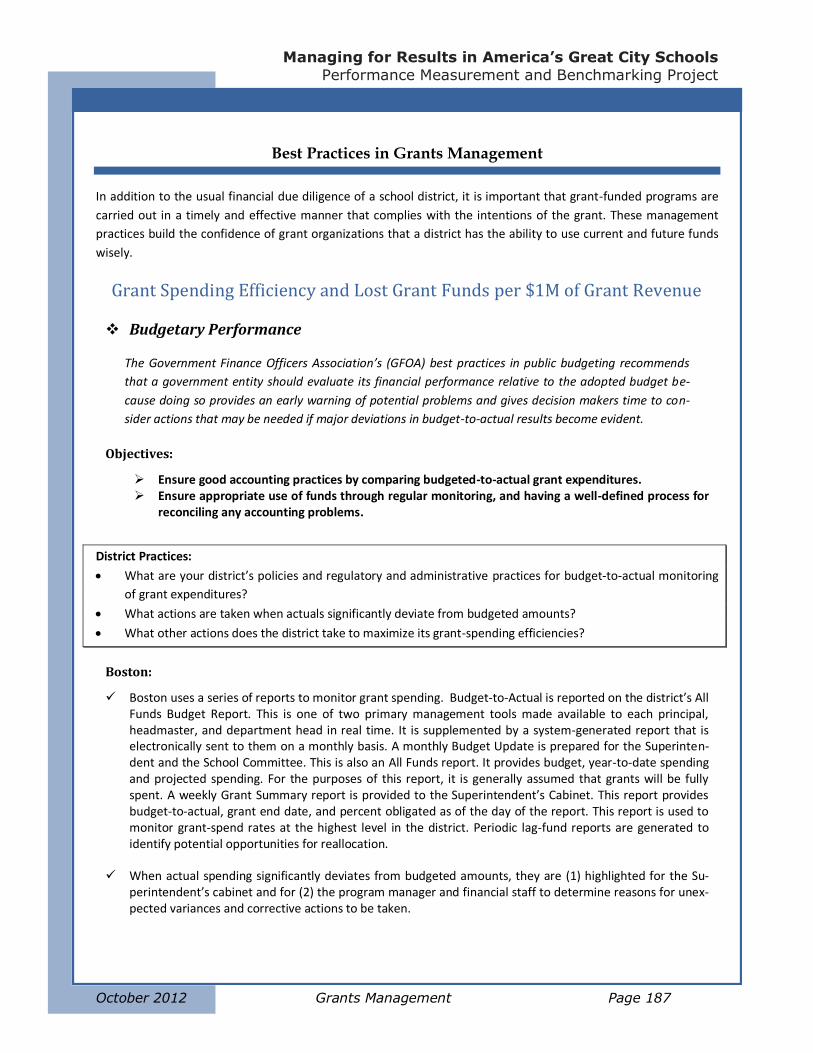
Managing for Results in America’s Great City Schools
Performance Measurement and Benchmarking Project
October 2012 Grants Management Page 187
Best Practices in Grants Management
In addition to the usual financial due diligence of a school district, it is important that grant-funded programs are
carried out in a timely and effective manner that complies with the intentions of the grant. These management
practices build the confidence of grant organizations that a district has the ability to use current and future funds
wisely.
Grant Spending Efficiency and Lost Grant Funds per $1M of Grant Revenue
Budgetary Performance
The Government Finance Officers Association’s (GFOA) best practices in public budgeting recommends
that a government entity should evaluate its financial performance relative to the adopted budget be-
cause doing so provides an early warning of potential problems and gives decision makers time to con-
sider actions that may be needed if major deviations in budget-to-actual results become evident.
Objectives:
Ensure good accounting practices by comparing budgeted-to-actual grant expenditures. Ensure appropriate use of funds through regular monitoring, and having a well-defined process for
reconciling any accounting problems.
District Practices:
What are your district’s policies and regulatory and administrative practices for budget-to-actual monitoring
of grant expenditures?
What actions are taken when actuals significantly deviate from budgeted amounts?
What other actions does the district take to maximize its grant-spending efficiencies?
Boston:
Boston uses a series of reports to monitor grant spending. Budget-to-Actual is reported on the district’s All Funds Budget Report. This is one of two primary management tools made available to each principal, headmaster, and department head in real time. It is supplemented by a system-generated report that is electronically sent to them on a monthly basis. A monthly Budget Update is prepared for the Superinten-dent and the School Committee. This is also an All Funds report. It provides budget, year-to-date spending and projected spending. For the purposes of this report, it is generally assumed that grants will be fully spent. A weekly Grant Summary report is provided to the Superintendent’s Cabinet. This report provides budget-to-actual, grant end date, and percent obligated as of the day of the report. This report is used to monitor grant-spend rates at the highest level in the district. Periodic lag-fund reports are generated to identify potential opportunities for reallocation.
When actual spending significantly deviates from budgeted amounts, they are (1) highlighted for the Su-perintendent’s cabinet and for (2) the program manager and financial staff to determine reasons for unex-pected variances and corrective actions to be taken.

z
Council of the Great City Schools
Page 188 Appendices – Case Studies of Best Practices October 2012
Program and financial leads are encouraged to participate in the Massachusetts State Department of Edu-cation’s conference calls and trainings on both grant-specific issues, and requirements for financial and programmatic reporting.
Columbus:
Periodic monitoring of budget-to-actual grant expenditures is reviewed at various levels throughout the organization. In addition to this monitoring, the accounting system has controls to prevent deviation from budgeted amounts. If monitoring reflects potential deviations, budget revisions are requested to the fun-der.
Memphis:
A Federal Programs Department staff member is assigned to each grant and is responsible for monitoring grant expenditures.
When actual spending significantly deviates from budgeted amounts the Federal Program leadership team meets to determine and implement corrective action steps.
Memphis also coordinates the use of grant funds with all other district funds when addressing district needs.
Miami-Dade County:
The district enhanced and expanded its initiative of grant-related training activities to better serve and manage grants. The post-award portion of the training focuses on budget creation, staffing and procure-ment procedures, management monitoring, amendments, financial reporting, Circular A-87 (Office of Management and Budget (OMB), Cost Principles for State, Local, and Indian Tribal Governments) certifica-tion requirements, grant-closeout processes, and Single Audit process issues. As a result of this mandatory training the district’s management and monitoring practices have improved and partially offset reductions in federal funding.
All federally funded programs are closely monitored to ensure that all funds are fully spent and any residu-al balance does not exceed the targeted unspent balance by more than 1 percent. The projections done by Miami-Dade County compare budget versus actual, and include expenditures for salaries and benefits, as well as all non-salary components. In addition, hourly personnel positions are projected based on a “burn rate” that estimates the day that funding will be exhausted in order to take timely and appropriate action to manage personnel positions. The results of these forecasts are distributed to all Program Managers and are reviewed by the Grants Administration office staff, where disparities and items of concern are commu-nicated in writing to the Program Manager, school, and department staff, and corrective action is closely monitored. If it appears that adequate corrective action has not been taken, a meeting is scheduled with the Program Manager and their direct reports, and if applicable, support departments to address any is-sues that impede the spending of funds. If the necessary actions to ensure spending of grant funds are not being implemented, progressive notification of the status of available funds is communicated and escalat-ed in the hierarchy to ensure appropriate actions are taken to spend all funds on a timely basis.
The intent of these aggressive actions are to ensure that: (a) grant funds that the district was awarded are used for their intended purposes and goals, and thereby preempt the need to seek amendments; (b) funds are fully spent whenever possible (2010-2011 unspent balances amounted to 1.6 percent); (c) the General Fund and its respective Reserves are not used to fund legitimate grant expenses; and (d) the Single Audit does not result in any finding pertaining to certifications, thereby eliminating would-be audit costs.

Managing for Results in America’s Great City Schools
Performance Measurement and Benchmarking Project
October 2012 Grants Management Page 189
An electronic system was developed to fully automate the mandated process of certification for all salaried compensation of any federally funded position in accordance with Circular A-87. Features of the system address the requirements of Circular A-87, as well as significantly simplify the certification process and strengthen overall internal controls.
Norfolk:
Each month, the district reconciles all grant-funded programs by project year and account codes to ensure that budgets are not over spent. If they are, the program manager and the Budget Office are required to resolve the overspending by either moving expenses that may have been incorrectly coded or processing a budget transfer to bring the grant into alignment with approved funding.
All program managers and their administrative personnel participate in one-on-one training with both the budget and accounting departments on the proper monitoring of grant funds.
The district’s school board policy governing expenditures details expectations for not just grant expendi-tures, but for all district expenditures. In addition, there is a Purchasing website, which has a number of detailed publications with guidelines and procedures to follow to properly expend district funds, including all grant funds, regardless of source.
Board policy requires leadership to exercise prudent financial management over all district funds and to make the best use of all funds. There is also a School Board Regulation on Management of Funds that pro-vides specific guidance on the appropriateness of certain categories of expenditures. In addition, there is a fiduciary responsibility for all NPS employees and a Code of Ethics, which is signed at hiring that stipulates that staff members will take due care with district resources (including financial).
A significant percentage of grant expenditures are made using the district’s credit card. This program has been nationally recognized and includes specific external audits on a bi-annual basis. There are approval permissions for every grant credit card transaction that ensure the program manager reviews each pur-chase for conformance with district policy and grant requirements. Any purchases that do not meet this standard are refused and a different account line must be identified for the charge. Additional disciplinary action may be taken, as management determines necessary. In addition, the approval routing for all grant-funded purchases includes the Senior Grant Accountant and the Senior Director, Accounting (financial con-troller) for a final compliance review.
Time and effort reports are generated monthly and are reviewed and certified by the principals at the schools where grant-funded employees work and are then reviewed by the district program manager for each grant to ensure that employees are doing work allowable under the grant and that they are properly charged. Any changes are identified by the program manager and submitted to the senior grant account-ant to correct.

z
Council of the Great City Schools
Page 190 Appendices – Case Studies of Best Practices October 2012
Program Evaluation
The Government Finance Officers Association recommends that a government entity should monitor and
analyze the performance of its service programs based on stated goals and budget expectations. GFOA
states that a government may need to adjust programs, strategies, performance measures, the budget,
and goals based on program reviews, and that processes are needed to ensure that these adjustments
are formally presented to decision makers and other stakeholders in order to receive adequate consider-
ation.
District Practices:
What are your district’s policies and regulatory and administrative practices for evaluating grant-funded pro-
grams?
How are decisions made regarding needed adjustments?
What other actions does the district take to ensure programmatic effectiveness?
Boston:
BPS currently conducts evaluations on many of its grants, both to improve service delivery and to inform resource allocation.
For some grants, where an external evaluator is the primary investigator, BPS plays a supportive role, usu-ally in the provision of primary or secondary data sources, identification of groups for matched compari-sons, assistance with methodology, communication with key stakeholders, etc.
The most robust evaluations entail not only summative reports of key findings, but also brief updates to program staff at regular intervals to inform the implementation process and allow for programmatic ad-justments. In addition, the district collaborates with the grantor at the beginning of a partnership or grant to jointly define and measure a grant’s impact and then to regularly monitor progress towards goals.
Miami-Dade County:
The office of Grants Administration establishes benchmarks and targets to monitor quarterly progress made in achieving measurable goals based on the output of operational activities. Accordingly, the Assis-tant Superintendent for the Office of Intergovernmental Affairs, Grants Administration and Community Engagement gather with staff annually to: (1) review the final outcomes of the different departments, (2) analyze the actual results of the various operational activities against benchmarks and goals, and (3) set goals for the upcoming fiscal year.
Throughout the year, performance is reviewed quarterly to determine progress towards established benchmarks, as well as determine whether the office work plan or business plan needs to be adjusted to meet established goals.
The main purposes for the reviews are to analyze progress made and challenges encountered, and to dis-cuss future initiatives. Then, new benchmarks are established and goals are agreed upon—with the entire office providing feedback—for the following fiscal year. Roles and responsibilities are also reviewed in or-der to assure that the necessary resources are available to assist and support the goals established (espe-cially student achievement). This method of strategic planning has resulted in a favorable alignment of re-sources that has assisted the district in addressing legislative shifts and funding reductions.

Managing for Results in America’s Great City Schools
Performance Measurement and Benchmarking Project
October 2012 Grants Management Page 191
Norfolk:
Program and financial reporting requirements are determined at the time the grant is awarded and Busi-ness and Finance ensures that the program manager is aware of the reporting requirements when they meet to discuss the set-up of the grant prior to the beginning of any spending.
For any program adjustments that are necessary, either due to changes in the district’s planned use for the funds or budgetary requirements that force changes, the program manager must seek written approval from the grantor prior to any changes being made in the financial accounting system (which controls all spending).
Aging of Grants Receivables
Financial Transparency and Predictability
Best practices in Accounts Receivable (A/R) Management, highlighted in the International Accounts Re-
ceivable Professionals (IARP) association’s first quarter 2005, Credit and Financial Management Review,
recommend that finance departments implement processes that provide real-time cash flow information
to management; focus on gaining visibility into receivables transactions; utilize past customer payment
behavior to drive collections decisions going forward; and automate manual processes.
Objectives:
Maintain positive cash flow using a real time reporting system that makes reimbursement infor-mation transparent.
Use a Minimum Drawdown Schedule to improve predictability.
District Practices:
What are your district’s policies and regulatory and administrative practices for managing the aging of grants
receivables?
How does the district manage its accounts receivables?
What other actions does the district take to monitor and reduce the aging of its grants receivables?
Boston:
Most of the grants received by the Boston Public Schools flow through the State Department of Education. (Department of Elementary and Secondary Education, or DESE). DESE has established a tight protocol for monthly reporting of actual expenditures to draw down cash. This system allows for standard, predictable and efficient claiming for the reimbursement of expenditures. The Accounting Department has responsibil-ity for reports of monthly expenditures that result in the receipt of revenue. The department also works with City Treasury to ensure posting of revenue to the correct special revenue grant account.
Program managers are not authorized to file financial reports to granting authorities; only Finance & Budg-et staff members are authorized to do so.
The district reported that while these business practices work well during the year, they do require special attention at the end of the year when there is a final deadline for claiming cash that precedes the grant-close date.
z
Council of the Great City Schools
Page 192 Appendices – Case Studies of Best Practices October 2012
Columbus:
At least monthly, the Treasurer’s Office monitors grant balances and requests cash draw-downs as needed.
Memphis:
Memphis’ administrative practice is to invoice each grantor per the grant guidelines either monthly or quarterly. A listing of aged grants receivables is maintained and monitored by an accountant who resolves any issues with invoices greater than 45 days old.
The district maintains a list of all outstanding grants receivables with the date the invoice was sent to the grantor. An accountant is assigned to follow-up with the grantor after 45 days.
If the revenue has not been received after 60 days, the grantor is contacted via email or phone again to re-solve any issues delaying payment.
Norfolk:
The majority of Norfolk’s grants are reimbursed monthly and there is rarely more than 1 percent of the dis-trict’s total annual budget outstanding at any given time.
Grant accounting has procedures in place to reconcile all grants monthly and as a part of that process, re-views outstanding grant balances. The majority of grants are reimbursed through the state and the Senior Director, Accounting and the Associate Superintendent for Business and Finance both monitor the status of any outstanding grant reimbursements.
Managing FTE Dependency
Financial Forecasting
The Government Finance Officers Association’s Best Practice in Financial Forecasting in the Budget Prep-
aration Process recommends that a government entity should have a financial planning process that as-
sesses long-term financial implications of current and proposed policies, programs, and assumptions and
that develops appropriate strategies to achieve its goals. A key component in determining future op-
tions, potential problems, and opportunities is the forecast of revenues and expenditures to determine,
among other potentialities, the likelihood that services can be sustained; and future commitments and
resource demands (e.g., work force requirements) can be met.
Objective:
Monitor grant-funded dependence of Full-Time Equivalent (FTE) positions so capacity of the organi-zation is not at-risk when funding for these positions are suspended
District Practices:
What are your district’s policies and regulatory and administrative practices for planning, forecasting and
monitoring risks associated with potential reductions in grant funding levels?
What other actions does the district take to assess the long-term implications of its grant dependencies?
Managing for Results in America’s Great City Schools
Performance Measurement and Benchmarking Project
October 2012 Grants Management Page 193
Boston:
Budget development at both the school and district levels considers all sources of funds to ensure a single, aligned use of all funds available to meet the district’s strategic priorities. This includes conservative as-sessments of future year funding for entitlement grants, competitive grants and reimbursement grants.
The district uses multi-year budgets to provide a longer-term planning framework than allowed by the an-nual budget cycle. This practice has been very powerful in setting the stage for both development and management of major federal sources of funds, i.e. The American Recovery and Reinvestment Act (ARRA), Education Jobs Bill, Race to the Top, and School Improvement Grants.
Financial challenges in recent years have created extraordinary pressures to utilize non-recurring funding for long-term needs, especially for FTEs. Multi-year planning has allowed the district to work towards bal-ancing short-term need with long-term risks. FTEs that focus on building capacity in the district had, in many instances, higher status in funding decisions than core positions.
Boston also seeks external expertise, like the Council of the Great City Schools, for assessment and projec-tion of future-year resources.
Columbus:
The Ohio Department of Education requires a five-year forecast that districts update twice a year - the first one in October after the official student enrollment count and the second between April 1 and May 31.
Columbus forecasts every individual line of Local and State revenues as well as all individual expenditures for salary, benefits, purchased services, materials/supplies, equipment, and other expenditures individual-ly. Additionally, the district projects advances and transfers and debt payments from the general fund.
Memphis:
The Federal Programs Department leadership monitors the funding level of grants and alerts other district leadership of projected decreases in grant funding, thereby allowing time for development of alternate plans.
Miami-Dade County:
The district designed an automated Circular A-87 Certification process, which is a fully electronic system designed to effectively and efficiently accomplish the mandated process of certification for all salary com-pensation of any federally funded position. The system, which received the approval of the Florida De-partment of Education as a substitute system, has the following features:
Generated periodic automatic time and effort reports for single and multiple objectives
Automated routing to the responsible personnel / department
Electronic approval allowing comments for required corrections
Adjustments or reclassifications of salaries and benefits are performed online through a Request
for Position Assignment (RPA), which accurately calculates the adjustment or transfer amount
from the actual earnings information contained in the employees earnings record and automatical-
ly triggers a certification for approval

z
Council of the Great City Schools
Page 194 Appendices – Case Studies of Best Practices October 2012
Monitors daily multi-objective positions for changes in abatement percentages, whereby any
changes made to the abatement percentage automatically triggers a certification for approval
Automatic escalation to direct report echelon to address delays in review and approval
De-certification and re-certification procedures for retroactive reclassification of personnel to an-
other funding source, as well changes to the abatement percentages, which provides an audit trail
in one certification
Provides a full audit trail accessible in an instant and can be sorted by employee, program, location
and/or date
Simplifies and expedites Single Audit records retrieval in an electronic format that can be facilitat-
ed in a wide variety of formats
Addresses mandated records-retention requirements, which stipulate storage in an electronic
format instead of hard copies
Norfolk:
The Associate Superintendent of Business and Finance and his senior staff closely monitor the economic projections being discussed at the federal and state levels, and from this they get a sense of the direction that K-12 funding is likely to take. This information is used to prepare projections for the next year’s budg-et cycle.
As a part of the annual budget process, grant-funded positions are projected in order to identify those that are likely to need to be either eliminated or transferred to another funding source to ensure that no indi-viduals are given a full year’s contract unless adequate funding exists.
Personnel documents associated with the hiring of grant-funded positions include information related spe-cifically to the grant, such as the length of the time period that the grant positions are authorized.
Finance holds regular meetings with grant managers to review compliance with grant requirements.

Managing for Results in America’s Great City Schools
Performance Measurement and Benchmarking Project
October 2012 Grants Management Page 195
Profiles of Districts
Boston Public Schools Enrollment: 57,000 Number of Schools: 125 Free/Reduced Eligibility: 78.0% English Language Learners: 43.0% Percent of Students with IEP: 19.0% Budget: $830m Mission: “BPS is committed to transforming the lives of all children through exemplary teaching in a world class system of innovative, welcoming schools.”
Miami-Dade County Schools Enrollment: 345,804 Number of Schools: 506 Free/Reduced Eligibility: 68.0% English Language Learners: 17.2% Students with IEP: 11.0% Budget: $3.434b Mission: “We provide the highest quality education so that all of our students are empowered to lead productive and fulfilling lives as lifelong learners and responsible citizens.”
Columbus City Schools Enrollment: 52,810 Number of Schools: 127 Free/Reduced Eligibility: 61.4% English Language Learners: 9.5% Percent of Students with IEP: 17.2% Budget: $794m Mission: “Each student is highly educated, prepared for leadership and service, and empowered for success as a citizen in a global community.”
Norfolk Public Schools Enrollment: 34,011 Number of Schools: 54 Free/Reduced Eligibility: 10.3% English Language Learners: 1.8% Percent of Students with IEP: 13.7% Budget: $379m Mission: “Our mission is to educate each student to be a successful, productive contributor to society by providing powerful teaching and learning opportunities.”
Memphis City Schools Enrollment: 104,829 Number of Schools: 218 Free/Reduced Eligibility: 78.1% English Language Learners: 5.3% Percent of Students with IEP: 12.4% Budget: $902m Mission: “MCS will be an internationally competitive urban school system that produces well-rounded, high achieving students. Academic Achievement: #1”
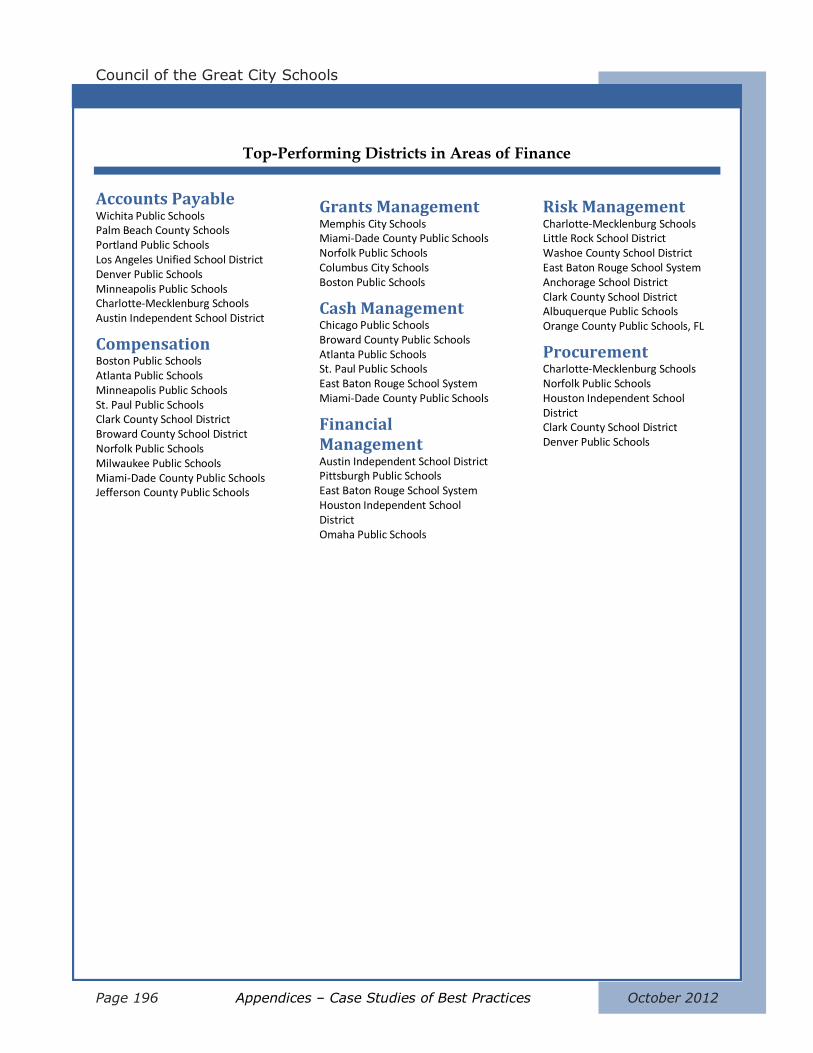
z
Council of the Great City Schools
Page 196 Appendices – Case Studies of Best Practices October 2012
Top-Performing Districts in Areas of Finance
Accounts Payable Wichita Public Schools Palm Beach County Schools Portland Public Schools Los Angeles Unified School District Denver Public Schools Minneapolis Public Schools Charlotte-Mecklenburg Schools Austin Independent School District
Compensation Boston Public Schools Atlanta Public Schools Minneapolis Public Schools St. Paul Public Schools Clark County School District Broward County School District Norfolk Public Schools Milwaukee Public Schools Miami-Dade County Public Schools Jefferson County Public Schools
Grants Management Memphis City Schools Miami-Dade County Public Schools Norfolk Public Schools Columbus City Schools Boston Public Schools
Cash Management Chicago Public Schools Broward County Public Schools Atlanta Public Schools St. Paul Public Schools East Baton Rouge School System Miami-Dade County Public Schools
Financial Management Austin Independent School District Pittsburgh Public Schools East Baton Rouge School System Houston Independent School District Omaha Public Schools
Risk Management Charlotte-Mecklenburg Schools Little Rock School District Washoe County School District East Baton Rouge School System Anchorage School District Clark County School District Albuquerque Public Schools Orange County Public Schools, FL
Procurement Charlotte-Mecklenburg Schools Norfolk Public Schools Houston Independent School District Clark County School District Denver Public Schools

Managing for Results in America’s Great City Schools
Performance Measurement and Benchmarking Project
October 2012 Grants Management Page 197
Background of these Case Studies
The purposes of this CGCS case study are to (1) identify top performing districts in Financial Management, as indi-
cated by the KPI Performance Management System data, and (2) determine the specific management practices
that led to these districts becoming top performers. The KPI Performance Management System collects and dis-
plays data for hundreds of performance measures that senior executives can use to monitor internal processes and
outcomes. However, to be considered a top performer a district has to perform consistently well across two select
groups of measures— the Power Indicators and Essential Few—which are comprised of strategic, policy, and man-
agement-level performance measures that are important for superintendents, chief executives, and school board
members to understand and monitor.
Methodology
The CGCS Performance Measurement and Benchmarking Project team, along with several teams of fi-1.nance staff members from multiple CGCS member school districts, uses a performance and benchmark-
ing survey to collect data in seven areas: (a) Accounts Payable, (b) Cash Management, (C) Compensation,
(d) Financial Management, (e) Grant Management, (f) Procurement, and (g) Risk Management.
The survey is distributed to all CGCS member districts and the data collected from the districts are com-2.piled, analyzed, and summarized by the team’s statistical analysts and TransACT Communications. The re-
sults are developed into a comparative report and published annually in Managing for Results in Ameri-
ca’s Great City Schools.
The project team analyzes the data for the Power and Essential Few KPIs to identify the top performing 3.districts in each of the seven areas of financial operations.
A separate “best practice” survey, containing questions for each of the seven areas of financial opera-4.tions, was designed to allow Chief Financial Officers and their staffs to describe the management and op-
erational practices that led their districts to produce high quality outcomes. This survey uses best practice
recommendations and industry standards as promulgated by such entities as the Governmental Finance
Officers Association (GFOA), the National Institute of Government Purchasing NIGP), and the International
Accounts Payable Professionals (IAPP) Association.
The project team reviews the “best practice” survey responses and conducts follow-up phone interviews 5.to clarify and expand on the responses before issuing case study reports.
z
Council of the Great City Schools
Page 198 Appendices – Case Studies of Best Practices October 2012
Managing for Results in America’s Great City Schools
Performance Measurement and Benchmarking Project
October 2012 Accounts Payable Page 199
C G C S C A S E S T U D Y
Accounts Payable Managing for Results in America’s Great City Schools:
A Case Study in Financial Management – Accounts Payable
March 2012
Aims and Objectives
As an industry, the business and operations components of K-12 have
not historically operated with a common set of industry standards for
monitoring and benchmarking performance. CGCS addressed this
through the development of its Performance Measurement and
Benchmarking Project. The case study element of the initiative is de-
signed to answer the question, “What are the effective management
practices of top performing urban school districts that allow them to
run effective financial and business operations?” Once these man-
agement practices are determined and disclosed, other districts across
the nation can use them to analyze and improve their practices. The intention of such disclosures is to increase
collaboration between executives of top performing districts and those districts striving to improve their perfor-
mance to enable the industry to build its knowledge about how large systems work and what it takes to improve
them.
Key Performance Indicators for Accounts Payable
There are three key performance indicators (KPIs) at the “Power Indicator” or “Essential Few” levels in the area of
Accounts Payable. Additionally, there are six more basic KPIs that are not listed here, but can be accessed through
the Performance Management System.
Number of Days to Process a Vendor Payment (Power Indicator)
This KPI measures the efficiency of the payment process. The number of days to process payments ranged from 2
to 15 days for seven of the eight top-performing districts in Accounts Payable. The median for all CGCS member
districts is 21 days, with 21 districts exceeding the median, encompassing a range of 23 to 75 days. Factors that
influence this measure include the use of automation to process AP transactions and administrative policies and
procedures to govern AP practices.
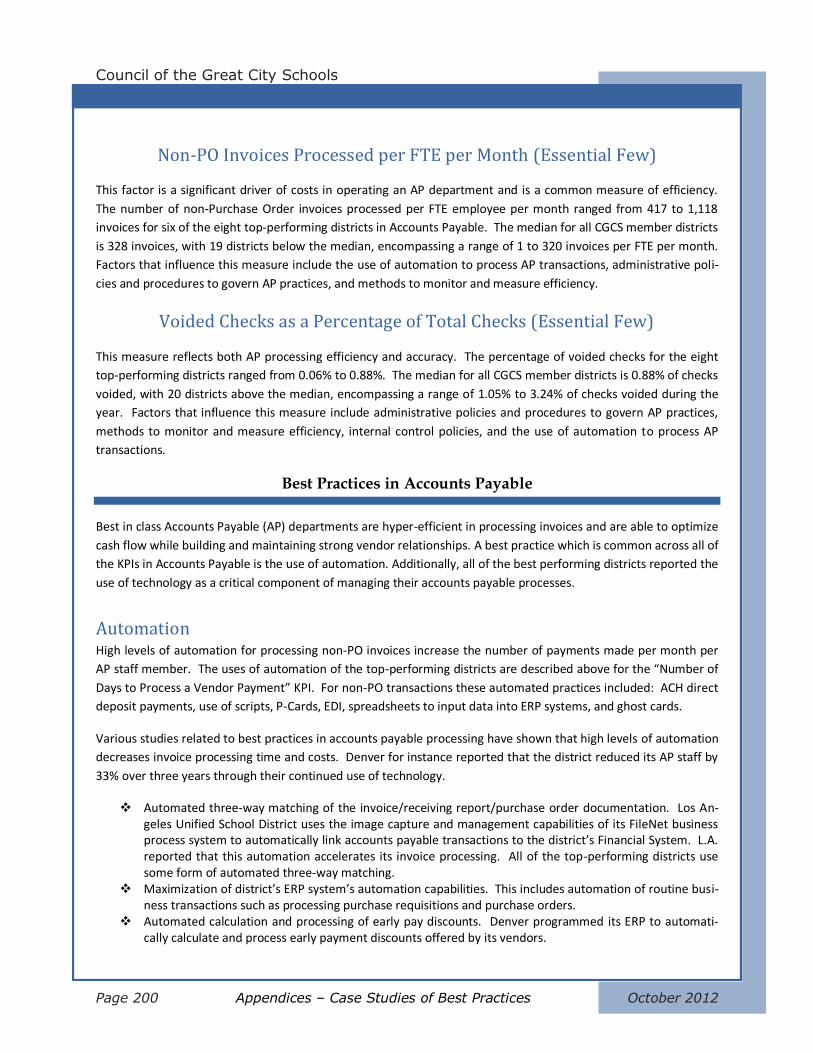
z
Council of the Great City Schools
Page 200 Appendices – Case Studies of Best Practices October 2012
Non-PO Invoices Processed per FTE per Month (Essential Few)
This factor is a significant driver of costs in operating an AP department and is a common measure of efficiency.
The number of non-Purchase Order invoices processed per FTE employee per month ranged from 417 to 1,118
invoices for six of the eight top-performing districts in Accounts Payable. The median for all CGCS member districts
is 328 invoices, with 19 districts below the median, encompassing a range of 1 to 320 invoices per FTE per month.
Factors that influence this measure include the use of automation to process AP transactions, administrative poli-
cies and procedures to govern AP practices, and methods to monitor and measure efficiency.
Voided Checks as a Percentage of Total Checks (Essential Few)
This measure reflects both AP processing efficiency and accuracy. The percentage of voided checks for the eight
top-performing districts ranged from 0.06% to 0.88%. The median for all CGCS member districts is 0.88% of checks
voided, with 20 districts above the median, encompassing a range of 1.05% to 3.24% of checks voided during the
year. Factors that influence this measure include administrative policies and procedures to govern AP practices,
methods to monitor and measure efficiency, internal control policies, and the use of automation to process AP
transactions.
Best Practices in Accounts Payable
Best in class Accounts Payable (AP) departments are hyper-efficient in processing invoices and are able to optimize
cash flow while building and maintaining strong vendor relationships. A best practice which is common across all of
the KPIs in Accounts Payable is the use of automation. Additionally, all of the best performing districts reported the
use of technology as a critical component of managing their accounts payable processes.
Automation High levels of automation for processing non-PO invoices increase the number of payments made per month per
AP staff member. The uses of automation of the top-performing districts are described above for the “Number of
Days to Process a Vendor Payment” KPI. For non-PO transactions these automated practices included: ACH direct
deposit payments, use of scripts, P-Cards, EDI, spreadsheets to input data into ERP systems, and ghost cards.
Various studies related to best practices in accounts payable processing have shown that high levels of automation
decreases invoice processing time and costs. Denver for instance reported that the district reduced its AP staff by
33% over three years through their continued use of technology.
Automated three-way matching of the invoice/receiving report/purchase order documentation. Los An-geles Unified School District uses the image capture and management capabilities of its FileNet business process system to automatically link accounts payable transactions to the district’s Financial System. L.A. reported that this automation accelerates its invoice processing. All of the top-performing districts use some form of automated three-way matching.
Maximization of district’s ERP system’s automation capabilities. This includes automation of routine busi-ness transactions such as processing purchase requisitions and purchase orders.
Automated calculation and processing of early pay discounts. Denver programmed its ERP to automati-cally calculate and process early payment discounts offered by its vendors.
Managing for Results in America’s Great City Schools
Performance Measurement and Benchmarking Project
October 2012 Accounts Payable Page 201
Electronic Data Interchange (EDI). Sixty percent of the top-performing districts reported using EDI to elec-tronically transmit data either between their internal systems or between their systems and the systems of outside organizations. For instance, Palm Beach uses both EDI and spreadsheets to load hundreds of Food Services, non-PO vendor invoices at one time into its ERP system. L.A. is developing plans to begin processing invoices via EDI with an upcoming implementation of the district’s ERP.
Electronic Payments One of the GFOA Accounts Payable best practices is the use of electronic payments to process payments to ven-
dors instead of traditional check printing.
Automated Clearing House (ACH) Payments are a form of electronic funds transfer that allows a vendor to collect a recurring payment electronically. ACH is used by 80% of the top-performing districts for re-curring vendor payments. Denver uses system flags that exist in the district’s Enterprise Resource Plan-ning (ERP) system to make direct payments to vendors for certain invoiced goods and services.
Purchase Cards (P-Cards). Used by 80% of the top-performing districts for small purchases. The School District of Palm Beach County reported, “The District’s use of the Purchasing card for small purchases has drastically reduced the number of invoices to input.” Austin Unified School district reported that their use of P-Cards district wide reduced the number of purchase orders processed by two-thirds.
Electronic Funds Transfer and Wire Transfers. Used by 60% of the top-performing districts for vendor payments. For example, since Austin is self-insured for Workers’ Compensation and employee health in-surance, the district requires third-party claims administrators to draft funds against claims directly from the district’s bank accounts.
Ghost Payment Cards. These are either P-Cards or credit cards provided to preferred vendors for ongoing use, with each vendor given a unique “ghost” card number which the vendors automatically charge when purchases are made by the district. In the case of Denver Public Schools, its AP department automatically receives an email confirming such payments. Austin uses a ghost card to pay for airline travel booked through the American Airlines’ reservation system and the district’s travel agent. Forty percent of the top-performing districts use this method.
Board and Administrative Policies One of the criteria for the GFOA’s Award for Excellence in Government Financing is the use of policies and proce-
dures to govern financial practices.
Sixty percent of the top-performing districts reported the use of district polices to govern their Accounts Payable processes. These districts reported that their policies address processes such as (1) the inclusion of prompt payment discounts in contract negotiations, (2) expedited payment processing of selected transactions that meet certain policy thresholds, (3) “piggyback” arrangements on previously negotiated master service agreements to take advantage of aggregated spend level discounts, and (4) establishing strict deadlines for reimbursement of employee expenses such as travel payments.
Administrative Procedures One of the criteria for the GFOA’s Award for Excellence in Government Finance is the use of policies and proce-
dures to govern financial practices.
Policy and procedures manual. The top-performing districts reported using formal, written documenta-tion for their AP processes. Specific examples of documented processes cited included: (1) delineation of
z
Council of the Great City Schools
Page 202 Appendices – Case Studies of Best Practices October 2012
responsibilities and accountabilities, (2) requirements for monitoring AP processes, and (3) identification of payment approval authority.
Internal Controls A high percentage of voided checks suggest a lack of internal controls and a potential for fraud. GFOA recom-
mends financial managers take responsibility for internal control and include some practical means for lower level
employees to report instances of management override of controls that could be indicative of fraud. The term
“Internal Controls” is a general category governing the AP process. Specific internal control initiatives reported by
the top-performing districts are described in the practices below.
Management Oversight
A GFOA best practice is the use of performance measures to monitor and improve processes. Top-performing dis-
tricts reported the use of metrics and key performance indicators to measure productivity. For example, Los Ange-
les reported using statistical trend data to measure turnaround time and to identify trouble spots and bottlenecks
in their AP workflow. In Austin, the AP Supervisor monitors each AP employee’s KPIs to monitor workload volumes
and throughput and shifts the team’s workload accordingly.
Use of electronic controls available in ERP systems to monitor such anomalies as duplicate invoice num-bers, misalignment of the three-way match, duplicate payments, and insufficient budgets.
Palm Beach tracks and monitors reasons for voided checks in order to detect any patterns that might ex-ist.
Los Angeles is under contract with an expense recovery firm to audit prior payment records to detect past overpayments, duplicate payments, and other anomalies. In addition the district uses reports designed to monitor check cancellations and to identify reasons for such transactions.
Controls over Master Vendor File
To help ensure proper disbursement of funds to the correct vendors, International Accounts Payable Professionals
(IAPP) Association standards recommend a systematic review of vendor master files.
Top-performing districts reported the use of strict controls over access to vendor master files. For in-stance Austin, Los Angeles, and Palm Beach require maintenance of vendor master files be performed by organizations other than Accounts Payable. In addition, Los Angeles contracts with a third-party adminis-trator to review vendor files for double entries and erroneous information and then corrects the files. Austin specifies specific data that vendors must provide to the district before they can be set up in the fi-nancial system.
Other Practices There are numerous miscellaneous practices top-performing districts reported using to improve efficiency. They
include:
Austin: (1) cross-Training of Accounts Payable staff, (2) formal training sessions on AP practices for district employees, and (3) availability of online AP training materials for access by employees. In addition, the average years of service of AP employees in the district’s AP department is eleven years. Austin reported,

Managing for Results in America’s Great City Schools
Performance Measurement and Benchmarking Project
October 2012 Accounts Payable Page 203
“This average absolutely contributes to our efficiency. Staff’s flexibility and willingness to be adaptable to new processes is also a contributing factor.”
Denver: (1) use of standard templates for frequently used means of communications, such as emails, (2) script processing of payments, (3) consolidation of vendor billings for all district services or products pro-vided by vendors frequently used by the district, and (4) use of system controls to reduce and/or elimi-nate duplicate payments.
Los Angeles: (1) periodic review of industry best practices, (2) periodic evaluation of district AP operations to identify productivity improvement opportunities, (3) use of metrics to measure productivity and statis-tics to track historical trends, and (4) ongoing staff training.
Palm Beach: to reduce the volume of past due invoices, the district created a Past Due Invoice Resolution team to concentrate on getting departments and schools to process receipts and unresolved invoice prob-lems.
Wichita: (1) balance daily batch totals to invoices entered to help identify and resolve issues in a timely manner, (2) regular review of invoice aging reports, and (3) utilize an AP audit recovery firm to find un-claimed credits and overpayments. These measures resulted in a disbursement accuracy rate of 99.988%.
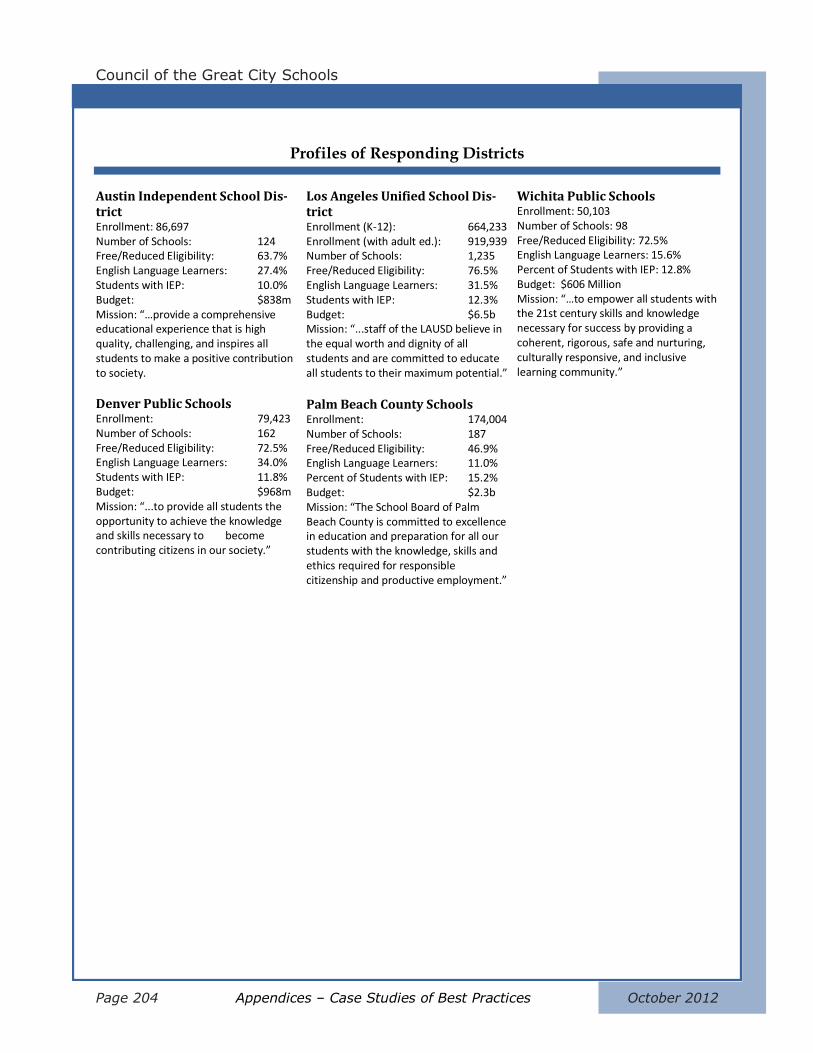
z
Council of the Great City Schools
Page 204 Appendices – Case Studies of Best Practices October 2012
Profiles of Responding Districts
Austin Independent School Dis-trict Enrollment: 86,697 Number of Schools: 124 Free/Reduced Eligibility: 63.7% English Language Learners: 27.4% Students with IEP: 10.0% Budget: $838m Mission: “…provide a comprehensive educational experience that is high quality, challenging, and inspires all students to make a positive contribution to society.
Denver Public Schools Enrollment: 79,423 Number of Schools: 162 Free/Reduced Eligibility: 72.5% English Language Learners: 34.0% Students with IEP: 11.8% Budget: $968m Mission: “...to provide all students the opportunity to achieve the knowledge and skills necessary to become contributing citizens in our society.”
Los Angeles Unified School Dis-trict Enrollment (K-12): 664,233 Enrollment (with adult ed.): 919,939 Number of Schools: 1,235 Free/Reduced Eligibility: 76.5% English Language Learners: 31.5% Students with IEP: 12.3% Budget: $6.5b Mission: “...staff of the LAUSD believe in the equal worth and dignity of all students and are committed to educate all students to their maximum potential.”
Palm Beach County Schools Enrollment: 174,004 Number of Schools: 187 Free/Reduced Eligibility: 46.9% English Language Learners: 11.0% Percent of Students with IEP: 15.2% Budget: $2.3b Mission: “The School Board of Palm Beach County is committed to excellence in education and preparation for all our students with the knowledge, skills and ethics required for responsible citizenship and productive employment.”
Wichita Public Schools Enrollment: 50,103 Number of Schools: 98 Free/Reduced Eligibility: 72.5% English Language Learners: 15.6% Percent of Students with IEP: 12.8% Budget: $606 Million Mission: “…to empower all students with the 21st century skills and knowledge necessary for success by providing a coherent, rigorous, safe and nurturing, culturally responsive, and inclusive learning community.”
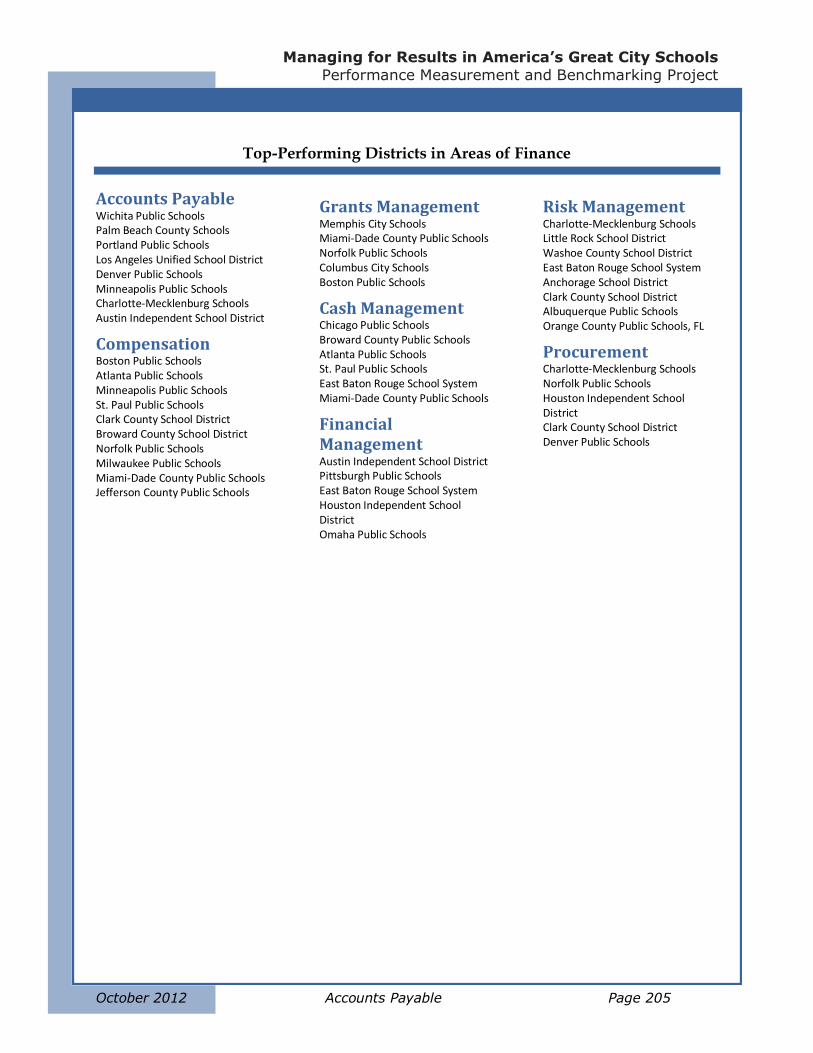
Managing for Results in America’s Great City Schools
Performance Measurement and Benchmarking Project
October 2012 Accounts Payable Page 205
Top-Performing Districts in Areas of Finance
Accounts Payable Wichita Public Schools Palm Beach County Schools Portland Public Schools Los Angeles Unified School District Denver Public Schools Minneapolis Public Schools Charlotte-Mecklenburg Schools Austin Independent School District
Compensation Boston Public Schools Atlanta Public Schools Minneapolis Public Schools St. Paul Public Schools Clark County School District Broward County School District Norfolk Public Schools Milwaukee Public Schools Miami-Dade County Public Schools Jefferson County Public Schools
Grants Management Memphis City Schools Miami-Dade County Public Schools Norfolk Public Schools Columbus City Schools Boston Public Schools
Cash Management Chicago Public Schools Broward County Public Schools Atlanta Public Schools St. Paul Public Schools East Baton Rouge School System Miami-Dade County Public Schools
Financial Management Austin Independent School District Pittsburgh Public Schools East Baton Rouge School System Houston Independent School District Omaha Public Schools
Risk Management Charlotte-Mecklenburg Schools Little Rock School District Washoe County School District East Baton Rouge School System Anchorage School District Clark County School District Albuquerque Public Schools Orange County Public Schools, FL
Procurement Charlotte-Mecklenburg Schools Norfolk Public Schools Houston Independent School District Clark County School District Denver Public Schools
z
Council of the Great City Schools
Page 206 Appendices October 2012
Background of these Case Studies
The purposes of this CGCS case study are to (1) identify the top performing districts in Financial Management, as
indicated by the Performance Management System (PMS) data, and (2) determine the specific management prac-
tices which led to these districts becoming top performers. The PMS collects and displays data for hundreds of
performance measures that senior executives can use to monitor internal processes and outcomes. However, to
be considered a top performer a district has to perform consistently well across two select groups of measures—
the Power Indicators and Essential Few—which are comprised of strategic, policy, and management level perfor-
mance measures that are important for superintendents, chief executives, and board members to understand and
monitor.
Methodology
The CGCS Performance Measurement and Benchmarking Project team, along with several teams of fi-1.nance staff members from multiple CGCS member school districts, uses a performance and benchmark-
ing survey to collect data in seven areas: (a) Accounts Payable, (b) Cash Management, (C) Compensation,
(d) Financial Management, (e) Grant Management, (f) Procurement, and (g) Risk Management.
The survey is distributed to all CGCS member districts and the data collected from the districts are com-2.piled, analyzed, and summarized by the team’s statistical analysts and TransACT Communications. The
results are developed into a comparative format and published in an annual report, Managing for Results
in America’s Great City Schools.
The project team analyzes the data for the Power and Essential Few KPIs to identify the top performing 3.districts in each of the seven areas of financial operations.
A separate “best practice” survey, containing questions for each of the seven areas of financial opera-4.tions, was designed to allow Chief Financial Officers and their staffs to describe the management and op-
erational practices that led their districts to produce high quality outcomes. This survey uses best practice
recommendations and industry standards as promulgated by such entities as the Governmental Finance
Officers Association (GFOA), the National Institute of Government Purchasing NIGP), and the International
Accounts Payable Professionals (IAPP) Association.
The project team reviews the “best practice” survey responses and conducts follow-up phone interviews 5.to clarify and expound on the responses before issuing case study reports. The districts that responded to
the “best practice” survey are shown in the district profile section below.