Embed Size (px)
Citation preview
European Journal of Business and Management www.iiste.org
ISSN 2222-1905 (Paper) ISSN 2222-2839 (Online)
Vol.6, No.11, 2014
120
To Examine the Application and Practicality of Aakers’ Brand
Equity Model in Relation with Recurrent Purchases Decision for
Imported Beauty Care products
(A study of female customers’ of Pakistan)
Saima Ulfat (corresponding Author)
Institute of Business and Management, University of Engineering & Technology, Lahore
Email: [email protected]
Dr. Asif Muzaffar
Institute of Business and Management , University of Engineering and Technology Lahore Pakistan
Email: [email protected]
Professor Dr. Muhammad Shoaib
Director, Institute of Business and Management, University of Engineering & Technology, Lahore
Abstract
Based upon Asker’s renowned conceptual framework of brand equity, this study is employing Linear Regression
analysis to investigate the causal relationships amongst all the dimensions of brand equity and recurrent purchase
decision of females for imported beauty care products. In this study, responses of 211 actual customers from
Pakistan have been used based upon Purposive sampling technique.
Research findings demonstrates, Brand Quality, Brand Loyalty and Brand Association are the significant
dimensions while having recurrent purchase decision about any imported beauty care product whereas Brand
Awareness has found weaker support for the same.
Significantly, this study is important for all worldwide manufacturers of beauty care products whose products are
available in local market of Pakistan and it can appear as a source of female consumers’ insight about brand
awareness, brand loyalty, brand association and brand quality which they may keep in mind while selecting their
important beauty care products.
Keywords: Brand Quality, Brand Association, Brand Loyalty, Brand Awareness, Re-current purchase, Beauty
care products
1. Introduction (Research Motivation)
Since prehistoric era, it is natural to consume beauty care products by both males and females in order to look
striking, gorgeous, elegant and presentable. Due consideration is developed that Females are more intended
towards use of beauty care products than males.
Firm beauty in every culture is depicted with the character of Cinderella whose first traces were found in
Chinese stories during early nineteen century (Miller, 2008). Likewise entire world, females of Pakistan are also
indulged in rigorous use of beauty enhancement products especially face and body care products as desire to
enhance physical appearance is seems to be natural phenomena (Adams, 1977). Pakistan is an underdeveloped
country so as its beauty market. Penetration has been 90% increased of beauty market in Pakistan and maximum
share is caught by skin care and hair care products (Manto, 2011). Scope of this thesis will reveal role of brand
equity for whole female segment of Pakistan.
Overall beauty care products including facial skin care and body care creams and lotions are abundantly
available in local markets of Pakistan including both local as well as imported. These products are radially used
by almost all females. Appearing under two price tiers, there are two nominated categories of these products
including first one as “mass fairness” a beauty care product with average price of Rs. 1.25 per ml. In second
category, “mass premium fairness” products appear having price level up to Rs. 8.00 per ml and above (Manto,
2011). In both categories international as well as local companies are offering their products but in first price tier,
mostly local beauty care products are appearing including English Fairness, Care Honey Cream and Lotion,
Faiza Beauty Cream, Bio Nikhar, Tibbat Cream and many more and Fair & Lovely Pakistan, in later price tier
mostly foreign companies products are appearing including Olay international, Pond’s White beauty, Garner,
Revlon Honey Lotion and L’Oreal etc. Other than all local manufacturers, mainly, six multinational giants are
playing in beauty market of Pakistan having unique blend of their face and body care brands. These include
L’Oreal, P&G, Avon , Unilever, Beiersdorf and Colgate (Manto, 2011). Steady perception of females while
using all these beauty care products is to attain an ultimately fairness and beauty either after using products of
any local brand or imported one. So every brand has established its brand equity in the minds of customers in its
European Journal of Business and Management www.iiste.org
ISSN 2222-1905 (Paper) ISSN 2222-2839 (Online)
Vol.6, No.11, 2014
121
own ways. Since new and emerging trends are appearing in beauty industry of Pakistan, so brand equity of any
selected product is also increasing if females move towards repurchase of that same brand’s product again and
again.
Since beauty is an embodied affective process said by (Coleman & Figueroa, 2010), so females always strive for
best beauty care brands available in the market. For females of Pakistan, color tones of their skins are always a
most important concern. To look fair appears as an adopted social trend so females tend towards regular use of
face and body care products. Often or frequent, females use these beauty care products irrespective of their age
bracket and social class. For females, there are specified reasons to use these products and to repurchase the
same after first use if they are satisfied and they depict these reasons in their own specialized manners. As both
local and international manufacturers are continuously enhancing features of their already launched products
along with introduction of new products so special attention is drawn to measure the brand equity of launched
products as already explained by (Liao & Chuang, 2004).
One effect of beauty care products is considered to minimize aging effects as females always demand a real,
perfect and long lasting beauty from any single selected product. Marketers are well aware with this perspective
and they treat females to pinch their soft feeling regarding this aspect in the way that females tend to purchase
same products again and again and bring higher economic returns for the producers of beauty care products (Yu,
2007). Another appealing aspect of females’ personality is to look superior to all by all means. They keep this
fact higher while selecting their beauty care products. This desire adhere them to opt particular fashion trends at
one hand and on the other hand, they decide radically about their face and body looks as well. (Johnston &
Taylor, 2008). Females of Pakistan also consider the selection of specified beauty care products as special pose
of their personality. Females are considered to be really “up-to-dated” if they adopt immediately and newly
launched products and they play the role of trend setter for other females (Andrew, 2011). All international
beauty care products manufacturers touch these feelings of our females whenever they launch their new products
in this territory. In some situations, launched products may not bring same results for our females being a part of
geographically different location as was launched in some other location but even then females incline to acquire
the newly launched product at-least for once, being less aware with the actual features of the lunched brand.
Since marketers are well aware with this fact, so they launch same advertisement campaigns as they used in
some other geographical territory (Castañeda, 1997).
One reason of more awareness of foreign beauty care brands and products is to be more exposed with the variety
of various products as increasing trends of globalization and advancement in technology and communication has
made access easier with new variety of products of other countries. Previous study by (Wang, Siu, & Hui, 2004)
has found, consumers psychological found products of other regions more valuable than their own. Another
study by (Hirschman & Holbrook, 1982) shows, consumers in developed countries feel more confidence while
using brands of their own origin being superior in quality and functionality than the consumers of developing
countries. Consumers of developing countries prefer to use imported products more as compared to local ones
while possessing an impressive image about these products in their mind. With reference to Pakistan territory,
this thing also provides a research gap to be analyzed.
This study has been conducted while keeping in view all the above aspects and various factors has been analyzed
which make females forced to purchase same imported beauty care products time and again.
1.1 Objective of the study The major objective of this study is stated as: “To examine the impact of each dimension of brand equity as well
as overall brand equity on re-current purchase decision of females for imported beauty care products”
2. Literature Review
The concept of brand equity was introduced in 1980, and marketing academicians and practitioners took special
interest to elaborate it with value of the brand in the minds of their target customers (Cobb-Walgren, Ruble, &
Donthu, 1995). Thus brand equity is termed as added value endowed by the brand name in the minds of the
customers (Myers, 2003). Brand equity is also a difference between multi attribute performance of a brand and
preferences of the customers while selecting any brand of their choice (Wood, 2000). It also affects the overall
quality and choice intension of the customers (Rao, Agarwal, & Dahlhoff, 2004).
Typically defined, brand equity is the set of assets or liabilities of a brand that are associated with its symbol or
name. These symbols can or cannot add value to its product or services. A brand is the net present value of the
goodwill consumers feel toward a product. (Lane, 2003) supports the notion that there is a continued emphasis
on customer-focused marketing approaches in the marketing mix supporting the idea that brand equity rests in
the mind of the consumer. Furthermore, “the brand is the thing” and that firms must properly build and leverage
their brand equity. There remains much confusion within the marketing literature on the definitions of brand
equity (Keller, 2009; Na, Marshall, & Keller, 1999). The initial notion of brand equity may have been based on
product attributes but this has since evolved to a new focus on a number of non-product attributes such as
personal service, price and trust (Keller, 2003).
European Journal of Business and Management www.iiste.org
ISSN 2222-1905 (Paper) ISSN 2222-2839 (Online)
Vol.6, No.11, 2014
122
Brand equity is the measure of overall brand fit for its target market so it can be used for marketing decision
making. Brand equity can be measured with two perspectives, from companies’ perspective as well as from
customers’ perspective. In literature of marketing, consumers’ brand equity falls in two groups, consumer
perception which covers, Brand Awareness, Brand association, Perceived Quality and consumer behavior which
covers brand loyalty and willingness to pay high price (Cobb-Walgren et al., 1995; Yoo & Donthu, 2001).
Before this operationalization, (David A Aaker, 1991b) has already incorporated behavioral as well as perceptual
dimensions in the definition of brand equity. (Lassar, Mittal, & Sharma, 1995) has further distinguished
behavioral dimension of brand loyalty from perceptual dimension and according to him behavior appears as
outcome of brand equity instead of brand itself.
Based on whole literature review, theoretical model is presented in Figure-01which gives the actual depiction
and direction of brand equity relationship with recurrent purchase. Logical relationship will start from brand
study and will end up on recurrent purchase factors important for customers while selecting their specified
brands repeatedly.
There is several brand equity models are available in literature elaborated by many researchers after Aaker’s
work but all models have basic constructs evolved from Aaker’s work which he presented in 1996. Aaker’s first
model was empirically tested in various studies as conducted by (W. G. Kim & Kim, 2004; Yoo & Donthu, 2001;
Yoo, Donthu, & Lee, 2000). Presented below is the simple Equity model developed by Aakar in 1991 which will
be used a first base line of this study.
Above mentioned dimensions of brand Equity are further endorsed by many later researchers and are used in
same ways in their researches (Bendixen, Bukasa, & Abratt, 2004; H.-b. Kim, Kim, & An, 2003; Lassar et al.,
1995; Motameni & Shahrokhi, 1998; Na et al., 1999; Yoo & Donthu, 2001). These agreed dimensions are
discussed in details as under. Other proprietary assets are not usually studied alone. These are studied in
emergence of rest four elements. So for this article, first four elements are selected to be studied.
According to (D.A. Aaker, 2011; O'Reilly, 2009) Consumers’ Loyalty is: “The proportion of times a purchaser
chooses products/services from the same producer, manufacturer, after being satisfied and/or provider in a
specific category compared to the total number of purchases made in that category from all producers,
manufacturers and/or providers, over a given time frame on a specified price, under the condition that other
acceptable products/services are equally available having same value added services”. So, a real loyal customer
is ready to pay always a premium price to the product or service of his vital interest with which he or she is
emotionally attached (Hallowell, 1996). Customer’ priority selection also contribute a noticeable part in overall
business success of the firm (Cohen, Gan, Au Yong, & Choong, 2006). Prominent Measures of customer’ loyalty
are shown in Figure 4.
Brand Awareness is second element in brand equity model. It is considered to be the first pre requisite of
consumer’ buying process (Oh, 2000). Customer needs to be aware with the product or brand before an actual
buying is made. Customers always get advantages of recall and recognition of brands and if they are unable to
place any brand in an appropriate purchasing context, they may not bring the product in their choice set (Percy &
Rossiter, 1992). Brand related reactions create accumulation of experiences either positive or negative and these
are directly related to the use or design of brand or role of media commentary (Macdonald & Sharp, 2003). It
also creates brand strength in the memory traces of individuals and reflect the memorability of a brand under
various conditions (Percy & Rossiter, 1992). Good brand awareness increases the probability of brand
consideration while encountering the brands in selection procedure of customers.
Being appeared as third prominent dimension; Perceived product quality is defined as, “customer’ perception
about overall superiority or quality of any product that leads towards intended purchase of product”. As defined
by (David A Aaker, 1991b), quality is the most important preference of customers when they anticipate their
purchases. Perceived quality is also directly related with the price of product (Iglesias & Guillén, 2004).
Consumers assume lesser price of the brand if its quality is perceived to be lower. Premium price is paid for the
brands having high quality (Lassar et al., 1995). Perceived product quality also have direct link with brand
loyalty, if buyers are not able to judge any brand on the basis of other features, quality becomes one simple
prospect select any product on any brand. Good perception brands increase brand loyalty which in return
increase future sales of any firm (Keller, 2003). Once a good quality brand’ tag is achieved by any brand,
chances of long term future growth increases dramatically.
Lastly, Perceived positive mental image associated with any brand is called as brand association. There are many
products features and attributes which contribute to create brand association. These include: Product use,
products feature, product attributes, customers’ related product benefits, Life-styles, product classes, competitors’
range and product origins (J. L. Aaker, 1997). Brand associations exist with their due levels of strengths. Brand
positioning is also based upon brand associations and differences of brand from competitors’ brands (Chen,
2001).
Brand association remarkably effect the information recalling and processing, it also provides a real point of
differentiation from competitors, provides a valid reason to opt, generates positives feelings and attitudes about a
European Journal of Business and Management www.iiste.org
ISSN 2222-1905 (Paper) ISSN 2222-2839 (Online)
Vol.6, No.11, 2014
123
brand and above all it serves as the basis of real time extensions (David A Aaker, 2012). Brand association
directly affects the satisfaction and purchasing behavior of consumers. Good brand associations act as a barrier
in selection of other brands even they make consumers to forget the incentives associated with the selection of
other brands (David A Aaker, 1991b, 1996).
Based upon all above dimensions, recurrent purchase is the individuals’ judgment to acquire same product of any
brand once again. It is also a decision by the customer to remain with the product/service provide for future
activities (Hellier, Geursen, Carr, & Rickard, 2003). Recurrent purchase occurs when customers decide to remain
with one single brand owing to be satisfied with their supplier (Zeithaml, Berry, & Parasuraman, 1996). Traces
of recurrent purchase decisions lies in product quality firstly (Boulding, Kalra, Staelin, & Zeithaml, 1993). It also
appears in marketing literature, customers’ retention owing to repeat purchase behavior and customers’ loyalty
often used interchangeably. In actual these are two entirely different terms and are originated from different
constructs. Customer retention is concerned with customers’ satisfaction and it directly links with repeat
purchase and in return it brings brand loyalty (Olsen, 2002). Brand loyalty is different from customer loyalty.
Attitudinal aspects of customers’ are covered under brand loyalty whereas customer loyalty is one step ahead
and it covers behavioral aspects as well (Na et al., 1999). Behavioral aspects cover actual use of brand and
customers’ satisfaction after using the brand. Customer satisfaction appears after actual use of product and its
suitability with the needs of the customers. Once any product fully fulfills expectations, it becomes part of
repurchasing cart and customers tend to acquire it time and again (Hellier et al., 2003). For recurrent purchase,
customers’ circumstances and likely situations play the role of most important dependent variable. Based upon
above mentioned literature traces, problem statement for this study has been generated as:
“Does brand equity affect female customers of Pakistan in recurrent purchase decision of imported beauty care
products?”
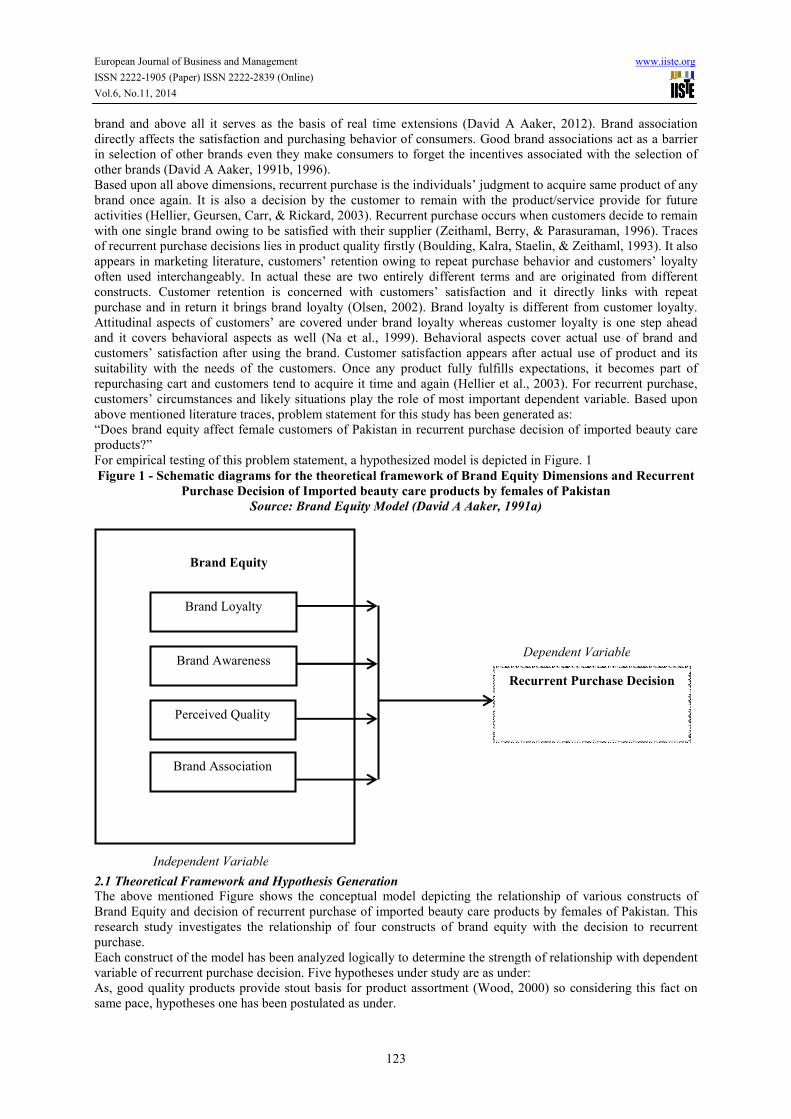
For empirical testing of this problem statement, a hypothesized model is depicted in Figure. 1
Figure 1 - Schematic diagrams for the theoretical framework of Brand Equity Dimensions and Recurrent
Purchase Decision of Imported beauty care products by females of Pakistan
Source: Brand Equity Model (David A Aaker, 1991a)
2.1 Theoretical Framework and Hypothesis Generation
The above mentioned Figure shows the conceptual model depicting the relationship of various constructs of
Brand Equity and decision of recurrent purchase of imported beauty care products by females of Pakistan. This
research study investigates the relationship of four constructs of brand equity with the decision to recurrent
purchase.
Each construct of the model has been analyzed logically to determine the strength of relationship with dependent
variable of recurrent purchase decision. Five hypotheses under study are as under:
As, good quality products provide stout basis for product assortment (Wood, 2000) so considering this fact on
same pace, hypotheses one has been postulated as under.
Brand Loyalty
Brand Equity
Brand Awareness
Perceived Quality
Brand Association
Recurrent Purchase Decision
Dependent Variable
Independent Variable
European Journal of Business and Management www.iiste.org
ISSN 2222-1905 (Paper) ISSN 2222-2839 (Online)
Vol.6, No.11, 2014
124
H1: Brand Quality has a positive impact on recurrent purchase decision
Customers hold strong connections in their minds and create unique associations with their selected brands and
these associations leads towards successive purchases if meets requirements (Chen, 2001) so based upon this
notion hypothesis two for this study has been postulated as under:
H2: Brand Association has a positive impact on recurrent purchase decision
As defined by (Na et al., 1999), brand recall and brand recognition, combines to build brand awareness which
increases probability of a particular brand name appearing in mind when a cue is given related to a product
category thus based upon this concept hypothesis three for this study has been postulated as under:
H3: Brand Awareness has a positive impact on recurrent purchase decision
Being loyal to the product, a single dissatisfied aspect cannot lead the customers towards competitors’ products
(Bowen & Shoemaker, 1998) so based on this aspect, hypothesis four has been postulated as under.
H4: Brand Loyalty has a positive impact on recurrent purchase decision
Strong brand equity leads towards high perceived quality of product, favorable brand association, resilient brand
awareness and endless brand loyalty (H.-b. Kim et al., 2003) . Summing up all in one verdict, hypothesis five has
been postulated as under.
H5: Brand Equity has a positive impact on recurrent purchase decision
3. Method of Research Study
This study is exploratory in nature and administers a causal relationship among the variables of brand equity
model by (David A Aaker, 1991a) and dependent variable of recurrent purchase decision of females of Pakistan
for imported beauty care products. All elements of Aaker’s model were appearing as independent variable
whereas recurrent purchase decision of females was appearing as a dependent variable.
Based upon indicators extracted from extensive literature review, an already tested structured and self-
administered questionnaire was selected to collect the research data from sampled females for this study. Parts of
research tool of this study were already sued by (Noone, 2010; Ponbamrungwong & Chandsawang, 2009) in
their researches. 7 points Likert scale was used to measure the multi-item constructs of this research, as already
used by Danaher and Haddrell (1996) and Oliver and Swan (1989) in their same researches,. Although
previously were tested, but Cronbach of each scale was again measured to establish the reliability. The reliability
of first scale (Noone, 2010) covering items, 2-38 was 0.910 whereas reliability of second scale
(Ponbamrungwong & Chandsawang, 2009) covering items 39-45 was 0.711. Alpha values of both the scales
were greater than .5 which acrosses the general acceptable level of .5 (Nunnally & Bernstein, 1978). Hence, both
scales reconfirmed the reliability standards and Alpha value for the complete tool was 0.915.
As research study was catering a specified group of females including only those who are users of imported
beauty care products so “purposive sampling” technique was used to serve the specific purpose of this research.
Based upon purposive sampling, responses of 211 females have been collected having age range from 18 years
to 45 years with both single and married marital status. Also both professional and non-professional females
have been analyzed under this research.
4. Data Analysis
For sensibility and theoretical assurance of each item in the data set of questionnaire, Cronbach’s Alpha Analysis
was run on selected research tool while using SPSS V.19.
While analyzing the demographics of whole sample under study, following results are extracted.
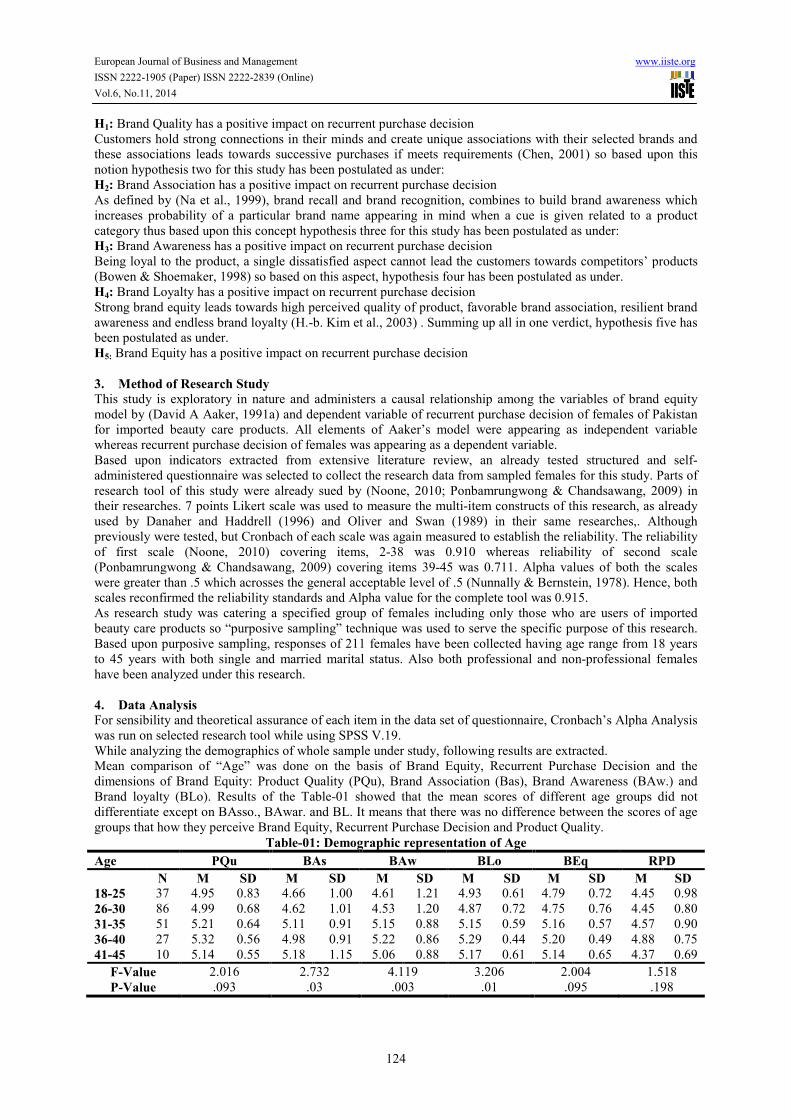
Mean comparison of “Age” was done on the basis of Brand Equity, Recurrent Purchase Decision and the
dimensions of Brand Equity: Product Quality (PQu), Brand Association (Bas), Brand Awareness (BAw.) and
Brand loyalty (BLo). Results of the Table-01 showed that the mean scores of different age groups did not
differentiate except on BAsso., BAwar. and BL. It means that there was no difference between the scores of age
groups that how they perceive Brand Equity, Recurrent Purchase Decision and Product Quality.
Table-01: Demographic representation of Age
Age PQu BAs BAw BLo BEq RPD
N M SD M SD M SD M SD M SD M SD
18-25 37 4.95 0.83 4.66 1.00 4.61 1.21 4.93 0.61 4.79 0.72 4.45 0.98
26-30 86 4.99 0.68 4.62 1.01 4.53 1.20 4.87 0.72 4.75 0.76 4.45 0.80
31-35 51 5.21 0.64 5.11 0.91 5.15 0.88 5.15 0.59 5.16 0.57 4.57 0.90
36-40 27 5.32 0.56 4.98 0.91 5.22 0.86 5.29 0.44 5.20 0.49 4.88 0.75
41-45 10 5.14 0.55 5.18 1.15 5.06 0.88 5.17 0.61 5.14 0.65 4.37 0.69
F-Value 2.016 2.732 4.119 3.206 2.004 1.518
P-Value .093 .03 .003 .01 .095 .198
European Journal of Business and Management www.iiste.org
ISSN 2222-1905 (Paper) ISSN 2222-2839 (Online)
Vol.6, No.11, 2014
125
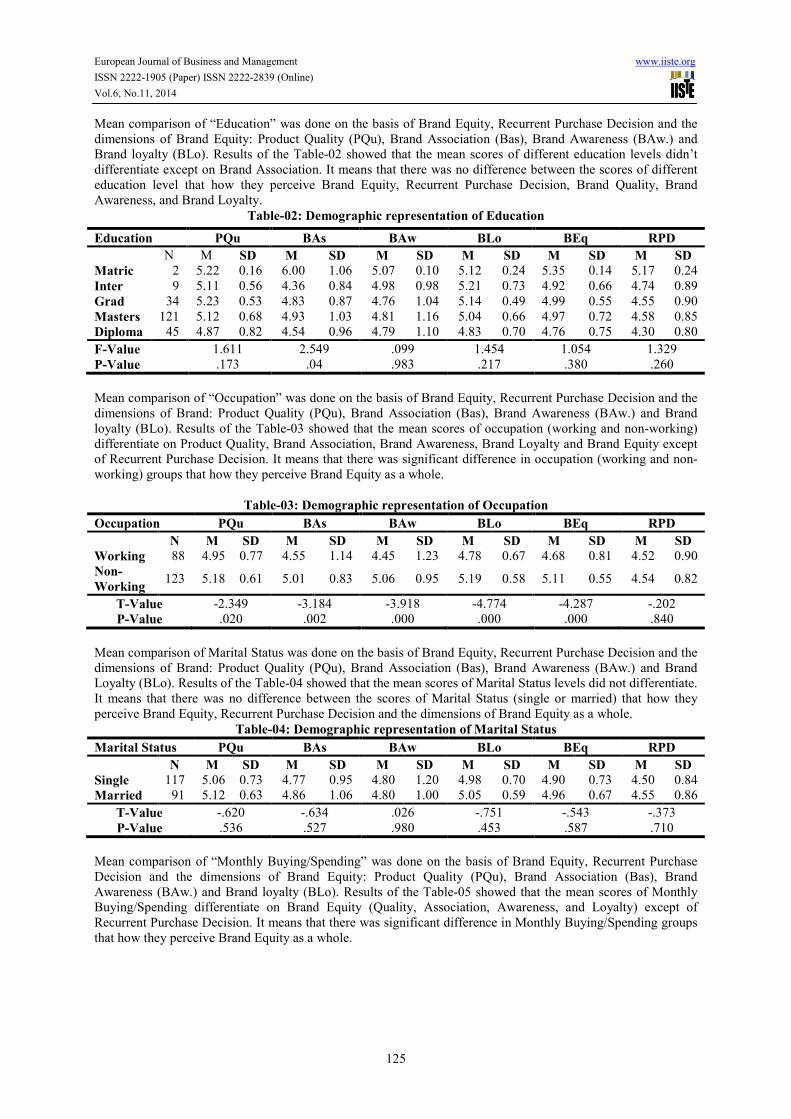
Mean comparison of “Education” was done on the basis of Brand Equity, Recurrent Purchase Decision and the
dimensions of Brand Equity: Product Quality (PQu), Brand Association (Bas), Brand Awareness (BAw.) and
Brand loyalty (BLo). Results of the Table-02 showed that the mean scores of different education levels didn’t
differentiate except on Brand Association. It means that there was no difference between the scores of different
education level that how they perceive Brand Equity, Recurrent Purchase Decision, Brand Quality, Brand
Awareness, and Brand Loyalty.
Table-02: Demographic representation of Education
Mean comparison of “Occupation” was done on the basis of Brand Equity, Recurrent Purchase Decision and the
dimensions of Brand: Product Quality (PQu), Brand Association (Bas), Brand Awareness (BAw.) and Brand
loyalty (BLo). Results of the Table-03 showed that the mean scores of occupation (working and non-working)
differentiate on Product Quality, Brand Association, Brand Awareness, Brand Loyalty and Brand Equity except
of Recurrent Purchase Decision. It means that there was significant difference in occupation (working and non-
working) groups that how they perceive Brand Equity as a whole.
Table-03: Demographic representation of Occupation
Occupation PQu BAs BAw BLo BEq RPD
N M SD M SD M SD M SD M SD M SD
Working 88 4.95 0.77 4.55 1.14 4.45 1.23 4.78 0.67 4.68 0.81 4.52 0.90
Non-
Working 123 5.18 0.61 5.01 0.83 5.06 0.95 5.19 0.58 5.11 0.55 4.54 0.82
T-Value -2.349 -3.184 -3.918 -4.774 -4.287 -.202
P-Value .020 .002 .000 .000 .000 .840
Mean comparison of Marital Status was done on the basis of Brand Equity, Recurrent Purchase Decision and the
dimensions of Brand: Product Quality (PQu), Brand Association (Bas), Brand Awareness (BAw.) and Brand
Loyalty (BLo). Results of the Table-04 showed that the mean scores of Marital Status levels did not differentiate.
It means that there was no difference between the scores of Marital Status (single or married) that how they
perceive Brand Equity, Recurrent Purchase Decision and the dimensions of Brand Equity as a whole.
Table-04: Demographic representation of Marital Status
Marital Status PQu BAs BAw BLo BEq RPD
N M SD M SD M SD M SD M SD M SD
Single 117 5.06 0.73 4.77 0.95 4.80 1.20 4.98 0.70 4.90 0.73 4.50 0.84
Married 91 5.12 0.63 4.86 1.06 4.80 1.00 5.05 0.59 4.96 0.67 4.55 0.86
T-Value -.620 -.634 .026 -.751 -.543 -.373
P-Value .536 .527 .980 .453 .587 .710
Mean comparison of “Monthly Buying/Spending” was done on the basis of Brand Equity, Recurrent Purchase
Decision and the dimensions of Brand Equity: Product Quality (PQu), Brand Association (Bas), Brand
Awareness (BAw.) and Brand loyalty (BLo). Results of the Table-05 showed that the mean scores of Monthly
Buying/Spending differentiate on Brand Equity (Quality, Association, Awareness, and Loyalty) except of
Recurrent Purchase Decision. It means that there was significant difference in Monthly Buying/Spending groups
that how they perceive Brand Equity as a whole.
Education PQu BAs BAw BLo BEq RPD
N M SD M SD M SD M SD M SD M SD
Matric 2 5.22 0.16 6.00 1.06 5.07 0.10 5.12 0.24 5.35 0.14 5.17 0.24
Inter 9 5.11 0.56 4.36 0.84 4.98 0.98 5.21 0.73 4.92 0.66 4.74 0.89
Grad 34 5.23 0.53 4.83 0.87 4.76 1.04 5.14 0.49 4.99 0.55 4.55 0.90
Masters 121 5.12 0.68 4.93 1.03 4.81 1.16 5.04 0.66 4.97 0.72 4.58 0.85
Diploma 45 4.87 0.82 4.54 0.96 4.79 1.10 4.83 0.70 4.76 0.75 4.30 0.80
F-Value 1.611 2.549 .099 1.454 1.054 1.329
P-Value .173 .04 .983 .217 .380 .260
European Journal of Business and Management www.iiste.org
ISSN 2222-1905 (Paper) ISSN 2222-2839 (Online)
Vol.6, No.11, 2014
126
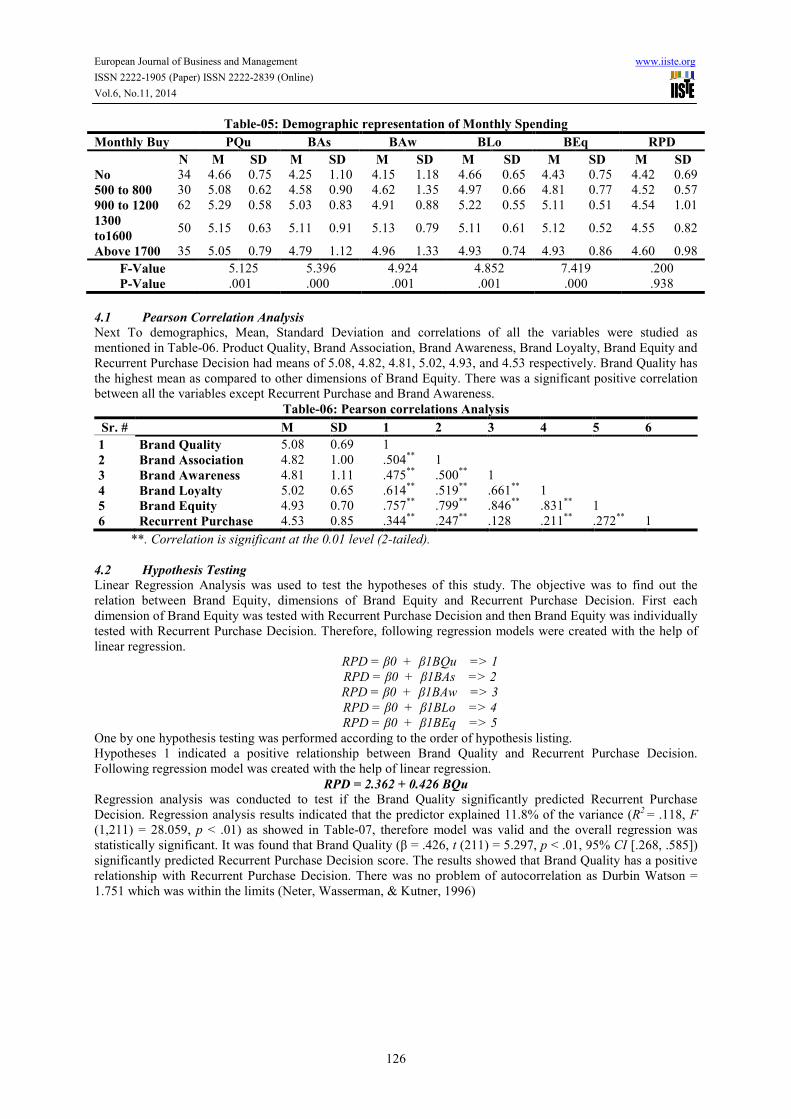
Table-05: Demographic representation of Monthly Spending
Monthly Buy PQu BAs BAw BLo BEq RPD
N M SD M SD M SD M SD M SD M SD
No 34 4.66 0.75 4.25 1.10 4.15 1.18 4.66 0.65 4.43 0.75 4.42 0.69
500 to 800 30 5.08 0.62 4.58 0.90 4.62 1.35 4.97 0.66 4.81 0.77 4.52 0.57
900 to 1200 62 5.29 0.58 5.03 0.83 4.91 0.88 5.22 0.55 5.11 0.51 4.54 1.01
1300
to1600 50 5.15 0.63 5.11 0.91 5.13 0.79 5.11 0.61 5.12 0.52 4.55 0.82
Above 1700 35 5.05 0.79 4.79 1.12 4.96 1.33 4.93 0.74 4.93 0.86 4.60 0.98
F-Value 5.125 5.396 4.924 4.852 7.419 .200
P-Value .001 .000 .001 .001 .000 .938
4.1 Pearson Correlation Analysis
Next To demographics, Mean, Standard Deviation and correlations of all the variables were studied as
mentioned in Table-06. Product Quality, Brand Association, Brand Awareness, Brand Loyalty, Brand Equity and
Recurrent Purchase Decision had means of 5.08, 4.82, 4.81, 5.02, 4.93, and 4.53 respectively. Brand Quality has
the highest mean as compared to other dimensions of Brand Equity. There was a significant positive correlation
between all the variables except Recurrent Purchase and Brand Awareness.
Table-06: Pearson correlations Analysis
Sr. # M SD 1 2 3 4 5 6
1 Brand Quality 5.08 0.69 1
2 Brand Association 4.82 1.00 .504**
1
3 Brand Awareness 4.81 1.11 .475**
.500**
1
4 Brand Loyalty 5.02 0.65 .614**
.519**
.661**
1
5 Brand Equity 4.93 0.70 .757**
.799**
.846**
.831**
1
6 Recurrent Purchase 4.53 0.85 .344**
.247**
.128 .211**
.272**
1
**. Correlation is significant at the 0.01 level (2-tailed).
4.2 Hypothesis Testing
Linear Regression Analysis was used to test the hypotheses of this study. The objective was to find out the
relation between Brand Equity, dimensions of Brand Equity and Recurrent Purchase Decision. First each
dimension of Brand Equity was tested with Recurrent Purchase Decision and then Brand Equity was individually
tested with Recurrent Purchase Decision. Therefore, following regression models were created with the help of
linear regression.
RPD = β0 + β1BQu => 1
RPD = β0 + β1BAs => 2
RPD = β0 + β1BAw => 3
RPD = β0 + β1BLo => 4
RPD = β0 + β1BEq => 5
One by one hypothesis testing was performed according to the order of hypothesis listing.
Hypotheses 1 indicated a positive relationship between Brand Quality and Recurrent Purchase Decision.
Following regression model was created with the help of linear regression.
RPD = 2.362 + 0.426 BQu
Regression analysis was conducted to test if the Brand Quality significantly predicted Recurrent Purchase
Decision. Regression analysis results indicated that the predictor explained 11.8% of the variance (R2
= .118, F
(1,211) = 28.059, p < .01) as showed in Table-07, therefore model was valid and the overall regression was
statistically significant. It was found that Brand Quality (β = .426, t (211) = 5.297, p < .01, 95% CI [.268, .585])
significantly predicted Recurrent Purchase Decision score. The results showed that Brand Quality has a positive
relationship with Recurrent Purchase Decision. There was no problem of autocorrelation as Durbin Watson =
1.751 which was within the limits (Neter, Wasserman, & Kutner, 1996)
European Journal of Business and Management www.iiste.org
ISSN 2222-1905 (Paper) ISSN 2222-2839 (Online)
Vol.6, No.11, 2014
127
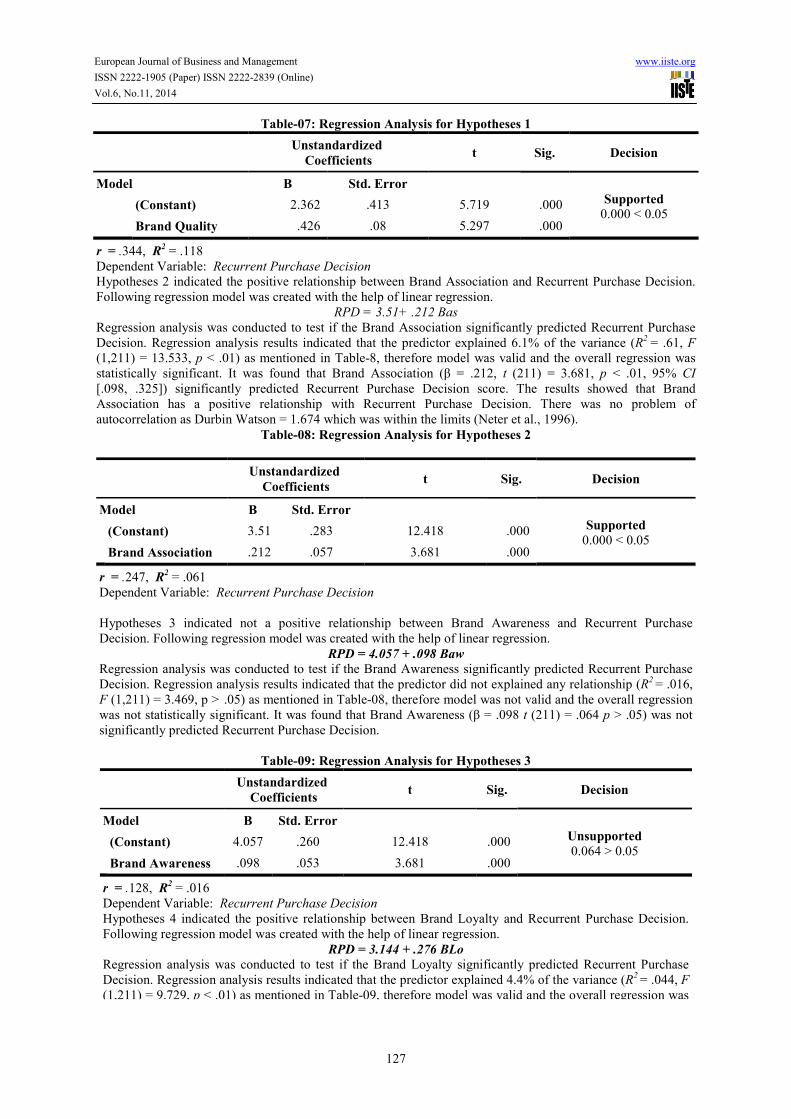
Table-07: Regression Analysis for Hypotheses 1
Unstandardized
Coefficients t Sig. Decision
Model B Std. Error
Supported
0.000 < 0.05 (Constant) 2.362 .413 5.719 .000
Brand Quality .426 .08 5.297 .000
r = .344, R2 = .118
Dependent Variable: Recurrent Purchase Decision
Hypotheses 2 indicated the positive relationship between Brand Association and Recurrent Purchase Decision.
Following regression model was created with the help of linear regression.
RPD = 3.51+ .212 Bas
Regression analysis was conducted to test if the Brand Association significantly predicted Recurrent Purchase
Decision. Regression analysis results indicated that the predictor explained 6.1% of the variance (R2
= .61, F
(1,211) = 13.533, p < .01) as mentioned in Table-8, therefore model was valid and the overall regression was
statistically significant. It was found that Brand Association (β = .212, t (211) = 3.681, p < .01, 95% CI
[.098, .325]) significantly predicted Recurrent Purchase Decision score. The results showed that Brand
Association has a positive relationship with Recurrent Purchase Decision. There was no problem of
autocorrelation as Durbin Watson = 1.674 which was within the limits (Neter et al., 1996).
Table-08: Regression Analysis for Hypotheses 2
Unstandardized
Coefficients t Sig. Decision
Model B Std. Error
Supported
0.000 < 0.05 (Constant) 3.51 .283 12.418 .000
Brand Association .212 .057 3.681 .000
r = .247, R2 = .061
Dependent Variable: Recurrent Purchase Decision
Hypotheses 3 indicated not a positive relationship between Brand Awareness and Recurrent Purchase
Decision. Following regression model was created with the help of linear regression.
RPD = 4.057 + .098 Baw
Regression analysis was conducted to test if the Brand Awareness significantly predicted Recurrent Purchase
Decision. Regression analysis results indicated that the predictor did not explained any relationship (R2 = .016,
F (1,211) = 3.469, p > .05) as mentioned in Table-08, therefore model was not valid and the overall regression
was not statistically significant. It was found that Brand Awareness (β = .098 t (211) = .064 p > .05) was not
significantly predicted Recurrent Purchase Decision.
Table-09: Regression Analysis for Hypotheses 3
Unstandardized
Coefficients t Sig. Decision
Model B Std. Error
Unsupported
0.064 > 0.05 (Constant) 4.057 .260 12.418 .000
Brand Awareness .098 .053 3.681 .000
r = .128, R2 = .016
Dependent Variable: Recurrent Purchase Decision
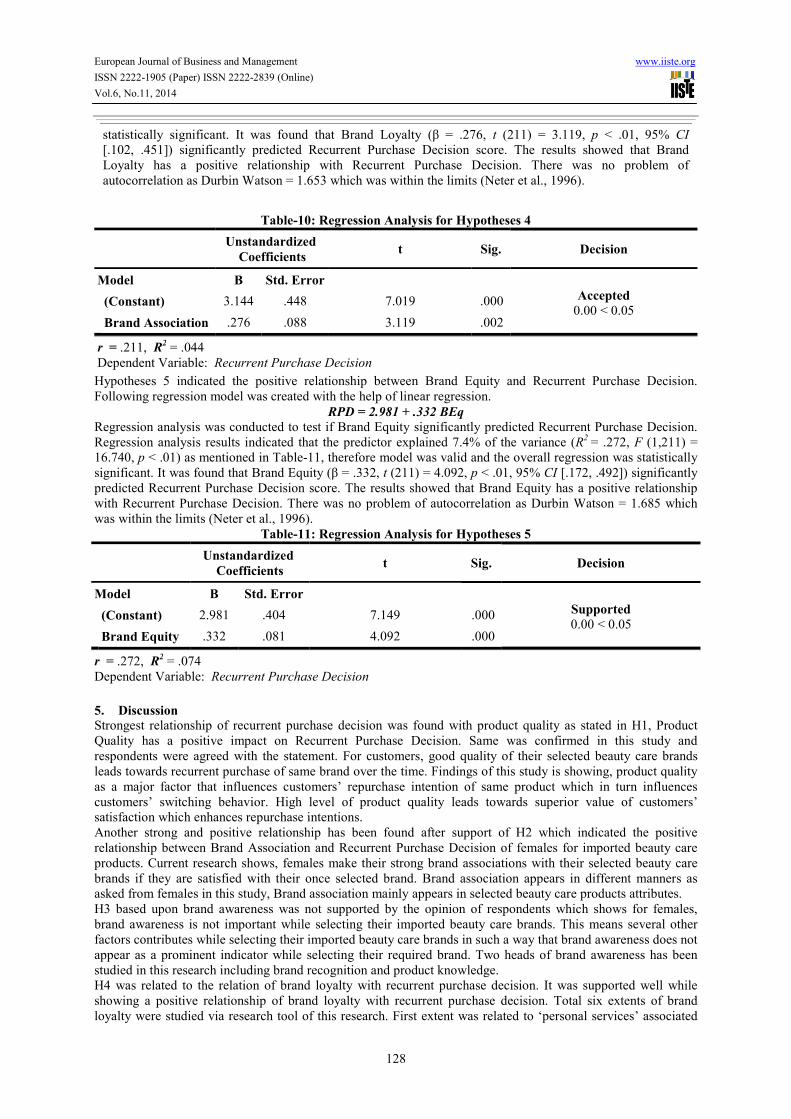
Hypotheses 4 indicated the positive relationship between Brand Loyalty and Recurrent Purchase Decision.
Following regression model was created with the help of linear regression.
RPD = 3.144 + .276 BLo
Regression analysis was conducted to test if the Brand Loyalty significantly predicted Recurrent Purchase
Decision. Regression analysis results indicated that the predictor explained 4.4% of the variance (R2 = .044, F
(1,211) = 9.729, p < .01) as mentioned in Table-09, therefore model was valid and the overall regression was
European Journal of Business and Management www.iiste.org
ISSN 2222-1905 (Paper) ISSN 2222-2839 (Online)
Vol.6, No.11, 2014
128
statistically significant. It was found that Brand Loyalty (β = .276, t (211) = 3.119, p < .01, 95% CI
[.102, .451]) significantly predicted Recurrent Purchase Decision score. The results showed that Brand
Loyalty has a positive relationship with Recurrent Purchase Decision. There was no problem of
autocorrelation as Durbin Watson = 1.653 which was within the limits (Neter et al., 1996).
Table-10: Regression Analysis for Hypotheses 4
Unstandardized
Coefficients t Sig. Decision
Model B Std. Error
Accepted
0.00 < 0.05 (Constant) 3.144 .448 7.019 .000
Brand Association .276 .088 3.119 .002
r = .211, R2 = .044
Dependent Variable: Recurrent Purchase Decision
Hypotheses 5 indicated the positive relationship between Brand Equity and Recurrent Purchase Decision.
Following regression model was created with the help of linear regression.
RPD = 2.981 + .332 BEq
Regression analysis was conducted to test if Brand Equity significantly predicted Recurrent Purchase Decision.
Regression analysis results indicated that the predictor explained 7.4% of the variance (R2
= .272, F (1,211) =
16.740, p < .01) as mentioned in Table-11, therefore model was valid and the overall regression was statistically
significant. It was found that Brand Equity (β = .332, t (211) = 4.092, p < .01, 95% CI [.172, .492]) significantly
predicted Recurrent Purchase Decision score. The results showed that Brand Equity has a positive relationship
with Recurrent Purchase Decision. There was no problem of autocorrelation as Durbin Watson = 1.685 which
was within the limits (Neter et al., 1996).
Table-11: Regression Analysis for Hypotheses 5
Unstandardized
Coefficients t Sig. Decision
Model B Std. Error
Supported
0.00 < 0.05 (Constant) 2.981 .404 7.149 .000
Brand Equity .332 .081 4.092 .000
r = .272, R2 = .074
Dependent Variable: Recurrent Purchase Decision
5. Discussion
Strongest relationship of recurrent purchase decision was found with product quality as stated in H1, Product
Quality has a positive impact on Recurrent Purchase Decision. Same was confirmed in this study and
respondents were agreed with the statement. For customers, good quality of their selected beauty care brands
leads towards recurrent purchase of same brand over the time. Findings of this study is showing, product quality
as a major factor that influences customers’ repurchase intention of same product which in turn influences
customers’ switching behavior. High level of product quality leads towards superior value of customers’
satisfaction which enhances repurchase intentions.
Another strong and positive relationship has been found after support of H2 which indicated the positive
relationship between Brand Association and Recurrent Purchase Decision of females for imported beauty care
products. Current research shows, females make their strong brand associations with their selected beauty care
brands if they are satisfied with their once selected brand. Brand association appears in different manners as
asked from females in this study, Brand association mainly appears in selected beauty care products attributes.
H3 based upon brand awareness was not supported by the opinion of respondents which shows for females,
brand awareness is not important while selecting their imported beauty care brands. This means several other
factors contributes while selecting their imported beauty care brands in such a way that brand awareness does not
appear as a prominent indicator while selecting their required brand. Two heads of brand awareness has been
studied in this research including brand recognition and product knowledge.
H4 was related to the relation of brand loyalty with recurrent purchase decision. It was supported well while
showing a positive relationship of brand loyalty with recurrent purchase decision. Total six extents of brand
loyalty were studied via research tool of this research. First extent was related to ‘personal services’ associated
European Journal of Business and Management www.iiste.org
ISSN 2222-1905 (Paper) ISSN 2222-2839 (Online)
Vol.6, No.11, 2014
129
with selected imported beauty care brand. This extent was covering seven items based upon reliability, products
updates, manufacturers’ local market knowledge, manufacturer’s approach, product speaks, manufacturer’s trust
worthiness in provision of quality products and recurring need fulfillment. Females supported the extract while
endorsing that their selected important beauty care products are reliable enough to add up regular product
updates in their products.
H5 was based upon relationship of overall brand equity with recurrent purchase decisions of female customers
regarding their imported beauty care products. This postulate was stated in order to judge a combine effect of all
four dimensions of brand equity including brand quality, brand association, brand awareness and brand loyalty.
Need for this postulation was raised as instigation was found from previous researches, customer based brand
equity occurs when customers have very high level of brand awareness, hold some strong brand association,
have favorable perception about brand quality and have unique brand loyalty regarding their selected beauty care
brands. (David A Aaker, 1991a; Keller, 2003) So keeping in mind this provocation, brand equity as a composite
variable was studied in relation with recurrent purchase decision. All the items asked under each dimension of
brand equity including Brand Quality, Brand Consciousness, Brand Awareness and Brand Loyalty separately
were analyzed under single head of brand equity. This hypothesis was also supported and notion was, females
like to be satisfied with maximum possible aspects of their selected imported beauty care products in order to
repurchase the same product again and again.
Since total four dimensions of Aaker’s Brand Equity Model were studied under this composite head, three out of
four were supported well including product quality, brand association and brand loyalty except one as brand
awareness. So significant contribution in brand equity model for females in selection of imported beauty care
products comes from product quality, brand association and band loyalty which indicate, for females to
repurchase their selected imported beauty care products repeatedly, they seek first of all quality as this head
explains 11.8% variance then their association which indicates 6.11% variance with their selected imported
beauty care products then comes their loyalty with the selected beauty care products which explains 4.4%
variance. For females of Pakistan, major role in establishing brand equity lies in product quality. If product
quality is found to be good every time, females establish their brand equity with their selected products well. Our
current research also confirms the previous researches on same topic conducted by (H.-b. Kim et al., 2003; Yoo
& Donthu, 2001). Their findings contribute; strongest impact is demonstrated by product quality as essential role
for developing brand equity. In addition, next contribution for brand equity comes from brand association which
is also positively related to brand equity. Based on this impression, a study was conducted by (Tong & Hawley,
2009) on sportswear brands in China and again confirmed the same. This current study is also consistent with
previous studies and further contributes, strong brand association support a competitively distinct and attractive
brand position while creating a favorable feelings and behaviors towards the brand and bring lasting customers’
satisfaction based recurrent purchase behavior of females of Pakistan. As statistical tests and empirical data in
this study did not provide enough support for a direct and positive relationship of brand awareness and recurrent
purchase decision, so in creation of brand equity, role of brand awareness is not demarcated. It indicates, having
only a great brand name is not essential for customers to create brand equity for the brand rather in some ways, it
may not contribute enough in repurchase intentions of same brand again and again.
Based upon all results congregated in this research, it has been found, Brand equity itself is a complicated
phenomenon and presented model in this research (based upon (David A Aaker, 1991a) working) explains only
7.4% variance which in turn indicates, other than the dimensions studied in this research there could be many
more dimensions that contribute for brand equity as a whole and leads females of Pakistan for recurrent purchase
of their selected imported beauty care products.
6. Conclusion
Extracted from results of this research, females of Pakistan perceived foreign beauty care products as higher
quality and they prefer to consume products of imported beauty care brands abundantly. This notion has been
embedded that apart from any age group, any social status or having any spending range on their beauty care
products, females always strive for imported beauty care products and preferred to consume them more as
compared to local ones. Keeping in view this psychic thinking of females of Pakistan, this research study was
started with the research question: “Does brand equity affect female consumers in recurrent purchase decision of
imported beauty care products?” (David A Aaker, 1991a) Brand Equity Model has been selected to investigate
the deep down insight of this research question. Due research settings has been made in order to investigate the
notion. Based on this selected model, total five hypotheses were postulated keeping in view each dimension of
the model (Product Quality, Brand Consciousness, Brand Awareness, Brand Loyalty and overall Brand Equity).
Five postulated hypotheses are tested empirically while gathering data from females of Pakistan using products
of imported beauty care brands. Conclusion is drawn from whole research study as; Consumers in every market
confront various kinds of brand and products available in any market. Consumers always like to find more and
more merchandises in their available market in order to get more opportunities to select their suitable provides.
European Journal of Business and Management www.iiste.org
ISSN 2222-1905 (Paper) ISSN 2222-2839 (Online)
Vol.6, No.11, 2014
130
Same is particularly true for cosmetic market of Pakistan. Here females have abundant market spread of both
foreign and local beauty care products. Having concept of superiority nature of imported products, this study has
been conducted. Since large number of products from all renowned cosmetics manufacturer companies are
imported every year so at one hand product range of these imported products provides large variety chunk to
females in order to select their own suitable products and at the other hand it provides highly competitive
situation in which marketers have to work extensively in order to gain due market share in the form of
continuous purchasing of once selected product. For this purpose marketers have to attain maximum customer
satisfaction from their products. In order to judge satisfaction based recurrent purchasing of imported beauty care
products, females products’ quality consciousness, brand association, brand awareness and brand loyalty has
been checked while using Aaker’s brand equity model. Responses of 211 females have been analyzed in this
research study. Previously, no such study was found particularly based upon females of Pakistan but notion was
available, females had more positive attitude towards foreign brands as compared to local ones and they assume
them more reliable than domestic ones. Brand equity model for all four dimensions was analyzed to contribute
the literature regarding basis of females’ recurrent purchase of imported beauty care products. Significant and
favorable relation is found for brand quality, brand association and brand loyalty with recurrent purchase while a
non-significant relation is found between brand awareness and recurrent purchase. First and very prominent
instance was related to product quality and same has been confirmed from statistics of this research study as well.
It has been concluded that product quality has a major contribution while selecting any imported beauty care
product once to next. Females showed, less important of brand awareness for recurrent purchase decision of
same brand whereas brand associations and brand loyalty also provide basis for recurrent purchase decision to
females of our territory.
7. Value addition Contribution
This research study has its specified contribution in literature as all previous researches conducted in the context
of Pakistan are mainly examine the relationship of brand quality, brand consciousness, brand awareness, brand
association and brand loyalty independently and primarily were showing their liberated relation with product
satisfaction as already studied by (Awan, Bukhari, & Iqbal, 2011; Razi et al., 2013) whereas this study is
summing up all these elements in the form of “Aakers’ Brand Equity Model” and moving beyond the customer
satisfaction while analyzing “recurrent purchase decision” of customers which occurs after due satisfaction. In
other words, this research is moving one step ahead than previously done researches in this area as no noticeable
work has been done in Pakistan to investigate these four popular constructs of brand equity simultaneously while
analyzing their relation with recurrent purchase decision of females. .
Secondly, this research is focusing on “female” members of society of Pakistan and again female focused
researches, primarily on the topic studied in this research are not conducted before so again this research study
has its own contribution keeping in view significance of gender based information summed up in this research.
Lastly, although imported beauty care products are abundantly in use of whole community of Pakistan but still
not a detailed research covering all brand related aspects of these products is presentably available so this
research study is filling this gap rigorously and will surely serve as mile stone for all future researches on this
same topic.
8. Managerial implication
Managerial implications can be described in two ways, implications for foreign manufacturers and future
implications for local managers.
8.1 Implications for Foreign Manufacturers
First and foremost managerial implication in the light of research results of this study is for the manufacturing
managers of imported beauty care products. They should steadily concentrate on “brand awareness mechanisms”
as this study is showing weaker brand awareness among the females of Pakistan for imported beauty care
products. Managers must review their efforts which they are currently performing in order to create brand
awareness among the females of Pakistan for their imported beauty care brands and products. For this, they may
enhance their promotional mix while adding more promotional ways which are not currently the part of their
promotional campaigns. For this managers could have more celebrity endorsements, sponsorships of various
social activities, more advertisements across various medias, priceless promotions and revision of marketing
strategies in order to make them more effective as endorsed by (J. L. Aaker, 1997; Cobb-Walgren et al., 1995;
Keller, 2009; Yoo et al., 2000).
Second implication for manufacturing managers of imported beauty care brands is, they must consider well the
inter relationships of all four elements of brand equity, especially product quality, brand association and brand
loyalty. They must clearly take into account the relation of brand quality and brand loyalty as keeping in account
the results of this whole research, these are the most important elements of recurrent purchase decision. So
managers should understand clearly, for getting recurrent purchases by same customers, they have to provide
European Journal of Business and Management www.iiste.org
ISSN 2222-1905 (Paper) ISSN 2222-2839 (Online)
Vol.6, No.11, 2014
131
continuous quality products with regular quality updates which will create loyal customers and these loyal
customers will surely have recurrent purchases along with referring to new customers as well.
8.2 Implications for Local Manufacturers
For local managers, implication of this research can lie in creation of brand awareness about their own beauty
care brands. Since this study has found weak relation of brand awareness with recurrent purchase decision so
although females are indulged in use of imported beauty care products but even then lack of awareness is there.
Local firms can get benefit of this situation while creating awareness of their own products in the minds of
female customers of Pakistan. Since they are present within the market, they may better correspond with the
customers instead of foreign managers so they must get benefit of this situation.
Second implication for local managers can be, as this study is showing, females are quality conscious about the
beauty care products which they use in routine so they must pay special attention towards quality related aspects
of their products and if flaws are there, they must eliminate them in order to cater their customers for longer run.
9. Research Limitations
First and foremost limitation of this study is, it is focusing to determine the brand equity based recurrent
purchase behavior of females of Pakistan only which means it is mainly targeting half of the total population as
no males attitudes and insights are judged by this research although males are also equally indulged now in use
of beauty care products.
Secondly, this research is steering brand equity based recurrent purchase behavior of a specific product class
only (imported beauty care products) although determined inferences of this research can also be implemented
on other product categories but no route is defined for this as research implications of beauty care products may
not correspond fully to other markets.
Lastly, this research was conducted in specified territories of Pakistan (including Lahore, Karachi, Islamabad and
Faisalabad) so composition of selected sample is not analogous enough to represent maximum population of
Pakistan.
10. Future Research Scope
Firstly, future research could be initiated while expending the sample range with males as well. While doing so,
not only males’ response will be gathered, also a comparative research based finding will be available which will
surely give a complete picture regarding insight of whole beauty care product’s market of Pakistan.
Secondly, while getting the basis from this current research study, future researches can be done on other product
industries as well while judging the Brand Equity based behavior of both males and females for products of each
industry.
Thirdly, to get more soft insights of respondents regarding feelings and attachments with their selected brands, a
future qualitative measures based research can also be initiated either for same sample range or while expanding
this range in any ways.
Fourthly, This research is broadly targeting the segment of ‘beauty care products’ although clear segregation of
beauty care products has been defined now so future research should be category based and it must endeavor a
large range of all those beauty care products which are radially available in the market of Pakistan.
Fifthly, while keeping in view managerial implications of this research, if more brand awareness campaigns are
launched by various manufacturers of beauty care brands, same study can be repeated in future while judging the
behavioral alteration in females of this territory.
Lastly, if covered larger geographical area in any future research, it will correspond a better representative
sample size of females and results will be more generalizable.
REFERENCES
Aaker, D. A. (1991a). Managing Brand Equity. The Free Press, New York, 206.
Aaker, D. A. (1991b). Managing brand equity: Capitalising on the value of a brand name. New York.
Aaker, D. A. (1996). Measuring brand equity across products and markets. California management review, 38(3),
103.
Aaker, D. A. (2011). Building strong brands: Simon and Schuster.
Aaker, D. A. (2012). Brand extensions: the good, the bad and the ugly. Sloan Management Review.
Aaker, J. L. (1997). Dimensions of brand personality. Journal of Marketing Research, 347-356.
Adams, G. R. (1977). Physical attractiveness research: Toward a developmental social psychology of beauty.
Human development.
Andrew, M. (2011). Aspirations of Beauty. Aurora by Dawn Media Group(6th), 66-67.
Awan, H. M., Bukhari, K. S., & Iqbal, A. (2011). Service quality and customer satisfaction in the banking sector:
a comparative study of conventional and Islamic banks in Pakistan. Journal of Islamic Marketing, 2(3),
203-224.
European Journal of Business and Management www.iiste.org
ISSN 2222-1905 (Paper) ISSN 2222-2839 (Online)
Vol.6, No.11, 2014
132
Bendixen, M., Bukasa, K. A., & Abratt, R. (2004). Brand equity in the business-to-business market. Industrial
Marketing Management, 33(5), 371-380.
Boulding, W., Kalra, A., Staelin, R., & Zeithaml, V. A. (1993). A dynamic process model of service quality:
from expectations to behavioral intentions. Journal of marketing research, 30(1), 7-27.
Bowen, J. T., & Shoemaker, S. (1998). Loyalty: A strategic commitment. Cornell Hotel and Restaurant
Administration Quarterly, 39(1), 12-25.
Castañeda, A. I. (1997). Engendering the History of Alta California, 1769-1848: Gender, Sexuality, and the
Family. California History, 76(2/3), 230-259.
Chen, A. C.-H. (2001). Using free association to examine the relationship between the characteristics of brand
associations and brand equity. Journal of Product & Brand Management, 10(7), 439-451.
Cobb-Walgren, C. J., Ruble, C. A., & Donthu, N. (1995). Brand equity, brand preference, and purchase intent.
Journal of Advertising, 24(3), 25-40.
Cohen, D., Gan, C., Au Yong, H. H., & Choong, E. (2006). Customer satisfaction: a study of bank customer
retention in New Zealand: Lincoln University. Commerce Division.
Coleman, R., & Figueroa, M. M. (2010). Past and Future Perfect? Beauty, Affect and Hope. Journal for Cultural
Research, 14(4), 357-373.
Hallowell, R. (1996). The relationships of customer satisfaction, customer loyalty, and profitability: an empirical
study. International Journal of Service Industry Management, 7(4), 27-42.
Hellier, P. K., Geursen, G. M., Carr, R. A., & Rickard, J. A. (2003). Customer repurchase intention: a general
structural equation model. European Journal of Marketing, 37(11/12), 1762-1800.
Hirschman, E. C., & Holbrook, M. B. (1982). Hedonic consumption: emerging concepts, methods and
propositions. The Journal of Marketing, 92-101.
Iglesias, M. P., & Guillén, M. J. Y. (2004). Perceived quality and price: their impact on the satisfaction of
restaurant customers. International Journal of Contemporary Hospitality Management, 16(6), 373-379.
Johnston, J., & Taylor, J. (2008). Feminist consumerism and fat activists: A comparative study of grassroots
activism and the Dove real beauty campaign. Signs, 33(4), 941-966.
Keller, K. L. (2003). Brand synthesis: The multidimensionality of brand knowledge. Journal of consumer
research, 29(4), 595-600.
Keller, K. L. (2009). Building strong brands in a modern marketing communications environment. Journal of
marketing communications, 15(2-3), 139-155.
Kim, H.-b., Kim, W. G., & An, J. A. (2003). The effect of consumer-based brand equity on firms’ financial
performance. Journal of consumer marketing, 20(4), 335-351.
Kim, W. G., & Kim, H.-B. (2004). Measuring customer-based restaurant brand equity. Cornell Hotel and
Restaurant Administration Quarterly, 45(2), 115-131.
Lane, K. K. (2003). Strategic brand management: building, measuring, and managing brand equity: Prentice Hall,
Upper Saddle River.
Lassar, W., Mittal, B., & Sharma, A. (1995). Measuring customer-based brand equity. Journal of consumer
marketing, 12(4), 11-19.
Liao, H., & Chuang, A. (2004). A multilevel investigation of factors influencing employee service performance
and customer outcomes. The Academy of Management Journal, 41-58.
Macdonald, E., & Sharp, B. (2003). Management perceptions of the importance of brand awareness as an
indication of advertising effectiveness. Massey University, Department of Marketing.
Manto, E. A. (2011). The Beauty Mindset. Aurora by Dawn Media Group(6th), 24-25.
Miller, L. (2008). Japan's Cinderella Motif: Beauty Industry and Mass Culture Interpretations of a Popular Icon.
Asian Studies Association of Australia, 32(3), 393-409.
Motameni, R., & Shahrokhi, M. (1998). Brand equity valuation: a global perspective. Journal of Product &
Brand Management, 7(4), 275-290.
Myers, C. A. (2003). Managing brand equity: a look at the impact of attributes. Journal of Product & Brand
Management, 12(1), 39-51.
Na, W. B., Marshall, R., & Keller, K. L. (1999). Measuring brand power: validating a model for optimizing
brand equity. Journal of Product & Brand Management, 8(3), 170-184.
Neter, J., Wasserman, W., & Kutner, M. H. (1996). Applied linear statistical models (Vol. 4): Irwin Chicago.
Noone, A. (2010). Is there a relationship between Aaker's Brand Equity Management model and repurchasing of
commercial grade exercise equipment in the Australian fitness industry?, 84-85.
Nunnally, J. C., & Bernstein, I. (1978). Psychometry theory: New York: McGraw Hill Book Company.
O'Reilly, N. (2009). Value Creation: The Power of Brand Equity.
Oh, H. (2000). The effect of brand class, brand awareness, and price on customer value and behavioral intentions.
Journal of Hospitality & Tourism Research, 24(2), 136-162.
Olsen, S. O. (2002). Comparative evaluation and the relationship between quality, satisfaction, and repurchase
European Journal of Business and Management www.iiste.org
ISSN 2222-1905 (Paper) ISSN 2222-2839 (Online)
Vol.6, No.11, 2014
133
loyalty. Journal of the Academy of Marketing Science, 30(3), 240-249.
Percy, L., & Rossiter, J. R. (1992). A model of brand awareness and brand attitude advertising strategies.
Psychology & Marketing, 9(4), 263-274.
Ponbamrungwong, A., & Chandsawang, S. (2009). The impact of brand on Thai female consumer in purchase
decision of foreign makeup product. Mälardalen University.
Rao, V. R., Agarwal, M. K., & Dahlhoff, D. (2004). How is manifest branding strategy related to the intangible
value of a corporation? Journal of Marketing, 126-141.
Razi, A., Ilyas, J., Bhatti, M. B., Moin, M. K., Haseeb, S., Ali, S., & Ahmed, H. M. (2013). Is Youth Brand
Conscious. Global Journal of Management And Business Research, 13(5).
Tong, X., & Hawley, J. M. (2009). Measuring customer-based brand equity: empirical evidence from the
sportswear market in China. Journal of Product & Brand Management, 18(4), 262-271.
Wang, C.-L., Siu, N. Y., & Hui, A. S. (2004). Consumer decision-making styles on domestic and imported brand
clothing. European Journal of Marketing, 38(1/2), 239-252.
Wood, L. (2000). Brands and brand equity: definition and management. Management decision, 38(9), 662-669.
Yoo, B., & Donthu, N. (2001). Developing and validating a multidimensional consumer-based brand equity
scale. Journal of Business Research, 52(1), 1-14.
Yoo, B., Donthu, N., & Lee, S. (2000). An examination of selected marketing mix elements and brand equity.
Journal of the Academy of Marketing Science, 28(2), 195-211.
Yu, S. H. (2007). An empirical investigation on the economic consequences of customer satisfaction. Total
Quality Management, 18(5), 555-569.
Zeithaml, V. A., Berry, L. L., & Parasuraman, A. (1996). The behavioral consequences of service quality. The
Journal of Marketing, 31-46.
The IISTE is a pioneer in the Open-Access hosting service and academic event
management. The aim of the firm is Accelerating Global Knowledge Sharing.
More information about the firm can be found on the homepage:
http://www.iiste.org
CALL FOR JOURNAL PAPERS
There are more than 30 peer-reviewed academic journals hosted under the hosting
platform.
Prospective authors of journals can find the submission instruction on the
following page: http://www.iiste.org/journals/ All the journals articles are available
online to the readers all over the world without financial, legal, or technical barriers
other than those inseparable from gaining access to the internet itself. Paper version
of the journals is also available upon request of readers and authors.
MORE RESOURCES
Book publication information: http://www.iiste.org/book/
Recent conferences: http://www.iiste.org/conference/
IISTE Knowledge Sharing Partners
EBSCO, Index Copernicus, Ulrich's Periodicals Directory, JournalTOCS, PKP Open
Archives Harvester, Bielefeld Academic Search Engine, Elektronische
Zeitschriftenbibliothek EZB, Open J-Gate, OCLC WorldCat, Universe Digtial
Library , NewJour, Google Scholar