Embed Size (px)
Citation preview
Research Article
To Evaluate the Effect of Solvents and Different Relative Humidity Conditionson Thermal and Rheological Properties of Microcrystalline Cellulose 101 UsingMETHOCEL™ E15LV as a Binder
Moksh Jagia,1 Maitri Trivedi,2 and Rutesh H. Dave1,3
Received 22 July 2015; accepted 25 September 2015; published online 19 October 2015
Abstract. The solvent used for preparing the binder solution in wet granulation can affect the granulationend point and also impact the thermal, rheological, and flow properties of the granules. The present studyinvestigates the effect of solvents and percentage relative humidity (RH) on the granules of microcrys-talline cellulose (MCC) with hydroxypropyl methyl cellulose (HPMC) as the binder. MCC was granulatedusing 2.5% w/w binder solution in water and ethanol/water mixture (80:20 v/v). Prepared granules weredried until constant percentage loss on drying, sieved, and further analyzed. Dried granules were exposedto different percentage RH for 48 h at room temperature. Powder rheometer was used for the rheologicaland flow characterization, while thermal effusivity and differential scanning calorimeter were used forthermal analysis. The thermal effusivity values for the wet granules showed a sharp increase beginning50% w/w binder solution in both cases, which reflected the over-wetting of granules. Ethanol/watersolvent batches showed greater resistance to flow as compared to the water solvent batches in the wetgranule stage, while the reverse was true for the dried granule stage, as evident from the basic flowabilityenergy values. Although the solvents used affected the equilibration kinetics of moisture content, the RH-exposed granules remained unaffected in their flow properties in both cases. This study indicates that thesolvents play a vital role on the rheology and flow properties of MCC granules, while the different RHconditions have little or no effect on them for the above combination of solvent and binder.
KEY WORDS: end point; granulation; powder rheology; relative humidity; thermal effusivity.
INTRODUCTION
In recent years, granulation has been studied extensively.With tablets and capsules being the most common and conve-nient solid oral dosage forms, an optimally designed granula-tion technology can act as a tremendous tool for minimizingthe variability in the batches, and hence diminishing the risk ofpoor quality (1). Over the past few decades, the practice ofpharmaceutical granulation, especially wet granulation, hasevolved scientifically and technologically. Wet granulation isdefined as the process of mixing the drug and the filler pow-ders together, and subsequently, wetting them by a bindersolution to obtain agglomerates such that the individual par-ticles can still be differentiated (2). The type and theconcentration of the binder solution used plays a critical rolein the wet granulation end point determination (3,4) and alsoon the various physical attributes of the tablets (5,6) such ashardness, friability (7), dissolution time (8), disintegration
time (9), compressibility, and the content uniformity of thetablets (10).
End point in wet granulation refers to the point and theappropriate time at which the granules reach the desired stageof similar mean particle size distribution, density, andhomogeneity (11) irrespective of the processing variables suchas the impeller or chopper speed and the binder addition rate(12). Although there is no generalized method of end pointdetection in wet granulation, a few methods like NIR spec-troscopy (13), torque measurements (14), and power con-sumption (15) have been used successfully to date. Recently,thermal effusivity measurements have come up as a novel toolto determine the end point of wet granulation by measuringpowder energies and thermal properties (16,17).
Microcrystalline cellulose (MCC) is one of the most com-monly used pharmaceutical excipient in the production oftablets and capsules. It can be used both as a diluent or binderin the wet granulation and direct compression processes.Binders play an important role in determining the hardnessand friability of the tablets (18). HPMC cellulose ethers servesas a great binder and adhesive in the wet granulation step forthe production of the immediate and sustained release tablets(19,20). The viscosity and surface tension of the binder solu-tion are known to impact the granulation mechanism depend-ing on the capillary and viscous forces (21).
1 Division of Pharmaceutical Sciences, Arnold & Marie Schwartz Col-lege of Pharmacy and Health Sciences, Long Island University,Brooklyn, New York 11201, USA.
2 Norwich Pharmaceuticals, Norwich, New York 13815, USA.3 To whom correspondence should be addressed. (e-mail:[email protected])
AAPS PharmSciTech, Vol. 17, No. 4, August 2016 (# 2015)DOI: 10.1208/s12249-015-0424-8
995 1530-9932/1 /0400-0995/0 # 2015 American Association of Pharmaceutical Scientists6
The flow properties of the granules formed after wetgranulation are greatly influenced by the environmental con-ditions, such as humidity and temperature, under which thegranules are stored in hoppers, transported, formulated,mixed, compressed, and packaged (22,23). So, the significanceof understanding the powder rheological properties with anoutlook to obtain the desired reproducible end results cannotbe negated (24,25). The traditional methods like angle ofrepose (26), bulk and tapped density (27), Carr’s compress-ibility index (28), and Hausner’s ratio (29) have long beenused for the powder flow characterization, but the lack ofreproducibility and predictability paved ways to the need fornovel methods. With the advancement in technology, newmethods such as shear cell (30,31), avalanche testing (32),cohesivity determination (33), torque rheometer (34),penetrometry (35), atomic force microscopy (36), and powderrheometer (37) have been successfully used, but no specificmethod has still been standardized for the assessment of pow-der flow properties. Powder rheometer has shown reproduc-ible and acceptable results in measuring the dynamic, bulk,and shear properties of powders (38,39).
The aim of the above-mentioned study was to evaluate theuse of the thermal effusivity probe and the freeman technology(FT4) powder rheometer, as joint tools in determining the effectof solvents on the optimum wet granulation end point of theMCC granules, formed with hydroxypropyl methyl cellulose(HPMC) as a liquid binder in water and ethanol/water (80:20)solvent systems. Besides this, the primary purpose of the re-search was to assess the effect of the solvents used above on therheological properties of the wet and dried granules using thepowder rheometer. In addition to this, it focuses on the impact ofdifferent levels of humidity on the flow properties of the driedgranules, for the above combination of solvent and binder. Theabove-mentioned study shall help the formulation scientists inthe selection of suitable solvents and optimum storage condi-tions for the granules, in terms of their rheological and flowproperty values. These values can, in turn, help in assessingthe stability of the granules when exposed to the different hu-midity environment, which always remains an area of concernfor the pharmaceutical industry.
MATERIALS AND METHODS
Materials
Microcrystalline Cellulose (Avicel® PH-101 NF, lot#:P113825474 FMC Biopolymer, Philadelphia, PA) was used asgiven. Hydroxypropyl methyl cellulose (METHOCEL™ E15Premium LV lot# VL23012406 a trademark of the Dow Chem-ical Company, Midland, MI) was used as a binder solutionwith deionized water (Barnstead Nanopure – Thermo scien-tific system, Waltham, MA) collected below 13 mΩ/cm andethyl alcohol (190 proof ACS/USP grade, lot# C1202101,Pharmco Products Inc., Brookfield, CT) as solvents.
Small-Scale Preparations
Ten grams of MCC 101 was granulated with varying (5,10, 15, 20, 25, 30, 35, 40, 45, 50, 55, 60) percentage (% w/w)concentration of HPMC E15 (2.5% w/w) as binder usingwater and ethanol/water (80:20) mixture as solvents in a
mortar and pestle. Subsequent thermal effusivity measure-ments were conducted using the thermal conductivity (TC)probe, Mathis instrument. The tentative end point of wetgranulation was determined for both granulating fluids.
Preparation of Granules
To reach to an even more precise conclusion regardingthe wet granulation end point, a (±2.5%) of the end pointbinder solution was carried out in both cases. Wet granulationwas carried out by a cuisinart mixer (East Windsor, NJ) on abatch size of 700 g of MCC 101 with 42.5%, 45%, 47.5%, 50%w/w binder solution (in case of water) and 45%, 47.5%, 50%,52.5% w/w binder solution (in the case of ethanol/water mix-ture). The granulating fluid was added for a period of 30 s, andthe blade speed was maintained between 40 and 60 rpm withthe total process of wet granulation being carried out for3 min. The wet mass, thus obtained after subsequent addition,was subjected to rheometer for further analysis. The remain-ing wet mass was passed through sieve #12; dried at 60°C untilthe percentage moisture content was reduced to 3–5%; andfinally, the dried granules were collected for further assay.Percentage moisture content was established using loss ondrying (Ohaus, MB 200, Pinebrook, NJ) measurements. Thegranules thus collected for each batch were subjected to rhe-ological characterization. All the experiments and the powdercharacterization were done in triplicates to measure reproduc-ibility, and the standard deviation obtained was <10%.
Thermal Effusivity Measurements
The thermal effusivity measurement was carried outusing the non-destructive, rapid testing c-therm (formerlyMathis instrument, Canada) ESPTM thermal conductivity(TC) probe. Samples following the wet granulation wereplaced in direct contact with the sensor surface, so as toprovide the maximum surface area contact for efficient results.The TC probe utilizes the principle of the change in thevoltage drop of the sensor element as a result of the interfacialtemperature change between the sample and the sensor due tothe heat generated by the sensor. Thermal effusivity is afunction of the thermo-physical properties of the materialgiven by the following equation:
Effusivity ¼ ffiffiffiffiffiffiffiffiffiffiffi
kρCp
p ð1Þ
Where
k Thermal conductivity (W/m·K)ρ Density (kg/m3)Cp Heat capacity (J/kg·K)
An equal volume-filled spatula of the sample (2–3 g)obtained from different locations of the above-mentionedprepared wet granules of MCC 101 with 42.5%, 45%,47.5%, 50.0% w/w binder solution (in case of water) and45%, 47.5%, 50.0%, 52.5% w/w binder solution (in the caseof ethanol/water mixture) was subjected to the thermaleffusivity testing. The experiments were conducted in
996 Jagia et al.
triplicates, so as to define the specific wet granulation endpoint for each batch.
Preparation of Humidity-Controlled Environment
The end point dried granules for both cases were treatedwith a chemically controlled humidity environment for a periodof 48 h by the use of the binary saturated aqueous solutions inwhich the solute is highly non-volatile. Saturated salt solutionwas prepared as a slushy mixture with distilled water and chem-ically pure salt enclosed in a sealed glass or metal chamber. Thehumidity chamber thus prepared was inspected for the requiredrelative humidity using a digital VWRHygrometer. Given that asaturated salt solution imparts only one relative humidity at aparticular temperature (40), different salts were selected toprovide three different relative humidities of 22.5%, 53.0%,and 75.0% at room temperature (25°C). The saturated saltsolution of potassium acetate, with an equilibrium relative hu-midity of (22.51±0.32), magnesium nitrate (52.89±0.22), sodiumchloride (75.29±0.12) were used to mimic the three differentrelative humidity environments at 25°C, i.e., room temperature(40,41).
Powder Characterization Using Rheometer
The wet mass obtained after granulation, dried granules,and the humidity-treated dried granules were all subjected tothe rheological characterization using freeman technology(FT4) rheometer (Worcestershire, UK). The FT4 powder rhe-ometer is a universal powder tester that can measure thedynamic, bulk, and shear properties of powders and granules.The instrument was calibrated for force, torque, height, androtational and linear velocities prior to use. A conditioningcycle was generally used to establish a homogenized low stresspacking in the powder bed and also to remove any pre-compression or excess air by exerting a slicing action of theblade downward, followed by an upward traverse which gent-ly lifts the powder and drops it over the blade, each particlecoming to rest behind it. After the conditioning cycle, thedynamic properties viz basic flowability energy (BFE), specificenergy (SE), and aeration energy (AE), bulk properties vizcompressibility and permeability, shear properties viz wallfriction angle (WFA), and shear stress were measured (42).
BFE Measurement
In accordance with the standard operating procedure, a50 mm×160 mm of the cylindrical split vessel assembly wasclamped on the platform of the rheometer and filled with therequired sample to be assayed. The BFE is the energy re-quired to establish a particular flow pattern in a conditionedprecise volume of the powder. The 48-mm diameter twistedblade moving with a −100 mm/s tip speed and rotating at a −5°helix was used to establish this flow pattern by the downwardanticlockwise motion, resulting in a compressive relativelyhigh stress flow mode in the powder sample. The amount ofthe work done by the blade in moving from top to bottomof the vessel by overcoming the resistance to the move-ment of the blade was found by integrating the areaunder the force-distance profile and was denoted as theBFE of the sample (43).
Specific Energy Measurement
The specific energy is calculated from the energy requiredto establish a particular flow pattern in a conditioned precisevolume of the powder. The 48-mm diameter twisted blade thatwas used to measure the BFE when returning back from thebottom to the top was used to establish the same flow pattern,but by the upward clockwise motion of the blade moving at100 mm/s and rotating at +5° helix. This resulted in the gentleshearing and lifting mode of displacement. The energy usedwas then divided by the split mass to obtain the specificenergy. Due to this low stress ambience, cohesion is the mostinfluential property.
Permeability Measurement
Permeability is a measure of how easily the air passesthrough a powder at increasing bulk stress. Pressure drop(PD) is used to characterize the effect on permeability. For thePD measurement, a 50 mm×85 ml of the cylindrical vessel wasclamped on the platform of the rheometer with an aerated baseat the bottom equipped with a constant air supply of 10 mm/s. Inthis test module, the conditioned powder sample was subjectedto a normal stress range of 1 to 15 kPa with the aid of a ventedpiston. Air pressure drop across the powder bed (i.e., resistanceto air flow through the powder bed) was measured for theapplied normal stress by using the given equation:
k ¼ qμLΔP
ð2Þ
Where
k Permeability (cm2)q Flux, or air flow rate (cm/s)L Length of powder bedΔP Pressure drop across the powder bed (mbar)
Compressibility Measurement
Compressibility is a measure of changes in the powder’sdensity owing to the direct application of a consolidating load.In this test, a vented piston was used to compress the condi-tioned sample contained in a 50 mm×85 ml cylindrical splitvessel under increasing normal stress, which was applied for adefined period to equilibrate with the powder bed. Compress-ibility was then calculated based on the change in the com-pressed bulk density (CBD) as a measure of the percentagechange in the volume calculated as follows:
Compressibility ¼ percentagechange involumeaftercompression %ð ÞBulk density ¼ split mass = volume after compression g=mlð Þ
ð3Þ
Aeration Energy/Ratio Measurement
For aeration testing, a 50 mm×260 ml vessel was clampedto the platform with an aerated base at the bottom, and the
997Effect of Solvents and Relative Humidity on Powder Rheology
conditioned powder sample was checked for the variationin the flow properties due to an increasing air supplyranging from 2 to 10 mm/s. The twisted blade with a tipspeed of 100 mm/s was used, and the changes in theaeration ratio and aeration energy was calculated usingthe formula:
Aerationratio ARð Þ ¼ Energy airvelocity0mm=sð Þ=Energy air velocity nð ÞAeratedenergy AEnð Þ ¼ Energy airvelocitynð Þ mJð Þ
ð4Þ
Aeration energy refers to the energy required to trans-form the powder bulk in to fluidized bed in which powderbehaves as a fluid.
Wall Friction Measurements
Wall friction refers to the friction between the powdersample and the equipment surfaces. In this test module, a50 mm×85 ml cylindrical split vessel was mounted on a serrat-ed base placed on the rheometer platform, and the condi-tioned sample was subjected to varying consolidation stressesusing the wall friction assembly (wall disc made of 316 stain-less steel, having a roughness average of 1.2 μm), whichoperates on the principle of inducing both the vertical andthe rotational stresses. The wall friction angle was determinedby plotting each of the steady state shear stress (rotationalstress) values against their corresponding normal stresses (ver-tical stress) and the effect of the powder flow propertiesagainst the material in contact studied. This parameter com-putes the force required to move a solid bulk against thespecific wall material (44).
ϕ ¼ tan−1 τw=σwð Þ ð5Þ
where,τw and σw are the shear and the normal stress on the wallmaterial, respectively.
Shear Cell Analysis
The shear cell analysis employed the use of the50 mm×85 ml cylindrical split vessel mounted on a serrat-ed base similar to the wall friction test. The conditionedpowder sample after pre consolidating with the ventedpiston was over consolidated with respect to the normalstress applied during shearing. This was achieved byreaching a critical consolidation level at steady state flowand then reducing the normal stress for shearing using theshear cell module. The shear stress was increased until thebed failed or sheared, and the maximum shear stress wasobserved, which was denoted as the point of incipientfailure or the yield point. Each of the incipient failurepoints were then plotted against their corresponding nor-mal stresses to give the yield loci (44).
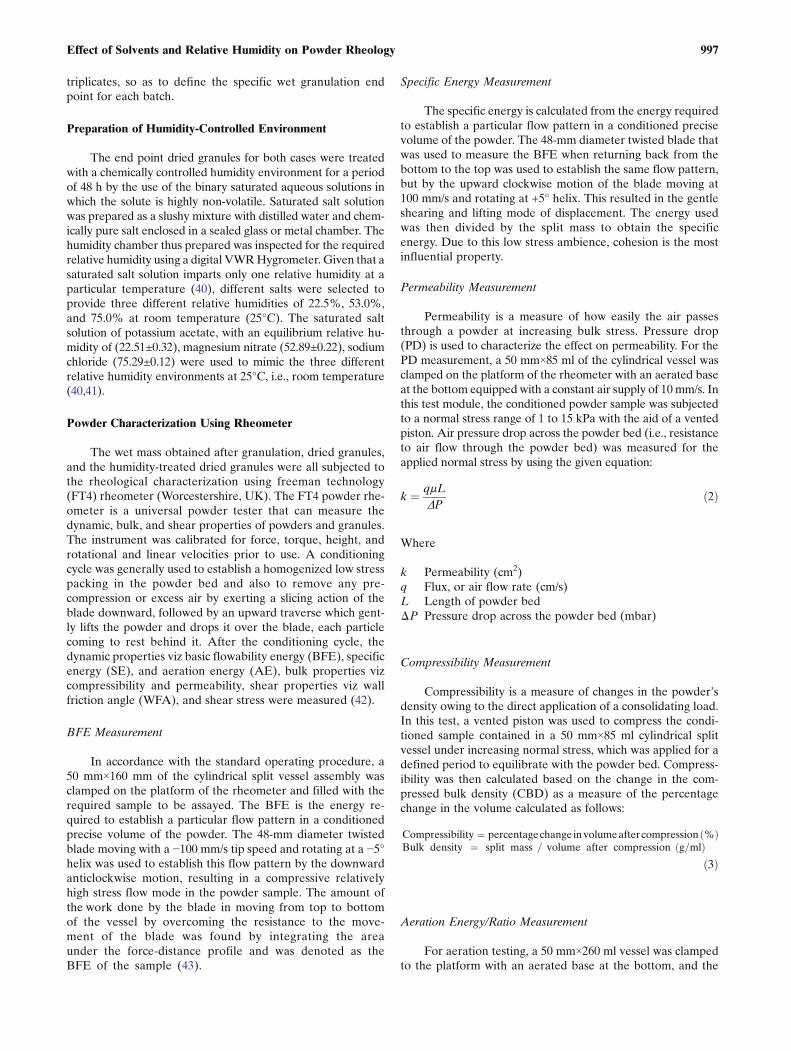
These yield loci utilizing the Mohr’s circle analysis asshown in (Fig. 1) (45), acted as the basis of parametersobtained during shear test such as: cohesion, unconfinedyield strength (UYS) (measure of the frictional and cohe-sion forces acting between powder particles at differentdegrees of consolidation), major principal stress (MPS)
(pressure applied to consolidate the powder), and flowfunction (ffc). The value for ffc is calculated as:
ffc ¼ MPS=UYS ð6ÞThe measurements carried out in the shear test were
based on the Jenike’s assumptions regarding the flow mea-surements of bulk solids. Hence, the data obtained was ana-lyzed and interpreted in the same way as that obtained from aJenike shear tester (46,47).
Differential Scanning Calorimetry
Differential scanning calorimetry (DSC) study was car-ried out using the Q100 (TA Instruments, New Castle, DE)with nitrogen (50 ml/min) as purge gas. The instrument wasfirst calibrated with indium. The experiments were performedin hermetically sealed aluminum pans and the mass of each ofthe sample was 7±1.5 mg. The heating rate was maintained at5°C/min from 20°C to 250°C. An important aspect while car-rying out the DSC was that there was no time lag or delaywhen taking the DSC readings for the wet granulation sampleand also for the humidity-treated granules (time bound exper-iment) to minimize errors in the results.
Compression of Tablets
Tablets were compressed for the end point granules withboth the granulating fluids using a Carver® press (mod-el#2822, Fred S. Carver INC., Wabash, IN.. USA) at a com-pression force of 3000 lb. Tablets were subsequently tested forits hardness utilizing tablet tester 6D (SchleunigerPharmatron, Inc., Manchester) and the values were noted.
Data Analysis
The raw data were treated and analyzed using the FT4data analysis software version 4.0.14 (Freeman TechnologyLtd, Tewkesbury, UK)
Fig. 1. Shear Cell Analysis
998 Jagia et al.
RESULTS
Thermal Effusivity Measurements
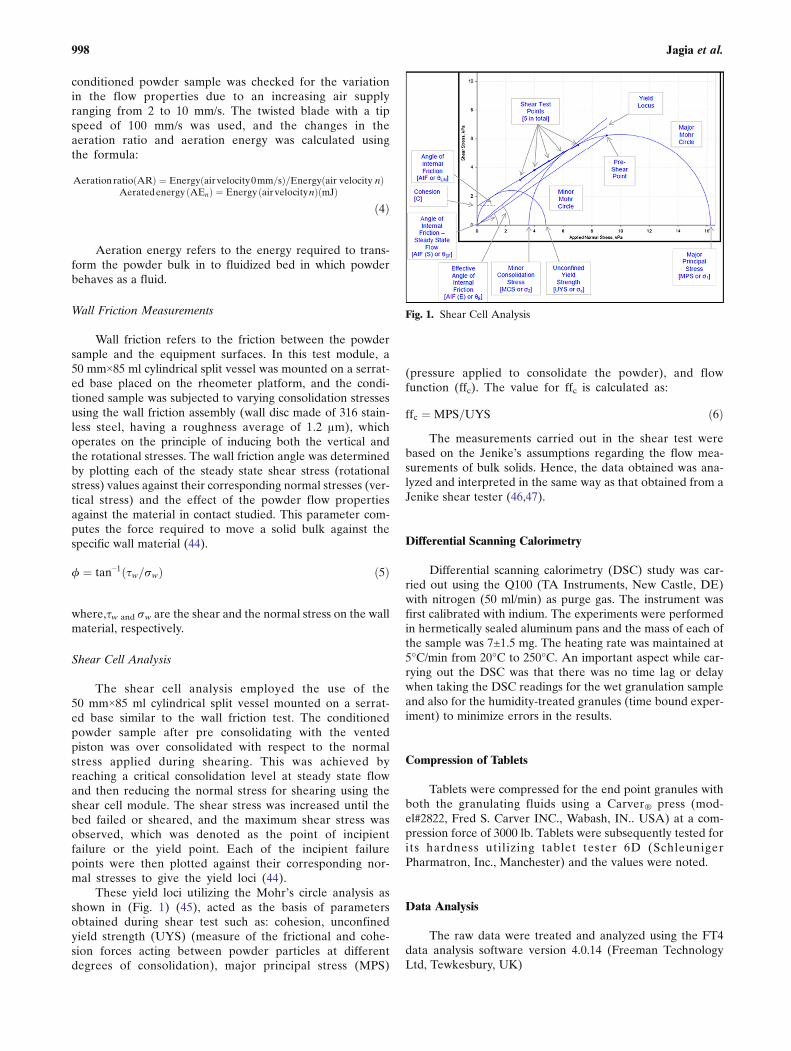
As evident from (Fig. 2), the effusivity values for thewet granules formed using water as solvent showed agradual increase up to 50% w/w binder solution. Howev-er, beginning 50% w/w binder solution, a steep increase inthe effusivity value was observed, which ultimately led tothe slurry formation at 65% w/w with values touchingaround 1647 (Ws1/2/m2K).
A similar trend was followed for the effusivity valuesusing ethanol/water (80:20) as solvent up to 50% w/w bindersolution; a steep increase beginning 50% w/w and finally theslurry formation at 65%, but values touching around 1050(Ws1/2/m2K).
Although 50% w/w binder solution was denoted as theend point for wet granulation in (water solvent) case, but aforce overload detection of this batch while operating in theFT4 Rheometer led to 47.5% w/w binder solution as the finalwet granulation end point for the purpose of rheological char-acterization. On the other hand, a force overload in the FT4rheometer at 52.5% w/w binder solution (ethanol/water sol-vent) led to 50% w/w binder solution as the wet granula-tion end points for the same rationale as mentionedearlier.
Measurement of Dynamic Properties (BFE, SE, and AE)
Wet Granules
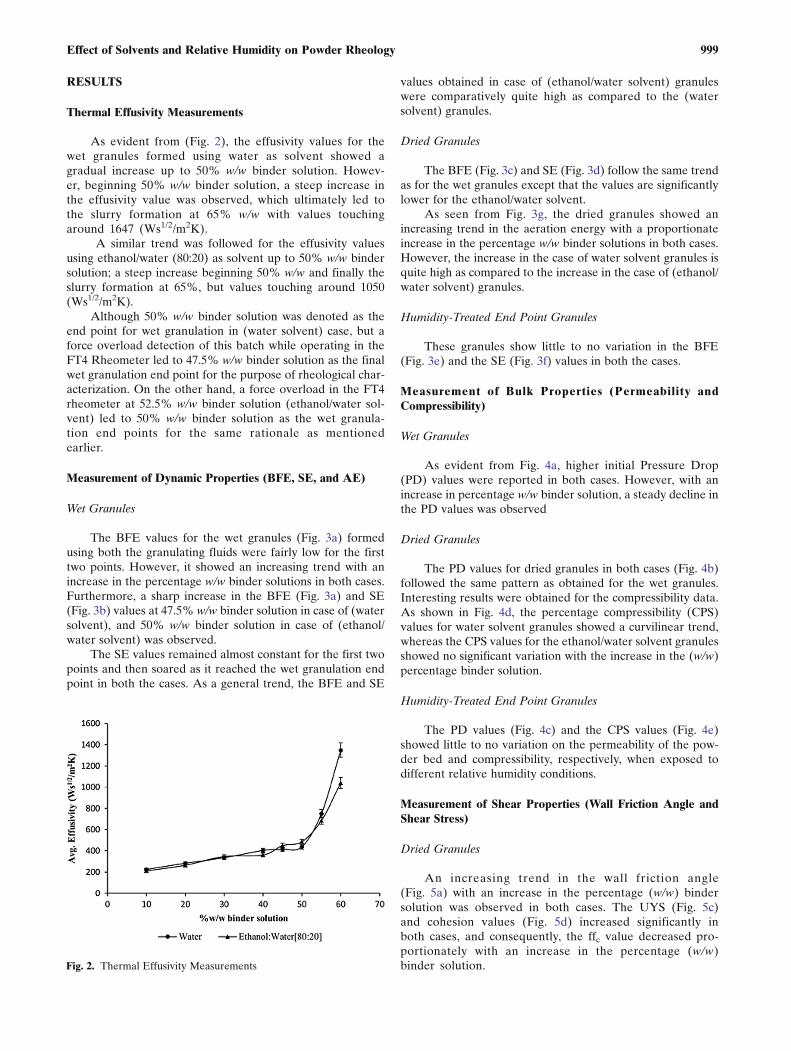
The BFE values for the wet granules (Fig. 3a) formedusing both the granulating fluids were fairly low for the firsttwo points. However, it showed an increasing trend with anincrease in the percentage w/w binder solutions in both cases.Furthermore, a sharp increase in the BFE (Fig. 3a) and SE(Fig. 3b) values at 47.5% w/w binder solution in case of (watersolvent), and 50% w/w binder solution in case of (ethanol/water solvent) was observed.
The SE values remained almost constant for the first twopoints and then soared as it reached the wet granulation endpoint in both the cases. As a general trend, the BFE and SE
values obtained in case of (ethanol/water solvent) granuleswere comparatively quite high as compared to the (watersolvent) granules.
Dried Granules
The BFE (Fig. 3c) and SE (Fig. 3d) follow the same trendas for the wet granules except that the values are significantlylower for the ethanol/water solvent.
As seen from Fig. 3g, the dried granules showed anincreasing trend in the aeration energy with a proportionateincrease in the percentage w/w binder solutions in both cases.However, the increase in the case of water solvent granules isquite high as compared to the increase in the case of (ethanol/water solvent) granules.
Humidity-Treated End Point Granules
These granules show little to no variation in the BFE(Fig. 3e) and the SE (Fig. 3f) values in both the cases.
Measurement of Bulk Properties (Permeability andCompressibility)
Wet Granules
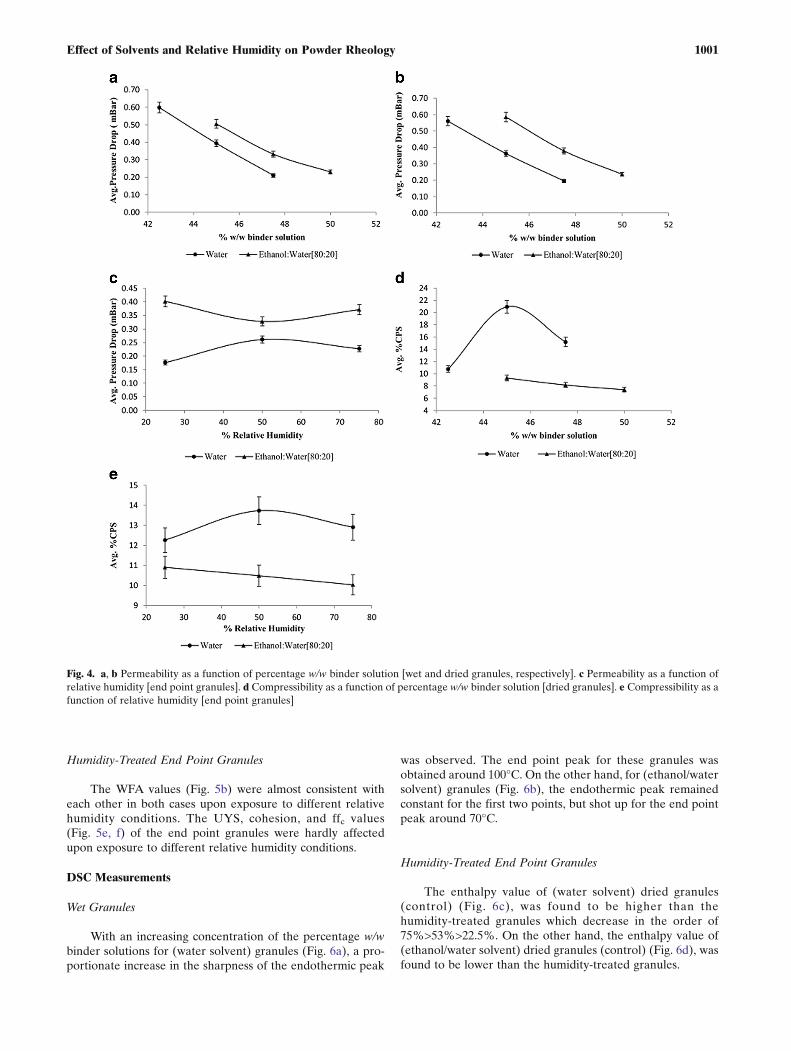
As evident from Fig. 4a, higher initial Pressure Drop(PD) values were reported in both cases. However, with anincrease in percentage w/w binder solution, a steady decline inthe PD values was observed
Dried Granules
The PD values for dried granules in both cases (Fig. 4b)followed the same pattern as obtained for the wet granules.Interesting results were obtained for the compressibility data.As shown in Fig. 4d, the percentage compressibility (CPS)values for water solvent granules showed a curvilinear trend,whereas the CPS values for the ethanol/water solvent granulesshowed no significant variation with the increase in the (w/w)percentage binder solution.
Humidity-Treated End Point Granules
The PD values (Fig. 4c) and the CPS values (Fig. 4e)showed little to no variation on the permeability of the pow-der bed and compressibility, respectively, when exposed todifferent relative humidity conditions.
Measurement of Shear Properties (Wall Friction Angle andShear Stress)
Dried Granules
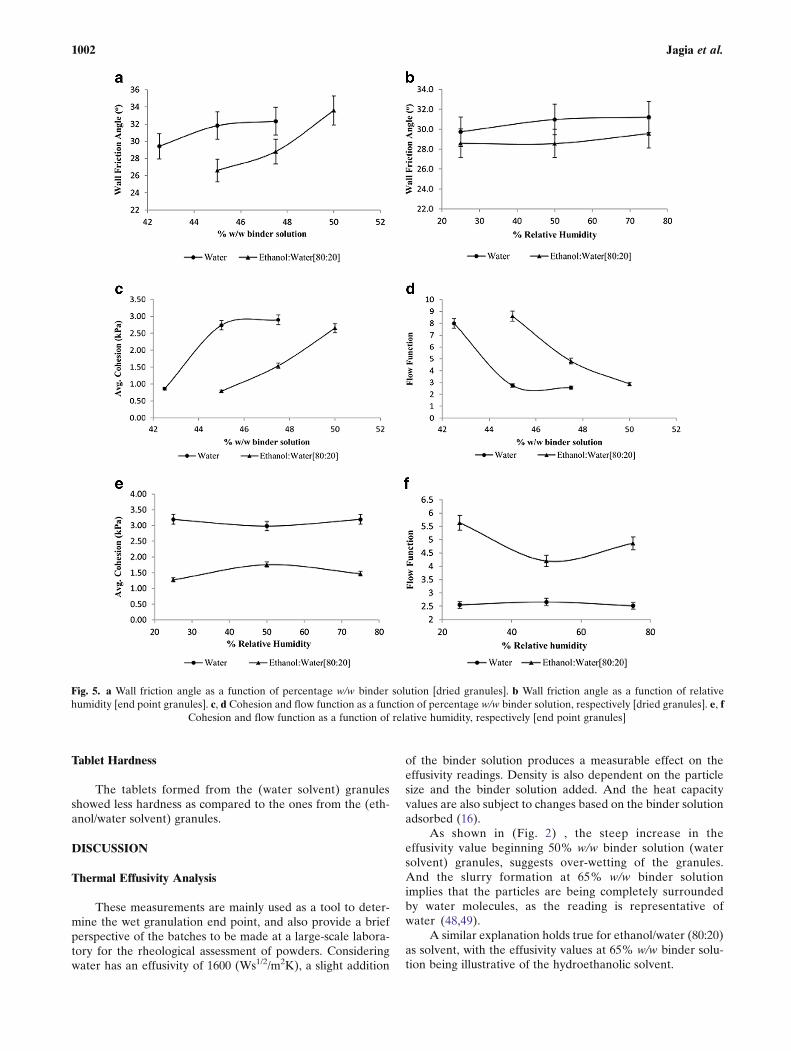
An increasing trend in the wall friction angle(Fig. 5a) with an increase in the percentage (w/w) bindersolution was observed in both cases. The UYS (Fig. 5c)and cohesion values (Fig. 5d) increased significantly inboth cases, and consequently, the ffc value decreased pro-portionately with an increase in the percentage (w/w)binder solution.Fig. 2. Thermal Effusivity Measurements
999Effect of Solvents and Relative Humidity on Powder Rheology
Fig. 3. a, b BFE and SE as a function of percentage w/w binder solution, respectively [wet granules]. c, d BFE and SE as a function of percentagew/w binder solution, respectively [dried granules]. e, f BFE and SE as a function of relative humidity, respectively [end point granules]. g
Aeration energy as a function of percentage w/w binder solution [dried granules]
1000 Jagia et al.
Humidity-Treated End Point Granules
The WFA values (Fig. 5b) were almost consistent witheach other in both cases upon exposure to different relativehumidity conditions. The UYS, cohesion, and ffc values(Fig. 5e, f) of the end point granules were hardly affectedupon exposure to different relative humidity conditions.
DSC Measurements
Wet Granules
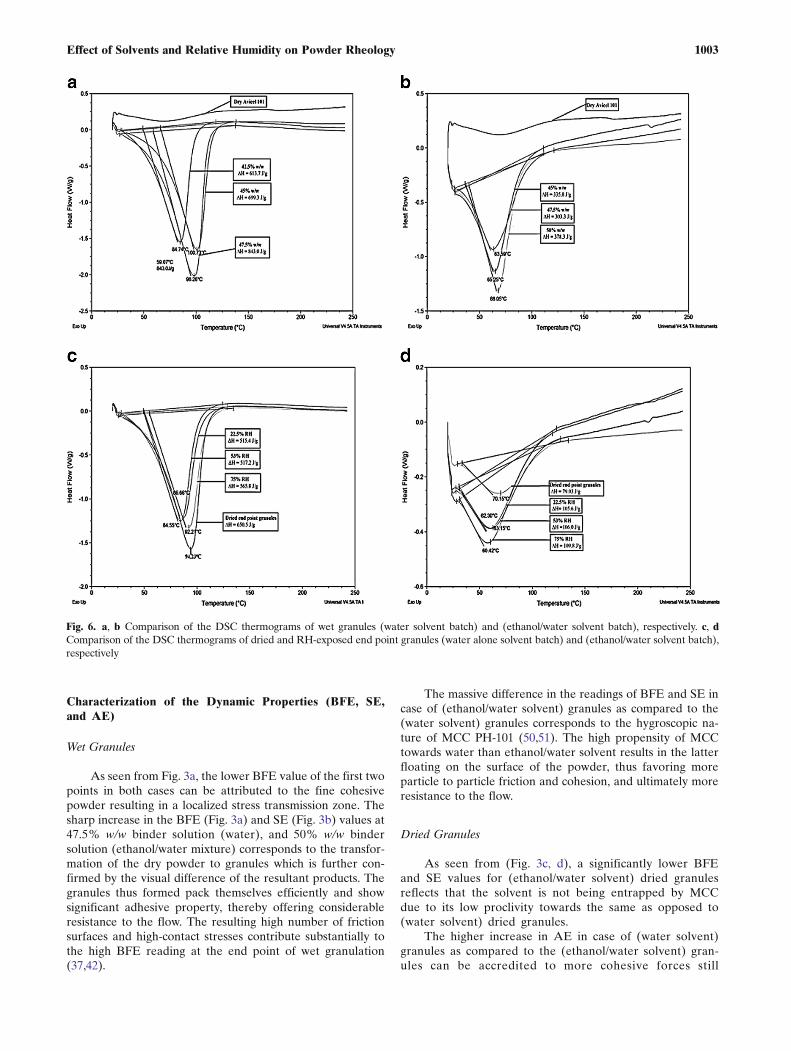
With an increasing concentration of the percentage w/wbinder solutions for (water solvent) granules (Fig. 6a), a pro-portionate increase in the sharpness of the endothermic peak
was observed. The end point peak for these granules wasobtained around 100°C. On the other hand, for (ethanol/watersolvent) granules (Fig. 6b), the endothermic peak remainedconstant for the first two points, but shot up for the end pointpeak around 70°C.
Humidity-Treated End Point Granules
The enthalpy value of (water solvent) dried granules(control) (Fig. 6c), was found to be higher than thehumidity-treated granules which decrease in the order of75%>53%>22.5%. On the other hand, the enthalpy value of(ethanol/water solvent) dried granules (control) (Fig. 6d), wasfound to be lower than the humidity-treated granules.
Fig. 4. a, b Permeability as a function of percentage w/w binder solution [wet and dried granules, respectively]. c Permeability as a function ofrelative humidity [end point granules]. d Compressibility as a function of percentage w/w binder solution [dried granules]. e Compressibility as afunction of relative humidity [end point granules]
1001Effect of Solvents and Relative Humidity on Powder Rheology
Tablet Hardness
The tablets formed from the (water solvent) granulesshowed less hardness as compared to the ones from the (eth-anol/water solvent) granules.
DISCUSSION
Thermal Effusivity Analysis
These measurements are mainly used as a tool to deter-mine the wet granulation end point, and also provide a briefperspective of the batches to be made at a large-scale labora-tory for the rheological assessment of powders. Consideringwater has an effusivity of 1600 (Ws1/2/m2K), a slight addition
of the binder solution produces a measurable effect on theeffusivity readings. Density is also dependent on the particlesize and the binder solution added. And the heat capacityvalues are also subject to changes based on the binder solutionadsorbed (16).
As shown in (Fig. 2) , the steep increase in theeffusivity value beginning 50% w/w binder solution (watersolvent) granules, suggests over-wetting of the granules.And the slurry formation at 65% w/w binder solutionimplies that the particles are being completely surroundedby water molecules, as the reading is representative ofwater (48,49).
A similar explanation holds true for ethanol/water (80:20)as solvent, with the effusivity values at 65% w/w binder solu-tion being illustrative of the hydroethanolic solvent.
Fig. 5. a Wall friction angle as a function of percentage w/w binder solution [dried granules]. b Wall friction angle as a function of relativehumidity [end point granules]. c, d Cohesion and flow function as a function of percentage w/w binder solution, respectively [dried granules]. e, f
Cohesion and flow function as a function of relative humidity, respectively [end point granules]
1002 Jagia et al.
Characterization of the Dynamic Properties (BFE, SE,and AE)
Wet Granules
As seen from Fig. 3a, the lower BFE value of the first twopoints in both cases can be attributed to the fine cohesivepowder resulting in a localized stress transmission zone. Thesharp increase in the BFE (Fig. 3a) and SE (Fig. 3b) values at47.5% w/w binder solution (water), and 50% w/w bindersolution (ethanol/water mixture) corresponds to the transfor-mation of the dry powder to granules which is further con-firmed by the visual difference of the resultant products. Thegranules thus formed pack themselves efficiently and showsignificant adhesive property, thereby offering considerableresistance to the flow. The resulting high number of frictionsurfaces and high-contact stresses contribute substantially tothe high BFE reading at the end point of wet granulation(37,42).
The massive difference in the readings of BFE and SE incase of (ethanol/water solvent) granules as compared to the(water solvent) granules corresponds to the hygroscopic na-ture of MCC PH-101 (50,51). The high propensity of MCCtowards water than ethanol/water solvent results in the latterfloating on the surface of the powder, thus favoring moreparticle to particle friction and cohesion, and ultimately moreresistance to the flow.
Dried Granules
As seen from (Fig. 3c, d), a significantly lower BFEand SE values for (ethanol/water solvent) dried granulesreflects that the solvent is not being entrapped by MCCdue to its low proclivity towards the same as opposed to(water solvent) dried granules.
The higher increase in AE in case of (water solvent)granules as compared to the (ethanol/water solvent) gran-ules can be accredited to more cohesive forces still
Fig. 6. a, b Comparison of the DSC thermograms of wet granules (water solvent batch) and (ethanol/water solvent batch), respectively. c, dComparison of the DSC thermograms of dried and RH-exposed end point granules (water alone solvent batch) and (ethanol/water solvent batch),respectively
1003Effect of Solvents and Relative Humidity on Powder Rheology
existing between the former granules due to the hygro-scopic nature of MCC (50,52). This prohibits the completeseparation of particles and the air channels or flowsthrough the bulk of the powder. Besides cohesion, thedensity of the granules also plays a vital role in theaeration process. Since the density of water is more thanethanol, and the fact that equal volumes of the samplewere taken during testing, the granules formed from watersolvent are denser than the granules formed from ethanol/water solvent hence requiring more aeration energy forthem to be lifted as opposed to the lighter ethanol/watergranules.
Humidity-Treated End Point Granules
The little to no variation in the BFE (Fig. 3e) andthe SE (Fig. 3f) values in both cases, suggests no changein the flow energies of the granules upon exposure todifferent relative humidity conditions.
Characterization of Bulk Properties (Permeability andCompressibility)
Wet Granules
The initial high PD value in both cases (Fig. 4a), repre-sents what predominantly are fines which provide more resis-tance for the air to pass through the bulk, thus making it lesspermeable. And the steady decline in PD values in both caseswith an increase in percentage w/w binder solution can beattributed to the formation of granules. These granules packthemselves in a way that promotes the efficient flow of airthrough them and hence, lesser values.
Dried Granules
The similar pattern of the PD values of dried granules asthat of wet granules again reflects that the granules offer lessresistance to the air flow as they approach the granulation endpoint.
Humidity-Treated End Point Granules
Almost unaffected PD (Fig. 4c) and CPS (Fig. 4e) valuesin both cases, suggests that the permeability and compressibil-ity of the granules are impervious to the different relativehumidity conditions.
Characterization of Shear Properties (Wall Friction Angle& Shear Stress)
Dried Granules
As shown in (Fig. 5a), the gradual increase in the WFAwith an increase in the percentage (w/w) binder solution inboth cases, attributes to the greater shear stress required toovercome the increasing cohesive forces and finally reach theincipient failure.
As evident from (Fig. 5c, d), the increasing UYS andcohesion values upon addition of more of the binder solutionattributes to the increasing resistance to fail (break) the bed.
This increase in resistance reflects greater frictional and cohe-sive forces between the powder particles. The decline in the ffcvalue indicates that the particular powder sample flows withless ease when subjected to the same stress conditions, furtherconfirming the increase in cohesivity of the powder bed.
Humidity-Treated End Point Granules
As indicated in (Fig. 5b, e, f) almost consistent WFA,UYS, cohesion, and ffc values in both cases, suggest that thedifferent relative humidity conditions did not impact the co-hesive forces among the granules significantly (30).
DSC Analysis
Wet Granules
As shown in (Fig. 6a), the proportionate increase in thesharpness of the endothermic peak with an increase in con-centration of the percentage w/w binder solution for (watersolvent) granules suggests an increase in the enthalpy valuesfound by integrating the peaks (52). And the appearance ofend point peak around 100°C reflects that water is no longerretained inside the granules but appears on the surface, thusfurther confirming the wet granulation end point (16). Asimilar explanation holds true for the end point endothermicpeak obtained around 70°C for (ethanol/water solvent)granules.
Humidity-Treated End Point Granules
As indicated in (Fig. 6c), the higher enthalpy valuesfor (water solvent) dried granules (control) than thehumidity-treated granules could possibly be explained bythe fact that the dried end point granules still have someentrained water molecules owing to the hygroscopicity ofMCC (53), corresponding to an enthalpy of (650.5 J/g).Because the humidity chamber works on the principle ofequilibration of the moisture content inside the granulesand the ambient environment (54), the 75% RH chamberresults in comparative less loss of water molecules fromthe powder to the inside environment as opposed to the53% RH and the 22.5% RH chambers; thereby meaningmore moisture still entrapped in the granules exposed tothe 75% RH, which is evident from its higher enthalpyvalue. But the enthalpy difference for the three RH con-ditions cannot be accounted for a significant change.
Figure 6d represents the humidity-treated end point gran-ules (ethanol/water solvent). Owing to the absence of anyentrapped water molecules, the granules, while attainingthe equilibrium moisture absorb some of the water mole-cules from the inside environment into the granules. Al-though, the enthalpy value for the %RH conditions showsa slight rise than for the dried granules, the values remainedalmost constant for the three different %RH conditions,suggesting little to no effect of the %RH on the granules.
Tablet Hardness Analysis
From Table I, it is very much evident that the tabletsformed from the water solvent granules showed less hardness,
1004 Jagia et al.
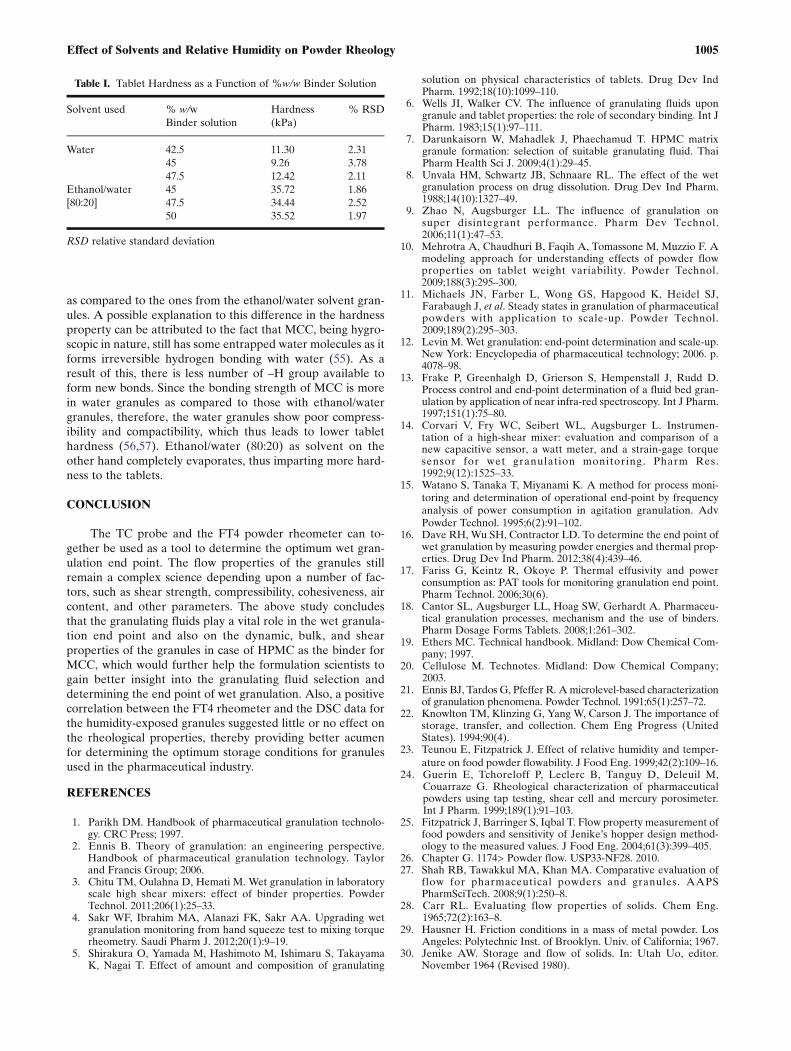
as compared to the ones from the ethanol/water solvent gran-ules. A possible explanation to this difference in the hardnessproperty can be attributed to the fact that MCC, being hygro-scopic in nature, still has some entrapped water molecules as itforms irreversible hydrogen bonding with water (55). As aresult of this, there is less number of –H group available toform new bonds. Since the bonding strength of MCC is morein water granules as compared to those with ethanol/watergranules, therefore, the water granules show poor compress-ibility and compactibility, which thus leads to lower tablethardness (56,57). Ethanol/water (80:20) as solvent on theother hand completely evaporates, thus imparting more hard-ness to the tablets.
CONCLUSION
The TC probe and the FT4 powder rheometer can to-gether be used as a tool to determine the optimum wet gran-ulation end point. The flow properties of the granules stillremain a complex science depending upon a number of fac-tors, such as shear strength, compressibility, cohesiveness, aircontent, and other parameters. The above study concludesthat the granulating fluids play a vital role in the wet granula-tion end point and also on the dynamic, bulk, and shearproperties of the granules in case of HPMC as the binder forMCC, which would further help the formulation scientists togain better insight into the granulating fluid selection anddetermining the end point of wet granulation. Also, a positivecorrelation between the FT4 rheometer and the DSC data forthe humidity-exposed granules suggested little or no effect onthe rheological properties, thereby providing better acumenfor determining the optimum storage conditions for granulesused in the pharmaceutical industry.
REFERENCES
1. Parikh DM. Handbook of pharmaceutical granulation technolo-gy. CRC Press; 1997.
2. Ennis B. Theory of granulation: an engineering perspective.Handbook of pharmaceutical granulation technology. Taylorand Francis Group; 2006.
3. Chitu TM, Oulahna D, Hemati M. Wet granulation in laboratoryscale high shear mixers: effect of binder properties. PowderTechnol. 2011;206(1):25–33.
4. Sakr WF, Ibrahim MA, Alanazi FK, Sakr AA. Upgrading wetgranulation monitoring from hand squeeze test to mixing torquerheometry. Saudi Pharm J. 2012;20(1):9–19.
5. Shirakura O, Yamada M, Hashimoto M, Ishimaru S, TakayamaK, Nagai T. Effect of amount and composition of granulating
solution on physical characteristics of tablets. Drug Dev IndPharm. 1992;18(10):1099–110.
6. Wells JI, Walker CV. The influence of granulating fluids upongranule and tablet properties: the role of secondary binding. Int JPharm. 1983;15(1):97–111.
7. Darunkaisorn W, Mahadlek J, Phaechamud T. HPMC matrixgranule formation: selection of suitable granulating fluid. ThaiPharm Health Sci J. 2009;4(1):29–45.
8. Unvala HM, Schwartz JB, Schnaare RL. The effect of the wetgranulation process on drug dissolution. Drug Dev Ind Pharm.1988;14(10):1327–49.
9. Zhao N, Augsburger LL. The influence of granulation onsuper disintegrant performance. Pharm Dev Technol.2006;11(1):47–53.
10. Mehrotra A, Chaudhuri B, Faqih A, Tomassone M, Muzzio F. Amodeling approach for understanding effects of powder flowproperties on tablet weight variability. Powder Technol.2009;188(3):295–300.
11. Michaels JN, Farber L, Wong GS, Hapgood K, Heidel SJ,Farabaugh J, et al. Steady states in granulation of pharmaceuticalpowders with application to scale-up. Powder Technol.2009;189(2):295–303.
12. Levin M. Wet granulation: end-point determination and scale-up.New York: Encyclopedia of pharmaceutical technology; 2006. p.4078–98.
13. Frake P, Greenhalgh D, Grierson S, Hempenstall J, Rudd D.Process control and end-point determination of a fluid bed gran-ulation by application of near infra-red spectroscopy. Int J Pharm.1997;151(1):75–80.
14. Corvari V, Fry WC, Seibert WL, Augsburger L. Instrumen-tation of a high-shear mixer: evaluation and comparison of anew capacitive sensor, a watt meter, and a strain-gage torquesensor for wet granulation monitoring. Pharm Res.1992;9(12):1525–33.
15. Watano S, Tanaka T, Miyanami K. A method for process moni-toring and determination of operational end-point by frequencyanalysis of power consumption in agitation granulation. AdvPowder Technol. 1995;6(2):91–102.
16. Dave RH, Wu SH, Contractor LD. To determine the end point ofwet granulation by measuring powder energies and thermal prop-erties. Drug Dev Ind Pharm. 2012;38(4):439–46.
17. Fariss G, Keintz R, Okoye P. Thermal effusivity and powerconsumption as: PAT tools for monitoring granulation end point.Pharm Technol. 2006;30(6).
18. Cantor SL, Augsburger LL, Hoag SW, Gerhardt A. Pharmaceu-tical granulation processes, mechanism and the use of binders.Pharm Dosage Forms Tablets. 2008;1:261–302.
19. Ethers MC. Technical handbook. Midland: Dow Chemical Com-pany; 1997.
20. Cellulose M. Technotes. Midland: Dow Chemical Company;2003.
21. Ennis BJ, Tardos G, Pfeffer R. Amicrolevel-based characterizationof granulation phenomena. Powder Technol. 1991;65(1):257–72.
22. Knowlton TM, Klinzing G, Yang W, Carson J. The importance ofstorage, transfer, and collection. Chem Eng Progress (UnitedStates). 1994;90(4).
23. Teunou E, Fitzpatrick J. Effect of relative humidity and temper-ature on food powder flowability. J Food Eng. 1999;42(2):109–16.
24. Guerin E, Tchoreloff P, Leclerc B, Tanguy D, Deleuil M,Couarraze G. Rheological characterization of pharmaceuticalpowders using tap testing, shear cell and mercury porosimeter.Int J Pharm. 1999;189(1):91–103.
25. Fitzpatrick J, Barringer S, Iqbal T. Flow property measurement offood powders and sensitivity of Jenike’s hopper design method-ology to the measured values. J Food Eng. 2004;61(3):399–405.
26. Chapter G. 1174> Powder flow. USP33-NF28. 2010.27. Shah RB, Tawakkul MA, Khan MA. Comparative evaluation of
flow for pharmaceutical powders and granules. AAPSPharmSciTech. 2008;9(1):250–8.
28. Carr RL. Evaluating flow properties of solids. Chem Eng.1965;72(2):163–8.
29. Hausner H. Friction conditions in a mass of metal powder. LosAngeles: Polytechnic Inst. of Brooklyn. Univ. of California; 1967.
30. Jenike AW. Storage and flow of solids. In: Utah Uo, editor.November 1964 (Revised 1980).
Table I. Tablet Hardness as a Function of %w/w Binder Solution
Solvent used % w/w Hardness % RSDBinder solution (kPa)
Water 42.5 11.30 2.3145 9.26 3.7847.5 12.42 2.11
Ethanol/water 45 35.72 1.86[80:20] 47.5 34.44 2.52
50 35.52 1.97
RSD relative standard deviation
1005Effect of Solvents and Relative Humidity on Powder Rheology
31. Ramachandruni H, Hoag SW. Design and validation of an annu-lar shear cell for pharmaceutical powder testing. J Pharm Sci.2001;90(5):531–40.
32. Hancock BC, Vukovinsky KE, Brolley B, Grimsey I, Hedden D,Olsofsky A, et al. Development of a robust procedure forassessing powder flow using a commercial avalanche testing in-strument. J Pharm Biomed Anal. 2004;35(5):979–90.
33. Faqih A, Chaudhuri B, Alexander AW, Davies C, Muzzio FJ,Tomassone MS. An experimental/computational approach forexamining unconfined cohesive powder flow. Int J Pharm.2006;324(2):116–27.
34. Abraham D, George K, Francis DJ. Rheological characterizationof blends of low density with linear low density polyethyleneusing a torque rheometer. Eur Polym J. 1990;26(2):197–200.
35. Zatloukal Z, Sklubalova Z. Penetrometry and estimation of theflow rate of powder excipients. Die Pharmazie-An Int J PharmSci. 2007;62(3):185–9.
36. Weth M, Hofmann M, Kuhn J, Fricke J. Measurement of attrac-tive forces between single aerogel powder particles and the cor-relation with powder flow. J Non-Cryst Solids. 2001;285(1):236–43.
37. Freeman R. Measuring the flow properties of consolidated, con-ditioned and aerated powders—a comparative study using a pow-der rheometer and a rotational shear cell. Powder Technol.2007;174(1):25–33.
38. Trivedi MR, Dave RH. To study physical compatibility betweendibasic calcium phosphate and cohesive actives using powderrheometer and thermal methods. Drug Dev Ind Pharm. 2013;1–12.
39. Chaudhari SP, Dave RH. To prepare and characterize microcrys-talline cellulose granules using water and isopropyl alcohol asgranulating agents and determine its end-point by thermal andrheological tools. Drug Dev Ind Pharm. 2014;1–9.
40. Wexler A, Hasegawa S. Relative humidity-temperature relation-ships of some saturated salt solutions in the temperature range 0to 50 C. Precision Measurements and Calibrations Bloss RL,Orloski MJ, editors. Government Printing Office, Washington,DC, NBS Special Publication. 1972;300(8):287–94.
41. Greenspan L. Humidity fixed points of binary saturated aqueoussolutions. J Res Natl Bur Stand A Phys Chem A. 1977;81:89–96.
42. Reg Freeman TFBA. The characterisation of the physical prop-erties of wet masses Powder Technology 174. 2007:25–33.
43. Navaneethan CV, Missaghi S, Fassihi R. Application of powderrheometer to determine powder flow properties and lubricationefficiency of pharmaceutical particulate systems. AAPSPharmSciTech. 2005;6(3):E398–404.
44. Freeman TC, Freeman RE, Armstrong B. The characterisation ofpowder and bulk material—a multivariate approach using dy-namic, shear and bulk property measurements. 2011.
45. Berry R, Bradley M, McGregor R. Brookfield powder flowtester—results of round robin tests with CRM-116 limestonepowder. Proc Inst Mech Eng E J Process Mech Eng.2014;0954408914525387.
46. Schulze D. Powders and bulk solids: behavior, characterization,storage and flow: Springer. 2007.
47. Schwedes J. Review on testers for measuring flow properties ofbulk solids. Granul Matter. 2003;5(1):1–43.
48. Ghorab MK, Chatlapalli R, Hasan S, Nagi A. Application ofthermal effusivity as a process analytical technology tool formonitoring and control of the roller compaction process. AAPSPharmSciTech. 2007;8(1):E155–61.
49. Roy Y, Closs S, Mathis N, Nieves E. Process analyticaltechnology—thermal effusivity as a process analytical technologyto optimize, monitor, and control fluid-bed drying—the authorspoint out the advantages and disadvantages of. PharmaceuticalTechnology. 2004;28(9):S21
50. Rowe RC, Sheskey PJ, Quinn ME, Press P. Handbook of phar-maceutical excipients. London: Pharmaceutical press; 2009.
51. Sun CC. Mechanism of moisture induced variations in true den-sity and compaction properties of microcrystalline cellulose. Int JPharm. 2008;346(1):93–101.
52. Szakonyi G, Zelkó R. The effect of water on the solid statecharacteristics of pharmaceutical excipients: Molecular mecha-nisms, measurement techniques, and quality aspects of final dos-age form. Int J Pharm Investig. 2012;2(1):18.
53. Ardizzone S, Dioguardi F, Mussini T, Mussini P, Rondinini S,Vercelli B, et al. Microcrystalline cellulose powders: structure,surface features and water sorption capability. Cellulose.1999;6(1):57–69.
54. Callahan J, Cleary G, Elefant M, Kaplan G, Kensler T, Nash R.Equilibrium moisture content of pharmaceutical excipients. DrugDev Ind Pharm. 1982;8(3):355–69.
55. Buckton G, Yonemochi E, Yoon W, Moffat A. Water sorptionand near IR spectroscopy to study the differences between mi-crocrystalline cellulose and silicified microcrystalline cellulosebefore and after wet granulation. Int J Pharm. 1999;181(1):41–7.
56. Leuenberger H, Rohera BD. Fundamentals of powder compres-sion. I. The compactibility and compressibility of pharmaceuticalpowders. Pharm Res. 1986;3(1):12–22.
57. Dawoodbhai S, Rhodes CT. The effect of moisture on powderflow and on compaction and physical stability of tablets. DrugDev Ind Pharm. 1989;15(10):1577–600.
1006 Jagia et al.