Embed Size (px)
Citation preview

UNCLASSIFIED
AD NUMBER
AD482279
NEW LIMITATION CHANGE
TOApproved for public release, distributionunlimited
FROMDistribution authorized to U.S. Gov't.agencies and their contractors;Administrative/Operational Use; Jan 1966.Other requests shall be referred to AirForce Materials Lab., Metals & CeramicsDiv., Wright-Patterson AFB, OH 45433.
AUTHORITY
AFSC/IST [WPAFB, OH] ltr dtd 21 Mar 1989
THIS PAGE IS UNCLASSIFIED

IUI
AFML-TR-65-Z&~Prt TV, Volume II r
TERNARY PHASE EQUILIBRIA IN TRANSITION METAL-
BORON-CARBON-SILICON-SYS TEMS
Part IV. Thermochemical Calculations
Volume I1. Thermodynamic Interpretationof Ternary Phase Diagrams
UJ E. Rudy
cg- iC Aerojet-General Corporation
TECHNICAL REPORT NO. AFML-TR-65-2, Part IV& Volume II
January 1966
This document is subject to special export controls and each transmittalto foreign governments or foreign nationals may be made only with priorapproval of Metals and Ceramics Division, Air Force Materials Laboratory,Wright-Patterson Air Force Base# Ohio.
rV
Air Force Materials Laboratory Z4.0Research and Technology Division V I'
Air Force Systems CommandWright-Patterson Air Force Base, Ohio L2

NO TIC ES
When Government drawings, specifications, or other data are usedfor any purpose other than in connection with a definitely related Govern-ment procurement operation, the United States Government thereby incursno responsibility nor any obligation whatsoeveri and the fact that the Govern-ment may have formulated, furnished, or in any way supplied the saiddrawings, specifications, or other data, is not to be regarded by implica-tion or otherwise as in any manner licensing the holder or any other personor corporation, or conveying any rights or permission to manufacture, use,or sell any patented invention that may in any way be related thereto.
I; forf I
STI W
Lf ... 7
I. 1.fI
Cop!ss of this report should not be returned to the Research andTechnology Division unless return is required by security considerations,contractual obligations, or notice on a specific document.
_____ __ - ~ -I

((7'AFML TR-5 Ft-/YrI-
TERNARY PHASE EQUILIBRIA IN TRANSITION METAL-
BORON-GARBON -SILICON STM
" Part IV. Thermochemical Calculations -
Volume II. Thermodynamic Interpretationof Ternary Phase Diagrams
Rudy . ?-A ,_(L:> 7)-~.' o
This document is subject to special export controls and each transmittalto foreign governments or foreign nationals may be made only with priorapproval of Metals and Ceramics Division, Air Force Materi.als Laboratory,Wright-Patterson Air Force Base, Ohio
ia
I.\!___ __ _____________ ~~;' ,"j:
[" -

1
FOREWORD (Cont'd)
Volume IIl. Zr-Ta-C SystemVolume IV. Ti-Zr-C, Ti-Hf-C, and Zr-Hf-C SystemsVolume V. Ti-Hf-B SystemVolume VI. Zr-Hf-B SystemVolume VII. Ti-Si-C, Nb-Si-C, and W-SI-C Systems
Part III. Special Experimental Techniques
Volume I. High Temperature Differential ThermalAnalysis.
Part IV. Thermochemical Calculations
Volume I. Thermodynamic Properties of Group IV,V, and VI Binary Transition-Metal Carbides.
This technical report has been reviewed and is approved.
W. G. RAMKEChief, Ceramics and Graphite BranchMetals and Ceramics DivisionAir Force Materials Laboratory [
iii
--
t'I

ABSTRACT
The equilibrium conditions for two-phase and three-phase equilibriain ternary systems are derived from the minimum conditions for the freeenergy, and special solutions are discussed on model examples. The pre-dictive capabilities of the thermodynamic approach are demonstrated on anumber of refractory carbide systems, and methods for the determination ofphase stabilities from experimental phase equilibrium data are outlined. Thethermodynamic discussions are supplemented by a general review of recentphase diagram work on refractory transition metal-B-element systems.
tiv
*I
(
ii
II

NASA Scientific and Technical Information Facilityoperated for the National Aeronautics and Space Administration by Documentation Incorporated
Post Office Box 33College Park. Md. 20740
Telephone lArea Code 3011 779-2121
FACILITY CONTROL NO. 92
ATTACHED IS A DOCUMENT ON LOAN
FROM: NASA Scientific and Technical Information Facility
TO: Defense Documentation CenterAttn: DDC-IRC (Control Branch)
Cameron Station
Alexandria, Va. 22314 1In accordance with the NASA-DOD Cooperative AD Number Assignment Agreement it isrequested that an AD number be assigned to the attached report.
ETAs this is our only available copy the return of the document (with ADnumber and any applicable distribution linitations) to the address below
is essential.
E This document may be retained by DOC. If retained, please indicate ADnumber 'and any applicable distribution limitations on the reproduced
copy of the title page and return to the address below.
-IReturn Address: NASA Scientific and TechnicalI nformation Facility
Attention: INPUT BRANCH
P. O. Box 33 ,
College Park, Maryland 20740
1
j
FFNo 244 Revised Aug 65
'I

NASA Scientific and Technical Information Facilityoperated for the National Aeronautics and Space Administration by Documentation Incorporated
Post Office Box 33College Park. Md. 20740
Telephone Area Code 301
779-2121
FACILITY CONTROL NO. jL 0
DATE,
ATTACHED IS A DOCUMENT ON LOAN
FROM: NASA Scientific and Technical Information Facility
TO: Defense Documentation CenterAttn: DDC-IRC (Control Branch)
Cameron StationAlexandria, Va. 22314
In accordance with the NASA-DOD Cooperative AD Number Assignment Agreement it isrequested that an AD number be assigned to the attached report.
rYAs this is our only available copy the return of the document (with ADnumber and any applicable distribution linitations) to the address below
is essential.
This document may be retained by DOC. If retained, please indicate ADnumber "and any applicable distribution limitations on the reproducedcopy of the title page and return to the address below.
Return Address: NASA Scientific and Technical Information FacilityAttention: INPUT BRANCH
~P. 0. Box 33College Park, Maryland 20740
-- 2
FFNo 244 Revlsed Aug 65

a '
TERNARY PHASE EQUILIBRIA IN TRANSITION METAL-
[BORON-CARBON-SILICON-S YS TEMS
Part IV. Thermochemical Calculations
Volume II. Thermodynamic Interpretationof Ternary Phase Diagramsc 'I
'I
E. Rudy
ci Aerojet-General Corporation
TECHNICAL REPORT NO. AFML-TR-65-2, Part rV, Volume II oJanuary 1966
This document: su bject to special export controls and each transmittalto foreign governments or foreign nationals may be made only with prior
J~l~p proval of Metals and Ceramics Division, Air Force Materials Laboratory,~Wright-Patterson Air Force Base, Ohio.
- :i
VAII
Air Force Materials Laboratory
Research and Technology DivisionAir Force Systems Command
-Wright-Patterson Air Force Base, Ohio
iI
.]I

TABLE OF CONTENTS
PAGE
I. INTRODUCTION .......... ................. 1
II. THERMOCHEMISTRY OF PHASE REA'%CTIONS INTERNARY SYSTEMS ....................... .. 5
A. Two-Phase Equilibria ....... ............. 6
B. Three-Phase Equilibria In Ternary Systems..... 14
I. DISCUSSION OF THE EQUILIBRIUM CONDITIONS ONMODEL EXAMPLES ........ .................. .19
A. Three-Phase Equilibria Resulting from MiscibilityGaps in Binary or Pseudo-Binary Solutions ....... 19
B. Three-Phase Equilibria Resulting from the Absence•of Isomorphaus Counter-Phases . .. .. .. . .. 24
]C. Binary and Pseud.)-Binary Systems of Non-Isomorphous Components ............. 4
D. Computer Approaches ...... .............. 47
IV. APPLICATION TO TERNARY METAL CARBONSYSTEMS ....... ........................... 53
A. The Tantalum-Tungsten-Carbon System ....... 54
1 . Equilibria in the Metal-Rich Portion of theSystem ........ .................... .73
Z. The Three-Phase Equilibrium MeC(B1) +
MeC(hex) + Me 2C (hex) ................. 80
3. The Three-Phase Equilibrium WC+MeCI X(l)+C. .86
B. Back-Calculations of Thermodynamic QuantitiesFrom Experimental Phase Diagram Data ........ .98.
1. The Two-Phase Equilibrium (WCr)--(WCr) C ......... ................ 100
2. Three-Phase Equilibrtum (W, Cr) C --(WCr),C -(W.,Cr) . .. .. . .. .. 236 01
3. Three-Phase Equilibrium (W,Cr) C ++(WCr) C6 + (WCr) C (T= 1575"K)....... 102
\ v

TABLE OF CONTENTS (Cont'd)
PAGE
4. Three-Phase Equilibrium (CrW) C -
-(Cr,W) C -(Cr, W) 3 (T = 1575"K). 7 ....... 103
5. Three-Phase Equilibrium (CrW) C--(Cr, W) 3 C -C (T = 1863K). ... ... . . . 103
6. Three-Phase Equilibrium (WCr)C--(W.Cr) C-C (T = 1863K) ............... 103
C. Discussion of the Carbon-Rich Equilibria in.Uranium-Transition Metal-Carbon Systems ..... 109
V. GENERAL DISCUSSION OF THE PHASE RELATIONSHIPSIN TERNARY SYSTEMS OF REFRACTORY TRANSITIONMETALS WITH B-ELEMENTS ..... ............. .115
A. Metal-Carbon Systems ................... .115
B. Metal-Boroa System. ....... .......... 117
C. Refractory Ternary Systems Involving a TransitionMetal and Two B-Elements .... ........... .. 127
VI. NOTES ON THE RELATION OF PHASE DIAGRAMDATA TO APPLICATION PROBLEMS .... ......... .136
VII CONCLUDING REMARKS .... ................... 142
References ........... ......................... .. 143
Appendix ............ .......................... .A-1
Vi
vt t

LIST OF ILLUSTRATIONS
FIGUR E PAGE
I Possible Phase Relationships in Simplified Ternary System
Z Realistic Appearance of the Diagram Type Presented inFigure 1 3
3 Principle Appearance of the Equilibria Upon Solid SolutionFormation Between the Component A and B, as well as theIntermediate Phases 4
A Two-Phase Equilibrium in a Ternary System 7
5 Graphical Construction of the Tie Lines from the &F-xCurves and Effect of Temperature Upon the DistributionEquilibrium 13
6 Three-Phase Equilibrium in a Ternary System (GeneralCase) 15
7 Three-Phase Equilibrium Resulting from a Miscibility Gapin a Pseudo-binary Solid Solution 21
8 Appearance of the Equilibria for the Case of Non-idealSolutions, and Graphical Determination of the Tie Lines 22
9 Formation of a Three-Phase Field Due to the Absence ofan Isomorphous Counterphase BC v in the Binary System B-C 24
1 0 Stability Relations in a Binary System A-C 26
Ila & llb Integral Free Energy of Disproportionation AF of aPhase Solution (A,B)C .and Corresponding zmer v
Appearance of the Phase Equilibria (Diagrammatic) 3Z
12 Relation Between the Integral Free Energies and the Rela-tive Atom Exchanges in Systems of Non-Isomorphous 36Components
13a & 13b Effect of Non-Ideal Solution Behavior on the Phase Equi-libria in Binary or Pseudo-binary Systems of Non-Isomorphous Components 41
14 Principal Relationships for the Stabilization of a ForeignLattice Type P in a Binary or PseudD-binary System 43
15 Generalized Free Enthalpy 31 Formation-ConcentrationDiagram for a Binary System at a Given Temperature andPressure 46
Vt vii
I
r

LIST OF ILLUSTRATIONS (Cont'd) (FIGURE PAGE
16 Tantalum-Carbon Phase Diagram 54
17 Tungsten-Carbon Phase Diagram 55 j18 Constitution Diagram Tantalum-Tungsten-Carbon 57
19 Scheil-Schultz Reaction Diagram for the System Tantalum-Tung sten -Carbon 58
ZOa - ZOn Experimental Temperature Sections for the Ta-W-C System 59
a. 1500 C h. Z650*Cb. 1750C i. 2745Cc. 2000 C J. 27606Cd. Z1909C k. Z835Ge. ZZL0 C 1. 3000f. Z300C m . 3ZO0 Cg. Z450*C n. 3500C
Zla - Zld Free Enthalpy of Formation-Concentration Gradients forTantalum-Tungsten Carbide Solid Solutions 69
a. Subcarbide Solid Solutions at (Ta, W)C07 {b. Subcarbide Solid Solutions at (Ta, W)CO43c. Subcarbide Solid Solutions at (Ta, W)C bd. Cubic Monocarbide Solid Solutions at (Ta, W)C 0.71
z2 Ta-W-C: Graphical Determination of the Solubility Rangesof Ta2 C and W C Solid Solutions. 75
Z3 Integral Free Enthalpy of Disproportionation of the (Ta, W)C 1 /2Phase into Mixtures of Metal and Monocarbide Solid
Solution 77
24 Calculated Vertical Sectlon (Isopleth) Across Taq, 0. 5 -WQ.0.5 79
Z5 Free Enthalpy of Forrnation-Concentratic-i Gradients forthe Cubic Monocarbide Solution at Compositions Close toStoichiometry (i = 6500 cal/gr. -At. Metal) 83
26 Graphical Determination of the Base Point of the Three PhaseEquilibrium WC + )Ta, W)C -x(Bl + W C at the Cubic Mono-Carbide Solution. 84
Z7 Integral Free Enthalpy of Disproportionation of the CubicMonocarbide Solid Solution [ (Ta, W)C 1 )] into Subcarblde
(Ta, W)C1/2 ] 85
viii
______

!ILIST OF ILLUSTRATIONS (Cont'd)
FIGURE PAGE -
28 Temperature Dependence of the Maximum TungstenExchange in Tantalum Mouocarbide 87
29 Graphical Determination of the Base Point of the Three-Phase Equilibrium WC-{Ta, W)C _x(Bl)-C at the Bl-SolidSolution 90
30 Integral Free Energy of Disproportionatlon of TungstenMonocarbide into Cubic (Ta, W)C 1 x Carbide Solutions andGraphite 91
31 Three-Phase Equilibrium (Ta, W)C1 (B1)+WC + C:Temperature Dependence of the Corositions of the BasePoint at the Cubic Solid Solution. 9Z
32a - 32f Calculated Temperature Sections for the Ta-W-C System 93
a. 1750"K d. Z500"Kb. Z000"K e. 2700*Kc. ZZ50°K f. '.3000"K
33 Section of the Phase Diagram Tungsten-Chromium-Carbonat 1300"C 99
31 Section of the Phase Diagram Molybd,.-num-Chromium-Carbon at 1300"C 99
35 System Section W-Cr-C at 1600K, Back-Calculated withthe Thermodynamic Data Derived from the ExperimentalSection in Figure 33. 107
36 System Section Mo-Cr-C at 1500*K, Back-Calculated withthe Thermodynamic Data Derived from the ExperimentalSection in Figure 34 108
37 Basic Phase Distribution in the Carbon-Rich Portion ofUraniuxn-Refractory Transition Metal-Carbon Systems 110
38 Temperature Dependence of the Graphite-Stable Rangesin Uranium-Containing Monocarbide Solutions 113
39 Free Enthalpy Changes for the ReactionUC + 0.86C- UC (UC)
(Data Calculated from Phas'lbiagrims U-Me-C) 114
40 Constitution Diagram Titanium-Tantalum-Carbon 118
41 Scheil-Schuitz Reactio "Uagram for the Ti-Ta-C System 119
ix
U i~.

LIST OF ILLUSTRATIONS (Cont'd)
FIGURE PAGE
42 Liquidus Projection in the Ti-Ta-C System 119 [1
43 Constitution Diagram Zirconium-Tantalum-Carbon 120 r"
44 Scheil-Schultz Reaction Diagram for the Zr-Ta-C System 121 I45 Liquidus Projection in the Zr-Ta-C System 11
46 Constitution Diagram Hafnium -Tantalum -Carbon 122
47 Scheil-Schultz Reaction Diagram for the Hf-Ta-C System 123
48 Liquidus Projections in the Hf-Ta-C System I3
49 Maximum Solidus Temperatures for the (Ta, Hf)C1 -,Monocarbide Solution 124
50 Constitution Diagram Zirconium-Hafnium-Boron 125
51 Scheil-Schultz Reaction Diagram for the Zr-Hf-B System 126
52 Liquidus Projections in the Zr-Hf-B System I6
53 Constitution Diagram Titanium-Boron-Carbon IZ9
54 Scheil-Schultz Reaction Diagram for the Ti-B-C System 130
55 Liquidus Projection in the Ti-B-C System 131
56 Constitution Diagram Zir conium-Boron -Carbon 132
57 Scheil-Schultz Reaction Diagram for the Zr-B-C System 133
58 Liquidus Projection in the Zr-B-C System 133
59 Constitution Diagram Hafniurmi-Boron Carbon 134
60 Scheil-Schultz Reaction DLagram for the Hf-B-C System 135
Liquidus Projection in the Hf-B-C System 135 V
6Z Conjugate Diffusion Couple Consisting of Two TernarySolutions (A,B)C and (A,B)C(Equilibration by'Xterstitial Atom Diffusion) 138
63 Phase Interchange in a Conjugate Ternary Diffusion for theCase, that the Interstitial Atom C is the Only DiffusingSpecies 139
x-
___________________

LIST OF ILLUSTRATIONS (Cont td)
FIGURE PAGE
64 Equilibration by Host (A.B) Atom Diffusion in a TernaryDiffusion Couple (A.B)Cu + (AB)C 140
65 Effect of Composition Upon the Equilibration Reactions ina Ternary Diffusion Couple (A.B)Cu + (A,B)C(C = Interstitial Element) 141
66 Constitution Diagram Titanium-Carbon A-4
67 Constitution Diagram Zirconium-Carbon A-5
68 Constitution Diagram Hafnium-Carbon A-6
69 Constitution Diagram Vanadlum-Carbon A-7
70 Constitution Diagram Niobium-Carbon A-7
71 Constitution Diagram TaNtalum-Carbon A-8
7Z Constitution Diagram Chromium-Carbon A-9
73 Constitution Diagram Molybdenum-Carbon A-10
74 Constitution Diagram Tungsten-Carbon A-11
75 Constitution Diagram Titanium-Boron A-12
76 Constitution Diagram Zirconium-Boron A-13
77 Constitution Diagram Hafnium-Boron A-14
78 Constitution Diagram Vanadium-Boron A-15
79 Constitution Diagram Niobiun-Boron A-16
80 Constitution Diagram Tantalum-Boron A-17
81 Constitution Diagram Chromium-Boron A-18
82 Constitution Diagram Molybdenum-Boron A-19f
83 Constitution Diagram Tungsten-Boron A-20
xi
II

LIST OF TABLES
TABLE PAGE
1 Thermodynamic Data Used in the Calculation of the PhaseEquilibria in the Ta-W-C System. 67
2 Differences for the Free Enthalpies of Formation ofTantalum and Tungsten Carbides (Values in cal/gr. -At.Metal) 67
3 Disproportionation and Transformation Energies forTantalum and Tungsten Carbides. 68
{4 Equilibrium Compositions of the Phases for the Three-Phase Equilibrium Moaocarbide + Metal + Subcarbide. 78
V 5 Partition Equilibrium Subcarblde + Monocarbide (Bi):Compatible Combinations of x'w and x W 82w w
6 Maximum Tantalum Exchange in WC (Calculated) 89
7 Summary of Thermochemical Results on ChromiumCarbides, Derivedfrom Phase Diagram Data in theSW-Cr-C and Mo-Cr-C System. 105
8 Free Enthalpies of Formation of Chromium Carbides(Compiled from the Literature). 105
9 Free Enthalpies of Formation of Unstable Chromium-Carbide Lattice Types 106
xii_______
I

I F-I. INTRODUCTION
At the present time, strong efforts are being made to utilize the
refractory properties of the sernimetal compounds of the high melting transi-
tion metals in parts for service at extremely high temperatures; similarly,
special techniques, such as dispersion and precipitation strengthening, are
being extensively used to improve the high temperature mechanical properties
of refractory alloys, and a considerable amount of research work is beingVdevoted to the development of oxidation resistant coatings for refractory
metal alloys. !I- Knowledge of the phase-equilibria existing in the corresponding alloy
systems is, therefore, of utmost importance for advanced alloy development
work. This is especially true in those instances where the intended opera-
tion temperatures are so high that non-equilibrium states cannot be main-
tained over significant lengths of time; consequently, the intrinsic stability
of the system itself becomes one' of the controlling factors.
A simple, and most direct route, to solve a specific problem would
be the consultation of the equilibrium diagram for the particular alloy system;
this way, however, can be followed only in exceptional cases, for extensive
phase diagram data are available for only binary systems, whereas data on
higher-order alloys are scarce and usually incomplete.
In view of the large number of possible combinations, which makes
a timely experimental solution of the problem nearly illusoric, the question
arises of how thermodynamic principles may be applied to relate the thermo-
chemical properties of binary alloys to their phase behavior in higher order
systems.
(1
___

If we consider, for example, a simple ternary system of the type
shown in Figure I where the solubilities in the boundary phases are quite
restricted, a simple consideration tells us, that in order to make the com-
bination A + BC stable with regard to AC-B, the free energy change of the
reaction
A + BG-- AC + B,
AF F +FA - F - FFR=FB+AC A BC
must be greater than zero. Knowing, therefore, the free energies of the
individual compounds, one could write down the free energy changes of all
C
4\
AC
Ni
Figure 1. Possible Phase Relationships in a SimplifiedTernary System -l
N NL4 N

po3sible combinations, and select as the stable equilibria those, for which
the above condition holds. Of course, this would only hold true if no ternary
compounds occur in the system, and if the range of homogeneity of the phases
is so small that the corresponding free energy variations within the homo-
geneity fields can be neglected. Most probably,the temperature section of the sys-
tern when correctly drawn, would appear as shown in Figure Z. The dark
areas represent the homogeneous (single-phase) ranges of the phases, and
the ternary phase field is subdivided into a number of areas where either two-
or three-phases are in equilibrium.
C
A
a \
/ 8C-C
AC- BC
AC - C
A ACC SC
7' / A.ABAEC-
A- B r,
-A
Figure 2. F.ealistic Appearance of the Diagram TypePresented in Figure i.
Although this approach looks - at least on the surface - qaite tempting,
its predictive value is nil. First of all, we have to assume,a priori,that the
homogeneity ranges of the phases will be small, and consequently accept the
3
V
%I

risk that we might be wrong; the other possibility, of course, to establish
the basic assumptions by experiment, would defeat the original purpose of the
calculations. Furthermore, and this is especially true for those cases, where
those ternary systems are being considered, wherein the compounds of the
binary systems A-C and B-C have similar structural properties, we will
have to expect extended solid solution formation between the alloy phases, which
ultimately yield the conditions shown In Figure 3. Here, the elements A
and B, as well as the intermediate phases AC and BC, form a complete series
of solid solutions. An infinite number of composition pairs (A, B)-(A, B)C exist,
which are in equilibrium with each other, and the tie lines, which connect co-
existing compositions, give us tie relative amount as well as the compositions
of the equilibrium phases for any alloy in the two-phase field. Considering
/ /
'
AC BC
4,/ / / \7
/ // /•\
/'
A / / // \e.,
Figure 3. Principal Appearance of the Equilibria Upon SolidSolution Formation Between Two Components andthe Intermediate Compounds.

this type of equilibrium from a more practical point of view, we see that the tie
lines would,for example, give us the compositions of the reaction products, if
alloys, from the edge system A-B, would be allowed to react with the com-
ponent C.
From these considerations it becomes quite obvious, that in order to
reach more definitive conclusions regarding the possible phase distribution
in a given system, any reasonable thermodynamic approach would have to
include the capability of quantitatively taking into account the changes intro-
duced by extended solid solution formation, and also would have to provide us
with relationships, which would principally enable us to determine the ternary
homogeneity range of binary phases.
In the following sections, we shall stress briefly the basic thermo-
dynamic approaches. After demonstrating the applicability of the equations
on a few model examples, we will concentrate on the thermodynamic evalua-
_. tion and interpretation of a number of recently investigated refractory alloy
systems and finally discuss the capabilities and limitations of thermodynamic
approaches in solving practical application problems.
II. THERMOCHEMISTRY OF PHASE REACTIONS IN TERNARY
SYSTEMS
According to the phase rule, the maximum number of phases which
can coexist in a three component system is five, or, with temperature and
pressure fixed, three. Therefore, a temperature section of a ternary system
will ordinarily be built-up by an arrangement of one-, two-, and three-phase
equilibria. Four-phase reactions (four-phase temperature planes),proceeding
at constant temperature, are important in the melting ranges, but seldomly
5
St.I''I

occur in the solidus regions oi systems involving condensed phases. Never-
theless, tht existence of four-phase temperature planes can be derived by
aa analysis of a series of temperature sections in the particular system( l )
The mathematical approach, therefore, concentratets on the establishment
of the conditions for the two- and three-phase equilibria at constant tempera-
ture and pressure.
A. TWO-PHASE EQUILIBRIA
In considering a two-phase field (Figure 4) in a ternary system,
the total free energy of a mixture is expressible in terms of the free energie3
and the mole masses of the indivi.lual phases. Let G be the total free energy,
and F1 u. F 2 the free energies of the coexisting phases. If phase i is present
in a quintity vi mnoles, and phase Z in a quantity of v2 moles, then
~F +V F2 (1)
The equilbrium state is characterized by a minimumir i the value uf F. Assurn-
ing conitant temperature and pressure, we see that the free energies of the
individual phases are concentration -dependent,
F1 = f yz, z()
F2 =f (xI', y it, z11)
With X, yp z', and x", y", z" denoting the compositions of phase 1 and 2,
F becomes then
F f (V1 v2' Y 1 , Z 1 x' y
6%
_
I

Homogeneous Phase
A XB B
Figure 4. Two-Phase Equilibrium in a Ternary System.
The Tie Line Through the Gross Composition (xyz)Shows the Coexisting Compositions.
The relations existing between the concentration terms together with the require-
ment for the conservation of the atomic masses, result in the following six
boundary conditions:
V1 +v2 = 1
x+yl + zI = 1
X" + y " + " =-1
v x' + Vzx = X
+ vzy" y
VlZ vZ = Zi2
7

where X, Y. and Z stands for the gross composition of the alloy. The location
of the minima is best evaluated by Lagrange's method:
8F \k
Proceeding in this way, we obtain eight determining eq.ations for the six
undetermined multipliers ak, as well as Y, and vz"
F, . al - a4. x1 - sYI - ay6zI = 0 (a)
F-c~- 4 x" =0 (b)F2 - al - a 4. -asy" - a6z11 = 0(b
V1 a2-C'V 0 (c)
'r-c a-v n0 (d)
I .- = 0 (e)
8F 2
V T7 3- 4 v2 = 0 (f)
v2 N'-yz - a %v z 0 (g)
From the last six equations, we obtain the important partial solution
- ~ T,p = L " - ](Za)
- T,p F- Tp (Zb)
aE)FE F T.
"-, = " - _JT (Zc)=- ] T p 70p8 F
a8
Eb B(2
I ,Y 52 ,p [cFy2 6zr ~

which, together with the boundary conditions and the remaining equations (a)
T: and (b), can now be used to evaluate the undetermined multipliers; this ultimately
yields the equilibrium conditions for the general case of the two-phase equl-
llbriun.
Geometrically, the solution represents the manifold of all
double tangent planes to the free energy surfaces of both phases, and implicitly
contains the well-known thermochemical relation, thatin the equilibrium stateI!
the partial free energies of the components are the same in all coexisting
7phases.We shall, however, not perform the evaluation of the general
condition equations, since the arithmetic is quite involved and the applications
of the resulting equations to actual ternary systems is too laborious and time-
consuming in order to be of any practical help. They retain a certain use-
fulness in pseudo-systems of elements or compounds of equal stoichiometry
and structure since for these cases the free energies of the boundary phases
cancel, and the course of the tie lines in the two-phase fields becomes a func-
tion of only the solution terms(Z).
In many instances, and this applies especially to systems involv-
ing semi- or non-metals, the intermetallic compounds formed are either
nearly perfect line compounds (true for most silicides and borides), or forn
* defect solid solutions, which are characterized by a similar variation of the
free energies across the homogeneous fields (carbides and nitrides). This
affects the appearance of the ternary equilibria such that the boundaries of
Xthe one-phase regions are nearly straight lines; running parallel to the
metal, - metal 2 -bases. The conditional equations can then be substantially
Vr *A treatment of the general case for interstitial-type compounds is given inE.Rudy:Ta-W-C System (AFML-TR-65-2, Part II, Volume VIII, March 1966).
9

simplified since we may take the concentration term of one of the com-
ponents, say z, as independent of x and y, i.e.,we permit the free energy to
be varied only by the relative exchange of A and B. Proceeding in this way,
we have:
x' + y' const = a (ax' -8y')
Z' const' = 1-a (8' 0)2
xt + y1 = const" = b (8x"= -8y")
Z1 = const' = 1-b (8z": 0)
Substituting into the partial solution from Lagrange's equation, we obtain the
two equivalent conditlons(3a) and (3b).
aTI][S] (3a) f I
8d T, p LaX-2i T, p (
[a- 1],[8F 2T,p L T, p (3b)
We note the formal analogy of these equations to the conditional equation for
binary alloys in both cases. A tie line connects two points of equal free energy j
gradients; however, due to the additional degree of freedom, the single tie
line in the binary system splits up into a aJ multiplicity (d tangent planes with T= J
const) in the ternary case. Taking the -example shown in Figure 3, it is seen that
a change of the significant parameters, in our example the exchange of atoms
A and B between the two solid 3olutions, alters the concentration and hence
the free energy of both phases in the direction A=B, and the gradient, therefore,
has to be taken along the same path.
10

II
A few simple considerations will show us the usefulness of
these equations. Assume, for the sake of simplicity, ideal mixing betweenI
t both solid solutions (A,B) and (A#B)C. Since we consider only changes in
the partial lattice (A, B) to be significant, we base the calculations on one
gram-atom of A+B in both solutions. In this way, we obtain as the free energy
for the solid solution A-B,
:x. ++x.x~n + xIn x(A, B) A A B FB + R.XAXA B B
and in a similar fashion for the free energy of the crystal solution (A,B)CI
F xA* FAI B +x. + RT (x In x' + x -I(AB)C AB BABC+A B xB)
xA XB . .Atomic fraction of A and B in (A, B)
X AXB....... Relative mole fraction of A and B in thesolution (A.B)C. (x'+ xB 1)
Differentiation and rearrangement yields the equation
X" B x
XA Bn FBC- FB- (FAc-FA)- R InxA xB
Substituting the more easily obtainable free energies of formation &Ff. for the
rfree energies,
=F -F -F"fBC BC B C
I
fAC -FAC" FA CU
we obtain the final relationship for the tie lines of this partition equilibrium:
R(RTIn K --- ~BCA-FA.C (4)
{- II11

The constant K abbreviates the expression
XIXB xAk
-xA
and we may interpret it as the equilibrium constant of a reaction
< A> + <B > <A >B>(A.B) (AB)C (A,B)C+ < (AB)
,&FfA and AF are the free energies of formation of the binary alloy phasesLAG £BC
AC and BC at the temperature T(p = 1 atm).
From equation (4) we derive readily, that the relative distribu-
tion of A and B in the solution (AB) and (AB)C is a functibn of the stabilities
of the boundary phases; for equal stabilities, i.e. AFf 0 = AF thefBC LAC'
relative concentrations of A and B in both solutions are equal. With
AFBC < AFfAC (BC more stable than AC), the concentration of B in the
solid solution (AB)C appears higher than in (A,B). The reverse is true for
the case AF > FfAC (AC more stable than 13C).
The free energy of mixing increases with increasing tempera-
ture and hence tends to equalize a given free energy difference AF 0 - AFLAC.
For the (hypothetical) limiting case T--. oo we obtain independent of the free
energy differences, equidistribution, xA = x and x B=
To illustrate the method and to demonstrate the graphical
solution method, we may treat the foregoing example numerically. Let, for
example, the free energy of formation of the binary compound AC be
-4.574 cal/mole and AG = -2287 cal/mole. We want to know the equi-BC
librium constant K as well as the tie line distribution for 500*K and 2000*K.
12.

According to equation (4)
RT in K = AFfC - AFAC 22Z87 cal/mole,
K =K (500-K) =10
K=K(COU-K) =1.779
The knowledge of the equilibrium constants K defines for any alloy (A.B)
the compositions of the products, which will be formed upon exposure to the
component C. From the decreasing slope of the tie lines with increasing tern-
* peratures (Figure 5), we derive, that the reactions tend to be less selective
* at high temperatures. i.e. the relative distribution of the components A and
B becomes less preferential.
K=10 Kc1.78AC BC AC 1C
__ B
60A0
00 ______K T=20
24000L0 . . . .
CONCENRATIO
z igre5 GapiclCostutin f h Te insfrm h___Crvsadfet_ fTmprtreo h
-2000o qulirim
-4000 T20013

For direct comparison purposes, but especially in those
instances, where the solutions cannot be treated as ideal, it is preferable to Fperform the evaluation graphically. For this purpose (equations 3a or 3b) we
plot the gradients of the free energies as a function of composition; the hori-
zontal intercepts between the curves at the chosen values xA or xA, imme-
diately then yis the equilibrium compositions (Figure 5). 1
B. THREE-PHASE EQUILIBRIA IN TERNARY SYSTEMS (Figure 6)
The derivation of the conditional equations for the three-phase I .
equilibrium is performed analogously to that for the two-phase equilibrium.
However, in view of the bulkiness and complexity of the resulting equations,
which make them of only limited use, we shall not stress the general ca&e but
rather concentrate on the simplified treatment which we will need for our
subsequent discussions of actual systems. A brief review of computer ap-
proaches for the solution of the unrestricted problem will be given in a later
section. We have to consider an equilibrium Ax,B y,C ,- A,, B y,Cz, , -
A,,,By 11,C ,,, where z', z", z"' have individually different, but otherwise
constant values.
Since three phases are involved now, the total free energy of -
the phase mixture becomes
F =vIF I+ v 2F z + v 3 F 3 ,
with F, W Y 'with * (x', y', z')
Fz z (xII, y"I, z"1)
F 2 4 2 (x'", y'", z'")
14

Homogeneous Phase 3
A6 C
!,
iI Homogeneous
Homogeneous Phase I /
XB
Figure 6. Three-Phase Equilibrium in a Ternary System(General Case).
!I
Together with the boundary conditions, which results from the relations existing
between the concentration terms as well as from the conservation of the atomic
masses ,we obtain, in the well-known manner after Lagrange to obtain the mini-
mumthe equations:
F I -I X' -a 2(a - x) - a3 (l-a) -a 0 (a)[4
2 1 -, CL2 (b- x")-a 3 (1-b)-a 0 (b)
F -a x"'- a (c - xtI' ) -C (1-c) - 4 0 (c)3 1 2 34
. 8F,
V1 75-=, I,+ V 0 (d)
L 15
II

8FV3 8 , - V + CLv 0 (e)
3 8 , , ~ v1 3 + a 2 V 3 0
with vI + v +v = Iwih 1 2 3
x' + y= const' a
x" + y"= const" b
X111 + y, const"'= c
From equations (d), (e), and (f) we obtain t1v important partial solution:
I , T, p I T.p [ -j T.p= " -z (5)
With this equation alone, however, the three-phase equilibrium
is not yet uniquely defined. An infinite number of solutions would satisfy
relation (5). and we need an additional condition in order to reduce the possible
solutions to only one. For this purpose, we turn to the remaining equations
and eliminate the imdetermined multipliers o. through a4"
Rearrangement of eqLaations (a), (b), and (c) yields
F1 -x' (a,-a) - a -3% + '3 a-a 4 -- 0
F 2 - X11-ab L -b - a 0
F3 -x'"(C- 1%) - 3 c-u. 3 + c - 0
Substituting relation (5) for al-ae and recalling the relation for calculating
partial (T1) from the integral quantities,
16
'I __ _ _

I
A xA
we obtain jilB B + b 2 3CL ) - a ( ,-%31 = 0
3B- T + b 2.-a) - c (a -%3) = 0
Elimination of . Land a3 finally yields
..1. .B 2 3 - 1 3 3 3 (6 )a-b b-c a-c
and, due to the symmetry of the relation, the equivalent equation
XA_ 2ZA FzA 3A zA_ F3A
- F __ (7)a- a - , - c.
The partial quantities in equation (6) and (7) are on a gram-atom basis. In
practical calculations it is inconvenient to first determine the differences of
the partial quantities, and then to divide by the composition factors a, b, and
c in order to satisfy the conditional equations. Instead, if we base our caicu-
lations on a gram-atom of the components A + B, i.e.,if we express the com-
P pound solutions in the form (A, B)C i , we have for
Solution I = (A,B)Cu
SolutionZ = (AB)CVV
Solution 3 = (A,B)Cw
1|-7
!I

FA U -FA() --u) a a
- zA 1-b"-~~F A (v ) = " -- V -
andaA 1-c
FAw C C
Substituting in equation (7) and rearranging the terms, we obtain the condi-
tional equation in the form:
(v-w) F + (w-u) Y + (u-v): 0 (8a)A(u) A~vj A(w)
Performing the same operation for the component B,we receive the equivalent
relation
(v-w) FB(u)+ (w-u) F (v)+ (u-v) w 0 (8b)B + (w-u F (w) 0
FA(u) FA(v) FA(w). Partial free energy of A in the solutions(A,B)Cu . (A.B)Cv , and (A,B)Cw .
B B(u).' B(v.I w)... Partial free energy of A in the solutions(A,B)Cu, (AB)Cv, and (AB)Cw
Equations (5) and (8) together now completely define the three-phase equilibrium:
From all coexisting composition triples admitted by equation (5), the correct
triples, i.e.,the compositions of the three phases, which have the lowest free
energy, are sorted out with the aid of equation (8). Equation (8) corresponds
to the law of the mass action in the form of the well-known thermodynamic-
relationship for the equilibrium state:
18
- .-!----1 i- - - -- - - - - - -----

V141= 0
where the v denote the mole masses of the zeacting species and the p, are
their thermodyiiamic potentials. The fact, that two equilibrium conditions
are required reveals that the law of mass action is not sufficient to locate
the three-phase equilibrium in terms of the individual equilibrium concentra-
tion of the phases.
Equation (5) and (8), will be extensively used for calculations
in actual systems. For the sake of convenience, we shall refer to equation (5)
as the "gradient-condition", and to equation (8),for reasons to be explained
later, as the "stability-concition".
III. DISCUSSION OF THE EQUILIBRIUM CONDITIONS ON MODEL
EXAMPLES
A. THREE-PHASE EQUILIBRIA RESULTING FROM MISCIBILITY
GAPS IN BINARY OR PSEUDO-BINARY SOLUTIONS
. This case is very frequently found in actual systems. Misci-
bility gaps in solid solutions may arise from large differences in the atomic
sizes of the constituents, where the resulting strain energies result in posi-
tive mixing terms, and ultimately may cause the solution to separate into
two distinct phases. As a first approximation, we may take account of the
=- nonideal behavior by adding a. positive enthalpy term to the ordinary mixing
quantities, the later being entirely due to the entropy of mixing. The most
common approach,using a parabolic form, is that originally proposed by
Van Laar, and the solutions which obey this bel-avlur are usually referred
to as "regular solutions". The free energy of mixing for the regular solution
is given by
19

mix+ r xli m~~xA = 'A" B RT (xAlnx x+x B In xj)-A B XAXBA AXBi )
where a is the so-called interaction parameter. The critical solution tem-
perature for the regular solution is derived from the condition, that the
first and second derivative must vanish at the critical point, and is given by
T -Tc ZR
Due to the symmetry of the terms, the critical point is located at x = and
IIthe miscibility gap by the regular solution model is symmetrical with regard
to x
A typical case for a three-phase equilibrium resulting from
the formation of a miscibility g. a one of the compound solutions is show
in Figure 7. For simplicity, the same basic system layout as in the example
shown in Figure 3 ias been chosen.
The psaudo-binary miscibility gap is suLfficiently defined by
the relation
..+"1 , LT,p const.
x...... Being the composition of the terminal solidXCG C2 solution.
The vertex of tlhe three-phase equilibrium at the solution (A, B) is located,
according to equation (5), at that point, where the free energy gradient of
the (A,B) solid solution coincides with the gradients of the solid solution
'I"

(A,B)C at the concentration points x and x The evaluation can be done
either by calculation or graphically as shown in Figure 8. To depict more
C
AC BC
A B
Figure 7. Three-Phase Eqlillbrium Resulting from a MiscibilityGap in a Pseudo-binary solid solution.
Fclearly the existing relations, the equilibria were drawn on a rectangular basisinstead of the usual triangular one The following data were assumed for
the calculations:
AF 4574 cal/mole ACfAG
Z'fBC 2287 cal/mole BC
AT 1000*C = 3960 cal/mole)
AT 1200*K (e2= 4750 cal/mole)
21
i[ zS

The free energies of both compounds are further assumed to have the same
temperature dependence so that the difference may be taken as being independent
of temperature. Choosing the pure components A and B as the reference
T - 1300°K T =l00'K T =900KA I Bf AC C C
6000 3000 j 3000
o (O0C(A. 8 (A, 1oB)C
(AAB/)
4000 2000 2000
aI
.' 2000 lOC-1000j
0 0 0
0-2000 --- 1000 -1000 ,B
-4000 -00 -2000 I
00.5 1.0 0 0. . oXBC) XB(XBC) X (X B i
- -- Meta stable
Figure 8. Appearance of the Equilibria for the Case of NonidealSolutions, and Graphical Determination of the Tie Lines. I
state, we obtain for the solid solution (A,B)
I(AB !A xB RT (x'Aln x in x)
and for the solution (A,B)C:
=A" AF +x" AF +a;x" x' + RT (xA Bx +x) n X11(A,B)C A fA C B A A B n
IThe free energy-concentration gradients become then:
II22t
. '"

U
F
- LA Tap I_ 4 1 (l-A x')+Rbx -p--
S1 c" FA,+a(l"Zx'U) +RT~ I x-TL xl' T ,p B B
These gradients are plotted in the lower portions of Figure 8 as a function of
the concentration xc and x' respectively.B d
At 1300*K, both solutions are above the critical temperature,
and the only heterogeneous equilibrium in existence is the two-phase equi-
librium between (A, B) and (A, B)CI_x . At 11000K we notice the formation of
a miscibility gap in the solution (AB)C, with the consequent formation of a
three-phase equilibrium
(A,B)I- ss + (A,B)II - ss + (A,B)-ss
Finally, at 900*K both solutions exhibit miscibility gaps, and
consequently, two three-phase equilibria, each of which is surrounded by
three two-phase equilibria, appear. The construction of the tie lines within
the two-phase fields from the gradient curves follows the same route as
previously described.
Re-examining the equations, we arrive at the conclusion that
for the evaluation of such three-phase equilibria, which result from the forma-
tion of miscibility gaps in binary or pseudo-binary solutions, the gradient con-
dition is sufficient for the evaluation of the base vertex of the three-phase field.
fZ3
S

I.
B. THREE-PHASE EQUILIBRIA RESULTING FROM THE
ABSENCE OF ISOMORPHOUS COUNTER-PHASES (Figure 9).
This is the most common type of three-phase equilibrium
occurring in ternary systems. In view of its importance and of its interest
from the theoretical side. it will be considered in somewhat greater detail.
Figure 9. Formation of a Three-Phase F ield Due to theAbsence of an Isomorphous Counter-PhaseBC in the Binary System B-C.
Suppose, as shown in Figure 9. we have a system where the
phases AC Uand BC uas well as the pair AC wand BCw,, are isomorphous and
form a continuous series of solid solutions In one system, say A-C, we
2I4
Z4t
Ac____
I

further have an intermetallic phase AC which does not occur in the edge-
system B-C. Due to the fact that the corresponding phase in the B-C
system is missing, the solid solution (A,B)Cv is ultimately terminated by
a three-.phase equilibrium
(A, B)C u + (A, B)Cv + (A, B)C w
Intuitively, we are inclined to assume that the range (A,B)v
will increase with increasing stability of the hypothetical phase BC v, for we
F know that the solution should extend over the whole concentration range if
such a compound would become stable in the binary :8-C system. We therefore
expect that the relative stability of the hypothetical phase BCv, (i.e. its free
energy of disproportionAtion into BC and BCw) will be the main controlling
factor for the size of the ternary range of the (A,B)C solid solution. The
general situation, shown for a binary system A-C with two phases AC u and
ACw, and a further compound AC of varying stability, is depicted in Figure 10V
(Case I, read BC instead of AC
To d.scuss the problem mathematically, we best start out
from the stability condition (8):
(v-w) FA(u) + (w-u) FA( )+ (V-W)F 0
Basing the calculations on the components as the reference state, we may
replace the free enthalpy values by the respective free enthalpies of forma-
tior., i.e. we may write AF in place of FAC without changing the form{u i
of the equation. Separation of the partial free energies into base- and con-
centration dependent terms yields
25
I

Av-mix -mix -mix 0(v-W)AF~k(U)+(w-uJAF;* )+ (v -W1A( w)''W +~.r(Wu)WA(V)(Vl Aw
I i0
\\ A Av
\
\ NAF Z <0
\ .. (I Unstable)
N 1E
AZACON\N
ASz <0: Eutectoid Point \ NzN
ASZ >0: Peritect0od Point \\ | AFZAC \ AC"\ "ZACv 0 \ /
- N Stable
Homogeneous Range ..of Phase X
Figure 10. Stability Relations in a Binary System A-C.
I: AC Unstable with Regard to a Mechanical MixtureofCk and ACw.
II: Boundary Case. Designating the High (Peritectoid) orLow (Eutectoid) Temperature Stability Limit of thePhase AC V .
M: AC Stable.V
A C is the Free Enthalpy Change Involved in the DisproportionationZAG V
Reaction:
(w-u)AC -- +(w-v) AC + (v-u) AC
26

Where the AF m ix terms refer to the partial quantities of mixing,and the
first three terms correspond to the free enthalpy change of the reaction
(w-u) ACv -*(w-v) AC u + (v-u) AC w . .. * ZAC
-he quantity AFzA may be regarded as the free enthalpy of disproportiona-
tion (AF ZAC ) of the phase AC v into the neighboring phases A and AC w .~V
Analogously, the last three terms, containing the partial mixing quantities
for the phases (A,B(C u0 (A,B)C, and (A,B)Cw& may be interpreted as thevu
corresponding free energy changes which result from the formation of the
solid solutions. The above equation may then be rewritten to
-mix
AF + AF 0 (9)ZAG ZAG
v v
Due to the reciprocity of the relations, the analogous expression for the
component B is obtained.
g- :--mix
AFZBC + AFZB C = 0 (10)V V
T
LThe three-phase equilibrium is therefore characterized by
the condition that the free enthalpy of disproportionation for each of the binary
compounds AC v and BC are brought to balance by the corresponding partial
solution terms. Knowing the solution behavior, relations (9) and (10) give us
a means, to separately determine the free enthalpies of disproportionation of
L the phases AC and BC from experimental phase-diagram data; this
allows us to assign free energy values to the hypothetical phase BC
r 27
'U _

To determine the equilibrium concentrations from given
thermodynamic data. we first employ the gradient condition, which yields
the vertices of all possible three-phase equilibria existing across the entire
concentration field. Mathematically, this procedure is equivalent to reduc-
3ing the so initially possible solutions (manifold of combinations between
three concentration variables, x, x', and x') to a manifold of only I [ sets
of interrelated triples (xx',x")]. These "compatible" triples of concentra-
tion terms are then inserted into equation (9) or (10); the correct composition
triple is that one for which these conditions are satisfied.
In view of the transcendency of the resulting equations, which
makes the arithmetic quite involved, the evaluation again is best done graphi-
cally. We will, however, not treat a model example, since the calculation
techniques will be demonstrated extensively in the application section, but
rather discuss a few important relations.
Relations (8) and (11) are valid for the equilibrium state; any
deviation from it will result in the appearance of a finite quantity, p, on the
right hand side; which essentially is a measure of the relative imbalance
between the disproportionation terms for the binary compounds and the mix-
ing quantities. We may therefore generalize condition (8) and write,
--mixA = AFZAc + AFzAc (11)
v v
-mix
B FZ +F Zc (12)v v
Z8 {

and note, that at equilibrium
(x) = 0
When (x) assumes positive values, i.e.,
( (x) > 0
the solution (A,B)C v is stable in respect to mechanical mixtures of (A,B)C
and (A,B)C w . For the case that
* (x) < 0,
the solution (A, B)C v is unstable and disproportionates into mixtures of the
solutions (A,B)Cu and (A, B)C w .
We further note, that
A [xA(u ) 1] AFZACv
qA [ XAlv) 0 ZBC
cOB [XB(u) = A] = FZBC
rB [xB(v) =0 1 AFZA cy v
i.e. a perfect symmetry of the relations.[So far, our relations have dealt only with partial quantities,
and we naturally expect the excess functions *A and 05B to describe only the
partial disproportionation quantities only. Consider now, for example, that
one would be interested in knowing how much a given crystal solution, in our case
the series (A,B)Cv stable in respect to the neighboring phases, i.e., we would
29
II
S- I

like to know the integral free enthalpy of disproportionation of any given com-
position (A, B)Cv into corresponding (quasi-equilibrium) mixtures of (A, B)
and (A, B)C.
With both functions 4'A and '1B known, the integral free enthalpy
of disproportionation i(x) of the crystal solution (A,B)Cv would be given by:
nt. (XI) = xAlv)" )APXiA) +X.Bv)B(xLB)
or, since
"B(v) = Av)
,int. xl) = XA(v). 'A(X A) + [ l-XA(v)] • B (x i)
The concentration variables x A and xiB abbreviate the sets of terms xA(u),
X and MAfwh and x3(u)' , xBw) respectively; they are used to
help to indicate the components to which the concentration variables refer.
Thus, by agreement
x = I-XB.
In order to obtain the integral function 1)(x), we have to deter-
mine the interrelation between the partial functions Land 43(i). It
can be shown (Appendix I) that both functions are identical, i.e.,
OAlLA = CBliB) i -
Substitution of this result into the equation for '1int.(Xi). yields
' int.(×i) = ,AlXiA) _ B(xiB) (13)
30
I

U
We obtain, therefore, the important result, that the integral free energy of
disproportionation of a crystal solution is equivalent to the sum of three free
enthalpy of disproportiona.tion and the partial free energy of mixing for either
one of the phases participating in the equilibrium.
With these findings, we are now able to schematically list the pos-
sible reaction types (Figures lla and llb). Each case is found in actual systems.
The case shown in Figure 11(b) is of special interest since it indicates the
possibility for a ternary disproportionation of a solid solution formed between
two stable, isomorphous binary phases.
As described previously, the graphical method offers the most
convenient route to eva'uate the equation. A closed solution for + int (xi),
which often is useful for initial estimates of the gross behavior of the phase-
relationships in a system, can be given for the case whee the solutions behave
&ideally. For this purpose, we have to combine equations (5) with equation (8)
or (11).
Expanding relation (5), we obtain (T,p = const)
FLACTu in XA(u)
-fA(u) = (AC - f(BC )z l-)U U A(u)
LkC vX(/ AFfC~) &"IBv} RT In xAV
[ AFfACfA C F In . . .. .n
f (A ) 'BC)I
31

A C
+
0 ,
ACIVB,
AC,, BC
Fig. 1 la
T< T c T Tc T >TC
> 0
ILI
0 1 0b
ACW BCW
Ac. BC,o x B 1 0 B 1 0 "B Fig. lib
Figure 11(a) and 11(b)
integral Free Energy of DisproportionationsF7MeC ,of a Phase Solution
(A. 'Cv,.and Corresponding Appearance of the 1ita seV Equilibria(Diag,.mrnatic).
Properties of the Function AFZMeC.:
FzMOCv ["B(v) 01 AFZACv
AFZMeC[ XB() 1] = FZBCv
kFZMeC v Z 0: Solution (A, B)CV Stable
AFZMeCv ! 0: Solution (A,B)C Unstable with regard tomechanic mixtures of (AB)Cu and (A,B)C w
32

Equation (11) yields
A [xi] AFZAC + 'ZAiC
v-u w-v
A[XiA3 "ZA +RT in A(w) 'A(u)ZAv XA(v)
with
AF'ZAC (v-u3 AEf(Arw) + (w-V) A5 FfAC -(w-u) A'f(AC
Substitution and rearrangement of the terms yields
W-u w-u]x AF R InIA(v) (K-1 [1+xAv (K -I)1
r or, seeking 4 as a function X~)
B(x )r-B[xcB(v)]>AFA -RTl[xBv( -1) (u K 1
The coaustants KC,, K2 ,K; and K 2 are defined by:
RT In K =A'fAG V- fBC; V- AfAC +A"MC
.T n K2 A -AF -AFfA A~B2B fAG EBCV v W W
K
K I 7 2
33
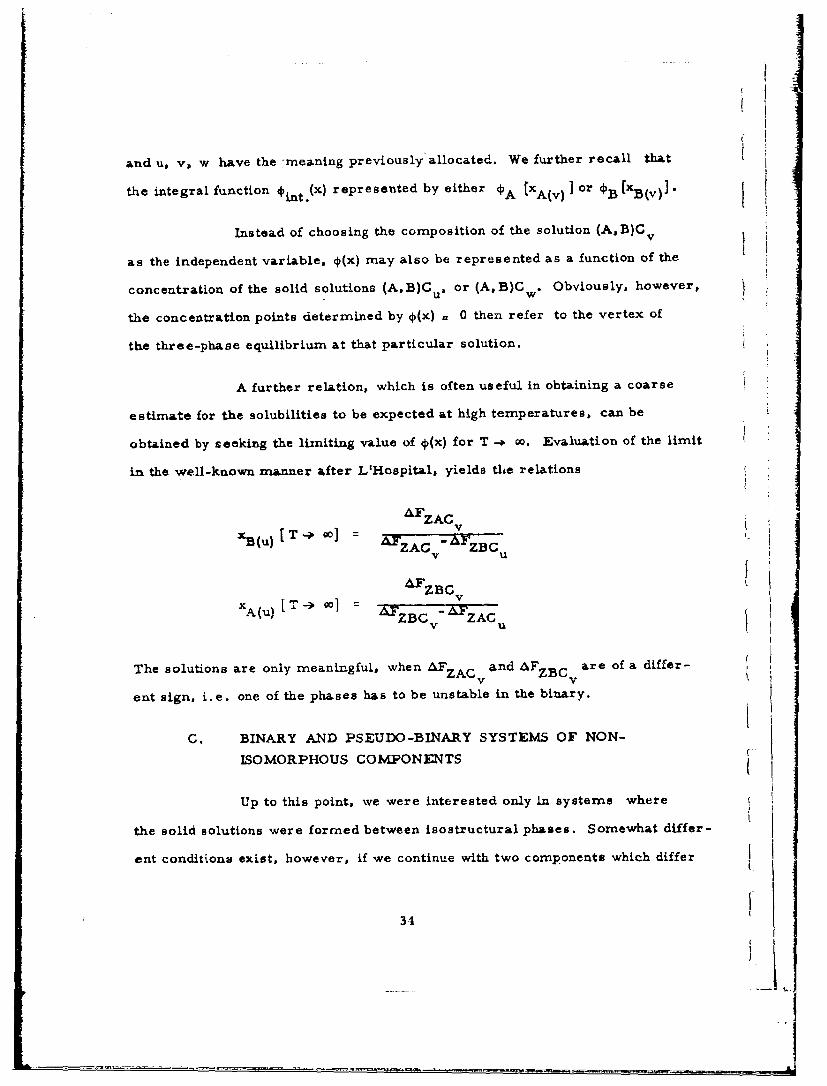
and u, v. w have the -meaning previously allocated. We further recall that
the integral function *int.(x) represented by either cPA (XA(v) I or OB [XB(v)]
Instead of choosing the composition of the solution (AB)C v
as the independent variable. c(x) may also be represented as a function of the
concentration of the solid solutions (A.B)C u & or (AB)Cw . Obviously, however,
the concentration points determined by 4(x) a 0 then refer to the vertex of
the three-phase equilibrium at that particular solution.
A further relation, which is often useful in obtaining a coarse
estimate for the solubilities to be expected at high temperatures, can be
obtained by seeking the limiting value of 4(x) for T -* oo. Evaluation of the limit
in the well-known manner after L'Hospital, yields the relations
'ZACXB() ZAC ZBC
v u
ZB G vXA (u)[LT- oo AFZB - AFzZBCv ZAGu
The solutions are only meaningful, when AZAC &nd AFZBC are of a differ-
ent sign, i.e. one of the phases has to be unstable in the binary.
C. BINARY AND PSEUDO-BINARY SYSTEMS OF NON-
ISOMORPHOUS COMPONENTS
Up to this point, we were interested only in systems where
the solid solutions were formed between isostructural phases. Somewhat differ-
ent conditions exist, however, if we continue with two components which differ
3.1

i- in their crystallographic framework. In general, temperature dependent
mutual solubilities will be observed, but the two solutions will always be
- i: separated by a two-phase field of finite width. The question arises now$ con-
cerning the relations between the magnitude of the atom exchanges in the two
structurally non-equivalent lattices and the energetical quantities. Furthermore,
* as a follow-on consideration, we will be interested in how deviations from the
ideal solution will affect the overall appearance of the equilibria.
Let A and B be the constituents of the binary or pseudo-binary
system. The crystal structure of A is designated with a, and that of B with P.
(A, B) is then the solid solution having the a-structure, and (A, B) the solu- Ition exhibiting the structural characteristics of P. We further assume that no
ternary compound is formed across the concentration field, i.e., the free
energies of all other phases conceivable to be formed, shall be more positive
than those of (A,B) , (AB),, or mechanical mixtures of both.
We expect that apart from the temperature, the adaptability
of the individual components to the lattice of the partner will influence the
widths of the homogeneous ranges; i.e., we expect the relative atom exchanges
in both lattice types to be a function of the transformation energies AFB ( - a)
and AF (a - P) for the component B and A. The free energy-concentrationA
relationships prevailing in such a system are shown in Figure I. In order
to obtain a mathematical relation between the concentration and the free energy
[ quantities, we start out from the well-known thermodynamic relationship that
in the equilibrium state the thermodynamic potentials (partial free enthalpies)
of A and B, must be the same in both solid solutions. Hence
'-(a) A(P)
1 35

I f
Denoting the integral free enthalpy of mixing of the a-solid solution with
mix ixa and that of with F and using the stable structure as the
AAF
1'
0
I i
x- ..Slblt iiifteaSldSlto-I XB Xl
Figure 12. Relation Between the Integral Free Energies and
the~ Relative Atom ExchangeR in Systems of Non- --
isomorphous C omponents.
xI . Solubility Limit of the o-Solid Solution Ix. .... Solubility Limit of the -Solid Solution
AFA(a-> P) .. Free Energy Change Involved in Converting the
Lattice Type of A (a) into that of B (P). (FreeEnergy of Transformation of A).
FI'&B(P4 1 a)..Free Energy of Transformation P -.*a for the
Component B.
36

* reference satet, we obtain -
-mixA(o) A (a)
-mixA(f) (a + P3) A (P)
- or
mix mixA(a) A(P) AFA(a -P P)
and In an analogous manuer for the component B
-mix -mx (13)[ FB( -(i) = F (13) C)
i .If both solutions behave ideally, these expressions become, applying the
well-known thermodynamic relationship for calculating partial from integral
",. quantities,
FA F +XB -x-A
We obtain then
-mixFA a) = RT ln xA(a)
-- mixFA = RlnXA(P)
RT - - AFA(L.*) (14)XA(P)
and for the component B
fxRT Bn B(pa) (15)f~ ~ ~~' (a) B )15
37
f -

With the following relations existing between the concentrations terms:
XB(P) -lXA(P)
XB(a) l -XAa .
B A(a)
For the case of non-ideal solutions, the partial quantities either can be derived
from known experimental data, the nonideality can be approximated by suitable
mathematical expressions. Thus, for example, using the regular solution
approach, we obtain the following equations:
-am i x 1- = +alX~) RT InX~a x
A(a) = L lXA(a) RTinxA(a)
Fmix 2 ~n
[ l-Xa - [() RT In - AF (
or, since for the majority of instances £ a = 4 = a
. [XA(a) XA(P)I [xA() + xA(P) _2J ] RT in A( [A"
Analogous expressions can be obtained for the component B.
From the foregoing equations, we derivethat the relative atom
exchange in systems between non-isostructural components is principally
determined by the free energy differences between the lattice types of the two
partners. Since the transformation energies are positive quantities, we
derive,for example from equation (16) that with increasing AFA(1 - P) the
38
|2

ratio increases, i.e. the width of the homogeneous range of the a-phase
Increases. while that of P narrows down. If we consider, for example the
special case, that FA(- +3) " AFB(P * c)' the homogeneity range of the
P -solution will be negligibly small.
Under these circumstances
mixF B (P3) 0
and we obtain from equation (15)
mixFB(a) B( +F a(3c)
For ideal solutions, this results in the simple relation:
RT In xl) AFB(p ) (17)
I- or, since
8 AFB(P * a) AHT B(P -w a)
- 2T
in the familiar Clausius-Clapeyron-type of equation,
[i81n x
. - 'T RT 2
This relation, in the integrated form
AHIn x A-
39

is commonly used to evaluate the enthalpy change AH from experimental
solubility curves ("heats of solution").
For practical purposes, it is often convenient to have a rapid
means by which the relative magnitude of both solutions can be estimated,
or, for the case of narrow two-phase ranges (small free enthalpies of trans-
formation of A and B, high temperatures), to obtain the concentration range
where the two-phase equilibrium is to be expected. For this purpose, we
seek the limiting expression in equation (16) and (17) for T-P go, and obtain
after LIHospital:
-A(a --o3-xA r . AFB( -Pa)
i.e. ,the limiting concentrations of A and B are inversely proportional to their
free enthalpies of transformation.
As an example, let AFA( a P) be 100 cal/gr. -At., and
= ZOO cal/gr. -At. With these values the approximate mid-point
composition of the two-phase range a + P will be at
B 1 -x A 1l 2 or xA 0. 5 5 ,xA 1A
i.e., the P-range extends further than the homogeneous field of a.
In order to demonstrate the applicability of the equations dis-
cussed in this chapter and to show the possible variations in the appearance of
the equilibria due to nonideal solution behavior, we shall consider one example
in somewhat greater detail.
40

We assune two structurally different components A and B,
with B transforming at T into a lattice type equivalent to that of A. Without
seriously curtailing the generality of the results, we shall use the regular
solution approach to describe the deviation from nonideal behavior, and we shall
also assume that AG A ( a - P) > > AGB(P -a)' so that we may neglect any atom
exchange in the component B. This helps us to simplify the arithmetic.
Including in equation (17) the nonideal~ty terms, we obtain
Sl-x] + RT In x &FxBB (a) B (P.- a)
2500 3Tu 000' = 0 (ideal)
-- e90 5940 cal/Mole
2000 / 250 --- Tu
1500 2000I
1 •/
! .. b./
1000 1 n1500CE4ec 7920 Cal/mole
- - t10300 co/Mole
500 A1000A03 A 0.5 B
CONCENTRATION, X
a. b.
Figure 13a and 13b.
Effect of Non-ideal Solution Behavior on the Phase -Equilibriain Binary or Pseudo-Binary Systems of Non-IsomorphousG ompo~ients (Regular Solutions).
41
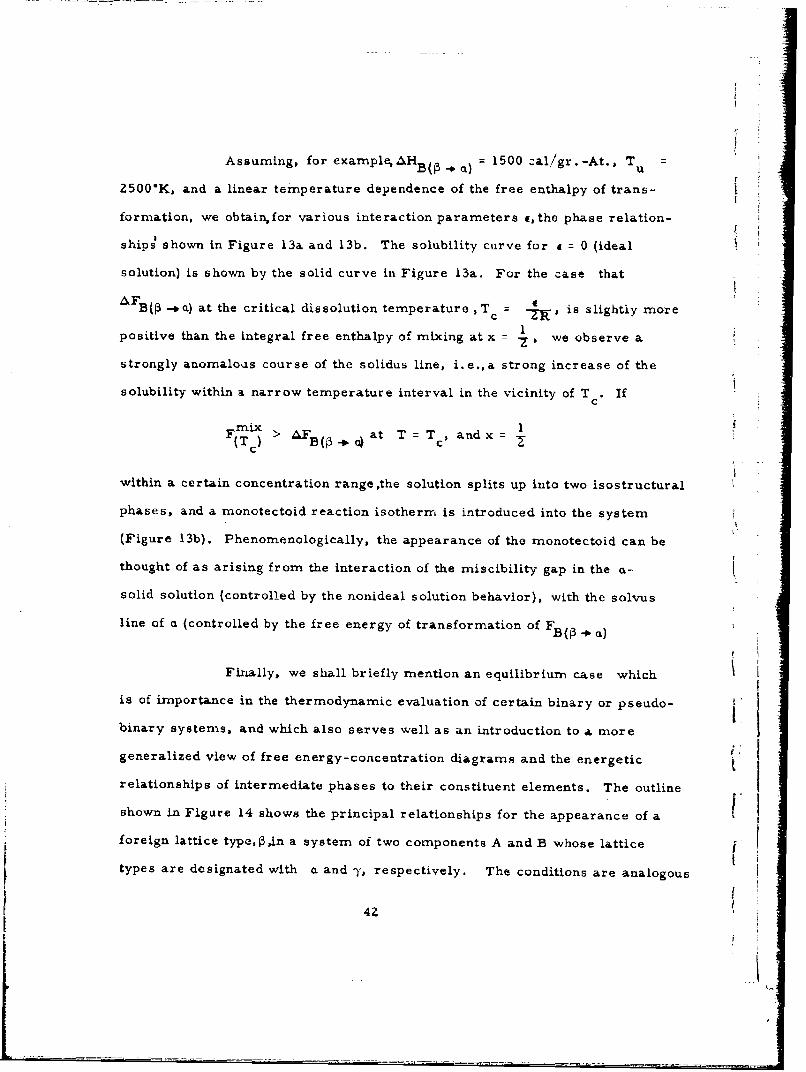
Assuming, for examPl;AHB(- = 1500 :al/gr. -At., T =
Z500"K, and a linear temperature dependence of the free enthalpy of trans-
formation, we obtainfor various interaction parameters a,the phase relation-
ship shown in Figure 13a and 13b. The solubility curve for 4 = 0 (ideal
solution) is shown by the solid curve in Figure 13a. For the case that
.B( --o a) at the critical dissolution temperature , Tc is slightly more1
positive than the integral free enthalpy of mixing at x 7Z we observe a
strongly anomalous course of the solidus line, i.e.,a strong increase of the
solubility within a narrow temperature interval in the vicinity of T . Ifc
mix IF > AF at T= T, andx=(TC) B(P3c -1c0
within a certain concentration range,the solution splits up into two isostructural
phases, and a monotectoid reaction isotherm is introduced into the system
(Figure 13b). Phenomenologically, the appearance of the nonotectoid can be
thought of as arising from the interaction of the miscibility gap in the a-
solid solution (controlled by the nonideal solution behavior), with the solvus
line of a (controlled by the free energy of transformation of F
B(P -* )
Finally, we shall briefly mention an equilibrium case which
is of importance in the thermodynamic evaluation of certain binary or pseudo-
binary systems, and which also serves well as an introduction to a more
generalized view of free energy-concentration diagrams and the energetic
relationships of intermediate phases to their constituent elements. The outline
shown in Figure 14 shows the principal relationships for the appearance of a
foreign lattice type,Pin a system of two components A and B whose lattice
types are designated with a and -y, respectively. The conditions are analogous
4Z

to those for the appearance of eutectic malt if we replace L (liquid) for
f3. The conditions for the non-variant (p = const) equilibrium, designating
the stability limit of 13, can easily be dex ived from the condition that the V
a( --)
11I
FA(.)Fii
-x-i X1
B 34
Figure 14. Principal Relationships for the Stabilization of aForeign Lattice Typepfin a Binary or Pseudo-BinarySystem.
Solidus Lines: Free Energy Variations Within the HomogeneousRanges.
XI, XII and XIH,XIV: Phase Boundaries of the Solutions a,, and y.
chemical potentials of the components A and B must be equal in all three
phases, i.e.,
~43

A(.) - (3-A(y)
7B (a) 7B(P) 'A(,y)
Th,. -g tour equations are of the type
€i (XOxPA x T) (i -Y.4)
containing as constants the free enthalpies of transformation AFA(a- P)'
AFA( - Y), AFB(, _ a), and F .From these equations To, the temperature
of the reaction isotherm, as well as the equilibrium concentrations of the three
coexisting phases, can be evaluated. At temperatures above or below the reac-
tion isoiherrn, the two-phase equilibria a + P, P +-y, and a + y, are evaluated
separately in the previously described manner.
Reviewing our findings and discussions in the previous sections,
we note that in a number of in;tances hypothetical, that is, to say, in the t
boundary systems unstablephases enter the calculations as quantities neces-
sary for the interpretation of the phase relationships in the combined systems.
A somewhat closer examination of the conditions reveals that as a minimum
requirement for the calculations, the stabilities of all binary la.ttice types corn-
bined have to be known.
Thus, if for example the stable lattice types of the combined
binary system A-C and B-C are differentiated by a, ,y,6, and q, of which,
say, a ,Y, and g occur in A-C, and a, P, and 6 in B-C, it is required that for
the system A-C the theimodynamic stability of the hypothetical phases P and
6 be known. Similarly, the stability of the phases y and e in the edge systemA
44

I
B-C have to be defined in order to be able to carry out principal predictions
regarding the phase relationships likely to be found in ternary system A-B-C.
-These calculations) however, would still involve certain limitations, for they
interpret the ternary phase-relationships only in terms of the five pregiven
lattice types a. P. 7,6, and a . For greater assurance of the calculated
data, the (concentration-dependent) sL-.bi-..ty of all lattice types, which coa-
ceivably may become stabilized and hence may play a role in the higher order
systems, must be computed and compared with the stability of the other phase
solutions. This requirement ultimately leads to the necessity of establish-
ing more generalized, but especially more complete, free energy concentra-
tion diagrams (Figure 15), which, upon extending the relationships to include
the component phases, would allow us to separate base- and concentration-
dependent terms for each lattice type considered.
It is obvious, that it is principally impossible to determine
*thern-odynamic quantities for hypothetical phases by calorimetric means;iI
from the conventional AF-x diagram, therefore, only lower limits for the
stability of hypothetical phases can be derived. On the other hand, by revers-
ing the procedure, i. e.,by evaluating experimentally established phase relation-
ships (which are not necessarily restricted to solid-solid equilibria, but also
may include solid-gas or solid-liquid phase equilibrium studies) with regard
to the stabilities of the phases participating at the equilibria, we are able to
extract stability data for hypothetical phases Thus, by investigating a
sufficiently large number of suitable sets of component combinations, we have,
at least in principle, the means available to ultimately provide a reasonably
complete mapping of the thermodynamic characteristics of all crystal types
which are of relevance for the particular group of systems.
( 45
* 2-

t
IK,'
AFA4) \ \ //.' .,,hFSJ~
\ \ \ /I - / ,AFA(O..8) " ., t ,F
... \ \ , / I - /"
! "' - "" "-- - / ,
"" // --" S-
'f"-"3 '" I.
N,
a a-R
"" t - /
I P... S
* N I
Fue --- )r... Free Energy of nformation - the Stabl
ige15 Geeralize Free Energy of Transfornation of t e Stable
Lattice (cy) of A into a lattice type j.(j= ai,,,y...w) [ ,FA(o. =c) =0]
Free Energy of Transfornation of the Stablea- i) ... Lattice (y) of B into a Lattice Type j,.'
(j =0,., ,y...w) [.FB(P_ 3) =0]
46

D. COMPUTER APPROACHES
* In the foregoing thermodynamic approaches for the calculation
of phase equilibria, we had to preassume certain properties in order to
sufficiently sxnplify the arithmetic tu allow the equations to be solved manually.
We had further restricted our discussion to cases# where two related elements
A and B show a similar behavior towards the third component C.
A relative disadvantage of the simplified method lies in the
fact that it does not allow a predicdkn of the course of the boundaries of the
!- one-phase ranges. While this shortcoming may be negligible for systems
involving quasi-line compounds, in combinations involving phases with wide,
but especially markedly different homogeneous ranges in the binaries, the free
energy variations due to changes in the overall stoichiometry of the phases
. (contents in C dependent on the A-B exchange) have to be taken into considera-
tion in order to obtain results which more closely describe the actual behavior.
Geometrically, the general solution of the conditional equa-
tions for a two-phase equilibrium in a ternary system represents the manifold
of the tangent points of all double tangent planes to the free energy surfaces in
the concentration-temperature space. The solutions are, therefore, of the
form
! (x,' y. z', T) 0
r ,2 (x". y". z". T) = 0
The boundaries of the one-phase regions at a given temperature (p = const)
*-re *he Lat ectin cuirye_ h -tween the surface iven by the solutions
47
{
£_-

S(xib Yi z TO), and the planes resulting from the concentration relation- t
,ship x + Y + z 1.
For a three-phase equilibrium, the general solutions repre-
sent the tangent points of all triple tangent planes to the free energy surfaces L
of the three phases. The multiplicity of solutions is oo0. Hence, the solu-
tions for the equilibrium concentrations of each individual phase is of the
form (p const)
(xv Yis Zi T) =0
4I(xis Yis zis T) 0 i
(x i + Yi + i =)
With T const (temperature section), the concentrations are fixed and
correspond to definite triples (x i , Yi, zi)"
For the numerical evaluation of the unrestricted problem, the
general conditional equations derived from the minimum conditions and the
existing constraints after the method by Lagrange are only of limited use;
the arithmetic in obtaining the equations in a form suitable for programming
is quite involved and circuitous, and convergence problems are difficult to elimi-
nate. Similar difficulties are encountered WAhen making use of the well-known
thermodynamic relationship that for the equilibrium state, the thermodynamic
potentials of each component must be the same in all coexisting phases. The
most direct approach for a numerical evaluation of the unrestricted problem
with the aid of a computer, consists in using the original minimum requirement
for the free energy, together with the existing boundary conditions.
4848
--- ---

I
Tho mathematical problem can be stated as follows: Given
in a function, , which Is composed of a linear combination of a series of
functions i
0 T..i~i (I i 4)E iv -_
The themselvesare functions of concentration variables xi,, Yi zi, as well as
p and T; the following additional constraints exist:
1;v i = 1
~vixi : X
2;viyi = Y
Zv.. ZI'
We easily identify < as the total free energy of the heterogeneous mixture of
*-the i phases, 4i as the integral free energy of the phases I, vi as the mass
fractions, x i, Yi, z, as the mole fractions of the components in the phases i,
p and T as pressure and temperature, and X, Y, Z as the gross composition
of the phase mixture.
We are interested in cases where p - const. (1 atm) and T
assumes a series of discrete, bat otherwise constant,values for a particular
set of computations (temperature sections). According to the phase rule, and
disregarding the occurrence of four-phase reaction isotherms at specific tem-
peratu:es, the values of I are restricted to I -5 i - 3, i.e., the number of co-
r existing phases are restricted to a maximum number of three. Thus, the
problem reduces to a determination of the of the coordinates x, y. z! for
4irI
49
_
Ir.
i1"1

for the maximumn of € for a series of prechosen values X, Y, Z; and Oz 6 ....
being pragiven functions.
Actual calculations are performed in a manner that the approxi-
mate phase relationships in the system are first computed using the simplified jtechnique previously described. This helps to limit the pregiven scanning
range,x iby, 'zi.for a given set of gross-compositions (XYZ) in the calculations.
After choosing a series of gross-concentration points (XYZ) from a %.wo-phase
range, the total free energy is computed for a series of combinations .x,,y 1 , ] -.
and x2, y2, z 2, with the density of the concentration points within the pre-
determined concentration area selected to be in accord with the
desired accuracy (grit spacing usually . 5 atomic percent). The stable corn-
binations (xly'z,) and x* yz*) are those for which it assumes the lowest value. .
After the tie line distribution in all possible two -phase ranges I
has been computed, the three-phase equilibria are considered as the next step.
This calculation is simplified by the fact that the compositions of two vertices 1I
from the goo manifold of "compatible" three-phase combinations are already
known from the calculations of the corresponding two-phase equilibria, i.e., I
the computer scan is limited to obtain the "compatible" composition of the -
third vertex. The final step in the evaluation, which sorts out the correct set
of composition triple from the ool manifold of solutions, consists of comparing
the free energies of a series of three-phase mixtures with corresponding one-
or two-phase mixtures, the stable combination being that one having the lower
value. This calculation is simplified by the fact that the composition of two
vertices are already known from the corresponding two-phase equilibrium, J
i. tnii scan---- limite Only to one phas., from which the composi-
tion of the third vertex is then obtained.
50 )

A few more words have to be said about the nature of the
functions the integral free energies of the homogeneous ranges in the
ternary ranges.
The rture and type of function to be chosen will depend on
the type of solid solution formed in the system, and hence are structure-
dependent.
The free energy of mixing of substitutional types of solid solu-
tions, where all three elements have to be regarded as equivalent canfor
most purposes, be adequately approximated by the vanLaar expression,
IMIjmixF =zj " ixixj + RT ijx i in x
where the e are the corresponding interaction parameters of the pairs i -jI3
and the x i denote the concentrations of the components i.
For the thermodynamic description of the phases, vacancies
are counted -- depending on the type of lattice site involved- as equivalent
to either substitutional or interstitial elements.
Ternary interstitial types of solid solutions generally can be
classified into two groups. These, with a common interstitial element C,
51

which typically would involve systems of two metals with 4n interstitial
element, and, on the other hand, solutions, where the two interstitial ele-
ments are didtributed within the host lattice of a carrier element A. Typical
cases would be systems consisting of one refractory transition metal with
two interstitial elements such as Ti-C-N, Zr-C-N, Zr-O-N, etc.
A characteristic of all latter types of compounds is the fact
that practically no atom exchanges between carrier and interstitia- sublattice
have to be taken into consideration. Thus, for example, a solution of two
metal monocarbides (AB)C at a certain carbon defect (v < 1) can adequately
be defined as a binary solution of (A B ), having free energies of FACxA B v
and FEC at the corresponding boundary compositions. ThusV
1 =xA FAC +x FBG + Gi(xAxB)V V
(x% kxB = )
To obtain the values per gram atom, the above expression
would have to be divided by I + v. The functions F and F dscribe theACV BCVfree energy variation of the phases AC and BC v across their homogeneous
fields in the respective binaries and are structure-dependent relations. These
functions can be obtained either from experimental data, or by fitting certain
pieces of experimental information such as phase boundaries, known free
energy at a given composition, heat capacity data for the calculation of the
temperature dependence, etc. to established thermodynamic models. Using
the Schottky-Wagner theory of non-stoichiometric alloy phases (4),related cal-
culations on refIractory interstitial types of compounds have especially been
5z
______

performed In recent yee- by L. Kaufmann and co-workers(5), achieving
remarkable agreement between calculated and observed properties. For phases
where the disordering parameters are beyond the permissible range of the
simplified Schottky-Wagner theory, the thermodynamic behavior of specific
16-9)crystal phases can be approximated by other suitable approaches'
In conclusion to this section, it may only be mentioned, that computer
calculations, using the methods described above, have been performed with
considerable success on model systems and are presently being applied to
the thermodynamic description of the high temperature phase relationships in
ternary metal-carbon systems. A detailed review of the results, however,
is beyond the scope of this repcrt and reference may be made to the series of
related reports, issued under a current Air Force program( 1 0 ) .
IV. APPLICATION TO TERNARY METAL CARBON SYSTEMS
We shall demonstrate the thermodynamic approaches exclusively on
ernary metal-carbon systems since the extensive experimental material
available for this system class allows a close comparison between theory and
experiment. We shall treat in fairly great detail the phase diagram tantalum-
tung sten -carbon. The phase relationships in this system are faizly compli-
cated, and therefore this ternary well serves to demonstrate the applicability5
of the thermodynamic approach.
In the sections following the discussion of the Ta-W-C system, we shall
s-immarize the thermodynamic findings In other selected metal-carbon systems
and ,lso demonstrate the back-calculation of thermodynamic q-tantities from
experimental phase equilibrium data. A short review of the general features
53
I

i
of the phase-relationships of transition metal-silicon-boron-carbon systems
will conclude our excursion into the field of ternary alloys. Ii
In the final chapter then, we shall try to relate phase diagram
and thermodynamic information to practical application problems, and
especially stress alloy compatibility considerations, and the significance of
partition equilibria for diffusion phenomena in multi-component alloys.
A. THE TANTALUM-TUNGSTEN-CARBON SYSTEM( 1 -1-)
In the binary system tantalum-carbon (Figure 16),two inter-
mediate phases, a subcarbide TaC with hexagonal close-packed arrangement
39835 le
4000- 4,7+0. 1
120 + Q5II
S300 4°
o2843 .oo 7' %
,.5 +_0.5 26 +0.5sI
2O Ta B-Ta2C I!, 2180"
200C /I7I-19300 -,, .v49,.8
10ra-Ta2 C --
0 10 20 30 40 50 60 70 80
Ta - ATOMIC % CARBON -.
Figure 16. Tantalum-Carbon Phase Diagram. .(Shaded Area: Preferential Precipitation of Metastable ,)
54
__ I

of metal atoms, and a face-centered cubic monocarbide with an exteaded
range of carbon defect solid-solutions, are formed. Like the other subcarbides
of the refra ory transition metalri, the carbon sublattice in Ta C undergoes
an order-c'sorder type of transformation at elevated temperature. The metal
host lattice is not affected by this transition.
In the tungsten-carbon system (Figure 17),the arrangement of
the metal atoms in the subcarbide is the same as for TaGZC although the higher
disordering temperature suggests differences in the degree of order in which
the N carbon atoms are distributed among the ZN lattice sites available in the
structure.
6-3600
3600 100' -3423t1 I.I
3400\ -13200 - -
2747 t 80 L*C
\ 393000 L
W 2776±5" 2735-6"
;2800 - 2746127 * W 5L 1 1
/1 / C (tub) 50E20 <0.5 /25.6 _
260
SI I I I I1E 20 30 40 50 60- Atomic % Corbon
Figure 17. Tungsten-Carbon Phase Diagram.
55

A cubic phase,analogous to TaGoccurs as a high temperature
phase at considerable substoichiometric compositions. In addition to W 2
and WC1 x(B1), a monocarbide with a simple hexagonal structure and ordered
distribution of carbon atoms is formed in the equiatomic concentration region.
The body-centered cubic metals form a continuous series of
solid solutions ( 1 3 ' 14, 15)
The phase relationships in the ternary alloys system are shown
in consolidated form in the ternary constitution diagram shown in Figure 18,
while the intcrrelation of binary and ternary isothermal reactions are presented
in the familiar Scheil-Schultz reaction diagram (Figure 19). For our purposes,
however, it is much easier to work with the temperature sections (Figure ZOa
through Z0n).
In examining the phase relationships, we note that the tungsten-
exchange in the cubic monocarbide gradually increases with increasing tem-
peratures, until at 2530*G, the temperature at which the cubic tungsten carbide
becomes stable in the binary, a complete solid solution is formed(Figure 20h).
An interesting behavior is exhibited in the metal-rich region. At lower tern-
peratures (<2450°C), the expected solid solution between TaC and W 2 is
interrupted by a two-phase equilibrium Bl+metal, i.e., the solid solutions of
Ta C and W2 C are both terminated by a three-phase equilibrium in the ternary
pha.se field. Toward.3 higher temperatures, the ternary homogeneous ranges
of the subcarbides increase and the two-phase range monocarbide+ metal
solution,gradually becomes narrower. Finally, at Z450"C, both three-phase
equilibria merge into a single (critical) tie line. Ab3ve this temperature, the
concentration space is divided into two regions where either metal + subcarbide,
or subcarbide + monocarbide are in coexistence. The latter equilibria persist
up to the liquidus range.
56

I'
"/C
3000
2500 <j
2
.z. - - - A A
CL
A~50 ,/ II -50
-w
Ul
I-0
J igr 1. o~tttin igrmTantlm-ug20'C~bn
I T7I4
so 0

Ta -C To- W- C * W-C aW
I..C L-8L- I- . L.C
L I , C86 0 * I L6 -?4 5 3 0 1 w70F
_L , 2735.j
IL
21! 2450
Figuire 19. Scheil-Schultz Reaction Diagram for the System
Tantalum -Tung sten-C arbon.
Legend of Symbols:
a ... Body-Centered Cubic Metal Phase
P... HexagonalWC Phase
-y a-Ta 2 C
-y ,y..1-Ta C and a-W C Solid Solutions
f'' for T > 2450"C) a
6 . Fac~e-Centered Cubic (BI) Monocarbide Phase
... P-W 2 C Phase
C .. Graphite
58

TO-W-C
CP
lb-w.Cc
Fig. 0a
To
59c
Ta-w-I17500C

TO-W-C2000*C
ToToe
'i/I TO-W-Cill 21901C
A-ToC a -Wz
Taa
60

To-W-
*
Fig. Z 0o
C
I
2 aOb- -C 2
Fig. 201!
I w
61I

ToC
To-C
b--I
To w 1
To-W-C I
Z68o a -~2
To . a-C.
62

BC
I-I2K Ts-W-
'I Fig. zoi
To w
- / To-W-C
I-2760*
Fig. 20j
To N
63

C
Fig. 20k
To -W-C
L-Y' Fig. 20 1
Tow
64

3200*C
TQC
Fig.2 20
FgrsZaToug Jw
Exermeta Tmpraur Scio fr heTaW- Sstm
To 65-
35006C

For the thermodynamic evaluatlon of the phase equilibria. Hthe following assumptions and compromises are made:
1. The ternary homogeneity ranges originate at the
binary phases and are drawn as straight lines
across the ternary field.
Z. Since no calorimetric data are available, the
solution of the subcarbides is considered as
ideal in the calculations.
3. The metal solution behaves ideally.
4. The carbon-rich boundary of the B I-phase can
be described as a regular solution, having an
interaction parameter of & = + 6500 cal/gr. -At.
metal. The metal-rich boundary is described as
ideal solution. These data were derived from
the temperature dependence of the Bl-ranges in
partial systems MeC-WC( 1 1 )
The following thermodynamic data, which are based on values
compiled from the literature as well as on available phase diagram informa-
(11,12,16,17,18)tion , will be used in the calculations (Table 1). We further f
write down the free enthalpy differences, which will be useful for the calcula-
tions (Table Z and Table 3).
The free energy gradient - concentration curves for the solid
solutions formed between the various phases are
a. Metal solution
'rf (TFf(Ta W)= ST lnxW
L C w Mi T, p _W
66

Table 1. Thermodynamic Data Used in the Calculation of thePhase Equilibria in the Ta-W-C System (Values incal/gr.At. Metal)
Reaction Free Enthalpy Change jW + C -- WC (hex.) AF =-8905 + 0.47.T
w + I/z C -. WC i/z IFfwcgz= -3, 150 - o.6Z.'T
W + C -+WC (BI) AFfWC: -3745 - 0.95-T
W + 0.71.C-*WCo,7#3 AFfWC O = -730 - 1.88.T
W + 0.61.C--&GWCO6 INB &FfWC 0.61 = + 340 - Z,08. T
Ta + C -*TaC &,F.TaF C -35, 300-1.80T log T+
6.48-T
Ta+0.71C-Tao.a l) AFfTaCo.. = -26,Z00 - 1.Z.T
Ta + 0.50C-.*TaC,/, AFfTaC/ : -19,680 - 1.19.T
Table Z. Differences in the Free Enthalpies of Formation ofTantalum and Tungsten Carbides.
(Values in cal/gr.-At. Metal)
AFfTaC (hex)= -11, 080 ont.
AFfTAC" 3 - AFfWCo.43 (hex) = -14, 100
- fTaC. -AFfWc (hex)= - 16, 530-0.57. T
"fWCon - ALFfTaCOn (BI) = Z5, 500-0.68T
"fWC AFfTaC (B) = 30, 700-0.95T
AFfWC - FfTaC(WC-type) -14, 000 + 0.47 T
i

Table 3. Disproportionation and Transformation Energiesfor Tantalum and Tungsten Carbides.
(Values in cal/gr. -At. Metal)
Reaction Free Enthalpy Change
Wc(hex) _WCl(Bl) + xG (x= 0) AFzw G =5160 -1.4ZT ,
WG 1 (BI) -*(l-Zx)WG(hex)+ZxWC,/2 'F zwc (cub) = -4790+1.71. T
(0.08 < x 5 0.35)
WC 1/ 2 -w 0.70 WC.71 (B1) + 0.30 W AF2zwC 2635 - 0.71.T
TaC1/,-*0.70 TaCon =+ 0.30 Ta ".F7TaC = 1420 + 0.40-T
TaC (Bi1) -. TaC (WC -type) AFR= > 12. 000 cal.R_
b. Subcarbide Solid Solution (calculated for y z 0. 37,
0.43, and 0.50).
[aAFf(Tao W)C+ x, "
L ax, "M 'fC "f TaC + rT _XTnW T,p y Y W
c. Monocarbide (Bi) Solid Solution (Calculated for
0.F 71
Ff (Ta,W) T p-x) - o.7-L 8x'w T, -.~'~ '~ a +R "
These gradients are plotted as a function of the tungsten-exchange in Figures
Zla through Zld.
68

1. 175(11K 4. 2500'Ka. 500 . 2750K3:e. 9 31 6. r 50K
3. 5
C -
0.1 0.2 03 0. .5 0.6 07 0 a 0.6 9 .0
1Figure Zla. Subcarbide Solid S olution at (Ta, W)C. 3
69

1. 17501K 4. 3000KL. 3000, .333. M"OK I.30001
3.0'
- L U
1.5
0 C. 0.2 0.3 0.4 0.0 0.6 0. 7 0.8 0.9 1.0
XB (A, W~C,
Figure Zib. Subcarbide Solid Solution at (Ta, W)CM. 3 .
70

. 70K 4. 15000K. x 6: rno~xs. 100* B.3000*K
3. 5
I U~3.0
F..
0 0.1 0,: 0.3 0.8 05 0.5 0.7 O.s 0.0 1.0
Figure ZIc. Subcarbide Solid Solution at (Ta, W)CO.5 0
71

4,0
000IC
-i ~25 - -
2.00. 0. 1 08 . .
6A0BC
Fi0r Zl.CbcM5crieSli ouina TWC
Fgrdentsd Cubr TatlM-Tunsnarbide Solutions. Tg )(.
Lower Single Curves: Gradients for (Ta, W).
72

II
1. Equilibria In the Metal-Rich Portion of the System
In view of the anomalous behavior of the subcarbide solid
solution, our initial interest concentrates on the evaluation of the stability of
the (Ta, W) C solid solution and mechanical mixtures of metal plus monocarbideI2
solid solution. Stability conditions (8a), rewritten for the disproportionationof the subcarbicarbidGe (MeC and metal (MeGu) solid
solution according to
(w-u) MeC * (w-v) MeC + (v-u) MeCw ,
l (u -0)
becomes ('MeC = 6500)w v W-V
w w'I
2 x Ta xTaAFl-" +RT lnZ = v l-x' a) "t Ta
Ta XT
and v w-vw w
2W W-F = _ (l-x' , ) R T nzWC w ) R
x, x',x" ..... Mole fraction exchange of A or B in themetal, subcarbide, and monocarbide solidsolution.
Although, A and B, strictly speaking, are not constants, their variation is
not critical, and we assume for the average stoichiometries of the subcarbide
and the monocarbide solid solution
v = 0.43 (.-30 At.% C)I and
w= 0.71 (-,41.5 At.16 C)
7| 73
..I- -

I
With these values, we obtain for the stability condition
U.06 0.3942
Xi a XTa R(x'&FZTaC 0.606.t ( Ta) + RT In-(Ta- aQ 3Ta T
and 0.606 0.394
2',' " W -
= 0.606t (l-x' ) + RT In x', R'(X'W)
Compatible triples of x * X1 and x' are obtained from the free energyTat Tat Ta
gradient curves in Figures 21b and Zd and are used to calculate the functionR (x)Ta (Figure ZZ). Composition x' is determined by the condition that
Rx (Taat equilibrium, R (x-T.) has to assume the value -AF i.e., we obtainTa ZTaC0 .4 3 'xI a as the intersection points between the function R(XtT) and the linesR~'a) -AF F 4RI(X'Ta) = -AFZTaC0 43 ' Performing this graphical evaluation (Figure 22), we
obtain two intersection points for all temperatures below Z700"K; these indicate,
that at these temperatures medium compositions of the (Ta, W) 2C solid solution
are unstable in respect to metal + monocarbide mixtures.
In view of the reciprocity of the relations (equation 11),
it is obvious that the same result could have been achieved by plotting RI(xlt)
as a function of x1W . and intersecting these curves with the lines given in
RII(x'W) =AF ZWC 4
We have previously found (equations 10, I1, and 12),
that the functions 1A(XA) and 4B(XB)
+mix
*A(xA)= AFZAG + ZAcv v
Amix=zBG + ZBc
V V
74

I
are identical, and are a measure of the Integral free enthalpy of dispropor- Itionation of the solution (A.B)C into mixtures of (AB)C and (A,B)CW.
4000
20000
i 2000 -
1I 1000
.1750KI i
I " I I
5 20°K 25000 K 2'0O0 K 225d0K/ 1 75 0 0K
17500K! J2250*K / 1751eI 2000OK
0 0.20 0.40 0.60 0.80 1.0- WC ,1/2 - TANTALUM EXCHANGE, AT% TaCI2
Figure Z2. Ta-W-C: Graphical Determination of the Solubility
Ranges of the TazC and W2C Solid Solutions.
Since AFmix R(Ta), we obtain as the free enthalpy
of disproportlonation, 4?z(x), of the subcarbide phase into mixtures of metal
and monocarbide solid solutions according to.
75
t!

MeCO,4s -. jo 0.606 MeCo.. + 0. 394 Me
Me= (Ta, W)
A(X T 'ZTaC, .3 + R (xA)
BlxV) = AFZWCo.,, +R'l(x'w)
z~x) "-A(X'Ta) -B (x
The resulting plot of 4)(x) as a function of x' is shown in Figure 23.Ta
For the sake of clarity, we note that
4z(xI'Ta = 0 ) = 'Fzwc0.j3
Z(XTa= ) = AFZ TaCo.43
As long as 4(x) is positive, the subcarbide solid solution is stable. <'(x) 0
yields the maximum solid solutility limits at the given temperature; for
4c(x) < 0, the alloys are either two- or three-phases, i.e.,single phased sub-
carbide alloys are unstable.
For all temperatures below 2703"K, 4(x) passes the zero
line twice, and is negative between the intersection points; as a consequence,
subcarbide alloys lying within this concentration range are unstable and dis-
proportionate. Above 2700*K, *)z(x) remains positive over the entire range
of metal-exchange, i.e.,solid solution formatiou between W2G and Ta C above
2700'K is complete.
With x'Ta at 4z(x) . 0 known, the eqilibrlum compo-
* sitions of the phases coexisting with the terminal Me 2C compositions
76
_ ___ = -

!*;
at the respective temperatures can simply be read off from the correspond-
ing free energy gradient-concentration curves.
2500
1. 1750°K 4. 25000K2. 2000°K 5. 2'70
0K
2000 3. 2250°K 6. 30000 K
1500
500
-6-
E -500
-1000
0 20 40 o 0
-TANTALUM EXCHANGE, AT%
Figure Z3. Integral Free Enthalpy of Disproportlonation of the(Ta, W)G Q Phase into Mixtures of Metal and MonocarbideSolid Soueion.
~ Z(X) > 0: Subcarbide Solution Stable.
Pz(x) < 0; Subcarbide Solution Unstable in Respectto Mixtures of Metal and MonocarbideSolutions.
771______"_

We find (Table 4):
Table 4. Equilibrium Compositions of the Phases for the Three-Phase Equillbria: Mono carbide + Metal + Subcarbide
Teprtre aRc Three-Phase "-W-RTrTbxee-Pha-seOI Equilibrium Equilibrium
x ]IIII
_____ W W X W x,. XW
1750 0.815 0.07 0.005 0.995 0.79 0.165
zor 0.825 0.12Z 0.010 0.992 0.75 0.195
22.., 0.83 0.17 0.025 0.985 0.68 0.19
2500 0.85 0.25 0.045 0.97 0.58 0.17
700 10.91 0.38 0.10 0.91 0.38 0.10
The compositions of the two three-phase equilibria coincide at 2700K and
represent the critical tie line for the quasibinary eutectoid reaction
Me 2 G(X') -* Me(x ) + Me(xl')
In contrast to the true binary reaction, the ternary reaction is of the second
C
order, and the composition x x I , and x~'in terms of the above equation
of reaction are defined only for the critical temperature; for T < Ta two
three-phase equilibria, which are separated by a two-phase field, are formed,
and the equilibrium concentrationis are temperature -dependent (Figure 24).
With the thrue-phase equilibrium in the metal-
rich regi.)n of the Ta-W-C system fixed, the basic phase distribution in this
concentration area of the system is defined. The end-points of the tie lines
78
i
zo .8z 0. l O.OlO .99 0.7 0.95

for any gien gross compositi nihntefvto-asfelscnb
read off directly from the gradient concentration curves (Figures Zia through
21 d).
3000
Pk; 38%, 27000 K
S2500 Homog.
HP
~2000-
0 0.2 0.4 0.6 0.8 1.0-TUNGSTEN EXCHANGE, A E~ -
I Figure 24. Calculated Vertical Section (Isopleth) AcrossTaGI,. - WC1. . 5
Note origination of two three-phase equilibria at thecritical Point PK'
79r

2. TheThree-Phase Equilibrium MeG(Bl) +MeC(hex)
+ MeC (hex)
The next three-phase equilibrium to be considered
concerns the disproportionation of the cubic monocarbids phase into subcarbide
and tungsten monocarbide solutions. The solution will give us the homogeneity
range of the carbide solid solution as a function of temperature, and define
the terminal compositions of the restraining three-phase field at the sub-
carbide and the tungsten monocarbide solid solution.
The overall reaction can be written as
MeG (Bi) -- a.MeC (hex) + b MeC 1/2 .. FZMeC(BI )
Since the stoichiometry of the cubic monocarbid2, and hence a and b varies with
the metal exchange, we first have to determine by an iteration process the
tungsten exchange in the monocarbide solution, in order to pick the right param-
eters a and b, and then determine from the (concentration-dependent) binaryf
free enthalpies of disproportionation of the cubic monocarbide an average
expression, which accounts for this concentration variation. Performing
this calculation, we obtain as the average free enthalpy of disproportionation
for the cubic tungsten carbide
AF ZWC1,~x = -4790 + 1.71.T cal/gr.-At. Tungsten
it is noted,-that the value must be in accordance with the binary stability limit of
this phase at Z530oC. The temperature,(T c), at which the cubic tungsten
carbide becomes stable in the binary system is characterized by
80
I '
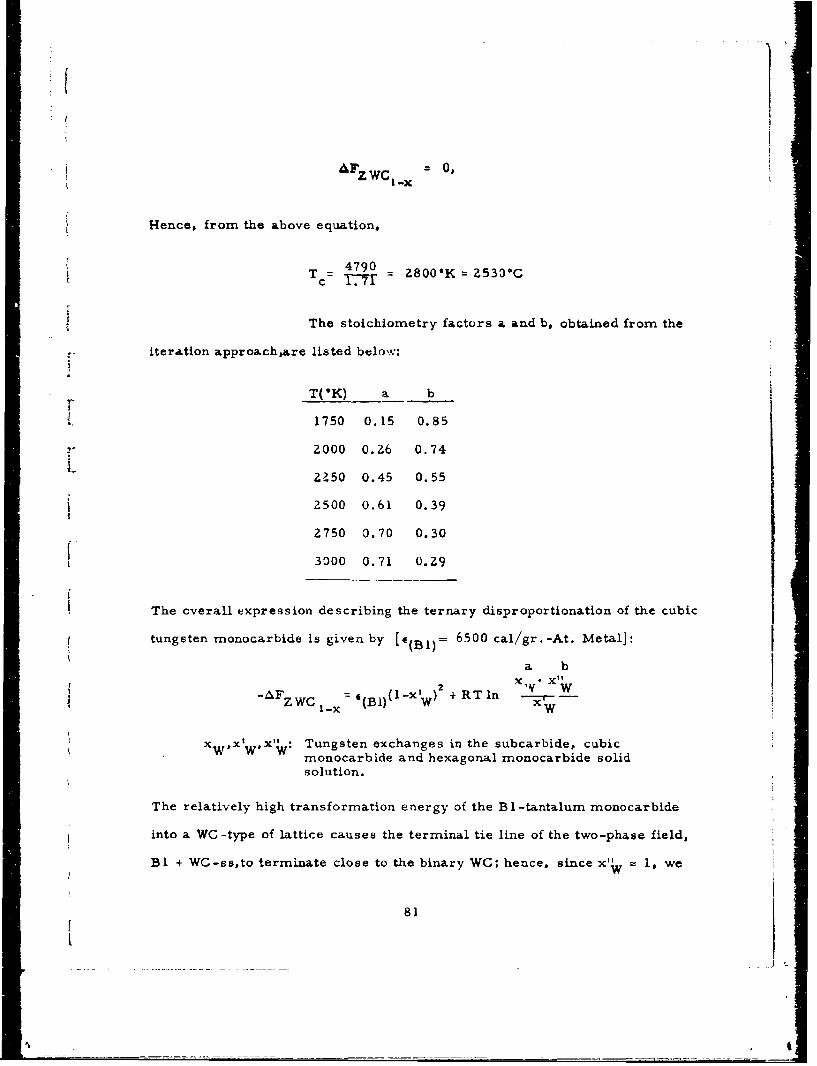
I-X
Hence, from the above equation,
T=- 4790 2800'K Z533*Cc?7
The stoichiometry factors a and b, obtained from the
iteration approachare listed below:~
T('K) a b
1750 0.15 0.85
2000 0.26 0.74
ZZ50 0.45 0.55
2500 0.61 0.39
2750 0.70 0.30
3300 0.71 0.2Z9
The overall expression describing the ternary disproportionation of the cubic
tungsten monocarbide is given by [e(B1)= 6500 cal/gr. -At. Metal]:
a b
-AF(1-x' + +RTln - -ZWC (Bl) W 2 X
XWXW x' V: Tungsten exchanges in the subcarbide, cubicmonocarbide and hexagonal monocarbide solidsolution.
The relatively high transformation energy of the B 1-tantalum monocarbide
into a WC -type of lattice causes the terminal tie line of the two-phase field,
B I + WC-ss,to terminate close to the binary WC; hence, since x'2, 1.w
81

neglect the corresponding solution term, obtaining the simplified equation
a r
w (Bl) (lW 2 + RT in -r- = R'(x)IzW -x l Wxw
From the gradient curves (Figures Zlc and 25), we obtain the following corn-
patible concentrations x for series of chosen values for x' (Table 5).
Table 5. Partition Equilibrium Subcarbi.de + Monocarbide (B 1):Compatible Combinations of x and xW ,
xIw x w
1750°K 2000°K ZZ50°K 2500°K 2750°K
0.05 0.84 0.73 0.635 0.535 0.475
0.10 0.91 0.84 0.76 0.695 0.625
0.20 0.93 0.895 0.84 0.80 0.745
0.30 0.945 0.91 0.88 0.84 0.80
0.40 0.95 0.9Z5 0.895 0.87 0.835
0.50 0.955 0.93 0.905 0.895 0.85
0.60 0.955 0.935 0.915 0.90 0.865 a
0.70 0.96 0.94 0. 9Z5 0.915 0.890 ~
0.80 0.965 0.95 0.94 0.93 0.915
0.90 0.98 0.97 0.965 0.96 0.95
The function RI(x),computed with the values of x w and x listed in Table 5,
are illustrated in Figure Z6. The equilibrium concentration x'w for the
various temperatures Ti are the abscissa corresponding to the functional
values R"(x) = -AFzwc (Ti).
82

4.0 I
1. I 10 4. I005X
3.0
0 . C
I., (A. _)C
FiurZ5FreEtapofFrain-ocnrtoGrdes
fo h ui ooabd ouin(aWC a
fiur Co p sii n Co e to (ASom tionChonetra tion56 Graient -At
Lower Single Curve: Gradient Curve for (Ta, W).
83

More illustrative for the physical problem than ths
function RI(x) are the expressions describing the integral free energies of
disproportionation, which, for the present case, are a measure of the
stability of the cubic solution against decomposition into the hexagonal
5000-
123 4 56
4000
1. 17500 K2. 20000 K3. 22500 K
3000 4. 25000 K5. 2750 0 K6. 30000 K
bm2000 m
1000.
0 20 40 60 80 100
(TaC) - TUNGSTEN EXCHANGE IN BI, AT % (WC 0 61) j
Figure 26. Graphical Determination of the Base Point of theThree-Phase Equilibrium WC + (Ta,W) C 1 (B1) + W 2Cat the Cubic Monocarbide Solution.
Note: The concentrations correspond to the maximumtungsten exchange in the cubic phase at thecorre sponding temperature.
tungsten monocarbide and tungsten-rich subcarbide solid solution. As out-
lined in preceding sections, this function is given by
84

I
f (x'W) = aFZWC + R'(x)
and is plotted, with x' W as independent variable, in Figure 27.
4000
3000
W 2000
S1000
0
1750OK 20000°2KO 5 d
-1000,
0 20 40 60 80 100
TUNGSTEN EXCHANGE IN B1, A'I%
Figure Z7. Integral Free Enthalpy of Disproportionation of theCubic Monocarbide Solid Solution [ (Ta, W)C I -] intoSubcarbide [(Ta, W)C 1/ 2 ] and Tungsten Monocarbide.
For
(x'w ) > 0
the monocarbide solid solution is stable, whereas for
401W',) > 0
85

it becomes unstable in respect to phase mixtures consisting either of
MeC + WC, or MeG _x + Me C + WC. The maximum tungsten exchange in
the monocarbide solid solutions is given by (x'w) = 0, and hence is obtained
from the intersection of 4(x'w) with the abscissa 4)(x') = 0.
with the o 'dinate, i.e. the value of the function p(X'w) at x' W = 0, corresponds
to the free enthalpy of transformation of the cubic tantalum monocarbide into
a phase exhibiting the structural characteristics of WC; according to the data
presented in Table (1), this intersection point would occur at c'(x'w) 12,000 cal.
A simple hexagonal tantalum monocarbide is therefore of comparatively low
stability.
The functional value of 4(x'w) at x' W = 1 represents
the free enthalpy of disproportionation of the binary cubic tungsten carbide into
hexagonal WC and W.G, and is negative (WC1 unstable) at temperatures
below 2800'K. Above this temperature, the function .p(x'w) does not cross
the abscissa at any composition i.e., the cubic solid solution includes the
tungsten-carbon binary.
The theoretical findings, as shown for the maximum
tungsten exchange in the cubic solid solution, are in excellent agreement
with the experimental findings (Figure 28).
86
__ I

II
3000 I0 CalculatedA Experimental
2800
0
2400
V 2000 P
I-I1600
0 0.2 0.4 0.6 0.8 1.0
- TUNGSTEN EXCHANGE, AT%?b--*
Figure 28. Temperature Dependence of the Maximum TungstenExchange in Tantalum Monocarbide.
3. The Three-Phase Equilibrium WC+MeC 1 _ (Bl) + C
The last equilibrium to be considered concerns the
equilibrium existing between tungsten monocarbide, cubic monocarbide solid
solution, and graphite; the overall reaction can be represented by
WC(hex) - WC (cub) + y'C ..... AF
87

Since this equilibrium involves the carbon-richest compositions of the cubic
monocarbide phase, the value of y wiil be small. Furthermore, the metal
solubilities in graphite are negigible, so that we may consider it as pure
graphite in our calculations.
S ability condition (8), rewritten for the present case
becomes (W oo):
2 2RT n-AF ZW C = f (BlI W) 4WC (1-xI w + RT In xxW
xW. . . tungsten exchange in the cubic solution
x W .. . tungsten exchange in the hexagonal WC
Since y in WCI x is small, AFZW C corresponds, in a close approximation,
to the free enthalpy of transformation of the hexagcnal (stable modification
of WC) into a face-centered cubic (BI) modification of WC, for whose stability
we have found (Table 2)
AFZ ArC - 5160 - 1.4Z-T cal/gr. -At. Tungsten.
Compatible couples of x andx could be obtained
from the gradient-concentration curves for the cubic and the hexagonal solid
solution; however, since we know (Equation 12 and 14) that the tantalum
excharige in the hexagonal WC will be governed mainiy by the transformation
energy of TaG (cub --P.hex.); the latter is a fairly large positive quantity
( + 12, 000 cal/gr.-At. Ta) as compared to AFzw C , we expect the relative
88
I

exchange of Ta in WC to be very small. The calculation yields the follow-
ing solubilities as a function of temperature (Table 6). We, therefore, dis-
regard the solution term for the tungsten monocarblde phase, and obtain
-AFZW C =(Bl) (1 + RT Inx W R" (x)
Table 6. Maximum Tantalun- Exchange in WC (Calculated)
Temperature Tantalum cx'lhange in WC.
K Atomic Percent
1750 3.5
2000 4.6
ZZ50 5.9
Z500 6.6
2750 6. ?
L 3000 5.0
The resulting plot of R"(x) versus the tungsten exchange is shown in FigureZ9.
The vertex of +hn. three-phase equilibrium MeC x(Bl) + MeC(hex) + C at the
cubic solid solution for various temperatures. Tifis determined, as described
before, by seeking the intersection points with the lines R"(x) = -AFzwC(Ti).
The integral function
Ixw) AFzw C I R" (x).
which compares the thermodynamic stability of cubic mcnocarbide solid solu-
tions with that of mechanical mixtures consist'.ig of WC and graphite,is pre-
sented in Figure 30.
89

In analogy to the considerations for the previously
treated equilibria, the cubic solution is stable as long as
P(X) > 0,
and disproportionate s into tungsten mon-carbide and graphite for he case
that Odx) < 0. The vertex of the three-phase equilibrium is determined by
40(X) 0.
4
3
_ _ _ i2t
0 1
1700 K 20000 K 2250' 250CPK 275&fK 30000 Kf
I II II - II -
0 20 40 60 80 100
-TUNGSTEN EXCHANGE, AT[%5-
Figure 29. Graphical Determination of the Base Point of theThree-Phase Equilibrium Won-(TasW)Ct (Bl) -C atthe B 1 -Solid Solution.
90
L
___ __ _____________

Comparing the base points of the three-phase equiibria
Me 1 (cub) + MeG (hex) + C (xW~, and Me2 C (hex) + MeC, (hexc) + MeCl1 (cuib)I -I
* (XW) at ths cubic aolid solution, we find - as it should be-
X W(uI) > XW(I)
4
17CK2DWK dK z500*K 275CPK 3O*
2
L~J
-6
-B
0 20 40 60 80 100I. ,. - TUNGSTEN EXCHANGE IN B1, A1-.
Figure 30. Integral Free Enthalpy of Disproportionation ofTungsten Moaocarbide into the Cubic (Ta, W)CI XCarbide Solutions and Graphite.
91

i[[
These results take account of the previously reported discrepancies of the
tungsten carbide solubility in tantalum monocarbide 9 showing it, within 1.
certain limits, to be dependent upon the carbon concentration of the alloys.
Hence, one would suspect that in view of the existing carbon defect in the
cubic monocarbide solution, solubility data collected on alloys along the
stoichiometric line TaC-WC actually refer to the concentrations of the ternary
equilibrium involving graphite. This is evidenced by a comparison of previous
literature data (19) with the present findings and calculations (Figure 31).
t
S2500
2000
4 -A. E. Kovalskii, et. al., 1946
SCalculated
1500 ,1-I , i I I i i
0 20 40 60 80 100
TaC - TUNGSTEN EXCHANGE, ATLo-
Figure 31. Three-Phase Equilibrium (TaW)C1 x(B1) + WC+ C:Temperature Dependence of the Composition of theBase Point at the Cubic Solid Solution.
9zI

The phase diagram data calculated in the previous
sections can now be used to assemble sections of the phase diagram for the
chosen temperatures. First, the ternary phase fieldeat a given temperature,
is subdivided by the known compositions of the vertices for the three-phase
equilibria. The con'entrations of the (arbitrarily chosen number) of tie lines
in the resulting two-phase fields are then determined from the free energy-
gradient curves and incorporated into the diagrams (Figures 3Za. through 3Zf.
C
0
{7f2
//CTaa
Ta 2CW C
Ta -ATOMIC f TUNOTEN -- W
Figure 3Za. 17500C
Although the approximation of the boundaries of the
one-phase ranges by straight lines is admittedly crude, the calculation was
able to reproduce the actual conditions remarkably well, and also yielded
93
II "

Ii
the correct temperaxre dependence of the equilibria. In fact, the calculated [tie line distributions in the various two-phase ranges probably supersede the
Fexperimental data in accuracy . The reason for this has to be sought in the
C[
CF
-Y-
/ i .
/
Ta - ATOMIC ' TUNGSTEN !
Figure 3Zb. 2000'K
fact that while the entire set of tie line compositions,calculated for a given
temperature, are functionally interrelated, each individual experimental tie
line independently carries the average experimental error. The scatter of
the individual experimental equilibrium compositions is therefore expected to
be more pronounced.
94

changesDue to the lack of thermochemnical data, the phase
equilibrium cagsintroduced by the a-P3-Me C order-disorder reactions
were not specifically regarded in the calculations. However, since their
overall effect upon the phase behavior is only secondary, thlis neglection does
not affect the general validity of the thermodynamic treatment.
C
Fk
IiiIS|lJ
JT|
a
Ta-AMNC '.TUNGOTE14 W
Figare 32c. ~z50*K.
The results of the preceding phase equilibrium
calculations would be capable of further improvement using the present
solution as the zero approximation in an iterative approach, or by refining
the compositions as indicated in a previous section - by computational
95
! no afectthegenralvaldit of he herodyami tratmnt.I

C PI
.17/'ii
r i
Ta -ATOMIC TUNGSTEN W
Figure 3Zd. 25000K.
C I
-C .'-
Ta WC
v Ta/
y w 2C
Ta - ATOMIC '~TUNGSTEN -~w
Fi.gure 32e . 2700 0 K.
96

Ta'1 - TM C C hGTN-
T&C
" a.WCI- X
Ta2C WIC
Ta ATOMC %, TUNGSTEN
Figure 32f. . 3000°K
Figures 3Za through 32f.
Calculated Temperature Sections for the Ta-W-C System.
methods. Due to the lack of high precision thermodynamic data, however,
the latter approaches would essentially become reduced to a data fit tc the
ecperiment. With present experimental means, the certainty to which high
temperature phase-equilibrium data is rarely better than + 2 atomic percent, hence
the net gain in accuracy and reliability may appear as negligible. The value of
an exact numerical solution of the unrestricted problem has to be, therefore .-- at
least for the time being- considered more as principal rather than factual.
97
*1- - - - - - - -- --

B. BACK-CALCULATIONS OF THERMODYNAMIC QUANTITIES
FROM EXPERIMENTAL PHASE DIAGRAM DATA.
Following our coasiderations on the tantalum-tungsten-carbon
system where we were concerned mainly with the computation of the phase {relationships from available thermochemical data, we shall now try the
opposite way, namely to demonstrate the applicability of the thermodynamic
metho:d to extract thermochemical information from available phase diagram
data. Apart from the fact that phase diagrams provida us with a convenient
source to derive thermodynamic quantities for hypothetical phases, which
are not accessible by calorimetric means, the need for such calculations often
may arise if pertinent data for the calculation of a specific system are not
available.
We choose the recently established phase diagrams Mo-Cr-C
and W-_r-Ct'"' as examples for the calculations. Temperature sections for
both ternary systems are shown in Figures 33 and 34. We consider the
W-Cr-C system first.
Tungsten and chromium form a nearly symmetrical niscibility
gap at temperatures below 1500G r23C6 exchanges at the equilibrium
temperature approximately 23 atomic percent tungsten, and the hexagonal
(W, Cr)2 C phase extends to a chromium exchange of 87 atomic percent. The Itequilibrium WC-Cr3C z is stable only below approximately 1500*C and is
replaced by an equilibrium (WCr) 2C-C at higher temperatures. As an approxi- .
nation to the actual behavior, the vanLaar expression for regular solutions F
will be used throughout the calculations. The interaction parameter for the
98
.1
_________ ___ ____

C
I-C
wC C2
Figure 33. Section of the Phase Diagram Tung sten-Chromium -Carbon at 1300*0.
Mo ~ C3
Figure 34. Secion of the System Molybdenum-Chiromium -Carbonf ~at 1300*C.
99

I
system W-Cr is derived from the critical point with the aid of the relation
TC
with the experimental value of T c 770K, i becomes 7010 cal/gr. -At.
metal. The corresponding interaction parameters for the carbide solid solu-
tions were derived from considerations regarding the relative atomic sizes,
the melting points of the phases, as well as the tie line distributions in the
two-phase fields.
1. The Two-Phase Equilibrium (W,Gr)-(W,Cr) 2C.
Conditional equation (3) applied to both solutions yields
AFf(Cr,W) 7010 x Cr (l-XCr) +RT [xcrlnxCr+(I-XCr )n(l- cr)]
and
AX 1 1-x +4000 (lIx'c) +f(CrW)C ! 2 Cr f,CrC1 l/ C/)2 Cr
+ RT[x'rlnx'Cr+ (l-x'r) nl-rx' r)
Fa A F Cf (C r, 7010 (l-Zx ) +RTn Cr
L Cr T,p Cr
7Ff(C r, W)C; XAF2 -AF + 400 (l-Zx' )RT Cr
fCrG fWC TC; ln x--Cr T, p 1/2 Cr2 Cr
X r 1-x'r
AFfCrC -Fw/ 7010 (1-ZxC )-4000(1-2x' + RTIn Cr r
1/2 fW 1,, 2 rCr Cr
100
_I

X CFree enthalpy of formation of CrC1 /2 lt tutr
C 1 /z analogous to that of W2C.
6F f WC Free enthalpy of formation of WG 1 /Z.
x rEICr Mole fraction chromium exchange in W and WC,/2 respectively.
This difference in the free enthalpies of formation for the subcarbides can
now be evaluated from the end points xr and x of the experimental tieCr Cr
lines at the two solutions (Figure 33).
Performing the calculation, we obtain as the mean value and
standard deviation*
AFfr - AF =-1500 + 500 cal/gr. -At. Metal (T 1575*K).fr1/2 fWC 1 //2
2. Three-Phase Equilibrium (W,Gr) Z3C 6 -(W,Cr) ,C-(W,Cr).
Stability condition (8), rewritten for this equilibrium
(u 0, v 0. 266, x 0. 436) becomes:
7*0./Il 0.39
- 0. 390 1 -x ?+ 0.61 j(1-xtt 2 _6 ) 2 +RTln x' Cr I 'xGr
ZGr 0 .2 6 6 'Cr 3xC;r) ZlxCr KCr
Intracionparmetrsfor the solutions (W, Cr), (W, Cr)C/ 2
and (W. C r* ntracio I arame7ters0 4 000, an d 4 0 00 cal/g r. -At Metal)
xC x',x Mole fraction chromium exchange in tungsten and the solu-Cr Cr' (2' tions (Cr, W), (Cr, W) C6 and (Cr, )
Insertin"7 Cie experimental points from the plaase diagram~, i.e. x Cr = 0.13,
-0. 77, and x" 0.65, we obtain the free enthalpy of disproportionation ofxGCr
101

CrC6/z3 into a hypothetical CrC 1 /and chromium:
AFzc rC 6 /23 = 970 cal/gr. -At Cr (T = 1575'K).
Substituting tungsten for chromium in the above equation, and inserting the
equivalent concentration xW l-x, we obtain for the free enthalpy of dis-
proportionation of a hypothetical WG6/ 3 into tungsten and WCG/ :
F ! -1790 cal/gr. -At. W, (T = 1575°K)
i.e. a phase W23 i6 Is unstable with regard to a mechanical mixture of W Cand W.)
Analogous expressions are now written down for all other three-
phase equilibria in the system, and the free enthalpies of disproportionation
for the corresponding phases evaluated.
3. Three-Phase Equilibrium (W,Cr) C +(WCr) 3 C6 +(WCrC,
(T = 1575-K).
The corresponding reaction is (u = 0.Z66, v = 0.43,
w = 0. 436).
Mec0$, -- 0.964 MeGo.43 0.036 MeCo.26 oss sol Sol.
AFZr 43 (Cr 7 C 3 -type) + 370 cal/gr. -At. Cr.
AFzwc (Cr 7 C3 -type) - Z6Zocal/gr. -At.W.
10Z

4. Three-Phase Equilibrium (Cr, W)C 3 -(Cr, W),C-(Cr, W) 3 C 2
(u 3/7; v i/z, w = Z/3
Cr /,-.7/10 CrC3 f +3/10 CrC2 / 3 AFZCrC/ 3 Z0 cal/gr. -At.Cr.
5. Three-Phase Equilibrium (Cr,W) C-(Cr.W) C -G2 3
(T = 1863"K)
(u 1/2, v = 2/3, w o)
CrC2 / 3 -Crc 3 /2 +1/6 C F r 800 cal/gr.-At.Cr.2/3Z~rC 2 1
WC2,1 (Gr G2 -type) W WC + 11/6 C -4100 cal/gr. -At. W
6. Three-Phase Equilibrium (WCr)G-(W,Cr)C-C(T=1863"K)V2
WC --- WC 1/z + I/Z C AFzw c =1960 cal/gr. -At. W
CrC (WC-i.ype) -eCrC2 (W 2C -type) + 1/2 C 'FZrG = -5170 cal/gr. -At.Cr.
In this system we have the interesting ckse that
none of the lattice types observed in the one system, occur in the other. In
order to enable a phase diagram calculation, the stability of all tungsten-phases
with the structural characteristics of the chromium-carbon phases,and similarly,
the structure of chromium-carbides with structures analogous to WC and WC
have to be known. The calculation of each equilibrium in this system involves
data for at least one hypothetical phase. Hence, based only on calorimetric
data, not one equilibrium in the whole system could be predicted, or e-en estimated.
103

Eccept for the monocarbide, which is missing at the Ichosen equilibrium temperature, the phase relationships in the Mo-Cr-C
system (Figure 34) are very similar to the system just treated with tungsten;
the thermochemical evaluation is analogous and the data obtained (MMoO.I
4000 cal/gr. -At. Metal) are summarized in Table 7. For comparison pur-r
poses, the data obtained from the W-Cr-C are included in the compilation.
The various structure designations (a, P ... i) refer to the following types
Designation Lattice Type I
a ........ MoG, W2C*
........ WC
y.........C C
8 .......... Crs C3 1Cr 7C 3
A comparison of the data shows excellent agreement between the free energy
changes obtained from the phase relationships in the two (independent) systems. I
The free energies of formation of the stable chromium
carbides are available from the literature, and representative values, ta.Un Ifroma rcen copiltio ( 1 6 ,17)
from a recent compiation , are given in Table (8).
*i
Mo2 C and W C differ at low temperatures in their sublattice order, however,since the exchange of chromium tends to outweigh the differences, a special
distinction is immaterial for our present purposes.
104

- i Table 7: Summary of Thermochemical Results on Chromium-CarbidesDerived from Phase Diagram Data in the W-Cr-C and Mo-Cr-C
* System. (Values in cal/gr. -At. Metal. T = 1575'K)
Free Enthalpy " of ReactionFrom From
Reaction W-Cr-C Mo-Cr-C
CrC (y) . 4Z.Cr+o.58CrCA5(L) + 970 + 860
CrC7 /3"(6) -0.88CrCo.4(a)+0.1ZCICO.z 66( 4 370 + 330
CrC (a) 40.7CrS/ (8) + 0.3CrC,/ (,) - 320 - 220
CrC/,3 ( C) -*CrC 2 (a) + 1/6 C + 800* + 945
CrC (1) -+CrC,! () + 1/2 C -5170
F *T = 1873°K
Table 8: Free Enthalpies of Formation of Chromium-, Carbides (Compiled from the Literature)
A AFf = A - B *T (cal/gr. -At.Chromium)
Carbide A B Temperature Range, OK
I Cr C -4270+800 0.40+0.1 298 - 1673"
Cr C -5710+800 0.81+0.1 Z98' - 1673'CrC -6170+800 0.86+0.1 298 - 1673-
These data can now be used to assign free energy data to the hypothetical
chromium carbides derived from the phase-diagram information (Table 9).
105[I

Table 9: Free Enthalpies of Formation of Unstable ChromiumCarbide Lattice Types (Absolute Values are BasedUpon the Data for the Stable Chromium Carbides)
A Ff = A - BT (cal/gr. -At. Chromium)
Carbide A B 1
CrC (WC-type) -5500 0.81+1.5
CrC (WC-type) - 650 0.90+0.5
CrC /(Bl-type) -2100 1.86+0.5
*From Mo-Cr -C
For phase diagram calculations, however, it is usually preferable to use
the differences directly as derived from the experimental sections, in order
to avoid an unnecessary accumulation of errors. In either instance, however,
it is advisable to countercheck the consistency of the values by back-calculating
the phase relationships using the data derived from the experimental sections
(Figures 35 and 36).
Compilations similar to those for the chromium carbides can
now be made for the chromium carbide-type lattice structures in the molybdenum-
carbon and tungsten-carbon system, providing us with base data for calculations
in systems involving these lattice types. We shall not go into any further detail,
since the relevant information has been collected elsewhere (16); however, we
will briefly discuss one aspect in the tungsten-chromium-carbon system, for
certain discrepancies between observed and calculated thermodynamic values
for the Me C phases initiated the search for, and finally resulted in the dis-
covery of the sublattice transformations, which were observed to occur in
nearly all subcarbide phases (9 ) in the meantime.
106
S

In the evaluation of the three-phase equilibrium
(W,Cr)C-(W.Cr) 2 C-C on one of the preceding pages, a value of AFz wc-
1960 cal/gr. -At. tungsten was obtained foz the free enthalpy change of the
reaction
WG - WC1 / + /Z C
I C
I~ I /
7 AU C
* Figure 35. System Section W-Cr-G at 1600*K, Back-Calculatedwith the Thermodynamic Data derived from theExperimental Section in Figure 33.
107

In contrast to this, from the known, and apparently well established literature
data for WC and W2G (Table 1), the corresponding value should be 3700 cal/gr. -
At. W. at a temperature of 1870*K. However, the calculated vertex of the
three-phase equilibrium at the solid solution (W.Cr) zC would be x c,/= 0. 08i
thi s would extend the three-phase equilibrium far above the observed homo-
geneity range of the (W.Gr) 2 C solid solution, and therefore presents a dis-
crepancy with the experimental findings.
C
/ I_
I
I .U
I
Figure 36. System Section Mo-Or-C at 1500 K Back-Calculatedwith the Thermodynamic Data Derived from the Experimental Section in Figure 34.
108
- I L

Since it was known from the iiterature(-O) that the
binary W~C phase had an ordered distribution of carbon atoms, the only pos-
sibility in overcoming the observed discrepancy of approximately 1700 cal/gr. -
At. tungsten, was to assume an essential disordered sublattice in the MeC
phase at higher chromium ccchanges. Thus, for the case of a narrow energyIgap between ordered and disordered phase (low transformation temperature),
the configurational entropy due to a statistical distribution of the N carbon
atoms among the ZN lattice sites available in the hexagonal close-packed Me,
structure (L'3-type) results in a free energy contribution of 1/2 RT ln 2
130 cl pr ormula weight MeIeand thus eliminates the discrepancy. A subse -
quent intensi,.e search to see, whether cr ndt, tic dis ordering extend~d to the binary
phases, finally resulted in the establishment of order-disorder reactions for
NbG, TaC, MoC and W2 CG. (The question, whether V 2C undergoes a related
transformation at low temperatures ( <800*C), is not yet completely resolved).
C. DISCUSSION OF ThE CARBON-RICH EQUILIBRIA IN
URANIU M- TRANSITION METAL-CARBON SYSTEMS
An interesting problem was present in connection with
the development of the fuel material for the European High Temperature Gas-
Cooled Reactor (Dragon). It consisted of the question, whether it would be
possible to stabilize the face-centered cubic monocarbide towards graphite
by alloying it with other suitable refractory carbides. We recall that in the
uranium-carbon system1) besides the monocarbide, two-carbon richer
phases U C 3and UC exist, of which the latter undergoes a crystallographic
transformation at approximately 1800*C. The resulting Ca.F.-type high tem-
perature modification of UC, ultimately forms a complete solid solution with
109
4;__

the monocarbide. The problem was attacked in order to circumvent diffi-
culties which might arise from the volume changes of the dicarbide phase in
the transformation process, affecting the stability of the tight pyrolytic
graphite shell into which the particles were embedded. Apart from these,
as well as other factors, it was h3ped that the increased melting tempera-
tures of the alloyed material could improve the high temperature stability of
the fuel materials. It was known from previous work, that uranium carbideZ 4)
forms complete solid solutions with a number of isostructural monocarbies',
the problem reduced to the question of,at wat ccncetrticn of thi allvir aterial
would the three-phase equilibrium(UMe)Cj-(U s Me)C-C be replaced by ia two-phase range monocarbide-graphite. The general phase-situation observed
in these systems is shown in Figure 37.
C 1i-
A
would ~ ~ U +h t re - h s e ui b iu(U, M e) C z- U e G C b e l c d
/ I
C+ C
U(,M) j 2(,e -UC2
Ce( (Ue) '
UC MeC I
x
Figure 37. Basic Phase Distribution in the Carbon-Rich Portionof Uranium-Refractory Transition Metal-Carbon Systems.
110

Since the thermodynamic stability of a dicarbide in
the refractory transition metal-carbon systems is considered low, the
metal-exchange in UC 2 can, in a first approximation, be neglected. Thermo-
dynamically, the point in Figure 37 is related to the thermodynamical prop-
erties of the phases by stability condition (8).I
(v-w) FA( )+ (w-u) FAv) + (u-v) FA(w) = 0
Applied to this case ( Z5 )
u = I solid solution (U,Me)C
v 1.85 UC 2
w cc C
we let w approach infinity, and the stability condition becomes
A(v) A(u)
i.e. the stoichiometry of the dicarbide does not enter into the result. Separating
the partial terms in base and concentration-dependent functions, neglecting
eventual metal exchanges in UG 2 , and replacing the free enthalpies by the
respective free enthalpies of formation, we obtain
-MIXAF + AF -AF =0
LUG UC f U C2
A AmixAF AFRUC : Fuuc R
The right hand side of the last equation represents the free enthalpy change
of the reaction
UC + 0.85C --*UC
111

V
The exact concentration-dependence of the partial molar free energy of UC
in carbide solutions is unknown; however, the following interaction param-
eter in the vanLaar expression for the regular solution, which were derived
from the tie line distributions within the miscibility gaps of pseudo-ternary
(26)systems U-Me-C may serve as useful approximations to describe the
average solution behavior:
'UC_ZrC -- 6,000, 'UG -HfC = 9,600, UC-NbC= 6,800 and aUC TaG=8,000 cal/mole.
Approximating the solutions as being regular, we obtain
Mec-UC (l-xu) + RT In xu AFR
x u .... Uranium exchange in the monocarbide solutionsMeC -UC.
The equilibrium composition x, in effect therefore becomes a function of the
free energy change AF . From the available thermodynamic data, AFR should
have been in the order of -20, 000 cal per formula change, corresponding to
xU < 2 atomic percent. From thesc data, an effective stabilization should
therefore, not have been expected. However, a closer examination of the values
reveals that they are incompatible with the observedlow-temperature decom-
position of UC ,whid rather indicatedonly a small value for AFR . This was
confirmed by experimental investigations of the phase-relationships in these
systems (26), and showed the restraining three phase equilibria for the
dicarbide to be located in the midile portions of the systems. The vertices of
the three-phase equilibrium (UMe)C-(UMe)2C-C at the monocarbide solid
solution for the various carbide solutions and a number of different tempera-
tures are presented in Figure 38.
112___ I c

Back calculation of Wfromn these phase data#, and
taking into account the transformationi of U10 2 a 80 ilsatrlna
zation,
AF -10, 350 -5. 57T cal/formnula change, (T zlo0z000OK)R
anrd
-7710- 4. 31 T cal/formula change (T =1900-21001K)
UCHCUC TaC*~~. UHCj-UC-NbC
2200 C-zrC -____
* 2100
wjcr 1900
w* j r- 1700
f1600 DECOMPOSITION UC2 -____
MeC 20 40 60 80 U C
mole % UC-
a Experimental Data
-Calculated with Mean Value of A
Figure 38. Temperature Dependence of the Graphite-Stable
Ranges in Uranium -Containing MonocarbideSolutions.
113

The calculated data for ARare illustrated in
Figure 39.
CLV,
o-3000 -
0
16000 -0 200 20
UDCalulted rom the System _____
igur 39,_ FreEtap hnesfrteRato
1600 180 2000 - , .6 2
(Dt Calculated from thae Syagrem s -- e
The free enthalpy of transformation of the tetragonal
into the cubic modification of UG 2 is given by the difference of AF' and f
AF.; we obtain, as a first approximation) from the data given above:
A~r 2640- 1.26 T cal/mole UC 2
114

[i
The phase diagram data, calculated with the mean values of RF and AF.
are in excellent agreement with the experiment (Figure 38). The binary
temperature stability limit T for the tetragonal UC-phase is given by
&FR= 0
= 1550"C
(Z5)and agree well with the experiment Also, more recent thermochemical
values for the free enthalpies of formation of the uranium carbides( 2 7 '28)
closely confirm the data derived from the phase diagrams.
V. GENERAL DISCUSSION OF THE PHASE RELATIONSHIPS IN
TERNARY SYSTEMS OF REFRACTORY TRANSITION METALS
WITH B-ELEMENTS
A. METAL-CARBON SYSTEMS
During the past few years, temperature sections for a large
t number of ternary transition metal-carbon alloys have been investigated or
calculated. Their detailed evaluation, however, would exceed the framework
of the present discussion, and, therefore, reference is made to the literature
compilation at the end of the text 39 ) . In general, the previous investigations
cover only one temperature section of the system, and the investigation of
S complete systems has been initiated only recently under the sponsorship of
the Wright-Patterson Air Force Materials Laboratory.
As a rule, no ternary phases are formed in the ternary carbide
systems, i.e. the ternary phase relationships are governed by the binary
115

compounds. Where the radius-ratio rule is fulfillud, the Isostructural mono-
carbides of the group IV and group V transition metals form complete series
of solid solutions. In the systems involving the group VI metals, the cubic
(BI) phases are stable at high temperatures only, and, therefore, the homo-
genelty ranges of the cubic solution are temperature-dependent; above the
eutectoid temperatures, however, which are 1960=C for a-MoG I X (B 1),
2530"C for ca-WC1 -x(B I), solid solution formation with the other cubic mono-
carbides is complete.
As for the subcarbides, complete solid solutions at higher tem-
peratures are formed between the Me C-phases of the group V metals as well
as between VC and Mo C, and V C and W ?C, respectively. In the carbon
systems of niobium and tantalum with the heavier group VI metals, the sub-
carbide solid solutions are unstable in respect to mechanical mixtures of
munocarbide and metal solution, but MeC single phase fields tend to increase
with temperature, or even show a continuous transition, as found for the
Ta-W-C system ( 12) . In the group IV metal-carbon systems, the Me C-phases
are unstable in respect to mixtures of metal + monozarbide; the ternary I
homogeneity ranges of the Me C phases in systems Me1 (V, VI)-Me,(IV)-C"
are therefore restricted.
In the ternary systems Me(group V or VI)-MeC(group IV)-C,due to
the instability of the Me 2C-phase in the binrry carbon systems of Ti, Zr, and
Hf, the ternary homogeneity ranges of the Me C-phases are very restricted.
In their basic layout, the ternary systems involving chromium
are similar to the molybdenum-containLng v y _tms, although the phase I
116

ii
distribution near the Cr-C edge systems are somewhat modified as a result
of the different structural characteristics of the chromium carbides.
The high temperature phase relationships in all ternary metal-
-trbon systems are complicated by the fact that in many of them even the
solid-state equilibria change rapidly with temperature, and the order-disorder-
transformations in the Me G-phases proceed as concentration-temperature
dependent reactions in the ternary phase fields. A few phase diagrams,
I together with their reaction diagrams and liquidus projections, which were takenIfrom the work referenced in (10), may serve to illustrate the general appearance
of the complete constitution diagrams (Figures 40 through 48). A
In neither of the previously indicated systems 0 ) do melting
point maxima of the monocarbide solid solutions occur, and earlier findings
are related to the fact that maximum melting of the interstitial monocarbides
1does not occur at stoichiometry, i.e. ,rnelting of the ternary alloys is a func-
tion of the metal as well as the carbon concentration (Figure 49).
B. METAL-BORON SYSTEM
Many of the structural characteristics of the intermediate phases,
art repeaeu tiroughout the systems of the group IV to the grocp V' .. etal6;
hence, where these conditions prevail, and the radius ratios are within the
tolerable limits, complete solid solutions usually are formed. The stability of
the borides decreases with increasing group number; consequently, the
selectivity of the metal-exchange increases upon combining group IV with
group V or group VI metal borides.
117
_ _ _

M - -I
I 2%
2500 %1 3%
2000
1500
7'Ibj
10 3
30 -------
0+_, 40so
50-
s90Ti 11103 go
Figure 40. Constitution Diagram Titanium -Tantalum -Carbon.i
(C E.Bruk! and D. P-. Harmon, i %) 5)
118J

To-C To -Ti-C *f-C T-.
T P LS L4C1 L48
SC L 50
L -0oav.,*B +,
ii ~.y.S Lpgi
I~ A -
Figure 41. Scheil-Schultz Reaction Diagram for the Ti-Ta-G System
3067
Wigue 42 LiqidusProjctios inthe i-TaC3Sytem
1190

t
471I
WeI
U- II41
I t
202

Ta -C Toa-Zr- C Zr-C Zr -Ta
-* + I I I+ +
7 agile
1820 I
b 0-B,
Figure 44, Scheil-Schultz Reaction Diagram for the Zr-Ta-C System.
/ 33300
24000
280843
J~350
200.0
min 18250
18760-. 3OI4*
Zr 1830- Ta- ATOMIC % TANTALUMh -34e~
Figure 45 .Liqtuidus Projections in the Zr-Ta-C System.

/ 61%
3330
3000 12
'Il
M2240
,
0:2000 '
I-Y
i. 2380 .2366 - 2120*
1 0 lid90
I it

A
To- C To-H - C ' fC IHf -TaL#C L & L+OL.9 L48 L*C' 040
33301 2350
-C Ia.L-.8 fc I .B
L -.1* L- -a
8.b a.a -~ a oUa 1. 0I I p
Figur 47. Sc ei -c lt Rea tio Di g a or t e H - a- y t m
2&)0~220 2600220 2EM oH
IJ9.
___ _ a-0
_______~~Y .__ _e_ _ __ _ _ _ _ _ _ __ _ __ _ _ __4___04 $ - a __ __ __ __ __ __ __ __ __ _6__ __ __ _0 4___ __

~47- __
4000 3983 + 15L392 ±_ _ t
3900
3800
6 20 40 60 80 100HfC 0.94 - MOLE 01 TaC 1j- 0' TaC 88
v C. Ayte and H. Alterthurn, 1930 %HfC-TaC)
*Our Measurements(Error limits on terniry alloys: ± 25'C)
Figure 49. Maximum Solidus Temperatures for the (Ta,Hf)G1 _xMono zarbide Solution.
Top: Concentration line of maximummelting.
Apart from the technically most interesting group IV metal-
boron systems N~hich presently are being investigated under Air Force sponsor-
s hip (10) , very lit tie experimental work has been performed In this system
class. The phase relationships in the Zr-Hf-B system, which are representa-
tive of the phase behavior of all ternary group IV metal borirles, are shown
in Figures 50, 51 , and 5Z.
124

-2 IT20
--c-- ------ - JJ80 -
-- I I
10025
Hf -----
_ _ _ _ _ _ _ _ _ 2 1
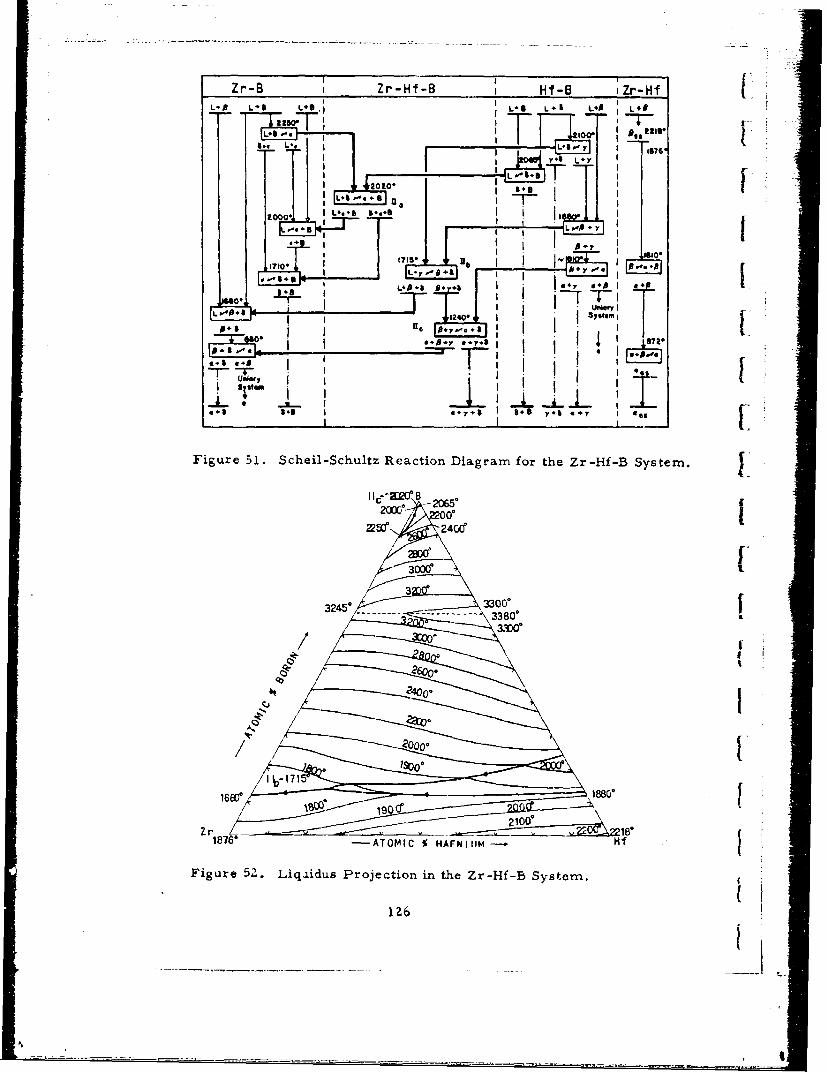
Zr-B Z-fBH- rH
L f1710, lb ..
10War I
S..~6- - O.TS ** 67 5
Figure 51. Scheil-Schultz Reaction Diagram for the Zr-Hf-B System.
I --ac B _2W
325 33OO0.
171
-A18I 11AFIM- Hf
Figure 52'. Llqaidus Projection in the Zr-Hf-B System.
126

C. REFRACTORY TERNARY SYSTEMS 'NVOLVING A
I TRANSITION METAL AND TWO B-ELEMENTS.
The group of systems considered are Me-X 1 -X 2 , where Me
stands for a refractory transition metal, andX, andX are either N,C,Si,
orB.
I Interstitials, such as oxygen and hydrogen, as well as other
elements, which to a certain degree might be equivalent to one of the elements
listed above and hence would fall into the same category, have been omitted
since they form either comparatively low-melting phases, or gaseous
reaction products with the other B-elements at high temperatures (0-Si, N,C).
Nitrogen in the refractory transition metals behaves similarly
to carbon, and a large number of interstitial compounds formed by this
element are isostructural with the carbides. Hence, extended or complete
intersolubility between nitrides and carbide phases is observed ( 1 9 } .I.
Nitrides and carbides on the one hand, and borides as well as
silicides on the other, are quite different in their structural characteristics.
* Solid solution formation between these compounds usually is very restricted,
indicating high mutual transformation or disproportionation energies of the
lattice structures. The silicon-containing systems are further characterized
( by the appearance of carbon (nitrogen, oxygen, boron)-stabilized ternary
phases(19) .
Although for the majority of the systems isothermal sections
I are available from previous work ( 1 9 ) , the high temperature portions of the
majority of the ternary alloy systems are still unknown, and even a number
of binary systems would require extensive revision. High temperature portions
Z7

of selected ternaries of these system classes are presently being investigated
under current Air Force programs (3Z) . From these systems, in particular the
borocarbides of the group IV metals have recently become of interest in the
development of oxidation-resistant graphites. Important equilibrium
characteristics of these systems are the formation of pseudo-binary systems
of the diborides with graphite and B 4C. Examples of the latter system group
are given in Figures 53 through 61.
I
1Z8
I!

r 3100- 44%6
3000-
-~ 2450'
25M 2620,i -. 0%
2400 240_
2200
I2
2c129

B3-C ITi-B-C I Ti-B Ti-CL-- LW L"L-L- +
L ~2776*
L.. -20* 10
238*80.2310. MOOS~ L-3
20B0 I
I I1650-I
4-00-4] f S-W.4 S.W.. Sp,+W y.b~p $+Y~p i +4 T+b 5*y P+ P.,
Legen~d: 0 .. O-Ti 3. TiS 2 p.. TIC -6..4C
Figure 54. Scheil-Schultz Reaction Diagram for the Tita..ium-Boron-Carbon System.
130

00 2450 I
o3225*I.
2800.
(e
CYI
Figure 55. Liqxidus Projection in the Ti-B-C System.
1 131

3400
32451
3100 * 6
3000
2100
2600 I2500 280.~
2400 T, 23801,oI
84C
500- 2I
12_ 20(
Fiue5.Cosiuin iga0ir0ir-o-nGro
(E. Rdy an St. indi2100 1 0
2103Z

8-C Zr - Zr-B-C Z L-C
L.. . L .IL. LI, L.i Laent, L. L-07ii V1 Ie izrc
/ I I .- I.C:L~r-,o"I Vol L-" T I
i ,- I, i, Q.,ov
-O. '23602°"lo 1 ! T ZL
" . ... a. -I I
2380, l '"0 -I I *1,
Li - L~--y.. L-S..12060-.A
S-IL. I
-- -- II-
1710. I I
r i I ..,.. 1 i' mi"4- '
ES 135*
, Io -i i i. .. _ _ I - - ,o .16601
I.. . B a I I- . * . i p- II5E - I '
Figure 57. Scheil-Schultz Reaction Diagram for the Zirconium-Boron-Carbon System.
t / 9
2450'
ma,5 C *a 0
Qp . I 1/90
{ /li'ii ' ,."-
NID I! / / h "/ ;)
Zr -ATOMIC % CARBON- 3440" max
Figure 58. Liquidus Projection in the Zr-B-C System.
133

/3926*
3700
3600 13500
3400
3300- 66
3200
3100-
300~
2900 -4O!
2600 -!50
I2300- - 34S * -\
23001 '
15001i~~~E 2400' ~I Hf~~
90 - =, 7
0 4246026-_
2000
18030
134C

L-9 LC L~I Df L-NIUI L
-t' so
L. allo
1l00.
I-H II I
Figure 60. Scheil-Schultz Reaction Diagram for the Hf-B-C System.
8 -2100-
2450*
100.
/A( m . / I
k~
A1 0.
0Oo-
0A
wi 2210, -ATOMIC % AASON 39B"
Figure 61 . Liquidus Projections in the Hf-B-C System.
135

VI. NOTES ON THE RELATION OF PHASE DIAGRAM DATA TO
APPLICATION PROBLEMS
The purpose of a constitution or phase diagram of a system is to depict
in condensed form the equilibria existing between the phases in the given
alloy system. Consultation of the phase diagram will tell us, whether or not.
or to what extent, given alloy mixtures will undergo reaction- when heated to
temperatures and for times which are sufficient to allow equilibration to
take place. The information is quantitative with respect to the nature and compo-
sition of the phases .A phase diagram, combined with kinetic data, provides us
with a whole spectrum of means to modify the properties of allc s, of which
extensive use has been made in the past. However, the increasing demand
for materials capable of operating for prolonged lengths of time at extremely
high temperatures has introduced additional variables which have to be taken
into consideration. In reviewing problem areas in the field of high-tempera-
ture materials, oxidation-resistant coatings, etc., it is seen that
the main problem is not so much found in not having materials with any
of the desired properties, but rather in the lack of a single-phased material,
which combines all of the necessary properties. The conception of a com-
posite, or heterogeneous system, therefore, involves the task of combining,
the beneficial properties of a number of constituents within a quasi-homogeneous
structure without degradation.
Consideration of a composite system always implies a certain degree
of prefixation,since we normally have a certain base material already in mind.
The main problem to be solved concerns the modification of certain undesirable
properties, so that the system will be capable of performing under the prescribed
136
_________ j. i

condition. Typical cases may involve the protection of exposed surfaces
from corrosive gas attack, reinforcement of ceramic ox plastic structures, and
transpiration systems, etc. Each case may have its specific extra require-
ments, thus placing further restraints upon the usability of particular mate-
rial systems; however, chemical compatibility between the alloy phases will
be an eliminative prerequisite if the conditions are such, that non-equilibrium
states cannot be maintained over significant lengths of time. The recognition
of such prerequisites, their experimental and/or theoretical rationalization,
and, as a result, the estahlishment of an effective elimination and selection
system, constitutes an important first step in an intelligently conducted attack
on the problem. The largest part of the information required for the initial
screening can be obtained from phase diagrams, and the only possible, or the
optimum, compositions determined from the existing phase relationships.
Detailed phase diagram information is also necessary in order to predict the
reaction paths in a system of reacting species. While phase compatibility can
prevail between only two phases in binary systems, the additional degree of
freedom in ternary alloys allows much wider variations in the equilibria formed.
Obviously, the multiplicity of combinations becomes still greater in higher
order alloys. Without going into too great detail, we shall try qualitatively to
demonstrate on a simple example the variety of reactions, which nay occur
in two-phased ternary alloys having the same overall composition.
For this purpose, let us arbitrarily assume a diffusion couple made
up of interstitial phase solutions (A,B)CU and (A,B)Gv . We shall choose the start-
ing compositions (dashed line in Figure 61) so that a conjugate system is
formed with respect to the equilibrium compositions Xe1 and x e
137

To make the example more concrete and easier to follow, we may,
for example, think, that u = 0 (metal solution), and v =(thus making it,
if C stands for carbon, a Me 2C solid solution). Equilibrium in the couple
AC V Xe1 1 BC v
1- I
ACU X1 Xe1 BC u
Figure 62. Conjugate Diffusion Couple, Consisting of TwoTernary Solutions (A, B)C u and (A, B)C v . [
(Equilibrium by Interstitial Atom Diffusion)
will be attained, if the composition of the solution (A,B)C reaches X , and
that of (A, B)C assumes the equilibrium composition, denoted by Xei.U IWe first consider the following extreme cases:
a. The interstitial atom C is the only diffusing speciesin the system.
b. The diffusion current is carried only by metal atoms(A, B)
In process (a), equilibration can only be achieved by migration of carbon atoms
across the metal-carbide interface (Figure 62); thus, the subcarbide solution,
having the non-equilibrium starting composition XiI, gradually gets converted
138

into a metal solution with the equilibrium concentration Xe. Simultaneously,
the transfer of carbon atoms results in a carburization of the metal solution
(starting composition Xi) into a subcarbide solution of the equilibrium composi-
tion X . The ultimate result is a complete phase interchange (Figure 63).e1 1
C Interface
(A, B)C u (A, B)C v
X _ Start
Intermediate Stage
(AB)C (A,B) u After Complete
Xe UXe 1I Equilibration
Figure 63. Phase Interchange in a Conjugate Ternary DiffusionCouple, for the Case that the Interstitial Atom C isthe Only Diffusing Species.
Considering the secoznd cases we see that the conpositions of the individual
phases gradually change along the lines indicated by the arrows in Figure 64, until
the equilibrium concentrations X and X are finally reached. We nate,T II
that for host atom diffusion both phases do not physically interchange.
In praztike. we never will have to deal with either extreme, but
generally will be confronted with a superposition of both types. However,
139

assume now, that, without changing the overall composition of the couple
as well as the position of the equilibrium tie line, we had chosen the initial I
compositions of the couple such that XI = X1l, i.e.,equal exchanges of A ani1
B in both solutions. Exchange of the inter stitial atom would not produce any
decrease in the total free energy of the diffusion system; hence, no net trans- tfer of interstitial atoms would occur, and equilibration would take place via
diffusion of atoms A and B only.
XeT XH
AC v BC
1 / 1VI
AC' X I Xe, BC 1
Figure 64. Equilibration by Host (A,B) Atom Diffusion in aTernary Diffusion Couple (A,B)Cu + (AB)Cv -
A closer analysis of the assumed example will reveal, that for all t
compositions lying between the line XI = X i and the equilibrium composi-
tions X and X , and regardless of the magnitude of the diffusion coefficiente I eI
for the interstitial phase, the diffusion current would be carried only by the
host atoms (Figure 65). For concentrations on the opposite t- of the divid-
ing line XI = Xii, equilibration will take place by a combination u host and
interstitial atom diffusion resulting in at least a partial phase interchange.
Thus, in slite of the fact, that no structural changes, or additional phases are
140

involved, the physical appearance and phase distribution of the ultimately
equilibrated alloy will vary significantly with the initially chosen starting
i compositions.
Ij .B A H
ACv BCv
0
II
AC ,- BCuACu C1 Xei JC
14- A - - B - J
I. Figure 65. Effect of Composition Upon the EquilibrationRea-tions in a Ternary Diffusion Couple(AB)Cu + (A,B)Cv (c = Interstitial Element)
0 ... Overall Composition of the Couple
Xe X e .. Equilibrium Tie Line
C . Conjugate Compositions
Vertical Shading ... Host Atom Diffusion Only
Horizontal Shading... Host + Interstitial Atom Diffusion (Partial Phase Interchange)
141

I
Since the type of diffusion proceeding at the couple interface is -
apart from the variation of the conposition - dependent on the course of the
tie lines, the diffusion process is closely linked to the equilibrium condLtions [prevailing in the system. We will, however, not pursue these questions any
further at this time, but emphasize the principal recognition of these factors Ifor the solution of practical diffusion problems. The possibility, to derive
free energy gradients for the interpretation and quantitative evaluation of
diffusion data, by combining the thermodynamic approaches described in the fprevious chapters with pertinent phase informatioa, shall oaly be mentioned
VII. CONCLUDING REMARKS
Although the presently available experimental and theoretical material
is still insufficient to allow a fairly complete correlation of phase diagram
with thermodynamic data, it has been shown. that with relatively simple
thermodynamic approaches, useful information regarding phase stability can fbe derived, and in turn applied, to evaluate the phase relationships in still -
unknown systems. The examples given also show some of the difficulties iencountered in applying mathematical models to actual systems they reveal [the need for more complete and accurate data to enable more refined calcula-
tions. In many instances this will require an extension of the measuring
techniques to higher temperatures in order to account for thermal effects
due to excitation of other internal degrees of freedom.
142
I
_____

REFERENCES
1 E. Rudy: Z. Metallkde 54 (1963).112.
2 Compare the Treatment of Corresponding Cases by
J.L. Meijering: Acta Met. 4 (1956)) 249J.L. Meijering and H. K HI rdyr: ibid. 5 (1957), 257J.L. Meijering: Philips Res. Rept. 5 (T950), 3331'J.L. Meijering in: "The Physical CIimistry of MetallicSolutions and Intermetallic Compounds, Vol.I1. (HerMajesty's Stationery Office, Lond'-n, 1959)E.Rudy, H.Nowotny, R.Kieffer, F.Benesovsky. andA.I~ckel: Mh.Chem.91 (1960), 176
3 L.S. Darken and R.W. Gurry: Physical Chemistry of MetalsI (McGraw-Hill, New York, 1953).,
4 W. Schottky and C.Wagner: Z.Phys. Chem. Bll (1930), 163.
5 L. Kaufmann, H-.Bernstein, and A. Sarney: ASD-TR-6-445, Part IV
(1963).
6 C. Wagner: Thermodynamics of Alloys (Addision-Wesley, Reading,Mass, 1952).
7 J.S. Anderson: Proc. Roy. Soc. A 185 (1946) 69.
8 A.L.G. Rees: Chemistry of the Defect Solid State (Methuen, Londzrn,1955).
9 E. Rudy, St. Windiscn, and Y.A. Cag:.FLT-52 Pr .VlI
10 Ternary Phase Equilibria in Transition Metal -Bor oa-Carban- SiliconSystems. Contract AF 33(615) -1249, Air Force Materials Laboratory,Wright-Patterson Air Force Base. Report Series AFML-TR-65-Z,Parts I. II, and IV. (1964 to 1966).
11 E. Rudy, El. Rudy, and F. Benesovsky: Mh.Chem. 93 (196Z), 1776.
1Z E. Rudy: AFML-TR-65-2, Part II (Jan 1966).
13 H. Buckle: Z. Metallkde 37 (1946), 53
14 C.H. Schramm, P.Gordon, and A.R. Kaufmnann: Trans. Amer. Ins t.Min. Met. Eng. ___ (1950), 195.
15 R. Kieffer, K. Sedilatschek, and H. Braun: Z. Metallkde, 50 (1959),18.
f16 E.Rudy and Y.A. Chang: Plansee Proc., 1964, p. 786.
143

REFERENCES (Cont'd) f
17 Y.A. Chang: AFML-TR-65-Z, Part IV, Vol.I (Sept. 1965).. 118 E. Rudy and H. Nowotny: Mh. Cheni. 94 (1963), 508.
19 Compare the compilation of related data in R. Kieffer and F.Benesovsky,Hartstoffe (Springer, Wien, 1963).
20 LN. Butorina, and Z.G. Pinsker: Soviet Physics, Crystallography,(1960), 560.
21 M.G. Bowman: Plansee Proc. 1964, 701.22 R. Kieffer, F. Benesovsky, and H. Nowotny: Planseeber f. Pulver-
metallurgie, 5 (1957), 33.
23 H. Nowotny, R. Kieffer, and F. Benesovsky, and E. Laube: Mh.Chem.88 (1957), 336; Rev. Met. 55 (1958), 454.
24 L.D. Brownly: J.Inst. Met. 87 (1958), 58.
25 E. Rudy and F. Benesovsky: Mh.Ghem. 94 (1963), Z04.
26 E. Rudy, H. Nowotny, F. Benesovsky, R. Kieffer, and A. Neckel:Mh. Chem. 91 (1960), 176. [I
27 C. B. Alcock and P. Grieveson: I.A.E.A. Symposium on the Thermo-dy-namics of Nuclear Material, Vienna (May, 1962). f
28 M.H. Rand :Lnd 0. Kubaschewski: AERE: Report 3487 (1960).
29 Compilation of References on Ternary Transition Metal-Carbon Systems
Ti-Zr-C: C.E.Brukl, and D.P. Harmon (AFML-TR-65-2,Ti-Hf-C. Part II, Vol. IV., Sept, 1965).Zr-Hf-C:
Ti-V-C: W.N. Eremenko and L.A. Tretjatsenko: Poroshkaia.Metallurgia 6 (1964), 27.
Ti-Ta-C: J.G. McMullin and J.T. Norton: J.Met. 5 (1953),1U05.C.E.Brukl and D.P. Harmon: AFML-TR-65-2,Part I1,
Vol. 11 (Jul 1965).Ti-b-: P. Stecher, F. Benesovsky, A. Neckel, and H. Nowotny:
Mh.Chem. 95 (1964), 1630.
Ti-Cr-C: W.N. Eremetnko, S.I. Tolmatseva, T.J.Velikanova:Report on Terperature-Resistant Alloys, AN SSSR,M. (1963)-95.
144
I

REFERENCES (Cont'd)
Ti-Mo-C: H. J. Alba~rt and 3. T. Norton: Planseever f.Pulvermet. 4 (1956), 2-6.
Ti-W-C: H. Nowotay. E. Parthd, R.Kieffer, and F.Benesovsky:Z.Metallkunde 45 (1954), 97.
Zr -Nb -C: P. Stecher, F.Benesovsky, A. Neckel, and H. Nowotny:
Mh. Chem. 95 (1964), 1630.Zr-Ta-C: D.P. Harmon and G. E.Brukl: AFML-TR-65-2,
V Part II, Vol.111 (August 1965). iZ r-C r-C;: T.F. Fedorov and Yu.B. Kuzma: Poroshkovia Metall.
3 (1965), 76.
{Zr -Mo -C: (a) T.CG.Wallace, C. P. Guitierrez, and P. L. Stone:
(b) T.F. Fedorov, Yu.B. Kuzma, and L.W.Gorshkova:
Poroshkovala Metall. 3 (1965), 69.jZr-W-C: E. Rudy: 2nd Progress Report, AF 33(615)-1249
(Octobzer 1964).
Hf-Nb-C: (a) E. Rudy: Z.Metallkunde 54 (lc 3),213(calculated).
(b) P. Stecher, F. Benesovsky, A. Neckel, and H-.Nowotny:Mh.Ghem. 95 (1964), 1630.
IHf- Ta-C: E.Rudy and H.Nowotny: Mh.Chern. 94 (1963), 507.E.Rudy: AFML-TR-65-2, Part II, VoTI (JunV 1965).
If II-MO -C: E. Rudy: 2nd Progress Report, AF 33(615)-1249Hf-W-C (October 1964).
1 V-Nb-C : E. Rudy: Z. Metallkunde. 54 (1963), 213 (calculated).V-Ta-C:Nb-Ta-C:
V-Cr-C: H.Rassaerts, R.Kieffer, and H.Nowotriy: Mh.Cheni. 96(1965), 1536.
IV-Mo-C: E.Rudy, E1.Rudy, and F.Benesovsky: PlanseeberPulvermet. 10 (1962), 42.
IV-W-C: E. Rudy, F. Bene sovsky, and E1.Rudy: Mh.Chem. 93(1962), 693.
145

[I
REFERENCES (Cont'd) I
Nb-Mo-C: E.Rudy, F. Benesovsky, and K.Sedlatschek: Mh.Chem.9Z (1961), 841. 1
Nb-W-C: E. Rudy and Y.A. Chang: Planse,! Proc. 1964, pp 786.
Ta-Mo-C: E.Rudy and Y.A. Chang: Plansee Proc., 1964, pp 786.
Ta-W-C: E. Rudy, El. Rudy, and F.Benesovsky: Mh.Chem. 93(196Z), 1176.
C -Mo-C: E. Rudy .tnd Y.A. Chang: Plansee Proc. 1964, 786.
C - w - C : (a) E.Rudy and Y.A. Chang: Plansee Proc. 1964.
(b) P.Stecher, F.BenesovskyandH.Nowotn.y: PlanseeberPulvermet. 12 (1964).
Mo-W-C: I-I.J.Albert and J. T. Norton: Planseeber Pulvermet. 4(1956), Z.
30 C. Agte and H. Alterthum: Z. Techa. Phys. 11 (1930), 182.
31 E. Rudy, D.P. Harmon, and G.E. Bruk: AFML-TR-65-Z, Part I,Vol. II (May 1965).
32 R.V. Sara, C.E. Lowell, and R. T. Dolof: WADD-TR-60-143, Part IV.(1963).
33 R.V. Sara: J. Amer. Cera-n.Soc. 48 (1965), 243.
34 E. Rudy: AFML-TR-65-2, Part I, Vol. IV (Sept. 1965).
35 E.K. Storms and R.J. McNeal: J. Phys.Chem. 66 (196Z). 1401.
36 H. Kimura and Y. Sasaki: Trans.Jap. Inst. Met. 2 (1961), 98. I37 E. Rudy and D.P. Harmon: AFML-TR-65-Z, Part I, Vol. V, (December1963)
38 D.S. Blozm and N.S. Grant: Trans.Am. Inst.Met.Eng. 188 (1950), 41.
39 E. Rudy, St. Windisch, and J.R. Hoffman: AFML-TR-65-2, Part I,Vol. VI (December 1965).
40 E. Iudy and St. Winsch: AFML-TR-65-Z. Part I, Vol. VII (Dec. 1965).
41 E. Rudy and St. Windisch: AFML-TR-65-2, Part I, Vol VIII (Jan 1966).
146

REFERENCES (Cont'd)
4Z E. Rudy and St. Windisch: AFML-TR-65-2. Part 1, Vol. IX. (Jan 1966).
43 E. Rudy and St. Wind~sch: AFML-TR-65-2, Part I, Vol. X (Feb 1966).
44 H. Nowotny, E. Piegger, R. Kieffer, and F. Benesovsky: Mh.Chem.89 (1958), 611.
45. E. Rudy and St. Windisch: AFML-TR-65-2, Part I, Vol. III (July 1965).
I
[147
iI

APPENDIX I
Proof of the Identity of the Functions ~A(x 1A and 4 B(XIB)
-mix
FZCv v A" C
mix "l (Z)6ZBCv +ZiB C v Bwith
'6ZAG =(w-v) AF[AC + (v-u) '&'LAC -(w-u) &F'AC (3)v U W
(FB w-vi AFfC + (v-u) AFBC- (w-u) AFfBC (4)FZ BBC
U uW
Mixing Terms:
(A, B )C (XA) X A+xBl
AFmL~r
(A. B) 2m (x'A) X;,+xj
A Fmix X1(tt + x' =(AIB)G 'vim B
The partial quantities Sr mliLx are related to the integral terms by:
-mixAC '01m + xB
v TA
~A 2M B _"R'
-mix 3FAG 1 3m B -5r-r- I
w A
A-1

ZAGM" (VU mE7ix + (w-v) diAC - (w-u) Z&rc'
=(w-Ufl +(w-V)~ (W-u)jO ±(w-u)x "n'3m Im 2m BX A~**~
'IM -u(5)A TxA
The analogous calculation performed for the component B yields:
~jmi =(w-u) 4p +(w-v) lm(w-u) + ('A'-u) xl'
+(w-v) x (Wrn X m (6)A xB B ,r
From the gradient condition we derive:
I~ L (A.B)C7I
TpT, p T, p
AF[(A, B)C z A 'FAC x1 £BCU + Vr
4£f(A, B)GC xA fAC + x"F.,C
"FfA,])C = X" AFA + x"' A CF + p3w(,) A B w m1
Differentiation and rearrangement of the terms yields:
fAG- BC+ AG- BC + (7)' A u " [ u A T x f A v A f v *
IA -2.

A1fAC A 1r 2B± + fBx (8)Ac v v + A w w A
Combining equations (1) and (2), with (5) and (6), and rearranging the terms,
we obtain
%i *AlXLA ) -'BlXtB} = AFZAC -AFz.Bc +Iv-u) r +(wv) 8 in -(wu) '
v v xA Ar A"
Su,)stituting for -r and T from equations (7) and (8) yields:TA TxA
A XiA) B(xA) = FzAc zB +(v-u) ("FfAc - FBc -FAc +F I-v V U U W W
-(W-u)( F -A -AF + AZBC
FLAG -6fBC fAGU U V V
From relations (3) and (4) follows immediately, that the last two terms in the
equation above are equivalent to AFzBG - AFZA C ; hence,v v
AlXLA) - OB~xiB) = 0or
,A(XiA) =B(X!B)
I.- A-3

APPENDIX II
Collection of the Most Recent Phase Diagrams for Binary Transition Metal-
Carbon, and Transition Metal-Boron Systems.
A07+150 I
2800 2776± 6
2400 / -o
UU2000 TiC
1.5 + 0""' 668±- 1650+ 5 °
E- 1600_ - -Ti 32.0 + 1.
I ~ ~-,48. 8
12oo, _...,, _III I 1 10 10 20 30 4C 50 60 10
Ti ATOMIC o CARBON
Figure 66. Constitution Diagram Til. niurn-Carbon. I(E.Rudy, D.P. Harmon, and G.E. Brukl, 1965)(31) I
A-4
I

r"II
3420'36 -46%
3400
3200 38.5 4 8.9
*1 -300
52800
-260G
2400
2200 J J.Farr
2000 38.57'"% 18600
f I 1 ,., 1 1
0 i0 20 30 40 50 60 70 so(Zr ATOMIC % CARBON
Figure 67. Constitution Diagram Zirconium-Carbon.
(R.V.Sara, C.E. Lowell, and R.T. Doloff, 1963 and 1965)
A-5
I

f -
F
1.I
4000 -48.5
-- /" / - \,F3600 / / I 0
30fH65
5±o.3 311
5~o I lti _ 0- H f n2400 k1.5 2360+- 300"4.
2218±6 14 I 34t I
2000 2160110*j
IV, 37.5 -
0 10 20 30 40 50 60 70Hf Atomic % C i-
Figure 68. Constitution Diagram Hafnium-Carbon. :
(E. Rudy, 1965) ( 3 4 )
I
A-6
_____

F,
(I3000/
-2500 265 -22650
2000 1888" ' "
1500 1 0
V 0.1 0.2 0.3 0.4 0.5 0.6 0.7 0.8 0.9 1.0CN MOLE RATIO
Figure 69. Constitution Diagram Vanadium -Carbon),
(E.K. Storms and R..J. McNeal, 196Z) ( 3 5)
3500-/30±0
3000- L3005 605
00 02340±20
2 0 0 0 _+ 2 °E
1500
1000
.500 I i t
NbT" 10 20 30 40 50 60 70
Atomic Percent Carbon
Figure 70. Conotitution Diagram Niobium-Carbon
(H. Kimura and Y. Sasaki, 1961)(36)
Note: The order-disorder reaction of the NbC-phaseat - Z450*C (36)is not recorded in the diagram.
[A-7

3983. 150 I47 +-0. 5
250 Ta49 4-a
304'61 0.
O0 0 3 0 0 6 0 8
Ta0 - ATMCTCABN -
-21801200C8
-19_0P_49.8
150_ _t _ _R 2_ _ _ _
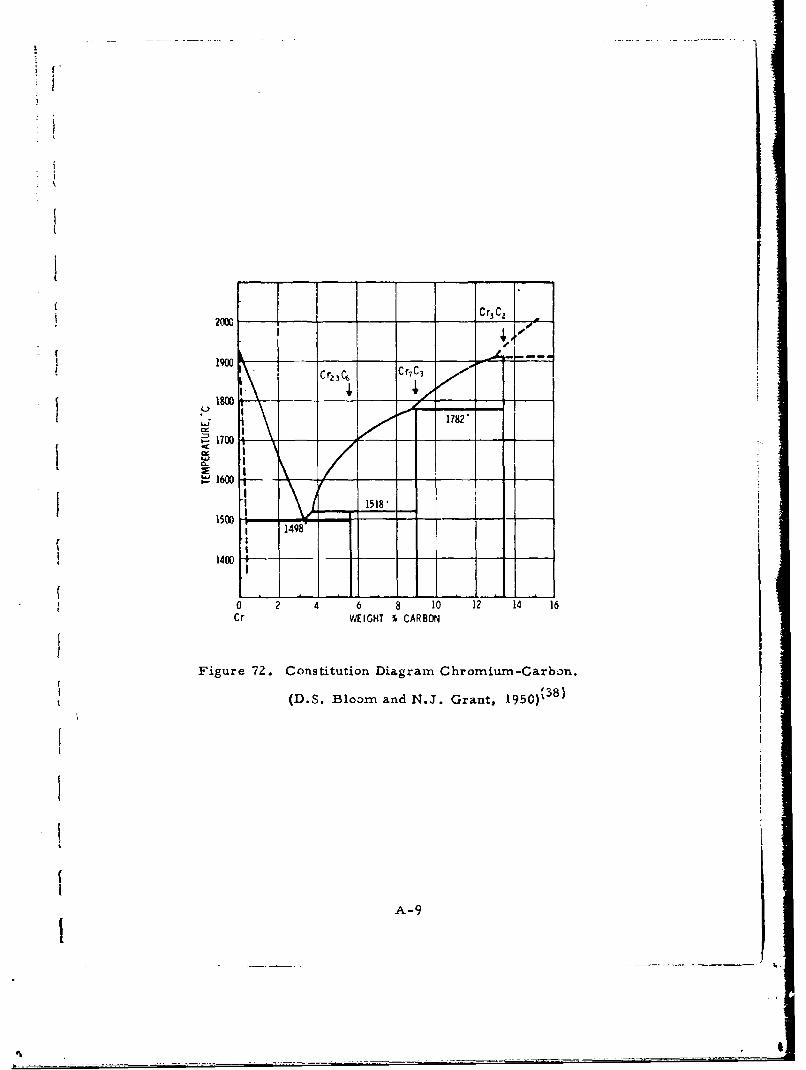
2000 ___Cr 3 C,
1900
S1700
~1600 _ ___
1400 4- _
0 2 4 6 8 10 12 14 16Cr WEIGHT %o CARBON
Figure 72. Cosiut i a~ram :ChoiumzGaban
A-9

r
|
33..6; 25 4 5 8
2800[383 . 3; 25t10 3 S ' 39.3 -12564. -$5
26 4: 25 2 5 - 42 2600 -_ 5'
31 8; 48 43 254 5
2400 4
. 4M
(E.00 10CI g1600 "'# "M CI-x
I 0.
A-10I
-"" _ _ _ _ Mo - .

I
3600-
30,3423 t I00
3200• \2747 .8 -/ L cS3000 L
! 2735-t 60S W L 2776t 5* . 227+4
f 2800 -3141/ 2776 '4*---7
o7 -WCi (cub) 50
-2C 2530120
Ct,- W 2 C --2200 - " -
r0
i I I 'I I
I0 20 30 40 50 60- Atomic %' Carbon -
Figure 74. Constitution Diagram Tungsten-Carbon.
(E. Rudy, St. Windisch, and J. R. Hoffman, 1965) (3 9 )
[--11
Ij. A -If
_ _ _ _ _ _ _ _ _ _ _ _ _ _ _ _ _ _ _ _ _ _ _ _ _ _ _ _ _ _ _ _ _ _ _ _ _ _ _ _ _ _ _ _ _ _ _ _ _ _ _ _ _ _ _ _ _ _ _ _ _ _ _ _ _ _ _ _ _ _ _ _ _ _ _

208 20 21 01r10 ..Iii
+ 0 TiB 7BP-TI.
II1500 1
0 20 40o 60 80 100
Ti ATOMIC % BORON B
Figure 75. Constitution Diagram Titanium - Bo:on. I(E. Rudy and St. Windisch, 1965)(40)
A-Z-

I
3245 +180~66%
I il' -' 2500
20 t 400 -98% -
20 0 -1 210?20O 1876 ZrB1
/1660±150 1710±L150
1500 <1 is 90!.-- Zr ZrB2
1000 a0 ± 150
872 I I I I I I0 20 40 60 80 100Zr ATOMIC % BORON B
Figure 76. Constitution Diagram Zirconium-Boron.
(E. Rudy and St. Windisch, 1965)(41)
A
IiI.
[A-13

I 33803500 3380+20.
-66%
-'3000 -
//210C1
-2500 2218 / HfB z \
203X D 2% 210202065±150[2% 1880± 150 HfB(B2T -9gg%/
1800 c -Hf 80 0+ 150 F.0 20 40 60 80 100
Hf ATOMIC % BORON B
Figure 77. Constitution Diagram Hafniumn-Boron. I
(E. Rudy and St. Windisch, 1 9 6 5)(4Z)
I
A-14

2747 *150
2800 2610.- 120 -~66
2600
2400
00
~-22200
S2000 1926 50 8
1800
1600
13
0 20 7 40 60 80 100V B
ATOMIC BORON
Figuxre 78. Constitution Diagram Vanadiunm - Boron
(E. Rudy and St. WindLach, 1965) (43)
[A- 15
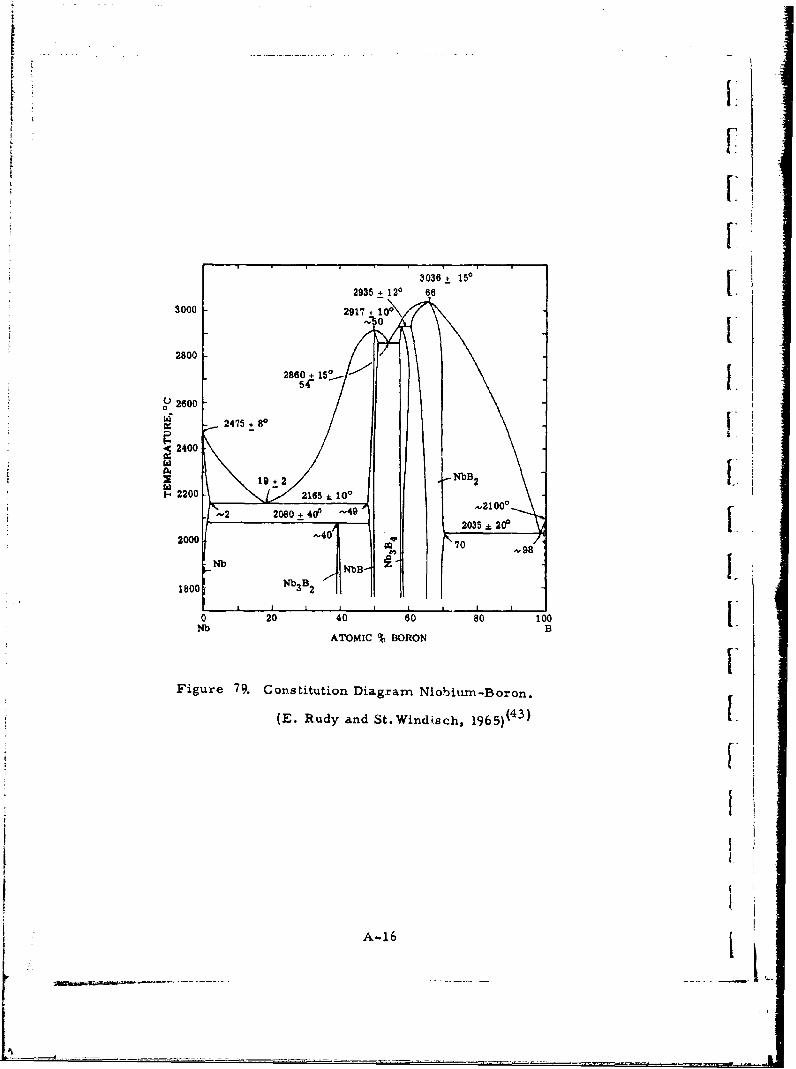
II FI
3036+ 1502935 + 120 66
2800
2860 + 15054-
S2600
2475,80
2400
19+2 NB1- 2200 2165 100
,2 2080 + 400 -49- K----2035 z± 20f
2000 -40 70 ,-98
1800 Nb 3 B2
0 20 40 60 80 100Nb B
ATOMIC % BORON
Figure 79. Constitution Diagram Niobium-Boron.
(E. Rudy and St. Windi.sch, 1965) (4 3 )
I
A-16
__1

3090 + 150$J. M. Leitnaker. 1960 "50 3037 200
3000
3030. 30O-- 2990 20*
2800 -
2600
2415 15540
2 23 - I TaB
2201 Ta2B /"2180 2d 20% 2
2040 + 30P 2055 ISP
2000 1 ,-,30 74S
1800 Ta 3 B2
Ta ATOMIC BORON B
Figure 80. Cor.stitution Diagram Tantalum-Boron
(E. Rudy and St. Windisch, 1965) ( 4 3 )
[
~A-17

T I1.
[
CrsB 3 [rBICr 3 BAI-
24100 C 2 r
Cr4B lit
I
41200- I900 - ..
0 20 40 60 80 100 ICr
-ATOMIC % B *
i
Figure 81. Constitution Diagram Chromium-Boro_
(H. Nowotny, E. Piegger, R. Kieffer, and F.Benesovsky,1958),(44)
A- 18j
%f
I
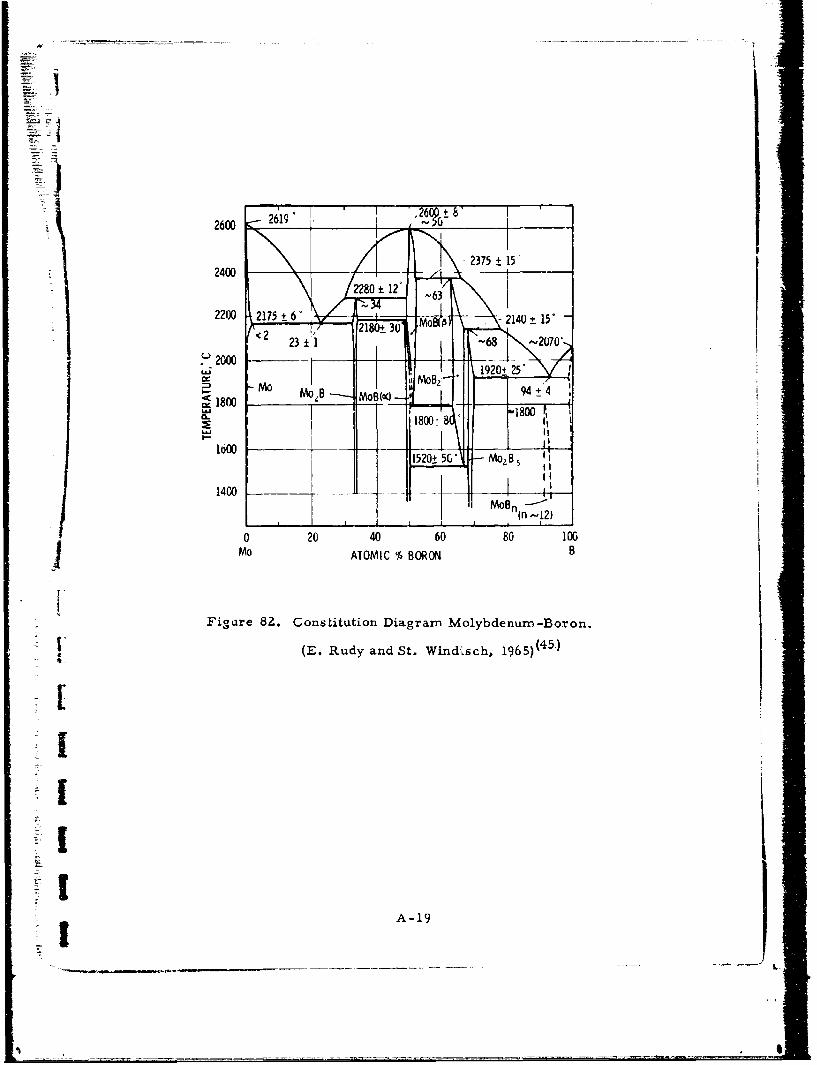
IA
2600 ;7--1'__ _
2400 ~J1 '3 -27±5
22000 2116 12 63
22 2 2175 6103 MAP) 2140 15
*~2 11__ - - 6 ~ 2070'
it o~r 1920t±25'
~1800 Ma MOZB jMoB(cQ_ --
1400 __ I_ _
00 40 20 60 8 0
Mo ATOMIC 11 BORON B
Figyure 8Z. Constitution Diagram Molybdenum -Bo-ron.
I (E. Rudy and St. WindLsch, 1965)(45.)
A-19

i
r
i
3400 3423 -20c
3200
267+ 12128 0O ~ .5 2665 12 0
CL 43, ± 1o\\
20 _B2
0 20 40 20W -ATOMICBORON B
[IFigure 83. Constitution Diagram Tungsten-Boron.
(E. Rudy and St. Windisch. 196 5) i
II =t
A-20

DOCUMENT CONTROL DATA . R&D(S4curily caiaalflcstion of title, body of abstrci and indefllE alotat10n must be entered vshan the oVYrall report 1e cl0 Iesifid)
ORIGINATING ACTIVITY (Comporato author) am. REPORT SECURITY C LAISIPICATION
Mater lals Re search Laboratory UnclassifiedAerojet-General Corporation 2b GROUPSacrarmento, California N. A.
REPORT TITLE
Ternary Phase Equilibria in Transition Metal-Boron-Carbon-Silicon Systems
PartIv. Thermochemical Calculations: Vol. 11. Thermodynamic Interpretation of4 DESCRIPTIVE NOTES (Typs of report and Inclusive date*) Ternary Phase Diagrams.
Documentary Report.S AUTHOR(S) (Lost nan e. first na.. initial)
Rudy, Erwin
S. REPORT DATE 7. TOTAL NO. OF PAGES 7b. NO. OF RKP$
January 1966 147 45
AF 33(615)-1249 AMLT-62h. PROJECT NO 7350 AFML-TR-65-Z
R 7Part IV, Volume II.
C Task No. 735001 9b. OTHER REPORT NO(S) (Any other numbrs dwal may be aastjn.dthis report)
d N.,A.0 AVAIL ABILITY/LIMITATION NOTICES
This document is subject to special export controls, and each transmittal to
foreign governments or foreign nationals may be made only with prior approval of
Metals & Ceramics Div.,AF Materials Laboratory, Wright-Patterson AFB, Ohio.
II SUPPLEMENTARY NOTES 12. SPONSORING MILITARY ACTIVITY
AFML (MAMC)Wright-Patterson AFB, Ohio 45433
13. A R TJOACT
"The equilibrium conditions for two-phase and three-phase equilibria in
ternary systems are derived from the minimum condition for the free energy,
and special solutions are discussed on model examples. The predictivecapabilities of the thermodynamic approach are demonstrated on a number ofrefractory carbide systems, and methods for the determination of phase stabilitiesfrom experimental phase equilibrium data are outlined. The thermodynamicdiscussions are supplemented by a general review'of recent phase diagramwork on refractory transition metal-B element systems/.
IF M11
1 JAN 64 73 UnclassifiedSecurity Classification
[I

UnclassifiedSecurity Classification_ __
14 LINK A LINK a LINK CKEY WORDS ROLK Wt SOLE WY ROLE WT
Phase Equilibria -
ThermodynamicsRefractory Alloys [
r
INSTRUCTIONS
1. ORIGINATING ACTIVITY: Enter the name and address imposed by security classification, using standard statementsof the contractor. subcontractor, grantee, Department of De- such astense activity or other organization (corporate author) issuing (1) "Qualified requesters may obtain copies of thisthe report, report from DDC " =2e. REPORT SECU14TY CLASSIFICATION: Enter the over- (2) "Foreign announcement and dissemination of thisall security classification of the report. Indicate whether"Restricted Date" is included. Marking is to be in accord- report by DDC is not authorized."ance with apprupriate security regulations. (3) "U. S. Government agencies may obtain copies of I
this report directly from DDC. Other qualified DDC2b. GROUP: Automatic downgrading is specified in DoD Di- users shall request throughrective 5200. 10 and Armed Forces Industrial Manual. Enterthe group number. Also, when applicable, show that optional rmarkings have been used for Group 3 and Group 4 as author- (4) "U. S. military agencies may obtain copies of thisized. report 4irectly from DDC Other qualified users
3. REPORT TITLE: Enter the complete report title in all shall request throughcapital letters. Titles in all cases should be unclassified.If a meaningful title carinor be selected without eljasifica- "lion, show title classificahicn in all capitals in parenthesis (5) "All distribution of this report is controlled. Qua-immediately following the title. ified DDC users shall request through
4. DESCRIPTIVE NOTES: If appropriate, enter the type ofreport, e.g., irterm, progress, summary, annual, or final. If ihe report has been furnished to the Office of TechnicalGive the inclusive dates when a specific reporting period is Services, Oapartnent of Commerce, for sale to the public, indi-covered. catse this fact and ealtr toe price, if known IS. AUTHOR(S): Enter the name(s) of author(s) as shown on IL SUPPLEMENTARY NO'1'i Use for additional explaro-or in the report. Enter last name, first name, middle initial. tory not"If military, show rank Pq.n branch of service. The name ofthe principal o.thor iS an absolute minimum requirement. 12. SPONSORING MILITARY ACTIVITY: Jnter the name ofthe departmental project otflcp or labloratory sponsoring (pay6. REPORT DATE Enter he date of the report as day, irg for) the research and development, Ir"lude address.month, year; or month, year. If more than one date appearson the report, use date of publication. 13. ABSTRACT: Enter an abstract giving a brief and factual
summary of the document indicative of the report, even though7. TOTAL NUMBER OF PAGES: The total pg: cout jt may also appear elsewhere in the body of the technical re-,
should follow normal pagination procedures, i.e., enter the Pori. If additional space is required, a continuation sheet shallnumber of pages containing information. be attached.
7b. NUMBER OF REFERENCES, Enter the total number of It is highly desirable that the abstract of classified reportsreferences cited in the report, be unclassified. Each paragraph -f the abstract shall end withBa. CONTRACT OR GRANT NUMBER: If appropriate, enter an indication of the military security classification of the in-the applicable number of the contract or grant unde, which formation in the paragraph. represented as (TS). (S), (C). or (U).the report was written. There s no limitation on the length of the abstracl. liow-Sb, 8c4 & ld. PROJECT NUMBER: Enter the appropriate ever. the suggested length is from 150 to 225 words.military department identification, such as project number,subproject number, system numbers, task number, etc. 14, KEY WOiJD.Q: Key words are technically meaningful terms
or short phrases that cheraC.: 'e a report and may be used as9a. ORIGINATOR'S REPORT NUMBER(S): Enter the offi- index entries for cataloging 'he repcrt Hr.v words must beciai report number by which the docutment will be identified selected so that no security classification is requ ."' Identi-and controlled by the originating activity, This number must fiers, such as equipment model designation, trade name, mtl.'be unique to this report. project code name, geographic location, may be used as key9b. OTHEtR REPORT NUMER(S : It the report hsa been words but will be followed by an indication of technical con-assigned any other report numbers (either by the originator text. The assignment of links, rules, and weights is optionsl.or by the sponsor), also enter this numberT().
10. AVAILABILITY/LIMITATIhN NOTICES: Enter any lim-itations on further dissemination of the report, other than those
Security Classification