Embed Size (px)
Citation preview

RUSSIAN JOURNAL OF EARTH SCIENCES, VOL. 8, ES5001, doi:10.2205/2006ES000208, 2006
To analysis of source mechanism of the 26 December2004 Indian Ocean tsunami
L. I. Lobkovsky1, R. Kh. Mazova2, I. A. Garagash3, L. Yu. Kataeva2, and I. Nardin2
Received 5 September 2006; revised 18 September 2006; accepted 5 October 2006; published 29 October 2006.
[1] Tsunami in the Indian Ocean generated by a strong earthquake in Sumatra-Andamanregion on 26 December 2004 led as known to catastrophic results at the coast of manycountries of this region. In spite of intensive study of this event by a number of groups,the character of seafloor displacements in the source during this earthquake remains tobe controversial. In this work, it is performed an analysis of physical aspects of similarearthquakes on the basis of keyboard model of tsunamigenic earthquakes. The numericalsimulation of generation, propagation and run-up of surface water waves on the basisof simplified keyboard model of tsunamigenic earthquakes with vertical displacementsof keyboard blocks in approximative geometry (without taking into account the realbathymetry) is also performed. It is obtained that tsunami waves generated by variouscombinations of keyboard block displacements are essentially different in character whichfact leads to quite different picture of maximum run-up distribution along the near-fieldcoast. It is performed the estimative computation for 26 December 2004 Sumatra-Andaman earthquake with taking into account of oblique character of the subductionzone characteristic for this earthquake. The computations performed explain the complexcharacter of run-up distribution at nearest to the source coasts and are in a good agreementwith run-up values at the Thailand coast. It is noted that such a model can account formore adequately the tsunami wavefield character in another regions of the Indian and thePacific Ocean basins as well. INDEX TERMS: 3060 Marine Geology and Geophysics: Subduction zone
processes; 3285 Mathematical Geophysics: Wave propagation; 4255 Oceanography: General: Numerical modeling;
7209 Seismology: Earthquake dynamics; KEYWORDS: tsunami generation, seismic source, wave propagation,
subduction zones, keyboard-blocks.
Citation: Lobkovsky, L. I., R. Kh. Mazova, I. A. Garagash, L. Yu. Kataeva, and I. Nardin (2006), To analysis of source mechanism
of the 26 December 2004 Indian Ocean tsunami, Russ. J. Earth. Sci., 8, ES5001, doi:10.2205/2006ES000208.
1. Introduction
[2] It is well known that 26 December 2004 and 28 March2005 in the Indian Ocean there occurred two earthquakes:the first one, with magnitude 9.2, produced a largest tsunamiwhich caused almost 300.000 deaths; and the second one,with magnitude 8.8, led to significant damages due to groundshaking but not produced a noticeable tsunami [for review,see, e.g., Lay et al., 2005]. Both earthquakes occurred in the
1P. P. Shirshov Institute of Oceanology, Russian Academy ofSciences, Moscow, Russia
2Nizhny Novgorod State Technical University, Nizhny Nov-gorod, Russia
3Institute of Physics of the Earth, Russian Academy of Sci-ences, Moscow, Russia
Copyright 2006 by the Russian Journal of Earth Sciences.
ISSN: 1681–1208 (online)
Indian Ocean west of the Sumatra Island and Thailand andthey are related to the same part of Philippine and Sundaisland arcs. Which cause is for so different results of earth-quakes at so close earthquake magnitude? And though thecause of absence of strong tsunami due to 28 March, 2005earthquake is not clear up to now, then it can be supposedthat the difference is connected with features of seafloor dis-placements in the earthquake source.
[3] As known, the formation of tsunami depends on char-acter and dynamics of displacements in earthquake sourcezone, i.e. on the initial seafloor displacements. As a rule,under computations of tsunami wave generation there areused the seismic data which indicate the rupture orienta-tion in the source and the energy of tsunami. Then, thestatic hydrodynamical problem on the recount of seafloordisplacement distribution to the ocean surface shape is con-sidered. Further, the obtained displacements of the watersurface with fixed length and height of the wave are takenas initial conditions and then it is performed the numerical
ES5001 1 of 17
ES5001 lobkovsky et al.: to analysis of source mechanism of tsunami ES5001
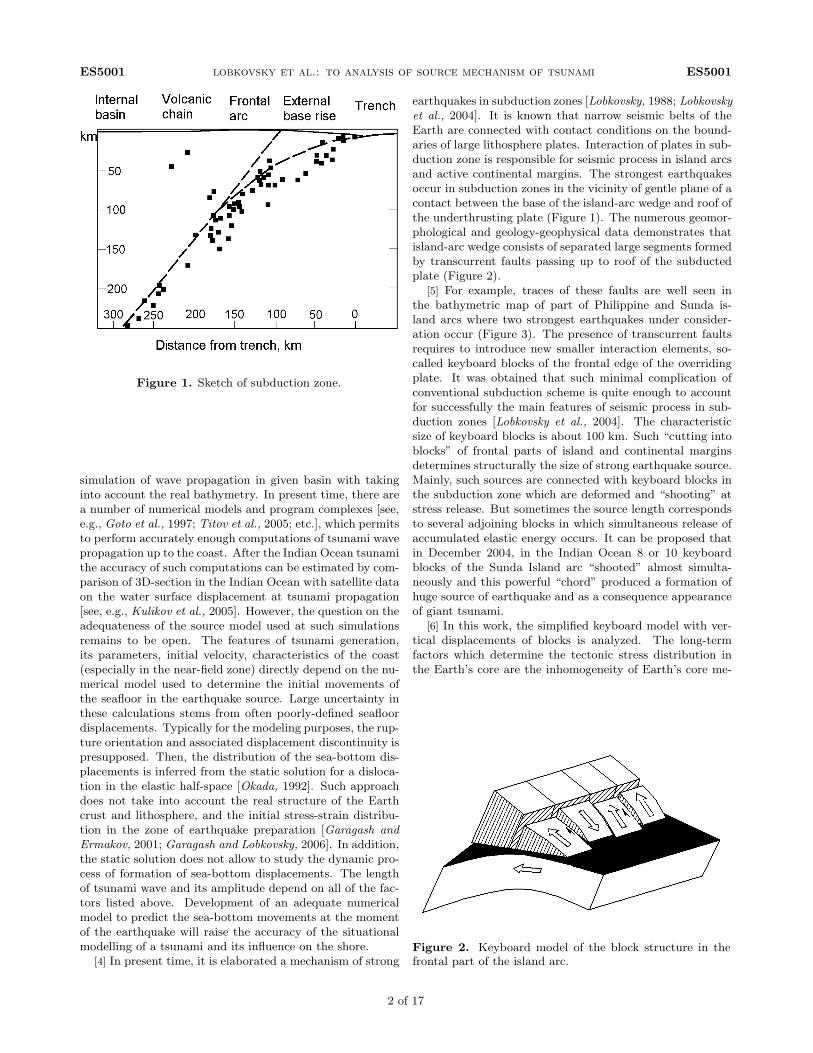
Figure 1. Sketch of subduction zone.
simulation of wave propagation in given basin with takinginto account the real bathymetry. In present time, there area number of numerical models and program complexes [see,e.g., Goto et al., 1997; Titov et al., 2005; etc.], which permitsto perform accurately enough computations of tsunami wavepropagation up to the coast. After the Indian Ocean tsunamithe accuracy of such computations can be estimated by com-parison of 3D-section in the Indian Ocean with satellite dataon the water surface displacement at tsunami propagation[see, e.g., Kulikov et al., 2005]. However, the question on theadequateness of the source model used at such simulationsremains to be open. The features of tsunami generation,its parameters, initial velocity, characteristics of the coast(especially in the near-field zone) directly depend on the nu-merical model used to determine the initial movements ofthe seafloor in the earthquake source. Large uncertainty inthese calculations stems from often poorly-defined seafloordisplacements. Typically for the modeling purposes, the rup-ture orientation and associated displacement discontinuity ispresupposed. Then, the distribution of the sea-bottom dis-placements is inferred from the static solution for a disloca-tion in the elastic half-space [Okada, 1992]. Such approachdoes not take into account the real structure of the Earthcrust and lithosphere, and the initial stress-strain distribu-tion in the zone of earthquake preparation [Garagash andErmakov, 2001; Garagash and Lobkovsky, 2006]. In addition,the static solution does not allow to study the dynamic pro-cess of formation of sea-bottom displacements. The lengthof tsunami wave and its amplitude depend on all of the fac-tors listed above. Development of an adequate numericalmodel to predict the sea-bottom movements at the momentof the earthquake will raise the accuracy of the situationalmodelling of a tsunami and its influence on the shore.
[4] In present time, it is elaborated a mechanism of strong
earthquakes in subduction zones [Lobkovsky, 1988; Lobkovskyet al., 2004]. It is known that narrow seismic belts of theEarth are connected with contact conditions on the bound-aries of large lithosphere plates. Interaction of plates in sub-duction zone is responsible for seismic process in island arcsand active continental margins. The strongest earthquakesoccur in subduction zones in the vicinity of gentle plane of acontact between the base of the island-arc wedge and roof ofthe underthrusting plate (Figure 1). The numerous geomor-phological and geology-geophysical data demonstrates thatisland-arc wedge consists of separated large segments formedby transcurrent faults passing up to roof of the subductedplate (Figure 2).
[5] For example, traces of these faults are well seen inthe bathymetric map of part of Philippine and Sunda is-land arcs where two strongest earthquakes under consider-ation occur (Figure 3). The presence of transcurrent faultsrequires to introduce new smaller interaction elements, so-called keyboard blocks of the frontal edge of the overridingplate. It was obtained that such minimal complication ofconventional subduction scheme is quite enough to accountfor successfully the main features of seismic process in sub-duction zones [Lobkovsky et al., 2004]. The characteristicsize of keyboard blocks is about 100 km. Such “cutting intoblocks” of frontal parts of island and continental marginsdetermines structurally the size of strong earthquake source.Mainly, such sources are connected with keyboard blocks inthe subduction zone which are deformed and “shooting” atstress release. But sometimes the source length correspondsto several adjoining blocks in which simultaneous release ofaccumulated elastic energy occurs. It can be proposed thatin December 2004, in the Indian Ocean 8 or 10 keyboardblocks of the Sunda Island arc “shooted” almost simulta-neously and this powerful “chord” produced a formation ofhuge source of earthquake and as a consequence appearanceof giant tsunami.
[6] In this work, the simplified keyboard model with ver-tical displacements of blocks is analyzed. The long-termfactors which determine the tectonic stress distribution inthe Earth’s core are the inhomogeneity of Earth’s core me-
Figure 2. Keyboard model of the block structure in thefrontal part of the island arc.
2 of 17

ES5001 lobkovsky et al.: to analysis of source mechanism of tsunami ES5001
Figure 3. The bathymetric map of Philippine and Sunda arcs.
chanical properties and its density variations [Lobkovsky etal., 2004]. At earthquake, initial stress distribution deter-mines essentially the character of motion in the vicinity ofthe earthquake source. The earthquake occurs when stressat any region of contact surface overcomes the breaking pointand the motion on it is accelerated. This process depend-ing on earthquake preparation process and the initial stresslevel will proceed quite differently. And at the same ver-tical displacements the tsunami waves generated by themwill be essentially different in character [Lobkovsky et al.,2005a, 2005b, 2006]. In first part of this work (Sections 2–4) it is considered a formation of tsunami source withouttaking into account the initial tectonic stresses in the earth-quake source. In second part of the work (Section 5) thereis performed evaluation of affect of initial stress in zone ofearthquake preparation.
2. Numerical Scheme to Modelthe Tsunami
2.1. Statement of the Problem
[7] The aim of this work is a numerical simulation of such aprocess in the tsunami source which would be a most relevantto possible motions occurring in the vicinity of earthquakesource during the first minutes after starting of the earth-quake. The process was modelled by vertical displacementsof rectangular keyboard blocks with height B (Figure 4).The keyboard block size varied from 50 km to 150 km longand of 50 km wide. The number of keyboard blocks wasvaried from 3 to 8. In this work, the simplified keyboard
3 of 17

ES5001 lobkovsky et al.: to analysis of source mechanism of tsunami ES5001
Figure 4. Geometry of generation and run-up of waterwave at the sloping beach.
model with vertical displacements of keyboard blocks is an-alyzed, horizontal movements of keyboard blocks were notconsidered because of technical complexity to realize numer-ically the horizontal displacements of the order of 10 m forkeyboard blocks, 50 km wide. It is considered a model prob-lem of tsunami wave generation by dynamical source, itspropagation and run-up on the sloping beach. The source
Figure 5. The example of successive block motion in earthquake source (a); The example of generationof surface water wave by seismic source: (b) for two time moments, (c) the view from upper point.
is modelled by seafloor vertical displacements of keyboardblocks with given vertical velocity for each block. For thefirst set of computations, the source was located at the dis-tance of 100 km from a beach being parallel to the coastline.The water height above the source was taken to be equalto H = 1 km. There was considered the wave propagationalong even bottom in approximative geometry and run-upon a sloping beach (Figure 4).
2.2. Governing Equations
[8] To describe the process of wave generation and prop-agation in correspondence with above assumptions it wasused the nonlinear system of shallow water equations (1),
∂η
∂t+
∂
∂x
((H + η −B) · u
)+
∂
∂y
((H + η −B) · v
)= Bt
∂u
∂t+ u
∂u
∂x+ v
∂u
∂y+ g
∂η
∂x= 0
∂v
∂t+ u
∂v
∂x+ v
∂v
∂y+ g
∂η
∂x= 0
(1)
4 of 17

ES5001 lobkovsky et al.: to analysis of source mechanism of tsunami ES5001
Figure 6. Successive motion of keyboard blocks in tsunamigenic earthquake source: the case of thesame sizes blocks (a) and the case of blocks with different sizes (b).
where η is the surface elevation, u, v are the horizontal (x, y)particle velocity components of the wave motion, H is theundisturbed depth of the water, B(t) is the seafloor defor-mation (seafloor displacement relative to initial position),g is the acceleration due to gravity [cf. with Garagash etal., 2003]. The equations (1) were approximated by differ-ence scheme according to [Sielecki and Wurtele, 1970]. Itwas used computation grid with space intervals ∆x, ∆y andwith time step ∆t. The tsunami wavefield was computed ona Cartesian coordinate system. The size of the calculatedregion corresponds to 2400 km×2400 km. The size of com-putation grid was equal to 6.6 km. The computation wasmade every 10 s satisfying the Courant stability condition.
3. Numerical Simulation of TsunamiGeneration, Propagation and Run-up:Keyboard Model of Source (DirectSubduction Zone)
[9] There was considered a dynamical source consistingof 5 rectangular keyboard blocks. In first set of computa-tions keyboard blocks with the same size 100 km×50 km(Figure 5) were taken. In a second set of computations,lengths of corresponding five blocks were taken to be equalto 50, 100, 150, 50, and 150 km, respectively, and the widthof all blocks was the same and equal to 50 km (Figure 6).Thus, source length for both sets of computations was equalto 500 km. The value of vertical displacement (upwards ordownwards) of keyboard blocks from initial position, at wa-ter depth equal to 1000 m, was taken to be equal to 3 m foreach keyboard block in both sets.
[10] The following scenarios were considered:
• uplift of first to fifth blocks, successively, one af-ter another with the same velocities (0.05 m s−1 or0.075 m s−1 or 0.15 m s−1);
• uplift of first to fifth blocks in various sequence butwith the same velocities (0.05 m s−1 or 0.075 m s−1
and 0.15 m s−1);
• uplift of first to fifth blocks in various sequence butwith different velocities;
• vertical displacement of blocks upward or downwardin various sequence but with the same velocities(0.05 m s−1 or 0.075 m s−1 or 0.15 m s−1);
• uplift of first to fifth blocks but the motion of eachnext block begins before stopping of preceding one.
[11] Variations of these five scenarios are presented inTable 1.
[12] From Table 1 it is seen that value of run-up on abeach depends on the distance between the source and thecoast (lines 2.2; 2.4; 2.5 in Table 1), on the velocity of blockvertical motion in the source: slower motion, smaller run-up (lines 1.1; 1.2 in Table 1), and on the block size: atthe same source (500 km long), its cutting to 5 blocks withlengths of 50, 100, 150, 50, and 150 km (with maximumsize 150 km×100 km) leads to run-up increase from 3 m to4 m (lines 1.2; 2.1 in Table 1), as compared with cutting ofthe same source to 5 equal blocks with size of each block100 km×50 km (Figure 6). It is also seen that if the motionof the next block begins before stopping of preceding onethen run-up value Rmax increases to 20 percents, and run-down value Rmin increases into 1.5 times (lines 1.1; 1.3 inTable 1).
3.1. Vertical Displacements of Keyboard Blocks inthe Source Only Upwards
[13] The analysis of the results obtained permits to sepa-rate them on two characteristic features. To the first group
5 of 17

ES5001 lobkovsky et al.: to analysis of source mechanism of tsunami ES5001
Table 1. Variations of Five Scenarios
no. The behaviour of blocks Displacement value Motion time of Time of overall Rmax Rmin
of one block (m) one block (s) process (s) (m) (m)
1.1 Successive motion 3 20 120 3.8 2.5of blocks upward
1.2 Successive motion 3 60 180 3 2.1of blocks upward
1.3 Successive motion of blocks upward.Motion of next block begins before 3 20 120 4.6 3.6stopping of preceding one
1.4 Motion of blocks up fromcenter in following sequence:3 block, 3 402 block, 3 204 block, 3 60 200 3.9 2.61 block, 3 205 block 3 60
1.5 Motion of blocks up from center 3 20 120 4.0 2.5to edges of the source : 3, 4, 2, 5, 1.
1.6 Successive motion:1, 3, 5 blocks upward, 3 20 120 4.2 4.22, 4 blocks downward
1.7 Successive motion up3 block 3 402, 4 simultaneously 3 40 120 3.8 2.61, 5 simultaneously 3 40
no. The behaviour Displacement value Motion time Distance Time of the overall Rmax Rmin
of blocks of one block of one block from the beach rupture process (m) (m)(m) (s) (km) (s)
2.1 Successive motion 3 60 100 300 4.0 2.8of blocks upward
2.2 Successive motionof blocks; 3 20 100 300 4 5.22, 5 blocks downward
2.3 Successive motionof blocks; 1, 2, 5 3 20 100 100 4.3 5.5blocks downward
2.4 Successive motionof blocks; 2, 5 3 20 50 100 5.5 4.3blocks downward
2.5 Successive motionof blocks; 2, 5 3 20 100 7.5 4.0blocks downward
2.6 Successive motionof blocks upward: 3 60 100 300 4.0 3.03, 4, 2, 5, 1
there are related events in which keyboard blocks in theearthquake source move only upwards (see, Table 1). As anexample, let us consider events for lines 1.1 and 2.6. Figure 7presents a space-time picture of behaviour of moving shore-
line for 600 km part of the coast for these cases. There arewell seen two wave fronts coming to a beach. The first frontreaches the beach nearly after 25 min from the onset time ofwave propagation from the source. And, at the same value
6 of 17

ES5001 lobkovsky et al.: to analysis of source mechanism of tsunami ES5001
Figure 7. Space-time picture for the moving shoreline. y-axis is directed along the coast, height scaleis in meters. (a) blocks of the same size, (b) blocks of different size.
of keyboard blocks (see Figure 5), first wave comes as con-tinuous front and it reaches the beach near simultaneouslyalmost in all points of the coast (Figure 7a). In the secondcase, the bend of the wave front is connected with differentkeyboard block size in the source and with sequence takenfor the motion of blocks (Figure 7b). The second run-upwave front (Figure 7) is of more complex shape with alter-nation of crests and troughs along all the 500 km wave front.Such shape of front is formed depending on sequence of key-board block motion in the source and on different velocityof their vertical motion.
[14] Figure 8 presents a distribution of maximum and min-imum run-ups Rmax at the coast for cases considered. It
Figure 8. Distribution of maximum and minimum run-ups along 600 km part of the coast; y-axis isdirected along the coast; Rmax is a maximum run-up; Rmin is a maximum run-down.
is well seen that for both cases maximum run-up Rmax isabout 4 m and maximum run-down from a beach Rmin isnear 2.8 meters. However, distribution of maximum run-up values along the coast is essentially different for eachcase considered. So, in the case of motion of the same key-board blocks the maximum run-up is practically uniformlydistributed along the coast with divergence of 10–17 per-cents (Figure 8a). Quite different situation arises for distri-bution of maximum run-ups in the case of upward motion ofkeyboard blocks with different sizes. The maximum run-upvalue distribution along the coast is between 0.5 m and 4 m(Figure 8b). The maximum values of water run-down froma beach Rmin along the coast differ in 3.5 times.
7 of 17

ES5001 lobkovsky et al.: to analysis of source mechanism of tsunami ES5001
Figure 9. Space-time picture distribution of maximum wave run-up along shoreline for tsunami sourceconsisting of keyboard blocks of the same size (Figure 6a); successive motion of blocks in the source:a) 2D simulation; b) 3D simulation.
3.2. Vertical Displacements of Keyboard Blocks inthe Source Upwards and Downwards
[15] Quite another picture appears when there is presentedthe motion of keyboard blocks upward as well as downward.In Figure 9 it is presented an example of space-time picturefor the case of vertical motion in the source of equal blocks,when 1, 3, 5 blocks are removed upward to 3 meters, and 2and 4 blocks are displaced downward also to 3 meters (line1.4 in Table 1). In this case, there appears a quite anotherpicture of distribution of crests and troughs at the wave run-up on a beach. There are well seen three wave fronts. Firstof them is an insignificant run-down in ones points and a
Figure 10. Space-time picture distribution of maximum wave run-up along shoreline for tsunami sourceconsisting of keyboard blocks of the different size (Figure 6b); successive motion of blocks in the source:a) 2D simulation; b) 3D simulation.
small run-up in another ones. The next wave front is al-ternation of maximum run-down Rmin (vertical component)and run-ups Rmax between −4 m and 4 m height. And thirdfront with scattering of these values between −3 m and 3 malso is an alternation of crests and troughs. At analogous se-quence of displacements but for keyboard blocks of differentlengths it appears a very similar picture (Figure 10). Here,most values of run-up on the coast are for waves of the sec-ond front while most run-down is for waves of the first front.In the first place, it can be related to the waves generatedby keyboard block downward motion since at various com-binations of blocks in the source the depression wave can befollowed by the elevation wave with larger height than thatgenerated by motions of blocks only upwards [Mazova and
8 of 17

ES5001 lobkovsky et al.: to analysis of source mechanism of tsunami ES5001
Figure 11. Propagation of surface water wave under rupturing in the source along the subduction zone.
Ramirez, 1999]. It is necessary to note that at rupture pro-cess in the source of tsunamigenic earthquake, surface waterwave comes towards rupture spreading with velocity deter-mined by that of vertical motion of keyboard blocks alongthe subduction zone. The wave generated by such sourcesimultaneously comes along the subduction zone and prop-agates from source with different velocities.
[16] In Figure 11 it is presented the propagation of sur-face water wave along the source at rupturing in the sourceduring the earthquake.
[17] The analysis performed demonstrates that at motionof keyboard blocks in the earthquake source the sequenceof their displacements, the change of the keyboard blocksize in 1.5–2 times, and the change of rise velocity in twotimes provides only insignificant change of the run-up value.However, the distribution of maximum run-ups and maxi-mum run-downs along the coast is essentially different, thisdifference can be of up to 8–10 times.
4. Numerical Simulation of TsunamiGeneration, Propagation and Run-up:Keyboard Model of the Source (Oblique(Sumatra-Andaman-Like) SubductionZone)
[18] The above performed study was then applied underanalysis of tsunami wave generation due to the 26 December2004 Indian Ocean earthquake. The earthquake source waslocated west of Sumatra Island northward along the oceanicsubduction zone. The extent of the source was estimatednear 1000 km [see, e.g. Lay et al., 2005].
[19] In this work, there are considered two possible scenar-ios of seafloor motions in the earthquake source (subductionzone) for geometry close to that of oblique subduction zone(Figure 3) in the source of Sumatra-Andaman earthquake[cf. with Lobkovsky et al., 1991]. These motions were ap-
9 of 17

ES5001 lobkovsky et al.: to analysis of source mechanism of tsunami ES5001
Figure 12. Modelling of the source of tsunamigenic earthquake 26 December 2004 by motion of threekeyboard blocks rising along the subduction zone one after another from south to the north (a); space-time picture of the moving shoreline(b). Maximum run-up is equal to Rmax = 9.5 m, run-down Rmin =7.5 m.
proximated by motion of several keyboard blocks with differ-ent size. The location of the source relative to the SumatraIsland and Thailand beaches, the ocean depth in the sourcezone, extent of the near-coast zone (slope length and shelfslope angle), as well as possible parameters of the earthquakeprocess were taken into account at given simulation. It wasconsidered a run-up on a plane slope. However, modelnessof the problem is that it was not taken into account thereal bathymetry of the ocean and estimations were made forwave propagation on the even bottom. Such approach corre-sponds to small-scale tsunamizonation when ocean bottomrelief can be considered as smoothed one [Soloviev et al.,1977]. It was mainly considered run-up at the nearest tothe earthquake source beach corresponding to the Thailandcoast.
4.1. Source Consisting of Three Keyboard Blocks
[20] The location of the first keyboard block with size400 km×150 km corresponds to the region of northwestof Sumatra Island where the first strongest quake occurs.Second keyboard block 300 km long is of width decreasingfrom 150 km to 100 km northward. Third keyboard block isalso of 300 km long, and the width is decreased from 100 kmto 50 km. The keyboard blocks moves successively: firstshifts upward to 9 meters, second shifts downward to 3 me-ters, third shifts upward to 5 meters. The entire time ofblock motion is equal to 330 s. Figure 12 shows the locationof keyboard blocks (a) and space-time picture of the mov-ing shoreline (b). Animation 1 (see online version) showsdynamics of wave generation, propagation, and run-up onthe beach. It is well seen that to a beach it comes a wavetrain: two large waves which are followed by a strong searecession. Then, in addition, three waves are followed them.
First front comes in nearly 1.5 hours after the beginning ofthe motions in the source. Its height is not very large, up to3 meters. Then, 20 min later, it comes the wave with height9.5 meters. It is followed by alternating wave run-ups andrun-downs with somewhat smaller height (depth).
4.2. Source Consisting of Eight Keyboard Blocks
[21] The location of the first keyboard block also corre-sponds to northwest Sumatra Island and is 300 km long whileall another blocks are 100 km long and 150 km wide. Thekeyboard blocks moves successively in the following order:
Block Block Vertical Shift Motionlength, km shift value, m time, s
1 300 km upward 7 602 100 km upward 3 403 100 km downward 3 604 100 km upward 4 505 100 km upward 2 306 100 km downward 2 607 100 km upward 3 408 100 km upward 2 60
Figure 13 shows the location of keyboard blocks (a) andspace-time picture of moving shoreline (b). Animation 2(see online version) shows dynamics of wave generation withscale of maximum run-up on the beach and 9 fragments ofsurface water wave generation. It is well seen that givenparameters of keyboard blocks in the earthquake source leadto one significant wave run-up on the beach and essentialrun-down and then to several more weak waves. Maximumrun-up in this case is equal to 11 meters.
10 of 17

ES5001 lobkovsky et al.: to analysis of source mechanism of tsunami ES5001
Figure 13. Modelling of the source of tsunamigenic earthquake 26 December, 2004 by motion of eightkeyboard blocks moving along the subduction zone one after another from south to north (a); space-timepicture of the moving shoreline(b). Maximum run-up is equal to Rmax = 11 m, run-down Rmin = 10 m.
[22] The further performed numerical simulation of thesurface water wave generation by motions of keyboard blocksin the source of given earthquake demonstrates that under
Figure 14. Sketch of the computational model subductionzone.
keyboard block motion in the source from south to north,along the subduction zone, the keyboard block sizes and ve-locity with which they move upward (downward), as well asvelocity with which this motion comes along the subductionzone are the essential factors.
5. Influence of Initial Stress Distributionin Zone of Earthquake Preparation toTsunami Formation
5.1. Analysis of Initial Stress Distribution inSeismic Source
[23] The distribution of initial stresses can affect the char-acter of the motion in the vicinity of a seismic source. It canbe demonstrated by the example of the plain-strain problemfor the keyboard model (Figure 2). The material of keyboardblock as well as moving and frontal plates is considered tobe an elastoplastic medium with given parameters and sat-isfying the Mohr-Coulomb yield criterion. The velocity dis-tribution in the bottom of the moving plate (Figure 14a) isdictated by the slow mantle motion. This velocity is causingthe accumulation of elastic stresses in the system. On thecontact of the plate and keyboard block the dry friction forceacts. An earthquake occurs when stresses on a local area ofthe contact surface exceed the strength limit and resultingslip (Figure 14b) is accelerating. Since the dynamic interfacefriction is less than the static friction, the dynamic frictionalresistance falls sharply and the earthquake occurs. This pro-cess depends on the interseismic time and the level of theinitial stresses which were achieved before the nucleation ofthe seismic motion and can be highly variable. In the case
11 of 17

ES5001 lobkovsky et al.: to analysis of source mechanism of tsunami ES5001
Figure 15. Distribution of the maximum shear stress for small (a) and large (b) time of elastic energy accumulation.
Figure 16. Distribution of residual displacements for the short (a) and long (b) time of elastic energy accumulation.
of small time of preparation, relatively small shear stresses(Figure 15a), residual friction angle value (e.g. of 8.3◦), thedisplacements in the earthquake source (Figure 16a) will beoriented in the direction of the plate movement. Otherwise,
Figure 17. Time plots of vertical displacement (a) and vertical velocity (b) of sea bottom during theearthquake.
in the case of large time of preparation and the greater levelof initial shear stresses (Figure 15b), the displacements willbe oriented in the opposite direction (Figure 16b). Thoughthe maximum vertical displacement of the sea bottom in
12 of 17
ES5001 lobkovsky et al.: to analysis of source mechanism of tsunami ES5001
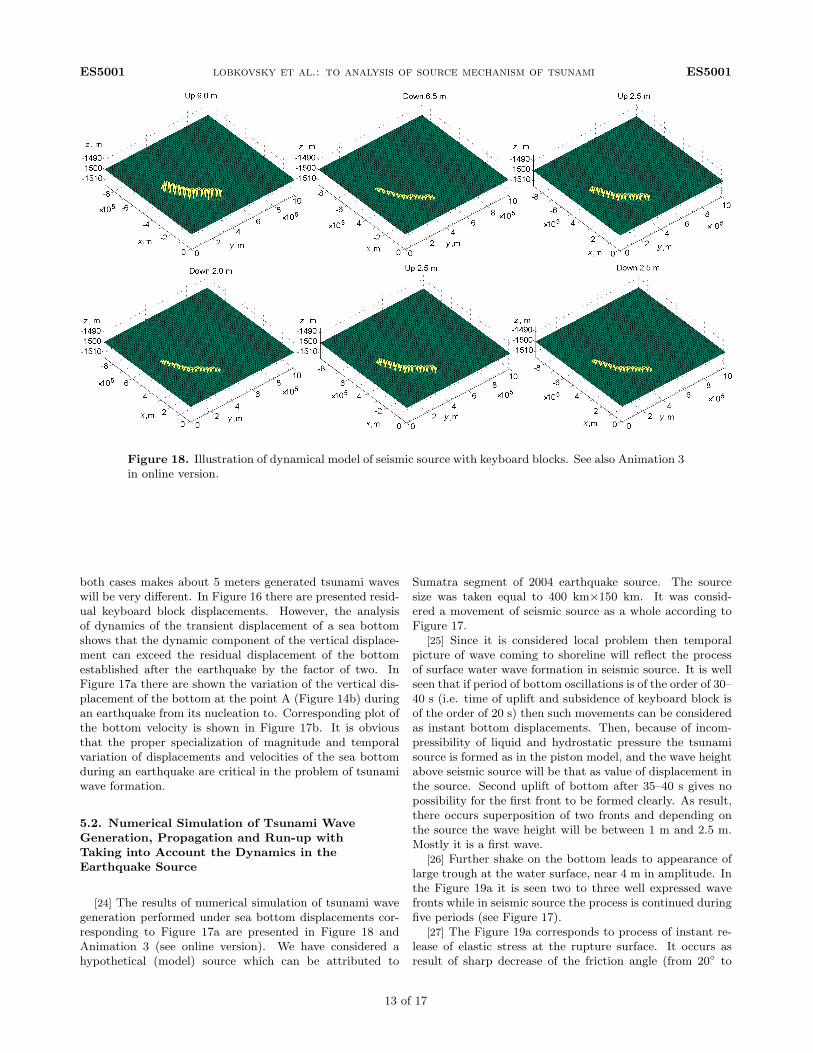
Figure 18. Illustration of dynamical model of seismic source with keyboard blocks. See also Animation 3in online version.
both cases makes about 5 meters generated tsunami waveswill be very different. In Figure 16 there are presented resid-ual keyboard block displacements. However, the analysisof dynamics of the transient displacement of a sea bottomshows that the dynamic component of the vertical displace-ment can exceed the residual displacement of the bottomestablished after the earthquake by the factor of two. InFigure 17a there are shown the variation of the vertical dis-placement of the bottom at the point A (Figure 14b) duringan earthquake from its nucleation to. Corresponding plot ofthe bottom velocity is shown in Figure 17b. It is obviousthat the proper specialization of magnitude and temporalvariation of displacements and velocities of the sea bottomduring an earthquake are critical in the problem of tsunamiwave formation.
5.2. Numerical Simulation of Tsunami WaveGeneration, Propagation and Run-up withTaking into Account the Dynamics in theEarthquake Source
[24] The results of numerical simulation of tsunami wavegeneration performed under sea bottom displacements cor-responding to Figure 17a are presented in Figure 18 andAnimation 3 (see online version). We have considered ahypothetical (model) source which can be attributed to
Sumatra segment of 2004 earthquake source. The sourcesize was taken equal to 400 km×150 km. It was consid-ered a movement of seismic source as a whole according toFigure 17.
[25] Since it is considered local problem then temporalpicture of wave coming to shoreline will reflect the processof surface water wave formation in seismic source. It is wellseen that if period of bottom oscillations is of the order of 30–40 s (i.e. time of uplift and subsidence of keyboard block isof the order of 20 s) then such movements can be consideredas instant bottom displacements. Then, because of incom-pressibility of liquid and hydrostatic pressure the tsunamisource is formed as in the piston model, and the wave heightabove seismic source will be that as value of displacement inthe source. Second uplift of bottom after 35–40 s gives nopossibility for the first front to be formed clearly. As result,there occurs superposition of two fronts and depending onthe source the wave height will be between 1 m and 2.5 m.Mostly it is a first wave.
[26] Further shake on the bottom leads to appearance oflarge trough at the water surface, near 4 m in amplitude. Inthe Figure 19a it is seen two to three well expressed wavefronts while in seismic source the process is continued duringfive periods (see Figure 17).
[27] The Figure 19a corresponds to process of instant re-lease of elastic stress at the rupture surface. It occurs asresult of sharp decrease of the friction angle (from 20◦ to
13 of 17

ES5001 lobkovsky et al.: to analysis of source mechanism of tsunami ES5001
Figure 19. Space-time picture of wave distribution at the coming to a beach.
8.2◦ for given case). If it takes place a transient process andfriction angle is a function of time f(t) then the effect of thisto character of surface displacements will be changed. Thejump is a “rigid reaction”, in prolongated f(t) process theperiod of sea bottom oscillations will be larger. The increaseof oscillation period in three to five times essentially changesthe character of formation of surface water wave by seismicsource.
[28] The space-time picture of behaviour of the wave atthe shoreline for given case (Figure 19b) is essentially dis-tinct from the case with “rigid reaction” (Figure 19a). In thisfigure, there are more clearly looked all wave fronts and it iswell seen that as a most is a third wave. In Figure 20 it is wellseen clearly expressed fronts of all waves. Figure 21 presentsa distribution of values of run-up at the beach and run-downfrom the beach for moments of maximum run-up (Rmax =4.5 m) and Rmin is more than 5 m in magnitude. Using com-putation method above proposed it was computed a num-ber of scenarios of generation and propagation of tsunamiwave in Indian Ocean basin for tsunami 26 December 2004.
In Figure 22 it is presented one of version of computationsat which it was considered a seismic source 1400 km longand 150 km width consisting of 14 blocks with equal length
Figure 20. Generation of surface water wave by seismicsource.
14 of 17

ES5001 lobkovsky et al.: to analysis of source mechanism of tsunami ES5001
Figure 21. Distribution of values of run-up at the beach and run-down from the beach for moments ofmaximum run-up Rmax and run-down Rmin.
[Hirata et al., 2006. Three time moments of generation intsunami source are presented in the figure: t = 20 s; t =2 min 20 s; t = 4 min 50 s, at which it was taken into ac-count the initial stress distribution in seismic source for eachblock, the moments when tsunami attacks the Sumatra is-land are: t = 16 min 30 s; t = 33 min 10 s; the momentwhen tsunami attacks the Thailand is: t = 1 h 50 min; fur-ther propagation of tsunami to Indian coast and attack toeast coast of Sri Lanka at t = 2 h 30 min.
[29] Thus, analysis of the scenarios of generation of tsu-nami wave with using of elastoplastic model of subductionzone permits to explain unexpected nonuniform distributionof tsunami waves for both near-field and far-field coasts.
6. Conclusion
[30] The numerical simulation of dynamical process in theearthquake source performed in this work on the basis ofkeyboard model demonstrates that tsunami waves generatedby different combination of keyboard block motions have anessentially different character what leads to different pic-ture of distribution of maximum run-ups along the coast.
Taking into account of oblique character of the subductionzone characteristic for 26 December 2004 Sumatra-Andamanearthquake gives a good agreement with run-up values ob-served at the Thailand coast. It is noted that such a modelcan more adequately account for the character of the wave-field in other regions of the Indian and the Pacific oceansalso.
Electronic Supplement
[31] The online version of this paper includes four ani-mations showing processes of generation, propagation andrun-up of tsunami waves on the beach. Animations 1 and 2show tsunami waves generation for the simplified model ofseismic source, which consists of three and eight blocks cor-respondingly, propagation of tsunami waves and running-upthem on the beach. Sizes and locations of blocks correspondto the seismic source, caused the catastrophic tsunami of26 December 2004 in the Indian Ocean. Successive motionof blocks with different velocities was set (see text for moredetail).
[32] Animation 3 shows movements of blocks in the seismic
15 of 17

ES5001 lobkovsky et al.: to analysis of source mechanism of tsunami ES5001
Figure 22. Generation and propagation of tsunami waves in the basin of the Indian Ocean for the seismicsource comprising 14 blocks for the time moments: a – t=20”, b – t=2’20’, c – t=4’50”, d – t=16’30”,e – t=33’10”, f – t=1h50’, g – t=2h30’, h – t=4h18’.
16 of 17
ES5001 lobkovsky et al.: to analysis of source mechanism of tsunami ES5001
source during the earthquakes. Calculations were made forthe stressed state of blocks at the earthquakes preparatorystage. (see text for more detais).
[33] Animation 4 for the tsunami in the Indian Ocean of26 December 2004 is based on the results of numerical simu-lation of surface waves generation for the seismic source con-sisting of 14 blocks (see [Hirata et al., 2006]). Movements ofblocks in the seismic source were calculated for the stressedstate of blocks, the propagation tsunami waves from seismicsource was calculated up to 10-m isobath.
References
Garagash, I. A., and V. A. Ermakov (2001), Use of geologi-cal and geophysical models for simulating of crust stress stateon the example of Sakhalin and Tien-Shan, in Problems ofSeismicity of the Far East, p. 33, Nauka, Khabarovsk.
Garagash, I. A., L. I. Lobkovsky, O. R. Kozyrev, andR. Kh. Mazova (2003), Generation and run-up of tsunamiwaves due to submarine landslide, Oceanology, 43(2), 185.
Garagash, I. A., and L. I. Lobkovsky (2006), An analysis ofthe dynamic displacement process of the sea bottom due toa subduction zone earthquake, in Proc. of 4th InternationalFLAC Symposium on Numerical Modeling in Geomechanics,p. 321, Balkema Press, Madrid.
Goto, C., Y. Ogava, N. Shuto, and N. Imamure (1997),Numerical Method of Tsunami Simulation with the Leap-Frog Scheme (IUGG/IOC Time Project), Manual and Guides,No. 35, 4 Parts, 126 pp., UNESCO, Paris.
Hirata, K., K. Satake, Y. Tanioka, T. Kuragano, Y. Hasegawa,Y. Hayashi, and N. Hamada (2006), The 2004 Indian Oceantsunami: Tsunami source model from satellite altimetry, EarthPlanets Space, 58(3), 195.
Kulikov, E., I. Medvedev, and S. Lappo (2005), Satellite record-ing of the Indian Ocean tsunami on 26 December, 2004, Dokl.Ros. Akad. Nauk, 401A, 444.
Lay, T., H. Kanamori, C. Ammon, M. Nettles, S. Ward,R. Asteer, S. Beck, S. Bilek, M. Brudzinski, R. Butler,H. Deshon, G. Ekstrom, K. Satake, and S. Sipkin (2005),The great Sumatra-Andaman earthquake of 26 December,2004, Science, 308, 1127, doi:10.1126/science.1112250.
Lobkovsky, L. I. (1988), Geodynamics of Spreading and Sub-duction Zones, and Two-Level Plate Tectonics, 253 pp., Nauka,Moscow.
Lobkovsky, L. I., V. I. Kerchman, B. V. Baranov, andE. I. Pristavkina (1991), Analysis of seismotectonic pro-cesses in subduction zones from the standpoint of a key-board model of great earthquakes, Tectonophysics, 199, 211,doi:10.1016/0040-1951(91)90173-P.
Lobkovsky, L. I., A. M. Nikishin, and V. E. Khain (2004),Current Problems of Geotectonics and Geodynamics, 611 pp.,Scientific World Press, Moscow.
Lobkovsky, L., R. Mazova, I. Garagash, L. Kataeva, andN. Petrukhin (2005a), Analysis of the 26 December, 2004Earthquake and Tsunami in the Indian Ocean on the Basis ofthe Subduction Keyboard Model, Geophys. Res. Abstr. ofEGU General Assembly, Austria, Vienna, 24–30 April 2005, 7,00949.
Lobkovsky, L. I., R. Kh. Mazova, and L. Yu. Kataeva (2005b),The Source Mechanism of Indian Ocean Tsunami of 26December, 2004, Proc. of Int. Tsunami Symposium, p.295, Chania, Crete Isl., Greece, 27–29 June, 2005.
Lobkovsky, L. I., R. Kh. Mazova, B. V. Baranov, andL. Yu. Kataeva (2006), Generation and propagation oftsunami in the Sea of Okhotsk (possible scenarios), Dokl.Ross. Akad. Nauk (in Russian), 410, 528.
Mazova, R. Kh., and J. F. Ramirez (1999), Tsunami wave withan initial negative wave on the Chilean coast, Nat. Hazards,20, 83, doi:10.1023/A:1008160113672.
Okada, Y. (1992), Internal deformation due to shear and tensilefaults in a half-space, Bull. Seismol. Soc. Am., 82, 1018.
Sielecki, A., and M. Wurtele (1970), The numerical integration ofthe nonlinear shallow water equations with sloping boundaries,J. Comput. Phys., 6, 219, doi:10.1016/0021-9991(70)90022-7.
Soloviev, S. L., A. V. Nekrasov, V. G. Bukhteev, andR. V. Pyaskovsky (1977), Preliminary tsunamizonation ofKurile-Kamchatka coast on the basis of hydrodynamical com-putations, in Theoretical and Experimental Research on theTsunami Problem, p. 131, Nauka, Moscow.
Titov, V., A. Rabinovich, H. Mofjeld, R. E. Tomson,and F. I. Gonzalez (2005), The global reach ofthe 26 December Sumatra tsunami, Science, 309, 2045,doi:10.1126/science.1114576.
I. A. Garagash, Institute of Physics of the Earth, RussianAcademy of Sciences, 10 B. Gruzinskaya Str., Moscow, Russia
L. I. Lobkovsky, P. P. Shirshov Institute of Oceanology, 36Nakhimovskiy pr., Russian Academy of Sciences, Moscow, Russia
R. Mazova, L. Kataeva, I. Nardin, Nizhny Novgorod StateTechnical University, Nizhny Novgorod, 603600 Russia([email protected])
17 of 17


![Geomagnetic activity during St. Patrick’s Day storm inferred from …elpub.wdcb.ru/journals/rjes/v16/2016ES000593/2016ES... · 2016-12-22 · data [Gvishiani et al., 2014, 2016b]](https://img.pdfslide.us/doc/110x75/5f787e92eb6c4631763e1233/geomagnetic-activity-during-st-patrickas-day-storm-inferred-from-elpubwdcbrujournalsrjesv162016es0005932016es.jpg)