Embed Size (px)
Citation preview

Attachments to ACCC Draft Decision onState Water Pricing Application:
2014–15 — 2016–17
March 2014
© Commonwealth of Australia 2014This work is copyright. Apart from any use permitted by the Copyright Act 1968, no part may be reproduced without permission of the Australian Competition and Consumer Commission. Requests and inquiries concerning reproduction and rights should be addressed to the Director Publishing, Australian Competition and Consumer Commission, GPO Box 3131, Canberra ACT 2601.Inquiries about this document should be addressed to:Australian Competition and Consumer CommissionGPO Box 520Melbourne Vic 3001Tel: (03) 9290 1800Fax: (03) 9663 3699Email: [email protected]
ACCC reference: 48904, D13/75484
1 ACCC Draft decision on State Water Pricing Application: 2014-15 – 2016-17 | Attachments

ContentsShortened forms...........................................................................................6
1 Total revenue..........................................................................................91.1 Draft decision.....................................................................................91.2 Assessment approach............................................................................151.3 State Water's proposal......................................................................16
1.3.1 Total Revenue...............................................................................................................171.4 Reasons for draft decision.......................................................................21
1.4.1 Cost sharing arrangement between users and Government....................................221.4.2 Sensitivity analysis......................................................................................................251.4.3 Weighted average cost of capital................................................................................261.4.4 Forecast capital expenditure.......................................................................................261.4.5 Operating expenditure.................................................................................................27
1.5 Corporate tax allowance..........................................................................271.5.1 Establishing the tax asset base..................................................................................281.5.2 Accumulated tax losses..............................................................................................30
2 Operating expenditure...........................................................................322.1 Draft decision...................................................................................322.2 The base-and-step assessment approach...........................................342.3 Base opex.........................................................................................36
2.3.1 New regulated charges................................................................................................372.3.2 Radio tower lease costs..............................................................................................38
2.4 Step changes – new regulatory obligations.........................................392.4.1 Collection of crop statistics........................................................................................402.4.2 Certification of environmental management system................................................412.4.3 Certification of asset management system...............................................................422.4.4 New hydrometric monitoring agreement with NSW Office of Water........................422.4.5 Basin plan implementation..........................................................................................432.4.6 Regulatory costs..........................................................................................................442.4.7 Drinking water quality monitoring program...............................................................45
2.5 Step changes – non-recurrent & cyclical expenditure..........................452.5.1 Periodic routine maintenance.....................................................................................462.5.2 Dam safety investigations...........................................................................................472.5.3 Staff vacancy rates.......................................................................................................482.5.4 Improved leave management......................................................................................482.5.5 Traineeships.................................................................................................................492.5.6 Workers’ compensation premiums.............................................................................492.5.7 Maintenance due to Lowbidgee asset audit...............................................................502.5.8 Increased sampling of water quality...........................................................................512.5.9 Cold water pollution investigations............................................................................522.5.10 Fish River valve replacement......................................................................................532.5.11 Flood-related corrective maintenance in the Macquarie valley................................542.5.12 Flood-related overtime.................................................................................................542.5.13 Updating manuals and plans.......................................................................................552.5.14 Debt raising costs........................................................................................................55
2.6 Step changes – discretionary expenditure..........................................572.6.1 Business transformation program..............................................................................572.6.2 NSW metering scheme – manual meter reading.......................................................59
ACCC Draft decision on State Water Pricing Application: 2014-15 – 2016-17 | Attachments 2

2.6.3 NSW metering scheme – data analysis......................................................................602.6.4 Customer-requested projects.....................................................................................612.6.5 Higher frequency meter reading in Fish River...........................................................62
2.7 Output growth..................................................................................622.7.1 Fish passage monitoring.............................................................................................622.7.2 Fish River variable costs.............................................................................................63
2.8 Input price changes...........................................................................642.8.1 Wage growth.................................................................................................................642.8.2 Energy and chlorine costs..........................................................................................652.8.3 Premiums from NSW Government insurer................................................................66
2.9 Efficiency gains.................................................................................672.9.1 Catch-up efficiency......................................................................................................672.9.2 Ongoing efficiency gains.............................................................................................672.9.3 Savings from Fish River pipeline replacement..........................................................69
2.10 Draft decision – approved expenditure...............................................70
3 Regulatory asset base............................................................................733.1 Draft decision...................................................................................733.2 State Water's application..................................................................77
3.2.1 Capex in the 2010–14 regulatory period.....................................................................773.2.2 Depreciation in the 2010–14 regulatory period..........................................................783.2.3 Projected RAB over the 2014–17 regulatory period..................................................78
3.3 Assessment approach.......................................................................793.4 Reasons for draft decision.................................................................80
3.4.1 Opening RAB in the 2010–14 regulatory period........................................................803.4.2 Capex in the 2010–14 regulatory period.....................................................................823.4.3 Depreciation used in the 2010–14 regulatory period................................................833.4.4 Opening RAB in the 2014–17 regulatory period........................................................833.4.5 Projected RAB during the 2014–17 regulatory period..............................................84
4 Capital expenditure................................................................................854.1 Draft decision...................................................................................85
4.1.1 Summary of reasons....................................................................................................864.1.2 Summary of approved expenditure............................................................................88
4.2 State Water's proposal............................................................................904.3 Submissions........................................................................................92
4.3.1 The ability of State Water to deliver its capital expenditure program.....................924.3.2 State Water’s proposed IT expenditure......................................................................924.3.3 Fish passage projects..................................................................................................934.3.4 Valley specific projects................................................................................................93
4.4 Assessment approach............................................................................934.4.1 Prudent and efficient capital expenditure..................................................................934.4.2 Assessment methodology...........................................................................................94
4.5 Reasons for draft decision.......................................................................944.5.1 Capitalised labour and overheads..............................................................................944.5.2 Contingencies.............................................................................................................1014.5.3 Dam safety compliance – Pre-1997 construction....................................................1044.5.4 Environmental planning and protection...................................................................1104.5.5 Renewals & replacement...........................................................................................1164.5.6 Water delivery and other operations........................................................................1244.5.7 Corporate systems.....................................................................................................130
3 ACCC Draft decision on State Water Pricing Application: 2014-15 – 2016-17 | Attachments

4.5.8 Allocation of State Water wide costs to each valley...............................................1414.5.9 Asset class allocation................................................................................................142
5 Rate of return......................................................................................1435.1 Draft decision.................................................................................1435.2 Legislative framework..........................................................................1455.3 Reasons for the draft decision................................................................146
5.3.1 Pricing principles.......................................................................................................1465.3.2 The AER's rate of return guideline............................................................................1485.3.3 Return on equity.........................................................................................................1495.3.4 Cost of debt................................................................................................................1665.3.5 Gearing ratio...............................................................................................................168
5.4 Revisions..........................................................................................168
6 Regulatory depreciation.......................................................................1696.1 Draft decision.................................................................................1696.2 State Water's application................................................................1706.3 Assessment approach......................................................................1716.4 Reasons for draft decision...............................................................173
6.4.1 Remaining economic lives........................................................................................1746.4.2 Standard economic lives...........................................................................................1766.4.3 Timing of depreciation—recognition of capex........................................................178
7 Forecast water extraction and entitlement volumes...............................1807.1 Draft decision.................................................................................1807.2 State Water's proposal..........................................................................182
7.2.1 Forecast water entitlement volumes........................................................................1827.2.2 Forecast water extractions........................................................................................183
7.3 Assessment approach......................................................................1887.4 Reasons for draft decision.....................................................................189
7.4.1 Forecast entitlement volumes...................................................................................1897.4.2 Forecast water extractions........................................................................................1927.4.3 Peel Valley..................................................................................................................202
8 Bulk water charges...............................................................................2038.1 Draft decision.................................................................................2038.2 Assessment approach......................................................................2098.3 The ACCC’s draft decision on tariff structure....................................210
8.3.1 State Water proposal.................................................................................................2108.3.2 Reasons for ACCC draft decision.............................................................................213
8.4 The ACCC’s draft decision entitlement charges.................................2178.4.1 State Water proposal.................................................................................................2178.4.2 Reasons for the ACCC’s draft decision on entitlement charges...........................218
8.5 The ACCC’s draft decision on State Water’s other proposed changes to its charges..............................................................................................220
8.5.1 Rebates for Irrigation Corporations and Districts...................................................2208.5.2 Fish River charges.....................................................................................................2278.5.3 Lowbidgee flood control and Irrigation District charges........................................2298.5.4 Peel Valley..................................................................................................................230
ACCC Draft decision on State Water Pricing Application: 2014-15 – 2016-17 | Attachments 4

9 Metering and miscellaneous charges.....................................................2339.1 Metering charges............................................................................235
9.1.1 Metering charges and the NSW metering scheme..................................................2359.1.2 Metering charges for regulated river customers.....................................................2369.1.3 Environmental gauging station charges..................................................................2439.1.4 Refundable deposit for resolving meter accuracy disputes...................................246
9.2 Miscellaneous charges.........................................................................2469.2.1 Fish River connection and disconnection charges.................................................2469.2.2 Charges for processing allocation trades................................................................2489.2.3 Yanco Creek levy........................................................................................................250
10 Form of price control.........................................................................25210.1 Draft decision.................................................................................25210.2 State Water's proposal....................................................................25210.3 Assessment approach......................................................................25310.4 Reasons for draft decision...............................................................253
10.4.1 Unders and Overs adjustment..................................................................................25510.5 Form of control – Price cap with unders and overs adjustment..........256
10.5.1 Calculation of valley charges....................................................................................25710.5.2 Calculation of Fish River charges.............................................................................26210.5.3 Calculation of MDBA and BRC charges...................................................................26610.5.4 Worked example of unders and overs adjustment for an example valley............269
Appendix A - State Water’s Tariff Structure: Risk-Sharing, Incentive and Efficiency Implications...............................................................................272
Appendix B – Background to Fish River charges...........................................290
Appendix C – Meetings with stakeholders and submissions...........................................291
5 ACCC Draft decision on State Water Pricing Application: 2014-15 – 2016-17 | Attachments

Shortened forms2010-14 regulatory period Regulatory period from 1 July 2010 to 30 June 2014 2014-17 access arrangement Regulatory period from 1 July 2014 to 30 June 2017 ABS Australian Bureau of StatisticsACCC Australian Competition and Consumer CommissionACG Allen Consulting GroupAEMC Australian Energy Market CommissionAER Australian Energy Regulator AIR Annual Information Return (IPART)ALARP as low as reasonably practicalAMS asset management systemANCOLD Australian National Committee On Large DamsATO Australian Tax OfficeAWA average water allocationsBRC Dumaresq–Barwon Borders Rivers CommissionBTP Business Transformation ProgramBWCOP Basin water charging objectives and principles (Water Act 2007)Capex Capital expenditureCAPM capital asset pricing modelCARMS computer-aided river management systemsCEPA Cambridge Economic Policy AssociatesCEWO Commonwealth Environmental Water OfficeCGS commonwealth government securitiesCIE Centre for International EconomicsCPI Consumer price index, measured as the weighted average of
eight capital citiesCSC customer service committeeDeloitte Deloitte Access Economics DGM dividend growth modelDLWC Department of Land and Water ConservationDLWC NSW Department of Land and Water ConservationDPI Dept of Primary Industries (Fisheries)DR/BCP Disaster recovery and business continuity planningDRP debt risk premiumDSU Dam safety upgradeEMS Environmental Management SystemEPP environmental and planning and protection
ACCC Draft decision on State Water Pricing Application: 2014-15 – 2016-17 | Attachments 6

ERA Economic Regulatory AuthorityERP Enterprise Resource PlanningESC Essential Services Commission (Victoria)ESCOSA Essential Services Commission of South AustraliaFASP Future Asset Service PotentialFish River Fish River Water Supply SchemeFrontier Frontier EconomicsFVC fair value curveGIS geographic information systemGPT General Property TrustGVIA Gwydir Valley Irrigators AssociationICDs irrigation corporations and districtsICT Information and Communications Technology IIO Irrigation Infrastructure OperatorIPART Independent Pricing and Regulatory Tribunal (NSW)IQQM Integrated Quantity and Quality ModeliSMART Integrated Surveillance Monitoring, Automation and Remote
TelemetryJIL Jemalong Irrigation LtdKL KilolitresLAD least absolute deviationsLVW Lachlan Valley WaterMAQ Minimum/Maximum Annual Quantity MDB Murray-Darling BasinMDBA Murray-Darling Basin AuthorityMI Murrumbidgee Irrigation LimitedMIL Murray Irrigation LimitedML MegalitresMPII Murrumbidgee Private Irrigators IncorporatedMRFF Macquarie River Food and FibreMRP market risk premiumMVFFA Murrumbidgee Valley Food and Fibre AssociationNMBC North Macquarie Bypass ChannelNOW NSW Office of WaterNPV net present valueNSP Network Service PlanNSW DSC NSW Dams Safety CommitteeNSW New South Wales
7 ACCC Draft decision on State Water Pricing Application: 2014-15 – 2016-17 | Attachments

NSWIC New South Wales Irrigators CouncilNWC National Water CommissionNWI National Water InitiativeNWMS National Water Market SystemOfgem Office of Gas and Electricity MarketsOLS Ordinary lead squaresOpex Operating expenditurePIIOP Private Irrigation Infrastructure Operators Program (NSW)PRA portfolio risk analysispricing principles, the pricing principles under the Water Charge (Infrastructure) Rules 2010PTRM post tax revenue model PwC PricewaterhouseCooper'sQCA Queensland Competition AuthorityRAB regulatory asset baseRFM RAB roll-forward modelRIT regulatory information templateSCA Sydney Catchment AuthoritySFG SFG ConsultingSRWUIP Sustainable Rural Water Use and Infrastructure ProgramState Water State Water Corporation of New South WalesSWW StateWaterWISETAB Tax asset baseVAA Value Adviser Associates VicGAAR AER's Victorian Gas Access Arrangement Review 2012WACC weighted average cost of capitalWAS water accounting systemWCIRs Water Charge (Infrastructure) Rules 2010WHS work health and safetyWMA NSW Water Management Act 2000WSPs Water Sharing PlansYCATAC Yanco Creek and Tributaries Advisory Council
ACCC Draft decision on State Water Pricing Application: 2014-15 – 2016-17 | Attachments 8

1 Total revenueThe total revenue requirement is a forecast of an operator’s prudent and efficient costs in the provision of water infrastructure services. Under the WCIR, the ACCC is required to assess whether State Water’s proposed total forecast revenue for the 2014–17 regulatory period is reasonably likely to meet the prudent and efficient costs of providing infrastructure services in that regulatory period.1
The ACCC must not approve the regulated charges set out in a pricing application unless it is satisfied that the total forecast revenue requirement for the regulatory period is reasonably likely to meet the prudent and efficient costs of providing infrastructure services.2
The ACCC’s draft determination of State Water’s total revenue requirement for the 2014–17 regulatory period is presented in this attachment. The ACCC’s draft decision on total revenue is the outcome of ACCC’s assessment of the individual building blocks as presented in greater detail in the relevant attachments.
1.1 Draft decisionThe ACCC has calculated a total revenue requirement of $283.0 million ($, nominal) over the 2014–17 regulatory period for all of State Water’s regulated valleys. This revenue requirement is $57.0 million ($, nominal) or 16.8 per cent lower that State Water's proposal. The ACCC’s draft decision accepts some aspects of State Water’s proposal as consistent with the requirements of the WCIR. However, the ACCC has determined that other aspects of State Water’s proposed building blocks are not prudent and efficient.3 Where the ACCC does not approve aspects of State Water’s proposal, it has determined those aspects at a level it considers are prudent and efficient. These determinations result in lower total revenue overall. Accordingly, the ACCC does not accept State Water’s proposed total revenue across all the valleys of $340.0 million ($, nominal).4
The main elements of the ACCC’s draft determination that reduces State Water’s total revenue relative to its proposal are:
A rate of return of 7.44 per cent, compared with State Water’s proposed 8.96 per cent.
Forecast capital expenditure of $151.8 million ($2013–14), compared with State Water’s proposed $204.1 million ($2013–14), a reduction of 21.5 per cent.
Forecast operating expenditure of $115.5 million ($2013–14), compared with State Water’s proposed $127.5 million ($2013–14), a reduction of 8.7 per cent.
Figure 1-1 compares the ACCC’s draft decision total revenue by building block with State Water’s proposal for the 2014–17 regulatory period.
1 WCIR, r. 29(2)(b)(i).2 WCIR, r. 29(3).3 WCIR, r. 29(2)(b)(i).4 The ACCC has recalculated State Water’s proposed total revenue requirement to exclude the IPART regulated
valleys of the North Coast, Hunter and South Coast.
9 ACCC Draft decision on State Water Pricing Application: 2014-15 – 2016-17 | Attachments

Figure 1-1 ACCC’s draft decision and State Water’s proposed annual building block revenue requirement ($m, nominal)
Source: ACCC analysis. Notes: The 2014-17 regulatory period annual allowance for regulatory depreciation (return of capital) is negative. This is
because the value of inflation on the RAB (negative) offsets the value of depreciation (positive).
Figure 1-2 compares the ACCC’s draft decision building blocks for State Water’s 2014–17 regulatory period with State Water’s proposed revenue requirement for that same period, and the approved revenue for the 2009–2014 regulatory period.5 The ACCC’s draft decision on State Water’s average annual revenue for the 2014–17 regulatory period results in an decrease of 0.4 per cent in real terms ($2013–14) on State Water’s average annual revenue in the 2009–2014 regulatory period.6 State Water’s proposed annual average revenue for the 2014–17 regulatory period is 19.6 per cent higher in real terms ($2013–14) than the average revenue approved by IPART for the 2009–14 regulatory period.7
5 IPART approved revenue for 2009 to 2014 included other allowances such as revenue volatility allowance and Murray Darling Basin Authority (MDBA) and Border Rivers Commission (BRC) costs. These allowances are included in Figure 1-2 to illustrate the contribution to annual average revenue during the period.
6 The ACCC has calculated this figure relative to the IPART revenue requirement less the MDBA & BRC costs and revenue volatility allowance. The ACCC’s draft decision average annual revenue would be 16.4 per cent lower than approved revenues in the previous period if the MDBA and BRC costs and revenue volatility allowance were included.
7 The ACCC has calculated this figure relative to the IPART revenue requirement less the MDBA & BRC costs and revenue volatility allowance. State Water’s annual average proposed revenue would be 0.4 per cent higher than approved revenues in the previous period if the MDBA and BRC costs and revenue volatility allowance were included.
ACCC Draft decision on State Water Pricing Application: 2014-15 – 2016-17 | Attachments 10
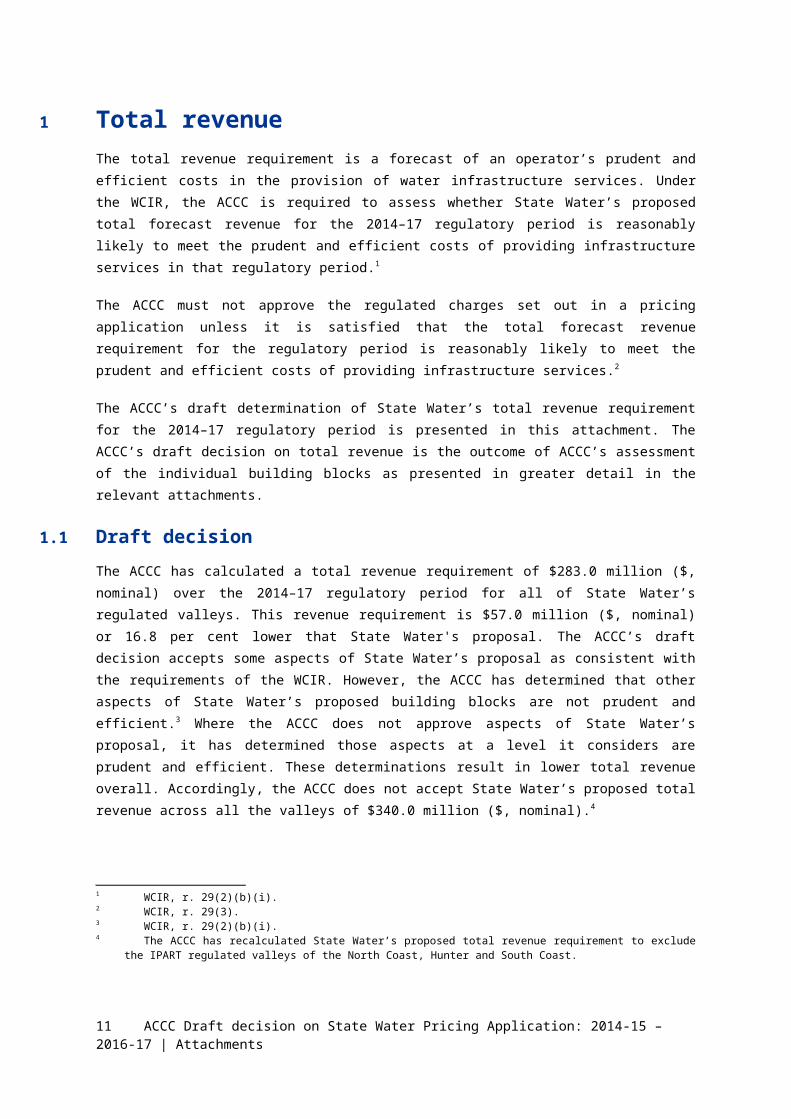
Figure 1-2 Annual average of ACCC’s draft decision compared with State Water’s proposed revenue and IPART approved revenue for 2009–10 to 2013–14 ($m, real 2013-14)
-20
-
20
40
60
80
100
120
140
IPART Approved2009 to 2014
State Water proposal2014 to 2017
ACCC draft decision2014 to 2017
Opex Return of capital Return on capital
MDBA & BRC Revenue Volatility
Average building block revenue ($m, real 2013-14)
Source: ACCC analysis. IPART, Review of bulk Water charges for State Water, June 2010, p. 46.
Notes: IPART approved revenue for 2009 to 2014 included other allowances such as revenue volatility and MDBA and BRC costs. These allowances are included here to illustrate the contribution to annual average revenue during the period.The 2014-17 regulatory period annual average allowance for regulatory depreciation (return of capital) is negative. This is because the value of inflation on the RAB (negative) offsets the value of depreciation (positive).
The ACCC arrives at its draft decision on State Water’s total revenue by summing the building blocks. The ACCC bases this on its assessment of the prudent and efficient costs on a valley by valley basis. These building blocks comprise of a return on capital, regulatory depreciation, and operating expenditure. This draft decision presents the total revenue for State Water and for each individual valley. The total revenues presented are the sum of building blocks. These are unsmoothed revenues unless stated otherwise. The total revenue requirement is allocated between users and the NSW Government using the user share percentages approved by IPART.8,9 To determine user charges, the ACCC has determined the user share of the total revenue requirement for State Water as a whole and for each valley.
Figure 1-3 compares the ACCC’s draft decision on State Water’s building block revenue requirement for the 2014–17 regulatory period with the IPART approved revenues in the 2010–14 regulatory period. It also presents State Water’s actual revenue recovered from bulk water charges over the 2010–14 regulatory period in comparison with State Water’s forecast revenue from bulk water charges.
8 IPART, Review of bulk water charges for State Water, June 2010, p. 108. 9 The user share percentages are based on an agreement between State Water and the NSW Government to maintain
the cost sharing ratios determined by IPART in 2001, 2006, and 2010.
11 ACCC Draft decision on State Water Pricing Application: 2014-15 – 2016-17 | Attachments

Figure 1-3 ACCC’s draft decision compared to State Water’s proposal revenue requirement (user share) and IPART approved revenue for 2009–10 to 2016–17 ($m, nominal)
0
10
20
30
40
50
60
70
80
2010 2011 2012 2013 2014 2015 2016 2017IPART approved (building block revenue)ACCC draft decision (building block revenue)State Water actual (bulk water charges revenue)State Water proposed (bulk water charges revenue)
Building block
revenues ($m,
nominal)
Source: ACCC analysis. IPART, Review of bulk Water charges for State Water, June 2010, p. 46.
Notes: IPART approved revenues from 2009–2014 are calculated net of MDBA and BRC costs and excludes revenue from the North Coast, Hunter and South Coast valleys not regulated by the ACCCState Water’s 2013–14 revenue is a forecast based on estimated building blocks. The bulk water charges revenue refers to the summation of revenue recovered from regulated user charges for each of State Water’s valleys regulated by the ACCC.
Table 1-1 presents the unsmoothed revenue as the sum of each building block. The relevant attachments to this decision discuss these building blocks in greater detail. This total building block revenue is net of large irrigator rebates. Large irrigators receive these rebates in the Lachlan, Murray and Murrumbidgee valleys in return for services they provide instead of State Water. Accordingly, these cost savings are not included in State Water’s revenues.
ACCC Draft decision on State Water Pricing Application: 2014-15 – 2016-17 | Attachments 12

Table 1-1 ACCC draft decision – State Water’s total building block revenue requirement for 2014–17 ($m, nominal)
2014-15 2015-16 2016-17 Total
Return on capital 52.2 57.7 62.2 172.0
Regulatory depreciation -3.2 -3.5 -3.6 -10.4
Operating expenditure 39.8 40.6 41.0 121.4
Annual building block revenue requirement (unsmoothed)
88.8 94.7 99.5 283.0
Plus: Large irrigator rebates 1.6 1.6 1.6 4.8
Total building block revenue 90.4 96.3 101.0 287.8
Source: ACCC analysis.Note: Numbers may not sum due to rounding.
Table 1-2 presents the total revenue requirement for each valley.
Table 1-2 ACCC’s draft decision – State Water’s total revenue requirement 2014–17 ($million, nominal)
2014–15 2015–16 2016–17 Total
Border 1.7 1.8 1.8 5.3
Gwydir 11.9 12.5 13.2 37.6
Namoi 14.9 16.8 18.5 50.2
Peel 3.6 4.3 4.3 12.1
Lachlan 12.3 13.1 14.0 39.4
Macquarie 11.1 12.3 12.9 36.4
Murray 6.5 6.6 6.7 19.8
Murrumbidgee 16.0 16.4 16.6 48.9
Lowbidgee 0.5 0.6 0.7 1.8
Fish River 10.2 10.5 10.8 31.5
Total 88.8 94.7 99.5 283.0
Source: ACCC analysis. Note: Numbers may not sum due to rounding.
Table 1-3 and Table 1-4 present the ACCC’s draft decision on user and government shares of State Water’s total revenue requirement by valley.
13 ACCC Draft decision on State Water Pricing Application: 2014-15 – 2016-17 | Attachments

Table 1-3 ACCC’s draft decision – User cost share of State Water’s total revenue requirement for 2014–17 ($m, nominal)
2014–15 2015–16 2016–17 Total
Border 1.6 1.6 1.6 4.7
Gwydir 5.1 5.4 5.8 16.4
Namoi 5.6 5.8 5.9 17.4
Peel 1.4 1.4 1.5 4.3
Lachlan 7.1 7.6 8.2 22.9
Macquarie 7.0 7.4 7.8 22.2
Murray 5.4 5.5 5.6 16.5
Murrumbidgee 9.6 10.0 10.0 29.6
Lowbidgee 0.5 0.6 0.7 1.8
Fish River 10.2 10.5 10.8 31.5
Total 53.5 55.7 57.9 167.1
Source: ACCC analysis. Note: Numbers may not sum due to rounding.
Table 1-4 ACCC’s draft decision – Government cost share of State Water’s total revenue requirement for 2014–17 ($m, nominal)
2014–15 2015–16 2016–17 Total
Border 0.2 0.2 0.2 0.6
Gwydir 6.8 7.1 7.4 21.3
Namoi 9.3 11.0 12.6 32.9
Peel 2.2 2.8 2.9 7.9
Lachlan 5.2 5.5 5.9 16.5
Macquarie 4.1 5.0 5.1 14.2
Murray 1.1 1.1 1.1 3.3
Murrumbidgee 6.4 6.4 6.5 19.3
Lowbidgee 0.0 0.0 0.0 0.0
Fish River 0.0 0.0 0.0 0.0
Total 35.3 39.0 41.6 115.9
Source: ACCC analysis. Note: Numbers may not sum due to rounding.
Figure 1-4 shows State Water’s allocation of total costs between users and the NSW Government from 2009–10 to 2016–17. This demonstrates that State Water is recovering an increasing proportion of its revenue requirement from the NSW Government. The ACCC’s determined total revenue is lower than that proposed by State Water. However, this is with a lower proportion of revenue recovered from the NSW Government compared to State Water’s proposal. This is because the ACCC has reduced State Water’s proposed capex and opex in activities that allocate a higher proportion of costs
ACCC Draft decision on State Water Pricing Application: 2014-15 – 2016-17 | Attachments 14

to the NSW Government, relative to users. The ACCC’s decision results in recovering an annual average of $56 million (nominal) from users (59 per cent of total revenue). State Water’s proposed building block revenue would result in recovering an annual average of $65 million (nominal) from users (57 per cent of total revenue) over the next regulatory period.
Figure 1-4 ACCC’s draft decision and State Water’s proposal – revenue requirement (unsmoothed) allocation between users and Government ($m, nominal)10,11
2010 2011 2012 2013 2014 2015 2016 2017 -
20
40
60
80
100
120
140
IPART approved -User IPART approved -GovernmentState Water proposed - User State Water proposed - GovernmentACCC draft decision - User ACCC draft decision - Government
Building block revenue
requirement
User and Government
shares ($m, nominal)
Source: ACCC analysis. IPART, Review of bulk Water charges for State Water, June 2010, p. 46.
Note: IPART approved revenues are calculated exclusive of MDBA & BRC costs that do not form part of the current pricing review.
1.2 Assessment approachThe ACCC is required to assess State Water’s proposed total forecast revenue for the regulatory period. The ACCC is to assess whether this reflects the prudent and efficient costs of providing infrastructure services in that regulatory period. Under the WCIR, the ACCC cannot approve the proposed charges unless it is satisfied that the total forecast revenue requirement for the regulatory period reflects the prudent and efficient costs of providing infrastructure services.12
The ACCC’s pricing principles set out the methodology to follow in approving or determining State Water’s total revenue and regulated charges.13 The ACCC uses a building block approach to calculate the total forecast revenue. The building block approach calculates the total revenue based on prudent and efficient costs. These include:
10 Figure 1-4 shows the IPART approved revenue requirement less MDBA & BRC costs for comparative purposes. These costs do not form part of State Water proposed costs at the time of this decision.
11 The proportion of user and Government shares of the revenue requirements represented in Figure 1-4 are at an aggregate level and therefore may not be representative of proportions by individual valleys.
12 WCIR, r. 29(2).13 ACCC, Pricing principles for price approvals and determinations under Water Charge (Infrastructure) Rules 2010,
July 2011.
15 ACCC Draft decision on State Water Pricing Application: 2014-15 – 2016-17 | Attachments

a return on the projected regulatory asset base (RAB), incorporating:
the value of the opening RAB established as at 1 July 2014 (attachment 3)
the value of forecast capital expenditure in the regulatory period (attachment 4)
a rate of return using a weighted average cost of capital (WACC) approach (attachment 5)
the level of regulatory depreciation (attachment 6)
the operating and maintenance costs incurred in the provision of water infrastructure services (attachment 2)
the cost of corporate tax allowance.
The ACCC approved ‘building blocks’ summed together give the required revenue in each year of the regulatory period. According to the ACCC’s end–of–year timing assumption, total revenue occurs on the final day of the year. The ACCC applies this assumption to expenditure and revenue cash flows for modelling purposes.14
The ACCC’s determination of State Water’s proposed building blocks is allocated between users and the NSW Government, based on approved cost sharing ratios. IPART approved the cost sharing arrangement between State Water and the NSW Government in its 2010 price review. The user share of total revenue will vary between individual valleys dependent on the value of the RAB. This is also dependent on the approved level of prudent and efficient costs allocated to users on the basis of the approved cost sharing ratios.
Once the total revenue requirement is determined, revenue used to determine user charges is allocated across regulated charges for approval by the ACCC. The ACCC may smooth the variations in either the forecast revenue requirement or forecast prices. This is for the purpose of maintaining price stability during a regulatory period. Maintaining price stability is consistent with the water charging objectives and principles under the Water Act (2007).15 The ACCC determination of the smoothed revenue requirement is set equal to the net present value (NPV) of the unsmoothed revenue requirement. The NPV equality of revenue streams ensures that revenue to be recovered from regulated charges is reasonably likely to meet that part of the prudent and efficient costs of providing infrastructure services (that is not met from other revenue).16
1.3 State Water's proposalState Water has proposed a total (unsmoothed) revenue requirement of $340 million (nominal) for the 2014–17 regulatory period. For the 2014–17 regulatory period, the building block calculation of State Water’s total revenue is based on a nominal post-tax approach. This approach differs to the previous determination undertaken by IPART.17 IPART applied a real pre-tax approach to calculate State Water’s revenue requirement from 1 July 2010 to 30 June 2014. State Water’s proposed revenue requirement over the 2014–17 regulatory period is comprised of different cost components compared to those approved by IPART at the previous price determination.18 In particular, the charges previously determined by IPART included costs of the Murray Darling Basin Authority (MDBA) and
14 ACCC, Pricing principles under the WCIR, July 2011, p. 6715 Water Act (2007), Schedule 2, Parts 2, s.2, of the Water Act (2007) and Schedule 2, Part 3, s.3 of the Water Act
(2007).16 WCIR, r. 29(2)(b)(ii).17 IPART, Review of bulk water charges for State Water, June 2010.
ACCC Draft decision on State Water Pricing Application: 2014-15 – 2016-17 | Attachments 16

Border Rivers Commission (BRC), as well as a revenue volatility allowance.19 Therefore, any comparison of the two sets of revenues needs to consider differences between these building block components.
1.3.1 Total Revenue State Water has proposed a total (unsmoothed) revenue requirement of $340 million (nominal) for the 2014–17 regulatory period. State Water’s proposed annual average total revenue represents an increase of 19.6 per cent over the current 2010–2014 regulatory period. State Water’s proposed increase in total revenue is driven by increases in its proposed operating expenditure, regulatory asset base, and WACC. Table 1-5 presents State Water’s proposed total revenue requirement.
Table 1-5 State Water proposal – Total revenue requirement for 2014–15 to 2016–17 ($m, nominal)
2014–15 2015–16 2016–17 Total
Return on capital 66.6 77.8 83.9 228.3
Regulatory depreciation –5.8 –7.3 –8.1 –21.2
Operating expenditure 43.7 44.2 45.0 132.9
Annual building block revenue requirement (unsmoothed)
104.6 114.6 120.8 340.0
Source: State Water regulatory building block model master.xlsm, submitted on 30 June 2013.
Note: State Water’s proposed total revenue has been adjusted to exclude the IPART regulated valleys of North Coast, Hunter and South Coast.
The regulated charges to be recovered from users are calculated with regard to the user share of State Water’s proposed costs. Table 1-6 presents State Water’s user share of the total revenue requirement, based on the State Water’s proposed cost sharing ratios. Table 1-8 presents these cost sharing ratios, which the NSW Government has approved.20
Table 1-6 State Water proposal – User share of total revenue requirement 2014–15 to 2016–17 ($m, nominal)
2014–15 2015–16 2016–17 Total
Return on capital 22.9 26.8 29.2 78.9
Regulatory depreciation –1.5 –2.0 –2.3 –5.9
Operating expenditure 40.1 40.6 41.5 122.2
Annual building block revenue requirement (unsmoothed)
61.5 65.4 68.4 195.2
Source: State Water, State Water regulatory building block model master.xlsm, submitted on 30 June 2013.Note: State Water’s proposed total revenue has been adjusted to exclude the IPART regulated valleys of North Coast, Hunter and South Coast.
Table 1-7 presents State Water’s proposed government shares of the total revenue requirement.
18 IPART approved revenue included MDBA & BRC costs and the revenue volatility allowance. State Water did not propose the inclusion of these costs as part of their pricing application.
19 IPART, Review of bulk Water charges for State Water Corporation, June 2010, p. 48.20 Letter from Katrina Hodgkinson MP - Minister for Primary Industries to Rod Sims Chairman ACCC – 21 November
2012.
17 ACCC Draft decision on State Water Pricing Application: 2014-15 – 2016-17 | Attachments

Table 1-7 State Water proposal – Government share of total revenue requirement 2014–15 to 2016–17 ($m, nominal)
2014–15 2015–16 2016–17 Total
Return on capital 43.7 51.0 54.7 149.3
Regulatory depreciation –4.2 –5.3 –5.7 –15.3
Operating expenditure 3.6 3.6 3.5 10.7
Annual building block revenue requirement (unsmoothed)
43.1 49.3 52.4 144.8
Source: State Water, State Water regulatory building block model master.xlsm, submitted on 30 June 2013.Note: State Water’s proposed total revenue has been adjusted to exclude the IPART regulated valleys of North Coast,
Hunter and South Coast.
State Water's proposed modelling of capital expenditure for the 2014-17 regulatory period is recognised on an as-incurred basis and not as-commissioned. State Water's recognition of capex on an as-incurred basis affects the return on capital and return of capital building blocks over the regulatory period. We discuss this further in the ACCC's decision on the RAB in attachment 3.
State Water's proposed annual regulatory depreciation allowance is negative due to the effects of inflation indexation on the opening RAB. The calculation of regulatory depreciation allowance is the value of straight-line depreciation less the inflation component of the opening RAB for that year. State Water's proposed remaining asset lives and standard asset lives influence the level of the straight-line depreciation. Under State Water's proposal, the standard asset lives and remaining asset lives result in a level of annual depreciation that is less than the inflation component of the opening RAB. That is, the (positive) impact from the inflation indexation more than offsets the (negative) depreciation of the RAB. The result is a negative regulatory depreciation allowance, thereby reducing State Water's revenue requirement.
State Water has not proposed a cost of corporate tax allowance building block for the 2014–17 regulatory period. State Water proposed that, due to claims for accelerated depreciation and other tax expenses, it does not forecast a taxable profit until at least 2016–17.21 State Water stated it has accumulated tax losses carried forward of $201 million (nominal) based on its 30 June 2012 tax return under the National Tax Equivalent Regime (NTER). The value of State Water’s proposed current accumulated tax losses and forecast taxable profit (loss) over the 2014–17 regulatory period are likely to result in zero tax liability during that regulatory period.22
State Water has not proposed any changes to the cost sharing ratios between users and the NSW Government, as approved by IPART in previous determinations. The NSW Government, in agreement with State Water, will maintain the existing cost sharing arrangement. The NSW Government will pay its share of the revenue requirement, consistent with the 2010 IPART determination.23 The cost sharing ratios used to determine the user and government cost shares apply to activities attracting capital and operating expenditures. The NSW Government’s share is removed from the revenue requirement before calculating user charges.
21 State Water Corporation, Pricing application to the Australia Competition and Consumer Commission for regulated charges to apply from 1 July 2014 (State Water application), June 2013, p.120.
22 State Water application, pp.119–120.23 State Water application, p.127.
ACCC Draft decision on State Water Pricing Application: 2014-15 – 2016-17 | Attachments 18

State Water’s proposed cost shares for users and the NSW Government are present below in Table 1-8. These cost shares apply to all valleys, excluding Lowbidgee and the Fish River Water Supply Scheme (FRWSS) where 100 per cent of costs are borne by users.
Table 1-8 State Water proposed user cost shares by activity type (per cent)Activity name User share (%) Government share (%)
Customer support 100 0
Customer billing 100 0
Metering and compliance 100 0
Water delivery and operations 100 0
Water transfers 100 0
Flood operations 50 50
Hydrometric monitoring 90 10
Water quality monitoring 50 50
Public liability insurances 100 0
Corrective maintenance 100 0
Routine maintenance 100 0
Asset management planning and replacement 100 0
Dam safety compliance – pre 1997 0 100
Dam safety compliance – post 1997 50 50
Environmental planning and protection 50 50
Renewal and replacement of assets 90 10
Structural and other enhancements 100 0
Corporate systems 100 0
Source: State Water, Pricing application to the Australia Competition and Consumer Commission for regulated charges from 1 July 2014, June 2013, p. 128.
State Water’s total revenue requirement is arrived at by summing the proposed costs of each valley, modelled using the building block approach. The following tables present State Water’s proposed revenue requirement at the individual valley level. This also presents the user and government shares of the total revenue for the 2014–17 regulatory period. For comparative purposes, the 2013–14 IPART approved total revenue is exclusive of MDBA and BRC costs. Table 1-9 to 1-11 present this in the total revenue requirement.
19 ACCC Draft decision on State Water Pricing Application: 2014-15 – 2016-17 | Attachments

Table 1-9 State Water proposal – Total revenue requirement (unsmoothed) by valley for 2013–14 to 2016–17 ($m, nominal)
Valley 2013–14 2014–15 2015–16 2016–17
Border 1.6 2.0 2.1 2.0
Gwydir 14.1 14.3 15.7 16.3
Namoi 22.1 18.1 20.7 23.1
Peel 3.3 4.5 5.9 5.8
Lachlan 13.4 14.0 15.6 16.5
Macquarie 12.8 13.1 15.5 16.5
Murray 7.5 8.5 8.5 9.0
Murrumbidgee 16.6 18.6 19.1 19.6
Lowbidgee n/a 0.8 0.7 0.7
Fish River 10.2 10.6 10.8 11.2
Total 101.45 104.6 114.6 120.8
ACCC Draft decision on State Water Pricing Application: 2014-15 – 2016-17 | Attachments 20

Source: State Water, Pricing application, p.125; IPART, Review of bulk Water charges for State Water, June 2010.Note: IPART approved revenue requirement for 2013–14 was adjusted to exclude MDBA and BRC costs.
Table 1-10 State Water proposal – User share of total revenue requirement (unsmoothed) by valley for 2014–15 to 2016–17 ($m, nominal)
Valley 2013–14 2014–15 2015–16 2016–17
Border 1.4 1.8 1.8 1.8
Gwydir 5.8 5.6 6.6 6.9
Namoi 6.1 6.4 6.6 6.8
Peel 1.2 1.7 1.9 1.9
Lachlan 7.9 8.2 9.2 9.5
Macquarie 7.4 8.1 9.1 10.0
Murray 6.5 7.3 7.2 7.6
Murrumbidgee 9.3 11.2 11.5 12.0
Lowbidgee n/a 0.8 0.7 0.7
Fish River 10.2 10.6 10.8 11.2
Total 55.7 61.5 65.3 68.4
Source: State Water, Pricing application, p.126; IPART, Review of bulk Water charges for State Water, June 2010.Note: IPART approved revenue requirement for 2013–14 was adjusted to exclude MDBA and BRC costs.
Table 1-11 State Water proposal - Government share of total revenue requirement (unsmoothed) for 2014–15 to 2016–17 ($m, nominal)
Valley 2013–14 2014–15 2015–16 2016–17
Border 0.2 0.2 0.2 0.2
Gwydir 8.3 8.7 9.1 9.4
Namoi 16.0 11.7 14.1 16.3
Peel 2.1 2.8 4.0 3.9
Lachlan 5.4 5.8 6.5 7.0
Macquarie 5.4 5.0 6.5 6.5
Murray 1.1 1.3 1.3 1.4
Murrumbidgee 7.3 7.5 7.6 7.6
Lowbidgee n/a 0.0 0.0 0.0
Fish River 0.0 0.0 0.0 0.0
Total 45.8 43.1 49.3 52.4
Source: State Water, Pricing application, p.126; IPART, Review of bulk Water charges for State Water, June 2010.Note: IPART approved revenue requirement for 2013–14 was adjusted to exclude MDBA and BRC costs.
21 ACCC Draft decision on State Water Pricing Application: 2014-15 – 2016-17 | Attachments

1.4 Reasons for draft decisionThe ACCC’s draft decision does not accept State Water’s proposed total revenue requirement of $340 million (nominal).24 The ACCC has calculated a total revenue requirement across all ACCC regulated valleys of $283.0 million ($nominal) over the 2014–17 regulatory period. This total revenue is 16.8 per cent lower than State Water’s proposed total revenue for the 2014–17 regulatory period. The ACCC has accepted that some aspects of State Water’s proposal are consistent with the requirements of the WCIR. However, not all aspects of State Water’s proposed building blocks have been determined to be prudent and efficient.25 The main elements of the ACCC’s draft determination that reduce State Water’s total revenue relative to the proposal are:
A rate of return of 7.44 per cent, compared with State Water’s proposed 8.96 per cent.
Forecast capital expenditure (gross) of $151.8 million (real 2013–14), compared with State Water’s proposed $204.1 million (real 2013–14), a reduction of 25.6 per cent.
Forecast operating expenditure of $115.5 million (real $2013–14), compared with State Water’s proposed $127.5 million (real $2013–14), a reduction of 8.7 per cent.
The ACCC’s draft decision on State Water’s total revenue includes adjustments to State Water’s proposed models. The ACCC found a number of errors with State Water’s proposed post-tax revenue models and building block model. These errors included incorrect timing assumptions for recognising capex and inappropriate asset class classifications. The ACCC remodelled and updated State Water’s building block revenues using the ACCC’s post-tax revenue model. Therefore, the ACCC’s draft decision on total revenue and State Water’s proposed total revenue also reflects corrections in the approach to modelling the total revenue requirement.
1.4.1 Cost sharing arrangement between users and GovernmentThe ACCC accepts the NSW Government’s cost sharing arrangements for the 2014–17 regulatory period. Table 1-12 and Table 1-13 present the approved cost sharing ratios for capex and opex, respectively.
24 The figure is with respect to State Water’s total revenue represent unsmoothed revenue derived from summation of the building block components for each of the ACCC regulated valleys.
25 WCIR, r. 29(2)(b)(i).
ACCC Draft decision on State Water Pricing Application: 2014-15 – 2016-17 | Attachments 22

Table 1-12 IPART approved capex user cost shares by activity type (per cent)Activity User share (%) Government share (%)
Asset management planning 100% 0%
Routine maintenance 100% 0%
Dam safety compliance – Pre 1997 Construction 0% 100%
Dam safety compliance 50% 50%
Renewal and replacement 90% 10%
Structural and other enhancements 100% 0%
Corporate systems 100% 0%
Environmental planning and protection 50% 50%
Flood operations 50% 50%
Office accommodation capital projects 100% 0%
Information management projects 100% 0%
River channel protection works 50% 50%
Water delivery and other operations 100% 100%
Source: IPART, Review of bulk water charges for State Water, June 2010, p. 108.
23 ACCC Draft decision on State Water Pricing Application: 2014-15 – 2016-17 | Attachments

Table 1-13 IPART approved opex user cost shares by activity type (per cent)
Activity User share (%) Government share (%)
Customer support 100% 0%
Customer billing 100% 0%
Metering and compliance 100% 0%
Water delivery and operations 100% 0%
Flood operations 50% 50%
Hydrometric monitoring 90% 10%
Water quality monitoring 50% 50%
Corrective maintenance 100% 0%
Routine maintenance 100% 0%
Asset management planning 100% 0%
Dam safety compliance capital projects – Pre 1997 0% 100%
Dam safety compliance 50% 50%
Environmental planning and protection 50% 50%
Insurance 100% 0%
Source: IPART, Review of bulk water charges for State Water, June 2010, p. 108.
The ACCC considers that the cost sharing ratios proposed by State Water reflect those approved by the NSW Government and by IPART at the last determination.26 Table 1-14 shows the ACCC’s decision on total revenue and the user and government shares of that revenue.
26 IPART, Review of bulk water charges for State Water, June 2010, p. 108.
ACCC Draft decision on State Water Pricing Application: 2014-15 – 2016-17 | Attachments 24

Table 1-14 ACCC’s decision on user and government shares of total revenue
Valley Share type 2014–15 2015–16 2016–17
Border User 1.6 1.6 1.6
Government 0.2 0.2 0.2
Gwydir User 5.1 5.4 5.8
Government 6.8 7.1 7.4
Namoi User 5.6 5.8 5.9
Government 9.3 11.0 12.6
Peel User 1.4 1.4 1.5
Government 2.2 2.8 2.9
Lachlan User 7.1 7.6 8.2
Government 5.2 5.5 5.9
Macquarie User 7.0 7.4 7.8
Government 4.1 5.0 5.1
Murray User 5.4 5.5 5.6
Government 1.1 1.1 1.1
Murrumbidgee User 9.6 10.0 10.0
Government 6.4 6.4 6.5
Lowbidgee User 0.5 0.6 0.7
Government n/a n/a n/a
Fish River User 10.2 10.5 10.8
Government n/a n/a n/a
Source: ACCC analysis. Note: n/a – not applicable.
The ACCC applies smoothing to the revenue to be recovered from users. This reduces the variation in prices resulting from variability in the unsmoothed building block revenue over the regulatory period. The smoothed and unsmoothed revenue streams are equal in terms of NPV. This ensures that State Water is able to recover the user share of prudent and efficient costs from regulated charges. Table 1-15 presents the ACCC draft decision on State Water’s smoothed revenue requirement and X factors for each of the ACCC regulated valleys.
25 ACCC Draft decision on State Water Pricing Application: 2014-15 – 2016-17 | Attachments

Table 1-15 ACCC’s draft decision – State Water smoothed revenue requirement by valley ($m, nominal)Valley 2014–15 2015–16 2016–17
Border Smoothed revenue 1.5 1.6 1.6
X factors 0.64% 0.64%
Gwydir Smoothed revenue 5.1 5.5 5.8
X factors -4.05% -4.05%
Namoi Smoothed revenue 5.6 5.8 6.0
X factors -0.76% -0.76%
Peel Smoothed revenue 1.4 1.4 1.5
X factors -0.82% -0.82%
Lachlan Smoothed revenue 7.2 7.7 8.2
X factors -4.26% -4.26%
Macquarie Smoothed revenue 7.0 7.4 7.8
X factors -2.63% -2.63%
Murray Smoothed revenue 6.5 6.5 6.5
X factors 1.97% 1.97%
Murrumbidgee Smoothed revenue 10.2 10.4 10.6
X factors 0.29% 0.29%
Lowbidgee Smoothed revenue 0.5 0.6 0.6
X factors -5.86% -5.86%
Fish River Smoothed revenue 10.2 10.5 10.8
X factors -0.71% -0.71%
Source: ACCC analysis. Note: A negative X factor represents a real price increase.
1.4.2 Sensitivity analysisThe ACCC has conducted sensitivity analyses to measure the effect of adopting State Water’s proposed building block inputs compared to the ACCC’s draft decision on total revenue. The scenarios considered:
The WACC parameters
Capital expenditure
Operating and maintenance expenditure.
The tables below present the effect of the State Water inputs relative to the ACCC’s draft decision on the user share of revenue used to determine regulated charges.
ACCC Draft decision on State Water Pricing Application: 2014-15 – 2016-17 | Attachments 26

1.4.3 Weighted average cost of capital The ACCC’s decision on the rate of return is 7.44 per cent. State Water proposed a rate of return of 8.96 per cent. The ACCC’s decision does not accept State Water proposed WACC parameters of risk free rate, equity beta, and debt risk premium. If the ACCC were to adopt State Water proposed WACC parameters, total revenue would $34.9 million ($, nominal) or 12.3 per cent higher for each individual valley.
Table 1-16 presents the difference in total revenue when adopting State Water’s WACC parameters for each individual valley.
Table 1-16 ACCC’s draft decision on State Water’s total unsmoothed revenue when adopting State Water’s WACC parameters
ACCC draft decision
WACC (per cent)
State Water proposal
WACC (per cent)
Change in revenue ($m, nominal)
Change in revenue (per cent)
Total 7.44% 8.95%27 34.9 12.3%
Source: ACCC analysis.
1.4.4 Forecast capital expenditure The ACCC has approved a capex allowance of $158.2 million ($, nominal) for the 2014–17 regulatory period. This differs from State Water’s proposed capex allowance of $212.0 million ($, nominal). The ACCC’s decision reflects reductions in expenditure and changes to the timing of certain expenditures. If the ACCC were to adopt State Water’s proposed capex allowance, State Water’s total revenue would be $9.6 million ($, nominal), or 3.2 per cent higher.
Table 1-17 ACCC’s draft decision on State Water’s total unsmoothed revenue when adopting State Water proposed capex forecast
ACCC draft decision capex ($m, nominal)
State Water proposal capex ($m, nominal)
Change in revenue ($m, nominal)
Change in revenue (per cent)
Border 0.3 1.0 0.2 2.9%
Gwydir 17.5 23.1 1.5 3.9%
Namoi 52.6 60.6 1.3 2.5%
Peel 18.8 22.0 0.5 3.7%
Lachlan 25.9 33.9 1.7 4.4%
Macquarie 24.2 34.2 1.8 5.0%
Murray 2.5 5.8 0.7 3.4%
Murrumbidgee 3.3 6.7 0.7 1.5%
Lowbidgee 1.7 1.9 0.0 1.6%
Fish River 12.4 22.9 0.7 2.3%
Total 158.2 212.0 9.1 3.2%
Source: ACCC analysis.
27 State Water’s proposed WACC parameters result in a WACC of 8.95 per cent. Therefore, State Water’s revenue modelling applies a WACC of 8.95 per cent, and not 8.96 per cent as per State Water’s pricing application.
27 ACCC Draft decision on State Water Pricing Application: 2014-15 – 2016-17 | Attachments

1.4.5 Operating expenditureThe ACCC has approved an opex allowance of $121.4 million ($, nominal) for the 2014–17 regulatory period. This differs from State Water’s proposed opex allowance of $134.0 million ($, nominal). If the ACCC were to adopt State Water’s proposed opex allowance, State Water’s total revenue would be $12.7 million ($, nominal), or 4.5 per cent greater.
Table 1-18 ACCC’s draft decision on State Water’s total unsmoothed revenue when adopting State Water’s proposed opex forecast
ACCC draft decision opex ($m, nominal)
State Water proposed opex ($m, nominal)
Change in revenue ($m, nominal)
Change in revenue (per cent)
Border 4.5 5.1 0.5 10.1%
Gwydir 12.5 13.5 1.0 2.6%
Namoi 14.8 15.5 0.7 1.4%
Peel 3.9 5.4 1.4 11.8%
Lachlan 16.8 19.1 2.3 5.8%
Macquarie 17.0 19.8 2.7 7.6%
Murray 11.1 13.5 2.3 12.4%
Murrumbidgee 23.4 25.5 2.1 4.4%
Lowbidgee 1.7 2.1 0.5 25.2%
Fish River 15.7 14.6 -1.1 -3.3%
Total 121.4 134.0 12.7 4.5%
Source: ACCC analysis. Note: Numbers may not add due to rounding.
1.5 Corporate tax allowanceThe ACCC has historically adopted a nominal post-tax framework for establishing the building block approach to determining revenue requirements.28 Under the post-tax framework, tax liabilities are explicitly modelled in the cash flows with a separate corporate income tax allowance included as a building block. State Water has adopted the nominal post-tax framework to derive its proposed revenue requirement at the individual valley level. State Water is a state owned corporation, registered under the NTER.29 The NTER requires government owned corporations be subject to taxation laws that facilitate competitive neutrality with privately owned corporations.
The ACCC considers the nominal post-tax approach estimates benchmark corporate tax costs more accurately and more closely aligned with timing of actual tax liabilities.30 In modelling the revenue building blocks, the transition to the nominal post-tax approach requires an explicit calculation of the cost of corporate tax allowance. This calculation is to be based on the expected prudent and efficient costs approved by the regulator. An operator’s application to levy regulated charges requires
28 ACCC, Pricing principles under the WCIR, July 2011, p. 29;ACCC, Statement of principles for the regulation of electricity transmission revenues, December 2004, p. 4.
29 State Water application, p.119.30 ACCC, Pricing principles under the WCIR, July 2011, p. 29.
ACCC Draft decision on State Water Pricing Application: 2014-15 – 2016-17 | Attachments 28

providing information regarding tax liabilities relating to the provision of infrastructure services in each year of a regulatory period. This includes:31
carried forward tax losses
tax depreciation.
The ACCC accepts State Water’s proposal to not include an estimate of the cost of corporate tax allowance during the 2014–17 regulatory period. State Water proposed not to include a cost of corporate tax building block because it does not expect to incur any tax liabilities during the 2014–17 regulatory period. State Water has noted significant accumulated tax losses of $201 million (nominal) based upon its 30 June 2012 NTER tax return.32 These losses are expected to offset expected profits over the 2014–17 regulatory period. In addition, tax losses will likely accumulate over the 2014–17 regulatory period. That is, it is unlikely that State Water will generate any taxable profits over the next three years. This is indicated by the level of State Water’s proposed revenue relative to the level of allowable expenses for tax purposes available under the NTER, including accelerated tax depreciation. The ACCC has reviewed material submitted by State Water and accepts that State Water is unlikely to incur a tax liability in any year of the 2014–17 regulatory period.
The ACCC expects that State Water will comply with the information requirements under the WCIR for its pricing application for regulated charges from July 2017. These include providing information regarding the cost of corporate tax. The ACCC considers there are issues for State Water to address regarding the explicit estimation of the cost of corporate tax building block for the regulatory period commencing 1 July 2017. These include:
establishing the value of the opening tax asset base
determining the value of any accumulated tax losses
the allocation of tax losses carried forward between State Water’s regulated and unregulated businesses
the allocation of tax losses carried forward between State Water’s individual valleys.
Tax depreciation cannot be modelled in the absence of an established value for the opening tax asset base for the 2014–17 regulatory period. Furthermore, State Water is uncertain of how much of the existing tax loss carried forward it should attribute to the ACCC regulated valleys. The ACCC considers that these issues affecting State Water’s ability to comply with its information requirement need to be resolved prior to the end of the 2014–17 regulatory period.
1.5.1 Establishing the tax asset baseThe explicit cash flow modelling of the tax building block requires an opening tax asset base. This is required to estimate the tax depreciation allowable in each year of a regulatory period. The tax depreciation allowances may differ from the value of regulatory depreciation. This is because the tax regime allows different rates of depreciation and the choice of method used to depreciate assets. Therefore, the opening value of the tax asset base may be significantly different to the opening RAB.
31 WCIR, Schedule1, s. 10.32 State Water, Pricing application to the ACCC, June 2013, p. 119-20.
29 ACCC Draft decision on State Water Pricing Application: 2014-15 – 2016-17 | Attachments

State Water is currently developing a tax asset register to determine a tax asset base value of its regulated assets during the next regulatory period.33 State Water noted that establishing a tax asset base would be a difficult exercise. This is because it entails attributing past tax losses across regulated and unregulated segments of the business, as well as individual valleys. The ACCC acknowledges that in determining a value for the tax asset base, certain assumptions may be required to accommodate instances of incomplete information.
Once established, the value of the tax asset base will represent the total future depreciation allowable for tax purposes used in calculating the cost of corporate tax. This will enable the ACCC to determine whether State Water has adequate cash flows to cover its prudent and efficient costs under the WCIR from the commencement of the next regulatory period on 1 July 2017. The ACCC considers State Water will need to propose an opening tax asset base in its pricing application for regulated charges from 1 July 2017. The ACCC notes that the precedence set by the Australian Energy Regulator (AER) may guide State Water’s proposal. This is because the AER has assessed the establishment of opening tax asset bases when energy network service providers were transitioning from pre-tax to post-tax regulatory regimes.34 Information required to establish State Water’s tax asset base includes the following:
State Water’s date of corporatisation or the date it was first subject to taxation (or the NTER)
the tax value of assets as at the date of corporatisation, in sufficient detail to distinguish RAB assets from any non-RAB assets, taking into account any revaluations that may have occurred
the vintage profile of the RAB assets when first subject to tax (including any capex undertaken prior to the commencement of regulation)
the tax depreciation rates or tax effectives lives applied to particular vintages of assets
roll forward of the tax value to commencement of the post-tax approach taking account of relevant tax depreciation provisions and actual capex and disposals.35
The ACCC considers that, consistent with the pricing principles, recognising capex on an as-commissioned basis provides an appropriate estimate of tax depreciation to roll forward the tax asset base.36
State Water has proposed significant accumulated tax losses to carry forward. These losses are primarily due to the claim for accelerated depreciation of its water facility infrastructure. The claim for accelerated depreciation for tax purposes indicates the divergence of the tax asset base from the RAB.
State Water’s ability to claim accelerated depreciation and accumulate tax losses provides a benefit to State Water. These benefits include the deferral of tax under the NTER. This is in lieu of the implicit value of tax approved under the pre-tax rate of return applied in previous regulatory periods. The IPART pre-tax framework assumed a tax effective rate equal to the corporate tax rate of 30 per cent. Tax scenarios can show the magnitude of the difference in revenues between the pre-tax framework’s implicit tax allowance and post-tax framework. That is, State Water’s claim for accelerated
33 State Water, Pricing application to the ACCC, June 2013, p.120.34 AER, New South Wales – Draft distribution determination 2009–10 to 2013–14, November 2008, pp. 204–10.;
AER, Queensland – Draft distribution determination 2010–11 to 2014–15, November 2009, pp. 214–17.35 AER, 2007, Issues paper – Electricity distribution network service providers, Transition of energy businesses from
pre-tax to post-tax regulation, June 2007, p. 12.36 ACCC, Pricing principles under the WCIR, July 2011, p. 45.
ACCC Draft decision on State Water Pricing Application: 2014-15 – 2016-17 | Attachments 30

depreciation and accumulated tax losses since the date of corporatisation may result in an effective tax rate significantly lower than the assumed 30 per cent. Therefore, State Water is likely to have received compensation for the future costs of tax when no tax would have been payable.
The ACCC considers that at the next pricing application from 1 July 2017, it will assess the magnitude of any excess revenues attributable to State Water arising from the transition from pre-tax to post-tax regimes. This will allow the ACCC to determine whether an adjustment of future revenues is required. The ACCC would make such an adjustment on the basis that deferred taxation due to State Water’s claim for accelerated depreciation and accumulated tax losses represents the cost of tax imposed upon users implicit in current prices. The claims for accelerated depreciation also lower the value of the tax asset base. This reduces the future depreciation expense for tax purposes. The outcome would provide State Water with a higher level of taxable income and cost of corporate tax allowance under the post-tax approach.
The information required to establish the tax asset base would assist in calculating the benefit received and the adjustment factor resulting from overestimating the cost of corporate tax implicitly approved under the previous pre-tax regime. Adjusting future revenues for past over-recovery of tax costs could take the form of adjusting the RAB. This would facilitate transferring the benefit from State Water to users through lower future prices. Assuming lower future prices and hence revenues, such an adjustment would defer the expected cost of tax imposed beyond the current expected level of accumulated tax losses and future tax losses.
1.5.2 Accumulated tax lossesThe ACCC considers that establishing the value of any accumulated tax losses at the commencement of the regulatory period is required to accurately estimate the benchmark tax payable using explicit cash flow modelling. State Water has proposed a significant accumulated tax loss carried forward since the date of corporatisation on 1 June 2004.37 These tax losses are associated with claims for operating losses, accelerated depreciation for water facility infrastructure and timing differences in relation to accounting for provisions.38 State Water stated that accelerated depreciation in earlier regulatory periods was the primary reason for the accumulated tax losses as at 1 July 2014.39
State Water’s proposed value of its accumulated tax losses are the result of claims for accelerated depreciation in respect of water facility infrastructure under sub-division 40F of the Income Tax Assessment Act (ITAA) 1997. State Water did not allocate tax losses between regulated and non-regulated parts of the business. State Water also stated that it did not believe it was feasible to do so.40 State Water submitted that its analysis indicated it would not earn a taxable profit to fully utilise the accumulated tax losses until after 30 June 2017.
Table 1-19 presents State Water’s forecast taxable profit (loss) for the period from 2012–13 to 2016–17.
37 State Water’s proposed accumulated tax loss position is not separated between the regulated and non-regulated segments of its business.
38 State Water, Pricing application to the ACCC, June 2013, pp. 119–120.39 State Water, Pricing application to the ACCC, June 2013, p.120.40 State Water, Pricing application to the ACCC, June 2013, p.120.
31 ACCC Draft decision on State Water Pricing Application: 2014-15 – 2016-17 | Attachments

Table 1-19 State Water’s forecast taxable profit (loss) 2012–13 to 2016–17 ($m, nominal)
2012–13 2013–14 2014–15 2015–16 2016–17
Net profit before tax 50.0 45.1 37.2 37.1 42.8
40F claim –59.0 –68.7 –57.8 –45.5 –30.6
Other timing differences
4.7 4.2 4.5 8.6 9.4
Estimated tax able profit
–4.3 –19.4 –16.1 0.2 21.6
Source: State Water, Pricing application, p. 120
The ACCC will be able to assess the validity of these claims when State Water provides sufficient details of accumulated tax losses and establishes its opening tax asset base at the next price review. The ACCC expects that details supporting the values of tax loss carried forward and opening tax asset base will be established from the date of corporatisation or the date State Water first became subject to the NTER.
The ACCC considers the ability to accrue tax losses by bringing forward tax depreciation expenses during a period of lower revenue has enabled State Water to offset future tax liabilities when expected revenues may be higher. Until State Water has fully utilised its accumulated tax losses, this represents a benefit to State Water in the form of reduced or zero tax liabilities. In approving regulated charges, the ACCC is to have regard to the total forecast revenue required to meet the prudent and efficient costs of providing infrastructure services.41 To the extent that State Water’s accumulated losses prevent it from incurring a tax liability in each year of a regulatory period, the resulting zero cost of corporate tax is the prudent and efficient cost of tax in that regulatory period. Therefore, the ACCC considers a zero allowance for the cost of corporate tax satisfies the requirement of clause 29(2)(b)(i) of the WCIR.
41 WCIR, clause 29(2)(b)(i).
ACCC Draft decision on State Water Pricing Application: 2014-15 – 2016-17 | Attachments 32

2 Operating expenditureOperating expenditure (opex) is the operating, maintenance and other non-capital costs that are incurred by State Water in providing water storage and delivery services. Opex is an important component of the building block model which we use to assess the total revenue State Water needs to provide water storage and delivery services.
Opex is not added to State Water’s regulatory asset base. State Water recovers its opex from users through charges levied in the same year in which the opex is incurred. State Water proposes to levy bulk water charges, metering charges, and charges for miscellaneous or ancillary services. State Water forecasts incurring opex in the 2014-17 regulatory period in providing each of the services related to these charges. This attachment assesses State Water’s forecast opex incurred in providing bulk water services provided in consideration for bulk water charges. The assessment of other forecast opex is in attachment 2.
State Water forecasts bulk water services opex in the Murray-Darling Basin of $127.51 million (real $2013-14) in aggregate over the 2014–17 period. Based on the cost sharing arrangements outlined in the Draft Decision, State Water’s forecast opex has a user share of $117.57 million (real $2013-14) in aggregate over the 2014–17 period. Figure 2-1 outlines State Water’s forecast opex.42
Figure 2-1 Opex for bulk water charges (millions, real $2013–14)43
Source: ACCC analysis. State Water Application
2.1 Draft decisionThe ACCC does not consider State Water’s forecast of opex to be prudent and efficient. Accordingly, our draft decision is to not approve State Water’s forecast opex and to determine it as set out below. The ACCC's reasons for this draft decision are summarised below. The ACCC considers that:42 State Water, building block model ‘2013-07-18 State Water Building Block Master – public version.xls’, attachment to
pricing submission, June 2013. 43 2013-14 is based on a budget estimate provided by State Water
33 ACCC Draft decision on State Water Pricing Application: 2014-15 – 2016-17 | Attachments

State Water’s proposed step increases in opex for changes in regulatory obligations are too high. The ACCC considers that a number of obligations do not represent a material change, and that in some areas a lower cost solution to the changed obligation is available.
a number of proposed step increases in opex to address non-recurrent expenditure are not justified. The ACCC considers that in many instances the base opex already includes amounts sufficient to recover non-recurrent expenditure
State Water’s proposed discretionary projects are generally prudent as they are endorsed by customers, but could be achieved at a lower cost.
State Water’s forecast changes in input prices are not realistic.
past performance indicates that State Water is likely to achieve a larger efficiency gain that it has proposed.
The ACCC considers that $115.57 million (real $2013–14) is a more prudent and efficient aggregate forecast opex for the regulatory period. This represents a forecast opex that is 9 per cent lower than State Water’s proposed opex. Based on the cost sharing arrangements outlined in the Draft Decision, the ACCC’s forecast of prudent and efficient opex has a user share of $106.12 million (real $2013-14) in aggregate over the 2014–17 period. Figure 2-1 outlines the ACCC’s draft decision on opex.
The ACCC applied the assessment approach outlined in section 2.2 below to assess the prudency and efficiency of State Water’s forecast opex and to determine an appropriate substitute forecast. The ACCC engaged Deloitte to review the prudency and efficiency of State Water’s opex forecasts. The ACCC’s reasons for not accepting State Water’s forecast opex are outlined in further detail in sections 2.3 to 2.9 below.
Changes to data since proposal
The historical cost data accompanying State Water’s regulatory proposal included an estimate of the expenditure incurred in 2012-13, as State Water was 11 months into the year at the time of submitting its proposal. State Water has subsequently provided actual 2012-13 opex figures.44
State Water also provided revised forecasts of opex for the years 2013–14 to 2016–17 that corrected for: 45
An erroneous under-allocation of corporate overheads.
Incorrect inclusion of GST in the cost of its hydrometric monitoring agreement with NOW.
The revisions are shown in Table 2-1.
44 State Water Corporation, Response to information request number 8.1 from the Australian Competition and Consumer Commission, June 2013, page 1.
45 State Water Corporation, Response to information request number 8.1 from the Australian Competition and Consumer Commission, June 2013, page 1.
ACCC Draft decision on State Water Pricing Application: 2014-15 – 2016-17 | Attachments 34

Table 2-1 Estimated and actual base opex (millions, real $2013–14)Original proposal Revised proposal
2012-13 2013-14 2014-15 2015-16 2016-17 2012-13 2013-14 2014-15 2015-16 2016-17
Total 36.8 37.95 42.67 42.04 41.77 37.28 38.36 43.02 42.38 42.11
Border 1.37 1.48 1.62 1.6 1.51 1.42 1.5 1.65 1.63 1.53
Fish River 4.51 4.19 4.61 4.53 4.51 4.75 4.26 4.69 4.61 4.59
Gwydir 3.95 4.01 4.35 4.24 4.19 3.91 4.03 4.36 4.24 4.2
Lachlan 5.15 5.48 6.18 6.1 5.74 5.27 5.52 6.24 6.16 5.8
Lowbidgee - - 0.77 0.65 0.6 - - 0.77 0.65 0.6
Macquarie 5.02 5.36 6.11 6.14 6.48 5.18 5.41 6.13 6.16 6.5
Murray 3.46 3.89 4.42 4.02 4.18 3.77 3.98 4.51 4.11 4.27
Murrumbidgee 7.36 7.35 8.1 8.01 8.08 7.17 7.39 8.12 8.04 8.11
Namoi 4.73 4.88 4.99 4.86 4.83 4.61 4.92 5.01 4.89 4.85
Peel 1.25 1.33 1.54 1.88 1.65 1.21 1.34 1.54 1.89 1.66Source: State Water Corporation; ACCC analysis.
2.2 The base-and-step assessment approachThe ACCC must not approve State Water’s proposed charges unless satisfied that:46
the total forecast revenue for the 2014–17 period is reasonably likely to meet the prudent and efficient costs of providing infrastructure services in that period; and
the forecast revenue from regulated charges is reasonably likely to meet that part of the prudent and efficient costs of providing infrastructure services that is not met from other revenue.
If the ACCC does not approve State Water’s charges, it must determine alternate charges that would satisfy the efficiency and prudency criteria. The ACCC must also have regard to the Basin water charging objectives and principles when approving or determining regulated charges.47
The ACCC must therefore assess the prudency and efficiency of that part of forecast opex that is met by State Water’s regulated bulk water charges. The ACCC has done this by developing its own forecast of prudent and efficient opex for the 2014–17 period and comparing this forecast to State Water’s proposed opex. The ACCC’s approach is to not approve State Water’s proposed opex if it materially differs from the ACCC’s forecast of prudent and efficient opex, and if necessary, determine opex based on the ACCC’s forecast.
The ACCC’s forecast is at the level of total bulk water opex for each valley; the comparison and determination of opex was not undertaken for individual categories or types of opex. Conducting an assessment at the total opex level allows for greater consideration of the contingencies and trade-offs between various opex categories, as well as the deliverability of the opex program as a whole.
The ACCC’s forecast of State Water’s prudent and efficient opex for the 2014–17 period is centred on the base-and-step forecasting method, which involves:
Establishing a base opex amount that represents the opex required by State Water to fulfil its obligations given all the relevant circumstances expected to ordinarily and consistently occur over the forecast period.
46 Rule 29(2) of the WCIR.47 Rule 29(4) of the WCIR.
35 ACCC Draft decision on State Water Pricing Application: 2014-15 – 2016-17 | Attachments

Estimating the step changes to the base opex that are required for State Water to respond to material changes in relevant circumstances that are realistically expected to occur over the forecast period, including:
Indexing to reflect changes in input costs over time
Productivity adjustments.
The ACCC considers that the forecast opex derived from its base-and-step method is a reasonable estimate of prudent and efficient costs. The ACCC considers that the base-and-step method derives prudent and efficient forecasts because it focuses on comparative analysis and the use of actual or ‘realised’ costs that reflect revealed efficiency.
A simple description of efficiency may be ‘producing more with less’.48 This statement infers comparisons, such as producing more outputs or using less inputs (or both) than the business has in the past or than other businesses (all other things equal). Considerations of efficiency therefore require comparative analysis.
The ACCC’s base-and-step method is a comparative method. Wherever possible and appropriate, the ACCC estimates base opex and step change amounts by comparison to costs incurred in the past by State Water or other similar infrastructure operators when undertaking similar activities. The base opex determined by the ACCC represents about 98 per cent of State Water’s aggregate opex determined by the ACCC for the 2014–17 period. The base opex—and therefore a significant amount of total opex—is directly determined by State Water’s past performance and the amount of opex that State Water has revealed as sufficient to meet its obligations given its current circumstances. The revealed cost of meeting current obligations and circumstances is then confirmed as prudent and efficient through benchmarking State Water’s performance against those of its peers (see section 2.9.1).
Comparative analysis that utilises actual or ‘realised’ data provides an objective, transparent, and repeatable method of assessing efficiency. Comparisons to idealised alternatives may be used in situations where the ACCC assesses details of individual step changes, for which reliably comparable actual or ‘realised’ data may not available due to the specificity of the project. In these instances the comparative analysis utilises idealised alternatives derived by the ACCC using industry expertise on what courses of action may be achievable in the circumstances.
The ACCC considered arguments raised by State Water and other stakeholders for step changes to base opex.
Amounts of opex proposed by State Water that represent a step change from base opex but are without supporting justification have not been added to base opex in the ACCC’s forecast.
The ACCC’s assessment of base opex is outlined in section 2.3. The ACCC’s assessment of various types of step changes is outlined in sections 2.4 to 2.9.
48 This description best applies to productive efficiency and dynamic efficiency. Allocative efficiency is best addressed through pricing structures and choice of pricing model (eg. building block model verses others), rather than the opex assessment.
ACCC Draft decision on State Water Pricing Application: 2014-15 – 2016-17 | Attachments 36

2.3 Base opexThe base opex amount should represent the opex required by State Water to fulfil its obligations given all the relevant circumstances expected to ordinarily and consistently occur over the forecast period (2014–17).
The ACCC considers that the base opex should be derived from actual opex incurred in the most recently completed full financial year for which data is available, which in this case is 2012–13. The ACCC’s draft decision on the base opex amount is shown in Table 2-2.
Table 2-2 Base opex (millions, real $2013–14)Base opex
Total 37.29Border valley 1.41Fish River valley 4.72Gwydir valley 3.84Lachlan valley 5.18Lowbidgee valley 0.53Macquarie valley 5.10Murray valley 3.75Murrumbidgee valley 7.03Namoi valley 4.54Peel valley 1.18Source: State Water Corporation; ACCC analysis.
The current financial year (2013–14) represents the current obligations and circumstances faced by State Water, and the ACCC’s starting assumption is that these obligations and circumstances will ordinarily continue into the future. Any changes relative to State Water’s current obligations and circumstances that are forecast to occur in the future can be considered as step changes to the base amount.
However, the current financial year has not yet been fully completed, and as such information on the opex required to meet current obligations and circumstances is not fully known. The most recently completed full financial year represents the most recent obligations and circumstances for which we have relevant opex data. Any new obligations and circumstances that State Water faced in 2012–13 from those it currently faces in 2013-14 can be considered in the context of step changes to the base amount.
Setting base opex at the level of opex incurred in the most recently completed full financial year ensures that the base opex reflects the current obligations and circumstances faced by State Water. However, further analysis is required to determine whether or not the base opex amount represents the prudent and efficient opex required given these obligations and circumstances.
In assessing the prudency and efficiency of opex, the ACCC considered the incentives faced by State Water. In this case, the ACCC notes that IPART set price controls for State Water in advance of the start of the period for which the prices applied.49 This provided incentives for State Water to:
avoid increasing costs beyond the level that can be recovered through the pre-determined prices
reduce costs below forecast and increase the return to its shareholders.
49 IPART, Final Report, Review of bulk water charges for State Water Corporation From 1 July 2010 to 30 June 2014, June 2010.
37 ACCC Draft decision on State Water Pricing Application: 2014-15 – 2016-17 | Attachments

The ACCC then considered the extent to which State Water has been, and is likely to continue to, respond to the incentives created by the regulatory framework. The ACCC found that, while not consistently outperforming the regulatory allowances set by IPART, State Water has historically demonstrated that it has been responding to the incentives in the regulatory framework (discussed further in section 2.9.1). State Water has met both ‘catch-up’ and ‘continuing’ efficiency targets built into regulatory allowances.50
To further examine the efficiency of base opex, the ACCC undertook a detailed engineering review of State Water’s base opex, as well as benchmarking of State Water’s base opex to the opex of other Australian water utilities. The ACCC found that (discussed further in section 2.9.1):
State Water’s asset management practices appear in line with good industry practice.51
State Water compares well to other Australian water utilities.52
State Water used a base-and-step approach to develop its forecast opex, but used budgeted opex amounts for 2013–14 as the base amount.53 Differences between the 2012–13 actual opex and State Water’s 2013–14 budgeted opex have been assessed as step changes in sections 2.4 to 2.9.
Actual opex incurred in 2012–13 is the initial amount of the ACCC’s base opex. The ACCC then adjusted reported actual opex to:
include actual 2012–13 costs incurred for Lowbidgee valley
exclude actual 2012–13 costs incurred for environmental gauging stations
correct for a cost reporting error relating to radio tower lease costs.
These adjustments to base opex are discussed in further detail below.
2.3.1 New regulated chargesThe ACCC assesses initial base opex as the amount of opex incurred in 2012–13 in providing the bulk water services that were regulated in 2012–13. State Water proposes to introduce the following new regulated charges for the 2014–17 period:
Bulk water charges for the Lowbidgee valley54
Metering charges for environmental gauging stations55
Previously, costs of providing bulk water services in the Lowbidgee valley were recovered from customers through an unregulated area-based charge.56 These costs are not included in the initial base opex as they relate to charges that were at that time (2012–13) unregulated. State Water is proposing to align the charging arrangements in Lowbidgee with those in other valleys. Bulk water storage and delivery costs for the Lowbidgee valley would then be recovered through regulated bulk water charges. To account for State Water’s proposed change to its pricing arrangements, the ACCC adjusted base opex to include the opex incurred in the Lowbidgee valley in 2012–13. This ensures
50 Deloitte Access Economics, Expenditure forecast review: State Water Corporation: Report to the ACCC and under Part 6 of the Water Charge (Infrastructure) Rules 2010, November 2013 (Deloitte report), pp. 18-19.
51 Deloitte report, pp. 35, 65.52 Deloitte report, pp. 20–23.53 State Water Corporation, Pricing Application to the Australian Competition and Consumer Commission for Regulated
Charges to Apply from 1 July 2014, June 2013 (State Water application), p. 45.54 State Water application, p. 157.55 State Water application, p. 181.56 State Water application, p. 157.
ACCC Draft decision on State Water Pricing Application: 2014-15 – 2016-17 | Attachments 38

that regulated bulk water opex and charges for the 2014–17 period reflect all the costs associated with providing regulated bulk water services.
In addition, costs of metering at identified environmental gauging stations were previously recovered through bulk water charges. These costs are therefore included in the initial base opex. However, for the 2014–17 period, State Water proposes to recover these costs through new separate metering charges instead of through bulk water charges. To ensure that these costs are not double-counted when determining prices for the 2014–17 period, the ACCC adjusted the initial base opex to exclude the amount of these costs incurred in 2012–13.
The adjustments are shown in Table 2-3.
Table 2-3 Adjustments for new regulated charges (millions, real $2013–14)Actual 2012-13 opex
Amount recovered through regulated
bulk water charges in 2012-13
Opex applicable to new environmental
gauging station charge
Opex incurred in the Lowbidgee valley
Amount relevant for forecasting future
regulated bulk water charges
Total 37.28 -0.306 0.533 37.50Border 1.42 -0.003 - 1.42Fish River 4.75 -0.001 - 4.75Gwydir 3.91 -0.051 - 3.86Lachlan 5.27 -0.057 - 5.21Lowbidgee - - 0.533 0.53Macquarie 5.18 -0.046 - 5.13Murray 3.77 -0.003 - 3.77Murrumbidgee 7.17 -0.082 - 7.08Namoi 4.61 -0.048 - 4.56Peel 1.21 -0.015 - 1.19Source: State Water Corporation; ACCC analysis.
2.3.2 Radio tower lease costs State Water submits that it has incurred radio tower lease costs annually since 2007–08, but that the costs for the five-year 2007–12 period were not recorded in their respective years and were instead erroneously recorded in the 2012–13 year. State Water submits that annual radio tower lease costs are approximately $43,000, while a total of $260,000 was recorded as radio tower lease costs in 2012–13.57 Accordingly, the ACCC has removed the additional $217,000 from the base opex as shown in Table 2-4.
57 State Water Corporation, Response to information request number 5.10 from the Australian Competition and Consumer Commission, June 2013, page 1.
39 ACCC Draft decision on State Water Pricing Application: 2014-15 – 2016-17 | Attachments

Table 2-4 Adjustment for radio tower lease and weir write-off costs (millions, real $2013–14)
Actual 2012-13 opex Adjustment for radio tower lease costs
Adjusted amount
Total 37.50 (0.217) 37.29Border 1.42 (0.008) 1.41Fish River 4.75 (0.036) 4.72Gwydir 3.86 (0.018) 3.84Lachlan 5.21 (0.028) 5.18Lowbidgee 0.53 - 0.53Macquarie 5.13 (0.030) 5.10Murray 3.77 (0.018) 3.75Murrumbidgee 7.08 (0.052) 7.03Namoi 4.56 (0.022) 4.54Peel 1.19 (0.007) 1.18Source: State Water Corporation; ACCC analysis.
2.4 Step changes – new regulatory obligationsThe ACCC considers it prudent and efficient for a business to comply with all relevant regulatory obligations. Therefore, a change in a regulatory obligation may require a step change in opex.
The ACCC generally considers an increase in opex to meet an existing regulatory requirement would be an efficiency loss, as it would represent a higher cost to meet the same requirement. Consequently a step change would not be required.
However, the ACCC also recognises an infrastructure operator should be provided with a reasonable opportunity to recover at least the efficient costs incurred in complying with a regulatory obligation or requirement. In some circumstances there may be external factors, beyond its control that might require an increase in expenditure to meet an existing regulatory requirement. In these circumstances, a step change may be required.
More broadly, the ACCC must consider the extent to which opex required to meet new or changed regulatory obligations may already be reflected in any productivity estimate that is applied to State Water’s opex. If a productivity estimate is derived from State Water’s historical performance, then this productivity estimate will take into account the opex historically incurred in meeting new or changed regulatory obligations. That is, the historical productivity estimate may have been larger (smaller) if less (more) opex was incurred to meet new or changed regulatory obligations. Similarly, if:
(1) the productivity estimate is derived from historical performance; and
(2) the forecast increase in regulatory costs over the 2014–17 period is consistent with the historical increase;
then step changes would not be required for new regulatory obligations.
There may be difficulty in determining the productivity impact of past regulatory obligation changes. Nonetheless, the ACCC is of the view that past changes in regulatory obligations must be considered when assessing State Water’s opex forecasts. Otherwise, applying productivity in the rate of change and adding step changes would overstate the prudent and efficient opex required.
The ACCC’s assessment of State Water’s forecast step changes in costs is set out below.
ACCC Draft decision on State Water Pricing Application: 2014-15 – 2016-17 | Attachments 40

2.4.1 Collection of crop statisticsState Water forecasts a step increase in opex for the collection of crop statistics.58 Table 2-5 shows State Water’s forecast step increase. The ACCC’s draft decision is to not approve State Water forecast step increase.
Table 2-5 Operating cost increases for the collection of crop statistics (millions, real $2013–14)
2014-15 2015-16 2016-17 Total
State Water forecast 0.173 0.173 0.173 0.519
ACCC Draft Decision - - - -
Source: State Water Corporation; ACCC analysis.
The Lachlan valley and Border rivers water supply work approvals require State Water to collect crop statistics from irrigation customers.59 The current work approval conditions commenced in July 2009 and November 2010 respectively. The ACCC considers that the base opex is sufficient for State Water to meet its current obligations, including crop statistic collection.
The NSW Irrigators’ Council (NSWIC) submitted the following:
“While NSWIC disputes this proposed cost item, we consider it appropriate that the ACCC consult with NSWIC Members in the Lachlan and Border River 32 valleys on this proposed cost item”.60
Lachlan Valley Water (LVW) disputed whether the collection of crop statistics was a regulatory requirement for State Water:
”The inclusion of a charge for collecting crop statistics on behalf of NSW Office of Water is not justified as these are not a water delivery requirement. LVW recommends that State Water recovers the cost of collecting crop statistics from NSW Office of Water”.61
Border Rivers Food and Fibre questioned the frequency of data collection:
“It is only necessary to collect crop statistics annually, once a year. It seems unnecessary to include these costs for collection of this data 4 times a year, when the current system of annual collection seems adequate”.62
The ACCC does not agree with LVW’s submission. Both the Lachlan valley and Border rivers’ water supply work approvals state that this is an obligation that State Water must fulfil.63 In relation to the submission from Border Rivers Food and Fibre, the ACCC agrees that the relevant clauses64 state the collection of crop statistics is to be on an annual basis as opposed to the quarterly collection proposed by State Water.
The current work approval conditions for the Lachlan and Border rivers commenced in July 2009 and November 2010 respectively. The ACCC considers that the base opex has been revealed as sufficient for State Water to meet its current obligations, including crop statistic collection.
58 State Water application, p. 47.59 Clause 35(f) in Lachlan Water Supply Work Approval. Clause 23(f) in Border Rivers Water Supply Work Approval.60 NSW Irrigators’ Council, Submission to Australian Competition and Consumer Commission, September 2013, p.28.61 Lachlan Valley Water, Submission to ACCC on State Water Regulated Charges 2014 – 2017, September 2013, p.13.62 Border Rivers Food and Fibre, Submission to the ACCC on the State Water Pricing Determination, September 2013,
p.3.63 Clause 35(f) in Lachlan Water Supply Work Approval. Clause 23(f) in Border Rivers Water Supply Work Approval.64 Clause 35(f) in Lachlan Water Supply Work Approval. Clause 23(f) in Border Rivers Water Supply Work Approval.
41 ACCC Draft decision on State Water Pricing Application: 2014-15 – 2016-17 | Attachments
State Water submits that it has not been fully compliant with its obligation to collect crop statistics and that an increase in opex is required to ensure full compliance in the future.65 However, the obligations to collect crop statistics have been in place since 2010-11 and historical opex (including the base amount) should reflect any increasing expenditure trend.
Therefore, the ACCC’s forecast opex has already taken into account State Water’s crop statistics obligations and the scope of the obligations. Therefore, no additional step increase to base opex for the collection of crop statistics is required.
2.4.2 Certification of environmental management systemState Water forecasts a step increase in opex to develop, implement and certify an Environmental Management System (EMS).66 Table 2-6 shows State Water’s forecast step increase. The ACCC’s draft decision is to not approve the forecast step increase in opex, and to determine a substitute step change as set out in Table 2-6.
Table 2-6 Operating cost increases for the environmental management system (millions, real $2013–14)
2014-15 2015-16 2016-17 Total
State Water Forecast 0.160 0.272 0.139 0.571
ACCC Draft Decision 0.160 0.202 0.068 0.430
Source: State Water Corporation; ACCC analysis.
State Water provided a detailed and transparent cost build-up that underpinned its forecast step increase for EMS costs. State Water’s cost build-up identified the internal and external resources required for EMS development, certification, and compliance auditing.67
State Water’s Operating Licence for 2013–18 requires State Water to develop, implement, and certify68 an EMS by 30 June 2018.69 The ACCC considers it prudent and efficient for State Water to comply with its regulatory obligations and therefore to develop, implement and certify an EMS. However, the ACCC considers that the prudent and efficient expenditure only requires certification in 2017–18 rather than 2015–16 as State Water proposes.
State Water submitted that it proposes certification in 2015–16 to, among other things, reduce the costs of compliance with its operating licence.70 State Water’s forecast of these cost savings ($69,000 over five years) is not sufficient to justify earlier certification in 2015–16.
The ACCC’s draft decision is to determine a lower step change as set out in Table 2-6 based on certification in 2017–18.
65 State Water Corporation, Response to information request number 8.40 from the Australian Competition and Consumer Commission, June 2013, page 2.
66 State Water application, p. 49.67 State Water, Response to information request number 20.3 from the Australian Competition and Consumer
Commission, June 2013, ‘ISO certification cost analysis – October 2012.xls’ attachment.68 That is, certified consistent with Australian Standard AS/NZS ISO 14001:2004: Environmental Management Systems
- Requirements with guidance for use. 69 See clauses 6.1.1(a) and 6.1.2(a) of State Water’s operating licence [IPART, State Water Corporation Draft
Operating Licence 2013-18, February 2013, page 12].70 Deloitte report, p. 53.
ACCC Draft decision on State Water Pricing Application: 2014-15 – 2016-17 | Attachments 42

2.4.3 Certification of asset management systemState Water forecast a step increase in operating activities for certification of its asset management system. However, State Water did not propose a step increase in opex for this activity, instead proposing that costs be met through its current cost base.71
State Water’s Operating Licence requires State Water’s asset management system (AMS) be consistent with, and certified against, the new international asset management standard72 by 30 June 2018.
The NSWIC’s submission objected to the upgrade of State Water’s AMS:
“NSWIC reiterates that we have continuously objected to the implementation of international standards for SWC's asset management. We continue to object to such a change and point to the significant cost increases that will be imposed on SWC's customers. NSWIC rejects the implementation of international standards for SWC's asset management as it causes a significant increase in costs without any evidence of any achieved benefits”.73
The ACCC’s disagrees with NSWIC’s submission, and notes that State Water proposes no additional cost burden from developing its AMS, and that the AMS will not result in cost increases that will be imposed on State Water’s customers. The ACCC’s draft decision is to approve State Water’s approach to costing the certification of its AMS. The ACCC considers it prudent and efficient for State Water to comply with its regulatory obligations and therefore take steps to ensure its AMS is consistent and certified. The ACCC also considers State Water’s approach to costing the certification of its AMS to be prudent and efficient.
2.4.4 New hydrometric monitoring agreement with NSW Office of WaterState Water forecast a step increase in opex for the higher purchase cost of hydrometric monitoring services from the NSW Office of Water (NOW).74
Table 2-7 shows State Water’s forecast step increase. The ACCC’s draft decision is to not approve State Water’s forecast step increase and to determine a substitute step increase.
Table 2-7 Operating cost increases for hydrometric monitoring services (millions, real $2013–14)
2014-15 2015-16 2016-17 TotalState Water Forecast 0.223 0.223 0.223 0.669
ACCC Draft Decision 0.100 0.100 0.100 0.299
Source: State Water Corporation; ACCC analysis.
State Water is obliged to monitor and report stream flow information to NOW and the Bureau of Meteorology. State Water obtains this information by purchasing river gauging and data management services from NOW under a service level agreement.75
71 State Water Corporation, Response to information request number 20.14 from the Australian Competition and Consumer Commission, October 2013, p. 1.
72 Australian Standard AS/NZS ISO 55001:2013: Asset Management- Management systems – Requirements.73 NSW Irrigators’ Council, Submission to Australian Competition and Consumer Commission, September 2013, p.30.74 State Water application, p. 45.75 Deloitte report, page 63.
43 ACCC Draft decision on State Water Pricing Application: 2014-15 – 2016-17 | Attachments
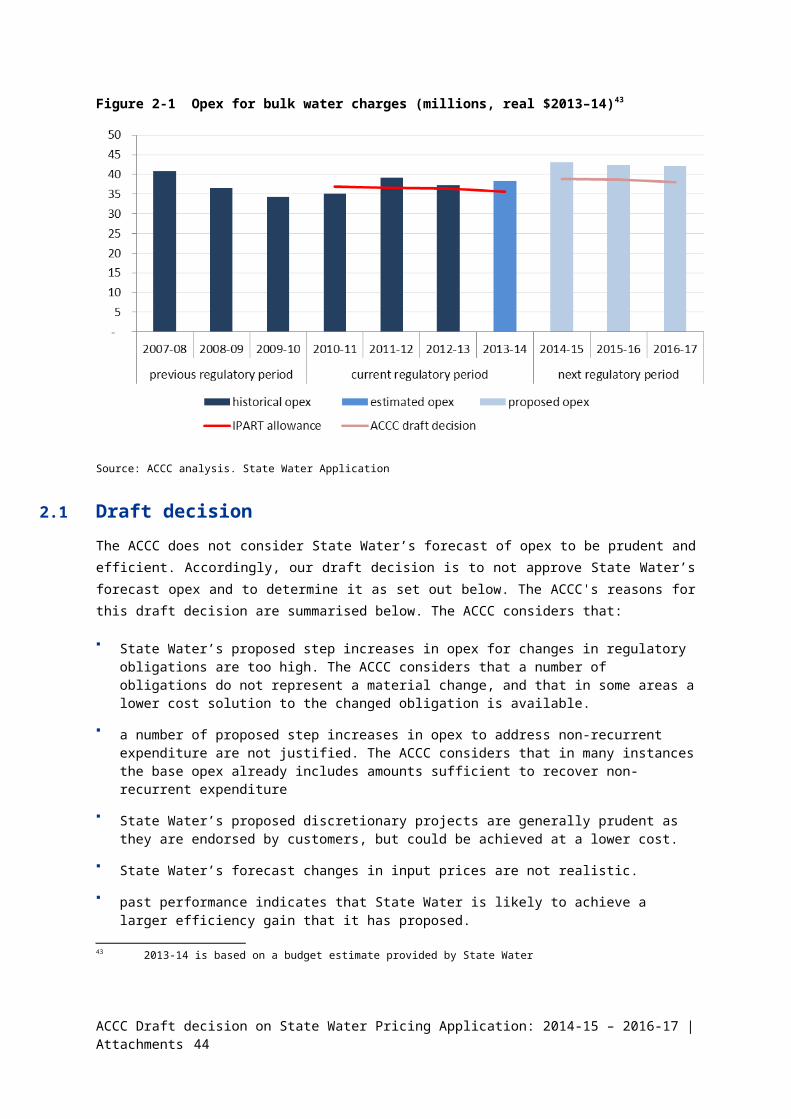
State Water’s current hydrometric monitoring service level agreement expires on 30 June 2014. State Water forecasts that a replacement service level agreement will require a step increase in opex, in part driven by an expanded scope of services including: 76
Upper Murrumbidgee rainfall and level sites (costing $101,000 (real $2013–14) per year)
Doppler equipment at Murrumbidgee sites (costing $22,500 (real $2013–14) per year)
The ACCC acknowledges that State Water has limited bargaining power in the purchase of hydrometric monitoring services and is a price-taker as NOW appears to be a monopoly provider of the services. Other service providers are unable to provide the range of services currently being provided by NOW, in particular as some services have legacy issues associated with them (e.g. data warehousing).77
However, the ACCC is not convinced that the expansion in services is prudent and efficient. The scope of State Water’s water storage and delivery operations have not materially changed over the course of the current regulatory period and there is no evidence that the current scope of the hydrometric monitoring agreement is insufficient for these operations.
The expansion in scope may represent an improvement in the services provided by State Water. In that case, such expansion would only be prudent if it resulted was endorsed by customers. No evidence has been provided that the expanded scope of the hydrometric monitoring agreement has broad customer endorsement. Accordingly, the ACCC does not accept State Water’s proposed step increase. The ACCC has determined a substitute step increase based on the removal of costs for Doppler equipment and the upper Murrumbidgee rainfall and level sites, as set out in Table 2-7.
2.4.5 Basin plan implementationState Water forecast a step increase in opex for the costs of implementing the Murray-Darling Basin Plan.78 .
Table 2-8 shows State Water’s forecast step increase. The ACCC’s draft decision is to not approve State Water’s forecast step increase.
Table 2-8 Operating cost increases for implementation of the Murray-Darling Basin Plan (millions, real $2013–14)
2014-15 2015-16 2016-17 Total
State Water forecast - 0.015 0.083 0.098
ACCC Draft Decision - - - -
Source: State Water Corporation; ACCC analysis.
State Water’s proposed step changes incorporate a number of smaller, discrete step changes that are all related to the implementation of different provisions of the Basin Plan. The Basin Plan implementation is scheduled to occur in stages until 2019.79
76 State Water Corporation, Response to information request number 5.16 from the Australian Competition and Consumer Commission, June 2013, page 2.
77 Deloitte report, p. 54.78 State Water application, p. 47.79 State Water Corporation, Response to information request number 30.14 from the Australian Competition and
Consumer Commission, November 2013, pages 1–2.
ACCC Draft decision on State Water Pricing Application: 2014-15 – 2016-17 | Attachments 44
Murray Irrigation submitted that additional opex related to the implementation of the Basin Plan should be covered by the Commonwealth Government:
“Murray Irrigation does not accept State Water’s claim that additional resources are required to implement the Murray Darling Basin Plan. The Basin Plan is a federal commitment and implementation costs should be funded by the Commonwealth. To this end, it is our understanding that the NSW Government is seeking Federal assistance for implementation costs of the Basin Plan. There should be no requirement for State Water to seek any costs associated with the Basin Plan, either for regulatory compliance or metering and monitoring activities, from their customers. Further, environmental water delivery carried out as part of the Murray-Darling Basin Plan is coordinated by the Commonwealth Environmental Water Holder who is obliged to pay the same delivery charges as other State Water customers and should not cause any increased cost burden to State Water”.80
The ACCC considers it reasonable that State Water would have to incur some opex implementing the Basin Plan. However, the ACCC considers that the base opex has been revealed as sufficient for State Water to meet its current obligations, including ongoing implementation of the Murray-Darling Basin plan.
Consultation on the Basin Plan began in November 2011, it came into effect in November 2012, and its implementation is scheduled to occur in stages until 2019.81 The ACCC acknowledges that State Water may in some years experience increasing costs as the Basin Plan is implemented, but considers that historical opex (including the base amount) should reflect this cost burden.
The ACCC acknowledges that there may be a period of higher costs as State Water responds to the implementation of the Basin Plan and the resultant obligations. However, the Basin Plan has been in place since 2011-12 and historical opex (including the base amount) should reflect the expenditure trend. Therefore, no additional step increase to base opex for the implementation of the Basin Plan is required.
2.4.6 Regulatory costsState Water forecast a step increase in opex for a higher regulatory information burden arising from a dual regulator (ACCC and IPART) framework, including the need to develop a tax asset base.82
Table 2-9 shows State Water’s forecast step increase. The ACCC’s draft decision is to not accept State Water’s forecast step increase and to determine a substitute step increase.
Table 2-9 Operating cost increases from new price review framework (millions, real $2013–14)
2014-15 2015-16 2016-17 Total
State Water forecast 0.267 0.160 0.160 0.587
ACCC Draft Decision 0.165 - - 0.165
Source: State Water Corporation; ACCC analysis.
Murray Irrigation stated that regulatory costs may even be lower under the ACCC compared to IPART:
“We do not accept the extent to which State Water claims regulatory costs will increase driven by the ACCC acquiring powers to regulate bulk water charges. Indeed it could be argued that the ACCC’s review process is less onerous than IPART’s process and therefore compliance and regulatory costs should decrease or, at the least, remain the same. Other
80 Murray Irrigation, Response to State Water Corporation’s Pricing application for regulated bulk charges - Submission to the Australian Competition and Consumer Commission, September 2013, p. 8.
81 Murray-Darling Basin Authority, MDBA.gov.au. 82 State Water Corporation, Response to information request number 5.6 from the Australian Competition and
Consumer Commission, June 2013, page 1.
45 ACCC Draft decision on State Water Pricing Application: 2014-15 – 2016-17 | Attachments

areas that may lead to increased regulatory burdens, such as the proposal to move to a revenue cap with annual price reviews are unnecessary and the associated costs can be avoided by not implementing them”.83
The ACCC does not agree with Murray Irrigation. The ACCC considers that there will be some initial costs associated with establishing a TAB. Notwithstanding this, the ACCC notes that it cannot foresee any other regulatory costs that would be anything other than normal operations for a regulated entity such as State Water.
State Water proposed costs of $164,672 (real $2013–14) in 2014–15 to develop a TAB. The ACCC considers that State Water’s proposed TAB costs are prudent and efficient given the work involved in developing a TAB for the 2017–21 price period.
2.4.7 Drinking water quality monitoring programState Water forecast a step increase in opex for the development and implementation of a drinking water quality monitoring program for its Fish River water supply scheme.84 Table 2-10 shows State Water’s forecast step increase. The ACCC’s draft decision is to accept State Water’s forecast step increase.
Table 2-10 Operating cost increases to develop drinking water quality monitoring program (millions, real $2013–14)
2014-15 2015-16 2016-17 TotalState Water Forecast 0.166 0.166 0.166 0.497ACCC Draft Decision 0.166 0.166 0.166 0.497Source: State Water Corporation; ACCC analysis.
The driver of the increase in opex is State Water’s obligation to comply with the Public Health Act 2010 (NSW), which stipulates that drinking water supply systems have an approved drinking water management plan in place by 1 September 2014.85 The Public Health Act 2010 (NSW) also provides an ongoing obligation (that commenced on 1 September 2012) for water carters (including water utilities that supply to water carters) to keep records of drinking water supplied. 86 State Water forecast that this necessitates an additional full time staff equivalent from 2013-14.
The ACCC considers it prudent for State Water to comply with its regulatory obligations and therefore develop and implement a drinking water quality monitoring program. The ACCC considers State Water’s forecast costs to be reasonable on the basis that the costs were developed through a detailed and transparent cost build-up that takes into account the relevant activities and is based on appropriate data sources. The ACCC’s draft decision is therefore to approve the forecast step increase.
2.5 Step changes – non-recurrent & cyclical expenditureAn infrastructure operator’s opex program will not be exactly the same from year to year. Some non-recurrent expenditure may be required over the forecast period that was not included in actual opex in the base year. Similarly, some non-recurrent expenditure will not be required over the forecast period due to the associated activity not taking place again. Consequently, if a particular activity was not undertaken in the base year this is not sufficient evidence to demonstrate a step change is required. 83 Murray Irrigation, Response to State Water Corporation’s Pricing application for regulated bulk charges - Submission
to the Australian Competition and Consumer Commission, September 2013, pp.7-884 State Water Corporation, Response to information request number 20.8 from the Australian Competition and
Consumer Commission, October 2013, page 1. 85 Part 3, Division 1.86 Clause 35 of the Public Health Regulations 2012 (NSW).
ACCC Draft decision on State Water Pricing Application: 2014-15 – 2016-17 | Attachments 46

Rather, the ACCC adopts a symmetrical approach, whereby a proposed step change to compensate for an activity not occurring in the base year must be balanced against the likely existence of abnormal increases in expenditure in that year.
The ACCC considers there could be reasons why a significant increase in non-recurrent expenditure is required. In some cases an infrastructure operator may have relatively limited discretion in whether or not to undertake this expenditure. For example, the need to undertake some maintenance activities, or the required scope of some maintenance activities, may vary from time to time to a material extent. As a result, base year opex may be insufficient to cover the costs of the new program of expenditure. In this case a step increase in opex may be required.
2.5.1 Periodic routine maintenanceState Water forecast a step increase in opex due to the need to undertake a number of routine maintenance tasks. Table 2-11 shows State Water’s forecast step increase.87 The ACCC’s draft decision is to not accept State Water’s forecast step increase and to determine a substitute step increase.
Table 2-11 Operating cost increases from periodic 2, 3, 5, 10, and 15 year scheduled works (millions, real $2013–14)
2014-15 2015-16 2016-17 TotalState Water forecast 0.699 0.857 1.466 3.023ACCC Draft Decision 0.096 0.166 0.231 0.492Source: State Water Corporation; ACCC analysis.
State Water submits that the opex increase is primarily due to the need to undertake a number of large scheduled tasks which have fallen behind in the current regulatory period due to flooding impacts, other higher priority works (e.g. MDBA obligations and delivering capital works), and staff vacancies.88
The NSWIC submitted that a step change was unnecessary due to no apparent change in State Water’s obligations relating to routine maintenance:
“SWC outlined that routine maintenance represents over 25 per cent of annual operating expenditure and is therefore the single biggest contributor to SWC's total operating costs. While NSWIC acknowledges the importance of routine maintenance, we consider it puzzling that SWC suggests a near 13 per cent annual average increase in this thematic expenditure item, while at the same time declaring that ‘State Water's asset maintenance costs have been approximately $10 to $12 million per annum in recent years and remain approximately within this band over the next regulatory period’.
Based on the comment above and other statements made by SWC within its submission, we assume that the underlying business operation of SWC have not significantly changed and hence operating cost changes in this magnitude are not justified.
NSWIC submits that opex for routine maintenance should be carried over from this determination with annual CPI adjustment minus an annual efficiency dividend as no evidence is provided that would warrant a 13 per cent cost increase”.89
The ACCC agrees with the NSWIC’s submission and considers that scheduled routine maintenance should typically represent normal operations for an infrastructure operator. The ACCC understands that expenditure incurred in individual categories will not be exactly the same from year to year, and while in any one year a particular category may experience cost savings, other categories may
87 State Water Corporation, Response to information request number 8.12 from the Australian Competition and Consumer Commission, June 2013, page 3.
88 Deloitte report, p. 36.89 NSW Irrigators’ Council, Submission to Australian Competition and Consumer Commission, September 2013, pp. 29-
30.
47 ACCC Draft decision on State Water Pricing Application: 2014-15 – 2016-17 | Attachments

experience costs that are higher than average levels. The ACCC notes that if scheduled works are delayed by higher priority tasks, such as addressing flood impacts, then State Water is likely to undertake increased expenditure in the areas of those higher priority tasks. This expenditure will be reflected in base opex.
However, the ACCC also understands that cyclical peaks in maintenance can occasionally occur when there is a large cohort of assets that simultaneously reach a risk/maintenance threshold (for example, if a large cohort of assets were installed in the same year and all require periodic maintenance at the same time). The ACCC has therefore considered whether the forecast increase in scheduled tasks represents a significant deviation from State Water’s normal operations, and whether base opex will be sufficient to fund the proposed activity on a case by case basis.
The ACCC examined the historical and forecasted volumes of State Water’s scheduled routine maintenance tasks, which are shown in Table 2-12.90
Table 2-12 Volume of scheduled routine maintenance tasks by task-frequencyTasks that are done every:
2 years 3 years 5 years 10 years 15 years All2010–13 period 321 19 211 37 0 5882014–17 period 367 18 238 85 2 710Source: State Water Corporation; ACCC analysis.
The ACCC considers that for most types of routine maintenance tasks there forecast volume of work is not a significant increase from current levels. However, the ACCC agrees that the number of routine maintenance tasks that fall due every 10 years and which are forecast to occur in the next regulatory period does represent a significant increase (130 per cent) from the amount of work undertaken in the current regulatory period.
Accordingly, the ACCC’s draft decision is to not approve State Water’s forecast step increase above base opex for routine maintenance and to determine a substitute step increase to account only for the increased volume of 10 year periodic tasks. The ACCC’s draft decision is shown in Table 2-11.
2.5.2 Dam safety investigationsState Water forecast a step increase in opex to support dam safety compliance activities.91 Table 2-13 shows State Water’s forecast step increase. The ACCC’s draft decision is to not approve State Water’s forecast step increase.
Table 2-13 Operating cost increases for dam safety investigations (millions, real $2013–14)
2014-15 2015-16 2016-17 Total
State Water forecast 0.339 0.433 0.131 0.904
ACCC Draft Decision - - - -
Source: State Water Corporation; ACCC analysis.
The increase above base opex is attributed to one-off safety investigation projects. NSWIC submitted that more detail is required to justify the increase in State Water’s opex for dam safety compliance.
90 State Water Corporation, Response to information request number 30.10 from the Australian Competition and Consumer Commission, November 2013, page 2.
91 State Water application, page 58.
ACCC Draft decision on State Water Pricing Application: 2014-15 – 2016-17 | Attachments 48

“As SWC proposes an annual increase of around 10 per cent in its opex for this thematic expenditure item, NSWIC request more detail on the proposed works. In particular, further information must to be provided on what costs are attributed to 'expert advice', 'surveying and mapping' and 'risk management drivers'.”92
The ACCC considers that dam safety investigations represent normal operations for an infrastructure operator and is likely to be reflected by the base opex, even if different investigations occur from year to year.
The ACCC has not been able to identify any change in obligations under the ANCOLD Dam Safety Management Guidelines (2003) or DSC regulatory requirements, or in current dam engineering best practice that necessitates a greater level of opex. Furthermore, over the coming years it would be expected that investigations of this nature would continue on a regular basis as other dams age and require similar investigations to assess the need for capital works.
The ACCC does not consider that State Water’s forecast dam safety investigations represent a material change in the scope of State Water’s operations, and therefore does not consider a step increase is necessary.
2.5.3 Staff vacancy ratesState Water submits that it experienced a staff vacancy rate of 8 per cent in 2012-13, resulting in unusual cost savings of $3,115,000 during 2011-12 and 2012-13. State Water submits that it cannot maintain adequate service levels with this staff vacancy rate, hence a step increase from a 2012-13 base would be required.93 Table 2-14 shows State Water’s forecast step increase. The ACCC’s draft decision is to not accept State Water’s forecast step increase.
Table 2-14 Operating cost increase for a return to normal staff vacancy rates (millions, real $2013–14)
2014-15 2015-16 2016-17 Total
State Water’s forecast 3.115 3.115 3.115 9.345
ACCC draft decision - - - -
Source: State Water Corporation; ACCC analysis.
The ACCC considers that the need to increase staff numbers and hence the need for a step increase above the base opex amount is not justified because:
State Water’s staff level in 2012-13 (measured as full time equivalents) appears reasonable in comparison to historical trends.94
The customer base and scope of operations is relatively static.
Regulatory obligations have not increased substantially and it is not apparent that State Water has been materially non-compliant with regulatory obligations in the past.
The ACCC considers that no step increase in opex is required to account for staff vacancy rates in 2012-13.
2.5.4 Improved leave managementState Water submits that unusual cost savings of $125,000 (real, $2012-13) were experienced in 2012-13 as a result of improved efficiencies in the reporting and management of staff leave, but that
92 NSW Irrigators’ Council, Submission to Australian Competition and Consumer Commission, September 2013, p.30.93 State Water Corporation, Response to information request number 5.10 from the Australian Competition and
Consumer Commission, June 2013, p. 2.94 See: Deloitte report, p. 29.
49 ACCC Draft decision on State Water Pricing Application: 2014-15 – 2016-17 | Attachments

these cost savings are not expected to continue.95 Table 2-15 shows the step increase in opex proposed by State Water to account for the end of these cost savings. The ACCC’s draft decision is to not accept State Water’s forecast step increase.
Table 2-15 Operating cost increases for a return to normal leave management (millions, real $2013–14)
2014-15 2015-16 2016-17 Total
State Water forecast 0.125 0.125 0.125 0.375
ACCC Draft Decision - - - -
Source: State Water Corporation; ACCC analysis.
The ACCC considers that discovering cost savings through improved internal processes is a part of normal business operations. All businesses over time identify inefficiencies and/or errors in their internal processes, develop solutions and realise benefits, among them cost savings. Further, the ACCC understands that expenditure incurred in individual categories will not be exactly the same from year to year, and while in any one year a particular category may experience cost savings, other categories may experience costs that are higher than average levels.
The ACCC considers that the cost savings from leave management are not uncharacteristic and therefore that the base opex remains an appropriate estimate of the opex required given current obligations. The ACCC considers that a step increase is not required to account for cost savings from improved leave management in 2012-13.
2.5.5 TraineeshipsState Water submitted that ‘funding of $104,500 (real, $2012-13) secured in 2012-13 for training will not continue due to the removal by the Commonwealth Government of funding support for Certificate III and IV level traineeships’.96 Table 2-16 shows State Water’s forecast step increase. The ACCC’s draft decision is to not accept State Water’s forecast step increase.
Table 2-16 Operating cost increases from removal of government-funded traineeships (millions, real $2013–14)
2014-15 2015-16 2016-17 Total
State Water forecast 0.105 0.105 0.105 0.314
ACCC Draft Decision - - - -
Source: State Water Corporation; ACCC analysis.
The Commonwealth Government began offering funding for Certificate III and IV traineeships in 2011. State Water noted that it had not paid for its staff to obtain these certificates prior to 2011-12.97
The ACCC is not convinced that a step increase in opex is efficient to continue a training program that State Water did not initiate until it received government funding for the training. The ACCC considers that the base opex is sufficient for State Water to efficiently provide necessary staff training. State Water may decide to use its opex allowance to continue the traineeships previously funded by the Commonwealth Government.
The ACCC considers that a step increase is not required to account for the discontinuation of traineeships from 2012-13 onwards.
95 State Water, Response to Information Request 5.9 and 5.10, June 2013, p. 2.96 State Water, Response to Information Request 5.9 and 5.10, June 2013, page 2.97 State Water, Response to Information Request 30.3, November 2013, page 1.
ACCC Draft decision on State Water Pricing Application: 2014-15 – 2016-17 | Attachments 50

2.5.6 Workers’ compensation premiumsState Water identified that there was an abnormal reduction in workers’ compensation premiums in 2012–13 of $170,000 (real, 2012-13) below the previous year. State Water considers that ‘this will not be repeated in 2013-14 and the forward couple of years due to a number of claims that are currently being investigated’.98 The ACCC’s draft decision is to not accept State Water’s forecast step increase. Table 2-17 shows the step increase in opex proposed by State Water.
Table 2-17 Operating cost increases from workers’ compensation claims (millions, real $2013–14)
2014-15 2015-16 2016-17 Total
State Water forecast 0.17 0.17 0.17 0.51
ACCC Draft Decision - - - -
Source: State Water Corporation; ACCC analysis.
Opex attributable to workers’ compensation premiums has been an ongoing cost item for State Water over the 2010–14 period and is likely to continue to be over the 2014–17 period. The ACCC considers that this is a normal opex item that will vary in size from time to time. The ACCC considers that there is no material change in State Water’s obligations or the scope of its operations to suggest a step increase from base opex is appropriate.
The ACCC therefore considers that a step increase in opex is not required to account for the reduction in workers’ compensation premiums in 2012-13.
2.5.7 Maintenance due to Lowbidgee asset auditState Water forecast a step increase in opex to improve asset conditions in Lowbidgee.99 Table 2-18 shows State Water’s forecast step increase. The ACCC’s draft decision is to not accept State Water’s forecast step increase.
Table 2-18 Operating cost increases to address Lowbidgee asset condition (millions, real $2013–14)
2014-15 2015-16 2016-17 Total
State Water Forecast 0.229 0.115 0.067 0. 411
ACCC Draft Decision - - - -
Source: State Water Corporation; ACCC analysis.
In October 2012 NOW released an amendment to the Murrumbidgee Water Sharing Plan to create rules for water diversions to Lowbidgee. The intention of the amendment was to bring the operation of Lowbidgee into line with other valleys and requirements under the MDBA Basin Plan. State Water undertook a review of Lowbidgee’s operational costs and maintenance requirements in anticipation of this. The review identified that increased maintenance is necessary to improve the long-term operation of Lowbidgee assets.100
The ACCC considers that asset audits and the discovery of asset conditions represent normal operations for an infrastructure operator. Some assets with poor condition will likely be identified from time to time, and the costs of addressing the condition of assets is likely to be reflected by the base opex. The ACCC notes that the amount of expenditure proposed in Lowbidgee as a result of the asset
98 State Water, Response to Information request 5.9 and 5.10, June 2013, page 1.99 State Water, Response to Information Request 5.20, June 2013, page 1.100 State Water application, p.157–158
51 ACCC Draft decision on State Water Pricing Application: 2014-15 – 2016-17 | Attachments

audit represents only 1.1 per cent of State Water’s total maintenance in the Murray-Darling Basin in the base year. The ACCC does not consider that maintenance requirements consequent from the Lowbidgee asset audit represent a material change in the scope of State Water’s operations, and therefore does not consider a step increase is necessary.
The ACCC’s draft decision is to not approve State Water’s forecast step increase for maintenance works in Lowbidgee.
2.5.8 Increased sampling of water qualityState Water forecast a step increase in opex associated with a return to normal levels of sampling and laboratory testing of water quality. Table 2-19 shows State Water’s forecast step increase. The ACCC’s draft decision is to not accept State Water’s forecast step increase.
Table 2-19 Operating cost increases to a return to normal sampling levels (millions, real $2013–14)
2014-15 2015-16 2016-17 Total
State Water Forecast 0.310 0.289 0.289 0.888
ACCC Draft Decision - - - -
Source: State Water Corporation; ACCC analysis.
State Water submits that water quality monitoring opex was abnormally low in 2012-13 due to a below average number of blue-green algae incidents.101 Figure 2-2 shows actual water quality monitoring opex from 2007-08 to 2011-12 and budgeted/forecast water quality monitoring opex from 2012-13 to 2016-17.
Figure 2-2 State Water’s actual, budgeted and proposed water quality monitoring opex (real $2013–14)
101 Sampling and laboratory testing costs account for approximately 72% of its proposed water quality monitoring (WQM) opex. [Deloitte report, page 48].
ACCC Draft decision on State Water Pricing Application: 2014-15 – 2016-17 | Attachments 52

The ACCC considers that sampling costs were abnormally high in 2011-12 rather than being abnormally low in 2012-13.
State Water advised that in 2011-12: 102
Laboratory costs were around $200,000 higher than normal due to a failure to accrue these costs in the previous year and therefore the need to make a double payment
The Lake Brewster WQM Program was established (a condition of a Commonwealth funding agreement) at a cost of $30,000 per annum.
The ACCC considers that the relatively high opex in 2011-12 is attributable to these one-off factors, rather than being reflective of a normal level of sampling. The ACCC considers that the base opex remains an appropriate estimate of the cost of current service operations given current obligations. This view is supported by the volume of samples recently monitored by State Water.103
The ACCC’s draft decision is to not approve State Water’s forecast step increase associated with sampling and laboratory testing for the 2014–17 period.
2.5.9 Cold water pollution investigationsState Water forecast a step increase in opex for investigations into cold water pollution at Keepit dam, Wyangala dam, and Blowering dam.104 Table 2-20 shows State Water’s forecast step increase. The ACCC’s draft decision is to not accept State Water’s forecast step increase and to determine a substitute amount.
Table 2-20 Operating cost increases for cold water pollution investigations (millions, real $2013–14)
2014-15 2015-16 2016-17 Total
State Water Proposed - 0.350 0.175 0.525
ACCC Draft Decision - 0.140 0.070 0.210
Source: State Water Corporation; ACCC analysis.
State Water’s operating licence and water supply works approvals place regulatory obligations on State Water to develop options for the mitigation of cold water pollution. State Water planned cold water pollution works for Burrendong, Copeton, Keepit, and Wyangala to occur in the current regulatory period (2009–14). However, only the Burrendong works went ahead, while the capital works at Keepit, Copeton, and Wyangala were deferred based on recommendations from IPART and consultants Atkins-Cardno. State Water’s experiences of mitigating cold water pollution at Burrendong were to inform any future cold water pollution projects. As a result, opex was incurred in 2009-10 for investigating options for mitigating cold water pollution at Burrendong, but no further opex was incurred, including in the base year.105
State Water now proposes to initiate investigations into cold water pollution mitigation at Wyangala, Keepit, and Blowering in accordance with its regulatory obligations. These investigations are to build
102 Deloitte report, pp. 48-49.103 Deloitte report, page 49.104 State Water, Response to Information Request 30.7, November 2013, page 1.105 State Water, Response to Information Request 30.7, November 2013, pages 2–3.
53 ACCC Draft decision on State Water Pricing Application: 2014-15 – 2016-17 | Attachments

upon the lessons learnt from delivery and operation of the Burrendong cold water pollution scheme, and to determine the scope of capital works required into the future.106
The ACCC considers that cold water pollutions investigations represent normal operations for a water storage operator and would ordinarily be represented in base opex, even if different investigations occur from year to year.
However, the ACCC considers that a step increase in opex for cold water pollution investigations is appropriate to account for the continuation of cold water pollution investigations after the pause during the Burrendong project (2009-10 to 2012-13). The ACCC considers it prudent and efficient for State Water to defer cold water pollution investigations in other areas until State Water can learn from the experiences at Burrendong.
The ACCC considers that the amount of proposed opex for cold water pollution investigations is too high based on State Water’s revealed costs from the Burrendong project. State Water proposes $175,000 (real $2013–14) for each investigation at Wyangala, Keepit, and Blowering. State Water submits that it incurred opex of about $66,000 (real $2013–14) in 2009–10 for investigations at Burrendong. In the absence of better information, the ACCC considers that State Water’s revealed Burrendong investigations costs should form the basis for future cost estimates. The ACCC therefore does not accept State Water’s proposed step increase, and has determined a substitute amount based on a cost of $70,000 (real $2013–14) per investigation.
2.5.10 Fish River valve replacementState Water forecast a step increase in opex for a valve replacement program in the Fish River Water Supply Scheme. Table 2-21 shows State Water’s forecast step increase. The ACCC’s draft decision is to not accept State Water’s forecast step increase.
Table 2-21 Operating cost increases for Fish River valve replacement program (millions, real $2013–14)
2014-15 2015-16 2016-17 Total
State Water Proposed 0.063 0.053 0.054 0.170
ACCC Draft Decision - - - -
Source: State Water Corporation; ACCC analysis.
The valve replacement program is an outcome of a maintenance audit in 2012-13. The program involves the replacement or refurbishment of stop valves, pressure release valves and scour valves. The program is expected to run over the next five to seven years.107
The ACCC considers the opex for valve replacement is part of the ebb and flow of State Water’s work requirements and that there are likely to be offsetting reductions elsewhere in State Water’s expenditure program.108
The ACCC considers that asset audits and the discovery of asset conditions represent normal operations for an infrastructure operator. Some assets in poor condition will likely be discovered from time to time, and the costs of addressing the condition of assets is likely to be included in the base opex, even if there is attention to addressing particular assets depending on their condition from year to year. The ACCC notes that the amount of expenditure proposed in Fish River as a result of the 106 State Water, Response to Information Request 30.7, November 2013, pages 2–3.107 Deloitte report, p. 38.108 Deloitte report, p.38.
ACCC Draft decision on State Water Pricing Application: 2014-15 – 2016-17 | Attachments 54

asset audit represents less than 0.5 per cent of State Water’s total maintenance expenditure in the Murray-Darling Basin in the base year. The ACCC does not consider that the Fish River valve replacement program represents a material change in the scope of State Water’s operations, and therefore does not consider a step increase is necessary.
The ACCC’s draft decision is to not approve a step increase in forecast opex for the Fish River valve replacement program.
2.5.11 Flood-related corrective maintenance in the Macquarie valleyState Water submitted that a step increase in opex would be required for flood-related corrective maintenance in the Macquarie valley. The driver for the proposed step increase is an increased likelihood of floods in the Macquarie valley due to storages being much higher when compared to the commencement of the 2010–14 regulatory period.109 State Water did not specifically quantify the proposed step increase, instead inferring that it would be required as part of its general opex allowance.
The ACCC’s draft decision is to not approve State Water’s forecast increase in flood-related corrective maintenance opex. The ACCC considers that managing storage levels and flood risks represents normal operations for a water infrastructure operator. Risks such as weather conditions are likely to fluctuate from time to time, and the costs of addressing these risks is likely to be included in the base opex, even if expenditure is incurred in different categories from year to year. The ACCC also considers that any increase in corrective maintenance due to flooding will likely be offset by a decrease in routine maintenance due to reduced access to sites.110
The ACCC’s draft decision is to not approve an increase in opex associated with flood-related corrective maintenance in the Macquarie valley.
2.5.12 Flood-related overtimeState Water submits that overtime expenditure was approximately $200,000 below average in the base year, due to no flood-related overtime taking place in 2012-13.111 Table 2-22 shows State Water’s forecast step increase. The ACCC’s draft decision is to not accept State Water’s forecast step increase.
Table 2-22 Operating cost increases for flood-related overtime (millions, real $2013–14)
2014-15 2015-16 2016-17 TotalState Water Proposed 0.200 0.200 0.200 0.600ACCC Draft Decision - - - -
Source: State Water Corporation; ACCC analysis.
The ACCC considers opex associated with overtime expenses to be part of the normal ebb and flow of the operations of a business like State Water. The ACCC understands that expenditure incurred in individual categories will not be exactly the same from year to year, and while in any one year a particular category may experience cost savings, other categories may experience costs that are higher than average levels.
109 Deloitte report, p.38.110 Deloitte report, p.38.111 State Water, Response to Information request 5.9 and 5.10, June 2013, page 2.
55 ACCC Draft decision on State Water Pricing Application: 2014-15 – 2016-17 | Attachments

The ACCC considers that a step increase in opex is not required to account for no overtime being incurred for flood-related works in 2012-13.
2.5.13 Updating manuals and plansState Water forecast a step increase above base opex to update its operation and maintenance manuals, including its flood manuals and a sustainability management plan. State Water submits that some of its manuals are over ten years old.112 Table 2-23 shows State Water’s forecast step increase. The ACCC’s draft decision is to not accept State Water’s forecast step increase.
Table 2-23 Operating cost increases to update flood manuals (millions, real $2013–14) 2014-15 2015-16 2016-17 Total
State Water Proposed 0.538 0.505 0.505 1.549
ACCC Draft Decision - - - -
Source: State Water Corporation; ACCC analysis.
The ACCC acknowledges that there is a need to update manuals. However, the ACCC considers that reviewing and updating internal processes and manuals is a part of normal business operations. As noted previously, all businesses over time identify inefficiencies and/or errors in their internal processes, develop solutions and realise benefits, among them cost savings. Further, the ACCC understands that expenditure incurred in individual categories will not be exactly the same from year to year.
Therefore, the ACCC considers that a step increase in opex to review and update manuals is not required.
2.5.14 Debt raising costsDebt raising costs are transaction costs incurred each time a business raises or refinances debt. These costs may include underwriting fees, legal fees, company credit rating fees and other transaction costs. The ACCC recognises this as a legitimate expense incurred in the process of raising debt. Therefore, the ACCC considers it appropriate to provide an allowance for these costs.
The pricing principles require the ACCC to treat any forecast debt raising costs as operating expenditure for rural water businesses to recover through building block revenue.113
The ACCC estimates debt raising costs using an approach based on a report it commissioned from the Allen Consulting Group (ACG) in 2004.114 The approach uses a five year window of up to date bond data to reflect current market conditions. The ACG approach:
Identifies the types of transaction costs that a prudent infrastructure operator acting efficiently would incur in raising debt.
Quantifies the level of these costs, taking into account the specific circumstances of the infrastructure operator, with reference to market rates for the relevant services.
112 State Water, Response to Information request 20.3, October 2013, page 3.113 ACCC, Pricing principles for price approvals and determinations under the WCIR, July 2011, pp. 43–44.114 ACG, Debt and equity transaction costs: Final Report to the ACCC, December 2004.
ACCC Draft decision on State Water Pricing Application: 2014-15 – 2016-17 | Attachments 56

The AER, which also uses the ACG approach, has updated the values of these costs to reflect more recent market data.115 The ACCC agrees with the AER’s updates and has therefore applied these updated values to State Water in its draft decision.
State Water has proposed the debt raising costs illustrated in Table 2-24. State Water derived these costs using the indicative debt raising cost benchmark the ACCC had included in its regulatory information templates. The ACCC has since updated this benchmark in line with the RAB and WACC in this draft decision. This is in line with the ACG approach to calculating debt raising costs.116
Table 2-24 State Water’s budgeted (FY14) and estimated (FY15–FY17) debt raising costs
FY14/15 FY15/16 FY16/17
Debt raising costs ($ million) 0.417 0.438 0.442
Debt raising costs (bppa) 8.1 8.1 8.1
Source: State Water, Pricing application to the ACCC, June 2013, p. 45; Frontier Economics, State Water building block model master 2014–17, 31 July 2013.
In this draft decision, the ACCC has applied this debt raising cost method to State Water. We have applied the benchmark allowance for State Water's updated RAB value ($722.42 million) and an indicative nominal vanilla WACC (7.44 per cent).117
Our benchmark allowance provides for two standard sized bond issues.
Table 2-25 shows the unit costs and the benchmark debt raising cost. The ACCC will update this analysis for the final decision based on the debt component of the RAB and WACC to be determined at the time.
Table 2-25 Indicative direct debt raising costs for State WaterValue Explanation 1 issue 2 issues
Total amount raised Multiples of median MTN ($250m) $250m $500m
Gross underwriting fee Median gross underwriting spread, upfront per issue, amortised 6.65 6.65
Legal and roadshow $195 000 upfront per issue, amortised 1.13 1.13
Company credit rating $55 000 per annum 2.20 1.10
Issue credit rating 4.5 basis points upfront per issue, amortised 0.65 0.65
Registry Fees (Startup) $4 000 upfront per issue, amortised 0.02 0.02
Registry Fees (Ongoing) $9 000 per issue per annum 0.36 0.36
115 See AER, Draft decision: Powerlink Queensland transmission network revenue cap 2007–08 to 2011–12, December 2006, p. 105. For 2009 updates see: AER, Draft decision—Appendices South Australia draft distribution determination 2010–11 to 2014–15, November 2009, p. 527 and AER, Draft decision—Appendices Queensland draft distribution determination 2010–11 to 2014–15, November 2009, p. 733. For 2011 updates see AER, Draft decision: Powerlink transmission determination 2012–13 to 2016–17, November 2011, pp. 204–211. Updates in this decision followed the report: PwC, Debt and equity raising costs: Appendix K to Powerlink Queensland 2013–2017 revenue proposal , April 2011.
116 For example, when we update our established debt raising cost method for State Water's proposed RAB ($766.06 million) and proposed WACC (8.96 per cent), we obtain debt raising costs of 10.4 bppa.
117 We have calculated an indicative WACC using a nominal risk free rate and debt risk premium based on a 20 business day indicative averaging period of 16 December 2013 to 15 January 2014. We will update these parameters as close as practically possible to the start of the regulatory period using an averaging period determined in advance.
57 ACCC Draft decision on State Water Pricing Application: 2014-15 – 2016-17 | Attachments

Total Basis points per annum 10.9 9.8
Source: ACCC analysis
This has resulted in the debt raising costs for State Water outlined in Table 2-26.
Table 2-26 Debt raising costs for State Water ($2013–14)Component FY14/15 FY15/16 FY16/17
Debt component of asset base ($ million) 421.2 465.3 501.6
Debt raising cost (bppa) 9.8 9.8 9.8
Debt raising costs ($ million) 0.413 0.456 0.492
Source: ACCC analysis
2.6 Step changes – discretionary expenditureTwo discretionary expenditure projects proposed by State Water are discussed below. These are the business transformation program and the NSW metering scheme.
The ACCC would not typically consider an incremental increase above base year opex is required for discretionary expenditure. For instance, an infrastructure operator might propose step changes above base year opex for projects or programs it considers will increase productivity. However, if a new program of expenditure delivers productivity savings those cost savings should also be factored into the forecast of total opex. Adding a step change above base year opex will not produce an efficient forecast if the cost savings resulting from the step change are not taken into account.
In some circumstances the benefits of a discretionary project may be improved services for customers. Such projects are likely to be supported by customers but may result in an increase in opex if there are not commensurate cost savings.
2.6.1 Business transformation programState Water forecast a step increase in opex for a number of IC refurbishment and upgrade projects identified as part of an overarching business transformation program. Table 2-27 shows State Water’s forecast step increase. The ACCC’s draft decision is to not accept State Water’s forecast step increase, but to determine a lower amount.
Table 2-27 Operating cost increases from business transformation program (millions, real $2013–14)
2014-15 2015-16 2016-17 Total
State Water Proposed 0.254 0.403 0.255 0.912
ACCC Draft Decision 0.176 0.176 0.176 0.528
Source: State Water Corporation; ACCC analysis.
State Water submits that since its separation from NOW in 2004 its corporate systems have developed in an ad hoc manner, which has resulted in an increasingly fragmented and inefficient IT
ACCC Draft decision on State Water Pricing Application: 2014-15 – 2016-17 | Attachments 58
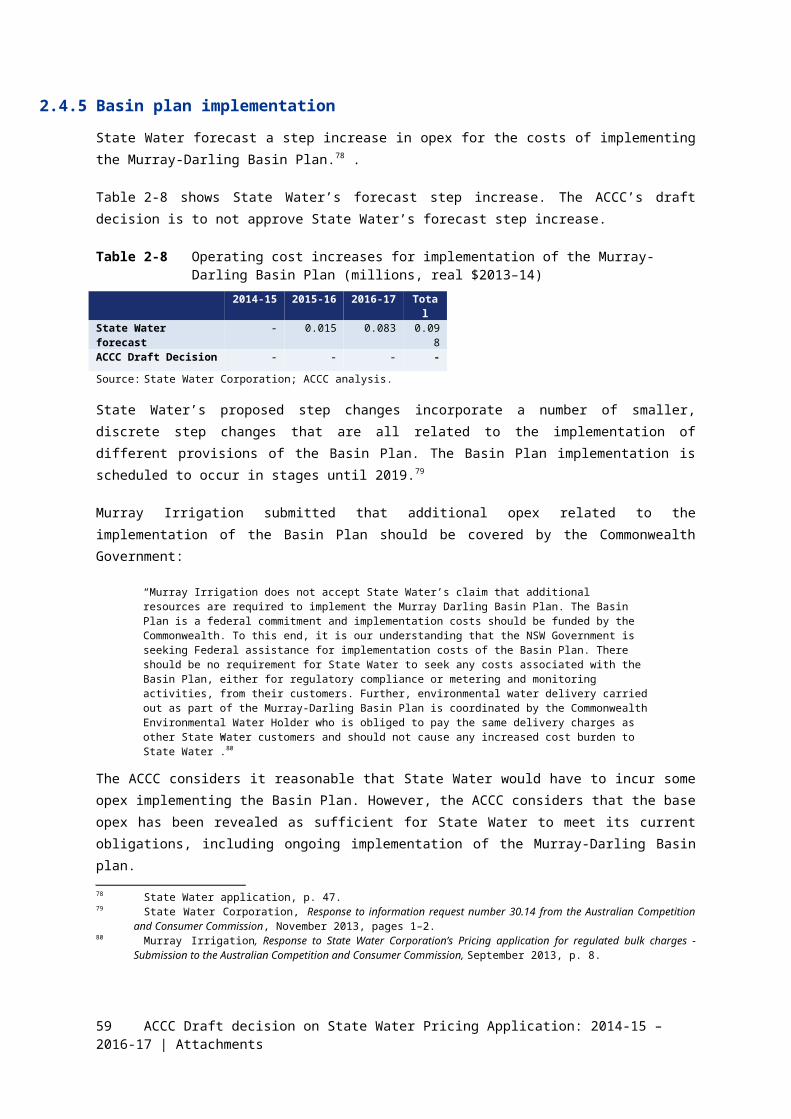
environment.118 State Water proposes a business transformation program to modernise existing IT infrastructure and services, which includes:119
Upgrades to desktop software and the hydrometric data systems (Hydstra)
Development of new capabilities such a geographic information system (GIS), computer-aided river management systems (CARMS), and remote operation of water delivery infrastructure (iSMART).
State Water’s proposed business transformation program is outlined in more detail in section 4.5.7. State Water forecasts a step increase in opex for costs associated with managing the implementation of the business transformation program as well as training and support post-implementation.
NSWIC submitted that no step change is required for corporate systems opex:
“NSWIC recognises the need for the proposed projects, but we are unable to support additional opex for activities that must be categorised as standard operating procedure. The opex requirements that have previously been identified by IPART must have a discretionary component built in that allows funding of such projects. NSWIC submits that the activities identified as 'corporate' are, in fact, standard operating procedures that are already represented within regulated opex. As such, we oppose increased opex for these programs”.120
The ACCC agrees with NSWIC’s submission, and considers historical opex to be a reasonable indicator of the prudent and efficient level of IT-related opex required by State Water in the 2014–17 period.
The ACCC accepts that there is a need for some replacement and refurbishment of State Water’s IT systems as many are over ten years old. However, the ACCC considers that State Water’s projects designed to enhance operations are generally not supported by customers and the costs of these projects appear to outweigh the benefits (see section 4.5.7). The ACCC does not approve a step increase in opex for these IT enhancement projects.
The ACCC considers that historical opex includes some costs associated with replacement of desktop software and hardware.121 The ACCC also notes that IT opex has varied significantly over the past five years, with an 84 per cent decrease from 2011–12 to 2012–13.122 Figure 2-3 shows the historical trend in IT opex.
State Water submits that the reduction in IT opex in 2012–13 is principally due to a review of the business transformation program putting the program on hold. State Water submits that the program was put on hold from early November 2012.123
118 State Water application, chapter 7.5.119 State Water application, p.64.120 NSW Irrigators’ Council, Submission to Australian Competition and Consumer Commission, September 2013, p. 30.121 State Water Corporation, BIS Strategy and Associated Business Transformation Program: Business Case, April
2012.122 State Water Corporation, Response to ACCC information request number 20.20 – attachment: response to Deloitte
opex and capex report, October 2012, page 1.123 State Water Corporation, Response to ACCC information request number 20.20 – attachment: response to Deloitte
opex and capex report, October 2012, page 1.
59 ACCC Draft decision on State Water Pricing Application: 2014-15 – 2016-17 | Attachments

Figure 2-3 Opex for IT systems (millions, real $2013–14)
Source: State Water Corporation; ACCC analysis.
The ACCC considers that the base opex in 2012–13 is unlikely to include costs for the replacement of out-dated IT systems, but that such costs are likely to be included in previous years. The ACCC therefore considers that an average of the opex incurred from 2009–13 should reasonably provide sufficient opex for State Water to undertake the necessary refurbishment of IT systems and infrastructure. The ACCC has therefore determined a step increase for IT opex by reference to the historical average IT opex over the 2009–13 period.
2.6.2 NSW metering scheme – manual meter readingState Water forecast a step decrease in opex for expected reduced manual meter reading as a result of the roll-out of remotely read meters under the NSW metering scheme.124 Table 2-28 shows State Water’s forecast step decrease. The ACCC’s draft decision is to accept State Water’s forecast step decrease.
Table 2-28 Operating cost decreases from reduced manual meter reading (millions, real $2013–14)
2014-15 2015-16 2016-17 TotalState Water Proposed -0.177 -0.560 -0.762 -1.498ACCC Draft Decision -0.177 -0.560 -0.762 -1.498Source: State Water Corporation; ACCC analysis.
124 State Water Corporation, Response to information request number 20.1 from the Australian Competition and Consumer Commission, October 2013, page 2.
ACCC Draft decision on State Water Pricing Application: 2014-15 – 2016-17 | Attachments 60

State Water proposes new metering service charges for metering services provided to customers that have their meter replaced through the NSW metering scheme.125
The new meters will also include telemetry components so they can be remotely read.126 Consequently, State Water will cease to incur costs involved in manually reading meters. This is the basis of State Water’s proposed step decrease in opex.
The ACCC considers State Water’s forecast cost savings to be reasonable on the basis that the forecasts were developed through a detailed and transparent cost build-up that takes into account the number of meters to be replaced and is based on current manual meter reading costs. The ACCC’s draft decision is therefore to approve the forecast step decrease.
2.6.3 NSW metering scheme – data analysisState Water forecast a step increase in opex for additional analysis of data retrieved from telemetered meters installed under the NSW metering scheme.127 Table 2-29 shows State Water’s forecast step increase. The ACCC’s draft decision is to not accept State Water’s forecast step increase.
Table 2-29 Operating cost increases for additional meter data analysis (millions, real $2013–14)
2014-15 2015-16 2016-17 Total
State Water Proposed 0.335 0.324 0.327 0.985
ACCC Draft Decision - - - -
Source: State Water Corporation; ACCC analysis.
State Water forecast that it would require an additional data analyst to collate and review data generated by new meters, as well as additional staff resources for a compliance and educational officer to manage customer enquiries, complaints, and water accounting usage issues.128
The ACCC notes that State Water currently undertakes data collation and analysis for data collected from manual meter reads, as well as monitoring and compliance activities related to existing customer-owned meters.129 The scope of these activities should decline as existing customer-owned meters are replaced with State Water-owned meters. We consider that this process will likely off-set the additional costs incurred in data analysis and compliance activities associated with the State Water-owned meters.
The ACCC acknowledges that there may be a period of time during which State Water must operate both a manually-read and remotely-read meter data system. However, the ACCC notes that the NSW metering scheme has already commenced in the Murray and Murrumbidgee valleys, hence the costs of operating two systems concurrently should already be reflected in the base opex. The ACCC also notes that State Water’s metering service charges include a cost component for audit and reporting activities such as collecting, processing and reporting compliance information.130 The ACCC therefore considers that a step increase for additional data analysis and compliance activities is not required.
125 State Water application, p.162.126 State Water application, p.162.127 State Water Corporation, Response to information request number 20.1 from the Australian Competition and
Consumer Commission, October 2013, page 2. 128 Deloitte report, p. 46.129 State Water application, p.173.130 State Water application, p.178.
61 ACCC Draft decision on State Water Pricing Application: 2014-15 – 2016-17 | Attachments

2.6.4 Customer-requested projectsState Water forecast a number of discretionary metering and compliance-related projects to be implemented over the 2014–17 period.131 The ACCC’s draft decision is to approve State Water’s forecast step increase as set out in Table 2-30.
Table 2-30 Operating cost increases for customer-requested projects (millions, real $2013–14)
2014-15 2015-16 2016-17 Total
State Water Proposed 0.497 0.497 0.272 1.266
ACCC Draft Decision 0.497 0.497 0.272 1.266
Source: State Water Corporation; ACCC analysis.
The forecast step increase includes $17,000 per year for maintenance of a gauging station at the Wallaroi Creek off-take in the Wallamundary system that is planned to be installed in 2014–15. The remaining expenditure is for investigative work into further understanding and quantifying the costs and benefits of potential infrastructure upgrades.132
Macquarie Valley Food and Fibre submitted that State Water customers were unable to have sufficient input in the CSC process:
“Unfortunately a delay in the finalisation of SWC’s pricing application meant that customers have not been able to scrutinise proposed expenditure ahead of SWC submitting their pricing application to the ACCC. SWC presented only aggregate revenue requirements and draft prices to CSCs throughout late May and early June of this year without providing a valley breakdown of proposed operating costs and capital expenditure that accompanied the proposal. There was therefore no opportunity for customers to have input to the appropriate level of price and service trade-offs or to consider the feasibility of future investment”.133
Lachlan Valley Water (LVW) stated that it supports the customer requested projects for the Lachlan valley, only raising concerns over transparency of costs:
“LVW supports the discretionary projects endorsed by the Lachlan CSC and, while not within ACCC’s role, recommends that discretionary projects be shown as a separate line item in State Water budgets so that there is clear accountability for the funds allocated for these specific purposes”.134
The ACCC considers it prudent that State Water discussed these discretionary projects with customers and decided that further investigative work into the costs and benefits of projects was warranted before proceeding with the projects. The ACCC is satisfied that the cost of these investigations is prudent and efficient to the extent that customers have been consulted and agreed to the project costs. The ACCC understands that State Water consulted on these discretionary projects with the Macquarie-Cudgegong customer service committee, the Lachlan customer service committee, and the Murrumbidgee customer service committee on the 13 March 2013, 19 March 2013, and 20 March 2013 respectively.135 The ACCC understands that the consultation included the proposed scope and expenditure for each project. The ACCC invites submissions from Macquarie
131 State Water application, p.53.132 State Water Corporation, Response to information request number 5.5 from the Australian Competition and
Consumer Commission, June 2013. 133 Macquarie River Food and Fibre, Submission on State Water Corporation’s Pricing application for regulated charges
from 1 July 2014, September 2013, p.8.134 Lachlan Valley Water Inc., Submission to ACCC on State Water Regulated Charges 2014 – 2017, September 2013,
p.11.135 State Water Corporation, Response to information request number 5.5 from the Australian Competition and
Consumer Commission, June 2013.
ACCC Draft decision on State Water Pricing Application: 2014-15 – 2016-17 | Attachments 62
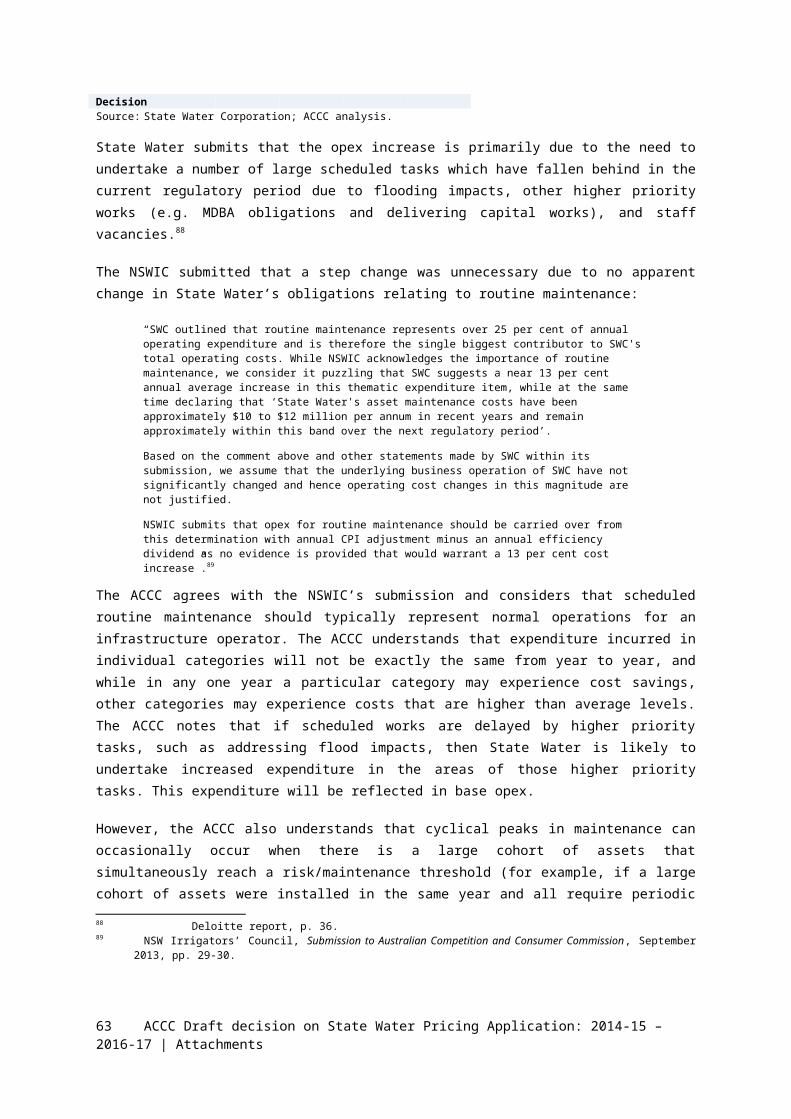
Valley Food and Fibre and other stakeholders on the extent to which the customer-requested projects have been endorsed by stakeholders.
Based on current information, the ACCC considers that there is support for these projects and has approved the step increase.
2.6.5 Higher frequency meter reading in Fish RiverState Water forecasts a step increase in opex to increase the frequency of meter reads in Fish River from annual to six-monthly following customer requests for higher frequency meter reading to address post-meter water leaks.136 Table 2-31 shows State Water’s forecast step increase. The ACCC’s draft decision is to accept State Water’s forecast step decrease.
Table 2-31 Operating cost increase for higher frequency metering in Fish River (millions, real $2013–14)
2014-15 2015-16 2016-17 Total
State Water’s forecast 0.018 0.018 0.018 0.031
ACCC draft decision 0.018 0.018 0.018 0.031
Source: State Water Corporation; ACCC analysis.
State Water submits that its proposed change from annual to six-monthly meter reads is in response to complaints by about 2 per cent of small water users in Fish River of water leaks on the customer side of the meter.137
The ACCC understands that the higher frequency meter reading should result in savings for some Fish River customers from reduced leaks. State Water consulted with and received endorsement from the Fish River CSC (including the Lithgow and Oberon local councils) on the proposal.138
The ACCC’s draft decision is to accept the step increase in opex.
2.7 Output growthOperating costs may increase if a business is required to deliver more services. State Water proposed two opex increases relating to output growth: additional fish passage monitoring and increased Fish River variable costs. These proposed opex increases are discussed below.
2.7.1 Fish passage monitoringState Water forecasts a step increase in opex for monitoring of new fish passage works. Section 4.3.3 discusses State Water’s forecast capex for the construction of new fish passages.139 Table 2-32 shows State Water’s forecast step increase, which has been approved in this draft decision.
Table 2-32 Operating cost increase for monitoring new fish passages (millions, real $2013–14)
2014-15 2015-16 2016-17 Total
State Water’s forecast 0.028 0.028 0.028 0.085
ACCC draft decision 0.028 0.028 0.028 0.085
Source: State Water Corporation; ACCC analysis.
136 State Water, Response 37 to information request from ACCC, 31 January 2014, pages 2–3. 137 State Water, Response 37 to information request from ACCC, 31 January 2014, pages 2–3. 138 State Water, Response 37 to information request from ACCC, 31 January 2014, pages 2–3. 139 State Water, Response 37 to information request from ACCC, 31 January 2014, pages 1–2.
63 ACCC Draft decision on State Water Pricing Application: 2014-15 – 2016-17 | Attachments

Fisheries NSW submitted that more opex is required to fund weir removal projects. It’s submission appeared to indicated the ACCC should determine this through the draft decision:
“(Fisheries NSW) strongly requests consideration be given to increasing funding allocated to State Water for OPEX so that weir removal projects can be pursued reducing the total expenditure on DSU [Dam Safety Upgrades] Fishway Offsets Program”.140
The ACCC has reviewed State Water’s proposed fishway works program, which includes expenditure on the construction of new fishways as well removal of weirs. State Water currently has 18 fishways that require monitoring.141 State Water’s proposed fish passage capex for the 2014–17 period, approved in the ACCC’s draft decision (see section 4.3.3), includes the construction of 11 new fishways and the removal of Gin Gin weir.142 This represents a material increase in the number of fishways that State Water is obliged to monitor and maintain.
State Water forecasts the number of monitored sites to increase from 18 to 20 and submits that monitoring at some existing sites will discontinue as the 11 new fishways are constructed.143 State Water proposes additional opex of $28,201 per year, or about 0.8 per cent of base opex, is required for monitoring new fish passages. State Water currently spends $16,767 per fish passage in opex to monitor fish passages.
The ACCC’s draft decision is to approve the forecast step increase. The ACCC has approved State Water’s proposed capex for the construction of new fish passage works, which will increase State Water’s stock of assets to be maintained. The ACCC accepts that it is prudent and efficient for State Water to incur increased opex associated with monitoring the new works and has approved the step increase proposed by State Water.
2.7.2 Fish River variable costsState Water forecasts a step increase in opex in the Fish River water supply scheme for higher variable costs associated with increased water consumption. State Water submits that an increase in water consumption in the Fish River water supply scheme will increase energy and chemical costs due to an increased need for pumping and water treatment.144 The ACCC’s draft decision is to not accept State Water’s forecast step increase and to substitute a smaller step increase. Table 2-33 shows State Water’s forecast step increase and the ACCC’s draft decision.
Table 2-33 Operating cost increase for increased Fish River consumption (millions, real $2013–14)
2014-15 2015-16 2016-17 Total
State Water’s forecast 0.230 0.230 0.230 0.691
ACCC draft decision 0.126 0.230 0.230 0.586
Source: State Water Corporation; ACCC analysis.
State Water forecasts that water consumption in the Fish River water supply scheme will return to 100 per cent of the long term average over the 2014–17 period.145
140 NSW Department of Primary Industries, Letter to Sebastian Roberts re Review of State Water Corporation’s Pricing Application to the Australian Competition and Consumer Commission for Regulated Charges from 1 July 2014, September 2013, p.3.
141 State Water Corporation, Completed fish passage,https://www.statewater.com.au/current+projects/Environmental+projects/Completed+fish+passage, accessed at 14:00 on 19 November 2013.
142 State Water Corporation, Fish passage cost estimate for thematic plan October 2012, 8 October 2012, page 2.143 State Water Corporation, Response 37 to ACCC information request, 31 January 2014, pages 1–2.144 State Water application, p.104.145 Deloitte report, page 43.
ACCC Draft decision on State Water Pricing Application: 2014-15 – 2016-17 | Attachments 64
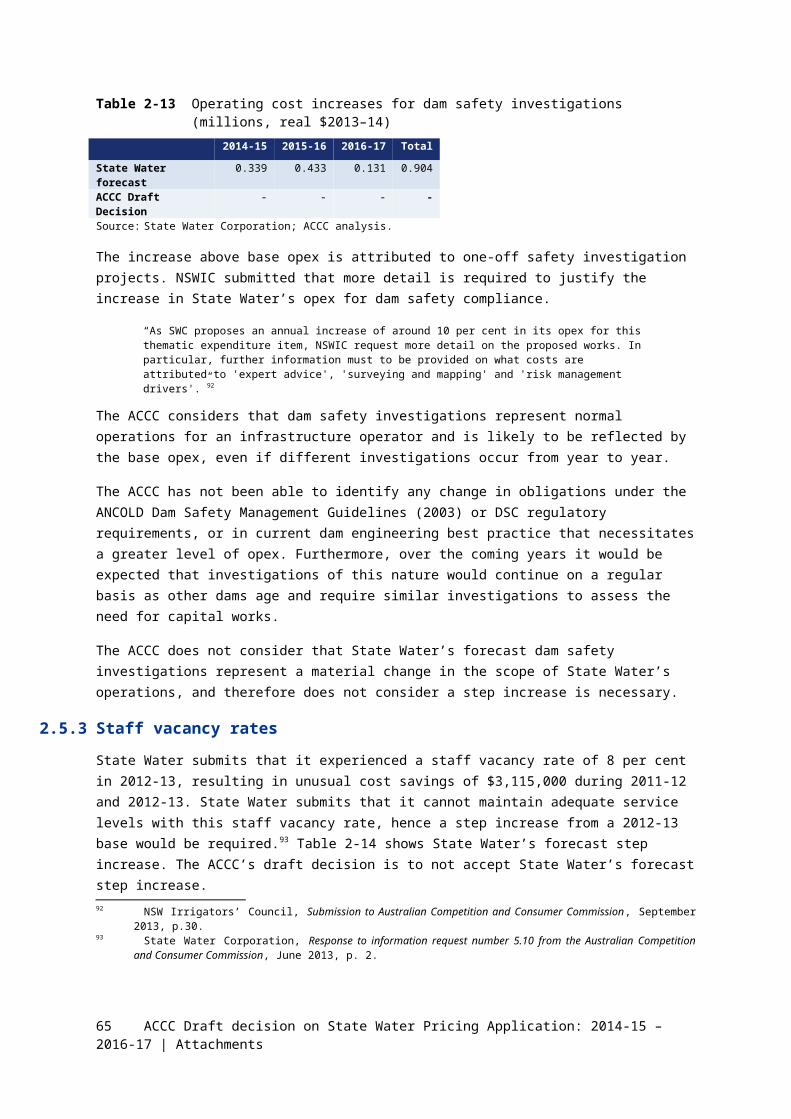
The ACCC accepts State Water’s forecast that the volume of water supplied in the Fish River water supply scheme is likely to increase over the 2014–17 period relative to the current regulatory period. However, the ACCC considers it more reasonable to assume that volumes will increase in a more gradual manner rather than return immediately to 100 per cent of the long term average in 2014–15 as forecast by State Water. As of October 2013, Oberon Dam was at 82 per cent of full capacity. The ACCC considers that consumption equating to 90 per cent of the long term average is a more reasonable forecast for 2014-15, with consumption increasing to 100 per cent in 2015-16 and remaining at 100 per cent in 2016-17.
The ACCC has therefore estimated a substitute step increase in opex derived from base year (2012–13) water delivery opex in the Fish River water supply scheme and an adjustment for forecast increases in consumption levels over the 2014–17 period.
2.8 Input price changesState Water proposed a number of opex increases that were due to input price changes. These are discussed below. The ACCC notes that its draft decision accounts for the effects of inflation by including the consumer price index (CPI) in the control formula used to determine regulated charges (see section 10.5).
State Water’s forecast opex may differ from the base amount if the forecast rates of change in the prices of particular inputs are materially different to the CPI. However, it is important to distinguish between input price changes and input cost changes. Input costs will not increase at the same rate as input prices if input prices increase to compensate input suppliers for improved product quality (and the resultant effects on State Water’s productivity). For example, to the extent labour prices increase to compensate workers for increased productivity, labour costs will not increase at the same rate since less labour is required to produce the same output. Consequently, forecasts of changes in input prices should be productivity adjusted unless productivity improvements are captured elsewhere in expenditure forecasts.
2.8.1 Wage growthState Water forecasts step increases in opex due to forecast growth in wages and superannuation rates. The ACCC has not accepted State Water’s forecast because:
it does not adequately account for the effect of a currently weak economic outlook on expected rates of wage growth, and
it is based on Commonwealth Government superannuation policies that have changed since State Water submitted its proposal.
Table 2-34 shows State Water’s forecasts and the ACCC’s draft decision.
Table 2-34 Step change for wages growth (millions, real $2013–14) 2014-15 2015-16 2016-17 Total
State Water’s forecast 0.360 0.790 1.264 2.414
ACCC draft decision - - - -
Source: State Water Corporation; ACCC analysis.
65 ACCC Draft decision on State Water Pricing Application: 2014-15 – 2016-17 | Attachments
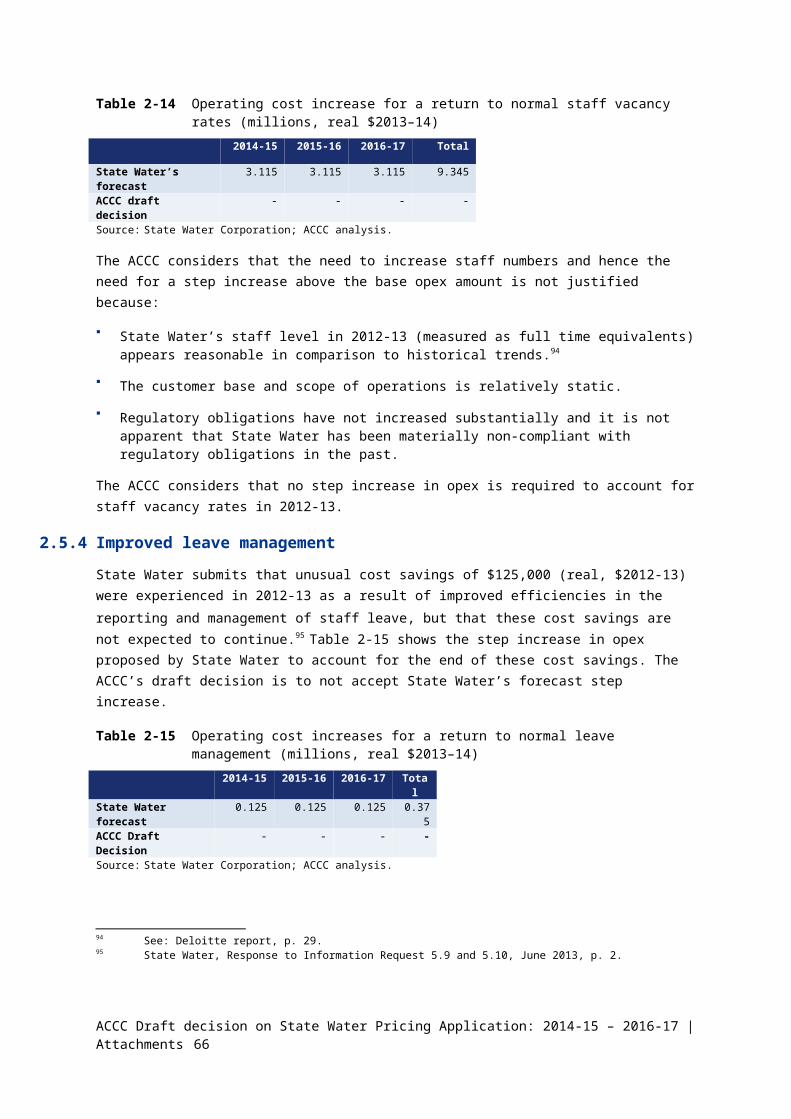
State Water’s forecast of wage growth was developed based on historical trends and an expected increase in superannuation obligations. State Water submits that average wage costs in the public sector have been growing by 4.2 per cent per year in nominal terms for the last 10 years.146
The ACCC considers that a simple ten year average of wages growth does not account for the currently weak economic outlook and that current wages growth is below this longer-term average. Deloitte Access Economics forecasts wage growth rates of 3.5 per cent to 3.6 per cent per year for the 2014–17 period.147 The ACCC considers that a growth rate in wages of 3.5 per cent per year is a reasonable forecast.
State Water’s forecast was also based on the previous Commonwealth Government mandating annual increases to superannuation payments of 0.25 per cent in 2014-15 and 0.5 per cent thereafter to 2019-20.148 However, the current Commonwealth Government’s superannuation policy is to maintain minimum superannuation contributions at the current level of 9.25 per cent.149
State Water forecast corresponding productivity gains to entirely offset its forecast step increase in opex due to wage growth. Forecasts of ongoing productivity gains are discussed separately in section 2.8.3.
The ACCC’s draft decision is that an additional step increase in opex for wages growth is not prudent and efficient.
2.8.2 Energy and chlorine costsState Water forecasts step increases in opex due to forecast growth in energy and chlorine costs in the Fish River water supply scheme.150 Table 2-35 shows State Water’s forecast step increase which has not been approved in this draft decision.
Table 2-35 Operating cost increases from energy and chemicals prices (millions, real $2013–14)
2014-15 2015-16 2016-17 TotalState Water ProposedEnergy 0.043 0.022 0.022 0.088Chlorine 0.085 0.105 0.126 0.316ACCC Draft DecisionEnergy - - - -Chlorine - - - -
Source: State Water Corporation; ACCC analysis.
The Fish River water supply scheme is different to State Water’s other areas of operation, with the following operational differences leading to a more variable operating cost structure:
Electricity costs, which are associated with a number of pumping stations required to transfer water to storages when needed
Chlorine costs, which are required to clarify and filter water delivered to some of the scheme’s customers.
146 State Water application, p.65.147 Deloitte report, pages 29–30.148 State Water application, p.65.149 The Coalition’s Policy for Superannuation, September 2013.150 State Water application, pages 52-53.
ACCC Draft decision on State Water Pricing Application: 2014-15 – 2016-17 | Attachments 66

State Water forecast energy price increases based on IPART’s retail electricity price determination for 2013–14 and subsequent price increases consistent with historical rates of change.151 State Water forecast its chlorine costs to be largely driven by energy prices.152 State Water forecast chlorine prices to increase by 3.5 per cent per year from 2013–14 to 2016–17.153
The ACCC considers that the rate of growth in energy and chemicals costs are unlikely to be higher than recent experience. The ACCC notes that Essential Energy’s average distribution prices fell by 1.75% on 1 July 2013 and that Essential Energy has recently undertaken that it will “limit network price increases to CPI or less for the next six years”. The ACCC also notes that the Commonwealth Government plans to remove the carbon price from 1 July 2014.
The ACCC has therefore not accepted the step increase in costs proposed by State Water.
2.8.3 Premiums from NSW Government insurerState Water forecasts a step increase in opex for insurance costs. Table 2-36 shows State Water’s forecast step increases. The ACCC’s draft decision is to approve State Water’s forecast step increases.
Table 2-36 Operating cost increases for insurance premiums (millions, real $2013–14) 2014-15 2015-16 2016-17 Total
State Water forecast 0.132 0.132 0.132 0.397
ACCC Draft Decision 0.132 0.132 0.132 0.397
Source: State Water Corporation; ACCC analysis.
State Water attributes increased costs over the 2014–17 period to: 154
An increase in the value of its insured asset base. Assets as at 1 July 2008 were valued at $3.6 billion, compared with $4.3 billion as at 30 June 2013
Several recent claims, including a landslide at the Burrinjuck Dam in December 2010155
Reinsurance costs.
State Water advised that its current insurance policy costs $0.44 per $1,000 of cover, which compares favourably with: 156
insurance costs identified for the 2010 State Water price review ($0.38 per $1,000 of cover)
insurance costs currently being paid by other state-owned corporations ($0.56 to $0.78 per $1,000 of cover).
The ACCC acknowledges that insurance is a market cost and that State Water’s forecast insurance costs benchmark well against its previous expenditure and that of its peers. The ACCC therefore considers State Water’s forecast increase in insurance costs for the 2014–17 period to be prudent and efficient.
151 State Water, Response to information request number 5.13 from the Australian Competition and Consumer Commission, June 2013, pages 1–2.
152 State Water application, pages 52-53.153 State Water, Response to information request number 5.13 from the Australian Competition and Consumer
Commission, June 2013, page 2.154 Deloitte report, p. 52.155 State Water insures through the Treasury Managed Fund of the NSW State government-owned SI Corp, which is a
hindsight fund.156 Deloitte Access Economics, Expenditure Forecast Review State Water Corporation – Report to the ACCC and under
Part 6 of the Water Charge (Infrastructure) Rules 2010 Draft Report, 30 September 2013, p. 47.
67 ACCC Draft decision on State Water Pricing Application: 2014-15 – 2016-17 | Attachments

2.9 Efficiency gainsThe ACCC is required to assess the prudency and efficiency of State Water’s forecast opex used to determine charges.157
Businesses may improve efficiency by adopting industry best practice (known as catch up efficiency) and discovering improvements within their own business operations.
State Water proposed some ongoing efficiency, but did not propose any catch-up efficiency. As stated in section 2.2, the ACCC’s approach to assessing the prudency and efficiency of State Water’s opex is to develop an independent forecast of prudent and efficient opex for the 2014–17 period and compare this forecast to State Water’s proposed opex. Therefore, in developing an independent forecast of prudent and efficient opex, the ACCC has considered a realistic forecast of both types of efficiency improvements.
2.9.1 Catch-up efficiencyThe ACCC examined State Water’s base opex to determine whether or not State Water is currently operating efficiently. A catch-up efficiency factor may be applied to base opex if State Water is not considered to be operating efficiently, with the size of the adjustment to base opex determined by the speed at which State Water could move towards efficient operation.
The ACCC’s review did not identify any high-level or systemic matters that suggest there is a significant efficiency ‘catch-up’ gap for State Water. However, the ACCC expects State Water to continue to make ongoing efficiency savings over the 2014–17 period (see section 2.9.2). The ACCC’s review found:
State Water’s asset management practices appear in line with good industry practice.158
State Water’s opex over the 2010–13 period broadly demonstrates that it has met the allowed opex by IPART, which reflected both a ‘catch-up’ and ‘continuing’ efficiency gains of 1.2 and 0.8 per cent per year respectively.159
State Water benchmarks positively to other Australian water utilities in terms of opex for regulated river services. State Water’s opex per ML of water delivered160 and opex per km of regulated river are lower than its comparator utilities161 for most of 2007-08 to 2011-12.
The ACCC’s draft decision is therefore to not include any step change to base opex for catch-up efficiencies.
2.9.2 Ongoing efficiency gainsState Water forecast annual efficiency savings equal to its forecast of real wage increases (see section 2.8.1), equating to 1.6 per cent of its controllable opex forecast over the 2014–17 period. State Water submits that it will achieve these savings through: 162
redundancies,
business system improvements,
occupational health and safety improvements,
157 Rule 29 of the Water Charge (Infrastructure) Rules 2010 (Cth).158 Deloitte report, pp. 35, 65.159 Deloitte report, pp. 18-19.160 Average of 2007-08 to 2011-12.161 SunWater, Goulburn Murray Water, and Southern Rural Water.162 State Water, Response to information request number 5.7 from the Australian Competition and Consumer
Commission, June 2013, page 1.
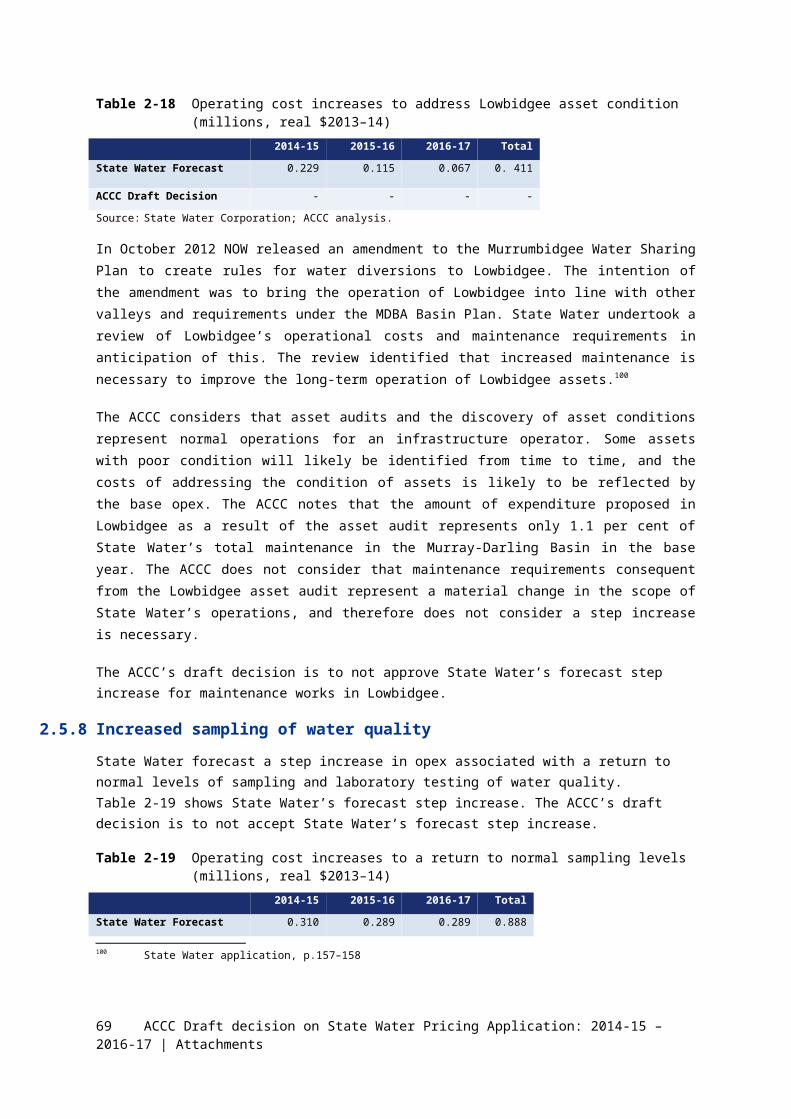
encouraging employee leave,
controlling travel and overtime, and
negotiations on enterprise bargaining agreements.
The ACCC’s draft decision is to not accept State Water’s forecast efficiency savings. The ACCC considers that State Water should be able to achieve an ongoing efficiency gain after accounting for forecast wage growth. The ACCC has determined an alternate efficiency gain based on State Water’s historical performance. Table 2-37 shows State Water’s forecasts and the ACCC’s draft decision.
Table 2-37 Operating cost increases due to productivity gains (millions, real $2013–14)
2014-15 2015-16 2016-17 Total
Gross efficiency gain State Water proposal -0.36 -0.79 -1.264 -2.414
ACCC draft decision -0.323 -0.643 -0.96 -1.926
Efficiency gain net of wage growth State Water proposal - - - -ACCC draft decision -0.323 -0.643 -0.96 -1.926
Source: State Water Corporation; ACCC analysis.
The ACCC considers that an ongoing efficiency gain of 1 per cent per year is prudent and efficient, based on the following:
State Water forecast that it could achieve an efficiency gain equating to 1.6 per cent of controllable opex per year. This efficiency gain is gross of State Water’s forecast wage growth, and the ACCC considers State Water’s forecast wage growth is too high.
State Water’s historical opex trend from 2007–08 to 2012–13 suggests an average efficiency gain on controllable opex of 0.8 per cent per year.
A continuing efficiency target was applied by IPART in its 2010 pricing determination for State Water (in addition to a 1.2 per cent per year catch-up efficiency target) and State Water has not materially exceeded the IPART allowance for the first three years of the current regulatory period.163
Setting ongoing efficiency targets is common practice across other regulators of water infrastructure operators. Annual efficiency targets set by other regulators range from 0.3 per cent for the Sydney Catchment Authority to 2.25 per cent for Sydney Water, with an average of 1.26 per cent.164
State Water proposed a level of efficiency gains that would entirely offset its forecast wages growth. The ACCC has based its draft decision on State Water’s revealed historical cost performance and past efficiency gains. These revealed efficiency gains are based on, or been influenced by, the historical circumstances encountered by State Water, including wages growth, other input price changes, and changes to regulatory obligations.
As discussed in section 2.4, the ACCC has determined specific step increases in opex to account for forecasts of relevant and material changes to regulatory obligations. No further changes to the forecast efficiency gains are necessary to account for forecast changes to obligations.
As discussed in section 2.8.1, the ACCC considers that State Water’s forecast wages growth is too high. The ACCC has determined a more prudent and efficient forecast of wages growth to be 3.5 per cent per year. To avoid double-counting, the ACCC has not included a separate step increase in opex for wages growth, and adopted an ongoing efficiency measure of one per cent per year that is net of wages growth.163 IPART, Review of bulk water prices for State Water Corporation from 1 July 2010 to 30 June 2014: Final Report ,
June 2010, page 74.164 Deloitte report, page 24.

State Water proposed a step increase in opex for redundancy costs that it submits are necessary to achieve forecast efficiency gains.165 Table 2-38 shows State Water’s historical redundancy expenditure and proposed step increase for redundancies.
Table 2-38 Historical, year-to-date, and forecast redundancy expenditure (millions, real $2013–14)
2009-10 2010-11 2011-12 2012-13 2013-14 2014-15 2015-16 2016-17
Redundancy opex 0.056 0.069 0.046 0.049 0.080 0.229 0.271 0.435
Proposed step change 0.180 0.191 0.206
Source: State Water Corporation; ACCC analysis.
The ACCC notes that State Water has incurred redundancy costs in the past and these costs are therefore reflected in the base opex. The ACCC also notes that its estimate of State water’s historical efficiency gain is net of redundancy costs. The ACCC’s determined ongoing efficiency gain of 1 per cent per year is also net of redundancy costs as it is derived from State Water’s revealed past performance. The ACCC sees no reason why State Water would need to increase redundancy expenditure above historical trends in order to achieve efficiency gains in line with historical trends. Therefore, the ACCC’s draft decision is to not approve State Water’s request for a separate step increase in redundancy costs.
2.9.3 Savings from Fish River pipeline replacementThe ACCC generally considers that State Water’s renewal and replacement capex program is prudent and efficient. One renewal and replacement project involves the replacement of a pipeline in the Fish River water supply scheme. State Water expects the project to produce opex savings from reduced maintenance costs, considering the frequency of historical breakages and associated repair costs.166
State Water’s preliminary analysis suggests that maintenance cost savings from this project should result in a net benefit.167 Therefore, the ACCC has accepted the capex project as prudent and efficient, but also considers that maintenance cost savings should be realised to offset the capital outlay. State Water did not propose a step change to account for maintenance savings derived from its Fish River pipeline replacement project.
State Water’s Fish River pipeline replacement project is forecast to require capex of $0.8 million in 2015–16 and $1.7 million in 2016–17 (real $2013-14).168 The ACCC therefore considers that maintenance opex in Fish River should reduce by in $0.07 million in 2016–17 to offset the capital costs of the pipeline replacement project. The level of reduction is based on the ACCC’s draft decision on asset lives, depreciation and the rate of return. The ACCC’s draft decision is shown in Table 2-39.
Table 2-39 Step change for Fish River maintenance savings (millions, real $2013–14) 2014-15 2015-16 2016-17 Total
State Water’s forecast - - - -
ACCC draft decision - - (0.054) (0.054)
Source: State Water Corporation; ACCC analysis.
165 State Water application, p. 45.166 Deloitte report, page 81.167 State Water Corporation, Asset Management Plan: Fish River Water Supply – 2013-14, May 2013, page 38.168 State Water Corporation, Asset Management Plan: Fish River Water Supply – 2013-14, May 2013, page 38.

2.10 Draft decision – approved expenditureThe ACCC does not consider State Water’s forecast opex of $127.51 million (real $2013–14) to be prudent and efficient. The ACCC considers that $115.57 million (real $2013–14) is a more prudent and efficient aggregate forecast opex for the regulatory period. This represents a forecast opex that is 9 per cent lower than State Water’s proposed opex. The ACCC’s draft decision on opex for each valley in the Murray-Darling Basin is shown in Table 2-40.
Table 2-40 Opex for bulk water charges by valley (millions, real $2013–14) State Water proposal ACCC draft decision
2014-15 2015-16 2016-17 2014-15 2015-16 2016-17
Total 43.02 42.38 42.11 38.86 38.65 38.07
Border valley 1.65 1.63 1.53 1.46 1.44 1.40Fish River valley 4.69 4.61 4.59 4.94 5.02 4.94
Gwydir valley 4.36 4.24 4.2 4.01 3.95 3.93Lachlan valley 6.24 6.16 5.8 5.37 5.37 5.28
Lowbidgee valley 0.77 0.65 0.6 0.53 0.53 0.53
Macquarie valley 6.13 6.16 6.5 5.42 5.37 5.38
Murray valley 4.51 4.11 4.27 3.63 3.49 3.44
Murrumbidgee valley 8.12 8.04 8.11 7.51 7.47 7.29
Namoi valley 5.01 4.89 4.85 4.73 4.75 4.63
Peel valley 1.54 1.89 1.66 1.25 1.25 1.23
Source: State Water Corporation; ACCC analysis.
The ACCC came to its decision by using the base-and-step forecasting method. The ACCC’s draft decision on base opex and accepted step changes are shown in Table 2-41.
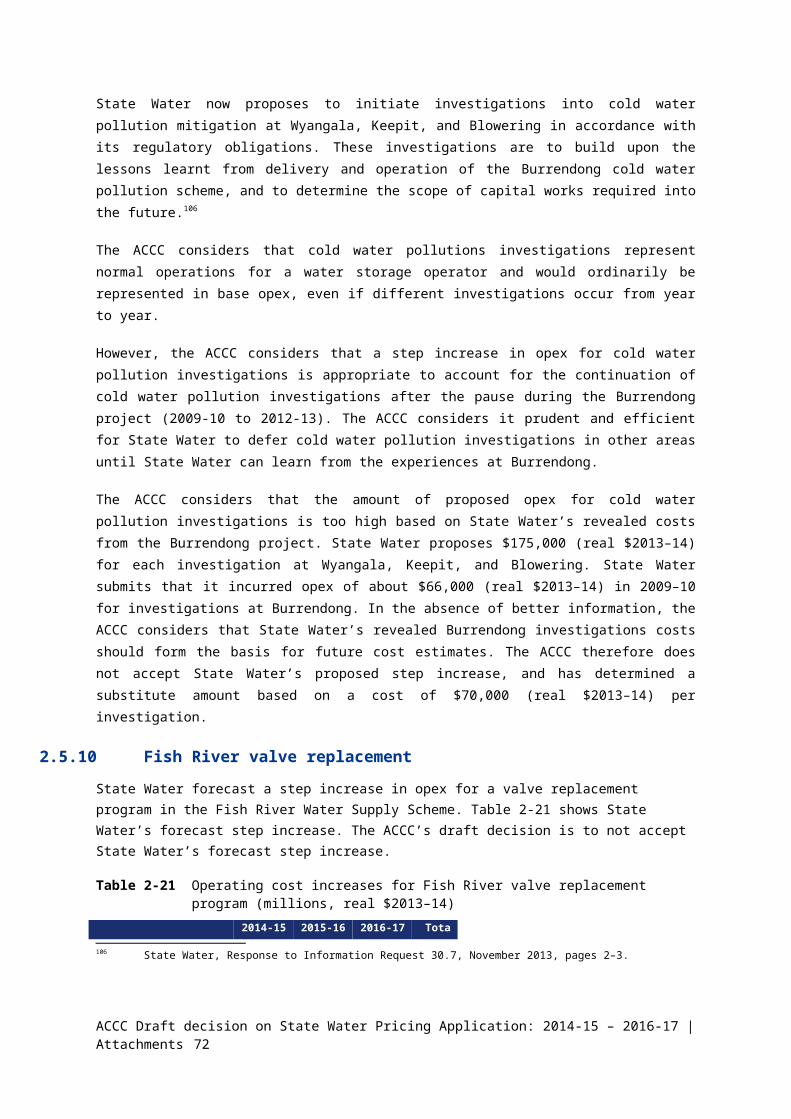
Table 2-41 Step change for wages growth (millions, real $2013–14)
2014-15 2015-16 2016-17 Total
State Water’s proposal 43.02 42.38 42.11 127.51
ACCC initial base opex 37.28 37.28 37.28 111.83
Adjustment - new Lowbidgee charges 0.53 0.53 0.53 1.60
Adjustment - new gauging station charges -0.31 -0.31 -0.31 -0.92
Adjustment - radio tower lease costs -0.22 -0.22 -0.22 -0.65
ACCC adjusted base opex 37.29 37.29 37.29 111.86
Step change – customer requested projects 0.50 0.50 0.27 1.27
Step change – Fish River output growth 0.13 0.23 0.23 0.59
Step change – IT costs 0.18 0.18 0.18 0.53
Step change – drinking water plan 0.17 0.17 0.17 0.50
Step change –periodic routine maintenance 0.10 0.17 0.23 0.49
Step change – EMS 0.16 0.20 0.07 0.43
Step change – insurance 0.13 0.13 0.13 0.40
Step change – hydrometric monitoring 0.10 0.10 0.10 0.30
Step change – cold water pollution - 0.14 0.07 0.21
Step change – regulatory costs 0.16 - - 0.16
Step change – fish passages 0.03 0.03 0.03 0.08
Step change – Fish River metering 0.02 0.02 0.02 0.05
Step change – debt raising costs 0.41 0.46 0.49 1.36
Step change – pipeline replacement savings - - (0.05) (0.05)
Step change – ongoing efficiency gains (0.33) (0.39) (0.39) (1.10)
Step change –reduced manual meter reads (0.18) (0.56) (0.76) (1.50)
ACCC draft decision 38.86 38.65 38.07 115.57
Difference from proposal (4.16) (3.74) (4.04) (11.94)
Source: State Water Corporation; ACCC analysis.
Based on the cost sharing arrangements outlined in the Draft Decision, the ACCC’s forecast of prudent and efficient opex has a user share of $106.12 million (real $2013-14) in aggregate over the 2014–17 period. The user share and government of opex for each valley in the Murray-Darling Basin is shown in Table 2-42.
ACCC Draft decision on State Water Pricing Application: 2014-15 – 2016-17 | Attachments 72

Table 2-42 ACCC draft decision: user and government share (millions, real $2013–14) User share Government share
2014-15 2015-16 2016-17 2014-15 2015-16 2016-17
Total 35.76 35.44 34.92 3.10 3.54 3.48Border valley 1.32 1.29 1.26 0.15 0.15 0.15
Fish River valley 4.94 5.02 4.94 - - -
Gwydir valley 3.60 3.54 3.51 0.41 0.42 0.42
Lachlan valley 4.86 4.83 4.77 0.51 0.55 0.52
Lowbidgee valley 0.53 0.53 0.53 - - -
Macquarie valley 4.99 4.94 4.95 0.43 0.44 0.43
Murray valley 3.45 3.31 3.27 0.18 0.18 0.17
Murrumbidgee valley 6.88 6.83 6.63 0.63 0.63 0.66
Namoi valley 4.10 4.07 3.99 0.63 0.68 0.64
Peel valley 1.09 1.08 1.07 0.16 0.17 0.17
Source: State Water Corporation; ACCC analysis.
73 ACCC Draft decision on State Water Pricing Application: 2014-15 – 2016-17 | Attachments

3 Regulatory asset baseState Water’s regulatory asset base (RAB) is the value of its assets used to provide infrastructure services for which regulated charges apply. For example, State Water’s RAB includes its dams, IT systems, plant and machinery, vehicles and buildings.
The RAB is a key input in determining State Water’s revenue. State Water earns a rate of return on the value of the RAB. It also recovers depreciation (or a return of capital) on assets in its RAB. Most significantly, the ACCC is not able to approve State Water’s proposed regulated charges unless we are satisfied that its RAB has been calculated properly.169
As part of this draft decision, the ACCC is required to assess State Water's proposed opening values for the RAB of its regulated valleys for each year of the 2010–14 and 2014–17 regulatory periods. The roll forward methodology for establishing the opening RAB is set out in the Water Infrastructure Charge Rules (WCIR).170 In practice, this involves the ACCC:
Confirming the value of the opening RAB as at 1 July 2010 (the first year of the 2010–14 regulatory period), and adjusting for the difference between actual capex and forecast capex for 2009–10.
Rolling forward the opening RAB from 1 July 2010 to determine the closing RAB as at 30 June 2014. This involves, for each year:
adding actual capex during the 2010–14 regulatory period171
removing depreciation, any capital contributions, any redundant assets and any asset disposals during the 2010–14 regulatory period
indexing the RAB for actual inflation during the 2010–14 regulatory period.
Using the ACCC's draft decision on depreciation, capex, disposals and inflation forecasts for the 2014–17 regulatory period to roll forward State Water's projected RAB for each year of that regulatory period. In particular, forecast capex is added to the RAB while forecast depreciation and disposals are removed from the RAB. Forecast inflation is used to index the RAB for the 2014–17 regulatory period.
This attachment presents the issues and outcomes of our analysis for the draft decision on State Water’s RAB.
3.1 Draft decisionThe ACCC does not approve State Water's total proposed opening RAB as at 1 July 2014 of $726.1 million (nominal) for its ACCC regulated valleys.
The ACCC has determined a total opening RAB as at 1 July 2014 of $702.0 million (nominal). The user share of the opening RAB as at 1 July 2014 is $237.6 million (nominal). The ACCC’s changes to
169 R 29(2)(a) of the Water Charge (Infrastructure) Rules 2010 (WCIR). The RAB must be calculated pursuant to Schedule 2 to the WCIR.
170 R 29 of WCIR.171 An estimate of the actual capex is required for the final year of the current regulatory period (2013–14) due to the
timing with completing this review before actual audited figures are available. The final decision will include audited actual capex for 2012–13 and a revised estimate of 2013–14 capex. At the next review, the ACCC will adjust the RAB for the difference between this estimate and actual capex for 2013–14 (including the accumulated return associated with this difference).
ACCC Draft decision on State Water Pricing Application: 2014-15 – 2016-17 | Attachments 74

State Water’s proposed inputs to the RAB roll forward model (RFM) are required under Schedule 2 of the WCIR and include:
Correcting State Water's estimates of forecast capex, depreciation and associated user share inputs for 2009–10. The ACCC considers these to be in error and has amended the amounts to be consistent with those approved by IPART.
Using forecast depreciation (adjusted for actual inflation) to roll forward the RAB instead of actual depreciation as proposed by State Water. The ACCC considers the forecast depreciation allowance as approved previously by IPART (adjusted for actual inflation) should be used in the roll forward.
Updating 2012–13 forecast CPI with actual CPI.172
Table 3-1 shows the ACCC’s draft decision on the roll forward of State Water’s RAB from 2009–10 (the last year of the 2006–10 regulatory period) through to the end of the 2010–14 regulatory period.
Table 3-1 ACCC’s draft decision on State Water's opening RAB roll forward for 2009–10 to 2013–14 ($million, nominal)
2009–10 2010–11 2011–12 2012–13 2013–14
Opening value 354.4 434.6 519.2 583.5 614.1
CPI indexation 8.6 12.7 16.9 9.5 15.4
Net capex 72.3 76.4 53.4 28.3 83.2
Less: straight-line depreciation 0.7 4.5 5.9 7.3 8.2
Difference in actual and forecast 2009–10 net capex 0.0 0.0 0.0 0.0 -1.9
Return on difference 0.0 0.0 0.0 0.0 -0.6
Closing value (Govt + user) 434.6 519.2 583.5 614.1 702.0
Closing value (User) 173.8 189.4 207.2 213.6 237.6
Closing value (Govt) 260.8 329.8 376.3 400.4 464.3
Note: Net capex figures are based on gross capex less any capital contributions from customers or third parties.Disposals not presented as there were no asset disposals recorded by State Water.Source: ACCC analysis.
The ACCC has determined a total projected closing RAB as at 30 June 2017 of $865.6 million (nominal) for State Water’s ACCC regulated valleys.
This is based on:
a total opening RAB as at 1 July 2014 of $702.0 million (nominal)
a forecast inflation rate of 2.5 per cent per annum
forecast net capex of $153.3 million (nominal), discussed further in attachment 4
172 The ACCC’s final decision will include an update to the actual CPI for 2013–14.
75 ACCC Draft decision on State Water Pricing Application: 2014-15 – 2016-17 | Attachments

a total straight-line depreciation of –$47.4 million (nominal) and total inflation indexation to the opening RAB of $57.8 million, discussed further in attachment 4.
The user share of the projected closing RAB at 30 June 2017 is $295.9 million (nominal). Table 3-2 sets out the projected roll forward of State Water’s RAB during the 2014–17 regulatory period.
Table 3-2 ACCC's draft decision on State Water’s projected RAB roll forward during the 2014–17 regulatory period ($million, nominal)
2014–15 2015–16 2016–17
Opening value 702.0 775.4 836.0
Inflation indexation 17.5 19.4 20.9
Net capex 70.3 57.1 26.0
Less: straight-line depreciation 14.3 15.9 17.3
Closing value (Govt + user) 775.4 836.0 865.6
Closing value (User) 254.7 275.9 295.9
Closing value (Govt) 520.8 560.2 569.7
Note: Disposals not presented as no asset disposals were proposed by State Water.Source: ACCC analysis.
Table 3-3 and Table 3-4 respectively show the breakdown of each valley’s opening and closing RABs for the 2014–17 regulatory period. The break down by user and government share is also shown. For comparative purposes, State Water’s application in relation to each of these valleys is also presented.
ACCC Draft decision on State Water Pricing Application: 2014-15 – 2016-17 | Attachments 76

Table 3-3 Summary of State Water’s application and ACCC’s draft decision on opening RAB at 1 July 2014 ($millions, nominal)
Valley Draft decision State Water application
User share Govt share
Total RAB User share Govt share
Total RAB
Border Rivers 2.9 0.5 3.4 3.7 0.5 4.2
Fish River 71.6 0.0 71.6 70.5 0.0 70.5
Gwydir 21.1 96.2 117.3 22.0 97.0 119.0
Lachlan 29.5 65.4 95.0 30.1 62.5 92.6
Lowbidgee – – – – – –
Macquarie 28.0 54.2 82.2 28.1 54.5 82.7
Murray 26.1 12.7 38.8 27.1 12.8 39.9
Murrumbidgee 34.4 76.9 111.3 43.0 81.8 124.8
Namoi 20.2 127.3 147.6 21.6 135.3 156.9
Peel 3.8 31.0 34.8 3.7 31.8 35.5
Total 237.6 464.3 702.0 249.9 476.2 726.1
Source: State Water’s proposed roll forward models, post-tax revenue models and ACCC analysis.
77 ACCC Draft decision on State Water Pricing Application: 2014-15 – 2016-17 | Attachments

Table 3-4 Summary of State Water’s application and ACCC’s draft decision on closing RAB at 30 June 2017 ($millions, nominal)
Valley Draft decision State Water application
User share Govt share
Total RAB User share Govt share
Total RAB
Border Rivers 3.2 0.6 3.8 4.8 0.5 5.4
Fish River 84.8 0.0 84.8 96.0 0.0 96.0
Gwydir 31.5 106.4 137.9 36.7 109.5 146.2
Lachlan 44.7 77.6 122.3 51.6 79.0 130.6
Lowbidgee 1.7 0.0 1.7 2.0 0.0 2.0
Macquarie 37.3 71.6 108.9 45.7 75.2 120.9
Murray 27.7 13.8 41.5 32.0 15.0 47.0
Murrumbidgee 37.3 76.9 114.2 50.8 84.0 134.8
Namoi 23.3 180.6 203.9 27.2 197.3 224.5
Peel 4.4 42.2 46.6 4.9 45.8 50.7
Total 295.9 569.7 865.6 351.6 606.4 958.0
Source: State Water’s proposed roll forward models, post-tax revenue models and ACCC analysis.
The ACCC’s assessment approach and reasoning for its draft decision are discussed in sections 3.3 and 3.4 respectively.
3.2 State Water's applicationState Water proposed a total RAB as at 1 July 2010 of $376.8 million (nominal) for its ACCC-regulated valleys. Rolling forward this RAB, it proposed a total opening RAB as at 1 July 2014 of $726.1 million (nominal) for its regulated valleys. The user share of the proposed opening RAB as at 1 July 2014 is $249.9 million (nominal).173 Table 3-5 shows the roll forward by State Water of its total RAB. The proposed opening RABs for the individual valleys are shown in Table 3-4 above.
173 State Water’s proposed RFMs, aggregated across all ACCC-regulated valleys. This sum differs from the figures presented in State Water’s application document which represent all State Water’s valleys including those located outside the Murray Darling Basin not regulated by the ACCC.
ACCC Draft decision on State Water Pricing Application: 2014-15 – 2016-17 | Attachments 78

Table 3-5 State Water’s proposed RAB roll forward for its regulated valleys for 2009–10 to 2013–14 ($million, nominal)
2009–10 2010–11 2011–12 2012–13 2013–14
Opening value 354.4 376.8 459.5 522.1 572.4
CPI indexation 8.6 11.0 15.0 8.5 14.3
Net capex 22.7 76.4 53.4 48.3 83.2
Less: straight-line depreciation 8.9 4.7 5.8 6.5 7.3
Difference in actual and forecast 2009–10 net capex
– – – – 47.7
Return on difference – – – – 15.7
Closing value (Govt + user) 376.8 459.5 522.1 572.4 726.1
Closing value (User) 169.3 184.2 201.5 224.6 249.9
Closing value (Govt) 207.5 275.4 320.6 347.8 476.2
Note: Disposals not presented as no disposals were proposed by State Water.Source: State Water’s proposed roll forward models.
3.2.1 Capex in the 2010–14 regulatory periodState Water stated it incurred net capex in the 2010–14 regulatory period of $261.3 million (nominal).174 Table 3-6 shows the breakdown of this amount by valley. The amounts for the valleys include actual capex for 2010–12 and State Water's estimates of actual capex incurred in 2012–13 and 2013–14.175
State Water also proposed to include actual net capex of $70.4 million (nominal) for 2009–10.176 This amount replaces the estimate allowed by IPART in the previous 2006–10 regulatory period when actual capex for 2009–10 was not yet available. State Water stated that the amount allowed by IPART in the previous determination was $22.7 million (nominal).
174 State Water’s proposed RFMs. 175 Audited actual capex for 2012–13 was provided by State Water after the initial proposal and incorporated into the
ACCC draft decision. State Water may provide an updated estimate of capex for 2013–14 as part of its revised proposal.176 State Water’s proposed RFMs.
79 ACCC Draft decision on State Water Pricing Application: 2014-15 – 2016-17 | Attachments

Table 3-6 State Water’s proposed total net capex for its regulated valleys during the 2010–14 regulatory period ($million, nominal)
2010–11 2011–12 2012–13 2013–14 Total
Border 0.2 0.1 1.2 0.1 1.7
Fish River 2.7 6.1 1.4 1.9 12.1
Gwydir 7.4 23.4 13.3 4.4 48.5
Lachlan 5.5 3.5 10.5 27.9 47.3
Macquarie 9.3 1.3 3.7 19.3 33.7
Murray 5.1 4.9 3.3 3.2 16.5
Murrumbidgee 10.4 1.6 8.6 4.7 25.2
Namoi 28.2 11.9 5.5 14.6 60.3
Peel 7.6 0.6 0.9 7.1 16.2
Total ACCC-regulated valleys 76.4 53.4 48.3 83.2 261.3
Source: State Water’s proposed roll forward models.Notes: Net capex figures are based on gross capex less capital contributions.
Figures include a half-year WACC allowance because capex is assumed to occur on average mid-year but only starts earning a return on capital the year after it is incurred. The half WACC compensates the business for this timing delay in the modelling assumptions.
3.2.2 Depreciation in the 2010–14 regulatory periodState Water proposed that its RAB be rolled forward for the 2010–14 regulatory period using an actual depreciation approach.177 This approach results in calculating depreciation based on actual capex incurred in the 2010–14 regulatory period. State Water proposed an average remaining life and standard life of 83 years for all assets as at 1 July 2010 to calculate the depreciation allowance. Using these inputs equates to a proposed total straight line depreciation of $24.3 million (nominal).
3.2.3 Projected RAB over the 2014–17 regulatory periodState Water proposed a total projected closing RAB for its regulated valleys as at 30 June 2017 of $958.0 million (nominal). The user share of the proposed projected closing RAB at 30 June 2017 is $351.6 million (nominal).178 This amount includes the addition of a new valley, Lowbidgee, which has an opening RAB value of zero as at 1 July 2014 and will have regulated charges determined for the 2014–17 regulatory period. The proposed closing RABs for the individual valleys are shown in Table 3-4.
State Water’s projected roll forward of the RAB for its regulated valleys during the 2014–17 regulatory period is shown in Table 3-7. State Water included in its RAB projection:
a forecast inflation of 2.50 per cent per annum
177 State Water’s proposed RFMs.178 State Water’s proposed PTRMs. The sum of the relevant figures in State Water’s individual PTRMs has been
presented for comparison because the figures presented in State Water’s proposal represent all State Water’s valleys including those located outside the Murray Darling Basin not regulated by the ACCC.
ACCC Draft decision on State Water Pricing Application: 2014-15 – 2016-17 | Attachments 80
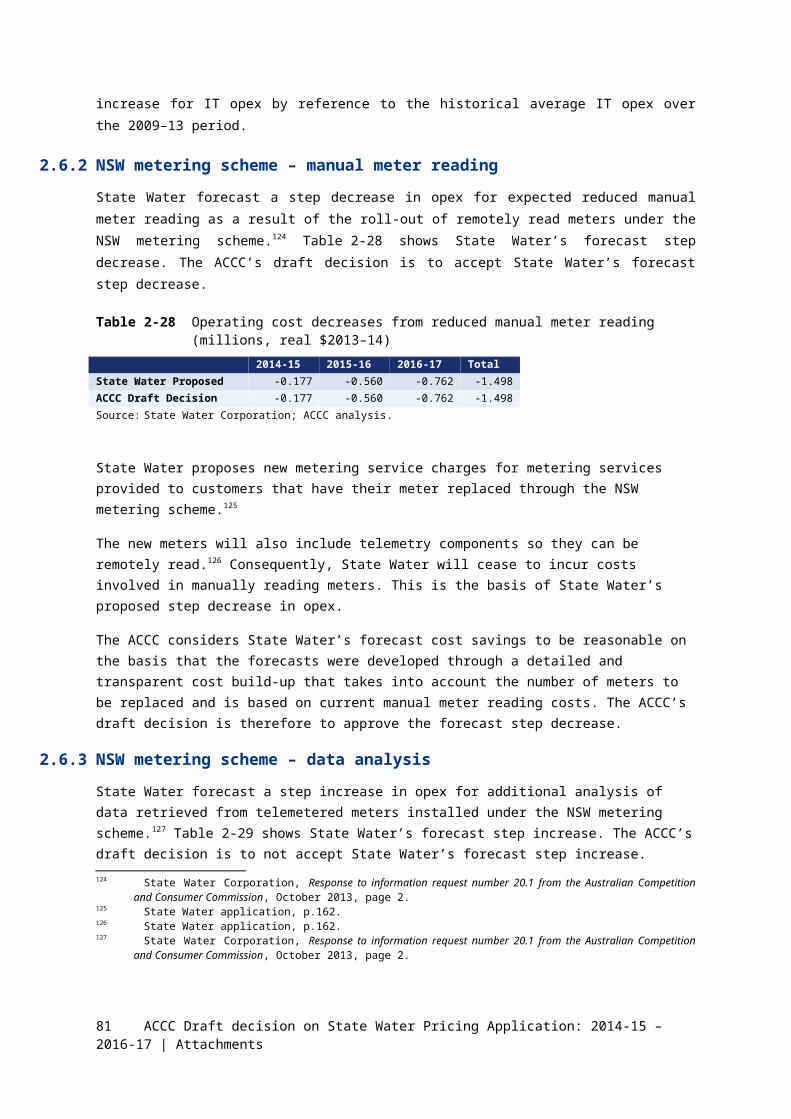
forecast net capex of $209.9 million (nominal), discussed in attachment 4.
forecast straight-line depreciation of $40.4 million (nominal), discussed in attachment 6.
Table 3-7 State Water's proposed projected RAB roll forward during the 2014–17 regulatory period ($million, nominal)
2014–15 2015–16 2016–17
Opening value 726.1 852.0 921.1
Inflation indexation 18.2 21.3 23.0
Net capex 120.0 61.4 28.5
Less: straight-line depreciation 12.1 13.6 14.6
Closing value (Govt + user) 852.0 921.1 958.0
Closing value (User) 294.3 321.4 351.6
Closing value (Govt) 557.8 599.7 606.4
Note: Disposals not presented as no asset disposals were proposed by State Water.Source: State Water’s proposed roll forward models.
3.3 Assessment approachThe ACCC's approach to assessing State Water's RAB roll forward is outlined in the ACCC’s WCIR pricing principles.179
First, the ACCC confirms the value of the opening RAB for the first year of the 2010–14 regulatory period (in this case, at 1 July 2010). This requires the ACCC to make adjustments to account for any difference between actual and forecast capex in the final year of the previous regulatory period (in this case, 2009–10) and any true-up adjustment for the cumulative return over the 2010-14 regulatory period as a result of this difference. The roll in of capex is also subject to any changes made in the ACCC's assessment of actual capex for that year.
Second, the opening RAB as at 1 July 2010 is rolled forward to determine the closing RAB as at 30 June 2014. This closing RAB becomes the value of the opening RAB for the 2014–17 regulatory period as at 1 July 2014, subject to any reclassification of services that would warrant the addition or removal of certain assets. The roll forward involves:
adding actual capex for each year—this requires assessing the capex and determining that it is consistent with the regulatory information templates. The final year (2013–14) capex will be an estimate (rather than actual) by the necessity of having to complete the review during that year.
removing depreciation for each year of the 2010–14 regulatory period
removing any capital contributions during the 2010–14 regulatory period
removing any unused assets and disposals during the 2010–14 regulatory period
indexing the RAB each year for actual inflation.179 ACCC, Pricing principles for price approvals and determinations under the Water Charge (Infrastructure) Rules 2010,
July 2011, section 3.1, p. 24.
81 ACCC Draft decision on State Water Pricing Application: 2014-15 – 2016-17 | Attachments

Third, the RAB is projected over the 2014–17 regulatory period by rolling forward the opening RAB as at 1 July 2014 to 30 June 2017. This involves taking the opening RAB:
adding forecast efficient capex for each year
removing forecast straight-line depreciation for each year
removing the forecast value of assets to be disposed of (or no longer used) during the 2014–17 regulatory period
indexing the RAB each year for forecast inflation.
The cost sharing ratios of the expenditure inputs determine the user and government shares of State Water’s RAB. The ACCC has been advised that the NSW Government has agreed to pay the Government’s share of the efficient costs calculated using the same cost sharing ratios as determined by IPART in 2010.180 This is discussed further in attachment 1.
3.4 Reasons for draft decisionThe ACCC does not accept State Water's proposed opening RABs as at 1 July 2014 for its regulated valleys and consequently the projected closing RABs as at 30 June 2017. In particular, the ACCC considers:
State Water’s proposed 2009–10 forecast net capex and depreciation amounts, and associated user share inputs are inconsistent with those approved by IPART in the previous price review determination.181 This affects the opening RAB as at 1 July 2014 because the reconciliation or ‘true up’ of the RAB for the difference between actual and forecast capex for that year is adjusted for in the final year (2013–14) of the 2010–14 regulatory period, as shown in Table 3-1. This is discussed in greater detail in section 3.4.1. These changes have affected the calculations for some valleys more than others.
The use of a forecast depreciation approach to roll forward the RAB over the 2010–14 regulatory period is more appropriate than State Water’s proposed actual depreciation approach.
Forecast net capex for 2014–17 should be $154.0 million (nominal), as discussed further in attachment 4.
The depreciation allowance for 2014–17 should be –$10.6 million (nominal), as discussed in attachment 6.
The ACCC's detailed reasons follow. This discussion includes other minor amendments to the roll forward of State Water's proposed RAB not noted above.
3.4.1 Opening RAB in the 2010–14 regulatory periodThe ACCC’s draft decision is to approve a total opening RAB for State Water’s regulated valleys as at 1 July 2010 of $434.6 million (nominal). This represents an increase of $57.8 million (nominal) or 15.3 per cent from State Water’s application.
180 Letter from Katrina Hodgkinson MP - Minister for Primary Industries to Rod Sims Chairman ACCC, 21 November 2012.
181 IPART, State Water 2010 Price Review Model.
ACCC Draft decision on State Water Pricing Application: 2014-15 – 2016-17 | Attachments 82

State Water proposed its 2009–10 actual capex is $70.4 million (nominal). The ACCC accepts State Water’s proposed 2009–10 actual capex. This amount is consistent with that provided in State Water’s regulatory information template (RIT).
The ACCC made a minor amendment to the opening RAB for Fish River as at 1 July 2009 to reflect the RAB approved in IPART’s price review determination.182 This adjustment is consistent with the operation of the RAB roll forward process set out in Schedule 2 to the WCIR, as discussed in section 3.1 of the ACCC’s WCIR pricing principles, which envisages a RAB set in a previous regulatory period to be rolled forward based on this value.183
2009–10 net capex and depreciation estimates
The main reason for the higher opening RAB as at 1 July 2010 in this draft decision is that the ACCC has amended State Water’s 2009–10 estimated net capex and depreciation values to those as approved in IPART’s price review determination. These values are key inputs to the RFM. The ACCC does not accept the estimated 2009–10 net capex, depreciation and associated user share inputs proposed by State Water.
As part of its review the ACCC identified an issue with State Water’s proposed RFM input for the 2009–10 estimated net capex, which did not reconcile with the value approved in IPART’s price review determination. The ACCC raised this matter with State Water. State Water indicated that the proposed amount of $22.7 million (nominal) was an error and subsequently provided updated RFMs to the ACCC.184;185 The updated RFMs were provided after the initial consultation period, therefore stakeholders were unable to comment on the revisions. The ACCC has reviewed the updated RFMs and confirms the value of $72.3 million (nominal) provided in these RFMs is the correct estimated net capex input. This value is consistent with that approved in IPART’s price review determination.186
The impact of this error is an increase to the RAB as at 1 July 2010 due to the inclusion of the higher estimated capex for 2009–10. However, this impact is more than offset by the revised reduction in the true-up that occurs in 2013–14 to reflect that State Water’s actual capex of $70.4 million (nominal) for 2009–10 was much closer to the corrected estimated capex allowance for that year than the amount initially proposed. Accordingly, as shown in Table 3-1 the reduced true-up in 2013–14 results in a downward adjustment to the closing RAB at 30 June 2014.
The ACCC also identified issues with the estimated depreciation and user shares inputs in the RFM and considers these amounts to also be errors of a similar nature discussed above. 187 The ACCC has amended these inputs to be consistent with the amounts approved in IPART’s price review determination.188 The ACCC’s draft decision is to adjust the RFM input for the 2009–10 forecast regulatory depreciation amount to –$7.9 million (nominal).189 This compares to the $0.3 million
182 IPART, State Water 2010 Price Review Model.183 ACCC, Pricing principles for price approvals and determinations under the Water Charge (Infrastructure) Rules 2010,
July 2011, p. 25.184 State Water’s proposal used 2013–14 net capex estimate instead of 2009–10 net capex estimate.185 State Water, Response 2 to ACCC information request, received 27 September 2013.186 IPART, State Water 2010 Price Review Model.187 The ACCC has amended the user share inputs in line with those approved by IPART at the previous price review
determination; however, these amendments do not impact on the roll forward of the total RAB value.188 IPART, State Water 2010 Price Review Model.189 The ACCC’s RFM requires 2009–10 input for forecast regulatory depreciation (straight-line depreciation net of the
CPI indexation on the opening RAB). IPART’s previous determination model provides separate amounts for CPI indexation of the RAB and straight-line depreciation. The ACCC has taken these separate indexation and depreciation amounts for 2009–10 from the IPART model by combining them to provide the required regulatory depreciation inputs amounts for use in the RFM. For the purposes of this draft decision the ACCC subtracted the CPI indexation of the opening RAB (including the half year capex for that year, consistent with IPART modelling) from the straight-line
83 ACCC Draft decision on State Water Pricing Application: 2014-15 – 2016-17 | Attachments

(nominal) proposed by State Water. The result of this correction is a higher opening RAB as at 1 July 2010.190
3.4.2 Capex in the 2010–14 regulatory periodThe ACCC has updated State Water’s proposed net capex for the 2010–14 regulatory period of $261.3 million (nominal) to include the actual 2012–13 capex as provided by State Water.191 Following this update, for the purposes of the RAB roll forward the ACCC approves a total actual capex for the 2010–14 regulatory period of $241.4 million (nominal). Table 3-8 shows the breakdown of this amount by valley. The proposed amounts for each year of the 2010–14 regulatory period are consistent with those provided in State Water’s revised RIT, but differ from those submitted as part of IPART’s annual information return (AIR). State Water has advised that the amounts in the RFM and RIT are correct. 192
State Water also advised that the majority of differences are due to the AIR being net of externally funded capex and including capitalised interest for dam safety capex. State Water provided a reconciliation between the data, but there are still some differences in actual capex for 2009–10 and 2010–11 which the ACCC is investigating. The amounts included in the RFM represent actual capex for 2010–13 and State Water's estimate of actual capex to be incurred in 2013–14.
Table 3-8 ACCC draft decision on total net capex for RAB roll forward by regulated valleys during the 2010–14 regulatory period ($million, nominal)
2010–11 2011–12 2012–13 2013–14 Total
Border 0.2 0.1 0.4 0.1 0.8
Fish River 2.7 6.1 0.6 1.9 11.4
Gwydir 7.4 23.4 10.9 4.4 46.1
Lachlan 5.5 3.5 8.9 27.9 45.8
Macquarie 9.3 1.3 2.5 19.3 32.4
Murray 5.1 4.9 2.6 3.2 15.8
Murrumbidgee 10.4 1.6 -1.0 4.7 15.7
Namoi 28.2 11.9 3.0 14.6 57.8
Peel 7.6 0.6 0.3 7.1 15.6
Total ACCC regulated valleys 76.4 53.4 28.3 83.2 241.4
Source: State Water’s proposed roll forward models and ACCC analysis.Notes: Net capex figures are based on gross capex less capital contributions.
The figures include a half-year WACC allowance because capex is assumed to occur on average mid-year but only starts earning a return on capital in the following year. This is because capex is added to the RAB at the end of the year. The half WACC compensates the business for this timing delay in the modelling assumptions.
depreciation allowance.190 This is because the amended regulatory depreciation that is being added to the RAB is negative due to the CPI
indexation amount more than offsetting the straight-line depreciation amount. 191 State Water, Response 8 to ACCC information request, received 30 August 2013.192 State Water, Response 11 to ACCC information request, received16 September 2013.
ACCC Draft decision on State Water Pricing Application: 2014-15 – 2016-17 | Attachments 84

3.4.3 Depreciation used in the 2010–14 regulatory periodThe ACCC does not approve State Water's application to roll forward its RAB to 1 July 2014 using an actual depreciation approach. The ACCC’s draft decision is to use forecast depreciation (adjusted for actual inflation) as approved by IPART in the previous price review determination for the 2010–14 regulatory period. The ACCC’s draft decision is to approve a total straight-line depreciation amount of $26.0 million (nominal), $1.7 million (or 7.0 per cent) more than State Water’s application.
The use of forecast depreciation to determine the opening RABs is consistent with IPART’s RAB roll forward approach in previous price review determinations. At the last review, IPART removed the forecast depreciation allowance for the 2006–10 regulatory period to determine the opening RAB as at 1 July 2010. This approach is also consistent with the requirements of Schedule 2 of the WCIR.
The ACCC also considers that using a forecast depreciation approach for the roll forward of the RAB provides a more appropriate level of incentives. A price cap form of regulation, which applies in the case of State Water, provides an incentive to underspend capex. This incentive is heightened if an actual depreciation approach is used because the service provider would then not only retain the return on capital benefit from underspending, but also retain the return of capital within the regulatory period on assets that were not acquired during that period. In its submission, New South Wales Irrigators’ Council (NSWIC) also raised concerns that State Water‘s RAB should reflect the value of the assets that have actually been funded, not the value of the assets that might be funded.193
By using the forecast depreciation allowance to roll forward the RAB, the RAB is reduced by the amount that customers paid for depreciation over the previous regulatory period. This means that even if actual capex is lower than forecast and therefore actual depreciation would be lower, the higher forecast depreciation amount will be removed from the RAB so that a lower RAB would be used to determine future charges.
Consistent with the position above, the ACCC also considers that the forecast depreciation allowance for the 2014–17 regulatory period (adjusted only for actual inflation) should be used to roll forward the RAB for that period at the next price review determination.
3.4.4 Opening RAB in the 2014–17 regulatory periodThe ACCC does not approve State Water’s proposed opening RAB as at 1 July 2014 of $726.1 million (nominal). The ACCC’s draft decision is to approve an opening RAB of $702.0 million (nominal) as at 1 July 2014. The user share of the opening RAB as at 1 July 2014 is $237.6 million (nominal). As discussed in section 3.4.1, State Water provided incorrect amounts for forecast 2009–10 net capex, depreciation and their associated user shares. This affected the RAB roll forward across the entire 2010–14 regulatory period. State Water also provided updated actual capex amounts for 2012–13. The ACCC’s amendments to these inputs in the RFM results in a total opening RAB of $702.0 million as at 1 July 2014 for State Water.
The ACCC received a number of submissions from stakeholders raising concerns that the RAB for the 2014–17 regulatory period would be based on State Water’s estimate of capex for 2013–14 and not actuals. NSWIC, Lachlan Valley Water Inc., Murray Irrigation and Namoi Water all submitted that the roll forward process was flawed as a result of using such an estimate.194
193 New South Wales Irrigators’ Council, Submission to the ACCC State Water review, 13 September 2013, chapter 8.194 New South Wales Irrigators’ Council, Submission to the ACCC State Water review, 13 September 2013, chapter 8.
Lachlan Valley Water Inc., Submission to ACCC, September 2013, pp. 16–17.Murray Irrigation, Response to State Water pricing application for 2014–17, September 2013, p. 8.
85 ACCC Draft decision on State Water Pricing Application: 2014-15 – 2016-17 | Attachments

It is the ACCC’s standard approach to establish the opening RAB of the next regulatory period (in this case 2014–17) using an estimate of capex for the final year of the current regulatory period (in this case 2013–14). Any difference between this estimate and actual capex, and associated accumulated return on capital in respect of the difference, will be accounted for at the next price review determination, as has been done for 2009–10 capex in this review.195 This approach is required because actual capex for 2013–14 will not be available in the time available for the ACCC to complete its review and set charges for the 2014–17 regulatory period. The ACCC understands that State Water will provide audited 2012–13 actual capex for the purposes of the final decision. The ACCC requests that State Water provide an updated estimate of 2013–14 capex for consideration in the ACCC’s final decision.
3.4.5 Projected RAB during the 2014–17 regulatory periodThe ACCC does not approve State Water’s proposed total projected closing capital base as at 30 June 2017 of $958.0 million (nominal). The ACCC’s draft decision is to approve a total projected closing capital base of $865.6 million (nominal) as at 30 June 2017. The user share of the projected closing RAB at 30 June 2017 is $295.9 million (nominal). The roll forward of State Water’s projected RAB over the 2014–17 regulatory period is shown in Table 3-2. A breakdown of the projected closing RAB as at 30 June 2017 by valley is presented in
Table 3-3. Compared to State Water’s application the ACCC’s calculation on the projected RAB reflects:
the various adjustments noted above to the opening RAB as at 1 July 2014
the revised forecast capex and depreciation allowances discussed in attachment 4 and 6 respectively.
Namoi Water, Submission to Australian Competition and Consumer Commission, September 2013, p. 6.195 See the adjustments listed in 2013–14 in Table 3-1.
ACCC Draft decision on State Water Pricing Application: 2014-15 – 2016-17 | Attachments 86

4 Capital expenditureCapital expenditure (capex) is incurred when a business spends money either to buy fixed assets or to add to the value of an existing fixed asset. Capex is an important component of the ACCC’s building block model which we use to assess the total revenue State Water needs to provide water infrastructure services.
Under Rule 29(2)(b) of the Water Charge (Infrastructure) Rules the ACCC must not approve the regulated charges unless the ACCC is satisfied that the applicant’s total forecast revenue for the regulatory period is reasonably likely to meet the prudent and efficient costs of providing infrastructure services in that regulatory period. Therefore the ACCC has assessed whether State Water’s proposed capital expenditures are prudent and efficient costs for providing infrastructure services in the 2014–17 regulatory period.
This attachment outlines the ACCC's assessment of State Water’s proposed capex for 2014–17.
4.1 Draft decisionThe ACCC does not approve State Water’s total capex forecast of $204.1 million (gross, real $2013–14) in its pricing application for the 2014–17 regulatory period.196, 197 This is because we are not satisfied that State Water’s proposal reflects the prudent and efficient costs of providing infrastructure services in that regulatory period. The ACCC considers that a total capex allowance of $151.8 million (gross, real $2013–14) reflects the prudent and efficient costs of providing infrastructure services in accordance with r.29 of the Water Charge Infrastructure Rules (WCIR). The ACCC also considers that $8.2 million (real $2013–14) reflects the expected upfront capital contributions State Water will receive. Therefore, the ACCC proposes to include $143.6 million (net, real $2013–14) as the capex input when determining the revenue allowed under rule 29(3) of the Water Charge Infrastructure Rules.
Figure 4-1 below shows the ACCC’s draft decision and State Water’s proposed capex.
196 State Water, Regulatory Information Template 2014–17, table 3.3. Note that this template shows details just for the Murray-Darling Basin valleys regulated by the ACCC, whereas expenditures shown in State Water’s formal pricing application cover all valleys including the coastal valleys regulated by IPART.
197 Gross capex refers to capex from all funding sources, whereas net capex is capex after deduction of external capital contributions. Real capex is valued at the constant price level of 2013–14.
87 ACCC Draft decision on State Water Pricing Application: 2014-15 – 2016-17 | Attachments

Figure 4-1 Capital expenditure – all valleys – ACCC draft decision ($m, real $2013–14)
Source: ACCC analysis
4.1.1 Summary of reasonsThe following is a summary of the ACCC’s draft decision. Details, reasoning and evidence for this are set out in section 4.5 of this attachment.
Capitalised labour and overheads forecast
State Water has been unable to disaggregate the labour and overhead components in its cost forecasts. The evidence available to the ACCC indicates that the amounts included in State Water’s forecasts are likely to be in excess of its historical capitalised labour and larger than expected given its capex program in the 2014–17 regulatory period. The ACCC requested information from State Water to allow it to disaggregate these amounts, but State Water stated that it was unable to do so.198
Based on the available information, including historical data and trends, we consider an adjustment to State Water’s forecasts is required to ensure State Water does not recover more than the prudent and efficient costs of labour and overheads. This adjustment has been applied to all State Water’s capital expenditure forecasts.
Deliverability of overall capital expenditure program
State Water has proposed significant capital expenditure in the first year of the 2014–17 regulatory period and a rapid drop-off over the rest of the regulatory period. Stakeholders have raised concerns about State Water’s ability to deliver the capital expenditure program in the forecast time period. These concerns have been driven by State Water underspending elements of its approved capex in the past.199 The ACCC considers that State Water’s forecast expenditure in the first year of the 2014–17 regulatory period is not achievable and so has re-phased elements of State Water’s fish passage projects to result in a smoother capital expenditure profile over the 2014–17 regulatory period.
198 State Water, Response 28.8 to ACCC information request, received 8 November 2013.199 Murray Irrigation submission, p.8; Lachlan Valley Water submission, p.16.
ACCC Draft decision on State Water Pricing Application: 2014-15 – 2016-17 | Attachments 88

Dam safety
The ACCC generally considers State Water’s Dam Safety program is prudent and efficient. However, as discussed in Section 4.5.1, the ACCC considers that an adjustment to State Water’s capitalised labour forecasts is required.
The ACCC considers that the Oberon Dam Safety project (Fish River) is not required in the 2014–17 regulatory period. The ACCC notes that State Water is bringing forward the works on the Oberon Dam to achieve efficiency in conducting it concurrently with the Rydal Dam project. The efficiencies identified by State Water in support of this proposal do not appear large enough to justify bringing the project forward to the 2014–17 regulatory period.
Renewals and replacement
The ACCC considers State Water’s renewals and replacement program is generally prudent and efficient. However, as discussed in Section 4.5.1, the ACCC considers that an adjustment to State Water’s capitalised labour forecasts is required. Further, the ACCC considers that the Rydal Dam inlet/outlet (Fish River) works should be reallocated to the dam safety program. This ensures the capex is correctly allocated to activities in accordance with the cost drivers.200
Corporate systems (IT business transformation)
The ACCC considers that the majority of the expenditure is prudent and efficient, and is justified by the need to replace ageing systems and avoid risk of failure of business and operating systems. Additionally, the ACCC notes that State Water will derive efficiency benefits from these projects.
The ACCC identified some components of the program which were primarily targeted at providing efficiency benefits where these benefits have not been adequately justified by State Water. Therefore, the ACCC did not consider these components prudent or efficient.
The ACCC does not approve the hardware component of the Desktop Software Upgrades project, because it would result in State Water recovering these costs as both capital expenditure and through the opex allowance — due to charges for desktop hardware being included in the base year opex.
Finally, the ACCC has allocated an additional amount of capex away from State Water’s regulated customers on the basis that some of the projects provide benefits to both the regulated and unregulated portions of State Water’s business.
Environmental planning and protection
The ACCC does not accept State Water applying a 10 per cent cost contingency for the (environmental and planning and protection (EPP) program. State Water uses a risk based costing method and used P50 cost estimates.201 The ACCC considers this methodology sufficiently compensates State Water for the risk of any cost overruns and so does not consider an additional contingency allowance to be efficient.
Water delivery and operations
200 The cost sharing agreement in Fish River is that it is 100 per cent user-funded. As such, this reallocation does not affect the calculation of either the user or government share of capex.
201 A P50 is a risk based estimate prepared on the basis that there is a 50 per cent chance that the cost of completing the project will be higher than forecast (and there is a 50 per cent chance the cost of completing the project will be lower than forecast).
89 ACCC Draft decision on State Water Pricing Application: 2014-15 – 2016-17 | Attachments

The ACCC does not consider the proposed expenditure on the Computer Aided River Management System (CARMS) is prudent and efficient. The ACCC notes that State Water has not completed a detailed business plan, obtained external funding or robustly identified the cost and benefits which may result from this project. Therefore the ACCC does not consider a prudent and efficient service provider would undertake this expenditure in the 2014–17 regulatory period.
The ACCC does not accept the proposed expenditure on the Crooked Creek water efficiency project because the anticipated benefits do not outweigh the cost of undertaking the project.
The ACCC does not accept the proposed capex for integrating the National Water Market System into State Water’s corporate systems, because it is unlikely to be needed in the next regulatory period.
4.1.2 Summary of approved expenditureThe tables below show State Water’s approved capital expenditure broken down by activities and valleys.
Table 4-1 compares State Water’s proposal and the ACCC’s draft decision, disaggregated by the broad activity categories used by State Water.
Table 4-1 Capital expenditure – State Water’s proposed and ACCC draft decision, by activity ($ ‘000, real $2013–14)
ACCC draft decision -
User share
ACCC draft decision -
Government share
ACCC draft decision -
Total
State Water proposal
Difference between
proposal and draft
Percentage difference
Dam safety compliance - Pre 1997 Construction
8,488 75,458 83,945 100,067 -16,122 -16%
Renewal & replacement 14,330 1,177 15,507 19,921 -4,413 -22%
Corporate systems 6,639 - 6,639 9,155 -2,516 -28%
Environmental planning and protection
22,677 22,677 45,355 57,254 -11,899 -21%
Water delivery and other operations
351 - 351 17,720 -17,369 -98%
Gross capex 52,486 99,312 151,798 204,117 -52,320 -26%
Capital contributions - 8,237 8,237 8,237 - 0%
Net capex 52,486 91,075 143,561 195,880 -52,320 -27%
Source: ACCC Analysis
Table 4-2 compares State Water’s proposal and the ACCC’s draft decision on a valley by valley basis.
ACCC Draft decision on State Water Pricing Application: 2014-15 – 2016-17 | Attachments 90

Table 4-2 Capital expenditure – State Water’s proposed and ACCC draft decision, by valley ($ ‘000, gross, real $2013–14)
ACCC decision - User
share
ACCC decision -
Government share
ACCC decision -
Total
State Water proposal
Difference between
proposal and draft
Percentage difference
Border Rivers 284 4 287 963 -676 -70%
Gwydir 9,320 7,384 16,703 22,317 -5,614 -25%
Namoi 2,631 47,065 49,697 58,373 -8,676 -15%
Peel 477 17,870 18,346 21,460 -3,114 -15%
Lachlan 13,954 10,762 24,716 32,648 -7,932 -24%
Macquarie 8,258 15,090 23,348 33,196 -9,848 -30%
Murray 1,446 953 2,399 5,546 -3,147 -57%
Murrumbidgee 2,941 184 3,125 6,347 -3,222 -51%
Lowbidgee 1,560 - 1,560 1,820 -260 -14%
Fish River 11,616 - 11,616 21,447 -9,830 -46%
Total 52,486 99,312 151,798 204,117 -52,320 -26%
Source: ACCC Analysis
Government and user shares
The ACCC has been advised that the NSW Government has agreed to pay a share of State Water’s efficient costs calculated on the basis of the same cost sharing ratios as determined by IPART in 2010.202 Applying those cost sharing ratios, the ACCC’s draft decision is that that the Government’s share of the gross capex is $99.3 million and users’ share of capex is $52.5 million.
202 Letter from Katrina Hodgkinson MP, Minister for Primary Industries, to Rod Sims Chairman ACCC, 21 November 2012.
91 ACCC Draft decision on State Water Pricing Application: 2014-15 – 2016-17 | Attachments

Figure 4-2 Capital expenditure — ACCC draft decision – Split between government and user share (gross, real $2013–14)
Source: ACCC analysis
4.2 State Water's proposalState Water proposed capex of $204.1 million (gross, real $2013–14) for its ACCC regulated valleys for the 2014–17 regulatory period.
State Water’s proposed capex is for:
$100.1 million on dam safety upgrades at five major dams as follows:
$12.0 million for the Burrendong Dam in Macquarie valley.
$47.0 million for the Keepit Dam in the Namoi valley.
$19.2 million for the Chaffey Dam in the Peel valley.
o State Water also submitted that it would receive $8.2 million in capital contributions towards the Chaffey Dam augmentation, from the Commonwealth and NSW Governments, Tamworth Regional Council and Peel Valley irrigators.203
203 State Water, Response 2.7 to ACCC information request, received 12 July 2013.
ACCC Draft decision on State Water Pricing Application: 2014-15 – 2016-17 | Attachments 92

$6.0 million for the Oberon Dam in the Fish River.
$5.9 million for the Rydal Dam in the Fish River.
$19.9 million on renewals and replacement programs. This includes several larger projects in the Macquarie Valley and Fish River, as well as numerous smaller projects across all valleys.
$9.2 million on corporate systems. This includes the funding required for State Water’s proposed Business Transformation Program (BTP), which is intended to modernise its IT systems.
$57.3 million on environmental planning and protection. This includes works on 13 fish passage offset sites identified as cheaper options than undertaking this work at major dams. The majority of this expenditure falls in the Gwydir, Lachlan and Macquarie Valleys.
$17.7 million on water delivery and other operations. This includes $13.6 million proposed for the roll out of Computer Aided River Management Systems (CARMS) and $3.5 million for the Crooked Creek water efficiency project in the Macquarie valley.
State Water’s proposed capex is set out in the tables below.
Table 4-3 State Water's proposed capital expenditure, by activity ($ ‘000, gross, real $2013-14)
2014–15 2015–16 2016–17 Total User share % User share
Dam safety compliance - Pre 1997 Construction
60,260 27,716 12,092 100,067 13,119 13%
Renewal & replacement 6,847 6,736 6,338 19,921 18,579 93%
Corporate systems 3,514 3,110 2,532 9,155 9,155 100%
Environmental planning and protection
42,784 14,470 - 57,254 28,627 50%
Water delivery and other operations
8,340 4,695 4,685 17,720 17,720 100%
Gross capex 121,745 56,727 25,646 204,117 87,200 43%
Capital contributions 8,237 - - 8,237 - 0%
Net capex 113,508 56,727 25,646 195,880 87,200 45%
Source: State Water applicationNote: Lowbidgee and Fish River are 100% user-funded and so the percentage user shares for dam safety and compliance and renewals and replacement in the above table reflect the higher rate of user contributions in these valleys.
93 ACCC Draft decision on State Water Pricing Application: 2014-15 – 2016-17 | Attachments

Table 4-4 State Water's proposed capital expenditure, by valley ($ ‘000, gross, real $2013-14)
2014–15 2015–16 2016–17 Total User share % User share
Border Rivers 330 351 282 963 959 100%
Gwydir 16,198 5,384 735 22,317 12,947 58%
Namoi 31,180 26,463 730 58,373 4,613 8%
Peel 20,884 349 228 21,460 1,051 5%
Lachlan 18,625 11,897 2,126 32,648 18,921 58%
Macquarie 27,172 4,294 1,730 33,196 15,432 47%
Murray 2,658 1,553 1,335 5,546 3,872 70%
Murrumbidgee 2,515 1,578 2,254 6,347 6,138 97%
Lowbidgee 349 829 642 1,820 1,820 100%
Fish River 1,832 4,029 15,585 21,447 21,447 100%
Total 121,745 56,727 25,646 204,117 87,200 43%
Source: State Water application
4.3 SubmissionsThe ACCC received multiple submissions which raised specific concerns with State Water’s proposed capex for the 2014–17 regulatory period. The ACCC also received submissions which supported aspects of State Water’s proposal.
Key points from stakeholders’ submissions are outlined below. These submissions are discussed in greater detail in the ACCC’s consideration of each capital program.
4.3.1 The ability of State Water to deliver its capital expenditure program. Several submissions raised concerns about whether State Water would be able to deliver its full capex program. Stakeholders consider that underspends in actual versus forecast capex appears to be a regular occurrence for State Water and raises the issue of State Water’s capacity to deliver on major expenditure programs.204
4.3.2 State Water’s proposed IT expenditureStakeholder groups were generally opposed to paying additional costs for corporate and IT projects, and were concerned there was insufficient information on the benefits. Stakeholders consider that customers have previously funded an upgrade of the ICT system without obtaining any commensurate benefits. They were also concerned that the expenditure forecasts and timing could be affected by an internal review currently being conducted by State Water. Finally, stakeholders consider that customers should not bear the cost of upgrading an information, communications and technology system that was not adequately planned and implemented initially, and should not have to pay for new systems which are needed because of past mismanagement.205
204 Murray Irrigation submission, p.8; Lachlan Valley Water submission, p.16.205 Peel Valley Water Users Association, submission, sections 3.3.3 and 3.3.5 – 3.3.6; Lachlan Valley Water,
submission, p.15.
ACCC Draft decision on State Water Pricing Application: 2014-15 – 2016-17 | Attachments 94

4.3.3 Fish passage projectsUsers generally did not support the allocation of 50 per cent of these costs to users. Users consider these costs arise as a result of dam safety upgrades and state legislation and so should be fully attributed to the NSW Government.206
Fisheries NSW requested that funding allocated by the ACCC for the 2014–17 period be sufficient to complete detailed designs and fish passage construction at the remaining 12 fishway sites to meet State Water’s legislative requirement under s.218 of the Fisheries Management Act.207
4.3.4 Valley specific projects Some stakeholders made comments on specific projects which affect their valley. In particular, the following projects were not supported by users in the relevant valley:
Crooked Creek water efficiency – Macquarie valley
Macquarie Marsh desilting – Macquarie valley.208
The users generally did not support these projects on the basis that the benefits of undertaking the project are uncertain.
4.4 Assessment approachThe ACCC has undertaken a detailed assessment of State Water’s forecast capex with a view to determining whether it reflects the prudent and efficient costs of providing infrastructure services in the 2014–17 regulatory period. The ACCC considers that this also ensures that the Basin water charging objectives and principles209 are also met insofar as they relate to State Water’s capex.
Details of the ACCC’s assessment and criteria for approving or not approving State Water’s proposed capex are set out below.
4.4.1 Prudent and efficient capital expenditureThe ACCC considers proposed capex is prudent if it is required for one or more of the following reasons:
(1) It is required by safety or other regulatory obligations.
(2) It is required to allow State Water to continue to operate at an appropriate service level with an acceptable level of business risk (i.e. if a system is critical to the functioning of State Water’s operations and the cost of mitigating the risk of failure is low compared to the cost of failure, then the project is prudent).
(3) It is required to replace or repair required assets on the basis of a continued need and the asset’s condition or remaining life.
(4) It results in financial benefits at least equal to the cost of the project (i.e. a net present value positive project on the basis of reduced future expenditure or increased water availability and sales)
206 Lachlan Valley Water, submission, p.14; New South Wales Irrigators’ Council (NSWIC), submission, p.10.207 NSW Department of Primary Industries (Fisheries NSW), submission, p.3.208 Macquarie River Food and Fibre submission, p.13.209 Schedule 2 of the Water Act 2007 (Cwth).
95 ACCC Draft decision on State Water Pricing Application: 2014-15 – 2016-17 | Attachments

(5) It is required to meet a growth in demand.
The ACCC considers proposed capex efficient if
(6) The project is undertaken at lowest sustainable cost.
4.4.2 Assessment methodologyThe ACCC has applied a number of assessment approaches to determine whether State Water’s proposed expenditure is prudent and efficient.
For larger projects, the ACCC has considered the need for each project and whether it is justified on one of the grounds identified above. We have then examined how the cost forecast has been constructed and whether it reflects prudent and efficient costs. We are mindful that different projects are at different stages of readiness. This means that robust costings are only available for some projects, while cost forecasts for other projects are necessarily at a more preliminary stage.
For smaller projects, the ACCC has generally considered the projects as a capex program. We then:
ascertained whether the program as a whole is required; and
whether the costs of undertaking the projects is justified.
The ACCC has also considered the opinions of its expert consultant Deloitte Access Economics (Deloitte). Deloitte conducted a review of State Water’s capex for the ACCC. In undertaking the review Deloitte sub-contracted some aspects of the review to specialist engineers Aurecon and Bird Consulting Group.
4.5 Reasons for draft decisionThe ACCC applied its assessment approach and concluded that State Water’s forecast capex for 2014–17 is not prudent and efficient. The ACCC has identified components of State Water’s proposed capex which do not reflect the prudent and efficient cost of providing the necessary infrastructure services. The ACCC’s reasons for reaching this conclusion are set out below.
Accordingly, the ACCC considers that capex of $151.8 million (real) gross capex for the 2014–17 regulatory period reflects the prudent and efficient costs of providing infrastructure services.
The following sections set out the ACCC’s assessment of the capex proposed by State Water.
4.5.1 Capitalised labour and overheadsThe ACCC’s draft decision is not to accept State Water’s approach to forecasting the costs of its capitalised internal labour and overheads. The ACCC considers that the prudent and efficient costs of providing infrastructure services in the 2014–17 regulatory period includes capitalised labour and overheads of $10.7 million.
State Water has not provided a robust estimate of its proposed capitalised labour and overhead costs.210 Moreover, the ACCC considers that State Water has not provided enough evidence for it to assess the approach State Water has taken to labour and overheads capitalisation in its capex 210 State Water, Response 28.8 to ACCC information request, received 8 November 2013.
ACCC Draft decision on State Water Pricing Application: 2014-15 – 2016-17 | Attachments 96

projects. On the basis of the information provided by State Water including proposed and historical expenditure, the ACCC has used an extrapolation methodology to estimate the amount of capitalised labour and overheads embedded in State Water’s proposed capex program for the 2014–17 regulatory period. The ACCC is unaware of a better extrapolation methodology, given the information that it has available.
State Water provided information on its fish passage and dam safety proposals which specifically identified labour and overhead costs capitalised in those projects.211 These projects accounted for 97 per cent of State Water’s total fish passage and 15 per cent of its dam safety program for the 2014–17 regulatory period. In total, these projects accounted for 32 per cent of State Water’s capital expenditure program for the 2014–17 regulatory period. If State Water provides the ACCC with additional information from which it can ascertain the capitalised labour and overheads in the remaining projects, the ACCC will take this information into account in its final decision.
The amount of specifically identified capitalised labour and overhead costs in those projects is $11.4 million. This represents an average of 18.4 per cent of the cost of these projects. Applying this proportion (18.4 per cent) to the whole of State Water’s proposed capex program for the 2014–17 regulatory period, it would appear that $32.9 million of labour and overhead costs may be embedded in State Water’s total capex proposal of $204.1 million. The ACCC is unable to know this for sure. But, given the information available, the ACCC considers this to be the most reasonable estimate it can make at this time.
The ACCC then compared this 18.4 per cent estimate with historical averages drawing on information provided by State Water. The ACCC estimates that State Water has historically capitalised around $4.0 million per annum over the three years of 2010–11 to 2012–13 period. This was equivalent to approximately 7.0 per cent of capex. This is substantially below the 18.4 per cent the ACCC considers is embedded in State Water’s proposed capex program for the 2014–17 regulatory period.
Based on the application of this methodology, the ACCC considers that $32.9 million is higher than the prudent and efficient amount of labour and overheads. Accordingly, the ACCC has proposed a capitalised labour and overhead of $10.7 million be included in State Water’s capex program, which is 7.0 per cent of the capex program approved for the 2014–17 regulatory period. The ACCC considers this substituted amount represents a reasonable estimate of prudent and efficient capitalised labour and overhead costs for the 2014–17 regulatory period, particularly given the paucity of information available.
211 Identified from documents supplied in the following information requests - State Water, Response 5.50 to ACCC information request, 16 July 2013; State Water, Response 27.1 (a) – 27.1 (c) to ACCC information request, received 4 November 2013.
97 ACCC Draft decision on State Water Pricing Application: 2014-15 – 2016-17 | Attachments

Table 4-5 Capitalised labour and overheads — State Water’s proposed and ACCC draft decision, by activity ($ ‘000, gross, real $2013–14)
ACCC decision -
User share
ACCC decision -
Government share
ACCC decision -
Total
Indicative - State
Water proposal*
Difference between proposal and draft
Percentage
difference
Dam safety compliance - Pre 1997 construction
597 5,304 5,901 17,918 -12,017 -67%
Renewal & replacement 1,007 83 1,090 3,260 -2,170 -67%
Corporate systems 467 - 467 1,393 -926 -67%
EP&P - fish passage works 1,594 1,594 3,188 10,307 -7,119 -69%
Water delivery and other operations
25 - 25 74 -49 -67%
Total 3,689 6,981 10,671 32,952 -22,281 -68%
Source: ACCC analysis*Note: This is the ACCC’s assessment of the capitalised labour and overheads embedded in State Water’s proposal.
Table 4-6 Capitalised labour and overheads —State Water’s proposed and ACCC draft decision on labour and overheads ($ ‘000, gross, real $2013–14)
ACCC decision -
User share
ACCC decision -
Government share
ACCC decision -
Total
Indicative - State Water
proposal*
Difference between
proposal and draft
Percentage difference
Border Rivers 20 0 20 60 -40 -67%
Gwydir 655 519 1,174 3,885 -2,711 -708%
Namoi 185 3,308 3,493 10,510 -7,017 -67%
Peel 34 1,256 1,290 3,857 -2,567 -67%
Lachlan 981 757 1,737 5,570 -3,833 -69%
Macquarie 581 1,061 1,641 5,302 -3,660 -69%
Murray 102 67 169 1,028 -859 -84%
Murrumbidgee 207 13 220 656 -437 -67%
Lowbidgee 110 - 110 328 -218 -67%
Fish River 817 - 817 1,756 -939 -54%
Total 3,689 6,981 10,671 32,952 -22,281 -68%
Source: ACCC Analysis* Note: This is the ACCC’s assessment of the capitalised labour and overheads embedded in State Water’s proposal.
State Water submission
State Water’s submission provided limited information on the manner in which it forecast its capitalised internal labour costs and overheads. This limited information was insufficient for the ACCC to determine the extent of State Water’s capitalised internal labour costs and overheads. However, during our review of State Water’s proposal the ACCC identified that State Water included a labour and overheads component in some of its cost build-ups. The ACCC identified specific allowances for capitalised labour and overheads in all the major fish passage projects and in four of the dam safety
ACCC Draft decision on State Water Pricing Application: 2014-15 – 2016-17 | Attachments 98

projects. The ACCC requested that State Water provide data on all internal labour costs included in the cost forecasts for each project and State Water advised that it was unable to do so.212
State Water’s responses to ACCC information requests have not claimed that there is no labour or overhead allowance included in the remaining cost forecasts. Rather, State Water indicated that it could not provide data on all internal labour costs included in its cost forecasts.213
Consultant report
Deloitte noted that it was unable to reconcile the total amount capitalised with the labour amounts capitalised in individual projects.214 Deloitte stated that, as a result of these reconciliation issues, it was concerned that State Water’s proposed capex estimates may be overstating its capitalised labour costs.215 Deloitte did not recommend any specific adjustment, but noted that the ACCC was continuing to follow-up on this issue.
Stakeholder submissions
The ACCC did not receive any submissions specifically discussing this aspect of State Water’s proposal.
ACCC’s consideration and conclusion
The ACCC notes that State Water uses a number of delivery methodologies and undertakes capital projects of varying complexity, so the amount of capitalised labour and overheads used on each project could vary substantially.216 Accordingly, it is difficult to determine on a project by project basis whether the amount of labour and overheads is the prudent and efficient amount. The ACCC considers that a reasonable assumption is that the amount of State Water’s capitalised labour and overheads will be driven by the size of State Water’s capital program. However, the ACCC also considers that the total amount of labour and overheads is ultimately constrained by the size of State Water’s staff and operations. Therefore the ACCC does not consider that State Water’s total labour and overheads capitalisation allowance would substantially depart from State Water’s total historical level.
When the ACCC compared State Water’s proposed labour and overheads against its historical level, the ACCC found that State Water’s proposal was significantly higher than previously incurred. The ACCC found that the labour and overheads embedded in State Water’s proposed capex (where they could be identified) averaged 18 per cent of capex. By contrast, the labour and overheads reported in State Water’s historical capex was 7 per cent of capex. Despite the ACCC only being able to identify the labour and overheads in projects accounting for 32 per cent of State Water’s capex, the ACCC identified labour and overheads of $11.4 million. Extrapolating for the total amount of labour and overheads embedded in State Water’s capital program ($32.9 million), State Water’s total proposed amount would be 2.3 times larger than the historical level of expenditure. The ACCC considers that such a divergence from history indicates that the amount of labour and overheads in State Water’s proposal is higher than prudent and efficient.
212 State Water, Response 28.8 to ACCC information request, received 8 November 2013.213 State Water, Response 28.8 to ACCC information request, received 8 November 2013.214 Deloitte report, p. 33.215 Deloitte report, p. 33.216 State Water provided information on five historical projects where the overheads varied from 1.4 per cent to 27.7 per
cent. However, because this is a select subset of projects, it does not provide a solid basis for determining average overheads. Source: State Water, Response 31.1 to ACCC information request, received 25 November 2013.
99 ACCC Draft decision on State Water Pricing Application: 2014-15 – 2016-17 | Attachments

The ACCC’s reasoning is set out in more detail below.
Labour and overhead amounts in State Water’s cost forecasts.
The ACCC identified specific allowances for capitalised labour and overheads in each of the major fish passage projects and in four of the dam safety projects. The ACCC then extrapolated the identified labour and overheads to assess the amount of labour and overheads embedded in State Water’s remaining capex projects.
The ACCC examined the labour and overheads of the fish passages program and considers the capitalised internal labour component of this program to be $9.5 million.217 Table 4-7 shows the amount of labour forecast by State Water in its fish passage program.
The ACCC also notes that State Water provided details of labour costs of the Lake Cargelligo fish passage project. This project was completed in 2011–12 and the labour component of this particular project was 8.1 per cent of the project’s costs.218 This indicates that State Water’s forecasts of labour and overhead costs for other fish passage projects may be higher than prudent and efficient.
State Water provided sufficient detail to examine the labour and overhead components of four out of seven dam safety projects.219 These projects were generally smaller dam safety projects and comprised $13.9 million out of the total $100 million in State Water’s proposed dam safety program. 220
The ACCC found that the labour and overheads of these four dam safety projects is $1.9 million.221
Table 4-7 shows the amount of labour and overheads forecast by State Water in the four dam safety projects (where the ACCC has been able to disaggregate these costs).
Table 4-7 Capitalised labour in projects where identified, 2014–17 ($ ‘000, gross, real $2013–14)
Fish passages Dam safety Total
Internal labour and overheads 9,459 1,936 11,395
Total project capex 47,874 13,910 61,784
Capitalised labour as proportion of capex 19.8% 13.9% 18.4%
Source: ACCC analysis of State Water’s proposal - State Water, Response 5.50 to ACCC information request, received 16 July 2013; Response 27.1 (a) – 27.1 (c) to ACCC information request, received 4 November 2011.
Remaining capital expenditure projects
The ACCC requested additional information to allow it to examine the labour and overheads components of State Water’s remaining capex programs. State Water indicated that it could not provide data on all internal labour costs included in its cost forecasts.222 Therefore, the ACCC does not currently have sufficient detail to explicitly identify the amount of labour and overheads embedded in each project’s cost forecasts. State Water did provide some evidence about the labour component
217 State Water, Response 5.50 to ACCC information request 5.50, received 16 July 2013.218 State Water, Response 31.1 (follow up to response 26.6 and 26.8) – capitalised labour, received 25 November 2013.219 These were the Rydal Dam upgrade, Oberon Dam upgrade, Menindee Lakes design work and Wyangala design
works.220 The ACCC notes that State Water provided details of labour and overhead costs previously incurred for the
Blowering Dam safety upgrade project. This project was completed in 2011–12 and the labour component of this particular project was 1.4 per cent of the projects costs. However, this was a large construction project and is not directly comparable with the projects identified above.
221 These amounts were based on the portion of the projects within the 2014–17 regulatory period — State Water, Response 27.1 (a) – 27.1 (c) to ACCC information request, received 4 November 2011.
222 State Water, Response 28.8 to ACCC information request, received 8 November 2011.
ACCC Draft decision on State Water Pricing Application: 2014-15 – 2016-17 | Attachments 100

of historical capex projects.223 However, this does not provide any further justification for State Water’s forecast labour and overheads for the 2014–17 regulatory period.
Given the lack of detailed information, the ACCC considers that the fish passage and dam safety costings (where labour and overheads are identifiable) are the best information available to indicate State Water’s approach to forecasting labour and overhead costs. The average proportion of labour and overheads identified in these projects is 18.4 per cent. On this basis, the ACCC considers that it is reasonable to use 18.4 per cent as the basis for extrapolation to the allowance for labour and overheads embedded in State Water’s other capex forecasts.
Expected labour and overhead costs (based on State Water’s proposal)
Information provided by State Water showed that historically it had capitalised labour amounts averaging $4.0 million per annum over the 2010–11 to 2012–13 period.224 This shows that over this period State Water’s labour and overheads were approximately 7.0 per cent of its capex.
Table 4-8 Capitalised labour and overheads — Historical data ($ ‘000, gross, nominal)
2010–11 2011–12 2012–13 Average
Actual capex* 79.5 56.4 35.1 57.0
Historical Internal labour + overheads 4.6 3.6 3.8 4.0
Percentage 5.7% 6.5% 10.9% 7.0%
Source: State Water, Response 28.3 to ACCC information request, received 8 November 2013.Note: *These capex figures do not correspond with the ACCC’s approved capex amount. They were provided by State
Water in the same data set as the overhead amounts. The ACCC has used these capex figures here to ensure the capex and overhead amounts are expressed on a consistent basis.
Based on State Water’s proposed capex, a reasonable forecast for State Water’s capitalised labour and overheads should be around $11.4 million over the 2014–17 regulatory period.225 This is an average of $4.7 million per annum. Table 4-9 shows the predicted labour and overheads in the 2014–17 regulatory period (based on State Water’s proposal).
Table 4-9 Predicted capitalised labour and overheads – Based on State Water’s proposed capex ($ ‘000, gross, real $2013–14)
2014–15 2015–16 2016–17 Total Average
State Water - Proposed Capex 121,745 56,727 25,646 204,117 68,039
Predicted Labour and Overheads
8,558 3,988 1,803 14,348 4,783
Percentage 7.0% 7.0% 7.0% 7.0% 7.0%
Source: ACCC analysis
Prudent and efficient overheads in the 2014–17 regulatory period
As noted above the ACCC has used the historical proportion of capitalised labour and overheads to extrapolate the amount of labour and overheads State Water needs in the 2014–17 regulatory period. Based on an approved capex program of $141.1 million (with labour and overheads removed) the ACCC considers that the prudent and efficient level of capitalised labour and overheads is $10.7 223 State Water, Response to follow up to response 31.1 – capitalised labour, received 25 November 2013.224 State Water, Response 28.3 to ACCC information request, received 8 November 2011.225 This is based on State Water’s proposal. To the degree the ACCC does not accept aspects of State Water’s
proposals the capitalised labour estimate also needs to be adjusted. This is discussed further below.
101 ACCC Draft decision on State Water Pricing Application: 2014-15 – 2016-17 | Attachments

million in the 2014–17 regulatory period. Accordingly the total approved capex program is $151.8 million.
Table 4-10 sets out the ACCC’s decision on prudent and efficient capitalised labour and overheads.
Table 4-10 Capitalised labour and overheads — ACCC draft decision ($ ‘000, gross, real
$2013-14)
2014–15 2015–16 2016–17 Total
ACCC draft decision on capex allowance (excluding internal labour)
69,905 49,335 21,886 141,127
Capitalised labour 5,286 3,730 1,655 10,671
Total capex allowance. 75,191 53,065 23,541 151,798
Source: ACCC analysis
Application to all cost forecasts
The ACCC notes that Deloitte did not propose to make an adjustment to remove labour and overheads from State Water’s cost forecasts. However, the ACCC notes that Deloitte was also unable to reconcile the total amount capitalised with the labour amounts capitalised in individual projects and expressed concerns that State Water’s proposed capex estimates may be overstating its capitalised labour costs. Therefore, the ACCC considers it appropriate to make this adjustment across all cost categories despite Deloitte’s recommendation.
Decision on capitalised labour allowance
The ACCC is required to review State Water’s proposed expenditure to determine whether it is the prudent and efficient costs of providing infrastructure services. Labour and overheads form part of State Water’s proposal and the ACCC is required to assess whether these forecasts are prudent and efficient. However, State Water has not disaggregated all of its cost forecasts to allow the ACCC to properly examine the labour and overhead costs. State Water states that it cannot provide this disaggregation.226 Therefore the ACCC has based its assessment on the best information available to it. The ACCC considers that the fish passage and dam safety (where labour and overheads are identifiable) cost forecasts are the best indicator of State Water’s approach to forecasting labour and overhead costs. As such, the ACCC considers that it is likely State Water has embedded a similar amount in its other cost forecasts. This indicates that State Water has included $32.9 million of labour and overhead costs in its proposal.
The ACCC then considered the size of State Water’s historical capex program and historical labour and overheads costs. Based on the size of the capex program approved by the ACCC we consider that the prudent and efficient expenditure on labour and overheads is $10.7 million. The ACCC has made this adjustment in the following manner:
(1) Removed identified labour and overhead amounts from cost forecasts — for projects where they
have been explicitly identified.
226 State Water, Response 28.8 to ACCC information request, received 8 November 2011.
ACCC Draft decision on State Water Pricing Application: 2014-15 – 2016-17 | Attachments 102

(2) Removed 18.4 per cent from all remaining cost forecasts (to remove the labour and overheads estimated to be embedded in the forecasts).
(3) Calculated the prudent and efficient level of labour and overhead costs (by applying the historical percentage of labour and overheads).
(4) Added the prudent and efficient labour and overhead costs back into each project. This has been done by spreading the prudent and efficient labour and overhead across all approved programs.
As a result the ACCC has made a net downward adjustment of $22.3 million to State Water’s forecast.
The ACCC’s preference is to make its final decision on the basis of more complete information. If State Water provides additional information subsequent to this draft decision the ACCC will examine any additional information and incorporate it into its final decision. If the ACCC does not receive sufficient additional information, then the extrapolation approach applied in this draft decision may continue to represent the most reasonable estimate the ACCC can make.
4.5.2 ContingenciesThe ACCC’s draft decision is not to accept State Water’s approach to forecasting the contingencies required in its cost forecasts. The ACCC’s draft decision is to:
accept State Water’s approach of applying a 10 per cent contingencies to the Dam Safety and Compliance Program. However, the ACCC notes that where it has reduced the approved allowance for this program, the contingencies have similarly been reduced; and
not accept State Water’s proposed additional project contingencies of $4.8 million (real $2013–14) on the Environmental Planning and Protection programs.
The ACCC considers that State Water’s P50 based cost forecasts for the environmental planning and protection programs reflect the prudent and efficient costs of providing infrastructure services.227
Where State Water also proposes a contingency allowance in addition to a P50 forecast, forecast expenditure will be greater than the prudent and efficient costs of providing infrastructure services in that regulatory period. On this basis, the ACCC does not accept the additional contingency allowance applied on top of the P50 cost estimates for the environmental planning and protection programs.
Where State Water applied a P20 cost forecast to the dam safety program, the ACCC has accepted that an additional contingency allowance of 10 per cent is required to meet the prudent and efficient costs of providing infrastructure services in that regulatory period.228 This is because the ACCC accepts that on average the cost of delivering the dam safety program will be higher than the P20 cost forecasts prepared by State Water.
227 A P50 is a risk based estimate prepared on the basis that there is a 50 per cent chance that the cost of completing the project will be lower than forecast (and there is a 50 per cent chance the cost of completing the project will be higher than forecast).
228 A P20 is a risk based estimate prepared on the basis that there is a 20 per cent chance that the cost of completing the project will be lower than forecast (and there is a 80 per cent chance the cost of completing the project will be higher than forecast).
103 ACCC Draft decision on State Water Pricing Application: 2014-15 – 2016-17 | Attachments

The ACCC also notes that, as discussed in section 4.5.2, it has not accepted that the Oberon Dam Safety Upgrade is prudent and efficient. Accordingly, the ACCC does not accept the contingency allowance for this project.
Finally, the ACCC identified a small discrepancy where the proposed contingencies did not equal exactly 10 per cent of the Dam Safety Costs. The ACCC has corrected this discrepancy in its draft decision.
Table 4-11 Project contingencies - State Water’s proposed and ACCC draft decision, by activity ($ ‘000, gross, real $2013–14)
ACCC decision -
User share
ACCC decision -
Government share
ACCC decision -
Total
State Water proposal
Difference between proposal and draft
Percentage difference
Dam safety compliance - Pre 1997 construction*
772 6,203 6,974 8,320 -1,346 -16%
Renewal & replacement - - - - - -
Corporate systems - - - - - -
EP&P - fish passage works - - - 4,780 -4,780 -100%
Water delivery and other operations
- - - - - -
Total 772 6,203 6,974 13,100 -6,126 -47%
Source: ACCC analysis*Note: Where the ACCC has not approved aspects of the dam safety program this has resulted in lower contingencies
being approved.
Table 4-12 Project contingencies —State Water’s proposed and ACCC draft decision by valley ($ ‘000, gross, real $2013–14)
ACCC decision -
User share
ACCC decision -
Government share
ACCC decision -
Total
State Water proposal
Difference between
proposal and draft
Percentage difference
Border Rivers - - - - - -
Gwydir - - - 1,532 -1,532 -100%
Namoi - 4,121 4,121 4,950 -830 -17%
Peel - 965 965 1,139 -174 -15%
Lachlan - 40 40 2,198 -2,159 -98%
Macquarie - 1,053 1,053 1,889 -836 -44%
Murray - 25 25 205 -180 -88%
Murrumbidgee - - - - - -
Lowbidgee - - - - - -
Fish River 772 - 772 1,187 -415 -35%
Total 772 6,203 6,974 13,100 -6,126 -47%
Source: ACCC analysis
ACCC Draft decision on State Water Pricing Application: 2014-15 – 2016-17 | Attachments 104

State Water proposal
State Water’s proposed contingencies for the dam safety upgrade and environmental planning and protection programs of $8.3 million and $4.8 million, respectively. The contingencies are allocated across the regulated valleys in proportion to the size of the projects in each valley.
State Water submitted that IPART had determined at its 2010–14 review that a contingency fund at a program level would be more efficient than a provision of contingency at each project level.229 State Water proposed to adopt this program-based approach with respect to the Dam Safety and Compliance (DSC) and the Environmental Planning and Protection programs for the 2014–17 regulatory period.
Consultant report
The ACCC’s consultant (Deloitte) considered the size and appropriateness of State Water’s proposed contingencies.230
Deloitte concluded that:
In respect of DSC projects, the 10 per cent contingency allowance appears reasonable given the shift to estimating DSC capex on a P20 basis.
The EPP program contingency of 10 per cent with P50 estimates may be excessive and should be reduced to 5 per cent.
In reaching its conclusion that the Environmental Planning and Protection programs should be reduced to 5 per cent Deloitte considered the amount of the contingencies which had been utilised in the previous regulatory period. Deloitte found that around 60 per cent of the Environmental Planning and Protection had been utilised.231 None of the Dam Safety and Compliance Contingency was utilised.232 Deloitte noted that the reason for the low utilisation of the contingencies may have been driven by the conservative P90 estimates used for those cost forecasts.233
Stakeholder submissions
The ACCC did not receive any submissions specifically discussing this aspect of State Water’s proposal.
ACCC’s consideration and conclusion
The ACCC notes that the Dam Safety and Compliance programs are based on a P20 cost basis. However, the Environmental Planning and Protection program is costed on a more conservative P50 basis.234
229 State Water Response to ACCC information request 5.49, received 16 July, p.3; and Response 5.50, received 18 July 2013.
230 Deloitte, final report, p. 91-94.231 Deloitte report p. 92. 232 Deloitte report, p. 92.233 Deloitte report, p. 93.234 Deloitte report,, p.91.
105 ACCC Draft decision on State Water Pricing Application: 2014-15 – 2016-17 | Attachments

The ACCC also notes that a P50 is a risk based estimate prepared on the basis that there is a 50 per cent chance that the cost of completing the project will be lower than forecast. Conversely, there is a 50 per cent chance cost of completing the project will be higher than forecast. This risk based forecast methodology takes account of anticipated risks and the possible cost impact of these risks. This forecasting methodology ensures that State Water’s risk is already accounted for in its cost forecast and so ensures that actual costs should not be systematically higher than its cost forecasts.
The ACCC notes that Deloitte, in recommending a reduction to a 5 per cent contingency for the environmental planning and protection program, examined the amount of contingencies used in the previous regulatory period and concluded that 60 per cent of the contingencies on the environmental planning and protection program had been used. When using a P50 cost forecast, State Water would expect to require some of the contingency allowance 50 per cent of the time. However, State Water would also expect the costs of the project to be less than forecast 50 per cent of the time. Therefore, State Water’s forecasting methodology should allow it to recover its costs across this program, without the need for an additional contingency allowance.
The ACCC considers that a contingency allowance above a P50 cost estimate does not reflect the prudent and efficient cost of providing infrastructure services. This is because State Water would expect that on average its P50 cost forecast is the prudent and efficient cost of providing the infrastructure services and any contingency allowance additional to this P50 estimate would in effect ensure that State Water’s revenue on average exceeds the prudent and efficient cost of providing the infrastructure services. Therefore, where State Water has prepared its cost forecasts on a P50 basis (in the environmental planning and protection program), the ACCC does not consider that State Water’s 10 per cent contingency allowance reflects the prudent and efficient cost of providing the infrastructure services as it overcompensates State Water for the risk of any cost overruns.
State Water has prepared its dam safety and compliance expenditure on a P20 basis. This means that there is an 80 per cent chance the final cost of the projects will be more than the initial forecast and only a 20 per cent chance that the projects will cost less than the cost forecast. Costs would generally overrun the initial forecasts when using a P20 forecast methodology. Therefore, the ACCC accepts that cost forecasts prepared on a P20 basis would on average be less than the prudent and efficient cost of providing the infrastructure services. On this basis the ACCC accepts a 10 per cent contingency on top of the P20 cost forecasts for these projects.
The ACCC considers that the best methodology for forecasting these costs would be to adopt a P50 forecast methodology. However, the ACCC accepts State Water’s approach of using a P20 forecast methodology and applying a 10 per cent contingency allowance.
4.5.3 Dam safety compliance – Pre-1997 construction The ACCC’s draft decision is to not accept State Water’s proposed $100.1 million (real $2013–14) in dam safety compliance expenditure. The ACCC, having regard to the evidence presented and accepting the opinion of its consultant Deloitte, considers that $83.9 million reflects the prudent and efficient costs of providing infrastructure services in the 2014–17 regulatory period. The ACCC accepts that all but one of the proposed dam safety upgrade programs is prudent and efficient.
The ACCC does not consider that it is prudent and efficient for State Water to undertake Dam Safety Compliance works at the Oberon Dam in the 2014–17 regulatory period. The ACCC understands that
ACCC Draft decision on State Water Pricing Application: 2014-15 – 2016-17 | Attachments 106

the NSW Dam Safety Committee’s date for compliance at Oberon Dam is as soon as practicable but no later than 2034.235 State Water proposed to bring forward the safety works for the Oberon Dam to the current period on the basis that it is efficient to undertake these works concurrently with the Rydal Dam safety works.236 The ACCC does not consider State Water’s efficiency gains outweigh the costs of bringing compliance forward 18 years. The ACCC notes that State Water has confirmed that the upgrade can be delayed beyond the next regulatory period.237
Further, as discussed in Section 4.5.1 above, the ACCC considers that State Water has included an allowance for capitalised internal labour in this program which is higher than the prudent and efficient level. The ACCC has reduced the labour component in each dam safety project to account for this.
The ACCC notes that Dam Safety and Compliance activities are generally 100 per cent Government funded under the NSW Government’s cost sharing arrangements. However, Fish River is 100 per cent user funded and therefore the dam safety upgrades on the Rydal and Oberon Dams (located in the Fish River) are 100 per cent user funded.
The ACCC’s decision on Dam Safety capex is set out in Table 4-13.
Table 4-13 Dam safety capital expenditure — State Water’s proposed and ACCC draft decision ($ ‘000, gross, real $2013–14)
ACCC decision -
User share
ACCC decision -
Government share
ACCC decision -
Total
State Water proposal
Difference between
proposal and draft
Percentage difference
Border Rivers - - - - - -
Gwydir - - - - - -
Namoi - 45,327 45,327 51,570 -6,243 -12%
Peel - 17,840 17,840 20,376 -2,535 -12%
Lachlan - 436 436 926 -490 -53%
Macquarie - 11,579 11,579 13,242 -1,663 -13%
Murray - 275 275 835 -559 -67%
Murrumbidgee - - - - - -
Lowbidgee - - - - - -
Fish River 8,488 - 8,488 13,119 -4,631 -35%
Total 8,488 75,458 83,945 100,067 -16,122 -16%
Source: ACCC analysis
State Water proposal
The major projects undertaken under this category of expenditure includes dam safety work on the dams identified in Table 4-14:
235 Deloitte report, p.73.236 Deloitte report, p. 73.237 Deloitte report, p. 74.
107 ACCC Draft decision on State Water Pricing Application: 2014-15 – 2016-17 | Attachments

Table 4-14 Major dam safety projects ($ ‘000, gross, real $2013–14)2014–15 2015–16 2016–17 Total
Oberon Dam – Fish River 145 471 5,388 6,003
Rydal Dam – Fish River 410 681 4,838 5,929
Wyangala Dam – Lachlan Valley 87 355 401 844
Keepit Dam – Namoi Valley 23,500 23,473 - 46,973
Burrendong Dam – Macquarie Valley 12,000 - - 12,000
Chaffey Dam – (including the DSU and augmentation components ) – Peel Valley
19,237 - - 19,237
Menindee Lakes – Murray Valley - 397 365 761
Contingency – Allocated across projects 4,880 2,340 1,100 8,320
Total 60,260 27,716 12,092 100,067
Source: State Water application
State Water submitted that it must ensure that its assets are managed in a manner consistent with its obligations in its licence and all applicable laws, policies and guidelines including the requirements of the NSW Dams Safety Committee (DSC).238
[******
******
* Redacted – Confidential*****
******
238 State Water Corporation, Pricing application to the Australia Competition and Consumer Commission for regulated charges to apply from 1 July 2014 (State Water application), June 2013, p. 78.
ACCC Draft decision on State Water Pricing Application: 2014-15 – 2016-17 | Attachments 108

****** ]
Consultant report
Deloitte and its subcontracted engineering experts performed a detailed examination of State Water’s dam safety expenditure. Deloitte supported State Water’s proposed expenditure on the majority of the Dam Safety projects.239 Deloitte stated that:240
* Redacted – Confidential
Keepit Dam
Deloitte considered this project prudent and efficient and found:241
The costs associated with the proposed works are reasonable as they are commensurate with upgrade projects of a similar type that have been recently completed, although we note the installation of post-tensioned anchors is a specialist area and there are few contractors available to undertake such work.
Burrendong Dam
Deloitte considered this project prudent and efficient and found:242
The proposed expenditure for the Burrendong Dam Phase 1b safety upgrade appears prudent and efficient based upon a comparison with similar upgrade projects on gated spillways. [Redacted – Confidential]
Wyangala Dam
Deloitte considered this project prudent and efficient and found:243
The proposed expenditure for the Wyangala Dam upgrade appears prudent and efficient based upon a comparison with similar upgrade projects on gated spillways.
Chaffey Dam
Deloitte considered this project prudent and efficient and found:244
The proposed expenditure for the Chaffey Dam Augmentation appears prudent and efficient. The availability of funding and commitment of the Federal, State and Local governments provide an opportunity to deliver this proposed augmentation within the next regulatory period.
Rydal Dam239 Deloitte report, p.67-72.240 Deloitte report, p 67.241 Deloitte report, p 69.242 Deloitte report, p 69.243 Deloitte report, p 70.244 Deloitte report, p 72.
109 ACCC Draft decision on State Water Pricing Application: 2014-15 – 2016-17 | Attachments
Deloitte considered this project prudent and efficient and found:245
The proposed expenditure for the Rydal Dam safety upgrade appears prudent and efficient. The estimated fill volumes and materials appear appropriate and the forecast cost is consistent with recent similar works on other dams (notably Kinchant Dam and Hinze Dam in Queensland and the Chaffey Dam augmentation project). These dams have involved retro-fitting better filters and downstream embankment raises amongst other works.
Oberon Dam
Deloitte did not support the Oberon Dam project in the 2014–17 regulatory period. Deloitte stated that:246
Redacted – Confidential
State Water was provided an opportunity to comment on Deloitte’s draft report and its comments were incorporated into Deloitte’s final report. State Water suggested that:247
rather than undertaking the full Oberon project, it will:
Undertake geotechnical work in a single contract for Oberon and Rydal Dam to achieve scale efficiencies
Acquire filter materials for both dams to achieve scale efficiencies and for an emergency stockpile in the event of a pipeline incident developing.
State Water has estimated the costs of these activities at around $560,000 over the regulatory period.
Deloitte did not accept that this proposed option was prudent and efficient on the basis that:248
State Water has not quantified the proposed efficiency savings State Water is not required to complete the project until 2034.
ACCC’s consideration and conclusion
The ACCC considers that $83.9 million reflects the prudent and efficient costs of Dam Safety programs in the 2014–17 regulatory period. In reaching this conclusion the ACCC examined the information provided by State Water to justify its Dam Safety program. Particularly, the ACCC sought to satisfy itself that State Water is required to undertake these works on the basis of an identified safety need. In seeking to determine whether these projects need to be undertaken the ACCC examined the PRAs provided by State Water.249 The ACCC also relied upon the opinion of its expert consultant Deloitte. Having performed its assessment, the ACCC does not consider the Oberon Dam safety upgrade (in Fish River) needs to be undertaken in the 2014–17 regulatory period.
The ACCC considers that the following Dam Safety Projects need to be undertaken by State Water:
Rydal Dam – Fish River
Wyangala Dam – Lachlan Valley
245 Deloitte report, p 73.246 Deloitte report, p.73.247 Deloitte report, p.73.248 Deloitte report, p. 73.249 State Water - Portfolio Risk Analysis Up~2 - ALL DAMS - Draft PRA Site Specific Reports and General Summary -
Rev1- 2013.PDF
ACCC Draft decision on State Water Pricing Application: 2014-15 – 2016-17 | Attachments 110

Keepit Dam – Namoi Valley
Burrendong Dam – Macquarie Valley
Chaffey Dam – (including the DSU and augmentation components ) – Peel Valley
Menindee Lakes – Murray Valley
The ACCC consider that State Water has provided sufficiently detailed safety assessments to demonstrate it is prudent and efficient to proceed with these projects in the 2014–17 regulatory period. The ACCC notes that its expert consultant Deloitte examined the PRAs provided by State Water and considered that there are identified safety needs supporting these projects.
The ACCC also considered whether State Water’s forecasts of the expenditure required for these projects reflect the efficient costs of undertaking the projects. The ACCC’s consultant Deloitte examined these projects and concluded that the forecast costs were prudent and efficient. Deloitte based its assessment of the reasonableness of these costs on the basis that they are commensurate with recent similar projects, which Deloitte examined.250 However, Deloitte noted that it based its assessment on the business case cost estimates of the projects.251 State Water subsequently provided to the ACCC a number of Microsoft Project files, which are the source of the estimates used in forecast expenditure. State Water advised that:252
The estimates represent the current figure allocated to project managers for the completion of the upgrades. The source of the estimate for each project varies depending on the development stage of the project. Sources may be concept or planning estimates produced by Asset Services as project sponsor; project managers forecast for completion where a project is well underway (eg Burrendong); or funding agreement figure based on a concept design for the incorporated dam safety works (Chaffey dam safety component of the larger augmentation project).
As discussed in section 4.5.1, the ACCC considers that the capitalised labour and overhead allowances in the cost estimates are not prudent and efficient, and should be adjusted as outlined in that section.
Oberon Dam
The ACCC does not consider that undertaking the Oberon Dam safety upgrade in the 2014–17 regulatory period is prudent and efficient. The ACCC notes that the risks presented in the PRA do not require immediate rectification and accepts the opinion of its consultant Deloitte that the Oberon Dam Safety upgrade be removed from the program in the 2014–17 regulatory period.253
[****
****** Redacted – Confidential
250 Deloitte report, p.68-72. 251 Deloitte report, p.67.252 State Water, Response 27.1(a) – 21.1 (c) to ACCC information request, received 4 November 2013.253 Deloitte report p. 73.
111 ACCC Draft decision on State Water Pricing Application: 2014-15 – 2016-17 | Attachments

**
********
****
4.5.4 Environmental planning and protectionThe ACCC’s draft decision is not to accept State Water’s proposed $57.3 million (real $2013–14) in Environmental Planning and Protection (EPP) expenditure. The ACCC considers that $45.4 million reflects the prudent and efficient expenditure. The reasons for the reduction are:
Reducing the contingency allowance from 10 per cent to 0 per cent as outlined in section 4.5.2
Reducing the allowance for capitalised internal labour as outlined in section 4.5.1.
Also, the ACCC considers that State Water may not be able to deliver its capex program in the timeframe proposed. Therefore, the ACCC has adjusted the timing of expenditures by moving $20 million from 2014–15 and spreading it equally across 2015–16 and 2016–17.
The ACCC’s draft decision is set out in Table 4-15.
ACCC Draft decision on State Water Pricing Application: 2014-15 – 2016-17 | Attachments 112

Table 4-15 EPP capital expenditure — State Water’s proposed and ACCC draft decision ($ ‘000, gross, real $2013-14)
ACCC decision - User share
ACCC decision - Government share
ACCC decision - Total
State Water proposal
Difference between proposal and draft
Percentage difference
Border Rivers - - - - - -
Gwydir 7,227 7,227 14,454 18,382 -3,928 -21%
Namoi 1,727 1,727 3,455 4,353 -898 -21%
Peel - - - - - -
Lachlan 10,025 10,025 20,051 24,916 -4,865 -20%
Macquarie 3,040 3,040 6,080 7,970 -1,890 -24%
Murray 658 658 1,316 1,632 -317 -19%
Murrumbidgee - - - - - -
Lowbidgee - - - - - -
Fish River - - - - - -
Total 22,677 22,677 45,355 57,254 -11,899 -21%
Source: ACCC analysis
State Water proposal
State Water and the Department of Primary Industries have negotiated a fish passage offset program where the fish passage requirements at large dams during the safety upgrade program were waived in favour of smaller and more cost effective alternatives of constructing fish passages on downstream weirs.254
State Water provided a letter from the Department of Primary Industries which confirms that State Water has an obligation under s.218 of the Fisheries Management Act 1994 to undertake the offset works identified in its proposal.255
The proposed projects under the EPP category of expenditure are shown in the table below:
254 State Water application, p.81.255 Director General of NSW Department of Primary Industries, letter to CEO of State Water Corporation, 9 May 2013.
113 ACCC Draft decision on State Water Pricing Application: 2014-15 – 2016-17 | Attachments

Table 4-16 State Water proposed EPP projects ($ ‘000, gross, real $2013–14)Valley Project 2014–15 2015–16 2016–17 Total
Gwydir Copeton Dam fishway offsets (Tyreel Weir, Boolooroo Weir, Tareelaroi Weir)
12,890 3,960 0 16,850
Lachlan Wyangala Dam fishway offsets (Brewster Diversion Weir, Jemalong Weir)
10,500 9,200 0 19,700
Macquarie Burrendong Dam fishway offsets (Gunningbar, Gin Gin or Bulgeraga)
7,324 0 0 7,324
Namoi Keepit Dam fishway offsets (Gungidera Weir) 4,000 0 0 4,000
Lachlan Lake Brewster Urgent Works 3,000 0 0 3,000
Lachlan Lake Brewster Outlet Regulator 100 0 0 100
Murray Wakool Regulator Fishway 1,500 0 0 1,500
Contingency 3,470 1,310 0
Total 42,784 14,470 0 57,254
Source: State Water application
Fish passages account for 95 per cent of the proposed EPP capex, and the Lake Brewster Urgent Works project, related to erosion control, accounts for most of the rest.
Stakeholder submissions
Lachlan Valley Water (LVW) submitted that the fishway offsets should be considered an integral part of the dam safety activity, with 100 per cent government funding rather than 50 per cent as for EPP, because:256
the fishway offsets are a direct requirement of the Dam Safety Upgrades
customers have had no opportunity for input on the appropriateness of the expenditure
the fishways are not required for the delivery of regulated water.
LVW supported the inclusion of capex for remedial work at Lake Brewster but requested that:257
detailed costing of the project be provided and justified
State Water make every effort to source external funding for this project.
The NSW Irrigators’ Council (NSWIC) submitted that:
those projects within the EPP budget that are as a result of state legislation ought be fully cost-attributed to the State Government. 258
Any EPP capex not based on clear directions from the Minister for Primary Industries should not be accepted.
State Water should source external funding for the Lake Brewster remedial works, as it is an enhancement to a project funded through the Water Smart Australia program with both water quality and water efficiency outcomes. 259
256 Lachlan Valley Water (LVW) submission, p.14.257 LVW submission, p.15.258 NSW Irrigators’ Council submission, p.10.259 NSW Irrigators’ Council submission, p.35.
ACCC Draft decision on State Water Pricing Application: 2014-15 – 2016-17 | Attachments 114

Fisheries NSW requested that funding allocated by the ACCC for the 2014–17 regulatory period be sufficient to complete detailed designs and fishway construction at the remaining 12 fishway sites to meet State Water’s legislative requirement under s.218 of the Fisheries Management Act.
Consultant report
The ACCC’s consultant Deloitte performed a detailed examination of the fish passage projects in State Water’s EPP expenditure forecast.
Deloitte supported the fishway offset program as a more cost-effective way of meeting environmental objectives than fishways at the main dam walls. It assessed the proposed costs by various means including comparisons of unit costs of major materials and components with current market rates, and whole project costs with quotes from recent tenders for similar fishways.
Deloitte accepted that estimated costs of the fish locks at Mollee Weir and Gunidgera in the Namoi valley are prudent and efficient as they are based on detailed design and construction tender prices received in early 2012. It found that the cost estimates for other valleys were generally based on preliminary or concept designs that are yet to be finalised through detailed design. However, it concluded that the estimated costs for the programs in each valley are prudent and efficient, as they are consistent with the tender prices for the Mollee Weir and Gunidgera structures, or similar fishways in Queensland.260
State Water proposed a contingency allowance of 10 per cent for the EPP program. As discussed in section 4.5.2 above, the ACCC considers that no contingency is required for the fish passage projects, because State Water has used a risk based forecasting technique and derived P50 forecasts of the expected costs.
With regards to the timing of the fish passage projects, Deloitte noted that State Water’s governance arrangements with respect to the delivery of capital programs had improved. Nevertheless, Deloitte’s view was that on-schedule delivery of its EP&P program may not occur due to the following reasons:261
Several of the EPP projects are still conceptual at this stage, and Deloitte considered it difficult to see how such a large amount of capital expenditure could occur before the end of 2014–15.
The EPP program in particular has a history of delays and deferrals. the extent to which these programs are ‘frontloaded’, with approximately 65 per cent of capex in the
first year of the regulatory period. the potential risks for wet weather to delay works, which has historically occurred on a number of
occasions. the fact that the EPP program in particular is susceptible to project delays.
State Water’s rationale for the front end loading of the capex program is to ensure that works commence before current Environmental Approvals expire.262 However Deloitte noted that:
DPI Fisheries have the expectation that the fishway design and construction of the 12 remaining high priority offset sites be completed by the end of the 2014–17 regulatory period.
The existing environmental approvals do not suggest that the program of works needs to be limited to the first two years of the regulatory period.
260 Deloitte report, p.75-79.261 Deloitte report, p.96.262 Deloitte report p. 96.
115 ACCC Draft decision on State Water Pricing Application: 2014-15 – 2016-17 | Attachments

Therefore, Deloitte proposed timing adjustments to account for what may be a more realistic capital program. Deloitte suggested the following adjustments:
Allocating the $20m reduction in the first year to each project based on its proportion of EPP capex in that year.
Distributing each project’s reduction in capex in the first year evenly across the second two years as an increase in capex.
Allocation of 50 per cent user share for fish passage projects
Several submissions have noted that the fish passages are required as a direct result of the dam safety upgrades (which are 100 per cent government-funded) and recommended that the fish passages should be treated in the same way.263 The ACCC notes that the WCIR does not provide the ACCC with the power to determine any cost sharing arrangement between the NSW Government and users. The NSW Government’s policy is to pay contributions towards State Water costs using the cost sharing ratios determined by IPART in its 2010 determination.264 The ACCC notes that IPART considered the categorisation of fish passage projects in its 2010 determination and determined that they should be categorised as an EPP project with 50 per cent user funding.265 The ACCC will maintain the categorisation of fish passages as an EPP activity with 50 per cent user funding.266
ACCC’s consideration and conclusion
The ACCC accepts that there is a regulatory obligation on State Water to provide fish passages, under direction of the NSW Minister for Primary Industries.267 Section 218 of the Fisheries Management Act 1994 (NSW) provides that, when anyone alters a dam or weir, the Minister for Primary Industries may require them to carry out works to allow fish to pass over or through the obstruction. The dam safety upgrades at Keepit, Split Rock, Burrendong, Wyangala and Copeton triggered the provisions of s.218. As provision of fish passage at the dam walls was not considered cost effective, DPI (Fisheries) and State Water negotiated an offset program whereby fishway requirements at the large dams were waived in favour of smaller and more cost-effective alternatives on downstream weirs.268 The Department of Primary Industries has confirmed that State Water is obligated to undertake the works at these 13 offset sites.269 The ACCC has examined the costings provided by State Water and considered the advice provided by its consultant Deloitte. The ACCC considers there are three areas where State Water’s costings do not reflect the prudent and efficient cost of providing infrastructure services.
Deliverability of projects
State Water’s proposed EPP capex involves a sharp increase on past actual levels in 2014–15. Further, some costings are still at conceptual stages. This indicates that State Water’s proposed timeline may be ambitious. The ACCC accepts Deloitte’s recommendation to redistribute $20m of the first year’s EPP capex to the second and third years as outlined above.
263 Lachlan Valley Water submission, submission, p.14; Macquarie River Food & Fibre, submission, p.13; New South Wales Irrigators’ Council (NSWIC), submission, p.10.
264 NSW Govt Response to IPART Review of Rural Water Charging Systems, October 2012. http://www.ipart.nsw.gov.au/Home/Industries/Water/Reviews/Rural_Water/Review_of_Rural_Water_Charging_Systems_2012.
265 The ratios were developed largely on the basis of ‘impactor pays’ rather than ‘beneficiary pays’ - IPART final decision State Water bulk water charges, 2010, p.110-114.
266 The ACCC takes any government contribution or cost share as an independent input into its price approval or determination process. (ACCC, Pricing principles for price approvals and determinations under the Water Charge (Infrastructure) Rules 2010, July 2011, p.65).
267 Director-General of Department of Primary Industries, letter to CEO of State Water of 9 May 2013, confirming determinations under s.218 of FMA.
268 State Water application, p.81; DPI letter to State Water, 9 May 2013.269 Department of Primary Industries (DPI) letter to ACCC, 1 November 2013.
ACCC Draft decision on State Water Pricing Application: 2014-15 – 2016-17 | Attachments 116

Contingencies
As discussed in section 4.5.2, the ACCC does not accept State Water applying a 10 per cent contingency to the EPP program. State Water used a risk based costing method and used P50 cost estimates as the basis of its forecast. The ACCC considers this costing methodology sufficiently allows for the probability of either cost overruns or underruns, and so does not consider an additional contingency allowance prudent and efficient.
Capitalised Labour
As discussed in section 4.5.1, the ACCC considers that the capitalised labour and overhead allowances in the cost estimates are not prudent and efficient, and should be adjusted.
Lake Brewster urgent remedial works
State Water proposes capex of $3 million for Lake Brewster remedial works in the Lachlan Valley in 2014–15, following initial expenditure of $2 million in 2013–14. The aim is to prevent erosion of the embankments constructed in the recently completed Lake Brewster environmental water saving project.270 State Water considers this work is needed urgently to prevent further costly erosion. Benefits of this project also include maintaining the original water savings and environmental improvements, and avoidance of occupational risks to staff. The Commonwealth Government had contributed $7.5m and the Lachlan Catchment Management Authority contributed $2.5 million to the original project.
Lachlan Valley Water supports the inclusion of capex for remedial work at Lake Brewster but requires that detailed costing of the project be provided and justified, and that State Water make every effort to source external funding for this project.271 The NSWIC notes that the Lachlan Valley Customer Service Committee has endorsed the repair work as a high priority but has not been provided with a detailed project outline or costing.
NSWIC submits that, as the Lake Brewster project provides water quality as well as water efficiency outcomes, and therefore a benefit for the whole community, State Water should source external funding for this project. The ACCC accepts that users would prefer that this project is funded by an external source. However, the ACCC has no role in determining what external parties may contribute to a project and therefore has examined this project on the basis that no external funding has been confirmed.
State Water provided a cost break-down and a project charter with an initial financial appraisal. This indicated that the project would have a positive return based on avoiding water losses with a value of $0.7m per annum.272 State Water’s analysis indicates that its expenditure would be justified by water savings to customers alone. The ACCC accepts that the work is required and should proceed on the best estimates available at this stage. Therefore, although the cost estimates are preliminary, the ACCC accepts the capex as prudent and efficient.
270 State Water, Response 25.2 to ACCC information request, received 25 October 2013.271 Lachlan Valley Water submission, p.15.272 State Water, Response 25.2 to ACCC information request, received 25 October 2013, and response to follow-up
question, received 11 November.
117 ACCC Draft decision on State Water Pricing Application: 2014-15 – 2016-17 | Attachments

4.5.5 Renewals & replacement The ACCC does not accept State Water’s proposal for $19.9 million in expenditure on its renewals and replacement program. The ACCC considers that $15.5 million in expenditure reflects the prudent and efficient cost of providing infrastructure services in the 2014–17 regulatory period.
As discussed in Section 4.5.1 above, the ACCC considers that State Water has included an allowance for capitalised internal labour in this program which is higher than justified. The ACCC has reduced the labour component in each project to account for this.
The ACCC considers the outlet works at Rydal Dam are more correctly classified as dam safety expenditure as the main driver for the works is to mitigate an existing safety issue. Therefore, the ACCC has re-allocated this project to the Dam safety category.
Other than the reduction for the internal labour component and the reallocation of one project to the Dam safety category, the ACCC considers that State Water’s renewals and replacement program is prudent and efficient.
The ACCC’s decision on renewals and replacement capex is set out in Table 4-17.
Table 4-17 Renewals and replacement capital expenditure — State Water’s proposed and ACCC draft decision ($ ‘000, gross, real $2013–14)
ACCC decision -
User share
ACCC decision -
Government share
ACCC decision -
Total
State Water proposal
Difference between
proposal and draft
Percentage difference
Border Rivers 34 4 37 43 -6 -14%
Gwydir 1,414 157 1,571 1,791 -220 -12%
Namoi 101 11 112 130 -18 -13%
Peel 264 29 293 335 -42 -12%
Lachlan 2,709 301 3,010 3,434 -424 -12%
Macquarie 4,236 471 4,706 5,367 -660 -12%
Murray 177 20 196 228 -32 -14%
Murrumbidgee 1,657 184 1,842 2,090 -248 -12%
Lowbidgee 1,467 - 1,467 1,670 -203 -12%
Fish River 2,271 - 2,271 4,832 -2,561 -53%
Total 14,330 1,177 15,507 19,921 -4,413 -22%
Source: ACCC analysis
State Water proposal
State Water submitted that it utilises asset data and estimates of remaining life to inform its asset renewals and replacements program. Specifically, State Water undertakes an assessment of Future Asset Service Potential (FASP) which accounts for factors including expected usage (service output), expected wear and tear (physical condition) and technical and commercial obsolescence (including
ACCC Draft decision on State Water Pricing Application: 2014-15 – 2016-17 | Attachments 118

risk). The service potential ratings are then used to inform State Water’s renewals and replacement program so that the program is optimised over the regulatory period.273
The major projects proposed by State Water are set out in Table 4-18.
Table 4-18 State Water proposed Renewals and replacement projects ($ ‘000, gross, real $2013–14)
2014–15 2015–16 2016–17 Total
Duckmaloi pipeline 0 800 1,700 2,500
Rydal Dam - outlet structure 0 800 1,400 2,200
North Macquarie marsh 200 2,900 - 3,100
Small renewals and replacement program 6,647 2,236 3,238 12,121
Total 6,847 6,736 6,338 19,921
Source: State Water application
Consultant’s report
Deloitte concluded that State Water’s forecast expenditure for asset renewals and replacements is prudent and efficient, given the robustness of its asset management approach.274 In reaching this conclusion, Deloitte also examined the level of historical expenditure on renewals and replacement. Deloitte found that State Water’s proposed renewals and replacement expenditure is 14 per cent less than average annual expenditure since 2007–08, and 29 per cent less than recent historical expenditure (2010–11 to 2012–13).275
Deloitte also found that State Water’s approach to asset management is clearly documented, logical and consistent with good practice, with forecast capex outlined in Asset Management Plans, which are prepared for all valleys and major assets.276 Deloitte stated that:277
Asset Management Plans are underpinned by an assessment of each asset’s future service potential, which is a key element in determining whether an asset needs to be better maintained, renewed, replaced or removed. Combining this data with asset failure consequence ratings allows a risk cost to be determined, which is used to inform objective asset renewal decision-making.
Whilst the total forecast expenditure profile over the next period is relatively consistent, the profile for individual valleys is generally not even. The magnitude of expenditure is proportional to the asset being renewed or replaced. The renewal/replacement of large assets can lead to uneven expenditure profiles for individual valleys.
Estimates are based on the knowledge and experience of asset planners and engineers that delivering similar projects over time. Forecast expenditure is based on estimates provided by asset planners, which are reviewed by senior engineers.
Businesses cases are prepared for proposed asset renewal projects that require a capital investment greater than $1.5 million. Deloitte examined the three preliminary business cases that have been prepared for asset renewal projects over the 2014–17 regulatory period. Deloitte considered these projects were prudent and efficient. Key findings from Deloitte’s report are set out below.
273 State Water application, p. 82.274 Deloitte report, p.82.275 Deloitte report, p.80.276 Deloitte report, p.81.277 Deloitte report, p.81.
119 ACCC Draft decision on State Water Pricing Application: 2014-15 – 2016-17 | Attachments

North Macquarie Marsh bypass channel project in the Macquarie valley
Deloitte considered the Macquarie Marsh project is prudent and efficient and found:278
(1) The need for this project is consistent with the Future Asset Service Potential assessment in the Macquarie Valley Asset Management Plan.
(2) Preliminary cost benefit analysis indicates that this option results in a marginally positive benefit due to water savings. The preliminary business case also indicates that local landholders would prefer a flowing stream for extraction than groundwater bores to supply their stock and domestic needs.
(3) Given that the preferred option results in a positive benefit… we believe forecast expenditure is prudent and efficient.279
(4) Fish River water supply pipeline replacement project (Duckmaloi):
Deloitte considered the Fish River water supply project is prudent and efficient and found:280
(5) The purpose of this project is to replace approximately 10 km of the existing pre-stressed concrete pipe to reduce the frequency of pipe failures that is impacting on service delivery.
(6) This will project will also reduce water losses and reduce work health and safety risks, as pipe repairs involve pouring lead and associated exposure.
(7) The need for this project is consistent with the Future Asset Service Potential assessment of the pipeline in the Fish River Water Supply Asset Management Plan.
(8) Preliminary analysis indicates that the project will result in a net benefit, considering the frequency of historical breakages and associated repair costs.
(9) Given our professional experience and the positive benefit we believe forecast expenditure is prudent and efficient.
(10)Rydal Dam inlet and outlet works renewal project in Fish River:
Deloitte considered the Rydal Dam inlet and outlet works is prudent and efficient and found:281
(11)The preliminary business case states that Rydal Dam is one of the highest risk dams within State Water’s dam portfolio, the inability to undertake required maintenance of the penstock and outlet valve in the future represents an unacceptable operational and dam safety risk. This is consistent with our review of State Water’s dam safety portfolio risk assessment.
(12)Whilst the project is intended to deliver asset and service reliability outcomes, we believe that dam safety compliance is the main driver and have transferred expenditure associated with this project ($2.2 million) to the dam safety compliance category.
278 Deloitte report, p.81.279 Deloitte report, p.81.280 Deloitte report, p.81-82.281 Deloitte report, p.82.
ACCC Draft decision on State Water Pricing Application: 2014-15 – 2016-17 | Attachments 120

Stakeholder submissions
Macquarie River Food and Fibre (MRFF) considered that the North Marsh project should be removed on the basis that the project has not been discussed with customers despite reflecting extraordinary expenditure that would result in likely price shocks.282
ACCC’s consideration
The ACCC notes that State Water has proposed numerous smaller projects in the renewals and replacement program. This includes approximately 70 projects which are under $0.5 million. The smallest project included in State Water’s proposal is expected to cost $2,500.
Due to the number of projects proposed, the ACCC has applied several assessment techniques to the proposed expenditure in this category. The ACCC has:
(1) Examined the processes which State Water has utilised to identify the renewals and replacement programs.
(2) Compared the expenditure of the program as a whole to historical expenditure.
(3) Examined larger projects in detail.
(4) Specifically examined all renewals and replacement expenditure in Lowbidgee as this category makes up 90 per cent of Lowbidgee’s capex forecast.
State Water’s Processes
The ACCC considers that State Water has reasonably robust processes for identifying and prioritising its renewals and replacement expenditure. In reaching this conclusion the ACCC has relied upon the opinion of its consultant Deloitte who found that State Water’s approach to asset management is clearly documented, logical and consistent with good practice.283 The ACCC has also examined State Water’s Future Asset Service Potential and State Water’s valley specific asset management plans.
Comparison against historical expenditure
The ACCC compared State Water’s historical expenditure on the renewals and replacement program against its forecast. As noted by Deloitte State Water’s proposed renewals and replacement expenditure is 14 per cent less than average annual expenditure since 2007–08, and 29 per cent less than recent historical expenditure (2010–2011 to 2012–13).284 Figure 4-3 shows that State Water’s proposed renewals and replacement expenditure is less than undertaken in previous periods.
282 Macquarie River Food and Fibre (MRFF) submission, p. 13. 283 Deloitte report, p.81.284 Deloitte report, p.80.
121 ACCC Draft decision on State Water Pricing Application: 2014-15 – 2016-17 | Attachments

Figure 4-3 Renewals and replacement expenditure — State Water’s historical and proposed (gross, $m, real 2013–14)
Source: State Water application
On a valley by valley basis, it can be seen that there is significant volatility in each valley’s renewals and replacement expenditure. However, as noted by Deloitte, the renewals and replacement of large assets can lead to uneven expenditure profiles for individual valleys. These spikes in expenditure in each valley appear to be caused by one-off large projects, they also appear to be transitory in nature and it is unusual for expenditure to remain elevated indefinitely. This appears to be reflected in State Water’s forecast for the 2014–17 regulatory period. The ACCC notes that the expenditure in some valleys is higher in this regulatory period than in previous periods. This generally is influenced by a small number of larger projects and the ACCC has examined these projects separately.
ACCC Draft decision on State Water Pricing Application: 2014-15 – 2016-17 | Attachments 122

Figure 4-4 Renewals and replacement expenditure – State Water’s historical and proposed, by valley ($ ‘000, gross)
Source: State Water application; ACCC analysis
Examination of larger projects
The ACCC examined in detail the larger renewals and replacement projects proposed by State Water.
North Macquarie Marsh bypass channel project in the Macquarie valley
The ACCC considers that this project is justified on the basis that the reduced water losses (from the more efficient transmission of the water down the North Macquarie Bypass Channel (NMBC)) appear to offset the costs of undertaking this project. In reaching this conclusion, the ACCC has considered the preliminary business case put forward by State Water, the opinion of its consultant Deloitte and the concerns of the MRFF.
State Water submitted that it is required to provide replenishment flows downstream of the Macquarie marsh under its water sharing plan for Macquarie and Cudgegong Regulated Rivers.285 State Water stated that under normal conditions, there are adequate outflows from the Macquarie Marshes to meet this requirement. However, during dry seasons, water has to be supplied through the NMBC to reduce losses through the Marshes.286
State Water submitted that the first 8 km of the channel were desilted as phase one of the project.287
Further State Water submitted that the remaining 10.5 km of uncleared channel is clogged with silt and aquatic vegetation. As a result of the asset condition, there is reduced flow conveyance through the channel during releases. Given the current amount of silting within the channel, a release of approximately 167 ML is required to achieve a delivery of 50 ML.
Finally, State Water submitted that the benefits of the project are largely attributable to the reduction in water losses as a result of saturating the sedimented silt. Bypass channel efficiency is improved by 285 State Water, Preliminary business case – North Macquarie Marsh Bypass Channel 2013, p. 3.286 Preliminary business case – North Macquarie Marsh, p. 3.287 Preliminary business case – North Macquarie Marsh, p. 3.
123 ACCC Draft decision on State Water Pricing Application: 2014-15 – 2016-17 | Attachments

reducing water lost resulting from saturation of sedimented silt. Preliminary cost and benefit analysis demonstrate that the desilting and clearing works have a benefit of $55,000 [net present value].288
The ACCC notes that Macquarie River Food and Fibre (MRFF) submitted that this project should not be approved. The MRFF submitted:289
removal of …. North Marsh projects on the basis that they have not been discussed with customers despite reflecting extraordinary expenditure that would result in likely price shocks – if future customer consultation finds the expenditure is warranted, the timeframe for project roll-out should be staged to avoid price shocks.
The ACCC notes the concerns of MRFF but considers that this project is prudent and efficient on the basis that it is expected to deliver benefits that are greater than the cost of undertaking the project.
Fish River water supply pipeline replacement project (Duckmaloi)
The ACCC considers that this project is justified on the basis that the reduced expenditure on repairs is sufficient to offset the costs of undertaking this project. In reaching this conclusion the ACCC has considered the preliminary business case put forward by State Water and the opinion of its consultant Deloitte.
State Water submitted that given the age of the pipelines in the Fish River system, State Water is experiencing frequent pipe failure in the prestressed concrete pipeline sections upstream and downstream of the Duckmaloi treatment plant.290 These pipe failures are impacting on service delivery. In addition to service delivery impacts, pipe failures also increase operational losses. State Water also submitted that frequent pipeline repair represents a significant work health and safety (WHS) risk as the stage 1 and 2 pipelines require the use of lead to undertake repairs.291 State Water submitted that in the last year there have been approximately 10 pipe and valve breakages upstream of the Duckmaloi treatment plant. These have been repaired either by works on the pipe/valve or a complete replacement of the pipe section depending on the severity of the break.292
Given the expenses involved in repairing the pipe and valve breakages, and the WHS risk avoidance benefits, State Water has calculated that replacing the relevant section of the pipeline is NPV positive.293
Rydal Dam inlet and outlet works renewal project in Fish River
The ACCC considers that there is a justified safety need to undertake this project. In reaching this conclusion, the ACCC has considered the preliminary business case put forward by State Water and the opinion of its consultant Deloitte who found that:294
the inability to undertake required maintenance of the penstock and outlet valve in the future represents an unacceptable operational and dam safety risk.
288 Preliminary business case – North Macquarie Marsh, p.8.289 Macquarie River Food and Fibre submission, p.13.290 State Water, Preliminary Business Case – Fish River Water Scheme – Pipeline Replacement 2013 p.2.291 Preliminary Business Case – Fish River Water Scheme – Pipeline Replacement 2013, p.2.292 Preliminary Business Case – Fish River Water Scheme – Pipeline Replacement 2013, p.2.293 Preliminary Business Case – Fish River Water Scheme – Pipeline Replacement 2013, p.4.294 Deloitte report, p.82.
ACCC Draft decision on State Water Pricing Application: 2014-15 – 2016-17 | Attachments 124

State Water submitted that as a result of the current configuration of the penstock295 and the outlet valve, the penstock is continually under hydraulic pressure. The Rydal Dam outlet valve has not been closed in approximately 10 years. Given the duration between the operations of the valve, the operability of this asset is unknown. As there is currently no method of isolating the penstock between the intake tower and the outlet valve, the operational ability of this valve is essential. State Water has stated that if there is a failure of the penstock upstream of the outlet valve there is no redundancy to stop the release from the storage, resulting in an uncontrolled release or potentially undermining the embankment.296
State Water also stated that given the identification of Rydal Dam as one of the highest risk dams within State Water’s dam portfolio, the inability to undertake required maintenance of the penstock and outlet valve in the future represents an unacceptable operational and dam safety risk.297 The ACCC accepts the evidence provided by State Water and the opinion of its consultant Deloitte that there is a need to undertake this project.
Finally, the ACCC accepts the advice of its consultant Deloitte that the dam safety compliance is the main driver of this project accordingly the ACCC has allocated this expenditure to that category.
Lowbidgee
The ACCC considers the expenditure on proposed projects in the Lowbidgee region to be prudent and efficient. The ACCC has reached this conclusion by considering the reported condition of the assets cited for replacement and the advice of its consultant Deloitte. State Water’s asset management plan indicates that the assets identified as needing replacement are in poor condition and some assets have already essentially failed.298
State Water submitted that given historical management and funding arrangements, water infrastructure assets within Lowbidgee have not been maintained to a standard consistent with other State Water assets. On this basis, State Water is proposing a targeted capital works program in the Lowbidgee system over the 2014–17 regulatory period. These works are programmed to address high risk assets including those that require high priority work and to address work health and safety concerns.299 State Water’s Lowbidgee asset management plan states that:300
A separate condition report of the Lowbidgee area assets was completed and since a Future Asset Seviceability Potential report has been completed:
Juanbung 112 has been considered to be failed Juanbung 113 has been considered to be failed Juanbung 114 has been considered to be failed Weir Rd Regulator 108 considered redundant in report a regulator in the Redbank Channel is a better
option Weir Rd Regulator 109 has been considered to be failed Weir Red Regulator 110 has been considered to be failed Wyndburn Middle Regulator B considered to be failed Lake Marimley Syphon considered to be failed Glen Avon Escape Regulator No 133 considered to be failed.
295 A penstock is a sluice or gate or intake structure that controls water flow, or an enclosed pipe that delivers water to hydraulic turbines and sewerage system.
296 State Water, Preliminary Business Case - Rydal Dam Inlet and Outlet Works 2013, p.2.297 Preliminary Business Case - Rydal Dam Inlet and Outlet Works 2013, p.2.298 State Water, Asset Management Plan: Low Bidgee Flood Control & Irrigation District Structures – 2013/14, p.20. 299 State Water application, p.83.300 State Water, Asset Management Plan Low Bidgee Flood Control & Irrigation District Structures – 2013/14, p.20.
125 ACCC Draft decision on State Water Pricing Application: 2014-15 – 2016-17 | Attachments

The ACCC’s consultant Deloitte examined these projects and considered that the cost estimates are commensurate with similar WHS enhancement projects undertaken by other bulk water providers such as SunWater and Goulburn-Murray Water.301 Deloitte found that the cost estimates for these works appear reasonable and considered State Water’s proposed capex to be prudent and efficient.302
ACCC conclusion
On the basis of the ACCC’s analysis, the ACCC considers that $15.5 million of expenditure reflects prudent and efficient expenditure on renewals and replacements in the 2014–17 regulatory period. The ACCC has made two adjustments to State Water’s proposed expenditure:
(1) The ACCC considers that State Water has included an allowance for capitalised internal labour in this program which is higher than justified. The ACCC has reduced the labour component in each project to account for this.
(2) The ACCC considers the outlet works at Rydal Dam are more correctly classified as dam safety expenditure as the main driver for the works is an existing safety issue. Consequently, the ACCC has re-allocated this project to the Dam safety category.
4.5.6 Water delivery and other operations The ACCC does not accept State Water’s proposal for $17.7 million in expenditure on its Water delivery and other operations program. The ACCC considers that $0.4 million in expenditure reflects the prudent and efficient cost of this program in the 2014–17 regulatory period. The ACCC does not consider the proposed expenditure on the Computer Aided River Management System (CARMS) is prudent and efficient. The ACCC notes that State Water has not completed a detailed business plan, obtained external funding or robustly identified the cost and benefits which may result from this project. Therefore, the ACCC does not consider a prudent and efficient service provider would undertake this expenditure in the 2014–17 regulatory period.
The ACCC does not approve the following projects as prudent and efficient for the next period:
CARMS (a State-wide project) ($13.6 million)
CO WMAWAS (water accounting system ($0.2 million)
Crooked Creek water efficiency project, in Macquarie valley ($3.5 million).
The ACCC considers that the discretionary projects agreed by stakeholder groups are prudent and efficient.
Finally, as discussed in section 4.5.1, the ACCC considers that the capitalised labour and overhead allowances in the cost estimates are not prudent and efficient, and should be adjusted as outlined in that section.
The ACCC’s decision on Water delivery and other operations capex is set out in Table 4-19.
301 Deloitte report, p.83. 302 Deloitte report, p.83.
ACCC Draft decision on State Water Pricing Application: 2014-15 – 2016-17 | Attachments 126

Table 4-19 Water delivery and other operations capital expenditure — State Water’s proposed and ACCC draft decision ($ ‘000, gross, $2013–14)
ACCC decision -
User share
ACCC decision -
Government share
ACCC decision -
Total
State Water proposal
Difference between
proposal and draft
Percentage difference
Border Rivers - - - 574 -574 -100%
Gwydir - - - 1,224 -1,224 -100%
Namoi - - - 1,264 -1,264 -100%
Peel - - - 385 -385 -100%
Lachlan 298 - 298 2,097 -1,799 -86%
Macquarie 53 - 53 5,268 -5,216 -99%
Murray - - - 1,935 -1,935 -100%
Murrumbidgee - - - 2,463 -2,463 -100%
Lowbidgee - - - - - -
Fish River - - - 2,510 -2,510 -100%
Total 351 - 351 17,720 -17,369 -98%
Source: ACCC analysis
State Water’s proposal
State Water proposed $17.7 million in expenditure on Water delivery and other operations. The Computer Aided River Management Systems (CARMS) accounts for $13.6 million of this expenditure. The Crooked Creek water efficiency project accounts for $3.5 million. The remaining projects account for a total of $0.6 million in expenditure over the 2014–17 regulatory period.
Although Water delivery and other operations capex accounts for only 9 per cent of total capex for the next period, it accounts for a substantial percentage of the user share of capex for some valleys. The CARMS project covers all of State Water’s regulated valleys and the costs have been allocated to each valley in proportion to its water deliver operational expenditure. Therefore, in valleys which do not have any significant capital projects, the CARMS project can account for a significant percentage of the user share of capex. For example, in State Water’s proposal the CARMS project accounts for 60 per cent of the user share in the Border valley, 50 per cent of the user share in the Murray valley and 37 per cent of the user share in the Peel valley.
State Water submitted that CARMS is a program being developed by State Water to upgrade its river operations monitoring and control technologies. State Water has advised that its objective is to ensure that the most efficient operational settings are achieved and that irrigators, environmental and other customers receive the optimal amount of water at the most effective and efficient time and location.303
State Water submitted that it expects CARMS to produce costs savings through eliminating some manual control operations, and produce water savings by significantly reducing operational surplus. Operational surplus is the water that has been released for river operations that subsequently is in
303 State Water application, p.84.
127 ACCC Draft decision on State Water Pricing Application: 2014-15 – 2016-17 | Attachments

excess of requirements, and for State Water’s system is typically 5-20 per cent of the released volume.304
State Water noted that it is investigating third party funding sources to roll out CARMS across the state. However, these funding sources are not guaranteed. During the process of customer consultation through Customer Service Committees, State Water submitted that it offered CARMS as a potential discretionary project in each valley. State Water stated that whilst generally supportive of the concept, none of the CSCs was prepared to endorse CARMS as a discretionary project in the absence of a more detailed business case. State Water expects to complete a more detailed business case during the current determination.
State Water notes that work has been taking place on this business case and consequently State Water has included some expenditure towards CARMS in its application.
State Water’s proposed capex on Water delivery and other operations comprises the projects listed in Table 4-20 below:305
Table 4-20 State Water’s proposed Water delivery and other operations projects ($ ‘000, gross, $2013–14)
Project 2014–15 2015–16 2016–17 Total
CARMS * 4,543 4,555 4,555 13,653
CO WMAWAS - Separation and Rewrite * 151 30 30 211
Crooked Creek water efficiency project 3,456 - - 3,456
Discretionary projects
Macquarie gauging station 60 - - 60
Lachlan - Wallamundry Creek Private Structures & Lachlan gauging station.
130 110 100 340
Total 8,340 4,695 4,685 17,720
Source: State Water applicationNote * Excluding share of total project allocated to coastal valleys
CARMS and CO WMAWAS together account for 78 per cent of the capex on water delivery. The Macquarie Valley Crooked Creek water efficiency project is the other major water delivery project.
Consultant’s report
Deloitte found that despite the proposed merits of CARMS, which centre on improved operational efficiency, it could not recommend approving expenditure for this project due to the lack of customer endorsement for irrigator funding of the project, and the uncertainty of the benefits until completion of a satisfactory business case.306 Deloitte also noted:
The economics of a decision by State Water to proceed with CARMS will depend on the availability of third-party funding, as well as the extent to which the potential reductions in operational surplus outweigh the required capex. This will require continued monitoring and assessment of the success of the Murrumbidgee pilot study.
304 State Water application, p.84.305 State Water application, s.7.4.4.306 Deloitte report, p.90.
ACCC Draft decision on State Water Pricing Application: 2014-15 – 2016-17 | Attachments 128

Stakeholder submissions
Several stakeholder groups including – NSWIC, Lachlan Valley Water, Peel Valley Water Users Association, Murray Irrigation - opposed the CARMS expenditure. These stakeholders submitted that:
State Water had provided insufficient information on valley-specific benefits
A more detailed business case was needed to substantiate the claimed efficiencies and water savings (Lachlan Valley Water). LVW opposes the State-wide commitment of $5 million per year for CARM until a detailed business case is completed and endorsed by CSCs.
If it does gain customer support the costs should be recovered through additional revenue from the efficiency gains
If State Water obtains the funding it is seeking from the Commonwealth, there must be no double-accounting – that is, recovering those funds again from customers (Murray Irrigation and NSWIC).
ACCC’s consideration and conclusion
Computer Aided River Management Systems (CARMS)
The ACCC notes that at this stage State Water has completed only a preliminary business case for CARMS. This business case sought $3.45 million to prepare a detailed business case for the NSW Government and to seek Commonwealth funding to roll out CARM across NSW rivers. The preliminary business case suggested that the full project would cost $40 million, with benefits of $99 million, based on water savings of 79 GL per annum.307 State Water has not yet prepared the detailed business case or secured funding from the Government. Despite this lack of a detailed business plan or funding agreement, State Water has sought $15 million ($13.6 million in the ACCC regulated valleys) for the CARMS project in the next regulatory period. In its application State Water stated that work has been taking place on the detailed business case.308
The ACCC considers that this project is predicated on the benefits that it will provide to users. However, State Water has not specifically included any forecasts for future savings in its application. State Water indicated that the water savings will be reflected in increased entitlements and deliveries over time as future actual volumes are included in the rolling average of past extractions. 309 The ACCC accepts that a project like CARMS may deliver water savings and may ultimately be in the best interest of State Water’s customers. However, in the absence of a detailed business plan and cost benefit analysis it is not possible to determine whether the benefits of this project will outweigh the costs of implementing it.
The ACCC notes that if it were to approve an allowance for the CARMS project, customers would bear the cost of funding $13.6 million in the 2014–17 regulatory period, regardless of whether the project proceeds or State Water is provided funding from other sources. Although State Water’s customers would be bearing the cost, there is no detailed business case to support the benefits that are expected to arise from this expenditure. As noted above, this proposed $13.6 million expenditure is allocated to all valleys and (particularly in smaller valleys) would have a material impact on some users’ tariffs in the 2014–17 regulatory period. Given the impact that this proposed project would have on tariffs, the ACCC considers that a prudent and efficient business would not undertake this project
307 State Water, Computer Aided River Management for the Northern Murray Darling Basin, 2013.308 State Water application, p.84.309 State Water, Response 17.3 to ACCC information request, received 3 October 2013.
129 ACCC Draft decision on State Water Pricing Application: 2014-15 – 2016-17 | Attachments

until it had robustly identified the benefits it would deliver. The ACCC also notes that the proposed expenditure is only a portion of the expected total cost of the project.
The ACCC also notes that user groups have expressed clear opposition to funding CARMS without further information, for example, a detailed business case to be endorsed by Customer Service Committees. External funding would reduce the cost to users, but is unlikely to be obtained in the absence of a more detailed business case that uses the latest data on benefits from the Murrumbidgee pilot project. As noted above, the ACCC understands that there is no commitment to external funding at this stage.
On this basis the ACCC does not consider this $13.6 million of expenditure is prudent and efficient.
Crooked Creek water efficiency project
The proposed scheme involves the provision of either a groundwater supply or surface water supply (or combination of both) in association with a pipeline in order to reduce the transmission loss of releases through the regulated section of Crooked Creek. State Water indicated that savings of between 2.9 and 4.3 GL/year can be made by implementation of this scheme.310
State Water consulted in 2009 with representatives of the local Macquarie Cudgegong Customer Service Committee.311 However, Macquarie River Food and Fibre (MRFF) recommended the Crooked Creek project be removed on the basis that it had not been discussed with customers despite reflecting extraordinary expenditure that would result in likely price shocks.312 MRFF recommended that if future customer consultation finds the expenditure is warranted, the timeframe for project roll-out should be staged to avoid price shocks.
Deloitte examined the Crooked Creek project and concluded that it was not a prudent and efficient project. In particular, Deloitte found that the costs of the project appear to outweigh the benefits of undertaking this project. Deloitte stated that:313
An NPV assessment was conducted for the identified five options as part of the Crooked Creek Water Efficiency Project. The assessment indicates that the scheme, whilst promoting water saving efficiencies, is not viable in the long term. The option with the highest NPV was $-1.8m, based on the assumption that State Water could on-sell the saved water. This assessment was based on a 20 year design life and discount rates of 7 % and an assumed price of the saved water is $7.95/ML (average for General Security Prices during the Regulatory Period) and $14.96/ML (average for High Security Prices during the Regulatory Period).
On this basis, the forecast expenditure is not considered prudent and it is recommended that the expenditure be removed.
The ACCC notes that the purpose of this project is to achieve water efficiency benefits. However, State Water’s NPV analysis indicates that the cost of achieving these benefits is greater than the value of the efficiency benefits that can be expected. On this basis the ACCC does not consider that this project would be undertaken by an efficient service provider and so does not reflect the prudent and efficient costs of providing infrastructure services.
The ACCC notes that State Water indicated to the ACCC’s consultant Deloitte that it agreed that this project could be removed. However, State Water considered an opex allowance of $50,000 was required to allow it to conduct investigative work to inform the development of a business case to
310 NSW Office of Water, Crooked Creek Water Saving Study, September 2009, Version 2.311 Central West Catchment Management Authority, memorandum to Macquarie Cudgegong Customer Service
Committee, ‘Crooked Creek efficiency project’, 28 May 2009, provided by State Water.312 MRFF submission, p.13.313 Deloitte report, p.90.
ACCC Draft decision on State Water Pricing Application: 2014-15 – 2016-17 | Attachments 130

alleviate customer concerns. Deloitte considered that these costs should be absorbed by State Water due to investigative work and business case development being part of the normal ebb and flow of State Water’s work requirements.314 As discussed in Attachment 2, the ACCC agrees that this project does not reflect a step change in State Water’s operating expenditure and so no additional opex allowance is required.
Water accounting system (CO WMAWAS)
State Water’s Water Accounting System (WAS) manages adjustments to customers’ water accounts such as for orders, deliveries and trades. The WAS is based on an earlier legacy system and was implemented in 2004. State Water implemented the WAS to support significant changes to implement the NSW Water Management Act 2000. State Water submitted that WAS needs to be replaced as it is over 20 years old, written in an out-dated programming language and very difficult to support. In its proposal State Water refers to this project as ‘CO WMAWAS – Separation and Rewrite’ but State Water has advised that, rather than rewriting WAS, it involves building a new water accounting system.315 State Water refers to its new water accounting system as OPAL.
State Water spent an estimated $0.7 million on the OPAL project up to 2012–13, and proposed capex of $0.2m in its pricing application. State Water submitted that OPAL was expected to be delivered through the National Water Market System (NWMS). State Water stated:316
The Commonwealth sponsored National Water Marketing System initiative, to which NSW and subsequently SWC have signed up to participate in, has significantly slowed the progression of the OPAL project, as there is significant crossover of scope between the two projects….. A key NWMS funding milestone is scheduled in early 2014, and this will determine which direction SWC proceeds with. A business case update will be undertaken following this determination.
Following the submission of its pricing application, State Water advised that the NWMS-funded part of the project is now at significant risk, and State Water will have a funding shortfall of $2.4 million for OPAL because it needs to revert to a regulatory funded OPAL solution.317
The ACCC understands the proposed $0.2 million of capex is for the integration costs of the NWMS into State Water Corporate Systems. As it appears that the NWMS component will not proceed as anticipated at the time of State Water’s application, the ACCC considers that there is no need for the proposed $0.2 million capex to integrate the NWMS into State Water’s IT system. Therefore, the ACCC does not consider this expenditure is prudent and efficient as it is unlikely that it will be incurred.
It appears that State Water will want to proceed with either the OPAL project or something functionally similar. However, State Water advised that it would not be seeking an additional capital allowance for projects it considers under-funded in the 2014–17 regulatory period.318 State Water advised that it would work within the requested IT budget by adopting a modular approach to the roll-out and prioritising key areas of these projects. Regardless, because State Water’s pricing application did not include funding for rolling out its own OPAL solution and other stakeholders have not had an
314 Deloitte report, p.90.315 State Water, Response 36.1(a) to ACCC information request, received 17 January 2014.316 State Water, response to ACCC request for business case documentation for the iSMART.docx, received 16
September 2013.317 ACCC BTP Auditor Presentation 9 Aug v0.9.PPT, slides 6, 13.318 State Water, personal communication – meeting with ACCC staff on 6 December 2013.
131 ACCC Draft decision on State Water Pricing Application: 2014-15 – 2016-17 | Attachments

opportunity to comment on this expenditure, the ACCC has not considered any additional funding for the OPAL project in this draft decision.
Discretionary projects
Through consultation with CSCs, State Water provided an opportunity for customers to nominate projects that would be directly funded through charges. The ACCC understands that three capital projects were nominated by customers as part of this process:
Macquarie gauging station
Lachlan Wallamundry Creek Private Structures
Lachlan gauging station.
The ACCC notes that during its consultation process no party provided a submission indicating they did not support these discretionary projects proceeding. Additionally, Lachlan Valley Water’s submission supported the discretionary projects endorsed by the Lachlan Customer Service Committee, that is, $310,000 for Wallamundry Creek Structures and $30,000 for a gauging station.
Deloitte noted that these discretionary projects and State Water’s proposed capex to deliver them have been endorsed by the customers requesting the works. Deloitte also considered that, at a high level, the estimates appear reasonable.319
The ACCC considers that these projects are prudent and efficient. In reaching this view the ACCC has considered both the users support for these projects and Deloitte view that the cost forecasts appear reasonable.
4.5.7 Corporate systems The ACCC’s draft decision is not to accept State Water’s proposed capex of $9.2 million (real $2013–14) for Corporate systems. The ACCC considers that expenditure of $6.6 million is prudent and efficient in the 2014–17 regulatory period.
State Water proposed $11.7 million for Corporate systems across its entire business, of which $9.2 million was allocated to ACCC-regulated valleys.320 This activity is funded 100 per cent by users. State Water’s Corporate Systems use Information and Communications Technology (ICT) infrastructure to provide information services, business applications and assistance to stakeholders. State Water’s Corporate Systems capex is part of its Business Transformation Program (BTP) which aims to overcome what it considers to be fundamental problems in its ICT systems.
The ACCC considers that the majority of the expenditure is prudent and efficient, and is justified by the need to replace ageing systems and avoid risk of failure of business and operating systems. Additionally, the ACCC notes that State Water will derive some efficiency benefits from these projects. Therefore, the ACCC has made some allowance for these savings within the general opex efficiency
319 Deloitte report, p.90. 320 The proposed capex averages $3.1m per annum over the 2014–17 regulatory period, compared with an estimated
$1.3m for Corporate Systems over the 2010–14 regulatory period. However, certain projects such as iSMART were categorised in Water delivery capex in 2010–14 but have been reclassified by State Water as Corporate Systems for 2014–17.
ACCC Draft decision on State Water Pricing Application: 2014-15 – 2016-17 | Attachments 132

target, but expects that the bulk of the savings should be reflected in forecasts for the 2017–18 regulatory period onwards.
The ACCC does not approve the hardware component of the Desktop Software Upgrades project, because it would result in State Water recovering these cost as capex and through the opex allowance — due to charges for desktop hardware being included in the base year opex.
The ACCC does not approve capex for the following components of the BTP:
Collaboration
Day planner
Data warehouse and business intelligence.
These components of the BTP appear to be primarily targeted at providing efficiency benefits but the ACCC considers that these benefits have not been adequately justified by State Water nor sufficiently reflected in cost savings for customers.
The ACCC also considers that for the following state-wide projects the share of total capex allocated to regulated valleys should be reduced to better reflect the manner in which this expenditure will be used by State Water:
IT Software refresh, Security, and Desktop software upgrades - reduced from 100 per cent to 75 per cent
Server software and minor solutions - reduced from 100 per cent to 90 per cent.
Finally, as discussed in section 4.5.1, the ACCC considers that the capitalised labour and overhead allowances in the cost estimates are not prudent and efficient, and should be adjusted
The ACCC’s decision on Corporate systems capex is set out in Table 4-21
133 ACCC Draft decision on State Water Pricing Application: 2014-15 – 2016-17 | Attachments

Table 4-21 Corporate systems capital expenditure — State Water’s proposed and ACCC draft decision ($ ‘000, gross, $2013–14 real)
ACCC decision -
User share
ACCC decision -
Government share
ACCC decision -
Total
State Water proposal
Difference between
proposal and draft
Percentage difference
Border Rivers 250 - 250 345 -95 -28%
Gwydir 679 - 679 921 -242 -26%
Namoi 803 - 803 1,056 -253 -24%
Peel 213 - 213 365 -152 -42%
Lachlan 921 - 921 1,275 -354 -28%
Macquarie 930 - 930 1,349 -419 -31%
Murray 611 - 611 915 -304 -33%
Murrumbidgee 1,283 - 1,283 1,795 -511 -28%
Lowbidgee 92 - 92 150 -57 -38%
Fish River 858 - 858 986 -128 -13%
Total 6,639 - 6,639 9,155 -2,516 -27%
Source: ACCC analysis
State Water’s proposal
State Water’s proposed capex comprises projects which are all part of its BTP. State Water has advised that the BTP aims to overcome fundamental problems in State Water’s ICT systems.321 State Water submitted that, since its separation from the NSW Office of Water (NOW) in 2004, its corporate systems have developed in an ad hoc manner, which has resulted in an ageing, fragmented and increasingly inefficient ICT and business solutions environment. State Water advised that this has encumbered the organisation with growing manual overheads, presents a significant risk to the viability of the organisation, and restricts future organisational growth and development.322
The BTP is designed to provide State Water with a planned and robust information technology infrastructure necessary to ensure that critical business applications solutions have maximum reliability and availability. This includes measures to replace unsupported legacy applications, integrate systems, and mitigate risks in the areas of network security, data reliability and compliance reporting.323
The proposed capex for Corporate systems includes the projects listed in Table 4-22 below:
321 State Water application, p.86.322 State Water application, p.62, 86.323 State Water application, p.87-88, 91-92.
ACCC Draft decision on State Water Pricing Application: 2014-15 – 2016-17 | Attachments 134

Table 4-22 State Water’s proposed Corporate systems projects ($’000, gross, $2013–14)
Project 2014–15 2015–16 2016–17 Total Portion allocated to ACCC regulated
valleys
IT Software refresh - 1,000 - 1,000 865
Day planner 10 - - 10 7
Server software & minor solutions 140 140 150 430 374
Data integration and management 30 30 100 160 104
Data warehouse and business Intelligence
105 30 100 235 153
State Water portal 77 - - 77 50
Disaster recovery/ business continuity planning (DR/BCP)
270 520 700 1,490 971
Collaboration 420 150 150 720 469
Security 120 144 172 436 379
Desktop software upgrades 220 240 270 730 634
iSMART 1,485 1,485 1,485 4,455 3,871
MP StateWaterWISEe 1,861 50 50 1,961 1,278
Total 4,738 3,789 3,177 11,704 9,155Note: The amounts for each year and total above are the full expenditures for the projects, for all valleys including MDB
and coastal, before allocation between regulated and unregulated areas.
The above projects are corporation-wide projects for which State Water has allocated a portion of the total costs to water infrastructure services in the ACCC-regulated valleys. The discussion below considers first the overall costs and then the allocation method.
State Water revision to forecast expenditure
Subsequent to providing its pricing application, State Water provided the ACCC with new information, which indicates that State Water considers it has under-estimated its funding needs for the BTP. State Water’s revised estimates were that an additional $10.5 million of capex would be required to efficiently deliver the BTP, of which $6.8 million is attributable to ACCC-regulated valleys. The shortfall comprises $8.2 million for Corporate systems projects and $2.4 million for Water delivery activities.324
State Water advised that it would not be seeking an additional capital allowance for these projects in the 2014–17 regulatory period.325 State Water advised that it would establish ‘a priority path to ensure that project benefits are realised should final project costs be inconsistent with approved project funding.’326
324 StateWater, ‘Deloitte Access Economics Opex Capex report – Corporate Systems/BTP Capital Expenditure’, received 1 November 2013, p.2. The shortfall related to StateWaterWISE $4.9m, Portal $0.2m, Hydstra $0.5m and ICT infrastructure $2.6m in Corporate Systems, and $2.4m for OPAL which is categorised as a Water Delivery activity. These amounts include IPART-regulated valleys and a corporate recovery allocation.
325 State Water, personal communication, meeting with ACCC staff on 6 December 2013.326 StateWater, Response 36.2 to ACCC information request, received 17 January 2014.
135 ACCC Draft decision on State Water Pricing Application: 2014-15 – 2016-17 | Attachments

The ACCC considers that its decision does not preclude State Water from proceeding with an increased level of capex above its approved allowance in the next period if it is confident that the internal benefits justify the expenditure. Given the large role that efficiency plays in State Water’s justifications for the BTP, further works under the BTP may be effectively self-financing.327
Stakeholder submissions
Stakeholder groups were generally opposed to paying additional costs for corporate and IT projects, and were concerned there was insufficient information on the benefits from these projects.
NSWIC recognized the need for corporate systems but would not support additional capex, which it considers must be categorized as standard operating procedures. NSWIC noted that customers have previously funded an upgrade of the ICT system without obtaining any commensurate benefits. NSWIC was concerned that the expenditure forecasts and timing could be affected by an internal review currently being conducted by State Water.328
Gwydir Valley Irrigators’ Association noted that the establishment of iWAS (internet water accounting system) had been supported by the GVIA under the assumption that reform will result in greater efficiency, improved performance and in the long-term stable prices. The GVIA is concerned that nearly 10 years after the establishment of iWAS, State Water continues to justify price and revenue increases on such grounds. GVIA also questioned the share of state-wide corporate costs allocated to Gwydir valley, and was concerned that insufficient information had been presented in business cases to allow a judgement on these issues.329
Peel Valley Water Users' Association considered that irrigators should not have to pay for new systems which are needed because of past mismanagement. LVW also submitted that customers should not bear the cost of upgrading an information, communications and technology system that was not adequately planned and implemented initially.330
Macquarie River Food and Fibre (MRFF) recommended removal of socialised costs for corporate projects that will not result in increased water deliveries or future cost savings for customers in the Macquarie valley.331
Consultant report
The ACCC’s consultant, Deloitte, considered that the upgrades to ICT infrastructure and software and to other systems (water accounting, data management and integration, stakeholder portal and network security systems) are business critical to State Water. Major conclusions drawn by Deloitte were:
Without these upgrades there is a high risk of business continuity issues which may result in the incorrect administration of water to customers and disruption to services.332
327 Additional capex not previously approved by the ACCC would be rolled into the RAB at the next price review, and the further experience on savings could be used to set opex for the following period.
328 NSW Irrigators’ Council, submission, p.36.329 Gwydir Valley Irrigators’ Association, submission, p.11-12.330 Peel Valley Water Users’ Association, section 3.3.5.331 Macquarie River Food and Fibre, submission, p.13.332 Deloitte report, p.85.
ACCC Draft decision on State Water Pricing Application: 2014-15 – 2016-17 | Attachments 136

The cost estimates proposed appear to be logically constructed and within a reasonable order of magnitude based on similar projects elsewhere. 333
State Water’s proposed capex for upgrades to ICT infrastructure and StateWaterWISE is prudent and efficient.
There is some risk that expenditure may exceed that forecast without strong cost control and governance.
ACCC’s consideration and conclusion
In assessing the prudency and efficiency of State Water’s expenditure on Corporate systems, the ACCC has applied its assessment approach to the information provided by State Water, taking account of Deloitte’s advice and stakeholder submissions.
The ACCC’s consideration of the different components of the BTP is set out below.
iSMART
iSMART (Integrated Surveillance Monitoring, Automation and Remote Telemetry) is a centralised Supervisory Control and Data Acquisition (SCADA) system which will enable remote surveillance of dams and automation of storage outlet valves. It is the largest component of Corporate Systems capex.
State Water submitted that the present system has problems with data timeliness, accuracy and historical access. The focus of the iSMART Strategic Plan is the development of a more robust and reliable network security, architecture and communications infrastructure.334 State Water stated that iSMART aims to upgrade legacy systems to reduce operational losses, achieve water savings and improve efficiency of water resource operations.335 In conjunction with CARMS, iSMART would help to reduce operational water losses through delivering the right amount of water at the right time and the right place.336 State Water’s business case for iSMART therefore includes future benefits from risk reduction and improved reliability on meeting regulatory requirements as well as cost savings.337
A revised business case submitted by State Water concluded that the iSMART program would generate operational savings of $0.4 million per annum, and risk avoidance benefits of $3.1m per annum, from a capital investment of $18.2 million.338 Operational savings from upgraded equipment and remote automation would result from reduced staff call-outs, travel and overtime, and reduced communications licensing and break-down replacement costs.339 Risk avoidance benefits include risks associated with asset failures, loss of control (of water releases), workplace health and safety (WHS) in operations and travel, security breaches, and failure to meet regulatory data requirements.340
Deloitte’s recommended accepting the iSMART project, stating:
Accordingly, despite the lack of transparency in the information provided, we accept the proposed iSMART capex on the basis that:
333 Deloitte report, p.86.334 State Water, Strategic Plan (2009–2014) iSMART Integrated Surveillance Monitoring, Automation and Remote
Telemetry, Sept 2009, p.4.335 State Water application, p.86.336 State Water, iSMART Business Case – prepared by ADASA Water and Environment Technology, (revised 2013), 14
November 2013, p.6, 15, 40.337 State Water, iSMART Business Case, 14 November 2013, p.7.338 State Water, iSMART Business Case, 14 November 2013, p.7-8. This updates an earlier plan - State Water,
Strategic Plan (2009–2014) iSMART Integrated Surveillance Monitoring, Automation and Remote Telemetry, Sept 2009, pp. 7, 51.
339 State Water, iSMART Business Case (Revised 2013), 14 November 2013, p.35-38.340 State Water, iSMART Business Case (Revised 2013), 14 November 2013, p.39.
137 ACCC Draft decision on State Water Pricing Application: 2014-15 – 2016-17 | Attachments

iSMART is integral to other aspects of State Water’s business transformation program (e.g. Business Intelligence, Murrumbidgee CARMs) by providing real-time asset operation and data feed into its corporate systems
Installation of modern telemetry equipment is consistent with good industry practice, with other rural water entities making similar upgrades to their water delivery systems in recent years
Implementation of the project is significantly progressed, with State Water already having invested much of the project budget.341
Subsequent to Deloitte finalising its report, State Water provided further details to the ACCC regarding the risk avoidance benefits and provided details of past incidents. This demonstrated the risks arising from the current IT system, which included:
failure to supply required regulatory hydrometric data
failures of gate release mechanisms
delays in notification of unplanned releases.342
The ACCC accepts that there will be important risk avoidance benefits from iSMART through allowing State Water to meet regulatory and security compliance and reduce operating risk. Taking account also of the efficiency benefits and the expenditure and progress on the project to date, the ACCC considers that the proposed capex of $4.5 million on iSMART is prudent and efficient. The efficiency benefits from iSMART and other BTP projects are discussed further below in this section.
StateWaterWISE
StateWaterWISE is an Enterprise Resource Planning (ERP) system which would integrate State Water’s core administrative processes such as finance, billing, personnel, project and asset management. StateWaterWISE (SWW) is the second largest corporate IT project, with proposed capex of $2.0 million over the 2014–17 period.
The ACCC notes that, subsequent to providing its application, State Water advised that the cost of completing the StateWaterWISE has been revised upward, and it will require a further $4.9 million to complete this project.343 As stated above, State Water has advised that it will not be seeking an additional allowance to cover the increased costs in the 2014–17 regulatory period. State Water advised that it would implement modules on a combined high risk / large benefit basis, and that most of the benefits identified in the business case accrue with the introduction of the core modules associated with the general ledger and payroll.344
State Water submitted that SWW is required to replace ageing unsupported systems and achieve efficiency benefits from upgrading and integrating administrative systems.345 State Water submitted that the billing and asset management systems are out-dated and will be unsupported in the future. Other areas to be integrated in SWW (human resources, customer relationship management, workflow, fleet management, project management and contract management) use poor technology or there is no system currently in place.346
341 Deloitte noted that the revised business case was provided immediately prior to them finalising its report and that it had not been able to determine the veracity of the identified benefits - Deloitte report, p.86.
342 State Water, incident reports in response to ACCC information request concerning iSMART, received 9 December 2013.
343 State Water, StateWaterWISE Project, Project Budget Revision Briefing Paper, October 12 2012; Response to Deloitte draft report – Corporate Systems/BTP Capital Expenditure, 1 November 2011, p.2.
344 State Water, Response 5.52 to ACCC information request, received 13 August 2013, p.3.345 StateWater, StateWaterWISE Business case, 19-Aug-11, p.6.346 State Water, application, p. 91.
ACCC Draft decision on State Water Pricing Application: 2014-15 – 2016-17 | Attachments 138

State Water stated that the need for SWW reflected considerable operational and business risks in the current environment due to:
critical unsupported legacy corporate system application environments, and
cumbersome and inefficient manual processes currently in place.347
Deloitte supported the SWW, stating that:348
We consider the implementation of State Water Wise (SWW) which is the enterprise resource planning (ERP) solution as also of critical importance to State Water. The ERP provides economies of scale for State Water systems through being supported by one provider replacing the many different unsupported licence agreements. The ERP enables integration of various systems (removing duplication and improving productivity) and automates many of the manual processes within State Water, which is likely to result in more efficient business practices and increase data reliability and timeliness which is critical for performance monitoring of the business. ……... We consider the move to the integrated ERP system will provide a more efficient and cost-effective solution for State Water and its customers than maintaining the status quo environment.
A report for State Water by an IT security consultant, Stratsec, found that: 349
“…better integration between the business and IT functions is necessary in order to ensure that there are no ‘gaps’ in the security methodology. Without tightly integrated processes, there is a risk of security becoming inconsistently applied throughout the
organisation.” The ACCC accepts that the out-dated and disparate systems used by State Water raise material risks of system and data failure. The integration inherent in SWW, as well as other BTP projects, should help overcome these risks, in particular by reducing the opportunities for security gaps. On the basis of such risk mitigation and the efficiency improvements, the ACCC considers that the proposed capex of $2.0 million for SWW is prudent and efficient. It should provide a reasonable allowance to meet the most urgent replacement needs and avoid critical business risks.
The original business case for SWW forecast gross annual savings of $1.7 million, with new annual recurring costs of $0.7 million, from capex of $5.9 million.350 Revised estimates provided by State Water indicated that the gross benefits are more likely to be between $0.4 million and $0.9 million per annum.351 The ACCC notes that a large part of the benefits of SWW are internal efficiencies for State Water which should be self-financing through the cost savings generated.352 Therefore any further expenditure that is self-financed should be justified by cost savings reflected in opex forecasts. The efficiency benefits from SWW and other BTP projects are discussed further below in this section.
Desktop software upgrades
The ACCC accepts the software component of this project is prudent and efficient. However, the ACCC does not accept the hardware component of this project as it would result in a double recovery of these costs in both the capex and opex allowances.
State Water described the project as ensuring access to current desktop hardware and software tools and versions.353 The software component includes upgrading Microsoft Office and tools such as Acrobat and Explorer to provide an operating environment based on Windows 7 and Microsoft 2010.
347 State Water, audit presentation on BTP, 9 August 2013, slide 9.348 Deloitte report, p. 86.349 Stratsec, Security Review & Remediation Roadmap, SWC Systems Based Audit Compliance, Version 1.0 - 24 June
2010, p. 5.350 StateWater, StateWaterWISE Business case, 19-Aug-11, p.13, 25; 351 StateWater Response 5.52 to ACCC/Deloitte Access Economics information request, received 13 August, p. 4-6.352 StateWaterWISE Business case, 19-Aug-11, p.9 (Project Benefits).353 State Water Response 31.5 to ACCC information request, received 29 November 2013.
139 ACCC Draft decision on State Water Pricing Application: 2014-15 – 2016-17 | Attachments
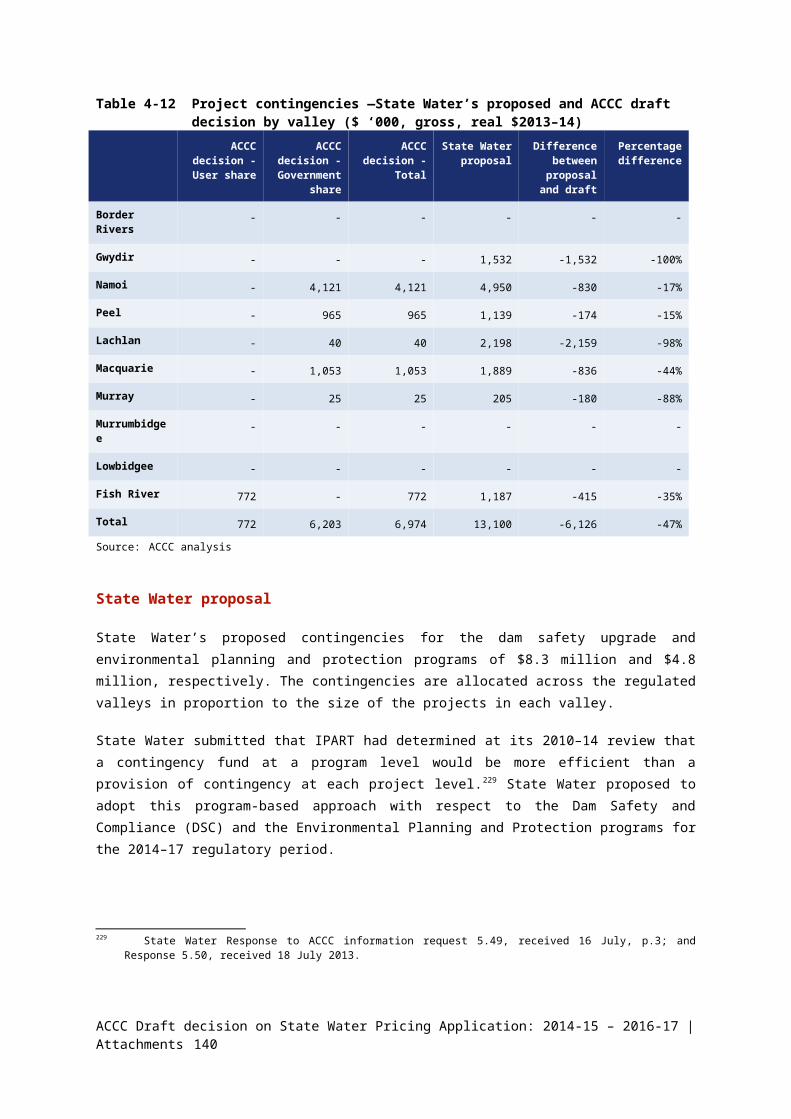
Further information provided by State Water showed that, out of the total project capex of $0.730 million, $0.692 million is actually attributable to replacing end-of-life IT hardware, specifically - computers, mobile devices and printers.354 State Water advised that:
Traditionally State Water has not included such expenditure on our RAB. Instead IT and motor vehicle costs are recouped via recharges through our operating expenses. i.e. depreciation expense for such equipment is a component of the recharge amount.
In the light of the previous practice, the ACCC considers that IT costs would be effectively double-counted if the opex component from earlier years is carried through from the base-year opex to the 2014–17 period, while the capex for replacement hardware is included in capex and the RAB. State Water has not advised any specific (downward) step-change to remove the earlier IT opex from the base-year 2012–13, and has not provided any information on the amount of opex that should be removed if the hardware is to be treated as capex in future. Accordingly, given the ACCC’s base-step-trend approach to estimating forecast opex, the ACCC considers that the opex it has approved includes an on-going component for IT hardware that will be replaced. Therefore, for this draft decision, it considers that the capex for IT hardware is not a prudent and efficient cost, as equivalent costs are already included in opex.355
If State Water prefers to account for such hardware as capex in future, the ACCC would consider accepting that approach and include the capex in the RAB. However, this would require State Water to provide adequate information on the equivalent step-down in opex.
Miscellaneous projects
The ACCC considers that most of the remaining IT projects are reasonable measures to ensure that critical business applications solutions have maximum reliability and availability and to ensure compliance with reporting obligations. This is consistent with Deloitte’s report which stated:
We consider the upgrades to ICT infrastructure and software and to other systems (water accounting, data management and integration, stakeholder portal and network security systems) as business critical to State Water. These are upgrades of old and unsupported systems that are core to undertaking the activities of the business and providing core services. Without these upgrades there is a high risk (in terms of both likelihood and consequence) of business continuity issues which may result in the incorrect administration of water to customers and disruption to services.
Further, the projects would help to overcome major deficiencies in the security of State Water’s systems identified in a report by a security consultant, Stratsec.356 Its report recommended a number of controls and processes to remediate these issues. It also recommended introducing an overall IT strategy to bring about better integration between the business and IT functions, in order to ensure that there are no ‘gaps’ in the security methodology.357
Accordingly, the ACCC considers that the following two projects are prudent measures to remediate the risks to business and operating systems from data failures and malicious intrusion
Disaster recovery and business continuity planning (DR/BCP)
354 State Water Response 36.3 to ACCC information request, received 17 January 2014.355 The ACCC deducted $692,000 from the proposed amount of this project. The ACCC spread this deduction across
each year of the 2014–17 regulatory period. 356 Stratsec, Security Review & Remediation Roadmap, SWC Systems Based Audit Compliance, Version 1.0 - 24 June
2010, p. 19-24.357 Stratsec report, p. 5.
ACCC Draft decision on State Water Pricing Application: 2014-15 – 2016-17 | Attachments 140

Security358
The following projects are justified on the grounds that they are targeted at the replacement of out-dated systems and avoiding the risk of failure to meet data obligations and disruption to business and operating systems:
IT Software refresh
Desktop software upgrades
Server software and minor solutions
Data integration and management
Portal.359
The ACCC does not accept the following three projects on the basis that State Water has not adequately justified the benefits that would arise from these projects:
Collaboration
Data warehouse and business intelligence
Day planner.
State Water’s rationale for undertaking these projects appears to be based on the efficiency benefits that they could deliver. The ACCC considers that State Water has not provided an adequate justification or estimate of the level of benefits expected from these components of the BTP. Therefore, the ACCC does not consider these projects to be prudent and efficient as it does not consider the benefits of these projects outweigh the costs of undertaking them. Further, the ACCC considers that these projects could be deferred without adverse effect on the core BTP projects.
Finally, subsequent to submitting its pricing proposal State Water advised that it now plans to execute the Day planner project after the next [2014–17] determination period.360 As the Day planner is unlikely to proceed in the 2014–17 regulatory period, it does not represent prudent and efficient capex.
Cost allocation of IT projects
The ACCC has examined the manner in which these costs have been allocated to each regulated valley and considers that for several projects, the proportion allocated to the regulated valleys is too high. The Corporate Systems projects are corporation-wide projects and State Water has allocated a share of the costs to both the regulated valleys and unregulated parts of State Water’s business. The portion allocated to the regulated valleys (including coastal valleys) has then been allocated to individual valleys on the basis of each valley’s proportion of total opex.
The ACCC notes that for a number of IT projects which are applicable to all aspects of State Water’s business, State Water allocated 75 per cent of the cost to the regulated valleys and 25 per cent to the 358 Brief descriptions of each project are provided in State Water’s application, p.92.359 Further details on these projects were provided by State Water in Response 31.5 to ACCC information request,
received 29 November 2013.The OPAL / CO WMAWAS project which also falls predominantly in this category was considered as a Water delivery activity.
360 State Water, BTP Projects Current Financial Appraisal - Nov 2013.xls.XLS, received with Response 31, 29 November 2013.
141 ACCC Draft decision on State Water Pricing Application: 2014-15 – 2016-17 | Attachments

unregulated portion of its business.361 These projects include Data integration, Data warehouse, Portal, DR/BCP, Collaboration and SWW. State Water advised that the allocation of 75 per cent is in proportion with the salaries costed to regulated and non-regulated opex projects. The ACCC accepts that this is a reasonable approach to allocating such joint costs.362
For other IT projects, State Water allocated 100 per cent of the cost to the regulated valleys. The ACCC considers this treatment appropriate if the projects are only of benefit to the regulated valleys. After examining these projects, the ACCC accepts that one of the projects – iSMART – is 100 per cent attributable to regulated valleys. However, we consider that three of the projects have broader application across the whole business, and that 75 per cent rather than 100 per cent of the cost should be allocated to regulated valleys. These projects are:
IT Software refresh,
Security
Desktop software upgrades.363
In response to questions from the ACCC, State Water agreed that these projects could possibly be treated the same way as [projects for which 75 per cent was allocated to regulated valleys].364Therefore, the ACCC considers the prudent and efficient amount of capex attributable to State Water’ regulated valleys is 75 per cent of the total for these projects.
The ACCC also considers that the Server software project has broader application across the whole business. This project was also allocated 100 per cent to regulated valleys. State Water subsequently advised that the project is approximately 90+ per cent for regulated operations.365 The ACCC considers that for this project the prudent and efficient amount of capex attributable to State Water’s regulated valleys is 90 per cent of the total for this project.
The ACCC considers that the allocation of these projects in State Water’s application is not prudent and efficient because it does not reflect the manner in which this expenditure will benefit the regulated and unregulated portions of State Water’s business. Therefore the ACCC has changed the allocation of these projects to reflect the prudent and efficient costs incurred by State Water’s regulated valleys. This reallocation reduces State Water’s approved capex over 2014–17 by $0.5 million.
Cost recovery through efficiencies
In determining the prices which would allow State Water’s revenue to meet its efficient costs, the ACCC must take account of the extent to which State Water will recover capital costs through cost reductions or increased water sales.366To the extent that such recovery occurs, the price increase required will be correspondingly lower, so the benefits from the efficiencies flow through to customers.
Although the ACCC considers that most of the BTP projects are justified on risk avoidance grounds, efficiency benefits also play a large role in the justifications given by State Water for its BTP projects.
361 State Water, 110613 Capex projects for reconciliation V4 laset ajds.xls.XLSX (Non valley sheet).362 State Water, Response 22.4 to ACCC information request, received 4 November 2013.363 State Water accepts that these projects could possibly be treated the same way as Corporate Recovery projects –
Response 22.6 to ACCC information request, received 4 November 2013.364 State Water, Response 22.6(b) to ACCC information request, received 4 November 2013.365 State Water, Response 22.6(a) to ACCC information request, received 4 November 2013. 366 Rule 29(2)(b)(i) of the WCIR requires the ACCC to be satisfied that the applicant’s total forecast revenue is
reasonably likely to meet the prudent and efficient costs of providing infrastructure services in that period.
ACCC Draft decision on State Water Pricing Application: 2014-15 – 2016-17 | Attachments 142

These include productivity gains from avoidance of manual work-arounds and the need to access multiple disparate data-bases, and less tangible benefits such as improved analysis and decision-making capability.367 The original business case for the integrated BTP assumed on-going benefits of $6.2 million per annum, including cost savings and additional revenues, based on a capital cost of $35 million.368
The cost savings embedded in State Water’s proposed prices for 2014–17 are much smaller than the above estimates. State Water’s proposed costs reflect an implicit efficiency target of about one per cent per annum of controllable operating expenditure.369 This includes various savings across the business from the implementation of new corporate systems and iSMART.370 State Water submitted that higher savings from the BTP have not been factored in for the following reasons:
A lower and more stable level of opex cannot be achieved until full replacement of all systems is finalised.371
Efficiency gains from the new system have already been factored into State Water’s operational cost base, in particular through staffing cuts resulting from the 2008 restructure in anticipation of new IT systems.372
The ACCC accepts that there could be some time lag before the new systems are established and operating successfully. However, the ACCC considers that State Water should continue to improve productivity in the 2014–17 period through the BTP and other means. Accordingly, in its opex assessment, the ACCC has made a step-change reduction of 1 per cent of opex per annum (accumulating) for efficiencies, based on the historical saving over 2009–13 – see Attachment 2.373
The ACCC considers, however, that the main benefits of the BTP should be reflected in forecasts for the following period from 2017–18. Given the transformational nature of the BTP and the magnitude of the savings forecast by State Water, a step-down in opex additional to regular productivity gain would be expected at the time of the next review.
4.5.8 Allocation of State Water wide costs to each valleyThe ACCC notes that State Water is undertaking several capex projects where the project benefits State Water as a whole and the cost of these projects cannot be explicitly allocated to one of the valleys. Where this is the case, State Water has allocated a portion of the cost to each valley.374 State water has allocated the capex cost to each valley on the basis of the opex expenditure in each valley.
The ACCC has examined the method State Water has used to allocate the capex. The ACCC considers that this method adequately reflects the drivers of the capex and so reflects the prudent and efficient costs incurred in each valley. Therefore, the ACCC accepts the methodology applied by State Water.
367 State Water, BIS Strategy and Associated Business Transformation Program Business Case, 26-Apr-12, p.5-6, 11; State Water, Response 31.1 to ACCC information request, received 29 November 2013, p.3.
368 State Water, BIS Strategy, p.19. State Water has subsequently revised some of these benefits downward - Response to ACCC information request 5.52, received 13 August 2013, pp.4,7; iSMART business case, revised 2013, p.7.
369 State Water application, p.65.370 State Water, Response 20.12 to ACCC information request, received 4 November 2013. Deloitte estimated that the
efficiency target amounted to 1.3 per cent of opex over the 2014–17 period, which State Water planned to achieve through a number of means including business system improvements, occupational health and safety improvements and controlling travel and overtime (Deloitte report, p. 19).
371 Deloitte report, p.57; State Water Response following Deloitte workshop - ‘BTP corporate systems capex’, received 1 November 2013, p.2.
372 State Water, Response 31.3 (c) to ACCC information request, received 29 November 2013.373 Additional opex costs complementary to the new systems are considered separately in attachment 2.374 State Water, 110613 Capex projects for reconciliation V4 laset ajds.xls.XLSX (Non valley sheet).
143 ACCC Draft decision on State Water Pricing Application: 2014-15 – 2016-17 | Attachments

The ACCC notes that it has updated the allocation of these projects in accordance with the ACCC’s decision on the approved opex allowance.
4.5.9 Asset class allocationAs discussed in chapter 6 the ACCC has decided that it will accept the asset class breakdown proposed by State Water, with the inclusion of a pipelines asset class as recommended by Deloitte. The ACCC has considered which capital projects proposed in the 2014–17 regulatory period should be allocated to the pipelines asset class.
The ACCC considers that expenditure on the Duckmoloi pipeline replacement project should be included in the new pipeline asset class. This project involves replacing 10 km of pipeline upstream of the Duckmaloi treatment plant. This capital project is currently included in the storage reservoirs asset category. The ACCC does not consider that any other projects in the 2014–17 regulatory period should be allocated to the new pipeline asset class.
The ACCC’s decision on the expenditure in each asset class for inclusion in the PTRM is set out below.
Table 4-23 ACCC draft decision on capital expenditure by asset class ($’000, gross, $2013–14)
2014–15 2015–16 2016–17 Total
Dams 63,094 39,278 14,737 117,109
Storage reservoirs 9,482 10,830 5,445 25,757
IT systems 2,582 2,223 1,835 6,639
Plant & machinery 33 32 33 99
Pipelines - 702 1,491 2,193
Total 75,191 53,065 23,541 151,798
Source: ACCC analysis
ACCC Draft decision on State Water Pricing Application: 2014-15 – 2016-17 | Attachments 144

5 Rate of returnThe rate of return is an input to the ACCC’s building block approach, which it uses to determine total revenue for each regulatory year of the regulatory period. The rate of return is to be commensurate with the commercial risk associated with State Water's regulated activities such that it recovers its efficient costs.375
The ACCC calculates State Water's cost of capital building block by multiplying the rate of return with the value of State Water's capital base. Consistent with State Water's pricing application, the rate of return we will adopt is the nominal 'vanilla' weighted average cost of capital (WACC) specification.376
This is also consistent with the pricing principles under the Water Charge (Infrastructure) Rules 2010 (the pricing principles).
This attachment provides detailed reasons for the ACCC’s decision on the rate of return, including the reasons for our:
overall framework for determining the rate of return
approach to determining each parameter within our rate of return framework.
5.1 Draft decision The ACCC does not approve State Water's proposed (indicative) rate of return of 8.96 per cent. We propose a rate of return of 7.44 per cent (subject to updating).377 We consider this to be commensurate with the commercial risk associated with State Water's regulated activities such that it recovers its efficient costs.
State Water's proposed rate of 8.96 per cent is based on estimates of the risk free rate and debt risk premium (DRP) averaged over a 10 year historical period.378 Conversely, the ACCC bases its draft decision rate of 7.44 per cent (subject to updating) on prevailing estimates of the risk free rate and debt risk premium observed over a short (indicative) averaging period.379
For the rate of return, the ACCC proposes to apply the pricing principles to State Water in full. We agree, therefore, with the following aspects of State Water's proposed rate of return method:
Adopting the Sharpe–Lintner capital asset pricing model (CAPM) to calculate the return on equity.
Adopting the yield on 10 year Commonwealth Government Securities (CGS) as the proxy for the risk free rate.
Adopting a market risk premium (MRP) of 6.0 per cent.
Specifying the return on debt as the DRP over the risk free rate.
375 ACCC, Pricing principles for price approvals and determinations under the Water Charge (Infrastructure) Rules 2010, July 2011, p. 26. (ACCC, Pricing principles under the WCIR, July 2011).
376 A nominal vanilla WACC is the combination of a nominal post–tax return on equity and a nominal pre–tax return on debt.
377 Our proposed rate of return for this draft decision will be updated using market data (for the risk free rate and debt risk premium) closer to the time of our final decision. Our proposed method involves updating the risk free rate and debt risk premium using an averaging period of 10–40 business days commencing as close a practically possible to the start of the regulatory period.
378 Specifically, the 10 year period ending 22 March 2013.379 Specifically, our indicative averaging period reflects market data from 16 December 2013 to 15 January 2014.
145 ACCC Draft decision on State Water Pricing Application: 2014-15 – 2016-17 | Attachments

Using corporate bonds with a BBB credit rating to estimate the DRP. We define the benchmark bond as a 10 year Australian corporate bond with a BBB+ credit rating. However, due to data inadequacies, the DRP can be calculated using BBB rated bonds in practice.
Adopting a 60 per cent gearing ratio.
In its pricing application, State Water departed from the pricing principles for several parameters. The ACCC does not agree with these proposed departures, which include:
Adopting a long term historical average risk free rate in estimating the return on equity. Rather, we adopt a short term averaging period as close as practicably possible to the start of the regulatory period.
Adopting an equity beta of 0.9, based on a combination of estimates of equity betas from Australian energy networks and water networks in the UK and US. Rather, we adopt an equity beta of 0.7. This is consistent with the pricing principles and is based on evidence from comparative businesses and regulatory decisions for Australian water businesses.380
Using a DRP based on a 10 year historical average. Rather, we estimate a prevailing 10 year forward looking DRP.
Table 5-1 sets out the individual WACC parameters and the indicative rate of return determined by the ACCC. Our proposed rate of return of 7.44 per cent (subject to updating) is lower than State Water's proposed rate of return of 8.96 per cent. This is consistent with stakeholder submissions, which supported applying a lower rate of return to State Water than 8.96 per cent.381
Table 5-1 State Water's rate of return (nominal) — ACCC draft decision382
Parameter State Water’s pricing application ACCC’s draft decision
Nominal risk free rate 5.26% 4.28%a
Equity beta 0.9 0.7
MRP 6.0% 6.0%
DRP 2.55% 2.46%a
Gearing level 60% 60%
Nominal post-tax return on equity 10.66% 8.48%
Nominal pre-tax return on debt 7.82% 6.74%
Nominal vanilla WACC 8.96% 7.44%
Source: State Water, Pricing application to the ACCC, June 2013, p. 99; ACCC analysis.
380 ACCC, Pricing principles under the WCIR, July 2011, pp. 34–38.381 Lachlan Valley Water Inc., Submission to the ACCC on State Water Corporation’s regulated charges 2014–2017,
September 2013, p. 4. (Lachlan Valley Water, Submission to the ACCC on State Water, September 2013); NSW Irrigators' Council, Submission to the ACCC on State Water Corporation’s pricing application, September 2013, p. 25. (NSWIC, Submission to the ACCC on State Water, September 2013); Macquarie River Food and Fibre, Submission on State Water Corporation’s pricing application for regulated charges from 1 July 2014, September 2013, pp. 14, 20. (MRFF, Submission on State Water, September 2013).
382 This draft decision does not address gamma because State Water did not propose a tax building block (see Attachment 1). Typically, we would specify gamma in the WACC decision, even though it is not required to estimate the nominal vanilla WACC. Gamma would be required for calculating regulatory allowances for corporation tax.
ACCC Draft decision on State Water Pricing Application: 2014-15 – 2016-17 | Attachments 146

Note: (a) We have based the nominal risk free rate and DRP on a 20 business day indicative averaging period from 16 December 2013 to 15 January 2014. We will update these estimates for our final decision to reflect an averaging period as close as practically possible to the start of the regulatory period.
5.2 Legislative frameworkThe Water Charge (Infrastructure) Rules 2010 (WCIR) provide for price approvals or determinations for State Water. State Water is a part six operator under the WCIR.383 The WCIR is non-prescriptive on the rate of return for part six operators.
Rule 25 requires part six operators to propose regulated charges for approval or determination by the ACCC (or by an accredited State regulator).384 This application must include information listed in schedule one of the WCIR. Amongst other building block information, this includes:385
Rate of return
Details of the rate of return:
(a) respect of each year of the initial period or the regulatory period that is set to expire; and
(b) proposed by the Part 6 operator for each year of the following regulatory period:
and the basis for that rate, including the methodology used to determine the rate and the values of all inputs used in the calculation of the rate.
The ACCC is to consider the part six operator’s application and other submissions in accordance with the test in rule 29, which specifies the following:386
(1) The Regulator, after considering submissions received before the date specified in the notice published under paragraph 28 (b), must, subject to subrule (2), approve, or determine, the regulated charges set out in the application under this Division.
(2) The Regulator must not approve the regulated charges set out in an application under this Division unless the Regulator is satisfied:
(a) that the determination of the applicant's regulatory asset base used to calculate those charges (where relevant) is in accordance with Schedule 2; and
(b) that:
(i) the applicant's total forecast revenue (from all sources) for the regulatory period is reasonably likely to meet the prudent and efficient costs of providing infrastructure services in that regulatory period; and
(ii) the forecast revenue from regulated charges is reasonably likely to meet that part of the prudent and efficient costs of providing infrastructure services that is not met from other revenue.
(3) If the Regulator is not satisfied as to the matters referred to in subrule (2), the Regulator must determine the regulated charges on the basis of the applicant's regulatory asset base determined in accordance with Schedule 2 (where relevant) and so as to be satisfied as to the matters referred to in paragraph (2)(b).
(4) In approving or determining regulated charges under this rule, the Regulator must have regard to whether the regulated charges would contribute to achieving the Basin water charging objectives and principles set out in Schedule 2 of the Act.
That is, the primary test is that the ACCC must be satisfied the applicant’s total forecast revenue is likely to meet the prudent and efficient costs of providing infrastructure services in that regulatory
383 Part 6 of the WCIR applies to an infrastructure operator that is not a member owned operator if it provides services in relation to at least 250GL of water access entitlements. See WCIR 23(1).
384 The Essential Service Commission of Victoria (ESC) is an accredited State regulator. The ESC regulates Goulburn–Murray Water and Lower Murray Water under the WCIR.
385 WCIR, Schedule 1: Information to be included in an application under Division 2 of Part 6 (r. 25).386 WCIR, r. 29.
147 ACCC Draft decision on State Water Pricing Application: 2014-15 – 2016-17 | Attachments

period. We must also have regard to whether the regulated charges would contribute to achieving the Basin Water Charging Objectives and the Basin Water Charging Principles.387
5.3 Reasons for the draft decisionIn forming its draft decision, the ACCC has considered an extensive range of material on the rate of return. This includes:
State Water's pricing application.
Submissions from stakeholders to State Water's pricing application.
The pricing principles.
The Australian Energy Regulator's (AER's) 2009 WACC guideline and 2013 rate of return guideline.
Recent regulatory decisions on the rate of return, including related expert advice. In particular, decisions and advice under the Victorian gas access arrangement review (VicGAAR).388
Primarily, the ACCC considers there are important benefits in applying the pricing principles to estimate the rate of return for State Water.389 The pricing principles set out an approach to estimating the rate of return, including values or methods for most parameters. We explain our reasons for this approach in the following sections of this attachment.
5.3.1 Pricing principlesIn this draft decision, the ACCC bases its estimate of the rate of return on the framework and parameter estimates set out in the pricing principles. The pricing principles set out our methodology for conducting the price approvals or determinations provided for in the WCIR. In particular, they set out an approach to estimating the rate of return, including values or methods for most parameters. This approach is summarised in Table 5-2.
387 See the Water Act 2007, Schedule 2 Parts 2 and 3 for the Water charging objectives and Water charging principles respectively.
388 The primarily relates to the AER's analysis of the prevailing 10 year forward looking risk free rate and its relationship with the MRP.
389 The pricing principles set out our methodology for conducting the price approvals or determinations provided for in the Water Charge Infrastructure Rules 2010 (WCIR)
ACCC Draft decision on State Water Pricing Application: 2014-15 – 2016-17 | Attachments 148

Table 5-2 The rate of return methodology under the pricing principlesParameter Pricing principles method
Rate of return Post-tax vanilla WACC.
Return on equity Sharpe–Lintner capital asset pricing model (CAPM) based on the Officer model.390
Return on debt Risk free rate plus debt risk premium (DRP).
Risk free rate Risk free rate estimated on the yield on10 year CGS, using an averaging period of 10–40 business days commencing as close as practically possible to the start of the regulatory period.
Equity beta Point estimate of 0.7. This estimate takes into account that energy networks and rural water businesses face comparable systematic risks. This also considers evidence from the AER’s 2009 WACC review and reviewed estimates adopted by other water regulators in Australia.
Market risk premium Market risk premium (MRP) of 6.0 per cent, calculated using long term historical estimates and cross-checked with survey measures commonly adopted by market practitioners.
Debt risk premium The benchmark DRP is to be estimated on the basis of the yields of BBB+ rated corporate bonds with 10 year maturity.
Gearing A benchmark gearing level of 60 per cent. Uses this benchmark as opposed to the actual level of gearing.
Gamma391 The utilisation rate of imputation credits multiplied by the imputation payout ratio. The pricing principles do not specify a value.
Source: ACCC, Pricing principles under the WCIR, June 2011, p. 28.
In July 2011, the ACCC published these pricing principles.392 This followed the inclusion of provisions in the WCIR providing for the accreditation of other State regulators. The rationale for publishing the pricing principles was to achieve consistent implementation of pricing approvals and determinations throughout the Murray Darling Basin (where there are multiple regulators). The accreditation provisions of the WCIR were drafted so that we could require a State regulator to implement the pricing principles as a condition of accreditation.
In February 2012, the ACCC accredited the Essential Services Commission of Victoria (ESC) as a state regulator with authority to make water charge approvals and determinations under the WCIR. The accreditation arrangements were subject to the condition that the ESC must apply the pricing principles for approvals of determinations under the WCIR.393 If the pricing principles are amended in the future, the ESC must apply the pricing principles as amended.
That the pricing principles are legally binding on the ESC is important for promoting consistency in regulatory approaches and outcomes across the Murray Darling Basin. If the ACCC departed from the pricing principles for State Water, this would create an inconsistency between the ESC’s and the ACCC’s regulatory approaches.
The pricing principles are explicit in stating the ACCC’s approach to the rate of return. However, they also state:394
390 The Officer model is an adaptation of the Sharpe–Lintner CAPM that assumes the equity market is entirely segregated and the marginal investor is purely the domestic investor. This version of the Sharpe–Lintner CAPM will account for imputation credits by redefining the return on equity and the MRP to reflect the value of imputation credits. See ACCC, Pricing principles under the WCIR, June 2011, p. 30.
391 Gamma is not a parameter of the vanilla WACC. However, gamma is required for calculating regulatory allowances for corporation tax.
392 ACCC, Pricing principles under the WCIR, June 2011.393 ACCC, Final decision on application by ESC for accreditation, February 2012, p. 8.394 ACCC, Pricing principles under the WCIR, June 2011, p. 6.
149 ACCC Draft decision on State Water Pricing Application: 2014-15 – 2016-17 | Attachments

It is likely that the principles will require revision from time to time to reflect changes in market conditions or new regulatory approaches. For this reason, the ACCC will retain the discretion to amend the pricing principles if necessary. In making any substantive changes to the principles, the ACCC will seek the views of stakeholders, including regulated businesses and relevant state regulators. The ACCC will comprehensively review all pricing principles after 1 July 2014.
This suggests the ACCC has discretion to change the pricing principles and adopt a new rate of return methodology for its regulatory decisions. While these pricing principles are not binding on us, consulting with stakeholders before making any substantive changes represents good regulatory practice. If we were to amend the rate of return section of the pricing principles, the comprehensive review after 1 July 2014 would be an appropriate occasion to do so.395 Moreover, to promote regulatory certainty we consider it appropriate to not change the basis for our price approvals and determinations after already receiving State Water's pricing application.
5.3.2 The AER's rate of return guidelineIn November 2012, the Australian Energy Market Commission (AEMC) made significant changes to the rate of return framework under the National Electricity Rules and National Gas Rules. Following this rule change, the AER developed a new rate of return approach and published an accompanying guideline in December 2013.
The ACCC proposes to consider the merits of applying the AER's new rate of return framework to water infrastructure operators when it reviews the pricing principles after 1 July 2014. We consider this appropriate for the following reasons:
It promotes regulatory consistency between the ACCC and AER.
The AER's guideline considers additional information to what we consider in the pricing principles. It also reviews the most updated research and analysis in proposing an approach for estimating the rate of return.
In this draft decision, however, the ACCC proposes to apply the pricing principles. The reasons for not applying the AER's rate of return guideline are outlined below:
We have previously stated that the pricing principles will form the basis for price approvals and determinations under the WCIR.396 Therefore, applying a rate of return methodology consistent with the pricing principles is appropriate and promotes regulatory certainty. We do not consider it appropriate to change the basis for our price approvals and determinations after already receiving State Water's pricing application.
The timing of State Water's forthcoming regulatory period is not sufficient to undertake an appropriate consultation process. We have previously stated that in making any substantive changes to the principles, we will seek the views of stakeholders, including regulated businesses and relevant state regulators.397 This approach—consulting with stakeholders before making any substantive changes—promotes regulatory certainty.
The AER's rate of return guideline was only finalised in December 2013. The timing of State Water's forthcoming regulatory period is not sufficient to fully consider the methodology set out in the AER's guideline. For example, the AER's proposed approach entails a number of changes to
395 ACCC, Pricing principles under the WCIR, June 2011, p. 11.396 ACCC, Pricing principles under the WCIR, June 2011, p. 10.397 ACCC, Pricing principles under the WCIR, June 2011, p. 6.
ACCC Draft decision on State Water Pricing Application: 2014-15 – 2016-17 | Attachments 150

the current approach which have not yet been implemented.398 Before we could apply the methodology outlined in the AER's new rate of return guideline, these implementation considerations would need to be resolved.
We consider the rate of return methodology in the pricing principles reasonable. It has been widely used by other regulators over the last decade. Further, no material has been provided to show that this methodology has produced estimates that deter investment. While it has recently produced low estimates, there is insufficient evidence to suggest that these estimates have been 'too low' or 'unreasonable'.
5.3.3 Return on equityThe return on equity is a direct input to the WACC formula and needs to be estimated to derive the overall rate of return for the regulated firm. The return on equity should compensate an investor for the opportunity cost of not investing in another investment with equivalent risk. Therefore, investors will be remunerated for bearing the risk associated with investing in the firm’s equity.399
The return on equity can be estimated by using the Sharpe–Lintner capital asset pricing model (CAPM). The ACCC considers the Sharpe–Lintner CAPM to be the most appropriate model for estimating the return on equity due to its wide use in the finance industry, and the volume of theoretical and empirical findings that support its use.
The Sharpe–Lintner CAPM can be estimated as the risk free rate, plus the product of the market risk premium (MRP) above the risk free rate and the equity beta. The equity beta represents the covariance of the business’ or asset’s return with that of the market.
In its pricing application, State Water proposed a nominal post–tax return on equity of 10.66 per cent, calculated using the Sharpe–Lintner CAPM.400 The ACCC agrees with State Water's proposed method of calculating the return on equity. However, we do not agree with its proposed values for the risk free rate and equity beta. The pricing principles state that the equity beta should be 0.7 and the risk free rate should be based on the yield on 10 year CGS, using an averaging period of between 10–40 business days commencing as close as practically possible to the start of the regulatory period.401 When the pricing principles are applied, the return on equity is 8.48 per cent (subject to updating).402
Risk free rate
The risk free rate measures the return an investor would expect from an asset with no default risk. As with other WACC parameters, the risk free rate should reflect prevailing conditions in the market for funds. The ACCC considers that yields on CGS are an appropriate proxy. The risk of the government defaulting on these bonds is low and yields on CGS are readily observable.
398 For example, the AER's rate of return guideline states that in estimating the return on equity , the AER will have regard to an alternative implementation of the Sharpe–Lintner CAPM (called the ‘Wright approach’) and takeover valuation reports. Implementing these additional measures will require making decisions on the appropriate data series, estimation period, method of averaging, method for exclusion of outliers and more.
399 ACCC, Pricing principles under the WCIR, June 2011, p. 30.400 State Water Corporation, Pricing application to the ACCC for regulated charges to apply from 1 July 2014, June
2013, p. 99. (State Water, Pricing application to the ACCC), June 2013).401 ACCC, Pricing principles under the WCIR, June 2011, p. 31.402 This estimate reflects a risk free rate averaging period from 16 December 2013 to 15 January 2014. This is a short
term averaging period of 20 business days, which we will update as close as practically possible to the start of the regulatory period to reflect prevailing market conditions.
151 ACCC Draft decision on State Water Pricing Application: 2014-15 – 2016-17 | Attachments

State Water's proposed method for calculating the risk free rate used an average of yields on CGS over a 10 year historical period. The ACCC does not agree with this proposed averaging period. However, we agree with State Water's proposal to use yields on CGS as a proxy for the risk free rate.
The ACCC estimates the risk free rate using the yields on 10 year CGS, averaged over a period of 10–40 business days commencing as close as practically possible to the start of the regulatory period.403 This methodology is consistent with the pricing principles. For the reasons set out in section 5.3.1, we propose to apply a risk free rate that is consistent with the pricing principles.
In addition to recognising the importance of applying the pricing principles, the ACCC considers the rate of return methodology specified in the pricing principles to be reasonable. We note that gas businesses have previously submitted to depart from using a prevailing risk free rate (or, alternatively, to depart from using historical data to calculate a MRP) under the AER's Victorian Gas Access Arrangement Review (VicGAAR).404 In the VicGAAR, the AER considered these submissions and commissioned expert advice on these issues concerning the risk free rate.405 The AER concluded the most appropriate averaging period for determining the risk free rate is a short period (10–40 business days), as close as practicably possible to the start of the regulatory period. In this draft decision, we have considered the material and decisions under the VicGAAR. We agree with the AER's reasons under this decision which include the following:
At any point in time, the prevailing risk free rate is the benchmark that the expected return on a risky investment must exceed (by a magnitude equal to the risk premium for the risky investment).406
Prevailing yields on 10 year CGS reflect the risk free rate over the appropriate forward looking investment horizon. The appropriate investment horizon is 10 years.407
Yields on CGS are market determined—that is, prevailing yields on CGS reflect the return that investors are willing to receive in current market conditions on an investment that is almost default risk free.
This approach promotes the regulatory objective, consistent with the building block model, that the present value of a service provider's expected revenue should match the present value of a service provider's expected expenditure (plus or minus any efficiency rewards or penalties). Associate Professor Lally advised this to the AER during the VicGAAR.408
403 ACCC, Pricing principles under the WCIR, June 2011, p. 31.404 See AER, Access arrangement final decision, APA GasNet Australia (Operations) Pty Ltd 2013–17, Part 2:
Attachments, March 2013; AER, Access arrangement final decision, Envestra Ltd 2013–17, Part 2: Attachments, March 2013; AER, Access arrangement final decision, Multinet Gas (DB No.1) Pty Ltd Multinet Gas (DB No.2) Pty Ltd 2013–17, Part 2: Attachments, March 2013; AER, Access arrangement final decision, SPI Networks (Gas) Pty Ltd 2013–17, Part 2: Attachments, March 2013.
405 See Lally, M., The present value principle: risk, inflation and interpretation, March 2013; Lally, M., Review of the AER’s methodology for the risk free rate and the market risk premium; McKenzie, M. and Partington, G., Review of the AER’s overall approach to the risk free rate and market risk premium , February 2013 (McKenzie and Partington, Review of the AER’s approach to the risk free rate and MRP, February 2013); McKenzie, M. and Partington, G., Report to the AER: Risk, asset pricing models and WACC, 27 June 2013 (McKenzie and Partington, Risk, asset pricing models and WACC, June 2013); CEPA, Australian energy regulator: Victorian gas networks market evidence paper, February 2013.
406 McKenzie, M. and Partington, G., Supplementary report on the market risk premium, 22 February 2012, p. 11. (McKenzie and Partington, Supplementary report on the MRP, February 2012).
407 ACCC, Pricing principles under the WCIR, June 2011, p. 31; AER, Final decision: Electricity transmission and distribution network service providers: Review of the weighted average cost of capital (WACC) parameters, 1 May 2009, p. xiii. (AER, Final Decision: WACC Review, May 2009).
408 Lally, M., The risk free rate and the present value principle, 22 August 2012, p. 3.
ACCC Draft decision on State Water Pricing Application: 2014-15 – 2016-17 | Attachments 152

The use of prevailing yields on CGS is consistent with the use of the Sharpe–Lintner CAPM. In the ActewAGL matter, both the expert for the AER (Associate Professor Lally) and the expert for the service provider (Greg Houston) agreed on this point.409
This approach provides an unbiased method for determining the risk free rate.410
Advice to the AER from Professor McKenzie and Associate Professor Partington and from Associate Professor Lally supported the use of a prevailing risk free rate.411
The ACCC recognises yields on CGS are lower than what they were during State Water's previous determination, but this does not invalidate any of the above reasons. The current yields on CGS reflect what would be expected of a well-functioning risk free rate proxy in current demand and supply conditions.412 In the Telstra matter, the Tribunal stated:413
...it is not unusual for yields to move from time to time in order to reflect prevailing market conditions and the expectations about the prospect for prices into the future.
Stakeholder submissions generally supported following the pricing principles in using a prevailing risk free rate.414
Market risk premium
The MRP is the expected return over the risk free rate that investors require to invest in a well-diversified portfolio of risky assets. It represents the risk premium that investors can expect to earn for bearing only non-diversifiable (systematic) risk. The MRP is common to all assets in the economy and not specific to an individual asset or business.
State Water proposed to adopt a MRP of 6.0 per cent, consistent with the pricing principles. State Water proposed that the ACCC should not estimate a contemporaneous MRP using a dividend growth model (DGM). We accept State Water's proposed MRP of 6.0 per cent.
While we cannot directly observe the MRP, methods are available to infer investor expectations at a point in time. These methods include examining historical excess returns, conducting surveys of the MRP used by practitioners and academics, assessing DGM estimates and using other financial market indicators such as an implied volatility approach. The WCIR do not specify a particular method for measuring the MRP.
409 Federal Court of Australia, ActewAGL Distribution v The Australian Energy Regulator [2011] FCA 639, 8 June 2011, paragraph 148.
410 Determining an averaging period in advance prevents service providers from deliberately selecting an averaging period with the highest yield available. See Lally, M., Expert Report of Martin Thomas Lally, 13 February 2011, pp. 9–10.
411 McKenzie and Partington, Supplementary report on the MRP, February 2012, pp. 11–12; Lally, M., The risk free rate and the present value principle, 22 August 2012, p. 3.
412 The Treasury and AOFM advice indicates that the movement in the Australian yield curve reflects a range of factors, including the changed stance of monetary policy and global financial market instability. See Australian Treasury and Australian Office of Financial Management, The Commonwealth Government Securities Market, July 2012. (Treasury and AOFM, Letter regarding the CGS Market, July 2012).
413 Australian Competition Tribunal, Telstra Corporation Limited ABN 33 051 775 556 [2010] ACompT 1, 10 May 2010, paragraph 417.
414 Lachlan Valley Water, Submission to the ACCC on State Water, September 2013, p. 17; NSWIC, Submission to the ACCC on State Water, September 2013, p. 41; MRFF, Submission on State Water, September 2013, p. 20.
153 ACCC Draft decision on State Water Pricing Application: 2014-15 – 2016-17 | Attachments

Academic literature and reports by regulated businesses recognise the evidence available for estimating the MRP is imprecise and subject to interpretation.415 That is, experts may employ alternative methods and assumptions for different methods. In addition, each method has strengths and limitations, and may give conflicting outcomes.416 For these reasons, the ACCC must exercise judgment in determining a value for the MRP.
Consistency between the market risk premium and risk free rate
In its pricing application, State Water stated that the ACCC’s approach to estimating the return on equity is internally inconsistent. This was because we adopt a MRP that reflects a long term average but use a risk free rate that reflects current market conditions.417 Consequently, State Water proposed to estimate the rate of return using a historical risk free rate.
In the VicGAAR, gas businesses used similar arguments when proposing to depart from adopting a prevailing risk free rate (or, alternatively, to depart from using historical data to calculate a MRP). 418 In the VicGAAR, the AER considered these submissions and commissioned expert advice concerning the risk free rate.419 The ACCC has reviewed this material.
Similar to the AER, the ACCC considers its methods for calculating the risk free rate and MRP are appropriate and internally consistent. Specifically, our estimation of the risk free rate and MRP are both:
10 year forward looking rates
based on prevailing market conditions at the start of the determination
estimated over the same timeframe.
Moreover, including historical excess returns (in the broad set of evidence the ACCC uses to estimate the MRP) does not constitute estimating the MRP on the basis of a long term average. We use historical excess returns on the basis that they are likely to influence investors’ expectations of the future. We also consider forward looking evidence, like survey evidence.
Further, the ACCC considers State Water mischaracterised its approach for the following reasons:
We calculate the risk free rate as a 10 year forward looking rate based on the market conditions prevailing as close as practically possible to the start of the regulatory period. Just because the yield varies over time, does not mean that the yield constitutes a 'short term' rate. Low yields on CGS, similarly to high yields on CGS, are not necessarily surprising or abnormal, but rather reflect
415 See, for example, Officer B. and Bishop S., Market risk premium, a review paper, August 2008, pp. 3–4.416 See, for example, Mehra R. and Prescott E.C., 'The equity premium, a puzzle' , Journal of Monetary Economics, 15,
1985, pp. 145–61; Damodoran A., Equity risk premiums (ERP), determinants, estimation and implications, September 2008, p. 1; Doran J.S., Ronn E.I. and Goldberg R.S., A simple model for time-varying expected returns on the S&P 500 Index, August 2005, pp. 2–3.
417 State Water, Pricing application to the ACCC, June 2013, pp. 101–102.418 See AER, Access arrangement final decision, APA GasNet Australia (Operations) Pty Ltd 2013–17, Part 2:
Attachments, March 2013; AER, Access arrangement final decision, Envestra Ltd 2013–17, Part 2: Attachments, March 2013; AER, Access arrangement final decision, Multinet Gas (DB No.1) Pty Ltd Multinet Gas (DB No.2) Pty Ltd 2013–17, Part 2: Attachments, March 2013; AER, Access arrangement final decision, SPI Networks (Gas) Pty Ltd 2013–17, Part 2: Attachments, March 2013.
419 See Lally, M., The present value principle: risk, inflation and interpretation, March 2013; Lally, M., Review of the AER’s methodology for the risk free rate and the market risk premium ; McKenzie and Partington, Review of the AER’s approach to the risk free rate and MRP, February 2013; McKenzie and Partington, Risk, asset pricing models and WACC, June 2013; CEPA, Australian energy regulator: Victorian gas networks market evidence paper, February 2013.
ACCC Draft decision on State Water Pricing Application: 2014-15 – 2016-17 | Attachments 154

prevailing demand and supply conditions and expectations about future prices.420 The fact that the market for CGS is liquid and functioning well provides us with confidence that market prices accurately reflect investor expectations and market conditions.421
We calculate the MRP as a 10 year forward looking rate based on prevailing market conditions at the start of the regulatory period. While we base a part of our MRP upon historical excess returns, this does not invalidate that we are estimating the MRP for the next 10 years. Even if the use of historical averaging introduces a downward bias in the present economic climate, the effect of this would be small relative to the standard deviation in the estimate and to the possible upward bias arising from significant unanticipated inflation in the 20th century.
Relationship between the market risk premium and risk free rate
In its pricing application, State Water discussed a potential negative relationship between the MRP and risk free rate.422 From this discussion, State Water proposed adopting a risk free rate based on a relatively long term average of yields on CGS.423 The ACCC does not consider this discussion provided sufficient reason to depart from the pricing principles. In forming this conclusion, we have considered material from the AER's VicGAAR in 2013, including:
A report from the AER's consultants, McKenzie and Partington:
McKenzie and Partington, considered the relationship between the MRP and risk free rate. They found pro and counter–cyclical relations were both possible.424 They also found the negative relationship between the risk free rate and MRP was insufficiently established to form the basis for a regulatory adjustment to the MRP.425 They acknowledged that a theoretical case for a negative relationship between the risk free rate and MRP may exist in certain circumstances. However, they found no sound basis for establishing this relationship over the 10 year forward looking investment horizon.426 This is because empirical evidence supporting this relationship over the relevant period is inconclusive. In fact, the negative correlation becomes weaker over a longer time horizon.
A report from the AER's consultant, Cambridge Economic Policy Associates (CEPA):
CEPA also found there was insufficient evidence to support a negative relationship between the risk free rate and MRP.427 CEPA found the negative relationship argument was theoretical rather than empirical and was primarily based on the implication of a stable return on equity.428 While CEPA claimed there was evidence to suggest the return on equity was stable in the long run, this could only inconclusively imply that a negative relationship exists.429
420 Treasury and AOFM, Letter regarding the CGS Market, July 2012; Australian Competition Tribunal, Telstra Corporation Limited ABN 33 051 775 556 [2010] ACompT 1, 10 May 2010, paragraph 417.
421 The Australian Government has a policy of issuing sufficient CGS to ensure liquidity in the market. This was initially stated in 2002–03 Budget, www.budget.gov.au/2003-04/bp1/html/bst7.htm; and was reaffirmed in 2011–12 Budget, www.budget.gov.au/2011-12/content/bp1/html/bp1_bst7-03.htm.
422 This commentary has predominate regards to Wright, Review of risk free rate and cost of equity estimates: A comparison of UK approaches with the AER, 25 October 2013. See State Water, Pricing application to the ACCC, June 2013, pp. 101–102.
423 State Water, Pricing application to the ACCC, June 2013, pp. 103–105.424 McKenzie and Partington, Review of the AER’s approach to the risk free rate and MRP, February 2013, p. 28.425 McKenzie and Partington, Review of the AER’s approach to the risk free rate and MRP, February 2013, p. 6.426 McKenzie and Partington, Review of the AER’s approach to the risk free rate and MRP, February 2013, p. 26.427 CEPA, Advice on the estimation of the risk free rate and MRP: Report prepared for the AER, March 2013, p. 25.428 CEPA, Advice on the estimation of the risk free rate and MRP: Report prepared for the AER, March 2013, p. 17.429 CEPA, Advice on the estimation of the risk free rate and MRP: Report prepared for the AER, March 2013, p. 26.
155 ACCC Draft decision on State Water Pricing Application: 2014-15 – 2016-17 | Attachments

A report from the gas businesses' consultant, Professor Wright:
Professor Wright's analysis suggested there is a negative relationship between the MRP and risk free rate, and that the return on equity is relatively stable over time. 430 Because of this negative correlation, State Water claimed that under current market conditions, our approach biases the return on equity downwards. When considering this information, however, it is important to note there are several limitations to Wright’s study. These include:
the evidence used in this study did not relate to Australia
the study used bond returns rather than yields
the study did not show a time series of MRP estimates
the study relied on visual rather that statistical evidence.
The ACCC considers that even if there was a negative relationship between the MRP and risk free rate, its approach for calculating these parameters would remain internally consistent. As previously discussed, we adopt 10 year forward looking rates based on prevailing market conditions for both the risk free rate and MRP. Therefore, State Water has mischaracterised our approach. State Water's argument does not warrant changing our approach from using prevailing rates to using historical rates.
Equity beta
The equity beta provides a measure of the riskiness of an asset’s return relative to the entire market. The equity beta reflects the exposure of the asset to systematic or non-diversifiable risk, which is the only form of risk that requires compensation under the Sharpe–Lintner CAPM.431 Systematic risk may include changes or volatility in relation to market variables such as inflation, economic growth, interest rates, exchange rates and taxation. It does not take into account diversifiable risks or business specific risks.432
State Water proposed an equity beta of 0.9. In this draft decision, the ACCC applies an equity beta of 0.7. This estimate is consistent with the pricing principles.433 As stated in section 5.3.1, and for the reasons outlined below, we consider there are important benefits in applying the pricing principles to estimate a rate of return for State Water.
Further, stakeholders generally support applying an equity beta consistent with the pricing principles, as opposed to the equity beta in State Water's pricing application.434
Updating the method used in the pricing principles
430 See State Water, Pricing application to the ACCC, June 2013, p. 102 for references to S. Wright, Review of risk free rate and cost of equity estimates: A comparison of UK approaches with the AER, October 2012.
431 McKenzie and Partington, Risk, asset pricing models and WACC, June 2013, p. 21.432 Frontier Economics, Assessing risk when determining the appropriate rate of return for regulated energy networks in
Australia, July 2013, p. 1. (Frontier, Assessing risk for regulated energy networks, July 2013); McKenzie and Partington, Risk, asset pricing models and WACC, June 2013, pp. 11–12.
433 ACCC, Pricing principles under the WCIR, July 2011, p. 38.434 Lachlan Valley Water, Submission to the ACCC on State Water, September 2013, pp. 4, 17; NSWIC, Submission to
the ACCC on State Water, September 2013, p. 42; MRFF, Submission on State Water, September 2013, p. 20.
ACCC Draft decision on State Water Pricing Application: 2014-15 – 2016-17 | Attachments 156
Regulators typically base their equity beta estimates on the historical equity betas of businesses deemed to be close comparators to the regulated business. This information is available only for businesses listed on the stock exchange. However, no Australian water business is listed on the Australian stock exchange. Therefore, the pricing principles considered other available evidence in proposing an equity beta of 0.7. This included information from the AER's 2009 WACC review (particularly the empirical estimates behind the equity beta), and the regulatory determinations of betas for Australian water networks.435
For example, in the pricing principles, the ACCC concluded the level of systematic risk faced by rural water businesses and energy businesses would be similar.436 We noted the ESC and the Independent Pricing and Regulatory Tribunal (IPART) had reached similar conclusions in determining equity betas for water businesses.437 We also noted that 0.7 was consistent with the upper–range of the empirical equity beta estimate of 0.44–0.68 in the AER's 2009 WACC review. Taking this information into account, we concluded the following in the pricing principles:438
Based on the most recent empirical data collected as part of the AER WACC review, the historical equity betas of energy transmission and distribution businesses were estimated to be between 0.4 and 0.7. Taking a conservative view of the likely equity beta estimate of operators regulated under the WCIR, the ACCC considers it appropriate to choose a value in the higher end of this range. The ACCC considers 0.7 to be an appropriate value.
The ACCC considers that, in current market conditions, the method applied in the pricing principles would still produce an equity beta of 0.7. In producing an estimate of 0.7, the pricing principles considered information from the AER's 2009 WACC review and regulatory decisions for water networks that were recent at the time. Therefore, we now consider information from the AER's 2013 rate of return review, along with recent regulatory decisions for Australian water networks.
In its 2013 rate of return review, the AER considered empirical evidence from Henry, the Economic Regulatory Authority (ERA) and SFG Consulting (SFG). The AER proposed a range of 0.4–0.7 for equity beta, from which it selected a point estimate of 0.7. In proposing this range, the AER had regard to the empirical evidence shown in Table 5-3, along with conceptual analysis that suggested the equity beta for a benchmark efficient entity should be low and less than 1.0. In proposing a point estimate from the top of the range, the AER also had regard to the theory underpinning the Black CAPM and empirical evidence from international comparators.
Table 5-3 Equity beta point estimates for Australian energy networksSource Estimation
periodIndividual firm averages
Fixed portfolios
Varying portfolios
Summary of analysis permutations
Henry 2009
2002–2008 0.45–0.71 0.49–0.66 0.43–0.78
Monthly/weekly intervals
2002/2003 start
Ordinary lead squares (OLS) and least absolute deviations (LAD) regressions
Value/equal weighted fixed portfolios
435 ACCC, Pricing principles under the WCIR, July 2011, pp. 35–38.436 ACCC, Pricing principles under the WCIR, July 2011, p. 38.437 See Essential Services Commission 2008, 2008 Water Price Review, Regional and Rural Businesses Water Plans
2008–2013 — Draft Decision, March, p. 86; Essential Services Commission, Metropolitan and Regional Businesses’ Water Plans 2005–06 to 2007–08, March, pp. 90–91; and IPART, Bulk Water prices for State Water corporation and Water administration Ministerial Corporation, From 1 October 2006 to 30 June 2010, p. 184; IPART, Sydney Water Corporation, 2005, Hunter Water Corporation, Sydney Catchment Authority, Prices of Water Supply, Wastewater and Stormwater Services – Final Determination and Report, June, p. 75.
438 ACCC, Pricing principles under the WCIR, July 2011, p. 38.
157 ACCC Draft decision on State Water Pricing Application: 2014-15 – 2016-17 | Attachments

Average/median varying portfolios
ERA 2011 2002–2011 0.44–0.60 – – Monthly/weekly intervals
OLS/LAD regressions
ERA 2013 2002–2012 0.49–0.52 0.47–0.53 – OLS, LAD, method of moments (MM) and Theil-Sen (TS) regressions
Value/equal weighted portfolios
SFG 2013 2002–2012 0.60 – 0.55 Four weekly repeat sampling
Source: AER, Explanatory Statement: Rate of return guideline, December 2013, p.87; Henry, Estimating β, 23 April 2009; ERA, Explanatory statement for the draft rate of return guidelines, 6 August 2013, pp. 168–181; SFG, Regression-based estimates of risk parameters for the benchmark firm, 24 June 2013, pp. 12–15; AER, Better Regulation: Rate of return final decision, December 2013. Note some averages are calculated by the AER.
An equity beta of 0.7 is also consistent with equity beta estimates from recent water determinations, which have ranged between 0.55–0.8. Water regulators have derived these equity betas from a combination of empirical estimates and other factors. For example, when ESCOSA applied an equity beta of 0.8 to SA Water, it stated that it was placing more weight on regulatory stability than on empirical evidence.439 It noted that regulatory decisions heavily weighted towards empirical evidence and firm specific characteristics produce estimates of around 0.6–0.7.440
Similarly, IPART has consistently applied equity betas of 0.6–0.8 to water utilities. This approach is distinct to the equity beta it previously applied to State Water, which was a range of 0.8–0.9.441
Critically, this reflects a shift in IPART's approach, rather than reflecting that State Water is a relatively risky water utility. IPART has concluded that evidence from its consultants, SFG and Professor Kevin Davis, strongly supported applying an equity beta of 0.6–0.8 to Australian water utilities.442
Consequently, IPART adopted an equity beta of 0.6–0.8 in its December 2011 Sydney Desalination Plant determination.443 Valuing a consistent approach to the rate of return over time, and having made changes to its equity beta after assessing the available evidence, IPART has since applied equity betas of 0.6–0.8 to water utilities.444
Table 5-4 shows equity beta estimates from other Australian regulators.
439 ESCOSA, Advice on a regulatory rate of return for SA Water: Final Advice, February 2012, p. 33.440 ESCOSA, Advice on a regulatory rate of return for SA Water: Final Advice, February 2012, p. 29.441 IPART, Review of bulk water charges for State Water Corporation from 1 July 2010 to 30 June 2014, June 2010. 442 SFG Consulting, Report to IPART: Cost of capital parameters for Sydney Desalination Plant, 10 August 2011. (SFG,
Cost of capital parameters for SDP, August 2011; Davis, K., Cost of capital parameters for Sydney Desalination Plant: By SFG Consulting — An initial review for IPART, August 2011.
443 IPART, Review of water prices for Sydney Desalination Plant Pty. Ltd.: Water—Final report, December 2011 (IPART, Review of water prices for SDP, December 2011).
444 IPART, Review of prices for Sydney Water Corporation's water, sewerage, stormwater drainage and other services: Water —Final report, June 2012, pp. 200, 208. (IPART, Review of prices for Sydney Water - Final report, June 2012)
ACCC Draft decision on State Water Pricing Application: 2014-15 – 2016-17 | Attachments 158

Table 5-4 Recent regulatory determinations of equity betas for Australian water networks
Regulator Decision Date Equity beta
ESC Greater metropolitan water businesses, regional urban water businesses
Jun 2013 0.65
ESC Rural water businesses Jun 2013 0.65 or 0.7a
IPART Hunter Water Corporation Jun 2013 0.6–0.8 (20 basis points above WACC range under current market conditions)
ESCOSA SA Water May 2013 0.8
IPART Gosford City Council, Wyong Shire Council May 2013 0.6–0.8 (20 basis points above WACC range under current market conditions)
QCA Seqwater's water supply schemes Apr 2013 0.65
ERA Water Corporation, Aqest, Busselton Water Mar 2013 0.65
IPART Sydney Catchment Authority Jun 2012 0.6–0.8 (midpoint WACC)
IPART Sydney Water Corporation Jun 2012 0.6–0.8 (midpoint WACC)
QCA SunWater's water supply schemes May 2012 0.55
IPART Sydney Desalination Plant Dec 2011 0.6–0.8 (midpoint WACC)
QCA Gladstone Area Water Board Jun 2010 0.65
Source: ESC, Price review 2013 — Final decision, June 2013; IPART, Hunter Water Corporation: Final report, June 2013; ESCOSA, SA Water's water and sewerage revenues: Final determination — Statement of reasons, May 2013; IPART, Gosford City Council and Wyong Shire Council, Water —Final Report, June 2013; QCA, Final report: Seqwater irrigation price review, vol. 1, April 2013; ERA, Inquiry into the efficient costs and tariffs of the Water Corporation, Aqwest and the Busselton Water Board: Revised final report, March 2013; IPART, Review of prices for the Sydney Catchment Authority, June 2012; IPART, Review of prices for Sydney Water Corporation's water, sewerage, stormwater drainage and other services, June 2012; QCA, Final report: SunWater, Irrigation price review, vol. 1; May 2012; IPART, Review of water prices for Sydney Desalination Plant Pty, December 2011; QCA, Gladstone Area Water Board: Investigation of pricing practices: Final report, June 2010.
Note: (a) ESC is required to adhere to the ACCC pricing principles when regulating water utilities in the Murray Darling Basin. Therefore, it applies an equity beta of 0.7 to Goulburn–Murray Water and Lower Murray Water.
An equity beta of 0.7 is also consistent with the ordinary least square (OLS) regression performed by SFG for State Water. That is, SFG's OLS regression estimated a re-levered equity beta of 0.59 for Australian listed energy networks and 0.64 for a sample of listed water utilities from the US and UK.
Australian energy networks as benchmark for systematic risk
State Water's proposed equity beta is partly based on empirical estimates using Australian energy networks.445 The ACCC considers it appropriate to use Australian energy networks to estimate an equity beta for State Water. This is consistent with the pricing principles, which state, 'rural water businesses are likely to face similar levels of systematic risk to energy distribution and transmission businesses'.
The systematic risk of energy networks is an adequate proxy for the systematic risk of water networks. In 2010, the ACCC commissioned Frontier Economics (Frontier) to advise on whether it could use energy–based equity betas as proxies for the water sector. Frontier also advised on how
445 This information is given 33 per cent weighting. 67 per cent weighting is given to international water businesses.
159 ACCC Draft decision on State Water Pricing Application: 2014-15 – 2016-17 | Attachments
observable differences between these sectors would affect the equity beta.446 Frontier concluded that many of the factors affecting systematic risk were similar between the two sectors.
Frontier found that water and energy networks shared similar systematic risk in their respective regulatory frameworks, ownership, industry structure, diversity of operations and operating leverage. While two factors (the customer base and competition) would affect systematic risk differently between the two sectors, these differences were sufficiently immaterial such that equity betas in water networks would still be appropriate proxies for energy networks. Namely, energy networks may have less systematic risk. This is because they have a greater proportion of residential customers which have lower income elasticity of demand than commercial customers. However, water networks could mitigate this risk through adopting appropriate tariff structures and trading water. Further, energy businesses would have more systematic risk because energy retail and generation is more competitive than rural water. However, the AER aims to exclude energy retailers and generators from their regression, by considering regulated distribution and transmission energy networks operating in Australia as its benchmark entity.447 The Frontier report stated that distribution and transmission networks remain natural monopolies and are an appropriate proxy for water networks. Overall, Frontier concluded the following:448
Given the difficulties in quantifying the differential combined with the offsetting nature of a rural water businesses market power and degree of vertical integration relative to energy and existing risk mitigation strategies, Frontier recommends that energy based equity betas are appropriate to apply to rural water businesses as a default.
A recent report by Frontier for the AER supported this conclusion.449
Regulated water networks in Australia are probably the closest comparators available to regulated Australian energy networks. Given the similarity of their activities and characteristics, water networks and energy networks are, in principle, reasonable comparators to one another.
The recent report for the AER compared risks between water and energy networks. Unlike the previous report, the focus was not specifically on systematic risk. Frontier found the two principal differences between the sectors were supply–driven volume risk and greater political/regulatory risk in the water sector. Regarding supply–driven volume risk, Frontier have previously noted that while rural water utilities have greater exposure to and dependence on weather patterns, this risk is diversifiable and is therefore independent to the equity beta.450 Regarding political/regulatory risk, Frontier attributed this to governments' larger roles in the water sector compared to energy. However, the previous Frontier report concluded that:451
While ownership may affect the actual betas associated with a business it should not have an effect on the estimate of beta for regulatory purposes. This is because regulators seek to estimate an appropriate commercial return as though the business was owned by commercial investors.
The report also noted that while there are some differences in the regulatory frameworks of water and energy, these differences should have an immaterial impact on equity betas. This is because both sectors have a common regulatory approach and instruments to address regulatory risk.
446 Frontier Economics, The cross sectoral application of equity betas: energy to water – A report prepared for the ACCC, April 2010. (Frontier, Energy to water, April 2010).
447 We note that no business used by the AER perfectly represents a benchmark entity. For instance, it uses APA Group as a comparator. APA Group owns some generation assets: see APA Group, Our Business: Energy infrastructure, accessed 27 November 2013, http://www.apa.com.au/our-business/energy-infrastructure.aspx..
448 Frontier, Energy to water, April 2010, p. 31.449 Frontier, Assessing risk for regulated energy networks, July 2013, p. 92.450 Frontier, Energy to water, April 2010, pp. 11–12.451 Frontier, Energy to water, April 2010, p. 19.
ACCC Draft decision on State Water Pricing Application: 2014-15 – 2016-17 | Attachments 160

The ACCC notes that under the AER's rate of return approach, it applies an equity beta point estimate of 0.7 from a range of empirical estimates of 0.4–0.7.452 Further, State Water's consultant, SFG, derived a re-levered equity beta for Australian energy networks of 0.59 using OLS. This estimate was from a 90 per cent confidence interval of 0.39–0.79.453 We consider this information supports applying an equity beta of 0.7 to State Water.
International water networks as benchmark entities
State Water predominately used international water businesses in its regression analysis to estimate its proposed equity beta.454 Alternatively, the ACCC takes information from international water networks into account by considering regulatory decisions that use this information.
The ACCC considers State Water's approach gave too much weight to international data. In particular, international water businesses are likely to have different systematic risks to State Water. Notwithstanding this, estimates of the equity beta derived from US and UK water businesses are broadly consistent with empirical information from Australian energy networks. These broadly support an equity beta of 0.7.
State Water is a provider of bulk water to rural Australia (predominately for irrigation). At a theoretical level, differences associated with international comparators are likely to arise because the geographical market in which a comparator business operates is a determinant of its systematic risk. This is because its geography will influence the conditions under which it operates relating to the regulatory regime, tax laws, industry structure and broader economic environment. As most of these conditions will be different for international comparator entities, the risk profile of overseas entities is likely to differ from those within Australia. NSWIC has also submitted that it is flawed to approximate the equity beta using UK and US water networks, because these businesses face significantly different market conditions and regulatory environments to State Water.455
These theoretical differences between international water networks and State Water are also apparent in practice. We can see this when considering the set of US and UK water utilities used by SFG in its reports to State Water and IPART.456
The average debt to equity ratio for the international comparator set is 0.74, whereas this is 1.55 for Australian energy networks.457 This suggests international comparators have very different gearing strategies—with approximately 43 per cent gearing on average. Whereas, Australian energy networks have approximately 61 gearing on average. This closely reflects the benchmark level of gearing for State Water, which is 60 per cent.
State Water's operations involve rural bulk water delivery. However, the majority of the international comparators are involved in residential water delivery and wastewater services. We expect this would place a downwards bias on State Water's estimated systematic risk since these international comparators would have a larger proportion of residential customers. This is because, 'generally residential or domestic customers exhibit much lower demand elasticity than commercial
452 AER, Better Regulation: Rate of return guidelines – Final decision, December 2013.453 SFG Consulting, Report to State Water: Estimation of beta for Australian water networks, April 2013, p. 3. (SFG,
Report to State Water, April 2013).454 This information is given 67 per cent weighting. 33 per cent weighting is given to Australian energy networks.455 NSWIC, Submission to the ACCC on State Water, September 2013, p. 42.456 SFG, Report to State Water, April 2013; SFG, Cost of capital parameters for SDP, August 2011.457 SFG, Report to State Water, April 2013, pp. 16, 19.
161 ACCC Draft decision on State Water Pricing Application: 2014-15 – 2016-17 | Attachments

customers'.458 For instance, when we exclude businesses with diversified operations from the comparator set, the range of re-levered OLS betas drops to 0.21–0.58, which is below our proposed equity beta of 0.7.459
State Water's operations are undiversified, whereas many of the international comparators have quite diversified operations. We expect many of these additional operations would have higher systematic risk than the operations of a monopoly infrastructure business, like State Water. For instance:
Consolidated Water operates desalination plants in the Cayman Islands, the Bahamas, Belize, the British Virgin Islands and the US.460 It also has one of the highest re-levered OLS betas (1.49).
SWJ Corporation invests in undeveloped land and operates commercial buildings.461 It also has one of the higher re-levered OLS betas in the comparator set. We note this is, nevertheless, a low beta (0.67).
Pennon Group provides recycling, renewable energy generation and waste management.462 However, its re-levered OLS beta is around the middle of our comparator set range (0.49).
Cadiz Inc. is predominately a renewable resource company and it is involved with organic agricultural operations.463 It also has the highest re-levered OLS beta in the comparator set (1.78).
Northumbrian Water Group provides plant and vehicle leasing, has a leisure business, a business that undertakes searches for homeowners and provides analytical laboratory and scientific services.464 It also has one of the highest re-levered OLS betas (currently 1.25).
Table 5-5 summarises the US and UK listed utilities that SFG has used in its reports for State Water and IPART. This provides a high level summary of each firm's operations and SFG's calculated re-levered equity betas that it derived using OLS.
458 Frontier, Energy to water, April 2010, 12.459 This range is formed by excluding the equity betas of Consolidated Water, SWJ Corporation, Pennon Group, Cadiz
Inc. and Northumbrian Water Group. We discuss why these firms have diversified operations in the proceeding bullet point.
460 Reuters (US Edition), Profile: Consolidated Water Co Ltd (CWCO.O), accessed 26 November 2013, http://www.reuters.com/finance/stocks/companyProfile?symbol=CWCO.O.
461 NASDAQ, Overview: SWJ Corp (SWJ) SPO, accessed 26 November 2013, http://www.nasdaq.com/markets/spos/company/sjw-corp-8743-71190.
462 Reuters (US Edition), Pennon Group PLC (PNN.L), accessed 26 November 2013, http://www.reuters.com/finance/stocks/companyProfile?symbol=PNN.L.
463 Cadiz, About us, accessed 26 November 2013, http://cadizinc.com/about-us/.464 Northumbrian Water Group, About us, accessed 26 November 2013, http://www.nwg.co.uk/Aboutus.aspx.
ACCC Draft decision on State Water Pricing Application: 2014-15 – 2016-17 | Attachments 162

Table 5-5 International water utilities used by SFGFirm (country) Re-levered
beta (OLS)Description of firm's activities
Consolidated Water Co. Ltd. (UK — Cayman Islands)
1.49 Produces /supplies retail and bulk water. Designs, constructs, and sells desalination plants. Provides desalination plant management/operating services. Operates desalination plants in the Cayman Islands, the Bahamas, Belize, the British Virgin Islands and the US. 465
Pennichuck Corp. (US)
0.21 A utility holding company comprised of three regulated private water utilities and two non-regulated companies. Collects, stores, treats, distributes and sells potable water.466
SJW Corp (US) 0.67 Holds two public utilities providing water services and a company developing a water supply project. Principal business is water production, purchase, storage, purification, distribution, wholesale and retail sale. Holds a company that owns undeveloped land and operates commercial buildings.467
American Water Works Company Inc. (US)
0.42 Water/wastewater utility, servicing 30 US states and two Canadian provinces. It has regulated and market-based operations, accounting for 88.8 per cent and 12.3 per cent of its consolidated operating revenue year ended 2011.468
Artesian Resources Corp. (US)
0.30 The parent holding company of a regulated public water utility.469
Cadiz Inc. (US) 1.78 A renewable resource company that owns over 70 square miles of property with significant water resources and clean energy potential. Its current projects include water conservation/recovery/storage, organic agricultural operations and sustainable land use.470
Northumbrian Water Group 1 (UK)
Northumbrian Water Group 2 (UK)471
0.33
1.25
Provides water/waste water management in Scotland, Ireland, Gibraltar. Holds a company that provides plant /vehicle leasing. Holds Northumbrian Water Ltd. (NWL), which provides water/sewerage services, has a leisure business (holiday accommodation, conferencing, fishing), a business that undertakes searches for homeowners (relating to water connections, contaminated land, planning) and a division that provides lab/scientific services.472 De-listed in 2011, now a subsidiary of UK Water (2011) Ltd (owned by Cheung Kong Infrastructure Holdings).473
United Utilities Group (UK)
0.58 Manages and operates regulated electricity distribution, water and wastewater networks in England. Manages other infrastructure assets in the UK and overseas.474
Severn Trent Water (UK)
0.50 Subsidiary of Severn Trent Plc, which holds companies that provide water, waste water treatment and operating services to utilities, municipalities and commercial customers. 475
Pennon Group Plc.(UK)
0.49 Provides water/sewerage services, recycling, renewable energy generation and waste management. 476
465 Reuters (US Edition), Profile: Consolidated Water Co Ltd (CWCO.O), accessed 26 November 2013, http://www.reuters.com/finance/stocks/companyProfile?symbol=CWCO.O.
466 NASDAQ, Overview: Pennichuck Corp (PNNW) SPO, accessed 26 November 2013, http://www.nasdaq.com/markets/spos/company/pennichuck-corp-1794-61382.
467 NASDAQ, Overview: SWJ Corp (SWJ) SPO, accessed 26 November 2013, http://www.nasdaq.com/markets/spos/company/sjw-corp-8743-71190.
468 Reuters (US Edition), Profile: American Water Works Company Inc (AWK.N), accessed 26 November 2013, http://www.reuters.com/finance/stocks/companyProfile?symbol=AWK.N.
469 Reuters (US Edition), Profile: Artesian Resources Corp (ARTNA.OQ), accessed 26 November 2013, http://www.reuters.com/finance/stocks/companyProfile?symbol=ARTNA.OQ.
470 Cadiz, About us, accessed 26 November 2013, http://cadizinc.com/about-us/.471 Northumbrian Group has two separate returns series spanning different time periods so is included as two individual
observations.472 Northumbrian Water Group, About us, accessed 26 November 2013, http://www.nwg.co.uk/Aboutus.aspx.473 The Wall Street Journal, Cheung Kong completes Northumbrian water deal, accessed 26 November 2013,
http://online.wsj.com/news/articles/SB10001424052970204346104576635793454829466.474 Bloomberg, Company profile for United Utilities Group PLC (UU/), accessed 26 November 2013,
http://www.bloomberg.com/quote/UU+:LN/profile.475 Severn Trent Water, Our story, accessed 26 November 2013, http://www.stwater.co.uk/about-us/our-story/476 Reuters (US Edition), Pennon Group PLC (PNN.L), accessed 26 November 2013,
http://www.reuters.com/finance/stocks/companyProfile?symbol=PNN.L.
163 ACCC Draft decision on State Water Pricing Application: 2014-15 – 2016-17 | Attachments

California Water Service Company (US)
0.52 Investor-owned American water utility, holding six water utilities. Provides regulated and non-regulated utility services.477
American States Water Company (US)
0.51 Provides water. Owns a company dedicated to the non-regulated water industry.478
Aqua America Inc. (US)
0.56 Provides water and wastewater services to residential, commercial, industrial, and public customers.479
The York Water Company (US)
0.48 Investor-owned, regulated water utility. Its primary business is to impound, purify and distribute water. It also operates a wastewater collection and treatment system.480
Connecticut Water (US)
0.43 A regulated public water utility providing drinking water.481
Middlesex Water (US) 0.44 Family of companies that provide residential water and wastewater services.482
Source: ACCC analysis; SFG Consulting, Report to State Water: Estimation of beta for Australian water networks, April 2013, p. 19 (SFG, Report to State Water, April 2013).
In setting an equity beta of 0.7, the ACCC has considered regulatory decisions for Australian water networks. In considering this information, we have had some regard to equity betas for international water businesses. This is because IPART, QCA and ESCOSA have considered information concerning international water networks. For example:
IPART applies an equity beta range of 0.6–0.8, based on a report from its consultant, SFG.483
IPART also engaged Professor Davis to provide a peer review of SFG's advice.484 SFG used the same international comparator set in this report, as it has in its report to State Water. 485 Using this data, SFG recommended IPART adopt a 0.7 equity beta under 60 per cent leverage.486 We note this recommendation was above its mean OLS beta estimate of 0.55, within a 90 per cent confidence interval of 0.40–0.70.487
QCA applied an equity beta of 0.55 to SunWater in 2012.488 QCA's consultant, NERA, estimated beta for SunWater using Australian energy utilities, as well as energy and water utilities in the US and UK.489 NERA concluded, 'the equity beta of an Australian water business should be set at a value that is no different from the equity beta of an Australian energy utility'.490 Nevertheless, its analysis included the following international data:
477 Reuters (US Edition), Profile: California Water Service Group (CWT.N), accessed 27 November 2013, http://www.reuters.com/finance/stocks/companyProfile?symbol=CWT.N.
478 Bloomberg, Market data: American States Water Co AWR, accessed 27 November 2014, http://www.bloomberg.com/quote/AWR:US/profile.
479 Bloomberg, Market Data: Aqua America Inc WTR, accessed 27 November 2013, http://www.bloomberg.com/quote/WTR:US/profile.
480 NASDAC, The York Water Company stock quote and summary data, accessed 26 November 2013, http://www.nasdaq.com/symbol/yorw
481 Connecticut Water, About us, Accessed 26 November 2013, http://www.ctwater.com/Home/About%20Us/Who%20We%20Are.
482 Bloomberg, Market data: Middlesex Water Co MSEX, accessed 27 November 2013, http://www.bloomberg.com/quote/MSEX:US/profile.
483 IPART, Review of water prices for SDP, December 2011, p. 87484 Davis, K., Cost of capital parameters for Sydney Desalination Plant: by SFG Consulting: An initial review for IPART ,
August 2011.485 SFG, Cost of capital parameters for SDP, August 2011, p. 10; SFG, Report to State Water, April 2013, p. 19.486 SFG, Cost of capital parameters for SDP, August 2011, p. 38.487 SFG, Cost of capital parameters for SDP, August 2011, p. 5.488 QCA, Final Report: SunWater irrigation price review: 2012–17, Vol. 1, May 2012, p. 493489 NERA, Cost of capital for water infrastructure company: Report for the QCA, 28 March 2011, pp. 34–37.490 NERA recommended an equity beta of 0.8, as applied by the AER during the time of this determination. See NERA,
Cost of capital for water infrastructure company: Report for the QCA, 28 March 2011, p. 48.
ACCC Draft decision on State Water Pricing Application: 2014-15 – 2016-17 | Attachments 164

The five UK water utilities used by PriceWaterhouseCoopers (PwC) in its report for the Office of Gas and Electricity Markets (Ofgem).491 Using data from 2000–2011, NERA found these equity betas ranged from 0.37–0.62.
Nine of the 10 US water utilities that the California Public Utilities Commission used in one of its rate of return decisions.492 Using data from 2000–2011, NERA found these equity betas ranged from 0.69–0.91.
ESCOSA applied an equity beta of 0.8 to SA Water, placing more weight on regulatory stability rather than on empirical evidence.493 ESCOSA considered regulatory decisions heavily weighted towards empirical evidence and firm specific characteristics produce estimates of around 0.6–0.7.494 Its consultant, Value Adviser Associates (VAA) considered that the empirical evidence from the SFG report for IPART suggested equity betas for US and UK water utilities lie in the range of 0.6–0.7.495
This information suggests that, while international water businesses will likely have different systematic risks to State Water, these estimates do not contradict our Australian estimates. That is, the ACCC considers empirical information from Australian energy networks, as well as US and UK water businesses broadly support an equity beta of 0.7.
Methodological issues underpinning equity beta estimates
In estimating the equity beta, the pricing principles reference regulatory decisions, particularly the AER's 2009 WACC review. Empirical estimates underpin these decisions. These estimates are derived with methodologies based on well accepted economic and finance principles. SFG estimated State Water's proposed equity beta using OLS, fitted and pooled empirical estimates. The ACCC does not consider SFG's fitted and pooled estimates are consistent with well accepted economic and finance principles. Further, these methodologies produced results that are fundamentally inconsistent with well accepted methods of estimating beta, such as OLS.
For the following reasons, the ACCC considers the AER's 2009 WACC review used empirical estimates based on sound methodologies:
The empirical estimates used by the AER are consistent with the Sharpe–Lintner CAPM. This is because the AER uses OLS and least absolute deviations (LAD) to predict the correlation between a firm's returns above the risk free rate and the MRP. We consider this an accurate representation of systematic risk under the Sharpe–Lintner CAPM.496 The pricing principles consider the Sharpe–Lintner CAPM to be the most appropriate model for estimating the return on equity, due to its wide use in the finance industry and its considerable theoretical and empirical support.497
491 PwC, Advice on the cost of capital analysis for DPCR5: Final Report, 2009.492 NERA drop Southwest Water Company because it derives less than half of its revenue from regulated water
operations. See Public Utilities Commission of the State of California, Decision 09-05-019, 7 May 2009; California Water Services, Opening brief of California Water Service Company, 1 October 2008.
493 ESCOSA, Advice on a regulatory rate of return for SA Water: Final Advice, February 2012, pp. 33–34.494 ESCOSA, Advice on a regulatory rate of return for SA Water: Final Advice, February 2012, p. 33.495 VAA, Advice on Components of Regulatory Rate of Return: Final Report, 9 November 2011; ESCOSA, Advice on a
regulatory rate of return for SA Water: Final Advice, February 2012, p. 29.496 The Sharpe–Lintner CAPM measures expected returns as the risk free rate plus the MRP multiplied by an equity
beta representing the covariance of the business’ return with that of the market. ACCC, Pricing principles under the WCIR, July 2011, p. 30.
497 ACCC, Pricing principles under the WCIR, July 2011, p. 30.
165 ACCC Draft decision on State Water Pricing Application: 2014-15 – 2016-17 | Attachments

Henry noted that typically, beta in the Sharpe–Lintner CAPM is estimated using OLS.498 Further, evidence suggests the OLS estimator is unbiased.499 McKenzie and Partington have also commented on the most commonly used method for estimating the equity beta within the Sharpe–Lintner CAPM. They identified this is an OLS regression of the market returns against the individual stock returns, where the point estimate of the slope coefficient is the risk parameter. 500
Further, they noted that when the assumptions of classical linear regression model are satisfied, the OLS provides the best linear unbiased estimator of the equity beta.501
Henry noted that while there are some concerns about the validity of the OLS estimator in the presence of outliers, LAD is the most popular approach for allowing for this. LAD estimators of beta minimise the sum of absolute values of the residuals, whereas OLS minimises the sum of squared residuals.502 This reduces the influence of outlying observations. In its 2009 and 2013 decisions, the AER considered equity beta estimates using OLS and LAD.
The AER considered appropriate empirical techniques when developing its approach to estimating equity beta in its 2009 WACC decision. This included analysing the following:503
choosing to use continuous rather than discrete returns
choosing to examine data post the 'technology bubble'
choosing to use weekly as well as monthly observations
using average individual equity beta estimates, as well as portfolio estimates
choosing not to use a Blume or Vasicek adjustment
other considerations, such as considering the R–squared statistic and confidence intervals.
Recent information considered in developing the AER's 2013 rate of return guideline provided further support for the empirical estimates in the AER's 2009 WACC review. These updated empirical estimates also supported an equity beta range of 0.4–0.7 (see Table 5-3). Further, the AER considered several different studies—all of which presented a consistent pattern of results. The AER noted 'this pattern is robust to the use of different econometric techniques, different comparator sets and different time periods.504
State Water's consultant, SFG produced similar results (a 0.39–0.79 range) when applying OLS to estimate equity beta.505 This further confirmed the consistent pattern of results derived using OLS.
State Water's consultant, SFG, used pooled and fitted estimates. The ACCC has less confidence in these estimates for estimating the systematic risk of State Water, as compensated for under the Sharpe–Lintner CAPM. We consider these estimates should not influence our value for the equity beta. Our concerns with the models used to produce fitted and pooled estimates include, but are not limited to:498 Henry, O., Estimating β, 23 April 2009, p. 3.499 Henry, O., Estimating β, 23 April 2009, p. 5.500 McKenzie, M. and Partington, G., Report to the AER: Estimation of the equity beta (conceptual and econometric
issues), April 2012, p. 19. (McKenzie and Partington, Estimation of equity, April 2012, p. 19501 McKenzie and Partington, Estimation of equity beta, April 2012, p. 19502 J.M. Wooldridge, Introductory econometrics: A modern approach, South-Western Cengage Learning: Ed. 4e, 2009,
p. 330; Henry, O, Estimating β, 23 April 2009, p. 9.503 AER, Final Decision: WACC Review, May 2009, pp. 342–34.504 AER, Better Regulation: Equity beta issues paper, October 2013, p. 6.505 SFG, Report to State Water, April 2013.
ACCC Draft decision on State Water Pricing Application: 2014-15 – 2016-17 | Attachments 166

The underlying theoretical model that beta is being estimated for is the Sharpe–Lintner CAPM, rather than an alternative pricing model. The equity beta under the Sharpe–Lintner CAPM measures the standardised correlation between the returns on an individual risky asset or business with that of the overall market.506 We consider OLS estimates capture this better than the fitted and pooled models that SFG applies. The implication behind using these pooled and fitted estimates is that incorporating industry and firm characteristic information can improve equity beta estimates. We are not satisfied that this position is correct.
These models are essentially unproven. The report has not provided adequate theoretical justification for these models, nor evidence that these models explain the distribution of returns well. Regulators and market practitioners commonly use the Sharpe–Lintner CAPM as a model, and OLS as an econometric technique. However, SFG's proposed pooled and fitted models produced significantly different results to this model and technique—even when using the same comparator set over the same time period.507
This method pools information from a large, diversified sample of firms—the majority of which are not comparable to Australian water networks.508 This forces an assumption on the data that the coefficients on the market capitalisation, book–to–market and debt–to–equity factors are the same across different industries. However, this may not be the case in reality. For instance, having a high debt–to–equity ratio may affect businesses in the mining or food production industries differently to how it will affect monopoly infrastructure providers, like water or energy networks.
This method incorporates the riskiness of an entity's industry into its systematic risk. This forces an assumption on the data that firms in an industry have relatively homogenous levels of systematic risk. This is not necessarily true, particularly for firms in the electricity industry classification. The electricity industry includes both electricity networks and companies generating conventional and alternative energy.509 Considering generators operate in a competitive environment and networks are regulated monopolies, it would be reasonable to assume systematic risks would vary materially between the entities in this sector. For example, this industry includes two of our comparator firms, Spark Infrastructure and SP AusNet, along with 23 other Australian firms—with an industry coefficient of 1.08.510 Consequently, the pooled and fitted betas for Spark Infrastructure and SP AusNet are significantly larger than their OLS betas. These increase from 0.5 to 1.19 (pooled) and 1.27 (fitted) for Spark Infrastructure and from 0.23 to 0.92 (pooled) and 0.99 (fitted) for SP AusNet.511
Further, even if the ACCC was to accept SFG's fitted and pooled estimates, it does not consider these estimates support an estimated equity beta of 0.9. We note SFG rounded its point estimate of 0.86 to 0.9 'for the purposes of discussion'.512 Further, we disagree with the rationale behind weighting the OLS, pooled and fitted estimates by 25, 50 and 25 per cent respectively. We note that SFG stated:513
The fitted OLS estimates rely upon each firm's OLS estimate as a starting point, and we shift these OLS estimates according to industry groupings and firm characteristics. So we are basically placing half the weight on the pooled estimation technique and half the weight on OLS estimation.
506 McKenzie and Partington, Risk, asset pricing models and WACC, June 2013, p. 21.507 SFG, Report to State Water, April 2013.508 This includes 2,400 Australian firms and 1,508 US/UK firms from 40 different industry classification benchmarks.
See SFG, Report to State Water, April 2013.509 ICB, Industry structure and definitions, <http://www.icbenchmark.com/ICBDocs/Structure_Defs_English.pdf,
accessed 2 October 2013; AER analysis.510 SFG, Report to State Water, April 2013.511 SFG, Report to State Water, April 2013, p. 15.512 SFG, Report to State Water, April 2013, p. 5.513 SFG, Report to State Water, April 2013, p. 5.
167 ACCC Draft decision on State Water Pricing Application: 2014-15 – 2016-17 | Attachments

However, the ACCC considers SFG's weightings are more appropriately characterised as placing 25 per cent on pure OLS and 75 per cent on modelling beta as a function of industry and firm characteristics. We note that by changing these weightings alone so that 50 per cent is place on OLS, the estimated equity beta would drop from 0.86 to 0.75.
5.3.4 Cost of debtThe cost of debt is defined as the sum of the risk free rate and a margin for debt in the pricing principles:514
The debt risk premium (DRP) is the margin above the nominal risk free rate that a debt holder would require to invest in the debt issued by a benchmark efficient entity. Combined with the nominal risk free rate, the DRP represents the return on debt and is an input into the rate of return.
For consistency purposes, the risk free rate used to estimate the cost of debt is equal to the risk free rate used in the Sharpe–Lintner CAPM for the return on equity. As discussed in section 5.3.3, we do not accept State Water's proposed approach for calculating the risk free rate. The ACCC proposes estimating the risk free rate for both the cost of debt and return on equity by observing the yield on 10 year CGS over a short period commencing as close as possible to the beginning of the regulatory period. This approach produces a risk free rate of 4.28 per cent using our indicative averaging period.
State Water proposed to calculate the DRP by defining the benchmark bond as a 10 year Australian corporate bond with a BBB+ credit rating. It estimated its DRP based on the Bloomberg BBB rated fair value curve (FVC) as Bloomberg does not produce a fair value curve for BBB+ rated bonds. The ACCC agrees with this benchmark, primarily because it is consistent with the pricing principles discussed in section 5.3.1 above.
However, the ACCC does not agree with State Water's proposed method of estimating the DRP using a 10 year historical average. Consistent with the risk free rate, we consider the DRP should be estimated using a method that is commensurate with prevailing market conditions.
The ACCC proposes to estimate the DRP using the Bloomberg BBB rated FVC at the 7 year term and extrapolate to 10 years based on paired bonds analysis. A 10 year forward looking DRP is appropriate because:
At any point in time, the DRP derived from prevailing BBB+ rated (or equivalent) corporate bonds indicates the premium on the risk free rate that debt holders expect to receive on a benchmark efficient entity in current market conditions.
Prevailing 10 year corporate bonds reflect the return over the appropriate forward looking investment horizon (which is 10 years).
514 ACCC, Pricing principles under the WCIR, June 2011, p. 38.
ACCC Draft decision on State Water Pricing Application: 2014-15 – 2016-17 | Attachments 168

An averaging period determined in advance minimises regulatory gaming. If historical periods are allowed, a service provider would have the ability to select a historical period that produced the highest return.
Further, State Water proposed a historical DRP to achieve consistency with its proposed historical risk free rate. However, given the ACCC has not accepted its reasons for adopting a historical cost of equity; it does not consider it necessary to address the historical DRP calculation method proposed by State Water.
Consistent with the risk free rate, the ACCC considers the DRP should be forward looking. The benchmark bond rate can be measured using Bloomberg's BBB rated seven year fair value curve, extrapolated to a 10 year maturity using paired bond analysis.515 This approach requires using a 10 year forward looking prevailing risk free rate, as previously discussed (see section 5.3.4). We extrapolate the Bloomberg BBB fair value curve from seven to 10 years, based on PricewaterhouseCooper's (PwC) analysis of paired bonds. The AER accepted this DRP method and PwC's paired bonds approach in the recent regulatory decisions.516
For this draft decision, the ACCC has identified four bond pairs that satisfy the PwC criteria used to select paired bonds. They are:
a pair of General Property Trust (GPT) bonds
a pair of Commonwealth Property bonds
a pair of Sydney airport bonds, and
a pair of SPI bonds.517
The ACCC has used an indicative averaging period of 20 business days from 16 December 2013 to 15 January 2014 for its DRP calculation. Based on our bond pairing analysis for this indicative averaging period, we calculate the extrapolated 10 year Bloomberg BBB fair value DRP at 2.46 per cent.
The ACCC notes the AER published its rate of return guideline in December 2013. In this guideline, it proposed to estimate the return on debt using a trailing average portfolio approach with annual update.518 We will comprehensively review the water pricing principles after 1 July 2014 and will review our approach to calculate return on debt at that time.
5.3.5 Gearing ratioThe gearing ratio is the ratio of the value of debt to total capital (that is, both debt and equity). The gearing ratio is used to weight the return on debt and equity when formulating the overall rate of return. State Water proposed a gearing ratio of 60:40 (that is, 60 per cent debt). 519 The ACCC accepts
515 Seven years is the maximum term currently published for the Bloomberg BBB fair value curve.516 AER, Draft decision: SP AusNet transmission determination 2014-15 to 2016-17, August 2013; AER, Draft decision:
APA GasNet access arrangement, September 2012; AER, Draft decision: Envestra access arrangement Victoria, September 2012; AER, Draft decision: Multinet access arrangement, September 2012; AER, Draft decision: SPI Networks access arrangement, September 2012.
517 We found two longer dated bonds (ISINs: AU3CB0195972 and AU3CB0195980) with the same maturity date of 28 June 2022. Therefore, we took the average of these two bonds and compared this average with the shorter dated bond (ISIN: AU3CB0205201) to calculate the annual difference in yields.
518 AER, Better Regulation: Rate of return guidelines – Final decision, December 2013.519 State Water, Pricing application to the ACCC, June 2013, p. 110.
169 ACCC Draft decision on State Water Pricing Application: 2014-15 – 2016-17 | Attachments

that applying a benchmark gearing ratio of 60:40 per cent to State Water as reasonable. This is consistent with the pricing principles, which note:520
It is standard practice amongst Australian regulators to adopt a benchmark assumption on the gearing levels of an efficiently financed business rather than the actual gearing level of regulated firms…
The benchmark DRP is to be estimated on the basis of a benchmark gearing level of 60:40 debt to equity on the yields of BBB+ rated corporate bonds with 10 year maturity.
Further, a gearing ratio of 60:40 is supported by relevant available empirical evidence, and is consistent with other regulatory decisions in the water sector, and in the infrastructure sector at large. In regulatory decisions for the water sector, IPART and the ESC have adopted a benchmark gearing ratio. These decisions had regard to the gearing ratios of comparable Australian utilities and UK water utilities to establish an appropriate benchmark.521 Based on their assessments, both regulators adopted a benchmark gearing ratio of 60:40 debt to equity in their regulatory decisions for the water sector. Further, the ACCC and AER adopt a benchmark ratio of 60:40 in regulating many infrastructure businesses.
5.4 RevisionsThe ACCC does not approve State Water's application in its present form. We propose to determine State Water's rate of return by the following revisions to State Water's pricing application:
Rather than adopting a 10 year historical risk free rate, adopt a 4.28 per cent indicative risk free rate (subject to updating). Estimate this with yields on 10 year CGS, using an averaging period of 10–40 business days commencing as close as practically possible to the start of the regulatory period.
Rather than adopting a 10 year historical DRP, adopt a 2.46 per cent indicative DRP (subject to updating). Estimate this on 10 year BBB+ rated (or equivalent) corporate bonds, using an averaging period of 10–40 business days commencing as close as practically possible to the start of the regulatory period.
Adopt an equity beta of 0.7.
520 ACCC, Pricing principles under the WCIR, July 2011, p. 40.521 ESC, Workshop Discussion Economic Regulation of the Victorian Water Sector: Estimating a return on and of Capital
Investment, April 2004; IPART, Draft Determination and Draft Report - Bulk Water Prices for State Water Corporation and Water Administration Ministerial Corporation - From 1 August 2006 to 30 June 2010, May 2006, p. 154.
ACCC Draft decision on State Water Pricing Application: 2014-15 – 2016-17 | Attachments 170
6 Regulatory depreciationDepreciation is the allowance provided so that capital investors can receive a return of invested capital over the economic life of the asset (return of capital). Regulatory depreciation represents the value of straight-line depreciation less the annual inflation indexation on the RAB.
The depreciation of the assets State Water uses to provide infrastructure services is an important component in calculating its projected RAB522 (as discussed in attachment 1). It is also an allowance in the total revenue requirement. For the ACCC to be satisfied that State Water’s RAB has been calculated in accordance with the WCIR, we must be satisfied that regulatory depreciation has been determined in accordance with the WCIR. The ACCC’s draft decision on State Water’s annual regulatory depreciation allowance for 2014–17 is outlined in this attachment.
The key factors that impact the regulatory depreciation allowance for the 2014–17 regulatory period include:
the remaining economic lives for depreciating existing assets in the opening RAB
the standard economic lives for depreciating new assets associated with forecast net capex.
The approved capex allowance and the opening RAB also affect the regulatory depreciation allowance but are discussed in other attachments.523
6.1 Draft decisionThe ACCC approves State Water's application to use the straight-line method to calculate the regulatory depreciation allowances as set out in the post-tax revenue model (PTRM). However, the ACCC does not approve State Water's total proposed regulatory depreciation allowance of –$22.1 million (nominal) for its regulated valleys, over the 2014–17 regulatory period. This is because the ACCC's adjustments to State Water's asset lives and its draft decisions on other components of State Water's application impact the proposed regulatory depreciation allowance. These other components are discussed in other attachments and include:
the opening RAB as at 1 July 2014 (discussed in attachment 1)
forecast net capex for 2014–17 (discussed in attachment 4).
The ACCC's draft decision is to determine State Water's total regulatory depreciation allowance over the 2014–17 regulatory period to be –$10.4 million (nominal). This represents an increase of $11.7 million (nominal) or 52.9 per cent from State Water's application. Table 6-1 shows the calculation of this figure. Given the relatively long lives of some assets, the regulatory depreciation allowance across all ACCC regulated valleys is negative overall. This is due to the indexation (inflation) adjustment to the RAB outweighing the straight-line depreciation component of regulatory depreciation. This is discussed in more detail in section 6.3.
522 In accordance with Schedule 2 to the WCIR.523 This is relevant for nine of the ten valleys regulated by the ACCC. Lowbidgee is a new valley so it does not have an
opening RAB.
171 ACCC Draft decision on State Water Pricing Application: 2014-15 – 2016-17 | Attachments

Table 6-1 ACCC's draft decision on State Water's depreciation allowance ($million, nominal)
2014–15 2015–16 2016–17 Total
Straight-line depreciation 17.5 19.4 20.9 57.8
Less: indexation on opening RAB 14.3 15.9 17.3 47.4
Regulatory depreciation -3.2 -3.5 -3.6 -10.4
Source: ACCC analysis.
Table 6-2 shows the breakdown of the ACCC’s regulatory depreciation allowance by individual valley. For comparative purposes, State Water’s proposed regulatory depreciation allowance for each valley is also presented.
Table 6-2 Comparison of State Water application and ACCC draft decision regulatory depreciation allowance for the 2014–17 regulatory period ($millions, nominal)
Valley State Water application Draft decision Difference
User share Govt share Total User share Govt share Total Total (%)
Border Rivers -0.1 0.0 -0.1 0.0 0.0 0.0 0.1
Fish River -1.8 0.0 -1.8 -0.4 0.0 -0.4 1.4
Gwydir -0.9 -2.6 -3.5 -0.5 -2.3 -2.7 0.7
Lachlan -1.2 -1.8 -3.0 -0.3 -0.6 -0.8 2.2
Lowbidgee 0.0 0.0 0.0 0.0 0.0 0.0 0.0
Macquarie -1.1 -1.9 -2.9 -0.5 -1.5 -2.0 1.0
Murray -0.7 -0.3 -1.1 -0.1 -0.1 -0.2 0.9
Murrumbidgee -1.1 -2.0 -3.1 0.3 0.2 0.4 3.6
Namoi -0.6 -4.6 -5.2 -0.2 -3.3 -3.5 1.7
Peel -0.1 -1.2 -1.3 -0.1 -1.1 -1.2 0.1
Total regulated valleys -7.7 -14.4 -22.1 -1.8 -8.6 -10.4 11.7
Source: State Water proposed PTRMs and ACCC analysis.
6.2 State Water's applicationFor the 2014–17 regulatory period, State Water proposed a total forecast regulatory depreciation allowance of –$22.1 million (nominal).524 The breakdown by individual valley is shown in Table 6-2 above. Table 6-3 shows the calculation of State Water’s proposed regulatory depreciation over the 2014–17 regulatory period.
524 State Water proposed PTRMs. The sum of relevant figures in State Water’s individual PTRMs has been presented for comparison as the figures presented in State Water’s application document represent all State Water’s valleys including those located outside the Murray Darling Basin not regulated by the ACCC.
ACCC Draft decision on State Water Pricing Application: 2014-15 – 2016-17 | Attachments 172

Table 6-3 State Water's proposed depreciation allowance ($million, nominal)
2014–15 2015–16 2016–17 Total
Straight-line depreciation 12.1 13.6 14.6 40.4
Less: indexation on opening capital base 18.2 21.3 23.0 62.5
Regulatory depreciation -6.0 -7.7 -8.4 -22.1
Source: State Water proposed PTRMs.
State Water proposed:
standard asset lives of 102.4 years. These lives are used for depreciating new assets associated with forecast net capex in the 2014–17 regulatory period. The proposed remaining asset lives were identical for each valley and asset class.
remaining asset lives as at 1 July 2014 of 61.3 years. These lives are used for depreciating existing assets in the opening RAB as at 1 July 2014. The proposed remaining asset lives were identical for each valley and asset class.
The proposed asset classes and corresponding standard and remaining asset lives are shown in Table 6-4.
Table 6-4 State Water’s proposed asset classes and standard and remaining lives as at 1 July 2014 (years)
Asset class Standard asset life Remaining asset life
Dams 102.37 61.3
Storage reservoirs 102.37 61.3
Revenue meters 102.37 61.3
IT systems 102.37 61.3
Plant & machinery 102.37 61.3
Office equipment 102.37 61.3
Buildings 102.37 61.3
Vehicles 102.37 61.3
Land n/a n/a
Source: State Water proposed PTRMs
6.3 Assessment approachState Water’s application must provide a forecast of depreciation for the 2014–17 regulatory period, including a demonstration of how the forecast is derived on the basis of the proposed depreciation method.525 The depreciation schedule sets out the basis on which the assets constituting the RAB (that is, the assets used to provide infrastructure services) are to be depreciated for the purpose of determining bulk water charges. The depreciation schedule may consist of a number of separate schedules, each relating to a particular asset or class of assets. In assessing State Water’s
525 Rule 25(5)(a) of the Water Infrastructure Charge Rules 2010 (WCIR).
173 ACCC Draft decision on State Water Pricing Application: 2014-15 – 2016-17 | Attachments

application, the ACCC also takes into account the depreciation schedule approved in the 2010–14 regulatory period in order to maintain consistency across regulatory periods.
In considering State Water’s proposed depreciation schedule, the ACCC is to assess the compliance of the proposed depreciation schedule with the approach to depreciation set out in the ACCC’s WCIR pricing principles guideline which states:
Fixed assets should be depreciated using a straight-line methodology. However, the regulator or the operator may adopt a different approach to depreciation where an operator can justify departure from this method or where it is appropriate for the regulator to do so. Where a different approach is used, the net present value (NPV) to the business must be the same as under a straight-line methodology.526
As set out in the ACCC’s WCIR pricing principles guideline, the ACCC considers that the straight-line method for calculating depreciation is normally the most appropriate methodology. The ACCC’s draft decision is to use this method in assessing State Water’s application and, if necessary, determining the appropriate method of depreciation.
In its submission to the ACCC, Gwydir Valley Irrigators Association raised concerns with the straight line methodology. They consider it is creating difficulties in calculating the remaining lifespan of all State Water’s assets as State Water has proposed to reduce the average remaining useful life due to reviews on a few different types of assets.527
The ACCC considers the determination of asset lives is separate from the method of calculating depreciation. The asset lives determine the years over which costs are recovered, while the depreciation method affects the profile of recovery of those costs. For example, a diminishing value depreciation method front loads recovery of costs early in an asset’s life. In contrast, a straight-line method leads to a relatively flatter profile of cost recovery. The ACCC considers that this flatter profile is the appropriate profile to depreciate State Water’s assets. It also allows assets to be depreciated only once over their economic life, and is therefore NPV neutral.
Under the ACCC’s building block approach in the PTRM, the regulatory depreciation allowance equals straight-line depreciation less the annual inflation indexation on the opening RAB for that year. Removing the inflation indexation from regulatory depreciation offsets the use of an indexed RAB and a nominal WACC (for determining the return on capital), thereby avoiding double counting of inflation. Double counting of inflation was a concern raised by NSWIC in its submission to the ACCC.528
The ACCC has assessed State Water’s proposed inputs to the regulatory depreciation calculation, including:
the opening RAB as at 1 July 2014, as discussed in attachment 1
forecast net capex in the 2014–17 regulatory period, as discussed in attachment 4
forecast inflation rate for the 2014–17 regulatory period, discussed in attachment 5
standard economic lives for each asset class—used for calculating the depreciation of new assets associated with forecast net capex in the 2014–17 regulatory period
526 ACCC, Pricing principles for price approvals and determinations under the Water Charge (Infrastructure) Rules 2010, July 2011, p. 44.
527 Gwydir Valley Irrigators Association Inc. submission to the ACCC State Water review, September 2013, p. 13.528 New South Wales Irrigators’ Council submission to the ACCC State Water review, 13 September 2013, chapter 8.
ACCC Draft decision on State Water Pricing Application: 2014-15 – 2016-17 | Attachments 174

remaining economic lives for each asset class—used for calculating the depreciation of existing assets associated with the opening RAB as at 1 July 2014.
The ACCC's draft decision on the required amendments to State Water’s proposed regulatory depreciation allowances reflects the ACCC’s determinations on these building block components. The ACCC’s assessment approach on the remaining and standard economic lives is set out below.
In general, the ACCC considers that consistency in the standard economic life for each asset class across regulatory periods will allow bulk water charges to vary smoothly over time.529 The ACCC also considers if the RAB or capex is disaggregated into asset classes, the life assigned to an asset class should more accurately reflect the average economic life of the asset types within that class. The ACCC will generally seek to roll forward the lives of existing assets based on the lives previously established for these assets. The ACCC recognises that over time the actual and expected useful lives of certain assets may diverge as changes in circumstances may suggest a shorter or longer life is more appropriate. In such circumstances, it may be reasonable to revise standard economic lives for new assets and in more limited circumstances also revise the remaining economic lives of existing assets.
6.4 Reasons for draft decisionThe ACCC's draft decision is to not approve State Water’s application, and to determine State Water's total regulatory depreciation allowance for the 2014–17 regulatory period at –$10.4 million ($nominal). This represents an increase of $11.7 million ($nominal) or 52.9 per cent from State Water's application. The breakdown by individual valley is shown in Table 6-2. The allowance in this draft decision reflects reductions in the opening RAB and the forecast capex allowance (discussed in other attachments) and changes to economic lives.
The remaining and standard economic lives proposed by State Water are substantially shorter than those previously approved by IPART. At the last two price reviews State Water argued that the useful lives of its assets are substantially shorter than the remaining asset lives that IPART used. In its 2006 determination IPART accepted proposed changes to State Water’s remaining asset lives. IPART accepted an average remaining asset life of 160 years for all assets existing on 1 July 2004 and an average standard asset life for all new assets beyond 1 July 2004 of 75 years. In its 2010 determination IPART rejected State Water’s proposed average remaining asset life of 83 years for all assets in its portfolio as at 1 July 2010 and retained the asset lives in its 2006 determination. As noted above, State Water is now proposing a single remaining asset life of 61.3 years as at 1 July 2014.
Given the substantial changes to asset lives proposed by State Water, the ACCC engaged Deloitte Access Economics (Deloitte) to review State Water’s economic lives for depreciating its assets across each ACCC regulated valley. The review provided advice on:
whether a remaining economic life of 61.3 years as at 1 July 2014 was a reasonable estimation of the assets making up State Water’s RAB
whether it was possible and/or reasonable to have different remaining economic lives for the individual ACCC regulated valleys
529 The ACCC has also tried to encourage smooth bulk water charges in other aspects of its decision including the application of a price cap with an ‘unders’ and ‘overs’ adjustment, as discussed in attachment 10.
175 ACCC Draft decision on State Water Pricing Application: 2014-15 – 2016-17 | Attachments

whether the breakdown of asset classes proposed by State Water for future capex and corresponding standard economic lives is reasonable.
The recommendations of Deloitte’s report and ACCC considerations are discussed below.
6.4.1 Remaining economic livesThe ACCC does not accept State Water’s proposed remaining economic life of 61.3 years for existing assets in all ACCC regulated valleys. The ACCC’s draft decision is to determine separate remaining asset lives for each valley as shown in Table 6-5. The ACCC considers that applying different remaining economic lives to each valley is more transparent and better reflects the principles of user pays than adopting a single remaining asset life for all valleys and better represents the mix of assets used in each valley. The ACCC considers this is consistent with its pricing principles and the Basin water charging objectives and principles in Schedule 2 of the Water Act 2007 (BWCOP).530
State Water proposed a similar reduction to remaining economic lives for the 2010 IPART price review. IPART rejected this proposal on the advice of Atkins Cardno after its review of State Water’s proposed economic lives.531 Atkins Cardno considered the data reliability and analysis underpinning the condition based assumptions as employed by State Water were not sufficiently robust at the time to justify using such an approach.532 However, Atkins Cardno did broadly accept the general approach proposed by State Water.
Deloitte’s findings on remaining economic lives
While Deloitte found it likely that many of the issues identified by Atkins Cardno regarding data quality remain to some degree, overall it found State Water’s data to be more robust than that of most regional water businesses it has reviewed.533 It also considered the overall methodology proposed by State Water to calculate remaining economic lives to be reasonable, although Deloitte did not test the sensitivity of all the assumptions made by State Water in applying its approach. 534 Based on the review conducted by Deloitte, the ACCC considers that the concerns raised by Atkins Cardno at the 2010 price review determination are substantially reduced. The ACCC therefore accepts the general approach proposed by State Water to determining its remaining economic lives.
However, Deloitte identified that the average remaining economic life of 61.3 years proposed by State Water included assets in valleys not regulated by the ACCC. By including only those assets in ACCC regulated valleys, Deloitte found the average remaining economic life for all assets in the ACCC regulated valleys to be 50.9 years at 1 July 2014 using State Water’s methodology. This represents a reduction of 10.4 years in the average remaining economic life from that proposed by State Water.
Deloitte also found that the average remaining economic lives varied considerably across valleys. This is due to variation in both the ownership of assets in the valleys and average age of the assets.535
For example, Peel valley consists mainly of relatively new assets compared to valleys like Macquarie
530 Water Act 2007, Schedule 2.531 IPART, Review of bulk water charges for State Water Corporation, June 2010, pp. 101–102.532 Atkins Cardno, Review of the Weighted Average Asset Life of State Water Corporation Assets, 11 December 2009,
pp. 4, 16–17.533 Deloitte also addressed other concerns raised by Atkins Cardno. Deloitte Access Economics, Final report - asset
lives for State Water’s 2014 pricing application, 9 December 2013, pp. 3–5.534 Deloitte Access Economics, Final report - asset lives for State Water’s 2014 pricing application , 9 December 2013,
pp. 3–5.535 Deloitte Access Economics, Final report - asset lives for State Water’s 2014 pricing application , 9 December 2013,
pp. 7–8.
ACCC Draft decision on State Water Pricing Application: 2014-15 – 2016-17 | Attachments 176

with relatively older assets, thus the remaining life of these newer assets is likely to be higher. In Murray valley, the key long-lived asset (Hume Dam) is owned by the Murray Darling Basin Authority (MDBA) rather than State Water and therefore not included in this review. Due to this large variation in remaining economic lives, Deloitte recommended the use of different remaining economic lives across valleys as shown in Table 6-5.536
The ACCC agrees with Deloitte’s recommendation to apply different remaining economic lives across valleys, although the ACCC has also tested the revenue impact of the recommended lives. To the extent that changes to remaining economic lives impact on State Water’s regulated charges, the ACCC considers that price shocks can adversely affect the efficient development of a market and its related markets and have a perverse or unintended pricing outcome.537 The ACCC modelled the impact to users if the approach to determining remaining economic lives in the IPART 2010 price review determination was continued. The analysis shows that total revenues to be recovered from users over the entire 2014–17 regulatory period would decrease by between about 1 per cent and 2.5 per cent across most valleys compared to State Water’s application (holding all other inputs constant). Fish River would experience a 4.8 per cent reduction.
If accepted, Deloitte’s recommended remaining economic lives would change total revenues to be recovered from users in all valleys by between –0.1 per cent and +4.8 per cent over the entire 2014–17 regulatory period compared with State Water’s application (holding all other inputs constant). The ACCC considers that the revenue impacts for all valleys are unlikely to cause significant price shock and thereby damage other markets or have a perverse or unintended pricing outcome. Applying these remaining economic lives provides greater transparency regarding the age of each valley’s assets. This assists in better planning for infrastructure assets replacement and avoids customers paying for assets too quickly (such that the asset is fully depreciated before the end of its useful life, which may encourage inefficient early replacement) or too slowly (such that customers continue to pay for assets even after they are no longer being used). The ACCC therefore considers its approach is consistent with the pricing principles and the BWCOP. The revenue impact of this draft decision on the remaining asset lives is over the 2014–17 regulatory period and is more than offset by the reductions to other building block costs, as shown in attachment 6.
Deloitte suggested the use of remaining economic lives rounded to the nearest 5 years because there is some uncertainty regarding the exact values. Given the availability of the point estimates, and no evidence to suggest that the rounded figures are a better estimate of remaining economic lives, the ACCC considers it appropriate to adopt the unrounded estimates for remaining economic lives. The ACCC’s draft decision is to determine remaining economic lives at 1 July 2014 as shown in Table 6-5. These remaining economic lives will be used for calculating the depreciation of the opening RAB as at 1 July 2014 for each valley.
The ACCC considers that the existing assets as at 1 July 2014 should be depreciated as a single class of assets for each valley, consistent with the approach employed by IPART for the 2010 price review. State Water proposed that its opening RABs at 1 July 2014 be broken down by asset class. However, this breakdown only reflected the 2010–14 asset class breakdown of capex as the assets in the opening RABs at 1 July 2010 were all assigned to the dams asset class. State Water also assigned an identical remaining economic life to each asset class, which has the same depreciation effect as using a single asset class. The ACCC did not review the breakdown of existing assets
536 The values in Table 1-5 represent the point estimates provided by Deloitte. Deloitte also presented values rounded to the nearest 5 years, although this rounding was purely a mechanical adjustment.
537 For example, agriculture depends on water as a key input to production. A price shock in the cost of this key input can affect the efficient development of the agricultural markets.
177 ACCC Draft decision on State Water Pricing Application: 2014-15 – 2016-17 | Attachments

proposed by State Water and Deloitte conducted its assessment of remaining economic lives using a single weighted average across all asset classes on a valley by valley basis. The ACCC considers it reasonable to vary the remaining asset life across valleys. However, the ACCC considers that to break it down further by asset class would be a costly exercise for no tangible benefit, as the same depreciation allowance will be obtained in each valley whether the remaining asset lives are broken down or not. The substantive allocation issue is at the valley level as prices differ across valleys.
For future capex over the 2014–17 regulatory period (and beyond) the asset classes will be broken down and separate standard economic lives applied for the calculation of depreciation, as discussed in section 6.4.2.
Table 6-5 ACCC’s draft decision and State Water proposed remaining economic lives by valley as at 1 July 2014 (years)
Valley Application Draft decision
Border Rivers 61.3 53.9
Fish River 61.3 46.6
Gwydir 61.3 59.2
Lachlan 61.3 45.7
Macquarie 61.3 56.0
Murray 61.3 46.5
Murrumbidgee 61.3 40.9
Namoi 61.3 53.9
Peel 61.3 63.6
Source: State Water proposed PTRMs, Deloitte Access Economics, Final report - asset lives for State Water’s 2014 pricing application, 9 December 2013, p. 8, and ACCC analysis.
6.4.2 Standard economic livesThe ACCC does not accept State Water’s proposed standard economic life of 102.4 years for all asset classes across its regulated valleys. The ACCC’s draft decision is to determine standard economic lives for each asset class as shown in Table 6-6.
Deloitte’s findings on asset class breakdown
In its review of State Water’s proposed economic lives, Deloitte assessed the asset class breakdown and standard economic lives that would be assigned to State Water’s capex for the 2014–17 regulatory period. Deloitte compared State Water’s breakdown with those of 12 other utilities, including 10 water utilities. Deloitte recommended including an additional asset class for pipelines. Pipelines were considered to have a substantially different economic life than other assets and could become more significant over time, particularly in Fish River.538 Deloitte found that State Water’s proposed asset classes, with the addition of a pipelines asset class, was consistent with the classes used by other utilities and appropriately reflects the nature of State Water’s RAB.
538 Deloitte Access Economics, Final report - asset lives for State Water’s 2014 pricing application, 9 December 2013, p. 10.
ACCC Draft decision on State Water Pricing Application: 2014-15 – 2016-17 | Attachments 178

The ACCC’s draft decision is to accept the asset class breakdown proposed by State Water, but to include a pipelines asset class as recommended by Deloitte.539 The asset class breakdown is shown in Table 6-6.
Deloitte’s findings on standard economic lives
Deloitte’s report also made recommendations on standard economic lives to be associated with the asset classes identified above. Deloitte had regard to the median standard economic lives used by other regulators for similar asset classes in recent decisions in the water and other regulated industries. It also gave consideration to State Water’s specific circumstances and the effective asset lives recommended by the Australian Tax Office (ATO) for similar assets.540
The ACCC accepts Deloitte’s recommendations on the standard economic lives for these asset classes as shown in Table 6-6. For the majority of asset classes (including vehicles, buildings, meters, office equipment) the benchmarking undertaken shows relatively small dispersion around the median asset life. In most cases, these assets are also likely to be a relatively smaller proportion of future capex. However, for other assets there are some significant variations around the median asset life determined by Deloitte. Dams are a significant asset in State Water’s RAB where such variations in median asset life were noted in Deloitte’s report.
In previous reviews IPART adopted a standard economic life of 200 years for State Water’s dams. However, the ACCC is satisfied that more recent regulatory decisions suggest 100 years to be increasingly the standard for regulatory depreciation purposes.541 While a new dam may last longer than a 100 years, this could be established with more certainty over time and may be reflected in revised remaining economic lives in the future. The ACCC also expects any refurbishment that significantly extends a dam’s life to also be included in this asset class, although such refurbishment need not necessarily add as much as 100 years to the dam life. On balance, the ACCC considers adopting a standard economic life of 100 years for dams, as recommended by Deloitte, is appropriate.
State Water’s capex on IT systems is material over the 2014–17 regulatory period and is expected to be recovered almost entirely from users. The ACCC gave careful consideration to whether Deloitte’s recommended standard economic life of 6 years for IT systems was reasonable. Deloitte found that 5 years was the most common and generally accepted economic life for IT assets. However, it also noted the nature of State Water’s IT expenditure was more specialised and likely to have a longer economic life. The ACCC agrees that State Water’s proposed IT systems are likely to be more specialised and considers a standard economic life of 6 years for IT assets to be appropriate.
539 Deloitte Access Economics, Final report - asset lives for State Water’s 2014 pricing application, 9 December 2013, p. 15.
540 Deloitte Access Economics, Final report - asset lives for State Water’s 2014 pricing application , 9 December 2013, pp. 11–13.
541 Deloitte Access Economics, Final report - asset lives for State Water’s 2014 pricing application, 9 December 2013, p. 12, 19–21.
179 ACCC Draft decision on State Water Pricing Application: 2014-15 – 2016-17 | Attachments

Table 6-6 ACCC’s draft decision and State Water proposed standard economic lives by asset class as at 1 July 2014 (years)
Asset Class Application Draft decision
Dams 102.37 100
Storage reservoirs 102.37 80
Revenue meters 102.37 15
IT systems 102.37 6
Plant & machinery 102.37 25
Office equipment 102.37 10
Buildings 102.37 60
Vehicles 102.37 5
Pipelines(a) – 80
Land n/a n/a
(a) Pipelines asset class not in State Water applicationSource: State Water proposed PTRMs, Deloitte Access Economics, Final report - asset lives for State Water’s 2014 pricing
application, 9 December 2013, p. 15 and ACCC analysis.
The ACCC considers applying the standard economic lives shown in Table 6-6 to be consistent with the WCIR and the Water Act 2007.542;543 As with remaining economic lives, applying a standard economic life that better reflects an asset’s expected useful life assists in efficient use of and planning for infrastructure assets. The breakdown of these standard economic lives by asset class also ensures greater transparency in the make-up of each valley’s RAB going forward. Applying the standard economic lives determined by the ACCC to the capex proposed by State Water would increase total revenues to be recovered from users in all valleys by between 1.8 per cent and 3.8 per cent over the entire 2014–17 regulatory period. This impact, however, is more than offset by the reductions to other building block costs, as shown in attachment 1.
6.4.3 Timing of depreciation—recognition of capexThe ACCC accepted State Water’s proposed forecast capex to be recognised on an as-incurred basis.544 Under an as-incurred approach, depreciation occurs as soon as the capex is forecast to be spent (incurred). However, large capex projects tend to be constructed over a few years with costs incurred over the construction period before the project is completed and providing services (commissioned). The ACCC’s preferred method is to recognise capex on a partially as-incurred approach. Under a partially as-incurred approach the regulated business earns a return on capital on capex as the cost is incurred. However, the business is only able to earn a return of capital (depreciation) on assets that are commissioned and providing services – that is, assets which are providing infrastructure services, as required by Schedule 2 of the WCIR. This is consistent with the ACCC’s WCIR pricing principles which state:
Depreciation of an asset must only be recovered once that asset is providing infrastructure services.545
542 Rule 29(2) of the Water Infrastructure Charge Rules 2010 (WCIR).543 Water Act 2007, Part 1, Division 1, 3(c).544 State Water Application, p. 93.545 ACCC, Pricing principles for price approvals and determinations under the Water Charge (Infrastructure) Rules 2010,
July 2011, p. 45.
ACCC Draft decision on State Water Pricing Application: 2014-15 – 2016-17 | Attachments 180

Following discussions with State Water, the ACCC is of the view that State Water’s financial reporting techniques would require significant modification to provide this data at present. The ACCC accepts the recognition of capex on as-incurred basis for this regulatory period but has advised State Water to address this matter for the 2017–21 price review determination. The ACCC also notes that this issue does not ultimately impact how much State Water will recover through depreciation over an asset’s life, but rather the timing of depreciation.
181 ACCC Draft decision on State Water Pricing Application: 2014-15 – 2016-17 | Attachments

7 Forecast water extraction and entitlement volumesThe determination of State Water’s valley–based entitlement and usage charges takes into account the user share of State Water’s revenue requirement, forecasts of water extractions and forecasts of the volume of entitlements for each valley serviced by State Water in the Murray Darling Basin (MDB). The ACCC’s review of the user share of State Water’s revenue requirement is set out in Attachment 1 of this draft decision.
The ACCC reviewed the forecasts of water extraction and the volume of entitlements proposed by State Water to make its decision on the proposed regulated charges for the first year of the 2014–15 to 2016–17 regulatory period. This attachment sets out the ACCC's assessment of the proposed forecasts of water extractions and the forecasts of the volume of entitlements for the MDB valleys serviced by State Water.
7.1 Draft decisionThe ACCC approves the forecast water extractions for the first year of the next regulatory period, 2014–15, as proposed by State Water for all valleys. The ACCC also approves forecast entitlement volumes as proposed by State Water over the next regulatory period for all valleys, except Fish River. The ACCC is satisfied State Water’s proposal for all valleys, except Fish River, meets the requirements of section 3.13 of the ACCC’s pricing principles for demand or consumption forecasts.546
That is, the ACCC is satisfied the proposed forecasts of water extractions and entitlement volumes for each valley:547
have been developed using an appropriate forecasting methodology
are based on reasonable assumptions about key drivers of demand
utilise the best available information
take into account current demand and economic conditions.
For Fish River, the ACCC has adjusted the proposed forecast minimum annual quantity (MAQ) to reflect the current water sharing plan for Fish River to ensure that forecasts be based on the best information available.548
The ACCC approves the use of the 20 year moving average approach to forecast water extraction in the subsequent years (2015–16 to 2016–17) of the next regulatory period for all valleys. However, the ACCC does not approve the proposed application of this approach for 2015–16 to 2016–17. This is because some data points included by State Water in the calculation of the 20 year moving average for these years will not be available at the time of the annual review. The ACCC notes that State Water will provide water extraction forecasts by valley for the regulatory years 2015–16 and 2016–17 as part of the regulated water charges annual review process under r.34 of the WCIR. The ACCC’s draft decision in respect of the application of the 20 years moving average for 2015–16 to 2016–17 will be implemented at the time of the relevant annual review.
546 ACCC, Pricing principles for price approvals and determinations under the Water Charge (Infrastructure) Rules 2010, July 2011, section 3.13, p.53.
547 Ibid, p.53.548 Ibid, p.54.
ACCC Draft decision on State Water Pricing Application: 2014-15 – 2016-17 | Attachments 182

The reasoning for the ACCC’s draft decision is set out in section 7.4 below.
The forecast water extractions approved in this draft decision represent a decrease of four per cent relative to 2010 IPART approved forecasts (Table 7-3).
The ACCC’s draft decision on extraction forecasts for the regulatory year 2014–15 and the forecast entitlement volumes for the regulatory period by valley are set out in Table 7-1 to Table 7-4.
Table 7-1 Forecast water entitlement volumes—ACCC draft decision by valley for 2014–17
Valley High security entitlements (ML)
General security entitlements (ML)
Supplementary entitlements (ML)
Border 3,122.0 263,238.0
Gwydir 21,457.9 509,665.0
Namoi 8,881.0 256,076.0
Peel 17,382.0
30,528.0
Lachlan 60,745.0 632,837.0
Macquarie 42,606.0 631,716.0
Murray 261,400.7 2,075,822.0
Murrumbidgee 436,928.0 2,260,133.0
Lowbidgee - - 747,000.0
Source: State Water, Pricing application to the ACCC, June 2013, p. 147.
Table 7-2 Forecast MAQ—ACCC draft decision for Fish River 2014–17
Customer MAQ (ML)
Delta electricity 8,184
Sydney Catchment Authority
3,650
Oberon Council 1064
Minor customers* 200*
Lithgow Council 1778
Note: * 200 kL per customerSource: State Water, Pricing application to the ACCC, June 2013, p.148 and, New South Wales Office of Water (NOW), (Miller,
D), Fish River water supply scheme: Water sharing arrangements, 2012, section 4.2.
183 ACCC Draft decision on State Water Pricing Application: 2014-15 – 2016-17 | Attachments

Table 7-3 Forecast water extractions—ACCC draft decision for 2014–15 versus IPART approved 2010 by valley
Valley ACCC draft decision (ML)
IPART approved 2010 Percentage change
Border 140,677 148,535 -5%
Gwydir 245,877 247,734 -1%
Namoi 158,961 165,558 -4%
Peel 11,164 13,052 -14%
Lachlan 227,697 258,319 -12%
Macquarie 279,671 300,832 -7%
Murray 1,459,689 1,541,376 -5%
Murrumbidgee 1,759,740 1,805,846 -3%
Total 4,283,475 4,481,252 -4%
Source: State Water, Pricing application to the ACCC, June 2013, and State Water’s response to the ACCC’s information request 16.
Table 7-4 Forecast water extractions—ACCC draft decision for Fish River 2014-15 Valley MAQ (ML)
Raw Water
Delta electricity 6,190
Sydney Catchment Authority 2,412
Oberon Council 717
Minor customers 52
Filtered water
Lithgow council 986
Minor customers 132
Source: State Water, Pricing application to the ACCC, June 2013 and State Water’s response to the ACCC’s information request 16
7.2 State Water's proposalThe forecasts proposed by State Water have two components: forecasts of water entitlement volumes and forecasts of water extractions in each valley.
7.2.1 Forecast water entitlement volumesState Water’s proposed forecasts of water entitlements volume for the next regulatory period are set out in Table 7-5 and Table 7-6.
ACCC Draft decision on State Water Pricing Application: 2014-15 – 2016-17 | Attachments 184

Table 7-5 Forecast water entitlement volumes—State Water proposal by valley for 2014–17
Valley High security entitlements
General security entitlements
Supplementary entitlements
Border 3,122 263,238
Gwydir 21,458 509,665
Namoi 8,881 256,076
Peel 17,382 30,528
Lachlan 60,745 632,837
Macquarie 42,606 631,716
Murrumbidgee 436,928 2,260,133
Murray 261,401 2,075,822
Lowbidgee - - 747,000
Source: State Water pricing application, p.147.
Table 7-6 Forecast MAQ—State Water proposal for Fish river 2014–17
Customer MAQ (ML)
Delta electricity 8,184
Sydney Catchment Authority
3,650
Oberon Council549 750
Minor customers* 200*
Lithgow Council550 2,092
Source: State Water pricing application, p.148.
7.2.2 Forecast water extractionsState Water has proposed forecast water extractions for each valley it services based on a 20 year moving average of actual past water extractions in the valley.551 Under this approach State Water has provided forecasts for the first year of the regulatory period (2014–15). State Water stated that forecast water extractions for 2015–16 will be based on extraction data for the years 1995–96 to 2014–15.552 Forecast water extractions for 2016–17 will be based on extraction data for the years 1996–97 to 2015–16.553 Table 7-7 sets out State Water’s proposed forecasts of water extractions by valley for the regulatory year 2014–15 and actual extractions for 20 years to 2013–14.
549 New South Wales Office of Water , Fisher River Water Supply Scheme – Review of water sharing plan, 2012, p.4 http://www.water.nsw.gov.au/view.aspx?ArticleID=568&cx=013747903361892052062:ilsox0kpjyq&cof=FORID:10&ie=UTF-8&q=fish+river+water+sharing+plan&sa=Search (accessed on 14 February 2014)
550 Ibid, p.4 http://www.water.nsw.gov.au/view.aspx?ArticleID=568&cx=013747903361892052062:ilsox0kpjyq&cof=FORID:10&ie=UTF-8&q=fish+river+water+sharing+plan&sa=Search (accessed on 14 February 2014)
551 For the first 2 years of the 20 year moving average, IQQM data is used.552 State Water, Pricing application to the Australian Competition and Consumer Commission for regulated charges to
apply from 1 July 2014, June 2013, p.144.553 Ibid, p.144.
185 ACCC Draft decision on State Water Pricing Application: 2014-15 – 2016-17 | Attachments
For Fish River, State Water’s proposed forecast water extractions by customer type for 2014–15 are set out in Table 7-8. This table also shows actual extractions over 20 years to 2013–14.
State Water’s proposed forecasting approach differs from that approved by IPART in its 2010 determination. In the 2010 determination, water extraction forecasts were based on a 20 average of past water extractions at the time of the determination for each valley.554
554 IPART’s final report on the 2010 State Water determination refers to a 20 year moving average as the methodology for forecasting water extractions. However, the examination of approved water extraction forecasts indicates a 20 year simple average of past extractions was used. For more details, see: IPART, Review of bulk water charges for State Water Corporation, 1 July 2010 to 30 June 2014 – Final report, June 2010, pp.122–131.
ACCC Draft decision on State Water Pricing Application: 2014-15 – 2016-17 | Attachments 186

Table 7-7 Water extractions by valley—State Water: actual (1994-2013) and forecast (2014-15)* FY ending Border Gwydir Namoi Peel Lachlan Macquarie Murray Murrumbidgee Total1994
68,087 98,863 122,249 9,980 284,975 514,616 1,826,143 2,087,709 5,012,6221995
63,884 45,181 39,636 11,916 389,862 167,020 2,135,851 2,565,241 5,418,5911996
139,403 178,003 97,586 5,942 385,000 199,100 2,033,593 2,159,000 5,197,6271997
169,812 394,616 198,965 5,641 436,000 348,937 2,372,284 2,611,000 6,537,2551998
187,883 454,913 323,274 16,020 414,000 403,989 1,972,013 2,442,000 6,214,0921999
164,331 374,762 216,487 5,561 278,000 336,071 2,063,827 2,119,000 5,558,0402000
180,863 417,837 246,478 7,309 285,000 385,748 1,252,922 1,713,000 4,489,1572001
231,793 425,315 248,842 10,241 407,000 464,188 2,224,902 2,198,000 6,210,2812002
182,622 443,145 280,340 14,671 439,572 545,664 2,076,048 2,254,000 6,236,0622003
123,803 278,986 236,853 21,805 237,252 375,914 969,209 1,730,000 3,973,8232004
100,542 159,250 80,653 13,325 43,510 174,168 1,306,721 1,655,000 3,533,1692005
107,564 154,840 96,650 15,165 21,165 63,784 1,244,515 1,533,411 3,237,0932006
134,417 218,496 141,325 14,753 112,436 180,723 1,644,734 1,942,641 4,389,5262007
131,934 129,467 66,559 9,718 57,260 204,745 559,115 934,075 2,092,8722008
112,269 79,132 51,212 9,080 30,777 30,867 226,153 471,430 1,010,9192009
117,688 143,199 97,482 10,183 27,798 65,439 301,558 568,580 1,331,9272010
100,850 46,959 75,152 17,517 11,787 73,820 414,880 822,914 1,563,8792011
163,725 245,148 149,958 6,915 85,699 203,146 773,243 1,279,759 2,907,5932012
134,200 200,724 128,272 4,219 212,769 296,618 1,670,161 1,738,426 4,385,3882013
197,869 428,699 281,247 13,317 394,082 558,856 2,125,907 2,369,613 6,369,5902014*
148,535 247,734 165,558 13,052 258,319 300,832 1,541,376 1,805,846 4,481,2522015**
140,677 245,877 158,961 11,164 227,697 279,671 1,459,689 1,759,740 4,283,475Note: Data for 1993 to 1995 FY are based on the Integrated Quantity and Quality Models (IQQM)
187 ACCC Draft decision on State Water Pricing Application: 2014-15 – 2016-17 | Attachments

* Forecast determined by IPART in 2010; **State Water’s proposed forecast = average over 20 years (1994 to 2013) Source:State Water pricing application and State Water response to the ACCC’s information request 16.
Table 7-8 Water extraction for Fish River—State Water: actual (1994-2013) and forecast (2014-15)Raw Water Filtered Water
FY ending Delta Electricity Sydney Catchment Authority
Oberon Council Minor customers Lithgow Council Minor customers Total
19945,201 3,736 704 117 2,088 301 12,147
19956,281 3,293 596 43 1,480 110 11,803
19967,662 3,215 622 45 1,138 116 12,799
19977,451 3,650 734 72 1,098 186 13,192
19987,243 3,003 827 54 970 138 12,235
19997,204 3,317 855 48 898 123 12,445
20007,294 3,468 767 50 858 129 12,566
20018,137 3,779 969 50 927 129 13,991
20028,359 3,677 838 50 1,019 129 14,073
20038,303 4,390 911 66 1,183 170 15,024
20046,734 3,005 732 60 968 155 11,655
20054,960 1,878 677 45 735 116 8,412
20066,367 2,098 725 64 959 164 10,377
20076,590 3,115 749 47 795 112 11,408
20084,367 1,077 601 40 747 110 6,942
20093,597 250 583 42 748 104 5,323
20103,824 0 591 40 747 88 5,291
20114,248 224 618 30 764 97 5,981
20124,112 43 658 36 755 92 5,696
ACCC Draft decision on State Water Pricing Application: 2014-15 – 2016-17 | Attachments 188

20135,864 1,014 585 41 833 65 8,402
2014*6,620 3,001 742 58 1,049 151 11,621
2015**6,190 2,412 717 52 986 132 10,488
*Forecast determined by IPART in 2010; ** State Water’s proposed forecast = average over 20 years ((1994 to 2013).Source: State Water submission – response to the ACCC’s information request 16.
189 ACCC Draft decision on State Water Pricing Application: 2014-15 – 2016-17 | Attachments

7.3 Assessment approachUnder clause 11 of schedule 1 of the WCIR, an application for approval or determination of regulated charges by a Part 6 operator must include the following details on demand or consumption:
actual demand or consumption for the regulatory period set to expire
forecast demand or consumption for the following regulatory period, including:
a description of the methodology used to forecast demand or consumption
assumptions on which the forecasts are based
consistency with historical data.
The pricing principles set out the criteria for assessing a Part 6 operator’s demand/consumption forecasts.555 In particular, the ACCC is to assess whether demand/consumption forecasts:556
are based on appropriate forecasting methodology
are based on reasonable assumptions about the key drivers of demand, including:
supply restrictions
environmental conditions, including inflows and the availability of water
commodities, including the treatment of water as a derived demand
any elasticity assumptions
demographic impacts, where appropriate.
utilise the best available information, including historical data that can identify trends in demand
take account of current demand and economic conditions.
In applying the above criteria to the proposed forecast demand/consumption, the ACCC focused on two key considerations:
the appropriateness of the forecasting methodology – this involves considering how the demand forecast has been developed and whether all relevant factors have been taken into account; and
the application of the forecasting methodology – this involves considering the accuracy of data and assumptions made on each of the input parameters.
The ACCC reviewed the data used to implement the forecasting methodology proposed by State Water. In doing this, the ACCC also had regard to recent trends in water extraction relative to expectations at the time the forecasts for the regulatory year 2014–15 were made. For this purpose, the ACCC compared actual system performance (water extraction by valley) during the 2010–14 regulatory period with forecast demand for the same period.
In making its draft decision, the ACCC relied on:
State Water’s pricing application557
555 ACCC, Pricing principles for price approvals and determinations under the Water Charge (Infrastructure) Rules 2010, July 2011, section 3.13, p. 54.
556 Ibid, p. 54.557 State Water, Pricing application to the Australian Competition and Consumer Commission for regulated charges to
apply from 1 July 2014, June 2013, chapters 13 and 14.
ACCC Draft decision on State Water Pricing Application: 2014-15 – 2016-17 | Attachments 190

information provided by State Water as part of its pricing application; specifically, the pricing model and the regulatory information template (RIT)
additional information provided by State Water in response to the ACCC's information requests; and
public submissions received in response to the pricing application.558
7.4 Reasons for draft decisionThe ACCC approves State Water’s proposed forecast water extractions for 2014–15 and forecast entitlement volumes for all the valleys over the next regulatory period, except for Fish River. The ACCC considers these forecasts satisfy the criteria for assessment set out in the ACCC’s pricing principles.
For Fish River, the ACCC approves State Water’s proposed forecast water extractions for 2014–15. However, it does not approve the proposed forecast MAQ because State Water’s proposal did not incorporate the updated MAQ as defined in the current Water Sharing Plan (WSP) for Fish River. The ACCC considers State Water’s proposal for Fish River is not consistent with the pricing principles, which require that forecasts be based on the best information available.559 The ACCC’s draft decision is set out in Table 7-1 to Table 7-4. The following sections set out the reasons for the ACCC’s draft decision on forecast entitlement volumes and water extractions.
7.4.1 Forecast entitlement volumesWith the exception of Fish River, customers of State Water across all valleys hold different types of water entitlements (that is, mainly high security and general security). These entitlements give customers access to a share of the water resource. The volume of entitlements is influenced by the issuing of access licences, which is governed by the NSW Water Management Act 2000 (WMA). Under, the NSW WMA, access licences are issued by the NSW Minister for water.560
State Water submitted that water entitlements are issued by the NSW Office of Water (NOW) on behalf of the Minister.561 These volumes have remained relatively stable over time (Figure 7-1). This can be shown by comparing approved entitlement volumes in IPART’s 2010 price determination with those proposed by State Water for the next regulatory period. IPART made a similar observation about the previous regulatory period in its 2010 price determination.562 The volume of entitlements is determined through the process of issuing access licences. The ACCC understands that entitlement volumes determined by NOW may change as a result of the NSW metering project and other water efficiency projects. If this occurs over the next regulatory period, State Water should provide revised forecasts at the time of the relevant annual review.
On this basis, the ACCC approves the forecast entitlement volumes by valley for the 2014–17 regulatory period as proposed by State Water (Table 7-1). However, State Water will be required to
558 The ACCC received five submissions on forecast demand/consumption from: Stan Carberry & Sons (Cardale), Macquarie River Food and Fibre, Lachlan Valley Water Inc., Murray irrigation LTD, New South Wales Irrigator’s Council. These are available on the ACCC website: http://www.accc.gov.au/regulated-infrastructure/water/state-waters-regulated-charges-2014-17-review/information-paper .
559 ACCC, Pricing Principles for price approval and determinations under the Water Charge (Infrastructure) Rules 2010, July 2010, p. 54.
560 NSW Water management Act 2000, Division 2http://www.legislation.nsw.gov.au/viewtop/inforce/act+92+2000+FIRST+0+N/.
561 State Water, Pricing application to the Australian Competition and Consumer Commission for regulated charges to apply from 1 July 2014, June 2013, p.147.
562 IPART, Bulk Water Prices for State Water Corporation and Water Administration Ministerial Corporation Water from 1 July 2010 to 30 June 2014 – Final report, June 2010, p.123.
191 ACCC Draft decision on State Water Pricing Application: 2014-15 – 2016-17 | Attachments

provide updated forecasts at the time of the annual review. These updates will capture changes in entitlement volumes as determined by NOW.
Figure 7-1 Water entitlement volumes—State Water proposal versus IPART 2010 approved
Source: IPART, 2010 determination–Final report, p.120 and State Water pricing application, p. 147.
Source: IPART, 2010 determination–Final report, p.120 and State Water pricing application, p. 147.
ACCC Draft decision on State Water Pricing Application: 2014-15 – 2016-17 | Attachments 192

Fish River
The Fish River Water Supply Scheme (the scheme) supplies water to Oberon and Lithgow Councils and Sydney Catchment Authority for town water supplies. The scheme also supplies water to Delta Electricity for power station operation at Wallerawang and Mount Piper (major customers). 563 In addition, it supplies water for domestic (and some stock) purposes to approximately 300 ‘minor customers’.564 The scheme provides two separate water supply systems: a raw water system (not suitable for drinking) and a filtered water supply system.
The licence entitlement for the scheme is issued to State Water under the NSW Water Act 1912. Customers are assigned a share in the form of a MAQ as part of the water sharing plan for Fish River under the NSW WMA. State Water submitted that over the next regulatory period, the MAQ will define the maximum volume of water that can be extracted by each of the major customers. 565 This cannot be exceeded except under specific conditions (for example, carry over).566
The ACCC reviewed the current water sharing plan for Fish River to check whether the MAQ proposed by State Water for its customers reflect that of the water sharing plan. 567 The ACCC found that the proposed MAQ for two groups of customers are not consistent with the current water sharing plan. The ACCC consider that MAQ for each customer group stated in the current water sharing plan for Fish River constitute the best available information on the MAQ to take into account for the purpose of forecasting volumes over the next regulatory period.568
Table 7-9 shows the MAQ as proposed by State Water, the MAQ as stated in the current water sharing plan and the ACCC draft decision.
Table 7-9: MAQ for Fish River—ACCC draft decision versus State Water proposal 2014–17
Customer Proposed MAQ WSP MAQ ACCC draft decision MAQ
Delta electricity 8,184 8,184 8,184
Sydney Catchment Authority
3,650 3,650 3,650
Oberon Council 750 1064 1064
Minor customers* 200* 200* 200*
Lithgow Council 2092 1778 1778
Source: State Water pricing application, p.148; New South Wales Office of Wather, (Miller, D), Fish River water supply scheme: Water sharing arrangements, 2012, section 4.2.
563 Delta Electricity is now owned by Energy Australia. For more details, see Energy Australia submission on State Water price application: http://www.accc.gov.au/regulated-infrastructure/water/state-waters-regulated-charges-2014-17-review/information-paper.
564 State Water, Pricing application to the Australian Competition and Consumer Commission for regulated charges to apply from 1 July 2014, RIT, June 2013, p.147.
565 Ibid, p.147.566 Carry over provisions allow for some of the account water to be carried over from one water year to the next. Some
valleys have a maximum amount that can be carried over from one water year to the next water year. In continuous accounting systems, there is no resetting of account balances and the account balance continues from year to year.
567 New South Wales Office of Water, (Miller, D), Fish River water supply scheme: Water sharing arrangements, 2012, section 4.2.
568 ACCC, Pricing principles for price approvals and determinations under the Water Charge (Infrastructure) Rules 2010, July 2011, section 3.13, p. 54.
193 ACCC Draft decision on State Water Pricing Application: 2014-15 – 2016-17 | Attachments

7.4.2 Forecast water extractionsState Water proposed a 20 year moving average as its approach for forecasting water extractions over the next regulatory period.569 There is a key difference between this proposed approach and that which was approved by IPART for the 2010–14 price determination. Under the proposed 20 year moving average approach, forecast water extractions will be calculated prior to each year of the next regulatory period. Thus, forecast water extractions will be updated each year to reflect the most recent actual water extractions. Therefore, the forecasts for each year of the regulatory period are likely to be marginally different from the previous year.570
Under rule 34(1) of the WICR, State Water must apply to the ACCC for approval or determination of its regulated charges in respect of the second year and each subsequent year of the regulatory period. Further, State Water must include in its application (among other things) the following:
forecast of demand for, or consumption of, infrastructure services for the year to which the application relates
the estimate of demand or consumption during the current year
information about how the forecast and estimate were calculated.571
The ACCC received six submissions on State Water’s proposed forecasts of water extractions and entitlement volumes.572 These submissions generally opposed State Water’s proposed 20 year moving average. Instead they favoured a return to the use of a long run average approach to forecasting water extractions, which was determined by IPART prior to its 2010 pricing determination for State Water. This long run average approach is based on outputs from the Integrated Quantity and Quality Model (IQQM) which was developed in the mid-1990s by the then NSW Department of Land and Water Conservation (DLWC).
The following discusses the appropriateness of State Water’s proposed forecast methodology and its application for generating forecast water extractions in the next regulatory period.
Appropriateness of forecasting methodology
This section discusses the appropriateness of the IQQM approach raised in submissions. It also discusses the appropriateness of the 20 year moving average proposed by State Water.
Long run average approach based on outputs from the IQQM
In submissions, stakeholders’ support for a return to the IQQM approach was based on the following reasons:
569 State Water, Pricing application to the Australian Competition and Consumer Commission for regulated charges to apply from 1 July 2014, June 2013, pp.143–144.
570 Under the simple 20 year average approved by IPART in the 2010 price determination, forecast water extraction were determined by averaging 20 year actual water extraction at the time of the determination – the forecasts remained constant over the regulatory period.
571 WCIR, r.34(2)(a)-(c).572 Submissions received include: Stan Carberry & Sons (Cardale), Macquarie River Food and Fibre, Lachlan Valley
Water Inc., Murray irrigation LTD, New South Wales Irrigator’s Council, Gwydir Valley Irrigators Association. These are available on the ACCC’s website: http://www.accc.gov.au/regulated-infrastructure/water/state-waters-regulated-charges-2014-17-review/information-paper.
ACCC Draft decision on State Water Pricing Application: 2014-15 – 2016-17 | Attachments 194

it is a primary water management and policy tool for NSW and forms the basis for regulated river Water Sharing Plans (WSPs) 573
it is the most robustly constructed and tested water availability model574
it fairly accounts for volatility, while providing long term certainty575
it matches water availability with the natural business cycles that depend on water.576
The IQQM was developed as a water management tool to evaluate the long term impacts of various water management regimes.577 It is a hydrological model which measures water availability in a system, and enables the modelling (estimation) of water extraction levels over a series of years (over 100). The IQQM predicts how a water system will operate given inputs such as rainfall and gauged flows. Forecasts of the level of development (irrigation and urban extraction drivers) and extraction regulation (for example, water sharing plans) are then applied to that framework to develop scenarios.
A key consideration for forecasting water extractions using the IQQM approach is that any impact of structural change will be accounted for with a substantial lag. This is because the forecasts of water extraction for a particular regulatory year are calculated as the average of modelled water extractions over more than 100 years. In terms of the performance of the model in the previous regulatory period, a chart showing forecasts versus actual water extractions is set out in Figure 7-2.
In its 2010 price determination, IPART assessed State Water’s actual water extractions for the 2006–10 regulatory period. IPART found this represented only 28 per cent of forecast water extractions and concluded:578
Our view is that the long run average approach to water extraction forecasting has failed over the course of the 2006 determination period and that a new approach is required.
573 Submission by: Gwydir Valley irrigator Association (p.17), Stan Carberry & Sons (Cardale).574 Submission by: Gwydir Valley irrigator Association (p.17).575 Submission by: Gwydir Valley irrigator Association (p.17), Murray Irrigation Limited, Lachlan Valley Water Inc, Stan
Carberry & Sons (Cardale).576 Submission by: Gwydir Valley irrigator Association (p.17), Stan Carberry & Sons (Cardale).577 Centre for International Economics, Review of consumption forecasts: Analysis to support 2006 bulk water price
determination – report prepared for Independent Pricing and Regulatory Tribunal of NSW, February 2006.578 IPART, Review of bulk water charges for State Water Corporation from 1 July 2010 to 30 June 2014 – Final report,
June 2010, IPART, Bulk Water Prices for State Water Corporation and Water Administration Ministerial Corporation Water from 1 October 2006 to 30 June 2006 – Final report, September 2006, p.121.
195 ACCC Draft decision on State Water Pricing Application: 2014-15 – 2016-17 | Attachments

Figure 7-2: Water extractions—actual versus IPART approved 2006–07 to 2009–10
Source: State Water data
The ACCC considers IPART reasonably analysed the relevance of the IQQM as a forecasting tool for water extraction. IPART performed this analysis for the purpose of determining regulated charges during the 2006 and 2010 price determinations.579 Analysis by IPART and its consultant (the Centre for International Economics (CIE)) concluded:
Forecast water extractions determined using the IQQM approach were approved in the absence of a better alternative at the time given data and information available.580
The IQQM is not appropriate for forecasting water extraction in the short run (the length of a regulatory period).581
The ACCC does not consider it reasonable to return to the IQQM approach to forecast water extraction for the next regulatory period. This is despite having had regard to the historical use of the IQQM approach, and the submissions which suggested re-adopting the IQQM approach. The ACCC’s reasons for approving the 20 year moving average approach are further discussed below.
579 IPART, Review of bulk water charges for State Water Corporation from 1 July 2010 to 30 June 2014 – Final report, June 2010, chapter 9; CIE, Review of consumption forecasts: Analysis to support 2006 bulk water price determination – report prepared for Independent Pricing and Regulatory Tribunal of NSW, February 2006, pp.1–27; and Centre for International Economics, State Water consumption forecasts for the 2010 pricing determination – report prepared for State Water Corporation, June 2010, chapter 3.
580 Centre for International Economics, Review of consumption forecasts: Analysis to support 2006 bulk water price determination – report prepared for Independent Pricing and Regulatory Tribunal of NSW, February 2006, pp.5–6; IPART, Bulk Water Prices for State Water Corporation and Water Administration Ministerial Corporation Water from 1 October 2006 to 30 June 2010 – Final report, September 2006, pp. 96–99.
581 IPART, Review of bulk water charges for State Water Corporation from 1 July 2010 to 30 June 2014 – Final report, June 2010, P.122; Centre for International Economics, Review of consumption forecasts: Analysis to support 2006 bulk water price determination – report prepared for Independent Pricing and Regulatory Tribunal of NSW, February 2006, pp.1–27; Centre for International Economics, State Water consumption forecasts for the 2010 pricing determination – report prepared for State Water Corporation, June 2010, chapter 3.
ACCC Draft decision on State Water Pricing Application: 2014-15 – 2016-17 | Attachments 196

Moving average forecasting methodology
The moving average approach proposed by State Water is comparable to the approach approved by IPART in the 2010 price determination. That is, both approaches assume that future water extractions reflect past usage. In the 2010 price determination, for each valley, IPART approved forecast water extractions based on a 20 year average. IPART used actual water extractions where the average was calculated on data series up to the time of the determination. The resulting forecast was then applied to each year of the current regulatory period. In approving this forecasting methodology, IPART considered that the approach:582
Focused on more recent information and reflects current extraction conditions.
Was relatively easy to identify and verify because it uses actual extractions for each valley.
Would allow State Water to better recover its revenue, with a lag. This is because the actual extractions that occur over the 2010 determination will be used to calculate prices at the next price review.
Relied on actual extractions (where possible) rather than modelled data from the IQQM. Therefore, it does not rely on having to update the IQQM at the commencement of each regulatory period (at the time the 2010 Determination was drafted, the most recent version of the IQQM model was last updated in 2005).
Figure 7-3 shows that, for the 2010–14 regulatory period, the 20 year average forecast approach has been a better predictor of actual outcomes compared to the IQQM approach. For each valley, Figure 7-4 shows how actual water extractions compare with the IPART approved forecasts.
Figure 7-3: Water extractions— actual versus IPART approved 2010–11 to 2013–14*
* Estimate for 2013–14Source: State Water pricing application to the ACCC, RIT and IPART final decision 2010.
582 IPART, Review of bulk water charges for State Water Corporation from 1 July 2010 to 30 June 2014 – Final report, June 2010, p.122.
197 ACCC Draft decision on State Water Pricing Application: 2014-15 – 2016-17 | Attachments

Figure 7-4: Forecast water extractions—ACCC draft decision and IPART approved by valley from 2006–07 to 2014–15
0
50
100
150
200
250
2006-07 2007-08 2008-09 2009-10 2010-11 2011-12 2012-13 2013-14 2014-15
Giga
litre
s
Border Valley
Actual water extractions Allowed
2006-2010 Regulatory period 2010-2014 Regulatory period 2014-2017 20
year moving
Source: State Water pricing application to the ACCC, RIT; IPART final decision 2006 and IPART final decision 2010.
0
50
100
150
200
250
300
350
400
450
500
2006-07 2007-08 2008-09 2009-10 2010-11 2011-12 2012-13 2013-14 2014-15
Giga
litre
s
Gwydir Valley
Actual water extractions Forecast water extractions
2006-2010 Regulatory period IQQM approved by IPART
2010-14 Regulatory period20 year average approved by IPART
2014-17 Regulatory period 20year moving average approved by ACCC
Source: State Water pricing application to the ACCC, RIT; IPART final decision 2006 and IPART final decision 2010.
ACCC Draft decision on State Water Pricing Application: 2014-15 – 2016-17 | Attachments 198

0
2
4
6
8
10
12
14
16
18
20
2006-07 2007-08 2008-09 2009-10 2010-11 2011-12 2012-13 2013-14 2014-15
Giga
litre
sPeel Valley
Actual water extractions Forecast water extractions
2006-2010 Regulatory periodIQQM approved by IPART
2010-14 Regulatory period 20 year average approved by
IPART
2014-17 Regulatory period20 year moving average approved by ACCC
Source: State Water pricing application to the ACCC, RIT; IPART final decision 2006 and IPART final decision 2010.
0
50
100
150
200
250
300
350
400
450
2006-07 2007-08 2008-09 2009-10 2010-11 2011-12 2012-13 2013-14 2014-15
Giga
litre
s
Lachlan Valley
Actual water extractions Forecast water extractions
2006-2010 Regulatory period IQQM approved by IPART
2010-2014 Regulatory period 20 year average approved by IPART
2014-17 Regulatoryperiod 20 year moving average approved by ACCC
Source: State Water pricing application to the ACCC, RIT; IPART final decision 2006 and IPART final decision 2010.
199 ACCC Draft decision on State Water Pricing Application: 2014-15 – 2016-17 | Attachments

0
200
400
600
800
1000
1200
1400
1600
1800
2000
2006-07 2007-08 2008-09 2009-10 2010-11 2011-12 2012-13 2013-14 2014-15
Giga
litre
sMurray Valley
Actual water extractions Forecast water extractions
2006-2010 Regulatory period IQQM approved by IPART
2010-2014 Regulatory period 20 year average approved by IPART
2014-17 Regulatory period 20 year moving average approved by ACCC
Source: State Water pricing application to the ACCC, RIT; IPART final decision 2006 and IPART final decision 2010.
The ACCC considers that the volume of water extracted in a given year depends on the demand for water throughout the year and the water availability at different points in the year. By relying on recent actual water extractions, the proposed moving average approach captures the key drivers of demand most likely to affect water extractions during the next period. This includes recent environmental, demographic and economic conditions.583 In addition, by forecasting one year at a time, the proposed approach ensures that recent changes in these conditions are accounted for. The ACCC therefore considers the moving average approach proposed by State Water to be an appropriate methodology to forecast water extractions for all the valleys in the next regulatory period. The ACCC acknowledges that the current 20 years of extraction data includes drought years and that this may result in a lower forecast. However, the ACCC also considered analysis by IPART in 2010 which showed that there is evidence to suggest a structural break in water extractions for most valleys.584 The ACCC considers that a 20 year moving average is better able to capture such effects.
If the recent drought years bias the forecast in State Water’s favour, such that the forecast is too low compared to actual extractions, and prices are higher (than if the forecasts was higher), the ACCC notes that the ‘unders’ and ‘overs’ account (discussed in Attachment 10 of this draft decision) will capture this and prices will be adjusted downward in subsequent years.
Application of forecasting methodology
As noted earlier, the key difference between the applications of these approaches is that under the proposed 20 year moving average approach, forecast water extractions will be calculated prior to each year of the next regulatory period. That is, forecasts water extraction will be updated each year to reflect the most recent actual water extractions, making it likely that the forecasts for each year of the regulatory period will be marginally different from the previous year.585
583 ACCC, Pricing principles for price approvals and determinations under the Water Charge (Infrastructure) Rules 2010, July 2011, section 3.13, p. 54.
584 IPART, Review of bulk water charges for State Water Corporation from 1 July 2010 to 30 June 2014 – Final report, June 2010, pp.128–129.
585 Under the simple 20 year average approved by IPART in the 2010 price determination, water extraction forecasts were determined by averaging 20 year actual water extraction at the time of the determination – the forecasts remained constant over the regulatory period.
ACCC Draft decision on State Water Pricing Application: 2014-15 – 2016-17 | Attachments 200

By updating forecast water extraction each year, the proposed 20 year moving average effectively reduces the forecast horizon to one year, compared to the entire regulatory period under the approach approved by IPART in 2010. It is generally acknowledged in the forecasting literature that the longer the forecast horizon, the less accurate the forecast will be.586 In this regard, the proposed 20 moving average is an improvement on the approach that applies to the current regulatory period.
Two submissions to the ACCC specifically commented on the moving average approach proposed by State Water. These broadly stating that it increases uncertainty for customers. Murray Irrigation Ltd (MIL) submitted that it does not support State Water’s proposal because it leads to annual price variation.587 The New South Wales Irrigators Council (NSWIC) submitted that the use of a 20-year moving average means that consumption figures are continuously updated in each year of the regulatory period. NSWIC submitted that this would increase uncertainty regarding future price adjustments.588
In response to these submissions, the ACCC considered whether the application of the 20 moving average approach is a reasonable approach to forecast water extractions. The ACCC has made the following observations:
Given the natural unpredictability of rainfall, any approach to forecasting water availability and extraction is likely to result in under or over estimation in a given year. However, some methods relative to others may minimise the magnitude of this occurring. This is:
demonstrated by comparing the outcomes of the 20 year average relative to the IQQM approach
likely to be true for the proposed 20 year moving average in that it shortens the forecast horizon.
The moving average approach as proposed by State Water will rely on actual extractions over an averaging period of 20 years. The reliance on actual water extraction levels to derive forecasts has some strengths and weaknesses. In terms of strengths, under the proposed approach, forecasts:
Are calculated annually at the time when the latest actual water extraction levels are known. This process ensures that recent climatic conditions, storage levels and usage are accounted for in each forecast. This is consistent with the pricing principles criteria for assessing demand forecasts;
Are relatively easy to identify and verify (with the approach easy to administer).
Are consistent with the requirement of r.34 of the WCIR and in a transparent manner.589
In terms of weaknesses the proposed approach may:
Result in yearly fluctuations in forecast water extractions, which would be translated into price variations. However, the yearly fluctuations would be small given that only one data point will be changed each year. The ACCC has determined a form of price control that we expect will protect State Water’s customers from unreasonable price volatility. We expect this will also provide State Water with a more stable revenue stream than would otherwise be the case (see Attachment 10 of this draft decision).
Be biased in a period characterised by substantial changes in water management rules. This could include, for example, substantial variation to Water Sharing Plans (WSPs). Changes in the
586 Greene, W. H., Econometric analysis, 2000, chapter 7.587 Murray Irrigation Limited, Submission to the ACCC: State Water Corporation pricing application, September 2013, p.
7. 588 New South Wales Irrigators Council, Submission to the ACCC: State Water Corporation pricing application,
September 2013, p. 51.589 Rule 34 of the WCIR makes provision for annual review for regulated charges.
201 ACCC Draft decision on State Water Pricing Application: 2014-15 – 2016-17 | Attachments

rules can affect total diversions and the ratio of high security water entitlements relative to general security water entitlements. However, this bias is likely to be limited over the next regulatory period given that:
The issuing of new water access entitlement is currently suspended by the NSW government.
The ability for entitlement holders to convert general security water entitlements into high security water entitlements has also been suspended by the NSW government.
Further consideration of the application of the 20 year moving average approach
Water extraction forecasts proposed by State Water for the first year (2014–15) of the next regulatory period are set out in Table 7-3 and Table 7-4.
These forecasts are based on actual data for the years 1993–94 to 2012–13. State Water submitted that the application of the proposed 20 year moving average forecasting methodology implies that forecast water extractions for 2015–16 will be based on data for the years 1995–96 to 2014–15. Also, State Water submitted that the forecasts for 2016–17 will be based on extraction data for the years 1996–97 to 2015–16 and so on.590 State Water added that it will provide forecast water extractions annually for subsequent regulatory years. This is when water extraction data required to produce these forecasts become available.591
The ACCC considers that State Water’s application of the 20 year moving average approach to derive forecast water extractions for 2015–16 and 2016–17 is different from that which State Water used to derive forecasts for 2014–15. This is because State Water’s proposal will omit one regulatory year’s worth of data. For example, the 20 year period starts at 1995–96 and ends at 2014–15 when it should be 1994–95 to 2013–14. The ACCC notes that actual water extractions for 2014–15 will not be available at the time of 2015–16 annual price review. The ACCC considers that forecasts for 2015–16 and 2016–17 should be based on data for 1994–95 to 2013–14 and 1995–96 to 2014–15, respectively (Table 7-10). This is desirable because in each case, actual data for the last year of the series will be available at the time of the annual review. This is consistent with the pricing principles, which require that a forecasting approach utilise the best information available.592
For this reason, the ACCC does not approve the application of the 20 year moving average proposed by State Water. The ACCC’s draft decision is set out in Table 7-10. The ACCC notes that this decision will be implemented when annual forecasts are submitted.
Table 7-10 Actual water extraction data series—ACCC draft decision versus State Water proposal on the derivation of forecast water extractions for 2014–17
Forecast year Proposed actual data series from which to derive a 20 year average
ACCC’s draft decision actual data series from which to derive a 20 year average
First regulatory year : 2014–15
1993–94 to 2012–13 1993–94 to 2012–13
Second regulatory year : 2015–16
1995–96 to 2014–15 1994–95 to 2013–14
Third regulatory year : 2016–17
1996–97 to 2015–16 1995–96 to 2014–15
Source: State Water Submission, p. 144 and ACCC analysis
590 State Water, Pricing application to the Australian Competition and Consumer Commission for regulated charges to apply from 1 July 2014, June 2013, p.144.
591 Ibid, p.144.592 ACCC, Pricing Principles for price approval and determinations under the Water Charge (Infrastructure) Rules 2010,
July 2010, p. 54.
ACCC Draft decision on State Water Pricing Application: 2014-15 – 2016-17 | Attachments 202

In summary, based on the above reasons, the ACCC’s draft decision is to approve the 20 year moving average as the forecasting approach for water extractions over the next regulatory period in all valleys serviced by State Water. However, the ACCC does not approved State Water’s proposed application of that forecasting approach. Table 7-10 sets out the ACCC’s draft decision to the application of the 20 year moving average approach over the next regulatory period.
7.4.3 Peel ValleyIn its pricing application, State Water’s proposed capex program included an extension of a key dam (the Chaffey dam) for the provision of bulk water to Peel valley customers (Attachment 4 of this draft decision). State Water submitted that the Chaffey dam’s capacity will increase from 62 GL to 100 GL as a result of the extension (61 per cent increase).593 Further, State Water submitted that the Chaffey dam extension is due to be completed in the first year of the next regulatory period (2014–15).594
The ACCC considered whether the dam extension would materially impact on water extractions in the next regulatory period. In response to questions on this matter, State Water submitted that the extension will result in an increase to long term average water allocations in the Peel valley. 595 State Water advised that, unless there is a flood event, there would be no increase in water allocations following the completion of the dam until the irrigation season. The irrigation season is unlikely to occur until the regulatory period commencing in 2017–18.596
The ACCC accepts State Water’s view that the extension of Chaffey Dam is unlikely to increase water allocations in the Peel Valley in the 2014–17 period. For the regulatory period commencing 2017–18, the ACCC will consider the appropriateness of the 20-year average forecast methodology for the Peel Valley. This is having regard to whether the Chaffey Dam extension will materially impact on water extractions in that regulatory period.
593
594 State Water, Response to the ACCC’s information request 18, Responses to questions on metering, 12-13 extractions, CARM benefits and impact of dam upgrades on water availability, 18 October 2013, p.3.
595 Ibid, p.3.596 Ibid, p.3.
203 ACCC Draft decision on State Water Pricing Application: 2014-15 – 2016-17 | Attachments

8 Bulk water chargesThis attachment sets out the ACCC’s draft decision on State Water’s proposed MDB bulk water entitlement and usage charges. Bulk water charges are set to recover State Water’s users’ share of the revenue requirement.
State Water proposed two key changes to the calculation of its charges for the 2014-17 regulatory period:
to transition to an 80:20 fixed to variable tariff structure597
to rebalance high security and general security entitlement charges by removing the high security premium598 from the calculation of high security entitlement charges.
In addition State Water proposed a number of other changes, specifically:
a decrease to the level of rebates for irrigation corporations and districts (ICDs)
changes to Fish River charges (to replace the current two-tiered usage charge for major customers with a single usage charge; and to introduce an annual water service charge for minor customers in Fish River)
introduction of charges for the Lowbidgee Flood Control and Irrigation District (Lowbidgee).
8.1 Draft decisionThe ACCC’s draft decision is to not approve State Water’s proposed charges for entitlements and usage for MDB valleys. This is because we consider they do not meet the requirements of rule 29.
597 In this decision variable charges are the usage charges and fixed charges are the entitlement charges.598 High security premium = average allocation to high security entitlements over the last 20 years / average allocation to
general security entitlements over the last 20 years.
ACCC Draft decision on State Water Pricing Application: 2014-15 – 2016-17 | Attachments 204

Table 8-1 to Table 8-5 below set out the ACCC’s draft decision on usage and entitlement charges. Table 8-6 sets out the ACCC’s draft decision on rebates to Irrigation Corporations and Districts.
The ACCC’s determined charges exclude the Murray Darling Basin Authority (MDBA) and Dumaresq–Barwon Borders Rivers Commission (BRC) costs, which are currently recovered by State Water through their usage and entitlement charges.599
The ACCC’s reasoning for its draft decision on bulk water entitlement and usage charges is discussed in sections 8.3 and 8.4. The ACCC’s reasoning to its draft decision on State Water’s other proposed changes are discussed in section 8.5.
Table 8-1 ACCC draft decision on high security entitlement charges by valley for 2014–15 and indicative charges for 2015-16 and 2016-17 ($ Real 2013-14) ($/ML)
Valley 2014-15 2015-16
Indicative price
2016-17
Indicative price
Border 6.59 6.54 6.50
Gwydir 13.57 14.12 14.69
Namoi 17.07 17.20 17.33
Peel* 27.58 30.34 33.38
Lachlan 12.89 13.44 14.01
Macquarie 12.82 13.16 13.50
Murray 1.76 1.72 1.69
Murrumbidgee 2.79 2.78 2.78
Lowbidgee
Source: ACCC analysis. Note: Peel Valley price increases are capped at 10 per cent per annum.
599 State Water did not include the recovery of MDBA and BRC costs in its proposed charges for the 2014-17 regulatory period.
205 ACCC Draft decision on State Water Pricing Application: 2014-15 – 2016-17 | Attachments
Table 8-2 ACCC draft decision on general security entitlement charges by valley for 2014–15 and indicative charges for 2015-16 ($ Real 2013-14) ($/ML)
Valley 2014-15 2015-16
Indicative price
2016-17
Indicative price
Border 2.22 2.20 2.19
Gwydir 3.34 3.47 3.61
Namoi 7.94 8.00 8.06
Peel* 3.03 3.34 3.67
Lachlan 3.20 3.33 3.48
Macquarie 3.48 3.57 3.66
Murray 1.00 0.98 0.96
Murrumbidgee 1.21 1.21 1.21
Lowbidgee 0.71 0.75 0.80
Source: ACCC analysis. Note: Peel Valley price increases are capped at 10 per cent per annum.
Table 8-3 ACCC draft decision on usage charges by valley for 2014–15 and indicative charges for 2015-16 and 2016-17 ($ Real 2013-14) ($/ML delivered)
Valley 2014-15 2015-16
Indicative price
2016-17
Indicative price
Border 6.45 6.41 6.37
Gwydir 12.16 12.65 13.16
Namoi 20.61 20.77 20.92
Peel* 45.56 50.12 55.13
Lachlan 18.49 19.28 20.10
Macquarie 14.71 15.10 15.50
Murray 2.60 2.55 2.49
Murrumbidgee 3.38 3.37 3.36
Lowbidgee 3.38 3.37 3.36
Source: ACCC analysis. Note: Peel Valley price increases are capped at 10 per cent per annum.
ACCC Draft decision on State Water Pricing Application: 2014-15 – 2016-17 | Attachments 206

Table 8-4 ACCC draft decision on raw water charges for Fish River for 2014–15 and indicative charges for 2015-16 and 2016-17 ($ Real 2013-14)
Raw Water 2014-15 2015-16
Indicative price
2016-17
Indicative price
Major customers (Delta, SCA, Oberon)
Minimum annual quantity (MAQ) access charge ($/kL)
0.34 0.34 0.34
Usage charge ($/kL) 0.38 0.38 0.39
Minor customers
Annual water service charge 67.63 68.11 68.60
Annual usage up to 200kL ($/kL) 0.38 0.38 0.39
Annual usage over 200kL ($/kL) 0.72 0.72 0.73
Source: ACCC analysis.
Table 8-5 ACCC draft decision on filtered water charges for Fish River for 2014–15 and indicative charges for 2015-16 and 2016-17 ($ Real 2013-14)
Filtered Water 2014-15 2015-16
Indicative price
2016-17
Indicative price
Major customers (Delta, SCA, Oberon)
Minimum annual quantity (MAQ) access charge ($/kL)
0.65 0.66 0.66
Usage charge ($/kL) 0.66 0.66 0.67
Minor customers
Annual water service charge 130.88 131.82 132.76
Annual usage up to 200kL ($/kL) 0.66 0.66 0.67
Annual usage over 200kL ($/kL) 1.31 1.32 1.33
Source: ACCC analysis.
207 ACCC Draft decision on State Water Pricing Application: 2014-15 – 2016-17 | Attachments

Table 8-6: ACCC draft decision on rebates for irrigation corporations and districts for 2014-15 to 2016-17 regulatory period ($ Real 2013-14)
2014-15 2015-16 2016-17
Jemalong 68,154 62,360 59,988
Murray Irrigation 914,220 852,753 827,006
Western Murray 31,944 29,797 28,897
West Corurgan 50,735 47,324 45,895
Moira 25,352 23,647 22,933
Eagle Creek 8,942 8,341 8,089
Murrumbidgee Irrigation 354,395 326,168 314,465
Coleambally 155,523 143,136 138,001
Total Rebates 1,609,264 1,493,526 1,445,273
Source: ACCC analysis.
Table 8-7 to Table 8-9 show the ACCC draft decision charges compared to current 2013-14 prices (excluding MDBA and BRC costs).
ACCC Draft decision on State Water Pricing Application: 2014-15 – 2016-17 | Attachments 208

Table 8-7: ACCC draft decision for valley charges: change relative to 2013–14 charges*
2014-15 2015-16 2016-17High security entitlement charge
Border -11% -11% -12%
Gwydir -6% -2% 2%
Namoi 7% 7% 8%
Peel 10% 21% 33%
Lachlan 4% 9% 13%
Macquarie 13% 16% 19%
Murray 3% 1% -1%
Murrumbidgee 6% 6% 5%
General security entitlement charge
Border 7% 7% 6%
Gwydir -17% -14% -10%
Namoi -12% -11% -10%
Peel 10% 21% 33%
Lachlan -28% -25% -21%
Macquarie -17% -15% -13%
Murray -21% -23% -24%
Murrumbidgee -14% -14% -14%
Usage charges
Border 6% 5% 5%
Gwydir -5% -1% 3%
Namoi 4% 5% 6%
Peel 10% 21% 33%
Lachlan 3% 7% 11%
Macquarie 6% 9% 12%
Murray -4% -6% -7%
Murrumbidgee 1% 1% 0%
209 ACCC Draft decision on State Water Pricing Application: 2014-15 – 2016-17 | Attachments

*Note: The ACCC removed the MDBA and BRC costs from the current State Water 2013-14 prices. This is to allow a better comparison between the draft decision prices which do not include MDBA and BRC costs and the 2013-14 prices.*Lowbidgee is not included because State Water had no prices for supplementary licences in the current regulatory period. To date, capital works in Lowbidgee have been funded by the revenue raised through a $4.10 per hectare area charge, and , in the past, government grants.600
Table 8-8: ACCC draft decision for Fish River raw water charges: change relative to 2013–14 charges*
Raw Water 2014-15 2015-16 2016-17
Major customers (Delta, SCA, Oberon) Minimum annual quantity (MAQ) access charge ($/kL) -11% -10% -10%
Usage charge ($/kL) -12% -11% -10%Minor customers Annual water service charge -28% -28% -27%Annual usage up to 200kL ($/kL) -55% -55% -54%Annual usage over 200kL ($/kL) -46% -46% -45%
Source: ACCC analysis
Table 8-9: ACCC draft decision for Fish River filtered water charges: change relative to 2013–14 charges*
Filtered 2014-15 2015-16 2016-17
Major customers (Delta, SCA, Oberon) Minimum annual quantity (MAQ) access charge ($/kL) 14% 16% 16%
Usage charge ($/kL) 8% 8% 10%Minor customers
Annual water service charge -3% -2% -1%
Annual usage up to 200kL ($/kL) -37% -37% -36%Annual usage over 200kL ($/kL) -23% -23% -22%
Source: ACCC analysis
8.2 Assessment approachUnder the WCIR the ACCC cannot approve State Water’s proposed regulated charges unless it is satisfied that:
the regulatory asset base (RAB) is calculated according to the objectives and principles in Schedule 2 of the WCIR; and
State Water's total forecast revenue is reasonably likely to meet the prudent and efficient costs of providing infrastructure services; and
the forecast revenue from regulated charges is reasonably likely to meet that part of the prudent and efficient costs of providing infrastructure services that is not met from other revenue.601
600 State Water Corporation, Pricing Application to the ACCC for regulated charges to apply from 1 July 2014, p.157.601 Water Charge Infrastructure Rules 2010, s.29.
ACCC Draft decision on State Water Pricing Application: 2014-15 – 2016-17 | Attachments 210

In approving or determining State Water’s regulated charges the ACCC must also have regard to whether the proposed charges would contribute to the Basin water charging objectives and principles (BWCOP) set out in Schedule 2 of the Water Act.602 The BWCOP include:
ensure sufficient revenue streams to allow efficient delivery of the required services
promote the economically efficient and sustainable use of water resources and water infrastructure assets
avoid perverse or unintended pricing outcomes
give effect to the principles of user pays in respect of water storage and delivery in irrigation systems
achieve pricing transparency in respect of water storage and delivery in irrigation systems
facilitate efficient water use and efficient functioning of water markets
include a consumption based component
recognition of the need for community service obligations (subsidies) where full cost recovery is unlikely to be achieved.
Criteria for assessing regulated water charges are also set out in the ACCC’s pricing principles for price approvals and determinations under the WICR. These principles generally reflect the BWCOP. In having regard to whether State Water’s proposed charges would contribute to the BWCOP the ACCC has placed more weight on the following aspects of the BWCOP:603
to avoid perverse or unintended pricing outcomes
to ensure sufficient revenue streams to allow efficient delivery of the required services
to promote the economically efficient and sustainable use of water infrastructure assets.
The ACCC considers these factors most relevant to determining water charges for MDB valleys.
8.3 The ACCC’s draft decision on tariff structureThe ACCC’s draft decision is to maintain State Water’s current tariff structure so that 40 per cent of its revenue is recovered through entitlement charges (fixed charges) and 60 per cent is recovered through usage charges (variable charges) over the 2014-17 regulatory period. The ACCC considers this tariff structure best contributes to the BWCOP
8.3.1 State Water proposal
Tariff Structure
State Water proposed to transition to an 80:20 tariff structure where, 80 per cent of its revenue is recovered through entitlement charges (fixed charges) and 20 per cent of its revenue is recovered through usage charges (variable charges). State Water proposed that this transition would be complete by 2016-17.
602 Water Charge Infrastructure Rules 2010, s.29.603 This choice is guided by the context of State Water’s proposal and that of submissions received during the review
process.
211 ACCC Draft decision on State Water Pricing Application: 2014-15 – 2016-17 | Attachments

State Water submitted that the continuation of the current 40:60 tariff structure results in a high risk of revenue under-recovery due to of volatility in water availability and/or demand, meaning that State Water may not be able to finance its operations in the face of revenue volatility risk.604
State Water’s proposed transition path to move to the proposed 80:20 tariff structure is illustrated in Figure 9-1.
Figure 8-1: State Water's proposed change to the proportion of revenue recovered through fixed and variable charges ($2013-14)
40
50
65
80
60
50
35
20
0
20
40
60
80
100
120
2013-14 2014-15 2015-16 2016-17
Perc
enta
ge
Fixed Variable
Current tariff structure Proposed tariff structure
As shown in Table 8-10 State Water’s proposed change to its tariff structure would generally result in increased entitlement charges and decreased water usage charges in the 2014-17 regulatory period.
604 State Water Corporation, Pricing application to the ACCC for regulated charges to apply from 1 July 2014, p131.
ACCC Draft decision on State Water Pricing Application: 2014-15 – 2016-17 | Attachments 212

Table 8-10: State Water–Proposed regulated charges: change relative to 2013–14 charges*
2014-15 2015-16 2016-17High security entitlement charge
Border -43% -44% -45%
Gwydir -38% -14% 11%
Namoi -9% 19% 47%
Peel 50% 107% 169%
Lachlan 2% 42% 87%
Macquarie -8% 30% 74%
Murray 8% 39% 68%
Murrumbidgee 13% 48% 82%
General security entitlement charge
Border 58% 56% 55%
Gwydir 23% 69% 121%
Namoi 30% 70% 110%
Peel 103% 179% 264%
Lachlan 16% 62% 114%
Macquarie 31% 86% 149%
Murray 16% 50% 81%
Murrumbidgee 30% 70% 109%
Usage charges
Border 3% 2% 1%
Gwydir -7% -31% -58%
Namoi 1% -29% -59%
Peel 79% 33% -20%
Lachlan 1% -24% -54%
Macquarie 6% -20% -50%
Murray -9% -37% -65%
Murrumbidgee -5% -34% -62%
*Note: State Water’s proposed prices were converted into $2013–14 before the calculation of percentage change. Also note the ACCC removed the MDBA and BRC costs from the current State Water 2013-14 prices. This is to allow a better comparison between State Water’s proposal which does not include MDBA and BRC costs and the 2013-14 prices.*Lowbidgee is not included because State Water had no prices for supplementary licences in the current regulatory period. To date, capital works in Lowbidgee have been funded by the revenue raised through a $4.10 per hectare area charge, and , in the past, government grants.605
605 State Water Corporation, Pricing Application to the ACCC for regulated charges to apply from 1 July 2014, p.157.
213 ACCC Draft decision on State Water Pricing Application: 2014-15 – 2016-17 | Attachments

8.3.2 Reasons for ACCC draft decisionThe ACCC considers that State Water’s proposed 80:20 fixed to variable tariff structure would not contribute to the BWCOP. The ACCC considers that the 80:20 fixed to variable structure does not promote the three BWCOP factors which we have identified as particularly relevant to water infrastructure charges. The ACCC’s reasoning for its draft decision on tariff structures with regard to these three factors is set out below.
To avoid perverse or unintended pricing outcomes
The ACCC considers that State Water’s proposed 80:20 tariff structure would transfer an unreasonable amount of volume-related risk from State Water to customers and that this has potential perverse and / or unintended pricing outcomes for the financial viability of farm businesses and on farm investment.
Given the make–up of farming output in the NSW MDB, many of State Water’s customers are likely to have a cash-flow which is positively correlated with water availability. Many croppers (e.g. rice and cotton growers) plant a larger area at times of high water availability. These growers will have substantially higher revenues and cash-flows in years of high water availability. When the cash flow of the water user is positively correlated with water availability, a water bill which is more closely correlated with water availability reduces the overall variability in cash flow.606 Therefore, reducing the variable charges for water usage and increasing fixed charges on water entitlements will likely increase the overall variability in cash-flow for a large proportion of State Water customers, exposing them to more risk.
The ACCC considers that there is a strong case that the current arrangements (under which the State Water bill for most customers is higher in years of high water availability and vice versa) acts as a natural hedge for customers. In particular, the current arrangements reduce the impact of State Water’s charges on its customers at times of low water availability when their financial status is at greatest risk. State Water’s proposal would increase risk on customers which, especially for customers unable to raise capital in dry periods when farming output is reduced, may have detrimental economic impacts.
The ACCC notes however that where water trade possible the volume of water used by State Water’s customers depends more on the water market price and not on the customer’s own water allocation. In these valleys customers can, in principle, reduce their exposure to State Water’s fixed water entitlement charges by selling their entitlements and relying on trade in water allocation to meet their water needs. However, a strategy of this kind exposes the water user to risk arising from variability in the water allocation price. In a fully developed market water users might have access to risk-management tools to hedge their exposure to water price risk. However, the ACCC notes that more sophisticated risk-management tools, such as hedge or forward contracts, do not currently exist in MDB water markets. In their absence, ACCC analysis suggests that the current structure of State Water’s charges may play a risk management role. State Water’s proposal would reduce that role.
606 Provided the sensitivity of the water bill to water availability is not too large.
ACCC Draft decision on State Water Pricing Application: 2014-15 – 2016-17 | Attachments 214

Most submissions opposed State Water’s proposed transition to an 80:20 tariff structure on the basis that the proposal would transfer State Water’s business risk to customers and threaten the financial viability of customers in dry periods.
Only two submissions supported the transitioning towards higher fixed charges, the Commonwealth Environmental Water Office (CEWO) and the Sydney Catchment Authority (SCA). CEWO submitted that they would prefer to pay the proposed higher proportion of fixed charges and lower proportion of variable water charges, subject to any overall increase being based on cost recovery and within reasonable bounds.
In summary, the ACCC considers a shift to an 80:20 fixed to variable tariff structure as proposed by State Water would increase financial risk to State Water’s customers. In particular the ACCC is concerned that the proposal will reduce the cash-flow of water users in dry periods which may limit their ability to raise capital with potentially detrimental economic impacts, giving rise to perverse or unintended pricing outcomes. The ACCC does not consider that this transfer of risk to customers through an 80:20 tariff structure would contribute to the BWCOP. The ACCC considers that the current 40:60 tariff structure better contributes to the BWCOP to avoid perverse or unintended pricing outcomes.
Further analysis regarding the transfer of risk to State Water’s customers is set out in Appendix A.
To ensure sufficient revenue streams to allow efficient delivery of the required services
The ACCC considers that a 40:60 tariff structure will allow State Water to recover sufficient revenue streams to allow efficient delivery of the required services.
The ACCC considers that while an 80:20 tariff structure would result in more stable cash-flows for State Water, there are other mechanisms, besides changing the tariff structure, for moderating the revenue variability previously experienced by State Water. The ACCC has decided to apply two such mechanisms in this draft decision:
a 20 year rolling average approach to forecast water extractions in the 2014-17 regulatory period. Under this approach, water extraction forecasts will be updated annually. Attachment 7 on Demand Forecasts sets out the ACCC’s draft decision on demand forecasting.
a form of price control that includes an ‘unders and overs’ account which is a running balance of differences between actual and forecast revenues. This mechanism will ensure that State Water receives any under recovery of allowed revenue during a regulatory period in net present value terms. Where State Water recovers more revenue than forecast, customers’ charges will be reduced in the future to reflect this. Attachment 10 on the Form of Control sets out the ACCC’s draft decision on the form of price control and the operation of the ‘unders and overs’ account.
In proposing to transition to a high fixed tariff structure, State Water submitted that its commercial viability is at risk due to a mismatch between the variability of its revenue and costs607. State Water also stated:
607 State Water Corporation, Pricing application to the ACCC for regulated charges to apply from 1 July 2014, p129-130.
215 ACCC Draft decision on State Water Pricing Application: 2014-15 – 2016-17 | Attachments

The current price cap and the tariff structure of 40:60 fixed–to–variable charges results in a high risk of revenue under-recovery as a result of volatility in water availability and/or demand. This tariff structure does not align with State Water’s high proportion of fixed costs, meaning that the business may not be able to finance its operations in the face of revenue volatility risk.608
Most submissions did not support State Water’s proposal. Lachlan Valley Water (LVW) noted that IPART approved a change to the demand forecasting method in the 2010 determination to address one of the causes of State Water’s revenue shortfall during 2006–10 regulatory period. 609 The ACCC notes that in making the decision to change the demand forecasting approach, IPART stated that it sought to select an approach that would better address the potential differences between forecast and actual water extractions, to better enable State Water to recover its revenue requirement over the 2010-14 regulatory period.610
Murrumbidgee Private Irrigators Incorporated (MPII) in conjunction with the Yanco Creek and Tributaries Advisory Council submitted that State Water has managed to operate with a positive net profit through the past period while delivering well below average water due to dry conditions. MPII noted that under the proposed 80:20 tariff structure, if the seasons returned to a dry phase, irrigators would be locked into paying a higher fixed charge at a time of low or zero income.611
The NSW Farmers Association submitted that the current tariff structure is understood and accepted and has provided State Water with a positive profit over the current and previous regulatory periods. The NSW Irrigators Council (NSWIC) also submitted that the increased use of carry-over and the continuous accounting practices in the northern NSW valleys have in recent years provided protection to State Water against variance in demand.612
LVW also noted that the change in the method of demand forecasting, which resulted in lower forecasts, emergence from the drought and maintenance of the 40:60 tariff structure have resulted in State Water’s revenue recovery improving during the 2010–14 regulatory period. 613 LVW provided an analysis showing that the combination of these factors has resulted in a forecast revenue shortfall of one per cent of State Water’s total allowed revenue in the 2010–14 regulatory period.614 Analysis undertaken by the ACCC shows that State Water is likely to recover more than its forecast revenue in the 2010–14 regulatory period.
The ACCC recognises that the current tariff structure, under which revenues vary with water availability, does expose State Water to variability in its revenue stream. However the regulatory framework ensures that over time State Water will on average earn sufficient revenue to cover its costs, including an appropriate cost of capital.
The ACCC considers that a 40:60 tariff structure in conjunction with the ACCC’s proposed form of price control will adequately address any risk to State Water of revenue under recovery as a result of volatility in water availability.608 Ibid, p131.609 Lachlan Valley water, submission on State Water Corporations price application, September 2013,
http://www.accc.gov.au/regulated-infrastructure/water/state-waters-regulated-charges-2014-17-review/information-paper610 I PART, Review of bulk water charges for State Water Corporation, 1 July 2010 to 30 June 2014 – Final report, June
2010, p.118.611 Murrumbidgee Private Irrigators Incorporated (MPII) in conjunction with the Yanco Creek and Tributaries Advisory
Council.
612 NSW Irrigators Council, submission on State Water Corporations price application, September 2013, http://www.accc.gov.au/regulated-infrastructure/water/state-waters-regulated-charges-2014-17-review/information-paper
613 Lachlan Valley Water, submission on State Water Corporations price application, September 2013, http://www.accc.gov.au/regulated-infrastructure/water/state-waters-regulated-charges-2014-17-review/information-paper
614 Lachlan Valley Water submission showed that most of State Water’s under-recovery in the first half of the 2010 - 2014 regulatory period was expected to be recovered in the second half of the period. For more detail, see Lachlan Valley Water Inc., submission on State Water Corporations price application, table 2 : http://www.accc.gov.au/regulated-infrastructure/water/state-waters-regulated-charges-2014-17-review/information-paper
ACCC Draft decision on State Water Pricing Application: 2014-15 – 2016-17 | Attachments 216

In summary, the ACCC considers State Water’s current 40:60 tariff structure acts as a risk management tool for State Water’s customers in times of low water availability. Based on its analysis the ACCC considers that State Water’s proposed transition to an 80:20 tariff structure will transfer a volume related risk to State Water’s customers and that this could have detrimental economic impacts, giving rise to perverse or unintended pricing outcomes. The ACCC considers that a 40:60 tariff structure in conjunction with the ACCC’s proposed ‘unders and overs’ account as set out in attachment 10 on the Form of Control will allow State Water to recover sufficient revenue streams to allow efficient delivery of the required services.
To promote the economically efficient and sustainable use of water resources
The ACCC also received submissions regarding whether State Water’s approach would promote the efficient use of water.
LVW submitted that State Water’s proposal may result in perverse outcomes whereby irrigators may be encouraged to pump water based on price (low usage charge) rather than water use efficiency and this could have potential negative environmental outcomes.
The NSW Farmers Association, Murrumbidgee Valley Food and Fibre Association (MVFFA), LVW and Namoi Water all commented that a move to higher fixed charges may have the perverse outcome of encouraging farmers to over produce or over use land to offset the high fixed cost of water, thereby also encouraging inefficient water use.
Murray Irrigation stated:
It is widely accepted that the most efficient way to ensure efficient use is to make people pay to use. By fixing charges for irrigators (and other water users), it removes any incentive for them to ensure they are using water efficiently and getting the best return from their inputs.
The ACCC has considered whether State Water’s proposal would have a significant impact on the sustainable and efficient use of water resources, having regard to the role of the water market, where water trade is not established and where it is established.
If water trade is not established, it is likely that users would have a range of different values for water at the margin. The marginal value of water for some of those users could be quite low. In this case there is a risk that increasing the water usage charge might deter some of those users from using their water allocation, reducing economic efficiency.
But given the presence of water trade, all users must have the same marginal value for water allocation, as reflected in the market price. In this context, increasing the usage charge results in a reduction in the market price for water, with no change in the volume of water used. As long as the market price is greater than zero there are no efficiency consequences from a change in the usage charge. In the presence of water trade a shift from charges on usage to charges on entitlement should have no impact on the efficiency of water use.
In summary, the ACCC considers the second scenario better reflects water market arrangements in the MDB and that in comparing the current 40:60 tariff structure with State Water’s proposal, neither are likely to have a significant impact on the efficiency of water use. Further analysis regarding this issue is set out in in Appendix A.
217 ACCC Draft decision on State Water Pricing Application: 2014-15 – 2016-17 | Attachments

Conclusion
In conclusion taking into account the above BWCOP factors, the ACCC’s draft decision is to maintain the current 40:60 tariff fixed to variable tariff structure. As discussed above, the ACCC considers this tariff structure best contributes to the BWCOP. The ACCC also notes that the 40:60 tariff structure contributes to the objective of the BWCOP to include a consumption based component and is transparent in that customers understand this tariff structure and can relate their volume of water use to the level of charges they pay.
8.4 The ACCC’s draft decision entitlement chargesThe ACCC’s draft decision is to not approve State Water’s proposal and to maintain the calculation of high security entitlement charges that applies in the current regulatory period; that is:
High security entitlement charge = general security entitlement charge x high security premium
Where:
High security premium = average water allocations (AWA)615 x water sharing plan (WSP) ratio.
State Water’s proposed changes, set out below in section 8.4.1, were intended to align with the 80:20 fixed to variable tariff structure they proposed for tariffs. Because the ACCC has rejected the 80:20 tariff structure the ACCC does not approve State Water’s proposed conversion factor. The ACCC considers the current conversion factor better reflects the value of high security entitlements under a 40:60 fixed to variable tariff split.
8.4.1 State Water proposal State Water proposed relatively higher charges for high security entitlement holders compared to general security entitlement holders to reflect their respective access rights to water.616 State Water also proposed to remove the high security premium ratio from the ratio currently used to calculate the high security entitlement charge.617 State Water’s proposed ratio is the Water sharing plan (WSP) ratio. That is, State Water proposed to calculate the high security entitlement charge in the 2014-17 regulatory period as follows:
High security entitlement charge = general security entitlement charge x WSP ratio618.
This proposal would result in a reduction in high security entitlement charges and increases in general security entitlement charges compared to the current approach.
615 AWA = average water allocations for high security entitlements over the last 20 years / average water allocations for general security entitlements over the last 20 years.
616 State Water Corporation, Pricing application to the ACCC for regulated charges to apply from 1 July 2014, p. 152.617 The conversion ratio is used to differentiate the high security entitlement charges from the general security
entitlement charges. The higher the conversion ratio the greater the high security entitlement charge for a given general security entitlement charge.
618 The WSP conversion factors are calculated by the NSW Office of Water (NOW) using two variables: 1. The ‘reliability’ of water and 2. the number of converted licences. These variables are used to simulate different combinations of conversions that can co-exist and NOW selects the combination that minimises adverse effects on third parties.The high security premium is the ratio of the average high security allocations over for the last 20 years over the average of general security allocations for the last 20 years.
ACCC Draft decision on State Water Pricing Application: 2014-15 – 2016-17 | Attachments 218

8.4.2 Reasons for the ACCC’s draft decision on entitlement chargesThe ACCC considers it is reasonable for State Water to charge holders of high security entitlements more than holders of general security entitlements. To determine the relative charges, a ratio is applied to the general security entitlement charge to calculate the high security entitlement charges. The ACCC considers that the current ratio best reflects the value of high security entitlements under a 40:60 tariff structure.
Table 8-11 shows State Water’s proposed WSP ratio. Table 8-12 shows the ACCC’s draft decision on the ratio to calculate the high security entitlement charge.
Table 8-11: State Water – proposed ratio to calculate high security entitlement charges Valley State Water Proposed
conversion ratio – WSP ratio
Border 1.28
Gwydir 1.81
Namoi 1.25
Peel 6.73
Lachlan 2.45
Macquarie 1.88
Murray 1.25
Murrumbidgee 1.63
Source: State Water price application 2013, p.153
Table 8-12: ACCC draft decision on the ratio to calculate high security entitlement charges Valley WSP ratio High security
premium for 2014-15ACCC conversion factor for 2014-15 (WSP ratio x high security premium)
Border 1.28 2.32 2.97
Gwydir 1.81 2.25 4.07
Namoi 1.25 1.72 2.15
Peel 6.73 1.47 9.88
Lachlan 2.45 1.65 4.03
Macquarie 1.88 1.96 3.69
Murray 1.25 1.41 1.76
Murrumbidgee 1.63 1.41 2.30
Source: State Water price application 2013, p.153 and State Water response to ACCC information request 16, September 2013.
In making its draft decision the ACCC notes that there does not appear to be any difference in the cost of water storage and delivery infrastructure used when State Water provides services to high security or general security entitlement holders. State Water did not provide any information to show that the costs of providing water storage and delivery services to high security entitlement holders and general security entitlement holders are different.
219 ACCC Draft decision on State Water Pricing Application: 2014-15 – 2016-17 | Attachments

The ACCC considers it reasonable for State Water to charge high security entitlement holders more than general security entitlement holders to reflect the extra ‘value’ in terms of reliability and security that high security entitlement holders have compared to general security entitlement holders.
State Water submitted that the current method for calculating high security entitlement charges is no longer appropriate given its proposal to transition to an 80:20 tariff structure.619 State Water also noted that its proposed movement to an 80:20 tariff structure creates a premium payable by high security licences and that this premium combined with the WSP ratio provides sufficient price differentiation between high security and general security licences that reflects their respective access rights to water.620
The ACCC has not approved State Water’s proposed 80:20 tariff structure which, as submitted by State Water, creates a premium payable by high security entitlement holders. Accordingly, under a 40:60 tariff structure, this premium will not be reflected in the calculation of high security charges as proposed by State Water.
The ACCC considers that State Water’s proposed application of the WSP ratio alone to derive high security charges in conjunction with the ACCC’s determined 40:60 tariff structure does not reasonably reflect the benefit of high security entitlement holders over a general security entitlement holders. State Water shared this view in its price application to IPART in 2010. At the time, State Water noted that this was demonstrated by the large number of general security entitlement holders who had converted to high security entitlements.621
In assessing the proposed differentiation between high security and general security entitlement charges, the ACCC considered whether an alternative ratio would be better suited (compared to State Water’s proposed WSP ratio) to capture the value of holding a high security entitlement over a general security entitlement. In assessing the extra value of the high security entitlements over general security entitlements the ACCC considered the higher market prices for high security entitlements and concluded it is the result of two factors: the higher average water allocations of high security entitlements relative to general security entitlements, and an additional premium for reliability.622
To capture the additional premium for reliability above the AWA ratio the ACCC reviewed the market prices of entitlements. However, robust data on entitlement prices is not available in the MDB valleys serviced by State Water other than Murray and Murrumbidgee valleys. The ACCC found that high security entitlements in both Murray and Murrumbidgee valleys are trading at close to 1.45 times greater than the ratio of long-run average water allocations (AWA ratio). This suggests that the premium for security and reliability of high relative to general security entitlements could be measured by the ratio of 1.45.
619 State Water Corporation, Pricing application to the ACCC for regulated charges to apply from 1 July 2014, p.152.620 State Water Corporation, Pricing application to the ACCC for regulated charges to apply from 1 July 2014, p.152.621 The ACCC notes that attempted conversions from general security to high security entitlements were so numerous
that the NSW Government imposed a state wide ban on all conversions to avoid widespread adverse third party impacts IPART, Review of bulk water charges for State Water Corporation, from 1 July 2010 to 30 June 2014 – Water draft determination and draft report March 2010, p128.
622 For example, consider a high security entitlement holder who holds 10ML in entitlements and who is allocated 10ML of water each year. Compare this to a general security entitlement holder with 30ML in entitlements, who over a three year period, gets the full allocation one year and zero allocations in the other two years. The average water allocated to the general security entitlement holder over three years is the same as that of the high security entitlement holder. However, the high security entitlement holder has a much more reliable supply of water. It is reasonable to assume that an irrigator would pay more for the 10 ML of high security entitlement compared to the 30 ML of general security entitlement, even though the amount of water supplied is the same on average.
ACCC Draft decision on State Water Pricing Application: 2014-15 – 2016-17 | Attachments 220

The ACCC considered applying a conversion factor incorporating both the AWA ratio and the additional market price premium of 1.45 to calculate the value of high security entitlements above general security entitlements. Such an approach would extrapolate the value of high security entitlements compared to general security entitlements in the Murray and Murrumbidgee valleys to the other MDB valleys where market price data is less robust. The ACCC concluded that due to insufficient data a ratio based on market prices could not currently be used as the conversion factor. The ACCC concluded however that the analysis demonstrates that the value of high security entitlements should reflect both the higher water allocations received on average by high security entitlement holders and an additional market premium for reliability.
Given that sufficiently reliable water market data does not exist for all MDB valleys the ACCC considers that the current WSP ratio should continue to be used to reflect the greater reliability of high security entitlements. Accordingly, the ACCC’s draft decision is to maintain the calculation of high security entitlement charges that applies in the current regulatory period; that is:
High security entitlement charge = general security entitlement charge x high security premium.
Where:
High security premium = AWA x WSP ratio.
The ACCC considers this reflects the value of high security entitlements under a 40:60 tariff structure and contributes to the objective of the BWCOP to reflect user pays in respect of water storage and delivery in irrigation systems.
The ACCC notes that the method for calculating high security charges may be revised in a future regulatory period.
8.5 The ACCC’s draft decision on State Water’s other proposed changes to its chargesThe following sets out the ACCC’s draft decision on other changes State Water proposed to its charges in its pricing application. In coming to a draft decision on these matters the ACCC has had regard to the BWCOP.
8.5.1 Rebates for Irrigation Corporations and DistrictsIrrigation Corporations and Districts (ICDs) aggregate water orders (i.e. extraction of water from natural water courses) on behalf of their customers (who typically hold irrigation rights against them) and undertake real-time monitoring of extractions along with billing, metering and compliance functions within their own irrigation networks.
State Water’s pricing arrangements for bulk water services have historically provided rebates to ICDs. These began in recognition of the economies of scale from large irrigation companies amalgamating meters within their areas of operation.623
623 Effective price reductions for wholesalers were first made available in 1992. These resulted from negotiations between regional directors of the Department of Land and Water Conservation (DLWC) and customer service managers of irrigation corporations (later privatised). At the time, bulk water tariff had two components: a delivery charge and a metering charge. The negotiations on price reductions for wholesalers of bulk water related to the DLWC’s approach to charging for meters.
221 ACCC Draft decision on State Water Pricing Application: 2014-15 – 2016-17 | Attachments

Rebates were continued by IPART in its 2010 Determination in recognition of the costs avoided by State Water because State Water’s end-users are the individual irrigators within the ICDs. Specifically, the rebate has been provided to ICDs in recognition of:
economies of scale achieved in delivering large volumes of water to ICDs relating to billing and metering activities, and to a lesser extent river operations activities, and
system wide benefits including policing of water use and qualitatively superior monitoring of diversions resulting from real-time monitoring.
The cost of the rebate is recovered through State Water’s bulk water charges.
State Water proposal for ICD rebates
State Water proposed to maintain rebates to ICDs in the next regulatory period but change the methodology of calculating the level of rebates.624 State Water’s proposed methodology results in a reduction in rebates relative to the current level. In calculating avoided costs from ICD’s real time monitoring which relate to telemetry installation and data transfer, State Water proposed to only include the avoided cost of installing telemetry and data transfer at each of the ICD service points, rather than the avoided cost of installing telemetry at all ICD customer sites as is currently the methodology.625 An ICD service point is the point at which the respective ICD extracts water from the river. This differs from ICD customer sites which are the retail distribution points at which an ICD delivers water to its customers. State Water proposed this change to the methodology of calculating rebates due to the state–wide metering project which involves connecting meters via telemetry, thus increasing the availability of real-time monitoring in the system.626 State Water submits that this removes much of the system benefit State Water receives from ICD real-time data in terms of avoided costs.627
State Water also proposed a sliding scale for rebates, whereby the rebate received in any one year depends on the volumetric entitlement held by the ICD.628 Table 8-13 shows a comparison of the proposed rebates relative to that applying in 2013–14.
624 State Water Corporation, Pricing application to the ACCC for regulated charges to apply from 1 July 2014, p 158.625 Ibid, p. 159.626 Ibid, p 159.627 Ibid, p. 159628 Ibid, p 160.
ACCC Draft decision on State Water Pricing Application: 2014-15 – 2016-17 | Attachments 222
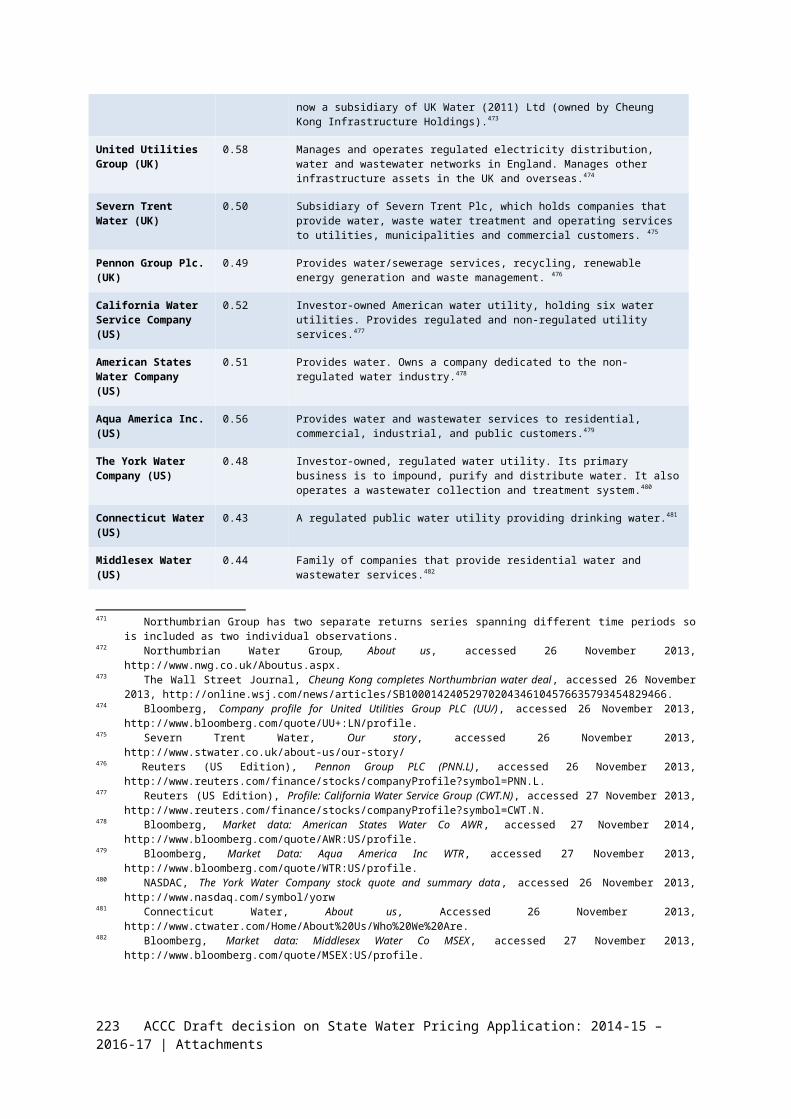
Table 8-13: State Water – Proposed large customer rebates: percentage change relative to 2013–14 large customer rebates*
Current rebate 2013/14 (Real $ 2013/14)
2014/15 (change relative to 2013/14)
2016/17 (change relative to 2013/14)
2014/15 (change relative to 2013/14)
Jemalong 89,674 -22% -31% -32%
Murray Irrigation 963,678 -29% -37% -39%
Western Murray 39,533 -39% -47% -48%
West Corurgan 52,165 -27% -36% -37%
Moira 25,325 -25% -34% -36%
Eagle Creek 11,076 -40% -47% -48%
Murrumbidgee Irrigation 831,003 -61% -66% -66%
Coleambally 367,927 -61% -66% -67%
Total 2,380,379 -45% -52% -53%
*All amounts converted in $2013–14 before calculation of percentage change.Source: ACCC’s calculation from State Water data (Pricing application, June 2013, 161) and IPART data (IPART final decision, June 2010, p.151)
ACCC draft decision on for rebates to ICDs
The ACCC’s draft decision is to approve rebates for ICDs for the next regulatory period. The ACCC considers that State Water’s cost for billing, metering, telemetry and data transfer per ML of servicing a non–ICD entitlement holder is greater than that to service an ICD. However, the ACCC does not approve the amount of rebates as proposed by State Water for the reasons set out below.
State Water submitted that its rationale for proposing to maintain rebates for ICDs was set out by IPART in its 2006 determination.629 For its 2006 determination, IPART commissioned CIE to determine the justification and quantity of ICD rebates. In its report to IPART, CIE outlined the history of rebates as summarised below:630
Following the amalgamation of meters in the 1990s, ICDs aggregated water orders and undertook billing and metering functions. The then bulk water provider, the Department of Land and Water Conservation (DLWC), acknowledged that some of its costs were defrayed by ICDs carrying these functions on its behalf. As a result, the final allocation of metering charges agreed to by DLWC effectively granted ICDs a lower per ML charge.631
In the 1990s, IPART set maximum prices to preserve the ICD discounts and moved all discounts to a single fixed charge on entitlements. IPART stated that:632
The costs incurred by the DLWC to deliver each ML of water to an area and district are lower on average than the costs of delivering that water to a river pumper. This is because the area and district aggregate water orders, billing and all interactions with the DLWC.
629 State Water Corporation, Pricing application to the ACCC for regulated charges to apply from 1 July 2014, pp. 158–159.
630 Centre for International Economics (CIE), Review of price discounts for wholesalers: A report prepared for Independent Pricing and Regulatory Tribunal of NSW, March 2006.
631 Centre for International Economics (CIE), Review of price discounts for wholesalers: A report prepared for Independent Pricing and Regulatory Tribunal of NSW, March 2006.
632 IPART, Bulk water prices from 1 July 1997, Determination No. 6, September 1997, p.35.
223 ACCC Draft decision on State Water Pricing Application: 2014-15 – 2016-17 | Attachments

State Water’s 2014-17 pricing application has acknowledged the cost savings arising from avoided billing, metering and compliance costs as well as system wide benefits resulting from ICDs extracting significant quantities of water and managing supply to their customers.633
Submissions to State Water’s 2014-17 pricing application have favoured rebates to ICDs. Jemalong Irrigation Ltd (JIL) stated:634
One of the negotiated conditions of the privatisation of the Jemalong District was the ongoing provision of a “bulk water discount” or “rebate”. This rebate was in recognition of the ongoing costs incurred by JIL and avoided by both State Water and the Office of Water for the continuing obligations of reading of meters, replacement/maintenance of meters, processing collated orders, customer service/liaison, billing and collection.
Murray Irrigation (MIL) submitted that it supports the retention of ICD rebates in recognition of the significant service irrigation infrastructure operators provide and the associated avoided costs to State Water.635
Calculation of ICDs rebates
State Water proposed to maintain most aspects of IPART’s approach to quantifying ICDs rebates. IPART calculated rebates by:636
(1) Quantifying the cost savings to State Water that result from ICDs’ billing, metering, compliance and real time monitoring functions (i.e. meters and data transfer by telemetry).
(2) Dividing total cost savings quantified in (1) by the total volume of entitlements in a valley to derive an average avoided cost per entitlement for each valley.
(3) For each ICD, multiplying the relevant average avoided cost per entitlement with the total volume of entitlements held by the ICD.
State Water updated cost estimates for billing, metering, compliance and real time monitoring functions by taking into account efficiencies achieved over the current regulatory period and updated estimates of the costs avoided from ICDs’ real-time monitoring of extractions.637
State Water’s proposed approach to quantify the avoided costs of installing telemetry differs from the current approach approved by IPART in 2010. Under the current approach, the avoided cost from ICDs real time monitoring was based on the avoided cost of installing telemetry at ICD customer sites.638 State Water’s proposal to base the calculation of avoided cost of installing telemetry at ICD service points instead of customer sites is the key driver of its proposed reduction in ICD rebates. Assuming that telemetry and data transfer is undertaken at ICD service points instead of ICD customer sites results in a significantly lower avoided cost for State Water and hence a reduction in the level of rebates to ICDs, compared to if telemetry and data transfer is assumed to be undertaken at ICD customer sites.
633 State Water Corporation, Pricing application to the ACCC for regulated charges to apply from 1 July 2014, pp. 158–159.
634 Jemalong Irrigation Ltd (JIL), submission for the 2013 ACCC water pricing review, pp.1-2, http://www.accc.gov.au/regulated-infrastructure/water/state-waters-regulated-charges-2014-17-review/information-paper
635 Murray Irrigation Limited (MIL), Response to State Water Corporation’s pricing application for regulated bulk water charges: Submission to the Australian competition and Consumer Commission, September 2013, p.14.
636 State Water Corporation, Pricing application to the ACCC for regulated charges to apply from 1 July 2014, p. 159.637 Ibid, pp. 159–160.638 State Water, response to ACCC request for further information on ICD rebates, 17 December 2013.
ACCC Draft decision on State Water Pricing Application: 2014-15 – 2016-17 | Attachments 224

Submissions supported retaining the current rebates and opposed State Water’s proposed change to calculating ICD rebates.
JIL submitted that its metering point is not scheduled to be replaced in the proposed metering program and that meter upgrades under the metering program are only available to river diverters and not to its customers–in other words, there will be no efficiencies made and therefore no cost savings to JIL.639 JIL noted that its staff will still be responsible for the ongoing manual reading of approximately 300 member customers and all associated ordering, processing, meter maintenance/replacement, billing and collection.640
Murrumbidgee Irrigation (MI) submitted that the current ICD rebates be maintained as State Water did not provide evidence that a reduction to the economies of scale and system–wide benefits of supplying water through ICDs has occurred.641
Murray Irrigation (MIL) disagreed with State Water that the benefits received from ICDs for real-time data monitoring will be removed. MIL submitted that State Water’s approach to calculating the avoided costs and it’s assumptions over–simplify the services that MIL provides and the true avoided costs.642 MIL also stated that, where State Water has installed modems on MIL’s infrastructure, MIL still bears the cost of having the modems calibrated, maintained and regularly audited; in addition to sending hourly file transfer downloads to State Water from sites where MIL has installed its own modems.643 MIL estimated that it would cost State Water on average $3 million per year ($2012–13) to service MIL’s customers, using the metering unit cost proposed by State Water.644 In providing this estimate, MIL noted the intention was to illustrate the extent of costs avoided by State Water for MIL’s customer meters.645
Lachlan Valley Water submitted that the rollout of the metering program in the Lachlan valley is currently expected to commence in mid-2014 and it questioned whether implementation of the program would justify a 32 per cent reduction in rebates in the Valley.646
Having considered the rationale for ICD rebates previously accepted by IPART, stakeholder submissions and the information provided by State Water in its 2014-17 pricing application, the ACCC considers that a rebate to ICDs is on balance reasonable due to the lower per ML of entitlement cost of servicing an ICD relative to that of servicing a non–ICD entitlement holder.
The ACCC considers that a rebate to ICDs promotes the water charging objectives as set out in schedule 2 of the Water Act. In particular the ACCC considers maintaining a rebate to ICDs promotes the economically efficient and sustainable use of water resources and infrastructure assets. As noted above the presence of ICDs achieves economies of scale in regard to billing, metering and river operation activities. ICDs also provide benefits including policing of water use and qualitatively superior monitoring of diversions resulting from real-time monitoring, thereby reducing the cost to State Water and promoting the efficient and sustainable use of water resources and infrastructure assets.
639 Jemalong Irrigation Ltd (JIL), submission for the 2013 ACCC water pricing review, pp.1-2, http://www.accc.gov.au/regulated-infrastructure/water/state-waters-regulated-charges-2014-17-review/information-paper
640 Ibid, pp.1-2. 641 Murrumbidgee Irrigation Limited (MI), submission on Sate Water Corporation pricing review, September 2013, p.2,
http://www.accc.gov.au/regulated-infrastructure/water/state-waters-regulated-charges-2014-17-review/information-paper642 Murray Irrigation Limited (MIL), Response to State Water Corporation’s pricing application for regulated bulk water
charges: Submission to the Australian competition and Consumer Commission, September 2013, p.14, http://www.accc.gov.au/regulated-infrastructure/water/state-waters-regulated-charges-2014-17-review/information-paper.
643 Ibid, p.15.644 Ibid, p.15.645 Ibid, p.15.646 Lachlan Valley Water Inc, Submission to ACCC on State Water regulated charges 2014–17, September 2013, p.24,
http://www.accc.gov.au/regulated-infrastructure/water/state-waters-regulated-charges-2014-17-review/information-paper
225 ACCC Draft decision on State Water Pricing Application: 2014-15 – 2016-17 | Attachments
The ACCC does not consider the level of rebate proposed by State Water to be reasonable. State Water’s proposal to change the calculation of avoided costs assumes that telemetry and data transfer is undertaken at ICD service points instead of ICD customer sites. This does not recognise that in the absence of ICDs, State Water would be required to carry out monitoring, calibration, audit of modems and data transfer at individual customer sites. The ACCC considers that calculating avoided costs on the basis of ICD customer sites as applied by IPART in the 2010 determination is a better approach to calculating rebates. Accordingly the ACCC does not approve the level of ICD rebates as proposed by State Water. For this decision the ACCC will continue the calculation of rebates using the methodology applied by IPART.
The ACCC has determined ICD rebates for 2014-17 by applying the current methodology used by IPART with updated numbers for the cost parameters used.647
Table 8-14 shows the volume of entitlements and average costs for the regulatory period used by IPART to calculate the rebates for the 2010 determination. Table 8-15 shows the volume of entitlements and average costs applied by the ACCC for this decision.
Table 8-14: Number of entitlements and average costs for the regulatory period used by IPART to calculate rebates for 2010 Determination in ($2013/14)
Lachlan Murray Murrumbidgee
Entitlements 693,724 2,333,661 2,700,993
Metering and Compliance $476,504 $756,168 $629,244
Billing $103,261 $70,992 $54,857
Telemetry installation $41,950 $475,429 $648,605
Data transfer costs $20,437 $236,639 $322,689
Total costs $642,151 $1,539,227 $1,655,395
Average cost per entitlement
$0.93 $0.66 $0.61
Source: ACCC analysis
Table 8-15: Number of entitlements and average costs for the regulatory period used by ACCC to calculate rebates for 2014 Determination in $2013/14
Lachlan Murray Murrumbidgee
Entitlements 693,582 2,337,223 2,697,041
Metering and Compliance $304,854 $592,227 $261,151
Billing $103,293 $150,199 $148,014
Telemetry installation $27,495 $536,293 $255,005
Data transfer costs $8,846 $172,538 $82,041
Total costs $444,488 $1,451,256 $746,212
Average cost per entitlement
$0.64 $0.62 $0.28
Source: ACCC analysis
647 The following parameters are used to calculate rebates: WACC, entitlements, customer sites, metering and compliance costs, billing costs, telemetry and data transfer costs.
ACCC Draft decision on State Water Pricing Application: 2014-15 – 2016-17 | Attachments 226

The differences in the level of the rebate between IPART’s decision for the 2010 Determination and this decision are due to updated costs applicable to the 2014-17 regulatory period for metering, compliance, billing, telemetry installation and data transfer. Changes in the number of customer sites within each ICD compared to the 2010 Determination are also a factor.648
The ACCC’s draft decision on the level of rebate to each ICD is set out in Table 8-16
State Water also proposed a sliding scale for rebates, whereby the rebate received in any one year depends on the volumetric entitlement held by the ICD.649 State Water stated:650
The Water Market Rules enable ICD customers to transform their water entitlements, meaning that these entitlements will effectively be transformed out of the ICD and become entitlements held by other State Water customers, who are likely to be new customers to State Water. This will directly reduce the economies of scale currently associated with the metering and billing activities undertaken by ICDs, and therefore ICD rebates should be reduced accordingly.
The ACCC considers that transformation does not necessarily reduce the customer base of an ICD to the extent suggested by State Water. When an irrigator transforms its irrigation right into a water access entitlement, this transformation does not automatically extinguish the irrigator’s right to have water delivered. The ACCC’s Water Monitoring Report illustrates that since transformation was enabled by the Water Market Rules in 2009, in most cases irrigators who transform do not transform the totality of their irrigation right and not all transformations result in terminations.651 That is, customers may transform all or part of their irrigation right but continue to irrigate by maintaining their right to have water delivered and sourcing water from remaining irrigation rights and / or buying water allocations.
The ACCC has not accepted State Water’s proposed sliding scale for rebates as it considers that the calculation of rebates for the ACCC’s draft decision reasonably accounts for the number of irrigators who continue to be customers of ICDs after transformation. This is because the calculation of avoided costs of installing telemetry and data transfer is based on customer sites.
Table 8-16 sets out the ACCC’s draft decision on rebates to ICDs for the 2014-15 to 2016-17 regulatory period. Table 8-18 shows the difference in the level of rebates as determined by the ACCC compared to the current 2013-14 rebate.
648 The number of customer sites within the ICD is calculated by dividing the entitlements within each ICD by the average number of entitlements per licence holder (excluding ICDs) in each of the relevant valleys (Murray, Murrumbidgee and Lachlan). This same methodology that was used by IPART for the 2010 Determination.
649 State Water Corporation, Pricing application to the ACCC for regulated charges to apply from 1 July 2014, p 160.650 Ibid, p 160.651 ACCC, Water Monitoring Reports, 2009–10, chapter 8; 2010–11, chapter 7; 2011–12, chapter 3.
227 ACCC Draft decision on State Water Pricing Application: 2014-15 – 2016-17 | Attachments
Table 8-16: ACCC draft decision- Annual ICD rebates for 2014-15 to 2016-17Entitlements
(ML)2014/15
($2013-14)2015/16
($2013-14)2016/17
$(2013-14)Jemalong
99,087 68,154 62,360 59,988
Murray Irrigation1,392,519 914,220 852,753 827,006
Western Murray48,657 31,944 29,797 28,897
West Corurgan77,278 50,735 47,324 45,895
Moira38,615 25,352 23,647 22,933
Eagle Creek13,620 8,942 8,341 8,089
Murrumbidgee Irrigation1,198,779 354,395 326,168 314,465
Coleambally Irrigation526,074 155,523 143,136 138,001
Total1,609,264 1,493,526 1,445,273
Source: ACCC analysis
Table 8-17: ACCC – Draft Decision ICD rebates: percentage change relative to 2013–14 ICD rebates*
Current rebate 2013/14 ($2013/14)
2014/15 (% change relative to current rebate)
2016/17 (% change relative to current rebate)
2014/15 (% change relative to current rebate)
Jemalong 89,674 -24% -30% -33%Murray Irrigation 963,678 -5% -12% -14%Western Murray 39,533 -19% -25% -27%West Corurgan 52,165 -3% -9% -12%Moira 25,325 0% -7% -9%Eagle Creek 11,076 -19% -25% -27%Murrumbidgee Irrigation 831,003 -57% -61% -62%Coleambally 367,927 -58% -61% -62%Total 2,380,379 -32% -37% -39%*All amounts converted in $2013–14 before calculation of percentage change.Source: ACCC’s calculation from State Water data (Pricing application, June 2013, 161); State Water response to information request #34, 17/01/2014; and IPART data (IPART final decision, June 2010, p.151)
8.5.2 Fish River chargesThe ACCC’s draft decision is to:
not approve State Water’s proposal to transition its charges for Fish River to an 80:20 fixed to variable tariff structure. The ACCC has determined that the current 55:45 tariff structure continue to apply to Fish River charges in the 2014-17 regulatory period.
approve State Water’s proposal to:
replace the current two-tiered usage charge for major customers in Fish River with a single tier charge; and
introduce an annual water service charge for minor customers in Fish River.
The ACCC notes that charges levied to Lithgow and Oberon councils and Sydney Catchment Authority are not regulated charges under Section 91(3) of the Water Act 2007. Accordingly the ACCC cannot determine charges for these customers. However, the ACCC has agreed with IPART to include all Fish River scheme charges in the ACCC’s review. The ACCC’s view on charges not covered by the Water Act 2007 is set out in the ACCC’s decision on Fish River.
ACCC Draft decision on State Water Pricing Application: 2014-15 – 2016-17 | Attachments 228

State Water proposal for Fish River
State Water proposed to transition the Fish River charges to an 80:20 fixed to variable tariff structure. State Water also proposed changes to regulated charges for the Fish River scheme, including:
replace the two-tiered usage charge for major customers with a single tier652
the introduction of an annual water service charge for minor customers; and
the introduction of connection and disconnection fees (The ACCC’s decision on connection and disconnection fees for Fish River is set out in Attachment 9 on Metering charges).
Background to Fish River charges is set out in Appendix B.
ACCC draft decision for Fish River
Tariff structure
As discussed in section 8.3 the ACCC has found that the current 40:60 tariff structure in MDB valleys better contributes to the BWCOP. The ACCC considers that its reasoning is also relevant to the current 55:45 tariff structure in Fish River. That is, the ACCC considers that the current tariff structure in Fish River in conjunction with the ACCC’s proposed form of price control will adequately address any risk to State Water of revenue under recovery as a result of volatility in water availability.
Consequently, the ACCC does not approve State Water’s proposal to transition to an 80:20 tariff structure in the 2014-17 regulatory period in Fish River. The ACCC’s draft decision is to maintain the current 55:45 tariff structure in Fish River for 2014-17 next regulatory period.
The ACCC received two submissions on Fish River charges. Energy Australia NSW Pty Ltd did not support an 80:20 tariff structure proposed by State Water.653 The Sydney Catchment Authority (SCA) supported State Water’s proposal.
Single tier usage charge for major customers
Currently, State Water levies two–tiers of usage charges in Fish River. The first tier applies to water usage up to the Maximum Annual Quantity (MAQ). The second tier applies to water usage above the MAQ. In proposing to change the two-tiered usage charge for major customers to a single tier (up to the MAQ), State Water submitted that these customers will not be permitted to extract water above their MAQ under the new water sharing plan for Fish River.
The ACCC assessed this information by reviewing the current Fish River water sharing plan. The ACCC found that the current water sharing plan prevents major customers from extracting water above their MAQ. Under the current water sharing plan, the MAQ is defined as the maximum volume of water that can be extracted by each major customer. This volume cannot be exceeded except through carry-over arrangements from one year to the next.
652 Under the new water sharing plan, major customers will not be permitted to extract water above their MAQ, except through carryover rules from one year to the next. This would make the second tier usage charge redundant for these customers.
653 On 2 September 2013, the NSW Government sold all its interest in the Wallerawang and Mt Piper power stations to Energy Australia. Delta Electricity now trade under the company name of Energy Australia NSW Pty Ltd. (submission from Energy Australia 26 September 2013).
229 ACCC Draft decision on State Water Pricing Application: 2014-15 – 2016-17 | Attachments

Based on information provided by State Water and the ACCC’s assessment, the ACCC approves the replacement of a two–tiered usage charge for Fish River major customers with a single tier usage charge as proposed by State Water for the 2014-17 regulatory period.
Annual water service charge for minor customers
The annual water service charge is an access charge which State Water proposed to set assuming a deemed MAQ for individual minor customers of 200kl. It is a fixed dollar amount (i.e. $/per annum). The ACCC notes that the current access charge for minor customers is a $/kL charge, but is based on a deemed MAQ of 200kL.
The ACCC has reviewed State Water’s methodology for calculating the annual usage charge for minor customers and found that the proposed fixed charge is calculated by multiplying the current $/kl charge by the MAQ of 200kl for a minor customers. The ACCC considers this charge is consistent with the current charge, but instead of being a $ per kl charge for a deemed MAQ of 200kl, State Water has proposed a fixed annual charge equivalent to the previous charge. The ACCC approves this charge. The ACCC draft decision for Fish River charges is set out in section 8.1, Table 8-4 and Table 8-5.
8.5.3 Lowbidgee flood control and Irrigation District chargesThe ACCC approves State Water’s proposed fixed charge for Lowbidgee for the 2014-15 regulatory period. The ACCC also approves State Water’s proposal to apply a usage charge equal to the applicable rate in the Murrumbidgee valley when a supplementary event occurs. The ACCC considers that any revenue raised through Lowbidgee usage charges should be included in the ‘unders and overs’ account (as discussed in attachment 10) for the Murrumbidgee Valley so that the revenue recovered by State Water will not be in excess of both the Murrumbidgee Valley and Lowbidgee revenue requirements.
State Water proposal
State Water proposed to introduce a two-part tariff arrangement for Lowbidgee based on full cost recovery over the 2014-17 regulatory period; that is, applying a fixed charge and a usage charge. 654
Under State Water’s proposal, the fixed charge would be applied to entitlement holders, with revenue contributing to the costs of running the Lowbidgee system.
State Water also proposed that as a result of the creation of the new supplementary licences, entitlement holders would also be required to pay a usage charge equal to the applicable rate in the Murrumbidgee valley when a supplementary event (e.g. excess water due to high rainfall) occurs. State Water proposed that revenue raised from this usage charge on Lowbidgee customers would contribute towards the costs of its services in the Murrumbidgee Valley (the original source of water supplied to Lowbidgee customers) on the basis that this is consistent with the charging arrangements for other Murrumbidgee supplementary licence holders.
Background to State Water’s proposal
654 State Water Corporation, Pricing application to the ACCC for regulated charges to apply from 1 July 2014, pp.158.
ACCC Draft decision on State Water Pricing Application: 2014-15 – 2016-17 | Attachments 230

The Lowbidgee Flood Control and Irrigation District (Lowbidgee region) is situated in the far west of the Murrumbidgee River catchment and extends over 163,000 hectares. To date capital works in the Lowbidgee region have been funded by revenue raised through a $4.10 per hectare area charge levied by State Water and through government grants.655 In October 2012, the NSW Office of Water (NOW) released an amendment to the Murrumbidgee Water Sharing Plan to create rules for water diversions to the Lowbidgee region. The amendment created a new set of supplementary licences which are co-held by each of the landholders in the Lowbidgee region based on land entitlement areas. The new licences commenced operation in October 2012.
ACCC draft decision for Lowbidgee flood control and Irrigation District charges
The ACCC received no submissions on proposed new charges for the Lowbidgee region. The ACCC reviewed the calculation of State Water’s proposed fixed charge for Lowbidgee and found that the proposed fixed charge recovers 100 per cent of the Lowbidgee revenue requirement.
The ACCC understands that the usage charge will be levied on Lowbidgee customers only when a supplementary event occurs. State Water did not provide any water extraction forecasts for Lowbidgee.
Since State Water’s proposed fixed charge for Lowbidgee recovers 100 per cent of the revenue requirement for Lowbidgee, any revenue recovered from the usage charge would be in excess of the Lowbidgee revenue requirement. State Water has advised that the usage charge will only apply when there is excess water in Murrumbidgee. State Water is unable to forecast when and if this will occur and how much excess water would be available.656
The ACCC notes that State Water proposes that the revenue raised from the Lowbidgee usage charge would contribute to the recovery of costs in the Murrumbidgee Valley. The usage charge for the Murrumbidgee Valley is based on the revenue requirement and forecast water extractions for Murrumbidgee Valley. Therefore any revenue raised from supplementary usage at Lowbidgee will be in excess of both the Murrumbidgee Valley and Lowbidgee revenue requirements.
Accordingly, the ACCC has determined that revenue raised through Lowbidgee usage charges will be included in the ‘unders and overs’ account (as discussed in Attachment 10) for the Murrumbidgee Valley so that the revenue recovered by State Water will not be in excess of both the Murrumbidgee Valley and Lowbidgee revenue requirements.
8.5.4 Peel ValleyTable 8-18 sets out charges for Peel Valley determined by the ACCC on the basis of a full cost recovery approach. The charges are based on the revenue requirement determined by the ACCC for the Peel Valley (attachment 1) and the volume forecast as determined in attachment 7. They are also consistent with the ACCC’s decision on the 40:60 ratio and the conversion factor.
Table 8-18: ACCC determined prices based on full cost recoveryPeel Valley Full cost recovery
tariffs for 2014-15 ($ Real 2013-14)
2014-15 prices compared to 2013-14 prices (%
655 Ibid, pp. 157.656 ACCC – File note: on communication with State Water 13-11-2013
231 ACCC Draft decision on State Water Pricing Application: 2014-15 – 2016-17 | Attachments

change)High security charge 26.14 3.8General security charge 2.65 (4.3)Usage charge 71.92 72.8Source: ACCC calculations
The ACCC notes that despite the ACCC’s draft decision to maintain the 40:60 fixed to variable tariff structure and the approach to calculating high security entitlements, charges for the Peel Valley are notably high compared to other MDB valleys if based on full cost recovery.
The Peel Valley Association submitted that the price increases in the Peel Valley proposed by State Water are excessive and a perverse pricing outcome. It added that prices should be more closely aligned with the surrounding valleys.
The ACCC considered whether it would be possible to reduce charges in the Peel Valley by applying an alternative methodology for forecasting water extractions based on the potential for the Chaffey Dam extension to positively impact on water extractions in the 2014-17 regulatory period. However, analysis shows that a material positive change to water extractions as a result of increased storage capacity is unlikely to occur before the regulatory period commencing in 2017-18.657
The ACCC notes that historically, prices in the Peel Valley have been set below full cost recovery. In its 2006-10 price determination, IPART stated:
In some valleys full cost recovery could not be achieved without substantial increases in tariffs that would have damaging impacts on users. In some instances (e.g. North Coast, South Coast and Peel), the Tribunal considers that cost reflectivity will never be achieved. In such instance, it considers State Water should review the future of these services and consult with government in those cases where it considers that the service could be recognised as a community service obligation.658
IPART has subsequently stated that State Water and the NSW Government should assess the long term viability of its operations in valleys such as Peel Valley that are below full cost recovery. 659 It added that in the interim, the NSW Government would need to fund the revenue shortfall as it had done for the 2006-10 determination.660
In its 2010-14 price determination, IPART adopted a price setting approach that capped average valley bill increases for general security customers to 10 per cent real per annum in the Peel Valley. 661
This was achieved through a subsidy to State Water’s operating costs in the Peel Valley determined by the NSW Government.
The ACCC considers that the NSW Government should give consideration to the continuation of a subsidy for the Peel Valley in the 2014-17 regulatory period. Such a subsidy would be consistent with the BWCOP’s recognition of the need for community service obligations (subsidies) where full cost recovery is unlikely to be achieved.
In principle, the ACCC supports valley based cost reflective pricing. However, irrigators in the Peel would face a price shock if the ACCC moved to full cost recovery immediately, with an increase in usage charges of around 70 per cent over the 2014-17 regulatory period. The ACCC has addressed
657 State Water, Response to the ACCC’s information request 18, Responses to questions on metering, 12-13 extractions, CARM benefits and impact of dam upgrades on water availability, 18 October 2013, p.3.
658 IPART, Bulk Water Prices for State Water Corporation and Water Administration Ministerial Corporation Water from 1 October 2006 to 30 June 2006 – Final report, September 2006, p.9.
659 IPART, Review of bulk water charges for State Water Corporation from 1 July 2010 to 30 June 2014 – Final report, June 2010, p.149.
660 Ibid, p.149.661 Ibid, pp.149–150.
ACCC Draft decision on State Water Pricing Application: 2014-15 – 2016-17 | Attachments 232

this perverse outcome by capping the price increase over the regulatory period at 10% annually. This is set out Table 8-19 below.
Should the NSW Government decide to continue a subsidy for the Peel Valley, the ACCC will reflect this outcome when determining State Water’s revenue allowance in the final decision.
Table 8-19: ACCC determined prices for Peel Valley capped at 10 per centPeel Valley ACCC determined
prices for 2014-15 ($ Real 2013-14)
2014-15 prices compared to 2013-14 prices (% change)
High security charge ($/ML) 27.58 10.0General security charge ($/ML) 3.03 10.0Usage charge ($/ML delivered) 45.56 10.0Source: ACCC calculations. Note: the 10 per cent price increase was applied to the ACCC’s calculations of the Peel Valley
prices for 2013-14 excluding any MDBA costs.
233 ACCC Draft decision on State Water Pricing Application: 2014-15 – 2016-17 | Attachments

9 Metering and miscellaneous chargesIn addition to its bulk water charges, State Water proposes to levy charges for the provision of the following services:
Metering at State Water-owned meters662
Metering at customer-owned unregulated river and groundwater meters663
Metering (gauging) at environmental water in-river gauging stations.664
Figure 9-1 outlines the operation of the different metering charges proposed by State Water.
The ACCC considers that the following charges are not regulated charges that are subject to Part 6 of the Water Charge (Infrastructure) Rules 2010:
Metering charges for State Water-owned meters, where the charge is imposed for metering at unregulated river and groundwater meters
Metering charges for customer-owned unregulated river and groundwater meters.
The ACCC considers that these charges are not for services provided in relation to water storage or delivery infrastructure. Therefore, the ACCC does not have a role in approving or determining these charges.
Further, while the charges assessed in this attachment have state-wide application and are not differentiated by location, the ACCC’s role in approving or determining charges only extends to services in the MDB. Therefore, the ACCC’s determination may not extend to metering charges for meters located outside the MDB.
Charges not approved or determined by the ACCC may be regulated by IPART.
662 State Water Corporation, Pricing Application to the Australian Competition and Consumer Commission for Regulated Charges to Apply from 1 July 2014, June 2013 (State Water application), p.168–170.
663 State Water application, p.181.664 State Water application, p.181.
ACCC Draft decision on State Water Pricing Application: 2014-15 – 2016-17 | Attachments 234
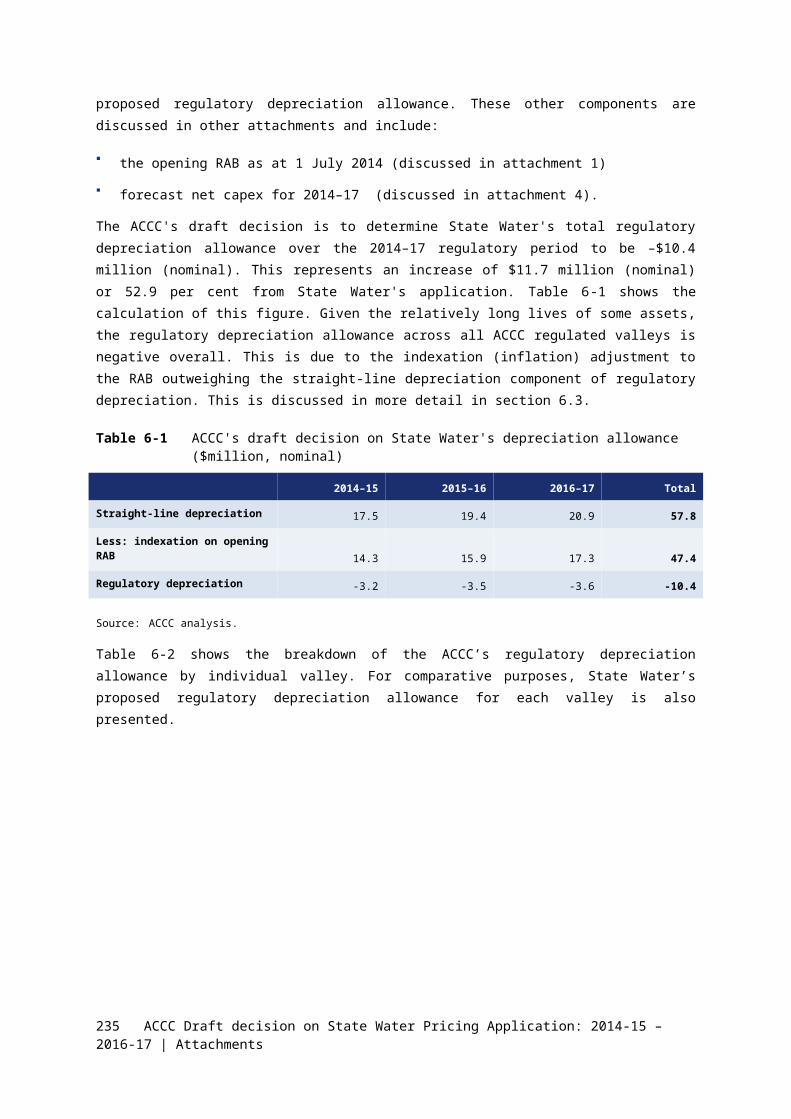
Figure 9-1 Application of the metering charges proposed by State Water
Source: ACCC calculations
235 ACCC Draft decision on State Water Pricing Application: 2014-15 – 2016-17 | Attachments
Customers using a State Water-owned
meter
Metering reading charge
for unregulated
and groundwater customers
No additional charge (meter reading costs
recovered through bulk water charge)
Metering service charge
Regulated river
customers
Unregulated river &
groundwater
customers
Customers using a
customer-owned meter
Extractive customers
Non-extractive
(environmental) customers
Regulated river
customers
Unregulated river &
groundwater
customers
Charges regulated by the ACCC under Part 6 of the WCIR
Charges not regulated by the ACCC under Part 6 of the WCIR
Environmental gauging
station charge

In addition to its bulk water charges and metering charges, State Water proposes to levy charges for the provision of the following services:
Connection and disconnection to the Fish River water supply scheme665
Processing of water allocation trades666
Yanco Creek natural resource management.667
The charges assessed in this attachment have state-wide application and are not differentiated by valley, but the ACCC’s role in approving or determining charges only extends to services in the MDB. Charges not approved or determined by the ACCC may be regulated by IPART.
9.1 Metering charges9.1.1 Metering charges and the NSW metering scheme
The NSW metering scheme is a program to replace customer-owned meters with new meters owned and operated by State Water. The scheme aims to assist irrigators in upgrading their meters to comply with the national metrological framework, as well as to achieve efficiencies through higher accuracy and remotely-read meters. Under the scheme the Commonwealth and NSW governments have offered to fund the initial cost of buying and install the meters.668 In exchange, the Commonwealth and NSW governments will retain a portion of the water savings achieved from the new meters. The remaining water savings will be left in the water system to improve reliability for existing entitlements.669
Currently, the NSW metering scheme has only been undertaken in pilot programs in the Murray and Murrumbidgee valleys. State Water first levied a metering service charge, approved by IPART, on customers that use a State Water-owned meter installed under these pilot programs in the current regulatory period. State Water is proposing to expand the coverage of its metering service charges to all of its valleys as the scheme is rolled out more extensively over the 2014-15 to 2016-17 period.670
The ACCC understands that the NSW metering scheme is a voluntary scheme. The NSW government is in the process of revising water access licence conditions to reflect the national metrological framework, and State Water’s customers may then be required to use an upgraded meter that complies with the framework.671 The NSW metering scheme provides an opportunity for customers to upgrade to a compliant meter owned by State Water for which the purchase and installation costs are funded by the Commonwealth and NSW governments. Customers that do not opt into the NSW metering scheme may be required to ensure they utilise a compliant meter.
State Water submits that some customers in northern valleys have expressed an interest in alternatives to accepting government-funded meters in exchange for the water entitlements created from the water savings achieved by the meters.672 To accommodate these customers, State Water has created an option for customers that opt out of the NSW metering scheme to (if an upgrade is required) fund their own meter upgrade or use a State Water-owned meter that has been funded by State Water independent from the NSW metering scheme.673 These State Water-funded meters will 665 State Water application, p.184.666 State Water application, p.183.667 State Water application, p.185.668 State Water Corporation, NSW Metering Scheme Fact Sheet 1: A National Water Initiative, A State Solution.669 NSW Office of Water, NSW Sustaining The Basin Metering Project: Business Case, June 2010, page iv.670 State Water application, p.165–166.671 NSW Office of Water, Letter to holders of water supply works approvals explaining changes to terms and conditions
of water supply works approvals, November 2011.672 State Water application, p.167.673 State Water application, p.169.
ACCC Draft decision on State Water Pricing Application: 2014-15 – 2016-17 | Attachments 236

be funded by creating separate metering service charges for State Water-funded meters and included the capital cost components of these meters in the metering service charges for these customers.674
The metering service charges are to be paid by each customer who receives a new State Water-owned meter as their nominated works675 (irrespective of whether or not the State Water-owned meter was funded by the government). Metering service charges cover the costs of operating, maintaining, and reading the State Water-owned meters as well as the provision, maintenance, and operation of information systems to process water meter data.676 Customers that do not join the NSW metering scheme retain their existing customer-owned meter as their nominated works. These customers do not pay the metering service charge, but may pay other charges that cover the costs of State Water reading these customer-owned meters for billing and compliance purposes (maintenance costs remain the responsibility of customer that owns the meter).677 Customers that extract water from unregulated river or groundwater sources and use a customer-owned meter will be liable to pay the State Water metering charge for customer-owned unregulated and groundwater meters.678 For customers that extract water from regulated river sources and use a customer-owned meter, State Water’s bulk water charge covers the costs of State Water reading these meters.679 These arrangements are shown in Figure 9-1. The number of customer-owned meters is forecast to decline as the new government-funded meters are rolled out across NSW.
9.1.2 Metering charges for regulated river customersState Water’s proposed metering service charges for the 2014–17 period are set out in Table 9-2 and Table 9-3 for government-funded and State Water-funded meters respectively.680 State Water is proposing to significantly change both the structure and level of the metering service charges from those currently imposed in the pilot areas.681 State Water’s current charges are shown in Table 9-1.
Table 9-1 Metering service charges – current chargesType of meter Annual charge per meterElectromagnetic meter without mobile phone or satellite telemetry coverage $219.78Electromagnetic meter with mobile phone telemetry coverage $296.80Electromagnetic meter with satellite telemetry coverage $620.31Channel meter with mobile phone telemetry coverage $620.31Channel meter with satellite telemetry coverage $620.31Source: State Water Corporation, Pricing application to the Australian Competition and Consumer Commission for
regulated charges to apply from 1 July 2014, June 2013, page 165.
State Water is proposing to change its charging structure by expanding the differentiation of meter types from 5 to 36, and by creating the option of State Water-owned meters funded independent from the NSW metering scheme. An indication of the change in price level is given by comparing the current annual charge of $296.80 for the most common meter type (electromagnetic meter with mobile phone telemetry coverage) with the proposed charge of $587.94 for median-sized meters (250mm) in 2014-15 – about 79% higher after adjusting for inflation.674 State Water application, p.179.675 All water entitlement holders must nominate a water supply works to be linked to their water entitlement. A water
supply works is a pump, bore, meter, etc that is authorised to take water under the water access licence. The water supply works must be authorised by a water supply works approval [NSW Office of Water, Guide to water access licences and certificates, May 2010, page 7].
676 State Water application, p.165–166.677 State Water application, p.173.678 State Water application, p.181–182.679 State Water application, p.173.680 State Water application, p.168–169.681 State Water’s current metering service charges were determined by IPART. The current schedule has different
charges for several different modes of telemetry (e.g. mobile phone versus satellite) but no difference due to size of meter. Table 15.1 in State Water’s pricing application outlines its current metering service charges. The proposed schedule has different charges for 17 sizes of electromagnetic meter, and one for channel meters. [State Water application, p.165.
237 ACCC Draft decision on State Water Pricing Application: 2014-15 – 2016-17 | Attachments

To reach its draft decision, the ACCC has applied the base-and-step assessment approach outlined in section 2. We used this approach to assess the appropriateness of State Water’s proposed metering service charges and (if necessary) to determine appropriate substitute charges.
The ACCC’s draft decision is to not approve State Water’s proposed metering service charges. The ACCC's reasons are detailed in this attachment and can be summarised as follows:
State Water’s forecast operating costs are too high compared to historical costs of operating and maintaining meters in Murray and Murrumbidgee valleys.
State Water’s initial input cost assumptions for capital costs are reasonable as they are based on an appropriate cost build-up and revealed unit rates, with the exception of the return on capital, which has been adjusted consistent with the ACCC’s decision on bulk water charges.
State Water’s method of modelling cost-based charges does not accurately account for capital costs.
The ACCC’s reasons are further detailed in sections 9.2.1 and 9.2.2 below. The ACCC’s draft decision is to determine the metering service charges as shown in:
Table 9-2 for government-funded meters for the next regulatory period.
Table 9-3 for State Water-funded meters for the next regulatory period.
ACCC Draft decision on State Water Pricing Application: 2014-15 – 2016-17 | Attachments 238

Table 9-2 Metering service charges — government-funded metersType of meter State Water’s proposal ACCC draft decision
2014–15 2015–16 2016–17 2014–15 2015–16 2016–17
50 mm with telemetry 529.64 529.73 527.63 197.63 204.57 211.4780 mm with telemetry 529.72 529.81 527.70 197.70 204.71 211.67100 mm with telemetry 530.16 530.29 528.10 198.14 205.46 212.75150 mm with telemetry 554.45 554.63 552.29 207.41 215.32 223.18200 mm with telemetry 581.84 582.06 579.65 217.53 225.71 233.85250 mm with telemetry 587.94 588.22 585.67 220.19 228.90 237.56300 mm with telemetry 589.10 589.47 586.71 221.33 230.90 240.40350 mm with telemetry 599.68 600.38 596.81 227.87 240.60 253.26400 mm with telemetry 662.51 663.47 659.29 252.63 267.78 282.84450 mm with telemetry 801.16 802.19 797.84 303.25 319.06 334.78500 mm with telemetry 810.55 811.73 807.04 307.81 324.99 342.07600 mm with telemetry 848.42 849.87 844.52 323.69 343.46 363.11700 mm with telemetry 861.19 862.92 856.91 330.52 352.87 375.09750 mm with telemetry 862.16 863.97 857.77 331.48 354.55 377.48800 mm with telemetry 904.11 906.34 899.13 350.05 377.12 404.01900 mm with telemetry 968.11 970.48 962.95 374.24 402.57 430.721000 mm with telemetry 971.29 973.91 965.79 377.40 408.06 438.54Channel with telemetry 9,844.49 9,847.21 10,040.26 3,591.49 3,634.04 3,686.41
50 mm without telemetry 557.87 557.96 555.86 207.82 214.76 221.6780 mm without telemetry 557.95 558.04 555.93 207.90 214.90 221.86100 mm without telemetry 558.39 558.52 556.33 208.33 215.66 222.94150 mm without telemetry 582.68 582.86 580.52 217.60 225.51 233.37200 mm without telemetry 610.07 610.29 607.88 227.72 235.90 244.04250 mm without telemetry 616.17 616.45 613.90 230.38 239.09 247.75300 mm without telemetry 617.33 617.70 614.94 231.53 241.09 250.59350 mm without telemetry 627.91 628.61 625.04 238.06 250.79 263.45400 mm without telemetry 690.74 691.70 687.52 262.82 277.97 293.03450 mm without telemetry 829.62 830.65 826.30 313.52 329.33 345.05500 mm without telemetry 839.01 840.19 835.49 318.08 335.26 352.34600 mm without telemetry 876.87 878.33 872.98 333.97 353.73 373.38700 mm without telemetry 889.64 891.37 885.36 340.79 363.14 385.36750 mm without telemetry 890.61 892.42 886.23 341.76 364.82 387.75800 mm without telemetry 932.56 934.80 927.59 360.32 387.39 414.29900 mm without telemetry 996.57 998.94 991.41 384.51 412.84 441.001000 mm without telemetry 999.75 1,002.37 994.25 387.67 418.34 448.82Channel without telemetry n.a. n.a. n.a. n.a. n.a. n.a.
Source: ACCC calculations
239 ACCC Draft decision on State Water Pricing Application: 2014-15 – 2016-17 | Attachments

Table 9-3 Metering service charges – State Water-funded metersType of meter State Water’s proposal ACCC draft decision
2014–15 2015–16 2016–17 2014–15 2015–16 2016–17
50 mm with telemetry 1,620.97 2,013.78 1,945.63 1,127.82 1,134.76 1,141.6780 mm with telemetry 1,628.92 2,025.31 1,956.85 1,135.70 1,142.70 1,149.66100 mm with telemetry 1,673.29 2,089.67 2,019.45 1,179.69 1,187.01 1,194.30150 mm with telemetry 1,777.15 2,229.72 2,156.31 1,267.84 1,275.75 1,283.61200 mm with telemetry 1,841.57 2,310.99 2,236.09 1,314.66 1,322.84 1,330.98250 mm with telemetry 1,919.55 2,421.67 2,343.90 1,388.57 1,397.28 1,405.94300 mm with telemetry 2,036.40 2,591.16 2,508.75 1,504.42 1,513.98 1,523.48350 mm with telemetry 2,478.14 3,229.03 3,129.36 1,938.37 1,951.10 1,963.76400 mm with telemetry 2,870.32 3,771.04 3,658.19 2,289.63 2,304.78 2,319.84450 mm with telemetry 3,098.73 4,040.28 3,923.84 2,429.22 2,445.04 2,460.76500 mm with telemetry 3,294.13 4,320.29 4,196.39 2,618.17 2,635.35 2,652.43600 mm with telemetry 3,683.51 4,869.58 4,731.61 2,982.52 3,002.29 3,021.94700 mm with telemetry 4,047.98 5,394.05 5,242.00 3,338.01 3,360.36 3,382.58750 mm with telemetry 4,146.20 5,536.50 5,380.56 3,435.37 3,458.44 3,481.37800 mm with telemetry 4,731.65 6,369.21 6,191.50 3,992.73 4,019.80 4,046.70900 mm with telemetry 4,967.66 6,683.46 6,498.86 4,187.43 4,215.76 4,243.921000 mm with telemetry 5,289.05 7,149.60 6,952.27 4,506.03 4,536.70 4,567.18Channel with telemetry 15,895.78 18,543.67 18,481.34 9,438.62 9,481.18 9,533.54
50 mm without telemetry 1,214.84 1,513.27 1,486.09 859.08 866.03 872.9380 mm without telemetry 1,222.78 1,524.79 1,497.31 866.96 873.96 880.93100 mm without telemetry 1,267.16 1,589.16 1,559.91 910.95 918.28 925.56150 mm without telemetry 1,371.01 1,729.21 1,696.78 999.10 1,007.01 1,014.87200 mm without telemetry 1,435.43 1,810.47 1,776.55 1,045.92 1,054.11 1,062.24250 mm without telemetry 1,513.42 1,921.15 1,884.36 1,119.84 1,128.55 1,137.21300 mm without telemetry 1,630.27 2,090.64 2,049.21 1,235.68 1,245.24 1,254.75350 mm without telemetry 2,072.00 2,728.51 2,669.82 1,669.63 1,682.36 1,695.02400 mm without telemetry 2,464.19 3,270.53 3,198.65 2,020.89 2,036.04 2,051.11450 mm without telemetry 2,692.83 3,539.99 3,464.52 2,160.57 2,176.38 2,192.10500 mm without telemetry 2,888.22 3,820.00 3,737.08 2,349.52 2,366.70 2,383.78600 mm without telemetry 3,227.60 4,369.29 4,272.30 2,713.87 2,733.64 2,753.28700 mm without telemetry 3,642.08 4,893.76 4,782.69 3,069.36 3,091.71 3,113.92750 mm without telemetry 3,740.29 5,036.21 4,921.25 3,166.72 3,189.78 3,212.71800 mm without telemetry 4,325.75 5,868.92 5,732.19 3,724.08 3,751.14 3,778.04900 mm without telemetry 4,561.76 6,183.17 6,039.55 3,918.78 3,947.11 3,975.261000 mm without telemetry 4,883.14 6,649.31 6,492.96 4,237.38 4,268.05 4,298.53Channel without telemetry n.a. n.a. n.a. n.a. n.a. n.a.Source: ACCC calculations
Meter operating and maintenance costs
The current metering service charges were approved by IPART in 2010 and were based on cost estimates made prior to the start of the pilot programs. These estimates were prepared by Nayar Consulting for the NSW Department of Water and Energy in September 2009. State Water submitted that it is now apparent that the current charges will significantly under-recover costs incurred. State Water’s proposed charges for the next regulatory period are based on new cost forecasts by Adasa. State Water submitted that the previous (Nayar) cost estimates were not in accordance with the national metrological assurance framework and Australian Standard 4747: Meters for non-urban water supply.682
682 State Water application, p. 165.
ACCC Draft decision on State Water Pricing Application: 2014-15 – 2016-17 | Attachments 240
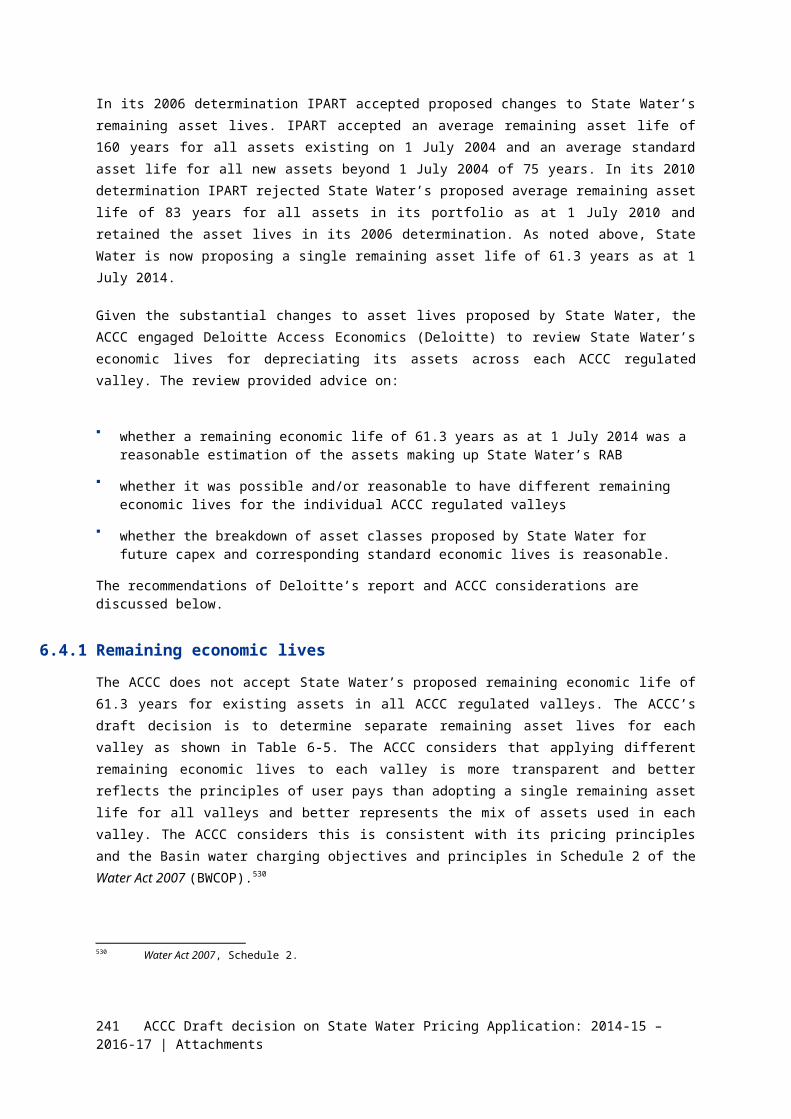
The ACCC notes that the previous (Nayar) analysis was based on the assumption that all meters installed under the NSW metering scheme will be subject to the maintenance and validation requirements of the National Standards, which had been released in 2008.683 However, the standards are not prescriptive on matters such as the frequency of maintenance visits, and the revised assumptions about such frequencies and costing rates result in a significantly higher total cost per meter.
State Water’s costs to date of operating and maintaining meters installed in the Murray and Murrumbidgee pilot programs have been much lower than State Water’s forecasts for the next regulatory period. State Water submitted that it installed 1,216 meters up to September 2013 under the NSW metering scheme. State Water submitted that in operating and maintaining these meters it incurred costs of $85,000 in 2012–13 and $90,000 for the first three months of 2013–14. 684 This suggests an average cost per meter of up to $296, well below the average cost per meter of $843 proposed by State Water, and in line with the average revenue per meter from the current charges.
The ACCC understands that the meters installed in the pilot programs are comparable to those to be installed in other valleys, as in both cases the meters must comply with the national water meter standards and NSW interim metering standards. State Water did not provide historical costs disaggregated into the same cost components that it used to forecast future meter costs. Consequently, the ACCC is unable to ascertain the particular operating and maintenance activities that State Water forecasts to be more costly than has been experienced to date.
State Water submitted that a continuation of the current charges would only allow State Water to provide a minimal level of service.685 However, it appears that customers do not demand a higher level of service above the minimum national water metering standards. All customer groups who commented on the meter service charges opposed the increases to the charges.686 Lachlan Valley Water, Gwydir Valley Irrigators’ Association, South West Water Users Association, and NSW Irrigators’ Council argued that there should be no increase in charges until firm actual data becomes available.687 Gwydir Valley Irrigators’ Association, Murrumbidgee Private Irrigators, and the NSW Irrigators’ Council commented that State Water’s forecast maintenance costs were excessive, in some
683 Nayar Consulting, Assessment of Annual Operation and Maintenance Costs for the NSW (Hawkesbury Nepean and NSW Murray-Darling Basin) Metering Scheme – Final, 16 September 2009.
684 State Water Corporation, Response to 26.1 to ACCC information request, received 1 November 2013, pp. 3–4. 685 State Water application, p. 165.686 NSW Irrigators’ Council, Submission to the Australian Competition and Consumer Commission on State Water
Corporation’s Pricing Application to the Australian Competition and Consumer Commission for Regulated Charges to Apply From 1 July 2014, September 2013, p. 54; Border Rivers Food and Fibre, Submission to the ACCC on The State Water Pricing Determination, September 2013, p. 3; Gwydir Valley Irrigators’ Association Inc., Submission to the Australian Competition and Consumer Commission on State Water Corporation’s Pricing Application to the Australian Competition and Consumer Commission for Regulated Charges to Apply From 1 July 2014 , September 2013, p. 22; Namoi Water, Submission to the Australian Competition and Consumer Commission on State Water Corporation Pricing Application, September 2013, p. 8; Peel Valley Water Users’ Association Inc., Submission to the Australian Competition and Consumer Commission on the proposed State Water bulk water pricing 2014 to 2017 , September 2013, pp. 18–19; Lachlan Valley Water Inc., Submission to ACCC on State Water Regulated Charges 2014-2017, September 2013, p. 25; Murrumbidgee Private Irrigators Inc., Draft Submission to Australian Competition and Consumer Commission on State Water Corporation Pricing Application to the ACCC for regulated charges to apply from 1 July 2014, September 2013, p. 3; Kalamunda Pastoral Company, Submission to ACCC review of State Water’s regulated charges to apply from 1 July 2014, September 2013, p. 2; Carberry & Sons, Submission to ACCC water pricing in the Namoi Valley, September 2013, p. 3.
687 NSW Irrigators’ Council, Submission to the Australian Competition and Consumer Commission on State Water Corporation’s Pricing Application to the Australian Competition and Consumer Commission for Regulated Charges to Apply From 1 July 2014, September 2013, p. 54; Gwydir Valley Irrigators’ Association Inc., Submission to the Australian Competition and Consumer Commission on State Water Corporation’s Pricing Application to the Australian Competition and Consumer Commission for Regulated Charges to Apply From 1 July 2014, September 2013, page 22; South West Water Users, Submission to ACCC Enquiry on State Water Pricing Proposals, September 2013, page 1.
241 ACCC Draft decision on State Water Pricing Application: 2014-15 – 2016-17 | Attachments

cases more than the installation cost.688 Further, State Water did not provide any evidence to suggest that it has not been compliant with the required standards to date with its current level of expenditure.
On the basis of the information available, the ACCC considers that State Water should be able to operate and maintain meters at a similar level of cost to that experienced in 2012–13 and 2013–14. The ACCC notes that State Water’s current charges are still sufficient to recover operating and maintenance costs at an average cost per meter of $296. This represents 35 per cent of the total operating and maintenance cost proposed by State Water. The ACCC has determined substitute metering service charges by:
accepting the new structure of charges proposed by State Water
setting forecast operating and maintenance costs at a level commensurate with current costs
adding capital costs (discussed in section 9.2.2) that were not included in current charges.
Namoi Water argued that there should be no increase in charges until pattern-approved meters are available.689
The NSW interim metering standards acknowledge that there are currently no pattern-approved meters that comply with the national metrological assurance framework. However, the interim metering standards provide that any meters installed in accordance with the interim standards and in a good faith attempt to comply with the national metrological assurance framework will be granted an exemption under the national framework.690 The ACCC is satisfied that the interim metering standards provide sufficient certainty that meters installed will not need to be replaced before the end of their useful lives solely to comply with the national framework.
Meter capital costs
State Water calculated capital costs for two purposes in its metering model:691
To estimate an annualised capital cost component for meters purchased by State Water for customers who do not join the government-funded scheme but independently comply with new metering standards.692
To estimate a capital cost component for replacement of failing meters (for both government-funded and State Water-funded meters). State Water forecasts that 1% of meters will fail each year for reasons not covered by warranty or insurance.
State Water used a building block approach to calculate depreciation and return on investment for these meters. State Water’s approach resulted in a component that is initially about 4% of the total metering service charge.693
688 NSW Irrigators’ Council, Submission to the Australian Competition and Consumer Commission on State Water Corporation’s Pricing Application to the Australian Competition and Consumer Commission for Regulated Charges to Apply From 1 July 2014, September 2013, page 54; Gwydir Valley Irrigators’ Association Inc., Submission to the Australian Competition and Consumer Commission on State Water Corporation’s Pricing Application to the Australian Competition and Consumer Commission for Regulated Charges to Apply From 1 July 2014 , September 2013, page 22; Murrumbidgee Private Irrigators Inc., Draft Submission to Australian Competition and Consumer Commission on State Water Corporation Pricing Application to the ACCC for regulated charges to apply from 1 July 2014, September 2013, page 3.
689 Namoi Water, Submission to the Australian Competition and Consumer Commission on State Water Corporation Pricing Application, September 2013, page 8.
690 NSW Office of Water, NSW Interim Water Meter Standards For Closed Conduit Metering, July 2013, page 1.691 State Water application, p.172.692 State Water provided this option for customers in northern valleys (Macquarie to Border) who have opposed the
Commonwealth-funded scheme.693 State Water Corporation, Building Block Model, attachment to State Water application, p. 172.
ACCC Draft decision on State Water Pricing Application: 2014-15 – 2016-17 | Attachments 242

The ACCC considers that the initial input cost assumptions used for capex are prudent and efficient on the basis that they were developed through detailed and transparent cost build-up that takes into account the relevant activities, is based on appropriate data sources, and was independently verified. State Water submits that it has not incurred any capex to date in the Murray and Murrumbidgee pilot programs.694 The ACCC acknowledges that capex may be incurred in future years and recognises that meter failures may approach the forecasted rate of 1 per cent per year over a longer time period. In addition, customers may take up the option of a State Water-funded meter rather than a government funded meter. Therefore, the ACCC has accepted the inclusion of cost components for these types of capital costs in the metering service charges.
However, the ACCC does not consider that State Water’s approach to modelling capex and calculating depreciation and a return on investment is appropriate. This is because State Water’s model included the following errors:
Charges are based on assumptions on the timing of cash flows that are inconsistent with the assumptions used to develop proposed bulk water charges (see Attachment 7).
The method used by State Water to calculate replacement costs does not accurately measure depreciation and return on investment because replacement meters bought after the first year were not added into the asset base.
The weighted average cost of capital is too high (see Attachment 5).
We consider that it would be more appropriate to calculate capital cost components using an annuity approach. An annuity determines an annual charge to recover a capital cost over the expected life of the asset. For a single asset, an annuity can be determined that allows for a flat real charge over the life of the asset. This has advantages in terms of transparency and certainty for customers, as well as administrative efficiency, because customers will pay the same charge regardless of when their meter is replaced and a capital base for replacement meters will not need to be maintained.
The size of the annuity is determined by:
The cost of installing the meter.
The expected life of the meter (State Water proposed an asset life of 20 years).
The discount rate (the WACC).
For replacement cost component only: the number of meters that need replacing each year.
The ACCC considers that the annuity approach is the most prudent and efficient method for determining metering service charges. The annual charges shown in Table 9-2 and Table 9-3 are based on the ACCC’s annuity approach.
The ACCC considers that State Water should continue to maintain asset base records for metering services, notwithstanding the use of the annuity approach to determining metering charges. While the annuity approach is currently considered the best method for determining metering service charges, this position may change as circumstances change. Further, maintaining asset base records can assist in determining the cost of installing meters and the expected life of meters, both of which are inputs into the annuity model. The ACCC therefore considers that it would be prudent for State Water to maintain records of its asset base used to provide metering services.
694 State Water Corporation, Response 26 to ACCC information request, received 1 November 2013, pp. 3–4.
243 ACCC Draft decision on State Water Pricing Application: 2014-15 – 2016-17 | Attachments

9.1.3 Environmental gauging station chargesState Water proposes to introduce new charges in the 2014–17 period for metering at in-river gauging stations,695 which will be payable by holders of water access entitlements that have the gauging stations as nominated works (typically only environmental water holders).696 State Water’s proposed charge is for $19,578 per gauging station per year, to be adjusted annually for inflation.697
The ACCC accepts State Water’s proposed metering charge for environmental gauging stations as prudent and efficient on the basis that:
the new charging arrangements will better align the treatment of metering services for environmental water holders with the treatment of metering services for extractive users, consistent with the principle of user pays
the costs of metering at the gauging stations is efficient given State Water’s hydrometric monitoring obligations.698
Table 9-4 shows the ACCC’s draft decision.
Table 9-4 Environmental gauging station charges – ACCC draft decisionACCC draft decision
2014–15 $19,5782015–16 $19,578 x ( 1 + ( CPIMarch 2015 – CPIMarch 2014) / CPIMarch 2014 ) )2016–17 $19,578 x ( 1 + ( CPIMarch 2015 – CPIMarch 2014) / CPIMarch 2014 ) ) x ( 1 + ( CPIMarch 2016 – CPIMarch 2015) / CPIMarch 2015 ) )Notes: CPIMarch2014 refers to the ABS consumer price index value for March 2014, all groups, weighted average of eight
capital citiesSource: State Water Corporation, Pricing application to the Australian Competition and Consumer Commission for
regulated charges to apply from 1 July 2014, June 2013, page 185.
State Water has not imposed the metering charge for environmental gauging stations before. State Water submits that the gauging station charge will be applicable to holders of environmental water entitlements who link their environmental water entitlement to a gauging station monitored by State Water.699
State Water currently measures the flow of environmental water at numerous gauging stations by purchasing hydrometric monitoring services from NOW (the owner of the gauging stations). Currently, the cost of these hydrometric monitoring services for all gauging stations is recovered from all users through bulk water charges. State Water forecasts that 23 gauging stations will be linked to environmental water entitlements in the next regulatory period. State Water proposes to recover the cost of hydrometric monitoring at these 23 nominated gauging stations through the gauging station charges. The cost of hydrometric monitoring at gauging stations that are not linked to an environmental water entitlement will still be recovered through bulk water charges. State Water proposed a corresponding step decrease to the bulk water charge to account for the proposed recovery of costs through the gauging station charges rather than the bulk water charge (see section 2.3.1).700
695 State Water application, p.181.696 For information on the operation of water access entitlements and their relation to nominated works in NSW, see:
NSW Office of Water, Guide to water access licences and certificates, 2010, page 7.697 State Water application, p.181.698 Deloitte Access Economics, Expenditure forecast review: State Water Corporation: Report to the ACCC and under
Part 6 of the Water Charge (Infrastructure) Rules 2010, November 2013 (Deloitte report), p.59.699 State Water Corporation, Response 38 to ACCC information request, received 31 January 2014, pp. 1–2.700 State Water Corporation, Response 38 to ACCC information request, received 31 January 2014, pp. 1–2.
ACCC Draft decision on State Water Pricing Application: 2014-15 – 2016-17 | Attachments 244

State Water also submits that a gauging station will need to be upgraded to comply with the national metering standards for in-stream measurement of environmental water if holders of environmental water entitlements nominate a gauging station as their nominated works.701 The environmental gauging station charge will recover the costs of upgrading the meter for compliance with the national metering standards as well as the ongoing cost of hydrometric monitoring at the gauging station.
The Commonwealth Environmental Water Office (CEWO) submitted that the gauging station charges should adhere to the beneficiary pays principle, that environmental water entitlement holders do not pay for gauging stations that they do not benefit from, and that the environmental water entitlement holders are the only beneficiaries of the nominated gauging stations.702
The ACCC considers that it is prudent and efficient to introduce a separate metering charge for environmental gauging stations as:
the new charging arrangements are more closely in line with the treatment of metering services for extractive users, and
the upgrading of the gauging stations benefit only environmental water entitlement holders.
State Water requires hydrometric information so that it can manage and delivery water to its customers in a timely and accurate manner.703 State Water obtains this information from the monitoring of hydrometric sites under its agreement with NOW, but also obtains some information from reading the meters used by extractive (non-environmental) customers.
In the current regulatory period extractive users were responsible for providing their own meter, and the cost of State Water’s meter reading activities were recovered through bulk water charges. Therefore, in the current period, the costs of meter reading and the costs of the monitoring agreement with NOW were both recovered through bulk water charges. However, the cost of maintaining water meters were borne by the customers that owned meters, while the costs of maintaining the gauging stations were included in the hydrometric monitoring fees paid by State Water to NOW and recovered from all users through bulk water charges.
With the introduction of the NSW metering scheme, extractive users are transitioning to State Water-owned meters and are paying separate metering charges based on the customer’s meter type. These metering charges recover the costs of both meter reading and meter maintenance for these meters.
All water entitlement holders must nominate a water supply works (e.g. a meter or a gauging station) to be linked to their water entitlement and ensure that their nominated works complies with the national water metering standards.704 State Water’s proposed charges for the 2014-17 regulatory period result in each entitlement holder paying either metering or gauging station charges associated with their relevant nominated works that cover the meter reading and maintenance costs for their meter / gauging station. The cost of obtaining hydrometric information from measurement sites not linked to any water entitlement (that is, gauging stations excluding the 23 nominated stations) is then recovered from all users through bulk water charges.705
The efficient use of water storage and delivery infrastructure and the efficient functioning of water markets are promoted by ensuring that users pay for the costs that their consumption of services induces State Water to incur. The ACCC considers that introducing the environmental gauging station 701 State Water application, p. 181.702 Commonwealth Environmental Water Office, Submission to the Australian Competition and Consumer Commission
review of State Water’s prices, September 2013, p. 1–2.703 Deloitte report, p. 60.704 NSW Office of Water, Guide to water access licences and certificates, May 2010, page 7.705 State Water Corporation, Response 38 to ACCC information request, received 31 January 2014, p. 2.
245 ACCC Draft decision on State Water Pricing Application: 2014-15 – 2016-17 | Attachments
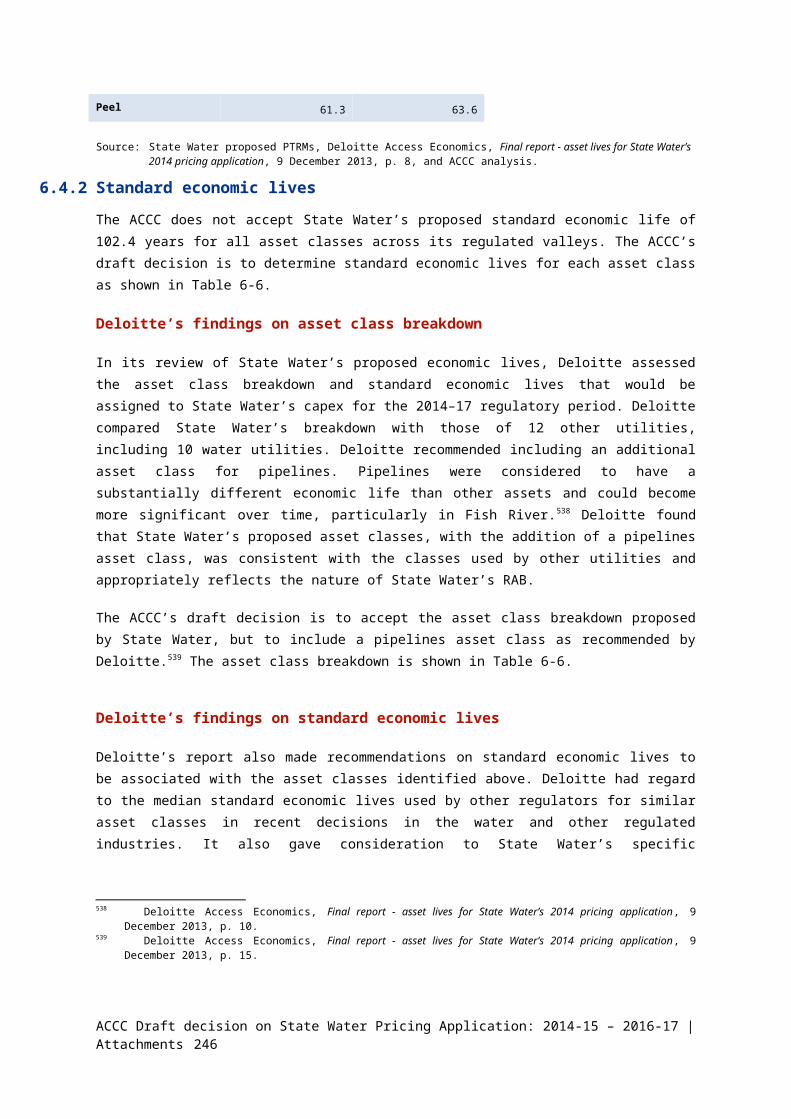
charge promotes the principle of user-pays. Also, introducing the environmental gauging station charge better aligns the metering arrangements of environmental water entitlement holders with the metering arrangements of extractive users.
The ACCC accepts that the cost of hydrometric monitoring at the 23 gauging stations is prudent and efficient. State Water’s operating licence requires that it collects and reports certain information, which State Water can only obtain by purchasing hydrometric monitoring services from NOW (see Attachment 2). State Water has limited bargaining power in the purchase of these hydrometric monitoring services and is a price-taker as NOW appears to be a monopoly provider of the services. The amount of the charge on metering environmental gauging stations is determined directly from the costs specified in the hydrometric monitoring agreement between State Water and NOW.706
The ACCC considers that the level of its proposed charge is efficient as:
it is prudent and efficient for State Water to comply with its regulatory obligations on metering standards, and
the services provided by NOW are the only practicable option for complying with these obligations.
State Water proposed that the metering charge for environmental gauging station charges be subject to annual inflation (CPI) adjustments, but did not state how it proposes the adjustments be done. 707 The ACCC’s draft decision is for charges to be specified by a control formula that includes an inflation component. The ACCC considers that it is prudent and efficient to adjust for inflation via a control formula (see attachment 10), which provides an appropriate balance between ensuring sufficient revenue streams for State Water while providing pricing transparency and certainty for customers.
State Water identified 23 gauging stations for which the station is likely to be the nominated works for an environmental water entitlement. The metering charge will be paid per gauging station per year, and State Water proposes that the charge be adjusted annually for inflation.708 State Water submits that if multiple water entitlements nominate the same gauging station as their nominated works, then the gauging station charge payable by each entitlement holder for that station will be adjusted in proportion with the size of the holder’s entitlement relative to the total MLs of entitlements linked to the gauging station.709 For example, if entitlement holder A has 100 MLs of environmental water entitlement, and entitlement holder B has 50 MLs of environmental water entitlement, and if both nominate a gauging station as their nominated works, then:
entitlement holder A’s gauging station charge will be $19,578 x ((100/(100+50)), and
entitlement holder B’s gauging station charge will be $19,578 x ((50/(100+50)).
9.1.4 Refundable deposit for resolving meter accuracy disputesIn its 2010 price determination IPART approved State Water charging a refundable deposit to be lodged with a dispute claim about meter accuracy of a State Water-owned meter. This charge is forfeited if the meter accuracy assessment shows that the meter is performing within agreed standards. The charge is refunded if the assessment shows that the meter is not performing within
706 State Water Corporation, Response 38 to ACCC information request, received 31 January 2014, p. 2.707 State Water Application, p. 182.708 State Water Application, p. 181.709 State Water Corporation, Response 26.25 to ACCC information request, received 31 October 2013, p. 1.
ACCC Draft decision on State Water Pricing Application: 2014-15 – 2016-17 | Attachments 246

agreed standards. State Water will also adjust past meter readings and bear the cost of repairing meter faults if the assessment shows that the meter is not performing within agreed standards.710
IPART determined a charge of $1,625.14 for 2012–13 ($ nominal) equivalent to meter testing costs. State Water proposes to continue these charging arrangements, with the charge based on the IPART-determined 2012–13 level ($1,625.14) and adjusted annually for inflation.711
The ACCC considers that it is prudent and efficient to recover the costs of additional meter testing from the requesting customers. The ACCC considers that the level of State Water’s proposed charge is prudent and efficient given it is based on IPART’s 2010 review without any real step increases. The ACCC therefore accepts State Water’s proposed charge, as shown in Table 9-5.
Table 9-5 Charges for testing meter accuracy under dispute – ACCC draft decisionCharge per application
2014–15 $1,666.002015–16 $1,666.00 x ( 1 + ( CPIMarch 2015 – CPIMarch 2014) / CPIMarch 2014 ) )2016–17 $1,666.00 x ( 1 + ( CPIMarch 2015 – CPIMarch 2014) / CPIMarch 2014 ) ) x ( 1 + ( CPIMarch 2016 – CPIMarch 2015) / CPIMarch 2015 ) )Notes: CPIMarch2014 refers to the ABS consumer price index value for March quarter 2014, all groups, weighted average
of eight capital citiesSource: State Water Corporation, ACCC analysis.
9.2 Miscellaneous charges9.2.1 Fish River connection and disconnection charges
State Water proposes to introduce new charges in the 2014–17 period for connection and disconnection of customers to the piped Fish River scheme.712 State Water proposes a connection charge of $461.26 and a disconnection charge of $256.25 in 2014-15, with annual adjustments for inflation.713 The ACCC accepts State Water’s proposed charges as prudent and efficient on the basis that the costs were developed through a detailed and transparent cost build-up. Table 9-6 shows the ACCC’s draft decision.
710 State Water application, p. 180.711 State Water application, p. 180.712 State Water application, p.184–185.713 State Water application, p.184–185.
247 ACCC Draft decision on State Water Pricing Application: 2014-15 – 2016-17 | Attachments

Table 9-6 Fish River connection and disconnection charges – ACCC draft decisionConnection charge
2014–15 $461.262015–16 $461.26 x ( 1 + ( CPIMarch 2015 – CPIMarch 2014) / CPIMarch 2014 ) )2016–17 $461.26 x ( 1 + ( CPIMarch 2015 – CPIMarch 2014) / CPIMarch 2014 ) ) x ( 1 + ( CPIMarch 2016 – CPIMarch 2015) / CPIMarch 2015 ) )
Disconnection charge2014–15 $256.252015–16 $256.25 x ( 1 + ( CPIMarch 2015 – CPIMarch 2014) / CPIMarch 2014 ) )2016–17 $256.25 x ( 1 + ( CPIMarch 2015 – CPIMarch 2014) / CPIMarch 2014 ) ) x ( 1 + ( CPIMarch 2016 – CPIMarch 2015) / CPIMarch 2015 ) )Notes: CPIMarch2014 refers to the ABS consumer price index value for March quarter 2014, all groups, weighted average
of eight capital citiesSource: State Water Corporation, ACCC analysis.
State Water has not levied these charges before and to date it has not undertaken a connection or disconnection to the Fish River scheme.714 Hence there are no complete historical unit costs against which to compare the proposed charges. However, State Water has used current labour rates and on-costs to develop its proposed charges under cost build-up approach, where State Water estimates the volume of labour required.715
The cost of installing a meter is based on a cost recovery of 2 hours for one staff member to attend the site, connect to the main and install the meter. There is also work in setting up customer accounts and contracts for supply. This takes about 1 hour of staff time.716
The ACCC considers State Water’s forecast labour volumes are reasonable on the basis that the costs were developed through a detailed and transparent cost build-up that takes into account the relevant activities. The ACCC considers State Water’s labour rates are prudent and efficient as they are derived from current labour rates.717 The ACCC considers that current labour rates are prudent and efficient because:
State Water has revealed its efficient costs by responding to the incentives provided in the ex-ante revenue allowance regulatory framework; and
State Water benchmarks well (at a total opex level) to other Australian water utilities.718
State Water forecasts that it will undertake 1 or 2 connections each year over the 2014-15 to 2016-17 period.719 State Water does not forecast it will undertake any disconnections over the same period, and has not budgeted any income from this source, but proposes the disconnection charge in case a disconnection does occur.720
State Water proposed that its Fish River connection and disconnection charges be adjusted annually for inflation, but did not propose how this adjustment should be implemented. The ACCC’s draft decision is for charges to be specified by a control formula that includes an inflation component. The ACCC considers that it is prudent and efficient to adjust for inflation through a control formula (Attachment 3), which provides an appropriate balance between ensuring sufficient revenue streams for State Water while providing pricing transparency and certainty for customers.
714 State Water submits that it received applications for connection to the Fish River scheme but there was a moratorium on new connections to the Fish River scheme until February 2013. State Water submits that it has received applications for connection since February 2013, but has not undertaken any connections to date, and expects to clear the backlog of these applications before the start of the 2014-15 to 2016-17 period. [State Water Corporation, Response 4.15 to ACCC information request, received 12 June 2013, p. 1.]
715 State Water, Response 4.15 to ACCC information request, received 12 June 2013, p. 2.716 State Water, Response 4.15 to ACCC information request, received 12 June 2013, p. 2.717 State Water Application, p. 185.718 For further detail, see attachment 2 on Opex.719 State Water Corporation, Response 4.15 to ACCC information request, received 12 June 2013, p. 1.720 State Water Corporation, Response 4.15 to ACCC information request, received 12 June 2013, p. 1.
ACCC Draft decision on State Water Pricing Application: 2014-15 – 2016-17 | Attachments 248

9.2.2 Charges for processing allocation tradesState Water proposes a charge for the processing of water allocation trades to be applied in the 2014–17 period. State Water currently charges a water allocation trade processing charge, and proposed to continue the current charge structure but to increase the level of the charging components.721 Table 9-7 sets out State Water’s current and proposed charges, and the ACCC’s draft determination, for water allocation trade processing.
Table 9-7 Allocation trade processing charge – charge componentsCharge component Current level Proposed level ACCC draft
decisionCharge per trade application $50 $55 $38Charge per ML of water entitlement traded $0.50 $0.55 $0.50Cap on per ML of water entitlements traded component(MLs required to reach cap)
$150(200)
$220(300)
$150(200)
Notes: Current charges are shown in nominal terms. Proposed and ACCC draft decision charges are shown in real $2013–14 terms. An annual inflation adjustment is to be applied to proposed and ACCC draft decision charges.
Source: State Water Corporation, ACCC analysis.
The ACCC accepts the proposed structure of charges for the processing of water allocation trades, but has not approved State Water’s proposed charges. As discussed further below, this is because State Water’s proposed charges are based on a continuation of the current costs of undertaking the service. State Water expects to receive fewer trade applications in the future but has not factored in a reduction in its variable costs for this activity.722 Table 9-8 outlines the ACCC’s draft decision on charges for water allocation trade processing.
Table 9-8 Allocation trade processing charge – ACCC draft decisionCharge per application
2014–15 $38.002015–16 $38.00 x ( 1 + ( CPIMarch 2015 – CPIMarch 2014) / CPIMarch 2014 ) )2016–17 $38.00 x ( 1 + ( CPIMarch 2015 – CPIMarch 2014) / CPIMarch 2014 ) ) x ( 1 + ( CPIMarch 2016 – CPIMarch 2015) / CPIMarch 2015 ) )
Charge per ML of allocation traded2014–15 $0.552015–16 $0.55 x ( 1 + ( CPIMarch 2015 – CPIMarch 2014) / CPIMarch 2014 ) )2016–17 $0.55 x ( 1 + ( CPIMarch 2015 – CPIMarch 2014) / CPIMarch 2014 ) ) x ( 1 + ( CPIMarch 2016 – CPIMarch 2015) / CPIMarch 2015 ) )Notes: CPIMarch2014 refers to the ABS consumer price index value for March quarter 2014, all groups, weighted average
of eight capital citiesSource: State Water Corporation, ACCC analysis.
The ACCC considers that State Water has not adequately accounted for its ability to reduce costs in response to a decline in the number of applications for allocation trade. The ACCC considers an efficient annual cost of processing trade applications to be $334,000 (real $2013-14) rather than State Water’s proposed $408,000 (real $2013-14).
The ACCC applied the base and step approach (see Attachment 2) to assess State Water’s proposed charges. The ACCC considers this approach is appropriate because the activities involved in providing the service have a history of costs and the service is typically ongoing in nature.
In the most recent full financial year (2012-13) State Water processed 4,515 allocation trades at a total cost of about $380,000 (real $2013-14). However, State Water forecasts that it will process fewer trades in the future than it did in 2012-13,723 while forecasting the cost to process these trades to
721 State Water application, pp. 183–184.722 State Water Corporation, Response 9.19 to ACCC information request, received 12 September 2013, pp. 3–4.723 State Water Corporation, Response 9.19 to ACCC information request, received 12 September 2013, pp. 3–4.
249 ACCC Draft decision on State Water Pricing Application: 2014-15 – 2016-17 | Attachments
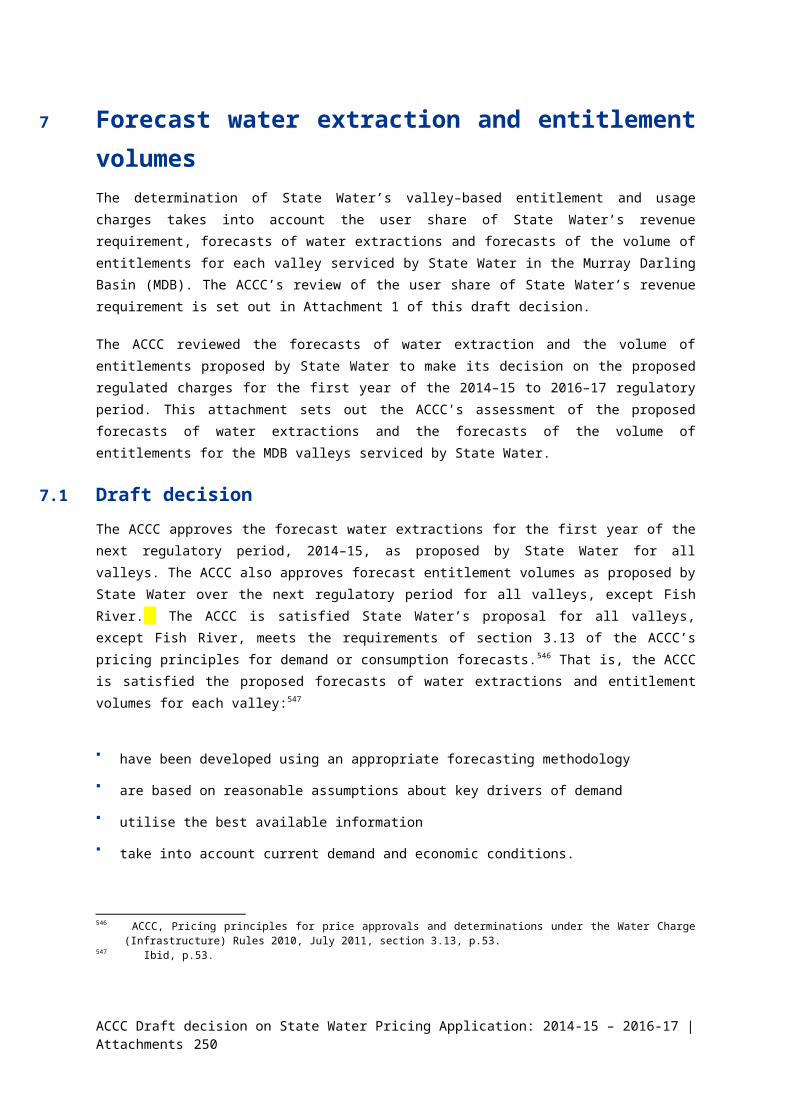
increase to $408,000 (real $2013-14) per year.724 The ACCC considers that it would be prudent and efficient for State Water to respond to lower allocation trade applications by reducing, rather than increasing, its costs.
Some costs may be largely fixed in nature, but the ACCC considers that the costs of processing allocation trades should generally reflect the amount of trades processed. State Water submits that its forecast cost of processing allocation trades is made up of:725
Staff costs ($355,000 per year, or 87 per cent) associated with processing trade applications, development of policies and procedures for water trade rules, attending the Basin Officials Committee Trade Operations Group and system interoperability conferences, and an allocation of corporate overheads.
An allocation of the system administration costs ($53,000 per year, or 13 per cent) associated with the Water Accounting IT System.
The costs of involvement in the Basin Officials Committee Trade Operations Group, the IT administration costs of the water accounting system and corporate overheads may be largely fixed. However, the ACCC considers that State Water’s cost allocation method should ensure that the amount of these costs allocated to trade processing activities varies with the number of trades processed and that any variable costs should also reflect the number of trades processed. Further, other staff costs should be variable in nature.
The ACCC therefore considers it prudent and efficient for costs to decline as the volume of trades processed declines. The ACCC used historical data from 2008-09 to 2012-13 to determine the extent to which costs should decline as trade volumes decline. Table 9-9 shows the annual cost incurred by State Water in processing allocation trade applications, and the number of allocation trades processed, since 2008-09.
Table 9-9 Processing trade applications – costs and volumes, actual and forecast 2008–09 2009–10 2010–11 2011–12 2012–13 2013–14 2014-15 2015-16 2016-17
Cost of processing trade applications($’000, real $2013–14)
419 462 267 269 380 408 * 408 * 408 * 408 *
Number of trade applications processed
8,587 4,386 1,963 2,214 4,515 3,000* 3,000* 3,000* 3,000*
Notes: * denotes forecastSource: State Water Corporation, Response 9.19 to ACCC information request, received 12 September 2013, pp. 3–4;
State Water Corporation, Response 26.13 to ACCC information request, received 25 October 2013, p. 2.
The cost and volume data from 2008–09 to 2012–13 suggests that a 1 per cent decline in trade volumes has been correlated with a 0.36 per cent decline in costs.726
The ACCC accepts State Water’s forecast trade volumes. State Water submitted that trade volumes were exceptionally high in 2008-09 and 2009-10 due to suspension of water sharing plans, and also in 2012-13 due to high dam levels and dry conditions during critical crop development stages. 727 State
724 State Water Application, p. 184.725 State Water Corporation, Response 4.14 to ACCC information request, received 16 June 2013, pp. 1–2.726 The cost responsiveness factor of 0.36 was estimated by taking the natural log of the cost and volumes data and
fitting a linear regression line (line of best fit) to the data. The 0.36 factor was taken as the slope of the line of best fit.727 State Water Corporation, Response 9.19 to ACCC information request, received 12 September 2013, pp. 3–4.
ACCC Draft decision on State Water Pricing Application: 2014-15 – 2016-17 | Attachments 250

Water forecasts 3,000 allocation trade applications per year in the 2014-17 regulatory period.728 A forecast of 3,000 allocation trade applications per year represents a 33.6 per cent decrease from 4,515 applications in the 2012–13 base year. Based on a cost responsiveness factor of 0.36, a 33.6 per cent decline in trade applications is estimated to result in a 12.1 per cent decline in costs. A 12.1 per cent decline in costs from $380,000 incurred in the 2012–13 base year equates to about $344,000.
The ACCC therefore considers that $334,000 (real $2013-14) per year is the efficient forecast of costs given 3,000 allocation trade applications per year, a cost responsiveness factor of 0.36, and a base level of annual costs of $380,000.
The ACCC has accepted the current $0.50 per ML traded charge component. The ACCC considers that the efficient functioning of water markets would be better promoted through price stability and certainty, particularly of the per ML charging component since market prices for water are typically denominated in MLs. The ACCC has therefore determined a per application charging component of $38 (compared to State Water’s proposal of $55) to ensure forecast revenue does not exceed forecast costs.729
State Water proposed that the allocation trade processing charges be subject to annual inflation (CPI) adjustments, but did not state how it proposes the adjustments be implemented.730 The ACCC’s draft decision is for charges to be specified by a control formula that includes an inflation component. The ACCC considers that it is prudent and efficient to adjust for inflation through a control formula (see Attachment 3), which provides an appropriate balance between ensuring sufficient revenue streams for State Water while providing pricing transparency and certainty for customers.
9.2.3 Yanco Creek levyState Water proposed a Yanco Creek levy of $0.9 per megalitre of water entitlement to be applied in the 2014–17 period and payable by customers in the Yanco Creek area. State Water currently imposes a Yanco Creek levy on entitlement holders in the Yanco Creek system. The levy was introduced in 2005 at $0.9 per ML of entitlement and has continued unchanged (in nominal terms).731
State Water imposes the Yanco Creek levy through its volumetric charges at the request of the Yanco Creek and Tributaries Advisory Council (YCATAC), and all revenue raised from the levy is passed-through directly to YCATAC.732 YCATAC uses this revenue to fund natural resource management expenditure on the Yanco Creek system.733 State Water does not charge YCATAC or withhold any revenue for the recovery of administrative costs from bill preparation and payment processing attributable to the Yanco Creek levy.734
728 State Water Corporation, Response 26.13 to ACCC information request, received 25 October 2013, p. 2.729 Based on a forecast of 147 chargeable (that is, falling below the charge cap) MLs traded per application, derived
from State Water’s forecast costs, revenue and trade volumes, which generates $220,909 (real $2013–14) of revenue at $0.50 per ML.
730
731 State Water, Pricing application to the Australian Competition and Consumer Commission for regulated charges to apply from 1 July 2014, June 2013, p. 185.
732 File note of telephone conversation between Matthew Simpson (ACCC) and Joseph Caruana (State Water) at 11:00 AM AEST on Wednesday 31 July 2013.
733 YCATAC, Submission to IPART review of bulk water pricing, 22 March 2005, p. 4.YCATAC developed its Yanco Creek System Natural Resource Management Plan (YCS NRMP) in May 2004 following community consultation beginning in July 2002 [YCATAC, The Yanco Creek System Natural Resource Management Plan, pp. 11–12].The YCS NRMP outlines a number of issues with the creek system and recommended actions to address these issues. YCATAC uses the revenue from the State Water Yanco Creek levy to achieve these recommended actions [YCATAC, The Yanco Creek System Natural Resource Management Plan, p. 61].
734 File note of telephone conversation between Matthew Simpson (ACCC) and Joseph Caruana (State Water) on Wednesday 31 July 2013.
251 ACCC Draft decision on State Water Pricing Application: 2014-15 – 2016-17 | Attachments
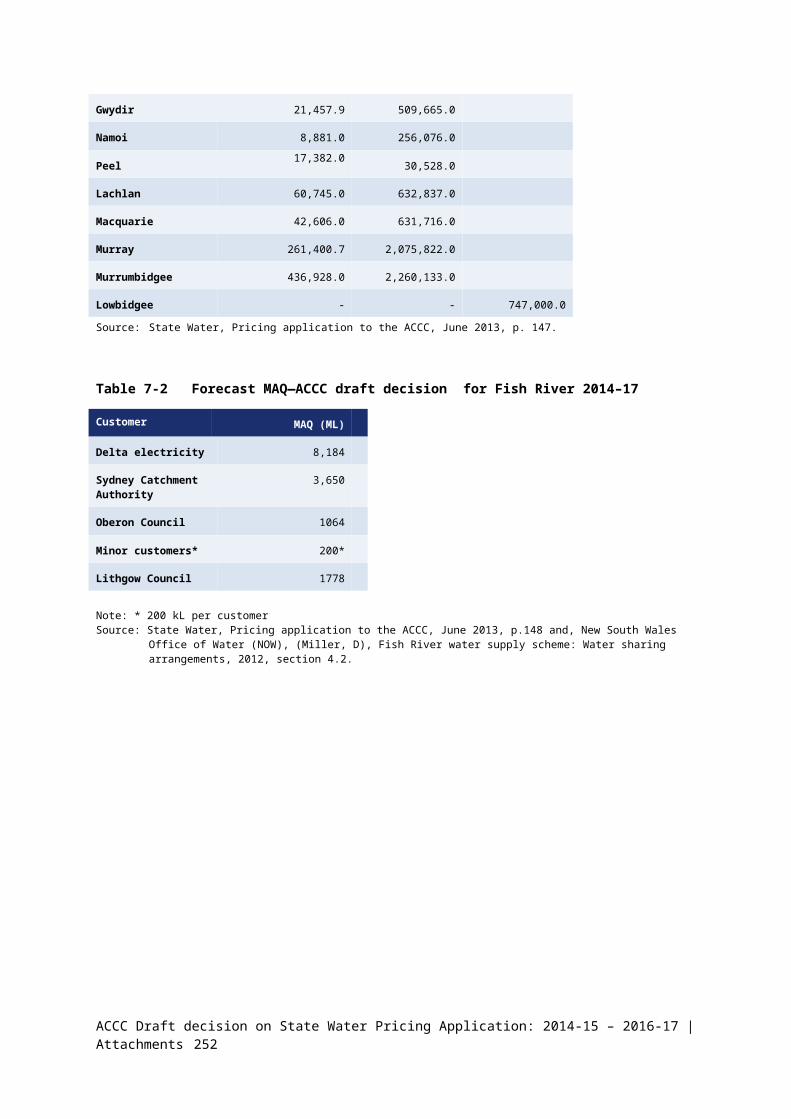
The ACCC’s draft decision is to approve State Water’s proposed Yanco Creek levy. The ACCC notes that the natural resource management activities planned for the Yanco Creek system are likely to improve the efficiency and water quality of water delivered via the system. The ACCC considers that the YCATAC levy is prudent and efficient as customers have been consulted and agreed to the project costs.
ACCC Draft decision on State Water Pricing Application: 2014-15 – 2016-17 | Attachments 252

10 Form of price controlThis attachment provides the ACCC’s draft decision on State Water’s form of price control for annual adjustments to bulk water entitlement and usage charges in the second and third years of the regulatory period.
In coming to a draft decision on the form of price control the ACCC took into account its pricing principles guideline, the WCIR and the Basin water charging objectives and principles (BWCOPs) set out in Schedule 2 of the Water Act.735
10.1 Draft decisionThe ACCC determines that a hybrid form of control should apply to State Water for the 2014-17 regulatory period. Specifically, we determine a price cap with an ‘unders’ and ‘overs’ adjustment. The ‘unders’ and ‘overs’ adjustment is the equivalent to the rate of return (i.e. the weighted average cost of capital (WACC)) multiplied by the balance in the ‘unders’ and ‘overs’ account.736 Therefore, the ACCC does not approve the revenue cap form of control as proposed by State Water for MDB valleys.
The ACCC is not satisfied that the revenue cap form of control proposed by State Water best achieves both revenue stability for State Water and price stability for customers.737 Further, the ACCC considers State Water’s proposed revenue cap effectively transfers volume related risk to customers. It would result in increases in prices during dry times, which could have detrimental economic implications for customers. The ACCC does not consider that this transfer of risk to customers would contribute to the BWCOP.
The reasoning for the ACCC’s draft decision and details of the form of control and its operation are set out in this attachment.
10.2 State Water's proposalState Water proposed the following form of price control:
a revenue cap with annual price adjustments and carryover of any shortage or excess revenue between regulatory periods; and
a 15 per cent annual rebalancing constraint on annual price adjustments.738
State Water proposed its revenue cap in conjunction with an 80:20 tariff structure where 80 per cent of costs are recovered through entitlement charges (fixed charges) and 20 per cent are recovered through usage charges (variable charges) over the 2014-17 regulator period.739 State Water also proposed a carryover mechanism between regulatory periods.740 The proposed carryover mechanism would ensure that the revenue requirement for the following regulatory period is reduced or increased by the amount of revenue that is over or under recovered from the previous regulatory period as a whole.741
735 Water Charge Infrastructure Rules 2010, s.29.736 (i.e. the ‘unders’ and ‘overs’ adjustment is not the full adjustment of the balance in the ‘unders’ and ‘overs’ account).737 ACCC WCIR pricing principles – July 2011 p.51.738 State Water, Pricing application to the ACCC for regulated charges to apply from 1 July 2014, June 2013 (State
Water application), p.129.739 State Water application, p.129.740 State Water application, p.129.741 State Water application, p.129.
253 ACCC Draft decision on State Water Pricing Application: 2014-15 – 2016-17 | Attachments

State Water’s proposal is different from the current price cap form of control determined by IPART which adjusts prices on an annual basis by the March CPI for the weighted average of eight capital cities. This results in stable prices for customers, as prices vary only by CPI on an annual basis. However, if actual water extractions are less (or more) than forecast State Water will under (or over) recover its revenue.
State Water submitted that its proposal for a revenue cap and an 80:20 tariff structure would operate together and reinforce each other to mitigate the risk of revenue volatility while minimising price shock and other impacts on customers.742
10.3 Assessment approachThe ACCC may choose any form of price control subject to meeting the requirements of the WCIR. Rule 37 of the WCIR requires the ACCC to consider an annual revision of State Water’s maximum charges in the second and each subsequent year of the regulatory period, in light of any updated information on demand or consumption forecasts, considering also price stability for each year of the regulatory period.
In determining the form of control the ACCC took into account the ACCC’s pricing principles guideline, which states that:
the decision in applying a form of price control will largely reflect a decision about achieving revenue stability for the operator and price stability for customers.
The ACCC also considered its determination under the WCIR to maintain a 40:60 tariff structure (as set out in attachment 10) and to use a rolling average of past water extractions to forecast future water extractions (as set out in the attachment 7).
10.4 Reasons for draft decisionThe ACCC considers its decision on the form of control takes into account the need to strike a balance between revenue stability and certainty for the operator and price stability for customers. Under rule 37 of the WCIR price stability is a key consideration for annual price adjustments.
The ACCC approach strikes a ‘middle path’ between the current price cap form of control and State Water’s proposed revenue cap which aims to better balance the needs of revenue stability and certainty for State Water and price stability for its customers. This form of control is effectively a hybrid between a revenue cap and a price cap, and through its ‘unders’ and ‘overs’ adjustment mechanism provides for a smoother price path over time compared to State Water’s proposed revenue cap.
A revenue cap acts as both a ceiling and guarantee of revenue. Under a pure revenue cap forecast (allowed) revenue is compared to actual revenue. Any over or under recovery of revenue is then carried forward to the next year. Prices for the next year are adjusted either upwards or downwards to reflect any under or over recovery in the previous year. Under a pure revenue cap customers bear all volume related risk743 through increases / decreases in price.
742 State Water application, p.129.743 Volume related risk is when actual water extractions differ from forecast and lead to an under recovery of revenue by
State Water from the usage charge.
ACCC Draft decision on State Water Pricing Application: 2014-15 – 2016-17 | Attachments 254

State Water’s proposed revenue cap effectively transfers volume related risk to customers. The ACCC considers this is inconsistent with the intent of the ACCC’s decision to maintain the 40:60 fixed to variable tariff structure as set out in Attachment 8. Under a revenue cap State Water is effectively guaranteed its revenue even during periods of low water availability. The ACCC considers the transfer of volume related risk to customers through a revenue cap form of control is likely to increase the economic risk faced by State Water’s customers.
State Water’s proposed 15 per cent constraint on price variations in a single year sought to smooth volatility in prices within the regulatory period. However, we consider it could result in significant price shocks over extended dry periods with year on year increases of 15 per cent.744
Six stakeholders commented on State Water’s proposed revenue cap. Sydney Catchment Authority (SCA) supports State Water’s proposal. However, NSW Irrigators Council (NSWIC), Namoi Water, Murray Irrigation, Lachlan Valley Water (LVW) and Gwydir Valley Irrigator’s Association (GVIA) do not support State Water’s proposal. The main reasons stakeholders prefer the current price cap form of control are that it provides certainty, transparency and price stability for users.
NSWIC submitted that:
State Water Corporation (SWC) proposes to further impose a carry-over mechanism between Determinations should any revenue shortfalls (or windfalls) in revenue occur over the next regulatory period. NSWIC considers this the second insurance mechanism that SWC tries to impose to protect itself from lower than (possibly) expected revenue. We believe that such a mechanism does have the capacity to cause significant price shocks between Determinations which could have substantial impact on the medium and long term planning and investment decisions for irrigators. Fixed capital investment in irrigation generally represents 'sunk costs' and are made based on irrigators best available knowledge at the time about future input costs. Should bulk water charges change dramatically between Determinations, then this could have a detrimental effect on the viability of invested capital by irrigators. The mechanism is therefore likely to serve as a disincentive for State Water's irrigation customers to further modernise their operations.
In contrast, a price cap adjusts prices on an annual basis by CPI. This results in stable prices for customers, but does not allow any reimbursement to State Water (customers) if actual water extractions are less (more) than forecast. Under a price cap form of control State Water bears the volume related revenue risk.
The ACCC’s form of control is effectively a hybrid between a revenue cap and a price cap, and through its ‘unders’ and ‘overs’ adjustment mechanism provides for a smoother price path over time compared to State Water’s proposed revenue cap. The ACCC considers that the inclusion of an ‘unders’ and ‘overs’ adjustment mechanism in its form of control addresses State Water’s concern of volume related revenue risk. The ‘unders’ and ‘overs’ adjustment mechanism is discussed below in section 10.4.1.
The ACCC considers that a price cap form of control with an ‘unders’ and ‘overs’ adjustment combined with:
the ACCC’s determination to maintain a 40:60 tariff structure (Attachment 8), and
approval of a 20 year rolling average method to forecast demand (Attachment 7),
strikes a reasonable balance between revenue adequacy and stability for State Water and price stability and relative certainty for its customers.
The ACCC considers that this approach complies with the WCIR and is consistent with the ACCC’s pricing principles guideline. In coming to a decision the ACCC has had regard to whether State
744 Under State Water’s proposed revenue cap, annual price increases / decreases would be capped at 15 per cent.
255 ACCC Draft decision on State Water Pricing Application: 2014-15 – 2016-17 | Attachments

Water’s proposed form of control would contribute to the Basin water charging objectives and principles (BWCOP) set out in Schedule 2 of the Water Act.745 The ACCC has placed more weight on the following aspects of the BWCOP:746
to avoid perverse or unintended pricing outcomes
to ensure sufficient revenue streams to allow efficient delivery of the required services,
and considers that the form of control set out in this attachment best contributes to the BWCOP. This is discussed further below.
Rule 37 of the WCIR requires the ACCC to consider an annual revision of State Water’s maximum charges in light of any updated information on demand or consumption forecasts, considering also price stability for each year of the regulatory period. This form of control will allow revised volume forecasts based on the 20 year moving average.
As discussed in attachment 8 many of State Water’s customers are likely to have cash-flows which are positively correlated with water availability. The ACCC considers that increases in prices of up to 15 per cent during extended dry periods, periods of drought, or periods of reduced water supply as a result of the revenue cap proposed by State Water could have detrimental economic implications for customers. As discussed in attachment 8, the ACCC does not consider that this transfer of risk to customers would contribute to the BWCOP.
As determined in attachment 8, the ACCC’s draft decision is to maintain the current 40:60 fixed to variable tariff structure. Under the 40:60 fixed to variable tariff structure more revenue is subject to volume related risk. Given that actual water extractions are extremely variable a revenue cap with a 40:60 tariff structure would result in highly variable prices.
The ACCC considers its hybrid form of control (price cap with an unders and overs adjustment) seeks a ‘middle path’ to balance adequacy and stability of revenue outcomes for State Water and price stability and relative certainty for its customers. The application of the ‘unders’ and ‘overs’ adjustment mechanism provides for a smoothed path of prices and revenue over time. The formula for the form of control is set out in section 10.5. The details of the unders and overs adjustment are discussed below.
10.4.1 Unders and Overs adjustmentThe ‘unders’ and ‘overs’ adjustment is symmetrical. It will allow State Water to recover extra revenue following an under-recovery of revenue through price increases. Conversely prices will be adjusted downwards following an over-recovery of revenue. The adjustment to revenue in any single year is calculated by multiplying the rate of return (WACC value of 7.44 per cent) by the balance in the ‘unders’ and ‘overs’ account.
The ‘unders’ and ‘overs’ account is a running balance of annual differences between actual and forecast revenues. The return on the balance in the ‘unders’ and ‘over’s account (i.e. the ‘unders’ and ‘overs’ adjustment) is added to the revenue requirement for the following year and tariffs are adjusted accordingly. Since the unders and overs adjustment is the equivalent to the rate of return multiplied by the balance in the unders and overs account and not based on the full difference between actual and forecast revenues, annual price changes will not be as significant as State Water’s proposed revenue cap. Analysis using historical data shows that real variations in prices under the ACCC’s proposed 745 Water Charge Infrastructure Rules 2010, s.29.746 This choice is guided by the context of State Water’s proposal and that of submission received during the review
process.
ACCC Draft decision on State Water Pricing Application: 2014-15 – 2016-17 | Attachments 256

form of control, as a result of differences between forecast and actual water extractions, would be five per cent or less per annum.
The ACCC considers the parameters for the ‘unders’ and ‘overs’ adjustment provides for greater price stability than State Water’s proposed revenue cap, whilst still allowing longer term revenue certainty for State Water. If there are dry periods, with an ‘unders’ and ‘overs’ account State Water will receive a return on the balance in the account, thereby recognising any additional borrowing costs needed by State Water to manage its cash flows during such periods.
The unders and overs adjustment also provides greater flexibility to deal with customer price impacts by allowing for smoothing of price movements over more than one regulatory period.
Having regard to the BWCOP, the ACCC considers that a 40:60 tariff structure in conjunction with the ‘unders’ and ‘overs’ account will allow State Water to recover sufficient revenue streams to allow efficient delivery of the required services.
Rule 37 of the WCIR requires the ACCC to consider an annual revision of State Water’s maximum charges in the second and third years of the regulatory period, in light of any updated information on demand or consumption forecasts, considering also price stability for each year of the regulatory period. The ACCC considers its proposed price cap with an ‘unders’ and ‘overs’ adjustment is consistent with rule 37 (2) of the WCIR as it allows for changes in demand or consumption forecasts and results in more stable prices than State Water’s proposed revenue cap, whilst still providing State Water with greater revenue certainty than its current price cap form of control.
10.5 Form of control – Price cap with unders and overs adjustmentThis section sets out the formulae for our price cap with an unders and overs adjustment. In setting out this formulae we note that the bulk water charges for the Border, Gwydir, Namoi, Peel, Lachlan, Macquarie, Murray, Murrumbidgee and Lowbidgee valleys consist of entitlement charges for high security and general security entitlement holders and usage charges which apply to both high and general security entitlement holders. This charging structure differs to the structure of charges in Fish River. In Fish River there are different charges for raw and filtered water. The charges for each type of water are structured into access and usage charges. Accordingly, we require different formulae for Fish River to that of the other valleys.
In addition to the charges above State Water will be required to recover through its charges, costs related to the operation of the Murray Darling Basin Authority (MDBA) and in the case of Border valley, the Border River Commission (BRC). These charges will be calculated in exactly the same manner as the valley charges above (that is, they are recovered 60% through usage charges and 40% through entitlement charges – split between high-security and general security charges). We have applied an unders-and-overs mechanism to these MDBA and BRC charges which would recover in the subsequent regulatory year the full revenue shortfall arising from a variation in water usage from that forecast in the previous year.
Section 10.5.1 sets out the form of control for valley charges, section 10.5.2 sets out the form of control for Fish River and section 10.5.3 sets out the form of control for the charges related to the MDBA and BRC costs.
257 ACCC Draft decision on State Water Pricing Application: 2014-15 – 2016-17 | Attachments
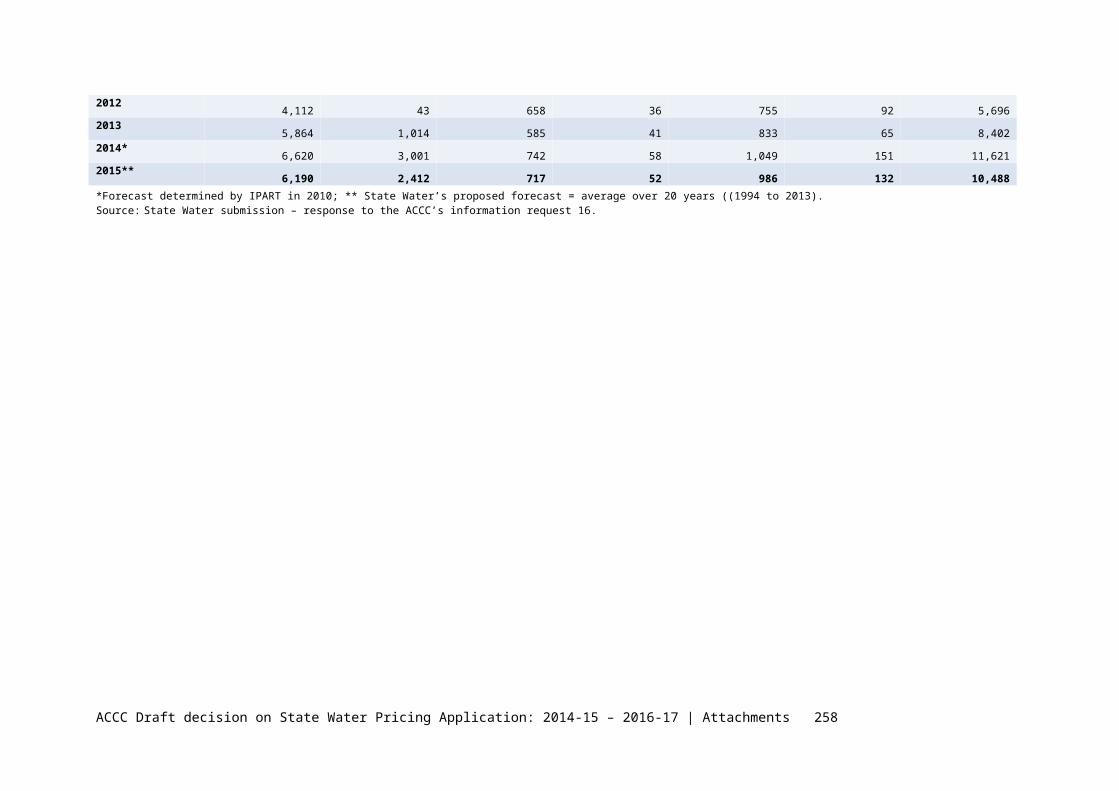
We will take into account the effect of the form of control in previous regulatory years in approving or determining:
State Water’s annual application for approval or determination of its regulated charges in the second year and each subsequent year of the regulatory period under Division 3 of Part 6 of the WICR; and
any application for a variation of regulated charges under Division 4 of the WCIR
We will then apply the form of control to any variation of regulated charges arising from those applications. We expect that the effect of the form of control will be that fewer changes to regulated charges will be necessary over a regulatory period. However, we will assess any annual or urgent application to vary regulatory charges in accordance with the WICR and the BWCOPS.
We note that the formulae below apply only to the application of the form of control, and not to the assessment of any other application under the WICR.
10.5.1 Calculation of valley chargesIn the case of all valleys except Fish River, the charges which State Water is allowed to levy are determined using a set of base revenues given by the building block model which are adjusted for the unders-and-overs mechanism and then allocated across the different charges.
Specifically, in valley , at time , the allowed charges are:
(a) For high-security entitlements ($/ML):
(b) For general-security entitlements ($/ML):
(c) For usage ($/ML):
These are defined in Table 10-1.
ACCC Draft decision on State Water Pricing Application: 2014-15 – 2016-17 | Attachments 258

Table 10-1 Description of terms used in formulae
Definitions
Valley: Border, Gwydir, Namoi, Peel, Lachlan, Macquarie, Murray, and Murrumbidgee.
Year: 2014-15, 2015-16, and 2016-17.
Conversion factor for valley i, in year t, calculated as set out below.
The share of entitlement charges (40 per cent) in State Water’s tariff structure.
The component of the (nominal) revenue allowance paid by water users for valley i, in year t, given by the Building Block Model at the start of the regulatory period.
The (nominal) revenue allowance for valley i, in year t, given by the unders-and-overs mechanism as set out below.
The expected number of high-security entitlements issued for valley i, in year t.
The expected number of general-security entitlements issued for valley i, in year t.
The expected water usage for valley i, in year t, based on a 20-year moving average of past water usage.
RealWACCtIs the real pre-tax weighted average cost of capital of 4.82%
HSEC i,t High security entitlement charge for valley i in year t
GSEC i,t General security entitlement charge for valley i in year t
UC i,t Usage charge for valley i in year t
CPIt Is the level of the CPI (measured as the weighted average of eight capital cities) for the March quarter immediately preceding year t (relative to the base year).
With the charges set in this way, if actual water usage is equal to expected water usage (and provided the number of entitlements is equal to the forecast number of entitlements), State Water should recover revenue from its water users equal to the sum of the user share of the water allowance (from the building block model) and the revenue adjustment from the unders-and-overs mechanism:
The building block model yields a real revenue allowance for each year of the regulatory period (i.e., a revenue allowance relative to the level of the CPI in some designated base year – typically the year before the start of the regulatory period). This is converted to a nominal revenue allowance by multiplying by the CPI, as follows:
259 ACCC Draft decision on State Water Pricing Application: 2014-15 – 2016-17 | Attachments

Here is the level of the consumer price index for year t relative to the base year. This is measured as the CPI reported by the ABS (the weighted average of eight capital cities) for the March quarter immediately preceding the start of financial year t, divided by the level of the corresponding CPI for the base year.
The conversion factor for valley i, in year t, , is the product of the Water Sharing Plan ratio
and the Average Water Allocation ratio :
The Water Sharing Plan ratio for a valley is given in Table 10-2.
Table 10-2 WSP ratios for each valley
Valley WSP ratio
Border 1.28
Gwydir 1.81
Namoi 1.25
Peel 6.73
Lachlan 2.45
Macquarie 1.88
Murray 1.25
Murrumbidgee 1.63
The Average Water Allocation for valley i, in year t, is calculated by dividing the average actual allocation to high security entitlements over the last 20 years by the average actual allocation to general security entitlements over the last 20 years. The 20 year period for calculating the average is given in the Table 10-3 below:
Table 10-3 Proposed actual data series from which to derive the 20 year average allocations and expected water usage
Forecast Year Actual data series from which to derive a 20 year average
First regulatory year 2014-15 1993-94 to 2012-13
Second regulatory year 2015-16 1994-95 to 2013-14
Third regulatory year 2016-17 1995-96 to 2014-15Source: see Attachment 7 – Demand Forecasts of this decision
The number of high security entitlements, general security entitlements, and expected water usage for 2014-15 is given in Table 10-4.
ACCC Draft decision on State Water Pricing Application: 2014-15 – 2016-17 | Attachments 260

Table 10-4 Water entitlements for 2014-15 (Forecast)
Valley High security entitlements
General security entitlements
Expected Water usage for 2014-15
Border 3,122 263,238 140,677
Gwydir 21,458 509,665 245,877
Namoi 8,881 256,076 158,961
Peel 17,382 30,528 11,164
Lachlan 60,745 632,837 227,697
Macquarie 42,606 631,716 279,671
Murray 261,401 2,075,822 1,459,689
Murrumbidgee 436,928 2,260,133 1,759,740
Lowbidgee 747,00 -Source: see Attachment 7 – Demand Forecasts of this decision
Calculation of unders and overs revenue adjustment for valley charges
The unders-and-overs revenue adjustment for valley i in year t is calculated as follows:
Here:
is the nominal weighted averaged cost of capital for financial year t. This is calculated as the product of the real WACC (determined in the regulatory process) and the annual change in the level of the CPI:
Where, as before, is the level of the CPI (measured as the weighted average of eight capital
cities reported for the March quarter immediately preceding year t) and is the real weighted average cost of capital determined in the regulatory process.
is the account balance in the unders-and-overs account which is calculated as the
difference between the forecast and out-turn revenue in each year. However, at the time when new prices are proposed the precise out-turn revenue is not known. The precise out-turn revenue for any given year is not known until after that year is completed, whereas new prices must be proposed and approved before the end of the current regulatory year. However, at the time which new prices are proposed State Water can make a more accurate forecast of the likely level of the out-turn revenue. Any remaining difference between this end-of-year forecast and the actual value can then be added to the unders-and-overs account in the subsequent years.
The account balance in the unders-and-overs account is therefore calculated as follows:
Here:
261 ACCC Draft decision on State Water Pricing Application: 2014-15 – 2016-17 | Attachments

is the improved forecast of the out-turn revenue for valley i and year t which is made
towards the end of the regulatory year t, at the time when new prices (for the subsequent regulatory year) must be proposed and approved.
is the actual out-turn revenue for valley i and year t, which is only known after
regulatory year t is completed. The out-turn revenue is calculated as follows:
Where is the actual water usage in valley i in year t, and for year t=2014-15, .
is the actual or out-turn number of high-security entitlements and is the actual or out-
turn number of general-security entitlements in valley i in year t.
Valley Charges for 2014-15 and indicative charges for 2015-16 and 2016-17
Table 10-5 to Table 10-7 set out indicative charges that would arise under this mechanism under the assumptions that (a) inflation is as forecast; (b) the number of high security and general security entitlements does not change; (c) water usage for the next few years of the regulatory period is exactly equal to the average usage (calculated using a 20-year moving average).
Table 10-5 High security entitlement charges by valley for 2014-15 ($ Real 2013-14) ($/ML) and indicative (base) prices for 2015-16 and 2016-17
Valley 2014-15 2015-16
(indicative prices)
2016-17
(indicative prices)
Border 6.59 6.54 6.50
Gwydir 13.57 14.12 14.69
Namoi 17.07 17.20 17.33
Peel* 27.58 30.34 33.38
Lachlan 12.89 13.44 14.01
Macquarie 12.82 13.16 13.50
Murray 1.76 1.72 1.69
Murrumbidgee 2.79 2.78 2.78
Lowbidgee
Source: ACCC analysis
ACCC Draft decision on State Water Pricing Application: 2014-15 – 2016-17 | Attachments 262

Table 10-6 General security entitlement charges by valley for 2014-15 ($ Real 2013-14) ($/ML) and indicative (base) prices for 2015-16 and 2016-17
Valley 2014-15 2015-16
(indicative prices)
2016-17
(indicative prices)
Border 2.22 2.20 2.19
Gwydir 3.34 3.47 3.61
Namoi 7.94 8.00 8.06
Peel* 3.03 3.34 3.67
Lachlan 3.20 3.33 3.48
Macquarie 3.48 3.57 3.66
Murray 1.00 0.98 0.96
Murrumbidgee 1.21 1.21 1.21
Lowbidgee 0.71 0.75 0.80
Source: ACCC analysis. Note: Peel Valley prices are capped at 10 per cent real price increases.
Table 10-7 Usage charges by valley for 2014-15 ($ Real 2013-14) ($/ML) and indicative (base) prices for 2015-16 and 2016-17
Valley 2014-15 2015-16
(indicative prices)
2016-17
(indicative prices)
Border 6.45 6.41 6.37
Gwydir 12.16 12.65 13.16
Namoi 20.61 20.77 20.92
Peel* 45.56 50.12 55.13
Lachlan 18.49 19.28 20.10
Macquarie 14.71 15.10 15.50
Murray 2.60 2.55 2.49
Murrumbidgee 3.38 3.37 3.36
Lowbidgee 3.38 3.37 3.36
Source: ACCC analysis. Note: Peel Valley prices are capped at 10 per cent real price increases.
Lowbidgee adjustment
Any revenue earned from the usage charge in Lowbidgee is to be included in the Murrumbidgee actual revenue.
10.5.2 Calculation of Fish River charges The structure of charges in the Fish River valley is quite different to the other valleys. There are different charges for raw and filtered water. The charges for each type of water are structured into
263 ACCC Draft decision on State Water Pricing Application: 2014-15 – 2016-17 | Attachments

access and usage charges. Large (major) customers pay an access charge based on their nominated Minimum Annual Quantity (MAQ). They also pay a usage charge based on their actual usage. Small (minor) customers pay an access charge based on a deemed MAQ of 200 kl. For usage below this deemed MAQ they pay the same usage charge as the major customers. For usage above this deemed MAQ they pay an additional charge equal to the access charge paid by the major customers.
More specifically, the charges to be determined are the access charge and the usage charge where i=Raw, Filtered, and t=2014-15, 2015-16, 2016-17.
Major customers pay the access charge for each unit of their nominated MAQ plus the usage
charge for their actual usage. Minor customers pay the access charge multiplied by their
deemed MAQ (200 kl) plus the usage charge for the first tier of their actual usage (usage below
the deemed MAQ of 200) and the usage charge for the second tier of the actual usage (usage above the deemed MAQ).
The charges are determined as follows:
(a) For the access charge ($/kl):
And
(b) For the usage charge ($/kl):
And
ACCC Draft decision on State Water Pricing Application: 2014-15 – 2016-17 | Attachments 264

Table 10-8 Description of terms used in formulae
Definitions
Is the share of total Fish River allowed revenue recovered in the access charges in year t
Is the share of the total Fish River allowed revenue recovered from raw water customers in year t
Is the total MAQ of the major customers of water of type i=Raw, Filtered, in year t.
Is the total expected usage of the major customers of water of type i=Raw, Filtered, in year t.
Is the deemed MAQ of the minor customers of water of type i=Raw, Filtered, in year t (equal to 200 times the number of minor customers).
Is the total expected usage in excess of the deemed MAQ (200 kl) for minor customers of water of type i=Raw, Filtered, in year t.
Is the total expected usage below the deemed MAQ for minor customers of water of type i=Raw, Filtered, in year t.
ACtFiltered Access charge for filtered water in year t
ACtraw Access charge for raw water in year t
ACtFiltered Usage charge for filtered water in year t
ACtraw Usage charge for raw water in year t
As before, these charges are set in such a way as to yield the total building block revenue allowance (plus the unders-and-overs revenue adjustment) for Fish River when out-turn usage is equal to expected usage:
As in the other values, the nominal building block revenue allowance is calculated as the real revenue allowance (determined in the regulatory process) multiplied by the by the CPI, as follows:
As before, is the level of the consumer price index for year t relative to the base year.
265 ACCC Draft decision on State Water Pricing Application: 2014-15 – 2016-17 | Attachments

The unders-and-overs revenue adjustment for Fish River is calculated in the same manner as in other valleys. As before, the actual or out-turn revenue for a regulatory year t is not known at the time when new prices must be set. As before, this problem is addressed by requiring State Water to make an improved forecast of the out-turn revenue before the end of regulatory year t. Any remaining difference between the improved forecast and the actual or out-turn revenue is recovered in subsequent years. The unders and overs adjustment is calculated as:
As before, the nominal weighted average cost of capital for financial year t is calculated as the product of the real WACC (determined in the regulatory process) and the annual change in the level of the CPI:
Table 10-9 Description of terms used in formulae
Definitions
Is the regulatory real pre-tax weighted-average cost of capital, given as 4.82%
Is the account balance in the unders-and-overs account which is calculated as follows:
and
Where is the actual water usage of the major customers in year t, is the actual water usage below the deemed MAQ
for the minor customers and is the actual water usage above the deemed MAQ for the minor customers.
As before, for year t=2014-15, .
Fish River charges for 2014-15 and indicative charges for 2015-16 and 2016-17
Table 10-10 and Table 10-11 set out the base charges for Fish River.
ACCC Draft decision on State Water Pricing Application: 2014-15 – 2016-17 | Attachments 266

Table 10-10 Raw water charges for Fish River for 2014–15 ($ Real 2013-14) and indicative charges for 2015-16 and 2016-17
Raw Water 2014-15 2015-16 2016-17
Major customers (Delta, SCA, Oberon)
Minimum annual quantity (MAQ) access charge ($/kL)
0.34 0.34 0.34
Usage charge ($/kL) 0.38 0.38 0.39
Minor customers
Annual water service charge 67.63 68.11 68.60
Annual usage up to 200kL ($/kL) 0.38 0.38 0.39
Annual usage over 200kL ($/kL) 0.72 0.72 0.73
Source: ACCC analysis.
Table 10-11 Filtered water charges for Fish River for 2014–15 ($ Real 2013-14) and indicative charges for 2015-16 and 2016-17
Filtered Water 2014-15 2015-16
(indicative prices)
2016-17
(indicative prices)
Major customers (Delta, SCA, Oberon)
Minimum annual quantity (MAQ) access charge ($/kL)
0.65 0.66 0.66
Usage charge ($/kL) 0.66 0.66 0.67
Minor customers
Annual water service charge 130.88 131.82 132.76
Annual usage up to 200kL ($/kL) 0.66 0.66 0.67
Annual usage over 200kL ($/kL) 1.31 1.32 1.33
Source: ACCC analysis.
10.5.3 Calculation of MDBA and BRC charges In addition to the charges above, State Water will be required to recover through its tariffs other charges related to the operation of the MDBA and in the case of Border valley, the BRC. These charges are calculated in exactly the same manner as the State Water charges above (that is, they are recovered 60% through usage charges and 40% through entitlement charges – split between high-security and general security charges). In addition, there is an unders-and-overs mechanism to recover any revenue shortfall arising from variation in water usage. Unlike the State Water unders-and-overs mechanism above, the full revenue shortfall is recovered (or paid back) in the subsequent regulatory year.
Specifically, in valley , at time , the allowed charges are:
(a) For high-security entitlements ($/ML):
(b) For general-security entitlements ($/ML):
267 ACCC Draft decision on State Water Pricing Application: 2014-15 – 2016-17 | Attachments

(c) For usage ($/ML):
Table 10-12 Description of terms used in the formulae for MDBA and BRC costs
Definitions
Valley: Border, Gwydir, Namoi, Peel, Macquarie, Murray, and Murrumbidgee.
Year: 2014-15, 2015-16, and 2016-17.
Conversion factor for valley i, in year t, calculated as set out below.
The share of entitlement charges (40 per cent) in State Water’s tariff structure.
The MDBA and BRC charges required to be recovered by State Water from water users in valley i, in year t, given by NSW Government towards the end of year t-1.
These are assumed to be provided in nominal terms.
The (nominal) revenue allowance for valley i, in year t, given by the unders-and-overs mechanism as set out below.
The expected number of high-security entitlements issued for valley i, in year t.
The expected number of general-security entitlements issued for valley i, in year t.
The expected water usage for valley i, in year t, based on a 20-year moving average of past water usage.
The unders-and-overs mechanism allows State Water to recover any shortfall (or repay any excess) of revenue in the subsequent year. However, as noted above, the actual revenue shortfall will not be known at the time when new prices must be proposed. As above, therefore, State Water will be required to submit an improved forecast of the revenue shortfall at the time when new prices are determined and any remaining deviation in revenue recovered in the subsequent regulatory year:
The revenue allowance for the unders-and-overs account is therefore calculated as follows:
Here:
is the nominal WACC for financial year t (calculated as set out above).
is the improved forecast of the revenue recovered towards charges for valley i
and year t which is made towards the end of the regulatory year t, at the time when new prices (for the subsequent regulatory year) must be proposed and approved.
ACCC Draft decision on State Water Pricing Application: 2014-15 – 2016-17 | Attachments 268

is the actual revenue recovered towards charges for valley i and year t, which is
only known after regulatory year t is completed. This out-turn revenue is calculated as follows:
Where, as before, is the actual water usage in valley i in year t, and for year t=2014-15,
. is the actual or out-turn number of high-security entitlements and is the
actual or out-turn number of general-security entitlements in valley i in year t.
At the time of its draft decision the ACCC had not received MDBA or BRC cost information. Accordingly no prices have been calculated for these charges.
269 ACCC Draft decision on State Water Pricing Application: 2014-15 – 2016-17 | Attachments

Worked example of unders and overs adjustment for an example valley
The regulatory period is three years. Our decision determines the bulk water charges for the first year of the period (2014-15), and indicative prices for 2015-16 and 2016-17. Prices for the second and third year of the regulatory period are determined by the annual price control formula. These prices will need to reflect the new forecast for water extractions based on the 20 year moving average and any ‘unders’ and ‘overs’ adjustment based on differences between actual revenue earned in the previous year and the allowed (forecast) revenue for that year.
We use the form of control to calculate the prices for our example Valley for the second year of the regulatory period (2015-16). It assumes that in the first year of the period (2014-15) actual water extractions were lower than the expected forecast water extractions, and resulted in State Water earning less revenue than allowed (forecast).
Table 10-13 ACCC determined prices at commencement of regulatory period
2014-15 determined prices 2015-16 indicative pricesHigh security entitlement charge ($/ML)
3.25 3.34
General security entitlement charge ($/ML)
1.43 1.47
Usage charge ($/ML) 3.97 4.08
The ACCC determined prices as set out in the above table 1.1 are based on the following parameters:
a revenue requirement of $11,637,825 for 2014-15
a revenue requirement of $11,977,109 for 2015-16
forecast water extractions of 1,759,755ML for 2014-15 and 2015-16
forecast high security entitlements of 436,928 for 2014-15 and 2015-16
forecast general security entitlements of 2,260,133 for 2014-15 and 2015-16
Actual outcomes in 2014-15
In 2014 actual water extractions are 1,677,727ML compared to the forecast of 1,759,755ML. High security and general security entitlements remained as forecast. Due to the difference between actual and forecast water extractions actual revenue earned was $11,312,582 instead of the allowed revenue of $11,637,825.
Calculation of the unders and overs adjustment
The unders-and-overs revenue adjustment is for valley i in year t is calculated as follows
ACCC Draft decision on State Water Pricing Application: 2014-15 – 2016-17 | Attachments 270

Table 10-14 Description of terms used in the formulae
Definitions
Is the regulatory weight-average cost of capital, given as 8% in this example
Is the account balance in the unders-and-overs account which is calculated as follows:
and
Where is the actual water usage in valley i in year t, and for year t=2014-15,
.
Table 10-15 Description of term used in formulae
Definitions
The component of the (nominal) revenue allowance paid by water users for valley i in year t, given by the building block model at the start of the regulatory period.
The (nominal) revenue allowance for valley i, in year t, given by the unders-and-overs mechanism as set out below.
Due to actual extractions being less than forecast State Water under recovered its revenue in 2014-15. To compensate for this under recovery the form of control allows State Water to recover additional revenue above that determined by the building block for 2015-16. Based on the above formula we can calculate the additional revenue (unders and overs adjustment) that needs to be added to the building block revenue for 2015-16.
= $11,312,582
= 0 + $11,637,825 - $11,312,582 = $325,242
8% * $325,242 = $26,019 (unders and overs adjustment)
Accordingly the adjusted revenue for 2015-16 is $12,003,128 (i.e. is equal to the building block revenue of $11,977,109 + the unders and overs adjustment of $26,019) i.e.
Calculation of 2015-16 prices
To calculate the 2015-16 prices the form of control requires the following:
271 ACCC Draft decision on State Water Pricing Application: 2014-15 – 2016-17 | Attachments

(1) adjusted revenue ( (i.e. $12,003,128 and
(2) the new 20 year moving average forecast (i.e. 1,725,146 ML).
The following formulae is used to calculate the chargesFor high-security entitlements ($/ML):
(b) For general-security entitlements ($/ML):
(c) For usage ($/ML):
Where: CF = conversion factorEHSE = expected high security entitlementsEGSE = expected general security entitlementsEWU = expected water usage
Table 10-16 2015-16 actual prices compared to indicative prices
2014-15 determined prices
2015-16 indicative prices
2015-16 actual prices
% change (actual 2015-16 compared to indicative)
% change (actual 2015-16 compared to 2014-15)
High security entitlement charge ($/ML)
3.25 3.34 3.35 0.34% 3%
General security entitlement charge ($/ML)
1.43 1.47 1.48 0.44% 3%
Usage charge ($/ML)
3.97 4.08 4.09 0.31% 3%
ACCC Draft decision on State Water Pricing Application: 2014-15 – 2016-17 | Attachments 272

Appendix A - State Water’s Tariff Structure: Risk-Sharing, Incentive and Efficiency Implications By Dr. Darryl Biggar.
State Water proposes to increase its charge on water entitlements and to reduce the charge on water delivery. This note focuses on the economic efficiency, risk-sharing, and incentive implications of this proposal.
Summary of key points
We must distinguish between the effect of the proposal on State Water and the effect on State Water’s customers. The effect of the proposal on State Water is to reduce the variability in its revenue stream. Since State Water’s costs are largely fixed, a reduction in the variability in its revenue stream reduces the variability in State Water’s cash-flows.
State Water argues that a reduction in the variability of its cash-flow is desirable on the grounds that its “commercial viability is at risk”. The reasons for this are unclear. If it is possible to forecast long-term average water availability, State Water should be adequately compensated on average under the current tariff structure. If there are no imperfections in the capital markets, no additional compensation or “revenue volatility allowance” is required. With the uncertain impact of climate change, forecasting long-term water availability may be difficult, potentially exposing State Water to some long-term risk. Furthermore, as a government-owned firm, State Water may face some difficulty accessing the capital markets, which could justify reducing the risk it faces, but this argument has not been raised by State Water. At this stage the economic harm from exposing State Water to some risk remains unclear.
The change in tariff structure does not affect the incentives faced by State Water. The incentive on State Water to reduce its expenditure depends on how a change in expenditure affects the average level of revenue it receives. This proposal affects the structure of State Water’s tariffs but not its average level of revenue, so should not change the incentive to reduce expenditure. Similar arguments apply to the incentive to invest. If, for some reason, State Water is constrained in how much it can borrow and invest today, State Water’s proposal, by reducing the volatility in its earnings stream, might allow State Water to carry out more productive investment, but State Water has not raised this argument. A reduction in the delivery charge may reduce the incentive on State Water to promote the usage of water, but since the overall amount of water available is fixed the proposal will have no impact on overall water consumption. Overall, the incentive impacts of this proposal on State Water are negligible or not relevant.
The impact of the proposal on State Water’s customers depends heavily on assumptions about the scope for trade in water markets. Where there is no scope for trade in allocated water (so-called temporary trade), each State Water customer can only consume the water that he/she has been allocated. This can vary substantially from year to year.
Where there is no scope for trade in water, State Water customers may have widely differing marginal value for the water which they are allocated. It is possible that some of these customers may have a relatively low value for water at the margin, especially in years with a high water allocation. It is therefore possible that higher charges for water delivery will deter some productive uses of water at the margin (customers will fail to make use of some water that is allocated to them). In this context, State Water’s proposal, by reducing the water delivery charges towards marginal cost, may increase efficiency of water use. However, it is not clear that this effect is large.
273 ACCC Draft decision on State Water Pricing Application: 2014-15 – 2016-17 | Attachments

The impact of State Water’s proposal on the risk to which a customer is exposed depends on the nature of the variability of the cash-flows of that customer. Customers with a cash-flow which is stable and independent of the water allocation would likely prefer a total water bill which is also stable and independent of the water allocation. These customers may prefer State Water’s proposal. However, especially in the absence of water trading, many State Water customers will face a cash-flow or revenue stream which varies with the availability of water. For example, many customers will irrigate a larger area when water availability is high, resulting in a higher cash-flow. Other customers (such as dairy farms) will purchase less external feed when water availability is high, reducing their costs. For these customers, the overall risk they face may be reduced by a water bill which is correlated with the water availability. For these customers, State Water’s proposal reduces variability in the water bill, but increases the overall risk they face.
Where market participants are risk averse, the assignment of risk can have direct economic consequences (risk, in itself, can reduce economic welfare). In addition, there can be secondary effects. Some State Water customers may be smaller enterprises which face credit constraints. For these enterprises, the amount they can borrow is limited by the worst-case scenario of a bad year or string of bad years. An increase in the volatility in their annual cash-flow is likely to increase the likelihood or severity of the worst case scenario and therefore may reduce the amount they can borrow. Or, given existing debt levels, may increase the likelihood of insolvency. In either case, farmers may be less willing and/or able to make valuable on-farm investments, with consequences for farm productivity. Under the current arrangements, the structure of water charges shares risk between State Water and its customers. State Water’s proposal may increase the risk on some customers, potentially reducing their investment.
In the case where water trade is feasible the analysis is more complex. Under the assumption that temporary water trade is feasible and active there is no longer a link between water users and water entitlement holders. A farmer may consume large amounts of water without holding entitlements. Conversely, any party (such as a financial institution) may hold water entitlements with no willingness or ability to ever take delivery of water. A water user can avoid the impact of State Water’s proposal by selling his/her entitlement.
In the presence of active water trade, the effect of trading is to equalise the marginal value of water across water users. This common marginal value of water is equal to the price of water in the temporary water market. This price is typically many times higher than State Water’s delivery charges. Since the supply of water is perfectly inelastic, as long as the price for water in the water market is positive, a change in the water delivery charge has no impact on water use: any increase in the water charge is matched by an offset reducing in the price of water. In other words, under these assumptions there are no economic efficiency consequences of State Water’s proposal.
The analysis of risk sharing is more complex in the case when water trade is feasible. When water trade is feasible, the volume of water used by State Water’s customers depends entirely on the water market price (and not on the water allocation). It appears that these customers would like some form of risk-management tools, such as hedge or forward contracts. But such risk-management tools do not (to my knowledge) currently exist. In their absence, it appears that the structure of State Water’s charges can play a risk-management role. State Water’s proposal would likely increase the risk faced by many of State Water’s customers.
In summary, State Water’s proposal will reduce the risk on State Water, but it is not yet clear that this has any material economic significance. State Water’s proposal will likely increase the risk on State Water’s customers, especially in regions where water trade is infeasible, but also in regions where water trade is feasible but water-price-risk-management instruments do not exist. The proposal
ACCC Draft decision on State Water Pricing Application: 2014-15 – 2016-17 | Attachments 274

may have some efficiency consequences where water trade is not feasible, but it seems likely that the efficiency consequences of the proposal are limited or nonexistent where water trade is feasible. There does not appear to be any material incentive consequences of the proposal. Overall, the risk-sharing arguments appear to be the strongest considerations. It appears that State Water’s charges are currently playing a risk-management role. State Water’s proposal would reduce that role.
It seems that the scope for water trading varies across NSW regions, with significantly more trading in the south. Although State Water’s proposal does not currently look desirable, as water trading develops and as risk-management tools are developed, State Water’s proposal will make more sense, perhaps starting with the southern NSW regions of Murray and Murrumbidgee.
Introduction
State Water Corporation (State Water) is the primary bulk water supplier in NSW. State Water collects water in dams and weirs and distributes that water to bulk water users – irrigation corporations, irrigators, industrial users, town water suppliers, and government agencies acting on behalf of the environment.
State Water uses a two-part tariff structure, with charges on (a) water entitlements; and (b) water usage. Historically State Water has raised the bulk of its revenue from charges on water usage. However, the total volume of water which is available to be used in NSW varies considerably from one year to the next, which causes considerable volatility in State Water’s revenues. State Water has expressed concerns that the current tariff structure is not cost reflective, and that “its commercial viability is at risk”747.
State Water proposes to transition to a tariff structure in which the bulk of its revenue will be recovered through charges on water entitlements. The intention of this proposal is to “mitigate the risk of revenue volatility”748. This change has potential implications for:
(a) The economic efficiency of water usage in NSW;
(b) The risk to which State Water and its customers are exposed;
(c) Incentives for investment by both State Water and its customers.
This note seeks to explore each of these further.
The impact of the proposal on State Water
Let’s look first at the impact of the proposal on State Water. The proposal may have an impact on both the level of revenue State Water receives, and the volatility of that revenue.
Impact on the level of revenue and volatility of cash-flow of State Water
In regard to the level of revenue, the clear intention is that the proposal will not change the level of revenue State Water receives on average. State Water will receive more in dry years and less in wet years, but on average, its revenue should stay the same.
The proposal should reduce the volatility of the revenue received by State Water. Since State Water’s costs are largely fixed, revenue volatility implies annual cash-flow volatility. There is no disagreement that State Water is currently exposed to volatility in its annual cash-flow and that the proposal would reduce this volatility. However, State Water has expressed concerns that the current tariff structure:747 State Water proposal, page 129.748 State Water proposal, page 129.
275 ACCC Draft decision on State Water Pricing Application: 2014-15 – 2016-17 | Attachments

“does not align with State Water’s high proportion of fixed costs, meaning that the business may not be able to finance its operations in the face of revenue volatility risk”.749
IPART, in its June 2010 decision on State Water’s tariffs, recognised that State Water faced a volatile revenue stream and considered that State Water should be allowed extra revenue in the form of a “revenue volatility allowance”:
“This allowance is designed to recover the costs State Water will face in managing the risk of revenue volatility – such as the holding costs it will incur if it needs to borrow funds to conduct its business in years when its revenue is low due to lower than forecast extractions.”750
IPART considers that these costs arise due to the need to “carry revenue shortfalls from year to year”751.
In making its current proposal, State Water has relied on a report by Frontier Economics. Frontier comment:
“These periods of over and under recovery should balance out assuming State Water’s approach to forecasting water sales volume is appropriate. However State Water still incurs a cost associated with financing this variable revenue stream. This reflects the cost of holding or sourcing additional capital sufficient to cover any under-recoveries that result over a regulatory period”.752
These conclusions can be queried. Provided the cost of capital is set correctly and provided the capital markets operate efficiently there are no additional costs associated with volatility in a cash-flow stream. There is no need to hold or source additional capital to cover under-recoveries.
To illustrate this point, suppose that a firm’s cash-flow at the end of a period is either $500, or $1500, with equal probability. Let’s suppose that the firm makes an investment of $800, and that this investment has an NPV of zero. Now suppose that the firm repeats this exercise for, say, ten periods. The firm receives either $500 or $1500 each period. In some periods it will earn well more than its costs and in other periods well less than its costs. Does this firm need any additional revenue to achieve an NPV of zero? The answer from finance theory is no. The present value of a stream of uncertain cash-flows is equal to the sum of the present value of each of those cash-flows individually. There is no need for any additional “revenue volatility allowance”. In particular, there is no need to hold or source additional capital to cover any under-recoveries.
In short, if the capital markets are working effectively, a large firm incurs no additional costs from revenue volatility other than through the impact on the cost of capital. If the cost of capital is set correctly, no additional revenue allowance is required.753
Why then, might State Water be concerned about volatility in the revenue it receives? One possibility is that uncertainty about climate change introduces uncertainty into the ability to forecast long-term water availability. Under the current arrangements, if there is a permanent shift towards a dryer climate in the Murray-Darling Basin, it may take many years before this shift is revealed in the climate data. Over that period of time
749 State Water proposal, page 131.750 IPART, State Water decision, June 2010, page 9.751 “We note there are costs associated with revenue volatility, as shortfalls resulting from revenue volatility may occur before
windfalls, leaving State Water to carry revenue shortfalls from year to year.” IPART, page 56.752 Frontier (2013), page 31.753 This conclusion relies on the assumption that the firm can finance with both equity and debt. If the firm is limited to using
debt to raise capital, and if there is a cost of default, then adverse outcomes in early years may lead to higher debt levels, increasing the risk of default in later years.
ACCC Draft decision on State Water Pricing Application: 2014-15 – 2016-17 | Attachments 276

State Water would likely substantially under-recover its expenses. State Water may seek to avoid this hard-to-quantify risk.754
Another possible reason why State Water may be concerned about revenue volatility relates to imperfections in the capital markets. Perhaps State Water, as a government-owned firm, does not have normal access to the capital markets. Perhaps it can only finance its operations through debt. In this case an increase in revenue volatility might imply higher borrowing costs, or lower credit limits (which potentially limits investment). However, to my knowledge, State Water has not made these arguments.
Before leaving this section it is worth noting that if revenue volatility on State Water is a concern there are other mechanisms, besides changing the tariff structure, for reducing the risk faced by State Water, such as the Loss Capitalisation Mechanism (LCM). Under the current arrangements, State Water will achieve an average or expected NPV of zero, but the actual or out-turn NPV may be positive or negative, even over quite long periods. In contrast, with an LCM State Water will automatically achieve an NPV of exactly zero, provided it remains possible to forecast the long-run water availability with accuracy. If State Water’s concern is with protecting itself from unforeseeable climate change, the only way to do so is to change the tariff structure.Impact on incentives on State Water
What about the impact of this proposal on State Water’s incentives? Let’s focus first on the incentive to reduce expenditure. The incentive to reduce expenditure depends on how changes in expenditure are reflected in changes in the average revenue allowance. For example, if a firm knows that an increase in expenditure of, say, $10 million, will result in an increase in its average revenue of $10 million, it has very little incentive to restrain its expenditure. This proposal affects the structure of State Water’s tariffs but not the average level. The link between the expenditure and the average revenue allowance is determined by other aspects of the regulatory regime (such as the mechanisms for assessing capex and opex). This proposal does not change these other aspects of the regulatory framework, so overall this proposal should have no impact on the incentive to reduce expenditure.
What about other incentives? Under the current arrangements the delivery charge is presumably in excess of the marginal cost of delivery. In principle, this creates an incentive for State Water to maximise water sales. But the total volume of water available is tightly controlled, so State Water has, in fact, no control over the volume of water sales.
The proposal may have some impact on the incentive to invest. The change in the tariff structure will reduce the risk faced by State Water. If State Water is currently capital-constrained, this reduction in risk may allow it to invest more. However, as noted above, State Water has not (to my knowledge) made the claim that it is currently capital constrained. State Water’s capital expenditure programme is currently driven by safety and environmental mandates, and is subject to regulatory oversight. I can see no risk that the proposal will, in itself, lead to over-spending on capital investment by State Water.
Overall, the impact of this proposal on the incentives on State Water seems limited to non-existent.
The no-water-trade case
The impact of State Water’s proposal on State Water’s customers depends on the scope for water trade, particularly trade in allocated water (also known as temporary water trade).754 Frank Knight (1921) drew a well-known distinction between risk (which is measurable/quantifiable) and uncertainty (which
is not). The case of future water availability in the face of climate change is better categorised as an uncertainty rather than a risk.
277 ACCC Draft decision on State Water Pricing Application: 2014-15 – 2016-17 | Attachments

Let’s assume first that no trade in water is possible. In this circumstance the only way to obtain water is to hold a water entitlement. Holders of water entitlements are allocated a volume of water against that entitlement. As long as such water users have a marginal value for water which exceeds the delivery fee, water users will choose to take delivery of all the water they are allocated, and will pay State Water delivery fees on that water.
Impact on efficiency of water usage
Let’s start by looking at the impact on the efficiency of water usage. In the absence of water trade, the marginal value of water across State Water’s customers could vary widely. It is possible that some customers would value additional water very highly, while other customers may have a very low value for water at the margin. Economic theory is clear that economic efficiency is achieved where the marginal value of the last unit consumed is just equal to marginal cost. If the water delivery charge is above marginal cost it is possible that some State Water customers, particularly those with a very low marginal value of water, will be deterred from taking delivery of water at the margin.
State Water does not seek to estimate the marginal cost of water delivery in its submission. It does assert that 95 per cent of its costs are fixed.755 State Water’s network does not to my knowledge suffer from congestion or delivery constraints. In addition, State Water’s network is primarily gravity-fed. These observations suggest that the marginal cost of water delivery is likely to be low or zero.756
On the other hand, the current delivery charges are materially above zero. It is therefore plausible that (under this assumption of no water trade) a reduction in the water delivery charge may increase water usage somewhat at the margin, improving economic efficiency. For this to occur at least some customers must face a sufficiently large allocation of water in at least some years such that their marginal value of water is less than the delivery charge and they would rather not use that water at all rather than pay the delivery charge. This is rather unlikely but not impossible. In other words, State Water’s proposal may have some (perhaps minor) impact on improving the efficiency of water use.
Impact on the level of revenue and volatility of cash-flow of water users
What is the impact of the proposal on the level of the water charges paid by State Water’s customers? Since State Water receives no more revenue on average from the proposal it follows that State Water’s customers pay no more in water charges on average. But this might conceal differences between customers or across years. It turns out that under State Water’s proposal a water user will pay more in any year in which that user’s water consumption is less than the long-term expected water allocation given the user’s water entitlement. For example, if a water user holds 100 ML of entitlement, and the long-term average water allocation in a valley is 60 per cent, the water user will pay more under State Water’s proposal in any year in which the water user consumes less than 60 ML and will pay more in any year in which the water user consumes more than 60 ML.
We are currently focusing on the case in which there is no water trade. Where there is no water trade a water user must either consume his/her allocation or let the water “go to waste”. If we make the assumption that all customers consume their water allocation, then it follows that all customers will pay the same charges on average – that is, the State Water proposal has no impact on the average bill of each customer.757
755 State Water proposal, page 140.756 Some water may be lost in the form of evaporation but this is not, to my knowledge, mentioned by State Water. Frontier
(2013), page 72 make the following comment: “On the basis of [a review of operating cost structure] State Water concludes that 99% of its operating costs are fixed. This is not a surprising result given the nature of State Water’s business. To the best of our knowledge it does use pumps to distribute water or treat water outside the Fish Creek area. Pumping and treatment activities involve variable costs associated with the electricity and chemicals consumed.”
757 More generally, if some customers choose not to take all of their water then customers which consume less than average are pay slightly less under State Water’s proposal, and customers which consume more than average pay
ACCC Draft decision on State Water Pricing Application: 2014-15 – 2016-17 | Attachments 278

Now let’s look at the impact on risk-sharing with State Water’s customers. Under the present arrangements State Water’s customers face some annual variation in their State Water bill. The total amount currently paid by State Water’s customers is lower in dry years and higher in wet years. Under State Water’s proposal, State Water’s customers would pay less in wet years and more in dry years, with less overall variability in their annual water bill.
The overall impact on the risk faced by a customer depends on the how that customer’s other cash-flows (excluding water charges) varies with the water allocation.
Consider first a customer whose cash-flow (excluding water charges) is constant from one year to the next, independent of water availability. Such a customer will likely prefer to have lower variability in the State Water bill. This might be the case, say, for a government department responsible for environmental flows. If the government department has a stable budgetary allocation, it may prefer to have a stable bill from State Water, independent of the amount of water allocated. Such a customer might prefer to have the delivery charge set at zero. We would expect that such a customer would prefer State Water’s proposal over the status quo.
But many of State Water’s customers are likely to have a cash-flow (excluding water charges) which is positively correlated with water availability. Many croppers (such as rice growers) plant a larger area at times of high water availability. These growers will face substantially higher revenues and cash-flows in years of high water availability. In other cases, even if the revenues of the water user are stable from year to year, the costs incurred may depend on water availability – for example, dairy farmers may have to purchase expensive feedstock in dry years.
When the cash-flow of the water user is positively correlated with water availability, a water bill which is also correlated with water availability reduces the overall variability in the cash-flow.758 Therefore, reducing the charges for water delivery and increasing the charges on water entitlements may, for these customers, increase the overall variability in the cash-flow. In this sense, State Water’s proposal may reduce the risk on State Water, but may increase the variability in the cash-flow on many of State Water’s customers.
To the extent to which State Water’s customers are risk-averse, exposing customers to risk in this way can be undesirable – it directly reduces overall economic welfare.
In addition, there can be other real effects. Specifically, although many of State Water’s customers are large corporations or town councils, many of State Water’s customers are owner-farmers. These smaller enterprises often do not have easy access to capital markets – that is, they cannot easily raise equity and often face borrowing constraints. The amount such customers can borrow is typically limited by a worst-case scenario – that is, the cash-flow in a bad year, or in a string of relatively bad years. An increase in cash-flow volatility will likely increase the probability the cash-flow from a bad year or string of bad years will fall below any given threshold. As a consequence, an increase in volatility can reduce the amount the customer can borrow. This may, in turn, limit investment, which can have an impact on farm productivity. In other words, shifting risk on to these customers may have harmful economic consequences.
Summary of no-water-trade case
In summary, under this assumption of no water trade, there is a clear trade-off between risk-sharing and efficiency. Increasing the charge for water delivery above the marginal cost of water delivery may deter some valuable uses at the margin by customers who
slightly more.758 Strictly speaking this is only true if the sensitivity of the water bill to the water delivered is less than the sensitivity of the
underlying cash-flow to the water used. If the water delivery charges were high enough it is theoretically possible that the overall cash-flow could become inversely correlated to water availability.
279 ACCC Draft decision on State Water Pricing Application: 2014-15 – 2016-17 | Attachments

would prefer not to take allocated water at all rather than pay the delivery charge. But this effect may be quite small (in practice I understand that water users typically take delivery of their entire water allocation). On the other hand, higher charges on water delivery may reduce the volatility of the cash-flow of State Water’s customers, reducing the risk to which they are exposed and increasing their ability to raise capital, with impacts on investment and productivity. I note that historically there has been a long-tradition in agriculture of arrangements (such as sharecropping or sharemilking) which apparently trade-off economic efficiency against improved risk sharing arrangements. The present arrangements may be an example of that sort of arrangement.
The active water trade case
Now let’s make the assumption that there is an active, competitive market in water – also known as temporary water trade. In this world, there is no longer any necessary connection between water users and water entitlement holders. A farmer may consume large amounts of water without holding water entitlements. Conversely, any party (such as a financial institution) may hold water entitlements with no willingness or ability to ever take delivery of that water.
This is an important observation. If water trade is impossible, the only way to obtain water is via an allocation against an entitlement. At the same time, water entitlements have no value if the holder cannot take delivery of the allocated water. As a result, all water users are water entitlement holders and vice versa. However, if water trade is possible, there is no necessary connection between using water and holding an entitlement. A water user can buy as much water as he/she needs on the water market. A water entitlement holder can sell as much water as he/she desires on the water market. No water user need be an entitlement holder or vice versa.
In this context, it is no longer correct to characterise State Water’s proposal as a change from fixed to variable tariffs or vice versa. Instead, State Water’s proposal is a change to the burden of charges between two groups – from charges on those who use water, to charges on those who hold water entitlements. A water user can always choose to avoid State Water’s entitlement charges simply by selling his/her entitlement.
Impact on efficiency of water usage
The effect of active water trade is to equalise the marginal value of water across water users. If any water user values water more highly at the margin than the current market price, he or she can simply purchase more water. If any water user has a marginal value for water below the market price he/she is better off by selling water at the margin. This is important because it means that it is unlikely that there will be users of water with a very low value for water at the margin.Let’s make the assumption that even if water allocated in State Water’s area is traded out of State Water’s region, that water must still pay State Water charges (the entitlement and delivery charges). This means that delivery charges cannot be avoided by trading out of the region.
Importantly, because there is a fixed supply of water available, the supply curve for water is inelastic. As a result, any increase in State Water’s delivery charge results in an equal and opposite change in the market price. For example, if there is a $5/ML increase in the water delivery charge, the demand curve for water shifts down by $5/ML. But the supply of water is fixed, so the new equilibrium market price is $5/ML lower. This is illustrated in the following diagram.
ACCC Draft decision on State Water Pricing Application: 2014-15 – 2016-17 | Attachments 280

This is an important point. As long as the market price for water is positive, any increase in the water delivery charge results in an equal and opposite drop in the market price for water with no net change in the volume of water consumed. As long as the market price for water does not drop to zero, any change in the water delivery charge has no impact on the economic efficiency of the market.
It is theoretically possible that if the water delivery charge were large enough, the water price would drop to zero and some water users would choose not to consume rather than incur the delivery charge. This is illustrated in the following diagram:
But, in practice, even in years of high water availability, the water price has remained many times higher than the water delivery charge. The potential for a change in the water delivery charge to result in a reduction in water usage seems to be very low risk.
We saw above that where water trade is impossible, it was likely that users would have a range of different values for water at the margin. The marginal value of water for some of those users could be quite low. In this case there was a risk that increasing the water delivery fee might deter some of those users from consuming water (that is, they may not take all of their allocation), reducing economic efficiency.
281 ACCC Draft decision on State Water Pricing Application: 2014-15 – 2016-17 | Attachments
Supply curve for water
Demand curve for water
An increase in the delivery charge by $5/ML lowers the demand curve resulting in a drop of $5/ML in the market price.
Volume of water allocated
Water price
Supply curve for waterDemand curve for water
If demand is particularly low, an increase in the water delivery charge can result in the market price dropping to zero resulting in a reduction in the water used.
Volume of water allocated
Water price

But in the presence of water trade, all users must have the same marginal value for water, as reflected in the market price. That market price is typically at least many times higher than the water delivery charge. In fact the market price can be in the hundreds of dollars per ML whereas the delivery charges for water are typically less than $10/ML. In this context, increasing the delivery charge merely results in a reduction in the market price for water, with no change in the volume of water consumed. As long as the market price is greater than zero there are no efficiency consequences from a change in the delivery fee. In the presence of water trade a shift from charges on delivery to charges on entitlement should have no impact on the efficiency of water use.
Impact on the level of revenue and volatility of cash-flow of water users
We saw above that in the case of no water trade if each water user consumes his/her water allocation, then although water users pay more in dry years and less in wet years, each water user pays the same amount on average. But this is no longer true where there is water trade. Instead, as we have seen, there is no necessary link between entitlement holding and water consumption. Water users which have a high water use relative to their entitlement (including water users who carry no entitlement at all) will pay less under State Water’s proposal. Conversely, water users which use relatively little water relative to their entitlement (including water users who hold entitlement but do not take delivery of water) will pay more under State Water’s proposal.
What about the risk-sharing implications of the proposal? Does the proposal to move towards a higher entitlement charge and a lower delivery charge increase or reduce the risk faced by State Water’s customers?
It is difficult to provide a generic answer to this question. However, it is easy to provide reasonable examples where the tariff structure can have a substantial impact in reducing the risk faced by State Water’s customers.
But, in theory, there are much better ways to reduce the risk to which water users are exposed. Later in this note I provide some examples of instruments which could, in principle, be used to eliminate the risk faced by water users who are active in the water market. To my knowledge such hedge contracts are not currently traded in the water market. In the absence of such contracts, State Water’s customers are exposed to risk. That risk can be partially mitigated by higher delivery charges and lower entitlement charges.
In other words, it appears that the current structure of State Water’s charges is playing a risk-mitigation role. This role arises due to the absence of a market in water-price risk-management products. If these other products were available, there would be no need to take into account risk allocation issues when considering the structure of State Water’s charges.
Summary
In conclusion, State Water’s proposal will reduce the risk on State Water. State Water claim that the change in tariff structure is essential for it to maintain commercial viability but on the basis of the evidence I have examined so far, this appears unlikely. In any case there are other ways of reducing the risk on State Water.
State Water’s current tariffs appear to play a risk-management role for State Water’s customers. In the absence of water trade, State Water’s proposal will increase risk on customers with a cash-flow which is correlated with the water allocation. An increase in risk may reduce the amount these customers can borrow, potentially reducing real investment. In the presence of water trade, the analysis is more complicated. It appears that in the absence of hedging products in the water market, the current structure of the water charges is playing a risk-management role. Ideally, there would exist risk
ACCC Draft decision on State Water Pricing Application: 2014-15 – 2016-17 | Attachments 282

management products which allow water users to lock in the price they pay for the water they use in advance. In the absence of such products, increasing the delivery fee above zero (and reducing the entitlement fee) seems to allow State Water’s customers to mitigate the risks they face.
Overall, the risk-management arguments seem to be the most significant. This note suggests that the current structure of the water delivery charges appear to be playing a risk-management role and we should be cautious about moving to other structures without allowing water users some other ways of mitigating their risks. One alternative would be to allow State Water customers a choice of the tariff structure they would prefer. As long as that choice is made in advance of knowledge of future water availability the scope for gaming would be minimised. A third possibility would be to allow State Water’s proposal in regions where the water market is developed, and where risk-management instruments could be developed.
The main conclusions of this paper are set out in the following table:
283 ACCC Draft decision on State Water Pricing Application: 2014-15 – 2016-17 | Attachments

Category Impact on State Water Impact on State Water’s Customers
Efficiency of water use
Where there is no scope for water trading, if there are currently some customers with a marginal value of water that they would rather let water go to waste than pay the delivery charge, the
proposal may allow for increased water use at the margin, increasing efficiency.
Where there is water trading, the proposal will likely increase the water market price but have no impact on water use, so no
change in efficiency of water use.
Level of water charges
State Water receives higher revenue in dry years and less in wet
years, but no change on average.
Where there is no water trading, and customers consume their
entitlement, each customer pays the same on average.
Where there is water trading, customers with high water use
and/or low entitlement holdings pay less, while customers with little
water use and/or high entitlement holdings pay more.
Risk-Sharing The proposal will reduce the volatility of State
Water’s revenue stream. The economic significance of this is unclear, but State Water may be seeking to
avoid the uncertainty brought about by climate
change.
Where there is no scope for water trading, the proposal will almost certainly increase the volatility of cash-flows for those customers
whose cash-flow is proportional to water availability. This increase in
volatility may reduce their ability to borrow, reducing on-farm
investment.Where there is scope for water trading, and where there are no
water-price risk-management tools it appears that the proposal may increase volatility. The current
arrangements may be acting as a partial substitute for a lack of other
risk-management tools.
Incentives No discernible impact on incentives for efficiency or incentives for investment.
Proposal may reduce incentives to promote
water use, but total water availability is fixed so this
will have no impact.
The use of a Loss Capitalisation Model
Let’s suppose that we have a firm which faces an uncertain revenue stream. The revenue in period t is given by the random variable , which has a mean . Let’s suppose the firm defines a loss-capitalisation account with a balance given by . Each period the
ACCC Draft decision on State Water Pricing Application: 2014-15 – 2016-17 | Attachments 284

firm is allowed a cash-flow equal to the revenue allowance plus the return on the outstanding balance:
Each period the balance is rolled forward by adding on the mean revenue and subtracting the actual revenue:
The impact of this is that for any time period T, the present value of the cash-flow stream up to time T is equal to the present value of the average cash-flow, plus the opening RAB, less the closing RAB discounted by the cost of capital:
Now, is a random variable, but it is the sum of many independent random variables with a mean of zero. The variance of this random variable grows linearly with T, but the denominator in the last term grows with a power of T, so the last term tends to zero as T is large. If the RAB starts at zero, we have proven that: as . In other words, the NPV of State Water is equal to the expected revenue (and not just equal on average).
The following graph illustrates how the revenue allowance for State Water would vary over 50 years using an LCM. The raw revenue allowance (which depends on the water allocation) is shown in blue. The actual revenue allowance (including the allowance for the loss capitalisation mechanisms) is shown in red. The cost of capital is 10 per cent. As can be seen the difference is relatively small. The impact of this mechanism is that the NPV of State Water is equal to the expected value no matter what the out-turn path of water availability (as opposed to just equal on average).
Who pays more from State Water’s proposal?
Let’s suppose that we have a charge of per unit of entitlement, and per unit of water actually delivered. Let’s suppose that in the market at a whole, there are units of
285 ACCC Draft decision on State Water Pricing Application: 2014-15 – 2016-17 | Attachments

water entitlements and units of water is actually delivered in a given year. The total water charges paid by customers and received by State Water in such a year is therefore:
Now, suppose the tariff structure is changed to new charges and which are set in such a way that the total revenue received by State Water remains the same on average:
We can express this as follows:
Now suppose that a water user holds units of entitlement and uses units of water in a given year ( is a random variable). This water user therefore pays the following amount in water charges:
When the tariff structure is changed, does the water user above pay more or less in water charges? The water user will pay more if and only if:
Which is true if and only if:
Let’s consider a change in tariff structure which increases the entitlement charge and reduces the delivery charge, so that (as State Water proposes). The water user above will pay more than the current arrangements in any year in which the user’s water consumption as a share of that user’s entitlement is smaller than the average water consumption as a share of the total entitlements:
If we make the assumption that all the water which is allocated is consumed then . Then it follows that a water user will pay more under State Water’s proposal
whenever the user’s water consumption as a share of the entitlement is less than the long-term average allocation for the market as a whole:
In other words, water users which consume relatively little water relative to their entitlement holding will tend to pay more under State Water’s proposal; in contrast water users which consume a large amount of water on average and/or have a relatively small entitlement holding will pay less.
In the special case where there is no water trading and where each user consumes his/her allocation , the water users will pay more in years of low allocation and less in years of high allocation but on average will pay exactly the same as in the status quo.
ACCC Draft decision on State Water Pricing Application: 2014-15 – 2016-17 | Attachments 286

The implications of the proposal for risk-sharing
The case of no water trading
Let’s suppose we have a generic water user which converts water, as an input, into a cash-flow stream. For example, this water user could be a rice grower or some other form of farmer. Let’s suppose that the net revenue of the water user when he/she uses a volume of water is given by . For example, if one ML of water can produce $200 worth of rice, then . Due to diminishing returns we would normally expect that the extra revenue generated by an extra unit of water is decreasing as the total volume of water used increases.
Let’s suppose that a water customer holds units of entitlement. The water allocation (as a percentage of entitlement) is a random variable so the customer is allocated a volume units of water. Let’s suppose the charges on entitlements are and the charges on delivery are .The overall cash-flow of the customer is therefore:
The water user chooses the volume of water which maximises this expression subject to the constraint that the total volume of water used is less than or equal to the allocation
. Let’s define to be the quantity which satisfies . It follows that the profit maximising choice of water use is given by:
If we assume that the marginal cost of delivery is zero, the efficient choice of water is . It is clear that as long as the delivery charge is large enough to
reduce the water consumption of a user below the user’s water allocation, there will be some loss of efficiency (if then ).
Let’s focus on the special case of a water user which has a constant marginal value for water up to some capacity limit . For example, this could be a farm with a fixed output per hectare, fixed water use per hectare, and a maximum area which can be planted. Let’s also assume that the marginal value of water is above the delivery charge that the user always consumes all of his/her entitlement, as long as he/she has the capacity to do so: . The cash-flow of the water user as a function of the entitlement is then:
The variability in this cash-flow is just in the first term. It is clear that this variability can be reduced by increase the water delivery charge towards the user’s marginal value of water (but not above). In other words, in this context there is a clear trade-off between risk-sharing and efficiency: Increasing the delivery charge reduces the volatility
287 ACCC Draft decision on State Water Pricing Application: 2014-15 – 2016-17 | Attachments

experienced by those water users who choose to consume, but deters some water users from consuming at all, which reduces efficiency.
The following graph illustrates how this might work. The following graph illustrates the cash-flow of an irrigator who can take up to 50 per cent of the water allocation he/she receives. The underlying cash-flow is increasing up to this limit and then is constant. If there is a particularly high delivery charge, the delivery charges also match this cash-flow pattern. The net cash-flow (after paying the delivery charges) shows very little volatility at all.
The case of water trading
Let’s suppose that the price of water in the water market is . Putting aside the water charges for the moment the net profit of the water user after paying for the water is as follows:
Let’s assume that the water user is a price-taker in the water market. The water user chooses the volume of water to use which maximises his/her net profit. From the first-order condition for this maximisation, the volume of water which maximises the profit satisfies:
This expression yields a downward-sloping demand curve for water , as illustrated in the following diagram:
ACCC Draft decision on State Water Pricing Application: 2014-15 – 2016-17 | Attachments 288

Let’s again focus on the special case of a water user which has a constant marginal value for water up to some capacity limit . For example, this could be a farm with a fixed output per hectare, fixed water use per hectare, and a maximum area which can be planted. In this case the net revenue of the water user is simply proportional to the water used, up to some maximum:
The profit-maximising choice of water usage as a function of the water price is given by:
The net profit of the water user is therefore:
In the special case where the marginal value of water for this user is very high, the profit-maximising choice of water usage is just constant at , and the net profit is .
What sort of hedging instrument will allow this user to perfectly hedge his/her risk? The answer is straightforward. Let’s assume that we have a water-price hedging instrument which pays out the difference between the water spot price and a strike price , but only when the water spot price is below the strike price. This instrument has a payout:
Let’s suppose the water user purchases a volume of this hedging instrument. Is there a combination of strike price and volume which eliminates the risk faced by this water user? The answer is clearly yes. The water user can purchase a volume of an instrument with a strike price . This instrument then has a payout which perfect matches the net profit of the water user above.
289 ACCC Draft decision on State Water Pricing Application: 2014-15 – 2016-17 | Attachments
Water price
Water volume

Furthermore, as long as there is a range of such instruments in the market, with a range of strike prices, any water user with a downward sloping demand for water can achieve a perfect hedge by purchasing a portfolio of such contracts.
Now let’s suppose that the hedge contracts above do not exist. Can the water charges be structured in such a way as to reduce the risk faced by water users?
As before, let’s suppose the water user holds an entitlement volume . The entitlement charge is assumed to be and the delivery charge . If the water user uses a volume of water, the total water charge is . A water user receives an allocation of water which is a percentage of the entitlement volume. If the allocation of water is expressed as , the volume of water the user receives is .
The net profit of the water user after paying the water charges and after receiving an allocation against the entitlement are as follows:
Now, since water is in inelastic supply, if we assume that all water users must pay the delivery fee, then any increase in the delivery fee must be matched by an equal-and-opposite reduction in the water market price. Therefore, let’s define a new price . This price is independent of changes in the delivery charge.
For simplicity, let’s assume that water users who receive a water allocation cannot avoid the delivery fee by simply choosing not to take the water they have been allocated. Instead we will assume that the delivery fee must be paid whether the water is taken or not (unless the water is sold to another user, who must then pay the delivery fee). With this assumption, as long as the delivery fee is positive, the water market price can be negative. For example, suppose that the delivery charge is $100/ML. A water user who is allocated water with a marginal value, of say $20/ML will be prepared to pay any amount up to $80/ML to have another water user take the water. Since at any price up to $-80/ML the user is still better off than keeping the water and using it himself.
We can re-write the net profit of the water user, given the level of entitlement as follows:
As before, we can assume that the water user chooses the level of water usage to maximise this profit given the prevailing water price: . We can then write the net-profit of the water user as a function of the underlying price:
Let’s take the case of the water user with a constant marginal value up to a fixed capacity.
To make progress to illustrate how the structure of fees can be used to reduce the risk of customers, let’s assume that the underlying price is a linear, downward-sloping function of the allocation .
Let’s assume that the marginal value of the water to the user is such that the user will choose to use its full capacity of water whenever the water allocation exceeds, say, 50 per cent. The water user starts with some initially level of entitlement. The following
ACCC Draft decision on State Water Pricing Application: 2014-15 – 2016-17 | Attachments 290

graph illustrates the case where there are no delivery charges, but only entitlement charges.
As can be seen, the net profit of the water user is highly dependent on the water allocation, with substantially higher profits in years in which allocations are high and the water price is low. The water charges do not limit this variability in the net profit. The net cash-flow (represented by the green line in the graph below) is very sensitive to the allocation.
Now consider the case where the delivery charge is increased to $700/ML, and the entitlement charge is reduced to $-40/ML. The total revenue raised on average in water charges remains the same. But the pattern of water charges and payment from the allocation is inversely correlated with the underlying cash-flow. Overall the net cash-flow of the water user is now relatively stable.
This example illustrates how a high delivery charge and low entitlement charge may expose a water user to significantly lower levels of risk than a high entitlement charge and a low delivery charge.
291 ACCC Draft decision on State Water Pricing Application: 2014-15 – 2016-17 | Attachments

This is merely an example. Different assumptions about the cash-flow of the water user and/or about the link between allocation and water prices will lead to different conclusions. However it serves to illustrate that a tariff structure with a very high delivery fee and a very low entitlement fee may act to insulate customers from cash-flow volatility.
ACCC Draft decision on State Water Pricing Application: 2014-15 – 2016-17 | Attachments 292

Appendix B – Background to Fish River chargesThe Fish River Water Supply Scheme supplies water to Oberon and Lithgow Councils and Sydney Catchment Authority (SCA) for town water supplies, as well as Delta Electricity (now Energy Australia) for power station operation at Wallerawang and Mount Piper (these are classified as major customers).759 The scheme also supplies water for domestic (and some stock) purposes to approximately 300 ‘minor customers’.760
The Fish River scheme is geographically separate from, and operationally different to State Water’s other areas of operation.761
Fish River customers do not have an entitlement as valley-based customers do. The customers have previously been given a share of the entitlement for the Fish River scheme in the form of a kilolitre (kL) minimum annual quantity (MAQ), which has been defined under the NSW Water Act 2012 Part 9 deemed licence held by State Water.
Instead of entitlement and usage charges (like the other MDB valleys), the Fish River charges are based on a fixed access charge which is set based on the MAQ share for major customers, and a deemed MAQ of 200kL per customer for minor customers. Currently, usage charges are two tiered, including a first tier charge for usage up to the MAQ, and a second tier charge for usage above the MAQ.
Charges levied for Lithgow and Oberon councils and Sydney Catchment Authority in the Fish River water supply area are not regulated charges under Section 91(3) of the Water Act 2007. Accordingly the ACCC cannot determine charges for these customers, which will be regulated by IPART. The ACCC has agreed with IPART to include all Fish River charges in the ACCC’s review, as set out in this attachment. IPART will review the charges levied for Lithgow and Oberon councils and Sydney Catchment Authority in 2014-15 and intends to use information from the ACCC’s review in its review process.762
759 Delta Electricity is now owned by Energy Australia.760 State Water, Pricing application to the Australian Competition and Consumer Commission for regulated charges to
apply from 1 July 2014, Regulatory information template (RIT), June 2013, p.147.761 The main differences include: (1) it provides two separate water supply systems: a raw water system (not suitable for
drinking) and a filtered water supply system, requiring chemical supply; (2) Part of the system is not gravity fed and a number of pumping stations are in place to transfer water to SCA storages when needed. These pumping stations require significant electricity supply; (3) Much of the scheme is serviced through pipeline infrastructure, rather than rivers and channels as is the case in State Water’s other valleys.
762 IPART’s website contains further information on its price review for certain Fish River customers. See http://www.ipart.nsw.gov.au/Home/Industries/Water/Reviews/Rural_Water/IPARTs_2015_review_of_State_Waters_prices_for_the_coastal_valleys_and_some_Fish_River_customers.
293 ACCC Draft decision on State Water Pricing Application: 2014-15 – 2016-17 | Attachments

Appendix C – Meetings with stakeholders and submissionsMeetings with stakeholders
Pre-application consultation
Prior to receiving State Water’s pricing application, ACCC staff held the following public meetings to discuss the ACCC’s forthcoming review:
Moree, 15 November 2012
Dubbo, 12 December 2012
Lithgow, 18 December 2012
Goondiwindi, 27 February 2013
Narrabri, 28 February 2013
Deniliquin, 6 March 2013
Condobolin, 19 March 2013
Leeton, 20 March 2013.
Post-application consultation
After receiving State Water’s pricing application, ACCC staff held the following meetings with stakeholders to discuss the application:
Melbourne, 9 October 2013 - NSW Department of Trade & Investment
Melbourne, 17 October 2013 - Macquarie River Food & Fibre
Sydney, 6 November 2013 – State Water Customer Service Committee Chairpersons’ Group (Border valley, Gwydir valley, Namoi-Peel valley, Lachlan valley, Macquarie valley, Murrumbidgee valley, Murray valley, Fish River)
Sydney, 6 November 2013 – NSW Irrigators’ Council Members’ Group (Gwydir Valley Irrigators, Lachlan Valley Water, Macquarie River Food & Fibre, Murray Irrigation, Murrumbidgee Private Irrigators, Murrumbidgee Valley Food & Fibre, Namoi Valley, NSW Farmers Association, Ricegrowers Association, South Western Water Users Association)
Griffith, 14 November 2014 – Murrumbidgee Irrigation and Murrumbidgee Private Irrigators & Yanco Creek & Tributaries Advisory Council
Deniliquin, 15 November 2013 – Murray Irrigation
Moree, 20 November 2013 - Gwydir Valley Irrigators' Association
Gunnedah, 20 November 2013 – Namoi-Peel Customer Service Committee
Gunnedah, 20 November 2013 – Peel Valley Water Users' Association and Tamworth City Council
ACCC Draft decision on State Water Pricing Application: 2014-15 – 2016-17 | Attachments 294

Sydney, 27 November 2013 – Energy Australia
Melbourne (teleconference), 24 January 2014 – NSW Department of Trade & Investment and NSW Department of Treasury
Melbourne (teleconference), 6 February 2014 – NSW Department of Trade & Investment and NSW Department of Treasury
Melbourne (teleconference), 13 February 2014 - Commonwealth Environmental Water Office and NSW Office of Environment and Heritage.
The ACCC’s consultants (Deloitte) and ACCC staff also held numerous meetings with State Water staff during the review of State Water’s application. ACCC staff also held regular meetings with IPART staff during the review.
List of submissions
Anonymous (name withheld)
Barry Dugan
Border Rivers Food and Fibre
Cameron Ferguson
Commonwealth Environmental Water Office
Energy Australia
Fisheries NSW
Gwydir Valley Irrigators' Association
Jemalong Irrigation
John Ryan
Kalumunda Pastoral
Lachlan Valley Water
Macquarie River Food and Fibre
Mark Dugan
MDBA
Michael Storrier
Mike Carberry
Murray Irrigation
Murrumbidgee Irrigation
Murrumbidgee Private Irrigators and Yanco Creek & Tributaries Advisory Council
295 ACCC Draft decision on State Water Pricing Application: 2014-15 – 2016-17 | Attachments

Murrumbidgee Valley Food and Fibre Association
Namoi Water
NSW Farmers' Association
NSW Irrigators' Council
Peel Valley Water Users' Association
Rural Funds Management
South West Water Users
Sydney Catchment Authority
Wakool Landholders' Association
ACCC Draft decision on State Water Pricing Application: 2014-15 – 2016-17 | Attachments 296