Embed Size (px)
Citation preview

UDC 6 3 3 . 7 1 ISSN 0494-3244
TOBACCO
BULLETIN O F TOBACCO SCIENCE AND PROFESSION
V o l . 6 2 N o
1 - 6 P . 0 1 - 5 7 P R I L E P
J A N U A R Y J U N E 2 0 1 2
O r i g i n a l s c i e n t i f i c p a p e r s :
C O N T E N T S :
S l o b o d a n D r a ž i ć , I l i j a R i s t e s k i , K i r i l F i l i p o s k i , K a r o l i n a K o c o s k a
R E S U L T S O F S T U D I E S O N R E C E N T L Y D E V E L O P E D V I R G I N I A T O B A C C O G E N O T Y P E S U N D E R D I F F E R E N T G R O W I N G C O N D I T I O N S I N S E R B I A . . . . . . . . . . . . . . . . . . . . 0 3 - 0 8
Y o v k o D j u l g e r s k i , D i m i t a r D i m a n o v :
I N H E R I T A N C E O F T H E N I C O T I N E I N B U R L E Y T O B A C C O C R O S S E S . . . . . . . . . . . . . . . . . . . . . . . . 0 9 - 1 2 I l i j a R i s t e s k i , K a r o l i n a K o c h o s k a , B i l j a n a G v e r o s k a :
R E S U L T S O F T H E I N V E S T I G A T I O N O N S O M E B I O - M O R P H O L O G I C A L C H A R A C T E R I S T I C S O F D O M E S T I C A N D I N T R O D U C E D V A R I E T I E S O F B U R L E Y T O B A C C O . . . . . . . . . . . . . . . . . . . . . . . . . . . . . . . . . . . . . . . . . . . . . . . . . . . . . . . . . . . . . . . . . . . . . . . . . . . . . . . . . . . . . . . . . . . . . . . . . . . 1 3 - 2 1
K . I v a n o v , P . Z a p r j a n o v a , V . A n g e l o v a , G . B e k j a r o v , L . D o s p a t l i e v :
C O M P A R I S O N O F D I G E S T I O N M E T H O D S F O R I C P D E T E R M I N A T I O N O F T O T A L P H O S P H O R O U S I N P L A N T M A T E R I A L S l . . . . . . . . . . . . . . . . . . . . . . . . . . . . . . . . . . . . . . . . . . . . . . . . . . . . . . . . . . . . . . . . . . . . 2 2 - 2 9
M i r o s l a v D i m i t r i e s k i , G o r d a n a M i c e s k a , P e t r e T a s k o s k i
I N V E S T I G A T I O N O F T H E R E S I S T A N C E T O B L U E M O L D ( P e r o n o s p o r a t a b a c i n a A d a m ) A N D B L A C K S H A N K ( P h y t o p h t h o r a p a r a s i t i c a v a r . n i c o t i a n a e ) I N S O M E O R I E N T A L T O B A C C O C U L T I V A R S A N D L I N E S . . . . . . . . . . . . . . . . . . 3 0 - 3 5
P . T a s k o s k i :
E V A L U A T I O N O F T H E A N T A G O N I S T I C E F F E C T O F T R I C H O D E R M A A S P E R E L L U M A G A I N S T T H E P A T H O G E N P Y T H I U M D E B A R Y A N U M . . . . . . . . . . . . . . . . . . . . . . . 3 6 - 4 4
H r i s t o A n a s t a s o v , S h t e l i y a n a K a l i n o v a :
I N F L U E N C E O F O X Y F L U O R F E N O N S O M E A N A T O M I C I N D I C E S I N T H E L E A V E S O F V I R G I N I A T O B A C C O P L A N T ( N I C O T I A N A T A B A C U M L . ) . . . . . . . . . . . . . . . . . . . . . . . . 4 5 - 4 8
B i l j a n a G v e r o s k a , I l i j a R i s t e s k i , K a r o l i n a K o c h o s k a :
C H A N G E S I N T H E M O R P H O L O G Y O F T H E F U N G U S A L T E R N A R I A A L T E R N A T A I N T H E T R A N S M I S S I O N F R O M N A T U R A L I N A R T I F I C I A L C O N D I T I O N S O F C U L T I V A T I O N . . . . . . . . . . . . . . . . . . . . . . . . . . . . . . . . . . . . . . . . . . . . . . . . . . . . . . . . . . . . . 4 9 - 5 7
3
UDC 633.71Тутун/Tobacco, Vol.62, No 1-6, 03-08, 2012University “St. Kliment Ohridski” - BitolaScientific Tobacco Institute – Prilep, R. Macedonia
ISSN 0494-3244
UDC: 633.71-152.61(497.11)”2011”Original scientific paper
RESULTS OF STUDIES ON RECENTLY DEVELOPED VIRGINIA TOBACCO GENOTYPES UNDER DIFFERENT GROWING CONDITIONS IN SERBIA
Slobodan Dražić1, Ilija Risteski2, Kiril Filiposki2, Karolina Kocoska2
1institute for Medicinal Plant Research Dr Josif Pančić, Belgrade, Serbia
2 University “St. Kliment Ohridski”- Bitola,Scientific Tobacco Institute, Kichevski Pat, bb. 7500 Prilep, R. Macedonia
ABSTRACT
The paper presents results of the studies on production traits of 12 recently developed Virginia tobacco genotypes. Seven experimental varieties (V- 817, V- 814, V- 813, V-81/VS, V-N 7/VS, V- H 97 and V-C 7/VS) were from Serbia and five varieties (V-88/09, V-82/07, V-53, V-33/09 and V-30/09) were from Macedonia. The variety Hevesi 9 was used as a check. The varietal trial was carried out in two locations in Serbia in 2011. The following parameters were analysed during the growing period: plant height, number of leaves per stalk, dimensions of leaves cutters and yield. The leaf colour on the stalk and the leaf colour after curing were estimated. Reliably higher yields in relation to the check (3,340 kg ha-1) were recorded in the varieties V - 817 (4,030 kg ha-1), V- 814 (3,940 kg ha-1) and V- 81/VS (3,810 kg ha-1). Yields of remaining genotypes were lower than the yield of the check. The leaf colour on the stalk was yellowish in the majority of genotypes, and it turned yellow after curing.
Key words: agroecological conditions, recently developed genotypes, yield, varietal trial, Virginia.
РЕЗУЛТАТИ ОД ИСТРАЖУВАЊАТА НА НОВОСОЗДАДЕНИ ГЕНОТИПОВИ
ВИРЏИНИЈА ОДГЛЕДУВАНИ ВО РАЗЛИЧНИ ПРОИЗВОДНИ УСЛОВИ ВО СРБИЈА
Во трудот се прикажани производните резултати од истражувањата на дванаесет новосоздадени генотипови вирџинија. Експерименталните сорти од Србија се (V- 817, V- 814, V- 813, V-81/VS, V-N 7/VS, V- H 97 и V-C 7/VS) и од Македонија (V-88/09, V-82/07, V-53, V-33/09 и V-30/09). Сортата Hevesi 9 е користена како стандард. Сортниот опит беше изведен во 2011 година на два локалитети во Србија. Во текот на вегетацијата се анализирани: висина, број листови на стеблото, димензии на средните листови и приносот. Оценувана е бојата на листовите на стеблото и после сушење. Сортите : V- 817 (4.030 kg/ha), V- 814 (3.940 kg/ha) и V- 81/VS (3.810 kg/ha) оствариле значајно повисоки просечни приноси на суви листови во однос на стандардот (3.340 kg/ha). Останатите генотипови оствариле пониски приноси во однос на стандардната сорта. Кај повеќето генотипови бојата на листовите на стеблото е жолтеникава, а после сушењето жолта. Клучни зборови: агроеколошки услови, новосоздадени генотипови, принос, сортен опит, вирџинија.

4
Previous studies showed that the introduced varieties of Virginia flue-cured tobacco did not fully expressed their genetic potential as they did in the regions of their origin and growth. This was confirmed by comparative trials with locally bred tobacco varieties, which mainly overyielded the introduced varieties. Therefore, the introduced varieties are most often used as an initial material in hybridisation, as they express more traits of important characteristics for this type of tobacco (Dražić and Prodanović, 1999. Dražić 1986, 2003, 2004, Risteski et al., 2009, Kocoska and Risteski, 2011).
The development of a new variety presents the accumulation of desirable genes and their recombination into one genotype, which will under certain growing conditions have high and
stable yields and will be of good quality. Factors affecting the final product, in this case leaf yield and leaf quality can be classified into two groups: external (soil, weather conditions, growing space, nutrition, harvest, curing) and genetic (variety with its biological, morphological, productive and physiological traits, response to the type of soil, uptake of nutrients). The yield level depends on the genetic potential of the variety, and stability depends on its response to environmental conditions, which is caused by its genetic composition (Dražić, 2001, 2007).
Therefore, the objective of the present study was to observe production traits of recently developed Virginia tobacco genotypes under environmental conditions of the production regions of Serbia.
Trials with 12 recently developed Virginia flue-cured tobacco varieties were set up in 2011. The varieties V-817, V-814, V-813, V-81/VS, V-N 7/VS, V-H 97 and V-C 7/VS were developed by the Institute for Medicinal Plant Research, Belgrade, Serbia, while the remaining five varieties V-88/09, V-82/07, V-53, V-33/09 and V-30/09 were derived by the Tobacco Institute, Prilep, Macedonia. The variety Hevesi 9 (Hungary) was used as a check. Male-sterile flowers were used in trails. According to cytoplasmic male sterility flowers belong to the type 3, which is suitable for cross pollination (Dražić, 1980).
The varietal trial was set up in two locations: Nova Pazova and Starčevo that are 30 km away from Belgrade. Nova Pazova and Starčevo are located North West and East of Belgrade, respectively. The tobacco seedling production was done in semi-hot beds during the March-May period. Planting was performed at a distance of 90 x 50cm with four replications at the end of May. The elementary plot size amounted to 12m2. The following production traits were analysed: plant height, number of leaves per stalk, dimensions of leaves cutters and yield. The leaf colour on the stalk and after curing was
estimated (Skalenkatalog, 1977/78). Results were processed by the analysis of variance. The significance of differences of observed traits was determined by the LSD test.
The conditions under which the trials were performed. - The soil in Nova Pazova is chernozem. According to agrochemical analyses, this soil is humus (3.21%), well supplied with available nitrogen (3.86%), optimally supplied with phosphorus (22 mg/100 g/soil) and potassium (21 mg/100 g/soil) and its reaction is neutral (pH in KCl=7.05). The soil in Starčevo is alluvium poorly supplied with humus (1.46%), which is desirable for the Virginia tobacco (Group of authors, 1976, Hawks, l978, Dražić, 1995). Results of agrochemical analysis show that this soil is poorly supplied with nitrogen (1.1%), optimally supplied with phosphorus (23 mg/100 g/soil) and fairly supplied with potassium (13.8 mg/100 g/soil). Mean annual air temperatures were approximate (Starčevo-13.4oC, Nova Pazova -13.0oC). On average, the precipitation sums during the growing season (April-September) were approximate in both locations (380-410 mm). It can be stated that soil and heat conditions were favourable for the growth and development of tobacco, which resulted in higher mean values of the production traits in the trial.
INTRODUCTION
MATERIAL AND METHODS
Тутун/Tobacco, Vol.62, No 1-6, 03-08, 2012

5
Plant height (cm). - The average plant height (cm) in Nova Pazova amounted to 170cm, while plants in Starčevo were higher (185cm), although the final values were similar to values obtained in Nova Pazova. It is considered that the tall stalk can be a disadvantage. A shorter stalk means a redistribution of the total organic matter in favour of leaves, and a greater plant resistance to deviation from the vertical position (Tables 1 and 2).
Number of leaves per stalk. - The number of leaves, as a varietal characteristic, was, on average, 22-24. The values of the minimum and the maximum were very close. Genotypes V-H97, V-33/09 and V-30/09 had the same number of leaves (24) in both locations. It should be stated that the highest number of leaves (26) was recorded in the variety V-N7/VS (Tables 1 and 2).
Dimensions of leaves. - Previous studies show that dimensions of leaves are affected by the variety, applied cropping practices and the soil (Dražić, 2001). Dimensions of all observed genotypes were approximate, nearly identical (57cm x 28cm). It is necessary to point out that the length to width ratio amounted to 2:1, which is desirable for this type of tobacco (Tables 1 and 2).
Leaf yield (g/plant-1). - The yield, as a complex trait, is affected by the variety, applied cropping practices and the soil, Dražić, 2001.
These studies show that average yields were approximate (174 and 171 g/plant-1) for both locations. However, yields varied with the locations from 105g/plant-1 (V-88/09) to 237g/plant-1 (V-817) in Nova Pazova and from 101g/plant-1 (V-30/09) to 238 g/plant-1 (V-81/VS) in Starčevo. Five varieties in Nova Pazova had a reliably higher yield than the check, while just one variety in Starčevo had significantly higher yield that the variety Havesi 9. This is a result of a higher yield of the check (210g/plant-1) (Tables 1 and 2).
Leaf yield (kg/ha-1). - The average yield of cured leaves amounted to 3,085 kg/ha-1 for both locations. The lowest yield of 1,710 kg/ha-1 was recorded in the variety V-30/09, which presents the decrease in the yield of 1,630 kg/ha-1 or 48.8% in comparison to the yield of the check. The highest yield was detected in the variety V-817 (4,030 kg/ha-1), which is higher by 690 kg/ha-1 or by 20.7% than the yield of the variety Hevesi 9. Beside the variety V-817, whose yield was significantly higher than the check, high yields were also recorded in the varieties V-813 and V-N7/VS. The remaining genotypes had lower yields, Table 3.
The colour estimation of leaves on stalks shows that it was yellowish for several genotypes, but after curing, it was yellow especially in the Macedonian varieties, Table 4.
RESULTS AND DISCUSSION
Table 1. Average values of the analysed traits (location: Nova Pazova)
O. no. Genotype Plant heightcm
Number of leaves
leaves/cutters cm
Yield g/plant-1 Rank
1. V- 817 165 22 56x28 237** 22. V- 814 192** 24 62x31 209** 43. V- 813 145 24 52x26 257** 14. V- 81/VS 160 26 54x25 124 105. V- N 7/ VS 155 26 58x24 223** 36. V- H 97 180* 23 64x30 162 87. V- C7/VS 170 24 62x26 195* 58. V-88/09 185 22 55x29 105 139. V-82/07 196** 26 50x26 123 1110. V-53 187** 26 55x26 176 611. V-33/09 151 24 50x25 166 712. V-30/09 163 24 50x30 119 1213. Hevesi 9 162 24 60x30 161 9
Average 170 24 56x27 174 -
* significant at 0.05 and ** 0.01 probability level
S. Dražić: Results of studies on recently developed Virginia tobacco genotypes under different growing conditions in Serbia

6
Table 2. Average values of the analysed traits (location: Nova Pazova)
O. no.
GenotypePlant height
cm
Number of leaves
leaves/cutters, cm Yield
g/plant-1 Rank
1. V- 817 149 20 60x30 209 32. V- 814 161 22 63x34 157 93. V- 813 151 20 57x29 181 64. V- 81/VS 166 21 62x33 238* 15. V- N 7/ VS 170 26* 55x25 200 46. V- H 97 135 23 60x30 147 107. V- C7 VS 147 22 50x25 171 88. V-88/09 190** 20 57x30 138 119. V-82/07 188** 24 62x34 190 510. V-53 190** 22 58x29 181 711. V-33/09 169 24 50x28 105 1212. V-30/09 135 24 40x24 101 1313. Hevesi 9 150 22 64x36 210 2
Average 185 22 57x29 171 - * significant at 0.05 and ** 0.01 probability level
Table 3. Average yield of cured leaves (kg ha-1)
O.no. Genotype
Average kg/ha-1
DifferenceRank
absolute relative1. V- 817 4030** + 690 120.7 12. V- 814 3290 -50 98.5 53. V- 813 3940** + 600 118.0 24. V- 81/VS 3260 -80 97.6 75. V- N 7/ VS 3810* + 470 114.0 36. V- H 97 2790 - 550 83.5 107. V- C 7/VS 3290 - 50 98.5 68. V-88/09 2190 -1150 65.6 129. V-82/07 2820 -520 84.4 910. V-53 3220 -120 96.4 811. V-33/09 2410 -930 72.2 1112. V-30/09 1710 -1630 51.2 1313. Hevesi 9 3340 - 100.0 4
Average 3085 - - -
* significant at 0.05 and **0.01 probability level
Тутун/Tobacco, Vol.62, No 1-6, 03-08, 2012

7
Under agroecological conditions of Serbia (Nova Pazova and Starčevo) the average yield of cured leaves amounted to 3,085 kg/ha-1. The highest yield of 4,030 kg/ha-1 was recorded in the variety V-817 (4,030 kg/ha), which was higher by 690 kg/ha-1 or by 20.7% than the yield of the check (Hevesi 9- 3,340 kg/ha). High yields were also recorded in varieties V-813 and V-N7/VS.
The lowest yield of 1,710 kg/ha-1 was detected in the variety V-30/09. This yield presents the decrease in the yield of 1,630 kg ha-1
Table 4. Qualitative traits of Virginia tobacco genotypes
O.no.
Genotype Trait and designation Leaf colour on the stalk after curing
1. V- 817 S-5 pale green S-5 light brown to orange yellow2. V- 814 S-3 yellowish S-3 yellow3. V- 813 S-5 pale green S-6 light brown4. V- 81/VS S-5 pale green S-3 yellow5. V- N 7/ VS S-7 strong green S-3 yellow6. V- H 97 S-7 strong green S-5 light brown to orange yellow7. V- C 7/VS S-3 yellowish S-4 lemon-yellow8. V-88/09 S-1 yellow S-3 yellow9. V-82/07 S-3 yellowish S-3 yellow10. V-53 S-3 yellowish S-3 yellow11. V-33/09 S-3 yellowish S-3 yellow12. V-30/09 S-3 yellowish S-4 lemon-yellow13. Hevesi 9 S-3 yellowish S-3 yellow
CONCLUSION
REFERENCES
or 48.8% in relation to the check. The yield of the other eight varieties (V-814, V-81/VS, V-H97, V-C7/VS, V-88/09, V-82/07, V-53 and V-33/09) was lower than the check. The average plant height over locations amounted to 170-185cm. There were more genotypes with shorter stalks, which is a desirable trait. The number of leaves was on average 22-24. The leaf dimensions were uniform (57cm x 28cm), while the length to width ratio of 2:1 was favourable. The colour of leaves on stalks was mainly yellowish, and after curing it turned yellow.
1. Dražić S., 1980. Neka svojstva cveta pri citoplazmatičnoj muškoj sterilnosti. Arhiv za poljoprivredne nauke, vol.41, N 143, sv.3, 393-399. Beograd .
2. Dražić S., 1986. Prilog ispitivanju morfoloških i produktivnih svojstava novih l ini ja f lue-cured duvana. Tutun/Tobacco, vol.36, N 7-8, 193-201.Prilep.
3. Dražić S., 1995. Proizvodnja duvana, izd. Poljoknjiga, Beograd, ISBN 86.901397-5-3, ID=32419596
4. Dražić S., Prodanović S., 1999. Phenotypis divergence of flue-cured virginian tobacco varieties. Genetika, vol.31, No1, 83-90, Belgarde.
5. Dražić S., 2001. Varijabilnost i međuzavisnost komponenti prinosa i prinosa kod virdžinijskih flue-cured duvana. Tutun/Tobacco, Vol.51, N 5-6, 121-127, Prilep.
6. Dražić S., 2003. Oplemenjivanje duvana u Jugoslaviji. Tututn/Tobacco. Vol.53, 3-4, 130-135, Prilep.
S. Dražić: Results of studies on recently developed Virginia tobacco genotypes under different growing conditions in Serbia

8
7. Dražić S., 2004. Identifikacija donora poželjnih alela za poboljšanje prinosa duvana (N.tabacum L.).Tutun/Tobacco, vol.54, 9-10, 193-197. Prilep.
8. Dražić S., 2007. Variability in collection of flue-cured Virginia tobacco. Vak, A Journal of Saurachtra University, special issue on Biotechnology, vol. 2, 2, 72-76. Rajkot, India.
9. Group of Authors, 1976. Tobacco Production, USDA , Agricultural research service, Agriculture information bulletin, N 245, USA.
10. Hawks S.N., Jr., 1978. Principles of flue-cured tobacco production. Preveo, dr Nikola Vuletić, Duhanski institut, Zagreb.
11. Kocoska Karolina, Risteski I., 2011. Comparative investigation of some foreign and domestic hybrid varieties of virginia toabcco in the region of Prilep, Tutun/Tobacco,vol. 61, N 1-6, 3-9. Prilep, R.Macedinia.
12. Risteski I., Kočoska K., Hristiski Ž., 2009. Morfološki karakteristiki na nekoi stranski i novosozdadeni domašni maškosterilni hibridni sorti )linii tutun od tipot virdžnija. Tutun/Tobacco, vol.59, N 11-12, Prilep, R.Makedonija.
13. Skalenkatalog fur die Erfassung von Merkmalen bei Nicotiana. 1977/78. band 24/25, S 43-63, Institute for Tabakforschung, Drezden, DDR
Тутун/Tobacco, Vol.62, No 1-6, 03-08, 2012

9
INHERITANCE OF THE NICOTINE IN BURLEY TOBACCO CROSSES
Yovko Djulgerski, Dimitar Dimanov
Tobacco and Tobacco Products Institut- Markovo, Bulgaria (e-mail:yovko_dulg @abv.bg)
ABSTRACT
For the purpose of examination of the degree of dominance, heterosis and heritability of the nicotine in tobacco cross hybrids, the populations P1, P2, F1 and F2 crosses of ten featuring local and introduced varieties of Burley tobacco were studied. As a result of the analysis a positive heterosis of economic value was established in most of the crosses tested. It was most expressed in Hybrid 1457 and Hybrid 1462. The inheritance of the nicotine is incompletely dominant or additive. The direction of inheritance varies both in direction of the parent with the lower and the parent with higher levels of nicotine. In the most of the studied hybrid combinations, a relatively high coefficient of heritability is set. So the selection with good quality of the seven genotypes will be more effective in earlier hybrid generations (F2 – F3). Low values of heritability coefficient where found in hybrids 1466, 1472 and 1478. Selection of nicotine will be effective in the later hybrid generations (F5 – F6). Keywords: Burley tobacco, nicotine, heritability, heterosis
НАСЛЕДУВАЊЕ НА НИКОТИНОТ КАЈ КРСТОСКИ ОД ТИПОТ БЕРЛЕЈ
За проучување на степенот на доминантност, хетерозисот и херитабилноста на никотинот кај тутунски хибриди, испитувани се П1, П2, Ф1 и Ф2 крстоските од десет домашни и странски сорти тутун од типот берлеј. Како резултат од анализата, кај поголемиот дел од испитуваните крстоски забележан е позитивен хетерозис со економско значење. Тој е најизразен кај Хибрид 1457 и Хибид 1462. Начинот на наследување на никотинот е нецелосно доминантен или адитивен. Правецот на наследување варира и кон родителот со пониска вредност на никотин и кон оној со повисока. Кај најголем дел од хибридните комбинации постои релативно висок коефициент на херитабилност. Затоа, селекцијата од седумте генотипови со висок квалитет ќе биде поефективна во пораните генерации на хибриди ((Ф1 – Ф3). Пониски вредности на коефициентот на херитабилност се утврдени кај хибридите 1466, 1472 и 1478. Селекцијата на никотинот ќе биде ефективна во подоцните генерации на хибриди (Ф5 – Ф6).
Клучни зборови: берлејски тутун, никотин, херитабилност, хетерозис
UDC 633.71Тутун/Tobacco, Vol.62, No 1-6, 09-12, 2012University “St. Kliment Ohridski” - BitolaScientific Tobacco Institute – Prilep, R. Macedonia
ISSN 0494-3244
UDC: 633.71-152.75:547.94(497.2)Original scientific paper

10
INTRODUCTION
MATERIAL AND METHODS
The chemical composition is essential for tobacco quality (Gyuzelev, 1983; Korubin-Aaleksosska, 2001). In Burley tobacco, the most important indicators shaping its use-value are nicotine, total nitrogen, sugars, ashes and ammonia, chlorine and proteins (Drachev, 1996; 2001; Tso, 1988). Of these, undoubtedly the most important role has the nicotine (Manolov, 1979; Stoilova, 2008). The use of genetic analysis on these indicators will help to improve the efficiency of the selection process (Dagnon and Dimanov, 2007).
Studies of some authors suggest that
inheritance of nicotine is the most negative overdominant and intermediate with a negative sign. Overdominantly positive inheritance was observed less frequently (Nicolic еt al., 1995). The literature refers to additive inheritance of nicotine (Bing-Guang, еt al.,2005). In Bulgaria, there is little data with respect to Burley tobacco for such studies (Dyulgerski, 2011).
The purpose of this work is to establish heterosis events and the nature of inheritance of nicotine in order to pick out prospective forms high in nicotine.
The experimental work was carried out in the experimental field of ITTI - Markovo village. Populations were investigated to P1, P2, F1 and F2 crosses of ten local and introduced varieties of Burley tobacco: Hybrid 1435 (L 1334 x Tn 86), Hybrid 1457 (1317 B x B 21); Hybrid 1462 (L 1322 x Ky 907), Hybrid 1463 (B 1344 x L 1330), Hybrid 1465 (L 1390 x Ky 908), Hybrid 1466 (B 1317 x Ky 8959), Hybrid 1471 (B1344 x
B 1317), Hybrid 1472 (B 1344 x Tn 90); Hybrid 1475 (B 1317 x Ky 908) and Hybrid 1478 (B 1317 x Tn 90).
Certainly the content of nicotine: arithmetic mean (x), the average error (Sx%), degree of dominance (d/a) by the formula of Mather (1949), heterosis effect in terms of better parental form (HP) in Omarov (1975) coefficient of the trait heritability (H2) by Sobolev (1976).
The data in Table 1 show that there is a positive heterosis effect on the economic value in six of the ten crosses. It was most pronounced in Hybrid 1457 - about 15% and Hybrid 1462 - over 12%. It can be concluded that heterosis, although
RESULTS AND DISCUSSION
in small amounts, has an economic significance in terms of research indicator. The economic heterosis effect is influenced positively by far off parents used for hybridization.
Тутун/Tobacco, Vol.62, No 1-6, 09-12, 2012

11
Inheritance of nicotine content is overdominant for Hybrids 1457, 1462, 1466 and 1472, incompletely dominant for Hybrids 1435, 1462, 1465, 1471 and 1478 and additive in Hybrid 1475. When the heterosis effect is observed, of the order of 9.6% it can be seen that it has a considerably high rate of traits heritability (63). The inheritance varies in direction of the parent with higher or lower values, depending on the crossing.
The value of the coefficient of heritability is quite diverse and varies depending on the crossing. High coefficients of heritability -up to 50%, were detected in Hybrid 1457, Hybrid 1462 and especially in Hybrid 1475. In combinations № 1471, 1435, 1465 relatively high coefficients
Table 1 Data on the content and inheritance of nicotine
Parents /Crosses/Indexes
Р1 Р2 F1 F2 d/a НР Н2
x±Sx% x±Sx% x±Sx% x±Sx%
Hybrid 1435(L 1334 х Тн 86) 2.94±0.34 2.06±0.03 2.26±0.04 2.29±0.17 0.55 76.9 0.31
Hybrid 1457(B 1317 х B 21) 2.41±0.10 2.13±0.30 2.76±0.23 2.61±0.18 1.75 114.5 0.54
Hybrid 1462(L 1322 х Ку 907) 2.56±0.31 2.61±0.21 2.93±0.15 2.73±0.22 0.30 112.3 0.57
Hybrid 1463(B 1344 х L 1330) 3.07±0.07 2.27±0.19 2.82±0.24 2.58±0.13 -1.1 91.9 0.43
Hybrid 1465(L 1390 х Ку 908) 2.61±0.16 3.35±0.16 2.37±0.07 2.46±0.15 -0.98 70.7 0.35
Hybrid 1466(B 1317 х Ку 8959)
2.41±0.30 2.28±0.29 2.59±0.26 2.44±0.14 1.88 107.5 0.16
Hybrid 1471А(B 1344 х B 1317) 3.07±0.07 2.41±0.30 2.5±0.32 2.54±0.11 -0.73 81.4 0.43
Hybrid 1472(B1344 х Tn 90) 3.07±0.07 2.61±0.31 3.27±0.09 2.77±0.16 1.87 106.5 0.19
Hybrid 1475(B 1317 х Ку 908) 2.41±0.30 3.35±0.16 3.67±0.02 3.04±0.19 0 109.6 0.63
Hybrid 1478(B 1317 хTn 90) 2.41±0.30 2.61±0.31 2.81±0.06 2.83±0.11 0.20 107.7 0.12
of heritability of nicotine content (0.43, 0.31, and 0.35) are also found. If the three crosses are removed, the coefficient of heritability is low - less than 20%. Prevailing values of the coefficients of heritability of the tested hybrids showed that the genetic expression of interest in these signs is low.
Most of the surveyed crosses showed relatively high degree of heritability. For this reason, the selection of genotypes with good quality will be more effective in earlier hybrid generations (F2–F3). In hybrids 1466, 1472 and 1478 the selection of nicotine will be effective in the later hybrid generations (F5–F6).
Y. Djulgerski: Inheritance of the nicotine in Burley tobacco crosses

12
1. In mos t o f the inves t iga ted crosses, positive heterosis of economic value was determined. It was pronounced most highly in Hybrid 1457 and Hybrid 1462. 2. The inheritance of nicotine content is overdominant, incompletely dominant or additive. The inheritance varies in direction of the parent with higher or lower nicotine content.
CONCLUSION
REFERENCES
3. A relatively high coefficient of heritability of the nicotine content is set for most hybrid combinations. For this reason, the selection of genotypes with good quality will be more effective in earlier hybrid generations (F2–F3). In Hybrids 1466, 1472 and 1478 nicotine content breeding will be effective in the later hybrid generations (F5 – F6).
1. Bing-Guang, Jun, Hiu-Ping, Yong-Ping, Yong-Fu, 2005. Genetic Analysis for Chemical Constituents in Flue-cured Tobacco (Nicotiana tabacum L.) Acta Agronomica Sinica, vol 31, No 12, pp.1557-1561.
2. Dagnon S., D. Dimanov, 2007. Chemometrc Evaluation of the Colour and Smoke Aroma in Oriental Tobaccos Based on the Polyphenol and Valeric Acid Cultivar Characteristics as Influenced by the Genotype, Bulgarian Journal of Agricultural Science, 13, 459-466.
3. Drachev D., 1996. Chemical indices of Bulgarian Burley tobacco. Bulgarian tobacco 5, 16-20.
4. Drachev D., 2001. Investigation physical and technological of indices of bulgarian big-leaf tobacco type Burley, Tobacco , 11-12, 351-354.
5. Dyulgerski Y., 2011. Selection and genetic research of Burley tobacco, Disertation
6. Gyuzelev L., 1983. Commodities tobacco. Plovdiv. „Hristo G. Danov“.
7. Korubin-Aaleksosska A., 2001. Graphic analysis of inheritance of some chemical components in tobacco varieties and their diallel F1 hybrids, Tutun/Tobacco, vol 50, 11 -12, 315-319.
8. Manolov A., 1979. Selection of low nicotine varieties. Bulgarian Tobacco 12, 1-8
9. Mather, K., Biometrical genetics, London, 1949.
10. Nicolic M., Berenji J., Ivic S., 1995. Agronomska, hemiska, tehnoloska I svoistva na pusenju eksperimentalnih linija I hibrida dunava tipa Burley. 17ti Simpozium, Ohrid.
11. Omarov, D.S.,1975. Estimates heterosis learn methods in plant biology. Agriculture biology volume Х, № 1.123-127.(in russan).
12. Sobolev N. A., 1976. Gibridologicheskiy analysis poligennim sign Cytology and Genetics, X, № 5, 424-436.
13. Stoilova A., 2008. Study the content of nicotine and secondary alkaloids in tobacco Burley type, Proceedings of the seventh national scientific conference with international participation „Environment and Health 2008“ Plovdiv, 389-392.
14. Tso T. C. Production, 1988. Production, Physiology and Biochemistry of Tobacco Plant, IDEALS Inc., Bestville, Maryland, USA.
Тутун/Tobacco, Vol.62, No 1-6, 09-12, 2012

13
UDC 633.71Тутун/Tobacco, Vol.62, No 1-6, 13-21, 2012University “St. Kliment Ohridski” - BitolaScientific Tobacco Institute – Prilep, R. Macedonia
ISSN 0494-3244
UDC: 633.71-152.61Original scientific paper
RESULTS OF THE INVESTIGATION ON SOME BIO-MORPHOLOGICAL CHARACTERISTICS OF DOMESTIC AND INTRODUCED VARIETIES OF
BURLEY TOBACCO
Ilija Risteski, Karolina Kochoska, Biljana Gveroska
University ”St. Kliment Ohridski ”-Bitola, Scientific Tobacco Institute-Prilep, Republic of Macedonia E-mail: [email protected]
ABSTRACT
During the two-years investigation (2010 and 2011), six Burley varieties were included in order to study some biologically-morphological characteristics such as time of flowering and resistance to some economically significant diseases, dimensions of the leaves from the middle belt (5th, 10th and 15th), the height of the stalk with the inflorescence and the number of leaves. In order to confirm the correctness of the results, they were statistically processed. Results on the investigated characteristics show unambiguous dominance of the varieties Pelagonec CMS F1 and B-98/N CMS F9 over all the other varieties in the trial. The results can contribute a lot in producer’s choice of tobacco variety, because they give certain guarantee and safety for a successful production cycle of this type of tobacco.
Key words: tobacco, varieties, Burley, flowering, diseases, leaves, stalks, dimensions.
РЕЗУЛТАТИ ОД ИСПИТУВАЊЕТО НА НЕКОИ БИО-МОРФОЛОШКИ СВОЈСТВА НА ДОМАШНИ И СТРАНСКИ СОРТИ ТУТУН ОД ТИПОТ БЕРЛЕЈ
Во двегодишните испитувања (2010 и 2011 год. ) беа вклучени шест берлејски сорти со цел подетално да се испитаат некои нивни биолошко-морфолошки како: време на цветање и отпорност на некои стопански позначајни болести, димензии на листовите од средниот појас (5 ти, 10 ти, и 15 ти), висината на стракот со соцветие и бројот на листовите. Со цел да се потврди точноста на резултатите, истите беа и статистички обработени. Добиените резултати за испитуваните својства покажуваат недвосмислена доминација на сортите Пелагонец ЦМС F1 и Б –98 /N ЦМС F9 над сите други сорти во опитот. Овие резултати можат многу да придонесат при изборот на сорта од страна на производителот, бидејќи влеваат извесна гаранција и сигурност за успешен производен циклус на овој тип тутун.
Клучни зборови: тутун, сорта, берлеј, цветање, болести, листови, стракови, димензии.

14
The Burley type worldwide, according to its size and production quantities, is right after the Virginia type and iс still irreplaceable constituent in cigarette blend. Because of the low costs during its production compared to some other types of tobacco (e.g. Virginia), on the world stock market it has a relatively low price,
which directly affects the forming of the final price of cigarettes.
Through our two year-investigations and the results obtained, more precise image of the characteristics of each variety is achieved (e.g. time of flowering, resistance to diseases, number of leaves etc.)
Before seed formation, there is a period of flowering and pollination. Rubin (1971) found out that the first flower to open is the central (ultimate) flower. The time needed for flowering at different types and varieties of tobacco is different. As a rule, the varieties with lower number of leaves bloom faster. Hawks ( 1994 ) said that the variety NC 22 NF “does
RESULTS AND DISCUSSIONLength of vegetation period of tobacco plant (flowering)
INTRODUCTION
MATERIAL AND METHODS
Six varieties were taken as a material for work in the two-year investigations (2010 and 2011), three of which were introduced (B-21 Ø USA, Banket 21, Zimbabwe and B-1317 Bulgaria), all of them in a fertile form, and three were domestic varieties (lines), two of which were in CMS form (B-98/N CMS F9 and Pelagonec CMS F1) and B-136/07 (fertile). The classical American Burley type B-21 was used as a check variety. The trial was set up in the field of Tobacco Institute-Prilep on colluvial type of soil. Processing of the areas used in the trial began with autumn ploughing in about 40 cm depth, and in the spring they were fattened with artificial fertilizer NPK– 8:22:20 with 300 kg/hand, after which they were ploughed two times. Before transplanting, the soil was treated with herbicide incorporated in the earth. On the surface prepared this way, the healthy seedling was transplanted by hand in four replications at randomized block system, with 90x50 cm spacing. The tobacco plant was hoed up twice and before every hoeing each stalk was given about 5g 26% KAN. During the vegetation, according to the needs
a few additional irrigations were made as well as protection of the plantation with checked preparations. Days required from transplanting to the beginning of flowering of tobacco varieties in the plantation, 50 % flowering and the end of flowering were recorded during the vegetation. The susceptibility of tobacco varieties to some economically significant diseases (TMV, PVY and Phytophthora parasitica var. nicotianae , was monitored and recorded, and the data were statistically processed by the method of calculation of arithmetic mean of relative numbers with different number of statistical units in plot ( Filiposki, 2011).
Morphological measurement was made only of the leaves that belong mostly to the middle belt (5th, 10th and 15th), which accounts fore 60-70% of the total leaf mass of the stalk. The height of the stalk with inflorescence and the total number of leaves per stalk were also analyzed. Measurements data were statistically processed by the analysis of variance method, set up in randomized blocks system (Filiposki 2011).
not bloom”, but it forms 30 leaves more than the ordinary varieties. It started forming flowers when the length of the day was not shortened to the maximum. Naumoski et. al. (1977) reported that by the end of flowering stage, tobacco plant has already formed about 90% of its vegetative mass. According to Donev (1973), by removal of flowers from the stalk, the root activity is
Тутун/Tobacco, Vol.62, No 1-6, 13-21, 2012

15
accelerated and new flowers appear. According to the data in Table 1, there are no drastic differences between the varieties in the trial from the time of transplanting to the time of beginning of flowering, with a remark that in 2011 the time needed for flowering in all varieties with no exceptions was somewhat longer compared to that in 2010. This is probably due to the more
rainless periods in 2011, especially in July and August.
At average, the check variety B-21 and the variety Banket 21 started to bloom first (for 61.5 and 61.0 days from the day of transplanting, respectively). The last to bloom was the variety Pelagonec CMS F1 (65.5 days) which is for 4.5 days later than the check variety B-21.
Table 1 Length of vegetation period of tobacco plant (flowering)
Varieti Cro
p
Beg
inni
ng o
f flo
wer
ing
from
tran
spla
ntin
g in
day
s
Avar
age
2010
/201
1
Abs
olut
e di
ffere
nce
from
th
e av
erag
e
50%
flow
erin
g fr
om
trans
plan
ting
in d
ays
Aver
age
2010
/201
1
Abs
olut
e di
ffere
nce
from
th
e av
erag
e
End
of fl
ower
ing
from
tra
nspl
antin
g in
day
s
Aver
age
2010
/201
1
Abs
olut
e di
ffere
nce
from
th
e av
erag
e
B-21 Ø 2010 60 61.5 / 67 69.0 / 72 74.52011 63 71 77
B-1317 2010 61 62.5 +1.0 69 70.5 +1.5 75 77.0 +2.52011 64 72 79
Banket 21 2010 58 61.0 -0.5 63 65.0 -4.0 67 69.5 -5.02011 64 67 72
B-136/07 2010 61 62.0 +0.5 66 68.5 -0.5 72 75.0 +0.52011 63 71 78B-98/N CMS F9
2010 63 64.0 +2.5 68 71.0 +2.0 78 79.0 +4.52011 65 74 80
Pelagonec CMS F1
2010 6465.5 +4.5
7374.0 +5.0
7779.5 +5.02011 67 75 82
With the other varieties in the trial, the time needed for the beginning of flowering was between 62.0 in B-136/07 to 64.0 in B-98/N CMS F9. The number of days until 50% of flowering was the least in the variety Banket 21 (65.0), which is 4.0 days less compared to the check variety B-21 which passed this stage for 69.0 days. The longest period for 50% of floweing was needed in the variety Pelagonec CMS F1 (74.0 days), which is 5.0 days more compared to the check variety. In other varieties of the trial, this period ranged from 68.5 days in B-136/07
to 71.0 days in B-98/N CMS F9.The period to the end of flowering was
first finished in the variety Banket 21 in 69.5 days, i.e. 5 days less compared to the check variety B-21 which needed 74.5 days for this period. The longest period (79.5 days) to the end of flowering was needed for variety Pelagonec CMS F1 , and it is 5 days more compared to the check variety B-21. In other varieties of the trial, this period ranges between 75.0 days in B-136/07 to 79.0 days in B-98/N CMS F9.
I. Risteski: Results of the investigations on some bio-morphological characteristics of domestic and introduced varieties of Burley tobacco

16
During its life cycle the tobacco plant, is often attacked by different diseases generated by viruses, bacteria and pathogenic fungi. The raw material derived from diseased stalks is with a low quality and with limited using value in fabrication. During our investigations, monitoring of the varieties resistance to TMV, PVY and Phytophthora parasitica var. nicotianae was included. According to Mickoski (1984), TMV is easily transmissible virus which causes severe damages lowering the yield up to 30%, and the diseased leaves are of a bad quality. The same author describes PVY as a very destructive
Diseases of tobacco plant during the vegetation
virus disease present worldwide, causing serious damages on tobacco plant as well as on potato, pepper, tomato etc. Buzančič (1984) reported that PVY was first described by Smith in 1931, and as a transmitter he points out the aphid.
Mickoski (1984) describes Phytophthora parasitica var. nicotianae as a destructive disease which mostly attacks tobacco plants of the types Virginia and Burley, and as a cause of it he points out the fungus Phytophthora parasitica var. nicotianae. The degree of disease in the varieties investigated can be seen in Table 2.
Data from Table 2 show that the health condition of the varieties is good, i.e. they have a low percentage of plants infested by viruses or by the fungus Phytophthora parasitica var. nicotianae. The highest percentage of plants is
Table 2 Diseases during the vegetation
Variety Cro
p
Tota
l num
ber o
f pla
nts TMV virus PVY virus Phytophthora parasitica var.
nicotianae
Infe
cted
pla
nts
Perc
enta
ge o
f in
fect
ed p
lant
s
Aver
age
for t
he
two
year
s
Infe
cted
pla
nts
Perc
enta
ge o
f in
fect
ed p
lant
s
Aver
age
for t
he
two
year
s
Infe
cted
pla
nts
Perc
enta
ge o
f in
fect
ed p
lant
s
Aver
age
for t
he
two
year
s
B-212010 51 4 7.83
3.922 3.92
1.96- -
0.002011 53 - - - - - -
B-13172010 52 4 7.69
3.85- -
0.00- -
2.042011 49 - - - - 2.00 4.08
Banket 212010 40 1 2.50
1.25- -
0.002.00 5.00
2.502011 45 - - - - - -
B-136/072010 50 2 4.00
6.002 4.00
2.003.00 6.00
3.002011 50 4 8.00 - - - -
B-98/ N CMS F9
2010 51 1 1.960.98
- -0.00
- -0.00
2011 44 - - - - - -
Pelagonec CMS F1
2010 48 - -0.00
- -0.00
- -0.00
2011 48 - - - - - -
infected with the virus disease tobacco mosaic (TMV), ranging from 0.98% in B-98/N CMS F9 to 6.00% in B-136/07, while in Pelagonec CMS F1 there are no symptoms of infection with this disease.
Тутун/Tobacco, Vol.62, No 1-6, 13-21, 2012

17
Characteristics of the 5th leaf
In the types B-1317, Banket 21, B-98/ N CMS F9 and Pelagonec CMS F1 no necrotic strain of tobacco (PVY) can be seen. In the varieties B-21 and B-136/07 the percentage of infection is only 1.96% and 2.00%, respectively. In average, the percentage of infected plants with Phytophthora parasitica var. nicotianae in
Table 3. Characteristics of the 5th leaf
Variety
Cro
p
Leng
th in
cm
Aver
age
201
0/11
Absolute difference from the average
wid
th in
cm
Aver
age
201
0/11
Absolute difference from the average
B21 Ø 2010 39.537.7 /
25.624.9 /
2011 36,0 24.2
B-13172010 48.7++
47.7 +10.0 32.5++
29.8 +4.92011 43.5++ 27.2++
Banket 212010 48.0++
44.8 +7.128.2
27.8 +2.92011 41.7++ 27.5
B-136/072010 53.7++
51.3 +13.6 39.6++
35.8 +10.92011 49.0++ 32.0++
B-98/NCMS F9
2010 53.0++
51.7 +14.0 30.8++
29.9 +5.02011 50,5++ 29.0+
PelagonecCMS F1
20102010 58,0++
58.2 +20.5 37.0++
37.6 +12.72011 58.5++ 38.2++
Leaf length Leaf width 2010 2011 2010 2011 LSD 5% 3.0 cm + 3.6 cm+ LSD 5% 3.6 cm + 3.6 cm +
1% 4.2cm ++ 5.1 cm ++ 1% 4.2 cm ++ 5.0 cm ++
B-136/07 is between 2.04 % and 3.00 %. In other varieties this disease does not appear.
It can be said that the variety B-136/07 has the highest percentage of plants infected with TMV, PVY and Phytophthora parasitica var. nicotianae, while in the variety Pelagonec CMS F1 none of the above diseases appears.
Morphological characteristics of tobacco, besides being genetically controlled and different for every type or variety, greatly depend on the soil and climate conditions, the applied
cultural practces, the presence of diseases etc. Characteristics of the 5th leaf in the varieties included in our two year-investigations are presented in Table 3.
According to these data, in 2011 – the year with lower amount of precipitations, the dimensions of the analyzed leaf in all varieties in the trial were smaller. However, from the average values it can be seen that the biggest length (58.2 cm) was observed in the variety Pelagonec CMS F1, which is 20.5 cm longer compared to the check variety B-21, where it reaches 37.7 cm, which is in fact, the smallest
measured length from all varieties in the trial. In the other varieties, this data ranges from 44.8 cm in Banket 21, to 51.7 cm in B-98/N CMS F9. Compared to the check variety, all varieties investigated in the trial showed statistically significant differences on the level of probability of 1%. The similar situation was recorded for the 5th leaf width, with the highest average (37.6 cm) in the variety Pelagonec CMS F1, which is
I. Risteski: Results of the investigations on some bio-morphological characteristics of domestic and introduced varieties of Burley tobacco

18
12.7 cm more compared to the check variety with 24.9 cm average width. In other varieties in the trial this data ranges between 27.8% in Banket 21 to 35.8 in B-136/07. Compared to the check variety in the two years of investigation, statistically significant differences on the level of
probability of 1% were recorded in the varieties Pelagonec CMS F1 and B-136/07, while the varieties B-1317 and B– 98/N CMS F9 showed such difference only in the 2010 crop. In 2011 the variety B– 98/N CMS F9 showed statistically significant differences on the level of 5%
The tenth leaf belongs to the middle belt, and the zone where it is formed yields leaves with the largest size. Risteski (2006), investigated 6 Burley varieties in the region of Prilep during
Characteristics of the 10th leaf
Table 4. Characteristics of the 10th leaf
Variety
Cro
p
Leng
th in
cm
Aver
age
201
0/11
Absolute difference from the average
Wid
th in
cm
Aver
age
2010
/11
Absolute difference from the average
B-21 Ø 2010 53.152.8 /
27.527.8 /
2011 53.5 28.2
B13172010 60.5++
57.3 +4.534.5++
32.5 +4.72011 54.2++ 30.5++
Banket 212010 52.8++
53.6 +0.8 27.5
29.0 +1.22011 54.5++ 30.5
B-136/072010 62.7++
60.9 +8.134.0++
31.5 +3.72011 59.2++ 29.0++
B-98/NCMS F9
2010 65.7++
65.2 +12.436.1++
35.5 +7.72011 64.7++ 35.0++
PelagonecCMS F1
20102010 71.1++
69.4 +16.640.1++
40.1 +12.32011 67.7++ 40.2++
Leaf length Leaf width 2010 2011 2010 2011LSD 5% 3.0 cm + 4.5 cm+ LSD 5% 1.8 cm + 3.7 cm +
1% 4.1cm ++ 6.3 cm ++ 1% 2.5 cm ++ 5.2 cm ++
1999-2001 and made conclusion that length of this leaf ranged 50-61 cm, the width 27-36 cm and the length: width ratio 1.62-1.88.
According to the data presented in Table 4, the highest average length of the 10th leaf (69.4 cm) was observed in the variety Pelagonec CMS F1 - 16.6 cm more in comparison with the check variety B-21 where this data was 52.8 cm. In other varieties from the trial this data ranged between 53.6 cm in Banket 21and 65.2 cm in B– 98/N CMS F9, with remark that in the rainless 2010, the length of this leaf was somewhat
smaller compared to that in 2010. Compared to the check variety B-21,
statistically significant differences at 1% probability level in both years if investigation were achieved by the varieties Pelagonec CMS F1 and B-136/07, and the variety B-1317 only in 2010 reached statistically significance of 1%. The highest average width of 40.1 cm was observed in the variety Pelagonec CMS F1, which is 12.3
Тутун/Tobacco, Vol.62, No 1-6, 13-21, 2012

19
cm more compared to the check B-21 which had the smallest width of this leaf compared to all other varieties - only 27.8 cm. In other varieties from the trial, the average width of this leaf ranged from 29.0 in Banket variety to 35.5 cm in B–98/N CMS F9 . Only the varieties Pelagonec
CMS F1 and B–98/N CMS F9 in both years of investigation reached statistically significant differences at 1% probability level. The varieties B-136/07 and B-1317 showed such differences only in the crop 2010.
The fifteenth leaf is also located in the middle belt of the stalk and as a raw material it is highly appreciated in the fabrication. The characteristics of this leaf can be seen from the data presented in Table 5.
Thus, in 2011, the year with less precipitations, this leaf was somewhat smaller in size compared to that in 2010. The variety Pelagonec CMS F1 again had the highest average length - 61.1 cm, which is 13.4 cm more than the smallest average length of 47.7 cm recorded in the check variety B-21. In other varieties of the trial, the width of this leaf ranged from 49.0 cm in Banket 21 to 59.5 cm in B–98/N CMS F9. In both years of investigation, only the
Characteristics of the 15th leaf
varieties Pelagonec CMS F1, B–98/N CMS F9 and B-136/07 reached statistically significant differences at 1% level of probability, compared to the check B-21, while the variety B-1317 showed such differences only in 2010.
The largest average width of the 15th leaf (33.5 cm) was recorded in the B-98/N CMS F9, i.e. 9.9 cm more compared to the check which had the smallest width (23.6 cm). In other varieties of the trial, this data ranged between 23.7 cm in the variety Banket 21 and 32.4 cm in Pelagonec CMS F1. Statistically significant differences of the investigated varieties compared to the check variety B-21 are completely identical as those presented for the character leaf length.
Table 5. Characteristics of the 15th leaf
Variety Cro
p
Le
ngth
in c
m
Aver
age
2010
/11 Absolute
difference from the average
Wid
thin
cm
Aver
age
2010
/11 Absolute
difference from the average
B-21 Ø 2010 49.547.7 /
23.523.6 /
2011 46.2 23.7
B-13172010 56.7++
52.4 +4.728.9++
26.2 +2.62011 48.2++ 23.5
Banket 212010 49.5++
49.0 +1.2 24.0
23.7 +0.12011 48.5++ 29.2++
B-136/072010 57.2++
55.4 +7.729.2++
28.4 +4.82011 53.7++ 27.7++
B-98/NCMS F9
2010 60.0++
59.5 +11.835.4++
33.5 +9.92011 59.1++ 31.7++
PelagonecCMS F1
20102010 63.1++
61.1 +13.432.8++
32.4 +8.82011 59.2++ 32.0++
Leaf length Leaf width 2010 2011 2010 2011
LSD 5% 3.1 cm + 2.9 cm+ LSD 5% 1.6 cm + 2.5 cm +
1% 4.3cm ++ 4.1 cm ++ 1% 2.3 cm ++ 3.4 cm ++
I. Risteski: Results of the investigations on some bio-morphological characteristics of domestic and introduced varieties of Burley tobacco

20
The height of the stalk and the leaf number are typical characters in tobacco and they are genetically regulated. However, there are some other factors that have particular influence on these characters, such as agro-ecological conditions and the application of cultural practices. Дюлгерски ( 2009 ) suggests an optimal stalk height of 145 - 180 cm in large-leaf tobaccos, and a number of 26-32 leaves in Burley tobacco. Data on stalk height with inflorescence and leaf number in the investigated varieties are presented in Table 6.
The highest stalk with inflorescence
Height of the stalk with inflorescence and leaf number per stalk
(191.5 cm) was achieved in the variety Pelagonec CMS F1, which is 41.0 cm more compared to the check variety B-21 (150.5 cm). In other varieties of the trial, the average height of the stalk with inflorescence ranged between 153.5 cm in Banket 21 and 188.6 cm in B–98/N CMS F9. In both years of investigation, statistically significant differences at 1% probability level for this character compared to the check variety B-21 were recorded for the varieties Pelagonec CMS F1, B–98/N CMS F9 and B-136/07, while B-1317 showed such statistic difference only in 2010.
Table 6. The height of the stalk with inflorescence and number of leaves
Variety Cro
p
Stalk height with
infloresc-ence
Aver
age
20
10/1
1
Absolute difference from the average R
ange
Le
af n
umbe
r
Aver
age
2010
/201
1 Absolute difference from the average R
ange
B-21 Ø2010 148.5
150.5 / 622.7
23.8 / 52011 152.5 24.7
B-1317 2010 171.5++
167.7 +17.2 4 28.7++
26.8 +3.0 32011 164.0 25.0
Banket 21 2010 153.5 153.5 +3.0 5 22,7 23.1 -0.7 62011 153.6 23.5
B-136/07 2010 185.7++
178.8 +28.3 3 28,0++ 26.7 +2.9 42011 172.0++ 25.5
B-98/NCMS F9 2010 188.5++
188.6 +38.1 2 32.7++ 32.9 +9.1 22011 88.7++ 33.2++
PelagonecCMS F1
2010 190.5++ 191.5 +41.0 1 34.0++ 34.0 +10.2 1
2011 192.5++ 34.0++
Stalk height Leaf number 2010 2011 2010 2011LSD 5% 7.4 cm + 11.9cm + LSD 5% 1.0 лист + 2.3 лист + 1% 10.3cm ++ 16.6 cm ++ 1% 1.4 лист ++ 3.2 лист ++
It can be seen from the data that the highest leaf number (34.0) was observed in the variety Pelagonec CMS F1, which is 10.2 leaves more compared to the check B-21, and the lowest leaf number (23.1) was observed in Banket 21. In other varieties of the trial, this data ranges from 23.8 leaves in the check variety B-21 to 32.9
leaves in B–98/N CMS F9. Statistically significant differences of the varieties in comparison with the check B-21 at 1% probability level in both years of investigation were observed only in the varieties Pelagonec CMS F1 and B–98/N CMS F9. The varieties B-136/07 and B-1317 reached such significance only in 2010.
Тутун/Tobacco, Vol.62, No 1-6, 13-21, 2012

21
According to the results of the two-year investigations, the following conclusions have been made:
- In average, the variety Banket 21 starts the flowering stage first (61.0 days) and ends it first (69.5 days). The last to start and end the flowering is the variety Pelagonec CMS F1 (79.5 days).
- The variety Pelagonec CMS F1 was the most tolerant to TMV, PVY and Phytophthora parasitica var. nicotianae, compared to the other varieties in the trial.
- The varieties Pelagonec CMS F1 and
CONCLUSION
REFERENCES
B–98 / N CMS F9 have the largest length and width of the 5th, 10th and 15th leaf .
- The average number of leaves (34.0) is the highest in variety Pelagonec CMS F1 and the lowest (23.1) in the variety Banket 21.
- The biggest height of the stalk (191.5 cm) was achieved in variety Pelagonec CMS F1 and the smallest (150.5 cm) in the check variety B-21.
- The investigations show unambiguous dominance of the varieties Pelagonec CMS F1 and B–98/N CMS F9 over the other varieties in the trial.
1. Buzančič A., 1988. Istraživanje primjene nekih novih herbicida u duhanu – Зборник на трудови, 14 ти Симпозиум за тутун – Охрид, 2-3 10. 1988 – Прилеп.
2. Донев И. Фетфаџиев В., 1973. Hapъчник по тютюнопроизвство – Пловдив
3. Дюлгерски Йовко, 2009. Сортов идеал при тютюн тип Бърлеŭ - Български тютюн, бр. 6/2009 стр. 16-18. София.
4. Mickoski Josif, 1984. Bolesti na tutunot - Stopanski vesnik- Skopje.
5. Naumoski K., Boceski D., Grdanoski M., Karajankov S., Ackoski B., 1977. Sovremeno proizvodstvo na tutun NIK. Nasa kniga – Skopje.
6. Risteski P. I., 2006. Sortnata struktura, nacinot na berbata i susenjeto, neophodni faktori za podobruvanje na kvalitetot i zgolemuvanje na proizvodstvoto na tipot berlej vo Republika Makedonija. Doktorska disertacija. Prilep.
7. Рубин Б.A., 1971. Физиология сеълскохозяйственнъих растений Московского универзитета.
8. Filiposki B. Kiril, 2011. Statisticki metodi vo zemjodelskite istrazuvanja - Odbrani poglavja - Prilep.
9. Uzunoski M., 1985. Proizvodstvo na tutun. Stopanski vesnik. Skopje
10. Hawks S.N.Colins. W. K., 1994. Nаčela proizvodnje virginiskog duhana. Zagreb.
I. Risteski: Results of the investigations on some bio-morphological characteristics of domestic and introduced varieties of Burley tobacco

22
COMPARISON OF DIGESTION METHODS FOR ICP DETERMINATION OF TOTAL PHOSPHOROUS IN PLANT MATERIALS
K. Ivanov1, P. Zaprjanova2, V. Angelova1, G. Bekjarov3, L. Dospatliev4
1University of Agriculture, 4000 Plovdiv, Bulgaria, e-mail [email protected] and Tobacco Products Institute, 4108 Markovo, Bulgaria
3University of Food Technology 4000 Plovdiv, Bulgaria4 Trakia University 6000 Stara Zagora, Bulgaria
ABSTRACT
A comparative study of the most commonly used methods for sample preparation for ICP determination of the content of total phosphorus and sulfur in plant materials was performed on the basis of reference material CTA-VTL-2 (Virginia tobacco leaves). The methods used in the study were evaluated according to the recovery of total phosphorus and sulfur, ease of application and rapidity of performance. It was found out that microwave digestion is the most suitable method for sample preparation for simultaneous determination of phosphorus and sulfur by ICP in plant material. Dry ashing is not suitable because of the considerable losses of sulfur during thermal processing of the material in open vessels. The investigation revealed high correlation between colorimetric and ICP methods for total phosphorus determination, with results generally differing within 5 to 10 %.
Key words: tobacco, digestion methods, total phosphorus and sulfur, ICP, colorimetric methods
СПОРЕДУВАЊЕ НА ДИГЕСТИВНИТЕ МЕТОДИ ЗА ОДРЕДУВАЊЕ НА ВКУПНИОТ ФОСФОР КАЈ РАСТИТЕЛНИОТ МАТЕРИЈАЛ СО ICP
Направено е компаративно проучување на вообичаените методи за подготвување на примероци за одредување ICP-одредување на содржината на вкупниот фосфор и сулфур во растителниот материјал врз база на референтен материјал CTA-VTL-2 (листови од вирџиниски тутун). Методите применти во проучувањето се проценети според враќањето на вкупниот фосфор и сулфур, сложеноста на апликацијата и брзината на изведувањето. Утврдено е дека микробрановата дигестија е најпогоден метод за подготовка на примероците за симултано одредување на фосфорот и сулфурот со ICP во растителен материјал. Сувото спалување не е погоден метод поради значителните загуби на сулфур за време на термалната обработка на материјалот во отворени садови. Направена е споредба помеѓу колориметрискиот и ICP-методот за одредување на вкупниот фосфор и утврдена е висока корелација помеѓу нив, со резултати што се разликуваат за 5% до 10%.
Клучни зборови: тутун, дигестивни методи, вкупен фосфор и сулфур, ICP, колориметриски методи
UDC 633.71Тутун/Tobacco, Vol.62, No 1-6, 22-29, 2012University “St. Kliment Ohridski” - BitolaScientific Tobacco Institute – Prilep, R. Macedonia
ISSN 0494-3244
UDC: 633.71:[546.18+546.22Original scientific paper

23
The determination of total phosphorus and sulfur in soils and plants is very important for agricultural and environmental studies. Phosphorus participates in a number of processes determining the growth, development and the productivity of the plant: formation of cell nucleus and cell multiplication, synthesis of lipids and specific proteins, transmission of hereditary properties, breathing and photosynthesis, energy transmission from richer to poorer energetic compounds etc. The multifarious role of P in plant metabolism is related to its participation in many biologically important organic compounds – nucleid acids, nucleoproteides, enzymes, vitamins, hormones, etc.
The determination of the total P in plant materials requires initial mineralization of the sample by digestion with mixtures of acids or ashing and phosphorous determination by different techniques, mainly colorimetry and inductively coupled plasma optical emission spectrometry (ICP-OES) (1, 2). The problems related to its precise determination by ICP-OES are mainly due to the decrease of the signal of phosphorus in the content of calcium and other slightly ionizing elements in test samples. This repression of the signal could be overcome by using scandium as internal standard (3).
As a compound of the amino acids cysteine, cystin and meteonin, tripeptide glutation, of different proteins and inorganic sulphates, sulfur has an important role for oxidation-reduction processes, the energy balance of the plant, the functioning of the phytohormones, the enzyme activation, chlorophill formation etc. Nitrogen and sulfur ratios (N : S) are often used as a diagnostic tool (4).
While the problem with phosphorus is well known and its content in the soil and plants is subject to constant control, in the case of sulfur this issue has been underestimated. During the last years, however, decreasing sulfur input from atmospheric deposition and fertilizers has led to increasingly widespread S deficiencies in the UK (5). Due to the strengthening of pollution control
measures, similar trends have been observed in other West European and North American countries.
The problem of increased S deficiency has led to a greater need for plant tissue and soil testing in order to diagnose whether applications of S fertilizers are necessary. Compared to other important elements, testing for sulfur is relatively new. The most widely used method for determination of total S in plant tissues involves the initial destruction of the organic matter by digestion with mixtures of nitric and perchloric acid, or ashing in the presence of magnesium nitrate in a muffle furnace, followed by dissolution of the ash in diluted acid (6). The total S in solution may then be analysed by colorimetry with the methylene blue method (7), by turbidimetry with barium sulphate formation (6, 8), X-ray fluorescence analysis (9, 10) or ion chromatography (IC) (11). In the recent years, ICP has been accepted as a basic technique for measuring sulfur, because of its capacity for measuring in a UV spectral range, the relative non-presence of spectral interferences and the possibility of multi-element analysis (12, 13).
In spite of the significant number of publications regarding determination of the sulfur content in plant materials, plant total S analysis shows greater variations than those shown for other elements. Examination of data from a bimonthly report of the International Plant Analytical Exchange Programme (IPE) shows that the coefficient of variation (CV) for plant total S is typically about 22 %, whereas for P, K and N the CVs ranges from 10 to 15 % (14). The higher CV for S supports the view that S analysis is more difficult for laboratories. This problem forces more efforts to be focused on the two main stages of analysis – sample preparation and appropriate methods for sulfur determination. This necessity defines the objective of this study - to compare different digestion methods for determination of total phosphorus and sulfur in plant material.
INTRODUCTION
K. Ivanov: Comparison of digestion methods for ICP determination of total phosphorous in plant materials

24
1. Plant materialA Polish reference material CTA-VTL-2
(Virginia tobacco leaves), containing 2204 ± 78 ppm phosphorous was used in the study. For the sulfur, a single information value of 0.669 wt % is given.
2. Digestion methodsThe inductively coupled plasma (ICP)
emission spectrometry allows the determination of both metals and non-metals. This is why it is most suitable as a chief method for complete analysis of the tested material. A main consideration in the selection of digestion methods was the possibility for simultaneous determination of the most important macro- and micronutrients in the plants by a single digestion procedure. The most common methods for total or nearly total decomposition of the sample were used as follows:
2.1. Dry ashing: Procedure for dry ashing at 400 oС,
450 oС, 500 oС and 550 oС in a muffle furnace, following BDS 11708-93, was used. Samples (0.5 g) were weighed in 50 mLglass beakers, charged on a hot plate with stepwise increasing temperature up to 350oC for 4 hours and finally ashed in a muffle furnace at 400, 450, 500 and 550 oС for 1 hour. After cooling, ashes were dissolved in 20 mLof 1.5 % HNO3, or in a composition 3:1 v/v of HCl: HNO3.
2.2. Wet mineralization:
a) HNO3 + H2O2 digestionOne gram of oven-dried sample was transferred to a teflon beaker to which 10 mL of concentrated nitric acid were added. The sample was then warmed on a hot plate to about 85-95 oC until the initial reaction had subsided. After cooling 0.5 mLof 30% hydrogen peroxide was added dropwise, and the sample was then reheated. Stepwise additions of peroxide were repeated until the sample solution had clarified and no fats were visible. The sample was then diluted to 50 ml.
b) Procedure for acid digestion One gram of oven-dried sample was
weighed into a Kjeldahl flask and 5 mLof 65% HNO3 were added. The flask was placed on a preheated hot plate and heated until its content was evaporated to dryness. 14 mLof 72% HCIO4 were added to the sample and it was heated for 60 min. The digest was cooled, filtrated and diluted to 100 mL in a calibrated flask.
c) Procedure for acid digestion, following ISO 5515-1979A tobacco sample of 2.0 to 2.5 g, dried to constant weight, was put in a Kjeldahl flask of 100 to 150 mL 30 mL HNO3 and 4.0 mL H2SO4 as well as a few glass pearls were added. The mixture was left to settle for 12 hours and after that the flask was carefully heated in order to avoid the formation of foam. The heating of the liquid continued until the boiling point was reached and the process of boiling continued until the liquid acquired brown color. After that portions of 1.0 to 2.0 mL HNO3 were added until the release of nitric oxides stopped and the release of white fumes began. The solution was cooled down, 15 mL were added and it was heated up again until boiling with release of white fumes began. The cooled solution was transferred into a measurement flask of 50 or 100 mL and was filled up to the marking.
The same standard was applied in the digestion procedure, including the use of HCIO4 6.0 to 8.0 mL HNO3 were added to the sample, it was left to settle for 12 hours and was brought to boiling without being evaporated to dryness. After cooling an additional portion of 6.0 to 8.0 mL HNO3 was added and the liquid was brought to boiling as the procedure was repeated once or twice more. After cooling, 6.0 to 8.0 mL HNO3 and 4.0 mL H2SO4 were added. The decomposition began vigorously without heating. After the vigorous reaction stopped, the sample was cooled and 4.0 to 6.0 mL HNO3 and 3.0 to 5.0 mL HCIO4 were added.
MATERIAL AND METHODS
Тутун/Tobacco, Vol.62, No 1-6, 22-29, 2012

25
The boiling continued until the solution became colorless. Then it was cooled and brought to volume of 50 or 100 cm3.
d) Procedure for acid digestion, following BDS 17365-94 for determination of heavy metals in tobacco and tobacco products:A tobacco sample of 2.0 to 2.5 g dried to constant weight was put into a Kjeldahl flask of 100 to 150 mL 20 mL HNO3 and 5.0 mL H2SO4 were added and the mixture was left to settle for 2 to 4 hours. After that the flask was heated in a sand bath for 30-40 minutes at 80-90оС. At the appearance of a dark yellow or brown coloring of the solution the flask was cooled and 10 mL HNO3 and 2 mL HCIO4 were added. The heating continued until the elimination of most of the acids. 10 mL of distilled water were added twice and the solution was heated until most of it evaporated. After cooling, the residue was treated twice by 4 mL 1М HCl and after that it was filled up to 10 mL with 1М HCl.
2.3. Microwave digestion (MW): A procedure for microwave digestion with different acid mixtures, following EPA METHOD 3051, suitable for flame AAS determination of heavy metals, was used. A microwave digestion system
(Milestone 1200 MEGA, Italy) with 10 MRD 300 rotor with 10 positions, max. pressure of 30 bars and max. power 1000 W was used. A homogenized sample of 0.5 g dry substance was weighed on assay balance into a Teflon bomb and 10 mLof concentrated nitric acid were added. The microwave mineralization programme comprised three stages: (i) 5 min. non-pulsed 250 W microwave irradiation; (ii) 5 min. 400 W pulsed microwave irradiation and (iii) 5 min. 600 W pulsed microwave irradiation. After a one minute ventilation, the sample was cooled and diluted to 50 ml. Several additional alternative acid combinations including H2O2 and HF were used in accordance with EPA METHOD 3052.
3. Phosphorus and sulfur determinationAn ICP-AES spectrometer Spectroflame
MODULA (Spectro Analytical Instruments, Kleve, Germany) , equipped with two monohromators: (i) spectral range 160 – 460 nm with nitrogen purged optics and (ii) spectral range 240 – 790 nm with air purged optics, was used. The analytical operational parameters were optimized with the aim to achieve the lowest possible limit of detection for phosphorus and sulfur (Table 1).
Table 1. Instrument settings and measurement conditions
Parameter Index
NebulizerRate of sample deliveryArgon torch gas flow (cooling gas)Argon auxiliary gas flowArgon nebulizer gas flow
Mainhard TR 30 A31.2 mLmin-1
14 l min-1 Ar0.5 l min-1 Ar1.4 l min-1 Ar
4. Statistical analysis
For evaluation of the correctness of results for phosphorous, three generally accepted criteria were used as follows:
1. D = X – XCRM, where X is the measured value and XCRM is the certified value. When D is within the borders of ± 2s, where s is the standard deviation
from the certified value, the result is considered to be good, when it is -3s ≤ D ≤ 3s - satisfactory, and beyond these limits the result is unsatisfactory.
2. D % = D/ XCRM .100 – percentage difference. When the values of D % are in the limits ± 200s / ХCRM the result is considered to be good, when the value is
K. Ivanov: Comparison of digestion methods for ICP determination of total phosphorous in plant materials

26
within the borders of ХCRM ± UCRM, where UCRM is the indefiniteness of the certified value, we accept the extent of extraction to be 100%. In all remaining cases the extent of extraction is equal to X/ XCRM.100. Due to the lack of data for standard deviation, when determining sulfur, there was no determined Z – criterion. In this case, when the certified value XCRM is within the limits of Х ± s, where s is the standard deviation of the measured value, we accept the extent of extraction to be 100%.
The emission l ines at ICP-AES determination of phosphorous and sulfur,
in the limits ± 200s/ ХCRM and ± 300s/ ХCRM - satisfactory, and when it is out of the limits ± 300s/ХCRM the result is unsatisfactory.
3. Z = X – XCRM / s . When Z ≤ 2 the result is considered to be good, when 2 ≤ Z ≤ 3 - satisfactory, when Z > 3 - unsatisfactory.
For easier evaluation of the effectiveness of different methods for sample preparation we have used R criterion showing the extent of extraction of the element in percents from the certified value. When the measured value X is
RESULTS AND DISCUSSION
Table 2. Emission lines upon ICP determination of phosphorous and sulfur, detection limits and interferences
Element Technique / Line Estimated D.L. Optics Interferences
PICP-OES 178.287 nm 0.015 µg ml-1
VI, Mo,Mn
ICP-OES 177.495 nm 0.020 µg ml-1 Cu, HfICP-OES 213.618 nm 0.024 µg ml-1 Cu,Fe
S ICP-OES 180.734 nm 0.010 µg ml-1
V Ca, AlICP-OES 182.034 nm 0.030 µg ml-1
estimated detection limits and interferences are presented in Table 2.
According to data from literary sources, in the case of ICP determination of phosphorus at 177.495 nm, there is spectral interference of copper. The concentration of copper in tobacco leaves, according to the certificate, is 18.2 ppm, and its concentration in the tested solutions after dilution was less than 0.05 ppm. The pulverization of 0.10 ppm mono standard of Cu does not give intensity different from the background at 177.495 nm. Therefore, at this concentration of copper, no off peak correction is necessary. However, the content of phosphorus in all test samples was determined at two different wavelengths -177.495 and 178.287. The results obtained are statistically indistinguishable, and the table presents the average values.
The content of sulfur was determined at wavelength of 182.034 nm. For both elements background correction was performed. For P determination we used the internal standard method by adding scandium to the samples
and standard solutions. The calibration was performed using three standard solutions in 2 % v/v HNO3. A commercial multielement standard solution with concentration 100 µg/l was used as a stock solution. The calibration standard solutions have the following concentrations: 0,0; 5.0 and 10.0 ppm.
Thirteen samples of the tested material (Virginia tobacco leaves) were prepared for analysis for total phosphorous and sulfur content. The results of the ICP analyses of phosphorous are presented in Table 3.
The results obtained show that the extraction of phosphorus is complete in all variants of dry ashing and microwave digestion. However, closer to the certified values are the results obtained during microwave mineralization, as the values of the Z – criterion do not exceed 2.0, and of D % - 7.0. It is observed that all results obtained by dry ashing are higher than the certified value, which excludes lack of
Тутун/Tobacco, Vol.62, No 1-6, 22-29, 2012

27
Table 3. Effectiveness of different digestion methods upon ICP-AES determination of phosphorous contents in tobacco leaves. XCRM = 2204 ppm, sCRM = 78 ppm
Method X ppm
sxppm D D, % Z R
Dry ashing, 550oC 2420 200 216* 9.80* 2.77* 100Dry ashing, 500oC 2430 220 226* 10.25* 2.90* 100Dry ashing, 450oC 2390 180 186* 8.44* 2.38* 100Dry ashing, 400oC 2280 150 76** 3.45** 0.97** 100Dry ashing + (HCl + HNO3) 2400 250 196* 8.89* 2.51* 100HNO3 + H2O2 digestion 2240 180 36** 1.63** 0.46** 100HNO3 + HCIO4 digestion 2300 100 96** 4.36** 1.23** 100HNO3 + H2SO4 + HClO4 digestion 2130 160 -74** -3.36** 0.95** 100
HNO3 + H2SO4 + HClO4 digestion 1930 280 -274 -12.43 3.51 87.6
HNO3 + H2SO4 digestion 1490 260 -714 -32.40 9.15 67.6MW, HNO3 2230 120 26** 1.18** 0.33** 100MW, HNO3 + H2O2 2270 190 66** 2.99** 0.85** 100MW, HNO3 + H2O2 + HF 2355 110 151** 7.08** 2.00** 100
* - “satisfactory” results ** - “good” results
During the last year soil and plant laboratories have moved from colorimetry to inductively coupled plasma (ICP) spectrometry to quantify phosphorous in soil and plants. The main reason is that ICP has the advantage of being quicker and provides the possibility to quantify phosphorus and other plant nutrients in a single analytical process (2). However, we have to take into account that the P value with ICP is not always comparable with the colorimetric P value, which usually has been used to set up fertilizer P recommendations. On the other hand, colorimetric procedures offer some advantages, such as increased sensitivity and lower instrumentation cost, and it is unlikely that ICP will completely displace colorimetric procedures. With the aim to define the magnitude of the difference between ICP and colorimetric P in the plant material investigated,
phosphorus at these temperatures. In four of the variants, however, the values of Z-criterion are greater than 2.0, and those of D % reach 10.25.
The results in the case of wet digestion are different. HNO3 + H2O2 and HNO3 + HCIO4
wet digestion methods are efficient and are estimated as “good”. The efficiency of the HNO3 + H2SO4 + HClO4 digestion depends on the acid ratio and can be “good”, while HNO3 + H2SO4 digestion is unsuitable.
we analysed the same solutions, obtained by the digestion methods described above, following the colorimetric procedure for P determination, described by M.K. John (15). The results are presented in Table 4.
The results obtained give us ground to recommend the use of the microwave digestion method during sample preparation for ICP determination of the content of phosphorus in plant material. In addition to providing full extraction and preventing loss during the digestion, this method is quick and easy for application. In case of lack of the necessary equipment, dry ashing could be used.
The results of the ICP analyses for sulfur are presented in Table 5, as in this case the results of wet digestion methods, using H2SO4 are not included.
K. Ivanov: Comparison of digestion methods for ICP determination of total phosphorous in plant materials

28
In this case, too, the best results are obtained by microwave digestion of the samples, as the three variants provide for 100 % recovery. In spite of that, however, the results vary broadly – from 0.620 to 0.744 %, and the values of sx in all measurements exceed 0.05.
None of the dry ashing variants is suitable for determining sulfur in plant material. Obviously, a great part of the sulfur is lost during thermal processing of the samples in open vessels. When using HNO3 + H2O2 wet digestion method an extraction of about 90% is reached. Poykio et al. (12) have also obtained results close to these when determining the content
Table 4. Effectiveness of different digestion methods upon colorimetric determination of phosphorous contents in tobacco leaves. XCRM = 2204 ppm, sCRM = 78 ppm
Method Xppm
sxppm D D, % Z R
Dry ashing, 550oC 2400 95 196* 8.89* 2.51* 100Dry ashing, 500oC 2260 112 56** 2.54** 0.72** 100Dry ashing, 450oC 2350 94 146** 6.62** 1.87** 100Dry ashing, 400oC 2260 85 56** 2.54** 0.72** 100Dry ashing + (HCl + HNO3 ) 2400 102 196* 8,89* 2.51* 100HNO3 + H2O2 digestion 2360 87 156** 7.08** 2.00** 100HNO3 + HCIO4 digestion 2400 83 196* 8.89* 2.51* 100HNO3 + H2SO4 + HClO4 digestion 2200 74 -4 -0.18** -0.05** 100
HNO3 + H2SO4 + HClO4 digestion 2000 99 -204* -9.26* -2.62* 90.7
HNO3 + H2SO4 digestion 1740 102 -464 -21.05 -5.95 78,9MW, HNO3 2320 82 116** 5.26** 1.49** 100MW, HNO3 + H2O2 2300 77 96** 4.36** 1.23** 100MW, HNO3 + H2O2 + HF 2430 95 226* 10.25* 2.90* 100
* - “satisfactory” results ** - “good” results
Table 5. Effectiveness of different digestion methods upon determination of sulfur contents in tobacco leaves
Method X, % sx, % XCRM, % D D, % RDry ashing, 550oC 0.564 0.060 0.669 -0.105 -15.70 84.3Dry ashing, 500oC 0.596 0.045 0.669 -0.073 -10.91 89.1Dry ashing, 450oC 0.558 0.052 0.669 -0.111 -16.59 83.4Dry ashing, 400oC 0.605 0.050 0.669 -0.064 -9.57 90,4Dry ashing + (HCl + HNO3 ) 0.581 0.061 0.669 -0.088 -13.15 86.8HNO3 + H2O2 digestion 0.598 0.061 0.669 -0.071 -10.61 89.4HNO3 + HCIO4 digestion 0.742 0.068 0.669 0.073 10.91 100MV, HNO3 0.744 0.057 0.669 0.075 11.21 100MW, HNO3 + H2O2 0.620 0.056 0.669 -0.049 -7.32 100MW, HNO3 + H2O2 + HF 0.653 0.052 0.669 -0.016 -2.39 100
of sulfur in a certified sample of beech leaves. According to the same authors, the HNO3 + HCIO4 digestion procedure gave lower results, which is in contradiction with the results that we have obtained.
Because one and the same method ICP-AES was used in all quantitative determinations, the comparative study carried out lead us to the conclusion that the sample preparation is a critical stage in determining sulfur in plant material, which requires thorough investigations in this direction. This conclusion is also supported by the inter-laboratory comparison of sulfur analysis in plant materials, summarized by Crosland et al. (5).
Тутун/Tobacco, Vol.62, No 1-6, 22-29, 2012
29
A comparative study of the most commonly used methods for sample preparation for ICP determination of the total phosphorus and sulfur contents in plant materials was held on the basis of reference material CTA-VTL-2 (Virginia tobacco leaves). The methods used in the study were evaluated according to the recovery of total phosphorus and sulfur, ease of application and rapidity of performance. It was found out that:
1. Microwave digestion and dry ashing methods, as well as wet methods, including the use of HNO3 + HClO4 quantitatively extract phosphorous from the studied plant samples. Microwave digestion gives the best results and could be recommended, taking into consideration its rapidity and
ease of determination. HNO3 + H2SO4 digestion, which gives low recoveries probably due to incomplete oxidation, and HNO3 + H2SO4 + HClO4 acid mixture have to be used very carefully.
2. Microwave digestion and wet HNO3 + HClO4 procedure quantitatively extract sulfur from the plant material, while dry ashing is not suitable because of considerable losses during thermal processing of the material in open vessels.
3. Microwave digestion is the most suitable method for sample preparation for simultaneous determination of phosphorus and sulfur by ICP-AES in plant material.
CONCLUSION
REFERENCES
1. Gasparatos D., Haidouti C., 2001. A comparison of wet oxidation methods for determination of total phosphorus in soils. J. Plant Nutr. Soil Sci., 164, 435.
2. Sicora F.J., Howe P.S., Hill L.E., Reid D.C., Harover D.E., 2005. Phosphorus Determination in Waters and Extracts of Soils and By-Products: Inductively Coupled Plasma Spectrometry versus Colorimetric Procedures. Commun.Soil Sci. Plant Anal., 36, 875.
3. Kola H., Peramaki P., Valimaki I.J., 2002. Correction of spectral interference of calcium in sulfur determination by inductively coupled plasma optical emission. spectrometry using multiple linear regression. Anal. At. Spectrom., 2,104.
4. Randall P.J., Wrigley C.W., 1986. Effects of sulfur supply on the yield, composition, and quality of grain from cereals, oilseeds, and legumes. Adv. Cereal Sci. Tech., 8 (1), 171.
5. Crosland A.R., Zhao F., McGrath S.P., 2001. Inter-laboratory comparison of sulphur and nitrogen analysis in plants and soils. Commun. Soil Sci. Plant Anal., 32, 685.
6. Blancharm R.W., 1986. Measurement of sulfur in soils and plants. In: Sulfur in Agriculture, (Ed. M.A. Tabatai). American Society of Agronomy, Madison, WI 455-490.
7. Johnson C .M. , Nish i t a H . , 1952 . Microestimation of sulphur in plant materials, soils and irrigation waters. Anal. Chem., 24, 736.
8. Morante C., 1991. Determination of plant sulphur and sulphate-sulphur by flow-injection analysis using a two-line manifold. Analytica Chimica Acta, 249, 479.
9. Norrish K., Hutton J.T.ED(P)XRF, 1997. Screening analysis and quantitative analysis with polarized X-rais. X-ray Spectrom., 6,12.
10. Sprta V., Knob B., Janos P., 1999. Fresenius’ Journal of Analytical Chemistry, 364 (8), 705.
11. Artiola J.F., Ali A.S., 1990. Determination of Sulfur in soil and plant samples using sodium bicarbonate/silver oxide dry ashing and ion chromatography. Commun. Soil Sci. Plant Anal., 21, 941
12. Poykio R., Torvela H., Peramaki P., Koukkanen T., Ronkkomaki T., 2000. Comparison of dissolution methods for multi-element analysis of some plant materials used as bioindicator of sulphur and heavy metal deposition determined. Analusis, 28, 850.
13. Hoenig M., 2001. Preparation steps in environmental trace element analysis - facts and traps. Talanta, 54, 1021.
14. Sterrett S.B., Smith C.B., Mascianica M.P., Demchak K.T., 1987. Comparison of analytical results from plant analysis laboratories. Commun. Soil Sci. Plant Anal., 18 (3), 287.
15. John M.K.,1970. Colorimetric Determination of phosphorus in soil and plant materials with ascorbic acid. Soil Science, 109 (4), 214.
K. Ivanov: Comparison of digestion methods for ICP determination of total phosphorous in plant materials

30
UDC 633.71Тутун/Tobacco, Vol.62, No 1-6, 30-35, 2012University “St. Kliment Ohridski” - BitolaScientific Tobacco Institute – Prilep, R. Macedonia
ISSN 0494-3244
UDC: 633.71-248.114.4/.6:632.938Original scientific paper
INVESTIGATION OF THE RESISTANCE TO BLUE MOLD (Peronospora tabacina Adam) AND BLACK SHANK (Phytophthora parasitica var. nicotianae) IN SOME ORIENTAL TOBACCO CULTIVARS AND LINES
Miroslav Dimitrieski, Gordana Miceska, Petre Taskoski
University”St.Kliment Ohridski”-Bitola, Scientific Tobacco Institute-Prilep, Republic of Macedonia, e-mail: [email protected]
ABSTRACT
Blue mold and black shank are among the most common and harmful diseases in R. Macedonia and other tobacco producing countries in the world. Considering the actuality of the problem and economic losses it produces, the aim of our paper was to investigate the resistance to these diseases in 8 newly created tobacco lines and two standard cultivars (P12-2/1 and YV 125/3). Investigations were carried out in Biological laboratory of Tobacco Institute-Prilep during 2010. Resistance of investigated cultivars and lines to the causing agents of the diseases was studied in conditions of artificial inoculation. Resistance was reported in three lines of the investigated tobacco, two of which were resistant to blue mold and one to black shank.
The new resistant lines will not only find application in practice, but they will be also used as sources of resistance in breeding programs.
Key words: tobacco, disease, blue mold, black shank, oriental tobacco, cultivars, line
ПРОУЧУВАЊЕ НА ОТПОРНОСТА СПРЕМА ПЛАМЕНИЦА (Peronospora tabacina Adam) И ЦРНИЛКАТА (Phytophtora parasitica var. nicotianae) КАЈ НЕКОИ
ОРИЕНТАЛСКИ СОРТИ И ЛИНИИ ТУТУН
Пламеницата и црнилката на тутунот спаѓаат во редот на најраспространетите и најштетните болести во нашата република и останатите земји производители на тутун од целиот свет. Имајќи ја во предвид актуелноста на проблемот, како и големите економски штети кои ги причинуваат овие две болести во тутунопроизводството, си поставивме за цел да ја проучиме отпорноста спрема пламеницата и црнилката на 8 новосоздадени ориенталски линии и две стандардни сорти П12-2/1 и ЈВ 125/3. Испитувањата се извршени во биолошката лабораторија на Институтот за тутун во текот на 2010 година. Отпорноста на испитуваните сорти и линии спрема причинителот на овие болести е проучувана во услови на вештачка инокулација. Од проучуваните 10 ориенталски сорти и линии тутун се добиени податоци за отпорноста спрема двете болести (пламеница и црнилка) кај 3 лини, две лини покажуваат отпорност кон црнилката, а една линија е отпорна на пламеницата. Овие новосоздадени отпорни линии освен што ќе можат да најдат примена во производството, ќе можат да се користат и како извори на отпорност во селекционите програми.
Клучни зборови: тутун, болест, пламеница, црнилка, ориенталски сорти, линии

31
In selection of oriental aromatic tobaccos, the main interest of breeders is always directed toward increasing the yield and improving the quality of tobacco. In our country, however, there is little or no work on creation of oriental tobacco cultivars resistant to economically important diseases. Such diseases are blue mold and black shank, which in some years and under favorable conditions for their appearance may cause serious damage to tobacco production ( 4, 5, 6, 9, 8). Gelemerov ( 1 ) reported that growing of oriental tobacco as a monoculture in the region of Nevrokop leads to frequent occurrence of diseases in epiphythotic form. According to him, the problem can be solved with creation and use of resistant cultivars. Currently, the world tendency in modern tobacco production is to limit the use of chemicals by introducing resistant cultivars (Palakarceva, 1986, cit. by Tranceva, 9). She reported that significant results on this subject were achieved in Bulgaria, with creation of cultivars Basma 15, Krumovgrad 90, Rila 82,
Jubilej 816, Nevrokop А-24, Djebel 169, Pobeda 3 etc., resistant to both diseases. Accordingly, the most effective control of these pathogens will be achieved only by creating and introducing new resistant lines and cultivars of oriental tobacco in primary production (2,3,10).
From the aspect of relevance of the problem, our recent investigations have been directed toward implementation of the achievements in intracultivar hybridization in creation of new oriental tobacco cultivars and lines, by which more oriental lines with high resistance to blue mold and black shank were obtained. Some of these lines and cultivars are subject of this study. Investigated tobacco cultivars and lines were analyzed in terms of their resistance to blue mold and black shank and the possibility of their utilization not only in production but also as a starting material for hybridization in creating new cultivars resistant to these diseases.
Investigations were made in Biological laboratory of Tobacco Institute-Prilep during 2010 and they included 10 cultivars and lines of oriental tobacco (P12-2/1, Hybrid 301/N, l. P 65-54/09, l. P 123-65/82, l. P 123-65/82, YV 125/3, Yk.l. 123-82, Yk.l. 20-23/10, Yk.l. 22-82/10, Yk.l. 301/23).
The newly created resistant lines included in investigations were obtained by intracellular hybridization, using introduced resistant cultivars and domestic non-resistant cultivars and lines of oriental tobacco.
For investigation of resistance to blue mold, 24 plants of each cultivar were transplanted and monitored. In order to improve the conditions for occurrence and development of the disease, tobacco pots were placed on hemp canvas and covered with polyethylene. Canvases were regularly moistened in order to increase relative humidity under the polyethylene and thus to create favorable conditions for disease occurrence. The symptoms of the disease in certain tobacco cultivars and lines appeared as a result of natural infection by the pathogen.
The resistance was estimated according to the EPPO scale:
0 – highly resistant- no visible infection
1 – resistant - 5 % infected plants
2 – moderately resistant - 5 - 25 % infected plants
3 - susceptible- 25 - 50% infected plants
4 – highly susceptible- 50% - 100% infected plants
Resistance to black shank disease of the investigated cultivars and lines was studied in conditions of artificial inoculation. Tobacco plants were transplanted in pots on 14.06.2010, with 24 plants for each cultivar.
Pure culture of the fungus Phytophthora parasitica var. nicotianae obtained from naturally infected tobacco plants was used as inoculum. The fungus was sown on potato-dextrose agar and incubated at a temperature of 25oC in a period of 15 days.
INTRODUCTION
MATERIAL AND METHODS
M. Dimitrieski: Investigation of the resistance to blue mold (Peronospora tabacina Adam) and black shank (Phytophthora parasitica var. nicotianae) in some oriental tobacco cultivars and lines

32
RESULTS AND DISCUSSION
Isolate P 25, race 0 of the pathogen was used in the trial. Tobacco plants were inoculated with suspension prepared from the fungus culture of one petri-dish, mixed in 100 ml distilled water.
Each plant was injured in the root system prior to inoculation. For easier infection, a knife was used to cut soil and root system around the stalk (7). After that, 30 ml of the prepared suspension was added to each plant by watering, and 30 ml distilled water was added to control plants. Inoculation was performed on 13.07.2010.
First symptoms of the disease, expressed through wilting of the leaves, appeared 4 days after inoculation. During the vegetation, several readings of the infected plants were made, and the last assessment was done on 01. 09. 2010. The ratio between the number of infected plants
and the total number of observed plants was used to assess disease intensity of each cultivar, expressed in percentages. The index of disease in investigated cultivars and in the check was used to calculate the index of resistance according to Abbott’s formula. Based on this index and by the scale of Kutova (cited by Trancheva, 9), with minor corrections, all varieties are classified into 5 categories:
0 - highly resistant- no visible infection 1 - resistant - 10% infected plants 2 - moderately resistant - 40% infected
plants 3 - susceptible- 50% infected plants 4 - highly susceptible- 50% - 100% infected
plants
Table 1 Tobacco cultivars naturally infected with black shank - greenhouse 2010-
Cultivars-lines Number of observed plants
Number of infected
plants
infected plants, % Index(1
P 12-2/1 20 4 20.0 2Hybrid 301/N 24 5 20.83 2l.P 65-54/09 24 24 100.0 4
l.P 123-65/82 20 0 0.0 0l.P 301-11/46 24 0 0.0 0
YV125/3 24 3 12.5 2Yk.l. 123-82 24 12 50.0 4
Yk.l. 20-23/10 20 1 5.0 1Yk.l.22-82/10 24 0 0.0 0Yk.l.301/23 20 0 0.0 0
In the investigations of black shank resistance which included 10 oriental tobacco cultivars and lines (Table 1), high resistance to the pathogen (index 0) was observed in 4 of the lines (l.P123-65/82, l.P301-11/46, Yk l. 22-82/10 and Yk l.301/23). During the observations and assessment of the occurrence and spread of the pathogen among the cultivars and lines tested in Biological Laboratory, there were no symptoms of disease in conditions of natural infection. Such symptoms appeared in other cultivars tested under the same conditions, as a result of natural infection by the pathogen. Among these, one tobacco line (Yk l. 20-23/10) showed to be
resistant (index 1), two standard cultivars (P12-2/1 and JV125/3) and the line Hybrid 301/H were moderately resistant (index 2), and two lines (l.P65-54/09 and JK l.123-82) were highly susceptible (index 4). The most susceptible line L.P65-54/09, in which 100% of the plants were infected, may serve as non-resistant check in future investigations of this disease.
The four highly resistant lines (l.P123-65/82, l.P301-11/46, Yk l. 22-82/10 and Yk l.301/23), beside their implementation in mass production, can be used as sources of resistance in creation of new cultivars.
Тутун/Tobacco, Vol.62, No 1-6, 30-35, 2012

33
(10 – highly resistant- no visible infection1 – resistant - 5 % infected plants 2 – moderately resistant - 5 - 25 % infected
plants 3 - susceptible- 25 - 50% infected plants 4 – highly susceptible- 50% - 100% infected
plants
According to the results on the resistance to black shank in conditions of artificial inoculation ( Table 2), out of the 10 cultivars and lines of oriental tobacco included in investigations, 5 lines were highly resistant (l. P 65-54/09, l.P 301-11/46, Yaka l. 20-23/10, Yaka l. 22-82/10 and Yk l.301/23) (Fig. 2). These plants showed 100% resistance, i.e. no symptoms of disease appeared during the growing period, up to 01.09.2010.
After inoculation with suspension prepared from the fungus culture, line l. P. 123 was estimated as resistant (index 1), and the lines Yaka l.123-82 and Hybrid 301/N as moderately resistant (index 0).
The other two standard cultivars, Prilep 12-2/1 (as non-resistant control) and YV 125/3 (Fig. no. 1) were rated as
highly susceptible (index 4) to the pathogen (Phytophthora parasitica var. Nicotianae). In these cultivars, the percentage of infected plants after inoculation was 100 and 87.5%, respectively.
The above results point out to the existence of differences in the level of resistance. According to our findings from previously conducted research (Tashkoski, Gveroska, Dimitrieski, Miceska, 2008), these differences depend on the resistance of the investigated cultivars and virulence of the isolates. Thus, out of 13 cultivars investigated, only Rila 82 showed the highest level of resistance, from 75% healthy plants in the more virulent isolates (P2 and P10) to 100% in the less virulent isolate (P13). Similar resistance was observed in Krumovgrad 58, which showed slightly higher susceptibility towards the more virulent isolate (P. 10).
In creation of black shank resistant cultivars, the following resistant lines can be used in breeding programs as components in hybridization: l. Q 65-54/09, l.P 301-11/46, Yaka l. 20-23/10, Yaka l. 22-82/10 and Yk l.301/23.
Table 2 Tobacco cultivars inoculated with a culture of Pytophthora parasitica var. nicotianae - greenhouse 2010
Cultivars-lines Inoculated plantsTotal No.
of infected plants
Infestation, %
Level of resistance
Index(1
P 12-2/1 20 20 100.00 - 4Hybid 301/N 24 8 33.33 66.67 2l.P 65-54/09 24 0 0.00 100.00 0
l.P 123-65/82 20 1 5.00 40.00 1l.P 301-11/46 24 0 0.00 100.00 0
YV 125/3 24 21 87.50 12.50 4Yk. l. 123-82 24 4 16.66 83.34 2
Yk. l. 20-23/10 20 0 0.00 100.00 0Yk. l..22-82/10 24 0 0.00 100.00 0Yk. l..301/23 20 0 0.00 100.00 0
M. Dimitrieski: Investigation of the resistance to blue mold (Peronospora tabacina Adam) and black shank (Phytophthora parasitica var. nicotianae) in some oriental tobacco cultivars and lines

34
Photo 1 YV 125/3 Photo 2 Yk l. 301/23
with index 1 (Yk. l. 20-23/10 to blue mold and l.P 123-65/82 to black shank).
- Standard cultivars P 12-2/1 and YV 125/3 proved to be highly susceptible to black shank and moderately resistant to blue mold, while lines l. P65-54/09 and Jk.l. 123-82 as highly susceptible to blue mold..
- Beside their use in commercial production, the lines with high resistance to blue mold and black shank can be used as sources of resistance in creation of new cultivars resistant to these diseases.
CONCLUSION
REFERENCES
The following conclusions can be drawn from the investigations on resistance to blue mold and black shank disease in some oriental tobacco cultivars and lines:
- From 10 studied oriental tobacco cultivars and lines, three lines show high resistance to blue mold and black shank (l. P. 301-11/46, Yk.l.22-82/10, Yk.l.301/23), two lines show high resistance to black shank (l. P65-54/09 and Yk l. 20-23/10) and the line l. P 123-65/82 shows high resistance to blue mold.
- Two lines were reported as resistant
1. Гелемеров С., 2005. Сbздавање на ориенталски тютюневи линии и сортове устойчиви на болести: тютюнева мозайка (Тоbacco mosaic virus, Аllard (TMV), и чернилка (Phytophtora parasitica var. nicotianae.) Бbлгария, 60 год. ИТТИ Пловдив, Юбилейна научна конференция с международно участие, 56-61.
2. Gornik R., 1973. Oblagoroduvanje na tutunot. Prilep.
3. Dimitrieski M., Miceska G., Taskoski P., 2011. Otpornost kon crnilkata (Phytophtora parasitika var. nicotianae) kaj nekoi sorti i linii orientalski tutun. Zastita na rastenijata, I Kongres za zastita na rastenijata, Godina XXII, Vol.XXII,.23- 27. Skopje.
(10 - highly resistant - no visible infection1 - resistant - 10 % infected plants 2 - moderately resistant - up to 40% infected
plants
3 - susceptible - up to 50% infected plants4 - highly susceptible - over 50% infected
plants
Тутун/Tobacco, Vol.62, No 1-6, 30-35, 2012
35
4. Димитров А., 2003. Нарbчник по защита на тютюна от болести, неприятели и плевели. Институт по тютюна и тютюневите изделия, Пловдив.
5. Mickovski J., 1984. Bolesti na tutunot. Stopanski vesnik . Skopje.
6. Mickovski J., 1988. Fitoftorata (crnilkata) vazen problem vo tutunoproizvodstvoto. Tutun/ Tobacco, Vol. 38, No 9-10, 317-327, Prilep.
7. Taskoski P., Pejcinovski F. 2002. Proveruvanje na virulentnosta na izolatite i identifikacija na fizioloski rasi od gabata Phytophthora parasitica var. nicotianae. Tutun/ Tobacco, Vol. 52, No 3-4, 89-100, Prilep.
8. Taskoski P., Dimitrieski M., Miceska G., 2008. Proucuvanje na otpornosta sprema
Phytophthora parasitica var. nicotianae kaj nekoi orientalski sorti na tutun. Zastita na rastenijata, God. XIX, Vol. XIX, 103-107, Skopje.
9. Trancheva R., 2000. Proucuvanje na otpornosta sprema TMV (Tobacco mosaic virus), plamenica (Peronospora tabacina Adam) i crnilka (Phytophthora parasitica var. nicotianae) na bugarski i introducirani tutunski sorti. Tutun/ Tobacco, Vol. 50, No 7-8, 123-127, Prilep.
10. Trancheva R., 2001. Proucuvanje na otpornosta kon crnilkata (Phytophthora parasitica /Dastur/ var. nicotianae /Breda de Haan/Tucker) na sortite i liniite tutun za sozdavanje na selekcionen materijal otporen na pricinitelot na bolesta. Tutun/ Tobacco, Vol. 51, No 3-4, 75-84, Prilep.
M. Dimitrieski: Investigation of the resistance to blue mold (Peronospora tabacina Adam) and black shank (Phytophthora parasitica var. nicotianae) in some oriental tobacco cultivars and lines
36
UDC 633.71Тутун/Tobacco, Vol.62, No 1-6, 36-44, 2012University “St. Kliment Ohridski” - BitolaScientific Tobacco Institute – Prilep, R. Macedonia
ISSN 0494-3244
UDK: 633.71-153.037:632.48]:632.937.1632.937.1:[633.71-153.037:632.48
Original scientific paper
EVALUATION OF THE ANTAGONISTIC EFFECT OF TRICHODERMA ASPERELLUM AGAINST THE PATHOGEN
PYTHIUM DEBARYANUM
Petre Tashkoski
University “St. Kliment Ohridski”- Bitola, Scientific Tobacco Institute, Kichevski pat, bb. 7500 Prilep, R. Macedonia E-mail: [email protected]
ABSTRACT
Investigations on Trichoderma asperellum species were conducted in vitro and in vivo. During the cultivation of the fungus T. asperellum, on nutrient medium in biculture with phytopathogenic fungus Pythium debaryanum, it stops the growth of the pathogenic fungus and continues to develop upon its colony. The growth of the pathogenic fungus cultivated in the presence of the antagonist is reduced for 37.27% in average, while the percentage of inhibition of fungus growth ranged between 54.55% and 72.73%. The biological control of root-rot disease on tobacco seedlings caused by this pathogen was evaluated in greenhouse conditions. Inoculation of seedlings was done with culture of the pathogen and with biculture of P. debaryanum and T. asperellum. The results have shown high percentage of infection in the control variants, while in variants treated with biculture the infection was minimum, i.e. the healthier and faster growing seedlings were obtained.
Key words: Tobacco, Pythium debaryanum, Trichoderma asperellum, antagonism.
ОЦЕНА НА АНТАГОНИСТИЧКОТО ДЕЈСТВО НА TRICHODERMA ASPERELLUM ПРОТИВ ПАТОГЕНОТ PYTHIUM DEBARYANUM
Испитувањата се вршени со видот Trichoderma asperellum во in vitro и in vivo услови. При одгледување на габата T. asperellum на хранлива подлога во двојна култура со фитопатогената габа Pythium debaryanum, истата го запира порастот на патогената габа и продолжува да се развива врз нејзината колонија. Порастот на патогената габа одгледувана во присуство на антагонистот е намален во просек за 37.27%, додека процентот на инхибирање на порастот на колонијата од патогената габа се движеше од 54.55% до 72.73%. Биолошката контрола на болеста полегнување на тутунскиот расад причинета од оваа фитопатогена габа, беше оценувана во заштитен простор. Извршено е инокулирање на расад со култура од патогенот и двојна култура од P. debaryanum и T. asperellum. Добиените резултати покажаа висок процент на зараза кај контролните варијанти, додека кај третираните варијанти со двојна култура, процентот на зараза беше минимален, односно расадот беше здрав и со побрз развој.
Клучни зборови: Тутун, Pythium debaryanum, Trichoderma asperellum, антагонизам.

37
Besides the possibility of using alternative methods for plant protection from diseases, pests and weeds, so far chemicals have been mostly used in practice. Lately, however, the usage of useful microorganisms in plant protection has become more and more important, especially in greenhouse conditions or in organic production. For ecological protection of the environment and plants, increased use of biological products and reduction of chemicals is recommended.
A lot of chemical pesticides are out of use because of the harmful influence on humans health, environment pollution and low effect in pest control or occurrence of resistance in the harmful organisms to the given chemical compound (4)
Today, in the era of integral and ecological protection of plants, in order to reduce the negative consequences of chemicals, more and more attention is paid to the usage of biological protection. Biological control of plant pathogens is not a new idea. The antibiotic properties of species of the genus Trichoderma (7) have been known since the 1930’s.
The term biological control is used in different fields of biology, especially in entomology and plant pathology (8). In entomology it denotes the use of living insects or pathogen microorganisms in the control of population of some harmful insects, and in phytopathology it applies to the use of microorganism antagonists to prevent the occurrence of disease. In both fields, the organisms that prevent the appearance of pests and weeds or pathogens are called biological control agents-BCA. The term biological control according to Baker and Cook, (1974), (1), means reducing of inoculum or the disease, i.e. activity of the pathogen made by one or more microorganisms with exception of the humans. In other words, biological control is control of the harmful activities of an organism by one or more other organisms (natural enemies)
B i o f u n g i c i d e s u s e b e n e f i c i a l microorganisms (fungi, bacteria, yeasts, viruses) (4), or products of their metabolism such as toxins, spores and antibiotics which act antagonistically on the causing agent, and plant extracts and ethereal oils in plant protection. Biopesticides
have different mechanisms of functioning, and the most common are competition for food and space, antibiosis or antagonism, predatoriness or parasitism (mycoparasitism) and induced (caused) resistance of the host plant (1,4). The essentiality of the antagonistic relations is in the ability of particular microorganisms to excrete antibiotics which act inhibitory, i.e. fungistatic on the development of other microorganisms. The fungus T. lignorum produces the antibiotic gliotoxin which acts as a fungicide on the development of pathogenic fungi Pythium spp. and Rhizoctonia spp.; T. viride produces the antibiotics viridian and gliotoxin (10). The species of the genus Trichoderma produce ferments (gluconase, cellulase and chitinase) which melt the cell walls of the pathogen, they penetrate into the cell and feed on its cytoplasm (1).
Often, biopreparations are applied through the soil for preventive protection of the root, the neck of the root and the stem of the plants (7). In agricultural production for protection of plants (4), they are used for treatment of seed and tubers, for immersion of the grafts or the seedling, for watering of the seedling and foliar spraying. They are used for treatments in gardening, viticulture, fruit-growing and in other cultivated plant species.
The use of biopesticides in protection of plants is especially important in organic production and its aim is to reduce the use of chemicals without reduction of crop yield. Up to the present day, the application of microbiological products is still recommended in integral protection of plants.
Presently, according to Đorđević (2008), (4), 185 biopesticide products are registered worldwide. Most of them (72) have bacteria as an active substance, 47 are from fungi, 40 are from entomopathogenic nematodes, 24 are from viruses and 2 from protozoa. Depending on the type of organism that has been controlled, biopesticides are divided into: bioinsecticides, biofungicides, bioherbicides, etc.
The most frequently used fungi in obtaining biofunicides are the species of the genus Trichoderma. They are widespread in the nature and have the ability to parasite other
INTRODUCTION
P. Tashkoski: Evaluation of the antagonistic effect of Trichoderma Asperallum against the pathogen Pythium Debayanym

38
fungi (12), i.e. to colonize the plant root, which makes them excellent means for bio-control (2). Trichoderma species are saprophytic fungi (they are not pathogens) with expressed antagonism, they adjust easily and they grow very fast. They do not attack other useful microorganisms in the soil, they improve the health condition of the plant, increase its resistance and enchance plant growth.
A large number of biofungicides have been obtained from the fungi T. harzianum, T. viride, T. polysporum and T. asperellum, which are antagonists to the phytopathogenic fungi of the species Pythium, Phytophthora, Rhizoctonia,
MATERIAL AND METHODS
Verticillium, Sclerotinia - the causing agents of different soil diseases of plants. (1). The biofungicide Trifender WP, which was tested on tobacco seedlings, was made on the basis of T. asperellum (13). Using this product, a high efficiency was reached in protection of potato from the soil pathogens P. debaryanum and R. solani (16).
The aim of this investigation was to evaluate the antagonistic effect of T. asperellum on growth of the phytophatogenic fungus P. debaryanum in vitro, and to study the biological control of this fungus causing tobacco seedlings damping off in greenhouse conditions.
The investigations were made in vitro and in vivo. The antagonistic ability of the fungus Trichoderma asperellum on the pathogen Pythium debaryanum is tested in laboratory. The pure culture of the pathogen P. debaryanum is derived from an infected tobacco seedling grown on a nutrient medium potato-dextrose agar, while the pure culture of the fungus T. asperellum on a nutrient medium potato-dextrose agar is derived from the biofungicide Trifender WP, on the basis of this fungus. For testing of the antagonistic ability of the fungus T. asperellum against this pathogen, the technique of biculture described by Dennis and Webster (1971), (12) is used. Fragments of 3 mm with mycelia of the pathogen
fungus and the fungus T. аsperellum were placed in Petri dishes with a diameter of 10 cm, at a distance of 3 cm. The variant with the biculture of the antagonist and pathogenic fungus was set up in three replications and 4 trials were made. Pure culture of the antagonistic and pathogenic fungus, set up in three replications, was grown separately as a check variant. The Petri dishes were incubated in thermostat at 250С, for 10 days. Readings were taken daily for 7 days, and the radial growth of mycelia colonies was regularly measured. The percentage of growth of mycelial colony of the pathogenic fungus cultivated in pure culture is estimated by the Siameto formula (11):
According to the growth percentage of the mycelial colony of the pathogen, the percentage of inhibition of the pathogenic fungus by T. аsperellum was estimated, using the formula of Mudri (7) and Siameto (11):
% of inhibition = (а-b/а) х 100
where:a= radial increase of pathogen in the
check variantb= radial increase of pathogen in the
presence of the antagonist
radius of growth in the presence of antagonist% = x 100 radius of growth in the check variant
The inhibition of gowth of the pathogenic
fungus colony, according to Živković (17), can be presented on a 0-4 scale, in the following categories:
0 = no inhibition, 1 = 1-25% inhibition, 2 = 26-50% inhibition,3 = 51-75% inhibition,4 = 76-100% inhibition
Biological control of the pathogen P. debaryanum, the causing agent of damping off
Тутун/Tobacco, Vol.62, No 1-6, 36-44, 2012

39
on tobacco seedlings, was checked in vivo, in protected area (biological laboratory). For this aim, two trials were set up. Tobacco seedlings of the variety P66 were grown in pots. The seedlings were inoculated at approximately 4 cm hieight (prior to rapid growth stage ), by foliar spraying with suspension prepared from fungus mycelia. Three variants were tested in each trial:
• Seedlings treated with pure culture of the pathogenic fungus P. debaryanum
• Seedlings treated with biculture of the pathogen P. debaryanum and the fungus T. аsperellum
• Check-untreated seedlingsThe culture of the fungi was cultivated
on potato-dextrose agar, in a thermostat for 10 days. Pure culture of the pathogen was
separately cultivated, and in other Petri dishes the pathogenic fungus and antagonistic fungus were cultivated together as a biculture, as was previously explained.
The inoculum was prepared by mixing the mycelia of one Petri dish in 200 ml distillated water, and the obtained suspension was used for spraying of the seedlings from a single pot with 380 cm2 area. The seedlings were inoculated on 22.06.2011 in the first trial and on 25.07.2011 in the second trial. The control pots with seedlings were treated only with water. Each variant was set in three replications. The efficiency of protection of the seedlings was evaluated according to the occurrence of infected seedlings, i.e. according to the percentage of the infected area.
Phytopathogenic fungus P. debaryanum, grown on potato-dextrose agar creates snow-white, web-like, airy and fast-growing mycelial colony (Picture 1). Antagonistic fungus T. аsperellum has poorer growth and creates white-colored colony which few days later, with the formation of conidiophores with conidia, turns green (Picture 2).
The growth of mycelia from the fungi
RESULTS AND DISCUSSION
cultivated on a nutrient medium was monitored for a period of 7 days. From the results of the laboratory analysis on the growth of mycelial colony of phytopathogenic fungus P. debaryanum and antagonistic fungus T. аsperellum, cultivated as a pure culture and together in biculture, the percentage of growth of the colony and the percentage of inhibition of the pathogen by the antagonist were estimated.
Pc. 1. P. debaryanum – pure culture Pc. 2. T. asperellum - pure culture
In Table, a scheme is presented of the daily growth of fungi cultivated as a pure culture and as a biculture of the pathogen and the
antagonist. The mean values of the replications from four trials are presented.
P. Tashkoski: Evaluation of the antagonistic effect of Trichoderma Asperallum against the pathogen Pythium Debayanym

40
Table1. Development of the colony during incubation in mm
Variant Days of incubation1 2 3 4 5 6 7
Pythium debaryanum 31.30 55.00 55.00 55.00 55.00 55.00 55.00
P.debaryanum+ T. asperellum 20.00 20.00 20.50 20.50 20.50 20.50 20.50
Trichoderma asperellum 3.50 14.00 19.00 26.00 38.00 46.00 52.50
Phytopahogenic fungus P. debaryanum cultivated as a pure culture showed very fast development. 24 hours after the sowing it reached a growth of 31.30 mm, and on the second day it could be seen that the whole Petri dish was filled, i.e. the radius of the mycelia colony was 55.00 mm. The antagonistic fungus T. аsperellum cultivated as a pure culture showed poorer growtht in comparison to the phytopahogenic fungus. The radius of its colony was 3.50 mm on the first day, and on the seventh day it reached 52.50 mm. The pathogenic fungus cultivated in
the presence of the antagonist, the first day had a good growth which reached 20.00 mm. On the succeeding days, the fungus had a very poor growth. On the third observation day a minimum growth of mycelial colony was measured - only 20.50 mm, which remained unchanged until the end of observation on the 7th day. Such a poor growth of the pathogen fungus was due to the antagonistic activity of T. asperellum which inhibited its growth. The growth of fungal colony in the period of seven days after incubation is presented on Graph. 1.
Graph 1. Daily growth of the mycelial colony
On the seventh day of observation, there were no considerable differences in the growth of mycelial colony of the fungi grown in pure culture. In all four trials almost the same results were obtained (Table 2). Phytopathogenic fungus P. debaryanum reached the highest growth with a radius of 55.00 mm. Similar was the development of the antagonist fungus, with 50.00 mm to 55.00
mm radius. The smallest growth was observed in the pathogenic fungus grown in the presence of the antagonist, where the radius of the colony ranged from 15.00 mm in the fourth trial to 25.00 mm in the third trial. In the first and the second trial, the radius of the colony was 22.00 and 20.00 mm, respectively.
Тутун/Tobacco, Vol.62, No 1-6, 36-44, 2012
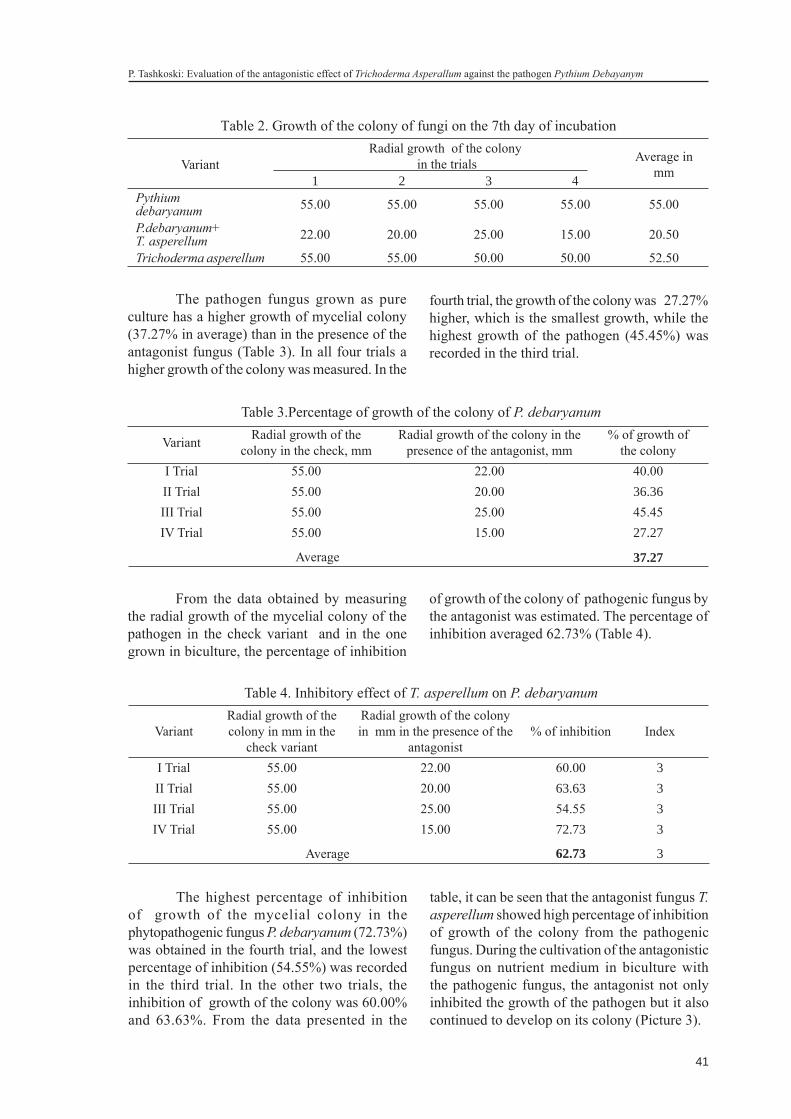
41
The pathogen fungus grown as pure culture has a higher growth of mycelial colony (37.27% in average) than in the presence of the antagonist fungus (Table 3). In all four trials a higher growth of the colony was measured. In the
Тable 2. Growth of the colony of fungi on the 7th day of incubation
VariantRadial growth of the colony
in the trials Average in mm1 2 3 4
Pythium debaryanum 55.00 55.00 55.00 55.00 55.00
P.debaryanum+ T. asperellum 22.00 20.00 25.00 15.00 20.50
Trichoderma asperellum 55.00 55.00 50.00 50.00 52.50
fourth trial, the growth of the colony was 27.27% higher, which is the smallest growth, while the highest growth of the pathogen (45.45%) was recorded in the third trial.
Table 3.Percentage of growth of the colony of P. debaryanum
Variant Radial growth of the colony in the check, mm
Radial growth of the colony in the presence of the antagonist, mm
% of growth of the colony
I Trial 55.00 22.00 40.00II Trial 55.00 20.00 36.36III Trial 55.00 25.00 45.45IV Trial 55.00 15.00 27.27
Average 37.27
From the data obtained by measuring the radial growth of the mycelial colony of the pathogen in the check variant and in the one grown in biculture, the percentage of inhibition
of growth of the colony of pathogenic fungus by the antagonist was estimated. The percentage of inhibition averaged 62.73% (Table 4).
Table 4. Inhibitory effect of T. asperellum on P. debaryanum
VariantRadial growth of the colony in mm in the
check variant
Radial growth of the colony in mm in the presence of the
antagonist % of inhibition Index
I Trial 55.00 22.00 60.00 3II Trial 55.00 20.00 63.63 3III Trial 55.00 25.00 54.55 3IV Trial 55.00 15.00 72.73 3
Average 62.73 3
The highest percentage of inhibition of growth of the mycelial colony in the phytopathogenic fungus P. debaryanum (72.73%) was obtained in the fourth trial, and the lowest percentage of inhibition (54.55%) was recorded in the third trial. In the other two trials, the inhibition of growth of the colony was 60.00% and 63.63%. From the data presented in the
table, it can be seen that the antagonist fungus T. asperellum showed high percentage of inhibition of growth of the colony from the pathogenic fungus. During the cultivation of the antagonistic fungus on nutrient medium in biculture with the pathogenic fungus, the antagonist not only inhibited the growth of the pathogen but it also continued to develop on its colony (Picture 3).
P. Tashkoski: Evaluation of the antagonistic effect of Trichoderma Asperallum against the pathogen Pythium Debayanym
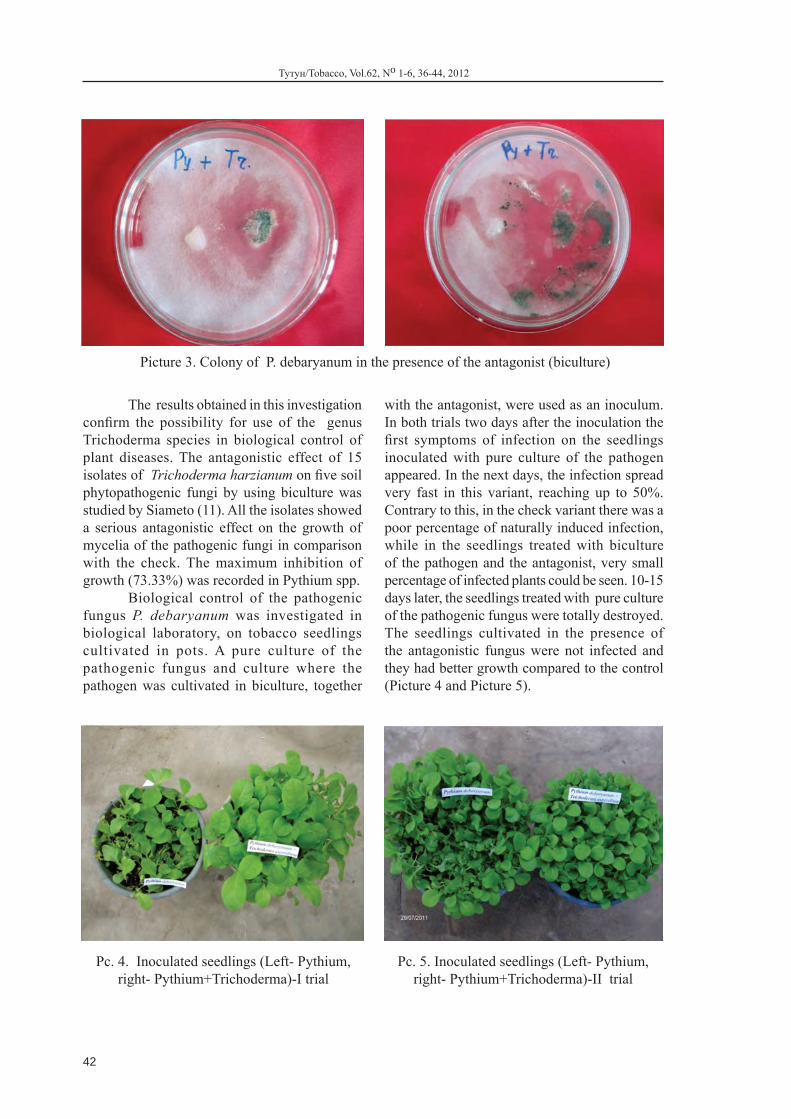
42
The results obtained in this investigation confirm the possibility for use of the genus Trichoderma species in biological control of plant diseases. The antagonistic effect of 15 isolates of Trichoderma harzianum on five soil phytopathogenic fungi by using biculture was studied by Siameto (11). All the isolates showed a serious antagonistic effect on the growth of mycelia of the pathogenic fungi in comparison with the check. The maximum inhibition of growth (73.33%) was recorded in Pythium spp.
Biological control of the pathogenic fungus P. debaryanum was investigated in biological laboratory, on tobacco seedlings cultivated in pots. A pure culture of the pathogenic fungus and culture where the pathogen was cultivated in biculture, together
Picture 3. Colony of P. debaryanum in the presence of the antagonist (biculture)
with the antagonist, were used as an inoculum. In both trials two days after the inoculation the first symptoms of infection on the seedlings inoculated with pure culture of the pathogen appeared. In the next days, the infection spread very fast in this variant, reaching up to 50%. Contrary to this, in the check variant there was a poor percentage of naturally induced infection, while in the seedlings treated with biculture of the pathogen and the antagonist, very small percentage of infected plants could be seen. 10-15 days later, the seedlings treated with pure culture of the pathogenic fungus were totally destroyed. The seedlings cultivated in the presence of the antagonistic fungus were not infected and they had better growth compared to the control (Picture 4 and Picture 5).
Pc. 4. Inoculated seedlings (Left- Pythium,right- Pythium+Trichoderma)-I trial
Pc. 5. Inoculated seedlings (Left- Pythium,right- Pythium+Trichoderma)-II trial
Тутун/Tobacco, Vol.62, No 1-6, 36-44, 2012

43
Two biological control agents, Bacillus subtilis and Trichoderma harzianum, were tested by Maketon et al. (5), alone or in combination, for control of three tobacco diseases (Ralstonia solanacearum, Pythium aphanidermatum and Cercospora nicotiana). The results showed that the two biological agents applied together give higher efficiency, which is equal to chemical treatments in the control of these diseases, than being applied separately. The high efficiency of biofungicides in control of Pythium species has been confirmed in several investigations (6,15). By application of biofungicides on the basis of T. harzianum, the yield of the treated crops was increased for 13% and according to Tran (14), the cultures treated with Trichoderma grow better and give higher yields than the untreated.
The fungus T. harzianum through the product TRI 003, was used in the investigations of Parađiković and co. (9), for control of the pathogens P. debaryanum and R. solani, causing agents of damping off on tomato seedlings, where
better results were achieved than by the use of the standard fungicides Previcur and Dithane. The same product gave higher efficiency in protection of salad seedlings, compared to the standard products (2,3).
In investigations made by Tashkoski (13), Trifender WP based on the fungus T. asperellum achieved 80% efficiency in the protection of tobacco seedlings from the pathogen P. debaryanum grown in protected area.
Analyzing the results obtained by the investigations of tobacco seedlings made in vitro in laboratory conditions and in vivo in proteced area, the fungus T. asperellum was not only a good antagonist inhibiting the growth of the pathogenic fungus colony, but it also appeared to be a real mycoparasite. The antagonistic fungus through its mechanisms of acting - antagonism and predatoriness (mycooparasitism), inhibited the infestation of tobacco seedlings by the pathogenic fungus P. debaryanum.
Phytopathogenic fungus P. debaryanum cultivated as pure culture on potato-dextrose agar as a nutrient medium has 37,27% faster growth than when cultivated in the presence of the antagonist.
The fungus T. asperellum showed high antagonistic activity upon the growth of mycelial colony of the pathogenic fungus. The percentage of inhibition of growth of the pathogenic colony was between 54.55% and 72.73%, or 62.73% in average.
The tobacco seedling inoculated with pure culture of the pathogenic fungus was completely destroyed, while the seedlings
inoculated with culture of the pathogen cultivated in the presence of antagonist the percentage of infected plants was very low. Seedlings cultivated in the presence of the antagonistic fungus were not infected by the pathogen and they had a better growth and development in comparison to the control.
The fungus T. asperellum appeared to be a real antagonist and mycoparasite of the phytopathogenic fungus P. debaryanum, which can be used in the future, through biological products, for protection of tobacco seedlings in commercial production.
1. Anonymous, 2011. Biopesticidi u svetu. http://www.agroservis.rs/biopesticidi u svetu. Agroservis, informativna agencija, noemvri.
2. Baličević R., Parađiković N., Ćosić J., Rozman V., 2008. Suzbijanje zemljišnih parazita (Pythium debaryanum, Rhizoctonia solani) na salati biološkim pripravkom. 43. Hrvatski i 3. međunarodni
simpozij agronoma, Opatija, Hrvatska, Zbornik radova 465-468.
3. Baličević R., Parađiković N., Ćosić J., Vrandečić K., Šamota D., 2009. Utjecaj supstrata na biološku zaštitu presadnica salate protiv patogena Rhizoctonia solani i Pythium debaryanum. 44. Hrvatski i 4. međunarodni simpozij agronoma, Opatija, Hrvatska, Zbornik radova 407-410.
CONCLUSION
REFERENCES
P. Tashkoski: Evaluation of the antagonistic effect of Trichoderma Asperallum against the pathogen Pythium Debayanym
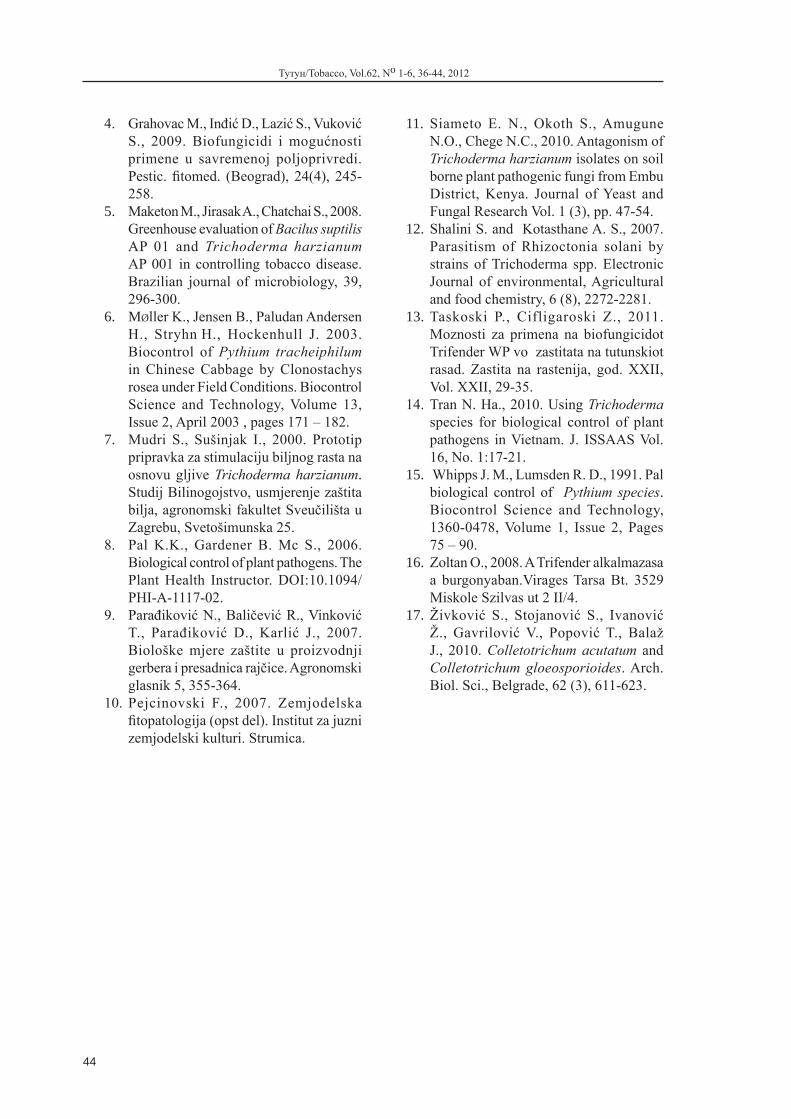
44
4. Grahovac M., Inđić D., Lazić S., Vuković S., 2009. Biofungicidi i mogućnosti primene u savremenoj poljoprivredi. Pestic. fitomed. (Beograd), 24(4), 245-258.
5. Maketon M., Jirasak A., Chatchai S., 2008. Greenhouse evaluation of Bacilus suptilis AP 01 and Trichoderma harzianum AP 001 in controlling tobacco disease. Brazilian journal of microbiology, 39, 296-300.
6. MØller K., Jensen B., Paludan Andersen H., Stryhn H., Hockenhull J. 2003. Biocontrol of Pythium tracheiphilum in Chinese Cabbage by Clonostachys rosea under Field Conditions. Biocontrol Science and Technology, Volume 13, Issue 2, April 2003 , pages 171 – 182.
7. Mudri S., Sušinjak I., 2000. Prototip pripravka za stimulaciju biljnog rasta na osnovu gljive Trichoderma harzianum. Studij Bilinogojstvo, usmjerenje zaštita bilja, agronomski fakultet Sveučilišta u Zagrebu, Svetošimunska 25.
8. Pal K.K., Gardener B. Mc S., 2006. Biological control of plant pathogens. The Plant Health Instructor. DOI:10.1094/PHI-A-1117-02.
9. Parađiković N., Baličević R., Vinković T., Parađiković D., Karlić J., 2007. Biološke mjere zaštite u proizvodnji gerbera i presadnica rajčice. Agronomski glasnik 5, 355-364.
10. Pejcinovski F., 2007. Zemjodelska fitopatologija (opst del). Institut za juzni zemjodelski kulturi. Strumica.
11. Siameto E. N., Okoth S., Amugune N.O., Chege N.C., 2010. Antagonism of Trichoderma harzianum isolates on soil borne plant pathogenic fungi from Embu District, Kenya. Journal of Yeast and Fungal Research Vol. 1 (3), pp. 47-54.
12. Shalini S. and Kotasthane A. S., 2007. Parasitism of Rhizoctonia solani by strains of Trichoderma spp. Electronic Journal of environmental, Agricultural and food chemistry, 6 (8), 2272-2281.
13. Taskoski P., Cifligaroski Z., 2011. Moznosti za primena na biofungicidot Trifender WP vo zastitata na tutunskiot rasad. Zastita na rastenija, god. XXII, Vol. XXII, 29-35.
14. Tran N. Ha., 2010. Using Trichoderma species for biological control of plant pathogens in Vietnam. J. ISSAAS Vol. 16, No. 1:17-21.
15. Whipps J. M., Lumsden R. D., 1991. Pal biological control of Pythium species. Biocontrol Science and Technology, 1360-0478, Volume 1, Issue 2, Pages 75 – 90.
16. Zoltan O., 2008. A Trifender alkalmazasa a burgonyaban.Virages Tarsa Bt. 3529 Miskole Szilvas ut 2 II/4.
17. Živković S., Stojanović S., Ivanović Ž., Gavrilović V., Popović T., Balaž J., 2010. Colletotrichum acutatum and Colletotrichum gloeosporioides. Arch. Biol. Sci., Belgrade, 62 (3), 611-623.
Тутун/Tobacco, Vol.62, No 1-6, 36-44, 2012

45
UDC 633.71Тутун/Tobacco, Vol.62, No 1-6, 45-48, 2012University “St. Kliment Ohridski” - BitolaScientific Tobacco Institute – Prilep, R. Macedonia
ISSN 0494-3244
UDK: 633.71-157.4:632.954(497.2)”2007/08”Original scientific paper
INFLUENCE OF OXYFLUORFEN ON SOME ANATOMIC INDICES IN THE LEAVES OF VIRGINIA TOBACCO PLANT (NICOTIANA TABACUM L.)
Hristo Anastasov, Shteliyana Kalinova
Agricultural University, 4000 Plovdiv, Bulgaria, E-mail: [email protected]
ABSTRACT
The oxyfluorfen was applied at a dose of 80ml/dka and 100ml/dka 72 hours before the process of tobacco planting. During the vegetation period some visible signs of phytotoxicity in the crop were observed – plant growth inhibition, deformation of leaves and vegetation tip, weak chlorosis, etc. For the purpose of determining the herbicide influence on the tobacco leaf anatomy, several fixed samples from the leaves’ middle sections were taken as well. The following indices were taken into consideration – stomata number/mm2 and stomata size (μm) from the upper and lower epidermis, size of assimilation parenchyma (mesophyll) in a leaf. It was established that oxyfluorfen caused considerable changes in the tobacco leaf anatomy, which were expressed in reduction of stomata number/mm2, and increase of the thickness of leaf lamina (blade), compared to those in the non-treated control plants.
Keywords: oxyfluorfen, phytotoxicity, tobacco leaf anatomy, stomata number/mm2, mesophyll
ВЛИЈАНИЕ НА ОКСИФЛУОРФЕНОТ НА НЕКОИ АНАТОМСКИ ПОКАЗАТЕЛИ ВО ЛИСТОВИТЕ ОД ВИРЏИНИСКИОТ ТУТУН
Оксифлуорфенот е примент во доза од 80ml/декар и 100ml/декар 72 часа пред садењето на тутунот. За време на вегетациониот период забележани се некои видливи знаци на фитотоксичност– инхибирање на порастот на растението, деформации на листовите и вегетативнит врв, слаба хлороза, итн. За одредување на влијанието на хербицидот врз градбата на тутунскиот лист, земени се и неколку фиксирани лисни примероци од средните сектори на листовите. Разгледувани се следниве показатели: број на стоми/mm2 и големина на стомите (μm) од горниот и долниот епидерм, големината на асимилациониот паренхим (мезофил) на листот. Утврдено е дека оксифлуорфенот го редуцира бројот на стоми/mm2 и зголемување на дебелината на лисната плојка, во споредба со нетретираните контролни растенија.
Клучни зборови: оксифлуорфен, фитотоксичност, градба на тутунскиот лист, број на стоми/mm2, мезофил

46
The negative influence of herbicides on crops in modern intensive agriculture is a topic of a number of studies which reveal crop changes emerging as a result of exposure to the effects of chemicals. The in-depth analysis of these changes involves studying the modifications in their anatomy which leads to changes on biochemical and physiological level, and the visible signs of these changes are the morphological anomalies observed in the plants.
Oxyfluorfen reduces the content of chloroplasts in the cells of the assimilation
parenchyma of leaves, and this has an adverse effect on the biochemical and physiological processes in plants (2, 4, 7, 8, 9, 16, 17). The photosynthesis, transpiration, and gas exchange disruptions are expressed in delayed plant growth and development, and frequently, this is a contributing factor to plant death (1, 3, 5, 6, 10, 11, 12, 13, 14, 15, 17).
The purpose of this study was to determine the influence of oxyfluorfen on some anatomic indicators in the leaves of the Virginia tobacco plant.
vegetation tip deformation, weak chlorosis, etc.For the purpose of determining the
effects of the herbicide on tobacco leaf anatomy, samples from the midsection of the leaves of the damaged plants and from the untreated control plants were taken and fixed in 70% Ethanol. To examine the anatomic indicators, an Amplival light microscope was used. The indicators taken into consideration were stomata number/mm2 and stomata size (μm) from the upper and lower epidermis, and size of the assimilation parenchyma (mesophyll) of the leaf – all at a combined magnification of 400 X (10 X ocular and 40 X objective).
In the period 2007-2008, at the Markovo village testing grounds of the Tobacco and Tobacco Products Institute in Plovdiv, in humus-carbonate soil, a field experiment was set up to determine the biological effectiveness and selectivity of some soil herbicides used in growing Virginia tobacco plants. One of them was the Goal 2E herbicide with active ingredient oxyfluorfen 24%.
Oxyfluorfen was applied in a dose of 80 ml/dka and 100 ml/dka 72 hours before the process of tobacco planting.
During the vegetation period, some visible signs of phytotoxicity in the crop were observed – plant growth inhibition, leaf and
The leaf of tobacco plant (Nicotiana tabacum L.) is dorsoventral. The stomata are located on both sides of the leaf, characterizing it as amphistomatic. The basic epidermal cells are more or less isodiametric in shape, with undulated, curvy anticlinal walls. The stomatal complex is of the anomocytic type (lacking differentiated subsidiary cells), in which the stomata-surrounding cells are indistinguishable from the other epidermal cells, and the guard cells are bean-shaped.
The mesophyll is heterogeneous, represented by palisade (columnar) and loosely packed (spongy) parenchyma. The palisade parenchyma is in two rows and is located directly underneath the upper epidermis of
the leaf. The spongy parenchyma consists of dispersedly situated, isodiametrically shaped parenchyma cells, interspersed with larger or smaller intercellular spaces, which are frequently connected to the stomata on lower epidermis of the leaf. Data on the influence of oxyfluorfen on some anatomic indicators in the leaves of broadleaf tobacco plant are given in Table 1. As a result of the herbicide action, the thickness of the assimilation parenchyma in the leaves of the treated plants increases. Regarding the palisade parenchyma, the highest values – (112.5)134.6±1.8(150) μm are observed in the lower dose of 80 ml/dka, in which the size of the columnar parenchyma is greater than the one measured in the 100 ml/dka dose.
INTRODUCTION
MATERIAL AND METHODS
RESULTS AND DISCUSSION
Тутун/Tobacco, Vol.62, No 1-6, 45-48, 2012

47
In the case of spongy parenchyma, the increase is the largest in the higher herbicide dose of 100 ml/dka, with recorded values of (100)190.1±3.7(212.5) μm. The degree to which the mesophyll in the leaves of treated plants increases is different in comparison to that of the control plants, and it encompasses the differences, both in terms of assimilation parenchyma and in terms of preparation dosage, and therefore, this is the cause for lamina deformation due to uneven growth of their palisade and spongy parenchyma.
Oxyfluorfen causes a reduction in the number of stomata per mm2 of the upper (adaxial) and the lower (abaxial) leaf epidermis of the treated plants. The lowest number of stomata per mm2 – (50)57.8±1.2(66.7) for the upper and (83.3)90.5±1.2(100) for the lower epidermis were recorded in plants treated with 80 ml/dka
Table 1. Influence of oxyfluorfen on some anatomic indices in the leaves of Virginia tobacco
Indexes (min) % ±S % (max) (min) v ±S % (max) (min) x ±S x (max)
Variants non treated treated - 80 ml/dka treated - 100 ml/dka
leaf parenchyma (mesophyll), um
palisade parenchyma
(100)114±1.2(125) (1 12.5)134.6±1.8(150) (100)124.3±2.0(145)
spongy parenchyma
(150)165±1.3(180) (170)188.1±1.6(202.5) (100)190.1±3.7(212.5)
upper epidermis stomata
number/mm2 (58.3)75±1.54(83.3) (50)57.8±1.2(66.7) (41.7)65.5±2.7(91.7)
length, um (35)38±0.5(42.5) (27.5)37.2±0.6(42.5) (25)31.5±0.8(40)
width, um (20)21.3*0.23(22.5) (25)26.8±0.4(30) (12.5)I9.7±0.8(30)
lower epidermis stomata
number/mm2 (108.3)150.2±3.58(183.3) (83.3)90.5± 1.2(100) (108.3)137.5±2.5(166.6)
length, um (32.5)35.6±0.3(37.5) (32.5)36.4±0.4(40) (20)28.25±1.1(40)
width, um (20)22±0.4(25) (20)24.3±0.4(27.5) (20)23.3±0.5(27.5)
herbicide. In plants treated with higher dose of 100 ml/dka, some increase in the stomata number is observed. both in the adaxial epidermis – (41.7)65.5±2.7(91.7) stomata/mm2 and in the abaxial epidermis – (108.3)137.5±2.5(166.6) stomata/mm2, but these results are lower than those recorded in untreated plants. In plants treated with 100 ml/dka herbicide, there are deformed stomata noticeable on the upper epidermis of the leaf, as well as stomata with only one guard cell, which has an adverse effect on their transpiration and gas exchange processes. The reduction in the number of stomata in plant leaves, the atrophy of the lamina and the ineffective functioning of the stomata complex are the cause for growth and development inhibition of treated plants.
Oxyfluorfen causes an increase in thickness of the assimilation parenchyma, lamina deformation, reduction of the stomata number/
mm2, and atrophy of the guard cells of stomata in the leaves of Virginia tobacco.
CONCLUSION
H. Anastasov: Influence of oxyfluorfen on some anatomic indices in the leaves of Virginia tobacco plant (Nicotiana tabacum L.)
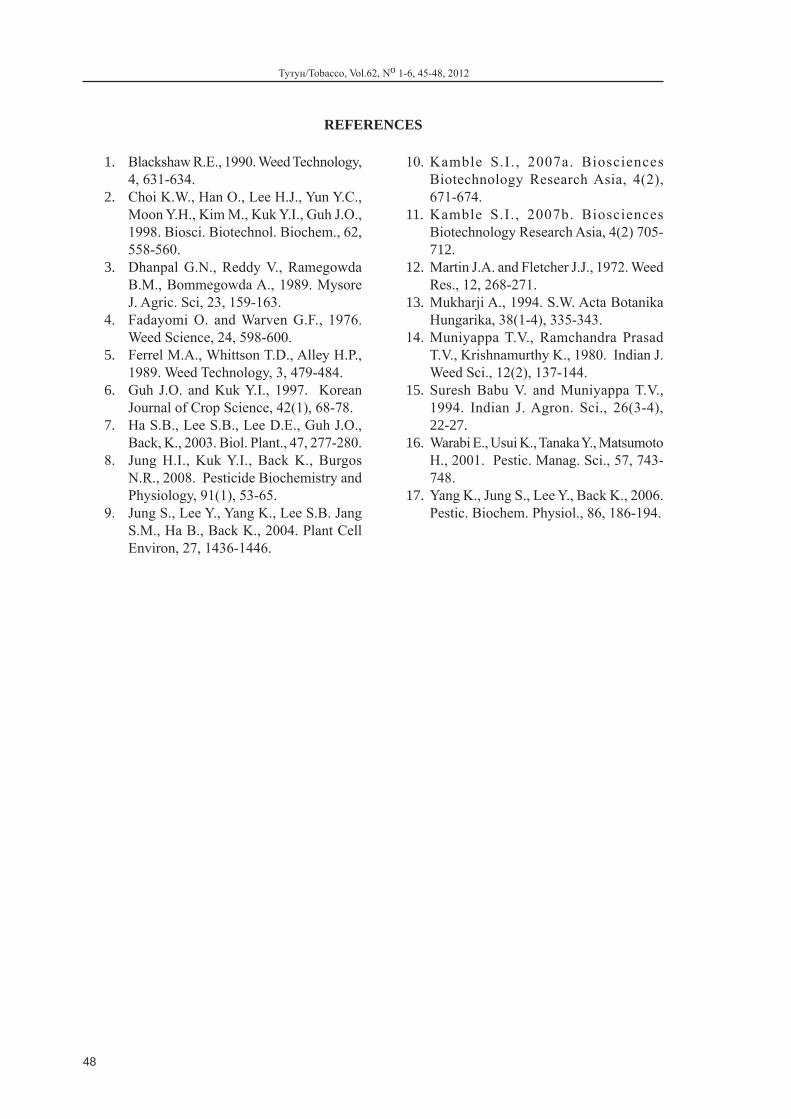
48
1. Blackshaw R.E., 1990. Weed Technology, 4, 631-634.
2. Choi K.W., Han O., Lee H.J., Yun Y.C., Moon Y.H., Kim M., Kuk Y.I., Guh J.O., 1998. Biosci. Biotechnol. Biochem., 62, 558-560.
3. Dhanpal G.N., Reddy V., Ramegowda B.M., Bommegowda A., 1989. Mysore J. Agric. Sci, 23, 159-163.
4. Fadayomi O. and Warven G.F., 1976. Weed Science, 24, 598-600.
5. Ferrel M.A., Whittson T.D., Alley H.P., 1989. Weed Technology, 3, 479-484.
6. Guh J.O. and Kuk Y.I., 1997. Korean Journal of Crop Science, 42(1), 68-78.
7. Ha S.B., Lee S.B., Lee D.E., Guh J.O., Back, K., 2003. Biol. Plant., 47, 277-280.
8. Jung H.I., Kuk Y.I., Back K., Burgos N.R., 2008. Pesticide Biochemistry and Physiology, 91(1), 53-65.
9. Jung S., Lee Y., Yang K., Lee S.B. Jang S.M., Ha B., Back K., 2004. Plant Cell Environ, 27, 1436-1446.
10. Kamble S.I. , 2007a. Biosciences Biotechnology Research Asia, 4(2), 671-674.
11. Kamble S.I., 2007b. Biosciences Biotechnology Research Asia, 4(2) 705-712.
12. Martin J.A. and Fletcher J.J., 1972. Weed Res., 12, 268-271.
13. Mukharji A., 1994. S.W. Acta Botanika Hungarika, 38(1-4), 335-343.
14. Muniyappa T.V., Ramchandra Prasad T.V., Krishnamurthy K., 1980. Indian J. Weed Sci., 12(2), 137-144.
15. Suresh Babu V. and Muniyappa T.V., 1994. Indian J. Agron. Sci., 26(3-4), 22-27.
16. Warabi E., Usui K., Tanaka Y., Matsumoto H., 2001. Pestic. Manag. Sci., 57, 743-748.
17. Yang K., Jung S., Lee Y., Back K., 2006. Pestic. Biochem. Physiol., 86, 186-194.
REFERENCES
Тутун/Tobacco, Vol.62, No 1-6, 45-48, 2012
49
CHANGES IN THE MORPHOLOGY OF THE FUNGUS ALTERNARIA ALTERNATA IN THE TRANSMISSION FROM NATURAL IN
ARTIFICIAL CONDITIONS OF CULTIVATION
Biljana Gveroska, Ilija Risteski, Karolina Kochoska
University “St. Kliment Ohridski”- Bitola,Scientific Tobacco Institute, Kichevski pat, bb. 7500 Prilep, R. Macedonia
E-mail: [email protected]
ABSTRACT
Ecological factors have great influence on the development of the pathogen, but they also influence it’s morphology. The aim of these study was to make morphological measurements of the fungus Alternaria alternata - causing agent of the brown spot disease, which develops on infected tobacco leaves and than in a pure culture, in order to determine the changes in morphology created during the change of conditions for development.
With microscopic measurements it was determined that the fungus which develops upon an infected vegetative material forms hyphae with smaller width than when it develops in pure culture. During the transition in artificial conditions, the conidiophores get smaller width and lartger length. The conidia in a pure culture have smaller dimensions than those of the infected leaves and the maximum number of all septa is smaller.
Key words: Alternaria аlternata, tobacco, morphology, changes
ПРОМЕНИ ВО МОРФОЛОГИЈАТА НА ГАБАТА ALTERNARIA ALTERNATA ПРИ ПРЕНЕСУВАЊЕ ОД ПРИРОДНИ ВО ВЕШТАЧКИ
УСЛОВИ НА ОДГЛЕДУВАЊЕ
Еколошките фактори имаат големо влијание врз развојот на патогенот, но исто така влијаат и врз неговата морфологија. Затоа, целта на овие истражувања беше да се извршат морфолошки мерења на предизвикувачот на болеста кафена дамкавост – габата Alternaria alternata која се развива на инфицирани тутунски листови, а потоа во чиста култура за да се утврдат промените во морфологијата што настануваат при промена на условите за развој.
Со микрoскопските мерења беше утврдено дека габата која се развива врз инфициран растителен материјал формира хифи со помала ширина отколку кога се развива во чиста култура. При премин во вештачки услови конидиофорите добиваат помала ширина, но поголема должина. Конидиите во чиста култура имаат помали димензии отколку тие врз инфицираните листови, но и максималниот број на сите септи е помал.
Клучни зборови: Alternaria alternata, тутун, морфологија, промени
UDC 633.71Тутун/Tobacco, Vol.62, No 1-6, 49-57, 2012University “St. Kliment Ohridski” - BitolaScientific Tobacco Institute – Prilep, R. Macedonia
ISSN 0494-3244
UDK: 632.488.43:633.71(497.7)633.71-248.843(497.7)
Original scientific paper

50
The reduction of the yield in most of the diseases caused by the fungi of the gender Alternaria can be caused by reduction of the photosynthetic activity, direct attack of the patho-gen, decrease of the quality of the product or a combination of those mechanisms (Rotem, 1994).
Alternaria alternata is a cause of the brown spot disease of tobacco. The combination of the ways of acting makes it one of the most important pathogens of tobacco. It attacks all types of tobacco, but the most susceptible are the large-leaf tobacco plants. The damages are mostly connected with the quality of tobacco leaves, but it also damages the smoking features of the tobacco raw material. Except of the time of vegetation, tobacco is a suitable substrate for development of this pathogen at the time of drying and processing of tobacco raw material. This fungus was isolated from the cigarettes, too (Kantor et al., 1979).
Its intensity of attack depends on the cli-mate conditions, the sensitiveness of the type and a lot of other factors during the manufacturing (Gveroska, 2005). But, in the artificial inocula-tions, in a lot of cases, the intensity of attack depends on the choice of the isolate.
According to Otani and Khmoto (1992) and Rotem (1994), A. alternata unites species that create specific toxins which are very patho-genic to certain kinds. Because of that, they sug-gest for them to be qualified as specialized forms of A. alternata. For example, A. alternata f.sp. tabaci which creates AT toxin is a pathogenic of tobacco too.
The morphological variations are typical characteristic of Alternaria species, particularly A. alternata (Rotem, 1994; Slavov, 2004). But, AT toxin is a recognizable factor in patho-system species Nicotiana - Alternaria alternata (Kodama et al., 1990). All the isolates, as well as spores of the nonpathogenic, to which AT toxin was added, cause brown spot to inoculated plants.
Anyway, in field conditions, the resistant types show lower degree of resistance compared to the artificial inoculation with AT toxin, because Alternaria fungi can attack the cells during the penetration through the damages of wind, rain etc. That is why the in vitro selection is not always the best choice (Ishida, 1992). There is also differ-ence in the conditions that influence sporulation and the size of the conidia too. The sporulation in natural conditions is created on green leaves, in the presence of water, and big influence has the relative humidity (Akimitsu, 2003).
The knowledge of morphology is important because there can be change in the pathogenicity of the isolates in cultivation of a culture, accompanied with a change in morphol-ogy of the conidia (Sobers and Doupnik, 1968). It is also necessary for the right methodological approach in all the investigations on the morphol-ogy, pathogenic features and the epidemiology of the disease.
The aim of this research was to give data for the morphology of the pathogen A. alternate in natural conditions, i.e. on infected tobacco leaves, and than in a pure culture, in order to confirm the possible changes of the morphology.
INTRODUCTION
MATERIAL AND METHODS
Because of the fact that the large-leaf tobacco plants are characterized with higher susceptibility to brown spot disease, the isolates obtained from 5 large-leaf types, three of which were Virginia (V 12, V 13 and V 22) and two Burley (B 36 and B 98). The choice of the types was random. Infected tobacco leaves with char-acteristic symptoms of the disease were collected. Parts of the leaves with spots were kept in Petri dishes with wet filter paper for 48 hours.
The material from the surface of leaf spots was taken with a sterile needle and 5
microscopic preparations were prepared for every isolate. 25-30 samples randomly chosen during the microscoping were analyzed in each preparation. The same procedure was applied in investigation of the morphology of the fungus in a pure culture,
After all the measurements of the fresh material were made, it was approached towards getting pure cultures. First parts of the infected tissue were placed on wet agar. After the develop-ment of the colony, small fragments were sowed again on potato-dextrose agar. The received pure
Тутун/Tobacco, Vol.62, No 1-6, 49-57, 2012

51
cultures were incubated in a thermostat of 25 degrees. Morphological measurements of the fungus were made on a 15-days pure culture.
The morphology of the fungus was stud-ied by analyzis of microscopic measurements of the hyphae width and the conidiophores and conidia size (length and width). Determination
(counting) of the diagonal, lengthwise and in-clined septa was also made.
The measurements were made by ocular micrometer, after previously gauging and deter-mination of the factor of appropriate increase according to the method of Ziberoski (1998).
RESULTS AND DISCUSSION
The pathogenic fungus A.alternata is a cause of the brown spot disease on tobacco in R. Macedonia (Gveroska, 2005) The disease got its name after the specific symptoms, i.e. appearance of brown spots on leaf surface. It can penetrate directly through the tissue. The secondary hyphae starts to develop after 49-72 hours mainly in substomic space, progresses towards the spongy parenchyma and continues to spread towards the palisade parenchyma, creating necrotic tissue
(Sami Saad and Hagedorn, 1969). During the spreading of the infection, in the centre of the spots, the organs of the pathogen are developing, and concentric rings are created around them. A yellowish, chlorine belt is created around the spots (Figure 1).
By isolation of the pathogen from the spots of the infected tobacco leaves we got pure culture of the fungus (Figure 2).
Figure 1. A. alternata - spots on infectedtobacco leaf
Figure 2. A. alternata - pure culture
The hyphae of the fungus A. alternata which develop in the spots of the infected tobacco leaves are 2.00-5.20 µm wide, or 3.19µm in av-erage. When they develop in pure culture, their width is increased and ranges 2.80 - 6.00 µm, or 3.87 µm in average. The biggest increase of width can be noticed in the isolate B36 (Table 1).
In natural conditions, because of the larger conidia, the hyphae are less noticeable than in pure culture. They are satirized, branch
laterally under different angle, they are colorless or they have light brown color (Figure 3).
The width of conidiophores of the fungus of the infected leaves is between 2.00 and 8.00 µm, and the length from 4.00 to 56.00µm, with an average value of the size 4.04 х 25.12µm. Co-nidiophores of the isolate B36 have the smallest, and those of the isolate V22 the biggest dimen-sions (Table 2).
B. Gveroska: Changes in the morphology of the fungus Alternaria Alternata in the transmission from natural in artificial conditions of cultivation
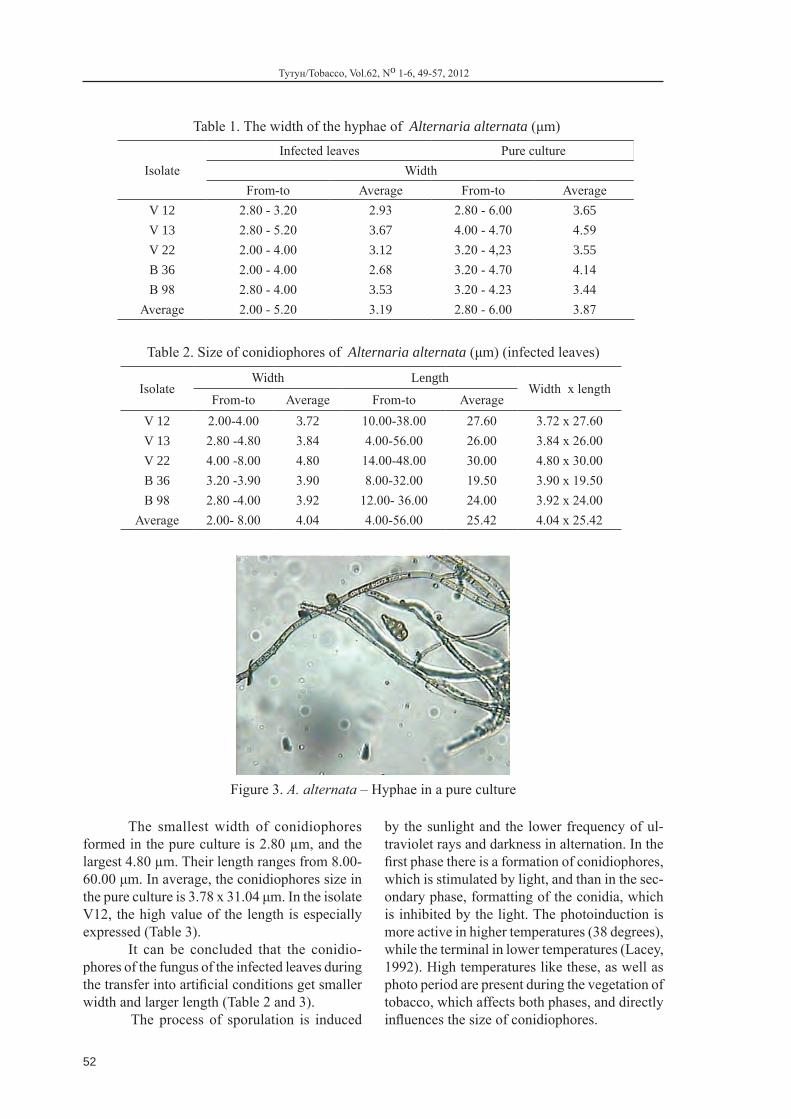
52
Table 2. Size of conidiophores of Alternaria alternata (μm) (infected leaves)
IsolateWidth Length
Width х lengthFrom-to Average From-to Average
V 12 2.00-4.00 3.72 10.00-38.00 27.60 3.72 х 27.60V 13 2.80 -4.80 3.84 4.00-56.00 26.00 3.84 х 26.00V 22 4.00 -8.00 4.80 14.00-48.00 30.00 4.80 х 30.00B 36 3.20 -3.90 3.90 8.00-32.00 19.50 3.90 х 19.50B 98 2.80 -4.00 3.92 12.00- 36.00 24.00 3.92 х 24.00
Average 2.00- 8.00 4.04 4.00-56.00 25.42 4.04 х 25.42
The smallest width of conidiophores formed in the pure culture is 2.80 µm, and the largest 4.80 µm. Their length ranges from 8.00-60.00 μm. In average, the conidiophores size in the pure culture is 3.78 х 31.04 μm. In the isolate V12, the high value of the length is especially expressed (Table 3).
It can be concluded that the conidio-phores of the fungus of the infected leaves during the transfer into artificial conditions get smaller width and larger length (Table 2 and 3).
The process of sporulation is induced
Table 1. The width of the hyphae of Alternaria alternata (μm)
IsolateInfected leaves Pure culture
Width From-to Average From-to Average
V 12 2.80 - 3.20 2.93 2.80 - 6.00 3.65V 13 2.80 - 5.20 3.67 4.00 - 4.70 4.59V 22 2.00 - 4.00 3.12 3.20 - 4,23 3.55B 36 2.00 - 4.00 2.68 3.20 - 4.70 4.14B 98 2.80 - 4.00 3.53 3.20 - 4.23 3.44
Average 2.00 - 5.20 3.19 2.80 - 6.00 3.87
Figure 3. A. alternata – Hyphae in a pure culture
by the sunlight and the lower frequency of ul-traviolet rays and darkness in alternation. In the first phase there is a formation of conidiophores, which is stimulated by light, and than in the sec-ondary phase, formatting of the conidia, which is inhibited by the light. The photoinduction is more active in higher temperatures (38 degrees), while the terminal in lower temperatures (Lacey, 1992). High temperatures like these, as well as photo period are present during the vegetation of tobacco, which affects both phases, and directly influences the size of conidiophores.
Тутун/Tobacco, Vol.62, No 1-6, 49-57, 2012

53
Conidiophores of the fungus of natural substrate in artificial conditions of cultivation are shown in Figures 4 and 5.
Table 3. Size of conidiophores of Alternaria alternata in pure culture (μm)
Isolate Width LengthWidth х Length
From-to Average From-to Average
V 12 2.80-4.00 3.72 16.00-60.00 36.20 3.72 х 60.00V 13 3.20 -4.80 3.92 12.00-32.00 23.00 3.92х 23.00V 22 3.20 -4.00 3.73 16.00-36.00 24.67 3.73х 24.67B 36 3.20 -4.00 3.82 20.00 - 60.00 36.67 3.82 х 36.67B 98 3.20 -4.00 3.73 8.00 - 44.00 34.67 3.73 х 34.67
Average 2.80- 4.80 3.78 8.00 -60.00 31.04 3.78 х 31.04
Figure 4. A. alternata – Conidiophores from spots of infected leaves
Figure 5. A. alternata – Conidiophores in pure culture
The width of conidia from the fungus formed on infected tobacco leaves is between 8.00 and 20.00 µм and the average value is 14.12 µm. The largest is the width of the conidia of B36 isolate. The length has the largest range between 28.00 and 84.00µm, and the average is 55.90µm. The conidia of the isolate V12 are characterized by their length, and they are almost twice the length of the conidia of other isolates (Table 4).
The average values of the conidia formed on the infected leaves are 14.12 x 55.90µm.
Su and Sun (1981) found polymorphic conidia in the infected tobacco leaves, with gold-en-brown body and light brown to transparent beak, long chain that are sometimes outspread, with diagonal, lengthwise and inclined partitions. Their size is bigger than the size of that from a culture grown on a surface.
Table 4. Size of the conidia of A. alternata (μm)Infected leaves
Isolate Width Length
width х length From-to Average From-to Average
V 12 8.00- 16.00 13.36 48.00 -78.00 81.08 13.36 х 81.08V 13 12.00 -20.00 15.04 42.00 -74.00 52.93 15.04 х 52.93V 22 8.00- 16.00 12.68 44.00 -84.00 56.00 12.68 х 56.00B 36 10.00 -20.00 15.88 28.00 - 54.00 41.07 15.88 х 41.07B 98 10.00 - 20.00 13.64 28.00 - 68.00 48.40 13.64 х 48.40
Average 8.00 - 20.00 14.12 28.00 -84.00 55.90 14.12 х 55.90
B. Gveroska: Changes in the morphology of the fungus Alternaria Alternata in the transmission from natural in artificial conditions of cultivation

54
In our investigations, also, the conidia formed in pure culture are smaller than those of the infected leaves (Table 5, Figure 6 and 7). Their average size is 11.05 x 30.16 µm. According to Misaghi et al (1978), the ecological factors largely change the size of its conidia.
Table 5. Size of the conidia of A. alternate in a pure culture (μm)
Isolate Width Length
width х length From-to Average From-to Average
V 12 8.00 - 16.00 11.30 20.00- 44.00 31.45 11.30 х 31.45V 13 8.00 -14.00 11.24 24.00 -48.00 33.16 11.24 х 33.16V 22 8.00 - 16.00 11.60 17.20 -40.00 27.15 12.00 х 27.15B 36 8.00 - 15.20 10.21 18.00 - 44.00 28.59 10.21 х 28.59B 98 8.00 - 16.00 10.90 22.00 - 48.00 30.45 10.90 х 48.00
Average 8.00 -16.00 11.05 17.20 - 48.00 30.16 11.05 х 30.16
Slavov et al. (2004) say that the size of the conidia, the shape and the segmentation varies depending on the age of the spores, substrate, pH value, the temperature, the humidity and the light. The changes are noticeable even in the same isolate.
The conidia have lower upper limit of the width, and so the average value is smaller. The biggest change can be noticed in the isolate B36, where from the biggest (Table 4), now the conidia have the smallest width (Table 5).
The length is almost twice shorter than of the conidia upon the natural substrate, which can be noticed in the marginal and in the average value too. Significant change, i.e. shortening of the length of the conidia has the isolate V 12; it is shortened for 60%. According to Rotem (1994), the length of the spores is more relevant factor than the width and it contributes for the identification of the pathogen. The same author gives data for the morphological changes of A. alternata of the same tobacco leaf: the length of the conidiophores is 20 to 50 µm, the conidia have 4-6 septa, and they are 11-13 µm and
long 30-86 µm. The values obtained in our investigations correspond with the given values.
According to Ritz (1995), besides the good development of substances with poorer nutritive mediums, reproductive structures of A. alternata have tendency to form on rich medium. The large leaf-tobaccos of the Virginia type are characterized with high content of sugars, which had an influence on the profuse sporulation, as well as on the size of conidia on the infected leaves. In the investigations of Hubballi, (2010), the surface with the extract of a leaf of the hoist had maximum influence on the development of all 15 tested isolates of A. alternate, followed by potato-dextrose surface (KDA). All the isolates sporulated on the KDA too, but they differ in the extent of sporulation, followed by different physiognomy of the colony.
Figure 6. A. alternate-conidia of the spots oninfected leaves
Figure 7.A. alternate- conidia in a pure culture
Тутун/Tobacco, Vol.62, No 1-6, 49-57, 2012

55
The conidia formed on infected tobacco leaves have 2-8 diagonal septa, 0-4 lengthwise and 0-3 inclined septa. In a pure culture they have maximum 6 diagonal, 3 lengthwise and 2 inclined septa. The conidia of the isolate V 13
have the largest number of diagonal septa (8 i.e. 6) on the infected leaves as well as in the pure culture. The isolate V 22 has conidia with the largest number of inclined septa only on the infected leaves (Table 6).
The highest percent of conidia formed on the infected leaves have 3 and 4 diagonal, 1 or 2 lengthwise and they do not have, or have only one inclined septum (Table 7a and b). The percentage of conidia with 3 diagonal septa is the biggest in the isolate B 36. Only the isolate V 13 has conidia with 8 diagonal septa (Table 7a). In the isolate B36, 71.43% of the conidia do not
have inclined septa. The isolate V 22 even with only 10 % is the only one that has conidia with 3 inclined septa (Table 7b). According to Simons (2007), the conidia have 1-7 (very often 3) diagonal and a small number or do not have lengthwise septa at all. In the examination of Kumar (2008), the conidia have 6-7 diagonal and 0-3 lengthwise septa.
IsolateNumber of septa
2 3 4 5 6 7 8% of conidia
V 12 0.00 8.33 16.67 25.00 25.00 16.67 0.00V 13 6.67 26.67 20.00 13.33 13.33 6.67 6.67V 22 0.00 20.00 40.00 20.00 0.00 0.00 0.00B 36 0.00 60.00 26.67 6.67 0.00 0.00 0.00B 98 6.67 26.67 26.67 26.67 6.67 0.00 0.00
Average 2.67 28.34 26.00 18.33 9.00 4.67 1.33
Table 7. The percentage of conidia with different number septa (infected leaves)а) diagonal
b) Lengthwise and inclined
Isolate
Lengthwise Inclined Number of septa
0 1 2 3 4 0 1 2 3% of conidia
V 12 27.27 27.27 27.27 18.18 0.00 63.64 18.18 18.18 0.00V 13 26.67 40.00 20.00 13.33 13.33 60.00 26.67 13.33 0.00V 22 20.00 40.00 30.00 10.00 0.00 40.00 30.00 20.00 10.00B 36 21.43 50.00 28.57 0.00 0.00 71.43 28.57 0.00 0.00B 98 6.67 53.33 13.33 20.00 6.67 60.00 26.67 13.33 0.00
Average 20.41 42.12 23.83 12.31 4.00 59.01 26.02 12.97 2.00
B. Gveroska: Changes in the morphology of the fungus Alternaria Alternata in the transmission from natural in artificial conditions of cultivation
Table 6. Number of septa in the conidia
Isolate Infected leaves Pure culture
Diagonal Lengthwise Inclined Diagonal Lengthwise Inclined V 12 3 - 7 0 - 3 0 - 2 2 - 4 1 - 2 0 - 2V 13 2 - 8 1 - 4 0 - 2 3 - 6 1 - 2 0 - 2V 22 3 - 7 0 - 3 0 - 3 2 - 4 1 - 3 0 - 1B 36 3 - 5 0 - 2 0 - 1 2 - 5 1 - 3 0 - 2B 98 2 - 6 1 - 4 0 - 2 2 - 6 1 - 2 0 - 2
From-to 2 - 8 0 - 4 0 - 3 2 - 6 1 - 3 0 - 2

56
The highest percentage of conidia have 3 and 4 diagonal septa even when they are formed in pure culture. The percentage of separation with 3 diagonal septa in the pure culture is the highest in the isolate V 12. Again, the isolate V 13 has the highest number (6) of diagonal septa (Table 8a).
The highest percentage, i.e. 45.83% of the conidia has lengthwise septum, and in relation to the isolates, the highest percentage was observed in the isolate V 12. The percentage of conidia without inclined septa is very high in all the isolates, as well as their average value (Table 8b).
- A. alternate in natural conditions (spots on tobacco leaves) forms hyphae with an average width of 3.19 μm, while in pure culture they are larger and are 3.87 μm wide.
- Conidiophores formed on infected tobacco leaves have an average size of 4.04х 25.42µm.
- In the transfer in artificial conditions, the conidiophores get smaller width, but larger length. Their dimensions are 3.78 х 31.04µm.
- The average values of the conidia formed on infected leaves are 14.12 х 55.90µm.
- The conidia formed in pure culture are smaller than those formed on the infected leaves.
Their average size is 11.05 х 30.16µm.- The conidia formed on the infected
leaves have 2-8 diagonal septa, 0-4 lengthwise and 0-3 inclined septa. In a pure culture the septaration is smaller, i.e. they have maximum 6 diagonal, 3 lengthwise and 2 inclined septa.
- The highest percentage of conidia formed on the infected tobacco leaves have 3 and 4 diagonal and 1 or 2 lengthwise septae and they have none or only one inclined septum.
- In the pure culture, the highest percentage of the conidia also have 3 and 4 diagonal septa and 1 lengthwise septum. High percentage of them do not have inclined septa.
Table 8. The percentage of conidia with different number septa (pure culture)а) diagonal
IsolateNumber of septa
2 3 4 5 6
% of conidiaV12 13.33 60.00 26.67 0.00 0.00 V 13 0.00 33.33 33.33 0.00 25.00V 22 13.33 6.67 20.00 0.00 0.00B36 31.25 40.00 26.67 6.67 0.00B 98 6.25 37.50 43.75 6.25 6.25
Average 12.83 35.50 30.08 2.58 6.25
b) Lengthwise and inclined
Isolate
Lengthwise inclined Number of septa
0 1 2 3 0 1 2% of conidia
В 12 13.33 66.67 20.00 0.00 80.00 6.67 13.33В 13 25.00 41.67 33.33 0.00 75.00 16.67 8.33В 22 33.33 33.33 26.67 6.67 80.00 20.00 0.00Б 36 18.75 56.25 18.75 6.25 87.50 6.25 6.25Б 98 50.00 31.25 18.75 0.00 50.00 31.25 12.50
Average 28.08 45.83 23.50 2.58 74.50 16.19 8.09
CONCLUSION
Тутун/Tobacco, Vol.62, No 1-6, 49-57, 2012

57
1. Akimitsu K., Peever T., Timmer L.W. 2003. Molecular, ecological and evolutionary approaches to understanding Alternaria diseases of citrus. Molecular Plant Pathology, Vol 4, No. 6, p. 435–446.
2. Gveroska B. 2005. Proucuvanje na bolesta kafena damkavost kaj tutunot predizvikana od Alternaria sp. i moznosti za nejzino suzbivanje vo Republika Makedonija. Univerzitet “Sv. Kliment Ohridski” - Bitola, JNU Institut za tutun - Prilep, doktorska disertacija.
3. Hubballi m., Nakkeeran S., Raguchander T., Anand T., Samiyappan R. 2010. Effect of Environmental Conditions on Growth of Alternaria alternata Causing Leaf Blight of Noni. World Journal of Agricultural Sciences 6 (2), p. 171-177.
4. Ishida Y. 1992. In vitro selection for tobacco cultivar resistant to Alternaria alternata. In: Chelkowski J. and Wisconti A. 1992. Alternaria Biology, Plant Diseases and Metabolities. Elsevier, Amsterdam-London-New York-Tokyo, p. 157-173.
5. Kantor D., Toth-Aranuos I., Perercsenyi E. , 1979. Characterist ics of the microbiological state of tobacco products. Acta Aliment., 1979, 8-1, p.13-24.
6. Kodama M., Suzuki T. Otani H.,&al., 1990. Purification and bioassay of host-selective AT-toxin from Alternaria alternata causing brown spot of tobacco. Nippon Shokubutshu Byori Gakkaiho = Ann. Phytopathol. Soc. Jpn, 56-5, p.628-36.
7. Kumar A. 2008. Studies on leaf blifht of chrysanthemum caused by Alternaria alternata (Fr.) Keissler. University of Agricultural Sciences, Dharwad, India. Master Degree Thesis.
8. Lacey J. 1992. Effects of Environment on growth and mycotoxins production by Alternaria species. In: Chelkowski J. and Wisconti A. 1992. Alternaria Biology, Plant Diseases and Metabolities. Elsevier, Amsterdam-London-New York-Tokyo, p. 381-404.
9. Misaghi I.J., Grogan R.G., Duniway J.M., Kimble K.A., 1978. Influence of Environmental and Culture Media on Spore Morphology of, Pathogenicity and Cultural Characteristics of Alternaria alternata. Phytopathology 68: 29-34.
10. Otani H., Kohmoto K. 1992. Host –specific toxins of Alternaria species. In: Chelkowski J. and Wisconti A. 1992. Alternaria Biology, Plant Diseases and Metabolities. Elsevier, Amsterdam-London-New York-Tokyo, p. 123-156.
11. Rotem J., 1994. The genus Alternaria. APS PRESS. St. Paul, Minnesota.
12. Sami Saad and Hagedorn D.J., 1969. Symptomathology and Epidemiology of Alternaria Leaf Spot of Bean, Phaseolus vulgaris. Phytopathology 59:1530-1533.
13. Simmons E.G. 2007. Alternaria: an identification manual 580. Fungal Databases, Nomenclature and Species Banks, Online Taxonomic Novelties International Mycological Association. www.mycobank.org.
14. Slavov S., Mayama S.,. Atanassov A. 2004. Some aspects of epidemiology of Alternaria alternata tobacco pathotype. Biotechnol. & Biotechnol. Eq. 18/3 p. 85-89.
15. Sobers E.K. and Doupnik Jr., 1969. Morphology, Pathogenicity and Cultural Characteristics of Single Conidium Isolates of Alternar ia longipes . Phytopathology 59: 202-205.
16. Su S.J. and Sun S.K., 1981. Studies on the tobacco brown spot disease in Taiwan. II. The relathionship between conidial morphology and pathogenicity of Alternaria alternata. Bull. Taiwan Tob. Res. Inst. 15, p.99-114.
17. Ritz K. 1995. Growth responses of some soil fungi to spatially heterogeneous nutrients. FEMS Microbiology Ecology, Vol. 16, No 4, p. 269-280.
18. Ziberoski J., 1998. Praktikum po mikrobiologija. Univerzitet Sv. Kliment Ohridski, Zemjodelski fakultet, Skopje.
REFERENCES
B. Gveroska: Changes in the morphology of the fungus Alternaria Alternata in the transmission from natural in artificial conditions of cultivation


![[Erik G. Larsson, Petre Stoica] Space-Time Block](https://img.pdfslide.us/doc/110x75/55cf96a3550346d0338cd1fe/erik-g-larsson-petre-stoica-space-time-block.jpg)