Embed Size (px)
Citation preview
Guidance Bureau
Monthly Review of Tamil Nadu Economy – June 2009. 1
MMoonntthhllyy RReeppoorrtt oonn TTaammiill NNaadduu EEccoonnoommyy ––JJuunnee 22000099
Contents
Agriculture 1
Rainfall 3
Reservoir Position (Water Level) 4
Agricultural Wages 10
Prices 13
State Average Wholesale Prices 16
Wholesale Price Index 17
Consumer Price Index 19
Off-take of Essential Commodities 21
Industries 22
Labour 27
Manpower and Employment 27
Electricity 29
Tax Revenue Collected 31
Distribution of Pattas 33
Number of Documents Registered and Revenue Earned
34
State Income 35

Guidance Bureau
Monthly Review of Tamil Nadu Economy – June 2009. 2
AANN OOVVEERRVVIIEEWW
Gross cropped area during the period April and May 2009 in respect of
Paddy by Kar / Kuruvai / Sornavari Season, Cumbu, Groundnut, Gingell, Sugarcane
and Turmeric have shown a decrease by 22.66%, 16.67%, 31.98%, 8.78%, 28.35%
and 61.54% respectively over the same period of previous year. Cholam, Cotton,
Blackgram and Onion have recorded remarkable increase in area by 52.08%,
20.59%, 65.79 and 14.29% respectively against the status of same month of the
previous year, i.e. May 2008.
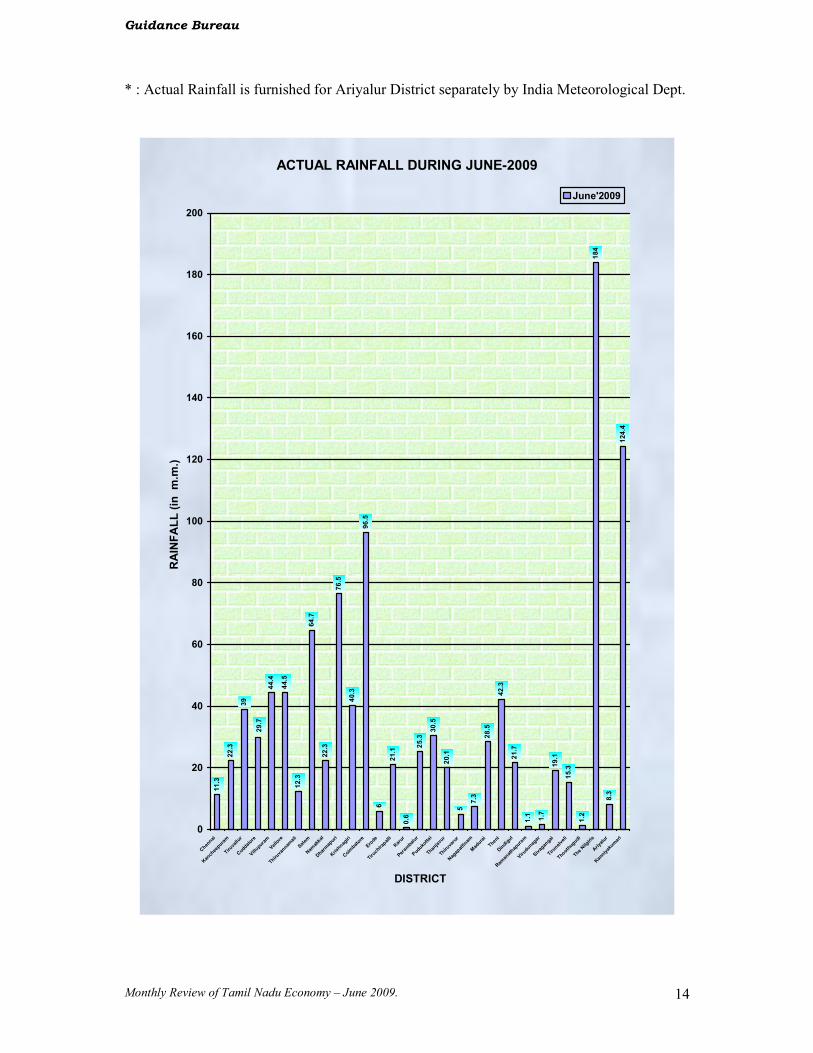
During the month of June-2009, average rainfall of the State is
recorded as 34.0 m.m. against the normal rainfall of 41.9 m.m., whereas it was 46.3
m.m. during the period of June-2008, indicating a negative trend by 26.57%. During
the reporting month, The Nilgiris District have received the highest rainfall of 184.0
m.m. followed by Kanniyakumari District which have received 124.4 m.m. Least
rainfall is recorded in Ramanathapuram District (1.1 m.m.). Almost, all the Districts
of the State have received rainfall ranging from 1.1 m.m. to 184.0 m.m. Comparative
to
month of previous year, the reporting month have recorded less rainfall.
The General Index of Industrial Production for the month of April 2009
registered a positive growth by 2.6% as against the corresponding month of the
previous year. The Index of Industrial Production by Use-based Classification,
Capital Goods and Consumer Non-Durable Goods have shown a healthy increase by
14.0% and 4.7% respectively, whereas all other items have indicated a negative trend.
The Composite Index of Agricultural Wages for the State for the month
of May 2009 exhibited 432 Points, reporting an increase of 4 Points when compared
with the Index Number of the previous month (April 2009). On the other hand, it
manifested 75 Points increase in comparison with May 2008.
Guidance Bureau
Monthly Review of Tamil Nadu Economy – June 2009. 3
Though maximum retail price of fine variety of Boiled rice prevailed at
Rs34.00/kg ,the maximum retail price of common variety of boiled rice prevailed at
Rs25.00/Kg.maximum retail price of Raw rice common variety and fine variety
prevailed at Rs23.00/Kg andRs .00/Kg In the case Redgram dhall and blackgram
dhall maximum retail price stood at Rs68.00 and Rs 60.00/kg respectively. Maximum
retail price of Ground nut oil and Gingelly oil existed at Rs72.00 and Rs115.00/Kg
respectively
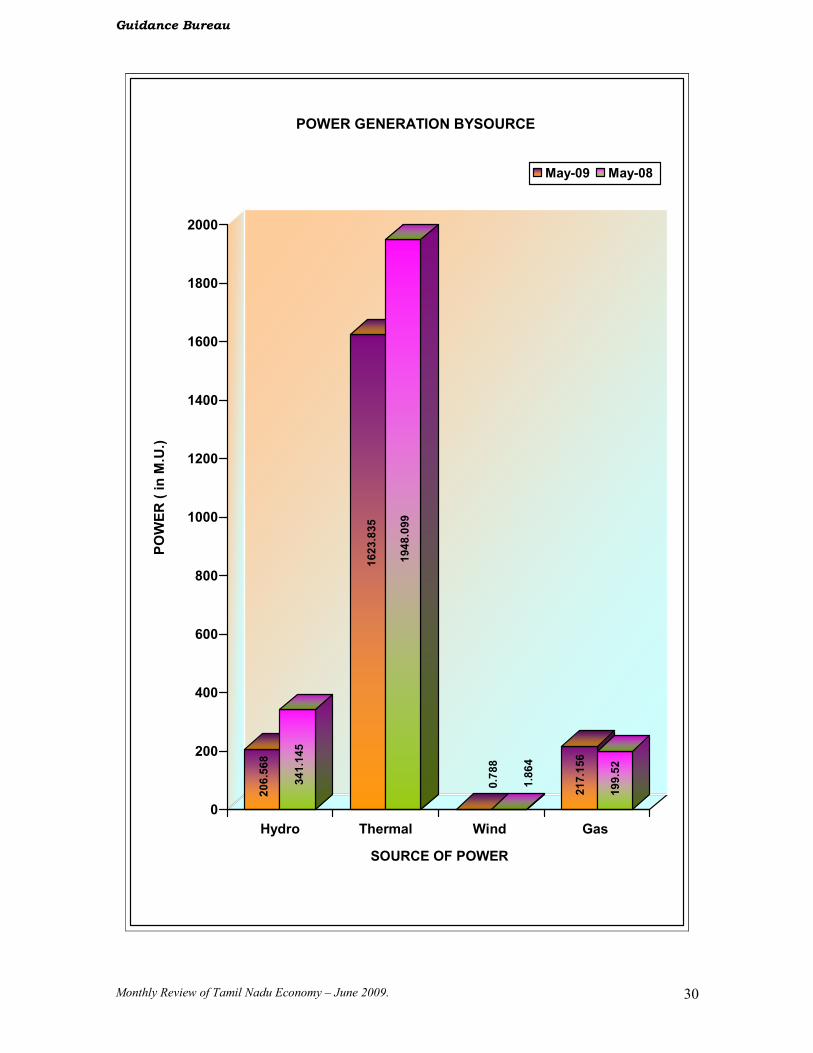
Total Power generated by all sources during the month of May’09 have
manifested downward trend by 17.76%. Whereas, Power Purchased from Traders
have recorded an increase by 10.70% over the period of May’08. Power Generation
by Wind indicates notable decrease from 1.864 M.U. in May 2008 to 0.788 M.U. in
May 2009, marking a negative trend by 57.73%. But the Power Generation from Gas
moved up from 199.52 M.U. in May 2008 to 217.156 M.U. in May 2009, showing an
increase of 8.84 %.
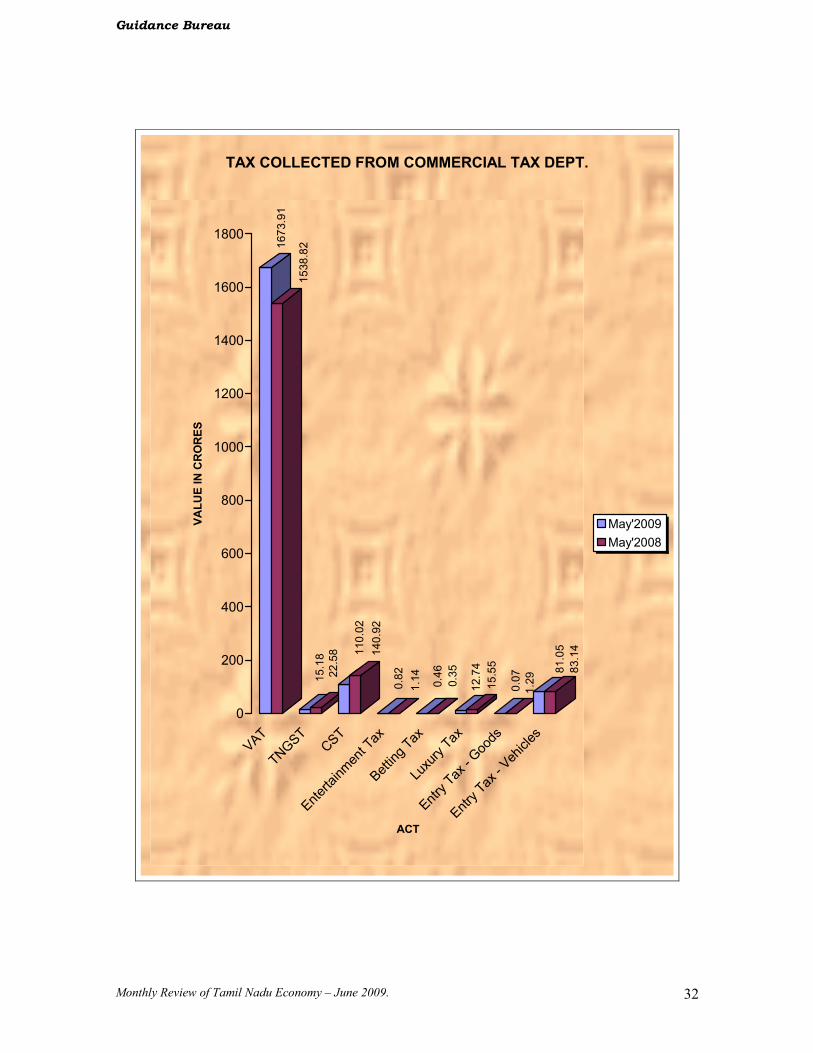
The State’s Tax Revenue Collection by Commercial Taxes Department
during May-2009 is Rs. 1894.25 Crore as against Rs.1803.79 Crore in May-2008
scoring an increase of 5.01%.
Chennai – 600 006, Sd/- xxxxxx
Dated :17 .07.2009. Principal Secretary and Director.
Guidance Bureau
Monthly Review of Tamil Nadu Economy – June 2009. 4
SSEELLEECCTT EECCOONNOOMMIICC II NNDDIICCAATTOORRSS OOFF TTHHEE SSTTAATTEE
Sl.
No. Factors Trend
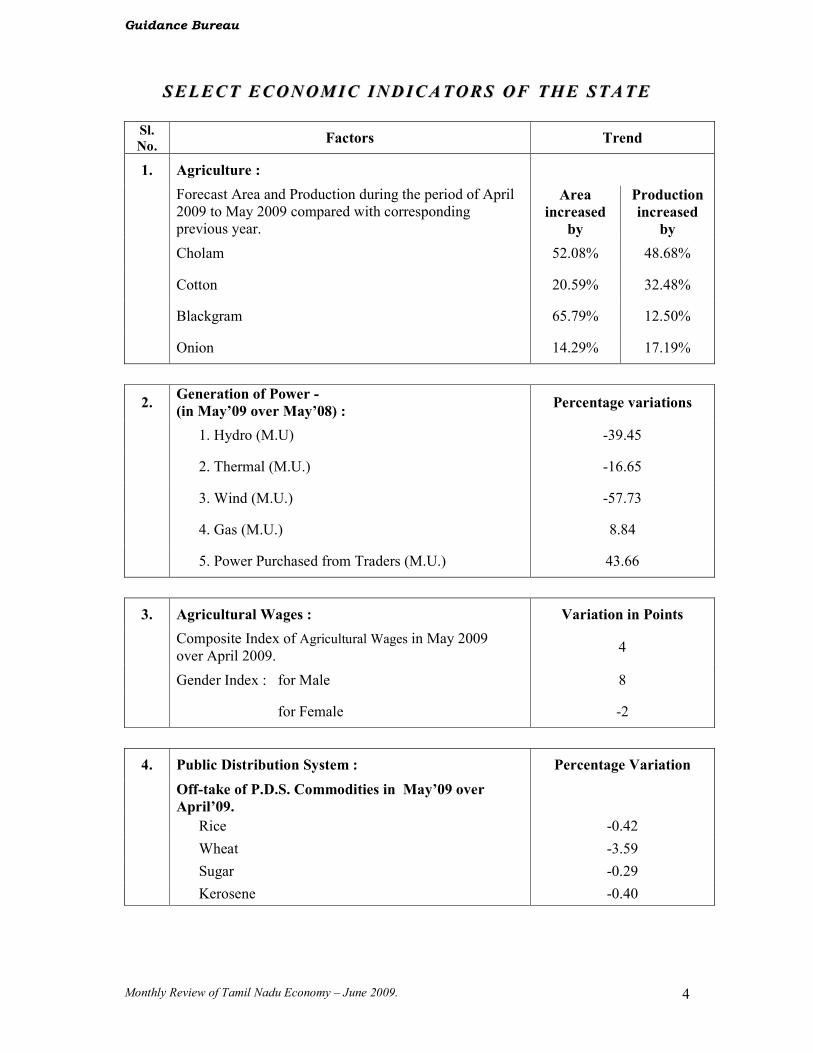
1. Agriculture :
Forecast Area and Production during the period of April 2009 to May 2009 compared with corresponding previous year.
Area
increased
by
Production
increased
by
Cholam 52.08% 48.68%
Cotton 20.59% 32.48%
Blackgram 65.79% 12.50%
Onion 14.29% 17.19%
2. Generation of Power -
(in May’09 over May’08) : Percentage variations
1. Hydro (M.U) -39.45
2. Thermal (M.U.) -16.65
3. Wind (M.U.) -57.73
4. Gas (M.U.) 8.84
5. Power Purchased from Traders (M.U.) 43.66
3. Agricultural Wages : Variation in Points
Composite Index of Agricultural Wages in May 2009 over April 2009.
4
Gender Index : for Male 8
for Female -2
4. Public Distribution System : Percentage Variation
Off-take of P.D.S. Commodities in May’09 over
April’09.
Rice -0.42
Wheat -3.59
Sugar -0.29
Kerosene -0.40

Guidance Bureau
Monthly Review of Tamil Nadu Economy – June 2009. 5
SSEELLEECCTT EECCOONNOOMMIICC II NNDDIICCAATTOORRSS OOFF TTHHEE SSTTAATTEE
(( CCoonn tt dd .. ))
Sl.
No. Factors Trend
5. Sale of Cement through T.N.C.S.C. Ltd. : Decreased by
Sale of Cement in May’09 over April’09 11,747 M.T.
6. Employment : Nos.
Total Job Seekers as per Live-Register upto May’09. 55.45 Lakhs
Job Seekers : Male Women
53.80 % 46.20 %
7. Tax Revenue Collected Percentage increase
In May’09 over May’08 5.01%
MMAA XX IIMMUUMM RR EE TT AA II LL PP RR II CC EE SS OO FF CCEE RR TT AA II NN EE SS SS EE NN TT II AA LL CCOOMMMMOODD II TT II EE SS
pp rr ii cc ee ii nn RR ss PP ee rr // KK gg
cc oo mm mm oo dd ii tt yy MM AA YY 22 00 00 99 JJ UU NN EE 22 00 00 99
11 .. BB oo ii ll ee dd RR ii cc ee FF ii nn ee 33 22 .. 00 00 33 44 .. 00 00
22 .. BB oo ii ll ee dd RR ii cc ee CC oo mm mm oo nn 22 44 .. 00 00 22 55 .. 00 00
33 .. RR aa ww RR ii cc ee ff ii nn ee
44 .. RR aa ww RR ii cc ee cc oo mm mm oo nn 22 33 .. 00 00 22 33 .. 00 00
55 .. RR ee dd gg rr aa mm dd hh aa ll ll 55 88 .. 00 00 66 88 .. 00 00
66 .. BB ll aa cc kk gg rr aa mm dd hh aa ll ll 55 88 .. 00 00 66 00 .. 00 00
77 .. BB ee nn gg aa ll gg rr aa mm dd hh aa ll ll 44 22 .. 00 00 44 22 .. 00 00
88 GG rr ee ee nn gg rr aa mm dd hh aa ll ll 66 00 .. 00 00 55 88 .. 00 00
99 .. GG rr oo uu nn dd nn uu tt OO ii ll 77 11 .. 00 00 77 22 .. 00 00
11 00 .. GG ii nn gg ee ll ll yy OO ii ll 11 11 55 .. 00 00 11 11 55 .. 00 00
11 11 .. CC oo cc oo nn uu tt OO ii ll 99 33 .. 00 00 99 00 .. 00 00
Guidance Bureau
Monthly Review of Tamil Nadu Economy – June 2009. 6
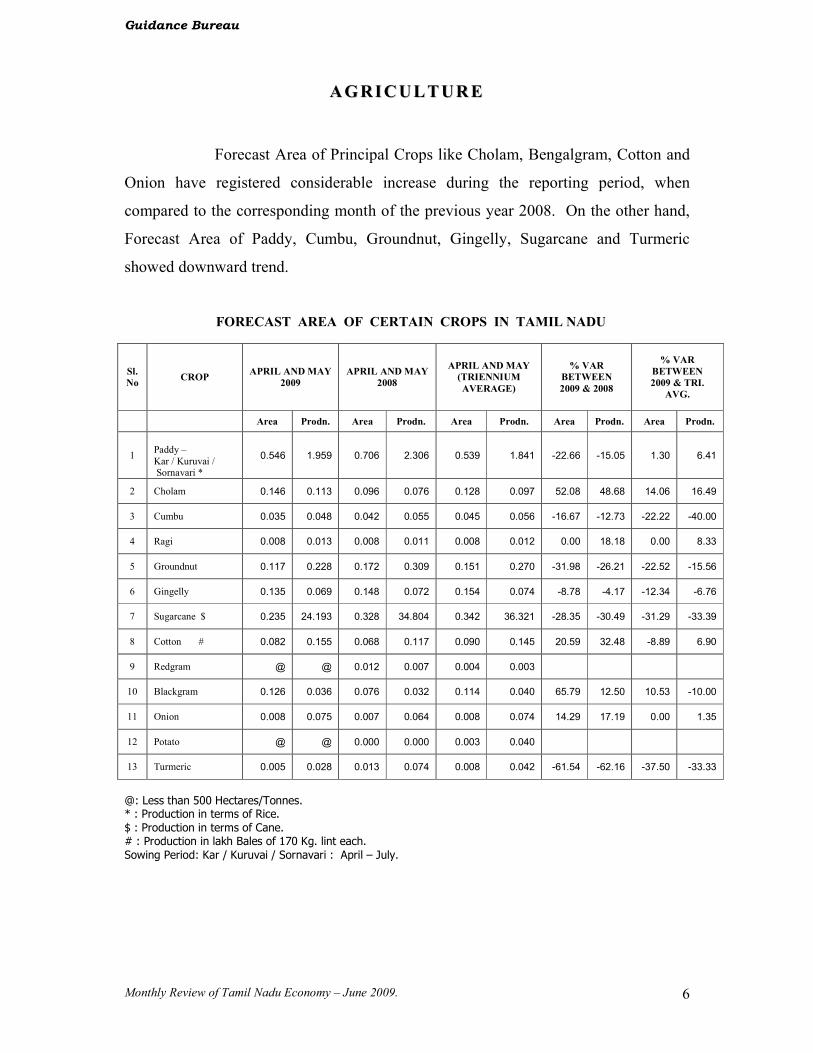
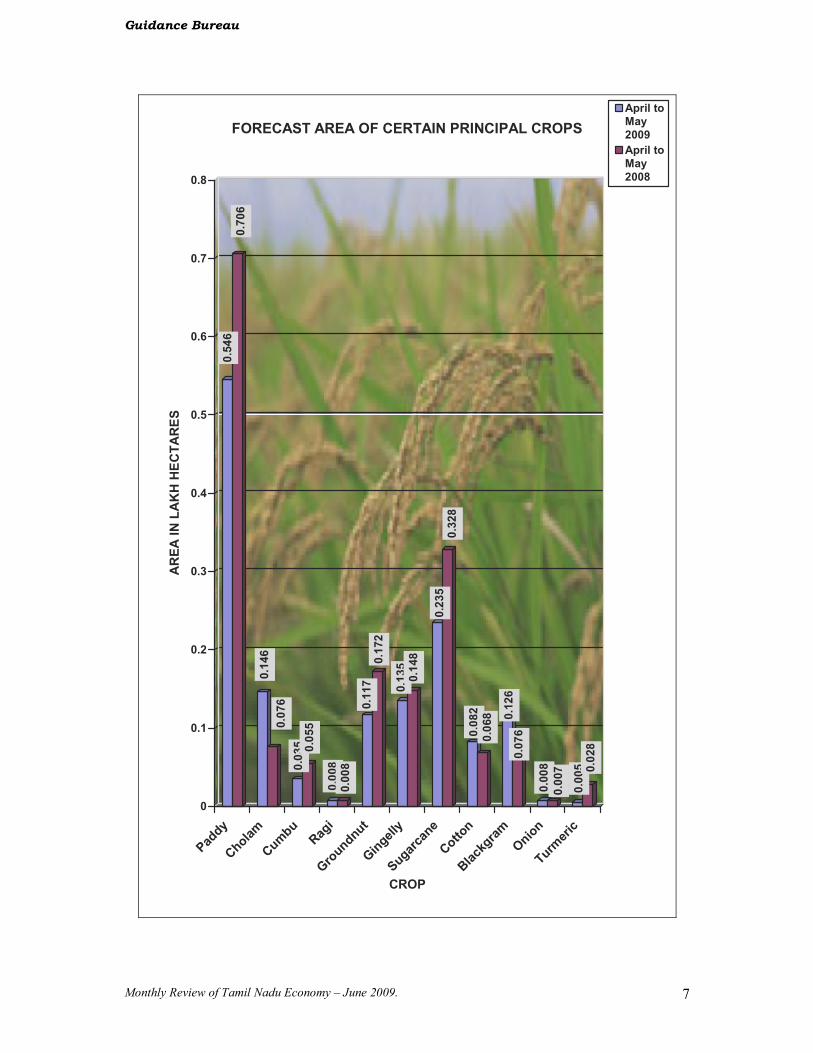
AAGGRRIICCUULLTTUURREE
Forecast Area of Principal Crops like Cholam, Bengalgram, Cotton and
Onion have registered considerable increase during the reporting period, when
compared to the corresponding month of the previous year 2008. On the other hand,
Forecast Area of Paddy, Cumbu, Groundnut, Gingelly, Sugarcane and Turmeric
showed downward trend.
FORECAST AREA OF CERTAIN CROPS IN TAMIL NADU
Sl.
No CROP
APRIL AND MAY
2009
APRIL AND MAY
2008
APRIL AND MAY
(TRIENNIUM
AVERAGE)
% VAR
BETWEEN
2009 & 2008
% VAR
BETWEEN
2009 & TRI.
AVG.
Area Prodn. Area Prodn. Area Prodn. Area Prodn. Area Prodn.
1
Paddy – Kar / Kuruvai / Sornavari *
0.546 1.959 0.706 2.306 0.539 1.841 -22.66 -15.05 1.30 6.41
2 Cholam 0.146 0.113 0.096 0.076 0.128 0.097 52.08 48.68 14.06 16.49
3 Cumbu 0.035 0.048 0.042 0.055 0.045 0.056 -16.67 -12.73 -22.22 -40.00
4 Ragi 0.008 0.013 0.008 0.011 0.008 0.012 0.00 18.18 0.00 8.33
5 Groundnut 0.117 0.228 0.172 0.309 0.151 0.270 -31.98 -26.21 -22.52 -15.56
6 Gingelly 0.135 0.069 0.148 0.072 0.154 0.074 -8.78 -4.17 -12.34 -6.76
7 Sugarcane $ 0.235 24.193 0.328 34.804 0.342 36.321 -28.35 -30.49 -31.29 -33.39
8 Cotton # 0.082 0.155 0.068 0.117 0.090 0.145 20.59 32.48 -8.89 6.90
9 Redgram @ @ 0.012 0.007 0.004 0.003
10 Blackgram 0.126 0.036 0.076 0.032 0.114 0.040 65.79 12.50 10.53 -10.00
11 Onion 0.008 0.075 0.007 0.064 0.008 0.074 14.29 17.19 0.00 1.35
12 Potato @ @ 0.000 0.000 0.003 0.040
13 Turmeric 0.005 0.028 0.013 0.074 0.008 0.042 -61.54 -62.16 -37.50 -33.33
@: Less than 500 Hectares/Tonnes. * : Production in terms of Rice. $ : Production in terms of Cane. # : Production in lakh Bales of 170 Kg. lint each. Sowing Period: Kar / Kuruvai / Sornavari : April – July.
Guidance Bureau
Monthly Review of Tamil Nadu Economy – June 2009. 7
0.546
0.706
0.146
0.076
0.035 0.055
0.008
0.008
0.117
0.172
0.135
0.148
0.235
0.328
0.082
0.068 0.126
0.076
0.008
0.007
0.005 0.028
0
0.1
0.2
0.3
0.4
0.5
0.6
0.7
0.8AREA IN LAKH HECTARES
Paddy
Cholam
Cumbu
Ragi
Groundnut
Gingelly
Sugarcane
Cotton
Blackgram
Onion
Turmeric
CROP
FORECAST AREA OF CERTAIN PRINCIPAL CROPS
April to
May
2009
April to
May
2008
Guidance Bureau
Monthly Review of Tamil Nadu Economy – June 2009. 8
RR aa ii nn ff aa ll ll ::
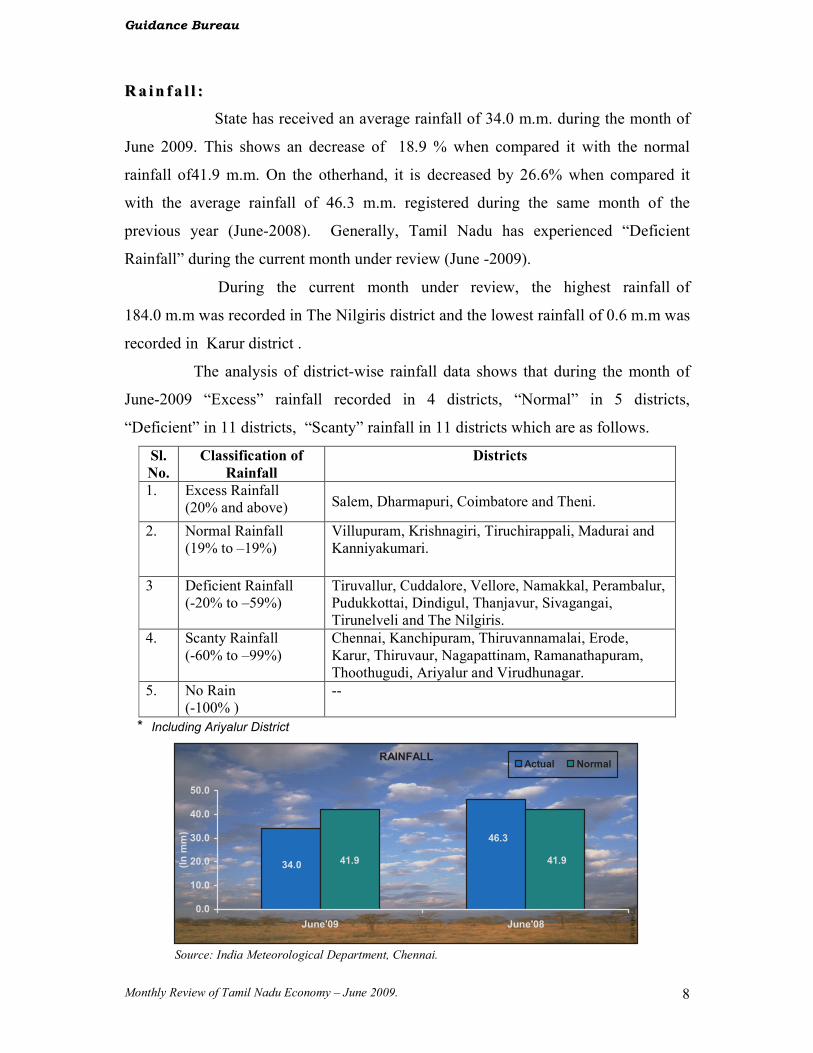
State has received an average rainfall of 34.0 m.m. during the month of
June 2009. This shows an decrease of 18.9 % when compared it with the normal
rainfall of41.9 m.m. On the otherhand, it is decreased by 26.6% when compared it
with the average rainfall of 46.3 m.m. registered during the same month of the
previous year (June-2008). Generally, Tamil Nadu has experienced “Deficient
Rainfall” during the current month under review (June -2009).
During the current month under review, the highest rainfall of
184.0 m.m was recorded in The Nilgiris district and the lowest rainfall of 0.6 m.m was
recorded in Karur district .
The analysis of district-wise rainfall data shows that during the month of
June-2009 “Excess” rainfall recorded in 4 districts, “Normal” in 5 districts,
“Deficient” in 11 districts, “Scanty” rainfall in 11 districts which are as follows.
Sl.
No.
Classification of
Rainfall
Districts
1. Excess Rainfall (20% and above) Salem, Dharmapuri, Coimbatore and Theni.
2. Normal Rainfall (19% to –19%)
Villupuram, Krishnagiri, Tiruchirappali, Madurai and Kanniyakumari.
3 Deficient Rainfall (-20% to –59%)
Tiruvallur, Cuddalore, Vellore, Namakkal, Perambalur, Pudukkottai, Dindigul, Thanjavur, Sivagangai, Tirunelveli and The Nilgiris.
4. Scanty Rainfall (-60% to –99%)
Chennai, Kanchipuram, Thiruvannamalai, Erode, Karur, Thiruvaur, Nagapattinam, Ramanathapuram, Thoothugudi, Ariyalur and Virudhunagar.
5. No Rain (-100% )
--
* Including Ariyalur District
Source: India Meteorological Department, Chennai.
RAINFALL
46.3
34.0 41.941.9
0.0
10.0
20.0
30.0
40.0
50.0
June'09 June'08
(In mm)
Actual Normal

Guidance Bureau
Monthly Review of Tamil Nadu Economy – June 2009. 9
Water levels of Important Reservoirs in Tamil Nadu as on 30.06.2009 :
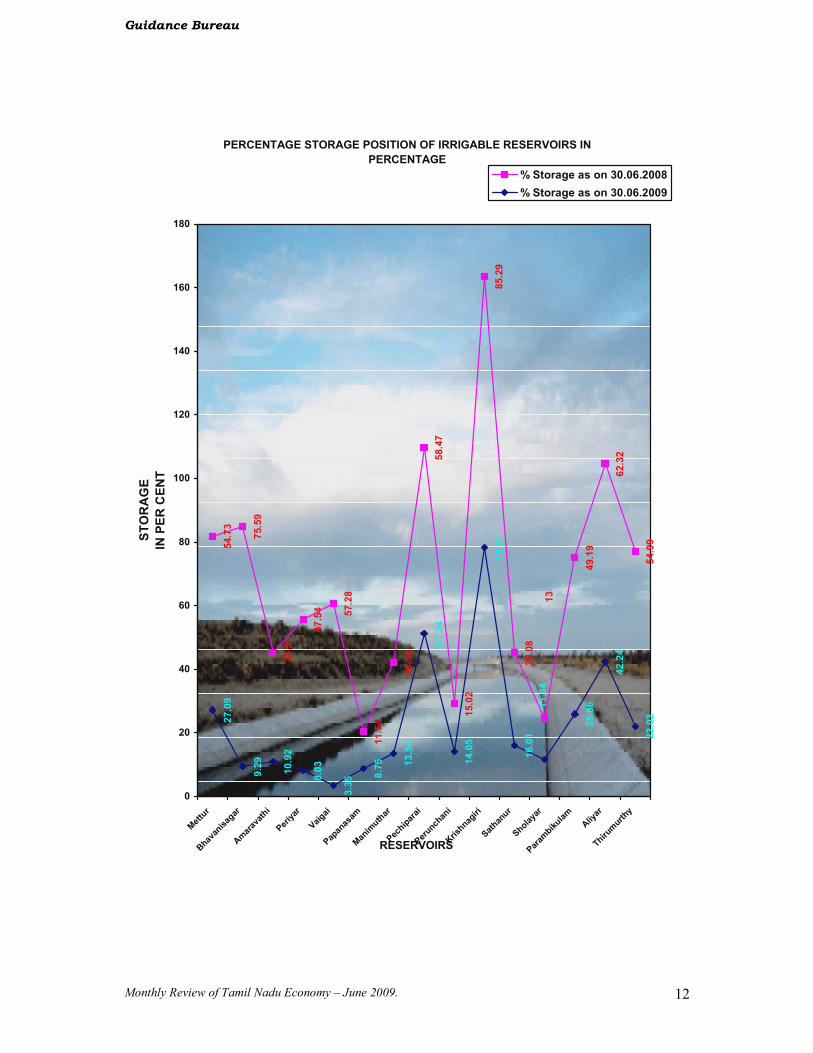
Among the Twenty One major Reservoirs in the State, Sixteen are
irrigable reservoirs while the other five reservoirs cater the supply of drinking water to
Chennai City. Among them Krishnagiri reservoir in Krishnagiri district recorded the
highest storage level with 78.21% of its storage capacity and Vaigai reservoir in
Madurai district recorded the least with 3.35% of its storage capacity. Almost, all the
reservoirs meant for irrigation having poor storage capacity during the month of June
2009, when comparing it with that of previous year of the same month. The Storage
level of the reservoirs are as below.
Krishnagiri : 70-80%
Pechiparai, Redhills : 50-60%
Chembarambakkam, Aliyar, Poondi : 40-50%
Mettur, Parambikulam, Thirumurthy : 20-30%
Periyar, Vaigai, Amaravathi, Perunchani, Sholayar, Bhavanisagar, Papanasam, Sathanur, Veeranam, Manimuthar, Sholavaram. : Below 20%

Guidance Bureau
Monthly Review of Tamil Nadu Economy – June 2009. 10
WATER LEVELS OF IMPORTANT RESERVOIRS IN TAMIL NADU
AS ON 30.06.2009
Sl. No.
Reservoir District Capacity at FRL
Storage as on
30.06.2009
Storage %
Storage as on
30.06.2008
Storage %
1 Mettur Salem 93470 25324 27.09 51157 54.73
2 Bhavanisagar Erode 32800 3046 9.29 24793 75.59
3 Amaravathi Coimbatore 4047 442 10.92 1388 34.30
4 Periyar Theni 10570 849 8.03 5025 47.54
5 Vaigai Madurai 6091 204 3.35 3489 57.28
6 Papanasam Tirunelveli 5500 481 8.75 651 11.84
7 Manimuthar Tirunelveli 5511 746 13.54 1573 28.54
8 Pechiparai Kanniyakumari 4450 2280 51.24 2602 58.47
9 Perunchani Kanniyakumari 2890 406 14.05 434 15.02
10 Krishnagiri Krishnagiri 1666 1303 78.21 1421 85.29
11 Sathanur Tiruvannamalai 7321 1172 16.01 2129 29.08
12 Chembarambakkam Kancheepuram 3645 1496 41.04 1979 54.29
13 Sholayar Coimbatore 5052 588 11.64 657 13.00
14 Parambikulam Coimbatore 13408 3467 25.86 6595 49.19
15 Aliyar Coimbatore 3864 1632 42.24 2408 62.32
16 Thirumurthy Coimbatore 1744 384 22.02 959 54.99
DRINKING WATER SUPPLY RESERVOIRS
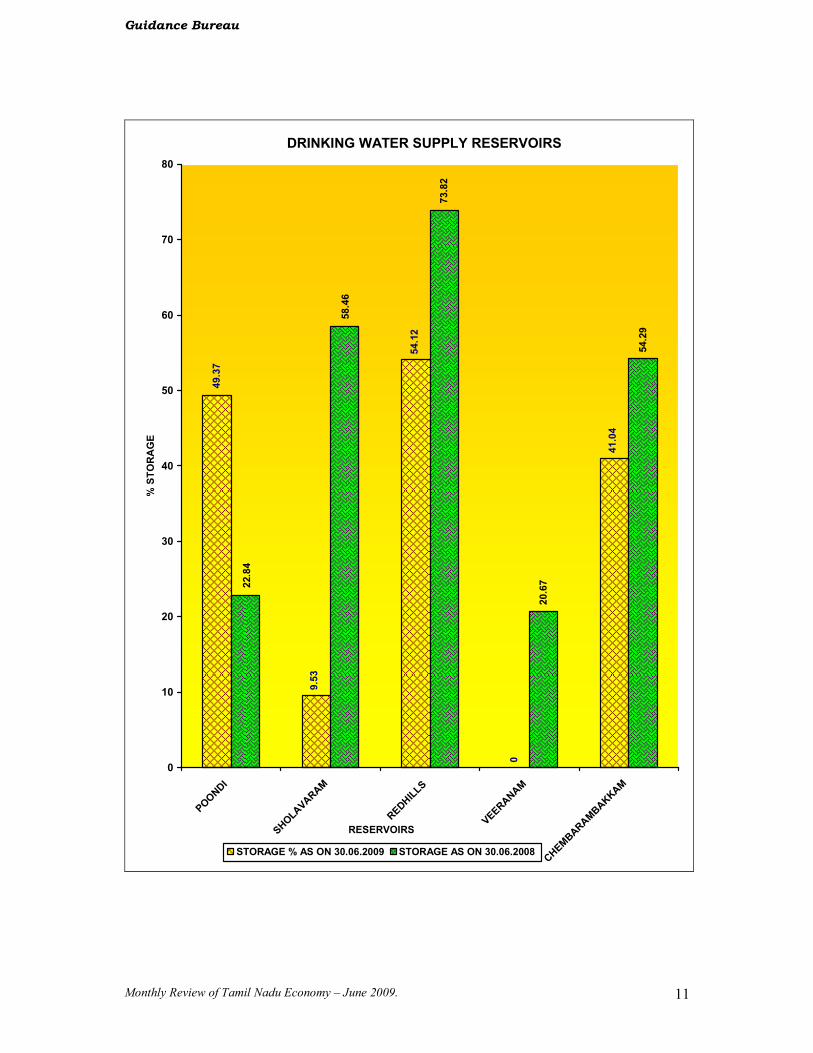
17 Poondi Thiruvallur 3231 1595 49.37 738 22.84
18 Sholavaram Thiruvallur 881 84 9.53 515 58.46
19 Chembarambakkam Kancheepuram 3645 1496 41.04 1979 54.29
20 Redhills Thiruvallur 3300 1786 54.12 2436 73.82
21 Veeranam Cuddalore 1456 0 0.00 301 20.67
* F.R.L.: Full Reservoir Level.
SS oo uu rr cc ee :: PP uu bb ll ii cc WW oo rr kk ss DD ee pp aa rr tt mm ee nn tt ,, CC hh ee nn nn aa ii -- 66 00 00 00 00 55 ..
Guidance Bureau
Monthly Review of Tamil Nadu Economy – June 2009. 11
DRINKING WATER SUPPLY RESERVOIRS
41.04
0
54.12
9.53
49.37
54.29
20.67
73.82
58.46
22.84
0
10
20
30
40
50
60
70
80
POONDI
SHOLAVARAM
REDHILLS
VEERANAM
CHEMBARAMBAKKAM
RESERVOIRS
% STORAGE
STORAGE % AS ON 30.06.2009 STORAGE AS ON 30.06.2008
Guidance Bureau
Monthly Review of Tamil Nadu Economy – June 2009. 12
PERCENTAGE STORAGE POSITION OF IRRIGABLE RESERVOIRS IN
PERCENTAGE
27.09
9.29
10.92
8.03
3.35 8.75 13.54
51.24
14.05
78.21
16.01
25.86
42.24
22.02
54.73
75.59
34.3
47.54 57.28
11.54
28.54
58.47
15.02
85.29
29.08
49.19
62.32
54.99
11.64
13
0
20
40
60
80
100
120
140
160
180
Mettur
Bhavanisagar
Amaravathi
Periyar
Vaigai
Papanasam
Manimuthar
Pechiparai
Perunchani
Krishnagiri
Sathanur
Sholayar
Parambikulam
Aliyar
Thirumurthy
RESERVOIRS
STORAGE
IN PER CENT
% Storage as on 30.06.2008
% Storage as on 30.06.2009
Guidance Bureau
Monthly Review of Tamil Nadu Economy – June 2009. 13
STATEMENT SHOWING DISTEICTWISE
RAINFALL DURING THE MONTH OF JUNE-2009
( in m.m.)
June 2009 June 2008 Sl.No
District
Actual Normal
%
Deviation Actual Normal
%
Deviation
1 Chennai 11.3 57.3 -80.3 65.1 57.3 13.6
2 Kancheepuram 22.3 56.6 -60.6 52.2 56.6 -7.8
3 Thiruvallur 39.0 63.1 -38.2 105.6 63.1 67.4
4 Cuddalore 29.7 41.9 -29.1 50.4 41.9 20.3
5 Villupuram 44.4 49.7 -10.7 37.3 49.7 -24.9
6 Vellore 44.5 59.6 -25.3 44.5 59.6 -25.3
7 Thiruvannamalai 12.3 55.8 -78.0 57.6 55.8 3.2
8 Salem 64.7 50.6 27.9 53.1 50.6 4.9
9 Namakkal 22.3 38.3 -41.8 17.6 38.3 -54.0
10 Dharmapuri 76.5 46.4 64.9 22.4 46.4 -51.7
11 Krishnagiri 40.3 48.4 -16.7 37.3 48.4 -22.9
12 Coimbatore 96.6 38.2 152.9 145.1 38.2 279.8
13 Erode 6.0 26.1 -77.0 12.3 26.1 -52.9
14 Tiruchirappalli 21.1 25.9 -18.5 4.0 25.9 -84.6
15 Karur 0.6 18.3 -96.7 20.1 18.3 9.8
16 Perambalur 25.3 41.1 -38.4 38.0 41.1 -7.5
17 Pudukottai 30.5 45.0 -32.2 44.5 45.0 -1.1
18 Thanjavur 20.1 36.7 -45.2 23.4 36.7 -36.2
19 Thiruvarur 5.0 31.4 -84.1 35.2 31.4 12.1
20 Nagapattinam 7.3 29.0 -74.8 33.7 29.0 16.2
21 Madurai 28.5 31.0 -8.1 35.8 31.0 15.5
22 Theni 42.3 18.3 131.1 60.5 18.3 230.6
23 Dindigul 21.7 30.6 -29.1 44.4 30.6 45.1
24 Ramanthapuram 1.1 14.0 -92.1 19.9 14.0 42.1
25 Virudhunagar 1.7 18.3 -90.7 7.2 18.3 -60.7
26 Sivagangai 19.1 32.2 -40.7 65.4 32.2 103.1
27 Tirunelveli 15.3 20.6 -25.7 11.0 20.6 -46.6
28 Thoothukudi 1.2 7.0 -82.9 3.3 7.0 -52.9
29 The Nilgiris 184.0 231.5 -20.5 294.7 231.5 27.3
30 Ariyalur 8.3 41.1 -79.8 ** ** **
31 Kanyakumari 124.4 126.5 -1.7 25.1 126.5 -80.2
State Average* 34.0 41.9 -18.9 46.3 41.9 10.5 Source: India Meteorological Department, Chennai – 6.
Guidance Bureau
Monthly Review of Tamil Nadu Economy – June 2009. 14
* : Actual Rainfall is furnished for Ariyalur District separately by India Meteorological Dept.
ACTUAL RAINFALL DURING JUNE-2009
11.3
22.3
39
44.4
44.5
12.3
22.3
76.5
30.5
5
7.3
1.1
15.3
21.7
28.5
1.2
19.1
124.4
8.3
184
1.7
42.3
25.3
6
0.6
20.1
21.1
96.5
40.3
64.7
29.7
0
20
40
60
80
100
120
140
160
180
200
Chennai
Kancheepuram
Tiruvallur
Cuddalore
Villupuram
Vellore
Thiruvannamali
Salem
Namakkal
Dharmapuri
Krishnagiri
Coimbatore
Erode
Tiruchirapalli
Karur
Perambalur
Pudukottai
Thanjavur
Thiruvarur
Nagapattinam
Madurai
Theni
Dindigul
Ramanathapuram
Virudunagar
Sivagangai
Tirunelveli
Thoothugudi
The Nilgiris
Ariyalur
Kanniyakumari
DISTRICT
RAINFALL (in m.m.)
June'2009
Guidance Bureau
Monthly Review of Tamil Nadu Economy – June 2009. 15
INDEX NUMBERS OF AGRICULTURAL WAGES FOR
THE MONTH OF APRIL 2009 - TAMIL NADU
Base Year : 1993 – 94
GENERAL INDEX :
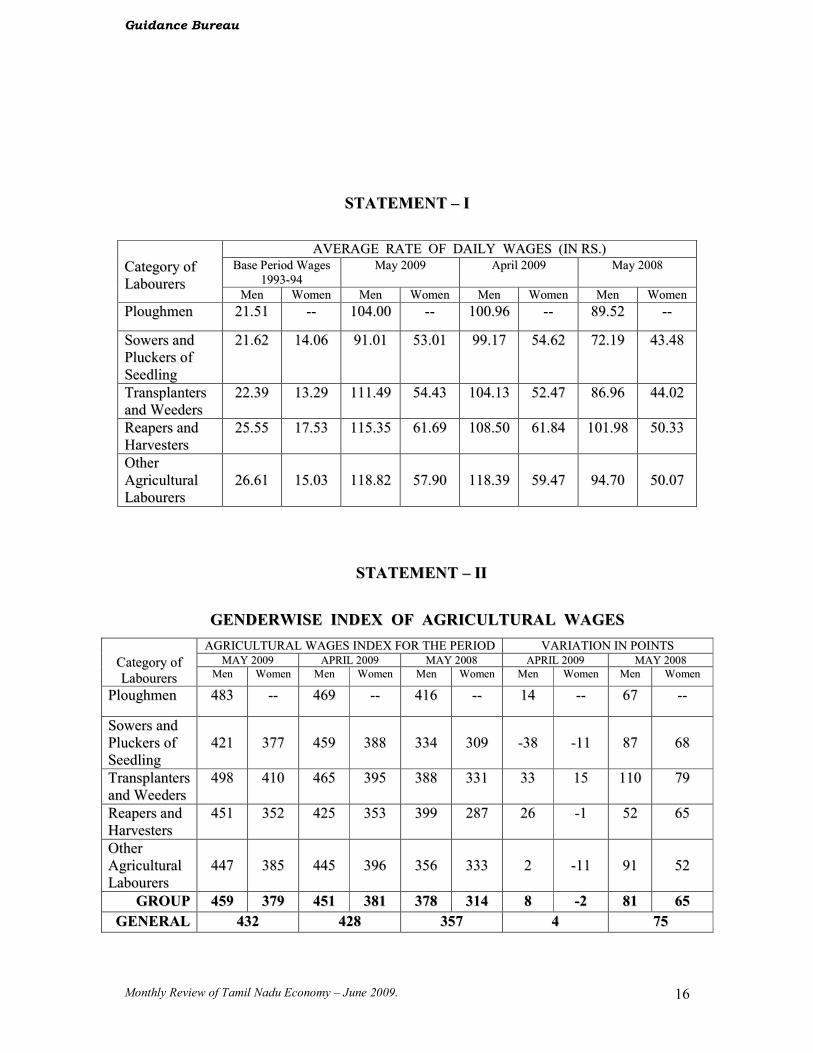
The Composite Index Number of Agricultural Wages for Tamil Nadu
for the month of May 2009 stood at 432 Points, reporting an increase of 4 Points,
when compared with the Index Number of the previous month (April 2009) and shows
an increase of 75 Points when compared with the Index Number of corresponding
month of previous year (May 2008).
GENDER INDEX :
During the month of May 2009, Index of Agricultural Wages for Men
stood at 459 Points with an increase of 8 Points and that of Women stood at 379
Points with a decrease of 2 Points, when compared with the corresponding Index of
previous month (April 2009).
ACTIVITY INDEX :
During the month of May 2009, Index Number of Agricultural Wages of
all categories of workers have been increased, ranging from 52 Points to 110 Points
when compared with the respective Index of corresponding month of previous year
(May 2008).
Guidance Bureau
Monthly Review of Tamil Nadu Economy – June 2009. 16
SSTTAATTEEMMEENNTT –– II
AAVVEERRAAGGEE RRAATTEE OOFF DDAAIILLYY WWAAGGEESS ((IINN RRSS..))
BBaassee PPeerriioodd WWaaggeess
11999933--9944 MMaayy 22000099 AApprriill 22000099 MMaayy 22000088
CCaatteeggoorryy ooff
LLaabboouurreerrss MMeenn WWoommeenn MMeenn WWoommeenn MMeenn WWoommeenn MMeenn WWoommeenn
PPlloouugghhmmeenn 2211..5511 ---- 110044..0000 ---- 110000..9966 ---- 8899..5522 ----
SSoowweerrss aanndd
PPlluucckkeerrss ooff
SSeeeeddlliinngg
2211..6622 1144..0066 9911..0011 5533..0011 9999..1177 5544..6622 7722..1199 4433..4488
TTrraannssppllaanntteerrss
aanndd WWeeeeddeerrss 2222..3399 1133..2299 111111..4499 5544..4433 110044..1133 5522..4477 8866..9966 4444..0022
RReeaappeerrss aanndd
HHaarrvveesstteerrss 2255..5555 1177..5533 111155..3355 6611..6699 110088..5500 6611..8844 110011..9988 5500..3333
OOtthheerr
AAggrriiccuullttuurraall
LLaabboouurreerrss
2266..6611
1155..0033
111188..8822
5577..9900
111188..3399
5599..4477
9944..7700
5500..0077
SSTTAATTEEMMEENNTT –– IIII
GGEENNDDEERRWWIISSEE IINNDDEEXX OOFF AAGGRRIICCUULLTTUURRAALL WWAAGGEESS
AAGGRRIICCUULLTTUURRAALL WWAAGGEESS IINNDDEEXX FFOORR TTHHEE PPEERRIIOODD VVAARRIIAATTIIOONN IINN PPOOIINNTTSS
MMAAYY 22000099 AAPPRRIILL 22000099 MMAAYY 22000088 AAPPRRIILL 22000099 MMAAYY 22000088
CCaatteeggoorryy ooff
LLaabboouurreerrss MMeenn WWoommeenn MMeenn WWoommeenn MMeenn WWoommeenn MMeenn WWoommeenn MMeenn WWoommeenn
PPlloouugghhmmeenn 448833 ---- 446699 ---- 441166 ---- 1144 ---- 6677 ----
SSoowweerrss aanndd
PPlluucckkeerrss ooff
SSeeeeddlliinngg
442211
337777
445599
338888
333344
330099
--3388
--1111
8877
6688
TTrraannssppllaanntteerrss
aanndd WWeeeeddeerrss 449988 441100 446655 339955 338888 333311 3333 1155 111100 7799
RReeaappeerrss aanndd
HHaarrvveesstteerrss 445511 335522 442255 335533 339999 228877 2266 --11 5522 6655
OOtthheerr
AAggrriiccuullttuurraall
LLaabboouurreerrss
444477
338855
444455
339966
335566
333333
22
--1111
9911
5522
GGRROOUUPP 445599 337799 445511 338811 337788 331144 88 --22 8811 6655
GGEENNEERRAALL 443322 442288 335577 44 7755
Guidance Bureau
Monthly Review of Tamil Nadu Economy – June 2009. 17

Guidance Bureau
Monthly Review of Tamil Nadu Economy – June 2009. 18
AGRICULTURAL WAGE INDEX - GENERAL
432
428
357
0
100
200
300
400
500
INDEX
POINTS
May-09
Apr-09
May-08
PRICES DISTRICT-WISE LAST WEEK END WHOLESALE AND RETAIL PRICES
OF ESSENTIAL COMMODITIES FOR THE MONTH OF JUNE-2009
AGRICULTURAL WAGE INDEX
378
451
459
314
381
379
0
50
100
150
200
250
300
350
400
450
500
May'09 April'09 May'08
GENDER
INDEX
Men
Women
Guidance Bureau
Monthly Review of Tamil Nadu Economy – June 2009. 19
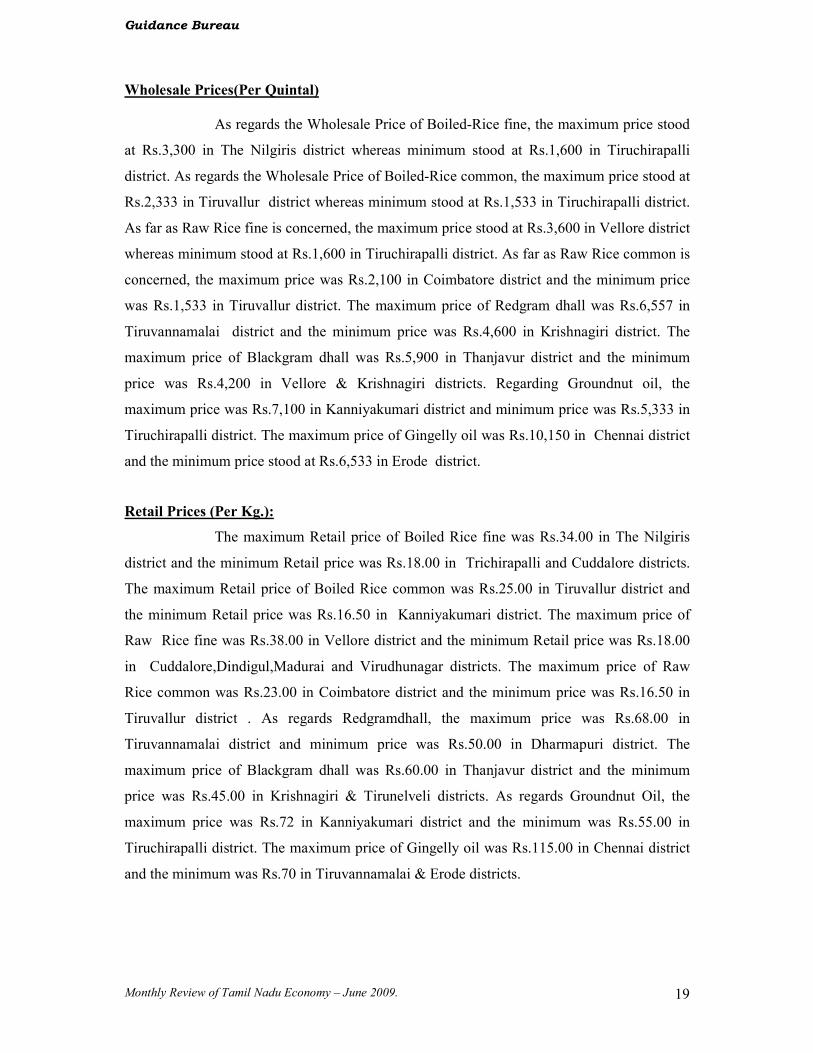
Wholesale Prices(Per Quintal)
As regards the Wholesale Price of Boiled-Rice fine, the maximum price stood
at Rs.3,300 in The Nilgiris district whereas minimum stood at Rs.1,600 in Tiruchirapalli
district. As regards the Wholesale Price of Boiled-Rice common, the maximum price stood at
Rs.2,333 in Tiruvallur district whereas minimum stood at Rs.1,533 in Tiruchirapalli district.
As far as Raw Rice fine is concerned, the maximum price stood at Rs.3,600 in Vellore district
whereas minimum stood at Rs.1,600 in Tiruchirapalli district. As far as Raw Rice common is
concerned, the maximum price was Rs.2,100 in Coimbatore district and the minimum price
was Rs.1,533 in Tiruvallur district. The maximum price of Redgram dhall was Rs.6,557 in
Tiruvannamalai district and the minimum price was Rs.4,600 in Krishnagiri district. The
maximum price of Blackgram dhall was Rs.5,900 in Thanjavur district and the minimum
price was Rs.4,200 in Vellore & Krishnagiri districts. Regarding Groundnut oil, the
maximum price was Rs.7,100 in Kanniyakumari district and minimum price was Rs.5,333 in
Tiruchirapalli district. The maximum price of Gingelly oil was Rs.10,150 in Chennai district
and the minimum price stood at Rs.6,533 in Erode district.
Retail Prices (Per Kg.):
The maximum Retail price of Boiled Rice fine was Rs.34.00 in The Nilgiris
district and the minimum Retail price was Rs.18.00 in Trichirapalli and Cuddalore districts.
The maximum Retail price of Boiled Rice common was Rs.25.00 in Tiruvallur district and
the minimum Retail price was Rs.16.50 in Kanniyakumari district. The maximum price of
Raw Rice fine was Rs.38.00 in Vellore district and the minimum Retail price was Rs.18.00
in Cuddalore,Dindigul,Madurai and Virudhunagar districts. The maximum price of Raw
Rice common was Rs.23.00 in Coimbatore district and the minimum price was Rs.16.50 in
Tiruvallur district . As regards Redgramdhall, the maximum price was Rs.68.00 in
Tiruvannamalai district and minimum price was Rs.50.00 in Dharmapuri district. The
maximum price of Blackgram dhall was Rs.60.00 in Thanjavur district and the minimum
price was Rs.45.00 in Krishnagiri & Tirunelveli districts. As regards Groundnut Oil, the
maximum price was Rs.72 in Kanniyakumari district and the minimum was Rs.55.00 in
Tiruchirapalli district. The maximum price of Gingelly oil was Rs.115.00 in Chennai district
and the minimum was Rs.70 in Tiruvannamalai & Erode districts.
Guidance Bureau
Monthly Review of Tamil Nadu Economy – June 2009.
20
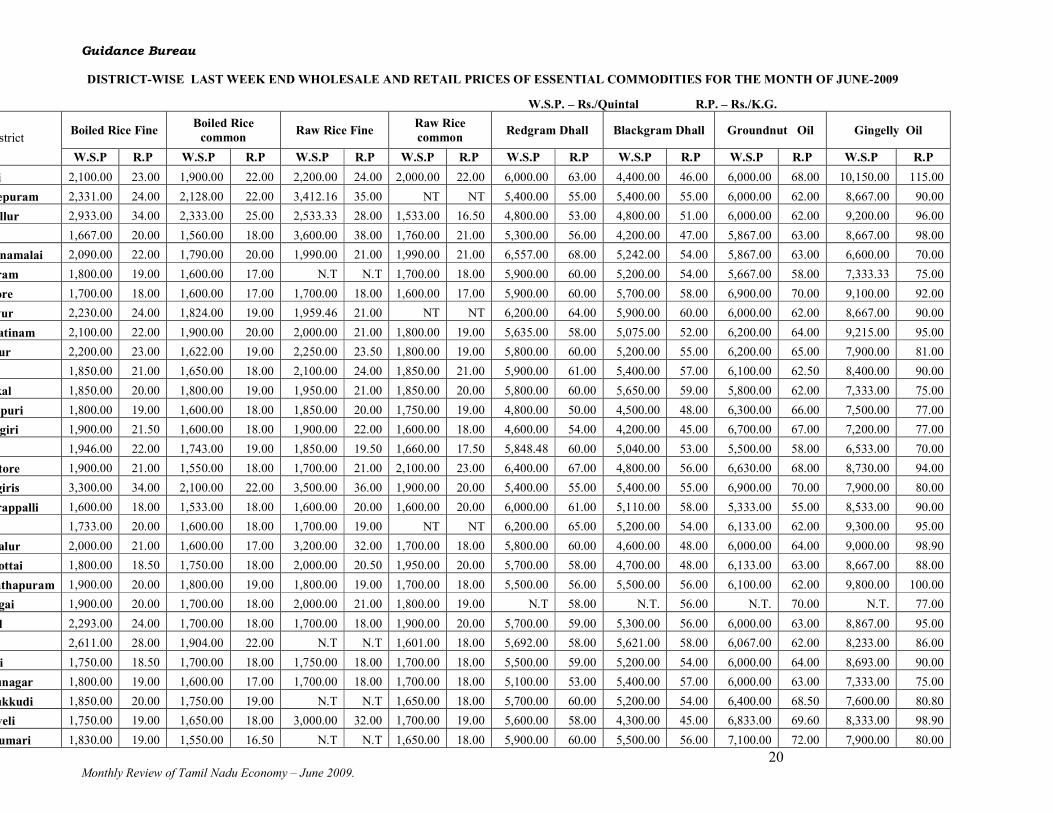
DISTRICT-WISE LAST WEEK END WHOLESALE AND RETAIL PRICES OF ESSENTIAL COMMODITIES FOR THE MONTH OF JUNE-2009
W.S.P. – Rs./Quintal R.P. – Rs./K.G.
Boiled Rice Fine Boiled Rice
common Raw Rice Fine
Raw Rice
common Redgram Dhall Blackgram Dhall Groundnut Oil Gingelly Oil
District
W.S.P R.P W.S.P R.P W.S.P R.P W.S.P R.P W.S.P R.P W.S.P R.P W.S.P R.P W.S.P R.P
Chennai 2,100.00 23.00 1,900.00 22.00 2,200.00 24.00 2,000.00 22.00 6,000.00 63.00 4,400.00 46.00 6,000.00 68.00 10,150.00 115.00
Kancheepuram 2,331.00 24.00 2,128.00 22.00 3,412.16 35.00 NT NT 5,400.00 55.00 5,400.00 55.00 6,000.00 62.00 8,667.00 90.00
Thiruvallur 2,933.00 34.00 2,333.00 25.00 2,533.33 28.00 1,533.00 16.50 4,800.00 53.00 4,800.00 51.00 6,000.00 62.00 9,200.00 96.00
1,667.00 20.00 1,560.00 18.00 3,600.00 38.00 1,760.00 21.00 5,300.00 56.00 4,200.00 47.00 5,867.00 63.00 8,667.00 98.00
Tiruvannamalai 2,090.00 22.00 1,790.00 20.00 1,990.00 21.00 1,990.00 21.00 6,557.00 68.00 5,242.00 54.00 5,867.00 63.00 6,600.00 70.00
Villupuram 1,800.00 19.00 1,600.00 17.00 N.T N.T 1,700.00 18.00 5,900.00 60.00 5,200.00 54.00 5,667.00 58.00 7,333.33 75.00
Cuddalore 1,700.00 18.00 1,600.00 17.00 1,700.00 18.00 1,600.00 17.00 5,900.00 60.00 5,700.00 58.00 6,900.00 70.00 9,100.00 92.00
Thanjavur 2,230.00 24.00 1,824.00 19.00 1,959.46 21.00 NT NT 6,200.00 64.00 5,900.00 60.00 6,000.00 62.00 8,667.00 90.00
Nagappatinam 2,100.00 22.00 1,900.00 20.00 2,000.00 21.00 1,800.00 19.00 5,635.00 58.00 5,075.00 52.00 6,200.00 64.00 9,215.00 95.00
Tiruvarur 2,200.00 23.00 1,622.00 19.00 2,250.00 23.50 1,800.00 19.00 5,800.00 60.00 5,200.00 55.00 6,200.00 65.00 7,900.00 81.00
1,850.00 21.00 1,650.00 18.00 2,100.00 24.00 1,850.00 21.00 5,900.00 61.00 5,400.00 57.00 6,100.00 62.50 8,400.00 90.00
Namakkal 1,850.00 20.00 1,800.00 19.00 1,950.00 21.00 1,850.00 20.00 5,800.00 60.00 5,650.00 59.00 5,800.00 62.00 7,333.00 75.00
Dharmapuri 1,800.00 19.00 1,600.00 18.00 1,850.00 20.00 1,750.00 19.00 4,800.00 50.00 4,500.00 48.00 6,300.00 66.00 7,500.00 77.00
Krishnagiri 1,900.00 21.50 1,600.00 18.00 1,900.00 22.00 1,600.00 18.00 4,600.00 54.00 4,200.00 45.00 6,700.00 67.00 7,200.00 77.00
1,946.00 22.00 1,743.00 19.00 1,850.00 19.50 1,660.00 17.50 5,848.48 60.00 5,040.00 53.00 5,500.00 58.00 6,533.00 70.00
Coimbatore 1,900.00 21.00 1,550.00 18.00 1,700.00 21.00 2,100.00 23.00 6,400.00 67.00 4,800.00 56.00 6,630.00 68.00 8,730.00 94.00
The Nilgiris 3,300.00 34.00 2,100.00 22.00 3,500.00 36.00 1,900.00 20.00 5,400.00 55.00 5,400.00 55.00 6,900.00 70.00 7,900.00 80.00
Tiruchirappalli 1,600.00 18.00 1,533.00 18.00 1,600.00 20.00 1,600.00 20.00 6,000.00 61.00 5,110.00 58.00 5,333.00 55.00 8,533.00 90.00
1,733.00 20.00 1,600.00 18.00 1,700.00 19.00 NT NT 6,200.00 65.00 5,200.00 54.00 6,133.00 62.00 9,300.00 95.00
Perambalur 2,000.00 21.00 1,600.00 17.00 3,200.00 32.00 1,700.00 18.00 5,800.00 60.00 4,600.00 48.00 6,000.00 64.00 9,000.00 98.90
dukkottai 1,800.00 18.50 1,750.00 18.00 2,000.00 20.50 1,950.00 20.00 5,700.00 58.00 4,700.00 48.00 6,133.00 63.00 8,667.00 88.00
Ramanathapuram 1,900.00 20.00 1,800.00 19.00 1,800.00 19.00 1,700.00 18.00 5,500.00 56.00 5,500.00 56.00 6,100.00 62.00 9,800.00 100.00
Sivagangai 1,900.00 20.00 1,700.00 18.00 2,000.00 21.00 1,800.00 19.00 N.T 58.00 N.T. 56.00 N.T. 70.00 N.T. 77.00
Dindigul 2,293.00 24.00 1,700.00 18.00 1,700.00 18.00 1,900.00 20.00 5,700.00 59.00 5,300.00 56.00 6,000.00 63.00 8,867.00 95.00
2,611.00 28.00 1,904.00 22.00 N.T N.T 1,601.00 18.00 5,692.00 58.00 5,621.00 58.00 6,067.00 62.00 8,233.00 86.00
Madurai 1,750.00 18.50 1,700.00 18.00 1,750.00 18.00 1,700.00 18.00 5,500.00 59.00 5,200.00 54.00 6,000.00 64.00 8,693.00 90.00
Virudhunagar 1,800.00 19.00 1,600.00 17.00 1,700.00 18.00 1,700.00 18.00 5,100.00 53.00 5,400.00 57.00 6,000.00 63.00 7,333.00 75.00
Thoothukkudi 1,850.00 20.00 1,750.00 19.00 N.T N.T 1,650.00 18.00 5,700.00 60.00 5,200.00 54.00 6,400.00 68.50 7,600.00 80.80
Tirunelveli 1,750.00 19.00 1,650.00 18.00 3,000.00 32.00 1,700.00 19.00 5,600.00 58.00 4,300.00 45.00 6,833.00 69.60 8,333.00 98.90
Kanyakumari 1,830.00 19.00 1,550.00 16.50 N.T N.T 1,650.00 18.00 5,900.00 60.00 5,500.00 56.00 7,100.00 72.00 7,900.00 80.00
Guidance Bureau
Monthly Review of Tamil Nadu Economy – June 2009.
21
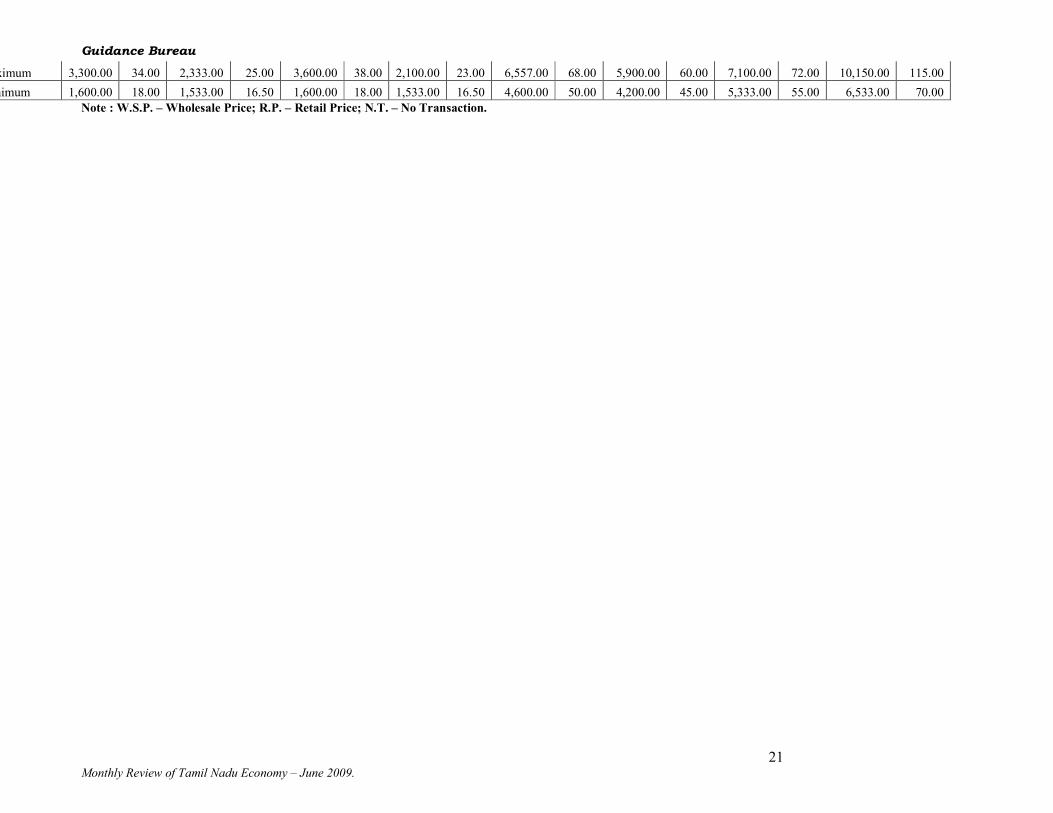
Maximum 3,300.00 34.00 2,333.00 25.00 3,600.00 38.00 2,100.00 23.00 6,557.00 68.00 5,900.00 60.00 7,100.00 72.00 10,150.00 115.00
Minimum 1,600.00 18.00 1,533.00 16.50 1,600.00 18.00 1,533.00 16.50 4,600.00 50.00 4,200.00 45.00 5,333.00 55.00 6,533.00 70.00
Note : W.S.P. – Wholesale Price; R.P. – Retail Price; N.T. – No Transaction.
Guidance Bureau
Monthly Review of Tamil Nadu Economy – June 2009. 15
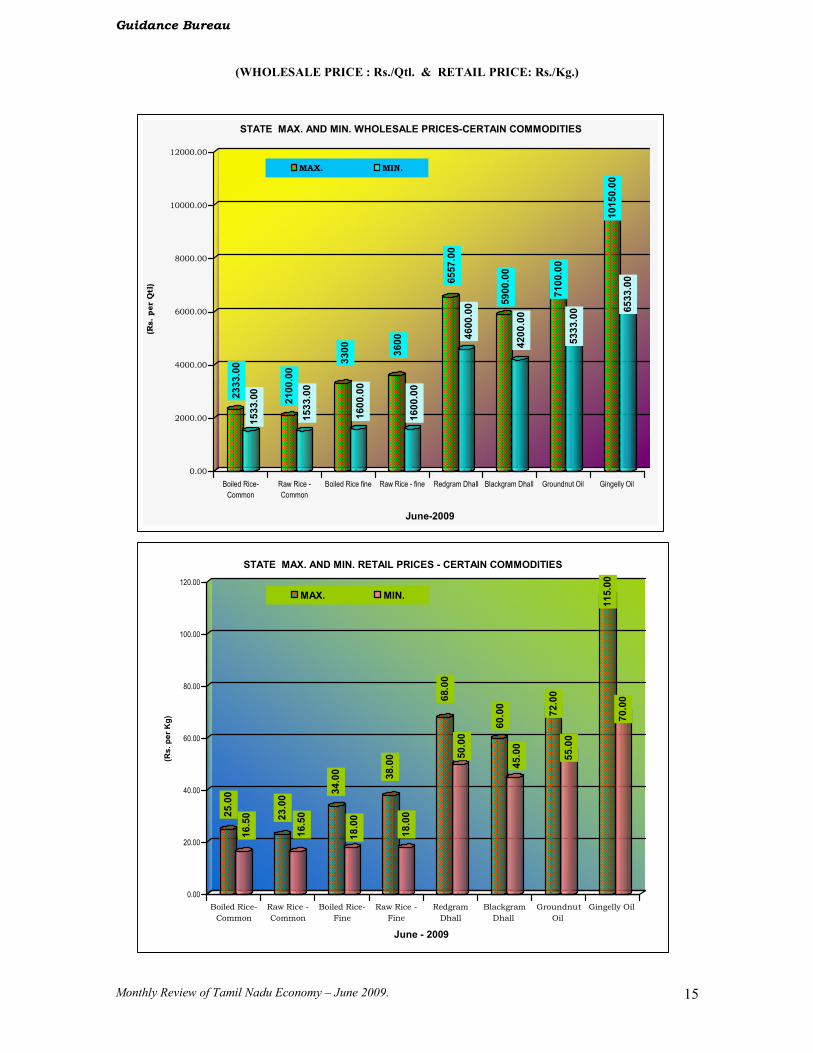
(WHOLESALE PRICE : Rs./Qtl. & RETAIL PRICE: Rs./Kg.)
2333.00
1533.00
2100.00
1533.00
3300
1600.00
3600
1600.00
6557.00
4600.00 5900.00
4200.00
7100.00
5333.00
10150.00
6533.00
0.00
2000.00
4000.00
6000.00
8000.00
10000.00
12000.00(Rs. per Qtl)
Boiled Rice-
Common
Raw Rice -
Common
Boiled Rice fine Raw Rice - fine Redgram Dhall Blackgram Dhall Groundnut Oil Gingelly Oil
June-2009
STATE MAX. AND MIN. WHOLESALE PRICES-CERTAIN COMMODITIES
MAX. MIN.
25.00
16.50 23.00
16.50
34.00
18.00
38.00
18.00
68.00
50.00
60.00
45.00
72.00
55.00
115.00
70.00
0.00
20.00
40.00
60.00
80.00
100.00
120.00
(Rs. per Kg)
Boiled Rice-
Common
Raw Rice -
Common
Boiled Rice-
Fine
Raw Rice -
Fine
Redgram
Dhall
Blackgram
Dhall
Groundnut
Oil
Gingelly Oil
June - 2009
STATE MAX. AND MIN. RETAIL PRICES - CERTAIN COMMODITIES
MAX. MIN.
Guidance Bureau
Monthly Review of Tamil Nadu Economy – June 2009. 16
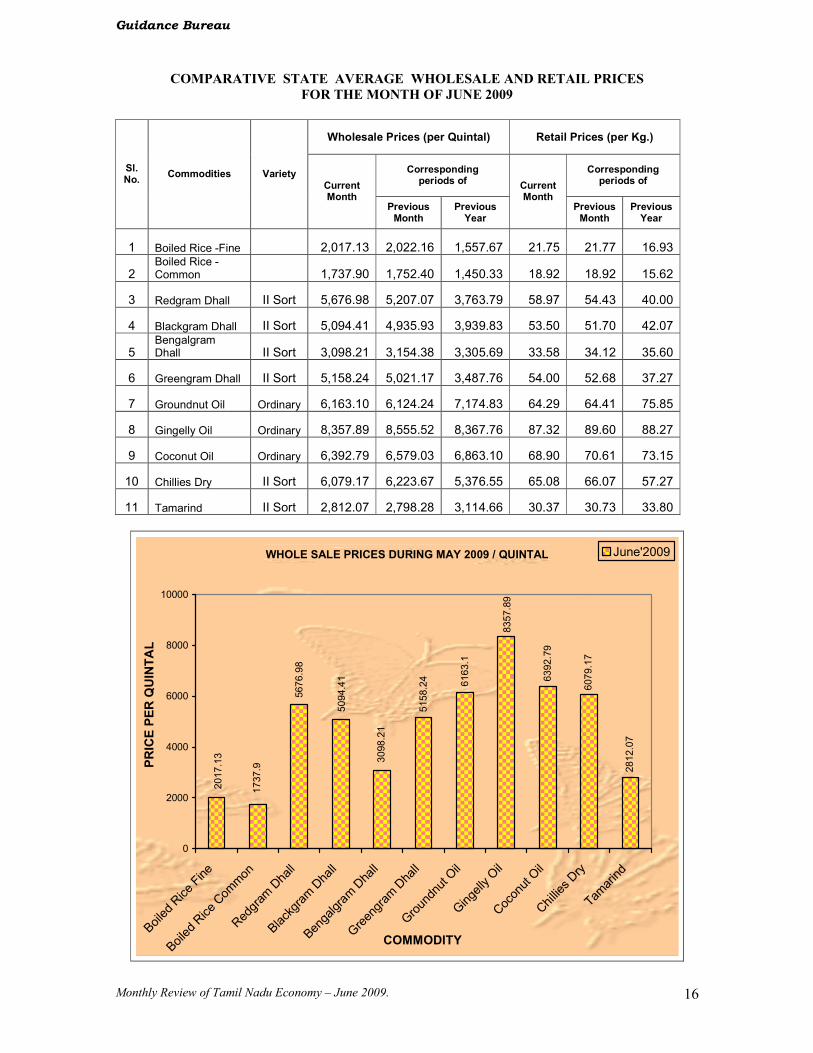
COMPARATIVE STATE AVERAGE WHOLESALE AND RETAIL PRICES
FOR THE MONTH OF JUNE 2009
Wholesale Prices (per Quintal) Retail Prices (per Kg.)
Corresponding periods of
Corresponding periods of
Sl. No.
Commodities Variety Current Month
Previous Month
Previous Year
Current Month
Previous Month
Previous Year
1 Boiled Rice -Fine 2,017.13 2,022.16 1,557.67 21.75 21.77 16.93
2 Boiled Rice -Common 1,737.90 1,752.40 1,450.33 18.92 18.92 15.62
3 Redgram Dhall II Sort 5,676.98 5,207.07 3,763.79 58.97 54.43 40.00
4 Blackgram Dhall II Sort 5,094.41 4,935.93 3,939.83 53.50 51.70 42.07
5 Bengalgram Dhall II Sort 3,098.21 3,154.38 3,305.69 33.58 34.12 35.60
6 Greengram Dhall II Sort 5,158.24 5,021.17 3,487.76 54.00 52.68 37.27
7 Groundnut Oil Ordinary 6,163.10 6,124.24 7,174.83 64.29 64.41 75.85
8 Gingelly Oil Ordinary 8,357.89 8,555.52 8,367.76 87.32 89.60 88.27
9 Coconut Oil Ordinary 6,392.79 6,579.03 6,863.10 68.90 70.61 73.15
10 Chillies Dry II Sort 6,079.17 6,223.67 5,376.55 65.08 66.07 57.27
11 Tamarind II Sort 2,812.07 2,798.28 3,114.66 30.37 30.73 33.80
WHOLE SALE PRICES DURING MAY 2009 / QUINTAL
2812.07
6079.17
6392.79
6163.1
5158.24
3098.21
5094.41
5676.98
1737.9
2017.13
8357.89
0
2000
4000
6000
8000
10000
Boiled Rice Fine
Boiled Rice Common
Redgram Dhall
Blackgram Dhall
Bengalgram Dhall
Greengram Dhall
Groundnut Oil
Gingelly Oil
Coconut Oil
Chillies Dry
Tamarind
COMMODITY
PRICE PER QUINTAL
June'2009
Guidance Bureau
Monthly Review of Tamil Nadu Economy – June 2009. 17
GROUP NAMEWISE WHOLESALE
PRICE INDEX - MARCH 2009
2637.29
1896.8
1526.62
1751.21
1624.22
1475.74
2562.06
1690.33
0
500
1000
1500
2000
2500
3000
Primary Articles Fuel, Power & Light Manufactured Products All Commodities
March'2009
March'2008
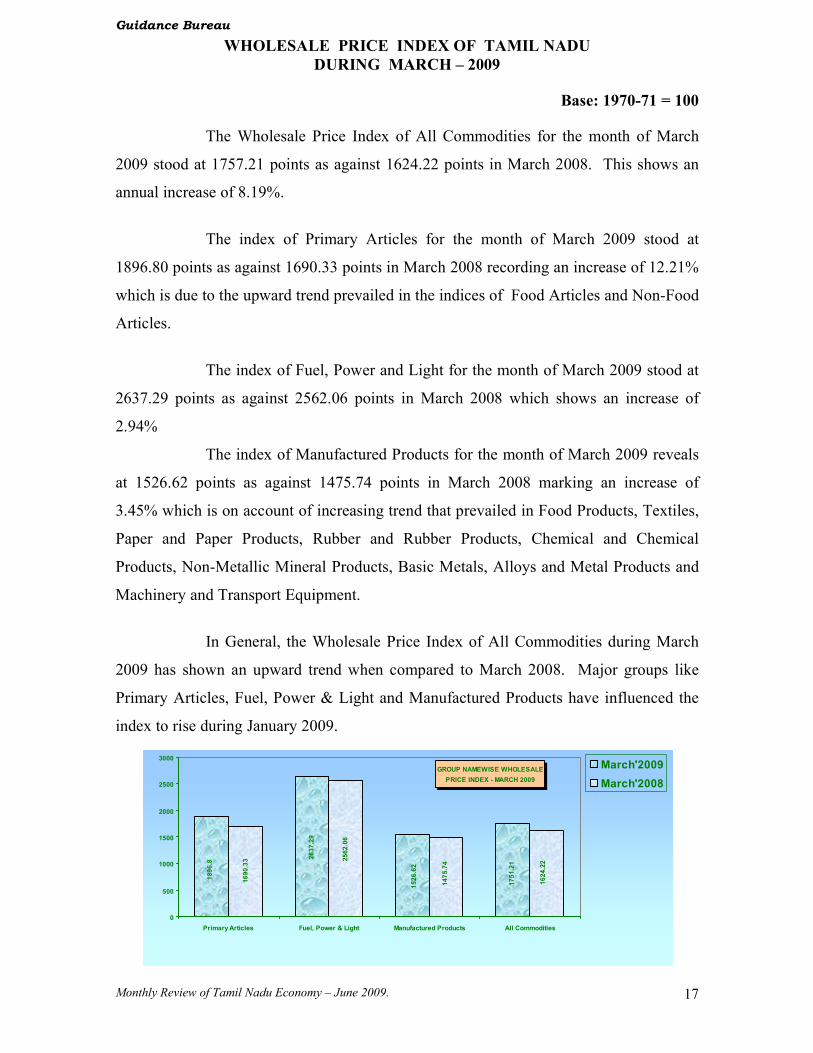
WHOLESALE PRICE INDEX OF TAMIL NADU
DURING MARCH – 2009
Base: 1970-71 = 100
The Wholesale Price Index of All Commodities for the month of March
2009 stood at 1757.21 points as against 1624.22 points in March 2008. This shows an
annual increase of 8.19%.
The index of Primary Articles for the month of March 2009 stood at
1896.80 points as against 1690.33 points in March 2008 recording an increase of 12.21%
which is due to the upward trend prevailed in the indices of Food Articles and Non-Food
Articles.
The index of Fuel, Power and Light for the month of March 2009 stood at
2637.29 points as against 2562.06 points in March 2008 which shows an increase of
2.94%
The index of Manufactured Products for the month of March 2009 reveals
at 1526.62 points as against 1475.74 points in March 2008 marking an increase of
3.45% which is on account of increasing trend that prevailed in Food Products, Textiles,
Paper and Paper Products, Rubber and Rubber Products, Chemical and Chemical
Products, Non-Metallic Mineral Products, Basic Metals, Alloys and Metal Products and
Machinery and Transport Equipment.
In General, the Wholesale Price Index of All Commodities during March
2009 has shown an upward trend when compared to March 2008. Major groups like
Primary Articles, Fuel, Power & Light and Manufactured Products have influenced the
index to rise during January 2009.

Guidance Bureau
Monthly Review of Tamil Nadu Economy – June 2009. 18
WHOLESALE PRICE INDEX: MARCH - 2009
(BASE:1970-71=100)
Group Name Weight March
2009
March
2008
%
variation
ALL COMMODITY INDEX 100.00 1757.21 1624.22 8.19
PRIMARY ARTICLES 52.69 1896.80 1690.33 12.21
Food Articles 32.26 2284.54 1966.35 16.08
Non-Food Articles 19.61 1291.21 1256.61 2.75
Minerals 0.82 1203.39 1203.39 0.00
FUEL, POWER & LIGHT 3.26 2637.29 2562.06 2.94
Manufactured Products 44.05 1526.62 1475.74 3.45
Food Products 6.76 1685.48 1618.47 4.14
Beverages, Tobacco& Products 0.25 21270.06 21270.06 0.00
Textiles 8.95 1508.77 1497.98 0.72
Paper & Paper Products 1.05 1768.70 1644.70 7.54
Leather & Leather Products 2.43 1045.16 1046.49 -0.13
Rubber & Rubber Products 1.52 1198.82 1080.66 10.93
Chemical & Chemical Products 3.39 1539.43 1378.12 11.71
Non-Metallic Mineral Products 1.46 2283.07 2129.98 7.19
Basic Metals, Alloys & Metal Products
2.34 1857.89 1761.21 5.49
Machinery and Transport Equipment
10.98 1216.50 1177.17 3.34
Miscellaneous Products 4.92 935.02 935.02 0.00

Guidance Bureau
Monthly Review of Tamil Nadu Economy – June 2009. 19
CENTREWISE CONSUMER PRICE INDEX
131
131
132
145
149
145
146
141 147
137
133
132
120
125
130
135
140
145
150
155
CHENNAI TRICHY MADURAI COIMBATORE COONOOR SALEM
CENTRE
POINTS
May 2009
May 2008
CCOONNSSUUMMEERR PPRR IICCEE II NNDDEEXX
(( ii )) CC oonn ss uummee rr PP rr ii cc ee II nn dd ee xx NN uummbb ee rr ff oo rr II nn dd uu ss tt rr ii aa ll WWoo rr kk ee rr ss ::
(Base year: 2001 =100)
The Consumer Price Index Number for Industrial Workers for Tamil Nadu
has moved up by 13 Points from 133 in May 2008 to 146 in May 2009, exhibiting an
increase of 9.77%. Centre-wise Index shows an increasing trend from 9 Points to 15
Points over the period of May 2008. All India Consumer Price Index increased from 139
Points in May 2008 to 151 Points in May 2009 indicating an increase of 13%.
TABLE – 1
CONSUMER PRICE INDEX NUMBER FOR INDUSTRIAL WORKERS
(BASE 2001 = 100)
CENTRES/Index
Central Series
MONTH/
YEAR
Chennai Tiruchy Madurai Coimbatore Coonoor Salem
TAMIL
NADU
ALL
INDIA
May 2009 145 149 145 146 141 147 146 151
May 2008 131 137 131 133 132 132 133 139
Increase in Points 14 12 14 13 9 15 13 12
Source: Director, Labour Bureau, Shimla.
Guidance Bureau
Monthly Review of Tamil Nadu Economy – June 2009. 20
151
139
146
133
120
125
130
135
140
145
150
155
TAMIL NADU ALL INDIA
May'2009
May'2008
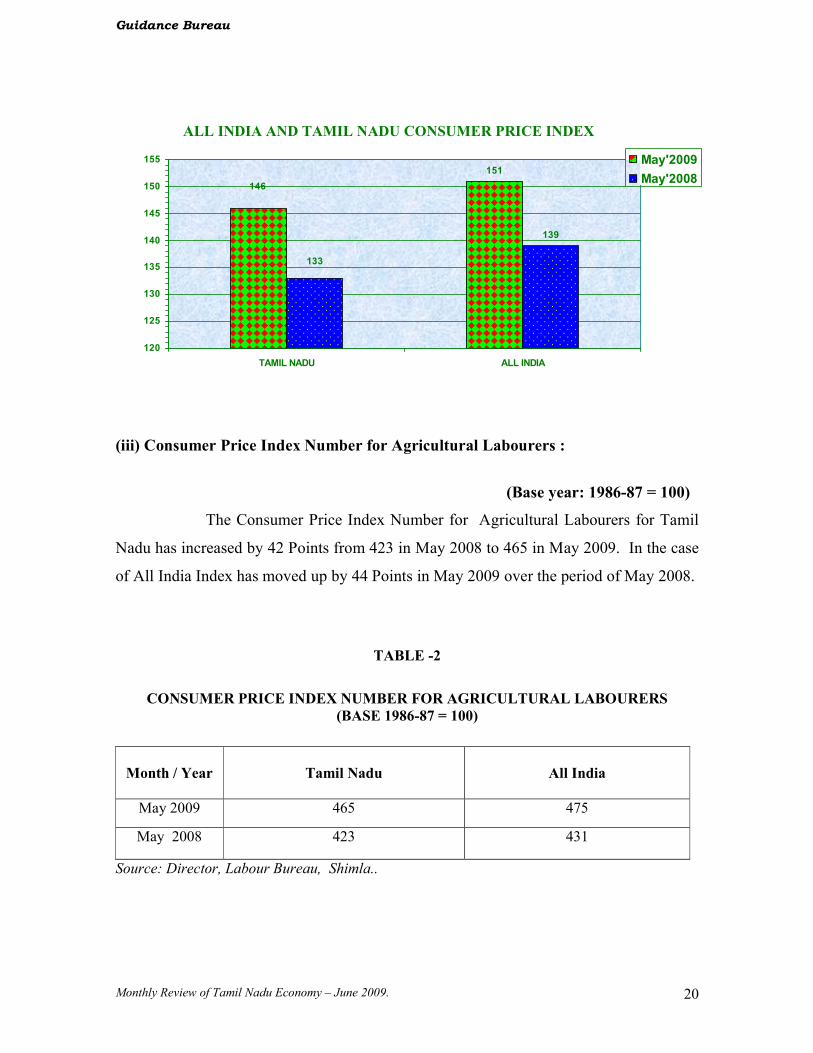
ALL INDIA AND TAMIL NADU CONSUMER PRICE INDEX
(iii) Consumer Price Index Number for Agricultural Labourers :
(Base year: 1986-87 = 100)
The Consumer Price Index Number for Agricultural Labourers for Tamil
Nadu has increased by 42 Points from 423 in May 2008 to 465 in May 2009. In the case
of All India Index has moved up by 44 Points in May 2009 over the period of May 2008.
TABLE -2
CONSUMER PRICE INDEX NUMBER FOR AGRICULTURAL LABOURERS (BASE 1986-87 = 100)
Source: Director, Labour Bureau, Shimla..
Month / Year
Tamil Nadu
All India
May 2009 465 475
May 2008 423 431
Guidance Bureau
Monthly Review of Tamil Nadu Economy – June 2009. 21
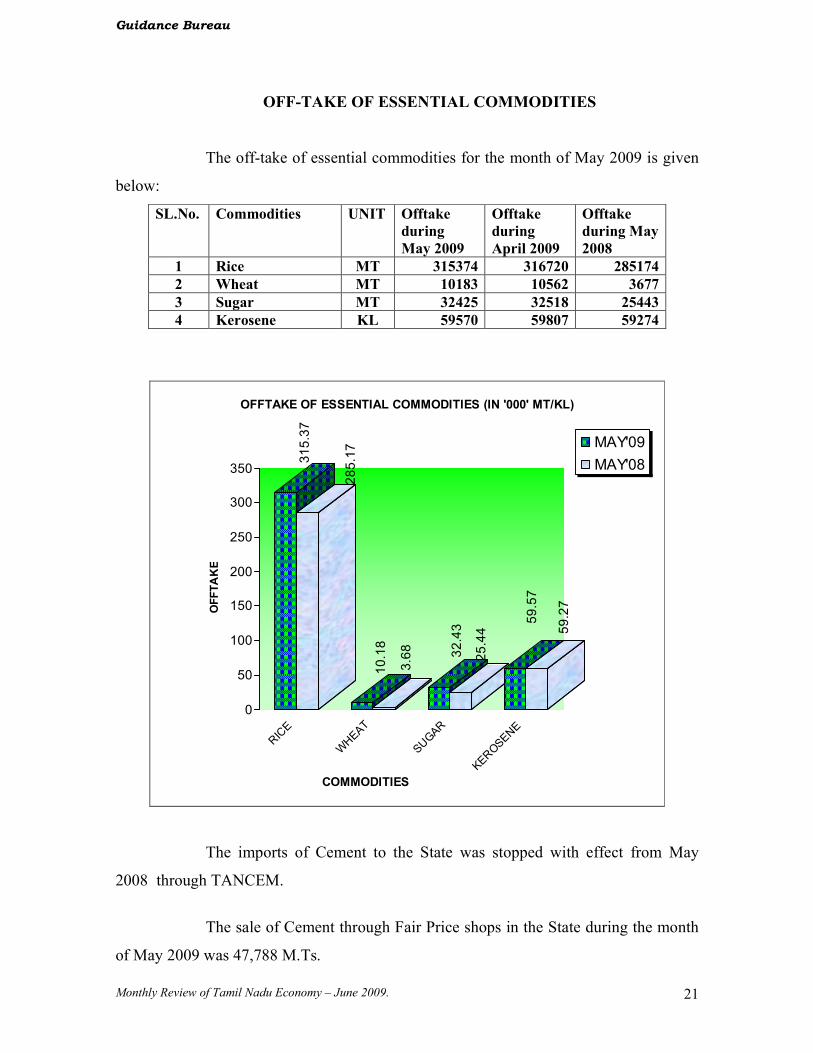
OFF-TAKE OF ESSENTIAL COMMODITIES
The off-take of essential commodities for the month of May 2009 is given
below:
SL.No. Commodities UNIT Offtake
during
May 2009
Offtake
during
April 2009
Offtake
during May
2008
1 Rice MT 315374 316720 285174
2 Wheat MT 10183 10562 3677
3 Sugar MT 32425 32518 25443
4 Kerosene KL 59570 59807 59274
315.37
285.17
10.18
3.68 32.43
25.44
59.57
59.27
0
50
100
150
200
250
300
350
OFFTAKE
RICE
WHEAT
SUGAR
KEROSENE
COMMODITIES
OFFTAKE OF ESSENTIAL COMMODITIES (IN '000' MT/KL)
MAY'09
MAY'08
The imports of Cement to the State was stopped with effect from May
2008 through TANCEM.
The sale of Cement through Fair Price shops in the State during the month
of May 2009 was 47,788 M.Ts.

Guidance Bureau
Monthly Review of Tamil Nadu Economy – June 2009. 22
IINNDDUUSSTTRRIIEESS
Trend in the Index of Industrial Production in Tamil Nadu
Month: April '09 (Provisional): (Base: 1999-2000 = 100)
Industrial production grew by a more than expected 2.6% in April 2009 as
against 12.0% in April’08, which is the best performance in 5 months reversing the
contraction in four of the previous five months. (Table I)
The increase in relative overall growth in April 2009 was primarily on
account of the better performance of the three sectors viz. Mining, Manufacturing and
Electricity generation. The indices of Mining, Manufacturing and Electricity sectors have
recorded a positive growth of 5.5%, 2.5% and 2.6% respectively during April’09 as
against -1.0%, 13.5% and 5.5% respectively in April’08. (Table I)
TTAABBLLEE II
SSeeccttoorr--wwiissee IInnddeexx ooff IInndduussttrriiaall PPrroodduuccttiioonn iinn TTaammiill NNaadduu
MMoonntthh:: AApprriill’’0099((PPrroovviissiioonnaall)) ((BBaassee:: 11999999--22000000==110000))
April’09 April’08
Sector Weight Index
% Growth
over
Apr' 08
Index
% Growth
over
Apr'07
Mining 28.72 152.1 5.5 144.2 -1.0
Manufacturing * 811.37 169.2 2.5 165.1 13.5
Electricity 159.91 144.7 2.6 141.1 5.5
General Index 1000.00 164.8 2.6 160.7 12.0
* relating to selected registered factories under section 2m(i) & 2m(ii) of the Factories
Act 1948.
152.1
144.2
169.2
165.1
144.7
141.1
125
130135140
145150155160
165170
INDEX
Mining Manufacturing Electricity
SECTOR
SECTORWISE INDEX
April '09
April '08
Guidance Bureau
Monthly Review of Tamil Nadu Economy – June 2009. 23
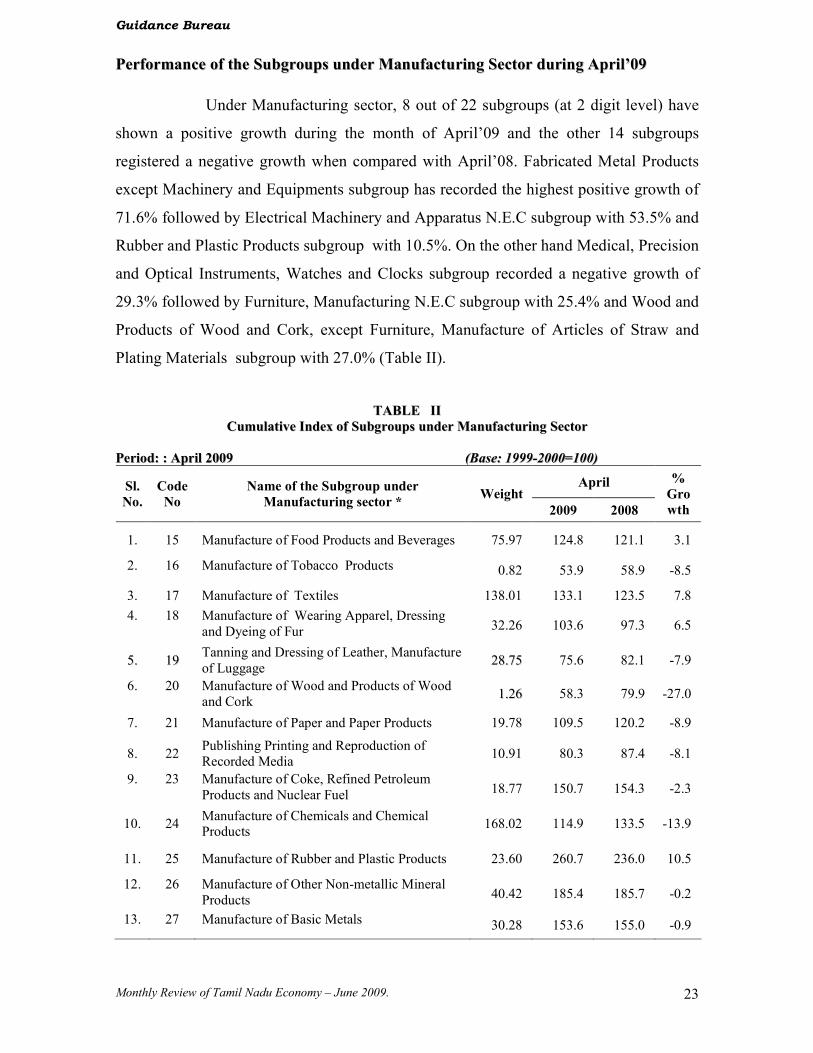
PPeerrffoorrmmaannccee ooff tthhee SSuubbggrroouuppss uunnddeerr MMaannuuffaaccttuurriinngg SSeeccttoorr dduurriinngg AApprriill’’0099
Under Manufacturing sector, 8 out of 22 subgroups (at 2 digit level) have
shown a positive growth during the month of April’09 and the other 14 subgroups
registered a negative growth when compared with April’08. Fabricated Metal Products
except Machinery and Equipments subgroup has recorded the highest positive growth of
71.6% followed by Electrical Machinery and Apparatus N.E.C subgroup with 53.5% and
Rubber and Plastic Products subgroup with 10.5%. On the other hand Medical, Precision
and Optical Instruments, Watches and Clocks subgroup recorded a negative growth of
29.3% followed by Furniture, Manufacturing N.E.C subgroup with 25.4% and Wood and
Products of Wood and Cork, except Furniture, Manufacture of Articles of Straw and
Plating Materials subgroup with 27.0% (Table II).
TTAABBLLEE IIII
CCuummuullaattiivvee IInnddeexx ooff SSuubbggrroouuppss uunnddeerr MMaannuuffaaccttuurriinngg SSeeccttoorr
PPeerriioodd:: :: AApprriill 22000099 ((BBaassee:: 11999999--22000000==110000))
April Sl.
No.
Code
No
Name of the Subgroup under
Manufacturing sector * Weight
2009 2008
%
Gro
wth
1. 15 Manufacture of Food Products and Beverages 75.97 124.8 121.1 3.1
2. 16 Manufacture of Tobacco Products 0.82 53.9 58.9 -8.5
3. 17 Manufacture of Textiles 138.01 133.1 123.5 7.8
4. 18 Manufacture of Wearing Apparel, Dressing and Dyeing of Fur 32.26 103.6 97.3 6.5
55.. 1199 Tanning and Dressing of Leather, Manufacture of Luggage
2288..7755 75.6 82.1 -7.9
6. 20 Manufacture of Wood and Products of Wood and Cork
11..2266 58.3 79.9 -27.0
7. 21 Manufacture of Paper and Paper Products 19.78 109.5 120.2 -8.9
8. 22 Publishing Printing and Reproduction of Recorded Media
10.91 80.3 87.4 -8.1
9. 23 Manufacture of Coke, Refined Petroleum Products and Nuclear Fuel 18.77 150.7 154.3 -2.3
10. 24 Manufacture of Chemicals and Chemical Products
168.02 114.9 133.5 -13.9
11. 25 Manufacture of Rubber and Plastic Products 23.60 260.7 236.0 10.5
12. 26 Manufacture of Other Non-metallic Mineral Products 40.42 185.4 185.7 -0.2
13. 27 Manufacture of Basic Metals 30.28 153.6 155.0 -0.9
Guidance Bureau
Monthly Review of Tamil Nadu Economy – June 2009. 24
TTAABBLLEE IIII ((CCoonnttdd..))
April Sl.
No.
Code
No
Name of the Subgroup under
Manufacturing sector * Weight
2009 2008
%
Gro
wth
14. 28 Manufacture of Fabricated Metal Products Except Machinery & Equipment
34.97 288.1 167.9 71.6
15. 29 Manufacture of Machinery & Equipment n.e.c 53.89 320.1 318.6 0.5
16. 30 Manufacture of Office Accounting and Computing Machinery
0.92 0.0 32.8 -
100.0
17. 31 Manufacture of Electrical Machinery and Apparatus n.e.c
13.60 374.0 243.7 53.5
18. 32 Manufacture of Radio, Television and Communication Equipment & Apparatus
7.45 272.0 272.2 -0.1
19. 33 Manufacture of Medical Precision & Optical Instruments, Watches and Clock
10.44 75.6 106.9 -29.3
20. 34 Manufacture of Motor Vehicles, Trailers and Semi –Trailers
82.45 281.5 293.8 -4.2
21. 35 Manufacture of Other Transport Equipment 14.23 119.1 108.6 9.7
22. 36 Manufacture of Furniture, Manufacturing n.e.c 4.77 60.4 81.0 -25.4
* relating to selected registered factories under section 2m(i) & 2m(ii) of the Factories Act 1948. Note: n.e.c.-not elsewhere classified.
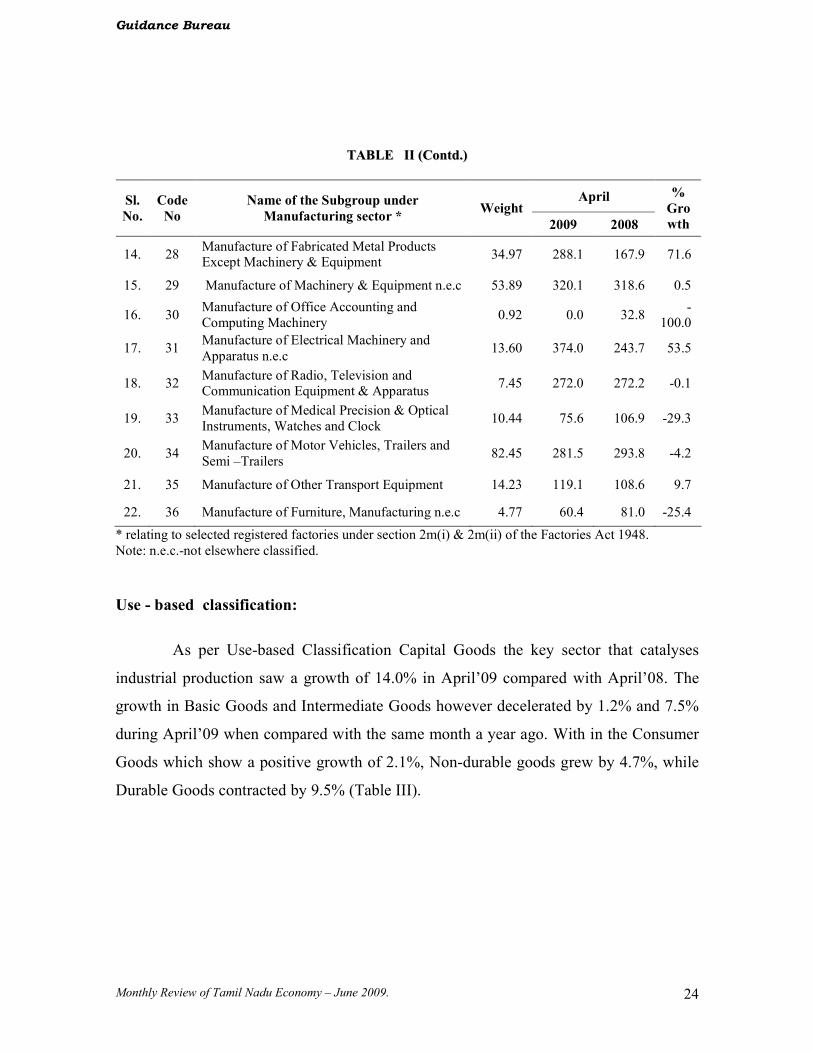
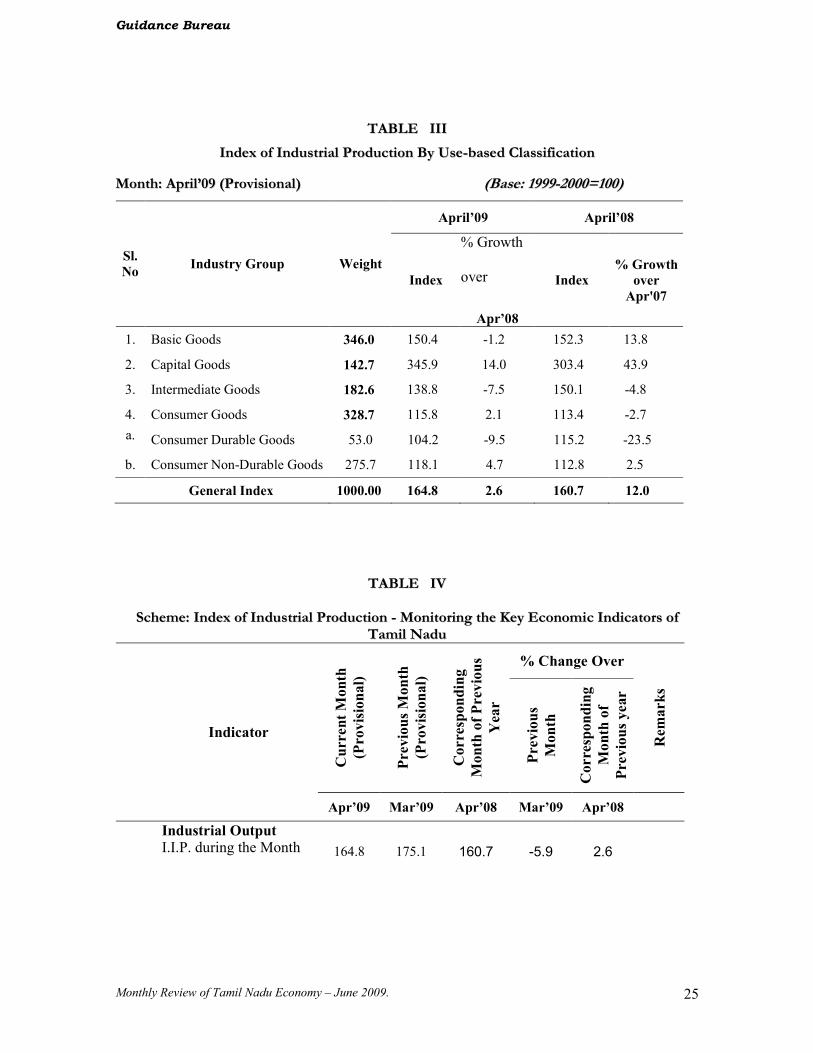
Use - based classification:
As per Use-based Classification Capital Goods the key sector that catalyses
industrial production saw a growth of 14.0% in April’09 compared with April’08. The
growth in Basic Goods and Intermediate Goods however decelerated by 1.2% and 7.5%
during April’09 when compared with the same month a year ago. With in the Consumer
Goods which show a positive growth of 2.1%, Non-durable goods grew by 4.7%, while
Durable Goods contracted by 9.5% (Table III).
Guidance Bureau
Monthly Review of Tamil Nadu Economy – June 2009. 25
TTAABBLLEE IIIIII
IInnddeexx ooff IInndduussttrriiaall PPrroodduuccttiioonn BByy UUssee--bbaasseedd CCllaassssiiffiiccaattiioonn
MMoonntthh:: AApprriill’’0099 ((PPrroovviissiioonnaall)) ((BBaassee:: 11999999--22000000==110000))
April’09 April’08
Sl.
No Industry Group Weight
Index
% Growth
over
Apr’08
Index
% Growth
over
Apr'07
1. Basic Goods 346.0 150.4 -1.2 152.3 13.8
2. Capital Goods 142.7 345.9 14.0 303.4 43.9
3. Intermediate Goods 182.6 138.8 -7.5 150.1 -4.8
4. Consumer Goods 328.7 115.8 2.1 113.4 -2.7
a. Consumer Durable Goods 53.0 104.2 -9.5 115.2 -23.5
b. Consumer Non-Durable Goods 275.7 118.1 4.7 112.8 2.5
General Index 1000.00 164.8 2.6 160.7 12.0
TTAABBLLEE IIVV
SScchheemmee:: IInnddeexx ooff IInndduussttrriiaall PPrroodduuccttiioonn -- MMoonniittoorriinngg tthhee KKeeyy EEccoonnoommiicc IInnddiiccaattoorrss ooff
TTaammiill NNaadduu
% Change Over
Current Month
(Provisional)
Previous Month
(Provisional)
Corresponding
Month of Previous
Year
Previous
Month
Corresponding
Month of
Previous year
Remarks
Indicator
Apr’09 Mar’09 Apr’08 Mar’09 Apr’08
Industrial Output
I.I.P. during the Month 164.8 175.1 160.7 -5.9 2.6

Guidance Bureau
Monthly Review of Tamil Nadu Economy – June 2009. 26
Index of Industrial Production by Use-based
Classification
118.1
104.2
138.8
115.8 345.9
150.4
Basic Goods
Capital Goods
Intermediate Goods
Consumer Goods
Consumer Durable Goods
Consumer Non-Durable Goods

Guidance Bureau
Monthly Review of Tamil Nadu Economy – June 2009. 27
LABOUR
The number of strikes and lockouts, number of workers involved along
with the mandays lost From February 2009 to April 2009 have been furnished below:
DDEETTAAIILLSS OOFF SSTTRRIIKKEESS AANNDD LLOOCCKKOOUUTTSS FFRROOMM FFEEBBRRUUAARRYY TTOO AAPPRRIILL 22000099
Number of Strikes and
Lockouts Number of Workers
affected Mandays lost Name of the
Industry Feb.’09 Mar.’09 Apr.’09 Feb.’09 Mar.’09 Apr.’09 Feb.’09 Mar.’09 Apr.’09
Textiles 3 3 1 479 547 200 18826 29983 33112
Engineering 0 0 0 0 0 0 0 0 0
Tannery 0 0 0 0 0 0 12360 12875 12360
Beedi & Cigar
1 0 0 60 0 0 360 0 0
Plantation 0 0 0 0 0 0 3430 0 0
Others 1 0 3 119 0 1226 2023 0 15290
Total 5 3 4 658 547 1426 36999 42858 60762
Source: Commissioner of Labour, Chennai-6.
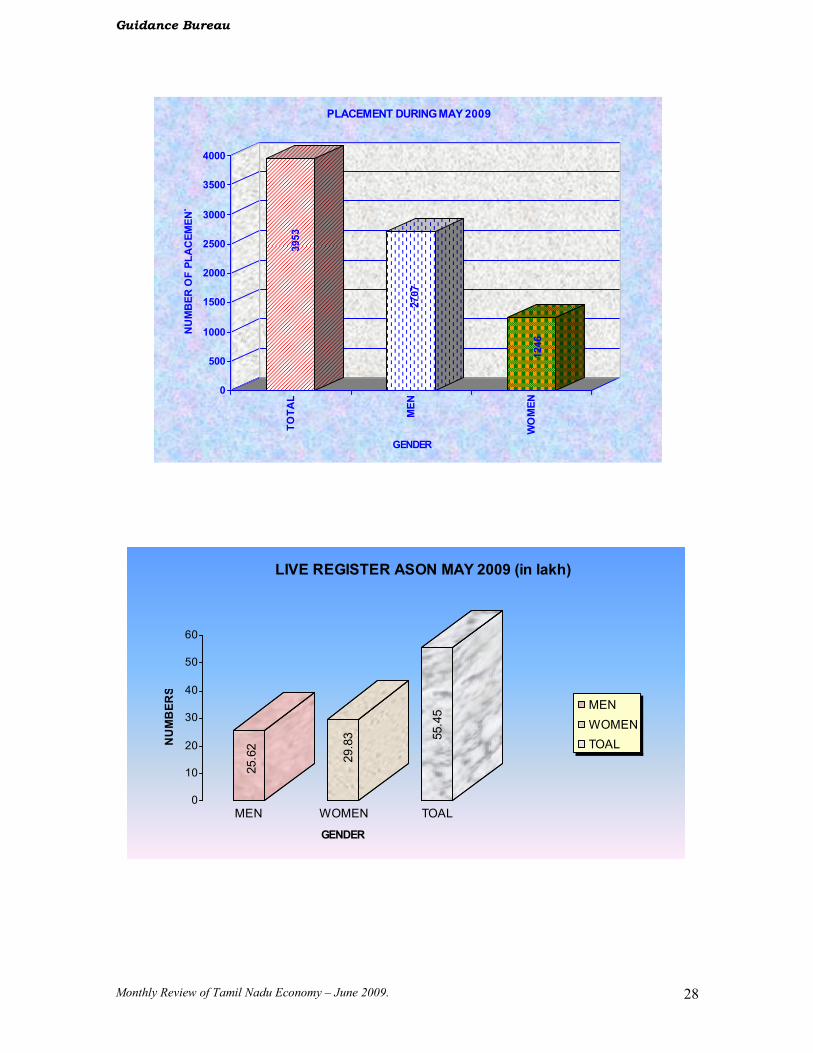
MANPOWER AND EMPLOYMENT SITUATION OF TAMIL NADU
Month: May-2009.
Number of Job seekers:
The number of job-seekers as per the Live-Registers maintained by all the
Employment Exchanges in Tamil Nadu at the end of May-2009 stood at 55.45 lakhs, out
of which 53.80 per cent is Women (29.83 lakhs).
Placements:
During the month of May 2009, the total number of placement is 3,953 out
of which 1,246 Women are placed.
Placement Total No. as per Live Register
Men Women Total Men Women Total 1 2 3 4 5 6
2707 1246 3953 2562009 2983269 5545278
Guidance Bureau
Monthly Review of Tamil Nadu Economy – June 2009. 28
3953
2707
1246
0
500
1000
1500
2000
2500
3000
3500
4000
NUMBER OF PLACEMENT
TOTAL
MEN
WOMEN
GENDER
PLACEMENT DURING MAY 2009
25.62
29.83 55.45
0
10
20
30
40
50
60
NUMBERS
MEN WOMEN TOAL
GENDER
LIVE REGISTER ASON MAY 2009 (in lakh)
MEN
WOMEN
TOAL

Guidance Bureau
Monthly Review of Tamil Nadu Economy – June 2009. 29
EELLEECCTTRRIICC IITTYY
Total Power Generation during the month of May 2009 is 2048.347 MU as
against 2490.628 MU during May 2008, reflecting a decrease of 17.76%. During the
current month, Power Generation from Hydro, Thermal and Wind indicating a lower
trend by 39.45%, 16.65% and 57.73% respectively in comparison with May 2008.
However, Power Generation for ‘Gas’ moved up considerably by 8.84% to that of
previous year. The Power Purchase from Traders was 363.194 MU during May 2009,
whereas it is 252.816 MU in May 2008 showing notable 43.66%.
Total availability of Power during May 2009 is 6002.526 M.U. as against
5984.338 M.U. in May 2008, showing a marginal increase of 0.30%.
During the Month of From April to May
Item
May 2009
May 2008
% Variationover 2008
2009 2008
% Variationover 2008
I. Installed Capacity (MW) 10214 10122 0.91 10214 10122 0.91
II. Power Generation (MU) 2048.347 2490.628 -17.76 4413.234 5047.081 -12.56
Hydro 206.568 341.145 -39.45 485.103 774.905 -37.40
Thermal 1623.835 1948.099 -16.65 3460.058 3878.018 -10.78
Wind 0.788 1.864 -57.73 0.919 1.920 -52.14
Gas 217.156 199.520 8.84 467.154 392.238 19.10
III. Power Purchase (MU) 3590.986 3243.795 10.70 6708.735 6125.162 9.53
Purchases from Traders 363.194 252.816 43.66 647.407 510.003 29.64
Sale / Swap power return through Traders
0.000 2.900 -- 0.000 0.000 --
IV. Total Availability (MU) 6002.526 5984.338 0.30 11769.376 11682.246 0.75
V. Peak Demand (MW) 9764 9505 2.72 9764 9505 2.72
(Instantaneous) 12/5/09 28/5/08 -- 12/05/09 28/5/08 --
Note: The Generation & Purchase figures for the month of May-2009 are Provisional. Source: Tamil Nadu Electricity Board, Chennai-2.
Guidance Bureau
Monthly Review of Tamil Nadu Economy – June 2009. 30
206.568
341.145
1623.835
1948.099
0.788
1.864
217.156
199.52
0
200
400
600
800
1000
1200
1400
1600
1800
2000
POWER ( in M.U.)
Hydro Thermal Wind Gas
SOURCE OF POWER
POWER GENERATION BYSOURCE
May-09 May-08

Guidance Bureau
Monthly Review of Tamil Nadu Economy – June 2009. 31
TTAAXX RREEVVEENNUUEE CCOOLLLLEECCTTEEDD
Total Tax collected from the Department of Commercial Tax during the
month May 2009 is Rs.1894.25 Crores recording an increase of 5.01% over the period
of May 2008. The Tax collection from VAT and Betting Tax have registered an upward
trend by 8.78% and 31.43% respectively. In the case of TNGST, CST, Entertainment
Tax, Luxury Tax, Entry Tax – Goods and Vehicles have indicated lower trend by
32.77%, 21.93%, 28.07%, 18.07%, 94.57 and 2.51% respectively.
(( RR ss .. ii nn CC rr oo rr ee ss ))
During the Month Upto the Month
Sl. No.
Tax
May
20
09
May
20
08
%
Var
iati
on
over
2
00
8
May
20
09
May
20
08
%
Var
iati
on
over
2
00
8
% Contri-bution upto May 2009
1. VAT 1673.91 1538.82 8.78 3390.36 3087.81 9.80 86.94
2. TNGST 15.18 22.58 -32.77 31.44 53.04 -40.72 0.81
3. VAT + TNGST 1689.09 1561.40 8.18 3421.80 3140.85 8.95 87.75
4. CST 110.02 140.92 -21.93 279.02 342.40 -18.51 7.16
5. ENTERTAINMENT TAX 0.82 1.14 -28.07 1.82 2.06 -11.65 0.05
6. BETTING TAX 0.46 0.35 31.43 1.13 0.96 17.71 0.03
7. LUXURY TAX 12.74 15.55 -18.07 24.91 29.10 -14.40 0.63
8. ENTRY TAX – GOODS 0.07 1.29 -94.57 0.18 2.66 -93.23 0.00
9. ENTRY TAX - VEHICLES
81.05 83.14 -2.51 170.63 187.76 -9.12 4.38
TOTAL 1894.25 1803.79 5.01 3899.49 3705.79 5.23 100.00
Source: Commercial Taxes Department, Chennai - 600 005.
Note: i) TNGST Act has been replaced by VAT Act, only Arrears are collected under TNGST Act. Hence, the negative growth rate under TNGST. ii) The Entry Tax on Goods Act had been struck down by High Court of Madras in the case of ITC Ltd. Hence, lesser collection.
Guidance Bureau
Monthly Review of Tamil Nadu Economy – June 2009. 32
1673.91
1538.82
15.18
22.58 110.02
140.92
0.82
1.14
0.46
0.35
12.74
15.55
0.07
1.29 81.05
83.14
0
200
400
600
800
1000
1200
1400
1600
1800
VALUE IN CRORES
VAT
TNGST
CST
Entertainment Tax
Betting Tax
Luxury Tax
Entry Tax - Goods
Entry Tax - Vehicles
ACT
TAX COLLECTED FROM COMMERCIAL TAX DEPT.
May'2009
May'2008
Guidance Bureau
Monthly Review of Tamil Nadu Economy – June 2009. 33
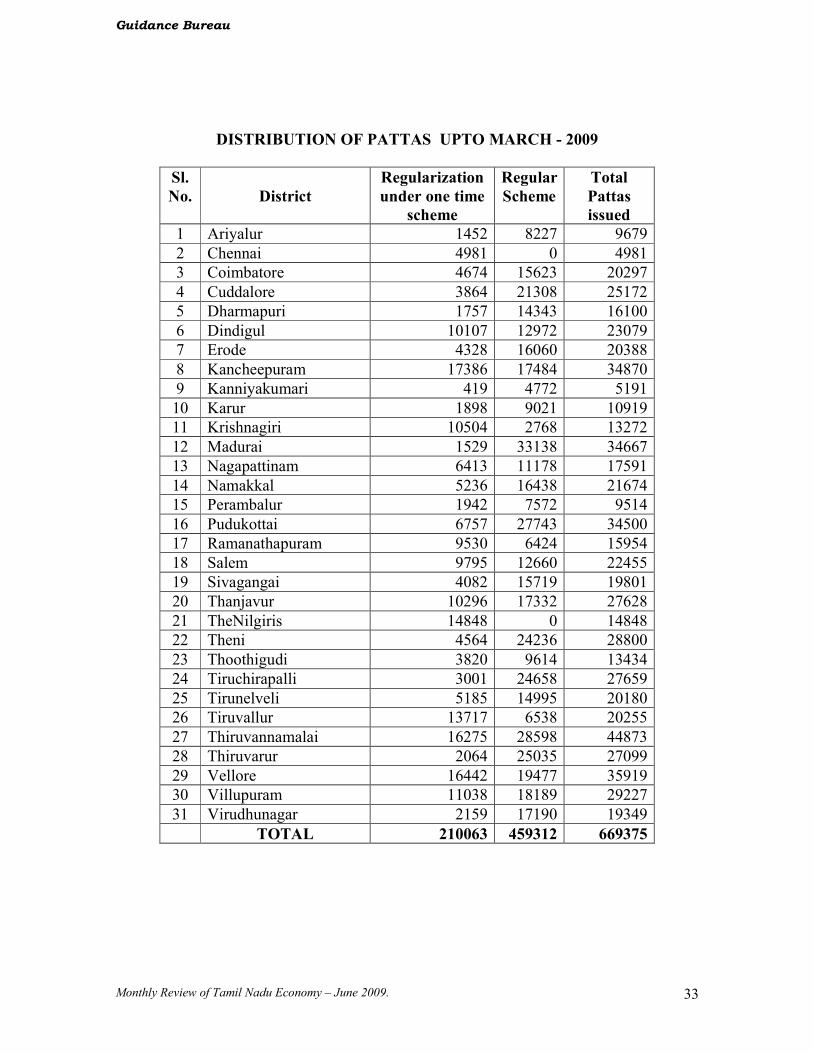
DISTRIBUTION OF PATTAS UPTO MARCH - 2009
Sl.
No.
District
Regularization
under one time
scheme
Regular
Scheme
Total
Pattas
issued
1 Ariyalur 1452 8227 9679
2 Chennai 4981 0 4981
3 Coimbatore 4674 15623 20297
4 Cuddalore 3864 21308 25172
5 Dharmapuri 1757 14343 16100
6 Dindigul 10107 12972 23079
7 Erode 4328 16060 20388
8 Kancheepuram 17386 17484 34870
9 Kanniyakumari 419 4772 5191
10 Karur 1898 9021 10919
11 Krishnagiri 10504 2768 13272
12 Madurai 1529 33138 34667
13 Nagapattinam 6413 11178 17591
14 Namakkal 5236 16438 21674
15 Perambalur 1942 7572 9514
16 Pudukottai 6757 27743 34500
17 Ramanathapuram 9530 6424 15954
18 Salem 9795 12660 22455
19 Sivagangai 4082 15719 19801
20 Thanjavur 10296 17332 27628
21 TheNilgiris 14848 0 14848
22 Theni 4564 24236 28800
23 Thoothigudi 3820 9614 13434
24 Tiruchirapalli 3001 24658 27659
25 Tirunelveli 5185 14995 20180
26 Tiruvallur 13717 6538 20255
27 Thiruvannamalai 16275 28598 44873
28 Thiruvarur 2064 25035 27099
29 Vellore 16442 19477 35919
30 Villupuram 11038 18189 29227
31 Virudhunagar 2159 17190 19349
TOTAL 210063 459312 669375
Guidance Bureau
Monthly Review of Tamil Nadu Economy – June 2009. 34
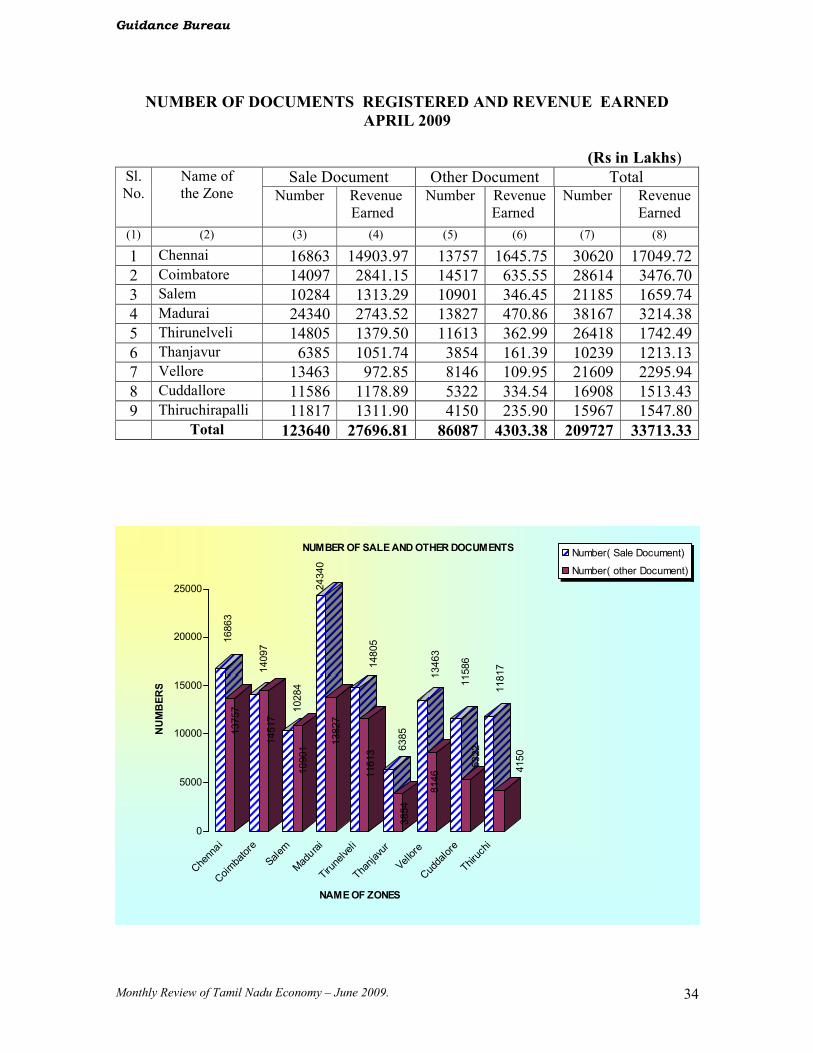
NUMBER OF DOCUMENTS REGISTERED AND REVENUE EARNED
APRIL 2009
(Rs in Lakhs)
Sale Document Other Document Total Sl. No.
Name of the Zone Number Revenue
Earned Number Revenue
Earned Number
Revenue Earned
(1) (2) (3) (4) (5) (6) (7) (8)
1 Chennai 16863 14903.97 13757 1645.75 30620 17049.72
2 Coimbatore 14097 2841.15 14517 635.55 28614 3476.70
3 Salem 10284 1313.29 10901 346.45 21185 1659.74
4 Madurai 24340 2743.52 13827 470.86 38167 3214.38
5 Thirunelveli 14805 1379.50 11613 362.99 26418 1742.49
6 Thanjavur 6385 1051.74 3854 161.39 10239 1213.13
7 Vellore 13463 972.85 8146 109.95 21609 2295.94
8 Cuddallore 11586 1178.89 5322 334.54 16908 1513.43
9 Thiruchirapalli 11817 1311.90 4150 235.90 15967 1547.80
Total 123640 27696.81 86087 4303.38 209727 33713.33
16863
13757
14097
14517
10284
10901
24340
13827
14805
11613 6385
3854
13463
8146
11586
5322
11817
4150
0
5000
10000
15000
20000
25000
NUMBERS
Chennai
Coimbatore
Salem
Madurai
Tirunelveli
Thanjavur
Vellore
Cuddalore
Thiruchi
NAME OF ZONES
NUMBER OF SALE AND OTHER DOCUMENTSNumber( Sale Document)
Number( other Document)
Guidance Bureau
Monthly Review of Tamil Nadu Economy – June 2009. 35
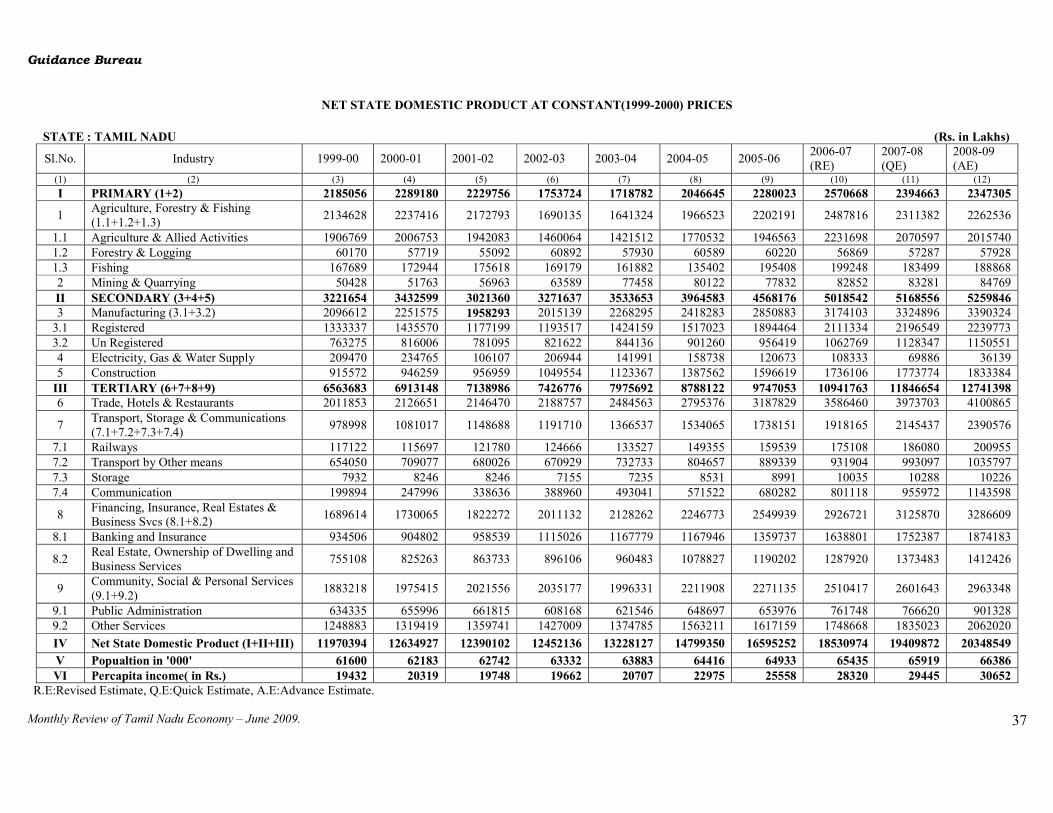
STATE INCOME
The Gross State Domestic Product (GSDP) at factor cost at constant prices (Base
1999-2000) for Tamil Nadu is Rs.209302/- Crore during 2006-07(Revised Estimate)
registering an increase of 11.29% over the previous year. The GSDP for 2007-08(Quick
Estimate) is Rs.218538./-Crore and 2008-09 (Advance Estimate) is Rs.228479./-Crore
registering an increase in growth rate of 4.41% and 4.55% respectively over the previous
years.
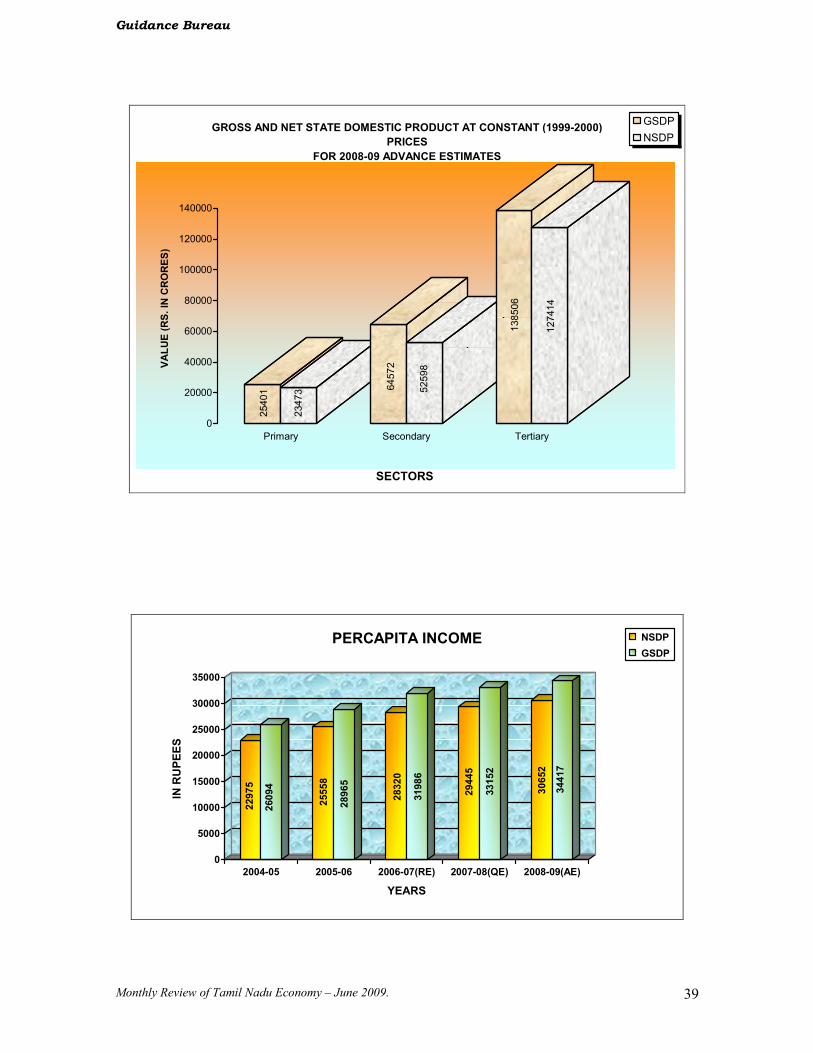
Trend of Growth and performance of major sectors of the economy
Primary Sector:
In the primary sector, the growth registered in the year 2006-07 (Revised
Estimate) is 12.64%, a high growth rate when compared with the previous year. This is
mainly due to the good performance of agriculture and allied activities sector (14.65%).
The growth rate of primary sector has registered a negative trend in both the years
2007-08(-6.81%) and 2008-09(-1.92%) .
Secondary Sector:
The Secondary Sector maintained a positive growth rate in 2006-07(RE),
2007-08 (QE) and 2008-09(AE)). Thus the growth rates observed for these years stood at
9.45%, 2.25% and 1.00% respectively when compared to previous years.
Tertiary Sector:
The growth of Tertiary Sector shown an increase of 11.96% in 2006-07 (RE)
followed by positive trends for subsequent years by 8.17% in 2007-08(QE) and 7.62% in
2008-09 (AE).
General:
In general, all the three major sectors of the economy fared well during
2006-07(RE), with a special mention to agriculture and allied activities sector. It is
noticed, that whenever the primary sector has achieved a high growth rate as a result of
good performance of agriculture, there is a simultaneous increase in the growth rate of
over all Gross State Domestic Product.

Guidance Bureau
Monthly Review of Tamil Nadu Economy – June 2009. 36
GROSS STATE DOMESTIC PRODUCT AT CONSTANT (1999-2000) PRICES
STATE : TAMIL NADU (Rs. in Lakhs)
Sl.No. Industry 1999-00 2000-01 2001-02 2002-03 2003-04 2004-05 2005-06 2006-07
(RE) 2007-08
(QE) 2008-09
(AE) (1) (2) (3) (4) (5) (6) (7) (8) (9) (10) (11) (12)
I PRIMARY (1+2) 2330844 2443098 2394974 1923591 1897103 2222732 2467454 2779283 2589892 2540089
1 Agriculture, Forestry & Fishing (1.1+1.2+1.3)
2266414 2374529 2319189 1842664 1798003 2121774 2369290 2674788 2484856 2433175
1.1 Agriculture & Allied Activities 2016886 2121047 2062278 1584438 1548538 1897115 2079101 2383651 2211580 2152988
1.2 Forestry & Logging 62834 59860 56832 63303 59931 62878 63154 59640 60078 60750
1.3 Fishing 186694 193622 200079 194923 189534 161781 227035 231497 213198 219437
2 Mining & Quarrying 64430 68568 75785 80927 99100 100958 98164 104496 105036 106913
II SECONDARY (3+4+5) 3967721 4257971 3791907 4167380 4443776 4974991 5712640 6252664 6393606 6457235
3 Manufacturing (3.1+3.2) 2653706 2853434 2597339 2696813 3005498 3232728 3764411 4191349 4389406 4475781
3.1 Registered 1737944 1871860 1643435 1689150 1955852 2097984 2546283 2837770 2952305 3010400
3.2 Un Registered 915762 981575 953905 1007663 1049646 1134744 1218128 1353579 1437101 1465381
4 Electricity, Gas & Water Supply 374475 433071 209082 387184 276756 309815 301220 270417 174447 90208
5 Construction 939540 971466 985485 1083383 1161522 1432448 1647008 1790898 1829754 1891245
III TERTIARY (6+7+8+9) 7119954 7505413 7797319 8138537 8740619 9610733 10627523 11898243 12870278 13850589
6 Trade, Hotels & Restaurants 2054383 2173064 2196249 2239478 2542330 2861978 3259065 3666604 4062501 4192504
7 Transport, Storage & Communications (7.1+7.2+7.3+7.4)
1184772 1299827 1394979 1460997 1654427 1843712 2058002 2255230 2515762 2794142
7.1 Railways 153120 151614 156671 157980 164024 179971 189418 206486 219424 236965
7.2 Transport by Other means 764269 836600 821604 832459 913105 1003100 1096210 1148677 1224104 1276736
7.3 Storage 8412 8745 8787 7667 7808 9127 9666 10788 11060 10993
7.4 Communication 258971 302867 407917 462891 569489 651514 762708 889279 1061174 1269448
8 Financing, Insurance, Real Estates & Business Svcs (8.1+8.2)
1834162 1891451 2006934 2218534 2359538 2496971 2823832 3222062 3440945 3612339
8.1 Banking and Insurance 962142 934496 989611 1148679 1204120 1202831 1396864 1677937 1794236 1918940
8.2 Real Estate, Ownership of Dwelling and Business Services
872020 956955 1017323 1069855 1155418 1294140 1426968 1544125 1646709 1693399
9 Community, Social & Personal Services (9.1+9.2)
2046637 2141071 2199157 2219528 2184325 2408072 2486625 2754346 2851071 3251604
9.1 Public Administration 759074 779329 790666 734810 746934 776536 784744 914066 919912 1081556
9.2 Other Services 1287563 1361742 1408491 1484718 1437391 1631536 1701881 1840280 1931159 2170048
IV Gross State Domestic Product
(I+II+III) 13418520 14206482 13984200 14229507 15081498 16808456 18807617 20930190 21853777 22847912
V Popualtion in '000' 61600 62183 62742 63332 63883 64416 64933 65435 65919 66386
VI Percapita income( in Rs.) 21783 22846 22288 22468 23608 26094 28965 31986 33152 34417
R.E:Revised Estimate, Q.E:Quick Estimate, A.E:Advance Estimate.
Guidance Bureau
Monthly Review of Tamil Nadu Economy – June 2009. 37
NET STATE DOMESTIC PRODUCT AT CONSTANT(1999-2000) PRICES
STATE : TAMIL NADU (Rs. in Lakhs)
Sl.No. Industry 1999-00 2000-01 2001-02 2002-03 2003-04 2004-05 2005-06 2006-07 (RE)
2007-08 (QE)
2008-09 (AE)
(1) (2) (3) (4) (5) (6) (7) (8) (9) (10) (11) (12)
I PRIMARY (1+2) 2185056 2289180 2229756 1753724 1718782 2046645 2280023 2570668 2394663 2347305
1 Agriculture, Forestry & Fishing (1.1+1.2+1.3)
2134628 2237416 2172793 1690135 1641324 1966523 2202191 2487816 2311382 2262536
1.1 Agriculture & Allied Activities 1906769 2006753 1942083 1460064 1421512 1770532 1946563 2231698 2070597 2015740
1.2 Forestry & Logging 60170 57719 55092 60892 57930 60589 60220 56869 57287 57928
1.3 Fishing 167689 172944 175618 169179 161882 135402 195408 199248 183499 188868
2 Mining & Quarrying 50428 51763 56963 63589 77458 80122 77832 82852 83281 84769
II SECONDARY (3+4+5) 3221654 3432599 3021360 3271637 3533653 3964583 4568176 5018542 5168556 5259846
3 Manufacturing (3.1+3.2) 2096612 2251575 1958293 2015139 2268295 2418283 2850883 3174103 3324896 3390324
3.1 Registered 1333337 1435570 1177199 1193517 1424159 1517023 1894464 2111334 2196549 2239773
3.2 Un Registered 763275 816006 781095 821622 844136 901260 956419 1062769 1128347 1150551
4 Electricity, Gas & Water Supply 209470 234765 106107 206944 141991 158738 120673 108333 69886 36139
5 Construction 915572 946259 956959 1049554 1123367 1387562 1596619 1736106 1773774 1833384
III TERTIARY (6+7+8+9) 6563683 6913148 7138986 7426776 7975692 8788122 9747053 10941763 11846654 12741398
6 Trade, Hotels & Restaurants 2011853 2126651 2146470 2188757 2484563 2795376 3187829 3586460 3973703 4100865
7 Transport, Storage & Communications (7.1+7.2+7.3+7.4)
978998 1081017 1148688 1191710 1366537 1534065 1738151 1918165 2145437 2390576
7.1 Railways 117122 115697 121780 124666 133527 149355 159539 175108 186080 200955
7.2 Transport by Other means 654050 709077 680026 670929 732733 804657 889339 931904 993097 1035797
7.3 Storage 7932 8246 8246 7155 7235 8531 8991 10035 10288 10226
7.4 Communication 199894 247996 338636 388960 493041 571522 680282 801118 955972 1143598
8 Financing, Insurance, Real Estates & Business Svcs (8.1+8.2)
1689614 1730065 1822272 2011132 2128262 2246773 2549939 2926721 3125870 3286609
8.1 Banking and Insurance 934506 904802 958539 1115026 1167779 1167946 1359737 1638801 1752387 1874183
8.2 Real Estate, Ownership of Dwelling and Business Services
755108 825263 863733 896106 960483 1078827 1190202 1287920 1373483 1412426
9 Community, Social & Personal Services (9.1+9.2)
1883218 1975415 2021556 2035177 1996331 2211908 2271135 2510417 2601643 2963348
9.1 Public Administration 634335 655996 661815 608168 621546 648697 653976 761748 766620 901328
9.2 Other Services 1248883 1319419 1359741 1427009 1374785 1563211 1617159 1748668 1835023 2062020
IV Net State Domestic Product (I+II+III) 11970394 12634927 12390102 12452136 13228127 14799350 16595252 18530974 19409872 20348549
V Popualtion in '000' 61600 62183 62742 63332 63883 64416 64933 65435 65919 66386
VI Percapita income( in Rs.) 19432 20319 19748 19662 20707 22975 25558 28320 29445 30652
R.E:Revised Estimate, Q.E:Quick Estimate, A.E:Advance Estimate.

Guidance Bureau
Monthly Review of Tamil Nadu Economy – June 2009. 38
GROWTH RATE OF GROSS STATE DOMESTIC PRODUCT AT CONSTANT (1999-2000) PRICES
STATE : TAMIL NADU
Sl.No. Industry 2000-01 2001-02 2002-03 2003-04 2004-05 2005-06 2006-07
(RE) 2007-08
(QE) 2008-09
(AE)
(1) (2) (4) (5) (6) (7) (8) (9) (10) (11) (12)
I PRIMARY (1+2) 4.82 -1.97 -19.68 -1.38 17.16 11.01 12.64 -6.81 -1.92
1 Agriculture, Forestry & Fishing (1.1+1.2+1.3)
4.77 -2.33 -20.55 -2.42 18.01 11.67 12.89 -7.10 -2.08
1.1 Agriculture & Allied Activities 5.16 -2.77 -23.17 -2.27 22.51 9.59 14.65 -7.22 -2.65
1.2 Forestry & Logging -4.73 -5.06 11.39 -5.33 4.92 0.44 -5.56 0.73 1.12
1.3 Fishing 3.71 3.33 -2.58 -2.76 -14.64 40.33 1.97 -7.90 2.93
2 Mining & Quarrying 6.42 10.53 6.78 22.46 1.87 -2.77 6.45 0.52 1.79
II SECONDARY (3+4+5) 7.32 -10.95 9.90 6.63 11.95 14.83 9.45 2.25 1.00
3 Manufacturing (3.1+3.2) 7.53 -8.97 3.83 11.45 7.56 16.45 11.34 4.73 1.97
3.1 Registered 7.71 -12.20 2.78 15.79 7.27 21.37 11.45 4.04 1.97
3.2 Un Registered 7.19 -2.82 5.64 4.17 8.11 7.35 11.12 6.17 1.97
4 Electricity, Gas & Water Supply 15.65 -51.72 85.18 -28.52 11.95 -2.77 -10.23 -35.49 -48.29
5 Construction 3.40 1.44 9.93 7.21 23.33 14.98 8.74 2.17 3.36
III TERTIARY (6+7+8+9) 5.41 3.89 4.38 7.40 9.95 10.58 11.96 8.17 7.62
6 Trade, Hotels & Restaurants 5.78 1.07 1.97 13.52 12.57 13.87 12.50 10.80 3.20
7 Transport, Storage & Communications (7.1+7.2+7.3+7.4)
9.71 7.32 4.73 13.24 11.44 11.62 9.58 11.55 11.07
7.1 Railways -0.98 3.34 0.84 3.83 9.72 5.25 9.01 6.27 7.99
7.2 Transport by Other means 9.46 -1.79 1.32 9.69 9.86 9.28 4.79 6.57 4.30
7.3 Storage 3.96 0.47 -12.74 1.85 16.88 5.91 11.61 2.52 -0.61
7.4 Communication 16.95 34.69 13.48 23.03 14.40 17.07 16.59 19.33 19.63
8 Financing, Insurance, Real Estates & Business Svcs (8.1+8.2)
3.12 6.11 10.54 6.36 5.82 13.09 14.10 6.79 4.98
8.1 Banking and Insurance -2.87 5.90 16.07 4.83 -0.11 16.13 20.12 6.93 6.95
8.2 Real Estate, Ownership of Dwelling and Business Services
9.74 6.31 5.16 8.00 12.01 10.26 8.21 6.64 2.84
9 Community, Social & Personal Services (9.1+9.2)
4.61 2.71 0.93 -1.59 10.24 3.26 10.77 3.51 14.05
9.1 Public Administration 2.67 1.45 -7.06 1.65 3.96 1.06 16.48 0.64 17.57
9.2 Other Services 5.76 3.43 5.41 -3.19 13.51 4.31 8.13 4.94 12.37
IV Gross State Domestic Product
(I+II+III) 5.87 -1.56 1.75 5.99 11.45 11.89 11.29 4.41 4.55
R.E:Revised Estimate, Q.E:Quick Estimate, A.E:Advance Estimate
Guidance Bureau
Monthly Review of Tamil Nadu Economy – June 2009. 39
25401
23473 64572
52598
138506
127414
0
20000
40000
60000
80000
100000
120000
140000
VALUE (RS. IN CRORES)
Primary Secondary Tertiary
SECTORS
GROSS AND NET STATE DOMESTIC PRODUCT AT CONSTANT (1999-2000)
PRICES
FOR 2008-09 ADVANCE ESTIMATES
GSDP
NSDP
22975
26094
25558
28965
28320
31986
29445
33152
30652
34417
0
5000
10000
15000
20000
25000
30000
35000
IN RUPEES
2004-05 2005-06 2006-07(RE) 2007-08(QE) 2008-09(AE)
YEARS
PERCAPITA INCOME NSDP
GSDP


![VELTECH VEL MULTIMEDIA VEL HIGHTECH - · Web viewFind the heat loss per square meter and interface temperatures. [M.U. Oct. – 97] Given Inner temperature T1 = 900(C + 273 = 1173](https://img.pdfslide.us/doc/110x75/5aabf1507f8b9aa06a8c8547/veltech-vel-multimedia-vel-hightech-viewfind-the-heat-loss-per-square-meter.jpg)