Embed Size (px)
Citation preview
TMX Group Inc.
Q2-2011 Management’s Discussion and Analysis
August 4, 2011
This MD&A of TMX Group Inc.’s (TMX Group) financial condition and results of operations is provided to enable a reader to assess our financial condition, material changes in our financial condition and our results of operations, including our liquidity and capital resources, for the quarter and six months ended June 30, 2011, compared with the quarter and six months ended June 30, 2010 or the year ended December 31, 2010. This MD&A is dated August 4, 2011 and should be read carefully together with our Q2/11 unaudited interim condensed consolidated financial statements, including notes, for the corresponding period which are prepared in accordance with International Financial Reporting Standards (IFRS). Each of these documents is filed with Canadian securities regulators and can be accessed through www.sedar.com or our website at www.tmx.com. The financial measures included in this MD&A are based on financial statements prepared in accordance with IFRS, unless otherwise specified. All amounts are in Canadian dollars unless otherwise indicated.
Additional information about TMX Group, including our most recent Annual Information Form, is available through www.sedar.com and on our website, www.tmx.com. We are not incorporating information contained on the website in this MD&A.
International Financial Reporting Standards (IFRS)
The Canadian Accounting Standards Board requires publicly accountable enterprises such as TMX Group to adopt IFRS for fiscal years beginning on or after January 1, 2011. Accordingly, the TMX Group unaudited interim condensed consolidated financial statements for the quarter and six months ended June 30, 2011 have been prepared in accordance with IFRS as published by the International Accounting Standards Board.
For each reporting period in 2011, we will also present comparative information for 2010, both for interim and annual financial statements, as applicable, on an IFRS basis. Our consolidated financial statements for the year ending December 31, 2011, will be our first annual financial statements prepared in accordance with IFRS. As this will be our first year of reporting under IFRS, First-time Adoption of IFRS (IFRS 1) is applicable.
In accordance with IFRS 1, we have applied IFRS retrospectively as of January 1, 2010 (the Transition Date) for comparative purposes. In preparing our opening balance sheet in accordance with IFRS, we have adjusted amounts reported previously in our financial statements prepared in accordance with pre-conversion Canadian generally accepted accounting principles (pre-conversion Canadian GAAP) (for a more detailed discussion and additional reconciliations see our unaudited interim condensed consolidated financial statements for the quarter ended March 31, 2011). We have included supplementary reconciliations of the impact of the conversion to IFRS on our net income attributable to TMX Group shareholders for the quarter and six months ended June 30, 2010 in this MD&A (see Changes in Accounting Policies).
2
TMX Group and LSEG Terminate Merger Agreement1
On June 29, 2011, TMX Group agreed with London Stock Exchange Group plc (LSEG) to terminate our merger agreement which was announced on February 9, 2011.
TMX Group shareholders were scheduled to vote on the merger on June 30, 2011. A majority of shareholder votes cast by proxy prior to the June 28, 2011 proxy deadline supported the merger resolution; however, it was determined that the two-thirds threshold required to approve the merger would not have been achieved.
In terminating the merger agreement, TMX Group agreed to pay a $10.0 million fee to LSEG. This $10.0 million fee would have become payable by TMX Group under the merger agreement if TMX Group shareholder approval of the merger had not been obtained. The $10.0 million fee has been included in LSEG and Maple Related Costs for Q2/11. TMX Group also agreed to pay a $29.0 million fee to LSEG if, within 12 months of the termination of the merger agreement, either the Acquisition Proposal (as defined in the merger agreement) made by Maple Group Acquisition Corporation (Maple) is consummated or TMX Group enters into an agreement in respect of the Acquisition Proposal and that agreement is later consummated. TMX Group has not accrued the further $29.0 million fee.
We will continue to pursue our growth objectives and the TMX Group Board of Directors (the Board) will review our opportunities, including the offer from Maple.
The Maple Offer
On May 13, 2011, TMX Group received an unsolicited written proposal for the acquisition of all of the common shares of TMX Group by a corporation, formed by a number of Canadian financial institutions, including pension funds and banks, operating under the name Maple Group Acquisition Corporation (Maple).
On June 13, 2011, Maple made a unilateral offer to acquire all of the common shares of TMX Group by way of a two-step transaction whereby 70% of the common shares would be exchanged for $48.00 in cash per common share and the remaining common shares would be exchanged for common shares of Maple (the Maple Shares). The details of the offer are set out in the offer and accompanying circular dated June 10, 2011 (the Original Maple Offer).
On June 22, 2011, Maple announced a variation to the Original Maple Offer whereby Maple would increase its offer price from $48.00 in cash per TMX Group common share to $50.00 in cash per common share and would increase the number of common shares to be purchased for cash under the Original Maple Offer from 70% to a maximum of 80% of the common shares (the Original Maple Offer, as varied, being the “Maple Offer”). In order for the Maple Offer to be successful, at least 70% of the common shares would have to be tendered to it. The Maple Offer is also conditional upon obtaining regulatory approval, including approval under the Competition Act (Canada) and from applicable provincial securities regulatory authorities.
1 The “TMX Group and LSEG Terminate Merger Agreement” section above contains certain forward-looking statements. Please refer to “Caution Regarding Forward-Looking Information” for a discussion of risks and uncertainties related to such statements.
3
On June 24, 2011, the Board concluded that the Maple Offer did not provide important financial and non-financial information that the Board would have required to make a recommendation regarding the Maple Offer and therefore made no recommendation. The reasons for the Board's determinations are detailed in the Directors' Circular, dated June 26, 2011, which is available on SEDAR at www.sedar.com and on our website at www.tmx.com.
The Maple Offer was initially open for acceptance until August 8, 2011. On August 3, 2011, Maple extended its offer to September 30, 2011, unless further extended or withdrawn. However, Maple cannot take up any shares tendered until all conditions are satisfied, including receipt of required approvals from the Competition Bureau and applicable provincial securities regulatory authorities. Maple has publicly disclosed that it expects to secure all necessary regulatory approvals by late fall.
On July 21, 2011, the Board authorized management and advisors to hold discussions with Maple regarding its unsolicited offer to acquire the shares of TMX Group. There is no assurance that any agreement or recommendation will result from our discussions with Maple.
Market Conditions2
Our revenue is impacted by the levels and nature of market activity on our exchanges. This activity is influenced by customer and product mix, including: volumes / contracts traded in cash equities and fixed income products, as well as derivatives and energy products; the number and market capitalization of listed issuers; the number and value of new and additional listings; as well as the number of subscribers to market data. While it is not possible to quantify the potential changes in some of these measures, future economic and market conditions will continue to affect these revenue drivers and impact future revenue and net income given our largely fixed cost structure.
We operate in the highly competitive exchange industry. Since entering the Canadian equities market, alternative trading systems (ATSs) have fragmented trading volumes. In 2010, Toronto Stock Exchange and TSX Venture Exchange combined held an average 73% share of equities volume traded in Canada. Our combined share of volume declined in the first six months of 2011 to an average of 67%. We expect to continue to face significant competitive pressure in this multi-marketplace environment. We compete for listings both in North America and internationally, particularly for small to medium sized enterprises (SMEs) and resource companies. In Canada, there is currently one competing listings venue and another entity pursuing exchange status with regulators.
Natural Gas Exchange Inc.’s (NGX) business of trading and clearing physical natural gas, electricity and crude oil contracts faces primary competition in energy markets in Canada and the United States from over-the-counter (OTC) bilateral markets (supported by voice brokers) and competing exchanges listing and clearing energy derivative products. Other exchanges and electronic trading platforms are now starting to list physical products designed to compete directly with the NGX contracts. Our alliance with IntercontinentalExchange, Inc. positions NGX
2 The “Market Conditions” section above contains certain forward-looking statements. Please refer to “Caution Regarding Forward-Looking Information” for a discussion of risks and uncertainties related to such statements.
4
to compete for trading with other venues while providing the tools to deliver clearing for exchange traded as well as OTC bilateral contracts.
In addition to competition from foreign derivatives exchanges that offer comparable derivatives products, Montréal Exchange (MX) faces domestic competition from OTC derivatives trading that occurs bilaterally between institutions. We may in the future also face competition from other Canadian marketplaces. In the United States, MX competes for market share of trading single stock options based on Canadian-based interlistings, or dual listings. However, options traded in the U.S. are not fungible with those traded in Canada.
MX’s subsidiary, Boston Options Exchange Group, LLC, or BOX, continues to face intense competition in the U.S. equity options market.
From a macro perspective, the relative strength of the Canadian economy impacts our key revenue drivers. In a growing economy, we would typically expect an increase in new public offerings and higher financing activity; the growth of capital may in turn drive more investing and trading activity across all asset classes and venues. In 2010, we saw an increase in IPO activity, commodity speculation and a marked increase in fixed income cash and futures trading that accompanied a rising short-term interest rate environment. During Q2/11, the value of overall new equity financings was up on TSX Venture Exchange, but down somewhat on Toronto Stock Exchange, compared with Q2/10. Equity trading volumes on TSX Venture Exchange in Q2/11 also increased over Q2/10, but were down somewhat on Toronto Stock Exchange over the comparable periods. Volumes traded on MX were up significantly in Q2/11 over Q2/10; however, fixed income and energy volumes traded were down over the corresponding periods.
Our belief is that over the long term, well-regulated neutral exchanges and clearing houses with ownership structures that are free of conflict will continue to play a key role in the success of capital markets. We provide transparent markets for capital formation and price discovery along with effectively collateralized clearing mechanisms for managing counterparty credit risk. We believe we are strategically positioned domestically and internationally to continue to succeed in this environment.
2011 Initiatives and Accomplishments3
Issuer Services
On May 3, 2011, TMX Group and QuoteMedia, Inc. announced the launch of TSX InfoSuite, a new market data and shareholder solution designed to enhance the suite of services for Toronto Stock Exchange and TSX Venture Exchange listed issuers. TSX InfoSuite’s offerings include stock quotes and key company information, in-depth market data on issuers, shareholder information and sector data.
On June 1, 2011, we announced that Toronto Stock Exchange had reached over 200 exchange traded products (ETPs) comprised of 187 exchange traded funds (ETFs) and 14 exchange
3 The “2011 Initiatives and Accomplishments” section above contains certain forward-looking statements. Please refer to “Caution Regarding Forward-Looking Information” for a discussion of risks and uncertainties related to such statements.
5
traded notes (ETNs). The number of ETPs has more than doubled in the past two years bringing the total market capitalization of listed ETPs to approximately $49 billion.
Cash Equities Trading
Dark Order Types
On June 20, 2011, we announced that our dark order types reached a volume milestone within the first week of enabling the full list of Toronto Stock Exchange and TSX Venture Exchange listed securities. The dark order types, which include the Dark Mid-Point and the Dark Limit order types, achieved a daily peak trading volume of over 3.3 million shares and averaged over 2 million shares traded per day. 24 participating organizations (POs) are posting dark orders and have executed against orders from over 85 POs that are currently receiving price improvement and reduced execution costs by trading with Toronto Stock Exchange and TSX Venture Exchange dark liquidity orders.
TMX Group dark order types were introduced in March 2011 with a phased launch that concluded on June 6, 2011, when all equity symbols were enabled. The TMX integrated model maximizes execution opportunities and reduces costs for all participants, including retail investors, fund managers and liquidity providers.
TMX Select
On July 11, 2011, we launched trading on TMX Select, an alternative equities trading system. Created in response to our customers' evolving trading strategies, Canada's newest ATS offers participants additional execution and liquidity seeking opportunities through a differentiated market and pricing model. As of August 4, 2011, over three hundred symbols are eligible to trade on TMX Select and the remainder of Toronto Stock Exchange and TSX Venture Exchange symbols will be introduced in a phased approach.
TMX Select features a customer-focused pricing model, which extends significant savings to liquidity takers. TMX Select's “symmetrical pricing” model, in which both liquidity seekers and providers are charged the same low fee, is significantly different from the standard maker-taker model currently maintained by other Canadian marketplaces.
Derivatives Trading and Clearing
On May 24, 2011, MX announced the launch of the SXM Mini Futures contract on the S&P/TSX 60 Index4. The SXM Mini Futures contract represents one quarter of the value of the current S&P/TSX 60 Index Standard Futures contract (SXF), offering a smaller capital alternative. The contract provides a new trading opportunity that can be used by a wide range of investors, including individual investors, who may find it particularly attractive due to its small notional size.
4 S&P" is the trademark of Standard & Poor's and "TSX" is the trademark of TSX Inc.
6
Energy Trading and Clearing
On July 13, 2011, NGX announced that it successfully initiated physical clearing at two new hubs in the U.S. market.
The additions include the Oneok Gas Transportation (OGT) hub in Oklahoma. OGT is an intrastate pipeline that is connected to six underground storage facilities, 20 processing plants and 130 producing fields.
The second new NGX hub is Tennessee Gas Pipeline’s Zone Zero North (TGP-Z0 North), an interstate pooling point that covers a broad area in north Texas. The hub compliments the TGP-Z0 South location, where NGX began physical clearing in April 2011.
As of August 4, 2011, NGX offers physical clearing at 37 U.S. locations.
Information Services
On June 14, 2011, we announced that TMX Datalinx, our information services division, has implemented its ultra-low latency network, TMXnet North America (NA), between Toronto, New York and Chicago. TMXnet NA is used to deliver TMX and other Canadian capital markets data to clients in New York and Chicago, as well as U.S. financial data to clients in TMX's co-location facility and the Toronto core. The network will also be used to offer dedicated telecommunications links for TMX Group's co-location clients.
On June 15, 2011, we announced that TMX Datalinx had entered into a bilateral agreement with NASDAQ OMX Global Data Products to make each marketplace's market data available in their respective co-location facilities. Using TMXnet NA, TMX and NASDAQ OMX's co-location clients can receive low latency, reliable and cost efficient access to NASDAQ OMX and TMX market data.
On August 3, 2011, we announced that we acquired Atrium Networks, a leading provider of high availability, cost effective, low latency data network and connectivity solutions in Europe and North America. The acquisition accelerates the expansion of TMX Group’s data network into Europe and the U.S. The company, which will be rebranded TMX Atrium, will operate as a unit of TMX Datalinx.
Technology Services
On May 12, 2011, we announced that LSEG's pan-European derivatives market, Turquoise Derivatives, had successfully migrated to the TMX SOLA trading system. SOLA, which was created by Montréal Exchange, is also the trading technology platform for Borsa Italiana's IDEM market as well as the Oslo Bors. The SOLA technology is designed for scalability to efficiently meet ever expanding capacity and performance requirements.
Quarter Ended June 30, 2011 Compared with Quarter Ended June 30, 2010
Net income attributable to TMX Group shareholders was $54.7 million, or $0.73 per common share on a basic and diluted basis for Q2/11, compared with net income attributable to TMX
7
Group shareholders of $58.4 million, or $0.79 per common share on a basic and diluted basis for Q2/10, representing a decrease in net income attributable to TMX Group shareholders of 6%. The decrease in net income attributable to TMX Group shareholders was due to $20.8 million of LSEG and Maple related costs, partially offset by higher revenue from issuer services, derivative markets trading and clearing and information services and lower overall operating expenses.
Adjusted Earnings per Share Reconciliation for Q2/11 and Q2/10**
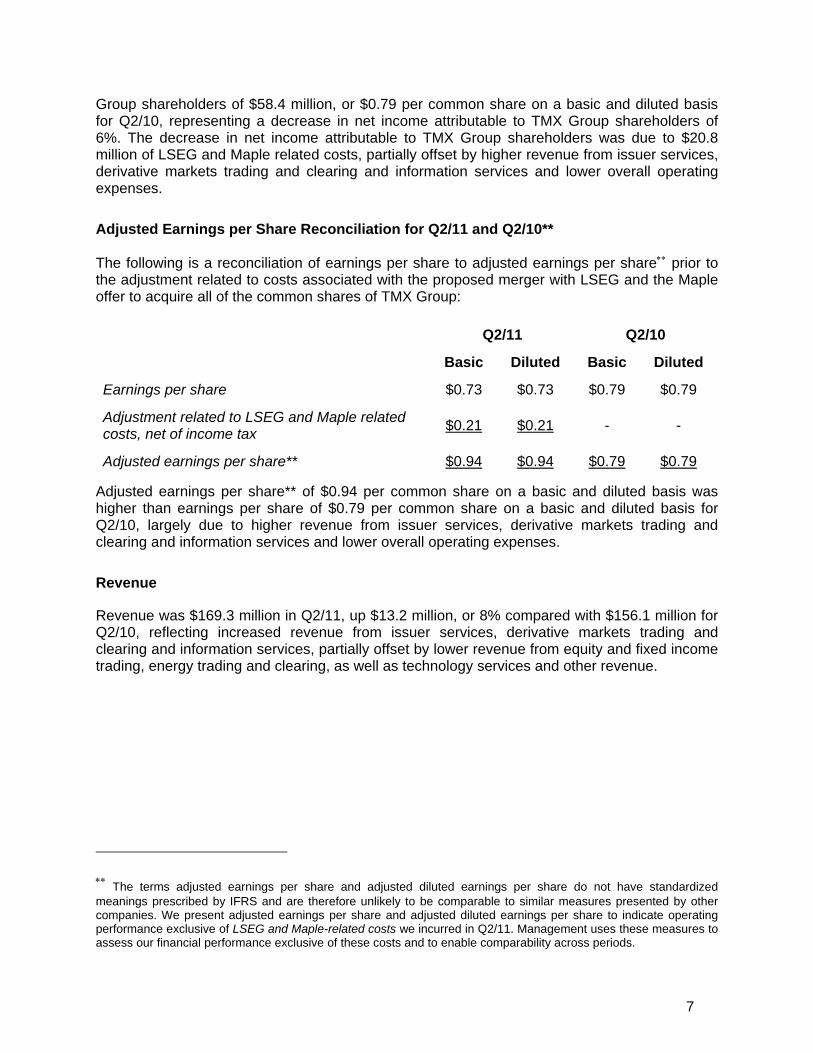
The following is a reconciliation of earnings per share to adjusted earnings per share∗∗ prior to the adjustment related to costs associated with the proposed merger with LSEG and the Maple offer to acquire all of the common shares of TMX Group:
Q2/11 Q2/10
Basic Diluted Basic Diluted
Earnings per share $0.73 $0.73 $0.79 $0.79
Adjustment related to LSEG and Maple related costs, net of income tax $0.21 $0.21 - -
Adjusted earnings per share** $0.94 $0.94 $0.79 $0.79
Adjusted earnings per share** of $0.94 per common share on a basic and diluted basis was higher than earnings per share of $0.79 per common share on a basic and diluted basis for Q2/10, largely due to higher revenue from issuer services, derivative markets trading and clearing and information services and lower overall operating expenses.
Revenue
Revenue was $169.3 million in Q2/11, up $13.2 million, or 8% compared with $156.1 million for Q2/10, reflecting increased revenue from issuer services, derivative markets trading and clearing and information services, partially offset by lower revenue from equity and fixed income trading, energy trading and clearing, as well as technology services and other revenue.
∗∗ The terms adjusted earnings per share and adjusted diluted earnings per share do not have standardized meanings prescribed by IFRS and are therefore unlikely to be comparable to similar measures presented by other companies. We present adjusted earnings per share and adjusted diluted earnings per share to indicate operating performance exclusive of LSEG and Maple-related costs we incurred in Q2/11. Management uses these measures to assess our financial performance exclusive of these costs and to enable comparability across periods.
8
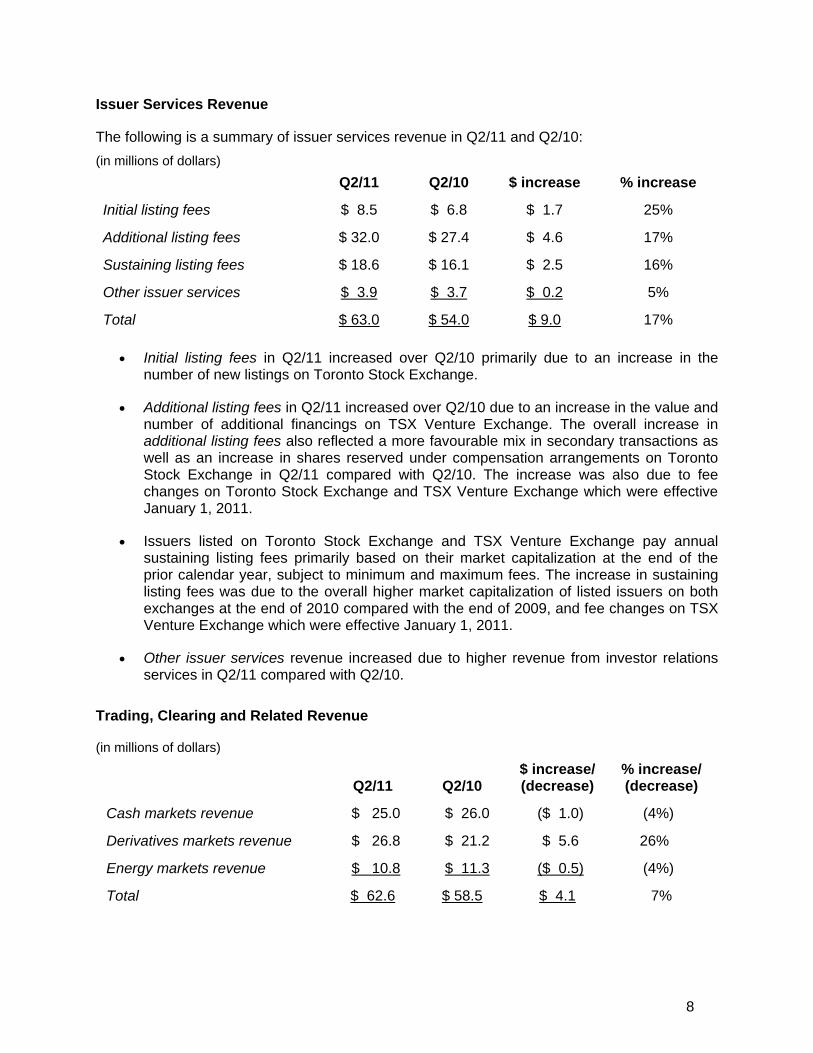
Issuer Services Revenue
The following is a summary of issuer services revenue in Q2/11 and Q2/10: (in millions of dollars) Q2/11 Q2/10 $ increase % increase
Initial listing fees $ 8.5 $ 6.8 $ 1.7 25%
Additional listing fees $ 32.0 $ 27.4 $ 4.6 17%
Sustaining listing fees $ 18.6 $ 16.1 $ 2.5 16%
Other issuer services $ 3.9 $ 3.7 $ 0.2 5%
Total $ 63.0 $ 54.0 $ 9.0 17%
• Initial listing fees in Q2/11 increased over Q2/10 primarily due to an increase in the number of new listings on Toronto Stock Exchange.
• Additional listing fees in Q2/11 increased over Q2/10 due to an increase in the value and number of additional financings on TSX Venture Exchange. The overall increase in additional listing fees also reflected a more favourable mix in secondary transactions as well as an increase in shares reserved under compensation arrangements on Toronto Stock Exchange in Q2/11 compared with Q2/10. The increase was also due to fee changes on Toronto Stock Exchange and TSX Venture Exchange which were effective January 1, 2011.
• Issuers listed on Toronto Stock Exchange and TSX Venture Exchange pay annual sustaining listing fees primarily based on their market capitalization at the end of the prior calendar year, subject to minimum and maximum fees. The increase in sustaining listing fees was due to the overall higher market capitalization of listed issuers on both exchanges at the end of 2010 compared with the end of 2009, and fee changes on TSX Venture Exchange which were effective January 1, 2011.
• Other issuer services revenue increased due to higher revenue from investor relations services in Q2/11 compared with Q2/10.
Trading, Clearing and Related Revenue
(in millions of dollars)
Q2/11 Q2/10 $ increase/ (decrease)
% increase/ (decrease)
Cash markets revenue $ 25.0 $ 26.0 ($ 1.0) (4%)
Derivatives markets revenue $ 26.8 $ 21.2 $ 5.6 26%
Energy markets revenue $ 10.8 $ 11.3 ($ 0.5) (4%)
Total $ 62.6 $ 58.5 $ 4.1 7%
9
Cash Markets
• The decrease in cash markets equity trading revenue was due to changes to our equity trading fee schedule effective March 1, 2011, which reduced the fees for significant usage for our Market on Open (MOO) facility and introduced net credit payments for trading in our continuous limit order book. The decrease was also due to additional changes effective April 1, 2011, which provided cost savings to participants that trade equities where the trade price per-security is lower than $1.00.
• The decrease was also somewhat due to a 6% decrease in the volume of securities traded on Toronto Stock Exchange in Q2/11 compared with Q2/10 (24.60 billion securities in Q2/11 versus 26.14 billion securities in Q2/10). This was partially offset by an 11% increase in the volume of securities traded on TSX Venture Exchange in Q2/11 compared with Q2/10 (16.37 billion securities in Q2/11 versus 14.72 billion securities in Q2/10).
• The decline also reflects decreased revenue from Shorcan Brokers Limited (Shorcan) fixed income trading in Q2/11 compared with Q2/10 due to lower volumes, somewhat offset by a more favourable product mix.
Derivatives Markets
• The increase in derivatives markets revenue reflects an increase in trading and clearing revenue from MX and Canadian Derivatives Clearing Corporation (CDCC). MX set a new quarterly trading record in Q2/11 with 16.27 million contracts traded; exceeding the previous record of 14.55 million contracts traded set in Q1/11. MX volumes increased by 36% over Q2/10 (16.27 million contracts traded in Q2/11 versus 11.97 million contracts traded in Q2/10) reflecting increased trading in the BAX and CGB contracts, as well as equity options. The increase in revenue was partially offset by a change in client mix. Open interest was up 43% at June 30, 2011 compared with June 30, 2010.
• The increase in derivatives markets revenue also reflects an increase in BOX revenues. There was a 12% increase in BOX volumes (26.73 million contracts in Q2/11 versus 23.81 million contracts traded in Q2/10). The increase in revenue was also due to price increases which were effective in Q3/10, partially offset by the impact of the depreciation of the U.S. dollar against the Canadian dollar in Q2/11 compared with Q2/10.
Energy Markets
• The decrease in energy markets revenue reflects a 17% decrease in total energy volume# traded on NGX from Q2/10 (3.54 million terajoules in Q2/11 compared to 4.29 million terajoules in Q2/10).
• The decrease in revenue was also due to the impact of the depreciation of the U.S. dollar against the Canadian dollar in Q2/11 compared with Q2/10.
# NGX total energy volume includes trading and clearing in natural gas, crude oil and electricity.
10
• The decrease was partially offset as a result of NGX recapturing previously deferred revenue in Q2/11.
• The decrease was also partially offset by higher revenue from Shorcan Energy Brokers Inc. (Shorcan Energy Brokers), a wholly-owned subsidiary of Shorcan, due to higher volumes in Q2/11 compared with Q2/10.
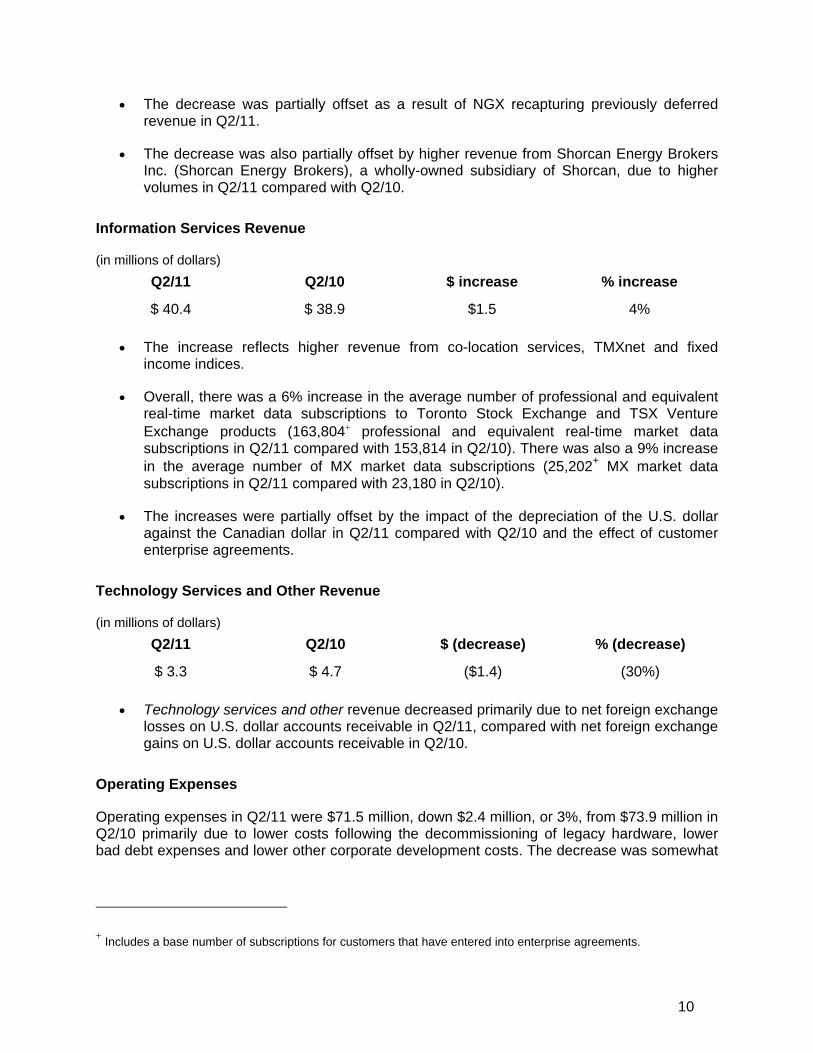
Information Services Revenue
(in millions of dollars) Q2/11 Q2/10 $ increase % increase
$ 40.4 $ 38.9 $1.5 4%
• The increase reflects higher revenue from co-location services, TMXnet and fixed income indices.
• Overall, there was a 6% increase in the average number of professional and equivalent real-time market data subscriptions to Toronto Stock Exchange and TSX Venture Exchange products (163,804+ professional and equivalent real-time market data subscriptions in Q2/11 compared with 153,814 in Q2/10). There was also a 9% increase in the average number of MX market data subscriptions (25,202+ MX market data subscriptions in Q2/11 compared with 23,180 in Q2/10).
• The increases were partially offset by the impact of the depreciation of the U.S. dollar against the Canadian dollar in Q2/11 compared with Q2/10 and the effect of customer enterprise agreements.
Technology Services and Other Revenue
(in millions of dollars) Q2/11 Q2/10 $ (decrease) % (decrease)
$ 3.3 $ 4.7 ($1.4) (30%)
• Technology services and other revenue decreased primarily due to net foreign exchange losses on U.S. dollar accounts receivable in Q2/11, compared with net foreign exchange gains on U.S. dollar accounts receivable in Q2/10.
Operating Expenses
Operating expenses in Q2/11 were $71.5 million, down $2.4 million, or 3%, from $73.9 million in Q2/10 primarily due to lower costs following the decommissioning of legacy hardware, lower bad debt expenses and lower other corporate development costs. The decrease was somewhat
+ Includes a base number of subscriptions for customers that have entered into enterprise agreements.
11
offset by higher costs associated with long-term employee performance incentive plans and higher organizational transition costs.
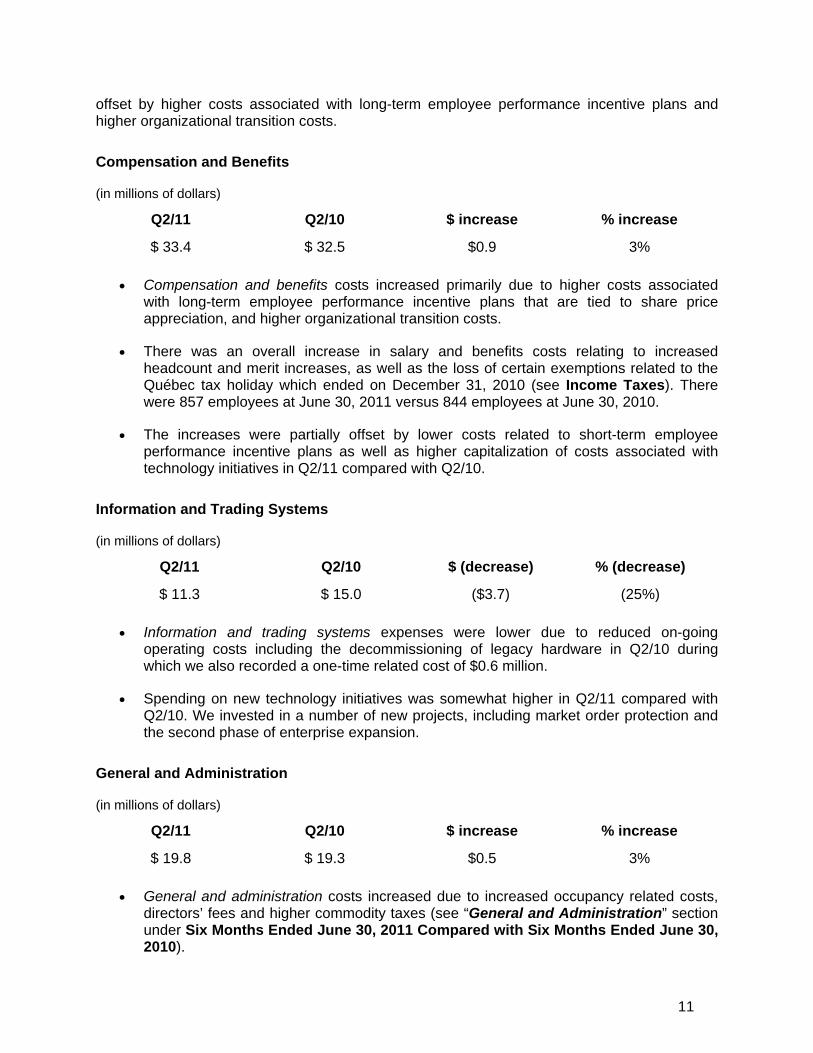
Compensation and Benefits
(in millions of dollars)
Q2/11 Q2/10 $ increase % increase
$ 33.4 $ 32.5 $0.9 3%
• Compensation and benefits costs increased primarily due to higher costs associated with long-term employee performance incentive plans that are tied to share price appreciation, and higher organizational transition costs.
• There was an overall increase in salary and benefits costs relating to increased headcount and merit increases, as well as the loss of certain exemptions related to the Québec tax holiday which ended on December 31, 2010 (see Income Taxes). There were 857 employees at June 30, 2011 versus 844 employees at June 30, 2010.
• The increases were partially offset by lower costs related to short-term employee performance incentive plans as well as higher capitalization of costs associated with technology initiatives in Q2/11 compared with Q2/10.
Information and Trading Systems
(in millions of dollars)
Q2/11 Q2/10 $ (decrease) % (decrease)
$ 11.3 $ 15.0 ($3.7) (25%)
• Information and trading systems expenses were lower due to reduced on-going operating costs including the decommissioning of legacy hardware in Q2/10 during which we also recorded a one-time related cost of $0.6 million.
• Spending on new technology initiatives was somewhat higher in Q2/11 compared with Q2/10. We invested in a number of new projects, including market order protection and the second phase of enterprise expansion.
General and Administration
(in millions of dollars)
Q2/11 Q2/10 $ increase % increase
$ 19.8 $ 19.3 $0.5 3%
• General and administration costs increased due to increased occupancy related costs, directors’ fees and higher commodity taxes (see “General and Administration” section under Six Months Ended June 30, 2011 Compared with Six Months Ended June 30, 2010).
12
• These increases were partially offset by lower bad debt expenses and lower other corporate development costs.
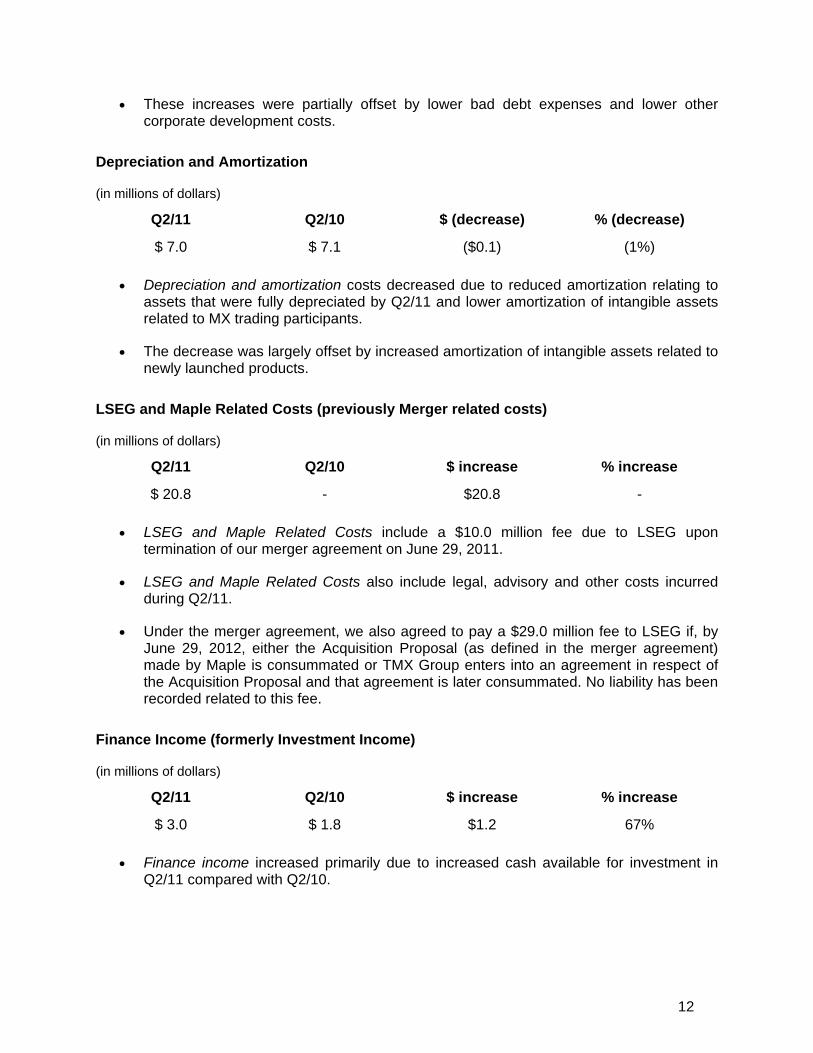
Depreciation and Amortization
(in millions of dollars)
Q2/11 Q2/10 $ (decrease) % (decrease)
$ 7.0 $ 7.1 ($0.1) (1%)
• Depreciation and amortization costs decreased due to reduced amortization relating to assets that were fully depreciated by Q2/11 and lower amortization of intangible assets related to MX trading participants.
• The decrease was largely offset by increased amortization of intangible assets related to newly launched products.
LSEG and Maple Related Costs (previously Merger related costs)
(in millions of dollars)
Q2/11 Q2/10 $ increase % increase
$ 20.8 - $20.8 -
• LSEG and Maple Related Costs include a $10.0 million fee due to LSEG upon termination of our merger agreement on June 29, 2011.
• LSEG and Maple Related Costs also include legal, advisory and other costs incurred during Q2/11.
• Under the merger agreement, we also agreed to pay a $29.0 million fee to LSEG if, by June 29, 2012, either the Acquisition Proposal (as defined in the merger agreement) made by Maple is consummated or TMX Group enters into an agreement in respect of the Acquisition Proposal and that agreement is later consummated. No liability has been recorded related to this fee.
Finance Income (formerly Investment Income)
(in millions of dollars)
Q2/11 Q2/10 $ increase % increase
$ 3.0 $ 1.8 $1.2 67%
• Finance income increased primarily due to increased cash available for investment in Q2/11 compared with Q2/10.
13
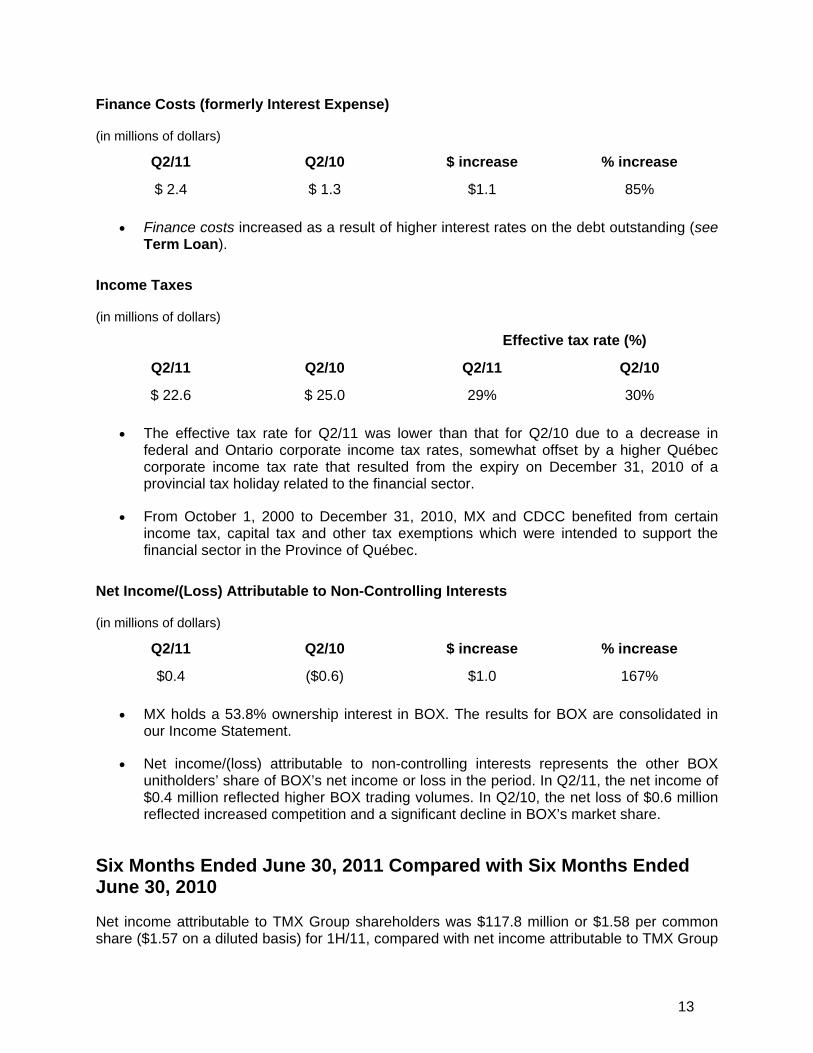
Finance Costs (formerly Interest Expense)
(in millions of dollars)
Q2/11 Q2/10 $ increase % increase
$ 2.4 $ 1.3 $1.1 85%
• Finance costs increased as a result of higher interest rates on the debt outstanding (see Term Loan).
Income Taxes
(in millions of dollars)
Effective tax rate (%)
Q2/11 Q2/10 Q2/11 Q2/10
$ 22.6 $ 25.0 29% 30%
• The effective tax rate for Q2/11 was lower than that for Q2/10 due to a decrease in federal and Ontario corporate income tax rates, somewhat offset by a higher Québec corporate income tax rate that resulted from the expiry on December 31, 2010 of a provincial tax holiday related to the financial sector.
• From October 1, 2000 to December 31, 2010, MX and CDCC benefited from certain income tax, capital tax and other tax exemptions which were intended to support the financial sector in the Province of Québec.
Net Income/(Loss) Attributable to Non-Controlling Interests
(in millions of dollars)
Q2/11 Q2/10 $ increase % increase
$0.4 ($0.6) $1.0 167%
• MX holds a 53.8% ownership interest in BOX. The results for BOX are consolidated in our Income Statement.
• Net income/(loss) attributable to non-controlling interests represents the other BOX unitholders’ share of BOX’s net income or loss in the period. In Q2/11, the net income of $0.4 million reflected higher BOX trading volumes. In Q2/10, the net loss of $0.6 million reflected increased competition and a significant decline in BOX’s market share.
Six Months Ended June 30, 2011 Compared with Six Months Ended June 30, 2010
Net income attributable to TMX Group shareholders was $117.8 million or $1.58 per common share ($1.57 on a diluted basis) for 1H/11, compared with net income attributable to TMX Group
14
shareholders of $115.5 million or $1.55 per common share on a basic and diluted basis for 1H/10, representing an increase in net income attributable to TMX Group shareholders of 2%. The increase in net income attributable to TMX Group shareholders was largely due to higher revenue across the major components of our business largely offset by increased expenses due to $29.1 million in LSEG and Maple related costs and a commodity tax adjustment∗.
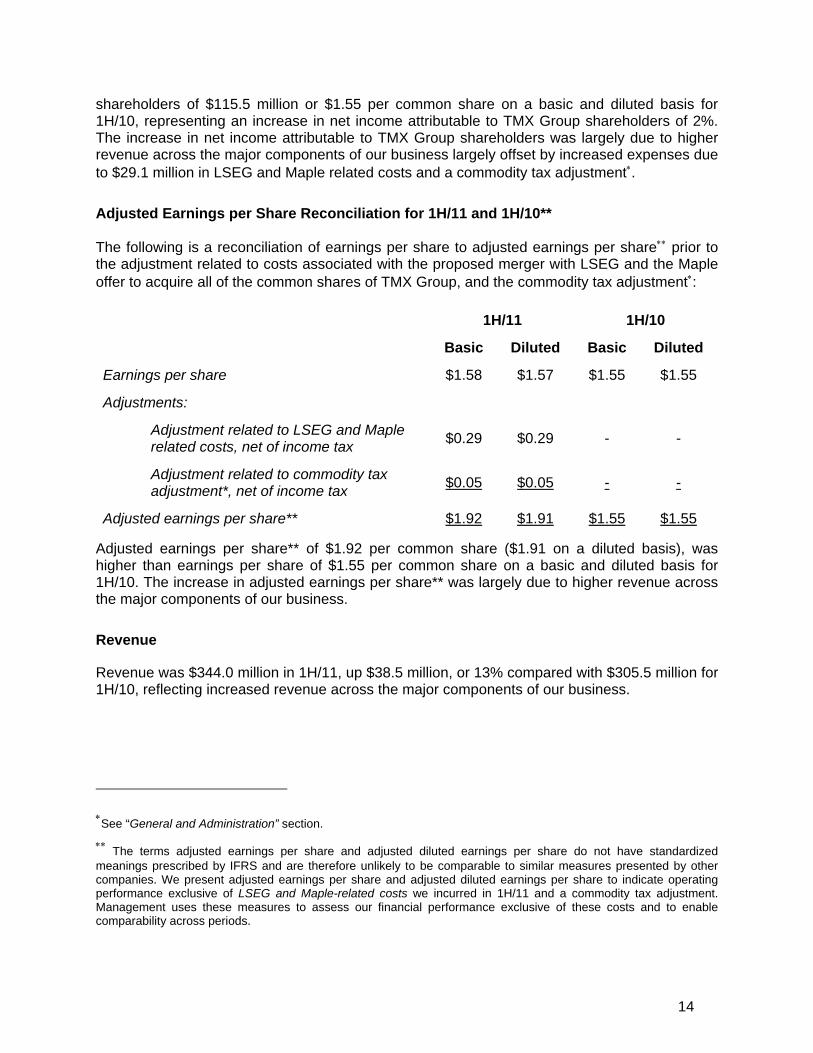
Adjusted Earnings per Share Reconciliation for 1H/11 and 1H/10**
The following is a reconciliation of earnings per share to adjusted earnings per share∗∗ prior to the adjustment related to costs associated with the proposed merger with LSEG and the Maple offer to acquire all of the common shares of TMX Group, and the commodity tax adjustment∗:
1H/11 1H/10
Basic Diluted Basic Diluted
Earnings per share $1.58 $1.57 $1.55 $1.55
Adjustments:
Adjustment related to LSEG and Maple related costs, net of income tax $0.29 $0.29 - -
Adjustment related to commodity tax adjustment*, net of income tax $0.05 $0.05 - -
Adjusted earnings per share** $1.92 $1.91 $1.55 $1.55
Adjusted earnings per share** of $1.92 per common share ($1.91 on a diluted basis), was higher than earnings per share of $1.55 per common share on a basic and diluted basis for 1H/10. The increase in adjusted earnings per share** was largely due to higher revenue across the major components of our business.
Revenue
Revenue was $344.0 million in 1H/11, up $38.5 million, or 13% compared with $305.5 million for 1H/10, reflecting increased revenue across the major components of our business.
∗See “General and Administration” section.
∗∗ The terms adjusted earnings per share and adjusted diluted earnings per share do not have standardized meanings prescribed by IFRS and are therefore unlikely to be comparable to similar measures presented by other companies. We present adjusted earnings per share and adjusted diluted earnings per share to indicate operating performance exclusive of LSEG and Maple-related costs we incurred in 1H/11 and a commodity tax adjustment. Management uses these measures to assess our financial performance exclusive of these costs and to enable comparability across periods.
15
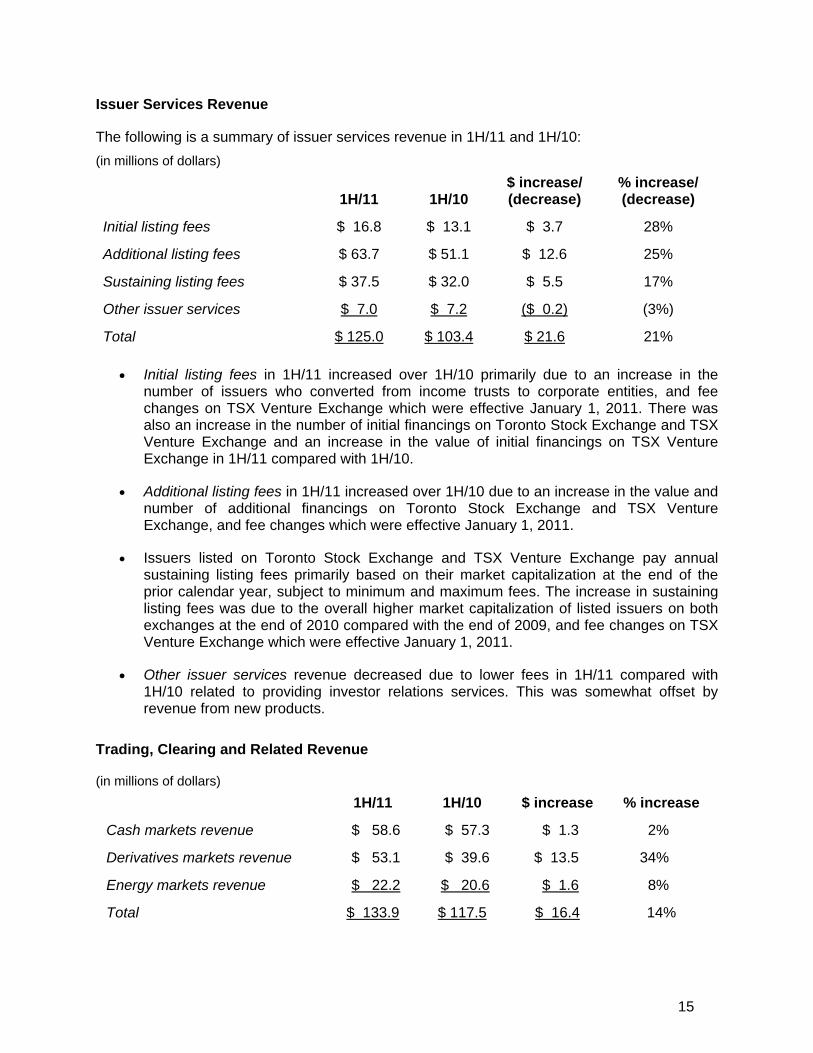
Issuer Services Revenue
The following is a summary of issuer services revenue in 1H/11 and 1H/10: (in millions of dollars)
1H/11 1H/10 $ increase/ (decrease)
% increase/ (decrease)
Initial listing fees $ 16.8 $ 13.1 $ 3.7 28%
Additional listing fees $ 63.7 $ 51.1 $ 12.6 25%
Sustaining listing fees $ 37.5 $ 32.0 $ 5.5 17%
Other issuer services $ 7.0 $ 7.2 ($ 0.2) (3%)
Total $ 125.0 $ 103.4 $ 21.6 21%
• Initial listing fees in 1H/11 increased over 1H/10 primarily due to an increase in the number of issuers who converted from income trusts to corporate entities, and fee changes on TSX Venture Exchange which were effective January 1, 2011. There was also an increase in the number of initial financings on Toronto Stock Exchange and TSX Venture Exchange and an increase in the value of initial financings on TSX Venture Exchange in 1H/11 compared with 1H/10.
• Additional listing fees in 1H/11 increased over 1H/10 due to an increase in the value and number of additional financings on Toronto Stock Exchange and TSX Venture Exchange, and fee changes which were effective January 1, 2011.
• Issuers listed on Toronto Stock Exchange and TSX Venture Exchange pay annual sustaining listing fees primarily based on their market capitalization at the end of the prior calendar year, subject to minimum and maximum fees. The increase in sustaining listing fees was due to the overall higher market capitalization of listed issuers on both exchanges at the end of 2010 compared with the end of 2009, and fee changes on TSX Venture Exchange which were effective January 1, 2011.
• Other issuer services revenue decreased due to lower fees in 1H/11 compared with 1H/10 related to providing investor relations services. This was somewhat offset by revenue from new products.
Trading, Clearing and Related Revenue
(in millions of dollars) 1H/11 1H/10 $ increase % increase
Cash markets revenue $ 58.6 $ 57.3 $ 1.3 2%
Derivatives markets revenue $ 53.1 $ 39.6 $ 13.5 34%
Energy markets revenue $ 22.2 $ 20.6 $ 1.6 8%
Total $ 133.9 $ 117.5 $ 16.4 14%
16
Cash Markets
• The increase in cash markets equity trading revenue was largely due to a 38% increase in the volume of securities traded on TSX Venture Exchange in 1H/11 compared with 1H/10 (41.60 billion securities in 1H/11 versus 30.10 billion securities in 1H/10). There was also a 7% increase in the volume of securities traded on Toronto Stock Exchange in 1H/11 compared with 1H/10 (54.92 billion securities in 1H/11 versus 51.48 billion securities in 1H/10).
• The increase was somewhat offset by changes to our equity trading fee schedule. On March 1, 2010, we reduced active trading fees on securities trading at less than $1.00 in the post-open continuous market and on April 1, 2010, we reduced trading fees for securities trading at $1.00 and higher. Effective March 1, 2011, we reduced the fees for significant usage for our MOO facility and introduced net credit payments for trading in our continuous limit order book. On April 1, 2011, we made additional changes that provided cost savings to participants that trade equities where the trade price per-share is lower than $1.00.
• Revenue from Shorcan fixed income trading in 1H/11 was unchanged from 1H/10, due to a more favourable product mix, offset by lower volumes.
Derivatives Markets
• The increase in derivatives markets revenue reflects an increase in trading and clearing revenue from MX and CDCC. MX volumes increased by 41% (30.82 million contracts traded in 1H/11 versus 21.94 million contracts traded in 1H/10) reflecting increased trading in the BAX and CGB contracts, as well as ETF and equity options. The increase in revenue was partially offset by a change in client mix. Open interest was up 43% at June 30, 2011 compared with June 30, 2010.
• The increase in derivatives markets revenue also reflects an increase in BOX revenues. There was a 41% increase in BOX volumes (58.40 million contracts in 1H/11 versus 41.48 million contracts traded in 1H/10). The increase in revenue was also due to price increases which were effective in Q3/10, partially offset by the impact of the depreciation of the U.S. dollar against the Canadian dollar in 1H/11 compared with 1H/10.
Energy Markets
• The increase reflects higher revenue from Shorcan Energy Brokers due to higher volumes in 1H/11 compared with 1H/10.
• The increase was also due to NGX recapturing previously deferred revenue in 1H/11.
• Total energy volume# was largely unchanged on NGX in 1H/11 compared with 1H/10 (7.64 million terajoules in 1H/11 compared to 7.61 million terajoules in 1H/10).
# NGX total energy volume includes trading and clearing in natural gas, crude oil and electricity.
17
• The higher revenue was somewhat offset by the impact of the depreciation of the U.S. dollar against the Canadian dollar in 1H/11 compared with 1H/10.
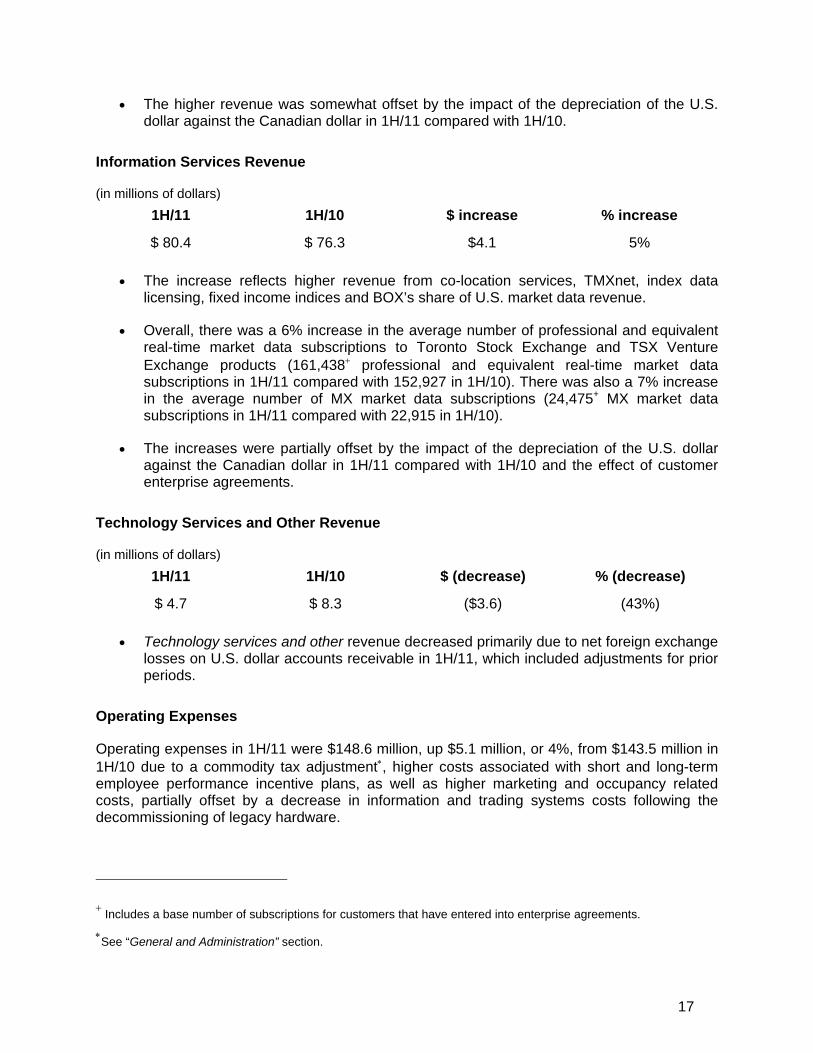
Information Services Revenue
(in millions of dollars) 1H/11 1H/10 $ increase % increase
$ 80.4 $ 76.3 $4.1 5%
• The increase reflects higher revenue from co-location services, TMXnet, index data licensing, fixed income indices and BOX’s share of U.S. market data revenue.
• Overall, there was a 6% increase in the average number of professional and equivalent real-time market data subscriptions to Toronto Stock Exchange and TSX Venture Exchange products (161,438+ professional and equivalent real-time market data subscriptions in 1H/11 compared with 152,927 in 1H/10). There was also a 7% increase in the average number of MX market data subscriptions (24,475+ MX market data subscriptions in 1H/11 compared with 22,915 in 1H/10).
• The increases were partially offset by the impact of the depreciation of the U.S. dollar against the Canadian dollar in 1H/11 compared with 1H/10 and the effect of customer enterprise agreements.
Technology Services and Other Revenue
(in millions of dollars) 1H/11 1H/10 $ (decrease) % (decrease)
$ 4.7 $ 8.3 ($3.6) (43%)
• Technology services and other revenue decreased primarily due to net foreign exchange losses on U.S. dollar accounts receivable in 1H/11, which included adjustments for prior periods.
Operating Expenses
Operating expenses in 1H/11 were $148.6 million, up $5.1 million, or 4%, from $143.5 million in 1H/10 due to a commodity tax adjustment∗, higher costs associated with short and long-term employee performance incentive plans, as well as higher marketing and occupancy related costs, partially offset by a decrease in information and trading systems costs following the decommissioning of legacy hardware.
+ Includes a base number of subscriptions for customers that have entered into enterprise agreements.
∗See “General and Administration” section.
18
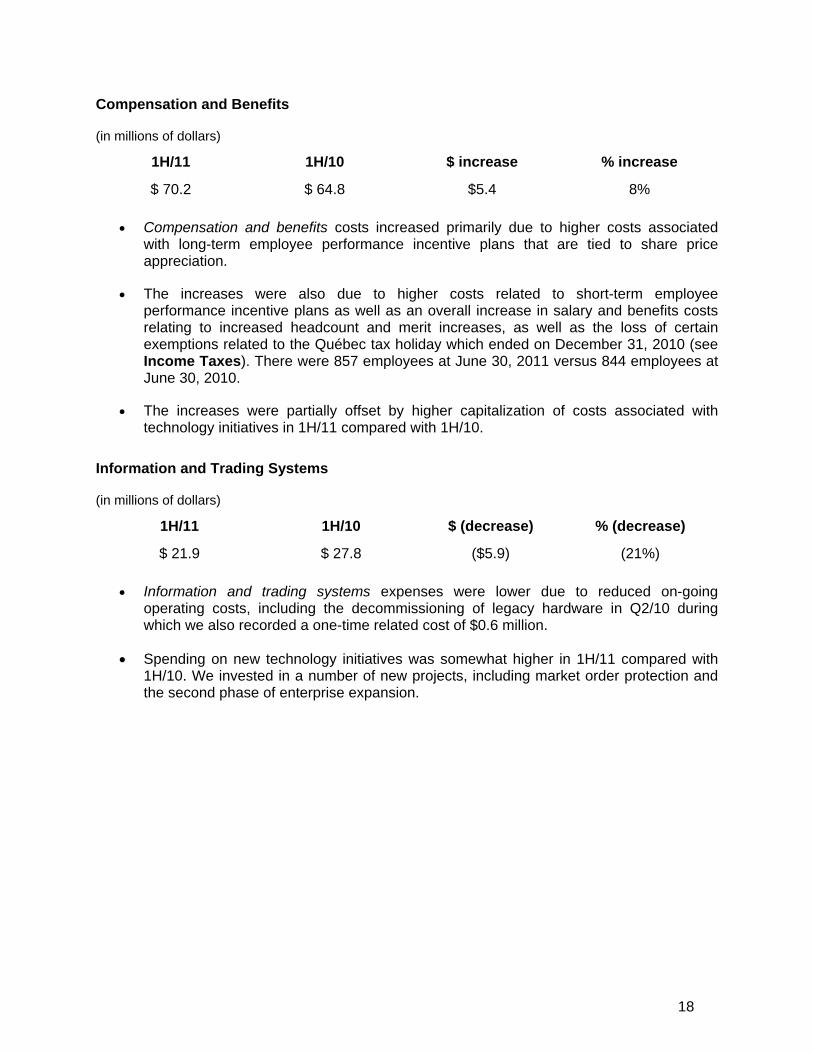
Compensation and Benefits
(in millions of dollars)
1H/11 1H/10 $ increase % increase
$ 70.2 $ 64.8 $5.4 8%
• Compensation and benefits costs increased primarily due to higher costs associated with long-term employee performance incentive plans that are tied to share price appreciation.
• The increases were also due to higher costs related to short-term employee performance incentive plans as well as an overall increase in salary and benefits costs relating to increased headcount and merit increases, as well as the loss of certain exemptions related to the Québec tax holiday which ended on December 31, 2010 (see Income Taxes). There were 857 employees at June 30, 2011 versus 844 employees at June 30, 2010.
• The increases were partially offset by higher capitalization of costs associated with technology initiatives in 1H/11 compared with 1H/10.
Information and Trading Systems
(in millions of dollars)
1H/11 1H/10 $ (decrease) % (decrease)
$ 21.9 $ 27.8 ($5.9) (21%)
• Information and trading systems expenses were lower due to reduced on-going operating costs, including the decommissioning of legacy hardware in Q2/10 during which we also recorded a one-time related cost of $0.6 million.
• Spending on new technology initiatives was somewhat higher in 1H/11 compared with 1H/10. We invested in a number of new projects, including market order protection and the second phase of enterprise expansion.
19
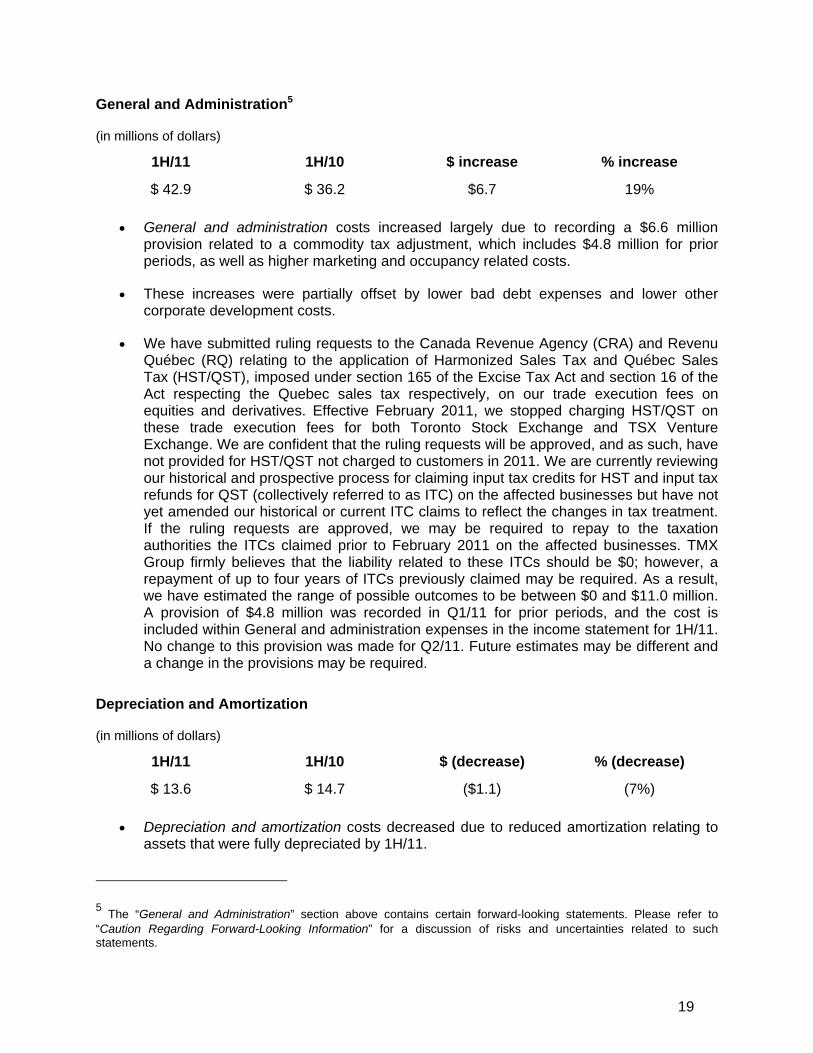
General and Administration5
(in millions of dollars)
1H/11 1H/10 $ increase % increase
$ 42.9 $ 36.2 $6.7 19%
• General and administration costs increased largely due to recording a $6.6 million provision related to a commodity tax adjustment, which includes $4.8 million for prior periods, as well as higher marketing and occupancy related costs.
• These increases were partially offset by lower bad debt expenses and lower other corporate development costs.
• We have submitted ruling requests to the Canada Revenue Agency (CRA) and Revenu Québec (RQ) relating to the application of Harmonized Sales Tax and Québec Sales Tax (HST/QST), imposed under section 165 of the Excise Tax Act and section 16 of the Act respecting the Quebec sales tax respectively, on our trade execution fees on equities and derivatives. Effective February 2011, we stopped charging HST/QST on these trade execution fees for both Toronto Stock Exchange and TSX Venture Exchange. We are confident that the ruling requests will be approved, and as such, have not provided for HST/QST not charged to customers in 2011. We are currently reviewing our historical and prospective process for claiming input tax credits for HST and input tax refunds for QST (collectively referred to as ITC) on the affected businesses but have not yet amended our historical or current ITC claims to reflect the changes in tax treatment. If the ruling requests are approved, we may be required to repay to the taxation authorities the ITCs claimed prior to February 2011 on the affected businesses. TMX Group firmly believes that the liability related to these ITCs should be $0; however, a repayment of up to four years of ITCs previously claimed may be required. As a result, we have estimated the range of possible outcomes to be between $0 and $11.0 million. A provision of $4.8 million was recorded in Q1/11 for prior periods, and the cost is included within General and administration expenses in the income statement for 1H/11. No change to this provision was made for Q2/11. Future estimates may be different and a change in the provisions may be required.
Depreciation and Amortization
(in millions of dollars)
1H/11 1H/10 $ (decrease) % (decrease)
$ 13.6 $ 14.7 ($1.1) (7%)
• Depreciation and amortization costs decreased due to reduced amortization relating to assets that were fully depreciated by 1H/11.
5 The “General and Administration” section above contains certain forward-looking statements. Please refer to “Caution Regarding Forward-Looking Information” for a discussion of risks and uncertainties related to such statements.
20
• The decrease also reflected lower amortization of the intangible assets related to the TMX Smart Order Router, MX trading participants and The Equicom Group Inc. (Equicom) customer list. This decrease was partially offset by increased amortization of intangible assets related to newly launched products.
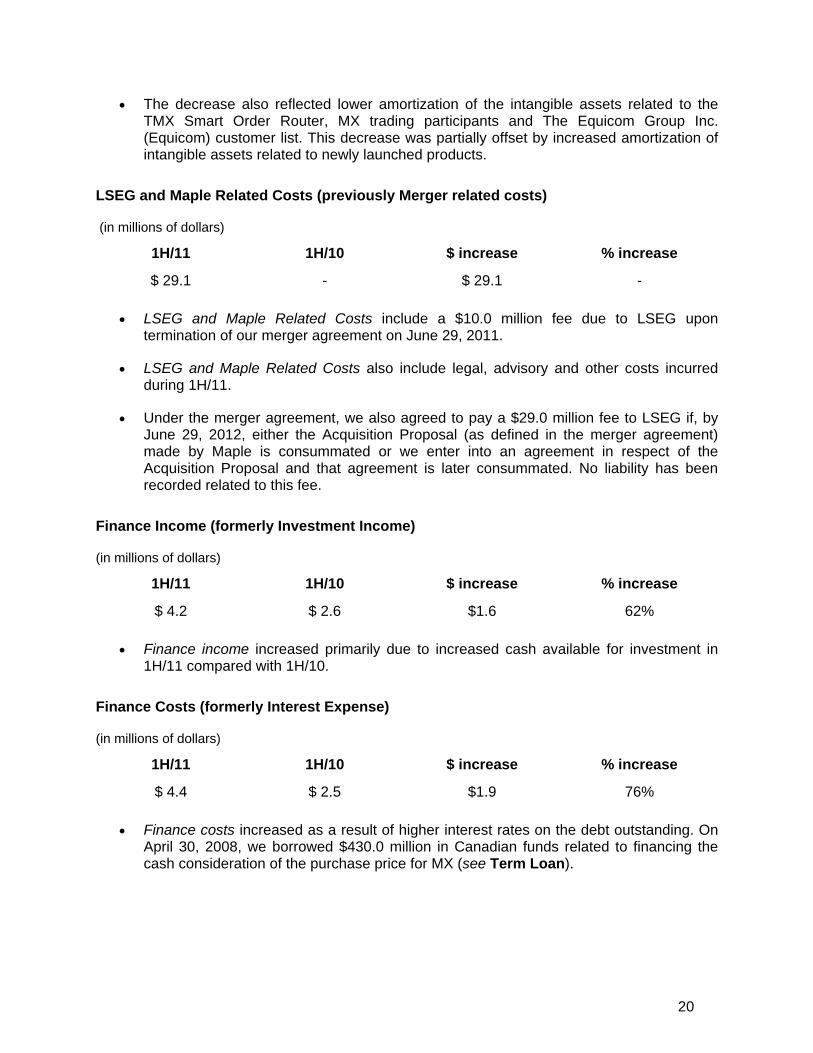
LSEG and Maple Related Costs (previously Merger related costs)
(in millions of dollars)
1H/11 1H/10 $ increase % increase
$ 29.1 - $ 29.1 -
• LSEG and Maple Related Costs include a $10.0 million fee due to LSEG upon termination of our merger agreement on June 29, 2011.
• LSEG and Maple Related Costs also include legal, advisory and other costs incurred during 1H/11.
• Under the merger agreement, we also agreed to pay a $29.0 million fee to LSEG if, by June 29, 2012, either the Acquisition Proposal (as defined in the merger agreement) made by Maple is consummated or we enter into an agreement in respect of the Acquisition Proposal and that agreement is later consummated. No liability has been recorded related to this fee.
Finance Income (formerly Investment Income)
(in millions of dollars)
1H/11 1H/10 $ increase % increase
$ 4.2 $ 2.6 $1.6 62%
• Finance income increased primarily due to increased cash available for investment in 1H/11 compared with 1H/10.
Finance Costs (formerly Interest Expense)
(in millions of dollars)
1H/11 1H/10 $ increase % increase
$ 4.4 $ 2.5 $1.9 76%
• Finance costs increased as a result of higher interest rates on the debt outstanding. On April 30, 2008, we borrowed $430.0 million in Canadian funds related to financing the cash consideration of the purchase price for MX (see Term Loan).
21
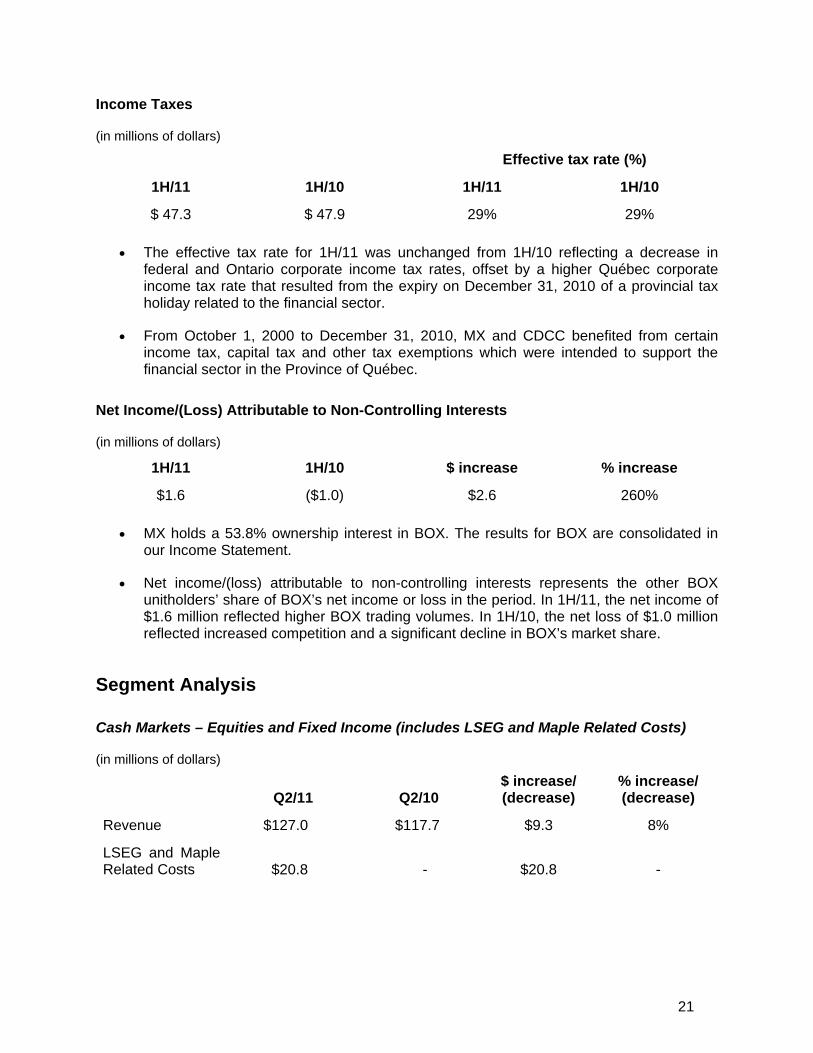
Income Taxes
(in millions of dollars)
Effective tax rate (%)
1H/11 1H/10 1H/11 1H/10
$ 47.3 $ 47.9 29% 29%
• The effective tax rate for 1H/11 was unchanged from 1H/10 reflecting a decrease in federal and Ontario corporate income tax rates, offset by a higher Québec corporate income tax rate that resulted from the expiry on December 31, 2010 of a provincial tax holiday related to the financial sector.
• From October 1, 2000 to December 31, 2010, MX and CDCC benefited from certain income tax, capital tax and other tax exemptions which were intended to support the financial sector in the Province of Québec.
Net Income/(Loss) Attributable to Non-Controlling Interests
(in millions of dollars)
1H/11 1H/10 $ increase % increase
$1.6 ($1.0) $2.6 260%
• MX holds a 53.8% ownership interest in BOX. The results for BOX are consolidated in our Income Statement.
• Net income/(loss) attributable to non-controlling interests represents the other BOX unitholders’ share of BOX’s net income or loss in the period. In 1H/11, the net income of $1.6 million reflected higher BOX trading volumes. In 1H/10, the net loss of $1.0 million reflected increased competition and a significant decline in BOX’s market share.
Segment Analysis
Cash Markets – Equities and Fixed Income (includes LSEG and Maple Related Costs)
(in millions of dollars)
Q2/11 Q2/10 $ increase/ (decrease)
% increase/ (decrease)
Revenue $127.0 $117.7 $9.3 8%
LSEG and Maple Related Costs $20.8 - $20.8 -
22
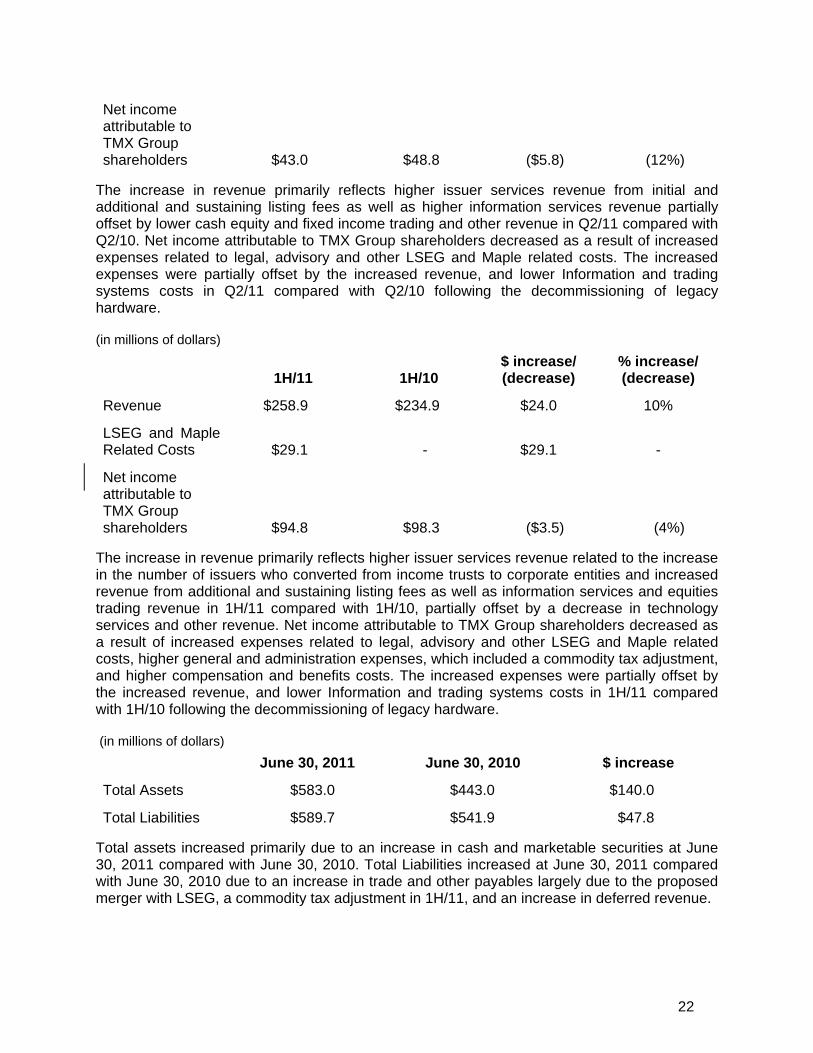
Net income attributable to TMX Group shareholders $43.0 $48.8 ($5.8) (12%)
The increase in revenue primarily reflects higher issuer services revenue from initial and additional and sustaining listing fees as well as higher information services revenue partially offset by lower cash equity and fixed income trading and other revenue in Q2/11 compared with Q2/10. Net income attributable to TMX Group shareholders decreased as a result of increased expenses related to legal, advisory and other LSEG and Maple related costs. The increased expenses were partially offset by the increased revenue, and lower Information and trading systems costs in Q2/11 compared with Q2/10 following the decommissioning of legacy hardware.
(in millions of dollars)
1H/11 1H/10 $ increase/ (decrease)
% increase/ (decrease)
Revenue $258.9 $234.9 $24.0 10%
LSEG and Maple Related Costs $29.1 - $29.1 -
Net income attributable to TMX Group shareholders $94.8 $98.3 ($3.5) (4%)
The increase in revenue primarily reflects higher issuer services revenue related to the increase in the number of issuers who converted from income trusts to corporate entities and increased revenue from additional and sustaining listing fees as well as information services and equities trading revenue in 1H/11 compared with 1H/10, partially offset by a decrease in technology services and other revenue. Net income attributable to TMX Group shareholders decreased as a result of increased expenses related to legal, advisory and other LSEG and Maple related costs, higher general and administration expenses, which included a commodity tax adjustment, and higher compensation and benefits costs. The increased expenses were partially offset by the increased revenue, and lower Information and trading systems costs in 1H/11 compared with 1H/10 following the decommissioning of legacy hardware.
(in millions of dollars) June 30, 2011 June 30, 2010 $ increase
Total Assets $583.0 $443.0 $140.0
Total Liabilities $589.7 $541.9 $47.8
Total assets increased primarily due to an increase in cash and marketable securities at June 30, 2011 compared with June 30, 2010. Total Liabilities increased at June 30, 2011 compared with June 30, 2010 due to an increase in trade and other payables largely due to the proposed merger with LSEG, a commodity tax adjustment in 1H/11, and an increase in deferred revenue.
23
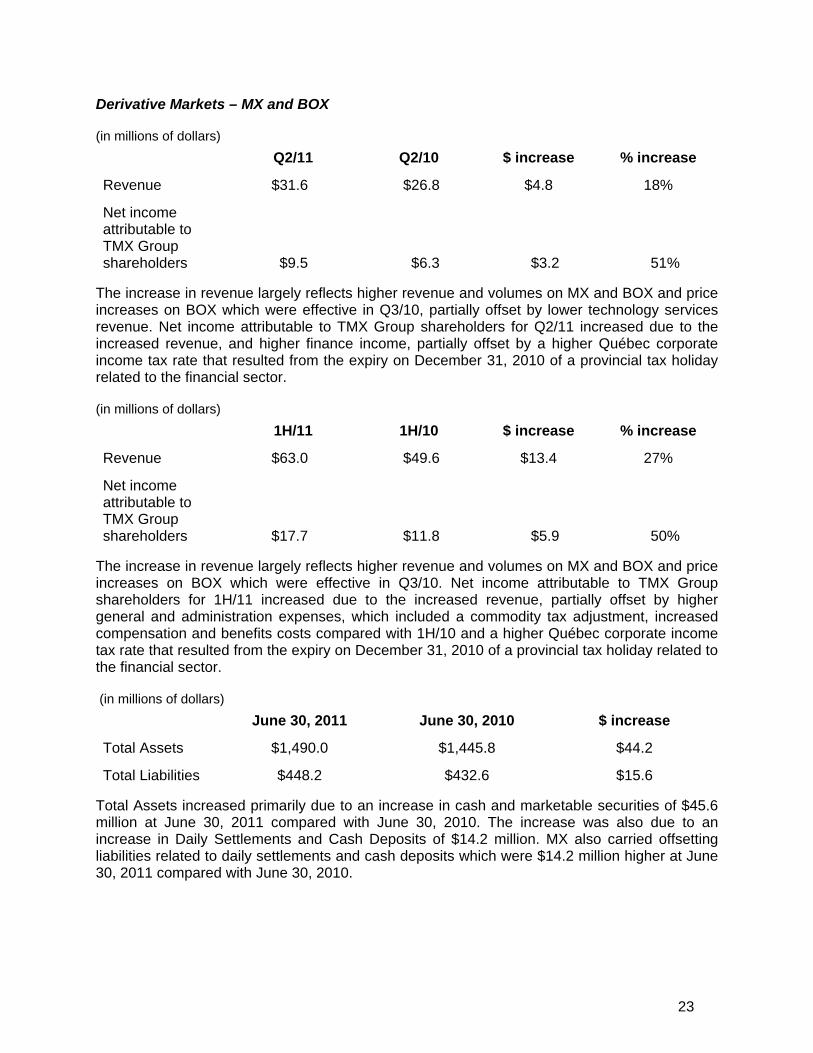
Derivative Markets – MX and BOX
(in millions of dollars) Q2/11 Q2/10 $ increase % increase
Revenue $31.6 $26.8 $4.8 18%
Net income attributable to TMX Group shareholders $9.5 $6.3 $3.2 51%
The increase in revenue largely reflects higher revenue and volumes on MX and BOX and price increases on BOX which were effective in Q3/10, partially offset by lower technology services revenue. Net income attributable to TMX Group shareholders for Q2/11 increased due to the increased revenue, and higher finance income, partially offset by a higher Québec corporate income tax rate that resulted from the expiry on December 31, 2010 of a provincial tax holiday related to the financial sector.
(in millions of dollars) 1H/11 1H/10 $ increase % increase
Revenue $63.0 $49.6 $13.4 27%
Net income attributable to TMX Group shareholders $17.7 $11.8 $5.9 50%
The increase in revenue largely reflects higher revenue and volumes on MX and BOX and price increases on BOX which were effective in Q3/10. Net income attributable to TMX Group shareholders for 1H/11 increased due to the increased revenue, partially offset by higher general and administration expenses, which included a commodity tax adjustment, increased compensation and benefits costs compared with 1H/10 and a higher Québec corporate income tax rate that resulted from the expiry on December 31, 2010 of a provincial tax holiday related to the financial sector.
(in millions of dollars) June 30, 2011 June 30, 2010 $ increase
Total Assets $1,490.0 $1,445.8 $44.2
Total Liabilities $448.2 $432.6 $15.6
Total Assets increased primarily due to an increase in cash and marketable securities of $45.6 million at June 30, 2011 compared with June 30, 2010. The increase was also due to an increase in Daily Settlements and Cash Deposits of $14.2 million. MX also carried offsetting liabilities related to daily settlements and cash deposits which were $14.2 million higher at June 30, 2011 compared with June 30, 2010.
24
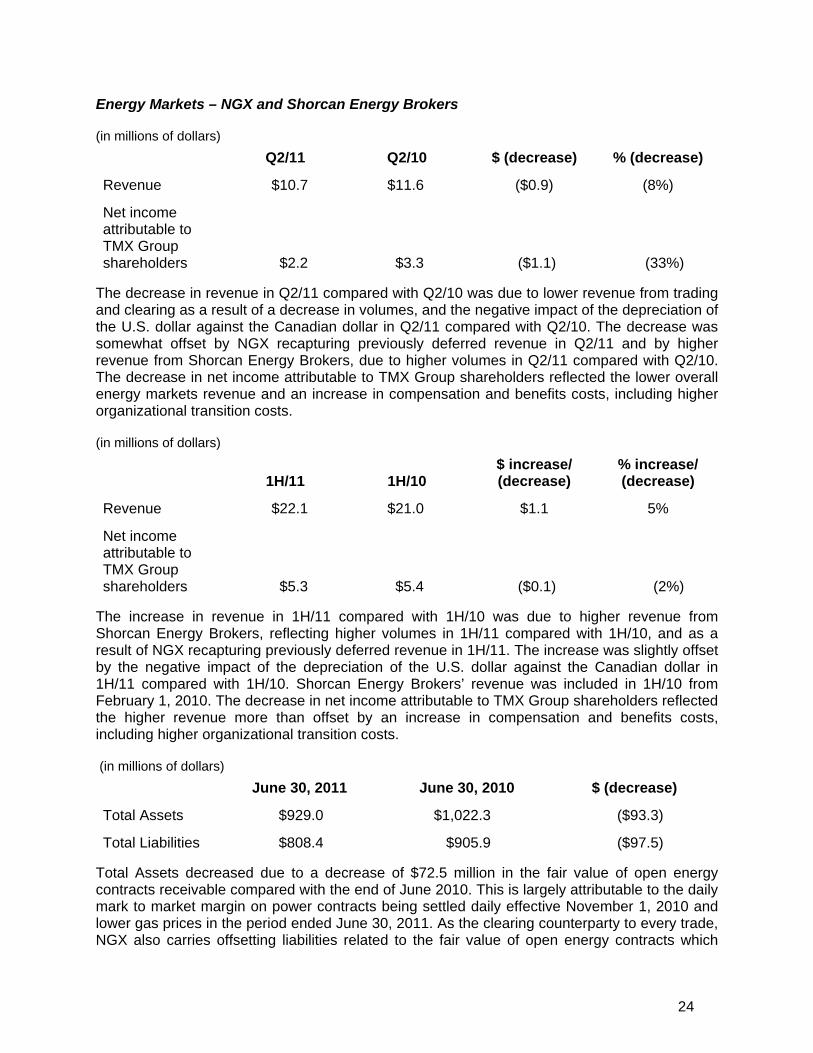
Energy Markets – NGX and Shorcan Energy Brokers
(in millions of dollars) Q2/11 Q2/10 $ (decrease) % (decrease)
Revenue $10.7 $11.6 ($0.9) (8%)
Net income attributable to TMX Group shareholders $2.2 $3.3 ($1.1) (33%)
The decrease in revenue in Q2/11 compared with Q2/10 was due to lower revenue from trading and clearing as a result of a decrease in volumes, and the negative impact of the depreciation of the U.S. dollar against the Canadian dollar in Q2/11 compared with Q2/10. The decrease was somewhat offset by NGX recapturing previously deferred revenue in Q2/11 and by higher revenue from Shorcan Energy Brokers, due to higher volumes in Q2/11 compared with Q2/10. The decrease in net income attributable to TMX Group shareholders reflected the lower overall energy markets revenue and an increase in compensation and benefits costs, including higher organizational transition costs.
(in millions of dollars)
1H/11 1H/10 $ increase/ (decrease)
% increase/ (decrease)
Revenue $22.1 $21.0 $1.1 5%
Net income attributable to TMX Group shareholders $5.3 $5.4 ($0.1) (2%)
The increase in revenue in 1H/11 compared with 1H/10 was due to higher revenue from Shorcan Energy Brokers, reflecting higher volumes in 1H/11 compared with 1H/10, and as a result of NGX recapturing previously deferred revenue in 1H/11. The increase was slightly offset by the negative impact of the depreciation of the U.S. dollar against the Canadian dollar in 1H/11 compared with 1H/10. Shorcan Energy Brokers’ revenue was included in 1H/10 from February 1, 2010. The decrease in net income attributable to TMX Group shareholders reflected the higher revenue more than offset by an increase in compensation and benefits costs, including higher organizational transition costs.
(in millions of dollars) June 30, 2011 June 30, 2010 $ (decrease)
Total Assets $929.0 $1,022.3 ($93.3)
Total Liabilities $808.4 $905.9 ($97.5)
Total Assets decreased due to a decrease of $72.5 million in the fair value of open energy contracts receivable compared with the end of June 2010. This is largely attributable to the daily mark to market margin on power contracts being settled daily effective November 1, 2010 and lower gas prices in the period ended June 30, 2011. As the clearing counterparty to every trade, NGX also carries offsetting liabilities related to the fair value of open energy contracts which
25
were also $72.5 million lower at June 30, 2011 compared with June 30, 2010. The decrease in Total Assets was also due to a decrease in energy contracts receivable of $23.4 million due to lower gas prices compared with the end of June 2010 and lower volumes delivered. As the clearing counterparty to every trade, NGX also carries offsetting liabilities in the form of energy contracts payable, which were $23.4 million lower at the end of June 2011.
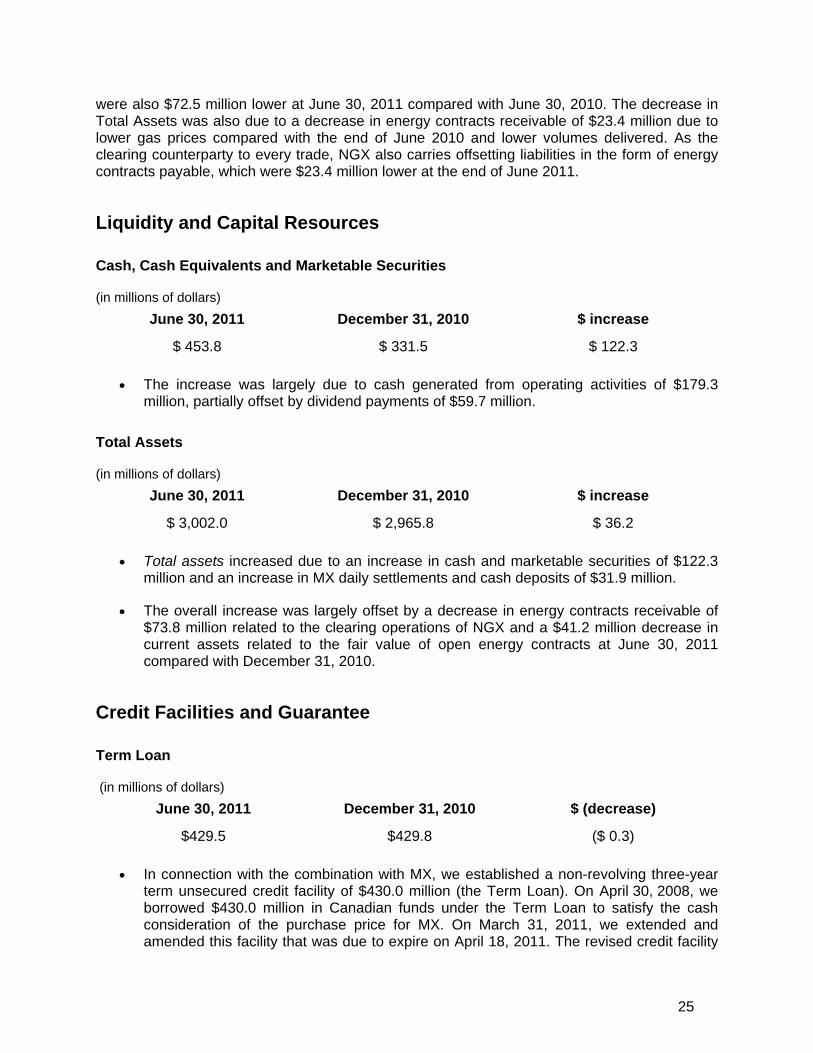
Liquidity and Capital Resources
Cash, Cash Equivalents and Marketable Securities
(in millions of dollars) June 30, 2011 December 31, 2010 $ increase
$ 453.8 $ 331.5 $ 122.3
• The increase was largely due to cash generated from operating activities of $179.3 million, partially offset by dividend payments of $59.7 million.
Total Assets
(in millions of dollars) June 30, 2011 December 31, 2010 $ increase
$ 3,002.0 $ 2,965.8 $ 36.2
• Total assets increased due to an increase in cash and marketable securities of $122.3 million and an increase in MX daily settlements and cash deposits of $31.9 million.
• The overall increase was largely offset by a decrease in energy contracts receivable of $73.8 million related to the clearing operations of NGX and a $41.2 million decrease in current assets related to the fair value of open energy contracts at June 30, 2011 compared with December 31, 2010.
Credit Facilities and Guarantee
Term Loan
(in millions of dollars) June 30, 2011 December 31, 2010 $ (decrease)
$429.5 $429.8 ($ 0.3)
• In connection with the combination with MX, we established a non-revolving three-year term unsecured credit facility of $430.0 million (the Term Loan). On April 30, 2008, we borrowed $430.0 million in Canadian funds under the Term Loan to satisfy the cash consideration of the purchase price for MX. On March 31, 2011, we extended and amended this facility that was due to expire on April 18, 2011. The revised credit facility
26
remains at $430.0 and will expire on December 28, 2011. Until April 18, 2011, the credit facility attracted interest at Bankers’ Acceptance (BA) plus 45 basis points. After that date, interest is charged at BAs plus 85 basis points.
• This credit facility contains customary covenants, including a requirement that TMX Group maintain:
• a maximum debt to adjusted EBITDA ratio of 3.5:1, where adjusted EBITDA means earnings on a consolidated basis before interest, taxes, extraordinary, unusual or non-recurring items, depreciation and amortization, all determined in accordance with IFRS;
• a minimum consolidated net worth covenant based on a pre-determined formula; and
• a debt incurrence test whereby debt to adjusted EBITDA must not exceed 3.0:1.
At June 30, 2011, all covenants were met.
Other Credit Facilities and Guarantee
To backstop its clearing operations, NGX currently has a credit agreement in place with a Canadian chartered bank which includes a US$100.0 million clearing backstop fund. We are NGX’s unsecured guarantor for this fund up to a maximum of US$100.0 million. This facility had not been drawn upon at June 30, 2011.
NGX also has an Electronic Funds Transfer (EFT) Daylight facility of $300.0 million in place with a Canadian Schedule I bank.
CDCC has a $50.0 million revolving standby credit facility with a Canadian Schedule I bank to provide liquidity in the event of default by a clearing member. This facility had not been drawn upon at June 30, 2011.
In addition, in January, 2011, CDCC arranged additional credit facilities. A $100.0 million daylight liquidity facility and a $50.0 million call loan facility were signed with a Canadian Schedule 1 bank. CDCC has not drawn on either facility.
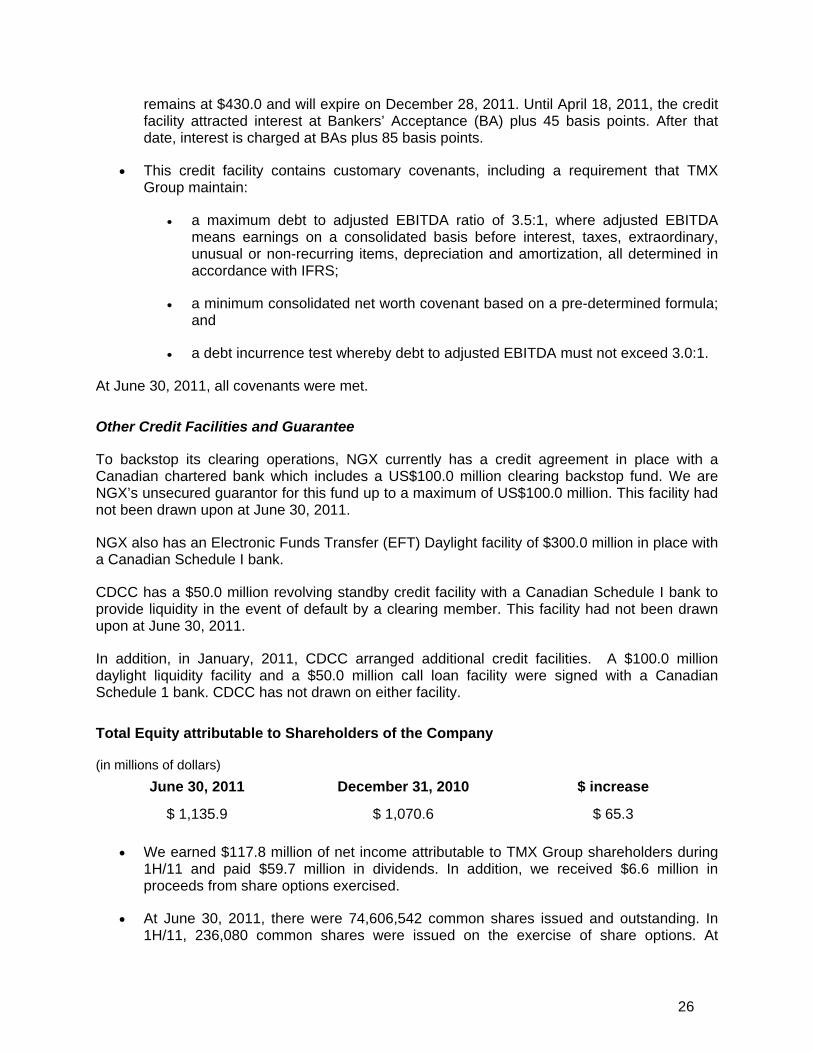
Total Equity attributable to Shareholders of the Company
(in millions of dollars) June 30, 2011 December 31, 2010 $ increase
$ 1,135.9 $ 1,070.6 $ 65.3
• We earned $117.8 million of net income attributable to TMX Group shareholders during 1H/11 and paid $59.7 million in dividends. In addition, we received $6.6 million in proceeds from share options exercised.
• At June 30, 2011, there were 74,606,542 common shares issued and outstanding. In 1H/11, 236,080 common shares were issued on the exercise of share options. At
27
June 30, 2011, 3,828,146 common shares were reserved for issuance upon the exercise of options granted under the share option plan. At June 30, 2011, there were 1,875,148 options outstanding.
• At August 3, 2011, there were 74,609,551 common shares issued and outstanding and 1,865,558 options outstanding under the share option plan.
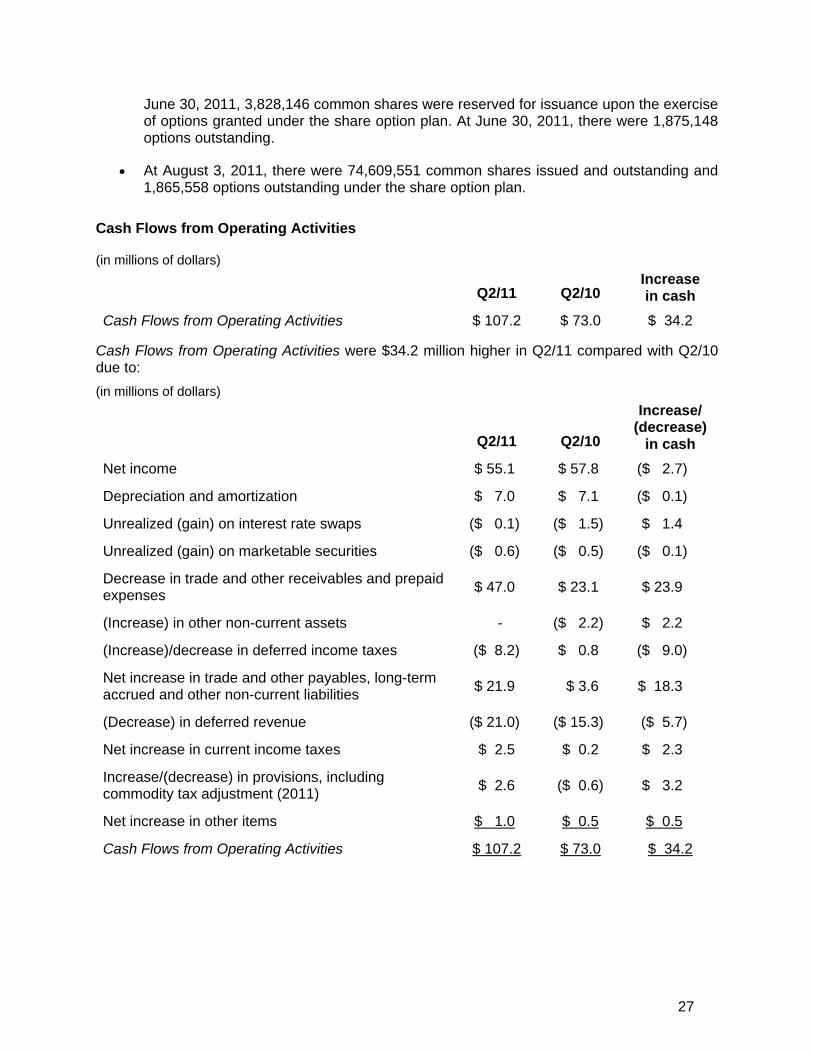
Cash Flows from Operating Activities
(in millions of dollars)
Q2/11 Q2/10 Increase in cash
Cash Flows from Operating Activities $ 107.2 $ 73.0 $ 34.2
Cash Flows from Operating Activities were $34.2 million higher in Q2/11 compared with Q2/10 due to: (in millions of dollars)
Q2/11 Q2/10
Increase/ (decrease)
in cash Net income $ 55.1 $ 57.8 ($ 2.7)
Depreciation and amortization $ 7.0 $ 7.1 ($ 0.1)
Unrealized (gain) on interest rate swaps ($ 0.1) ($ 1.5) $ 1.4
Unrealized (gain) on marketable securities ($ 0.6) ($ 0.5) ($ 0.1)
Decrease in trade and other receivables and prepaid expenses $ 47.0 $ 23.1 $ 23.9
(Increase) in other non-current assets - ($ 2.2) $ 2.2
(Increase)/decrease in deferred income taxes ($ 8.2) $ 0.8 ($ 9.0)
Net increase in trade and other payables, long-term accrued and other non-current liabilities $ 21.9 $ 3.6 $ 18.3
(Decrease) in deferred revenue ($ 21.0) ($ 15.3) ($ 5.7)
Net increase in current income taxes $ 2.5 $ 0.2 $ 2.3
Increase/(decrease) in provisions, including commodity tax adjustment (2011) $ 2.6 ($ 0.6) $ 3.2
Net increase in other items $ 1.0 $ 0.5 $ 0.5
Cash Flows from Operating Activities $ 107.2 $ 73.0 $ 34.2
28
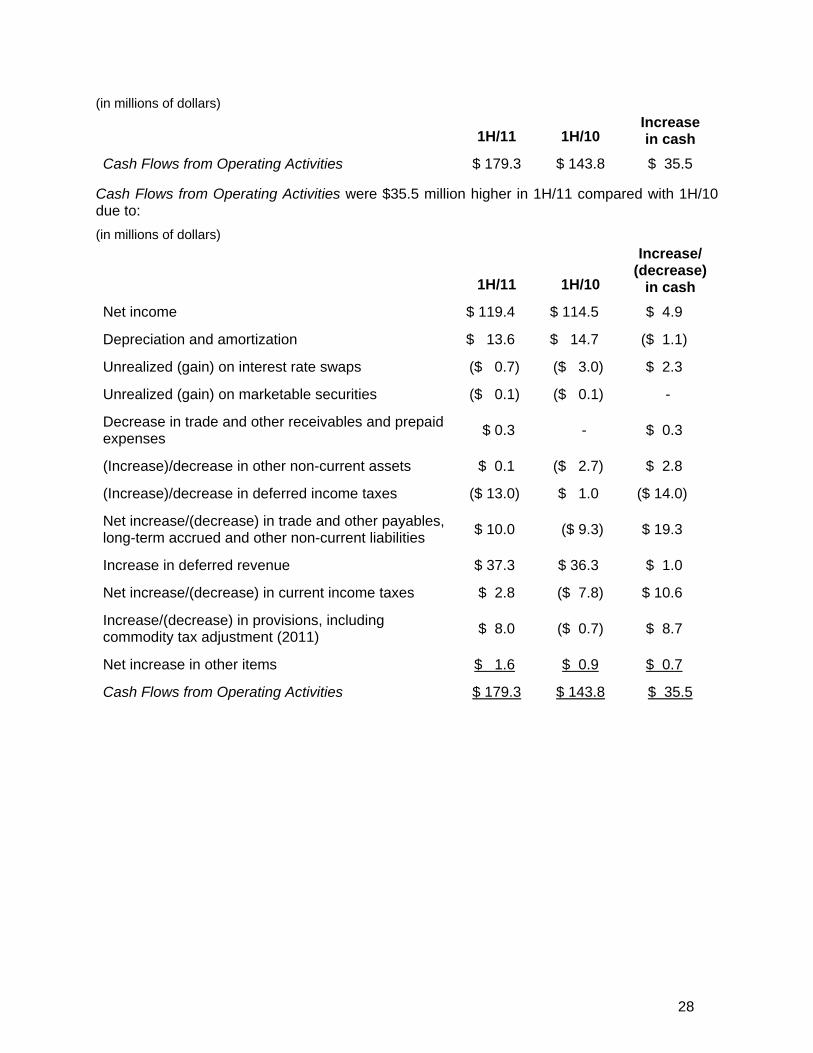
(in millions of dollars)
1H/11 1H/10 Increase in cash
Cash Flows from Operating Activities $ 179.3 $ 143.8 $ 35.5
Cash Flows from Operating Activities were $35.5 million higher in 1H/11 compared with 1H/10 due to: (in millions of dollars)
1H/11 1H/10
Increase/ (decrease)
in cash Net income $ 119.4 $ 114.5 $ 4.9
Depreciation and amortization $ 13.6 $ 14.7 ($ 1.1)
Unrealized (gain) on interest rate swaps ($ 0.7) ($ 3.0) $ 2.3
Unrealized (gain) on marketable securities ($ 0.1) ($ 0.1) -
Decrease in trade and other receivables and prepaid expenses $ 0.3 - $ 0.3
(Increase)/decrease in other non-current assets $ 0.1 ($ 2.7) $ 2.8
(Increase)/decrease in deferred income taxes ($ 13.0) $ 1.0 ($ 14.0)
Net increase/(decrease) in trade and other payables, long-term accrued and other non-current liabilities $ 10.0 ($ 9.3) $ 19.3
Increase in deferred revenue $ 37.3 $ 36.3 $ 1.0
Net increase/(decrease) in current income taxes $ 2.8 ($ 7.8) $ 10.6
Increase/(decrease) in provisions, including commodity tax adjustment (2011) $ 8.0 ($ 0.7) $ 8.7
Net increase in other items $ 1.6 $ 0.9 $ 0.7
Cash Flows from Operating Activities $ 179.3 $ 143.8 $ 35.5
29
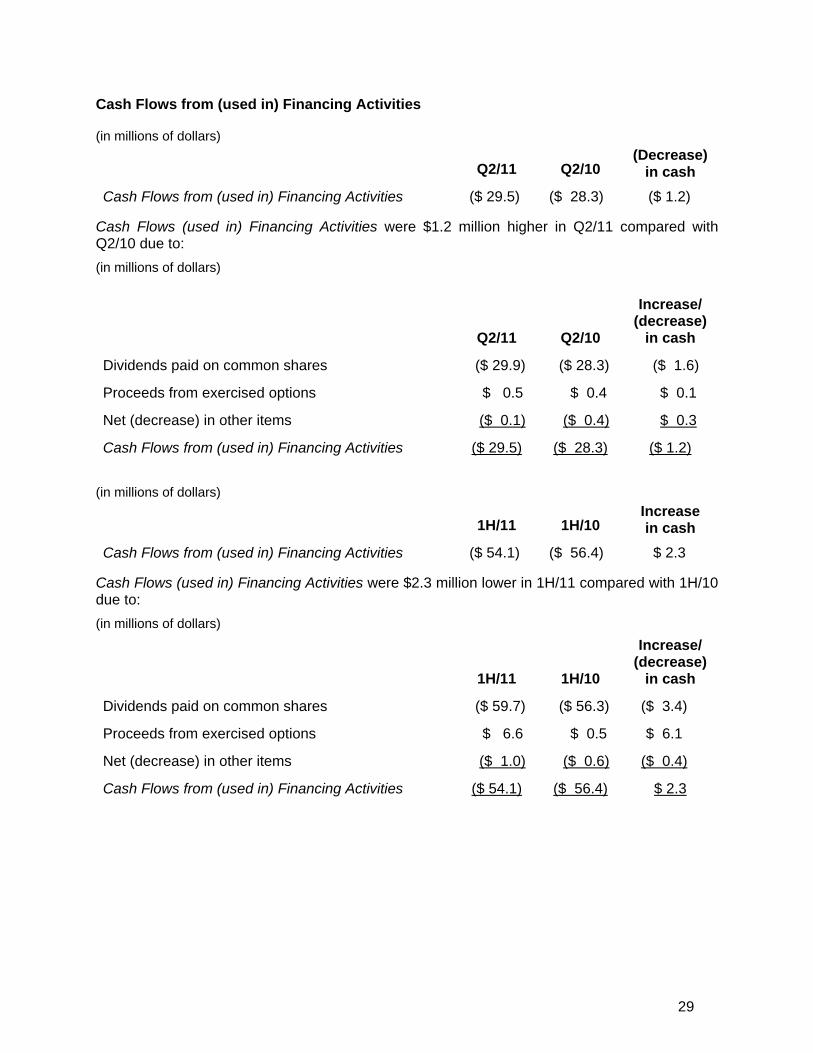
Cash Flows from (used in) Financing Activities
(in millions of dollars)
Q2/11 Q2/10 (Decrease)
in cash Cash Flows from (used in) Financing Activities ($ 29.5) ($ 28.3) ($ 1.2)
Cash Flows (used in) Financing Activities were $1.2 million higher in Q2/11 compared with Q2/10 due to: (in millions of dollars)
Q2/11 Q2/10
Increase/ (decrease)
in cash
Dividends paid on common shares ($ 29.9) ($ 28.3) ($ 1.6)
Proceeds from exercised options $ 0.5 $ 0.4 $ 0.1
Net (decrease) in other items ($ 0.1) ($ 0.4) $ 0.3
Cash Flows from (used in) Financing Activities ($ 29.5) ($ 28.3) ($ 1.2)
(in millions of dollars)
1H/11 1H/10 Increase in cash
Cash Flows from (used in) Financing Activities ($ 54.1) ($ 56.4) $ 2.3
Cash Flows (used in) Financing Activities were $2.3 million lower in 1H/11 compared with 1H/10 due to: (in millions of dollars)
1H/11 1H/10
Increase/ (decrease)
in cash
Dividends paid on common shares ($ 59.7) ($ 56.3) ($ 3.4)
Proceeds from exercised options $ 6.6 $ 0.5 $ 6.1
Net (decrease) in other items ($ 1.0) ($ 0.6) ($ 0.4)
Cash Flows from (used in) Financing Activities ($ 54.1) ($ 56.4) $ 2.3
30
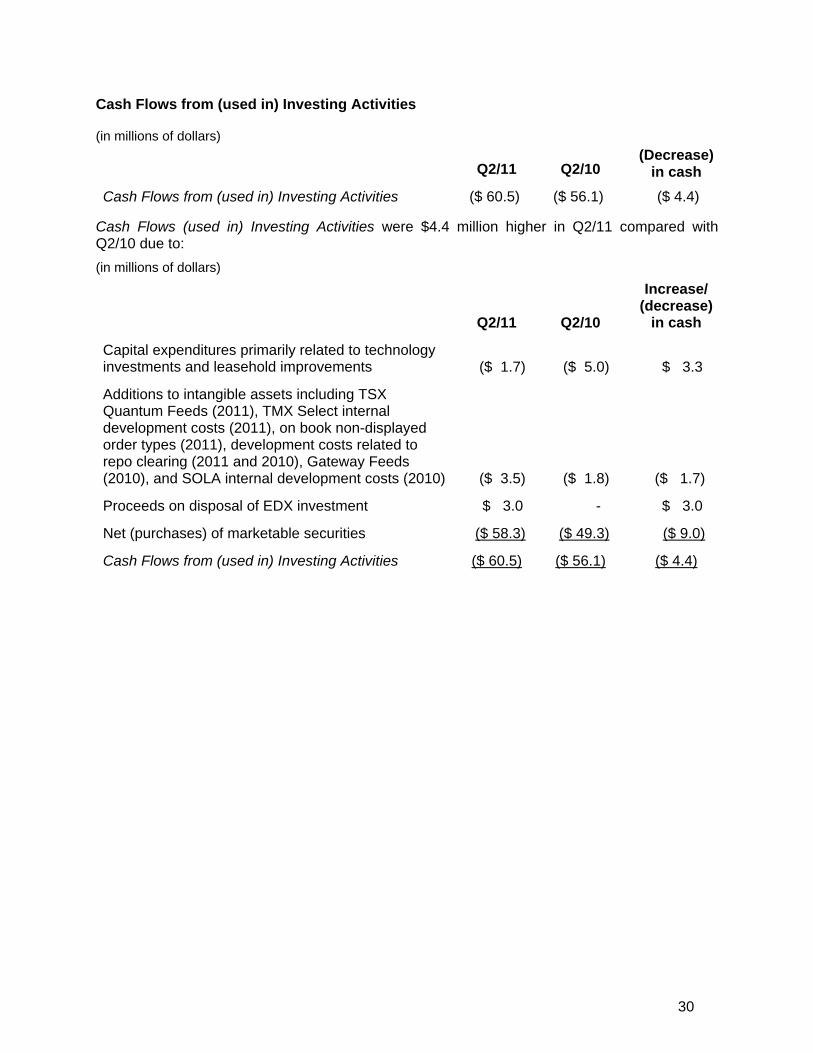
Cash Flows from (used in) Investing Activities
(in millions of dollars)
Q2/11 Q2/10 (Decrease)
in cash Cash Flows from (used in) Investing Activities ($ 60.5) ($ 56.1) ($ 4.4)
Cash Flows (used in) Investing Activities were $4.4 million higher in Q2/11 compared with Q2/10 due to: (in millions of dollars)
Q2/11 Q2/10
Increase/ (decrease)
in cash
Capital expenditures primarily related to technology investments and leasehold improvements ($ 1.7) ($ 5.0) $ 3.3
Additions to intangible assets including TSX Quantum Feeds (2011), TMX Select internal development costs (2011), on book non-displayed order types (2011), development costs related to repo clearing (2011 and 2010), Gateway Feeds (2010), and SOLA internal development costs (2010) ($ 3.5) ($ 1.8) ($ 1.7)
Proceeds on disposal of EDX investment $ 3.0 - $ 3.0
Net (purchases) of marketable securities ($ 58.3) ($ 49.3) ($ 9.0)
Cash Flows from (used in) Investing Activities ($ 60.5) ($ 56.1) ($ 4.4)
31
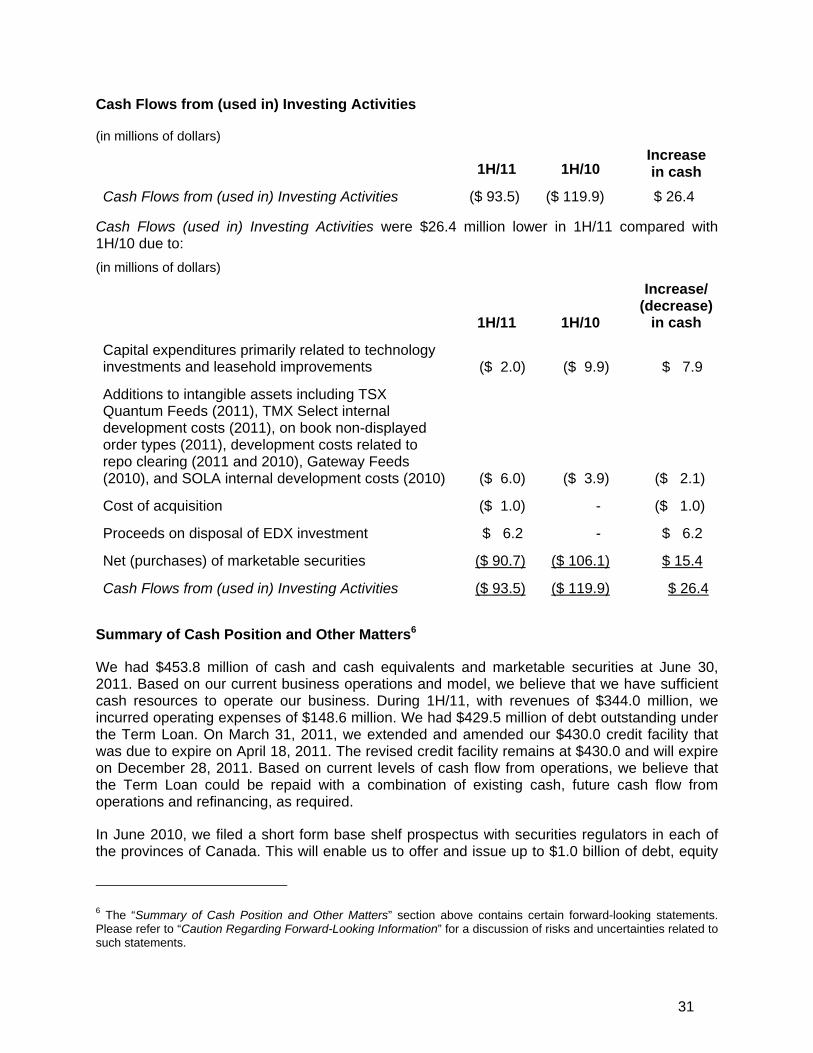
Cash Flows from (used in) Investing Activities
(in millions of dollars)
1H/11 1H/10 Increase in cash
Cash Flows from (used in) Investing Activities ($ 93.5) ($ 119.9) $ 26.4
Cash Flows (used in) Investing Activities were $26.4 million lower in 1H/11 compared with 1H/10 due to: (in millions of dollars)
1H/11 1H/10
Increase/ (decrease)
in cash
Capital expenditures primarily related to technology investments and leasehold improvements ($ 2.0) ($ 9.9) $ 7.9
Additions to intangible assets including TSX Quantum Feeds (2011), TMX Select internal development costs (2011), on book non-displayed order types (2011), development costs related to repo clearing (2011 and 2010), Gateway Feeds (2010), and SOLA internal development costs (2010) ($ 6.0) ($ 3.9) ($ 2.1)
Cost of acquisition ($ 1.0) - ($ 1.0)
Proceeds on disposal of EDX investment $ 6.2 - $ 6.2
Net (purchases) of marketable securities ($ 90.7) ($ 106.1) $ 15.4
Cash Flows from (used in) Investing Activities ($ 93.5) ($ 119.9) $ 26.4
Summary of Cash Position and Other Matters6
We had $453.8 million of cash and cash equivalents and marketable securities at June 30, 2011. Based on our current business operations and model, we believe that we have sufficient cash resources to operate our business. During 1H/11, with revenues of $344.0 million, we incurred operating expenses of $148.6 million. We had $429.5 million of debt outstanding under the Term Loan. On March 31, 2011, we extended and amended our $430.0 credit facility that was due to expire on April 18, 2011. The revised credit facility remains at $430.0 and will expire on December 28, 2011. Based on current levels of cash flow from operations, we believe that the Term Loan could be repaid with a combination of existing cash, future cash flow from operations and refinancing, as required.
In June 2010, we filed a short form base shelf prospectus with securities regulators in each of the provinces of Canada. This will enable us to offer and issue up to $1.0 billion of debt, equity
6 The “Summary of Cash Position and Other Matters” section above contains certain forward-looking statements. Please refer to “Caution Regarding Forward-Looking Information” for a discussion of risks and uncertainties related to such statements.
32
or other securities over a 25-month period ending in July 2012. The net proceeds of any such offerings would be used for general corporate purposes, including repaying outstanding indebtedness from time to time, and funding future acquisitions or investments.
Cash flows from operations were $179.3 million in 1H/11. We paid $59.7 million in dividends in 1H/11.
In keeping with our commitment to deliver state of the art levels of technology to our markets, we are continuing to invest in, and are implementing a multi-phased initiative to expand the infrastructure across our trading and data enterprise. In order to increase throughput capability, we are expanding our internal networks, storage and application servers. The first expansion phase was completed in Q1/10. We are incurring annual operating expenses, including amortization, of approximately $10.0 million to support this initiative. We expect the second expansion phase to be complete in Q4/11. Our technology team is also currently focused on research and development of next generation trading technology.
Debt financing of future investment opportunities could be limited by current and future economic conditions, the covenants on TMX Group’s existing credit facilities, and by our financial viability ratios imposed by securities regulators.
The recognition order of TSX Inc. by the OSC contains certain financial viability tests that must be met. If TSX Inc. fails to meet any of these tests for a period of more than three months, TSX Inc. cannot, without the prior approval of the Director of the OSC, pay dividends (among other things) until the deficiencies have been eliminated for at least six months or a shorter period of time as agreed by OSC staff. TSX Venture Exchange is required by various provincial securities commissions to maintain adequate financial resources for the performance of its functions in a manner that is consistent with the public interest and the terms of its recognition orders. Under its recognition order, MX is also subject to certain financial viability tests set by the Autorité des marchés financiers (AMF) that must be met. If MX fails to meet any of these tests for a period of more than three months, MX cannot, without the prior approval of the AMF, pay dividends (among other things) until the deficiencies have been eliminated for at least six months. NGX is required by the ASC to maintain adequate financial resources to operate its trading system and support its trade execution functions.
As at June 30, 2011, we met all of the above requirements.
Managing Capital
Our primary objectives in managing capital, which we define to include our share capital and various credit facilities, include:
• Maintaining sufficient capital for operations to ensure market confidence. Currently, we target to retain a minimum of $100.0 million in cash and marketable securities. This amount is subject to change.
• We do this by managing our capital subject to capital maintenance requirements imposed on us and our subsidiaries as follows:
• In respect of TSX Inc., as required by the OSC to maintain certain regulatory ratios as defined in the OSC recognition order, as follows:
33
- a current ratio not less than 1.1:1;
- a debt to cash flow ratio not greater than 4:1; and
- a financial leverage ratio consisting of adjusted total assets to adjusted shareholders’ equity not greater than 4:1.
We have complied with these externally imposed capital requirements.
• In respect of TSX Venture Exchange Inc., as required by various provincial securities commissions to maintain adequate financial resources.
We have complied with these externally imposed capital requirements.
• In respect of NGX, to:
- maintain adequate financial resources, as required by the ASC; and
- maintain a current ratio of no less than 1:1 and a tangible net worth of not less than $9.0 million, as required by a Schedule I Canadian chartered bank.
We have complied with these externally imposed capital requirements.
• In respect of Shorcan, by IIROC which requires Shorcan to maintain a minimum level of shareholder’s equity of $0.5 million.
We have complied with this externally imposed capital requirement.
• In respect of MX, as required by the AMF to maintain certain regulatory ratios as defined in the AMF recognition order, as follows:
- a working capital ratio of not less than 1.5:1;
- a cash flow to total debt ratio of more than 20%; and
- a financial leverage ratio consisting of total assets to shareholders’ equity of less than 4:1.
We have complied with these externally imposed capital requirements.
• Maintaining sufficient capital to meet the covenants imposed in connection with our term loan (see Term Loan).
We have complied with these externally imposed capital requirements.
• Retaining sufficient capital to invest in, and continue to grow, our business both organically and through acquisitions.
• Increasing total returns to shareholders through methods such as dividends and purchasing shares for cancellation pursuant to normal course issuer bids.
34
Our objectives, policies and processes for managing capital have not changed in the current economic environment.
Changes in Internal Control over Financial Reporting
Notwithstanding our conversion to IFRS, there were no changes to internal control over financial reporting during the quarter beginning April 1, 2011 and ended on June 30, 2011 that materially affected, or are reasonably likely to materially affect, our internal control over financial reporting.
Quarterly Information
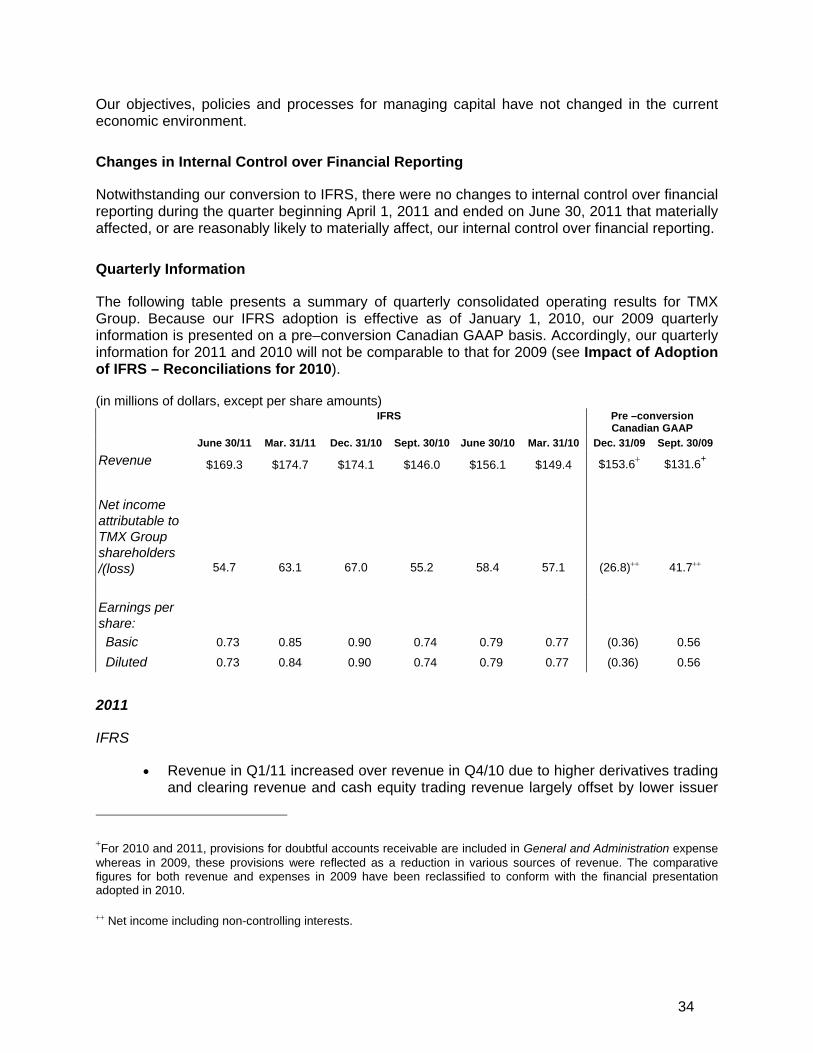
The following table presents a summary of quarterly consolidated operating results for TMX Group. Because our IFRS adoption is effective as of January 1, 2010, our 2009 quarterly information is presented on a pre–conversion Canadian GAAP basis. Accordingly, our quarterly information for 2011 and 2010 will not be comparable to that for 2009 (see Impact of Adoption of IFRS – Reconciliations for 2010).
(in millions of dollars, except per share amounts) IFRS Pre –conversion
Canadian GAAP June 30/11 Mar. 31/11 Dec. 31/10 Sept. 30/10 June 30/10 Mar. 31/10 Dec. 31/09 Sept. 30/09
Revenue $169.3 $174.7 $174.1 $146.0 $156.1 $149.4 $153.6+ $131.6+
Net income attributable to TMX Group shareholders /(loss) 54.7 63.1 67.0 55.2 58.4 57.1 (26.8)++ 41.7++
Earnings per share:
Basic 0.73 0.85 0.90 0.74 0.79 0.77 (0.36) 0.56
Diluted 0.73 0.84 0.90 0.74 0.79 0.77 (0.36) 0.56
2011
IFRS
• Revenue in Q1/11 increased over revenue in Q4/10 due to higher derivatives trading and clearing revenue and cash equity trading revenue largely offset by lower issuer
+For 2010 and 2011, provisions for doubtful accounts receivable are included in General and Administration expense whereas in 2009, these provisions were reflected as a reduction in various sources of revenue. The comparative figures for both revenue and expenses in 2009 have been reclassified to conform with the financial presentation adopted in 2010.
++ Net income including non-controlling interests.
35
services, energy trading as well as technology services and other revenue. Net income attributable to TMX Group shareholders for Q1/11 decreased over Q4/10 primarily due to costs associated with the proposed merger with LSEG and an increase in general and administration expenses related to a commodity tax adjustment.
• Revenue in Q2/11 decreased compared with revenue in Q1/11 due to lower cash markets and energy trading revenue partially offset by higher technology services and other revenue and increased revenue from issuer services and information services. Net income attributable to TMX Group shareholders for Q2/11 decreased over Q1/11 primarily due to the decreased revenue and LSEG and Maple related costs partially offset by lower general and administration costs related to a commodity tax adjustment and lower compensation and benefits costs. Finance income was somewhat higher in Q2/11 compared with Q1/11.
2010
IFRS
• It is not possible to compare revenue for Q1/10 (IFRS basis) with revenue for Q4/09 (pre-conversion Canadian GAAP basis) as issuer services revenue was recognized on a different basis. However, excluding issuer services revenue, in Q1/10 revenue decreased compared with Q4/09 due to the higher technology services revenue in Q4/09 from the one-time license fee of $13.5 million from the London Stock Exchange,(LSE) lower cash markets equity trading and energy trading revenue. This was somewhat offset by increased revenue from cash markets fixed income trading and information services. Also excluding the impact of recognizing issuer services revenue on a different basis, net income attributable to TMX Group shareholders for Q1/10 increased over the net loss reported in Q4/09 largely as a result of the non-cash goodwill impairment charge of $77.3 million related to BOX and the write-down in the value of future tax assets and liabilities of $10.4 million.
• Revenue in Q2/10 increased over revenue in Q1/10 due to higher revenue from issuer services, information services, energy trading and Canadian derivatives trading, somewhat offset by lower revenue from cash equities trading and U.S. derivatives trading. Net income attributable to TMX Group shareholders for Q2/10 increased over net income attributable to TMX Group shareholders in Q1/10 largely due to higher revenue partially offset by higher expenses as we continued to invest in technology initiatives, corporate development and marketing.
• Revenue in Q3/10 decreased over revenue in Q2/10 primarily due to lower revenue from issuer services. The decrease was also as a result of lower cash markets trading revenue and technology services revenue, partially offset by higher energy trading revenue. Net income attributable to TMX Group shareholders for Q3/10 decreased over Q2/10 due to lower revenue. The impact was partially offset by lower information and trading systems costs as well as reduced general and administration expenses.
• Revenue in Q4/10 increased over revenue in Q3/10 primarily due to significantly higher issuer services and cash markets trading revenue as well as higher derivatives trading and clearing revenue, partially offset by lower technology services
36
revenue. Net income attributable to TMX Group shareholders was higher in Q4/10 compared with Q3/10. The increase in revenue was partially offset by higher compensation and benefits costs, information and trading systems costs and general and administration costs and lower finance income (formerly investment income). In addition, there was a write-down to estimated fair value of $1.7 million on our 19.9% interest in EDX in Q4/10.
2009
Pre- conversion Canadian GAAP
• Revenue in Q3/09 decreased over revenue from Q2/09 largely due to lower revenue from Toronto Stock Exchange cash equities trading and information services. Net income for Q3/09 decreased over Q2/09 primarily due to the decreased revenue and an increase in compensation and benefits costs, information and trading systems expenses as well as amortization.
• Revenue in Q4/09 increased over revenue from Q3/09 primarily due to increased technology services revenue, which included a one-time license fee of $13.5 million from the LSE, as well as higher revenue from issuer services, cash markets trading and information services. This was partially offset by lower revenue from derivatives and energy trading. There was a net loss in Q4/09 largely due to the non-cash goodwill impairment charge of $77.3 million related to BOX and an increase in income taxes due to a write-down in the value of future tax assets and liabilities of $10.4 million, partially offset by the increased revenue and lower overall expenses compared with Q3/09.
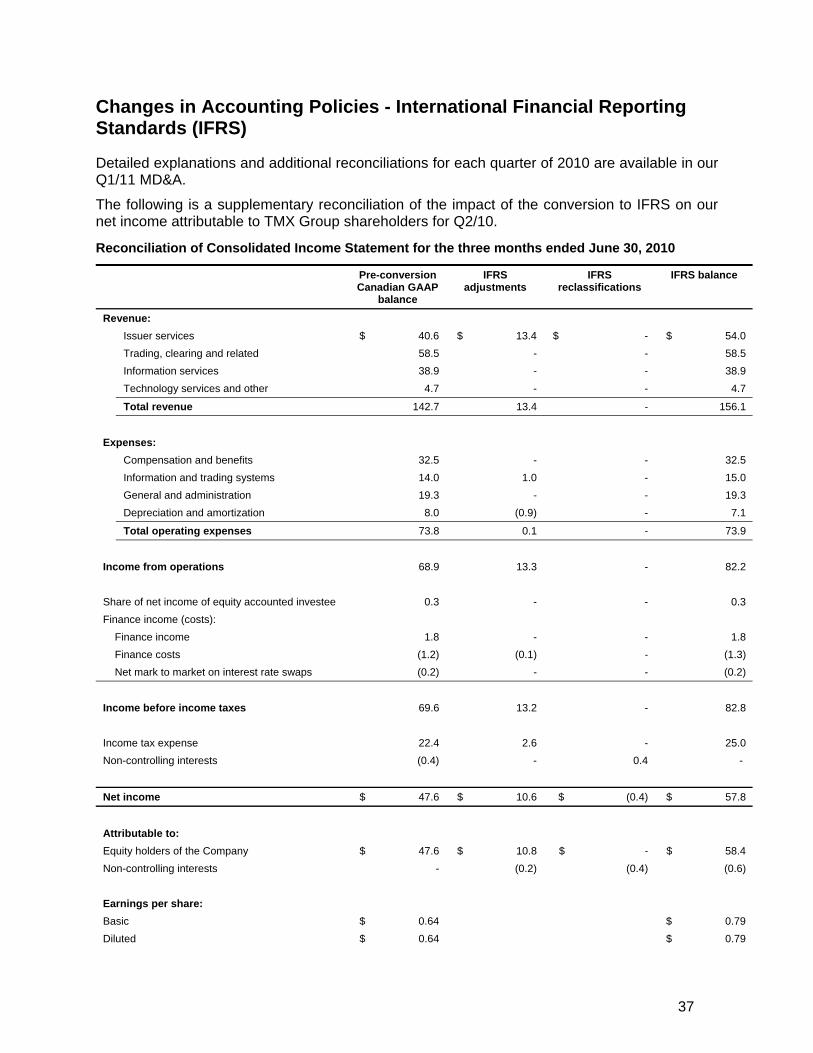
37
Changes in Accounting Policies - International Financial Reporting Standards (IFRS)
Detailed explanations and additional reconciliations for each quarter of 2010 are available in our Q1/11 MD&A.
The following is a supplementary reconciliation of the impact of the conversion to IFRS on our net income attributable to TMX Group shareholders for Q2/10.
Reconciliation of Consolidated Income Statement for the three months ended June 30, 2010
Pre-conversion Canadian GAAP
balance
IFRS adjustments
IFRS reclassifications
IFRS balance
Revenue: Issuer services $ 40.6 $ 13.4 $ - $ 54.0 Trading, clearing and related 58.5 - - 58.5 Information services 38.9 - - 38.9 Technology services and other 4.7 - - 4.7
Total revenue 142.7 13.4 - 156.1
Expenses: Compensation and benefits 32.5 - - 32.5 Information and trading systems 14.0 1.0 - 15.0 General and administration 19.3 - - 19.3 Depreciation and amortization 8.0 (0.9) - 7.1
Total operating expenses 73.8 0.1 - 73.9
Income from operations 68.9 13.3 - 82.2 Share of net income of equity accounted investee 0.3 - - 0.3 Finance income (costs): Finance income 1.8 - - 1.8 Finance costs (1.2) (0.1) - (1.3) Net mark to market on interest rate swaps (0.2) - - (0.2)
Income before income taxes 69.6 13.2 - 82.8 Income tax expense 22.4 2.6 - 25.0 Non-controlling interests (0.4) - 0.4 -
Net income $ 47.6 $ 10.6 $ (0.4) $ 57.8
Attributable to: Equity holders of the Company $ 47.6 $ 10.8 $ - $ 58.4 Non-controlling interests - (0.2) (0.4) (0.6) Earnings per share: Basic $ 0.64 $ 0.79 Diluted $ 0.64 $ 0.79
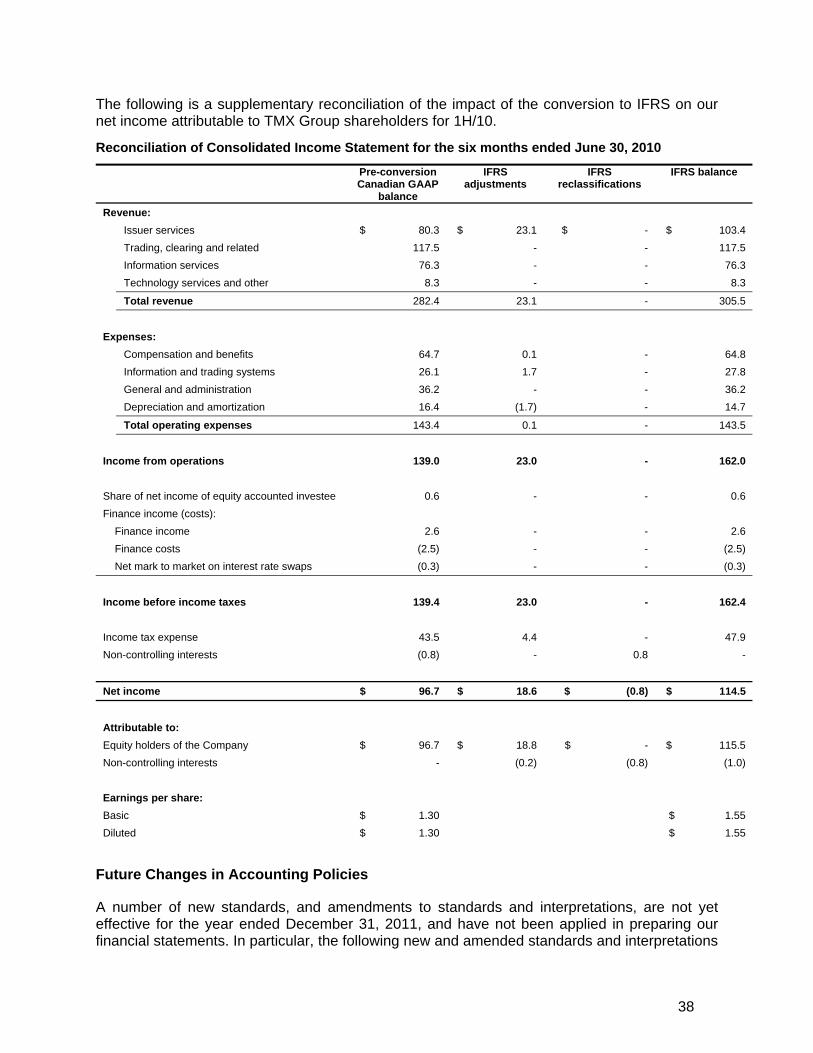
38
The following is a supplementary reconciliation of the impact of the conversion to IFRS on our net income attributable to TMX Group shareholders for 1H/10.
Reconciliation of Consolidated Income Statement for the six months ended June 30, 2010
Pre-conversion Canadian GAAP
balance
IFRS adjustments
IFRS reclassifications
IFRS balance
Revenue: Issuer services $ 80.3 $ 23.1 $ - $ 103.4 Trading, clearing and related 117.5 - - 117.5 Information services 76.3 - - 76.3 Technology services and other 8.3 - - 8.3
Total revenue 282.4 23.1 - 305.5
Expenses: Compensation and benefits 64.7 0.1 - 64.8 Information and trading systems 26.1 1.7 - 27.8 General and administration 36.2 - - 36.2 Depreciation and amortization 16.4 (1.7) - 14.7
Total operating expenses 143.4 0.1 - 143.5
Income from operations 139.0 23.0 - 162.0 Share of net income of equity accounted investee 0.6 - - 0.6 Finance income (costs): Finance income 2.6 - - 2.6 Finance costs (2.5) - - (2.5) Net mark to market on interest rate swaps (0.3) - - (0.3)
Income before income taxes 139.4 23.0 - 162.4 Income tax expense 43.5 4.4 - 47.9 Non-controlling interests (0.8) - 0.8 -
Net income $ 96.7 $ 18.6 $ (0.8) $ 114.5
Attributable to: Equity holders of the Company $ 96.7 $ 18.8 $ - $ 115.5 Non-controlling interests - (0.2) (0.8) (1.0) Earnings per share: Basic $ 1.30 $ 1.55 Diluted $ 1.30 $ 1.55
Future Changes in Accounting Policies
A number of new standards, and amendments to standards and interpretations, are not yet effective for the year ended December 31, 2011, and have not been applied in preparing our financial statements. In particular, the following new and amended standards and interpretations
39
are required to be implemented for financial years beginning on or after January 1, 2013, unless otherwise noted:
• IFRS 9, Financial instruments
• IFRS 10, Consolidated financial statements
• IFRS 11, Joint arrangements
• IFRS 12, Disclosure of interests in other entities
• IFRS 13, Fair value measurement
• IAS 27, Separate financial statements
• IAS 28, Investments in associates and joint ventures
• IAS 1, Presentation of financial statements: Presentation of items of other comprehensive income – Amendments requiring the grouping of items within other comprehensive income (effective for annual periods beginning on or after July 1, 2012)
• IFRS 7, Financial instruments – disclosure - Amendments regarding transfers of financial assets (effective for annual periods beginning on or after July 1, 2011)
• IAS 12, Income taxes - Amendments regarding deferred income tax - Recovery of underlying assets (effective for annual periods beginning on or after January 1, 2012)
• IAS 19, Employee benefits – Amendments regarding the recognition of gains and losses, the presentation of changes in assets and liabilities, and enhanced disclosure requirements
We are reviewing these new standards and amendments to determine the potential impact on our financial statements.
Caution Regarding Forward-Looking Information
This Management’s discussion and analysis (MD&A) of TMX Group contains “forward-looking information” (as defined in applicable Canadian securities legislation) that is based on expectations, assumptions, estimates, projections and other factors that management believes to be relevant as of the date of this MD&A. Often, but not always, such forward-looking information can be identified by the use of forward-looking words such as “plans”, “expects”, “is expected”, “budget”, “scheduled”, “targeted”, “estimates”, “forecasts”, “intends”, “anticipates”, “believes”, or variations or the negatives of such words and phrases or statements that certain actions, events or results “may”, “could”, “would”, “might” or “will” be taken, occur or be achieved or not be taken, occur or be achieved. Forward-looking information, by its nature, requires us to make assumptions and is subject to significant risks and uncertainties which may give rise to the possibility that our expectations or conclusions will not prove to be accurate and that our assumptions may not be correct.
Examples of such forward-looking information in this MD&A include, but are not limited to, factors relating to stock, derivatives and energy exchanges and clearing houses and the
40
business, strategic goals and priorities, market condition, pricing, proposed technology and other initiatives, financial condition, operations and prospects of TMX Group, which are subject to significant risks and uncertainties. These risks include: competition from other exchanges or marketplaces, including alternative trading systems and new technologies, on a national and international basis; dependence on the economy of Canada; adverse effects on our results caused by global economic uncertainties; failure to retain and attract qualified personnel; geopolitical and other factors which could cause business interruption; dependence on information technology; vulnerability of our networks and third party service providers to security risks; failure to implement our strategies; regulatory constraints; risks of litigation; dependence on adequate numbers of customers; failure to develop or gain acceptance of new products; currency risk; adverse effect of new business activities; not being able to meet cash requirements because of our holding company structure and restrictions on paying dividends; dependence and restrictions imposed by licenses and other arrangements; dependence of trading operations on a small number of clients; new technologies making it easier to disseminate our information; risks associated with our clearing operations; challenges related to international expansion; restrictions on ownership of TMX Group shares; inability to protect our intellectual property; dependence on third party suppliers; adverse effect of a systemic market event on our derivatives business; risks associated with the credit of customers; cost structures being largely fixed; risks associated with integrating the operations, systems, and personnel of new acquisitions; and dependence on market activity that cannot be controlled.
The forward looking information contained in this MD&A is presented for the purpose of assisting readers of this document in understanding our financial condition and results of operations and our strategies, priorities and objectives and may not be appropriate for other purposes. Actual results, events, performances, achievements and developments are likely to differ, and may differ materially, from those expressed or implied by the forward-looking information contained in this MD&A.
Such forward-looking information is based on a number of assumptions which may prove to be incorrect, including, but not limited to, assumptions in connection with the ability of TMX Group to successfully compete against global and regional marketplaces; business and economic conditions generally; exchange rates (including estimates of the U.S. dollar - Canadian dollar exchange rate), the level of trading and activity on markets, and particularly the level of trading in TMX Group’s key products, business development and marketing and sales activity; the continued availability of financing on appropriate terms for future projects; productivity at TMX Group, as well as that of TMX Group’s competitors; market competition; research & development activities; the successful introduction and client acceptance of new products; successful introduction of various technology assets and capabilities; the impact on TMX Group and its customers of various regulations; TMX Group’s ongoing relations with its employees; and the extent of any labour, equipment or other disruptions at any of its operations of any significance other than any planned maintenance or similar shutdowns.
While we anticipate that subsequent events and developments may cause our views to change, we have no intention to update this forward-looking information, except as required by applicable securities law. This forward-looking information should not be relied upon as representing our views as of any date subsequent to the date of this MD&A. We have attempted to identify important factors that could cause actual actions, events or results to differ materially from those current expectations described in forward-looking information. However, there may be other factors that cause actions, events or results not to be as anticipated, estimated or intended and that could cause actual actions, events or results to differ materially from current expectations. There can be no assurance that forward-looking information will

41
prove to be accurate, as actual results and future events could differ materially from those anticipated in such statements. Accordingly, readers should not place undue reliance on forward-looking information. These factors are not intended to represent a complete list of the factors that could affect us. A description of the above-mentioned items is contained in our 2010 Annual MD&A under the heading Risks and Uncertainties.