Embed Size (px)
Citation preview
In Press - Academy of Management Journal
TMT COORDINATION NEEDS AND THE CEO PAY GAP:
A COMPETITIVE TEST OF ECONOMIC AND BEHAVIORAL VIEWS
Andrew D. Henderson
Department of Management CBA 4.202
University of Texas at Austin Austin, TX 78712
Phone: (512) 471-5276
and
James W. Fredrickson
Department of Management CBA 4.202
University of Texas at Austin Austin, TX 78712
Phone: (512) 471-5694
March 3, 2000
We are indebted to Janet Dukerich, Syd Finkelstein, Don Hambrick, Beta Mannix, Phyllis Siegel,
Ruth Wageman, Jim Westphal, Associate Editor Rita Kosnik, and two anonymous reviewers for their

In Press - Academy of Management Journal
valuable comments and suggestions on earlier drafts of this paper. Rick Johnson was especially
generous in providing archival diversification data.
In Press - Academy of Management Journal
1
TMT COORDINATION NEEDS AND THE CEO PAY GAP: A COMPETITIVE TEST OF ECONOMIC
AND BEHAVIORAL VIEWS
Abstract
Some strategies require senior managers to tightly coordinate their decisions, and this creates
opposing pressures on the CEO pay gap, defined as the difference in pay between a firm's CEO and
other TMT members. While smaller gaps promote collaborative behavior, larger ones create
tournament-like incentives that address monitoring problems associated with joint decisions. Therefore,
a behavioral view predicts that higher coordination needs will encourage smaller pay gaps, and the
combination of smaller gaps and greater coordination needs will enhance firm performance. An
economic view, particularly tournament theory, predicts the opposite. A competitive empirical test
found that: (1) tournament theory better predicted the size of CEO pay gaps; (2) there was a balance
between the two views as predictors of firm performance – some results supported tournament theory,
while an equal number supported the behavioral view; and (3) there were several paradoxes between
pay and performance. For instance, pay gaps increased with capital investment, but the interaction of
higher investment and larger gaps yielded lower performance. Overall, a mix of economic and
behavioral ideas was required to fully explain the results.

In Press - Academy of Management Journal
2
Managers are usually paid more than their subordinates, even those who are outstanding
managers themselves. Mid-level managers, for instance, are paid more than front-line supervisors, and
CEOs are paid more than other senior executives. Behavioralists and economists have radically
different views of such across-rank pay gaps, particularly when coordinated decision making is
required. Behavioralists contend that large pay gaps undermine coordination by creating feelings of
relative deprivation among subordinates (Cowherd & Levine, 1992; Martin, 1981), and by establishing
strong temptations for subordinates to sabotage their coworkers to win promotion (Dye, 1984; Milgrom
& Roberts, 1988). In contrast, economists focus on problems with shirking and free-riding that arise
when joint work efforts make it hard to distinguish individuals’ marginal contributions. They contend
that when substantial coordination is required, large pay gaps are beneficial because they provide
strong, tournament-like incentives that retain their potency even though monitoring individual efforts is
impractical (Lazear & Rosen, 1981; Rosen, 1986).
This study addresses these conflicting ideas about across-rank pay gaps. First, it identifies
specific conflicts between the economic views embodied in tournament theory and the behavioral views
embodied in theories of relative deprivation, organizational politics, and allocation preferences. Second,
it develops several pairs of rival hypotheses that put those theories to a stringent competitive test. Other
studies have discussed general tensions between economic and behavioral views (e.g., Bok, 1993;
Main, O’Reilly, & Wade, 1993; Siegel, 1996), but none has rigorously tested them head-to-head. To
do so, we believe that it is critical to assess multiple pairs of rival hypotheses to determine if (1) a clear,
consistent winner emerges; (2) opposing influences consistently cancel one another; or (3) the
competing views are potential complements because some empirical evidence supports one view, while
different evidence supports the other.
This study is able to distinguish between these three possibilities, while earlier ones have not.
Doing so proved to be important because our tests revealed a set of contrasting and sometimes
paradoxical results that neither an economic nor behavioral view, by itself, could fully explain. Instead, a
complementary mix was required, a finding important to future theory building.
In Press - Academy of Management Journal
3
THEORY DEVELOPMENT
Many studies have examined the pay of individual executives (e.g., Finkelstein & Hambrick,
1989; Gomez-Mejia, Tosi, & Hinkin, 1987; Murphy, 1985; Westphal & Zajac, 1994), but there has
been very little research on the pay of top management teams (TMTs), or differences in pay within them
(Siegel, 1996; Siegel & Hambrick, 1996).
This study examines the CEO pay gap, defined as the difference between a CEO's compensation
and the average pay of other top management team members. Other aspects of pay inequality (Allison,
1978) or TMT pay dispersion (Siegel, 1996) might be considered; however, studying the CEO pay gap
is important because it allows a competitive test of tournament theory (Lazear & Rosen, 1981; Rosen,
1986) and behavioral theories about relative deprivation (Cowherd & Levine, 1992; Martin, 1981),
organizational politics (Dye, 1984; Milgrom & Roberts, 1988), and allocation preferences (Leventhal,
1976; Leventhal, et al., 1980). This test is noteworthy because it addresses tensions between economic
perspectives that emphasize competition as a means to elicit effort from agents (e.g., Fama, 1980;
Gibbons & Murphy, 1990; Williamson, 1975), and behavioral perspectives that emphasize the role of
cooperation (e.g., Barnard, 1938; Bartlett & Ghoshal, 1993; Ghoshal & Moran, 1996).
To construct this test, we consider coordination needs, which exist when top executives must
jointly process information to resolve interdependencies among different parts of the firm (cf. Galbraith,
1973; Hambrick & Siegel, 1998; Thompson, 1967). For example, coordination needs are typically
higher in larger firms because their subunits are more numerous, specialized, and differentiated than in
smaller organizations (Blau & Schoenherr, 1971; Haveman, 1993). As firms become larger, they
become more difficult to manage, and teams of top managers play a more important role in coordinating
their activities (Chandler, 1962). The following subsections develop competing views about
coordination needs and CEO pay gaps.
A Behavioral View of the CEO Pay Gap
A behavioral perspective suggests that across-rank pay gaps are a critical part of a firm’s social-
psychological and socio-political context and have a profound effect on whether people selfishly pursue
their own interests or cooperatively contribute to broader organizational goals. One component of this
perspective is relative deprivation theory (Cowherd & Levine, 1992; Martin, 1981, 1982), which is

In Press - Academy of Management Journal
4
part of the extensive literature on distributive justice (Greenberg, 1987). Deprivation theory argues that
individuals compare their pay to that of people at higher organizational ranks. If lower-level workers
perceive that they have received less than they deserve, they feel deprived, which leads to adverse
reactions such as absenteeism or strikes. In addition, cooperation suffers because employees become
less committed to organizational goals, and their cohesiveness declines (Cowherd & Levine, 1993;
Deutsch, 1985).
Relative deprivation is particularly germane to the CEO pay gap for two reasons. First, it
involves upwards comparisons between lower-level employees and their superiors. For instance,
secretaries, hourly workers, and lower-level managers have been found to experience relative
deprivation because of pay differences between themselves and senior managers (Cowherd & Levine,
1992; Martin, 1981). Thus, deprivation is an across-rank phenomenon that speaks to differences
between CEOs and other members of the TMT (Siegel, 1996).
Second, deprivation involves comparisons of outcomes with little regard for differences in inputs,
such as effort, ability, or skills (Martin, 1981). Employees often downplay input differences because of
a strong, society-wide preference for equal outcomes (Jasso & Rossi, 1977), and because people
overestimate their abilities and contributions relative to others (Cook & Yamagishi, 1983; Meyer,
1975). In addition, pay differentials are readily observed, while input differences are hard to measure,
so employees tend to judge what they receive, not what they contribute (Pfeffer & Langton, 1993). As
a result, large pay differences, even those driven by real differences in productivity, are often major
sources of dissatisfaction (Bloom, 1999; Cowherd & Levine, 1992; Martin, 1982; Pfeffer & Langton,
1993). Deprivation theory therefore suggests that large CEO pay gaps will be perceived as unjust even
if CEOs routinely contribute more than other TMT members.
The political economy literature reaches similar conclusions regarding cooperative behavior and
large pay gaps. A politically informed view recognizes that employees face choices about: (a) their overall
level of effort, (b) the split of their overall effort between self-serving and cooperative ends, and (c) their
emphasis on politics, particularly efforts to make themselves look good and their peers look bad (Dye,
1984; Milgrom & Roberts, 1988; Lazear, 1989). The size of pay gaps across hierarchical ranks is critical
because it influences each of those choices. Large pay gaps increase overall effort by subordinates

In Press - Academy of Management Journal
5
(choice a), but do so by promoting self-serving efforts at the expense of cooperative ones (choice b), and
also increase the likelihood of political sabotage (choice c). Among executives, sabotage includes
withholding vital information from peers, attempting to damage the reputation of one’s rivals, engaging in
covert influence attempts with superiors, and polishing one’s own reputation rather than paying attention to
substantive operating issues (Dye, 1984; Eisenhardt & Bourgeois, 1988; Finkelstein & Hambrick, 1988;
Milgrom & Roberts, 1988).
Political economy theory concludes that when teamwork is vital, the hazards of sabotage and
decreased cooperation overwhelm the benefits of greater, but more self-serving efforts. This indicates
that firms requiring substantial cooperation should make across-rank pay differences relatively small,
smaller even than differences in marginal contributions would warrant (Milgrom & Roberts, 1988;
Lazear, 1989). Such pay compression is particularly important at the highest ranks because promotion
contests favor individuals who are both politically adept and likely to engage in sabotage (Lazear,
1989). Consequently, this literature suggests that smaller CEO pay gaps will be more efficient in firms
with substantial coordination needs.
Few empirical studies have tested ideas about relative deprivation or political sabotage among top
executives, and those that have offer conflicting results. Main et al. (1993) found that TMT pay
dispersion had a positive relationship with profitability, regardless of executive team interdependence,
which contradicts political economy arguments. In contrast, Hambrick and Siegel (1998) found that
smaller interrank pay gaps were associated with higher stock returns in industries where executive
collaboration was important. These limited and conflicting results suggest that further study of top
executives is needed.
It is important to note that relative deprivation and political economy theories are reactive
(Greenberg, 1987) since they focus on individuals’ responses to pay gaps. In comparison, other
behavioral theories are proactive because they describe how pay is set. In particular, allocation
preference theory (Freedman & Montanari, 1980; Greenberg, 1987; Leventhal, 1976; Leventhal, et al.,
1980) contends that pay is set with an eye towards avoiding dissatisfaction among recipients. As
Leventhal (1976: 108) states, such dissatisfaction “may have serious negative consequences for the

In Press - Academy of Management Journal
6
allocator. He may be subjected to criticism and pressure from dissatisfied individuals … Such criticism is
inherently unpleasant and may also pose a threat to the allocator’s authority and status”.
Allocation preference theory concludes that compensation decisions are not made in a vacuum, but
instead, involve reciprocal relationships between those who set pay and those who receive it. Empirical
work on non-executives has identified several conditions where pay will be distributed relatively equally,
even when there are substantial differences in individual performance. These include: (1) when it is
important to maintain social harmony; (2) when it is difficult to assess individuals’ marginal contributions;
(3) when competition among group members is likely to result in the sabotage of interdependent work
efforts; and (4) when cooperation is vital (Lawler, 1971; Leventhal, 1976; Leventhal, et al., 1980;
Steiner, 1972). In turn, each of these conditions is likely to exist in firms with substantial coordination
needs.
To summarize, the behavioral view, which encompasses ideas about relative deprivation,
organizational politics, and allocation preferences, indicates that smaller pay gaps will promote
cooperation and lower the chances that executives will either sabotage their rivals or undermine the
authority of pay setters. Therefore, this view predicts that in firms with greater coordination needs,
CEO pay gaps will be smaller, and the combination of higher coordination needs and smaller gaps will
enhance firm performance. As detailed later, such combinations, which involve a fit between gap size
and coordination needs, may involve either mediated or moderated relationships (cf. Prescott, 1986;
Venkatraman, 1989). The following section shows that an economic view draws opposing conclusions.
An Economic View of the CEO Pay Gap
Economists point to competition for pay and promotion as a means to elicit strong efforts from
agents who are otherwise prone to shirking and free-riding (Gibbons & Murphy, 1990; Jensen &
Meckling, 1976). In particular, tournament theory (Green & Stokey, 1983; Lazear & Rosen, 1981;
Rosen, 1986), which is based on a game-theoretic view of principal-agent relations, speaks directly to
the size of CEO pay gaps. That theory was developed to explain the very large pay gaps typically
observed between CEOs and the executives directly below them. As Lazear and Rosen (1981: 847)
state: "On the day that a given individual is promoted from vice-president to president, his salary may
triple. It is difficult to argue that his skills have tripled in that one-day period". Standard economic

In Press - Academy of Management Journal
7
theory, where pay is linked to marginal product, cannot explain such outcomes, but they are explainable
if agents are viewed as contestants competing for promotion in a sequential elimination tournament with
a very large, winner-take-all prize.
Tournament theory asserts that when monitoring is reliable and inexpensive, optimal effort is
obtained by paying agents on the basis of their marginal products. Promotion choices are also
straightforward because principals can simply compare contestants’ marginal contributions. However,
monitoring difficulties vary across firms (Jensen & Meckling, 1976), and as oversight becomes more
costly and unreliable, three problems arise: (1) agents have stronger incentives to shirk, (2) paying agents
on the basis of their marginal product is less feasible, and (3) identifying the best candidates for
promotion is increasingly difficult. These problems give principals incentives to implement tournaments
where: (a) pay is successively higher at each rank; (b) the size of pay gaps between successive ranks
increases with hierarchical level; and (c) the pay gap between the CEO and the next highest-ranking
executive is particularly large. Each of these pay characteristics is expected to become more
pronounced as monitoring becomes harder.
Under such conditions, tournaments have three potential advantages over contracts that pay for
marginal product. First, pay is based on the ordinal ranking of agents’ contributions. Ranking is simpler
than precisely measuring marginal products, so monitoring costs are lower. Second, large prizes are
inherently motivating (Ehrenberg & Bognanno, 1990; Becker & Huselid, 1992), which gives lower-level
contestants strong incentives to be ranked highly so that they can eventually compete for the very large
rewards at the top of the firm. This discourages shirking, so principal agent interests tend to self-align in
tournaments, and there is little need for the costly supervision needed to enforce a marginal-product
contract. Third, agents who have been successful in prior promotion contests have incentives to
continue striving rather than resting on their laurels. This occurs because the size of interrank pay gaps
increases with hierarchical level, and the gap between the CEO and the next-highest rank is the largest
of all (Rosen, 1986).
Empirical research on executives supports some of these ideas. Lambert et al. (1993) found that
interrank pay gaps were successively larger at higher managerial ranks, and the pay gap between the
CEO and the next-highest executive was particularly large. Main et al. (1993) and O’Reilly et al.

In Press - Academy of Management Journal
8
(1988) observed that the chances of a winning a tournament decrease with the number of competitors.
This suggests that to maintain strong incentives, CEO pay gaps will increase with the number of vice
presidents (VPs) competing for the top job. Main and colleagues found support for this, however,
O’Reilly and colleagues found a negative relationship, which contradicts tournament theory. These
studies indicate that CEOs are paid a good deal more than other executives, yet such differences may
exist simply because the most able are promoted and their influence increases with hierarchical rank, an
outcome consistent with marginal-product contracting. So it is important to establish not only that large
pay gaps exist (cf. Lambert et al., 1993), but also that gap size varies with tournament conditions, such
as the number of competitors (Main et al., 1993; O’Reilly et al., 1988). Limited and conflicting
evidence on that matter indicates that further study is needed.
On the whole, tournament theory holds that as monitoring difficulties increase, larger CEO pay
gaps reduce the need for costly supervision and provide strong incentives that better align principal-
agent interests. Monitoring is particularly difficult when there is joint production and task
interdependence (Eisenhardt, 1989; Jones & Hill, 1988; Konrad & Pfeffer, 1990), such as when TMT
members must collectively resolve interdependencies among different parts of the firm. So this theory
predicts that CEO pay gaps will be larger in firms with greater coordination needs, and the combination
of higher needs and larger gaps will enhance firm performance.
Hypothesis Development
As seen here, behavioral and economic theories reach conflicting conclusions about CEO pay
gaps. This makes it possible, to quote Popper (1959: 108), to “choose the theory which best holds its
own in competition with other theories; the one which, by natural selection, proves itself the fittest to
survive.” But to do so effectively, we believe, it is critical to develop and test several pairs of competing
hypotheses. As Sutton and Staw (1995: 377) state, “theory stems from a single or small set of research
ideas” that produce an extensive “set of interrelated propositions and hypotheses”. Similarly, Kaplan
(1968: 298) describes how a social science theory involves a “network of relations so as to constitute an
identifiable configuration or pattern.” Since theories involve webs of interconnections, any single test is
insufficient to support one theory over another. Instead, strong competitive tests require multiple trials.
In Press - Academy of Management Journal
9
To accomplish this, we consider how a firm’s diversification strategy, technology, and structure
contribute to coordination needs within its TMT. Other factors like environmental volatility may also
affect those needs, but they are beyond the scope of this study. The following subsections develop
competing hypotheses about coordination needs and the size of CEO pay gaps, and how combinations
of those factors affect firm performance.
Diversification and gap size. Two aspects of diversification strategy are likely to affect
coordination needs: (1) the relatedness of a firm’s businesses; and (2) the number of businesses (i.e.,
product-market areas) that it pursues (Chandler, 1962; Galbraith, 1973). Related diversification
requires top executives to take an active role in resolving reciprocal interdependencies, coordinating
resource exchanges, and leveraging core competencies across business areas (Michel & Hambrick,
1992; Prahalad & Bettis, 1986; Rumelt, 1974). So as relatedness increases, greater demands for
coordinated information processing are placed upon the TMT (Hill & Hoskisson, 1987; Jones & Hill,
1988).
Similarly, the number of businesses that a firm pursues affects coordination needs. In related
diversifiers, larger numbers of businesses increase the operational interdependencies that the TMT must
address (Chandler, 1962; Jones & Hill, 1988; Michel & Hambrick, 1992). In unrelated diversifiers,
larger numbers of businesses add to the amount of information that top executives must consider to
make informed decisions about investment flows in those firms’ internal capital markets (Henderson &
Fredrickson, 1996; Hill & Hoskisson, 1987; Jones & Hill, 1988). Since a single executive can critically
evaluate only a limited number of investments (Bower, 1970: 35), monitoring and allocating investments
among numerous businesses becomes a team effort1.
As noted earlier, behavioral theory concludes that pay will be allocated more equally when
coordination needs are greater, while tournament theory indicates that larger pay gaps will be used to
resolve the monitoring difficulties associated with joint work efforts. Applied to the aspects of
diversification strategy considered here, this suggests two pairs of competing hypotheses:
1 Related and unrelated diversification can be considered as separate constructs, both conceptually (Jones & Hill, 1988) and empirically (Palepu, 1985). Here, we expect that once the total number of businesses is accounted for, unrelated diversification will contribute relatively little to coordination needs (Hill & Hoskisson, 1987; Jones & Hill, 1988), so our analyses control for unrelatedness, but it is not a focus of our hypotheses.

In Press - Academy of Management Journal
10
H1(behavioral): There will be a negative relationship between the relatedness of a firm’s businesses and the size of the CEO pay gap.
H1(tournament): There will be a positive relationship between the relatedness of a firm’s businesses and the size of the CEO pay gap.
H2(behavioral): There will be a negative relationship between number of businesses and the size of the CEO pay gap.
H2(tournament): There will be a positive relationship between number of businesses and the size of the CEO pay gap.
Technology and gap size. Technology is another source of coordination needs. Here we
consider both R&D spending and capital investment activity, which represent critical long-term
commitments. The strategic implications of such investments bring them squarely within the purview of
top management (Bantel & Jackson, 1989; Bower, 1970; Prahalad & Bettis, 1986).
As either capital investment or R&D activity increases, some combination of the following occurs:
(1) the number of investment projects grows; or (2) the size and complexity of the average project
increases. As noted above, a single executive can critically evaluate only a limited number of projects, so
evaluating numerous activities becomes a team effort, particularly because there are often multiple and
conflicting demands for capital, personnel, and top management attention across technology proposals
(Bower, 1970; Hayes & Abernathy, 1980). Conversely, very complex projects often exceed the
cognitive grasp of any single executive (Thompson, 1967), so multiple executives are required for
thorough evaluation.
The long, multi-year lags between technology expenditures and potential future revenues further
complicate such decisions. To make informed choices across competing projects, executives need a
deep understanding of technological and competitive risks, the capabilities of different project teams, and
emerging contingencies that may demand large-scale redirections of resources across projects (Brown &
Eisenhardt, 1997; Wheelwright & Clark, 1992). Objective financial controls based on past performance
provide little guidance about these future-oriented decisions (Hayes & Abernathy, 1980), so instead,
strategic control processes and detailed understanding are vital (Baysinger & Hoskisson, 1990). Again,
such complex decisions create substantial coordination needs that demand team efforts. A behavioral
view concludes that smaller pay gaps enhance such coordination, while tournament theory concludes that
larger gaps better address the monitoring difficulties that arise with such joint decision making:
In Press - Academy of Management Journal
11
H3(behavioral): There will be a negative relationship between R&D activity and the size of the CEO pay gap.
H3(tournament): There will be a positive relationship between R&D activity and the size of the CEO pay gap.
H4(behavioral): There will be a negative relationship between capital investment activity and the size of the CEO pay gap.
H4(tournament): There will be a positive relationship between capital investment activity and the size of the CEO pay gap.
Structure and gap size. We also consider two structural factors that are likely to influence
coordination needs: firm size and the number of vice presidents. Larger firms are more structurally
complex than smaller ones, and have subunits that are more specialized and differentiated (Blau &
Schoenherr, 1971; Haveman, 1993). So as firms become larger, they become more difficult to
manage, and TMTs play a more important role in coordinating their activities (Chandler, 1962).
Similarly, coordination needs will be greater in firms with more vice presidents. Employing more VPs
has definite costs, both monetary (salary, staff, etc.), and procedural, because larger groups are more
difficult to integrate (Gooding & Wagner, 1985; Levine & Moreland, 1990). Despite this, some firms
employ numerous VPs because they expect to better coordinate their business activities (Chandler,
1962; Galbraith, 1973; Lawrence & Lorsch, 1967). Once again, such coordination needs create
opposing pressures on the CEO pay gap, which suggests two pairs of competing hypotheses:
H5(behavioral): There will be a negative relationship between firm size and the size of the CEO pay gap.
H5(tournament): There will be a positive relationship between firm size and the size of CEO pay gap.
H6(behavioral): There will be a negative relationship between the number of VPs and the size of the CEO pay gap.
H6(tournament): There will be a positive relationship between the number of VPs and the size of CEO pay gap.
Performance implications. What are the effects of coordination needs and gap size on firm
performance? The behavioral perspective suggests two related possibilities. One is that larger gaps are
universally detrimental to performance because relative deprivation and political sabotage decreases
cooperation and organizational commitment. Cowherd and Levine (1992), for instance, found that
product quality was lower when pay gaps between executives and lower-level workers were larger, and

In Press - Academy of Management Journal
12
Bloom (1999) found that the performance of professional baseball teams was lower when players’ pay
was more dispersed. Combined with the earlier hypotheses, which predict that coordination needs affect
gap size, this suggests a mediated relationship: Coordination needs → CEO pay gaps → Firm
performance. If so, gaps will have a direct and negative effect on performance, one that mediates the
effects of coordination needs:
H7(mediated- There will be a negative relationship between the size of CEO pay gaps behavioral): and firm performance, one that mediates the effects of coordination needs.
A related possibility involves moderation. Pfeffer and Langton (1993) found that social
interaction moderated the relationship between faculty pay dispersion and productivity, and Hill, Hitt,
and Hoskisson (1992) found that diversification strategy moderated the relationship between executive
pay and profitability. These studies and others (e.g., Gomez-Mejia, 1992) suggest that a firm’s strategy
and structure interact with pay to affect performance. Given this, one could argue that some firms are
particularly reliant on TMT coordination, including those that are larger, more diverse, or pursuing
corporate-level economies through their technologies or TMT structure (Chandler, 1962; Jones & Hill,
1988). Larger gaps may be particularly harmful in such firms because greater needs for coordinated
decision making conflict with greater incidences of relative deprivation and political sabotage. Such
firms would pay the costs of pursuing strategic integration (e.g., more R&D investment, more capital
investment, more executive time and compensation), but realize few benefits. If so, the interaction of
coordination needs and CEO pay gaps will be negatively related to performance.
H7(moderated- The interaction of larger CEO pay gaps and greater coordination needs behavioral) will have a negative relationship with firm performance.
Tournament theory offers contrasting ideas. One is that larger pay gaps lead to higher
performance, regardless of coordination needs, because they elicit stronger individual effort. For
instance, empirical studies show that firm performance is higher when TMT pay is more dispersed
(Main et al., 1993), and professional athletes perform better when there are larger prize gaps between
first and second place (Becker & Huselid, 1992; Ehrenberg & Bognanno, 1990). Again, combined
with the earlier hypotheses about coordination needs and gap size, this suggests a chain (coordination
needs → gap size → performance), in which gap size has a direct and positive effect on performance
that mediates the impact of coordination needs:

In Press - Academy of Management Journal
13
H7(mediated- There will be a positive relationship between the size of the CEO pay gaps tournament): and firm performance that will mediate the effects of coordination needs.
A second tournament-based idea involves moderation. Consider that even though tournaments
can overcome problems with shirking that arise when principals cannot accurately assess agents’
marginal contributions, tournaments actually impose cost penalties when monitoring is simple relative to
contracts that pay for individual productivity (Green & Stokey, 1983; Lazear & Rosen, 1981).
Penalties include: (a) the CEO is paid much more than his or her marginal product; and (b) lower-
ranking executives, to fund the CEO’s prize, are paid much less than what they produce, which is
extremely demotivating when employees can easily compute their marginal contributions (Lazear &
Rosen, 1981). If so, then large gaps are potential replacements for tight monitoring, but their efficiency
is contingent upon high needs for coordination. This suggests a moderated relationship:
H7(moderated- The interaction of larger CEO pay gaps and greater coordination needs tournament) will have a positive relationship with firm performance.
In conclusion, a firm’s diversification strategy, technology, and structure each affect the need for
coordinated decision making within its TMT. In turn, behavioral and economic views offer conflicting
predictions about (a) the relationship between those needs and the size of CEO pay gaps, and (b)
relationships between coordination needs, gap size, and firm performance. Moreover, within both the
tournament and behavioral views, there are contrasting ideas about mediated and moderated
performance effects.
RESEARCH METHOD
Sample
To test these ideas, data were collected on the top executives and firms in four industry groups --
chemicals, high-tech equipment, natural resources, and conglomerates. As reported later, these groups
yielded a sample with considerable variation on the independent and dependent variables, which
increases our confidence that the results will generalize.
The chemicals group was composed of the chemical manufacturers listed in Fortune's annual
survey of industrial corporations. The high-tech equipment group combined firms in Fortune's office
equipment and computer category with the firms in its scientific and photographic equipment sector.
The natural resources group combined firms in Fortune's petroleum refining category with those listed

In Press - Academy of Management Journal
14
under mining and crude oil production. Conglomerates were studied to insure broad variation in
measures of relatedness and number of businesses. Fortune does not identify such firms, so we used
the Business Week and Forbes annual surveys to construct that group (Henderson & Fredrickson,
1996). To control for differences across industry groups, we employed dummy variables where
conglomerates were the omitted category.
Data were collected for the years 1985 and 1990, which produced a sample of 189 firm-years
(chemicals = 43 observations; high-tech equipment = 54; natural resources = 55; conglomerates = 37).
Some firms moved in and out of the listings across years, so the sample included 26 firms that appeared
in 1985 only, 43 in 1990 only, and 60 that appeared in both years. Thus, the total sample size was 26
+ 43 + (2 x 60) = 189. As reported later, steps were taken to verify that the results were unaffected by
the repeated observations. To control for inflation and any other time-related differences, the year was
coded as a dummy variable (1985 = 0; 1990 = 1). Observing two years that were relatively far apart
helps us to rule out idiosyncratic period effects, which enhances generalizability.
Measures
Dependent variables. Hypotheses 1 through 6 involve CEO pay gaps, which were assessed
using cash, long-term, and total compensation. Data on pay were collected from proxy statements.
Here, cash compensation includes all remuneration in the form of salary and bonus. Long-term
compensation equals the value of stock options, performance unit or share plans, restricted stock,
phantom stock, and long-term management incentive plans. Total compensation is the sum of cash
and long-term pay.
As defined earlier, the CEO pay gap equals the difference in pay between a firm's chief executive
and the average pay of its other TMT members. In their proxy statements, public firms are required to
disclose the compensation of their CEO and the four other highest-paid executives. The pay of other
managers is seldom listed. Given this, TMTs were operationally defined to include the CEO and the four
other highest-paid managers, an approach used by Main et al. (1993). In turn, CEO pay gaps for cash,
long-term, and total pay were defined as the natural log of the quantity equal to the CEO's pay minus the
average pay of the four non-CEOs listed in a firm’s proxy. Natural logs were used to reduce
heteroscedasticity in our regression models.

In Press - Academy of Management Journal
15
Note three things about these measures. First, this approach may either omit TMT members or
include persons that are not part of the top group, however, this should not create serious problems. The
sampled firms were quite large (average annual sales = $8.59 billion), so most TMTs probably had more
than five people. Also, the difference in pay between a firm’s CEO and the next highest ranking
executive is typically quite large, while subsequent pay gaps are much smaller, and become smaller still if
more executives are considered (Lambert et al., 1993). Consequently, the TMTs studied here may have
other members, but including their pay would likely have little impact on the calculated size of CEO pay
gaps.
A second thing about these measures is that long-term pay was valued using the procedure
described by Lambert and colleagues (1993), in which stock options are valued at 25 percent of their
exercise price. This produces values in the same range as the Black-Scholes model (Lambert et al.,
1993), but to insure robustness, we followed the advice of those authors and also valued options at 50
percent of their exercise price. Results were unchanged. Grants associated with performance plans
were valued by multiplying the number of performance units, performance shares, or phantom shares by
their respective target values (when stated prospectively) or by the actual payout per unit (if stated
retrospectively). Restricted stock was valued by multiplying the number of shares by the share price on
the date of the grant.
The amount of pay ultimately received under a long-term plan is uncertain at the time that it is
awarded, and there is little consensus among researchers about how to value such grants (see Lambert
et al., 1993 for discussion). For example, the ultimate proceeds from stock options are dependent on
the future performance of the stock, whether an executive remains with the firm, and the executive's risk
preferences. So as in any study of long-term pay, our results reflect the assumptions used to value it.
The third feature of the cash, long-term, and total pay gaps is that they are difference scores.
Authors such as Cronbach and Furby (1970) have argued that such scores should not be used as
dependent variables, however, Allison (1990) demonstrates that those concerns are unfounded. In fact,
difference scores offer the benefit of eliminating specification error associated with unobserved firm-level
factors that might cause the pay of a firm’s CEO and other TMT members to vary in tandem (cf.
Allison, 1990; Kenny & Cohen, 1979).

In Press - Academy of Management Journal
16
Firm performance, the dependent variable in hypothesis 7, was measured by annual return on
assets (ROA), which was obtained from COMPUSTAT. Return on equity (ROE) yielded similar
results. ROA was also used as a control in the analyses of CEO pay gaps since chief executive pay
may vary with firm performance (Finkelstein & Hambrick, 1989; Murphy, 1985). Results of the pay
gap analyses were unchanged when other performance controls (e.g., 3-year average, 2-year average,
and year-to-year change in ROA, ROE, and stock price) were used.
Independent variables. Relatedness was measured using the Jacquemin and Berry (1979)
entropy index: Relatedness = Σ Pi ln (1 / Pi) , where Pi equals the percentage of sales a firm
received from its ith 4-digit SIC segment within its primary 2-digit industry (Davis & Duhaime, 1989;
Hoskisson, Hitt, Johnson, & Moesel, 1993; Palepu, 1985). Segment sales and primary industry
designations were obtained from the COMPUSTAT Business Segment Tapes. Number of businesses
was measured using the count of 4-digit SIC codes listed for a firm in Standard & Poor's Register of
Corporations, Directors and Executives.
R&D activity (annual R&D expenditures divided by sales) and capital investment activity
(annual capital equipment expenditures divided by sales) were obtained from COMPUSTAT. This
measure of capital investment is similar to ones for capital intensity, such as the net value of property,
plant, and equipment divided by number of employees; however, those measures assess accumulations
across time and may be high in a given year only because of decisions made long ago. Coordination
activities associated with old investments may have become routine events handled by lower-level
employees. Since that is not our focus, we consider new capital investment, which involves non-routine
decisions that likely require executive attention.
Firm size was measured as the natural logarithm of employees, data that were obtained from
COMPUSTAT. The number of VPs was assessed by counting the number of corporate officers in
each firm as listed in Standard & Poor's Million Dollar Directory (O’Reilly et al., 1988).
Control variables. Several factors were controlled that might affect either CEO compensation
or firm performance. CEOs’ pay has been linked to their time in office (Finkelstein & Hambrick, 1989;
Hill & Phan, 1991), so CEO tenure, measured in years, was controlled. Also, CEOs who were
outside successors may command higher pay (Frank & Cook: 1995: 70; Hambrick & Finkelstein,
In Press - Academy of Management Journal
17
1995). Thus, the outsider dummy variable was coded using data on company tenure and CEO tenure
obtained from Forbes. CEOs were designated as outsiders if company tenure minus CEO tenure was
less than or equal to one year.
CEOs who share power with others may be paid less because they are unable to dominate the
pay-setting process (Finkelstein, 1992). Using data from proxy statements, the shared power dummy
was coded 1 if any of the following were true: (a) someone other than the CEO chaired the board of
directors; (b) the CEO cochaired the board; or (c) another executive held the title of Chief Operating
Officer. That variable was coded 0 otherwise.
CEO pay gaps may be larger in firms with higher levels of executive pay; for instance, a gap of
$100,000 may be unremarkable when all TMT members earn over $1 million, but noteworthy when all
earn less than $200,000. Thus, the team’s average pay was assessed for cash, long-term, and total
compensation. Those variables equaled the average pay (in $100,000) of the five executives listed in a
firm’s proxy statement, one of whom was the CEO. This also controls for the possibility that gap size
varies because CEO pay has a constant ratio to that of other TMT members and scaling factors differ
across firms. In addition, pay dispersion among non-CEOs may affect whether they collaborate (Pfeffer
& Langton, 1993), so non-CEO dispersion was controlled by calculating the coefficient of variation
(Allison, 1978) for cash, long-term, and total pay among the four highest-paid non-CEOs in each firm.
Finally, unrelated diversification may have a negative effect on firm performance (Bettis, 1981;
Rumelt, 1974), so we used an entropy measure to control for it. Unrelated diversification equaled
Σ Pi ln (1 / Pi), where Pi was the percentage of total sales a firm received from its ith 2-digit SIC
segment (Hoskisson et al., 1993; Palepu, 1985).
RESULTS
Table 1 provides descriptive statistics for all variables. Table 2 breaks out the means and
standard deviations by industry group. Note that the groups were not homogeneous. For example, the
natural resources group had the highest average capital investment, but the standard deviation of that
measure was also the highest among those firms.
------------------------------------------ Insert Tables 1 and 2 about here
------------------------------------------

In Press - Academy of Management Journal
18
Model Specification
The data were analyzed with multiple regression models where the six indicators of coordination
needs (R&D activity, number of businesses, etc.) were treated as separate variables. The independent
variables were not scaled and aggregated because we did not expect that they would covary substantially.
For instance, firms investing heavily in R&D to differentiate their products might either focus on a single
niche or target a number of different businesses (Porter, 1985). Table 1 bears this out: correlations
among the independent variables were modest.
Two supplementary analyses validated this approach. First, we ran a factor analysis on the six
independent variables. This yielded a six-factor solution where each variable loaded heavily on a
completely separate factor (r > .95 in each case), and all other loadings were low (r < .22). Thus,
each of the six factors was essentially identical to a different indicator of coordination needs. Second, we
assessed multicollinearity in the regression models using the matrix decomposition techniques (Judge et al.,
1988: 870) available through the COLLIN option in SAS’s PROC REG. The highest condition index
was 6.04 in the gap size models, and 11.40 in the ROA models, numbers that are far below the maximum
acceptable threshold of 20 (Belsley, Kuh, & Welsch, 1980). This indicates that collinearity did not affect
the hypothesis tests. Overall, these factor and collinearity analyses confirmed that the independent
variables were empirically distinct.
Hypothesis Tests
Pay gap size. Table 3 contains regression models that predict the size of CEO pay gaps for cash,
long-term, and total compensation. Models 1 and 2 examine the cash pay gap, models 3 and 4 the long-
term pay gap, and models 5 and 6 the total pay gap. Controls were entered in models 1, 3, and 5. The
independent variables were added in models 2, 4, and 6. Positive and significant effects for the
independent variables support tournament theory and contradict the behavioral perspective. Negative
relationships do the opposite. Null relationships support neither theory.
------------------------------------------ Insert Table 3 about here
------------------------------------------

In Press - Academy of Management Journal
19
Hypothesis 1 considers the relationship between gap size and the relatedness of a firm’s businesses.
As seen in models 2 and 6 of Table 3, that relationship was not significant for the cash or total pay gaps,
so neither of the competing theories was supported. Model 4 shows a positive and significant relationship
for the long-term pay gap, which supports tournament theory and contradicts the behavioral perspective.
Hypothesis 2 addresses number of businesses. Models 2 and 6 report positive and significant
relationships between that variable and the size of the cash and total pay gaps. Those results support
tournament theory and contradict the behavioral perspective. Model 4 indicates a null relationship for
long-term pay.
Hypothesis 3 involves capital investment activity. Model 2 shows a null result for cash pay. Models
4 and 6 reveal positive and significant relationships for the long-term and total pay gaps, results that
support tournament theory and contradict the behavioral view. Hypothesis 4 concerns R&D activity. Its
effect was not significant in models 2 or 6. In contrast, model 4 indicates a positive and significant
association with the long-term gap, which supports tournament theory.
Hypothesis 5 regards firm size, and as models 2, 4, and 6 show, size had a positive and significant
relationship with all three pay gaps. Those results support tournament theory and contradict the
behavioral perspective. Hypothesis 6 involves the number of VPs. Models 2 and 6 show a negative and
significant association, outcomes that support the behavioral perspective and contradict tournament
theory. That relationship was not significant for long-term pay.
Performance. Hypothesis 7 advanced four competing possibilities: Larger pay gaps might yield
higher performance (economic view) or lower (behavioral view), and each might arise from mediated
relationships (coordination needs → pay gaps → performance) or moderated ones (coordination needs
x pay gaps → performance). Table 4 shows the regression models predicting performance measured
by return on assets. For readability, its coefficients have been multiplied by 100. Model 1 contains the
controls, model 2 adds the indicators of coordination needs, and model 3 further adds pay gaps. Since
the cash and total pay gaps were highly collinear, the total pay gap was dropped. Results were
unchanged when the total pay gap was used instead of cash.

In Press - Academy of Management Journal
20
------------------------------------------ Insert Table 4 about here
------------------------------------------
If pay gaps are a mediator, then (i) coordination needs should have significant effects in model 2,
and (ii) pay gaps should have significant effects in model 3, and (iii) coefficients for coordination needs
that are significant in model 2 should be smaller or non-significant in model 3 (Baron & Kenny, 1986;
Venkatraman, 1989). As model 2 shows, firm size was the only indicator of coordination needs that
was even marginally significant, and an F-test of the ∆R2 between models 1 and 2 (cf. Cohen, 1968;
Greene, 1993: 206) was not significant (p > .11), so it may well be spurious. Also, pay gaps were not
significant in model 3, and the coefficient for size was actually larger and more significant in model 3 than
model 2. Consequently, none of the three criteria for mediation were met. In other analyses not shown
here, we performed several path analyses using the CALIS procedure in SAS to further assess the
Coordination Needs → Pay Gap → Performance model. Those analyses, which are available from the
authors by request, revealed the same relationships between coordination needs and pay gaps reported
in Table 3 and further showed that the pay gap-to-performance relationship was not significant. So
overall, there was no support for either the mediated-economic or mediated-behavioral versions of
hypothesis 7.
Next, we assessed whether pay gaps moderated the relationship between coordination needs and
performance. It should be noted that many studies reveal that cross-sectional relationships between
executive pay and performance are very weak or non-existent (e.g., Gomez-Mejia, Tosi, & Hinkin,
1987; O'Reilly et al., 1988; Henderson & Fredrickson, 1996), particularly for cash pay (Murphy,
1985; Finkelstein & Hambrick, 1989). Therefore, we expected much stronger results when interactions
were formed using long-term rather than cash or total compensation. Analysis confirmed this. No
interactions were significant when pay gaps were measured by total compensation, and interactions of
the cash pay gap with capital investment activity and number of businesses were marginally significant.
However, as shown in model 4 of Table 4, results for the long-term pay gap were considerably
stronger.
Model 4 shows that four of the six interactions were significant, as was an F-test of ∆R2 (p < .03)
that compared it to model 3, which contained main effects only. Diagnostics revealed some collinearity

In Press - Academy of Management Journal
21
in model 4, so the two non-significant interactions were dropped in model 5. Other analyses, not shown
here, revealed that the remaining interactions mediated the marginally significant ones involving cash pay
gaps, so long-term pay gaps were driving the results. Therefore, the following discussion focuses on
model 5, in which interactions of the long-term gap with relatedness, number of businesses, capital
investment, and number of VPs were all significant, and ∆R2 was significant (p < .02) compared to
model 3.
To interpret model 5, we calculated∂ ROA/∂ xi (e.g., Schoonhoven, 1981; Gupta &
Govindarajan, 1984) for xi equal to each of the four indicators of coordination needs in its interactions.
For instance,∂ ROA/∂ relatedness = (−21.576/100) + {(1.554/100) ∗ long-term gap size}. Across
the observed range of gap size, that slope changed from positive, for large gaps, to negative, for small
ones, which signals a non-monotonic relationship (Schoonhoven, 1981). To visualize this, Figure 1
graphs ROA = β1 relatedness + β2 gap size + β3 relatedness ∗ gap size for three different gaps: large =
µ + σ; medium = µ; and small = µ − σ, where µ and σ are the mean and standard deviation of the
long-term pay gap. As seen there, in firms with higher levels of related diversification, larger pay gaps
were associated with higher performance, which supports the moderated-tournament version of H7 and
contradicts the moderated-behavioral version. Though not graphed, the number of VPs x gap size
interaction yielded similar results. In contrast, smaller pay gaps were beneficial in firms with more
businesses or higher capital investment activity, results that support the moderated-behavioral prediction
and contradict the moderated-tournament version. Figure 2 graphs results for number of businesses,
which are also representative of those for capital investment. Overall, this indicates that neither theory
could fully explain performance. Instead, complementary elements of each were required. -------------------------------------------------
Insert Figures 1 and 2 about here -------------------------------------------------
Robustness of Results
To establish robustness, we added other interactions (e.g., relatedness x number of businesses;
gap size x relatedness x number of businesses), and quadratic terms (e.g., number of businesses2) to the
models in Tables 3 and 4. None were significant, and the other results were unchanged. For the
performance analyses, we also assessed interactions between non-CEO pay dispersion and the

In Press - Academy of Management Journal
22
measures of coordination needs. None of those were significant and the other results were unchanged,
so we are confident that CEO pay gaps are driving the reported outcomes, not dispersion among the
rest of the TMT.
The sample contained 60 firms observed in both 1985 and 1990. Repeated observations like this
may create correlated error terms that inflate t-statistics, so we reestimated our models on subsamples
containing only one observation per firm (Davis-Blake & Uzzi, 1993: 213). Each subsample included
all observations from firms sampled in only one year (n = 69), plus exactly one observation, randomly
selected, from each firm that contributed data in both 1985 and 1990 (n = 60). The models in Tables 3
and 4 were reestimated four times using different sets of randomly selected observations. All results
were robust.
DISCUSSION
This study puts tournament and behavioral theories to a competitive test. A behavioral view
concludes that cooperation is more likely and sabotage less when pay gaps between hierarchical ranks
are small (Cowherd & Levine, 1992; Dye, 1984). This suggests that CEO pay gaps will be smaller in
firms with greater coordination needs, and the combination of smaller gaps and higher coordination
needs will yield better performance. In contrast, tournament theory contends that when monitoring is
difficult, larger gaps better elicit strong efforts from agents (Lazear & Rosen, 1981; Rosen, 1986),
which suggests that pay gaps will be larger, and larger gaps will yield higher performance when
coordination needs make monitoring particularly tough.
Table 5 summarizes our findings. Recall that results supporting one theory also contradict the
other. Blank cells indicate null results that support neither view. Overall, the results suggest that the two
theories are complements – portions of each are needed to comprehensively explain these outcomes,
and neither theory, by itself, did a complete job. In addition, Table 5 reveals three important
subpatterns: (1) tournament theory dominated the behavioral perspective in predicting the size of CEO
pay gaps; (2) there was a balance between those theories as predictors of firm performance; and (3)
there were several paradoxes between how executive pay is allocated and the associated levels of
performance. The following discussion explores these subpatterns and further considers why results for
the number of VPs differed from the rest.

In Press - Academy of Management Journal
23
------------------------------------------ Insert Table 5 about here
------------------------------------------
The Three Subpatterns
Gap size. As seen in Table 5, nine test results indicated that pay gaps were significantly larger in
firms with greater coordination needs, results that covered five of the six independent variables.
Consequently, tournament theory better predicted the size of CEO pay gaps than did the behavioral
view. What might explain this? To now, we have said little about who allocates executive pay,
however, both boards of directors and CEOs often have influences that are independent of labor
market forces or efficiency concerns (Finkelstein & Hambrick, 1988; Main et al., 1988). Our results
make it tempting to speculate that large gaps exist because CEOs take advantage of boards in situations
where monitoring is difficult. But if such difficulties provide special freedom to dictate pay, why don’t
such CEOs also boost their colleagues’ pay also? This question is particularly salient given the
arguments of allocation preference theory, which contends that allocators equalize pay when
cooperation is essential.
Here, with an eye toward future theory building, we offer a different explanation involving threats
and opportunities perceived by CEOs and boards in firms with substantial coordination needs. Decision
makers typically perceive threats in situations where they lack control (Dutton & Jackson, 1987),
moreover, they exhibit a threat bias where attention to downside risk crowds out consideration of
upside opportunities (Jackson & Dutton, 1988). As noted earlier, joint work efforts offer opportunities
for collaborative synergy, but they also undermine the ability of CEOs and boards to monitor, and hence
control, other members of the TMT. Consequently, this lack of control may pose a threat that pushes
aside attention to potential collaboration.
If so, CEOs and boards may view tournaments as an attractive way to set pay because they
induce strong effort despite weak monitoring (Becker & Huselid, 1992). The resulting competition may
harm collaboration, but that may be secondary to CEOs and boards who are seeking control. This
conjecture raises several questions. For instance, how important is TMT control to boards and CEOs?
On what dimensions (e.g., effort, conflict) do they most wish to assert control, and what strategic
factors do they believe are the biggest threats to it? Similarly, do they view loafing as a bigger threat

In Press - Academy of Management Journal
24
than sabotage, and if so, what mechanisms, such as consensual decision processes, do they use to
manage the latter? As these questions indicate, threat perceptions may be a critical contingency factor
that swings CEOs and boards away from behavioral considerations towards economic ones where
control is asserted via incentives (cf. Jensen & Meckling, 1976). So when threats arise, most
executives may begin to act like agency theorists regardless of whether it’s effective (cf. Ghoshal &
Moran, 1996). Consequently, future study of perceived threats associated with controlling the TMT
may offer new insights into why an economic view often crowds out the behavioral considerations
needed for cooperation.
Firm performance. A second subpattern in Table 5 is the balance between tournament and
behavioral theories as predictors of firm performance. For relatedness and number of VPs, the
interaction of larger pay gaps and greater coordination needs was associated with higher performance,
which supports tournament theory. Yet for number of businesses and capital investment activity, the
interaction of smaller gaps and greater coordination needs was associated with higher performance,
which supports the behavioral perspective.
What caused these mixed results? Our arguments drew on research suggesting that coordination
needs affect the ability of superiors to monitor subordinates and hold them responsible for bottom-line
performance (Eisenhardt, 1989; Konrad & Pfeffer, 1990). That ability is undoubtedly important, but so
too is the ability of peers to mutually monitor and control one another (Ouchi, 1979). Reflecting on the
mixed results seen here, we now speculate that there are tradeoffs between superior-subordinate and
peer-to-peer monitoring that vary across different sources of coordination needs. In the following
discussion, we cast CEOs and boards in the role of superiors, and TMT members below the CEO in the
roles of subordinates and peers.
In firms with many vice presidents or high levels of relatedness, subordinates may have little
personal accountability to superiors for bottom-line performance, yet behavioral monitoring among
subordinates may be high. For instance, the resource sharing that underpins related diversification
obscures individual contributions (Jones & Hill, 1988), but it also brings lower-level executives into
frequent contact in situations where reciprocity and mutual accommodation are important (Michel &
Hambrick, 1992). Consequently, such executives may have weak incentives to improve the bottom line

In Press - Academy of Management Journal
25
and strong ones to accommodate their peers. Similarly, some firms employ numerous VPs to integrate
their business activities (Chandler, 1962; Galbraith, 1973; Lawrence & Lorsch, 1967), and such
integration both obscures individual contributions and leads to frequent contact among boundary
spanners.
In such firms, large CEO pay gaps may be effective because (a) they represent coveted prizes
that overcome potential problems with shirking and free-riding fostered by low personal accountability,
and (b) they do not create pervasive political sabotage, which is held in check by mutual monitoring
among peers. If so, this would explain why tournament theory better predicted performance in firms
with high levels of relatedness or large numbers of VPs.
In sharp contrast, bottom-line accountability to superiors may be high, and behavioral monitoring
among peers may be low in firms with many businesses or high levels of capital investment. Firms with
numerous businesses have many separate profit centers (Baysinger & Hoskisson, 1990), and similarly,
high capital investment is common in vertically integrated firms (Balakrishnan & Wernerfelt, 1986) that
are divided into multiple upstream and downstream units, each with bottom-line responsibility (Eccles &
White, 1988). In such firms, the profusion of profit centers should lead to high personal accountability,
but mutually enforced norms of cooperation are likely to be low because of contentious, politicized
battles over inter-unit resource allocations and transfer prices (Bower, 1970; Eccles & White, 1988).
In companies with many profit centers, large CEO pay gaps may be ineffective because (a) high
accountability already promotes strong effort, and (b) tournament competition encourages sabotage
among executives whose relationships are already strained and politicized. If so, this would explain why
behavioral theory better predicted performance in firms with many businesses and high levels of capital
investment. Again, the overall mixture of results indicates that future research is needed to better
integrate behavioral and tournament theory. As discussed here, a promising avenue involves exploring
tensions between accountability to one’s superiors for financial performance and accountability to one’s
peers for cooperative behavior.
Paradoxes. A third subpattern in Table 5 involves several paradoxes between pay allocation and
the associated levels of firm performance. For instance, firms with more businesses or capital
investment had larger CEO pay gaps, outcomes consistent with tournament theory, but in such firms,
In Press - Academy of Management Journal
26
performance was higher when pay gaps were smaller, outcomes supporting the behavioral view. This
suggests a paradox: Pay gaps apparently discourage cooperation in firms whose horizontal
diversification and capital investment strategies would greatly benefit from it.
As discussed earlier, the size of CEO pay gaps may depend on control threats perceived by chief
executives and boards, while performance may depend on how executives below the CEO appraise
their accountability to one another. This implies a critical decoupling that may explain these paradoxes:
Pay gaps reflect the concerns of CEOs and boards, while performance depends on relationships among
lower-level managers. This decoupling also highlights why it is important to consider tensions within top
management groups rather than treating them as a unified whole (Hambrick, 1994). A unified view is
often taken in agency research (e.g., Gomez-Mejia, Tosi, & Hinkin, 1987; Tosi & Gomez-Mejia,
1989), but attention to coordination needs and across-rank pay gaps brings these tensions into sharp
focus.
VP results. The final conclusion to draw from Table 5 is that results for the number of vice
presidents differed from the others. CEO pay gaps were smaller in firms with more VPs, which
supports the behavioral view and contradicts the other results that all support tournament theory.
Moreover, there was a paradox between pay allocation and firm performance involving the number of
VPs that was the mirror image of the two described above. For VPs, behavioral theory predicted gap
size, and tournament theory predicted performance, while the opposite was true for number of
businesses and capital investment.
Why are the VP results so different? Building on our earlier discussion, we suspect that a large
collection of VPs constitutes a powerful political force that influences how CEOs and boards regard other
executives, and how such executives behave toward one another. CEOs and board members,
recognizing the collective power of numerous VPs, may equalize pay across ranks to remove a salient
source of inequality and dissatisfaction (cf. Leventhal, 1976). However, frequent contact among
numerous VPs who are responsible for business integration (cf. Chandler, 1962; Lawrence & Lorsch,
1967) may also enforce collaborative norms among peers. If so, large pay gaps may be effective in firms
with many VPs because they promote effort without creating pervasive sabotage. Again, this suggests
that synthesizing economic and behavioral theories may require a better understanding of (a) the concerns

In Press - Academy of Management Journal
27
and threats that superiors perceive with regard to controlling subordinates, and (b) norms of
accommodation and reciprocity among peers.
Other Observations
Like all research, this study has limitations, one of which is that its data are growing old. Since
1990, our final year of observation, executive pay has exploded, particularly for CEOs. If anything, we
expect this makes CEO pay gaps a more salient phenomenon and one with even greater performance
implications, however, future research is needed to ascertain this. A second limitation is a lack of direct
controls for executives’ skills and responsibilities. A portion of any CEO pay gap likely exists because
CEOs have more responsibility than other TMT members, and CEOs were judged, when they were
appointed, to be comparatively capable. In our models, the intercept and other controls should largely
account for this, but a better approach would involve longitudinal analyses using fixed-effects time-series
models, which would control for stable differences between a CEO’s capabilities and the average of
other TMT members. Again, this points to a need for further study.
Those limitations notwithstanding, our results have clear implications for top executives,
particularly board members and CEOs. Our finding that executive pay was consistently set in ways that
foster competition in firms particularly requiring cooperation is clearly at odds with the emphasis on
teamwork that is increasingly purveyed by consultants and reported in the business press. If CEOs and
boards are preaching the gospel of teams throughout their firms but rewarding self-promotion and
individualism in their executive pay, this is likely to create confusion and cynicism. This may occur not
only among top executives, but also among lower-level managers who are considering whether the long
push for the executive suite is worth it, and even among front-line employees making decisions about
their organizational commitment (cf. Cowherd & Levine, 1992). Given this, we wonder if the benefits
of large pay gaps that we discovered are perhaps short-lived compared to the discontent that they
gradually breed among the many employees who will never have a realistic shot at the corner office.
This suggests that CEOs and boards should consider the mixed signals that their executive pay
packages are sending, signals that affect both their own credibility and what type of person – driven, but
political, individualistic, and possibly cynical – that will self-select into their executive ranks.

In Press - Academy of Management Journal
28
Concluding Remarks
The theories studied here offer profoundly different descriptions of human nature. The tournament
perspective draws heavily on agency theory, which holds that individuals are calculative self-maximizers
who respond strongly to monetary incentives and work hard to evade administrative controls (Jensen &
Meckling, 1976). Such opportunism, which involves “self-interest seeking with guile” (Williamson,
1975: 9), is argued to be pervasive, so firms enhance their efficiency by using internal competition for
large monetary rewards to align the interests of principals and agents. Indeed, firms are viewed as
market substitutes where pay and promotion contests stand in for the price system to productively
channel self-interest (Fama, 1980; Williamson, 1975). As Williamson (1991: 162) states, firms are
merely “a continuation of market relations, by other means”.
In stark contrast, behavioral theory asserts that opportunism is not hard-wired. Instead, socio-
political context, which includes how people are paid, largely determines whether opportunism or
cooperation prevails (Cowherd & Levine, 1992; Dye, 1984; Lazear, 1989; Martin, 1982). Moreover,
cooperation plus shared purpose enables firms to adapt in ways that markets cannot because markets
rivet attention to near-term, easily measured outcomes, while cooperation and shared purpose reduce
opportunism, encourage innovation, enable collective action, and guide behavior in ambiguous situations
where relevant price information is missing (Barnard, 1938; Bartlett & Ghoshal, 1993; Ghoshal &
Moran, 1996Ghoshal & Moran, 1996). Consequently, a behavioral view concludes that markets and
hierarchies are not substitutes.
These disparate views are the subject of extensive commentary by authors such as Granovetter
(1985), Perrow (1986), and Ghoshal and Moran (1996), but very few, if any, empirical studies have
put these conflicting ideas to a rigorous competitive test. This study does so, and its results suggest that
both market-like incentives and socio-political forces are important. When we undertook this study, we
expected that this competitive test would yield a clear and consistent winner. Having completed it, we
are now struck by the complex interplay of economic and behavioral forces that surround the CEO pay
gap. This complexity begs further consideration of the tradeoffs among strong monetary incentives,
subordinates’ accountability for bottom-line performance, norms of reciprocal accommodation among
peers, and the felt need for CEOs and boards to exert control. Future study of these forces stands to

In Press - Academy of Management Journal
29
enrich our understanding of executive pay and the numerous tensions between economic and behavioral
views of the firm.

In Press - Academy of Management Journal
30
REFERENCES
Allison, P. D. 1978. Measures of inequality. American Sociological Review, 43: 865-880.
Allison, P. D. 1990. Change scores as dependent variables in regression analyses. In C. C. Clogg (Ed.), Sociological Methodology: 93-114. Oxford: Basil Blackwell.
Balakrishnan, S., & Wernerfelt, B. 1986. Technical change, competition and vertical integration. Strategic Management Journal, 7: 347-359.
Bantel, K. A., & Jackson, S. E. 1989. Top management and innovations in banking: does the composition of the top team make a difference? Academy of Management Journal, 10: 107-124.
Barnard, C. I. 1938. The functions of the executive. Cambridge, MA: Harvard University Press.
Baron, R. M., & Kenny, D. A. 1986. The moderator-mediator variable distinction in social psychological research: Conceptual, strategic, and statistical considerations. Journal of Personality and Social Psychology, 51: 1173-1182.
Bartlett, C. A., & Ghoshal, S. 1993. Beyond the M-form: Toward a managerial theory of the firm. Strategic Management Journal, 14(Winter special issue): 23-46.
Baysinger, B., & Hoskisson, R. E. 1990. The composition of boards of directors and strategic control: Effects on corporate strategy. Academy of Management Review, 15: 72 - 87.
Becker, B. E., & Huselid, M. A. 1992. The incentive effects of tournament compensation systems. Administrative Science Quarterly, 37: 336-350.
Belsley, D. A., Kuh, E., & Welsch, R. E. 1980. Regression diagnostics: Identifying influential data and sources of collinearity. New York: Wiley.
Bettis, R. A. 1981. Performance differences in related and unrelated diversified firms. Strategic Management Journal, 2: 379-393.
Blau, P. M., & Schoenherr, R. 1971. The structure of organizations. New York: Basic Books.
Bloom, M. 1999. The performance effects of pay dispersion on individuals and organizations. Academy of Management Journal, 42: 25-40.
Bower, J. L. 1970. Managing the resource allocation process. Boston, MA: Harvard Business School Press.
Bok. D. 1993. The cost of talent. New York: Free Press.
Brown, S. L., & Eisenhardt, K. M. 1997. The art of continuous change: Linking complexity theory and time-paced evolution in relentlessly shifting organizations. Administrative Science Quarterly, 42: 1-34.
In Press - Academy of Management Journal
31
Chandler, A. D. 1962. Strategy and structure: Chapters in The history of the American industrial enterprise. Cambridge: MIT Press.
Cohen, J. 1968. Multiple regression as a general data-analytic system. Psychological Bulletin, 70: 426-443.
Cook, K. S., & Yamagishi, T. 1983. Social determinants of equity judgments: The problem of multidimensional input. In D. M. Messick & K. S. Cook (eds.), Equity theory: Psychological and sociological perspectives: 95-126. New York: Praeger.
Cowherd, D. M., & Levine, D. I. 1992. Product quality and pay equity between lower-level employees and top management: An investigation of distributive justice theory. Administrative Science Quarterly, 37: 302-320.
Cronbach, L. J., & Furby, L. 1970. How we should measure “change” -- or should we? Psychological Bulletin, 74: 68-80.
Davis, R., & Duhaime, I. M. 1989. Business level data disclosed under FASB No. 14: Effective use in strategic management research. Academy of Management Best Paper Proceedings: 7-11.
Davis-Blake, A., & Uzzi, B. 1993. Determinants of employment externalization: A study of temporary workers and independent contractors. Administrative Science Quarterly, 38: 195-223.
Deutsch, M. 1985. Distributive justice: A social psychological perspective. New Haven, CT: Yale University Press.
Dutton, J. E., & Jackson, S. E. 1987. Categorizing strategic issues: Links to organizational action. Academy of Management Review, 12: 76-90.
Dye, R. A. 1984. The trouble with tournaments. Economic Inquiry, 22: 147-149.
Eccles, R. G., & White, H. C. 1988. Price and authority in inter-profit center transactions. American Journal of Sociology, 94 (supplement): S17-S51.
Ehrenberg, R. G., & Bognanno, M. L. 1990. Do tournaments have incentive effects? Journal of Political Economy, 98: 1307-1324.
Eisenhardt, K. M. 1989. Agency theory: An assessment and review. Academy of Management Review, 14: 57-74.
Eisenhardt, K. M., & Bourgeois, L. J. 1988. Politics of strategic decision making in high-velocity environments: Toward a midrange theory. Academy of Management Journal, 31: 737-770.
Fama, E. F. 1980. Agency problems and the theory of the firm. Journal of Political Economy, 88: 288-307.

In Press - Academy of Management Journal
32
Finkelstein, S. 1992. Power in top management teams: Dimensions, measurement, and validation. Academy of Management Journal, 35: 505-538.
Finkelstein, S., & Hambrick, D. C. 1988. Chief executive compensation: A synthesis and reconciliation. Strategic Management Journal, 9: 543-558.
Finkelstein, S., & Hambrick, D. C. 1989. Chief executive compensation: A study of the intersection of markets and political processes. Strategic Management Journal, 10: 121-134.
Frank, R. H., & Cook, P. J. 1995. The winner-take-all society. New York: Free Press.
Freedman, S. M., & Montanari, J. R. 1980. An integrative model of managerial reward allocation. Academy of Management Review, 5: 381-390.
Galbraith, J. R. 1973. Designing complex organizations. Reading, MA: Addison-Wesley.
Ghoshal, S., & Moran, P. 1996. Bad for practice: A critique of the transaction cost theory. Academy of Management Review, 21: 13-47.
Gibbons, R., & Murphy, K. J. 1990. Relative performance evaluation for chief executive officers. Industrial and Labor Relations Review, 43 (special issue): 30S-51S.
Gomez-Mejia, L. R. 1992. Structure and process of diversification, compensation strategy, and firm performance. Strategic Management Journal, 13: 381-397.
Gomez-Mejia, L. R., Tosi, H., & Hinkin, T. 1987. Managerial control, performance, and executive compensation. Academy of Management Journal, 30: 51-70.
Gooding, R. Z., & Wagner, J. A. 1985. A meta-analytic review of the relationship between size and performance: The productivity and efficiency of organizations and their subgroups. Administrative Science Quarterly, 30: 462-481.
Granovetter, M. 1985. Economic action and social structure: The problem of embeddedness. American Journal of Sociology, 91: 481-510.
Green, J. R., & Stokey, N. L. 1983. A comparison of tournaments and contracts. Journal of Political Economy, 91: 349-364.
Greenberg, J. 1987. A taxonomy of organizational justice theories. Academy of Management Review, 12: 9-22.
Gupta, A. K., & Govindarajan, V. 1984. Business unit strategy, managerial characteristics, and business unit effectiveness at strategy implementation. Academy of Management Journal, 27: 25-41.
Hambrick, D. C. 1994. Top management groups: A conceptual integration and reconsideration of the “team” label. In B. M. Staw and L. L. Cummings (Eds.), Research in Organizational Behavior, 16: 171-213. Greenwich, CT: JAI Press.
In Press - Academy of Management Journal
33
Hambrick, D. C., & Finkelstein, S. 1995. The effects of ownership structure on conditions at the top: The case of CEO pay raises. Strategic Management Journal, 16: 175-193.
Hambrick, D. C., & Siegel, P. A. 1998. Pay dispersion within top management groups: Evidence of its harmful effects of performance of high-technology firms. Working paper, Columbia University.
Haveman, H. A. 1993. Organizational size and change: Diversification in the savings and loan industry after deregulation. Administrative Science Quarterly, 38: 20-50.
Hays, R. H., & Abernathy, W. J. 1980. Managing our way to economic decline. Harvard Business Review, July-Aug: 67-77.
Henderson, A. D., & Fredrickson, J. W. 1996. Information-processing demands as a determinant of CEO compensation. Academy of Management Journal, 39: 575-606.
Hill, C. W. L., Hitt, M. A., & Hoskisson, R. E. 1992. Cooperative versus competitive structures in related and unrelated diversified firms. Organization Science, 3: 501-521.
Hill, C. W. L., & Hoskisson, R. E. 1987. Strategy and structure in the multiproduct firm. Academy of Management Review, 12: 331-341.
Hill, C. W. L., & Phan, P. 1991. CEO tenure as a determinant of CEO pay. Academy of Management Journal, 34: 707-717.
Hoskisson, R. E., Hitt, M. A., Johnson, R. A., Moesel, D. D. 1993. Construct validity of an objective (entropy) categorical measure of diversification strategy. Strategic Management Journal, 14: 215-235.
Jackson, S. E., & Dutton, J. E. 1988. Discerning threats and opportunities. Administrative Science Quarterly, 33: 370-387.
Jacquemin, A. P., & Berry, C. H. 1979. Entropy measure of diversification and corporate growth. Journal of Industrial Economics, 27: 359-369.
Jasso, G., & Rossi, P. H. 1977. Distributive justice and earned income. American Sociological Review, 42: 639-651.
Jensen, M. C., & Meckling, W. H. 1976. Theory of the firm: Managerial behavior, agency costs and ownership structure. Journal of Financial Economics, 3: 305-360.
Jones, G. R., & Hill, C. W. L. 1988. Transaction cost analysis of strategy -structure choice. Strategic Management Journal, 9: 159-172.
Judge, G. G., Hill, R. C., Griffiths, W. E., Lütkepohl, H., & Lee, T. 1988. Introduction to the theory and practice of econometrics (2nd ed.). New York: Wiley.

In Press - Academy of Management Journal
34
Kaplan, A. 1968. The conduct of inquiry: Methodology for behavioral science. Scranton, PA: Chandler Publishing.
Kenny, D. A., & Cohen, S. H. 1979. A reexamination of selection and growth processes in the nonequivalent control group design. In K. Schuessler (ed.), Sociological Methodology: 290-313. San Francisco: Jossey-Bass.
Konrad, A. M., & Pfeffer, J. 1990. Do you get what you deserve? Factors affecting the relationship between productivity and pay. Administrative Science Quarterly, 35: 258-285.
Lambert, R. A., Larcker, D. F., & Weigelt, K. 1993. The structure of organizational incentives. Administrative Science Quarterly, 38: 438-461.
Lawler, E. E. 1971. Pay and organizational effectiveness: A psychological view. New York: McGraw-Hill.
Lawrence, P. R., & Lorsch, J. W. 1967. Differentiation and integration in complex organizations. Administrative Science Quarterly, 12: 1-47.
Lazear, E. P. 1989. Pay equality and industrial politics. Journal of Political Economy, 97: 561-580.
Lazear, E. P., & Rosen, S. 1981. Rank-order tournaments as optimum labor contracts. Journal of Political Economy, 89: 841-864.
Levine, J. M., & Moreland, R. L. 1990. Progress in small group research. Annual Review of Psychology, 41: 585-634.
Leventhal, G. S. 1976. The distribution of rewards and resources in groups and organizations. In L. Berkowitz & E. Walster (Eds.), Advances in Experimental Social Psychology 9: 91-131. New York: Academic Press.
Leventhal, G. S., Karuza, J., & Fry, W. R. 1980. Beyond fairness: A theory of allocation preferences. In G. Mikula (Ed.), Justice and social interaction: 167-218. New York: Springer-Verlag.
Main, B. G., O'Reilly, C. A., & Wade, J. 1993. Top executive pay: Tournament or teamwork? Journal of Labor Economics, 11: 606-628.
Martin, J. 1981. Relative deprivation: A theory of distributive injustice for an era of shrinking resources. In L. L. Cummings and B. M. Staw (eds.), Research in Organizational Behavior, 3: 53-107. Greenwich, CT: JAI Press.
Martin, J. 1982. The fairness of earnings differentials: An experimental study of the perceptions of blue-collar workers. Journal of Human Resources, 17: 110-122.
Meyer, H. H. 1975. The pay-for-performance dilemma. Organizational Dynamics, 3(3): 39-50.

In Press - Academy of Management Journal
35
Michel, J. G., & Hambrick, D. C. 1992. Diversification posture and top management team characteristics. Academy of Management Journal, 35: 9-37.
Milgrom, P., & Roberts, J. 1988. An economic approach to influence activities in organizations. American Journal of Sociology, 94(Supplement): S154-S179.
Murphy, K. J. 1985. Corporate performance and managerial remuneration. Journal of Accounting and Economics, 7: 11-42.
O'Reilly, C. A., Main, B. G., & Crystal, G. S. 1988. CEO compensation as tournament and social comparison: A tale of two theories. Administrative Science Quarterly, 33: 257-274.
Ouchi, W. G. 1979. A conceptual framework for the design of organizational control mechanisms. Management Science, 25: 833-848.
Palepu, K. 1985. Diversification strategy, profit performance and the entropy measure. Strategic Management Journal, 6: 239-255.
Perrow, C. B. 1986. Complex organizations: A critical essay, (3rd edition). New York: McGraw-Hill.
Pfeffer, J., & Langton, N. 1993. The effect of wage dispersion on satisfaction, productivity, and working collaboratively: Evidence from college and university faculty. Administrative Science Quarterly, 38: 382-407.
Popper, K. 1959. The logic of scientific discovery. New York: Harper & Row.
Porter, M. E. 1985. Competitive advantage. New York: Free Press.
Prahalad, C. K., & Bettis, R. A. 1986. The dominant logic: A new linkage between diversity and performance. Strategic Management Journal, 7: 485-501.
Prescott, J. E. 1986. Environments as moderators of the relationship between strategy and performance. Academy of Management Journal, 29: 329-346.
Rosen, S. 1986. Prizes and incentives in elimination tournaments. American Economic Review, 76: 701-715.
Rumelt, R. P. 1974. Strategy, structure, and economic performance. Boston, MA: Harvard Business School Press.
Schoonhoven, C. B. 1981. Problems with contingency theory: Testing assumptions hidden within the language of contingency "theory". Administrative Science Quarterly, 26: 349-377.
Siegel, P. A. 1996. Top management team compensation: A reorientation of theory and method. Presented at the 1996 meeting of the Academy of Management, Cincinnati, Ohio.
In Press - Academy of Management Journal
36
Siegel, P. A., & Hambrick, D. C. 1996. Business strategy and the social psychology of top management teams. In J. Dutton and J. Baum (eds.), Advances in Strategic Management, 13: 91-119. Greenwich, CT: JAI Press.
Steiner, I. D. 1972. Group processes and productivity. New York: Academic Press.
Sutton, R. I., & Staw, B. M. 1995. What theory is not. Administrative Science Quarterly, 40: 371-384.
Thompson, J. D. 1967. Organizations in action. New York: McGraw-Hill.
Tosi, H. L., & Gomez-Mejia, L. R. 1989. The decoupling of CEO pay and performance: An agency theory perspective. Administrative Science Quarterly, 34: 169-189.
Venkatraman, N. 1989. The concept of fit in strategy research: Toward verbal and statistical correspondence. Academy of Management Review, 14: 423-444.
Westphal, J. D., & Zajac, E. J. 1994. Substance and symbolism in CEOs' long-term incentive plans. Administrative Science Quarterly, 39: 367-390.
Wheelwright, S. C., & Clark, K. B. 1992. Revolutionizing product development. New York: Free Press.
Williamson, O. E. 1975. Markets and hierarchies: Analysis and antitrust implications. New York: Free Press.
Williamson, O. E. 1991. Economic institutions: Spontaneous and intentional governance. Journal of Law, Economics, and Organizations, 7: 159-187.
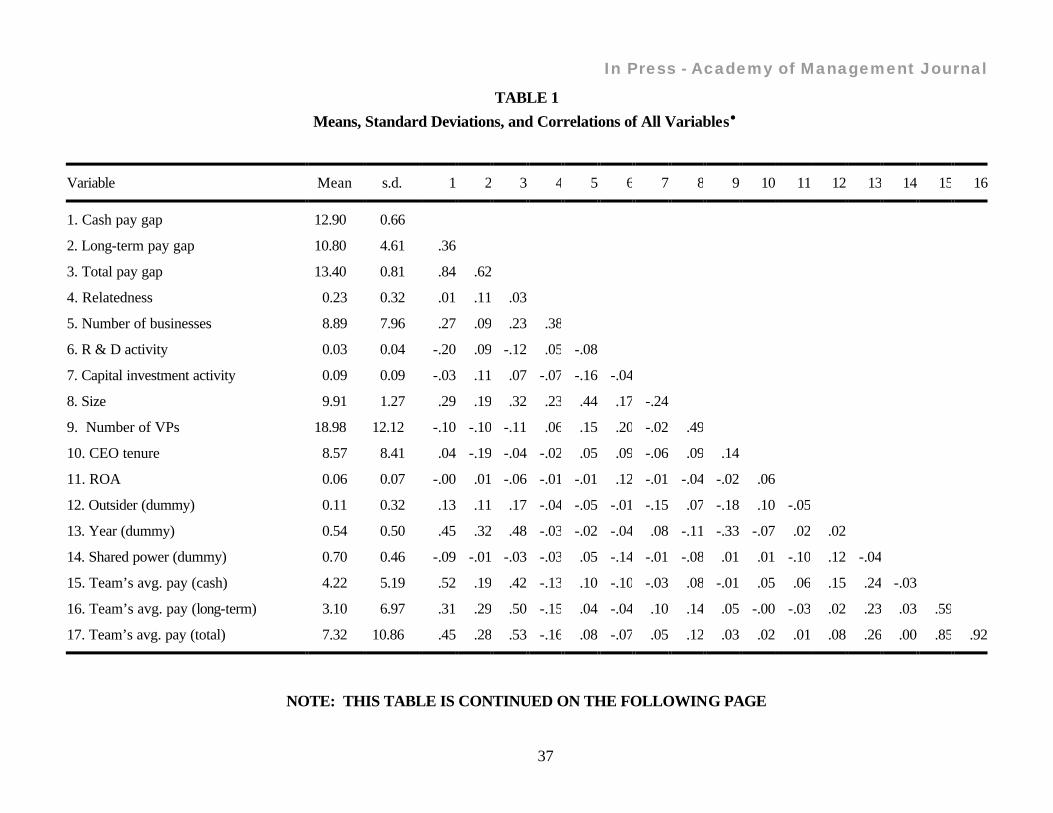
In Press - Academy of Management Journal
37
TABLE 1 Means, Standard Deviations, and Correlations of All Variables•
Variable Mean s.d. 1 2 3 4 5 6 7 8 9 10 11 12 13 14 15 16
1. Cash pay gap 12.90 0.66
2. Long-term pay gap 10.80 4.61 .36
3. Total pay gap 13.40 0.81 .84 .62
4. Relatedness 0.23 0.32 .01 .11 .03
5. Number of businesses 8.89 7.96 .27 .09 .23 .38
6. R & D activity 0.03 0.04 -.20 .09 -.12 .05 -.08
7. Capital investment activity 0.09 0.09 -.03 .11 .07 -.07 -.16 -.04
8. Size 9.91 1.27 .29 .19 .32 .23 .44 .17 -.24
9. Number of VPs 18.98 12.12 -.10 -.10 -.11 .06 .15 .20 -.02 .49
10. CEO tenure 8.57 8.41 .04 -.19 -.04 -.02 .05 .09 -.06 .09 .14
11. ROA 0.06 0.07 -.00 .01 -.06 -.01 -.01 .12 -.01 -.04 -.02 .06
12. Outsider (dummy) 0.11 0.32 .13 .11 .17 -.04 -.05 -.01 -.15 .07 -.18 .10 -.05
13. Year (dummy) 0.54 0.50 .45 .32 .48 -.03 -.02 -.04 .08 -.11 -.33 -.07 .02 .02
14. Shared power (dummy) 0.70 0.46 -.09 -.01 -.03 -.03 .05 -.14 -.01 -.08 .01 .01 -.10 .12 -.04
15. Team’s avg. pay (cash) 4.22 5.19 .52 .19 .42 -.13 .10 -.10 -.03 .08 -.01 .05 .06 .15 .24 -.03
16. Team’s avg. pay (long-term) 3.10 6.97 .31 .29 .50 -.15 .04 -.04 .10 .14 .05 -.00 -.03 .02 .23 .03 .59
17. Team’s avg. pay (total) 7.32 10.86 .45 .28 .53 -.16 .08 -.07 .05 .12 .03 .02 .01 .08 .26 .00 .85 .92
NOTE: THIS TABLE IS CONTINUED ON THE FOLLOWING PAGE
In Press - Academy of Management Journal
38

In Press - Academy of Management Journal
39
TABLE 1 (cont.) Means, Standard Deviations, and Correlations of All Variables•
Variable Mean s.d. 1 2 3 4 5 6 7 8 9 10 11 12 13 14 15 16
18. Non-CEO dispersion (cash) 25.09 15.85 .21 -.09 .15 -.09 .04 -.28 .04 -.04 -.13 .13 -.05 .00 .17 .17 .35 .12
19. Non-CEO dispersion (long-term) 41.09 38.07 .06 .38 .18 -.07 -.09 -.06 -.04 -.18 -.19 -.02 .08 .25 .16 .04 .19 .17
20. Non-CEO dispersion (total) 28.56 17.30 .16 .03 .25 -.07 .01 -.21 .04 -.02 -.15 .21 -.04 .02 .17 .13 .26 .30
21. Unrelated diversification 0.54 0.47 .24 -.02 .14 -.01 .44 -.46 -.05 .23 .01 .09 -.15 .06 -.10 .07 .14 .03
22. High-tech group 0.28 0.45 -.20 .05 -.12 -.15 -.28 .72 -.06 .10 .13 .01 .09 .00 -.03 -.17 -.02 .03
23. Chemicals group 0.23 0.42 .03 .08 -.00 .34 .09 -.03 -.06 -.11 -.10 .05 .16 -.03 .06 -.00 -.05 -.10
24. Natural resources group 0.29 0.46 -.02 -.11 -.06 -.32 -.18 -.53 .22 -.29 -.06 -.11 -.22 -.08 -.05 .19 -.21 -.10
Variable 17 18 19 20 21 22 23
18. Non-CEO dispersion (cash) .24
19. Non-CEO dispersion (long-term) .20 .18
20. Non-CEO dispersion (total) .32 .75 .43
21. Unrelated diversification .08 .17 -.03 .13
22. High-tech group .01 -.16 .03 -.09 -.50
23. Chemicals group -.09 -.11 .06 -.10 -.06 -.34
24. Natural resources group -.17 .09 -.05 .06 .14 -40 -.35
• N = 189; p < .05 for all r > 0.14; p < .01 for all r > 0.18. Pay gaps equal the natural log of the difference between the CEO’s pay and the average pay of the four highest-paid non-CEOs listed in a firm’s proxy statement. Size equals the natural log of employees. Year = 1 for 1990, and 0 for 1985. Team’s average pay is measured in $100,000.

In Press - Academy of Management Journal
40
TABLE 2 Means and Standard Deviations by Industry Group
Industry Group Variable Chemicals High-Tech
Equipment Natural
Resources Conglomerate
Cash pay gap 12.93 (0.58)
12.68 (0.77)
12.87 (0.54)
13.19 (0.60)
Long-term pay gap 11.57 (2.92)
11.31 (3.53)
10.21 (4.97)
10.81 (4.94)
Total pay gap 13.39 (0.70)
13.24 (0.95)
13.32 (0.76)
13.72 (0.71)
ROA 0.08 (0.07)
0.07 (0.08)
0.04 (0.06)
0.06 (0.04)
Relatedness 0.43 (0.41)
0.15 (0.26)
0.07 (0.13)
0.34 (0.34)
Number of businesses 10.19 (8.65)
5.37 (4.41)
6.64 (4.13)
16.26 (10.51)
R&D activity 0.03 (0.02)
0.08 (0.04)
0.01 (0.01)
0.02 (0.02)
Capital investment activity 0.08 (0.04)
0.09 (0.04)
0.13 (0.14)
0.07 (0.10)
Firm size 9.65 (1.13)
10.11 (1.15)
9.34 (1.34)
10.76 (0.96)
Number of VPs 16.64 (9.90)
21.40 (14.79)
17.74 (9.24)
19.97 (13.51)
Year 0.60 (0.49)
0.52 (0.50)
0.51 (0.50)
0.57 (0.50)
CEO tenure 9.40 (9.21)
8.72 (8.21)
7.14 (7.45)
9.49 (9.12)
Outsider 0.09 (0.29)
0.11 (0.32)
0.07 (0.26)
0.81 (0.40)
Shared power 0.70 (0.46)
0.57 (0.50)
0.84 (0.37)
0.68 (0.47)
Team’s average pay -- cash
3.72 (5.26)
4.08 (4.20)
2.52 (4.30)
7.64 (6.19)
Team’s average pay -- long-term
1.84 (3.43)
3.46 (8.01)
1.99 (5.38)
5.78 (9.59)
Team’s average pay -- total
5.55 (7.65)
7.54 (11.00)
4.50 (8.52)
13.43 (14.47)
Non-CEO dispersion -- cash
21.92 (11.67)
21.07 (11.07)
27.31 (12.92)
31.33 (25.28)
Non-CEO dispersion -- long-term
45.27 (42.84)
43.00 (38.05)
37.90 (38.61)
38.20 (31.76)
Non-CEO dispersion -- total
25.31 (13.97)
26.21 (18.52)
30.21 (14.47)
33.31 (21.64)
Unrelated diversification 0.48 (0.39)
0.17 (0.28)
0.64 (0.40)
0.99 (0.43)

In Press - Academy of Management Journal
41
N = 189; Standard deviations shown in parentheses.

In Press - Academy of Management Journal
42
TABLE 3 Multiple Regression Models of CEO Pay Gaps for Cash, Long-Term, and Total Compensation•
Cash Long-Term Total Predictor Model 1 Model 2 Model 3 Model 4 Model 5 Model 6
Relatedness 0.011 1.608 ** 0.043
Number of businesses 0.011 * 0.029 0.014 *
R&D activity –0.874 15.602 * –0.470
Capital investment activity 0.388 9.183 *** 1.344 *
Firm size 0.176 *** 0.885 *** 0.236 ***
Number of VPs –0.008 * –0.044 –0.012 **
High-tech group –0.088 0.106 1.532 1.694 * –0.062 0.140
Chemicals group 0.060 0.213 † 1.381 1.709 * 0.040 0.205
Natural resources group 0.096 0.218 –0.047 0.956 –0.028 0.092
Year 0.487 *** 0.440 *** 2.137 *** 1.912 *** 0.609 *** 0.550 ***
ROA –0.000 0.001 –0.011 –0.005 –0.006 –0.005
CEO tenure 0.002 0.004 –0.085 *** –0.075 *** –0.006 –0.004
Outsider 0.153 0.238 * 0.707 * 1.239 * 0.348 * 0.487 ***
Shared power –0.133 –0.142 † 0.177 0.219 –0.084 –0.081
Team’s average pay 0.051 *** 0.052 *** 0.108 *** 0.105 ** 0.027 *** 0.026 ***
Non-CEO dispersion –0.001 0.001 0.031 ** 0.037 *** 0.006 † 0.006 *
Unrelated diversification 0.252 * 0.066 1.316 0.848 0.214 † –0.025
R2 0.442 *** 0.594 *** 0.254 *** 0.331 *** 0.443 *** 0.620 *** (F-statistic) (12.104) (13.971) (6.535) (4.710) (12.147) (15.513)
∆R2 from controls 0.152 *** 0.077 *** 0.177 *** (F-statistic) (10.146) (4.351) (12.522)

In Press - Academy of Management Journal
43
† p < .10; * p < .05; ** p < .01; *** p < .001 (two-tailed tests) • N = 189. Table contains nonstandardized regression coefficients.

In Press - Academy of Management Journal
44
TABLE 4 Multiple Regression Models of ROA•
Predictor Model 1 Model 2 Model 3 Model 4 Model 5
Relatedness –2.685 –2.589 –21.576 ** –22.051 **
Number of businesses 0.060 0.048 0.678 * 0.785 **
R&D activity –13.690 –11.519 18.035 –20.705
Capital investment activity 3.273 3.846 53.990 * 51.360 *
Firm size –0.926 † –1.163 * –0.303 –1.630 **
Number of VPs 0.007 0.014 –0.329 ** –0.300 *
Long-term pay gap 0.034 1.241 0.143
Cash pay gap 0.996 1.031 0.883
Relatedness x Long-term gap 1.554 ** 1.571 **
Num. of businesses x Long-term gap –0.049 * –0.059 **
R&D activity x Long-term gap –3.468
Cap. invest. activity x Long-term gap –4.723 * –4.455 *
Firm size x Long-term gap 0.120
Number of VPs x Long-term gap 0.032 ** 0.028 **
High-tech group –1.079 –1.064 –1.108 –1.110 –1.078
Chemicals group 0.177 –0.285 –0.497 –0.470 –0.542
Natural resources group –1.245 –3.124 † –3.308 † –3.273 † –3.678 *
Year 0.779 0.066 0.043 0.358 0.197
CEO tenure –0.018 –0.016 –0.016 0.004 0.009
Outsider –2.794 † –3.318 * –3.695 * –2.518 –2.722 †
Shared power –1.024 –0.943 –0.802 –0.616 –0.707
Team’s average pay 0.000 0.000 0.000 0.000 0.000
Non-CEO dispersion 0.019 0.014 0.012 –0.022 –0.022
Unrelated diversification –2.311 † –2.522 † –2.600 † –3.078 * –2.806 *
R2 0.091 † 0.143 * 0.150 † 0.220 * 0.213 ** (F-statistic) (1.626) (1.686) (1.579) (1.855) (1.951)
∆R2 from previous model 0.052 0.007 0.070 * –0.007 (F-statistic) (1.722) (0.720) (2.468) (0.799)
† p < .10; * p < .05; ** p < .01 (two-tailed tests)
In Press - Academy of Management Journal
45
• N = 189. Table contains nonstandardized regression coefficients multiplied by 100. The R2 for model 5 is significantly higher than that of model 3 (p < .02).

In Press - Academy of Management Journal
46
TABLE 5 Summary of Competitive Test Results •
H1 - H6: Size of the CEO Pay Gap H7: Firm Performance
Indicators of Coordination Needs
Cash Compensation
Long-Term Compensation
Total Compensation
Coordination Needs x Long-Term Pay Gap Interactions
Relatedness Tournament (+) Tournament (+)
Number of businesses Tournament (+) Tournament (+) Behavioral (−)
R&D Activity Tournament (+)
Capital investment activity Tournament (+) Tournament (+) Behavioral (−)
Firm size Tournament (+) Tournament (+) Tournament (+)
Number of VPs Behavioral (−) Behavioral (−) Tournament (+)
• Cells indicate whether empirical results supported the tournament or behavioral perspectives. Blank cells indicate non-significant relationships that support neither theory. Tournament support involves positive relationships, while negative associations support the behavioral view.

In Press - Academy of Management Journal
47
FIGURE 1 ROA vs. Relatedness at Different-Sized CEO Pay Gaps•
-0.20
-0.15
-0.10
-0.05
0.00
0.05
0.10
0.00 0.20 0.40 0.60 0.80 1.00 1.20 1.40
Relatedness
Influenceon ROA
• Observed range of relatedness is 0.00 - 1.32. For gap size, large = µ + σ; medium = µ; and small = µ − σ, where µ and σ are the mean and standard deviation of the long-term CEO pay gap. This result supports tournament theory and contradicts the behavioral perspective.
Small pay gap
Medium pay gap
Large pay gap

In Press - Academy of Management Journal
48
FIGURE 2 ROA vs. Number of Businesses at Different-Sized CEO Pay Gaps•
-0.05
0.00
0.05
0.10
0.15
0.20
1 10 20 30 40
Number of Businesses
Influenceon ROA
• Observed range of number of businesses is 1 - 41. For gap size, large = µ + σ; medium = µ; and small = µ − σ, where µ and σ are the mean and standard deviation of the long-term CEO pay gap. This result supports the behavioral perspective and contradicts tournament theory.
Small pay gap
Medium pay gap
Large pay gap
In Press - Academy of Management Journal
49
Andrew D. Henderson is an assistant professor of management in the Graduate School of
Business at the University of Texas at Austin, where he received his Ph.D. in strategic management. His
research interests include organizational evolution and executive decision processes.
James W. Fredrickson is Associate Professor of Management and Chevron Oil Foundation
Centennial Fellow in the Graduate School of Business at the University of Texas at Austin. His research
interests include a variety of issues related to top management teams, strategic decision processes and
executive compensation. He holds a Ph.D. in strategic management from the University of Washington.