Embed Size (px)
Citation preview
TMS320C6000Code Composer Studio
Tutorial
Literature Number: SPRU301AMay 1999
Printed on Recycled Paper
IMPORTANT NOTICE
Texas Instruments and its subsidiaries (TI) reserves the right to make changes to their products or todiscontinue any product or service without notice, and advises customers to obtain the latest version ofrelevant information to verify, before placing orders, that the information being relied on is current andcomplete. All products are sold subject to the terms and conditions of sale at the time of orderacknowledgment, including those pertaining to warranty, patent infringement, and limitation of liability.
TI warrants performance of its semiconductor products to the specifications applicable at the time of salein accordance with TI’s standard warranty. Testing and other quality control techniques are utilized to theextent TI deems necessary to support this warranty. Specific testing of all parameters of each device isnot necessarily performed, except those mandated by government requirements.
CERTAIN APPLICATIONS USING SEMICONDUCTOR PRODUCTS MAY INVOLVE POTENTIALRISKS OF DEATH, PERSONAL INJURY, OR SEVERE PROPERTY OR ENVIRONMENTAL DAMAGE(“CRITICAL APPLICATIONS). TI SEMICONDUCTOR PRODUCTS ARE NOT DESIGNED,AUTHORIZED, OR WARRANTED TO BE SUITABLE FOR USE IN LIFE-SUPPORT DEVICES ORSYSTEMS OR OTHER CRITICAL APPLICATIONS. INCLUSION OF TI PRODUCTS IN SUCHAPPLICATIONS IS UNDERSTOOD TO BE FULLY AT THE CUSTOMER’S RISK.
In order to minimize risks associated with the customer’s applications, adequate design and operatingsafeguards must be provided by the customer to minimize inherent or procedural hazards.
TI assumes no liability for applications assistance or customer product design. TI does not warrant orrepresent that any license, either express or implied, is granted under any patent right, copyright, maskwork right, or other intellectual property right of TI covering or relating to any combination, machine, orprocess in which such semiconductor products or services might be or are used. TI’s publication ofinformation regarding any third party’s products or services does not constitute TI’s approval, warrantyor endorsement thereof.
Copyright © 1999, Texas Instruments Incorporated
This is a draft version printed from file: tut_pref.fm on 5/6/99
Preface
Read This First
About This Manual
Code Composer Studio speeds and enhances the development process forprogrammers who create and test real-time, embedded signal processingapplications. Code Composer Studio extends the capabilities of the CodeComposer Integrated Development Environment (IDE) to include fullawareness of the DSP target by the host and real-time analysis tools.
This tutorial assumes that you have Code Composer Studio, which includesthe TMS320C6000 Code Generation Tools and the DSP/BIOS and RTDXAPIs and plug-ins. This manual also assumes that you have installed a targetboard in your PC containing the DSP device.
If you only have Code Composer Studio Simulator and the Code GenerationTools, but not the complete Code Composer Studio, you can perform thesteps in Chapter 2 and Chapter 4.
If you are using the DSP simulator instead of a board, you are also limited toperforming the steps in Chapter 2 and Chapter 4.
This tutorial will introduce you to some of the key features of Code ComposerStudio. The intention is not to provide an exhaustive description of everyfeature. Instead, the objective is to prepare you to begin DSP developmentwith Code Composer Studio.
iii
Notational Conventions
Notational Conventions
This document uses the following conventions:
❏ The TMS320C6000 core is also referred to as ’C6000.
❏ Code Composer Studio generates files with extensions of .s62 and .h62.These files can also be used with both the TMS320C6201 and theTMS320C6701. DSP/BIOS does not use the floating-point instructionsthat are supported by the TMS320C6701.
❏ Program listings, program examples, and interactive displays are shownin a special typeface. Examples use a bold version of the specialtypeface for emphasis; interactive displays use a bold version of thespecial typeface to distinguish commands that you enter from items thatthe system displays (such as prompts, command output, error messages,etc.).
Here is a sample program listing:
Void copy(HST_Obj *input, HST_Obj *output){ PIP_Obj *in, *out; Uns *src, *dst; Uns size;
❏ In syntax descriptions, the instruction, command, or directive is in a boldtypeface and parameters are in an italic typeface. Portions of a syntaxthat are in bold should be entered as shown; portions of a syntax that arein italics describe the type of information that should be entered. Syntaxthat is entered on a command line is centered. Syntax that is used in atext file is left-justified.
❏ Square brackets ( [ ] ) identify an optional parameter. If you use anoptional parameter, you specify the information within the brackets.Unless the square brackets are in a bold typeface, do not enter thebrackets themselves.
iv
Related Documentation from Texas Instruments
Related Documentation from Texas InstrumentsThe following books describe the devices, related support tools, and CodeComposer Studio.
Most of these documents are available in Adobe Acrobat format after youinstall Code Composer Studio. To open a document, from the Windows Startmenu, choose Programs−>Code Composer Studio ’C6000−>Documentation.
To obtain a printed copy of any of these documents, call the TexasInstruments Literature Response Center at (800) 477-8924. When ordering,please identify the book by its title and literature number.
Code Composer Studio User’s Guide (literature number SPRU328)explains how to use the Code Composer Studio development environmentto build and debug embedded real-time DSP applications.
DSP/BIOS User’s Guide (literature number SPRU303) describes how to useDSP/BIOS tools and APIs to analyze embedded real-time DSP applications.
TMS320C6000 Assembly Language Tools User's Guide (literaturenumber SPRU186) describes the assembly language tools (assembler,linker, and other tools used to develop assembly language code),assembler directives, macros, common object file format, and symbolicdebugging directives for the ’C6000 generation of devices.
TMS320C6000 Optimizing C Compiler User's Guide (literature numberSPRU187) describes the ’C6000 C compiler and the assembly optimizer.This C compiler accepts ANSI standard C source code and producesassembly language source code for the ’C6000 generation of devices.The assembly optimizer helps you optimize your assembly code.
TMS320C62x/C67x Programmer's Guide (literature number SPRU198)describes ways to optimize C and assembly code for theTMS320C62x/C67x DSPs and includes application program examples.
TMS320C62x/C67x CPU and Instruction Set Reference Guide (literaturenumber SPRU189) describes the ’C62x/C67x CPU architecture,instruction set, pipeline, and interrupts for these digital signalprocessors.
TMS320C6201/C6701 Peripherals Reference Guide (literature numberSPRU190) describes common peripherals available on theTMS320C6201/’C6701 digital signal processors. This book includesinformation on the internal data and program memories, the externalmemory interface (EMIF), the host port, multichannel buffered serialports, direct memory access (DMA), clocking and phase-locked loop(PLL), and the power-down modes.
TMS320C62x Technical Brief (literature number SPRU197) gives anintroduction to the digital signal processor, development tools, andthird-party support.
Read This First v
Related Documentation
TMS320C6201 Digital Signal Processor Data Sheet (literature numberSPRS051) describes the features of the TMS320C6201 and providespinouts, electrical specifications, and timings for the device.
TMS320C6701 Digital Signal Processor Data Sheet (literature numberSPRS067) describes the features of the TMS320C6701 and providespinouts, electrical specifications, and timings for the device.
TMS320 DSP Designer’s Notebook: Volume 1 (literature numberSPRT125) presents solutions to common design problems using ’C2x,’C3x, ’C4x, ’C5x, and other TI DSPs.
Related Documentation
You can use the following books to supplement this user’s guide:
American National Standard for Information Systems-ProgrammingLanguage C X3.159-1989, American National Standards Institute.
The C Programming Language (second edition), by Brian W. Kernighanand Dennis M. Ritchie. Prentice Hall Press, 1988.
Programming in ANSI C, Kochan, Steve G. Sams Publishing, 1994.
C: A Reference Manual, Harbison, Samuel and Guy Steele. Prentice HallComputer Books, 1994.
Trademarks
MS-DOS, Windows, and Windows NT are trademarks of MicrosoftCorporation. Other Microsoft products referenced herein are eithertrademarks or registered trademarks of Microsoft.
The Texas Instruments logo and Texas Instruments are registeredtrademarks of Texas Instruments. Trademarks of Texas Instruments include:TI, XDS, Code Composer Studio, Probe Point, Code Explorer, DSP/BIOS,RTDX, Online DSP Lab, BIOSuite, and SPOX.
All other brand or product names are trademarks or registered trademarks oftheir respective companies or organizations.
vi
If You Need Assistance . . .
If You Need Assistance . . .
Note: When calling a Literature Response Center to order documentation, please specify the literature number.
❏ World-Wide Web SitesTI Online http://www.ti.comSemiconductor Product Information Center (PIC) http://www.ti.com/sc/docs/pic/home.htmDSP Solutions http://www.ti.com/dsps320 Hotline On-lineTM http://www.ti.com/sc/docs/dsps/support.htm
❏ North America, South America, Central AmericaProduct Information Center (PIC) (972) 644-5580TI Literature Response Center U.S.A. (800) 477-8924Software Registration/Upgrades (214) 638-0333 Fax: (214) 638-7742U.S.A. Factory Repair/Hardware Upgrades (281) 274-2285U.S. Technical Training Organization (972) 644-5580DSP Hotline (281) 274-2320 Fax: (281) 274-2324 Email:[email protected] Modem BBS (281) 274-2323DSP Internet BBS via anonymous ftp to ftp://ftp.ti.com/pub/tms320bbs
❏ Europe, Middle East, AfricaEuropean Product Information Center (EPIC) Hotlines: Multi-Language Support +33 1 30 70 11 69 Fax: +33 1 30 70 10 32 Email: [email protected] Deutsch +49 8161 80 33 11 or +33 1 30 70 11 68 English +33 1 30 70 11 65 Français +33 1 30 70 11 64 Italiano +33 1 30 70 11 67EPIC Modem BBS +33 1 30 70 11 99European Factory Repair +33 4 93 22 25 40Europe Customer Training Helpline Fax: +49 81 61 80 40 10
❏ Asia-PacificLiterature Response Center +852 2 956 7288 Fax: +852 2 956 2200Hong Kong DSP Hotline +852 2 956 7268 Fax: +852 2 956 1002Korea DSP Hotline +82 2 551 2804 Fax: +82 2 551 2828Korea DSP Modem BBS +82 2 551 2914Singapore DSP Hotline Fax: +65 390 7179Taiwan DSP Hotline +886 2 377 1450 Fax: +886 2 377 2718Taiwan DSP Modem BBS +886 2 376 2592Taiwan DSP Internet BBS via anonymous ftp to ftp://dsp.ee.tit.edu.tw/pub/TI/
❏ JapanProduct Information Center +0120-81-0026 (in Japan) Fax: +0120-81-0036 (in Japan)
+03-3457-0972 or (INTL) 813-3457-0972 Fax: +03-3457-1259 or (INTL) 813-3457-1259DSP Hotline +03-3769-8735 or (INTL) 813-3769-8735 Fax: +03-3457-7071 or (INTL) 813-3457-7071DSP BBS via Nifty-Serve Type "Go TIASP"
❏ DocumentationWhen making suggestions or reporting errors in documentation, please include the following information that is on the title page: the full title of the book, the publication date, and the literature number.
Mail: Texas Instruments Incorporated Email: [email protected] Technical Documentation Services, MS 702 P.O. Box 1443
Houston, Texas 77251-1443
Read This First vii
This is a draft version printed from file: tutorialTOC.fm on 5/6/99
Contents
1 Code Composer Studio Overview . . . . . . . . . . . . . . . . . . . . . . . . . . . . . . . . . . . . . . . . . . . . .1-1This chapter provides an overview of the Code Composer Studio software development process, the components of Code Composer Studio, and the files and variables used by Code Composer Studio.1.1 Code Composer Studio Development . . . . . . . . . . . . . . . . . . . . . . . . . . . . . . . . . . . . . .1-21.2 Code Generation Tools . . . . . . . . . . . . . . . . . . . . . . . . . . . . . . . . . . . . . . . . . . . . . . . . .1-41.3 Code Composer Studio Integrated Development Environment . . . . . . . . . . . . . . . . . . .1-7
1.3.1 Program Code Editing Features. . . . . . . . . . . . . . . . . . . . . . . . . . . . . . . . . . .1-71.3.2 Application Building Features. . . . . . . . . . . . . . . . . . . . . . . . . . . . . . . . . . . . .1-81.3.3 Application Debugging Features . . . . . . . . . . . . . . . . . . . . . . . . . . . . . . . . . .1-8
1.4 DSP/BIOS Plug-ins. . . . . . . . . . . . . . . . . . . . . . . . . . . . . . . . . . . . . . . . . . . . . . . . . . . . .1-91.4.1 DSP/BIOS Configuration . . . . . . . . . . . . . . . . . . . . . . . . . . . . . . . . . . . . . . .1-101.4.2 DSP/BIOS API Modules . . . . . . . . . . . . . . . . . . . . . . . . . . . . . . . . . . . . . . . .1-11
1.5 Hardware Emulation and Real-Time Data Exchange. . . . . . . . . . . . . . . . . . . . . . . . . .1-131.6 Third-Party Plug-ins . . . . . . . . . . . . . . . . . . . . . . . . . . . . . . . . . . . . . . . . . . . . . . . . . . .1-141.7 Code Composer Studio Files and Variables. . . . . . . . . . . . . . . . . . . . . . . . . . . . . . . . .1-15
1.7.1 Installation Folders . . . . . . . . . . . . . . . . . . . . . . . . . . . . . . . . . . . . . . . . . . . .1-151.7.2 File Extensions . . . . . . . . . . . . . . . . . . . . . . . . . . . . . . . . . . . . . . . . . . . . . . .1-161.7.3 Environment Variables . . . . . . . . . . . . . . . . . . . . . . . . . . . . . . . . . . . . . . . . .1-171.7.4 Increasing DOS Environment Space . . . . . . . . . . . . . . . . . . . . . . . . . . . . . .1-17
2 Developing a Simple Program . . . . . . . . . . . . . . . . . . . . . . . . . . . . . . . . . . . . . . . . . . . . . . . .2-1This chapter introduces Code Composer Studio and shows the basic process used to create, build, debug, and test programs.2.1 Creating a New Project. . . . . . . . . . . . . . . . . . . . . . . . . . . . . . . . . . . . . . . . . . . . . . . . . .2-22.2 Adding Files to a Project. . . . . . . . . . . . . . . . . . . . . . . . . . . . . . . . . . . . . . . . . . . . . . . . .2-32.3 Reviewing the Code . . . . . . . . . . . . . . . . . . . . . . . . . . . . . . . . . . . . . . . . . . . . . . . . . . . .2-42.4 Building and Running the Program. . . . . . . . . . . . . . . . . . . . . . . . . . . . . . . . . . . . . . . . .2-62.5 Changing Program Options and Fixing Syntax Errors . . . . . . . . . . . . . . . . . . . . . . . . . .2-82.6 Using Breakpoints and the Watch Window . . . . . . . . . . . . . . . . . . . . . . . . . . . . . . . . .2-102.7 Using the Watch Window with Structures. . . . . . . . . . . . . . . . . . . . . . . . . . . . . . . . . . .2-122.8 Profiling Code Execution Time . . . . . . . . . . . . . . . . . . . . . . . . . . . . . . . . . . . . . . . . . . .2-132.9 Things to Try. . . . . . . . . . . . . . . . . . . . . . . . . . . . . . . . . . . . . . . . . . . . . . . . . . . . . . . . .2-152.10 Learning More . . . . . . . . . . . . . . . . . . . . . . . . . . . . . . . . . . . . . . . . . . . . . . . . . . . . . . .2-15
ix
Contents
3 Developing a DSP/BIOS Program . . . . . . . . . . . . . . . . . . . . . . . . . . . . . . . . . . . . . . . . . . . . . 3-1This chapter introduces DSP/BIOS and shows how to create, build, debug, and test programs that use DSP/BIOS.3.1 Creating a Configuration File . . . . . . . . . . . . . . . . . . . . . . . . . . . . . . . . . . . . . . . . . . . . 3-23.2 Adding DSP/BIOS Files to a Project . . . . . . . . . . . . . . . . . . . . . . . . . . . . . . . . . . . . . . . 3-43.3 Testing with Code Composer Studio. . . . . . . . . . . . . . . . . . . . . . . . . . . . . . . . . . . . . . . 3-63.4 Profiling DSP/BIOS Code Execution Time . . . . . . . . . . . . . . . . . . . . . . . . . . . . . . . . . . 3-83.5 Things to Try . . . . . . . . . . . . . . . . . . . . . . . . . . . . . . . . . . . . . . . . . . . . . . . . . . . . . . . . 3-103.6 Learning More . . . . . . . . . . . . . . . . . . . . . . . . . . . . . . . . . . . . . . . . . . . . . . . . . . . . . . . 3-10
4 Testing Algorithms and Data from a File . . . . . . . . . . . . . . . . . . . . . . . . . . . . . . . . . . . . . . . 4-1This chapter shows the process for creating and testing a simple algorithm and introduces addi-tional Code Composer Studio features.4.1 Opening and Examining the Project . . . . . . . . . . . . . . . . . . . . . . . . . . . . . . . . . . . . . . . 4-24.2 Reviewing the Source Code . . . . . . . . . . . . . . . . . . . . . . . . . . . . . . . . . . . . . . . . . . . . . 4-44.3 Adding a Probe Point for File I/O . . . . . . . . . . . . . . . . . . . . . . . . . . . . . . . . . . . . . . . . . 4-64.4 Displaying Graphs. . . . . . . . . . . . . . . . . . . . . . . . . . . . . . . . . . . . . . . . . . . . . . . . . . . . . 4-84.5 Animating the Program and Graphs . . . . . . . . . . . . . . . . . . . . . . . . . . . . . . . . . . . . . . . 4-94.6 Adjusting the Gain. . . . . . . . . . . . . . . . . . . . . . . . . . . . . . . . . . . . . . . . . . . . . . . . . . . . 4-104.7 Viewing Out-of-Scope Variables . . . . . . . . . . . . . . . . . . . . . . . . . . . . . . . . . . . . . . . . . 4-114.8 Using a GEL File . . . . . . . . . . . . . . . . . . . . . . . . . . . . . . . . . . . . . . . . . . . . . . . . . . . . . 4-134.9 Adjusting and Profiling the Processing Load. . . . . . . . . . . . . . . . . . . . . . . . . . . . . . . . 4-144.10 Things to Try . . . . . . . . . . . . . . . . . . . . . . . . . . . . . . . . . . . . . . . . . . . . . . . . . . . . . . . . 4-164.11 Learning More . . . . . . . . . . . . . . . . . . . . . . . . . . . . . . . . . . . . . . . . . . . . . . . . . . . . . . . 4-16
5 Debugging Program Behavior . . . . . . . . . . . . . . . . . . . . . . . . . . . . . . . . . . . . . . . . . . . . . . . 5-1This chapter introduces techniques for debugging a program and several DSP/BIOS plug-ins and modules.5.1 Opening and Examining the Project . . . . . . . . . . . . . . . . . . . . . . . . . . . . . . . . . . . . . . . 5-25.2 Reviewing the Source Code . . . . . . . . . . . . . . . . . . . . . . . . . . . . . . . . . . . . . . . . . . . . . 5-35.3 Modifying the Configuration File . . . . . . . . . . . . . . . . . . . . . . . . . . . . . . . . . . . . . . . . . . 5-65.4 Viewing Task Execution with the Execution Graph. . . . . . . . . . . . . . . . . . . . . . . . . . . 5-105.5 Changing and Viewing the Load . . . . . . . . . . . . . . . . . . . . . . . . . . . . . . . . . . . . . . . . . 5-125.6 Analyzing Task Statistics . . . . . . . . . . . . . . . . . . . . . . . . . . . . . . . . . . . . . . . . . . . . . . 5-155.7 Adding Explicit STS Instrumentation. . . . . . . . . . . . . . . . . . . . . . . . . . . . . . . . . . . . . . 5-175.8 Viewing Explicit Instrumentation . . . . . . . . . . . . . . . . . . . . . . . . . . . . . . . . . . . . . . . . . 5-185.9 Things to Try . . . . . . . . . . . . . . . . . . . . . . . . . . . . . . . . . . . . . . . . . . . . . . . . . . . . . . . . 5-205.10 Learning More . . . . . . . . . . . . . . . . . . . . . . . . . . . . . . . . . . . . . . . . . . . . . . . . . . . . . . . 5-20
6 Analyzing Real-Time Behavior . . . . . . . . . . . . . . . . . . . . . . . . . . . . . . . . . . . . . . . . . . . . . . . 6-1This chapter introduces techniques for analyzing and correcting real-time program behavior.6.1 Opening and Examining the Project . . . . . . . . . . . . . . . . . . . . . . . . . . . . . . . . . . . . . . . 6-26.2 Modifying the Configuration File . . . . . . . . . . . . . . . . . . . . . . . . . . . . . . . . . . . . . . . . . . 6-36.3 Reviewing the Source Code Changes . . . . . . . . . . . . . . . . . . . . . . . . . . . . . . . . . . . . . 6-56.4 Using the RTDX Control to Change the Load at Run Time . . . . . . . . . . . . . . . . . . . . . 6-76.5 Modifying Software Interrupt Priorities . . . . . . . . . . . . . . . . . . . . . . . . . . . . . . . . . . . . 6-11
x
Contents
6.6 Things to Try. . . . . . . . . . . . . . . . . . . . . . . . . . . . . . . . . . . . . . . . . . . . . . . . . . . . . . . . .6-126.7 Learning More . . . . . . . . . . . . . . . . . . . . . . . . . . . . . . . . . . . . . . . . . . . . . . . . . . . . . . .6-12
7 Connecting to I/O Devices . . . . . . . . . . . . . . . . . . . . . . . . . . . . . . . . . . . . . . . . . . . . . . . . . . .7-1This chapter introduces RTDX and DSP/BIOS techniques for implementing I/O.7.1 Opening and Examining the Project . . . . . . . . . . . . . . . . . . . . . . . . . . . . . . . . . . . . . . . .7-27.2 Reviewing the C Source Code . . . . . . . . . . . . . . . . . . . . . . . . . . . . . . . . . . . . . . . . . . . .7-37.3 Reviewing the Signalprog Application . . . . . . . . . . . . . . . . . . . . . . . . . . . . . . . . . . . . . .7-67.4 Running the Application . . . . . . . . . . . . . . . . . . . . . . . . . . . . . . . . . . . . . . . . . . . . . . . . .7-77.5 Modifying the Source Code to Use Host Channels and Pipes . . . . . . . . . . . . . . . . . . .7-107.6 More about Host Channels and Pipes . . . . . . . . . . . . . . . . . . . . . . . . . . . . . . . . . . . . .7-127.7 Adding Channels and an SWI to the Configuration File . . . . . . . . . . . . . . . . . . . . . . . .7-137.8 Running the Modified Program. . . . . . . . . . . . . . . . . . . . . . . . . . . . . . . . . . . . . . . . . . .7-177.9 Learning More . . . . . . . . . . . . . . . . . . . . . . . . . . . . . . . . . . . . . . . . . . . . . . . . . . . . . . .7-17
Contents xi
Chapter 1
Code Composer Studio Overview
This chapter provides an overview of the Code Composer Studio softwaredevelopment process, the components of Code Composer Studio, and thefiles and variables used by Code Composer Studio.
Code Composer Studio speeds and enhances the development process forprogrammers who create and test real-time, embedded signal processingapplications. It provides tools for configuring, building, debugging, tracing,and analyzing programs.
1.1 Code Composer Studio Development . . . . . . . . . . . . . . . . . . . . . . . . 1–2
1.2 Code Generation Tools . . . . . . . . . . . . . . . . . . . . . . . . . . . . . . . . . . . . 1–4
1.3 Code Composer Studio Integrated Development Environment . . . 1–7
1.4 DSP/BIOS Plug-ins . . . . . . . . . . . . . . . . . . . . . . . . . . . . . . . . . . . . . . . 1–9
1.5 Hardware Emulation and Real-Time Data Exchange . . . . . . . . . . . 1–13
1.6 Third-Party Plug-ins . . . . . . . . . . . . . . . . . . . . . . . . . . . . . . . . . . . . . 1–14
1.7 Code Composer Studio Files and Variables . . . . . . . . . . . . . . . . . . 1–15
Topic Page
1-1
Code Composer Studio Development
1.1 Code Composer Studio Development
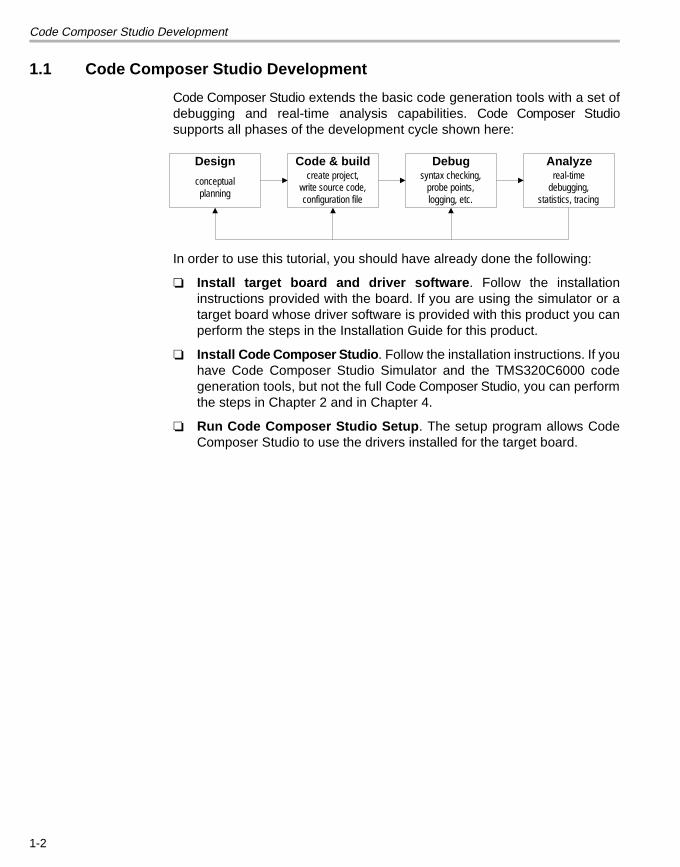
Code Composer Studio extends the basic code generation tools with a set ofdebugging and real-time analysis capabilities. Code Composer Studiosupports all phases of the development cycle shown here:
In order to use this tutorial, you should have already done the following:
❏ Install target board and driver software. Follow the installationinstructions provided with the board. If you are using the simulator or atarget board whose driver software is provided with this product you canperform the steps in the Installation Guide for this product.
❏ Install Code Composer Studio. Follow the installation instructions. If youhave Code Composer Studio Simulator and the TMS320C6000 codegeneration tools, but not the full Code Composer Studio, you can performthe steps in Chapter 2 and in Chapter 4.
❏ Run Code Composer Studio Setup. The setup program allows CodeComposer Studio to use the drivers installed for the target board.
Design Debug AnalyzeCode & build
conceptualplanning
create project,write source code,configuration file
syntax checking,probe points,logging, etc.
real-timedebugging,
statistics, tracing
1-2
Code Composer Studio Development
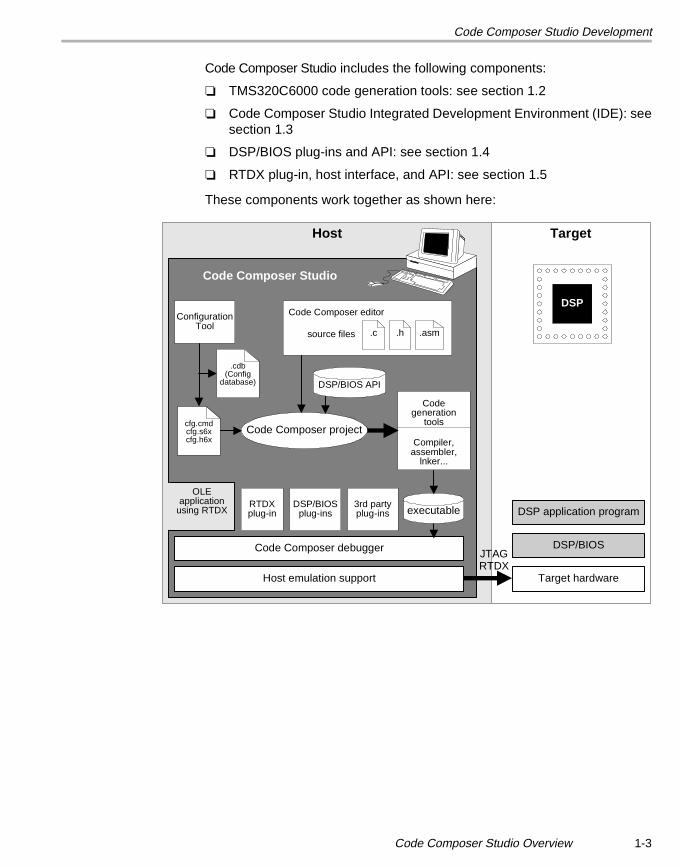
Code Composer Studio includes the following components:
❏ TMS320C6000 code generation tools: see section 1.2
❏ Code Composer Studio Integrated Development Environment (IDE): seesection 1.3
❏ DSP/BIOS plug-ins and API: see section 1.4
❏ RTDX plug-in, host interface, and API: see section 1.5
These components work together as shown here:
TargetHost
Target hardware
DSP application program
DSP
Code Composer Studio
JTAGRTDX
Code Composer debugger
DSP/BIOSplug-ins
RTDXplug-in
3rd partyplug-ins
cfg.cmdcfg.s6xcfg.h6x
.cdb(Config
database)
Compiler,assembler,
lnker...
Codegeneration
toolsCode Composer project
.asm.h.c
Code Composer editor
source files
DSP/BIOS API
OLEapplication
using RTDX
ConfigurationTool
executable
DSP/BIOS
Host emulation support
Code Composer Studio Overview 1-3
Code Generation Tools
1.2 Code Generation Tools
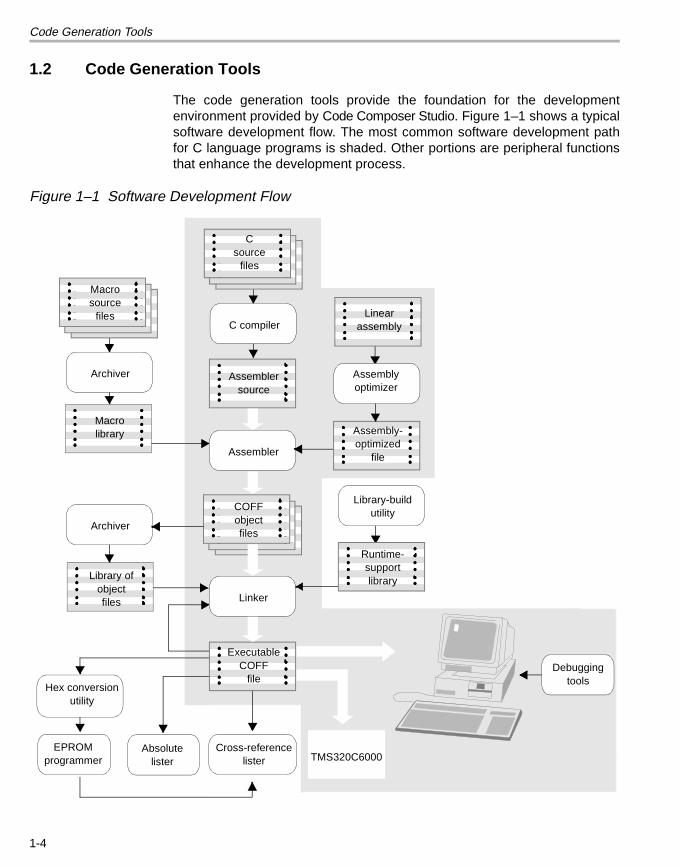
The code generation tools provide the foundation for the developmentenvironment provided by Code Composer Studio. Figure 1–1 shows a typicalsoftware development flow. The most common software development pathfor C language programs is shaded. Other portions are peripheral functionsthat enhance the development process.
Figure 1–1 Software Development Flow
Assembler
Linker
Macrolibrary
Library of objectfiles
EPROMprogrammer
Assemblersource
COFFobjectfiles
Archiver
Macro source
files
Archiver
C compiler
Library-buildutility
Debugging tools
Runtime-supportlibrary
TMS320C6000
Csource
files
Assembly-optimized
file
Assembly optimizer
Linear assembly
Hex conversion utility
Cross-referencelister
ExecutableCOFF
file
Absolutelister
1-4
Code Generation Tools
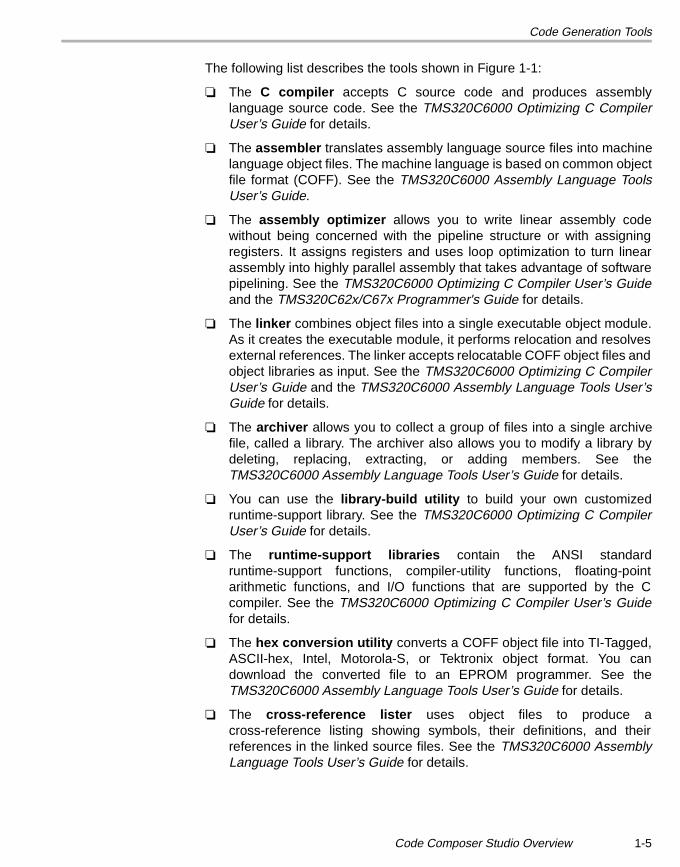
The following list describes the tools shown in Figure 1-1:
❏ The C compiler accepts C source code and produces assemblylanguage source code. See the TMS320C6000 Optimizing C CompilerUser’s Guide for details.
❏ The assembler translates assembly language source files into machinelanguage object files. The machine language is based on common objectfile format (COFF). See the TMS320C6000 Assembly Language ToolsUser’s Guide.
❏ The assembly optimizer allows you to write linear assembly codewithout being concerned with the pipeline structure or with assigningregisters. It assigns registers and uses loop optimization to turn linearassembly into highly parallel assembly that takes advantage of softwarepipelining. See the TMS320C6000 Optimizing C Compiler User’s Guideand the TMS320C62x/C67x Programmer's Guide for details.
❏ The linker combines object files into a single executable object module.As it creates the executable module, it performs relocation and resolvesexternal references. The linker accepts relocatable COFF object files andobject libraries as input. See the TMS320C6000 Optimizing C CompilerUser’s Guide and the TMS320C6000 Assembly Language Tools User’sGuide for details.
❏ The archiver allows you to collect a group of files into a single archivefile, called a library. The archiver also allows you to modify a library bydeleting, replacing, extracting, or adding members. See theTMS320C6000 Assembly Language Tools User’s Guide for details.
❏ You can use the library-build utility to build your own customizedruntime-support library. See the TMS320C6000 Optimizing C CompilerUser’s Guide for details.
❏ The runtime-support libraries contain the ANSI standardruntime-support functions, compiler-utility functions, floating-pointarithmetic functions, and I/O functions that are supported by the Ccompiler. See the TMS320C6000 Optimizing C Compiler User’s Guidefor details.
❏ The hex conversion utility converts a COFF object file into TI-Tagged,ASCII-hex, Intel, Motorola-S, or Tektronix object format. You candownload the converted file to an EPROM programmer. See theTMS320C6000 Assembly Language Tools User’s Guide for details.
❏ The cross-reference lister uses object files to produce across-reference listing showing symbols, their definitions, and theirreferences in the linked source files. See the TMS320C6000 AssemblyLanguage Tools User’s Guide for details.
Code Composer Studio Overview 1-5
Code Generation Tools
❏ The absolute lister accepts linked object files as input and creates .absfiles as output. You assemble the .abs files to produce a listing thatcontains absolute addresses rather than relative addresses. Without theabsolute lister, producing such a listing would be tedious and requiremany manual operations.
1-6
Code Composer Studio Integrated Development Environment
1.3 Code Composer Studio Integrated Development Environment
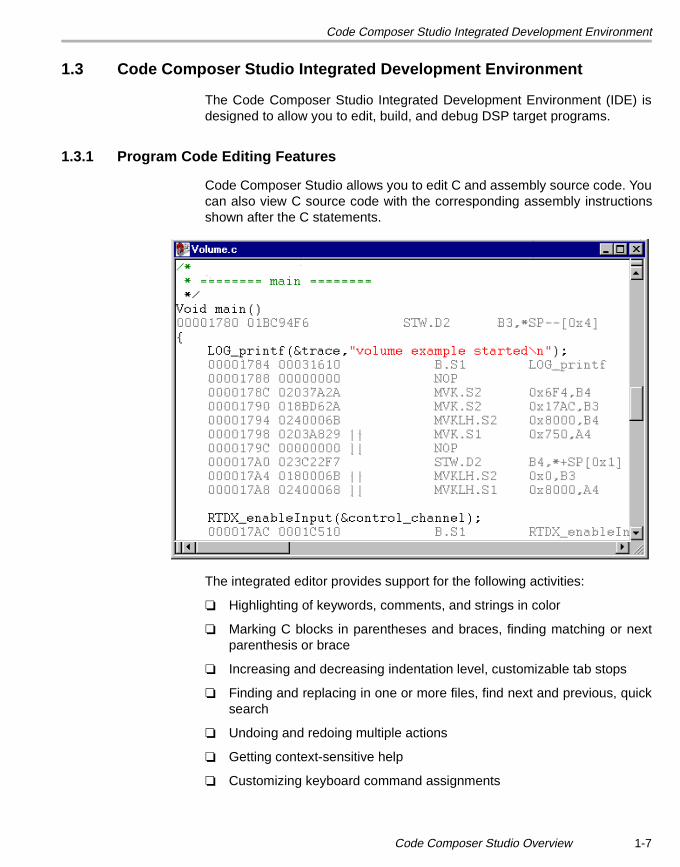
The Code Composer Studio Integrated Development Environment (IDE) isdesigned to allow you to edit, build, and debug DSP target programs.
1.3.1 Program Code Editing Features
Code Composer Studio allows you to edit C and assembly source code. Youcan also view C source code with the corresponding assembly instructionsshown after the C statements.
The integrated editor provides support for the following activities:
❏ Highlighting of keywords, comments, and strings in color
❏ Marking C blocks in parentheses and braces, finding matching or nextparenthesis or brace
❏ Increasing and decreasing indentation level, customizable tab stops
❏ Finding and replacing in one or more files, find next and previous, quicksearch
❏ Undoing and redoing multiple actions
❏ Getting context-sensitive help
❏ Customizing keyboard command assignments
Code Composer Studio Overview 1-7

Code Composer Studio Integrated Development Environment
1.3.2 Application Building Features
Within Code Composer Studio, you createan application by adding files to a project.The project file is used to build theapplication. Files in a project can includeC source files, assembly source files,object files, libraries, linker commandfiles, and include files.
You can use a window to specify theoptions you want to use when compiling,assembling, and linking a project.
Using a project, Code Composer Studiocan create a full build or an incrementalbuild and can compile individual files. Itcan also scan files to build an include filedependency tree for the entire project.
Code Composer Studio’s build facilities can be used as an alternative totraditional makefiles. If you want to continue using traditional makefiles foryour project, Code Composer Studio also permits that.
1.3.3 Application Debugging Features
Code Composer Studio provides support for the following debuggingactivities:
❏ Setting breakpoints with a number of stepping options
❏ Automatically updating windows at breakpoints
❏ Watching variables
❏ Viewing and editing memory and registers
❏ Viewing the call stack
❏ Using Probe Point tools to stream data to and from the target and togather memory snapshots
❏ Graphing signals on the target
❏ Profiling execution statistics
❏ Viewing disassembled and C instructions executing on target
Code Composer Studio also provides the GEL language, which allowsdevelopers to add functions to the Code Composer Studio menus forcommonly performed tasks.
1-8
DSP/BIOS Plug-ins
1.4 DSP/BIOS Plug-ins
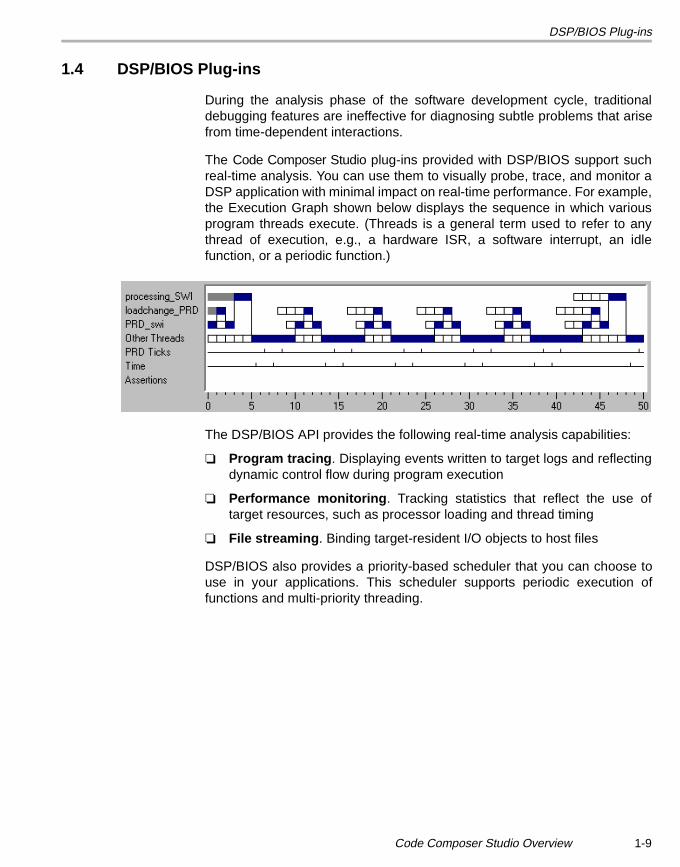
During the analysis phase of the software development cycle, traditionaldebugging features are ineffective for diagnosing subtle problems that arisefrom time-dependent interactions.
The Code Composer Studio plug-ins provided with DSP/BIOS support suchreal-time analysis. You can use them to visually probe, trace, and monitor aDSP application with minimal impact on real-time performance. For example,the Execution Graph shown below displays the sequence in which variousprogram threads execute. (Threads is a general term used to refer to anythread of execution, e.g., a hardware ISR, a software interrupt, an idlefunction, or a periodic function.)
The DSP/BIOS API provides the following real-time analysis capabilities:
❏ Program tracing. Displaying events written to target logs and reflectingdynamic control flow during program execution
❏ Performance monitoring. Tracking statistics that reflect the use oftarget resources, such as processor loading and thread timing
❏ File streaming. Binding target-resident I/O objects to host files
DSP/BIOS also provides a priority-based scheduler that you can choose touse in your applications. This scheduler supports periodic execution offunctions and multi-priority threading.
Code Composer Studio Overview 1-9
DSP/BIOS Plug-ins
1.4.1 DSP/BIOS Configuration
You can create configuration files in the Code Composer Studio environmentthat define objects used by the DSP/BIOS API. This file also simplifiesmemory mapping and hardware ISR vector mapping, so you may want to useit even if you are not using the DSP/BIOS API.
A configuration file has two roles:
❏ It lets you set global run-time parameters.
❏ It serves as a visual editor for creating and setting properties for run-timeobjects that are used by the target application’s DSP/BIOS API calls.These objects include software interrupts, I/O pipes, and event logs.
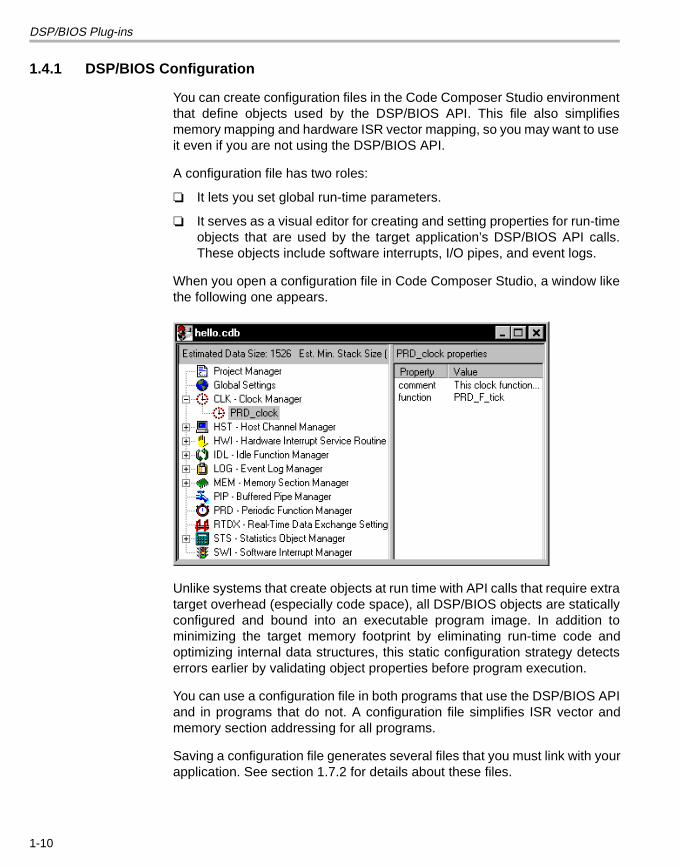
When you open a configuration file in Code Composer Studio, a window likethe following one appears.
Unlike systems that create objects at run time with API calls that require extratarget overhead (especially code space), all DSP/BIOS objects are staticallyconfigured and bound into an executable program image. In addition tominimizing the target memory footprint by eliminating run-time code andoptimizing internal data structures, this static configuration strategy detectserrors earlier by validating object properties before program execution.
You can use a configuration file in both programs that use the DSP/BIOS APIand in programs that do not. A configuration file simplifies ISR vector andmemory section addressing for all programs.
Saving a configuration file generates several files that you must link with yourapplication. See section 1.7.2 for details about these files.
1-10
DSP/BIOS Plug-ins
1.4.2 DSP/BIOS API Modules
Unlike traditional debugging, which is external to the executing program, theDSP/BIOS features require the target program to be linked with certainDSP/BIOS API modules.
A program can use one or more DSP/BIOS modules by defining DSP/BIOSobjects in a configuration file, declaring these objects as external, and callingDSP/BIOS API functions in the source code.
Each module has a separate C header file or assembly macro file you caninclude in your program. This allows you to minimize the program size in aprogram that uses some, but not all, DSP/BIOS modules.
The DSP/BIOS API calls (in C and assembly) are optimized to use minimalresources on your target DSP.
The DSP/BIOS API is divided into the following modules. All the API callswithin a module begin with the codes shown here.
❏ CLK. The on-chip timer module controls the on-chip timer and providesa logical 32-bit real-time clock with a high-resolution interrupt rate as fineas the resolution of the on-chip timer register (4 instruction cycles) and alow-resolution interrupt rate as long as several milliseconds or longer.
❏ HST. The host input/output module manages host channel objects, whichallow an application to stream data between the target and the host. Hostchannels are statically configured for input or output.
❏ HWI. The hardware interrupt module provides support for hardwareinterrupt routines. In a configuration file, you can assign functions that runwhen hardware interrupts occur.
❏ IDL. The idle function module manages idle functions, which are run in aloop when the target program has no higher priority functions to perform
❏ LOG. The log module manages LOG objects, which capture events inreal time while the target program executes. You can use system logs ordefine your own logs. You can view messages in these logs in real timewith Code Composer Studio.
❏ MEM. The memory module allows you to specify the memory segmentsrequired to locate the various code and data sections of a target program
❏ PIP. The data pipe module manages data pipes, which are used to bufferstreams of input and output data. These data pipes provide a consistentsoftware data structure you can use to drive I/O between the DSP deviceand other real-time peripheral devices.
Code Composer Studio Overview 1-11
DSP/BIOS Plug-ins
❏ PRD. The periodic function module manages periodic objects, whichtrigger cyclic execution of program functions. The execution rate of theseobjects can be controlled by the clock rate maintained by the CLK moduleor by regular calls to PRD_tick, usually in response to hardware interruptsfrom peripherals that produce or consume streams of data.
❏ RTDX. Real-Time Data Exchange permits the data to be exchangedbetween the host and target in real time, and then to be analyzed anddisplayed on the host using any OLE automation client. See section 1.5for more information.
❏ STS. The statistics module manages statistics accumulators, which storekey statistics while a program runs. You can view these statistics in realtime with Code Composer Studio.
❏ SWI. The software interrupt module manages software interrupts, whichare patterned after hardware interrupt service routines (ISRs). When atarget program posts an SWI object with an API call, the SWI moduleschedules execution of the corresponding function. Software interruptscan have up to 15 priority levels; all levels are below the priority level ofhardware ISRs.
❏ TRC. The trace module manages a set of trace control bits which controlthe real-time capture of program information through event logs andstatistics accumulators
For details about each module, see the online help or the TMS320C6000DSP/BIOS User’s Guide.
1-12
Hardware Emulation and Real-Time Data Exchange
1.5 Hardware Emulation and Real-Time Data Exchange
TI DSPs provide on-chip emulation support that enables Code ComposerStudio to control program execution and monitor real-time program activity.Communication with this on-chip emulation support occurs via an enhancedJTAG link. This link is a low-intrusion way of connecting into any DSP system.An emulator interface, like the TI XDS510, provides the host side of the JTAGconnection. Evaluation boards like the C6x EVM provide an on-board JTAGemulator interface for convenience.
The on-chip emulation hardware provides a variety of capabilities:
❏ Starting, stopping, or resetting the DSP
❏ Loading code or data into the DSP
❏ Examining the registers or memory of the DSP
❏ Hardware instruction or data-dependent breakpoints
❏ A variety of counting capabilities including cycle-accurate profiling
❏ Real-time data exchange (RTDX) between the host and the DSP
Code Composer Studio provides built-in support for these on-chipcapabilities. In addition, RTDX capability is exposed through host and DSPAPIs, allowing for bi-directional real-time communications between the hostand DSP.
RTDX provides real-time, continuous visibility into the way DSP applicationsoperate in the real world. RTDX allows system developers to transfer databetween a host computer and DSP devices without stopping their targetapplication. The data can be analyzed and visualized on the host using anyOLE automation client. This shortens development time by giving designersa realistic representation of the way their systems actually operate.
Code Composer Studio Overview 1-13
Third-Party Plug-ins
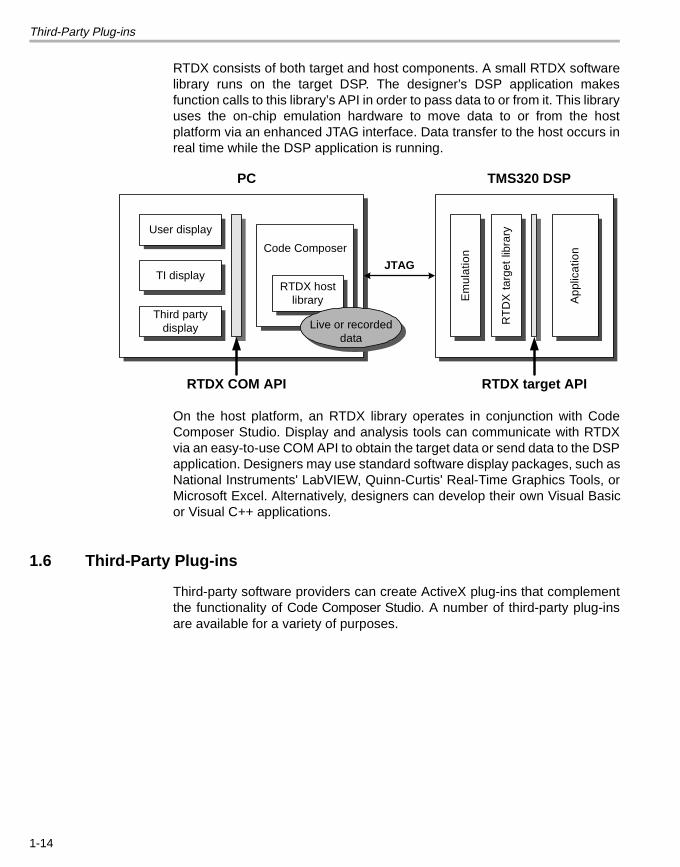
RTDX consists of both target and host components. A small RTDX softwarelibrary runs on the target DSP. The designer’s DSP application makesfunction calls to this library’s API in order to pass data to or from it. This libraryuses the on-chip emulation hardware to move data to or from the hostplatform via an enhanced JTAG interface. Data transfer to the host occurs inreal time while the DSP application is running.
On the host platform, an RTDX library operates in conjunction with CodeComposer Studio. Display and analysis tools can communicate with RTDXvia an easy-to-use COM API to obtain the target data or send data to the DSPapplication. Designers may use standard software display packages, such asNational Instruments' LabVIEW, Quinn-Curtis' Real-Time Graphics Tools, orMicrosoft Excel. Alternatively, designers can develop their own Visual Basicor Visual C++ applications.
1.6 Third-Party Plug-ins
Third-party software providers can create ActiveX plug-ins that complementthe functionality of Code Composer Studio. A number of third-party plug-insare available for a variety of purposes.
User display
TI display
Third partydisplay
Code Composer
RTDX hostlibrary E
mul
atio
n
RT
DX
tar
get
libra
ry
App
licat
ion
PC TMS320 DSP
RTDX COM API RTDX target API
Live or recordeddata
JTAG
1-14
Code Composer Studio Files and Variables
1.7 Code Composer Studio Files and Variables
The following sections provide an overview of the folders that contain theCode Composer Studio files, the types of files you use, and the environmentvariables used by Code Composer Studio.
1.7.1 Installation Folders
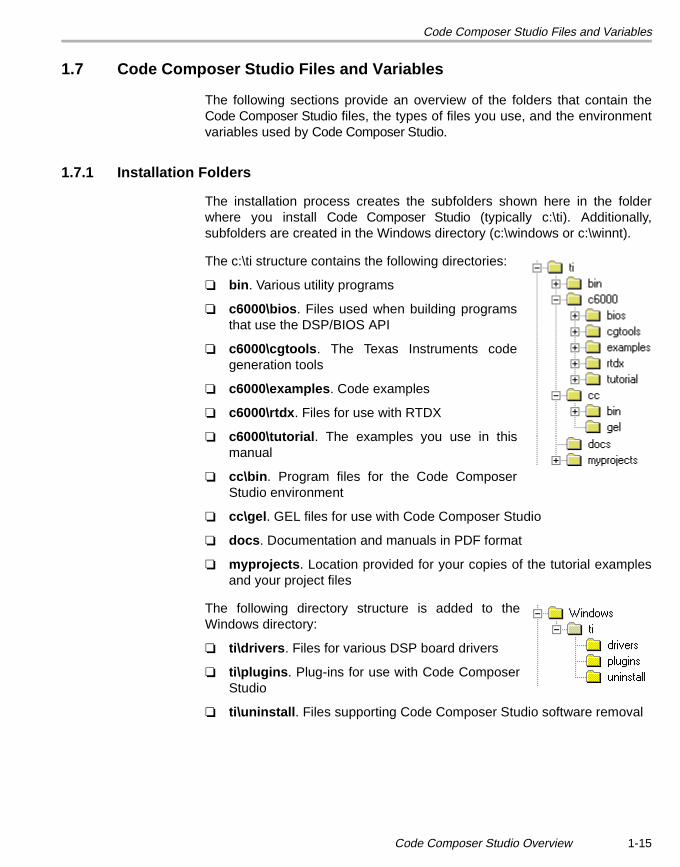
The installation process creates the subfolders shown here in the folderwhere you install Code Composer Studio (typically c:\ti). Additionally,subfolders are created in the Windows directory (c:\windows or c:\winnt).
The c:\ti structure contains the following directories:
❏ bin. Various utility programs
❏ c6000\bios. Files used when building programsthat use the DSP/BIOS API
❏ c6000\cgtools. The Texas Instruments codegeneration tools
❏ c6000\examples. Code examples
❏ c6000\rtdx. Files for use with RTDX
❏ c6000\tutorial. The examples you use in thismanual
❏ cc\bin. Program files for the Code ComposerStudio environment
❏ cc\gel. GEL files for use with Code Composer Studio
❏ docs. Documentation and manuals in PDF format
❏ myprojects. Location provided for your copies of the tutorial examplesand your project files
The following directory structure is added to theWindows directory:
❏ ti\drivers. Files for various DSP board drivers
❏ ti\plugins. Plug-ins for use with Code ComposerStudio
❏ ti\uninstall. Files supporting Code Composer Studio software removal
Code Composer Studio Overview 1-15
Code Composer Studio Files and Variables
1.7.2 File Extensions
While using Code Composer Studio, you work with files that have the followingfile-naming conventions:
❏ project.mak. Project file used by Code Composer Studio to define aproject and build a program
❏ program.c. C program source file(s)
❏ program.asm. Assembly program source file(s)
❏ filename.h. Header files for C programs, including header files forDSP/BIOS API modules
❏ filename.lib. Library files
❏ project.cmd. Linker command files
❏ program.obj. Object files compiled or assembled from your source files
❏ program.out. An executable program for the target (fully compiled,assembled, and linked). You can load and run this program with CodeComposer Studio.
❏ project.wks. Workspace file used by Code Composer Studio to storeinformation about your environment settings
❏ program.cdb. Configuration database file created within Code ComposerStudio. This file is required for applications that use the DSP/BIOS API,and is optional for other applications. The following files are alsogenerated when you save a configuration file:
■ programcfg.cmd. Linker command file■ programcfg.h62. Header file■ programcfg.s62. Assembly source file
Although these files have extensions of .s62 and .h62, they can also beused with the TMS320C6701. DSP/BIOS does not need to use thefloating-point instructions supported by the TMS320C6701, thereforeonly one version of the software is required to support both DSPs.
1-16
Code Composer Studio Files and Variables
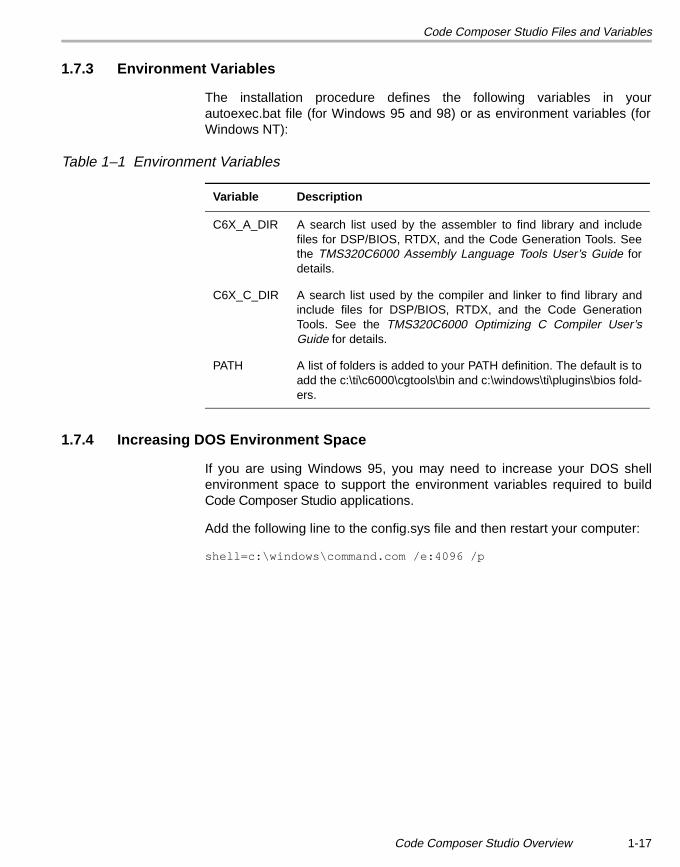
1.7.3 Environment Variables
The installation procedure defines the following variables in yourautoexec.bat file (for Windows 95 and 98) or as environment variables (forWindows NT):
Table 1–1 Environment Variables
1.7.4 Increasing DOS Environment Space
If you are using Windows 95, you may need to increase your DOS shellenvironment space to support the environment variables required to buildCode Composer Studio applications.
Add the following line to the config.sys file and then restart your computer:
shell=c:\windows\command.com /e:4096 /p
Variable Description
C6X_A_DIR A search list used by the assembler to find library and includefiles for DSP/BIOS, RTDX, and the Code Generation Tools. Seethe TMS320C6000 Assembly Language Tools User’s Guide fordetails.
C6X_C_DIR A search list used by the compiler and linker to find library andinclude files for DSP/BIOS, RTDX, and the Code GenerationTools. See the TMS320C6000 Optimizing C Compiler User’sGuide for details.
PATH A list of folders is added to your PATH definition. The default is toadd the c:\ti\c6000\cgtools\bin and c:\windows\ti\plugins\bios fold-ers.
Code Composer Studio Overview 1-17
Chapter 2
Developing a Simple Program
This chapter introduces Code Composer Studio and shows the basic processused to create, build, debug, and test programs.
In this chapter, you create and test a simple program that displays a helloworld message.
This tutorial introduces you to some of the key features of Code ComposerStudio. The intention is not to provide an exhaustive description of everyfeature. Instead, the objective is to prepare you to begin DSP softwaredevelopment with Code Composer Studio.
In order to use this tutorial, you should have already installed CodeComposer Studio according to the installation instructions. It is recommendedthat you use Code Composer Studio with a target board rather than with thesimulator. If you have Code Composer and the Code Generation Tools, butnot Code Composer Studio, or if you are using the simulator, you can performthe steps in Chapter 2 and Chapter 4 only.
2.1 Creating a New Project . . . . . . . . . . . . . . . . . . . . . . . . . . . . . . . . . . . . 2–2
2.2 Adding Files to a Project . . . . . . . . . . . . . . . . . . . . . . . . . . . . . . . . . . 2–3
2.3 Reviewing the Code . . . . . . . . . . . . . . . . . . . . . . . . . . . . . . . . . . . . . . 2–4
2.4 Building and Running the Program . . . . . . . . . . . . . . . . . . . . . . . . . . 2–6
2.5 Changing Program Options and Fixing Syntax Errors . . . . . . . . . . 2–8
2.6 Using Breakpoints and the Watch Window. . . . . . . . . . . . . . . . . . . 2–10
2.7 Using the Watch Window with Structures. . . . . . . . . . . . . . . . . . . . 2–12
2.8 Profiling Code Execution Time . . . . . . . . . . . . . . . . . . . . . . . . . . . . 2–13
2.9 Things to Try . . . . . . . . . . . . . . . . . . . . . . . . . . . . . . . . . . . . . . . . . . . 2–15
2.10 Learning More . . . . . . . . . . . . . . . . . . . . . . . . . . . . . . . . . . . . . . . . . . 2–15
Topic Page
2-1
Creating a New Project
2.1 Creating a New Project
You begin by creating a project with Code Composer Studio and addingsource code files and libraries to that project. In this example, you usestandard C library functions to display a hello world message.
1) If you installed Code Composer Studio in c:\ti, create a folder calledhello1 in the c:\ti\myprojects folder. (If you installed elsewhere, create afolder within the myprojects folder in the location where you installed.)
2) Copy all files from the c:\ti\c6000\tutorial\hello1 folder to this new folder.
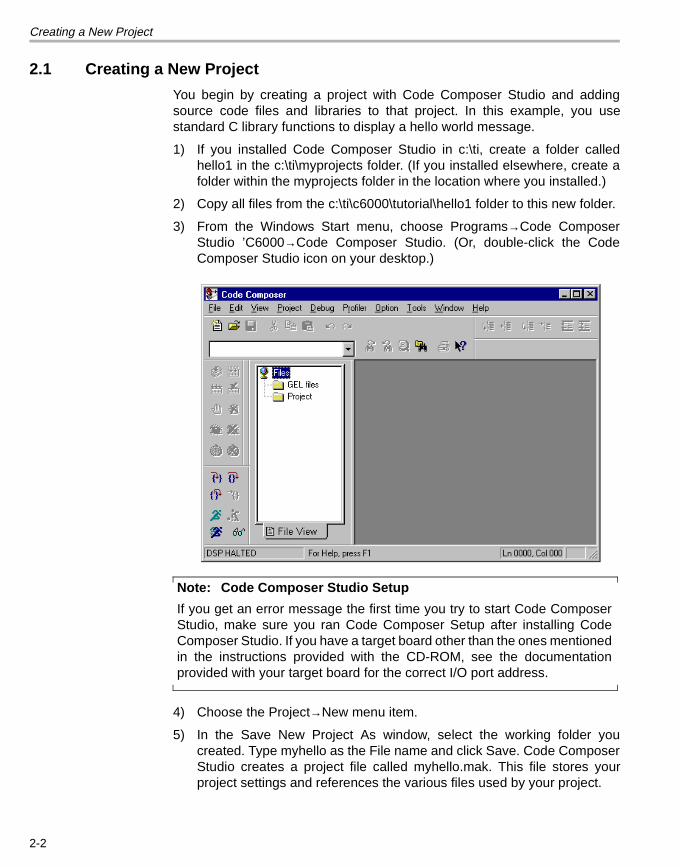
3) From the Windows Start menu, choose Programs→Code ComposerStudio ’C6000→Code Composer Studio. (Or, double-click the CodeComposer Studio icon on your desktop.)
Note: Code Composer Studio Setup
If you get an error message the first time you try to start Code ComposerStudio, make sure you ran Code Composer Setup after installing CodeComposer Studio. If you have a target board other than the ones mentionedin the instructions provided with the CD-ROM, see the documentationprovided with your target board for the correct I/O port address.
4) Choose the Project→New menu item.
5) In the Save New Project As window, select the working folder youcreated. Type myhello as the File name and click Save. Code ComposerStudio creates a project file called myhello.mak. This file stores yourproject settings and references the various files used by your project.
2-2
Adding Files to a Project
2.2 Adding Files to a Project
1) Choose Project→Add Files to Project. Select hello.c and click Open.
2) Choose Project→Add Files to Project. Select vectors.asm and clickOpen. This file contains assembly instructions needed to set the RESETinterrupt service fetch packets (ISFPs) to branch to the program’s C entrypoint, c_int00. (For more complex programs, you can define additionalinterrupt vectors in vectors.asm, or you can use DSP/BIOS as shown insection 3.1 to define all the interrupt vectors automatically.)
3) Choose Project→Add Files to Project. Select Linker Command File(*.cmd) in the Files of type box. Select hello.cmd and click Open. This filemaps sections to memory.
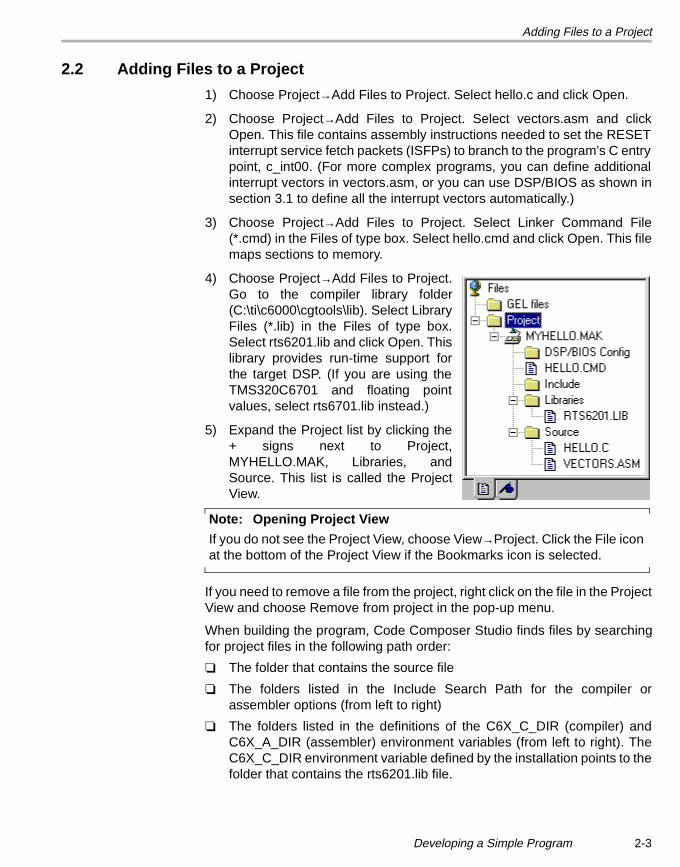
4) Choose Project→Add Files to Project.Go to the compiler library folder(C:\ti\c6000\cgtools\lib). Select LibraryFiles (*.lib) in the Files of type box.Select rts6201.lib and click Open. Thislibrary provides run-time support forthe target DSP. (If you are using theTMS320C6701 and floating pointvalues, select rts6701.lib instead.)
5) Expand the Project list by clicking the+ signs next to Project,MYHELLO.MAK, Libraries, andSource. This list is called the ProjectView.
Note: Opening Project View
If you do not see the Project View, choose View→Project. Click the File iconat the bottom of the Project View if the Bookmarks icon is selected.
If you need to remove a file from the project, right click on the file in the ProjectView and choose Remove from project in the pop-up menu.
When building the program, Code Composer Studio finds files by searchingfor project files in the following path order:
❏ The folder that contains the source file
❏ The folders listed in the Include Search Path for the compiler orassembler options (from left to right)
❏ The folders listed in the definitions of the C6X_C_DIR (compiler) andC6X_A_DIR (assembler) environment variables (from left to right). TheC6X_C_DIR environment variable defined by the installation points to thefolder that contains the rts6201.lib file.
Developing a Simple Program 2-3
Reviewing the Code
2.3 Reviewing the Code
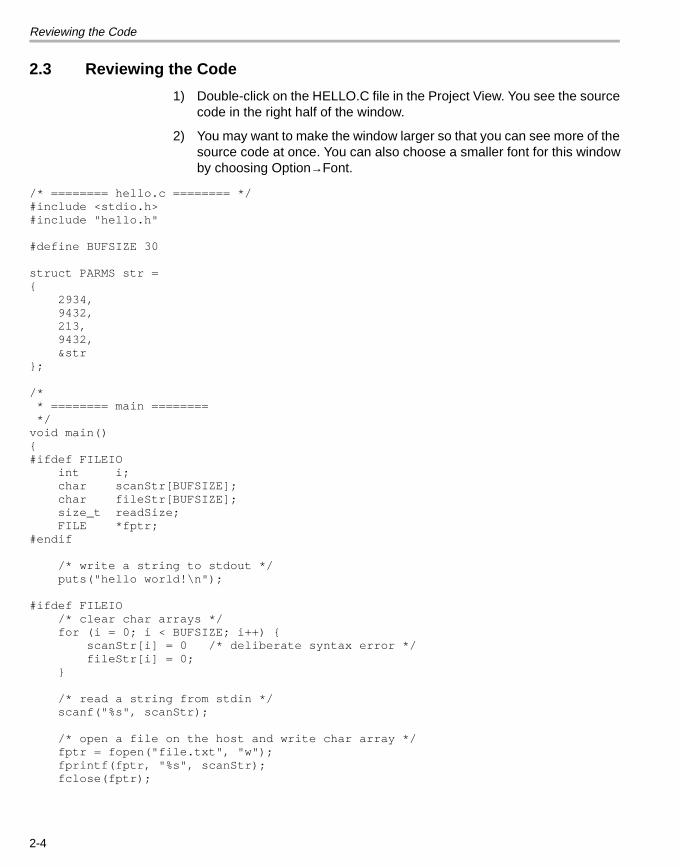
1) Double-click on the HELLO.C file in the Project View. You see the sourcecode in the right half of the window.
2) You may want to make the window larger so that you can see more of thesource code at once. You can also choose a smaller font for this windowby choosing Option→Font.
/* ======== hello.c ======== */#include <stdio.h>#include "hello.h"
#define BUFSIZE 30
struct PARMS str = { 2934, 9432, 213, 9432, &str };
/* * ======== main ======== */void main(){#ifdef FILEIO int i; char scanStr[BUFSIZE]; char fileStr[BUFSIZE]; size_t readSize; FILE *fptr;#endif
/* write a string to stdout */ puts("hello world!\n");
#ifdef FILEIO /* clear char arrays */ for (i = 0; i < BUFSIZE; i++) { scanStr[i] = 0 /* deliberate syntax error */ fileStr[i] = 0; }
/* read a string from stdin */ scanf("%s", scanStr);
/* open a file on the host and write char array */ fptr = fopen("file.txt", "w"); fprintf(fptr, "%s", scanStr); fclose(fptr);
2-4
Reviewing the Code
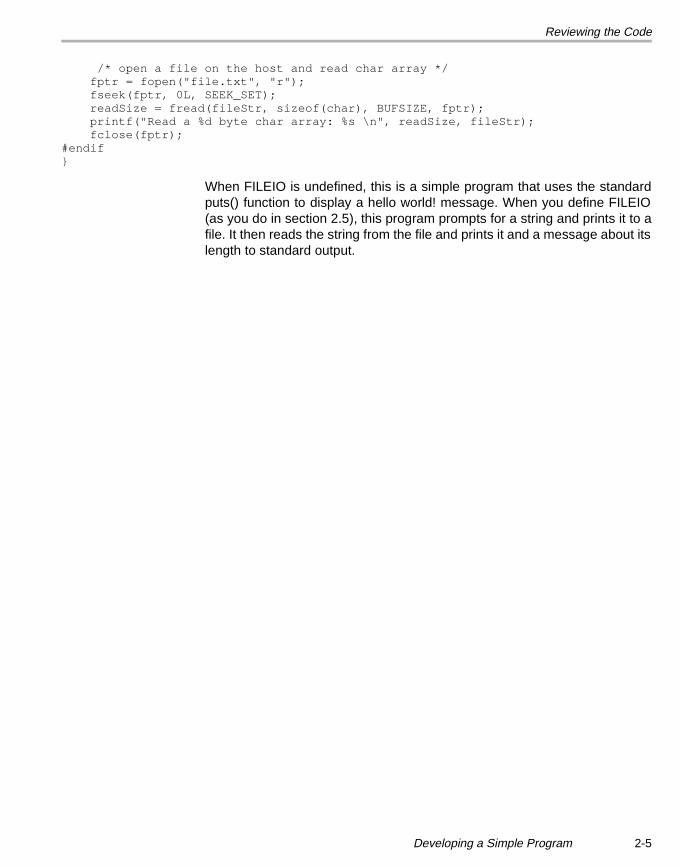
/* open a file on the host and read char array */ fptr = fopen("file.txt", "r"); fseek(fptr, 0L, SEEK_SET); readSize = fread(fileStr, sizeof(char), BUFSIZE, fptr); printf("Read a %d byte char array: %s \n", readSize, fileStr); fclose(fptr);#endif}
When FILEIO is undefined, this is a simple program that uses the standardputs() function to display a hello world! message. When you define FILEIO(as you do in section 2.5), this program prompts for a string and prints it to afile. It then reads the string from the file and prints it and a message about itslength to standard output.
Developing a Simple Program 2-5
Building and Running the Program
2.4 Building and Running the Program
Code Composer Studio automatically saves changes to the project setup asyou make them. In case you exited from Code Composer Studio after theprevious section, you can return to the point where you stopped working byrestarting Code Composer Studio and using Project→Open.
Note: Resetting the Target DSP
If you can start Code Composer Studio the first time, but a subsequent timeyou get an error message that says it cannot initialize the target DSP,choose the Debug→Reset DSP menu item. If this does not correct theproblem, you may need to run a reset utility provided with your target board.
1) Choose Project→Rebuild All or click the (Rebuild All) toolbar button.Code Composer Studio recompiles, reassembles, and relinks all the filesin the project. Messages about this process are shown in a frame at thebottom of the window.
2) Choose File→Load Program. Select the program you just rebuilt,myhello.out, and click Open. (It should be in the c:\ti\myprojects\hello1folder unless you installed Code Composer Studio elsewhere.) CodeComposer Studio loads the program onto the target DSP and opens adis-assembly window that shows the disassembled instructions thatmake up the program. (Notice that Code Composer Studio alsoautomatically opens a tabbed area at the bottom of the window to showoutput the program sends to stdout.)
3) Click on an assembly instruction in the Dis-Assembly window. (Click onthe actual instruction, not the address of the instruction or the fieldspassed to the instruction.) Press the F1 key. Code Composer Studiosearches for help on that instruction. This is a good way to get help on anunfamiliar assembly instruction.
4) Choose Debug→Run or click the (Run) toolbar button.
Note: Screen Size and Resolution
Depending on the size and resolution of your screen, part of the toolbarmay be hidden by the Build window. To view the entire toolbar, right-click inthe Build window and deselect Allow Docking.
2-6
Building and Running the Program
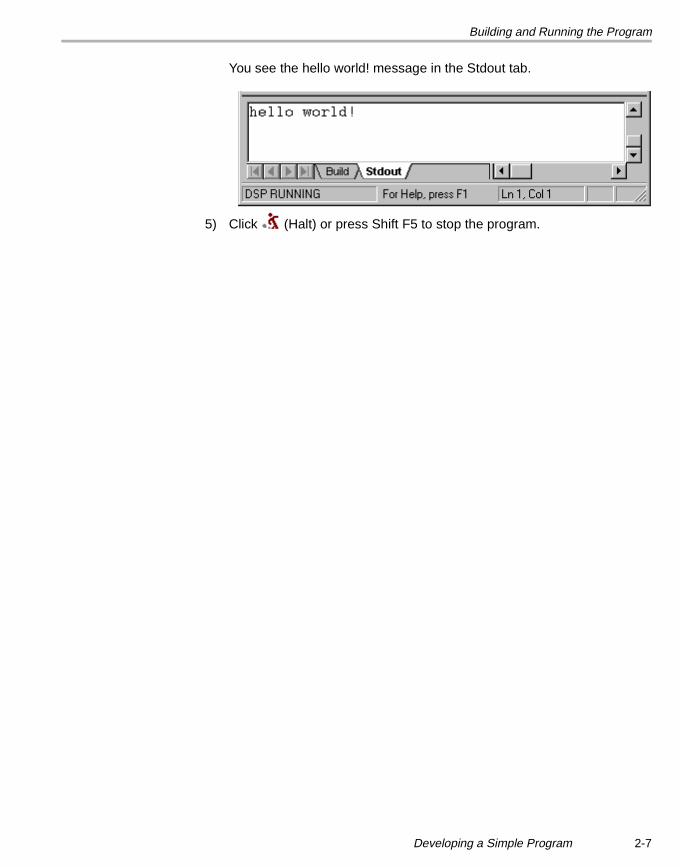
You see the hello world! message in the Stdout tab.
5) Click (Halt) or press Shift F5 to stop the program.
Developing a Simple Program 2-7
Changing Program Options and Fixing Syntax Errors
2.5 Changing Program Options and Fixing Syntax Errors
In the previous section, the portion of the program enclosed by thepreprocessor commands (#ifdef and #endif) did not run because FILEIO wasundefined. In this section, you set a preprocessor option with CodeComposer Studio. You also find and correct a syntax error.
1) Choose Project→Options.
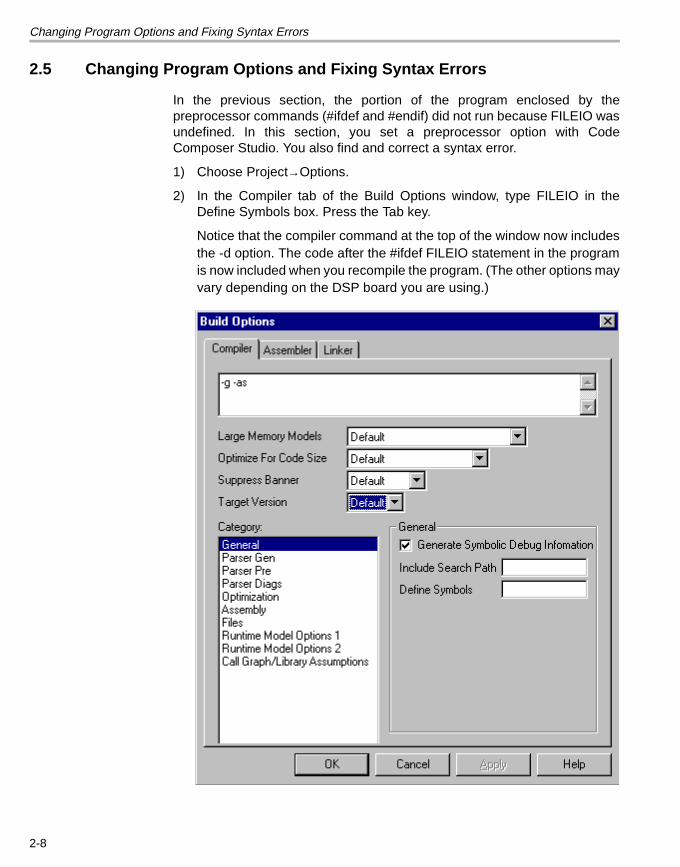
2) In the Compiler tab of the Build Options window, type FILEIO in theDefine Symbols box. Press the Tab key.
Notice that the compiler command at the top of the window now includesthe -d option. The code after the #ifdef FILEIO statement in the programis now included when you recompile the program. (The other options mayvary depending on the DSP board you are using.)
2-8
Changing Program Options and Fixing Syntax Errors
3) If you are programming for the TMS320C6701 and your program usesfloating point values, go to the Target Version field and select 67xx fromthe pull-down list.
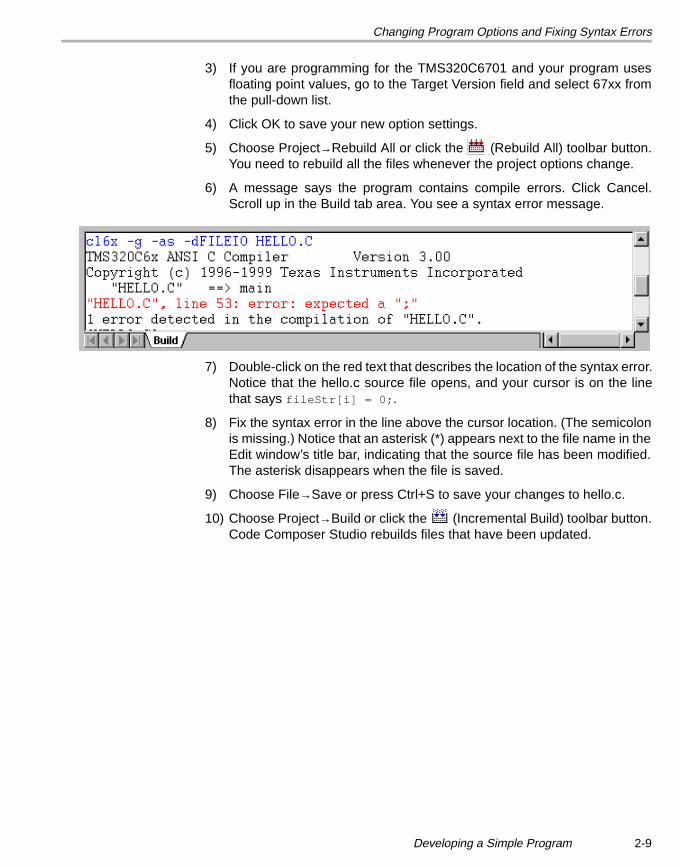
4) Click OK to save your new option settings.
5) Choose Project→Rebuild All or click the (Rebuild All) toolbar button.You need to rebuild all the files whenever the project options change.
6) A message says the program contains compile errors. Click Cancel.Scroll up in the Build tab area. You see a syntax error message.
7) Double-click on the red text that describes the location of the syntax error.Notice that the hello.c source file opens, and your cursor is on the linethat says fileStr[i] = 0;.
8) Fix the syntax error in the line above the cursor location. (The semicolonis missing.) Notice that an asterisk (*) appears next to the file name in theEdit window’s title bar, indicating that the source file has been modified.The asterisk disappears when the file is saved.
9) Choose File→Save or press Ctrl+S to save your changes to hello.c.
10) Choose Project→Build or click the (Incremental Build) toolbar button.Code Composer Studio rebuilds files that have been updated.
Developing a Simple Program 2-9
Using Breakpoints and the Watch Window
2.6 Using Breakpoints and the Watch Window
When you are developing and testing programs, you often need to check thevalue of a variable during program execution. In this section, you usebreakpoints and the Watch Window to view such values. You also use thestep commands after reaching the breakpoint.
1) Choose File→Reload Program.
2) Double-click on the hello.c file in the Project View. You may want to makethe window larger so that you can see more of the source code at once.
3) Put your cursor in the line that says:
fprintf(fptr, "%s", scanStr);
4) Click the (Toggle Breakpoint) toolbar button or press F9. The line ishighlighted in magenta. (If you like, you can change this color usingOption→Color.)
5) Choose View→Watch Window. A separate area in the lower-right cornerof the Code Composer Studio window appears. At run time, this areashows the values of watched variables.
6) Right-click on the Watch Window area and choose Insert NewExpression from the pop-up list.
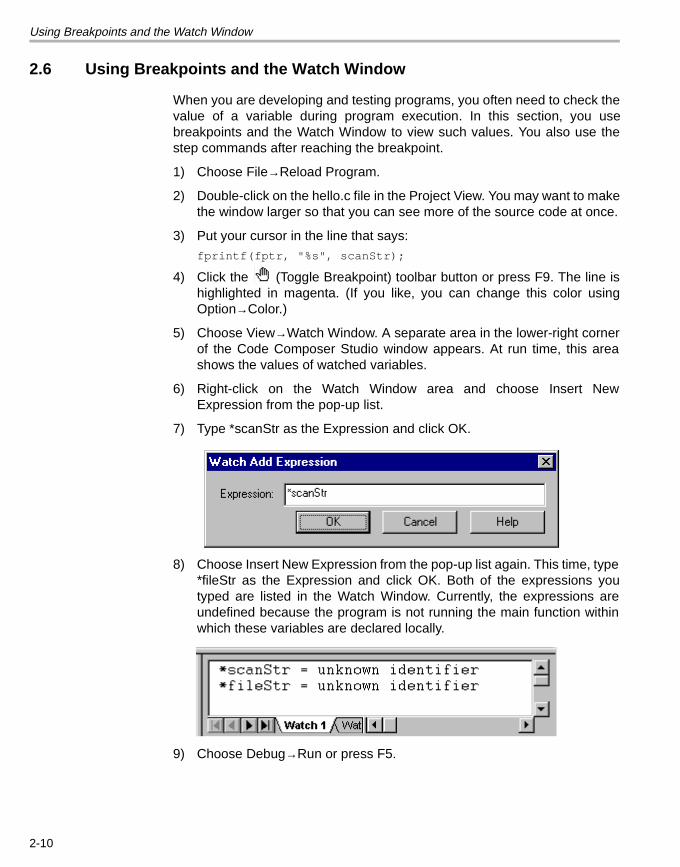
7) Type *scanStr as the Expression and click OK.
8) Choose Insert New Expression from the pop-up list again. This time, type*fileStr as the Expression and click OK. Both of the expressions youtyped are listed in the Watch Window. Currently, the expressions areundefined because the program is not running the main function withinwhich these variables are declared locally.
9) Choose Debug→Run or press F5.
2-10
Using Breakpoints and the Watch Window
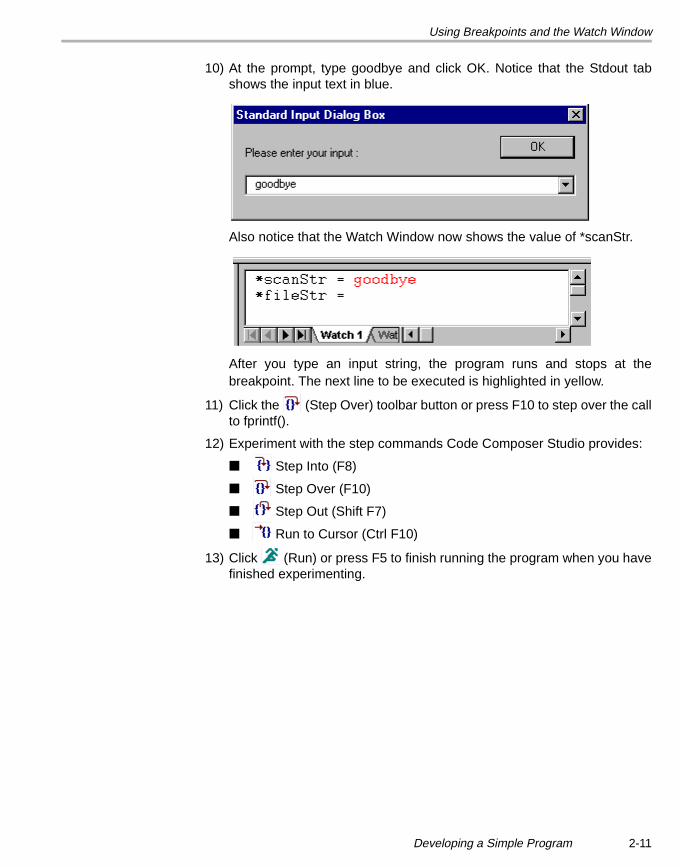
10) At the prompt, type goodbye and click OK. Notice that the Stdout tabshows the input text in blue.
Also notice that the Watch Window now shows the value of *scanStr.
After you type an input string, the program runs and stops at thebreakpoint. The next line to be executed is highlighted in yellow.
11) Click the (Step Over) toolbar button or press F10 to step over the callto fprintf().
12) Experiment with the step commands Code Composer Studio provides:
■ Step Into (F8)
■ Step Over (F10)
■ Step Out (Shift F7)
■ Run to Cursor (Ctrl F10)
13) Click (Run) or press F5 to finish running the program when you havefinished experimenting.
Developing a Simple Program 2-11
Using the Watch Window with Structures
2.7 Using the Watch Window with Structures
In addition to watching the value of a simple variable, you can watch thevalues of the elements of a structure.
1) Right-click on the Watch Window area and choose Insert NewExpression from the pop-up list.
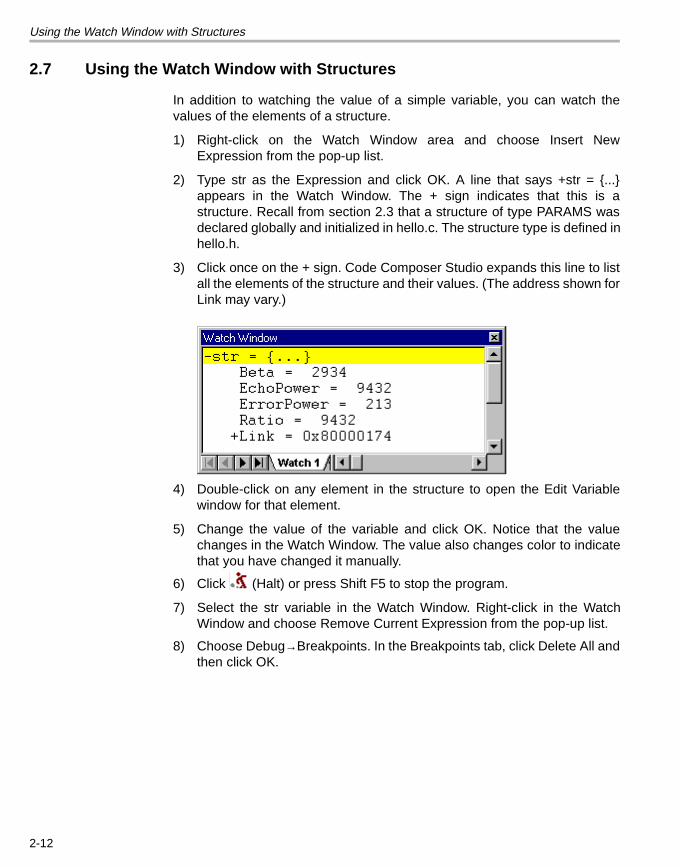
2) Type str as the Expression and click OK. A line that says +str = {...}appears in the Watch Window. The + sign indicates that this is astructure. Recall from section 2.3 that a structure of type PARAMS wasdeclared globally and initialized in hello.c. The structure type is defined inhello.h.
3) Click once on the + sign. Code Composer Studio expands this line to listall the elements of the structure and their values. (The address shown forLink may vary.)
4) Double-click on any element in the structure to open the Edit Variablewindow for that element.
5) Change the value of the variable and click OK. Notice that the valuechanges in the Watch Window. The value also changes color to indicatethat you have changed it manually.
6) Click (Halt) or press Shift F5 to stop the program.
7) Select the str variable in the Watch Window. Right-click in the WatchWindow and choose Remove Current Expression from the pop-up list.
8) Choose Debug→Breakpoints. In the Breakpoints tab, click Delete All andthen click OK.
2-12
Profiling Code Execution Time
2.8 Profiling Code Execution Time
In this section, you use the profiling features of Code Composer Studio togather statistics about the execution of the standard puts() function. InChapter 3, page 3–10, you compare these results to the results for using theDSP/BIOS API to display the hello world message.
1) Choose File→Reload Program.
2) Choose Profiler→Enable Clock. A check mark appears next to this itemin the Profiler menu. This clock counts instruction cycles. It must beenabled for profile-points to count instruction cycles.
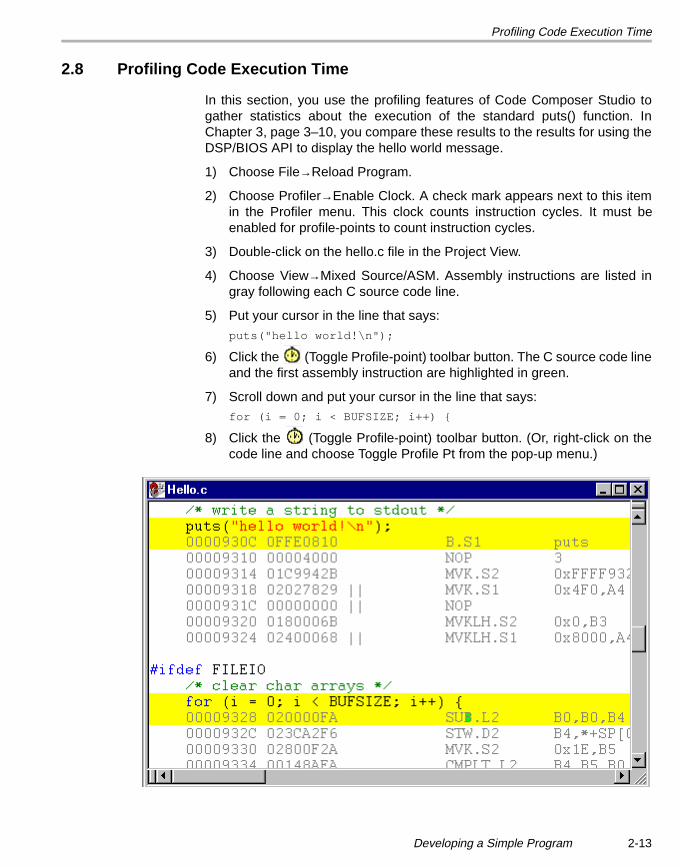
3) Double-click on the hello.c file in the Project View.
4) Choose View→Mixed Source/ASM. Assembly instructions are listed ingray following each C source code line.
5) Put your cursor in the line that says:
puts("hello world!\n");
6) Click the (Toggle Profile-point) toolbar button. The C source code lineand the first assembly instruction are highlighted in green.
7) Scroll down and put your cursor in the line that says:for (i = 0; i < BUFSIZE; i++) {
8) Click the (Toggle Profile-point) toolbar button. (Or, right-click on thecode line and choose Toggle Profile Pt from the pop-up menu.)
Developing a Simple Program 2-13
Profiling Code Execution Time
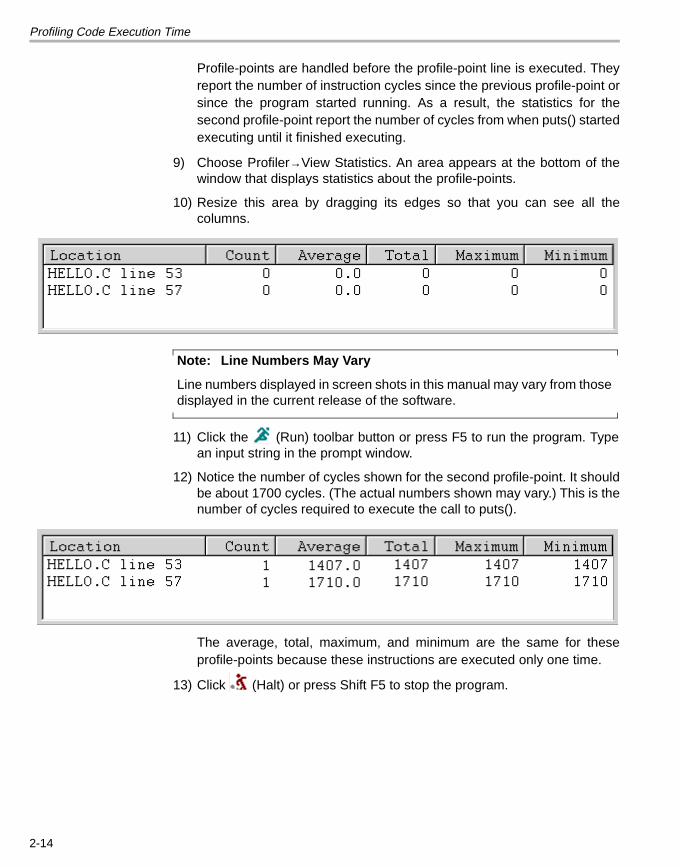
Profile-points are handled before the profile-point line is executed. Theyreport the number of instruction cycles since the previous profile-point orsince the program started running. As a result, the statistics for thesecond profile-point report the number of cycles from when puts() startedexecuting until it finished executing.
9) Choose Profiler→View Statistics. An area appears at the bottom of thewindow that displays statistics about the profile-points.
10) Resize this area by dragging its edges so that you can see all thecolumns.
Note: Line Numbers May Vary
Line numbers displayed in screen shots in this manual may vary from thosedisplayed in the current release of the software.
11) Click the (Run) toolbar button or press F5 to run the program. Typean input string in the prompt window.
12) Notice the number of cycles shown for the second profile-point. It shouldbe about 1700 cycles. (The actual numbers shown may vary.) This is thenumber of cycles required to execute the call to puts().
The average, total, maximum, and minimum are the same for theseprofile-points because these instructions are executed only one time.
13) Click (Halt) or press Shift F5 to stop the program.
2-14
Things to Try
Note: Target Halts at Profile-Points
Code Composer Studio temporarily halts the target whenever it reaches aprofile-point. Therefore, the target application may not be able to meetreal-time deadlines when you are using profile-points. (Real-timemonitoring can be performed using RTDX. See section 1.5.)
14) Before proceeding to the next chapter (after completing section 2.9),perform the following steps to free the resources used in your profilingsession:
■ Go to the Profiler menu and uncheck Enable Clock.
■ Close the Profile Statistics window by right-clicking and choosingHide from the pop-up menu.
■ Go to Debug→Breakpoints. Select Delete All and click OK.
■ Go to Profiler→Profile-points. Select Delete All and click OK.
■ Go to the View menu and uncheck Mixed Source/ASM.
2.9 Things to Try
To further explore Code Composer Studio, try the following:
❏ In the Build Options window, examine the fields on the Compiler,Assembler, and Linker tabs. Notice how changing the values in the fieldaffects the command line shown. You can see the online help to learnabout the various command line switches.
❏ Set some breakpoints. Choose Debug→Breakpoints. In the Breakpointtype box, notice that you can also set conditional breakpoints that breakonly if an expression is true. You can also set a variety of hardwarebreakpoints.
2.10 Learning More
To learn more about using Code Composer Studio, see the online help forCode Composer Studio or the Code Composer Studio User’s Guide (whichis provided as an Adobe Acrobat file).
Developing a Simple Program 2-15
Chapter 3
Developing a DSP/BIOS Program
This chapter introduces DSP/BIOS and shows how to create, build, debug,and test programs that use DSP/BIOS.
In this chapter, you optimize the hello world program you created in Chapter2 by using DSP/BIOS.
3.1 Creating a Configuration File . . . . . . . . . . . . . . . . . . . . . . . . . . . . . . . 3–2
3.2 Adding DSP/BIOS Files to a Project . . . . . . . . . . . . . . . . . . . . . . . . . 3–4
3.3 Testing with Code Composer Studio. . . . . . . . . . . . . . . . . . . . . . . . . 3–6
3.4 Profiling DSP/BIOS Code Execution Time . . . . . . . . . . . . . . . . . . . . 3–8
3.5 Things to Try . . . . . . . . . . . . . . . . . . . . . . . . . . . . . . . . . . . . . . . . . . . 3–10
3.6 Learning More . . . . . . . . . . . . . . . . . . . . . . . . . . . . . . . . . . . . . . . . . . 3–10
Topic Page
3-1
Creating a Configuration File
3.1 Creating a Configuration File
Another way to implement the hello world program is to use the LOG moduleprovided with the DSP/BIOS API. You can use the DSP/BIOS API to providebasic run-time services within your embedded programs. This API isoptimized for use on real-time DSPs. A program can use one or more of theDSP/BIOS modules as desired.
In this chapter, you modify the files you used in Chapter 2 to use theDSP/BIOS API. (If you skipped Chapter 2, create a folder called hello1 in thec:\ti\myprojects folder. Copy all files from the c:\ti\c6000\tutorial\hello1 folderto this new folder.)
In order to use the DSP/BIOS API, a program must have a configuration filethat defines the DSP/BIOS objects used by the program. In this section, youcreate a configuration file.
1) If you have closed Code Composer Studio, restart it and useProject→Open to reopen the myhello.mak project in thec:\ti\myprojects\hello1 folder. (If you installed elsewhere, create a folderwithin the myprojects folder in the location where you installed.)
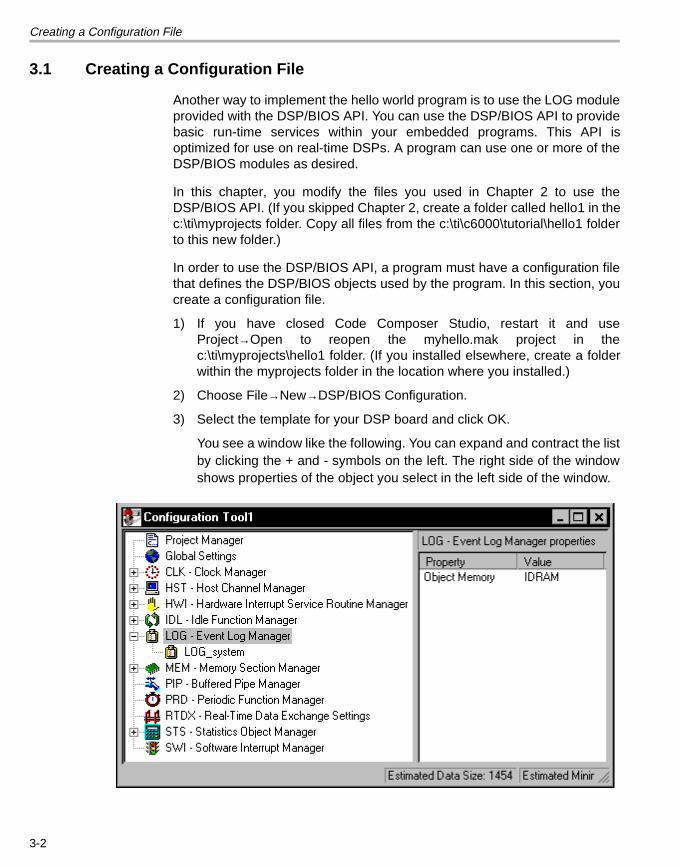
2) Choose File→New→DSP/BIOS Configuration.
3) Select the template for your DSP board and click OK.
You see a window like the following. You can expand and contract the listby clicking the + and - symbols on the left. The right side of the windowshows properties of the object you select in the left side of the window.
3-2
Creating a Configuration File
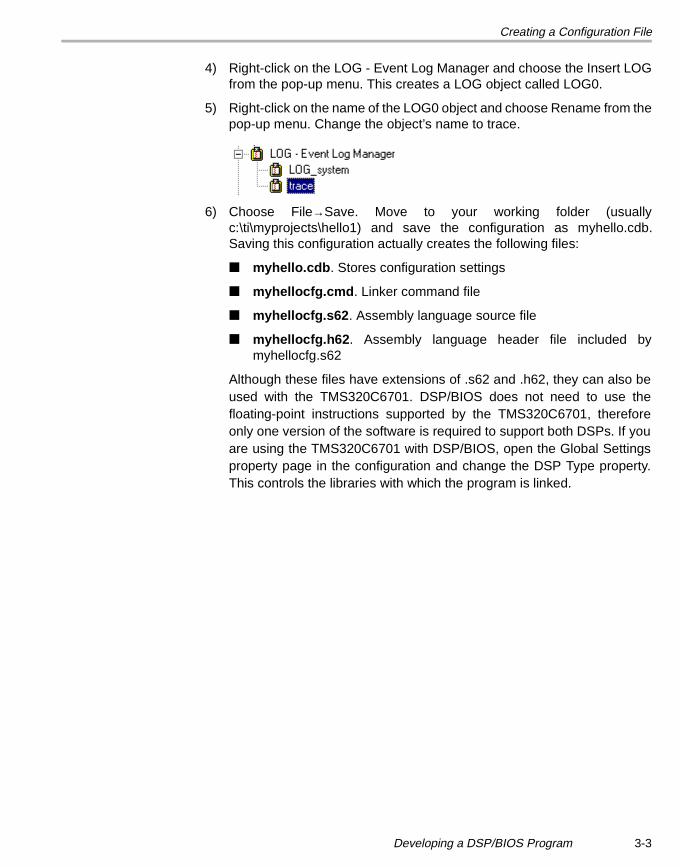
4) Right-click on the LOG - Event Log Manager and choose the Insert LOGfrom the pop-up menu. This creates a LOG object called LOG0.
5) Right-click on the name of the LOG0 object and choose Rename from thepop-up menu. Change the object’s name to trace.
6) Choose File→Save. Move to your working folder (usuallyc:\ti\myprojects\hello1) and save the configuration as myhello.cdb.Saving this configuration actually creates the following files:
■ myhello.cdb. Stores configuration settings
■ myhellocfg.cmd. Linker command file
■ myhellocfg.s62. Assembly language source file
■ myhellocfg.h62. Assembly language header file included bymyhellocfg.s62
Although these files have extensions of .s62 and .h62, they can also beused with the TMS320C6701. DSP/BIOS does not need to use thefloating-point instructions supported by the TMS320C6701, thereforeonly one version of the software is required to support both DSPs. If youare using the TMS320C6701 with DSP/BIOS, open the Global Settingsproperty page in the configuration and change the DSP Type property.This controls the libraries with which the program is linked.
Developing a DSP/BIOS Program 3-3
Adding DSP/BIOS Files to a Project
3.2 Adding DSP/BIOS Files to a Project
1) Choose Project→Add Files to Project. Select Configuration File (*.cdb) inthe Files of type box. Select the myhello.cdb file and click Open. Noticethat the Project View now contains myhello.cdb in a folder calledDSP/BIOS Config. In addition, the myhellocfg.s62 file is now listed as asource file.
2) The output file name must match the .cdb file name (myhello.out andmyhello.cdb). Go to Project→Options and choose the Linker tab. In theOutput Filename field, type myhello.out.
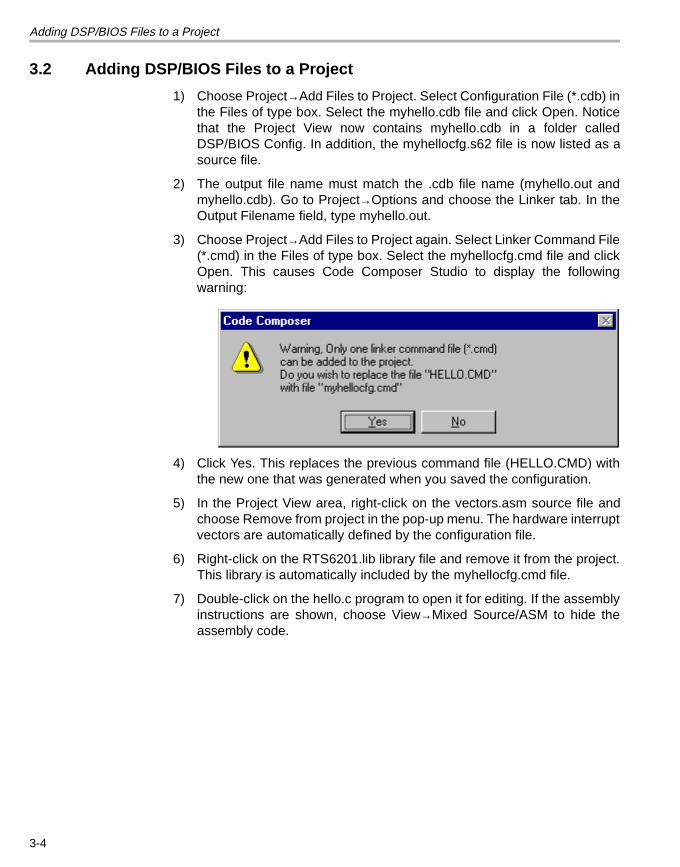
3) Choose Project→Add Files to Project again. Select Linker Command File(*.cmd) in the Files of type box. Select the myhellocfg.cmd file and clickOpen. This causes Code Composer Studio to display the followingwarning:
4) Click Yes. This replaces the previous command file (HELLO.CMD) withthe new one that was generated when you saved the configuration.
5) In the Project View area, right-click on the vectors.asm source file andchoose Remove from project in the pop-up menu. The hardware interruptvectors are automatically defined by the configuration file.
6) Right-click on the RTS6201.lib library file and remove it from the project.This library is automatically included by the myhellocfg.cmd file.
7) Double-click on the hello.c program to open it for editing. If the assemblyinstructions are shown, choose View→Mixed Source/ASM to hide theassembly code.
3-4
Adding DSP/BIOS Files to a Project
8) Change the source file’s contents to the following. (You can copy andpaste this code from c:\ti\c6000\tutorial\hello2\hello.c if you like.) Makesure you replace the existing main function (which has the puts()function) with the main shown below, because puts() and LOG_printf usethe same resources.
/* ======== hello.c ======== */
/* DSP/BIOS header files*/#include <std.h>#include <log.h>
/* Objects created by the Configuration Tool */extern far LOG_Obj trace;
/* ======== main ======== */Void main(){ LOG_printf(&trace, "hello world!");
/* fall into DSP/BIOS idle loop */ return;}
9) Notice the following parts of this code:
■ The code includes the std.h and log.h header files. All programs thatuse the DSP/BIOS API must include the std.h file and header files forany modules the program uses. The log.h header file defines theLOG_Obj structure and declares the API operations in the LOGmodule. The std.h file must be included first. The order of theremaining modules you include is not important.
■ The code then declares the LOG object you created in theconfiguration file.
■ Within the main function, this example calls LOG_printf and passesit the address of the LOG object (&trace) and the hello world!message.
■ Finally main returns, which causes the program to enter theDSP/BIOS idle loop. Within this loop, DSP/BIOS waits for softwareinterrupts and hardware interrupts to occur. Chapter 5 throughChapter 7 explain these types of events.
10) Choose File→Save or press Ctrl+S to save your changes to hello.c.
11) Choose Project→Options. Remove FILEIO from the Define Symbols boxin the Compiler tab. Then click OK.
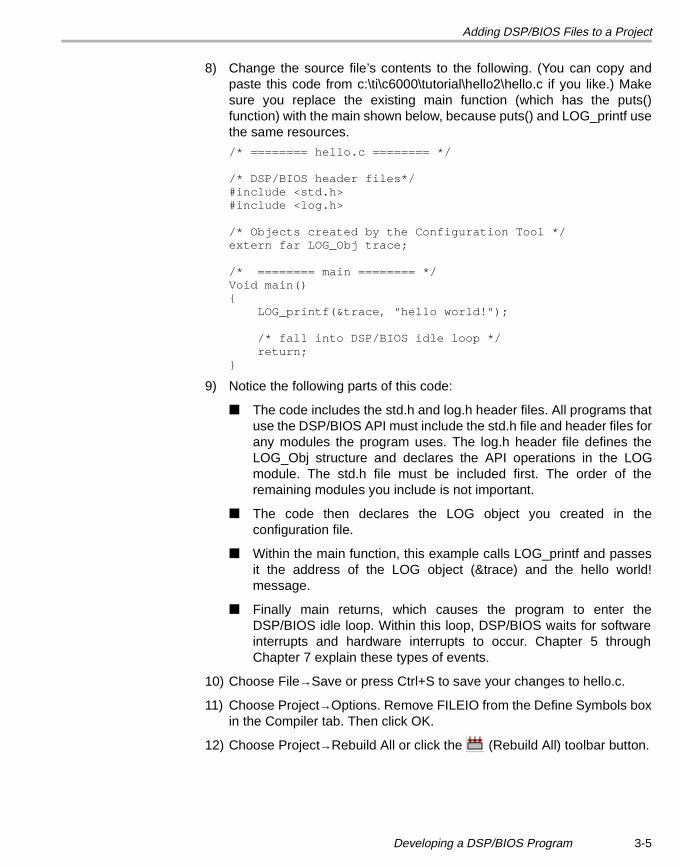
12) Choose Project→Rebuild All or click the (Rebuild All) toolbar button.
Developing a DSP/BIOS Program 3-5
Testing with Code Composer Studio
3.3 Testing with Code Composer Studio
Now you can test the program. Since the program writes only one line to aLOG, there is not much to analyze. Chapter 5 through Chapter 7 show moreways to analyze program behavior.
1) Choose File→Reload Program.
2) Choose Debug→Go Main.
3) Choose Tools→DSP/BIOS→Message Log. A Message Log area appearsat the bottom of the Code Composer Studio window.
4) Right-click on the Message Log area and choose Property Page from thepop-up window.
5) Select trace as the name of the log to monitor and click OK. The defaultrefresh rate is once per second. (To change refresh rates, chooseTools→DSP/BIOS→RTA Control Panel, then right-click on the RTAControl Panel and choose Property Page.)
6) Choose Debug→Run or press F5.
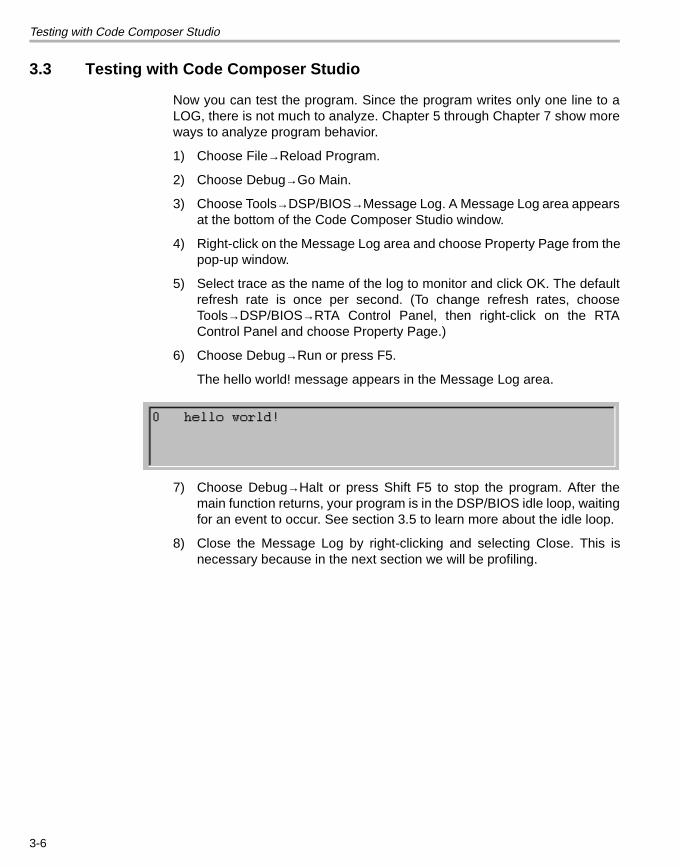
The hello world! message appears in the Message Log area.
7) Choose Debug→Halt or press Shift F5 to stop the program. After themain function returns, your program is in the DSP/BIOS idle loop, waitingfor an event to occur. See section 3.5 to learn more about the idle loop.
8) Close the Message Log by right-clicking and selecting Close. This isnecessary because in the next section we will be profiling.
3-6
Testing with Code Composer Studio
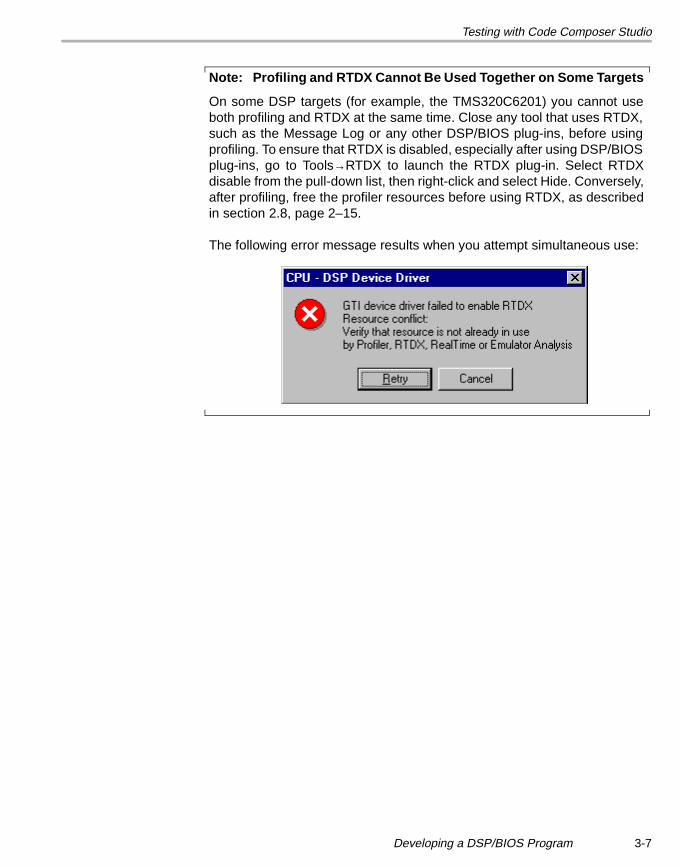
Note: Profiling and RTDX Cannot Be Used Together on Some Targets
On some DSP targets (for example, the TMS320C6201) you cannot useboth profiling and RTDX at the same time. Close any tool that uses RTDX,such as the Message Log or any other DSP/BIOS plug-ins, before usingprofiling. To ensure that RTDX is disabled, especially after using DSP/BIOSplug-ins, go to Tools→RTDX to launch the RTDX plug-in. Select RTDXdisable from the pull-down list, then right-click and select Hide. Conversely,after profiling, free the profiler resources before using RTDX, as describedin section 2.8, page 2–15.
The following error message results when you attempt simultaneous use:
Developing a DSP/BIOS Program 3-7
Profiling DSP/BIOS Code Execution Time
3.4 Profiling DSP/BIOS Code Execution Time
Earlier, you used the profiling features of Code Composer Studio to find thenumber of cycles required to call puts(). Now, you can do the same for the callto LOG_printf().
1) Choose File→Reload Program.
2) Choose Profiler→Enable Clock. Make sure you see a check mark next tothis item in the Profiler menu.
3) Double-click on the hello.c file in the Project View.
4) Choose View→Mixed Source/ASM. Assembly instructions are listed ingray following each C source code line.
5) Put your cursor in the line that says:
LOG_printf(&trace, "hello world!");
6) Click the (Toggle Profile-point) toolbar button. This line and theassembly language instruction that follows it are highlighted in green.
7) Scroll down and put your cursor in the line for the final curly brace of theprogram, and click the (Toggle Profile-point) toolbar button.
You might think that you should set the second profile-point on the linethat says return; since that is the last statement in the program.However, notice that there are no assembly language equivalents shownuntil after the curly brace. If you set the profile-point at the line that saysreturn;, Code Composer Studio automatically corrects the problem atrun time.
8) Choose Profiler→View Statistics.
9) Click the (Run) toolbar button or press F5 to run the program.
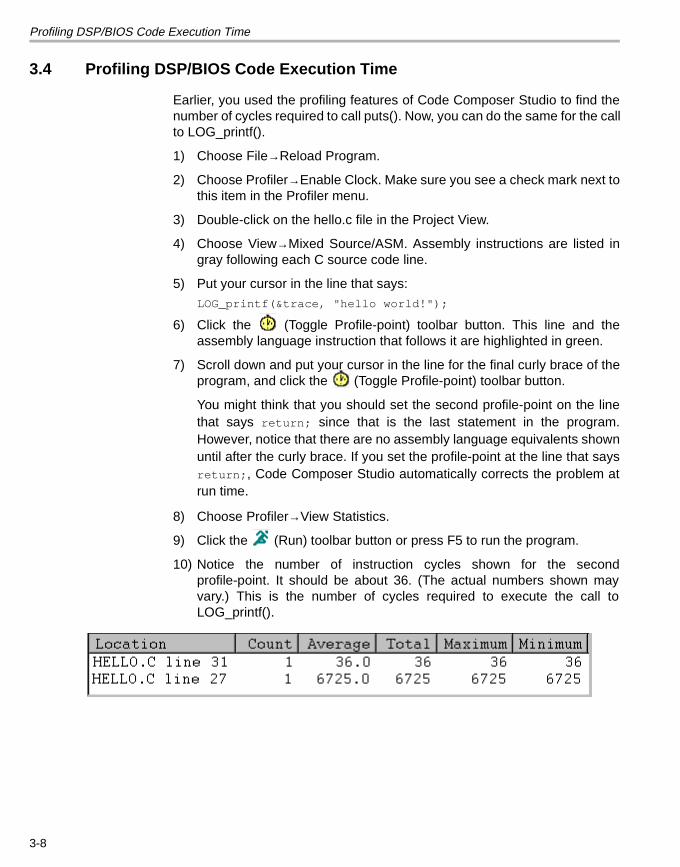
10) Notice the number of instruction cycles shown for the secondprofile-point. It should be about 36. (The actual numbers shown mayvary.) This is the number of cycles required to execute the call toLOG_printf().
3-8
Profiling DSP/BIOS Code Execution Time
Calls to LOG_printf() are efficient because the string formatting isperformed on the host PC rather than on the target DSP. LOG_printf()takes 36 instruction cycles compared to over 1700 for puts(). You canleave calls to LOG_printf() in your code for system status monitoring withvery little impact on code execution.
11) Click (Halt) or press Shift F5 to stop the program.
12) Before proceeding to the next chapter (after completing section 3.5),perform the following steps to free the resources used in your profilingsession:
■ Go to the Profiler menu and uncheck Enable Clock.
■ Close the Profile Statistics window by right-clicking and choosingHide from the pop-up menu.
■ Go to Debug→Breakpoints. Select Delete All and click OK.
■ Go to Profiler→Profile-points. Select Delete All and click OK.
■ Go to the View menu and uncheck Mixed Source/ASM.
Developing a DSP/BIOS Program 3-9
Things to Try
3.5 Things to Try
To explore Code Composer Studio, try the following:
❏ Load myhello.out and put a breakpoint on the line that calls LOG_printf().Use Debug→Breakpoints to add a breakpoint at IDL_F_loop. (TypeIDL_F_loop in the Location box and click Add.)
Run the program. At the first breakpoint, use View→CPURegisters→CPU Register to see a list of register values. Notice that GIEis 0, indicating that interrupts are disabled while the main function isexecuting.
Run to the next breakpoint. Notice that GIE is now 1, indicating thatinterrupts are now enabled. Notice that if you run the program, you hit thisbreakpoint over and over.
After the startup process and main are completed, a DSP/BIOSapplication drops into a background thread called the idle loop. This loopis managed by the IDL module and continues until you halt the program.The idle loop runs with interrupts enabled and can be preempted at anypoint by any ISR or software interrupt triggered to handle the application’sreal-time tasks. Chapter 5 through Chapter 7 explain more about usingISRs and software interrupts with DSP/BIOS
❏ In an MS-DOS window, run the sectti.exe utility by typing the followingcommand lines. Change the directory locations if you installed CodeComposer Studio in a location other than c:\ti.cd c:\ti\c6000\tutorial\hello1sectti hello.out > hello1.prncd ..\hello2sectti hello.out > hello2.prn
Compare the hello1.prn and hello2.prn files to see the differences inmemory sections and sizes when using stdio.h calls and DSP/BIOS.
3.6 Learning More
To learn more about using Code Composer Studio and DSP/BIOS, see theonline help for Code Composer Studio. In addition, see the Code ComposerStudio User’s Guide and the TMS320C6000 DSP/BIOS User’s Guide (whichare provided as Adobe Acrobat files).
3-10
Chapter 4
Testing Algorithms and Data from a File
This chapter shows the process for creating and testing a simple algorithmand introduces additional Code Composer Studio features.
In this chapter, you create a program that performs basic signal processing.You expand on this example in the following two chapters.
You create and test a simple algorithm using data stored in a file on your PC.You also use Probe Points, graphs, animation, and GEL files with CodeComposer Studio.
4.1 Opening and Examining the Project . . . . . . . . . . . . . . . . . . . . . . . . . 4–2
4.2 Reviewing the Source Code . . . . . . . . . . . . . . . . . . . . . . . . . . . . . . . . 4–4
4.3 Adding a Probe Point for File I/O . . . . . . . . . . . . . . . . . . . . . . . . . . . . 4–6
4.4 Displaying Graphs. . . . . . . . . . . . . . . . . . . . . . . . . . . . . . . . . . . . . . . . 4–8
4.5 Animating the Program and Graphs . . . . . . . . . . . . . . . . . . . . . . . . . 4–9
4.6 Adjusting the Gain. . . . . . . . . . . . . . . . . . . . . . . . . . . . . . . . . . . . . . . 4–10
4.7 Viewing Out-of-Scope Variables . . . . . . . . . . . . . . . . . . . . . . . . . . . 4–11
4.8 Using a GEL File . . . . . . . . . . . . . . . . . . . . . . . . . . . . . . . . . . . . . . . . 4–13
4.9 Adjusting and Profiling the Processing Load. . . . . . . . . . . . . . . . . 4–14
4.10 Things to Try . . . . . . . . . . . . . . . . . . . . . . . . . . . . . . . . . . . . . . . . . . . 4–16
4.11 Learning More . . . . . . . . . . . . . . . . . . . . . . . . . . . . . . . . . . . . . . . . . . 4–16
Topic Page
4-1
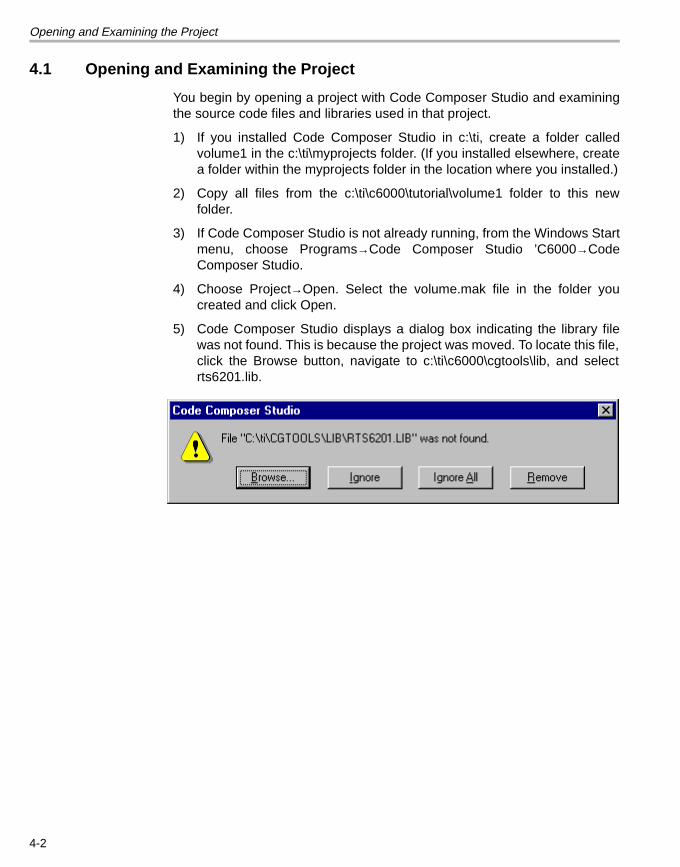
Opening and Examining the Project
4.1 Opening and Examining the Project
You begin by opening a project with Code Composer Studio and examiningthe source code files and libraries used in that project.
1) If you installed Code Composer Studio in c:\ti, create a folder calledvolume1 in the c:\ti\myprojects folder. (If you installed elsewhere, createa folder within the myprojects folder in the location where you installed.)
2) Copy all files from the c:\ti\c6000\tutorial\volume1 folder to this newfolder.
3) If Code Composer Studio is not already running, from the Windows Startmenu, choose Programs→Code Composer Studio ’C6000→CodeComposer Studio.
4) Choose Project→Open. Select the volume.mak file in the folder youcreated and click Open.
5) Code Composer Studio displays a dialog box indicating the library filewas not found. This is because the project was moved. To locate this file,click the Browse button, navigate to c:\ti\c6000\cgtools\lib, and selectrts6201.lib.
4-2
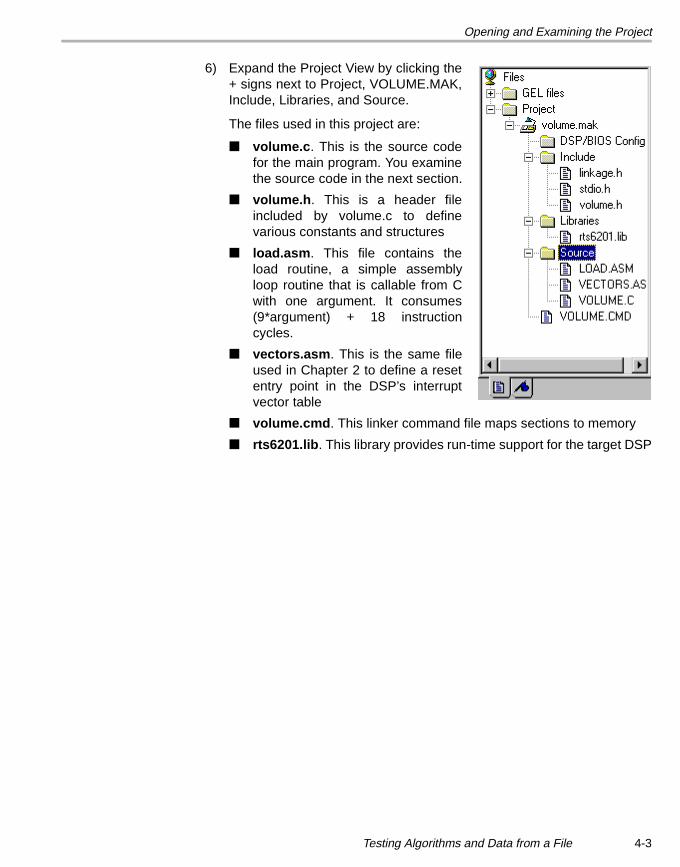
Opening and Examining the Project
6) Expand the Project View by clicking the+ signs next to Project, VOLUME.MAK,Include, Libraries, and Source.
The files used in this project are:
■ volume.c. This is the source codefor the main program. You examinethe source code in the next section.
■ volume.h. This is a header fileincluded by volume.c to definevarious constants and structures
■ load.asm. This file contains theload routine, a simple assemblyloop routine that is callable from Cwith one argument. It consumes(9*argument) + 18 instructioncycles.
■ vectors.asm. This is the same fileused in Chapter 2 to define a resetentry point in the DSP’s interruptvector table
■ volume.cmd. This linker command file maps sections to memory
■ rts6201.lib. This library provides run-time support for the target DSP
Testing Algorithms and Data from a File 4-3
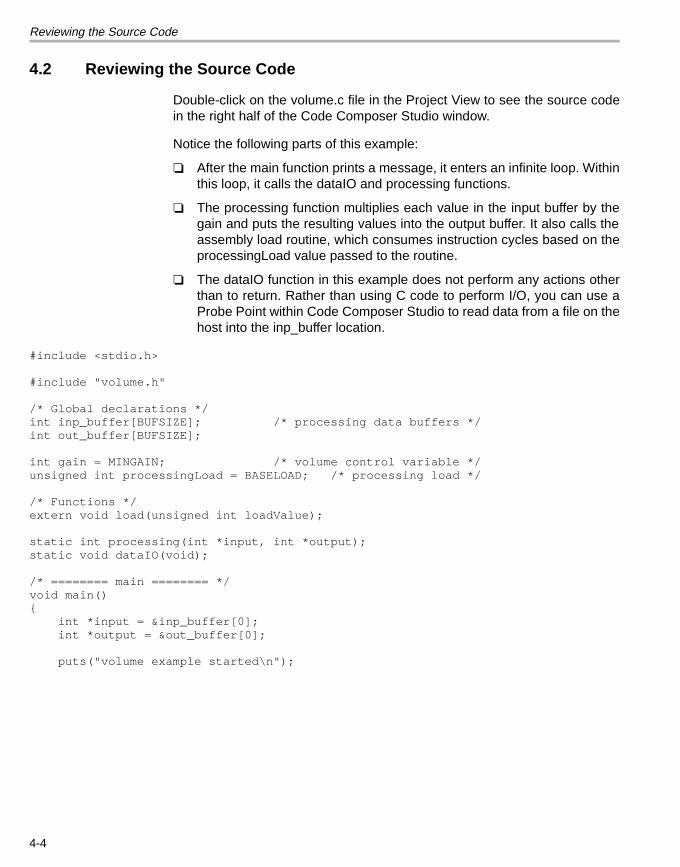
Reviewing the Source Code
4.2 Reviewing the Source Code
Double-click on the volume.c file in the Project View to see the source codein the right half of the Code Composer Studio window.
Notice the following parts of this example:
❏ After the main function prints a message, it enters an infinite loop. Withinthis loop, it calls the dataIO and processing functions.
❏ The processing function multiplies each value in the input buffer by thegain and puts the resulting values into the output buffer. It also calls theassembly load routine, which consumes instruction cycles based on theprocessingLoad value passed to the routine.
❏ The dataIO function in this example does not perform any actions otherthan to return. Rather than using C code to perform I/O, you can use aProbe Point within Code Composer Studio to read data from a file on thehost into the inp_buffer location.
#include <stdio.h>
#include "volume.h"
/* Global declarations */int inp_buffer[BUFSIZE]; /* processing data buffers */int out_buffer[BUFSIZE];
int gain = MINGAIN; /* volume control variable */unsigned int processingLoad = BASELOAD; /* processing load */
/* Functions */extern void load(unsigned int loadValue);
static int processing(int *input, int *output);static void dataIO(void);
/* ======== main ======== */void main(){ int *input = &inp_buffer[0]; int *output = &out_buffer[0];
puts("volume example started\n");
4-4
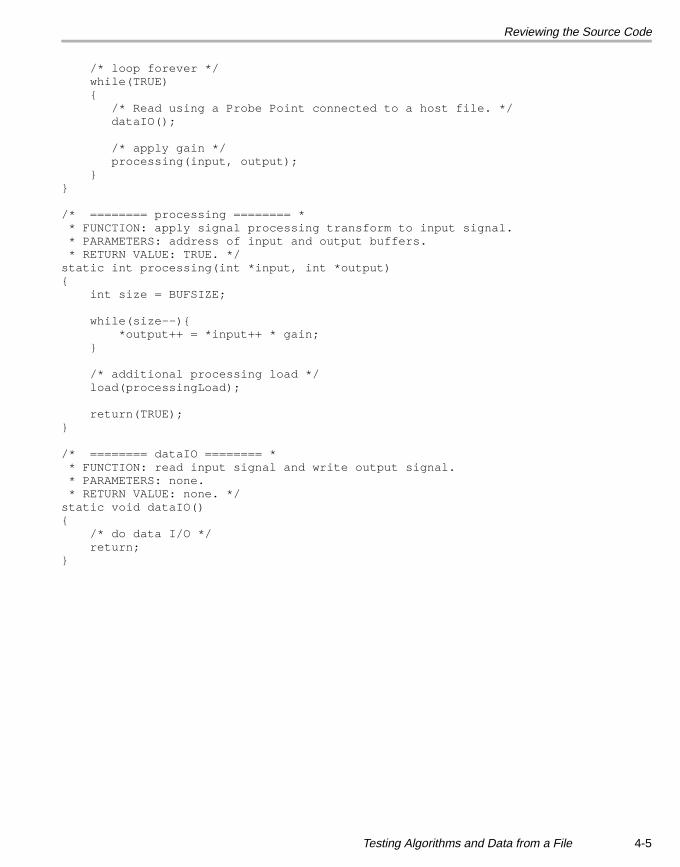
Reviewing the Source Code
/* loop forever */ while(TRUE) { /* Read using a Probe Point connected to a host file. */ dataIO(); /* apply gain */ processing(input, output); }}
/* ======== processing ======== * * FUNCTION: apply signal processing transform to input signal. * PARAMETERS: address of input and output buffers. * RETURN VALUE: TRUE. */static int processing(int *input, int *output){ int size = BUFSIZE;
while(size--){ *output++ = *input++ * gain; } /* additional processing load */ load(processingLoad); return(TRUE);}
/* ======== dataIO ======== * * FUNCTION: read input signal and write output signal. * PARAMETERS: none. * RETURN VALUE: none. */static void dataIO(){ /* do data I/O */ return;}
Testing Algorithms and Data from a File 4-5
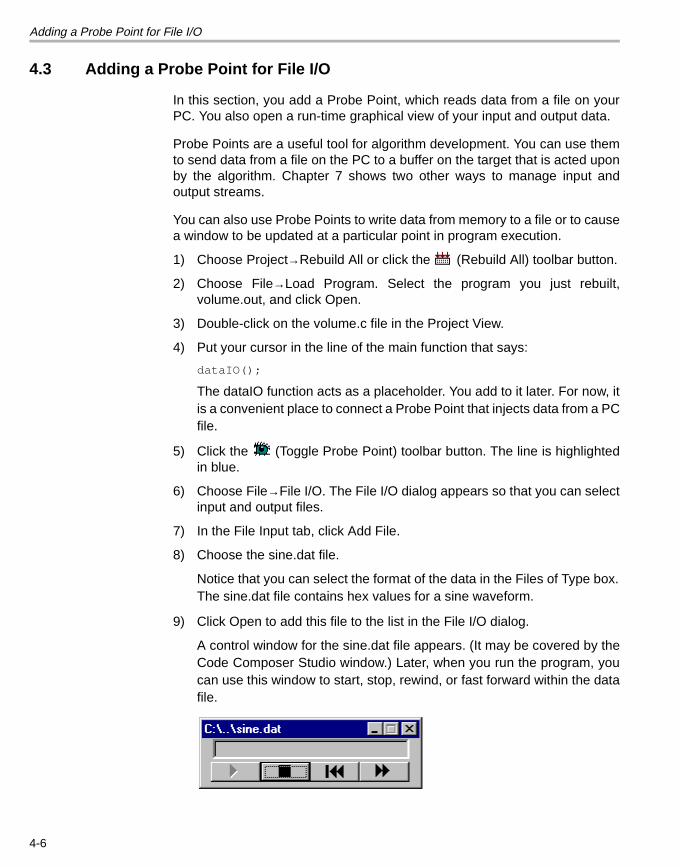
Adding a Probe Point for File I/O
4.3 Adding a Probe Point for File I/O
In this section, you add a Probe Point, which reads data from a file on yourPC. You also open a run-time graphical view of your input and output data.
Probe Points are a useful tool for algorithm development. You can use themto send data from a file on the PC to a buffer on the target that is acted uponby the algorithm. Chapter 7 shows two other ways to manage input andoutput streams.
You can also use Probe Points to write data from memory to a file or to causea window to be updated at a particular point in program execution.
1) Choose Project→Rebuild All or click the (Rebuild All) toolbar button.
2) Choose File→Load Program. Select the program you just rebuilt,volume.out, and click Open.
3) Double-click on the volume.c file in the Project View.
4) Put your cursor in the line of the main function that says:
dataIO();
The dataIO function acts as a placeholder. You add to it later. For now, itis a convenient place to connect a Probe Point that injects data from a PCfile.
5) Click the (Toggle Probe Point) toolbar button. The line is highlightedin blue.
6) Choose File→File I/O. The File I/O dialog appears so that you can selectinput and output files.
7) In the File Input tab, click Add File.
8) Choose the sine.dat file.
Notice that you can select the format of the data in the Files of Type box.The sine.dat file contains hex values for a sine waveform.
9) Click Open to add this file to the list in the File I/O dialog.
A control window for the sine.dat file appears. (It may be covered by theCode Composer Studio window.) Later, when you run the program, youcan use this window to start, stop, rewind, or fast forward within the datafile.
4-6
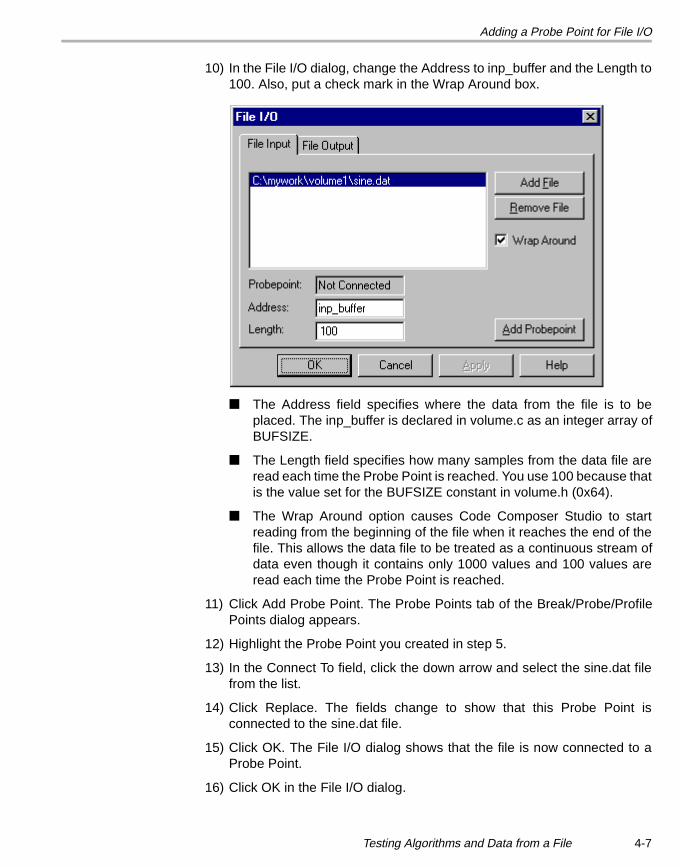
Adding a Probe Point for File I/O
10) In the File I/O dialog, change the Address to inp_buffer and the Length to100. Also, put a check mark in the Wrap Around box.
■ The Address field specifies where the data from the file is to beplaced. The inp_buffer is declared in volume.c as an integer array ofBUFSIZE.
■ The Length field specifies how many samples from the data file areread each time the Probe Point is reached. You use 100 because thatis the value set for the BUFSIZE constant in volume.h (0x64).
■ The Wrap Around option causes Code Composer Studio to startreading from the beginning of the file when it reaches the end of thefile. This allows the data file to be treated as a continuous stream ofdata even though it contains only 1000 values and 100 values areread each time the Probe Point is reached.
11) Click Add Probe Point. The Probe Points tab of the Break/Probe/ProfilePoints dialog appears.
12) Highlight the Probe Point you created in step 5.
13) In the Connect To field, click the down arrow and select the sine.dat filefrom the list.
14) Click Replace. The fields change to show that this Probe Point isconnected to the sine.dat file.
15) Click OK. The File I/O dialog shows that the file is now connected to aProbe Point.
16) Click OK in the File I/O dialog.
Testing Algorithms and Data from a File 4-7
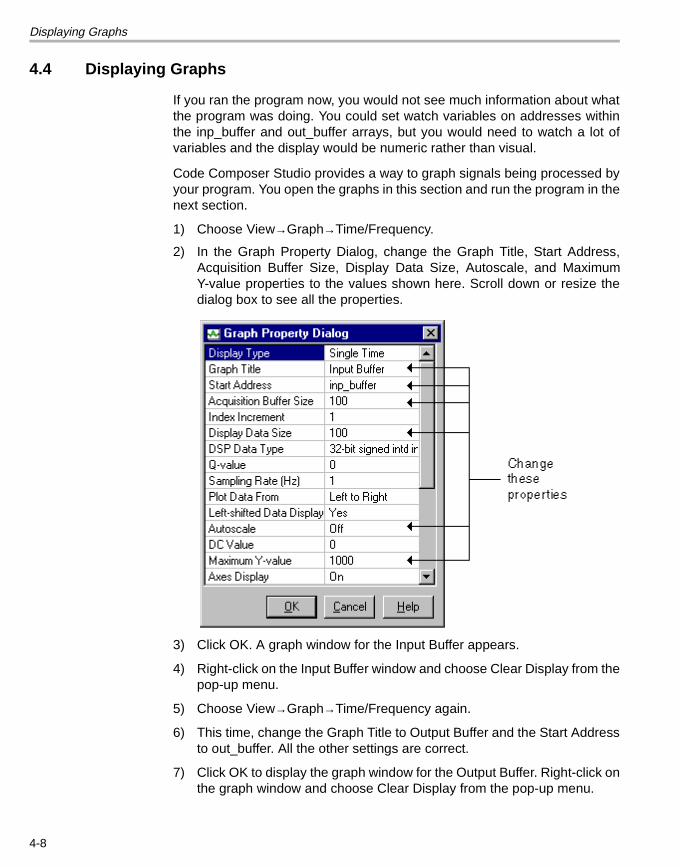
Displaying Graphs
4.4 Displaying Graphs
If you ran the program now, you would not see much information about whatthe program was doing. You could set watch variables on addresses withinthe inp_buffer and out_buffer arrays, but you would need to watch a lot ofvariables and the display would be numeric rather than visual.
Code Composer Studio provides a way to graph signals being processed byyour program. You open the graphs in this section and run the program in thenext section.
1) Choose View→Graph→Time/Frequency.
2) In the Graph Property Dialog, change the Graph Title, Start Address,Acquisition Buffer Size, Display Data Size, Autoscale, and MaximumY-value properties to the values shown here. Scroll down or resize thedialog box to see all the properties.
3) Click OK. A graph window for the Input Buffer appears.
4) Right-click on the Input Buffer window and choose Clear Display from thepop-up menu.
5) Choose View→Graph→Time/Frequency again.
6) This time, change the Graph Title to Output Buffer and the Start Addressto out_buffer. All the other settings are correct.
7) Click OK to display the graph window for the Output Buffer. Right-click onthe graph window and choose Clear Display from the pop-up menu.
4-8
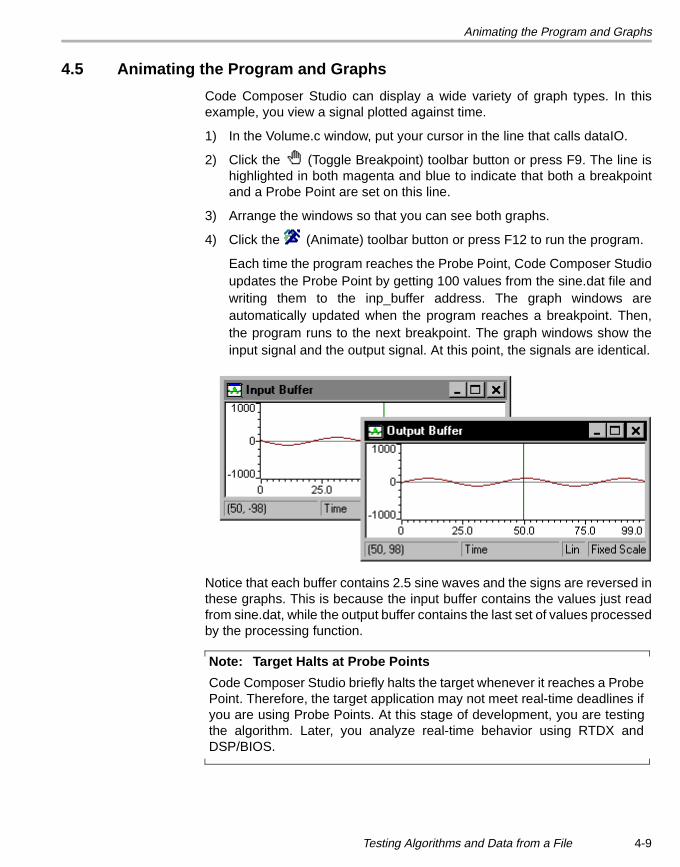
Animating the Program and Graphs
4.5 Animating the Program and Graphs
Code Composer Studio can display a wide variety of graph types. In thisexample, you view a signal plotted against time.
1) In the Volume.c window, put your cursor in the line that calls dataIO.
2) Click the (Toggle Breakpoint) toolbar button or press F9. The line ishighlighted in both magenta and blue to indicate that both a breakpointand a Probe Point are set on this line.
3) Arrange the windows so that you can see both graphs.
4) Click the (Animate) toolbar button or press F12 to run the program.
Each time the program reaches the Probe Point, Code Composer Studioupdates the Probe Point by getting 100 values from the sine.dat file andwriting them to the inp_buffer address. The graph windows areautomatically updated when the program reaches a breakpoint. Then,the program runs to the next breakpoint. The graph windows show theinput signal and the output signal. At this point, the signals are identical.
Notice that each buffer contains 2.5 sine waves and the signs are reversed inthese graphs. This is because the input buffer contains the values just readfrom sine.dat, while the output buffer contains the last set of values processedby the processing function.
Note: Target Halts at Probe Points
Code Composer Studio briefly halts the target whenever it reaches a ProbePoint. Therefore, the target application may not meet real-time deadlines ifyou are using Probe Points. At this stage of development, you are testingthe algorithm. Later, you analyze real-time behavior using RTDX andDSP/BIOS.
Testing Algorithms and Data from a File 4-9
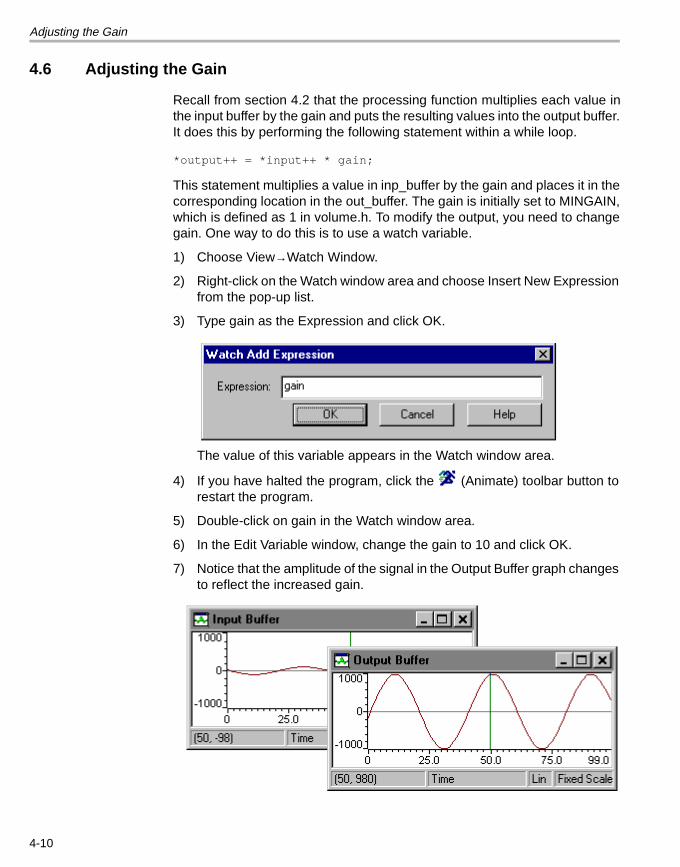
Adjusting the Gain
4.6 Adjusting the Gain
Recall from section 4.2 that the processing function multiplies each value inthe input buffer by the gain and puts the resulting values into the output buffer.It does this by performing the following statement within a while loop.
*output++ = *input++ * gain;
This statement multiplies a value in inp_buffer by the gain and places it in thecorresponding location in the out_buffer. The gain is initially set to MINGAIN,which is defined as 1 in volume.h. To modify the output, you need to changegain. One way to do this is to use a watch variable.
1) Choose View→Watch Window.
2) Right-click on the Watch window area and choose Insert New Expressionfrom the pop-up list.
3) Type gain as the Expression and click OK.
The value of this variable appears in the Watch window area.
4) If you have halted the program, click the (Animate) toolbar button torestart the program.
5) Double-click on gain in the Watch window area.
6) In the Edit Variable window, change the gain to 10 and click OK.
7) Notice that the amplitude of the signal in the Output Buffer graph changesto reflect the increased gain.
4-10
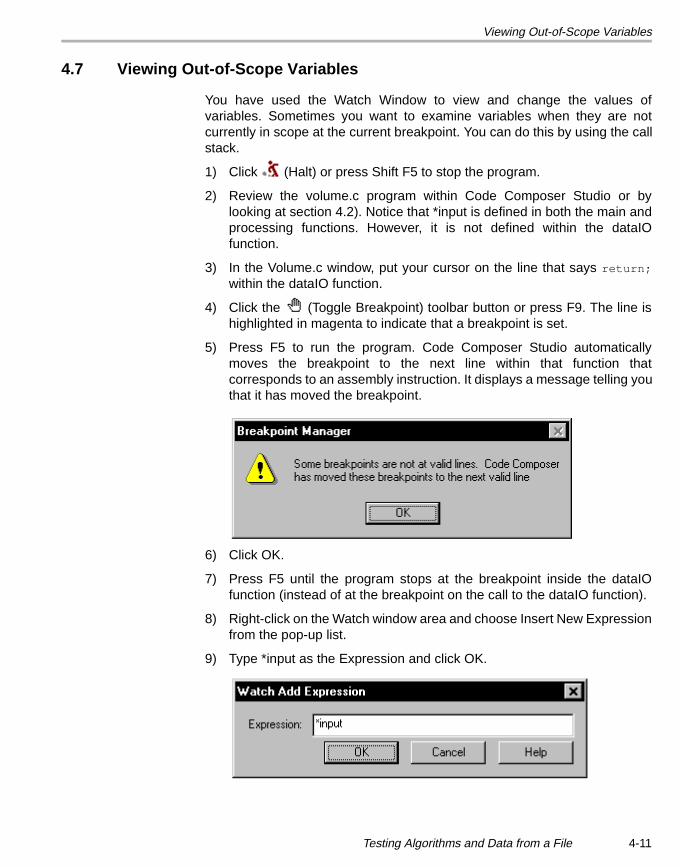
Viewing Out-of-Scope Variables
4.7 Viewing Out-of-Scope Variables
You have used the Watch Window to view and change the values ofvariables. Sometimes you want to examine variables when they are notcurrently in scope at the current breakpoint. You can do this by using the callstack.
1) Click (Halt) or press Shift F5 to stop the program.
2) Review the volume.c program within Code Composer Studio or bylooking at section 4.2). Notice that *input is defined in both the main andprocessing functions. However, it is not defined within the dataIOfunction.
3) In the Volume.c window, put your cursor on the line that says return;within the dataIO function.
4) Click the (Toggle Breakpoint) toolbar button or press F9. The line ishighlighted in magenta to indicate that a breakpoint is set.
5) Press F5 to run the program. Code Composer Studio automaticallymoves the breakpoint to the next line within that function thatcorresponds to an assembly instruction. It displays a message telling youthat it has moved the breakpoint.
6) Click OK.
7) Press F5 until the program stops at the breakpoint inside the dataIOfunction (instead of at the breakpoint on the call to the dataIO function).
8) Right-click on the Watch window area and choose Insert New Expressionfrom the pop-up list.
9) Type *input as the Expression and click OK.
Testing Algorithms and Data from a File 4-11
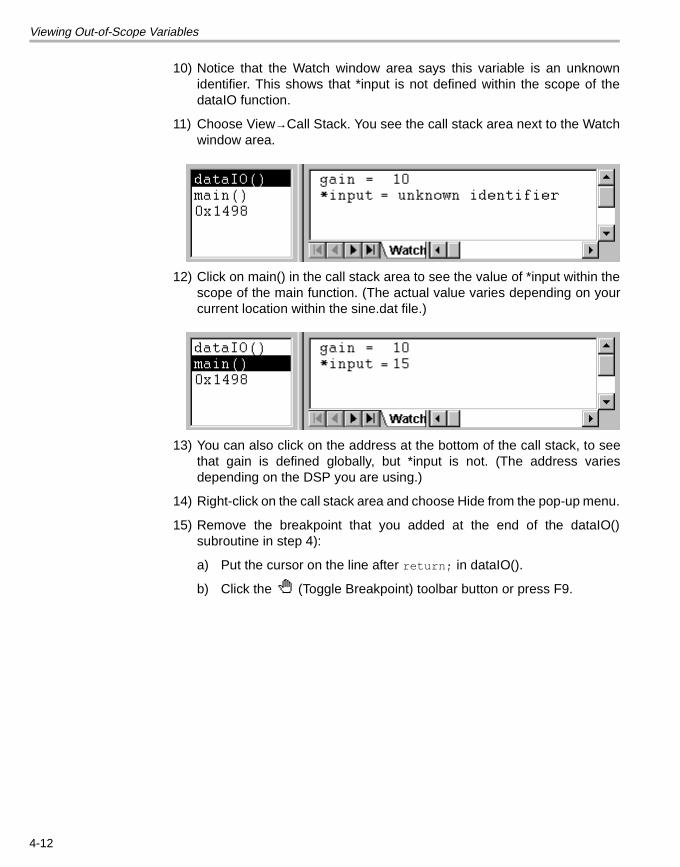
Viewing Out-of-Scope Variables
10) Notice that the Watch window area says this variable is an unknownidentifier. This shows that *input is not defined within the scope of thedataIO function.
11) Choose View→Call Stack. You see the call stack area next to the Watchwindow area.
12) Click on main() in the call stack area to see the value of *input within thescope of the main function. (The actual value varies depending on yourcurrent location within the sine.dat file.)
13) You can also click on the address at the bottom of the call stack, to seethat gain is defined globally, but *input is not. (The address variesdepending on the DSP you are using.)
14) Right-click on the call stack area and choose Hide from the pop-up menu.
15) Remove the breakpoint that you added at the end of the dataIO()subroutine in step 4):
a) Put the cursor on the line after return; in dataIO().
b) Click the (Toggle Breakpoint) toolbar button or press F9.
4-12
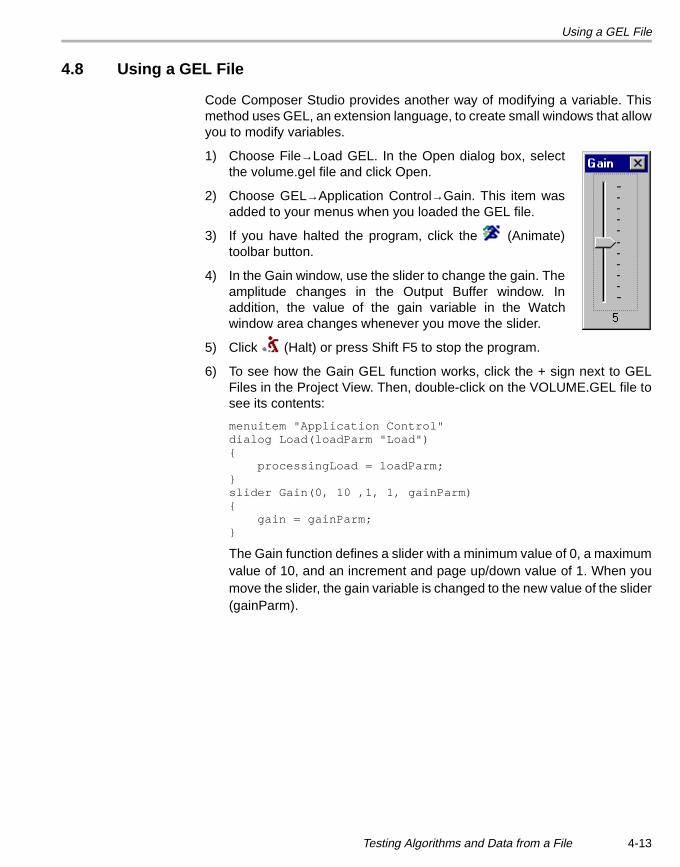
Using a GEL File
4.8 Using a GEL File
Code Composer Studio provides another way of modifying a variable. Thismethod uses GEL, an extension language, to create small windows that allowyou to modify variables.
1) Choose File→Load GEL. In the Open dialog box, selectthe volume.gel file and click Open.
2) Choose GEL→Application Control→Gain. This item wasadded to your menus when you loaded the GEL file.
3) If you have halted the program, click the (Animate)toolbar button.
4) In the Gain window, use the slider to change the gain. Theamplitude changes in the Output Buffer window. Inaddition, the value of the gain variable in the Watchwindow area changes whenever you move the slider.
5) Click (Halt) or press Shift F5 to stop the program.
6) To see how the Gain GEL function works, click the + sign next to GELFiles in the Project View. Then, double-click on the VOLUME.GEL file tosee its contents:
menuitem "Application Control"dialog Load(loadParm "Load"){ processingLoad = loadParm;}slider Gain(0, 10 ,1, 1, gainParm){ gain = gainParm;}
The Gain function defines a slider with a minimum value of 0, a maximumvalue of 10, and an increment and page up/down value of 1. When youmove the slider, the gain variable is changed to the new value of the slider(gainParm).
Testing Algorithms and Data from a File 4-13
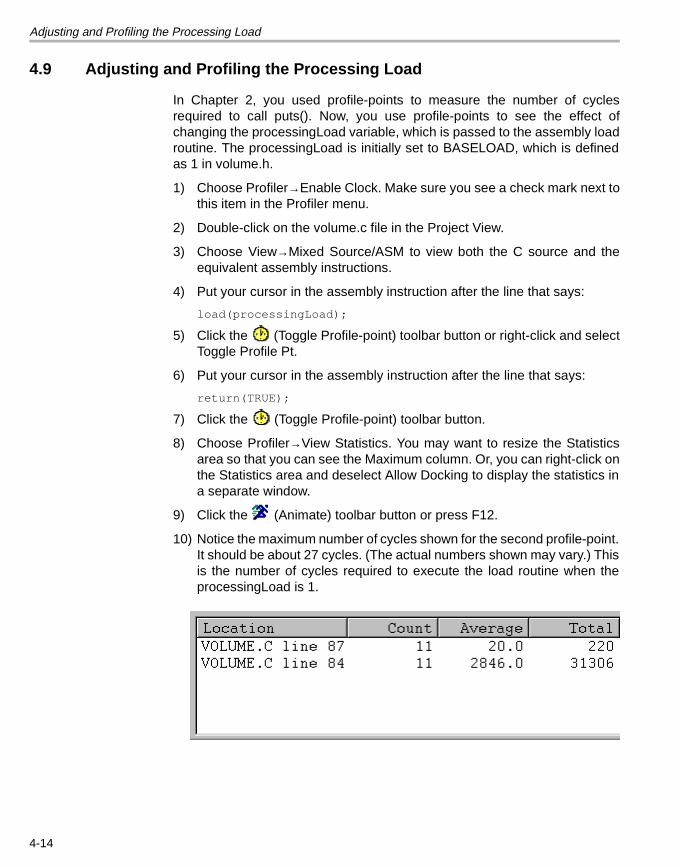
Adjusting and Profiling the Processing Load
4.9 Adjusting and Profiling the Processing Load
In Chapter 2, you used profile-points to measure the number of cyclesrequired to call puts(). Now, you use profile-points to see the effect ofchanging the processingLoad variable, which is passed to the assembly loadroutine. The processingLoad is initially set to BASELOAD, which is definedas 1 in volume.h.
1) Choose Profiler→Enable Clock. Make sure you see a check mark next tothis item in the Profiler menu.
2) Double-click on the volume.c file in the Project View.
3) Choose View→Mixed Source/ASM to view both the C source and theequivalent assembly instructions.
4) Put your cursor in the assembly instruction after the line that says:
load(processingLoad);
5) Click the (Toggle Profile-point) toolbar button or right-click and selectToggle Profile Pt.
6) Put your cursor in the assembly instruction after the line that says:
return(TRUE);
7) Click the (Toggle Profile-point) toolbar button.
8) Choose Profiler→View Statistics. You may want to resize the Statisticsarea so that you can see the Maximum column. Or, you can right-click onthe Statistics area and deselect Allow Docking to display the statistics ina separate window.
9) Click the (Animate) toolbar button or press F12.
10) Notice the maximum number of cycles shown for the second profile-point.It should be about 27 cycles. (The actual numbers shown may vary.) Thisis the number of cycles required to execute the load routine when theprocessingLoad is 1.
4-14
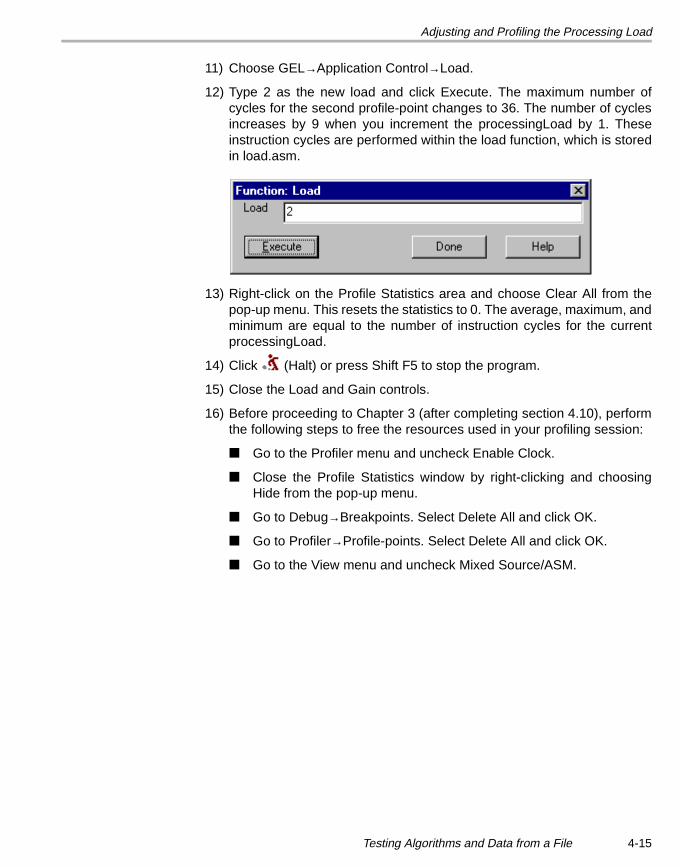
Adjusting and Profiling the Processing Load
11) Choose GEL→Application Control→Load.
12) Type 2 as the new load and click Execute. The maximum number ofcycles for the second profile-point changes to 36. The number of cyclesincreases by 9 when you increment the processingLoad by 1. Theseinstruction cycles are performed within the load function, which is storedin load.asm.
13) Right-click on the Profile Statistics area and choose Clear All from thepop-up menu. This resets the statistics to 0. The average, maximum, andminimum are equal to the number of instruction cycles for the currentprocessingLoad.
14) Click (Halt) or press Shift F5 to stop the program.
15) Close the Load and Gain controls.
16) Before proceeding to Chapter 3 (after completing section 4.10), performthe following steps to free the resources used in your profiling session:
■ Go to the Profiler menu and uncheck Enable Clock.
■ Close the Profile Statistics window by right-clicking and choosingHide from the pop-up menu.
■ Go to Debug→Breakpoints. Select Delete All and click OK.
■ Go to Profiler→Profile-points. Select Delete All and click OK.
■ Go to the View menu and uncheck Mixed Source/ASM.
Testing Algorithms and Data from a File 4-15
Things to Try
4.10 Things to Try
To explore using Code Composer Studio, try the following:
❏ Add processingLoad to the Watch window. When you use the Load GELcontrol, the processingLoad value is updated in the Watch window.
❏ Right-click on the Watch window area and choose Insert NewExpression. Click the Help button and read about the display formats youcan use. Experiment with various display formats. For example, you cantype *input,x as the expression to view the sine input in hexadecimalformat.
❏ Change BUFSIZE in volume.h to 0x78 and rebuild, then reload theprogram. Change the Length in the File I/O dialog to 0x78 and theAcquisition Buffer Size for both graphs to 0x78. This causes a buffer tocontain 3 full sine waves rather than 2.5 waves. Animate the program andnotice that the input and output buffer graphs are now in phase. (You mayneed to halt the program to see whether the graphs are in phase.)
❏ Instead of using profile-points to gather statistics, try using the clock.Replace the profile-points with breakpoints. Choose Profiler→ViewClock. Run the program to the first breakpoint. Double-click on the clockarea to clear it. Run the program again. The clock shows the number ofcycles it takes to reach the second breakpoint.
❏ To practice using the project-building capabilities of Code ComposerStudio, copy all files from the c:\ti\c6000\tutorial\volume1 folder to a newfolder. Delete the volume.mak file. Then, use Code Composer Studio torecreate the project. You need to use the Project→New menu item andthe Project→Add Files to Project menu item. See section 4.1 for a list ofthe files to add to the project.
4.11 Learning More
To learn more about Probe Points, graphs, animation, and GEL files, see theonline help for Code Composer Studio or the Code Composer Studio User’sGuide (which is provided as an Adobe Acrobat file).
4-16
Chapter 5
Debugging Program Behavior
This chapter introduces techniques for debugging a program and severalDSP/BIOS plug-ins and modules.
In this chapter, you modify the example from Chapter 4 to create a programthat schedules its functions and allows for multi-threading. You viewperformance information for debugging purposes. You also use morefeatures of DSP/BIOS, including the Execution Graph, the real-time analysiscontrol panel (RTA Control Panel), the Statistics View, and the CLK, SWI,STS, and TRC modules.
This chapter requires a physical board and cannot be carried out using asoftware simulator. Also, this chapter requires the DSP/BIOS components ofCode Composer Studio.
5.1 Opening and Examining the Project . . . . . . . . . . . . . . . . . . . . . . . . . 5–2
5.2 Reviewing the Source Code . . . . . . . . . . . . . . . . . . . . . . . . . . . . . . . . 5–3
5.3 Modifying the Configuration File . . . . . . . . . . . . . . . . . . . . . . . . . . . . 5–6
5.4 Viewing Task Execution with the Execution Graph . . . . . . . . . . . . 5–10
5.5 Changing and Viewing the Load . . . . . . . . . . . . . . . . . . . . . . . . . . . 5–12
5.6 Analyzing Task Statistics . . . . . . . . . . . . . . . . . . . . . . . . . . . . . . . . . 5–15
5.7 Adding Explicit STS Instrumentation . . . . . . . . . . . . . . . . . . . . . . . 5–17
5.8 Viewing Explicit Instrumentation . . . . . . . . . . . . . . . . . . . . . . . . . . . 5–18
5.9 Things to Try . . . . . . . . . . . . . . . . . . . . . . . . . . . . . . . . . . . . . . . . . . . 5–20
5.10 Learning More . . . . . . . . . . . . . . . . . . . . . . . . . . . . . . . . . . . . . . . . . . 5–20
Topic Page
5-1
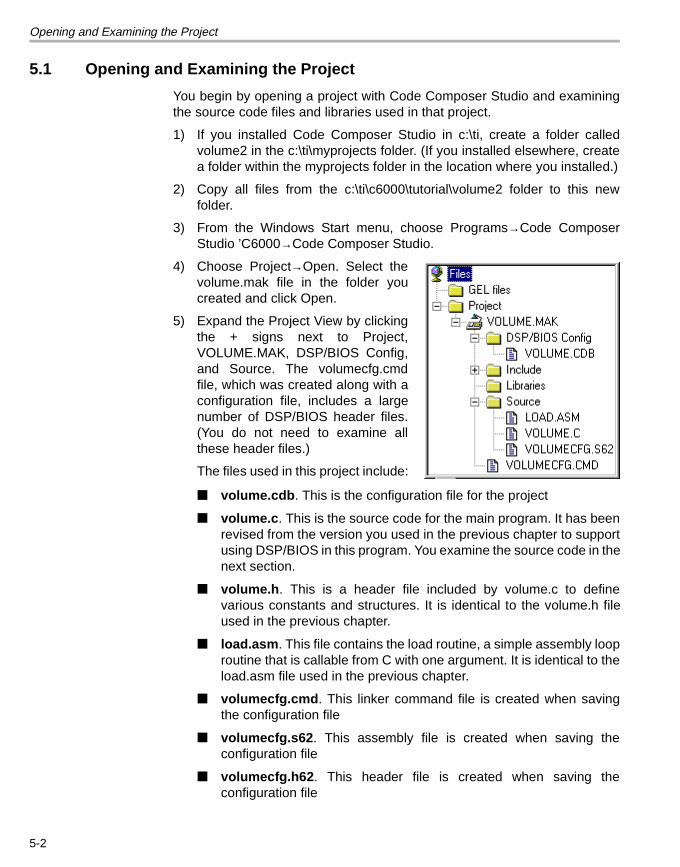
Opening and Examining the Project
5.1 Opening and Examining the Project
You begin by opening a project with Code Composer Studio and examiningthe source code files and libraries used in that project.
1) If you installed Code Composer Studio in c:\ti, create a folder calledvolume2 in the c:\ti\myprojects folder. (If you installed elsewhere, createa folder within the myprojects folder in the location where you installed.)
2) Copy all files from the c:\ti\c6000\tutorial\volume2 folder to this newfolder.
3) From the Windows Start menu, choose Programs→Code ComposerStudio ’C6000→Code Composer Studio.
4) Choose Project→Open. Select thevolume.mak file in the folder youcreated and click Open.
5) Expand the Project View by clickingthe + signs next to Project,VOLUME.MAK, DSP/BIOS Config,and Source. The volumecfg.cmdfile, which was created along with aconfiguration file, includes a largenumber of DSP/BIOS header files.(You do not need to examine allthese header files.)
The files used in this project include:
■ volume.cdb. This is the configuration file for the project
■ volume.c. This is the source code for the main program. It has beenrevised from the version you used in the previous chapter to supportusing DSP/BIOS in this program. You examine the source code in thenext section.
■ volume.h. This is a header file included by volume.c to definevarious constants and structures. It is identical to the volume.h fileused in the previous chapter.
■ load.asm. This file contains the load routine, a simple assembly looproutine that is callable from C with one argument. It is identical to theload.asm file used in the previous chapter.
■ volumecfg.cmd. This linker command file is created when savingthe configuration file
■ volumecfg.s62. This assembly file is created when saving theconfiguration file
■ volumecfg.h62. This header file is created when saving theconfiguration file
5-2
Reviewing the Source Code
5.2 Reviewing the Source Code
This example modifies the example from Chapter 4 to introduce real-timebehavior. Rather than having the main function loop forever, the data I/O inthe real application is likely to happen as a result of a periodic externalinterrupt. A simple way to simulate a periodic external interrupt in the exampleis to use the timer interrupt from the on-chip timer.
1) Double-click on the volume.c file in the Project View to see the sourcecode in the right half of the Code Composer Studio window.
2) Notice the following aspects of the example:
■ The data types for declarations have changed. DSP/BIOS providesdatatypes that are portable to other processors. Most types used byDSP/BIOS are capitalized versions of the corresponding C types.
■ The code uses #include to reference three DSP/BIOS header files:std.h, log.h, and swi.h. The std.h file must be included before otherDSP/BIOS header files.
■ The objects created in the configuration file are declared as external.You examine the configuration file in the next section.
■ The main function no longer calls the dataIO and processingfunctions. Instead, the main function simply returns after callingLOG_printf to display a message. This drops the program into theDSP/BIOS idle loop. At this point, the DSP/BIOS scheduler managesthread execution.
■ The processing function is now called by a software interrupt calledprocessing_SWI, which yields to all hardware interrupts.Alternatively, a hardware ISR could perform the signal processingdirectly. However, signal processing may require a large number ofcycles, possibly more than the time until the next interrupt. Suchprocessing would prevent the interrupt from being handled.
■ The dataIO function calls SWI_dec, which decrements a counterassociated with a software interrupt object. When the counterreaches 0, the software interrupt schedules its function for executionand resets the counter.
The dataIO function simulates hardware-based data I/O. A typicalprogram accumulates data in a buffer until it has enough data toprocess. In this example, the dataIO function is performed 10 timesfor each time the processing function is performed. The counterdecremented by SWI_dec controls this.
Debugging Program Behavior 5-3
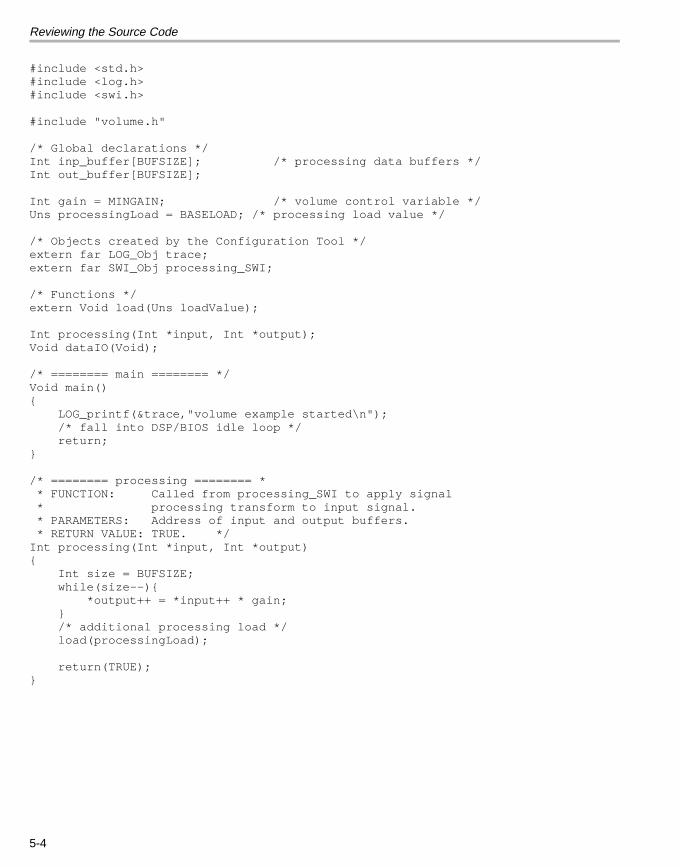
Reviewing the Source Code
#include <std.h>#include <log.h>#include <swi.h>
#include "volume.h"
/* Global declarations */Int inp_buffer[BUFSIZE]; /* processing data buffers */Int out_buffer[BUFSIZE];
Int gain = MINGAIN; /* volume control variable */Uns processingLoad = BASELOAD; /* processing load value */
/* Objects created by the Configuration Tool */extern far LOG_Obj trace;extern far SWI_Obj processing_SWI;
/* Functions */extern Void load(Uns loadValue);
Int processing(Int *input, Int *output);Void dataIO(Void);
/* ======== main ======== */Void main(){ LOG_printf(&trace,"volume example started\n"); /* fall into DSP/BIOS idle loop */ return;}
/* ======== processing ======== * * FUNCTION: Called from processing_SWI to apply signal * processing transform to input signal. * PARAMETERS: Address of input and output buffers. * RETURN VALUE: TRUE. */Int processing(Int *input, Int *output){ Int size = BUFSIZE; while(size--){ *output++ = *input++ * gain; } /* additional processing load */ load(processingLoad); return(TRUE);}
5-4
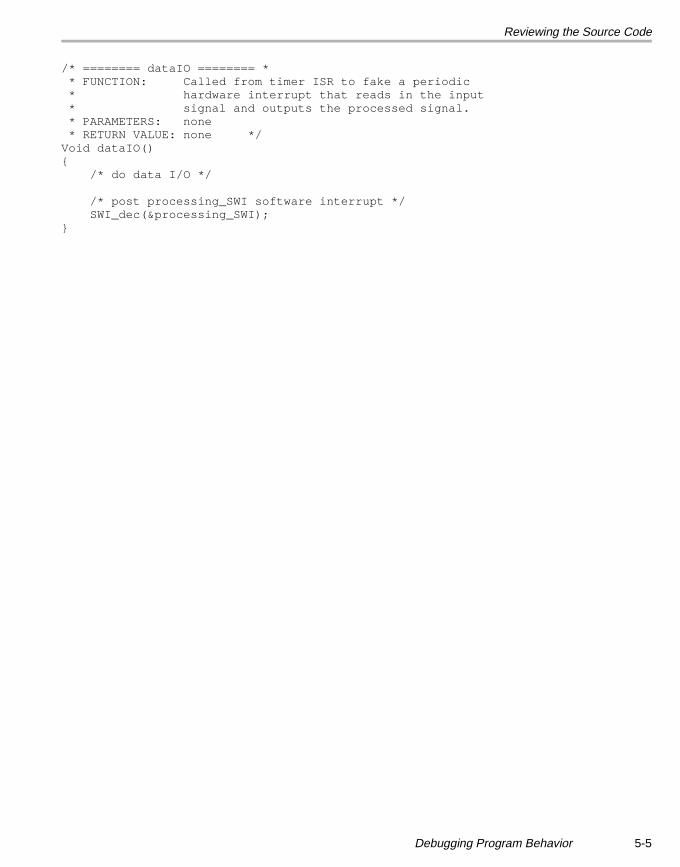
Reviewing the Source Code
/* ======== dataIO ======== * * FUNCTION: Called from timer ISR to fake a periodic * hardware interrupt that reads in the input * signal and outputs the processed signal. * PARAMETERS: none * RETURN VALUE: none */Void dataIO(){ /* do data I/O */ /* post processing_SWI software interrupt */ SWI_dec(&processing_SWI); }
Debugging Program Behavior 5-5
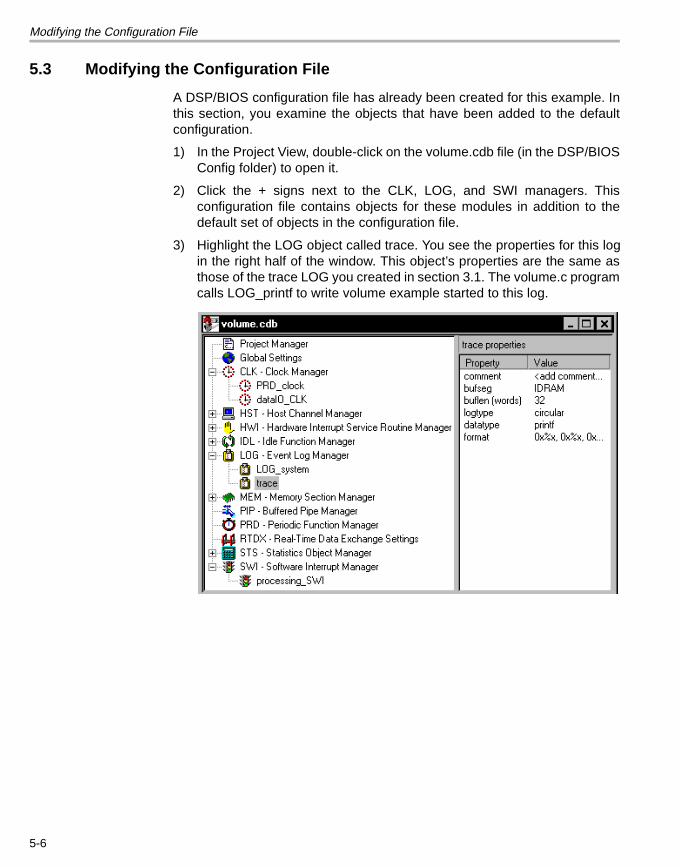
Modifying the Configuration File
5.3 Modifying the Configuration File
A DSP/BIOS configuration file has already been created for this example. Inthis section, you examine the objects that have been added to the defaultconfiguration.
1) In the Project View, double-click on the volume.cdb file (in the DSP/BIOSConfig folder) to open it.
2) Click the + signs next to the CLK, LOG, and SWI managers. Thisconfiguration file contains objects for these modules in addition to thedefault set of objects in the configuration file.
3) Highlight the LOG object called trace. You see the properties for this login the right half of the window. This object’s properties are the same asthose of the trace LOG you created in section 3.1. The volume.c programcalls LOG_printf to write volume example started to this log.
5-6
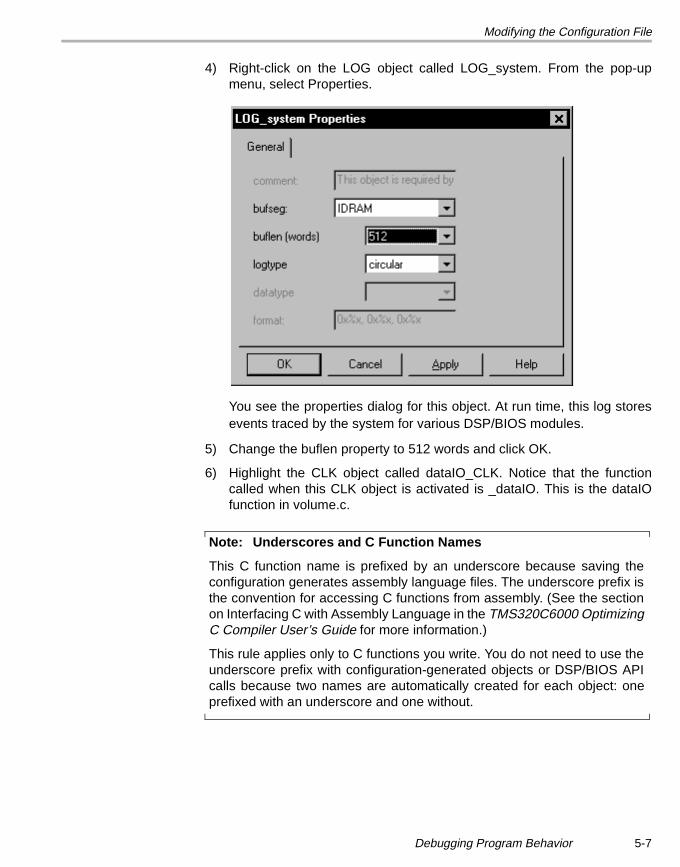
Modifying the Configuration File
4) Right-click on the LOG object called LOG_system. From the pop-upmenu, select Properties.
You see the properties dialog for this object. At run time, this log storesevents traced by the system for various DSP/BIOS modules.
5) Change the buflen property to 512 words and click OK.
6) Highlight the CLK object called dataIO_CLK. Notice that the functioncalled when this CLK object is activated is _dataIO. This is the dataIOfunction in volume.c.
Note: Underscores and C Function Names
This C function name is prefixed by an underscore because saving theconfiguration generates assembly language files. The underscore prefix isthe convention for accessing C functions from assembly. (See the sectionon Interfacing C with Assembly Language in the TMS320C6000 OptimizingC Compiler User’s Guide for more information.)
This rule applies only to C functions you write. You do not need to use theunderscore prefix with configuration-generated objects or DSP/BIOS APIcalls because two names are automatically created for each object: oneprefixed with an underscore and one without.
Debugging Program Behavior 5-7
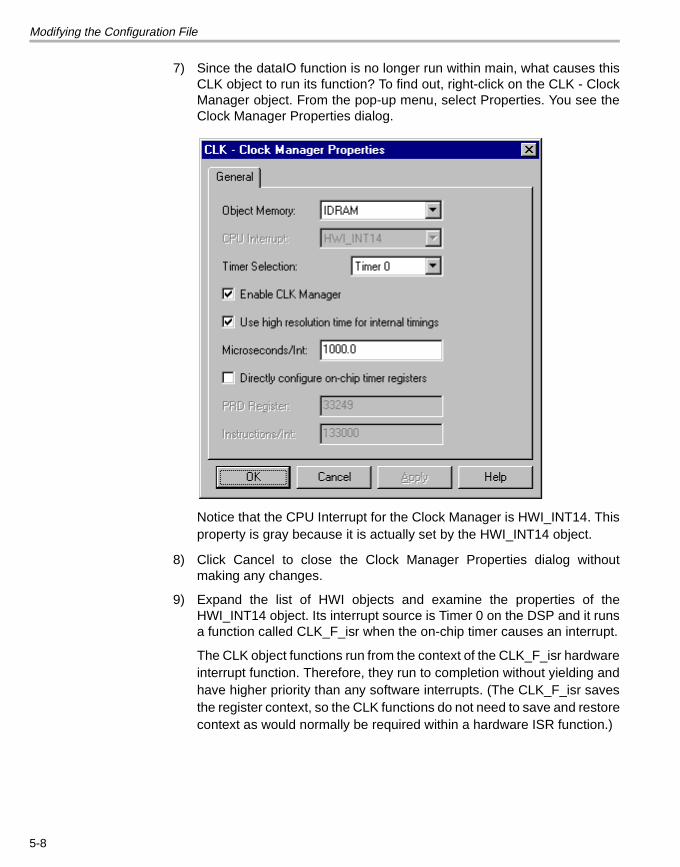
Modifying the Configuration File
7) Since the dataIO function is no longer run within main, what causes thisCLK object to run its function? To find out, right-click on the CLK - ClockManager object. From the pop-up menu, select Properties. You see theClock Manager Properties dialog.
Notice that the CPU Interrupt for the Clock Manager is HWI_INT14. Thisproperty is gray because it is actually set by the HWI_INT14 object.
8) Click Cancel to close the Clock Manager Properties dialog withoutmaking any changes.
9) Expand the list of HWI objects and examine the properties of theHWI_INT14 object. Its interrupt source is Timer 0 on the DSP and it runsa function called CLK_F_isr when the on-chip timer causes an interrupt.
The CLK object functions run from the context of the CLK_F_isr hardwareinterrupt function. Therefore, they run to completion without yielding andhave higher priority than any software interrupts. (The CLK_F_isr savesthe register context, so the CLK functions do not need to save and restorecontext as would normally be required within a hardware ISR function.)
5-8
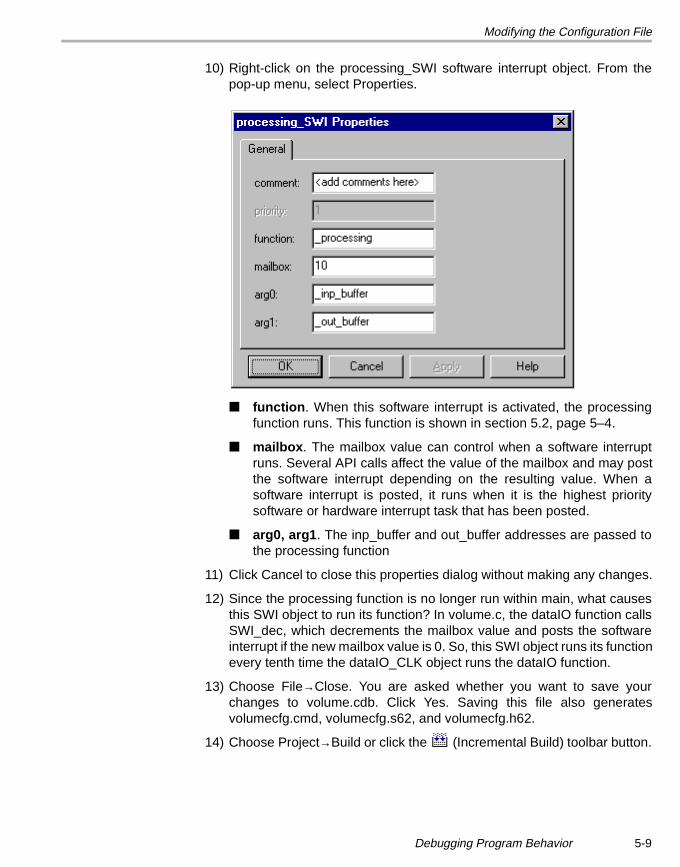
Modifying the Configuration File
10) Right-click on the processing_SWI software interrupt object. From thepop-up menu, select Properties.
■ function. When this software interrupt is activated, the processingfunction runs. This function is shown in section 5.2, page 5–4.
■ mailbox. The mailbox value can control when a software interruptruns. Several API calls affect the value of the mailbox and may postthe software interrupt depending on the resulting value. When asoftware interrupt is posted, it runs when it is the highest prioritysoftware or hardware interrupt task that has been posted.
■ arg0, arg1. The inp_buffer and out_buffer addresses are passed tothe processing function
11) Click Cancel to close this properties dialog without making any changes.
12) Since the processing function is no longer run within main, what causesthis SWI object to run its function? In volume.c, the dataIO function callsSWI_dec, which decrements the mailbox value and posts the softwareinterrupt if the new mailbox value is 0. So, this SWI object runs its functionevery tenth time the dataIO_CLK object runs the dataIO function.
13) Choose File→Close. You are asked whether you want to save yourchanges to volume.cdb. Click Yes. Saving this file also generatesvolumecfg.cmd, volumecfg.s62, and volumecfg.h62.
14) Choose Project→Build or click the (Incremental Build) toolbar button.
Debugging Program Behavior 5-9
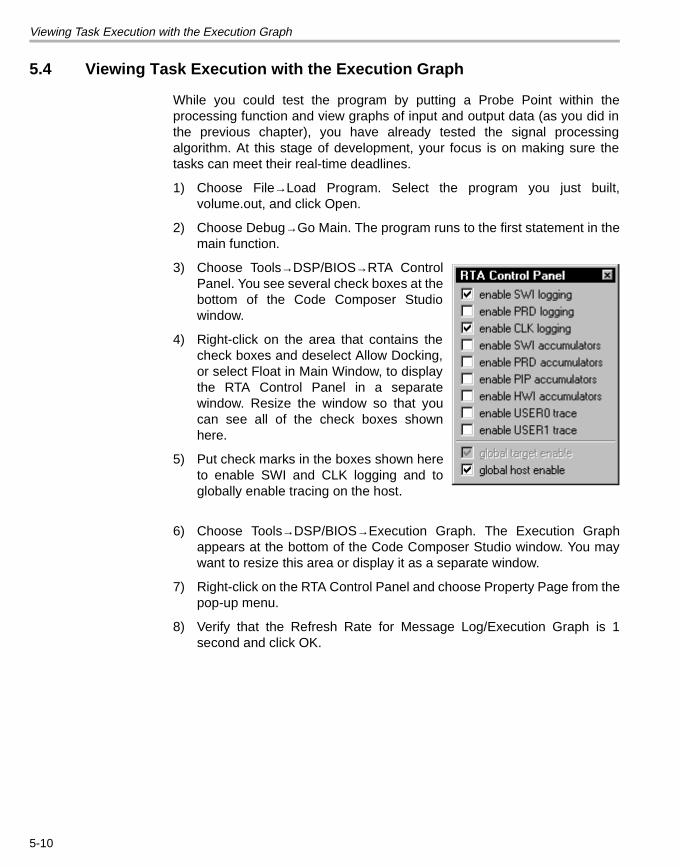
Viewing Task Execution with the Execution Graph
5.4 Viewing Task Execution with the Execution Graph
While you could test the program by putting a Probe Point within theprocessing function and view graphs of input and output data (as you did inthe previous chapter), you have already tested the signal processingalgorithm. At this stage of development, your focus is on making sure thetasks can meet their real-time deadlines.
1) Choose File→Load Program. Select the program you just built,volume.out, and click Open.
2) Choose Debug→Go Main. The program runs to the first statement in themain function.
3) Choose Tools→DSP/BIOS→RTA ControlPanel. You see several check boxes at thebottom of the Code Composer Studiowindow.
4) Right-click on the area that contains thecheck boxes and deselect Allow Docking,or select Float in Main Window, to displaythe RTA Control Panel in a separatewindow. Resize the window so that youcan see all of the check boxes shownhere.
5) Put check marks in the boxes shown hereto enable SWI and CLK logging and toglobally enable tracing on the host.
6) Choose Tools→DSP/BIOS→Execution Graph. The Execution Graphappears at the bottom of the Code Composer Studio window. You maywant to resize this area or display it as a separate window.
7) Right-click on the RTA Control Panel and choose Property Page from thepop-up menu.
8) Verify that the Refresh Rate for Message Log/Execution Graph is 1second and click OK.
5-10
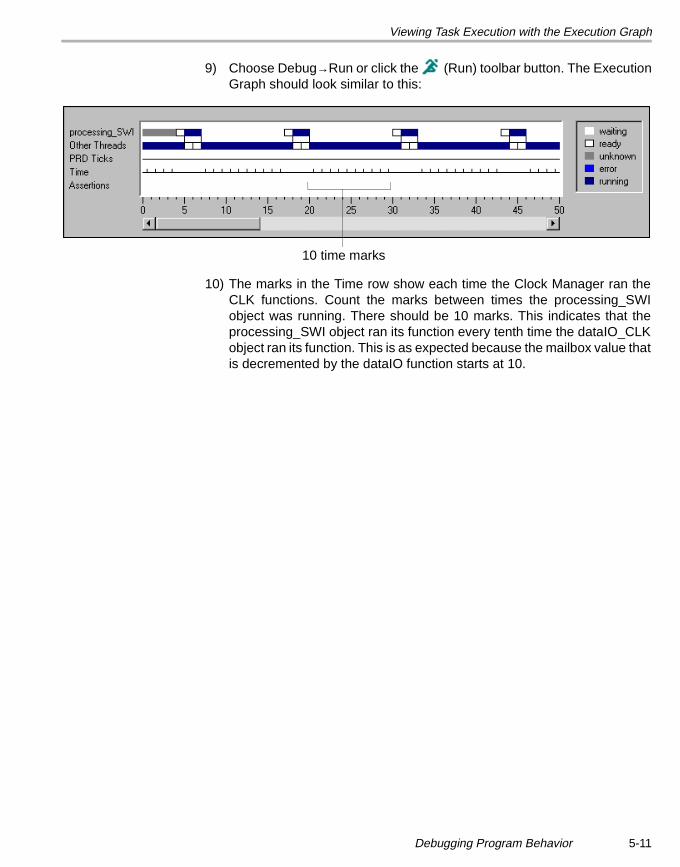
Viewing Task Execution with the Execution Graph
9) Choose Debug→Run or click the (Run) toolbar button. The ExecutionGraph should look similar to this:
10) The marks in the Time row show each time the Clock Manager ran theCLK functions. Count the marks between times the processing_SWIobject was running. There should be 10 marks. This indicates that theprocessing_SWI object ran its function every tenth time the dataIO_CLKobject ran its function. This is as expected because the mailbox value thatis decremented by the dataIO function starts at 10.
10 time marks
Debugging Program Behavior 5-11
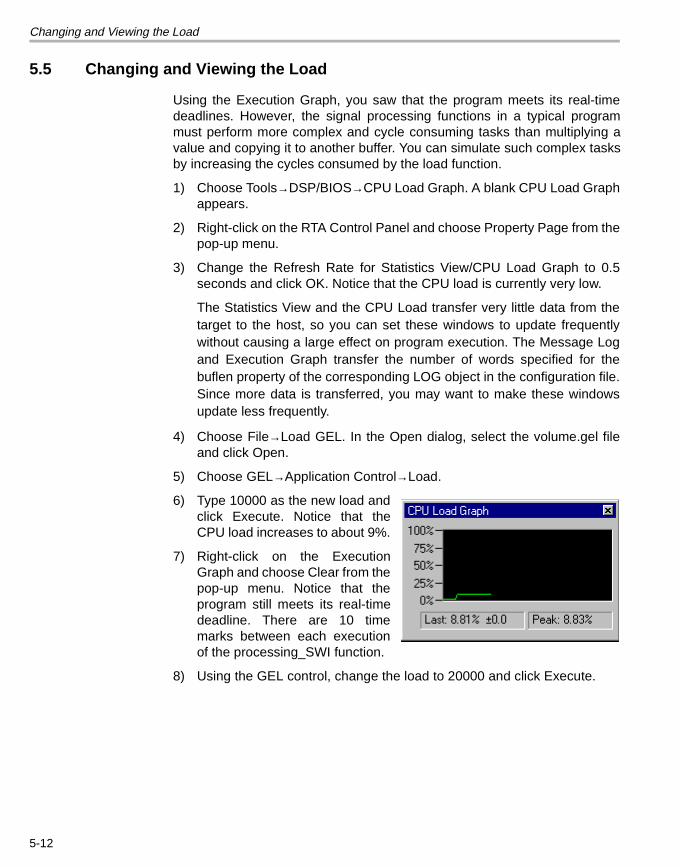
Changing and Viewing the Load
5.5 Changing and Viewing the Load
Using the Execution Graph, you saw that the program meets its real-timedeadlines. However, the signal processing functions in a typical programmust perform more complex and cycle consuming tasks than multiplying avalue and copying it to another buffer. You can simulate such complex tasksby increasing the cycles consumed by the load function.
1) Choose Tools→DSP/BIOS→CPU Load Graph. A blank CPU Load Graphappears.
2) Right-click on the RTA Control Panel and choose Property Page from thepop-up menu.
3) Change the Refresh Rate for Statistics View/CPU Load Graph to 0.5seconds and click OK. Notice that the CPU load is currently very low.
The Statistics View and the CPU Load transfer very little data from thetarget to the host, so you can set these windows to update frequentlywithout causing a large effect on program execution. The Message Logand Execution Graph transfer the number of words specified for thebuflen property of the corresponding LOG object in the configuration file.Since more data is transferred, you may want to make these windowsupdate less frequently.
4) Choose File→Load GEL. In the Open dialog, select the volume.gel fileand click Open.
5) Choose GEL→Application Control→Load.
6) Type 10000 as the new load andclick Execute. Notice that theCPU load increases to about 9%.
7) Right-click on the ExecutionGraph and choose Clear from thepop-up menu. Notice that theprogram still meets its real-timedeadline. There are 10 timemarks between each executionof the processing_SWI function.
8) Using the GEL control, change the load to 20000 and click Execute.
5-12
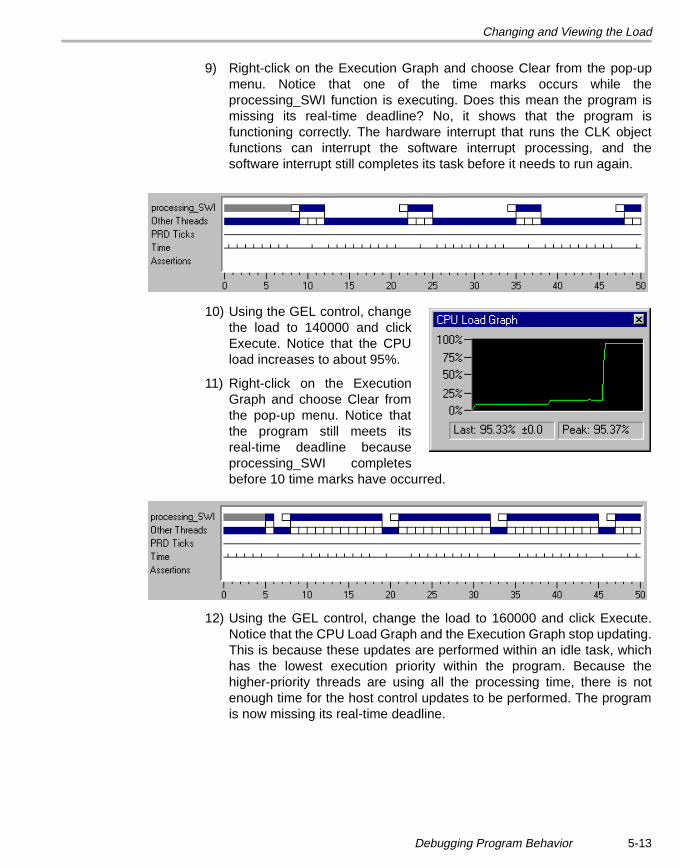
Changing and Viewing the Load
9) Right-click on the Execution Graph and choose Clear from the pop-upmenu. Notice that one of the time marks occurs while theprocessing_SWI function is executing. Does this mean the program ismissing its real-time deadline? No, it shows that the program isfunctioning correctly. The hardware interrupt that runs the CLK objectfunctions can interrupt the software interrupt processing, and thesoftware interrupt still completes its task before it needs to run again.
10) Using the GEL control, changethe load to 140000 and clickExecute. Notice that the CPUload increases to about 95%.
11) Right-click on the ExecutionGraph and choose Clear fromthe pop-up menu. Notice thatthe program still meets itsreal-time deadline becauseprocessing_SWI completesbefore 10 time marks have occurred.
12) Using the GEL control, change the load to 160000 and click Execute.Notice that the CPU Load Graph and the Execution Graph stop updating.This is because these updates are performed within an idle task, whichhas the lowest execution priority within the program. Because thehigher-priority threads are using all the processing time, there is notenough time for the host control updates to be performed. The programis now missing its real-time deadline.
Debugging Program Behavior 5-13
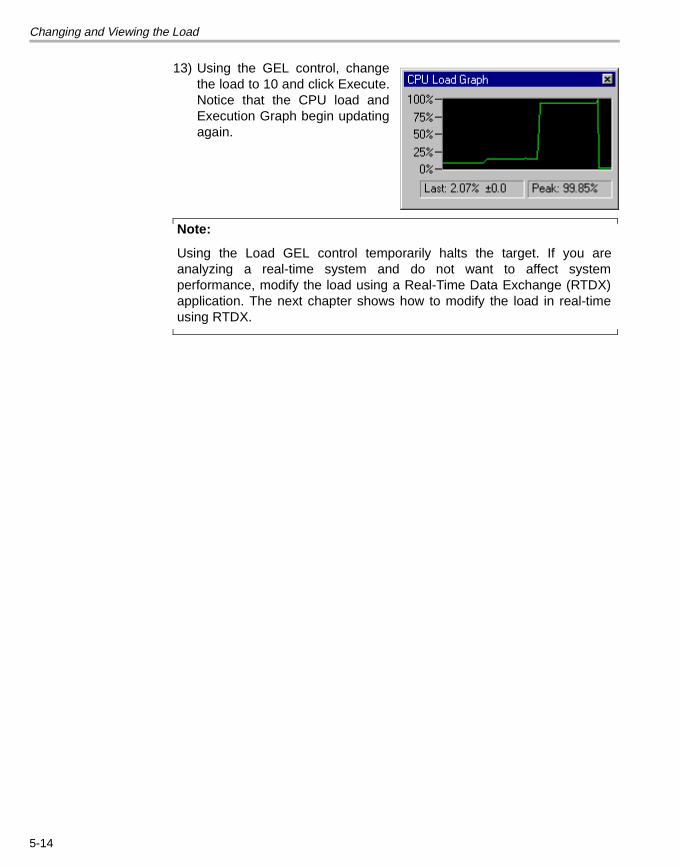
Changing and Viewing the Load
13) Using the GEL control, changethe load to 10 and click Execute.Notice that the CPU load andExecution Graph begin updatingagain.
Note:
Using the Load GEL control temporarily halts the target. If you areanalyzing a real-time system and do not want to affect systemperformance, modify the load using a Real-Time Data Exchange (RTDX)application. The next chapter shows how to modify the load in real-timeusing RTDX.
5-14
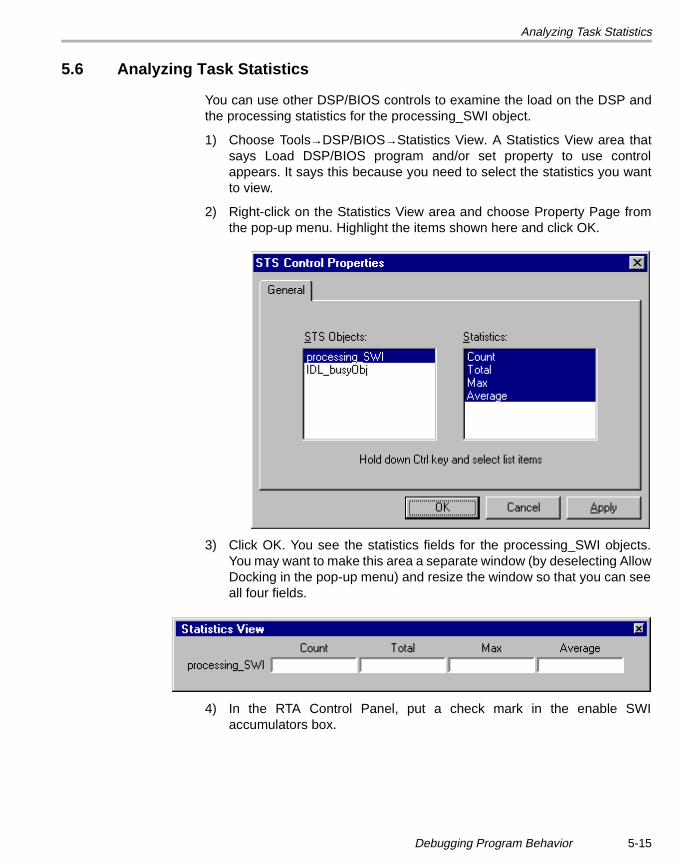
Analyzing Task Statistics
5.6 Analyzing Task Statistics
You can use other DSP/BIOS controls to examine the load on the DSP andthe processing statistics for the processing_SWI object.
1) Choose Tools→DSP/BIOS→Statistics View. A Statistics View area thatsays Load DSP/BIOS program and/or set property to use controlappears. It says this because you need to select the statistics you wantto view.
2) Right-click on the Statistics View area and choose Property Page fromthe pop-up menu. Highlight the items shown here and click OK.
3) Click OK. You see the statistics fields for the processing_SWI objects.You may want to make this area a separate window (by deselecting AllowDocking in the pop-up menu) and resize the window so that you can seeall four fields.
4) In the RTA Control Panel, put a check mark in the enable SWIaccumulators box.
Debugging Program Behavior 5-15
Analyzing Task Statistics
5) If you have halted the program, click the (Run) toolbar button.
6) Notice the Max value in the Statistics View.
7) Using the GEL control, increase the load and click Execute. Notice thechange in the Max value for the number of instructions performed fromthe beginning to the end of processing_SWI increases.
8) Experiment with different load values. If you decrease the load, right-clickon the Statistics View and select Clear from the pop-up menu.
This resets the fields to their lowest possible values, allowing you to seethe current number of instruction cycles in the Max field.
9) Click the (Halt) toolbar button and close all the DSP/BIOS and GELcontrols you have opened.
5-16
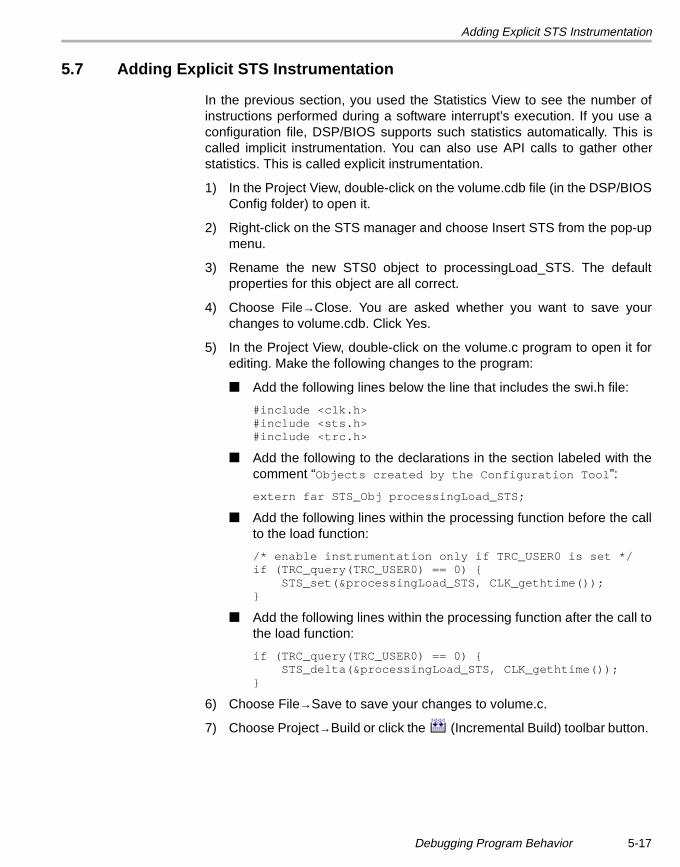
Adding Explicit STS Instrumentation
5.7 Adding Explicit STS Instrumentation
In the previous section, you used the Statistics View to see the number ofinstructions performed during a software interrupt’s execution. If you use aconfiguration file, DSP/BIOS supports such statistics automatically. This iscalled implicit instrumentation. You can also use API calls to gather otherstatistics. This is called explicit instrumentation.
1) In the Project View, double-click on the volume.cdb file (in the DSP/BIOSConfig folder) to open it.
2) Right-click on the STS manager and choose Insert STS from the pop-upmenu.
3) Rename the new STS0 object to processingLoad_STS. The defaultproperties for this object are all correct.
4) Choose File→Close. You are asked whether you want to save yourchanges to volume.cdb. Click Yes.
5) In the Project View, double-click on the volume.c program to open it forediting. Make the following changes to the program:
■ Add the following lines below the line that includes the swi.h file:
#include <clk.h>#include <sts.h>#include <trc.h>
■ Add the following to the declarations in the section labeled with thecomment “Objects created by the Configuration Tool”:
extern far STS_Obj processingLoad_STS;
■ Add the following lines within the processing function before the callto the load function:
/* enable instrumentation only if TRC_USER0 is set */if (TRC_query(TRC_USER0) == 0) { STS_set(&processingLoad_STS, CLK_gethtime());}
■ Add the following lines within the processing function after the call tothe load function:
if (TRC_query(TRC_USER0) == 0) { STS_delta(&processingLoad_STS, CLK_gethtime());}
6) Choose File→Save to save your changes to volume.c.
7) Choose Project→Build or click the (Incremental Build) toolbar button.
Debugging Program Behavior 5-17
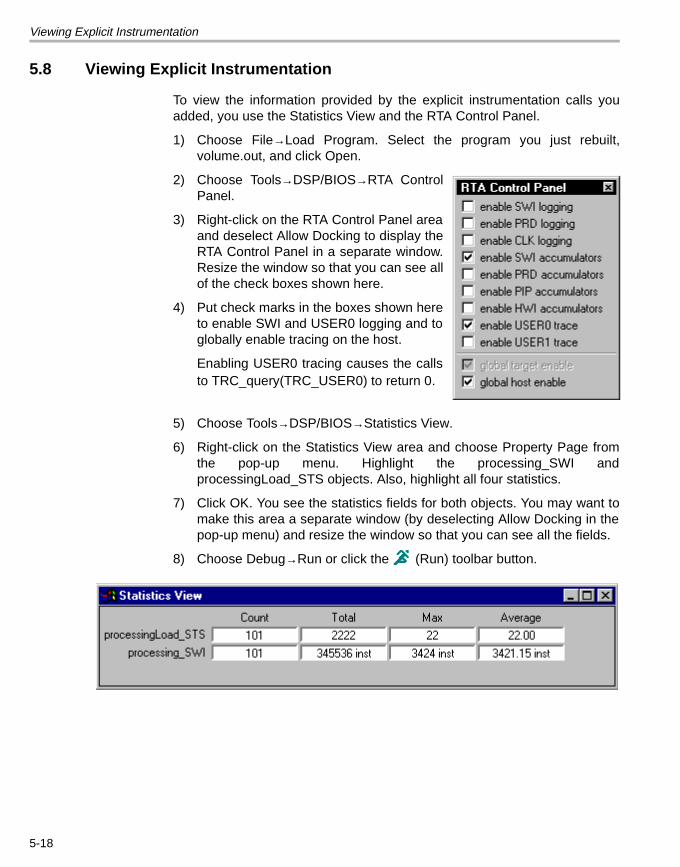
Viewing Explicit Instrumentation
5.8 Viewing Explicit Instrumentation
To view the information provided by the explicit instrumentation calls youadded, you use the Statistics View and the RTA Control Panel.
1) Choose File→Load Program. Select the program you just rebuilt,volume.out, and click Open.
2) Choose Tools→DSP/BIOS→RTA ControlPanel.
3) Right-click on the RTA Control Panel areaand deselect Allow Docking to display theRTA Control Panel in a separate window.Resize the window so that you can see allof the check boxes shown here.
4) Put check marks in the boxes shown hereto enable SWI and USER0 logging and toglobally enable tracing on the host.
Enabling USER0 tracing causes the callsto TRC_query(TRC_USER0) to return 0.
5) Choose Tools→DSP/BIOS→Statistics View.
6) Right-click on the Statistics View area and choose Property Page fromthe pop-up menu. Highlight the processing_SWI andprocessingLoad_STS objects. Also, highlight all four statistics.
7) Click OK. You see the statistics fields for both objects. You may want tomake this area a separate window (by deselecting Allow Docking in thepop-up menu) and resize the window so that you can see all the fields.
8) Choose Debug→Run or click the (Run) toolbar button.
5-18
Viewing Explicit Instrumentation
9) Notice the difference between the Max values for processing_SWI andprocessingLoad_STS. You used the CLK_gethtime function tobenchmark the processing load. On TMS320C6000 DSPs, thehigh-resolution time is incremented every 4 instruction cycles. Multiplythe Max value for processingLoad_STS by 4 and subtract the result fromthe processing_SWI Max value. The result should be about 3308instructions. (The actual numbers shown may vary.) These instructionsare performed within the processing function, but not between the callsto STS_set and STS_delta.
For example, when the load is 10, the processingLoad_STS Max is about49 and the processing_SWI Max is about 3504. (The actual numbersshown may vary.) To calculate the instruction cycles performed within theprocessing function but outside the calls to STS_set and STS_delta, theequation is:
3504 - (49 * 4) = 3308
10) Choose GEL→Application Control→Load. (If you have closed andrestarted Code Composer Studio, you must reload the GEL file.)
11) Change the Load and click Execute.
12) Notice that while both Max values increase, the difference between thetwo Max values (after you multiply the processingLoad_STS Max by 4)stays the same.
13) Remove the check mark from the enable USER0 trace box in the RTAControl Panel.
14) Right-click on the Statistics View and choose Clear from the pop-upmenu.
15) Notice that no values are updated for processingLoad_STS. This isbecause disabling the USER0 trace causes the following statement in theprogram to be false:
if (TRC_query(TRC_USER0) == 0)
As a result, the calls to STS_set and STS_delta are not performed.
16) Before proceeding to the next chapter (after completing section 5.9),perform the following steps to prepare for the next chapter:
■ Click (Halt) or press Shift F5 to stop the program.
■ Close all GEL dialog boxes, DSP/BIOS plug-ins, and sourcewindows.
Debugging Program Behavior 5-19
Things to Try
5.9 Things to Try
To further explore DSP/BIOS, try the following:
❏ Change the Statistics Units property of the SWI Manager in theconfiguration file to milliseconds or microseconds. Rebuild the programand notice how the values in the Statistics View change.
❏ Change the Host Operation property of the processingLoad_STS objectin the configuration file to A * x and the A property to 4. This HostOperation multiplies the statistics by 4. The calls to CLK_getltime causestatistics to be measured in high-resolution timer increments, whichoccur every 4 CPU cycles. So, changing the Host Operation converts thetimer increments to CPU cycles. Rebuild the program and notice how thevalues in the Statistics View change.
❏ Modify volume.c by using the CLK_getltime function instead of theCLK_gethtime function. Rebuild the program and notice how the valuesin the Statistics View change. The CLK_getltime function gets alow-resolution time that corresponds to the timer marks you saw in theExecution Graph. You must increase the load significantly to change theStatistics View values when using CLK_getltime.
5.10 Learning More
To learn more about the CLK, SWI, STS, and TRC modules, see the onlinehelp or the TMS320C6000 DSP/BIOS User’s Guide (which is provided as anAdobe Acrobat file).
5-20
Chapter 6
Analyzing Real-Time Behavior
This chapter introduces techniques for analyzing and correcting real-timeprogram behavior.
In this chapter, you analyze real-time behavior and correct schedulingproblems using the example from Chapter 5. You use RTDX (Real-Time DataExchange) to make real-time changes to the target, use DSP/BIOS periodicfunctions, and set software interrupt priorities.
This chapter requires a physical board and cannot be carried out using asoftware simulator. Also, this chapter requires the DSP/BIOS and RTDXcomponents of Code Composer Studio.
6.1 Opening and Examining the Project . . . . . . . . . . . . . . . . . . . . . . . . . 6–2
6.2 Modifying the Configuration File . . . . . . . . . . . . . . . . . . . . . . . . . . . . 6–3
6.3 Reviewing the Source Code Changes . . . . . . . . . . . . . . . . . . . . . . . . 6–5
6.4 Using the RTDX Control to Change the Load at Run Time . . . . . . . 6–7
6.5 Modifying Software Interrupt Priorities . . . . . . . . . . . . . . . . . . . . . . 6–11
6.6 Things to Try . . . . . . . . . . . . . . . . . . . . . . . . . . . . . . . . . . . . . . . . . . . 6–12
6.7 Learning More . . . . . . . . . . . . . . . . . . . . . . . . . . . . . . . . . . . . . . . . . . 6–12
Topic Page
6-1
Opening and Examining the Project
6.1 Opening and Examining the Project
In this chapter, you’ll modify the example you worked on in the previouschapter.
Note:
If you did not complete the previous chapter, you can copy example filesfrom the volume3 folder that reflect the state of the example at the end ofthe previous chapter. Copy all the files from c:\ti\c6000\tutorial\volume3 (orthe location where you installed Code Composer Studio) to your workingfolder.
1) Copy only the following files from the c:\ti\c6000\tutorial\volume4\ folderto your working folder. (Note that you should not copy all the files from thevolume4 folder. In particular, do not copy the volume.cdb file.)
■ volume.c. The source code has been modified to allow you to usethe RTDX module to change the load without stopping the targetprogram. You examine the changes in section 6.3.
■ loadctrl.exe. This is a simple Windows application written in VisualBasic 5.0. It sends load values to the target in real time using RTDX.
■ loadctrl.frm, loadctrl.frx, loadctrl.vbp. If you have Visual Basic,you can use it to examine these source files for the loadctrlapplication
2) From the Windows Start menu, choose Programs→Code ComposerStudio ’C6000→Code Composer Studio.
3) Choose Project→Open. Select the volume.mak file in your working folderand click Open.
6-2
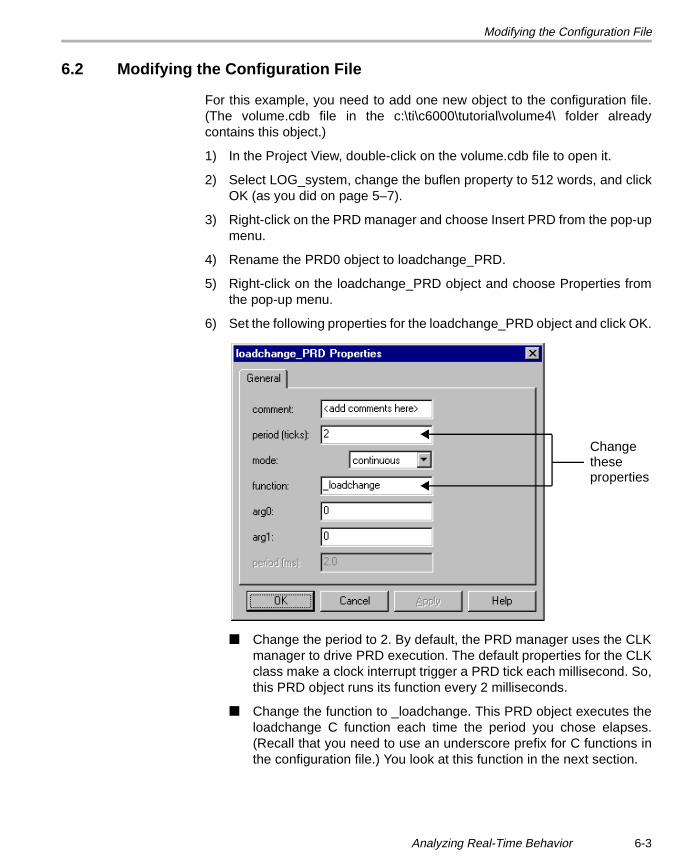
Modifying the Configuration File
6.2 Modifying the Configuration File
For this example, you need to add one new object to the configuration file.(The volume.cdb file in the c:\ti\c6000\tutorial\volume4\ folder alreadycontains this object.)
1) In the Project View, double-click on the volume.cdb file to open it.
2) Select LOG_system, change the buflen property to 512 words, and clickOK (as you did on page 5–7).
3) Right-click on the PRD manager and choose Insert PRD from the pop-upmenu.
4) Rename the PRD0 object to loadchange_PRD.
5) Right-click on the loadchange_PRD object and choose Properties fromthe pop-up menu.
6) Set the following properties for the loadchange_PRD object and click OK.
■ Change the period to 2. By default, the PRD manager uses the CLKmanager to drive PRD execution. The default properties for the CLKclass make a clock interrupt trigger a PRD tick each millisecond. So,this PRD object runs its function every 2 milliseconds.
■ Change the function to _loadchange. This PRD object executes theloadchange C function each time the period you chose elapses.(Recall that you need to use an underscore prefix for C functions inthe configuration file.) You look at this function in the next section.
Changetheseproperties
Analyzing Real-Time Behavior 6-3
Modifying the Configuration File
7) Click the + sign next to the SWI manager. Notice that a SWI object calledPRD_swi was added automatically. This software interrupt executesperiodic functions at run time. Therefore, all PRD functions are calledwithin the context of a software interrupt and can yield to hardwareinterrupts. In contrast, CLK functions run in the context of a hardwareinterrupt.
8) Click the + sign next to the CLK manager. Notice that the CLK objectcalled PRD_clock runs a function called PRD_F_tick. This functioncauses the DSP/BIOS system clock to tick (by calling the PRD_tick APIfunction) and the PRD_swi software interrupt to be posted if any PRDfunctions need to run. PRD_swi runs the functions for all the PRD objectswhose period has elapsed.
9) Your own programs can call PRD_tick from some other event, such as ahardware interrupt, to drive periodic functions. Notice that the PRDmanager has a property called Use CLK Manager to drive PRD. If youremove the check mark from this box, the PRD_clock object isautomatically deleted. Make sure this box is checked for this example.
10) Recall that the processing_SWI object has a mailbox value of 10 and thatthe mailbox value is decremented by the dataIO_CLK object, which runsevery millisecond. As a result, the processing_SWI runs its function every10 milliseconds. In contrast, the loadchange_PRD object should run itsfunction every 2 milliseconds.
11) Choose File→Close. You are asked whether you want to save yourchanges to volume.cdb. Click Yes. Saving this file also generatesvolumecfg.cmd, volumecfg.s62, and volumecfg.h62.
12) Choose Project→Rebuild All or click the (Rebuild All) toolbar button.
6-4
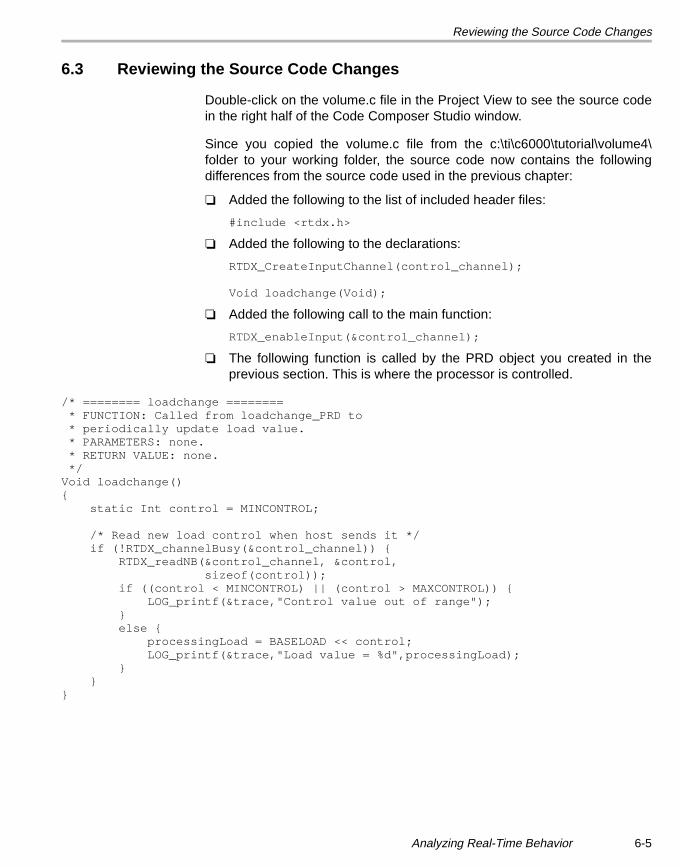
Reviewing the Source Code Changes
6.3 Reviewing the Source Code Changes
Double-click on the volume.c file in the Project View to see the source codein the right half of the Code Composer Studio window.
Since you copied the volume.c file from the c:\ti\c6000\tutorial\volume4\folder to your working folder, the source code now contains the followingdifferences from the source code used in the previous chapter:
❏ Added the following to the list of included header files:
#include <rtdx.h>
❏ Added the following to the declarations:
RTDX_CreateInputChannel(control_channel);
Void loadchange(Void);
❏ Added the following call to the main function:
RTDX_enableInput(&control_channel);
❏ The following function is called by the PRD object you created in theprevious section. This is where the processor is controlled.
/* ======== loadchange ======== * FUNCTION: Called from loadchange_PRD to * periodically update load value. * PARAMETERS: none. * RETURN VALUE: none. */Void loadchange(){ static Int control = MINCONTROL;
/* Read new load control when host sends it */ if (!RTDX_channelBusy(&control_channel)) { RTDX_readNB(&control_channel, &control, sizeof(control)); if ((control < MINCONTROL) || (control > MAXCONTROL)) { LOG_printf(&trace,"Control value out of range"); } else { processingLoad = BASELOAD << control; LOG_printf(&trace,"Load value = %d",processingLoad); } }}
Analyzing Real-Time Behavior 6-5
Reviewing the Source Code Changes
This function uses RTDX API functions to change the load of the processingsignal in real time. Notice the following aspects of these changes:
❏ The call to RTDX_enableInput enables the input channel calledcontrol_channel so that data can flow on it from the host to the target. Atrun time, a Visual Basic host client writes a load control value on thatchannel, thereby sending it to the target application.
❏ The call to RTDX_readNB asks the host to send a load control value onthe control_channel and stores it in the variable called control. This callis non-blocking; it returns without waiting for the host to send the data.The data is delivered when the host client writes to control_channel.From the time of the call to RTDX_readNB until the data is written to thevariable control, this channel is busy, and no additional requests can beposted on this channel (that is, calls to RTDX_readNB do not succeed).During that time, the call to RTDX_channelBusy returns TRUE forcontrol_channel.
❏ The processingLoad = BASELOAD << control; statement shifts the bitsin BASELOAD (1) to the left by the number of digits specified by thecontrol. Because MAXCONTROL is set to 31, the RTDX control allowsyou to set an exponentially scaled value for the load up to the maximumvalue that can be stored in a 32-bit variable.
6-6
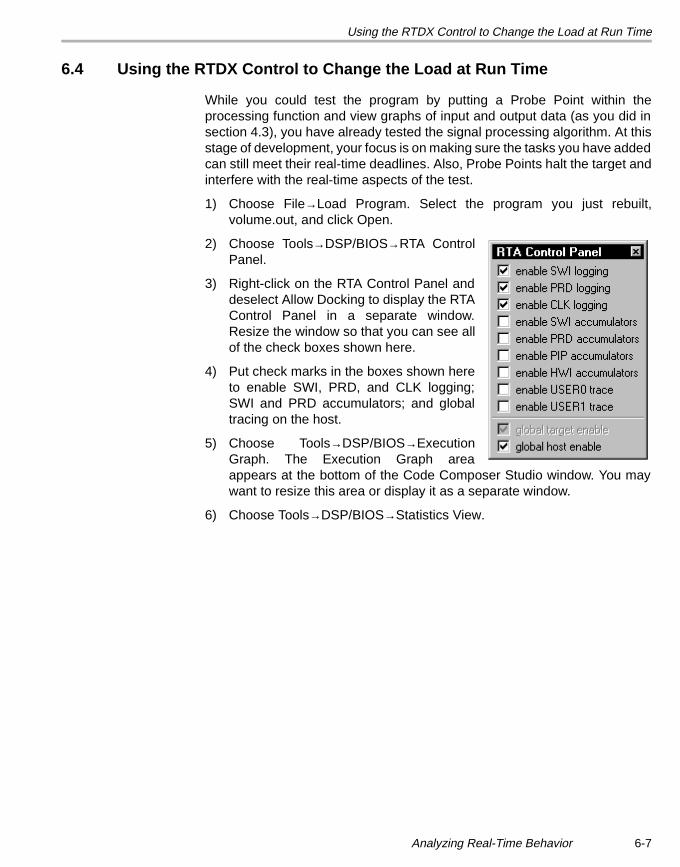
Using the RTDX Control to Change the Load at Run Time
6.4 Using the RTDX Control to Change the Load at Run Time
While you could test the program by putting a Probe Point within theprocessing function and view graphs of input and output data (as you did insection 4.3), you have already tested the signal processing algorithm. At thisstage of development, your focus is on making sure the tasks you have addedcan still meet their real-time deadlines. Also, Probe Points halt the target andinterfere with the real-time aspects of the test.
1) Choose File→Load Program. Select the program you just rebuilt,volume.out, and click Open.
2) Choose Tools→DSP/BIOS→RTA ControlPanel.
3) Right-click on the RTA Control Panel anddeselect Allow Docking to display the RTAControl Panel in a separate window.Resize the window so that you can see allof the check boxes shown here.
4) Put check marks in the boxes shown hereto enable SWI, PRD, and CLK logging;SWI and PRD accumulators; and globaltracing on the host.
5) Choose Tools→DSP/BIOS→ExecutionGraph. The Execution Graph areaappears at the bottom of the Code Composer Studio window. You maywant to resize this area or display it as a separate window.
6) Choose Tools→DSP/BIOS→Statistics View.
Analyzing Real-Time Behavior 6-7
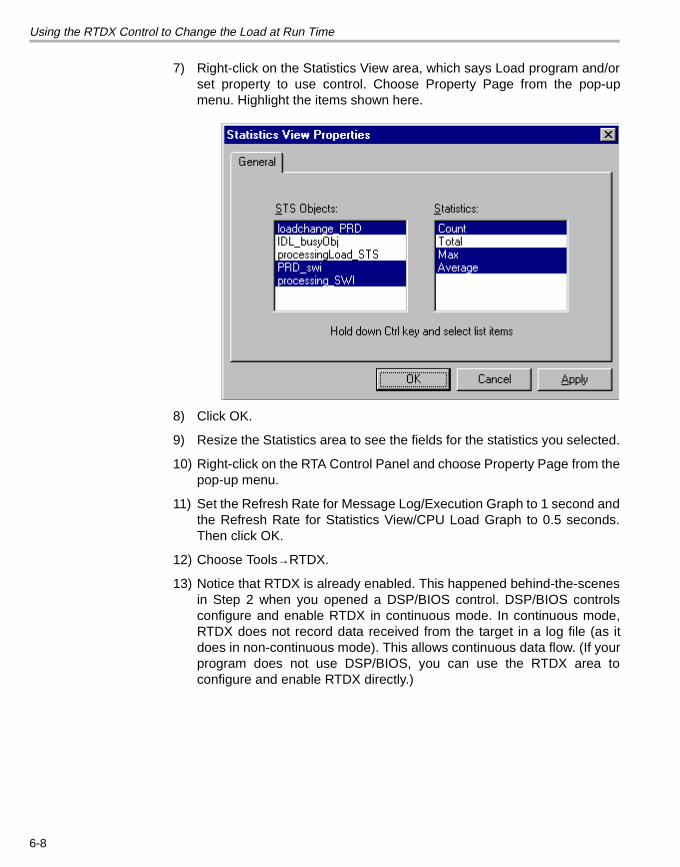
Using the RTDX Control to Change the Load at Run Time
7) Right-click on the Statistics View area, which says Load program and/orset property to use control. Choose Property Page from the pop-upmenu. Highlight the items shown here.
8) Click OK.
9) Resize the Statistics area to see the fields for the statistics you selected.
10) Right-click on the RTA Control Panel and choose Property Page from thepop-up menu.
11) Set the Refresh Rate for Message Log/Execution Graph to 1 second andthe Refresh Rate for Statistics View/CPU Load Graph to 0.5 seconds.Then click OK.
12) Choose Tools→RTDX.
13) Notice that RTDX is already enabled. This happened behind-the-scenesin Step 2 when you opened a DSP/BIOS control. DSP/BIOS controlsconfigure and enable RTDX in continuous mode. In continuous mode,RTDX does not record data received from the target in a log file (as itdoes in non-continuous mode). This allows continuous data flow. (If yourprogram does not use DSP/BIOS, you can use the RTDX area toconfigure and enable RTDX directly.)
6-8
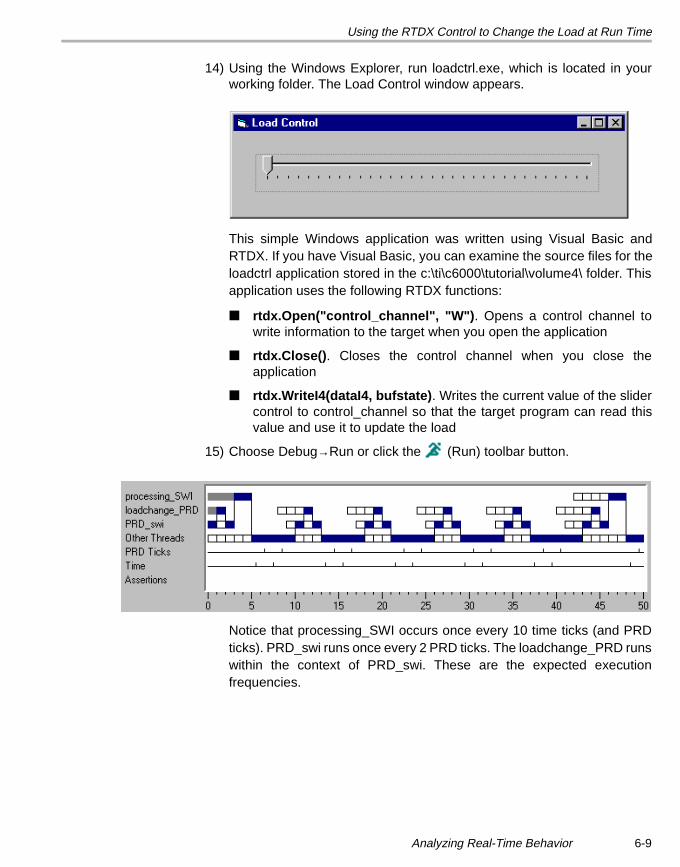
Using the RTDX Control to Change the Load at Run Time
14) Using the Windows Explorer, run loadctrl.exe, which is located in yourworking folder. The Load Control window appears.
This simple Windows application was written using Visual Basic andRTDX. If you have Visual Basic, you can examine the source files for theloadctrl application stored in the c:\ti\c6000\tutorial\volume4\ folder. Thisapplication uses the following RTDX functions:
■ rtdx.Open("control_channel", "W"). Opens a control channel towrite information to the target when you open the application
■ rtdx.Close(). Closes the control channel when you close theapplication
■ rtdx.WriteI4(dataI4, bufstate). Writes the current value of the slidercontrol to control_channel so that the target program can read thisvalue and use it to update the load
15) Choose Debug→Run or click the (Run) toolbar button.
Notice that processing_SWI occurs once every 10 time ticks (and PRDticks). PRD_swi runs once every 2 PRD ticks. The loadchange_PRD runswithin the context of PRD_swi. These are the expected executionfrequencies.
Analyzing Real-Time Behavior 6-9
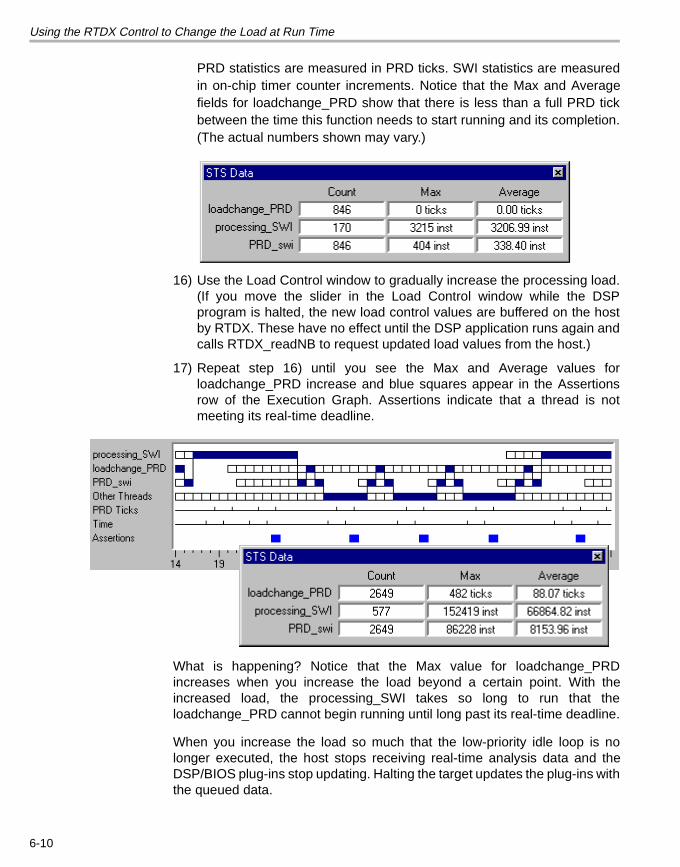
Using the RTDX Control to Change the Load at Run Time
PRD statistics are measured in PRD ticks. SWI statistics are measuredin on-chip timer counter increments. Notice that the Max and Averagefields for loadchange_PRD show that there is less than a full PRD tickbetween the time this function needs to start running and its completion.(The actual numbers shown may vary.)
16) Use the Load Control window to gradually increase the processing load.(If you move the slider in the Load Control window while the DSPprogram is halted, the new load control values are buffered on the hostby RTDX. These have no effect until the DSP application runs again andcalls RTDX_readNB to request updated load values from the host.)
17) Repeat step 16) until you see the Max and Average values forloadchange_PRD increase and blue squares appear in the Assertionsrow of the Execution Graph. Assertions indicate that a thread is notmeeting its real-time deadline.
What is happening? Notice that the Max value for loadchange_PRDincreases when you increase the load beyond a certain point. With theincreased load, the processing_SWI takes so long to run that theloadchange_PRD cannot begin running until long past its real-time deadline.
When you increase the load so much that the low-priority idle loop is nolonger executed, the host stops receiving real-time analysis data and theDSP/BIOS plug-ins stop updating. Halting the target updates the plug-ins withthe queued data.
6-10
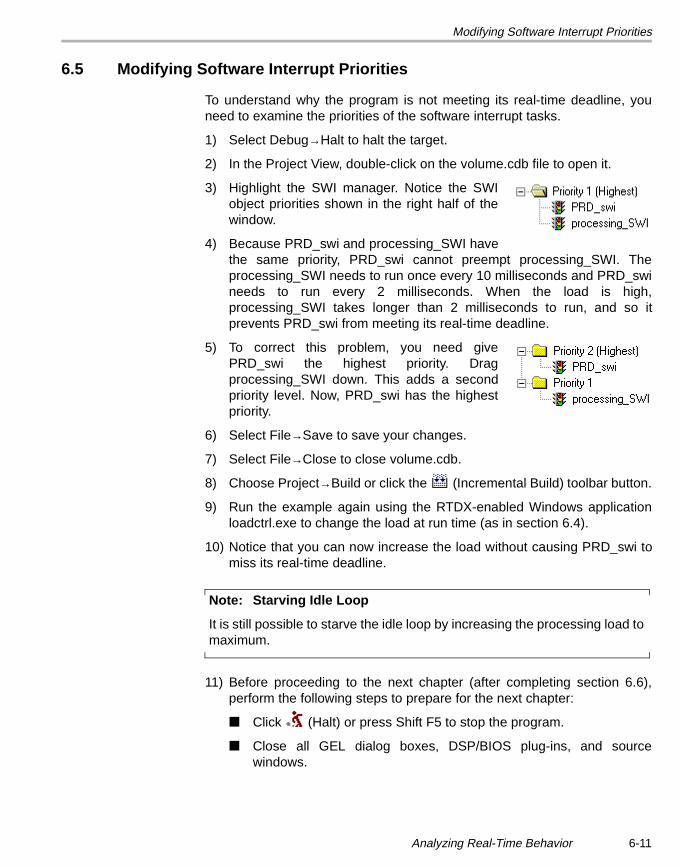
Modifying Software Interrupt Priorities
6.5 Modifying Software Interrupt Priorities
To understand why the program is not meeting its real-time deadline, youneed to examine the priorities of the software interrupt tasks.
1) Select Debug→Halt to halt the target.
2) In the Project View, double-click on the volume.cdb file to open it.
3) Highlight the SWI manager. Notice the SWIobject priorities shown in the right half of thewindow.
4) Because PRD_swi and processing_SWI havethe same priority, PRD_swi cannot preempt processing_SWI. Theprocessing_SWI needs to run once every 10 milliseconds and PRD_swineeds to run every 2 milliseconds. When the load is high,processing_SWI takes longer than 2 milliseconds to run, and so itprevents PRD_swi from meeting its real-time deadline.
5) To correct this problem, you need givePRD_swi the highest priority. Dragprocessing_SWI down. This adds a secondpriority level. Now, PRD_swi has the highestpriority.
6) Select File→Save to save your changes.
7) Select File→Close to close volume.cdb.
8) Choose Project→Build or click the (Incremental Build) toolbar button.
9) Run the example again using the RTDX-enabled Windows applicationloadctrl.exe to change the load at run time (as in section 6.4).
10) Notice that you can now increase the load without causing PRD_swi tomiss its real-time deadline.
Note: Starving Idle Loop
It is still possible to starve the idle loop by increasing the processing load tomaximum.
11) Before proceeding to the next chapter (after completing section 6.6),perform the following steps to prepare for the next chapter:
■ Click (Halt) or press Shift F5 to stop the program.
■ Close all GEL dialog boxes, DSP/BIOS plug-ins, and sourcewindows.
Analyzing Real-Time Behavior 6-11
Things to Try
6.6 Things to Try
To further explore DSP/BIOS, try the following:
❏ When you increase the load, the Execution Graph shows thatprocessing_SWI requires more than one PRD tick to run. Does this meanthat processing_SWI is missing its real-time deadline? Recall thatprocessing_SWI must run every 10 milliseconds, while PRD ticks occurevery millisecond.
❏ What would happen if the processing function were called directly from ahardware ISR rather than being deferred to a software interrupt?Hardware ISR run at a higher priority than the highest priority SWI object.
❏ View the CPU Load Graph. Use the RTA Control Panel to turn thestatistics accumulators on and off. How much does this affect the CPUload? How much does this affect the statistics for processing_SWI?
❏ Add calls to STS_set and STS_delta in the loadchange function like theones you added in section 5.7. How does this change affect the CPUload? Now, add calls to STS_set and STS_delta in the dataIO function.How does this change affect the CPU load? Why? Consider thefrequency at which each function is executed. Even small increases tothe processing requirements for functions that run frequently can havedramatic effects on CPU load.
6.7 Learning More
To learn more about the software interrupt priorities and the RTDX and PRDmodules, see the Code Composer Studio and RTDX online help or theTMS320C6000 DSP/BIOS User’s Guide (which is provided as an AdobeAcrobat file).
6-12
Chapter 7
Connecting to I/O Devices
This chapter introduces RTDX and DSP/BIOS techniques for implementingI/O.
In this chapter, you connect a program to an I/O device using RTDX andDSP/BIOS. You also use the HST, PIP, and SWI modules of the DSP/BIOSAPI.
This chapter requires a physical board and cannot be carried out using asoftware simulator. Also, this chapter requires the DSP/BIOS and RTDXcomponents of Code Composer Studio.
7.1 Opening and Examining the Project . . . . . . . . . . . . . . . . . . . . . . . . . 7–2
7.2 Reviewing the C Source Code . . . . . . . . . . . . . . . . . . . . . . . . . . . . . . 7–3
7.3 Reviewing the Signalprog Application . . . . . . . . . . . . . . . . . . . . . . . 7–6
7.4 Running the Application . . . . . . . . . . . . . . . . . . . . . . . . . . . . . . . . . . . 7–7
7.5 Modifying the Source Code to Use Host Channels and Pipes . . . 7–10
7.6 More about Host Channels and Pipes . . . . . . . . . . . . . . . . . . . . . . . 7–12
7.7 Adding Channels and an SWI to the Configuration File . . . . . . . . 7–13
7.8 Running the Modified Program . . . . . . . . . . . . . . . . . . . . . . . . . . . . 7–17
7.9 Learning More . . . . . . . . . . . . . . . . . . . . . . . . . . . . . . . . . . . . . . . . . . 7–17
Topic Page
7-1
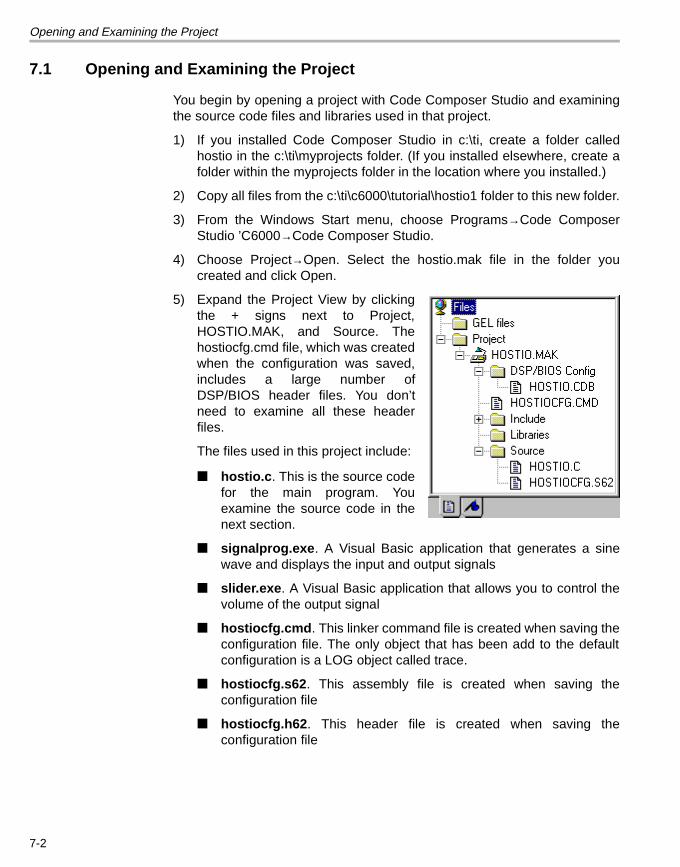
Opening and Examining the Project
7.1 Opening and Examining the Project
You begin by opening a project with Code Composer Studio and examiningthe source code files and libraries used in that project.
1) If you installed Code Composer Studio in c:\ti, create a folder calledhostio in the c:\ti\myprojects folder. (If you installed elsewhere, create afolder within the myprojects folder in the location where you installed.)
2) Copy all files from the c:\ti\c6000\tutorial\hostio1 folder to this new folder.
3) From the Windows Start menu, choose Programs→Code ComposerStudio ’C6000→Code Composer Studio.
4) Choose Project→Open. Select the hostio.mak file in the folder youcreated and click Open.
5) Expand the Project View by clickingthe + signs next to Project,HOSTIO.MAK, and Source. Thehostiocfg.cmd file, which was createdwhen the configuration was saved,includes a large number ofDSP/BIOS header files. You don’tneed to examine all these headerfiles.
The files used in this project include:
■ hostio.c. This is the source codefor the main program. Youexamine the source code in thenext section.
■ signalprog.exe. A Visual Basic application that generates a sinewave and displays the input and output signals
■ slider.exe. A Visual Basic application that allows you to control thevolume of the output signal
■ hostiocfg.cmd. This linker command file is created when saving theconfiguration file. The only object that has been add to the defaultconfiguration is a LOG object called trace.
■ hostiocfg.s62. This assembly file is created when saving theconfiguration file
■ hostiocfg.h62. This header file is created when saving theconfiguration file
7-2
Reviewing the C Source Code
7.2 Reviewing the C Source Code
The example in this chapter simulates a DSP application that digitizes anaudio signal, adjusts its volume, and produces an analog output at theadjusted volume.
For simplicity, no actual device is used to send and receive analog data in thisexample. Instead, the example tests the algorithm using host-generateddigital data. Input and output data and volume control are transferredbetween the host and the target using RTDX.
A Visual Basic application running on the host uses RTDX to generate theinput signal and display the input and output signals. This application allowsdevelopers to test the algorithm without stopping the target. Similar methodscan be used to create display controls for real-time testing of otherapplications. You examine the Visual Basic application in the next section.
1) Double-click on the hostio.c file in the Project View to see the sourcecode.
2) Notice the following aspects of this example:
■ Three RTDX channels are declared globally. The first input channelcontrols the volume. The second input channel receives the inputsignal from the host. The output channel sends the output signal fromthe target to the host. (Input and output channels are named from theperspective of the target application: input channels receive datafrom the host, and output channels send data to the host.)
■ The call to RTDX_channelBusy returns FALSE if the channel is notcurrently waiting for input. This indicates that the data has arrivedand can be read. As in the previous chapter, the call toRTDX_readNB is non-blocking; it returns control to the DSPapplication without waiting to receive the data from the host. The datais delivered asynchronously when the host client writes it to thecontrol_channel.
■ The call to RTDX_read waits for data if the channel is enabled.
■ The call to RTDX_write writes the contents of the buffer to the outputRTDX channel if the channel is enabled.
Connecting to I/O Devices 7-3
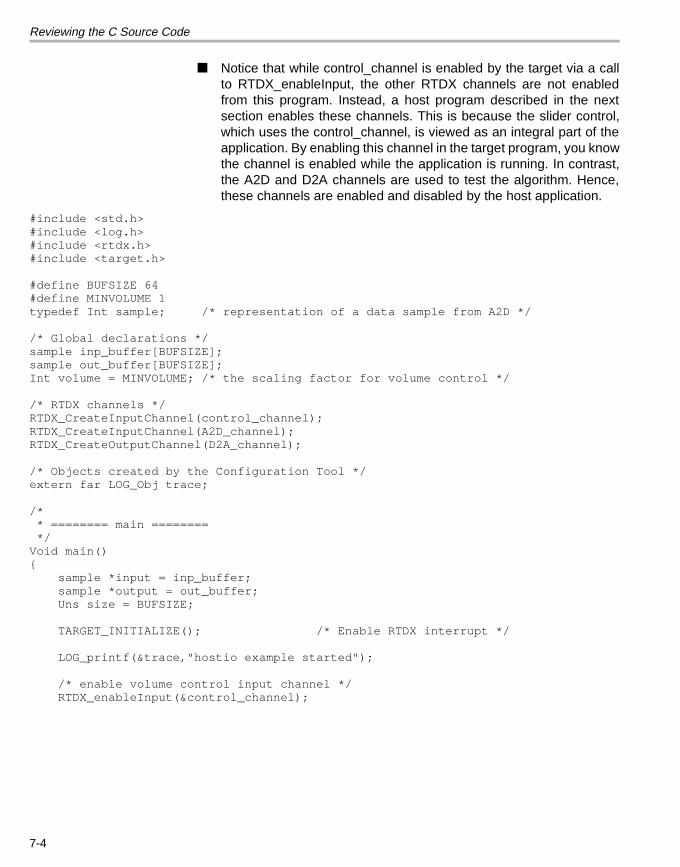
Reviewing the C Source Code
■ Notice that while control_channel is enabled by the target via a callto RTDX_enableInput, the other RTDX channels are not enabledfrom this program. Instead, a host program described in the nextsection enables these channels. This is because the slider control,which uses the control_channel, is viewed as an integral part of theapplication. By enabling this channel in the target program, you knowthe channel is enabled while the application is running. In contrast,the A2D and D2A channels are used to test the algorithm. Hence,these channels are enabled and disabled by the host application.
#include <std.h>#include <log.h>#include <rtdx.h> #include <target.h>
#define BUFSIZE 64#define MINVOLUME 1typedef Int sample; /* representation of a data sample from A2D */
/* Global declarations */sample inp_buffer[BUFSIZE];sample out_buffer[BUFSIZE];Int volume = MINVOLUME; /* the scaling factor for volume control */
/* RTDX channels */RTDX_CreateInputChannel(control_channel);RTDX_CreateInputChannel(A2D_channel);RTDX_CreateOutputChannel(D2A_channel);
/* Objects created by the Configuration Tool */extern far LOG_Obj trace;
/* * ======== main ======== */Void main(){ sample *input = inp_buffer; sample *output = out_buffer; Uns size = BUFSIZE; TARGET_INITIALIZE(); /* Enable RTDX interrupt */ LOG_printf(&trace,"hostio example started"); /* enable volume control input channel */ RTDX_enableInput(&control_channel);
7-4
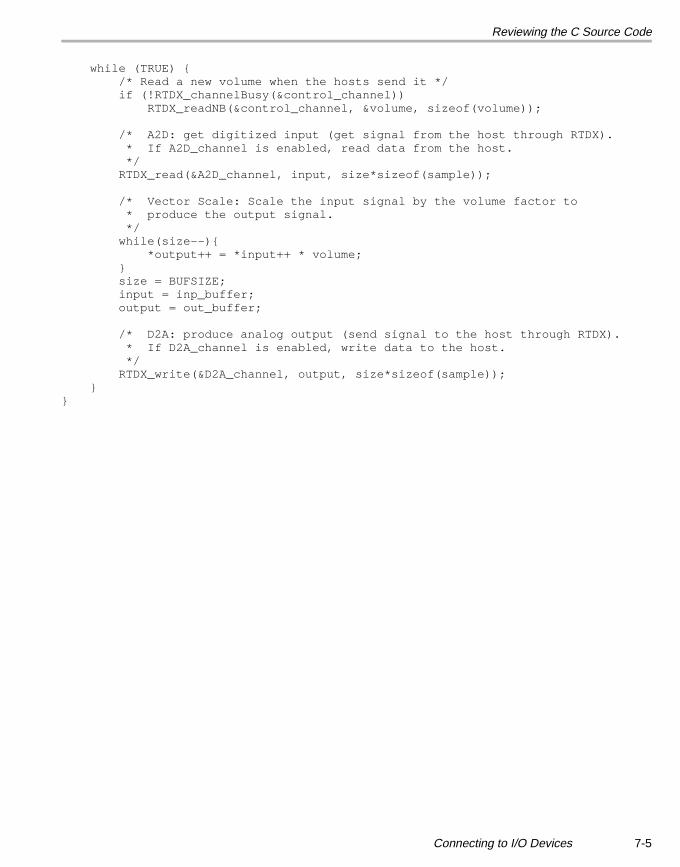
Reviewing the C Source Code
while (TRUE) { /* Read a new volume when the hosts send it */ if (!RTDX_channelBusy(&control_channel)) RTDX_readNB(&control_channel, &volume, sizeof(volume));
/* A2D: get digitized input (get signal from the host through RTDX). * If A2D_channel is enabled, read data from the host. */ RTDX_read(&A2D_channel, input, size*sizeof(sample));
/* Vector Scale: Scale the input signal by the volume factor to * produce the output signal. */ while(size--){ *output++ = *input++ * volume; } size = BUFSIZE; input = inp_buffer; output = out_buffer;
/* D2A: produce analog output (send signal to the host through RTDX). * If D2A_channel is enabled, write data to the host. */ RTDX_write(&D2A_channel, output, size*sizeof(sample)); }}
Connecting to I/O Devices 7-5
Reviewing the Signalprog Application
7.3 Reviewing the Signalprog Application
The source code for the signalprog.exe application is available in thesignalfrm.frm file. Details about this application are provided in thesignalprog.pdf Adobe Acrobat file. In this section, you examine a few of theroutines and functions that are important for this example.
❏ Test_ON. This routine runs when you click the Test_ON button. It createsinstances of the RTDX exported interface for the input channel (toDSP)and for the output channel (fromDsp). Then it opens and enables both ofthese channels. The channels in the signalprog application are the samechannels declared globally in the hostio.c source code.
This routine also clears the graphs and starts the timer used to call theTransmit_Signal and Receive_Signal functions.
The following global declarations earlier in the Visual Basic source codeconnect the READ_CHANNEL and WRITE_CHANNEL used in theTest_ON routine to the D2A_channel and A2D_channel used in hostio.c:
’ Channel name constantsConst READ_CHANNEL = "D2A_channel"Const WRITE_CHANNEL = "A2D_channel"
❏ Test_OFF. This routine disables, closes, and releases the RTDX objectscreated by Test_ON. It also disables the timer.
❏ Transmit_Signal. This function generates a sine wave signal anddisplays it in the Transmitted Signal graph. Then, the function attempts totransmit the signal to the target using the Write method of the toDSPchannel.
❏ Receive_signal. This function uses the ReadSAI4 method of thefromDSP channel to read a signal from the target. It displays the signalin the Received Signal graph.
❏ tmr_MethodDispatch_Timer. This routine calls the Transmit_Signaland Receive_Signal functions. This routine is called at 1 millisecondintervals after the timer object is enabled by the Test_ON routine.
7-6
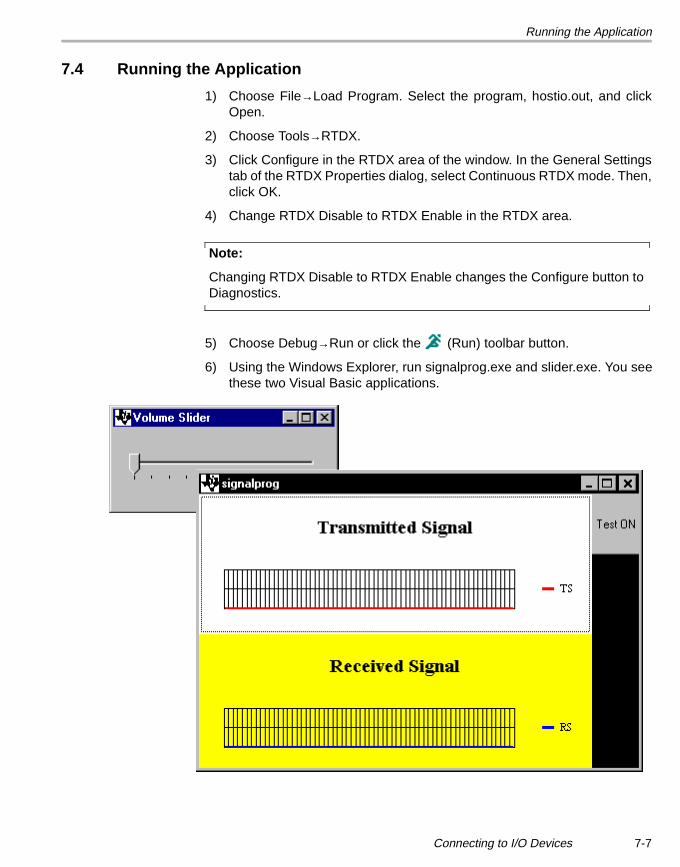
Running the Application
7.4 Running the Application
1) Choose File→Load Program. Select the program, hostio.out, and clickOpen.
2) Choose Tools→RTDX.
3) Click Configure in the RTDX area of the window. In the General Settingstab of the RTDX Properties dialog, select Continuous RTDX mode. Then,click OK.
4) Change RTDX Disable to RTDX Enable in the RTDX area.
Note:
Changing RTDX Disable to RTDX Enable changes the Configure button toDiagnostics.
5) Choose Debug→Run or click the (Run) toolbar button.
6) Using the Windows Explorer, run signalprog.exe and slider.exe. You seethese two Visual Basic applications.
Connecting to I/O Devices 7-7
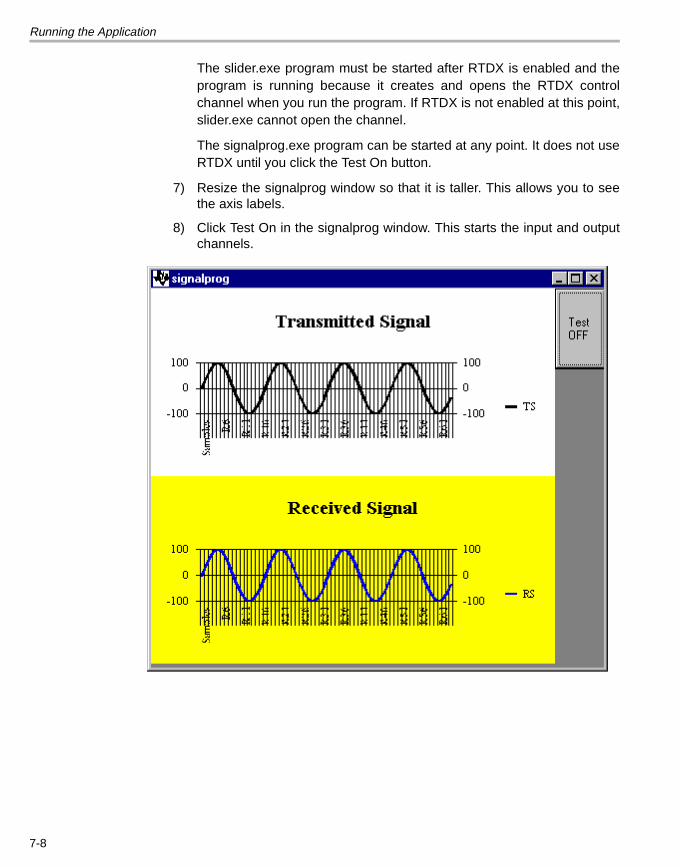
Running the Application
The slider.exe program must be started after RTDX is enabled and theprogram is running because it creates and opens the RTDX controlchannel when you run the program. If RTDX is not enabled at this point,slider.exe cannot open the channel.
The signalprog.exe program can be started at any point. It does not useRTDX until you click the Test On button.
7) Resize the signalprog window so that it is taller. This allows you to seethe axis labels.
8) Click Test On in the signalprog window. This starts the input and outputchannels.
7-8
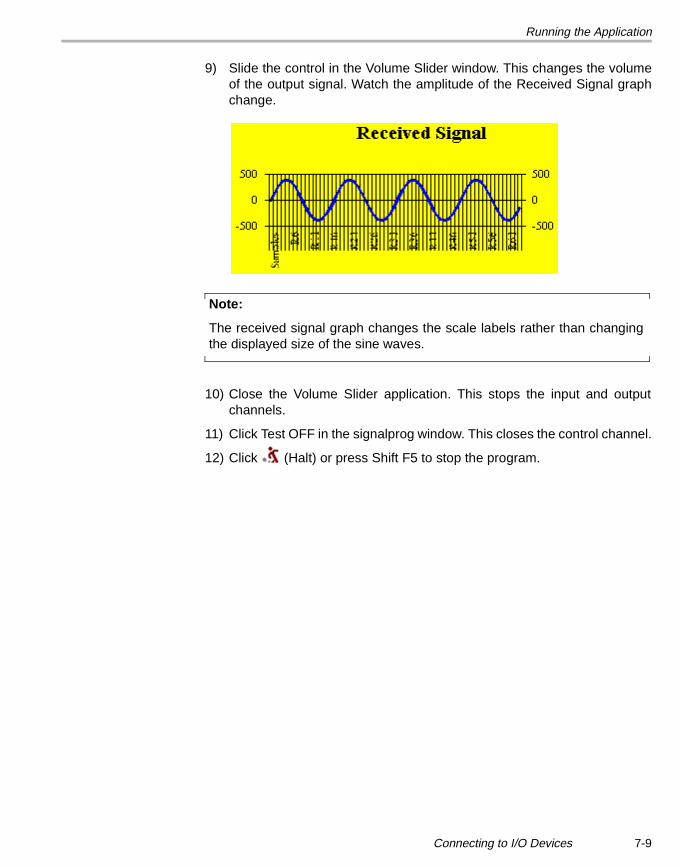
Running the Application
9) Slide the control in the Volume Slider window. This changes the volumeof the output signal. Watch the amplitude of the Received Signal graphchange.
Note:
The received signal graph changes the scale labels rather than changingthe displayed size of the sine waves.
10) Close the Volume Slider application. This stops the input and outputchannels.
11) Click Test OFF in the signalprog window. This closes the control channel.
12) Click (Halt) or press Shift F5 to stop the program.
Connecting to I/O Devices 7-9
Modifying the Source Code to Use Host Channels and Pipes
7.5 Modifying the Source Code to Use Host Channels and Pipes
Now you modify the example to use the host channels and pipes providedwith DSP/BIOS. The modified example still tests your DSP algorithm in realtime. Rather than generating a sine wave on the host, this time the datacomes from a host file.
The HST module provides a more direct path toward implementing I/O withperipheral devices. The HST module uses the PIP module for host I/O. Youcan use the PIP module API with minimal modifications to the source codeonce the I/O devices and ISRs are ready for testing.
1) Copy only the following files from the c:\ti\c6000\tutorial\hostio2\ folder toyour working folder. (Note that you should not copy all the files from thehostio2 folder. In particular, do not copy the hostio.cdb file.)
■ hostio.c. The source code has been modified to use the HST andPIP modules of the DSP/BIOS API instead of RTDX to transfer theinput and output signals
■ input.dat. This file contains input data
2) Double-click on the hostio.c file in the Project View to see the source codein the right half of the Code Composer Studio window. The source codenow contains the following differences from the source code used earlierin this chapter:
■ Added the following to the list of included header files:
#include <hst.h>#include <pip.h>
■ Removed the BUFSIZE definition, the global declarations ofinp_buffer and out_buffer, and the RTDX input and output channeldeclarations. This example retains the RTDX channel used to controlthe volume.
■ Moved the input and output functionality from a while loop in the mainfunction to the A2DscaleD2A function. This function is called by theA2DscaleD2A_SWI object, which you create in the next section.
/* ======== A2DscaleD2A ======== *//* FUNCTION: Called from A2DscaleD2A_SWI to get digitized data * from a host file through an HST input channel, * scale the data by the volume factor, and send * output data back to the host through an HST * output channel. * PARAMETERS: Address of input and output HST channels. * RETURN VALUE: None. */
7-10
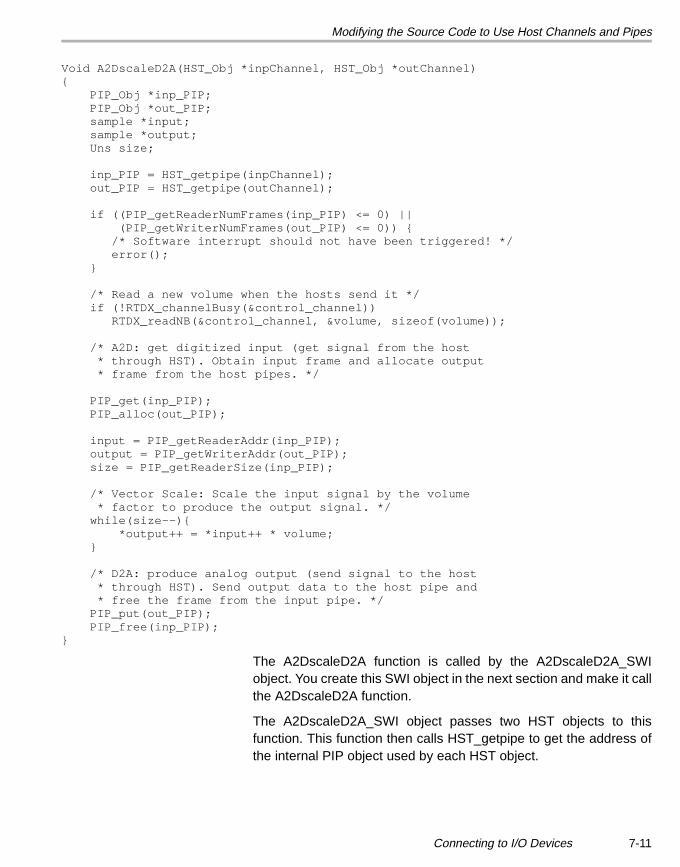
Modifying the Source Code to Use Host Channels and Pipes
Void A2DscaleD2A(HST_Obj *inpChannel, HST_Obj *outChannel){ PIP_Obj *inp_PIP; PIP_Obj *out_PIP; sample *input; sample *output; Uns size;
inp_PIP = HST_getpipe(inpChannel); out_PIP = HST_getpipe(outChannel);
if ((PIP_getReaderNumFrames(inp_PIP) <= 0) || (PIP_getWriterNumFrames(out_PIP) <= 0)) { /* Software interrupt should not have been triggered! */ error(); }
/* Read a new volume when the hosts send it */ if (!RTDX_channelBusy(&control_channel)) RTDX_readNB(&control_channel, &volume, sizeof(volume)); /* A2D: get digitized input (get signal from the host * through HST). Obtain input frame and allocate output * frame from the host pipes. */ PIP_get(inp_PIP); PIP_alloc(out_PIP); input = PIP_getReaderAddr(inp_PIP); output = PIP_getWriterAddr(out_PIP); size = PIP_getReaderSize(inp_PIP); /* Vector Scale: Scale the input signal by the volume * factor to produce the output signal. */ while(size--){ *output++ = *input++ * volume; } /* D2A: produce analog output (send signal to the host * through HST). Send output data to the host pipe and * free the frame from the input pipe. */ PIP_put(out_PIP); PIP_free(inp_PIP);}
The A2DscaleD2A function is called by the A2DscaleD2A_SWIobject. You create this SWI object in the next section and make it callthe A2DscaleD2A function.
The A2DscaleD2A_SWI object passes two HST objects to thisfunction. This function then calls HST_getpipe to get the address ofthe internal PIP object used by each HST object.
Connecting to I/O Devices 7-11
More about Host Channels and Pipes
Calls to PIP_getReaderNumFrames and PIP_getWriterNumFramesthen determine whether there is at least one frame in the input pipethat is ready to be read and one frame in the output pipe that can bewritten to.
Using the same RTDX calls used earlier in this chapter, the functiongets the volume setting from the RTDX control channel.
The call to PIP_get gets a full frame from the input pipe. The call toPIP_getReaderAddr gets a pointer to the beginning of the data in theinput pipe frame and PIP_getReaderSize gets the number of wordsin the input pipe frame.
The call to PIP_alloc gets an empty frame from the output pipe. Thecall to PIP_getWriterAddr gets a pointer to the location to beginwriting data to in the output pipe frame.
The function then multiplies the input signal by the volume and writesthe results to the frame using the pointer provided byPIP_getWriterAddr.
The call to PIP_put puts the full frame into the output pipe. The callto PIP_free recycles the input frame so that it can be reused the nexttime this function runs.
■ Added an error function, which writes an error message to the tracelog and then puts the program in an infinite loop. This function runs ifA2DscaleD2A runs when there are no frames of data available forprocessing.
7.6 More about Host Channels and Pipes
Each host channel uses a pipe internally. When you are using a host channel,your target program manages one end of the pipe and the Host ChannelControl plug-in manages the other end of the pipe.
When you are ready to modify your program to use peripheral devices otherthan the host PC, you can retain the code that manages the target’s end ofthe pipe and add code in functions that handle device I/O to manage the otherend of the pipe.
7-12
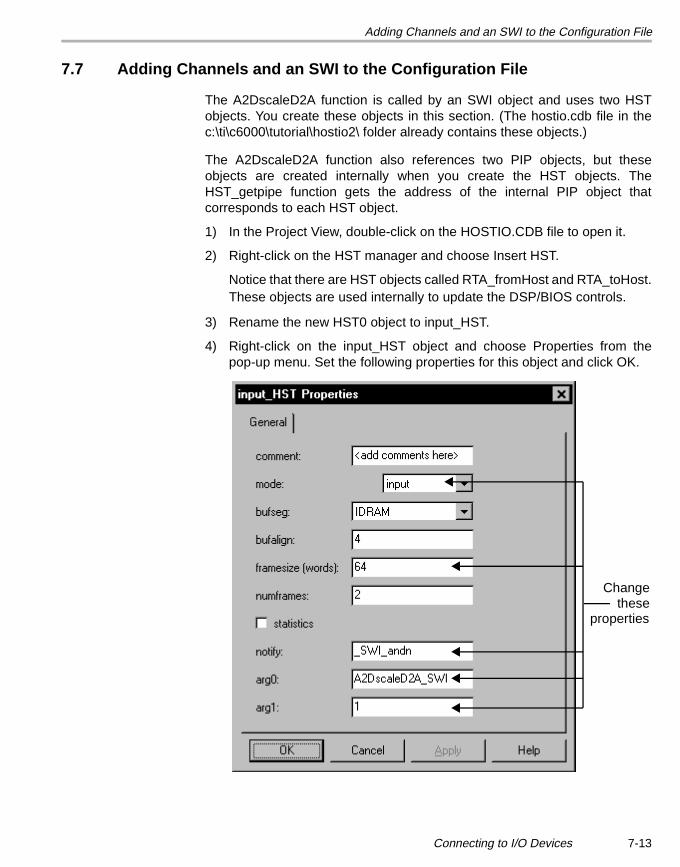
Adding Channels and an SWI to the Configuration File
7.7 Adding Channels and an SWI to the Configuration File
The A2DscaleD2A function is called by an SWI object and uses two HSTobjects. You create these objects in this section. (The hostio.cdb file in thec:\ti\c6000\tutorial\hostio2\ folder already contains these objects.)
The A2DscaleD2A function also references two PIP objects, but theseobjects are created internally when you create the HST objects. TheHST_getpipe function gets the address of the internal PIP object thatcorresponds to each HST object.
1) In the Project View, double-click on the HOSTIO.CDB file to open it.
2) Right-click on the HST manager and choose Insert HST.
Notice that there are HST objects called RTA_fromHost and RTA_toHost.These objects are used internally to update the DSP/BIOS controls.
3) Rename the new HST0 object to input_HST.
4) Right-click on the input_HST object and choose Properties from thepop-up menu. Set the following properties for this object and click OK.
Changethese
properties
Connecting to I/O Devices 7-13
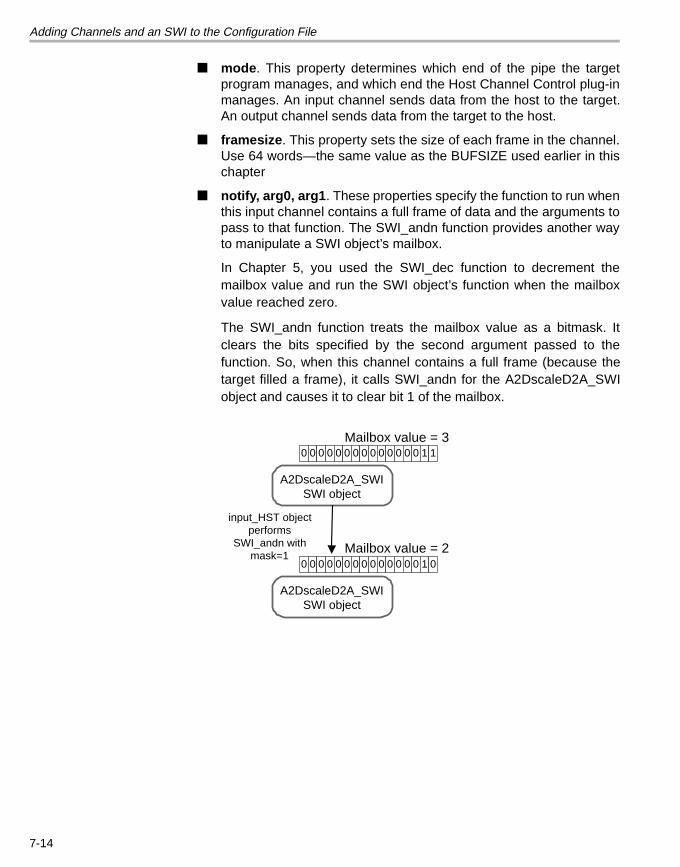
Adding Channels and an SWI to the Configuration File
■ mode. This property determines which end of the pipe the targetprogram manages, and which end the Host Channel Control plug-inmanages. An input channel sends data from the host to the target.An output channel sends data from the target to the host.
■ framesize. This property sets the size of each frame in the channel.Use 64 words—the same value as the BUFSIZE used earlier in thischapter
■ notify, arg0, arg1. These properties specify the function to run whenthis input channel contains a full frame of data and the arguments topass to that function. The SWI_andn function provides another wayto manipulate a SWI object’s mailbox.
In Chapter 5, you used the SWI_dec function to decrement themailbox value and run the SWI object’s function when the mailboxvalue reached zero.
The SWI_andn function treats the mailbox value as a bitmask. Itclears the bits specified by the second argument passed to thefunction. So, when this channel contains a full frame (because thetarget filled a frame), it calls SWI_andn for the A2DscaleD2A_SWIobject and causes it to clear bit 1 of the mailbox.
Mailbox value = 3
A2DscaleD2A_SWISWI object
Mailbox value = 2
A2DscaleD2A_SWISWI object
input_HST objectperforms
SWI_andn withmask=1
0 0 0 0 0 0 0 0 0 0 0 0 0 0 1 0
0 0 0 0 0 0 0 0 0 0 0 0 0 0 1 1
7-14
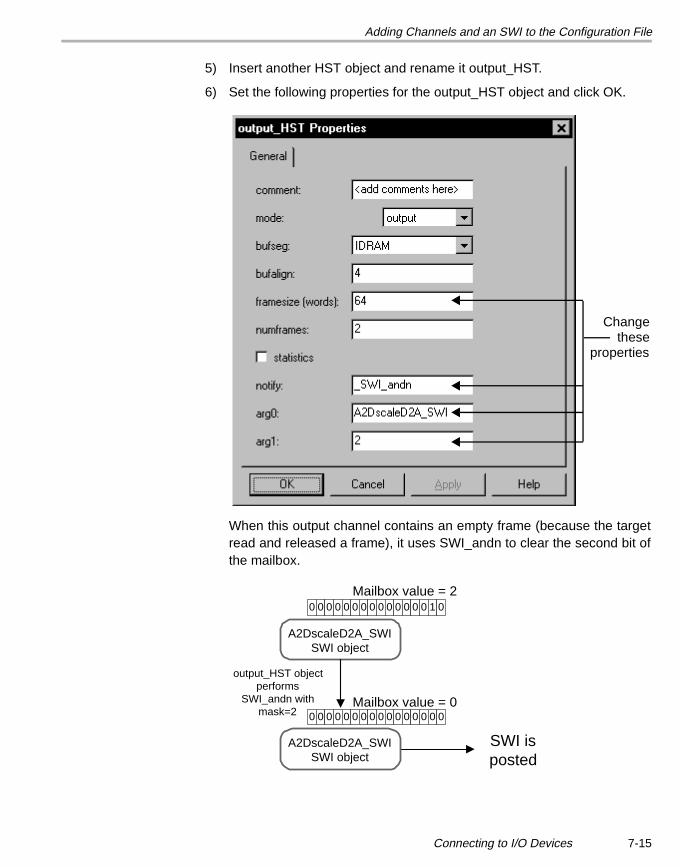
Adding Channels and an SWI to the Configuration File
5) Insert another HST object and rename it output_HST.
6) Set the following properties for the output_HST object and click OK.
When this output channel contains an empty frame (because the targetread and released a frame), it uses SWI_andn to clear the second bit ofthe mailbox.
Changethese
properties
Mailbox value = 2
Mailbox value = 0
output_HST objectperforms
SWI_andn withmask=2
SWI isposted
A2DscaleD2A_SWISWI object
A2DscaleD2A_SWISWI object
0 0 0 0 0 0 0 0 0 0 0 0 0 0 0 0
0 0 0 0 0 0 0 0 0 0 0 0 0 0 1 0
Connecting to I/O Devices 7-15
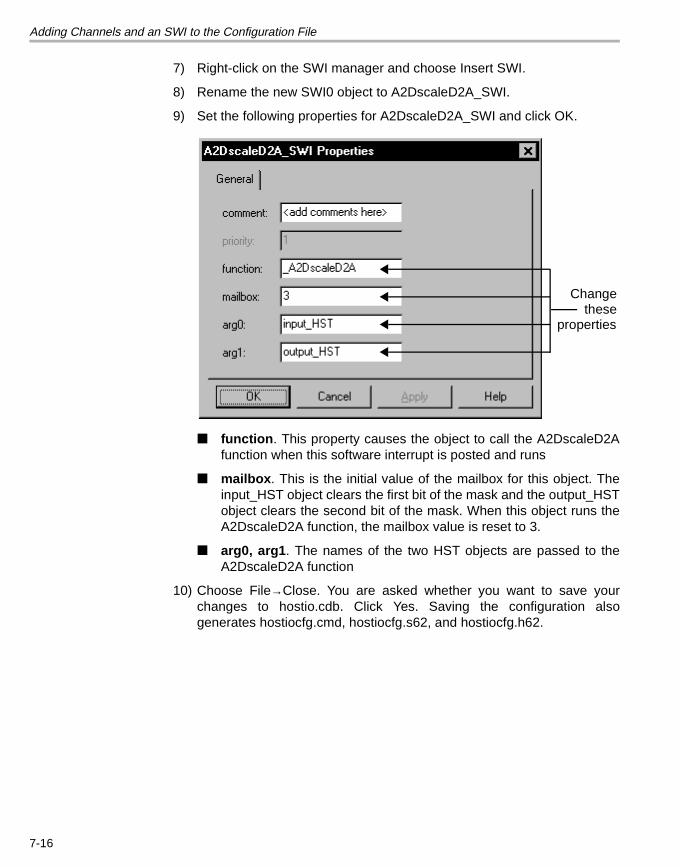
Adding Channels and an SWI to the Configuration File
7) Right-click on the SWI manager and choose Insert SWI.
8) Rename the new SWI0 object to A2DscaleD2A_SWI.
9) Set the following properties for A2DscaleD2A_SWI and click OK.
■ function. This property causes the object to call the A2DscaleD2Afunction when this software interrupt is posted and runs
■ mailbox. This is the initial value of the mailbox for this object. Theinput_HST object clears the first bit of the mask and the output_HSTobject clears the second bit of the mask. When this object runs theA2DscaleD2A function, the mailbox value is reset to 3.
■ arg0, arg1. The names of the two HST objects are passed to theA2DscaleD2A function
10) Choose File→Close. You are asked whether you want to save yourchanges to hostio.cdb. Click Yes. Saving the configuration alsogenerates hostiocfg.cmd, hostiocfg.s62, and hostiocfg.h62.
Changethese
properties
7-16
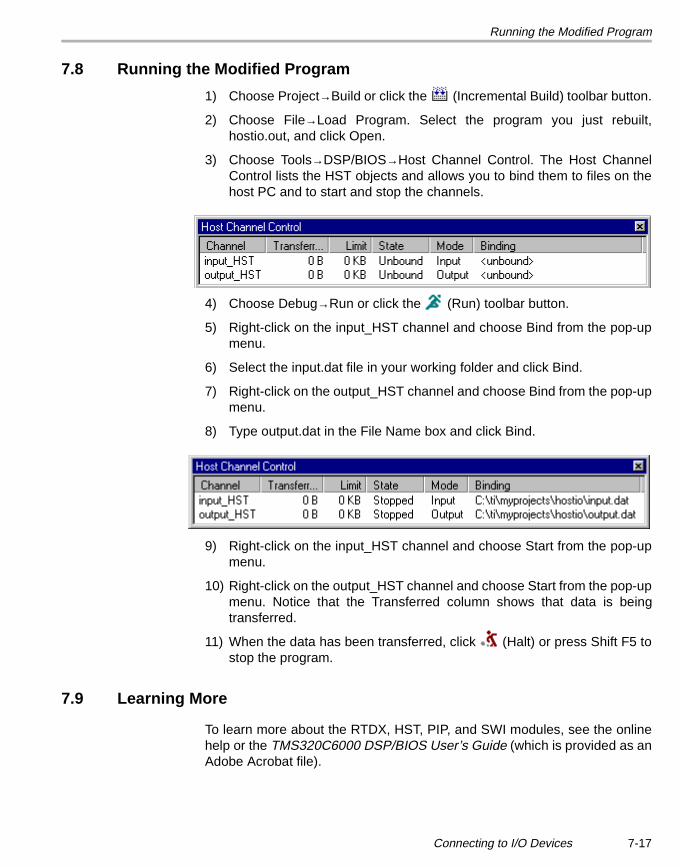
Running the Modified Program
7.8 Running the Modified Program
1) Choose Project→Build or click the (Incremental Build) toolbar button.
2) Choose File→Load Program. Select the program you just rebuilt,hostio.out, and click Open.
3) Choose Tools→DSP/BIOS→Host Channel Control. The Host ChannelControl lists the HST objects and allows you to bind them to files on thehost PC and to start and stop the channels.
4) Choose Debug→Run or click the (Run) toolbar button.
5) Right-click on the input_HST channel and choose Bind from the pop-upmenu.
6) Select the input.dat file in your working folder and click Bind.
7) Right-click on the output_HST channel and choose Bind from the pop-upmenu.
8) Type output.dat in the File Name box and click Bind.
9) Right-click on the input_HST channel and choose Start from the pop-upmenu.
10) Right-click on the output_HST channel and choose Start from the pop-upmenu. Notice that the Transferred column shows that data is beingtransferred.
11) When the data has been transferred, click (Halt) or press Shift F5 tostop the program.
7.9 Learning More
To learn more about the RTDX, HST, PIP, and SWI modules, see the onlinehelp or the TMS320C6000 DSP/BIOS User’s Guide (which is provided as anAdobe Acrobat file).
Connecting to I/O Devices 7-17
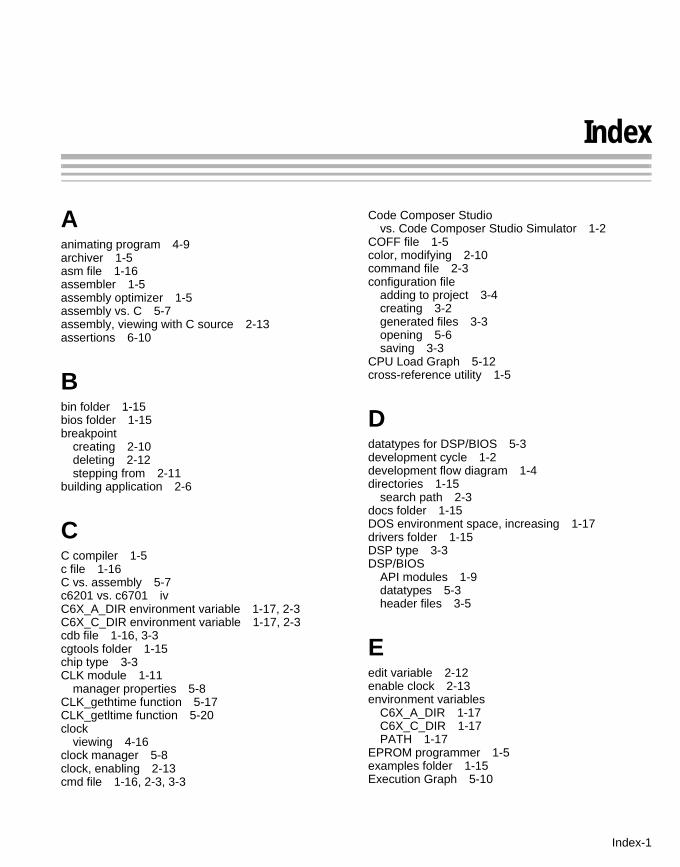
This is a draft version printed from file: tutorialIX.fm on 5/6/99
Index
Aanimating program 4-9archiver 1-5asm file 1-16assembler 1-5assembly optimizer 1-5assembly vs. C 5-7assembly, viewing with C source 2-13assertions 6-10
Bbin folder 1-15bios folder 1-15breakpoint
creating 2-10deleting 2-12stepping from 2-11
building application 2-6
CC compiler 1-5c file 1-16C vs. assembly 5-7c6201 vs. c6701 ivC6X_A_DIR environment variable 1-17, 2-3C6X_C_DIR environment variable 1-17, 2-3cdb file 1-16, 3-3cgtools folder 1-15chip type 3-3CLK module 1-11
manager properties 5-8CLK_gethtime function 5-17CLK_getltime function 5-20clock
viewing 4-16clock manager 5-8clock, enabling 2-13cmd file 1-16, 2-3, 3-3
Code Composer Studiovs. Code Composer Studio Simulator 1-2
COFF file 1-5color, modifying 2-10command file 2-3configuration file
adding to project 3-4creating 3-2generated files 3-3opening 5-6saving 3-3
CPU Load Graph 5-12cross-reference utility 1-5
Ddatatypes for DSP/BIOS 5-3development cycle 1-2development flow diagram 1-4directories 1-15
search path 2-3docs folder 1-15DOS environment space, increasing 1-17drivers folder 1-15DSP type 3-3DSP/BIOS
API modules 1-9datatypes 5-3header files 3-5
Eedit variable 2-12enable clock 2-13environment variables
C6X_A_DIR 1-17C6X_C_DIR 1-17PATH 1-17
EPROM programmer 1-5examples folder 1-15Execution Graph 5-10
Index-1
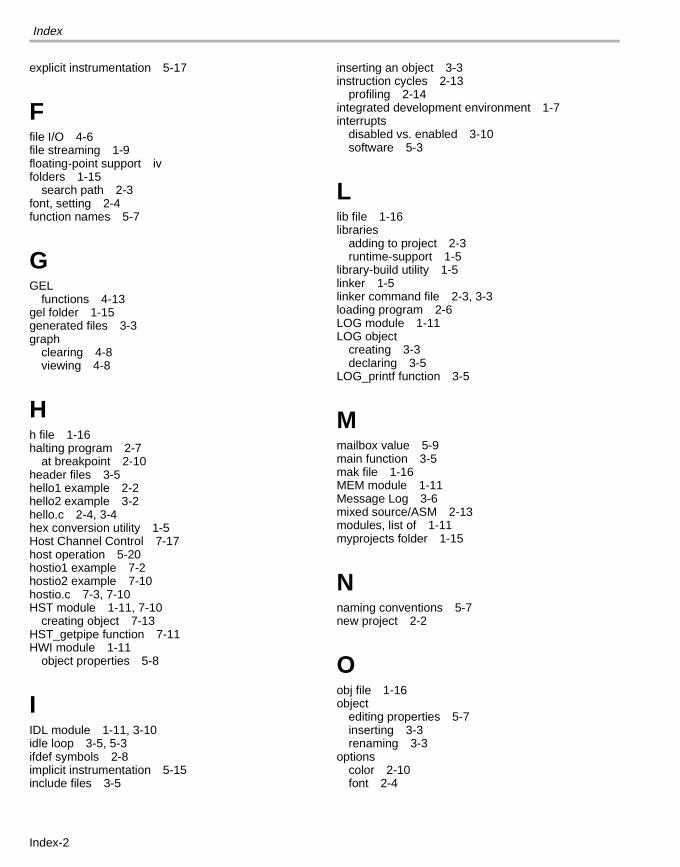
Index
explicit instrumentation 5-17
Ffile I/O 4-6file streaming 1-9floating-point support ivfolders 1-15
search path 2-3font, setting 2-4function names 5-7
GGEL
functions 4-13gel folder 1-15generated files 3-3graph
clearing 4-8viewing 4-8
Hh file 1-16halting program 2-7
at breakpoint 2-10header files 3-5hello1 example 2-2hello2 example 3-2hello.c 2-4, 3-4hex conversion utility 1-5Host Channel Control 7-17host operation 5-20hostio1 example 7-2hostio2 example 7-10hostio.c 7-3, 7-10HST module 1-11, 7-10
creating object 7-13HST_getpipe function 7-11HWI module 1-11
object properties 5-8
IIDL module 1-11, 3-10idle loop 3-5, 5-3ifdef symbols 2-8implicit instrumentation 5-15include files 3-5
inserting an object 3-3instruction cycles 2-13
profiling 2-14integrated development environment 1-7interrupts
disabled vs. enabled 3-10software 5-3
Llib file 1-16libraries
adding to project 2-3runtime-support 1-5
library-build utility 1-5linker 1-5linker command file 2-3, 3-3loading program 2-6LOG module 1-11LOG object
creating 3-3declaring 3-5
LOG_printf function 3-5
Mmailbox value 5-9main function 3-5mak file 1-16MEM module 1-11Message Log 3-6mixed source/ASM 2-13modules, list of 1-11myprojects folder 1-15
Nnaming conventions 5-7new project 2-2
Oobj file 1-16object
editing properties 5-7inserting 3-3renaming 3-3
optionscolor 2-10font 2-4
Index-2
Index
options for project 2-8out file 1-16
PPATH environment variable 1-17performance monitoring 1-9PIP module 1-11, 7-10PIP_alloc function 7-11PIP_free function 7-11PIP_get function 7-11PIP_getReaderAddr function 7-11PIP_getReaderNumFrames function 7-11PIP_getReaderSize function 7-11PIP_getWriterAddr function 7-11PIP_getWriterNumFrames function 7-11PIP_put function 7-11plug-ins
DSP/BIOS 1-9RTDX 1-13third party 1-14
plugins folder 1-15PRD module 1-12
adding object 6-3PRD_clock CLK object 6-4PRD_swi object 6-4PRD_tick function 6-4preprocessor symbols 2-8priorities of software interrupts 6-11Probe Point
connecting 4-7creating 4-6
profile clock 2-13profile-point
creating 2-13viewing statistics 2-14
programhalting 2-7loading onto target 2-6running 2-6
program tracing 1-9project
adding files 2-3building 2-6creating new 2-2options 2-8viewing files in 2-3
project management 1-8properties
changing 5-7viewing 5-6
Rreal-time deadlines 5-12, 6-10renaming an object 3-3resetting DSP 2-6RTDX
channel declaration 7-3rtdx folder 1-15RTDX host interface 1-13RTDX module 1-12
configuring 6-8, 7-7RTDX_channelBusy function 6-5, 7-3RTDX_enableInput function 6-5, 7-4RTDX_read function 7-3RTDX_readNB function 6-5RTDX_write function 7-3rtdx.Close 6-9rtdx.Open 6-9rtdx.WriteI4 6-9rts6201.lib 2-3rts6701.lib 2-3running 2-6
animation 4-9to cursor 2-11to main 5-10
running Code Composer Studio 2-2runtime-support libraries 1-5
Ssaving 2-9search path 2-3sectti utility 3-10signalprog.exe 7-6simulator iii, 1-2slider.exe 7-7source files
adding to project 2-3mixed C/assembly view 2-13
starting Code Composer Studio 2-2statistics
units 5-20, 6-10viewing with profile-points 2-14
Statistics View 5-15step commands 2-11stopping program 2-7structure
watch variables 2-12STS module 1-12
adding instrumentation 5-17Statistics View 5-15
STS_delta function 5-17STS_set function 5-17SWI module 1-12
Index-3
Index
object properties 5-9priorities 6-11
SWI_andn function 7-14SWI_dec function 5-3symbols, defining 2-8syntax errors 2-9
Ttime/frequency graph 4-8TRC module 1-12TRC_query function 5-17troubleshooting 2-6tutorial folder 1-15
Uunderscore 5-7uninstall folder 1-15USER0 tracing 5-18utility folder (bin) 1-15
Vvariables, editing 2-12vectors.asm 2-3view statistics 2-14Visual Basic application 6-2volume1 example 4-2volume2 example 5-2volume3 example 6-2volume4 example 6-2volume.c 4-4, 5-3, 6-5
Wwatch variable
adding 2-10changing value 2-12removing 2-12structures 2-12
wks file 1-16
Index-4