Embed Size (px)
Citation preview

To: Tennessee Municipal Benchmarking Project From: Michael Walters Young, Business Process Improvement Manager Date: March 24, 2015 Re: How is TMBP Data Being Used? The City of Franklin has many different performance measurement initiatives. Some of these are departmental based, while others are more comprehensive and organization-wide. The TMBP is one of those organization-wide initiatives. Over time, we have included results within the budget book to varying degrees. These add clarity to the budget and demonstrate the City’s overall standing and performance vs. the rest of the state. The current budget process (Fiscal 2016), uses TMBP data in a more deliberate and streamlined way than ever before. The two attachments demonstrate this usage. The first – a sample of the FY 2016 budget, has three pages dedicated to Performance Measures. The data is organized in a Workload/Efficiency/Outcome manner (similar to the way it is organized for the TMBP). It also highlights certain average data from the TMBP next to the comparable Franklin indicator. In this way, we are able to show how we compare in a uniform and easy to understand manner. The second example integrates TMBP data into our Strategic Plan, FranklinForward. This examples is a “scorecard” we created to demonstrate our progress on meeting strategic plan themes and goals. Although this scorecard has been partially developed, we will be shifting this presentation to an online scorecard in the near future to allow as transparent and open a presentation of how we are performing as possible. Questions? Thoughts? Concerns? E-mail me at: [email protected]. Or call me at (615) 550-6687.


City of Franklin, TennesseeFY 2016 Operating Budget Request
Building & Neighborhood ServicesChris Bridgewater, Director
Budget Summary
2013 2014 2016
Actual Actual Budget Estimated Base Budget $ %
Personnel 1,743,498 1,975,427 2,124,022 1,989,485 2,149,690 25,668 1.2%
Operations 357,660 304,090 312,232 357,250 245,478 ‐66,754 ‐21.4%
Capital 651,873 111,511 0 0 0 0 0.0%
Total 2,753,031 2,391,028 2,436,254 2,346,735 2,395,168 ‐41,086 ‐1.7%
Departmental Summary
Department Goals
2015 2015 v. 2016
The Building and Neighborhood Services Department supports the safety and quality of life for the residents and visitors of the City of Franklin. The department has multiple responsibilities including: plan review of construction documents, issuing permits (building, sign, driveway, and tree removal), construction inspections, property maintenance violation enforcement, and enforcement of other standards and regulations found in the Franklin Municipal Code and Zoning Ordinance. There are four divisions within this department: 1) Building Codes Review and Inspections, 2) Development Services and Permitting, 3) Zoning Administration and Inspections and 4) Neighborhood Resources and Housing.
Although construction activity has increased this past year, staff will be able to meet level of service commitments in the coming year.
In the coming fiscal year, Building and Neighborhood Services will continue to analyze its fee structure to more accurately offset costs of regulating development activity for residential and multi-family residential developments.
The focus this year will be to continue to make more services available online so that customers can choose to make applications over the internet, rather than having to make a trip to City Hall.
Building & Neighborhood Services
COF - Data Use #1
TMBP End of Cycle Meeting - 3/24/15 - Page 1
City of Franklin, TennesseeFY 2016 Operating Budget Request
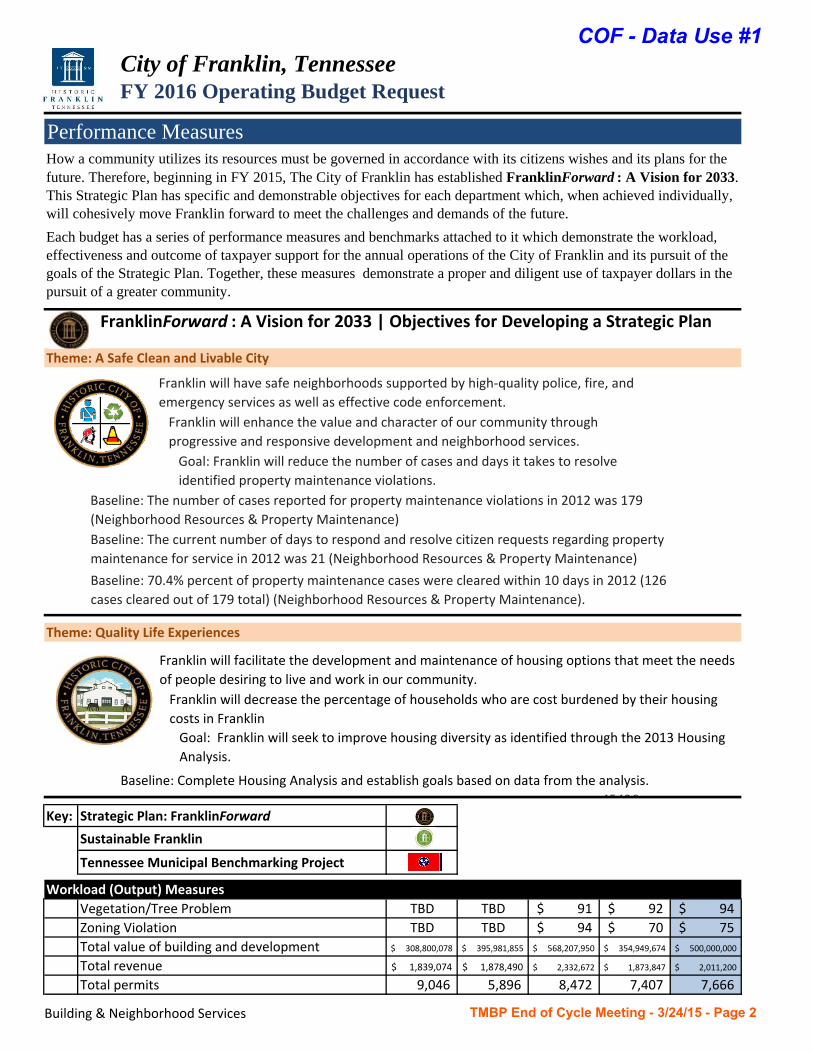
Performance Measures
FranklinForward : A Vision for 2033 | Objectives for Developing a Strategic Plan
Theme: A Safe Clean and Livable City
Theme: Quality Life Experiences
45436Key: Strategic Plan: FranklinForward
Sustainable Franklin
Tennessee Municipal Benchmarking Project TWorkload (Output) Measures
Vegetation/Tree Problem TBD TBD 91$ 92$ 94$
Zoning Violation TBD TBD 94$ 70$ 75$
Total value of building and development 308,800,078$ 395,981,855$ 568,207,950$ 354,949,674$ 500,000,000$
Total revenue 1,839,074$ 1,878,490$ 2,332,672$ 1,873,847$ 2,011,200$
Total permits 9,046 5,896 8,472 7,407 7,666
How a community utilizes its resources must be governed in accordance with its citizens wishes and its plans for the future. Therefore, beginning in FY 2015, The City of Franklin has established FranklinForward : A Vision for 2033. This Strategic Plan has specific and demonstrable objectives for each department which, when achieved individually, will cohesively move Franklin forward to meet the challenges and demands of the future.
Each budget has a series of performance measures and benchmarks attached to it which demonstrate the workload, effectiveness and outcome of taxpayer support for the annual operations of the City of Franklin and its pursuit of the goals of the Strategic Plan. Together, these measures demonstrate a proper and diligent use of taxpayer dollars in the pursuit of a greater community.
Franklin will have safe neighborhoods supported by high‐quality police, fire, and
emergency services as well as effective code enforcement.
Franklin will enhance the value and character of our community through
progressive and responsive development and neighborhood services.
Goal: Franklin will reduce the number of cases and days it takes to resolve
identified property maintenance violations.
Baseline: The number of cases reported for property maintenance violations in 2012 was 179
(Neighborhood Resources & Property Maintenance)
Baseline: The current number of days to respond and resolve citizen requests regarding property
maintenance for service in 2012 was 21 (Neighborhood Resources & Property Maintenance)
Baseline: 70.4% percent of property maintenance cases were cleared within 10 days in 2012 (126
cases cleared out of 179 total) (Neighborhood Resources & Property Maintenance).
Franklin will facilitate the development and maintenance of housing options that meet the needs
of people desiring to live and work in our community.
Franklin will decrease the percentage of households who are cost burdened by their housing
costs in Franklin
Goal: Franklin will seek to improve housing diversity as identified through the 2013 Housing
Analysis.
Baseline: Complete Housing Analysis and establish goals based on data from the analysis.
Building & Neighborhood Services
COF - Data Use #1
TMBP End of Cycle Meeting - 3/24/15 - Page 2

City of Franklin, TennesseeFY 2016 Operating Budget Request
Performance MeasuresTennessee Statewide Benchmarking Average 2,135 1,417 4,091 TBD TBD
Total construction plans reviewed 1,296 904 896 800 800Tennessee Statewide Benchmarking Average 560 486 456 TBD TBD
Total notice of completions issued N/A N/A N/A N/A N/A
Total certificates of occupancy issued 799 912 428 600 600
Building inspections performed 21,101 27,966 23,991 25,000 25,000 Tennessee Statewide Benchmarking Average 10,287 9,816 9,367 TBD TBD
Building code violations 3,889 N/C 5,388 4,200 6,224
Property Maintenance code inspections 272 499 566 600 600
Total property maintenance code violations 0 343 566 600 600
Inoperable auto violations 38 17 97 50 80
Overgrown lot violations 15 54 88 90 90
Dilapidated structure violations 0 10 29 20 28
Property Parcels 24,007 21,379 21,591 22,000 22,695
Number of building inspector / certified plan
reviewer FTEs11 11 15 16 16
Tennessee Statewide Benchmarking Average 4 4 5 TBD TBD
Number of permit technician / administrative /
support FTEs4 7 7 7 7
Total number of building code FTEs 22 20 25 26 26Tennessee Statewide Benchmarking Average 7 7 7 TBD TBD
Property maintenance code enforcement FTE's 2.5 2 2 2 2
Property maintenance administrative and support
FTEs1 0 0 0 0
Property Maintenance Inspections / 1,000 Parcels 11 23 26 27 26Tennessee Statewide Benchmarking Average 53 123 89 TBD TBD
Number of Construction Plans Reviewed per FTE (Inspectors/Reviewer FTEs Only)
118 82 60 50 50
Tennessee Statewide Benchmarking Average 156 96 109 TBD TBD
Building Inspections per FTE (Inspectors FTEs Only) 1,918 2,542 1,599 1,563 1,563
Tennessee Statewide Benchmarking Average 2417 1,813 1,717 TBD TBD
*FY 2015 & 2016 data estimated.
Efficiency Measures
2012 2013 2014 2015* 2016*
Building Code Enforcement Program Cost per
Capita30$ 32$ 29$ 30$ 33$
Tennessee Statewide Benchmarking Average 13$ 14$ 16$ TBD TBD
Building Code Inspectors/Certified Plan Reviewer
FTE per 1,000 Population0.18 0.17 0.22 0.23 0.23
Tennessee Statewide Benchmarking Average 0.08 0.10 0.10 TBD TBD
Property Maintenance Code Enforcement Program
Cost per Capita5.3 5$ 7$ 7$ 7$
Building & Neighborhood Services
COF - Data Use #1
TMBP End of Cycle Meeting - 3/24/15 - Page 3

City of Franklin, TennesseeFY 2016 Operating Budget Request
Performance MeasuresTennessee Statewide Benchmarking Average 5$ 4$ 4$ TBD TBD
Property Maintenance Inspections per Property
Maintenance Inspector FTEs109 250 283 300 300
Tennessee Statewide Benchmarking Average 557 898 1,661 TBD TBD
Property Maintenance Code Enforcement Program
Cost per Parcel13.80$ 16.00$ 23.32$ 23$ 23$
Tennessee Statewide Benchmarking Average 13.26$ 8.36$ 9.66$ TBD TBD
Revenue per Permit Issued N/A 182$ 211$ 253$ 262$ Tennessee Statewide Benchmarking Average 179$ 258$ 146$ TBD TBD
Building Code Enforcement cost per permit issued 207.47$ 337.86$ 237.72$ 283.52$ 273.94$
Tennessee Statewide Benchmarking Average 773.70$ 462.46$ 403.51$ TBD TBD
Total building code enforcement cost per building
inspection88.41$ 71.23$ 83.95$ 84.00$ 84.00$
Tennessee Statewide Benchmarking Average 169.23$ 194.83$ 171.41$ TBD TBD
*FY 2015 & 2016 data estimated.
Outcome (Effectiveness) Measures
2012 2013 2014 2015* 2016*
Reduce the number of cases and days it takes to resolve identified property maintenance violations.
# of cases reported for property maintenance
violations179 343 566 600 600
Target 179 179 179 179 179
Meets Target? Yes No No No No
# of days to respond and resolve citizen requests
regarding property maintenance for service 21 N/C 21 21 21
Target 21 21 21 21 21
Meets Target? Yes N/A Yes Yes Yes
% of property maintenance cases cleared within 10
days 70.4%
Target 70.4% 70.4% 70.4% 70.4% 70.4%
Average number of days from complaint to first
inspection3 N/C 2 2 2
Average number of days to resolve violation 21 N/C 21 21 21
Cases brought into compliance 210 325 580 600 600
Number of Property Maintenance Cases Brought
Into Compliance per 1,000 Population3 5 8 9 9
Tennessee Statewide Benchmarking Average 25 26 21 TBD TBD
% of all Property Maintenance Violations Brought
into ComplianceN/A 95% 102% 100% 100%
Tennessee Statewide Benchmarking Average N/A 86% 98% TBD TBD
*FY 2015 & 2016 data estimated.
Revenue and value of building estimates for FY 2015 are estimates and require further refinement.
Data being compiled
Building & Neighborhood Services
COF - Data Use #1
TMBP End of Cycle Meeting - 3/24/15 - Page 4

City of Franklin, TennesseeFY 2016 Operating Budget Request
Organizational Chart
Note: For detailed counts and authorized positions, please see following page entitled "Staffing by Position"
Building & Neighborhood Services
COF - Data Use #1
TMBP End of Cycle Meeting - 3/24/15 - Page 5

City of Franklin, TennesseeFY 2016 Operating Budget Request
Staffing by Position
Position Pay Grade
F‐T P‐T F‐T P‐T F‐T P‐T F‐T P‐T F‐T P‐T
Building & Neigh. Svcs. Director Grade K 1 0 1 0 1 0 1 0 1 0
Building Official Grade I 1 0 1 0 1 0 1 0 1 0
Zoning & Development Coor. Grade H 1 0 1 0 1 0 1 0 1 0
Plans Examiner III Grade H 0 0 0 0 1 0 1 0 0 0
Building Inspector IV Grade G 0 0 0 0 2 0 2 0 2 0
Plans Examiner II Grade G 0 0 0 0 2 0 2 0 3 0
Zoning Administrator Grade G 1 0 1 0 1 0 1 0 1 0
Neighborhood Resources Super Grade F 1 0 1 0 1 0 1 0 1 0
Housing Development Coor. Grade F 1 0 1 0 1 0 1 0 1 0
Plans Examiner I Grade F 0 0 0 0 2 0 2 0 2 0
Building Associate Grade F 1 0 1 0 1 0 1 0 1 0
Building Inspector III Grade F 0 0 0 0 3 0 3 0 4 0
Building Inspector II Grade E 0 0 0 0 4 0 5 0 2 0
Technical Support Specialist Grade E 0 0 0 0 1 0 1 0 1 0
Zoning Enforcement Officer Grade E 0 0 0 0 2 0 2 0 2 0
Signs/Design Standards Admin. Grade E 1 0 1 0 0 0 0 0 0 0
Neighborhood Resources Coor. Grade E 2 0 2 0 1 0 1 0 1 0
Building Inspector I Grade D 0 0 0 0 1 0 1 0 3 0
Permit Technician Grade D 4 0 4 0 3 0 3 0 3 0
Planning Associate Grade D 0 0 0 0 1 0 1 0 1 0
Administrative Assistant Grade D 0 0 0 0 1 0 1 0 1 0
Sr. Building Inspector ‐‐‐ 1 0 1 0 0 0 0 0 0 0
Sr. Building Inspector/Elect. ‐‐‐ 1 0 1 0 0 0 0 0 0 0
Building Inspector ‐ Plans Ex. Sr. ‐‐‐ 1 0 0 0 0 0 0 0 0 0
Build. Insp. ‐ Elect. Plans Ex.Sr. ‐‐‐ 1 0 0 0 0 0 0 0 0 0
Build. Insp. ‐ Plumb/Mech. Ex.Sr ‐‐‐ 1 0 1 0 0 0 0 0 0 0
Fire Code Plans Examiner ‐‐‐ 1 0 1 0 0 0 0 0 0 0
Build. Inspect. ‐ Electrical ‐‐‐ 2 2 0 2 0 0 0 0 0 0
Building Inspector ‐‐‐ 4 0 1 0 0 0 0 0 0 0
Combo Inspector ‐ Grade 1 ‐‐‐ 0 0 3 0 0 0 0 0 0 0
Combo Inspector ‐ Grade 2 ‐‐‐ 0 0 4 0 0 0 0 0 0 0
26 2 26 2 31 0 32 0 32 0
FY 2016
Total
FY 2012 FY 2013 FY 2014 FY 2015
Building & Neighborhood Services
COF - Data Use #1
TMBP End of Cycle Meeting - 3/24/15 - Page 6

City of Franklin, TennesseeFY 2016 Operating Budget Request
Budget Actual Actual Budget Estd Base
2013 2014 2015 2015 2016 $ %
Personnel
Salaries & Wages 1,229,063 1,369,159 1,551,213 1,424,899 1,524,110 (27,103) ‐1.7%
Employee Benefits 514,435 606,268 572,809 564,586 625,580 52,771 9.2%
Total Personnel 1,743,498 1,975,427 2,124,022 1,989,485 2,149,690 25,668 1.2%
Operations
Transportation Services 2,638 1,418 2,397 2,397 2,475 78 3.3%
Operating Services 4,823 8,330 10,600 10,113 5,300 (5,300) ‐50.0%
Notices, Subscriptions, etc. 9,203 18,417 14,974 14,824 15,384 410 2.7%
Utilities 24,920 29,497 27,707 27,735 27,747 40 0.1%
Contractual Services 109,819 89,272 20,000 27,323 20,000 ‐ 0.0%
Repair & Maintenance Services 15,725 19,559 15,980 15,980 16,400 420 2.6%
Employee programs 3,470 9,416 3,811 3,375 3,872 61 1.6%
Professional Development/Travel 10,950 10,289 21,600 21,647 24,775 3,175 14.7%
Office Supplies 11,320 12,328 10,620 10,360 10,930 310 2.9%
Operating Supplies 5,060 6,482 5,520 6,002 6,366 846 15.3%
Fuel & Mileage 21,296 20,654 22,000 20,000 20,000 (2,000) ‐9.1%
Machinery & Equipment (<$25,000 82,706 28,957 86,200 120,174 16,200 (70,000) ‐81.2%
Repair & Maintenance Supplies 2,420 507 ‐ ‐ ‐ ‐ 0.0%
Operational Units 24,612 34,424 45,436 45,436 45,436 ‐ 0.0%
Property & Liability Costs 27,898 13,321 11,420 16,958 16,070 4,650 40.7%
Permits 800 975 250 250 250 ‐ 0.0%
Financial Fees ‐ 25 ‐ ‐ ‐ ‐ 0.0%
Debt Service and Lease Payments ‐ 219 13,717 14,276 14,273 556 4.1%
Total Operations 357,660 304,090 312,232 357,250 245,478 (66,754) ‐21.4%
Capital 651,873 111,511 ‐ ‐ ‐ ‐ 0.0%
Total BNS Department 2,753,031 2,391,028 2,436,254 2,346,735 2,395,168 (41,086) ‐1.7%
Difference
Personnel- A part time Administrative Assistant is proposed to handle development related records requests. As properties change hands or are refinanced, all development related records are requested by parties of interest during the transaction. - An additional Plans Examiner I is proposed for the Zoning section to review Residential plans. The current Plans Examiner for the Zoning section also serves as the Flood Plain Administrator. Adding this position would allow the current plans examiner the time to focus on the intensive process needed to improve the City's CRS (Community Rating System) rating which impacts how much our citizens pay for flood insurance. This position would also focus on a more detailed and coordinated review of projects within the Historic Zoning Overlay.-Underfilled positions for Plans Examiner III, Inspector III, and Inspector II will be reduced to reflect the current status within the department. As Inspectors continue to gain certifications and demonstrate proficiency, requests will be made in future budgets to take advantage of the efficiencies gained from having multiply certified inspectors.OperationsBNS has implemented the Technology Fee which is intended to support technological improvements focused on providing better customer service. An example is to convert paper application processes to become accessible online, which is a key element of the City's Strategic Plan.In the past year, renovations to City Hall have created the floor space for a Development Services 'One Stop Shop' whose purpose is to allow all personnel needed to perform development approvals to be present in one location for a defined menu
Building & Neighborhood Services
COF - Data Use #1
TMBP End of Cycle Meeting - 3/24/15 - Page 7

FranklinForw
ard: Progress Report
Theme: A
Safe Clean
and Livab
le City
Goals
FY 2011
FY 2012
FY 2013
FY 2014
FY 2015*
Departm
ent: Fire
Average Franklin total response tim
e (dispatch and dep
artm
ent)*
4.48
5.49
5.53
6.04
TBD
Ten
nessee Statewide Ben
chmarking Average
4.30
4.45
4.38
TBD
TBD
Meets Target?
Yes
Yes
Yes
Yes
TBD
Meets Target?
No
No
No
TBD
TBD
Fire Loss per $1 m
illion of Appraised
Value
N/A
87.26
$
43.97
$
63.39
$
TBD
Meets Target?
N/A
N/A
Yes
No
TBD
* FY 2015 data estim
ated.
The Franklin Fire Departm
ent will reduce property fire loss per $1 m
illion of ap
praised value.
Sub‐Theme: Franklin will have safe neighborhoods supported by high‐quality police, fire, and emergency services as well as
effective code enforcement.
The Franklin Fire Departm
ent will provide a response tim
e among the top quartile of Tennessee Benchmark cities (TMBP).
Provide a response tim
e am
ong the top quartile of Tennessee Ben
chmark cities (TM
BP).
Percent met total target response tim
e (6 m
in, 35 sec)
Franklin Response among top quartile of TM
BP cities?
Sample FranklinForw
ard Scorecard
Page 1 of 1
3/13/2015
COF - Data Use #1
TMBP End of Cycle Meeting - 3/24/15 - Page 8