Embed Size (px)
Citation preview

TM
ADL Global 100: A Survey of Attitudes Toward Jews in
Over 100 Countries Around the World
Total population
of countries surveyed:
5,940,093,187 = 85.9% of the world’s population
Total adult population
of countries surveyed:
4,161,578,905 = 88.4% of the world’s adult population
Surveys conducted in
countries which account for:
96.9%
of the world’s GDP
Surveys
conducted in:
9 of the 10
most populous countries in the world
2
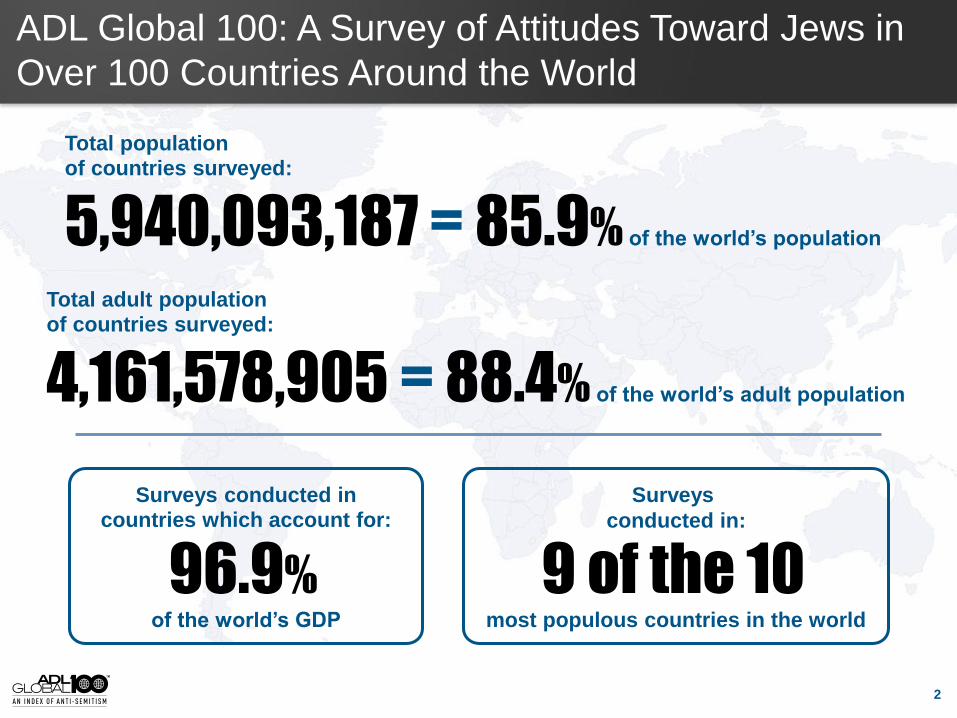
ADL Global 100 Countries by Region
The Americas Western Europe Eastern Europe Middle East & North
Africa (MENA) Sub-Saharan
Africa Asia Oceania
Argentina Austria Belarus Algeria Botswana Armenia Australia
Bolivia Belgium Bosnia & Herzegovina Bahrain Cameroon Azerbaijan New Zealand
Brazil Denmark Bulgaria Egypt Côte d’Ivoire Bangladesh
Canada Finland Croatia Iran Ghana China
Chile France Czech Republic Iraq Kenya Georgia
Colombia Germany Estonia Jordan Mauritius India
Costa Rica Greece Hungary Kuwait Nigeria Indonesia
Dominican Republic Iceland Latvia Lebanon Senegal Japan
Guatemala Ireland Lithuania Libya South Africa Kazakhstan
Haiti Italy Moldova Morocco Tanzania Laos
Jamaica The Netherlands Montenegro Oman Uganda Malaysia
Mexico Norway Poland Qatar Mongolia
Nicaragua Portugal Romania Saudi Arabia The Philippines
Panama Spain Russia Tunisia Singapore
Paraguay Sweden Serbia Turkey South Korea
Peru Switzerland Slovenia United Arab Emirates Thailand
Trinidad & Tobago United Kingdom Ukraine West Bank & Gaza Vietnam
United States Yemen
Uruguay
Venezuela
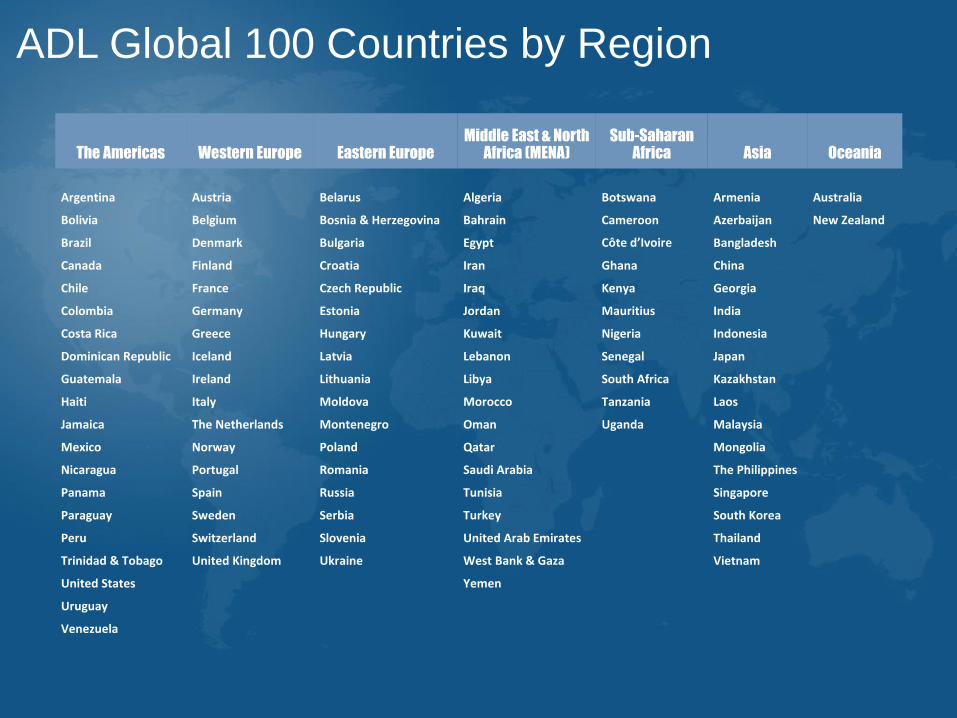
The ADL Global 100: World Coverage
Polled countries Included Not included
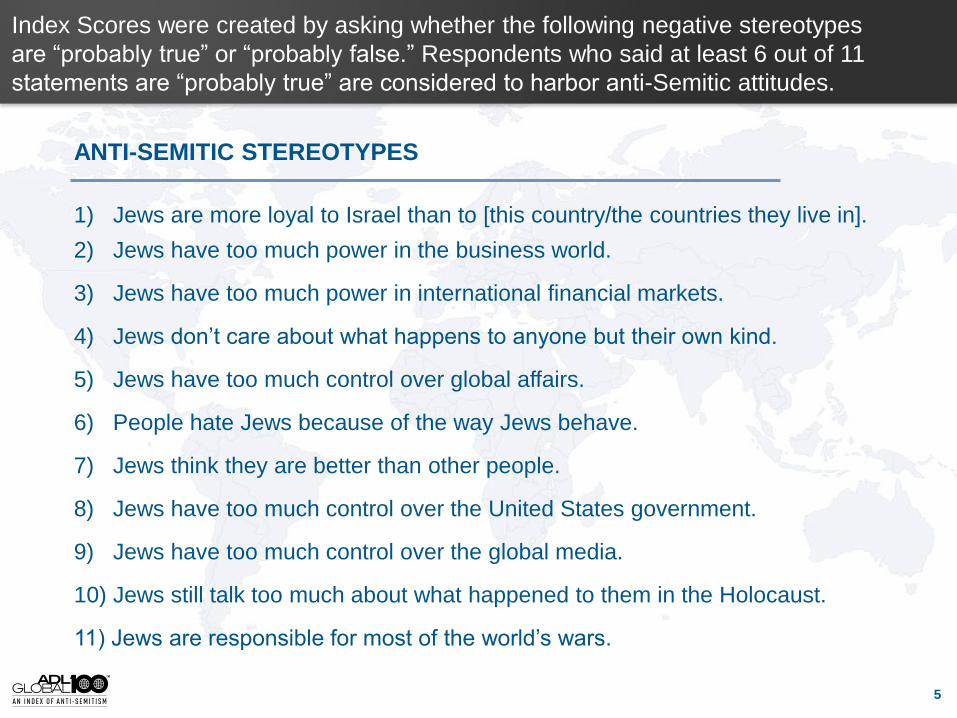
ANTI-SEMITIC STEREOTYPES
1) Jews are more loyal to Israel than to [this country/the countries they live in].
2) Jews have too much power in the business world.
3) Jews have too much power in international financial markets.
4) Jews don’t care about what happens to anyone but their own kind.
5) Jews have too much control over global affairs.
6) People hate Jews because of the way Jews behave.
7) Jews think they are better than other people.
8) Jews have too much control over the United States government.
9) Jews have too much control over the global media.
10) Jews still talk too much about what happened to them in the Holocaust.
11) Jews are responsible for most of the world’s wars.
Index Scores were created by asking whether the following negative stereotypes
are “probably true” or “probably false.” Respondents who said at least 6 out of 11
statements are “probably true” are considered to harbor anti-Semitic attitudes.
5
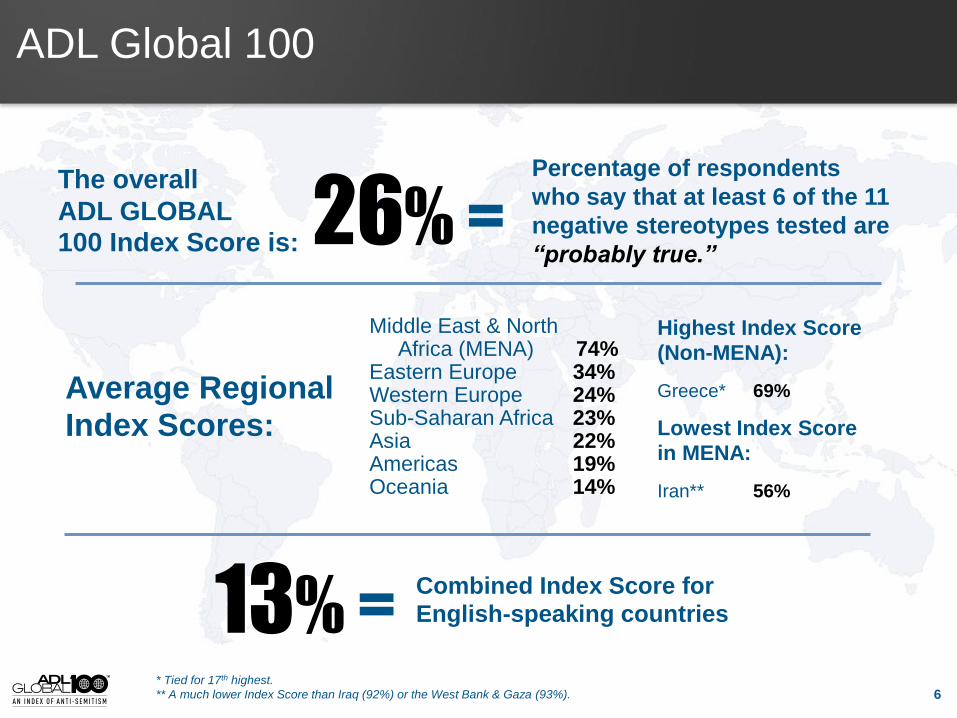
The overall
ADL GLOBAL 100 Index Score is: 26% =
Percentage of respondents
who say that at least 6 of the 11
negative stereotypes tested are
“probably true.”
* Tied for 17th highest.
** A much lower Index Score than Iraq (92%) or the West Bank & Gaza (93%).
Average Regional Index Scores:
Middle East & North Africa (MENA) 74% Eastern Europe 34% Western Europe 24% Sub-Saharan Africa 23% Asia 22% Americas 19% Oceania 14%
Lowest Index Score
in MENA:
Iran** 56%
Highest Index Score
(Non-MENA):
Greece* 69%
ADL Global 100
Combined Index Score for
English-speaking countries 13% = 6
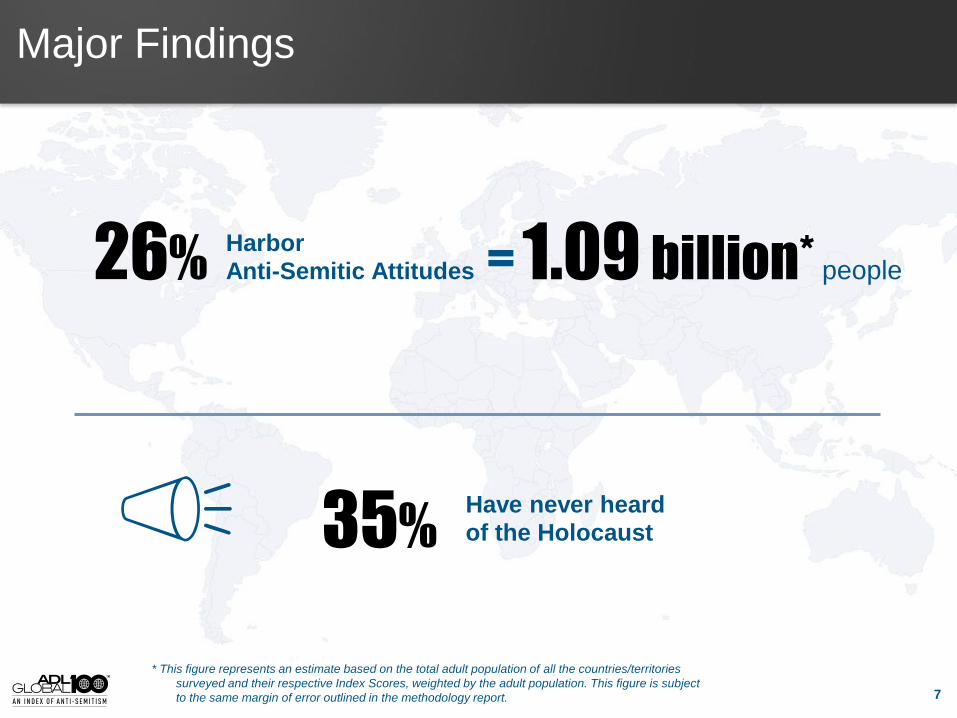
Major Findings
26% Harbor Anti-Semitic Attitudes = 1.09 billion* people
35% Have never heard
of the Holocaust
* This figure represents an estimate based on the total adult population of all the countries/territories
surveyed and their respective Index Scores, weighted by the adult population. This figure is subject
to the same margin of error outlined in the methodology report. 7
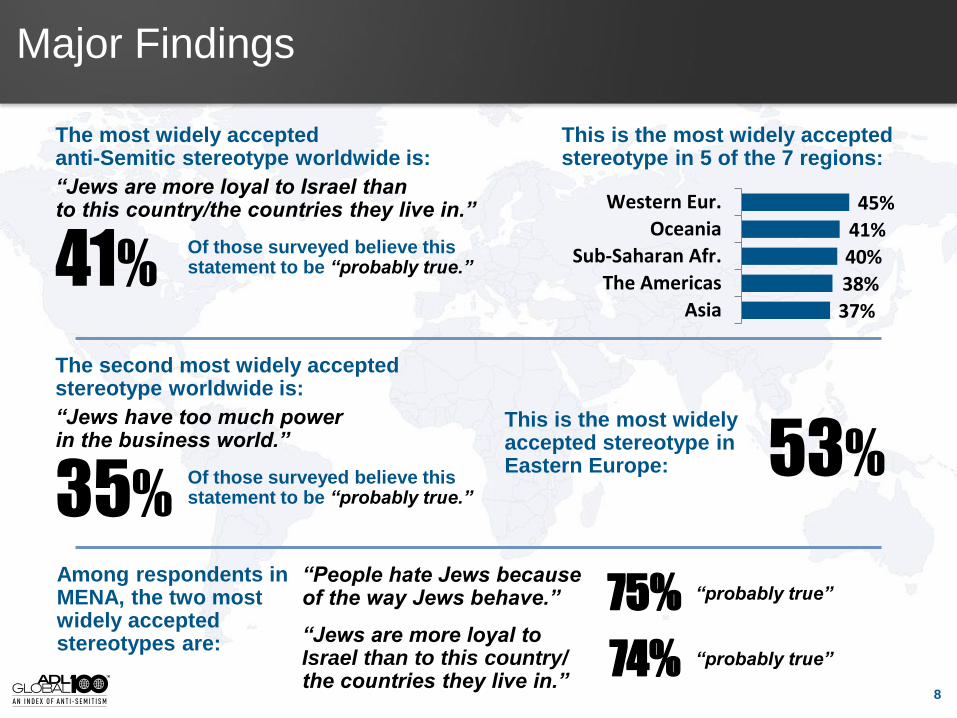
Major Findings
41%
The most widely accepted anti-Semitic stereotype worldwide is:
Of those surveyed believe this statement to be “probably true.”
“Jews are more loyal to Israel than to this country/the countries they live in.”
37%
38%
40%
41%
45%
Asia
The Americas
Sub-Saharan Afr.
Oceania
Western Eur.
This is the most widely accepted stereotype in 5 of the 7 regions:
75% “probably true” Among respondents in MENA, the two most widely accepted stereotypes are:
“People hate Jews because of the way Jews behave.”
35%
The second most widely accepted stereotype worldwide is:
Of those surveyed believe this statement to be “probably true.”
“Jews have too much power in the business world.”
This is the most widely accepted stereotype in Eastern Europe: 53%
8
“Jews are more loyal to Israel than to this country/ the countries they live in.”
74% “probably true”
Major Findings
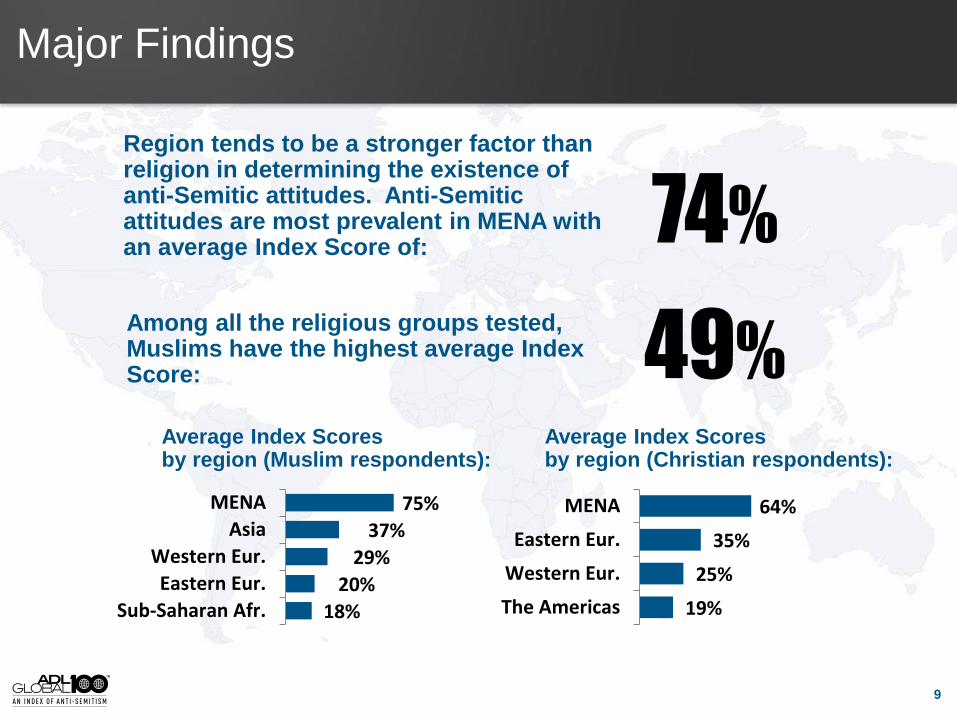
74%
Region tends to be a stronger factor than religion in determining the existence of anti-Semitic attitudes. Anti-Semitic attitudes are most prevalent in MENA with an average Index Score of:
49% Among all the religious groups tested, Muslims have the highest average Index Score:
18%
20%
29%
37%
75%
Sub-Saharan Afr.
Eastern Eur.
Western Eur.
Asia
MENA
Average Index Scores by region (Muslim respondents):
19%
25%
35%
64%
The Americas
Western Eur.
Eastern Eur.
MENA
Average Index Scores by region (Christian respondents):
9
Major Findings
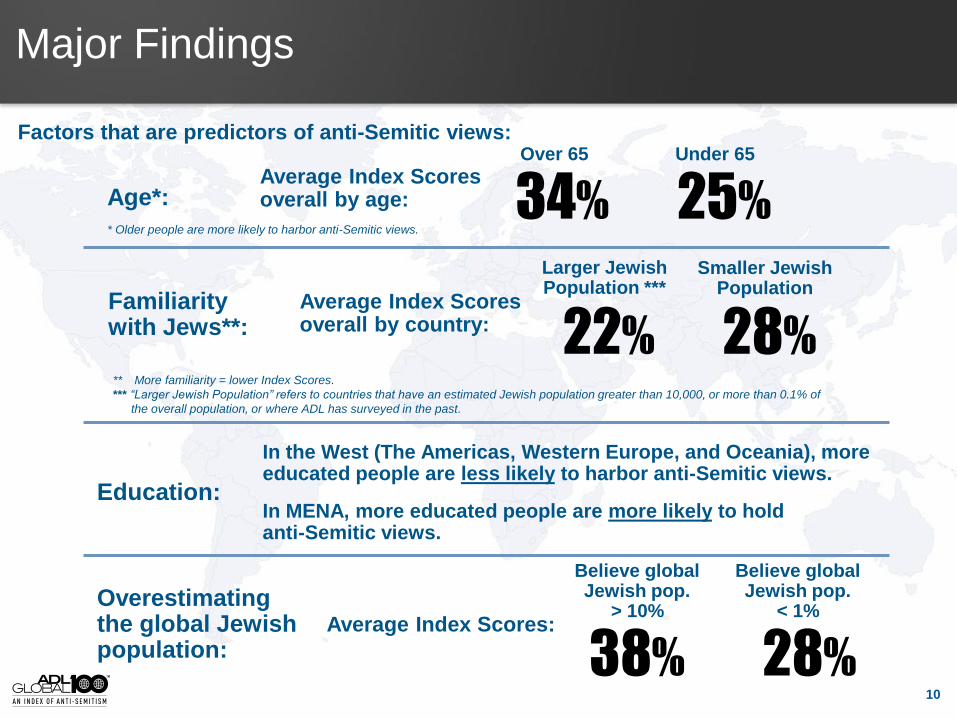
Age*: Average Index Scores overall by age:
Over 65
34% Under 65
25%
Familiarity with Jews**:
Average Index Scores overall by country:
Larger Jewish Population ***
22%
Smaller Jewish Population
28%
Education:
In the West (The Americas, Western Europe, and Oceania), more educated people are less likely to harbor anti-Semitic views.
In MENA, more educated people are more likely to hold anti-Semitic views.
Overestimating the global Jewish population:
Average Index Scores:
Believe global Jewish pop.
> 10%
38% 28%
Believe global Jewish pop.
< 1%
* Older people are more likely to harbor anti-Semitic views.
** More familiarity = lower Index Scores.
*** “Larger Jewish Population” refers to countries that have an estimated Jewish population greater than 10,000, or more than 0.1% of
the overall population, or where ADL has surveyed in the past.
10
Factors that are predictors of anti-Semitic views:
Major Findings
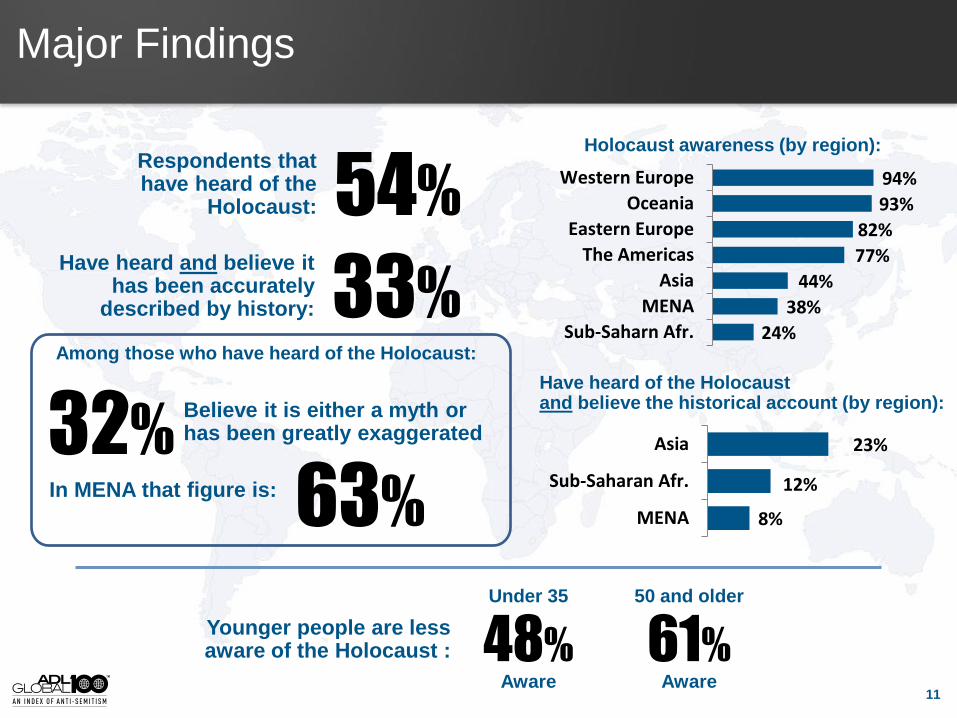
24%
38%
44%
77%
82%
93%
94%
Sub-Saharn Afr.
MENA
Asia
The Americas
Eastern Europe
Oceania
Western Europe
Holocaust awareness (by region):
8%
12%
23%
MENA
Sub-Saharan Afr.
Asia
Have heard of the Holocaust and believe the historical account (by region):
54% Respondents that have heard of the
Holocaust:
33% Have heard and believe it
has been accurately described by history:
32% Believe it is either a myth or has been greatly exaggerated
63% In MENA that figure is:
Younger people are less aware of the Holocaust :
Under 35
48% Aware
50 and older
61% Aware
Among those who have heard of the Holocaust:
11
Major Findings
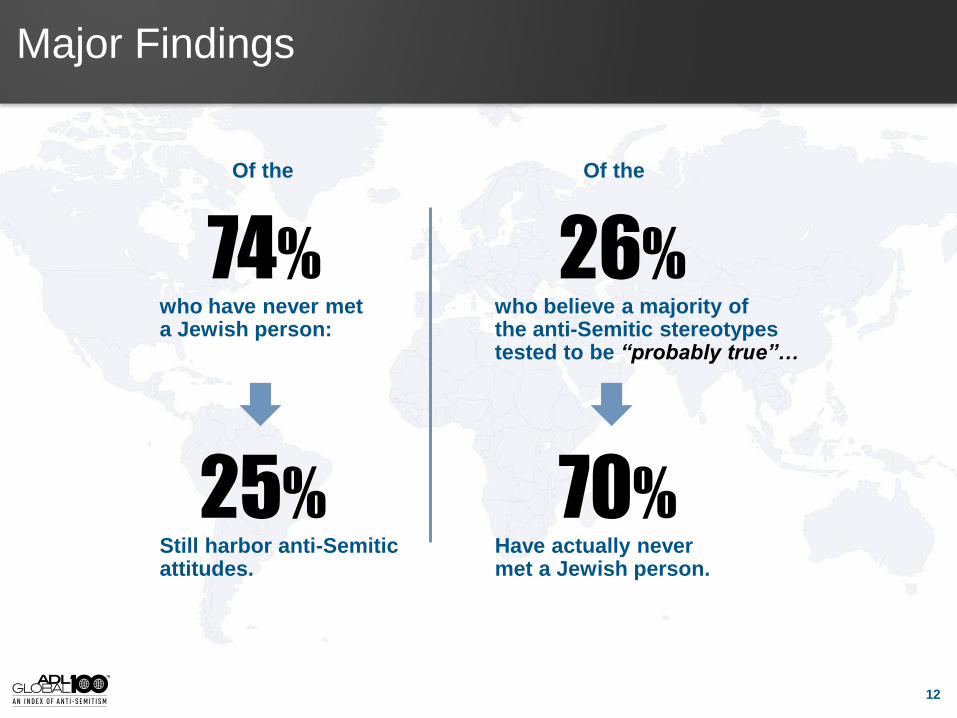
74% who have never met a Jewish person:
25% Still harbor anti-Semitic attitudes.
26%
Of the
who believe a majority of the anti-Semitic stereotypes tested to be “probably true”…
70% Have actually never met a Jewish person.
Of the
12
Major Findings
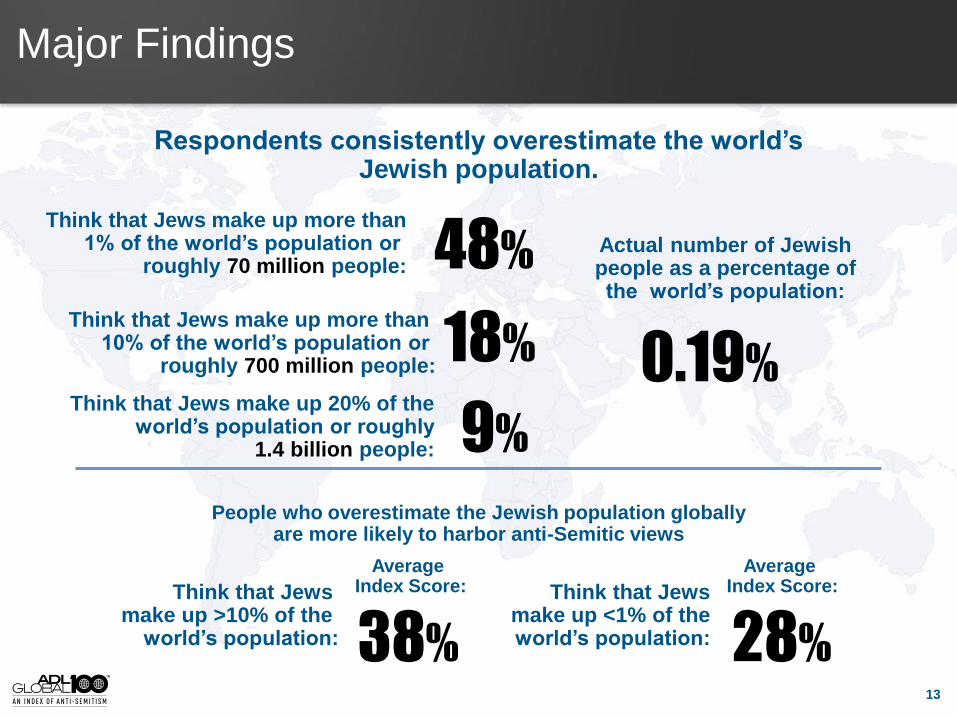
Respondents consistently overestimate the world’s Jewish population.
48% Think that Jews make up more than
1% of the world’s population or roughly 70 million people:
18% Think that Jews make up more than
10% of the world’s population or roughly 700 million people:
9% Think that Jews make up 20% of the
world’s population or roughly 1.4 billion people:
Actual number of Jewish people as a percentage of the world’s population:
0.19%
People who overestimate the Jewish population globally are more likely to harbor anti-Semitic views
Think that Jews make up >10% of the
world’s population: 38%
Average Index Score: Think that Jews
make up <1% of the world’s population: 28%
Average Index Score:
13
Major Findings
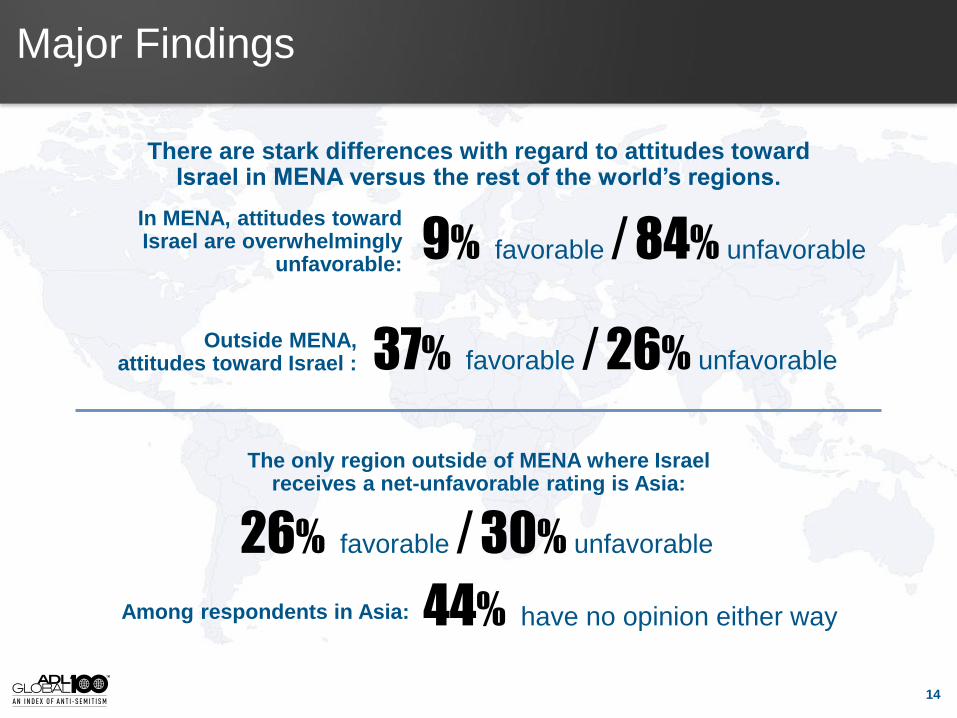
There are stark differences with regard to attitudes toward Israel in MENA versus the rest of the world’s regions.
9% favorable / 84% unfavorable
In MENA, attitudes toward Israel are overwhelmingly
unfavorable:
37% favorable / 26% unfavorable Outside MENA,
attitudes toward Israel :
26% favorable / 30% unfavorable
The only region outside of MENA where Israel receives a net-unfavorable rating is Asia:
44% have no opinion either way Among respondents in Asia:
14
Major Findings
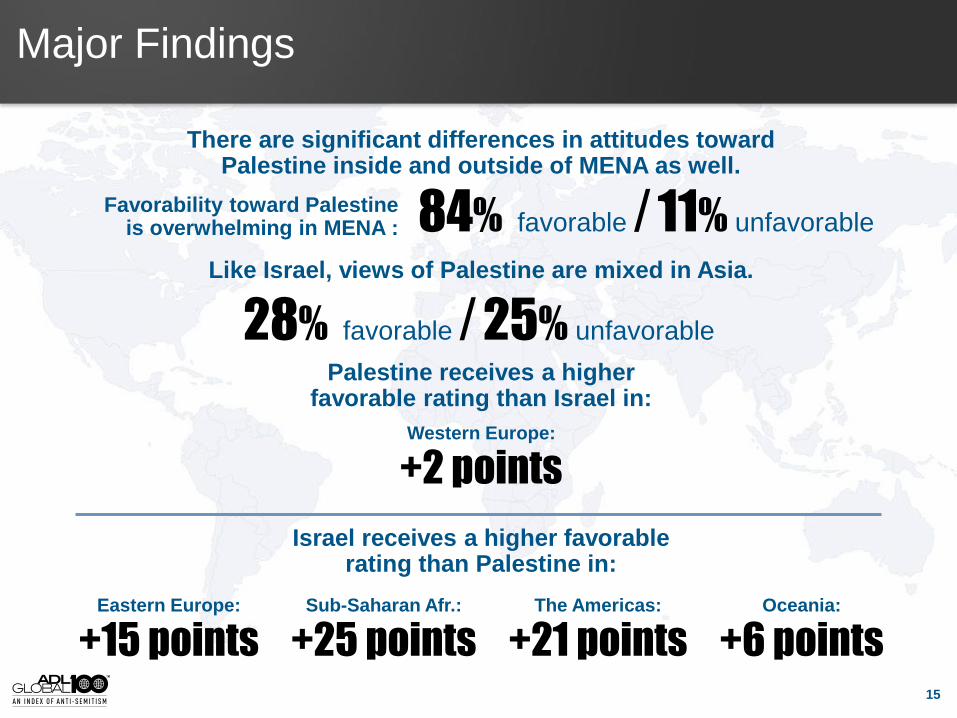
There are significant differences in attitudes toward Palestine inside and outside of MENA as well.
84% favorable / 11% unfavorable Favorability toward Palestine
is overwhelming in MENA :
Like Israel, views of Palestine are mixed in Asia.
28% favorable / 25% unfavorable
Israel receives a higher favorable rating than Palestine in:
Sub-Saharan Afr.:
+25 points Eastern Europe:
+15 points The Americas:
+21 points Oceania:
+6 points
Palestine receives a higher favorable rating than Israel in:
Western Europe:
+2 points
15
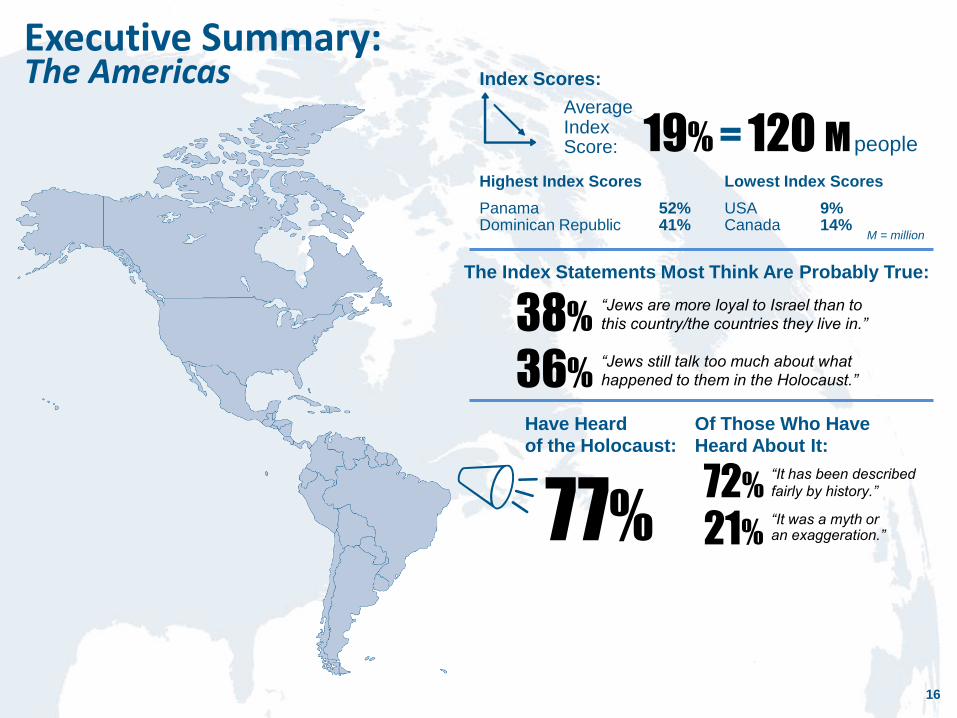
The Index Statements Most Think Are Probably True:
“Jews are more loyal to Israel than to
this country/the countries they live in.”
“Jews still talk too much about what
happened to them in the Holocaust.”
38%
36%
Highest Index Scores
Panama 52% Dominican Republic 41%
Lowest Index Scores
USA 9% Canada 14%
Average Index Score: 19% = 120 M people
Index Scores:
Have Heard of the Holocaust:
77%
Of Those Who Have Heard About It:
72% “It has been described
fairly by history.”
21% “It was a myth or an exaggeration.”
Executive Summary: The Americas
M = million
16
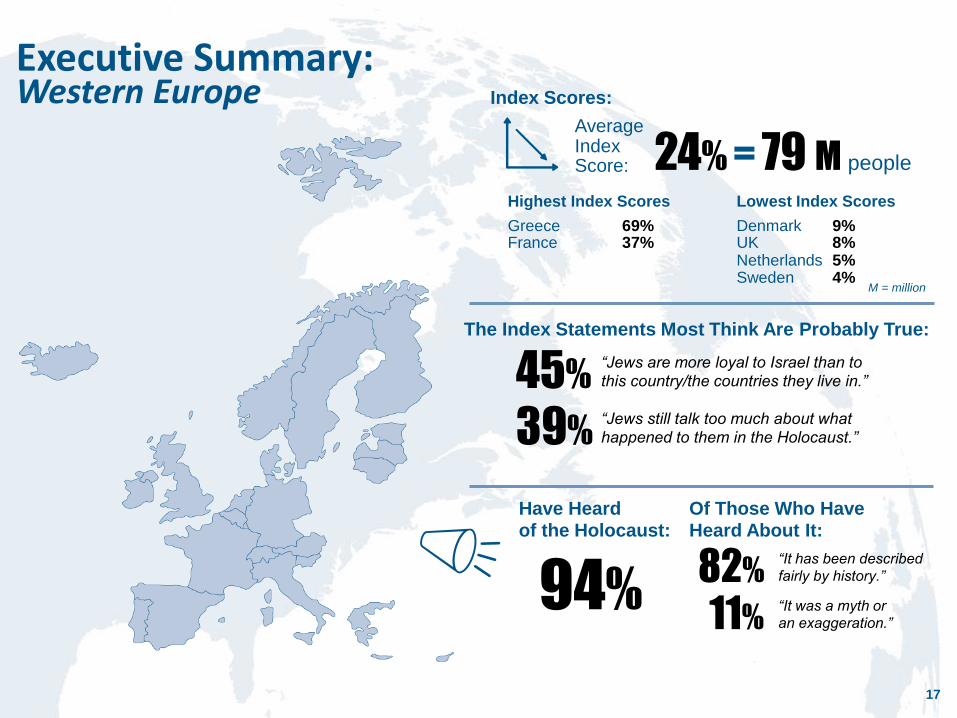
Highest Index Scores
Greece 69% France 37%
Lowest Index Scores
Denmark 9% UK 8% Netherlands 5% Sweden 4%
Average Index Score: 24% = 79 M people
Index Scores:
Executive Summary: Western Europe
Have Heard of the Holocaust:
94%
Of Those Who Have Heard About It:
82% “It has been described
fairly by history.”
11% “It was a myth or
an exaggeration.”
The Index Statements Most Think Are Probably True:
“Jews are more loyal to Israel than to
this country/the countries they live in.”
“Jews still talk too much about what happened to them in the Holocaust.”
45%
39%
M = million
17
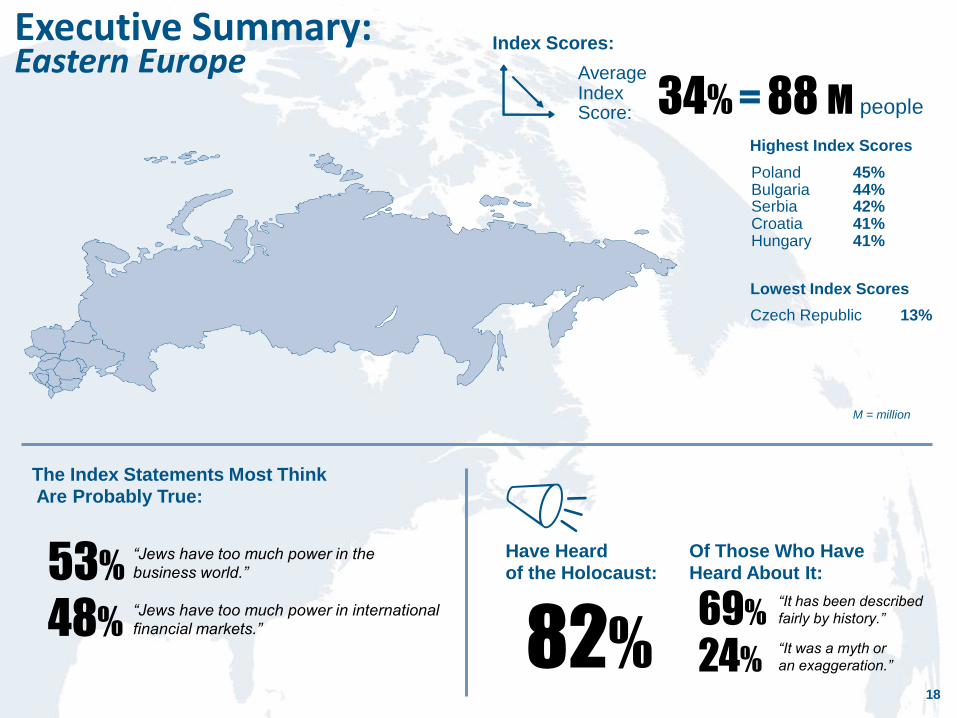
Have Heard of the Holocaust:
82%
Of Those Who Have Heard About It:
69% “It has been described
fairly by history.”
24% “It was a myth or
an exaggeration.”
Average Index Score:
Highest Index Scores
Poland 45% Bulgaria 44% Serbia 42% Croatia 41% Hungary 41%
34% = 88 M people
Lowest Index Scores
Czech Republic 13%
Index Scores: Executive Summary: Eastern Europe
The Index Statements Most Think Are Probably True:
“Jews have too much power in the business world.”
“Jews have too much power in international
financial markets.”
53%
48%
M = million
18
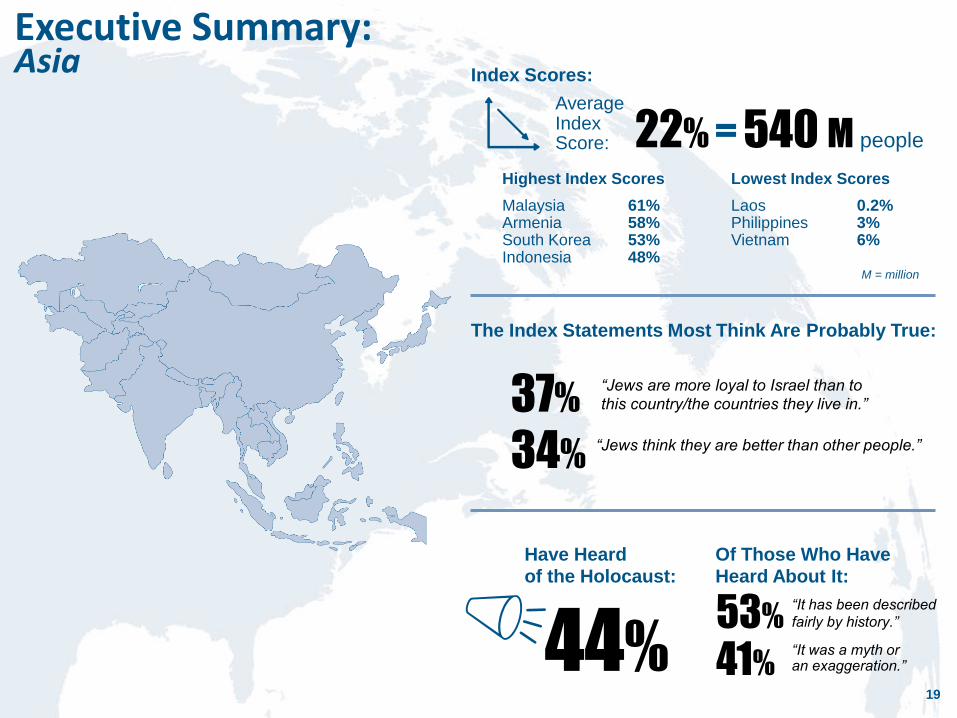
Average Index Score: 22% = 540 M people
Index Scores:
Highest Index Scores
Malaysia 61% Armenia 58% South Korea 53% Indonesia 48%
Lowest Index Scores
Laos 0.2% Philippines 3% Vietnam 6%
Executive Summary: Asia
Have Heard of the Holocaust:
44%
Of Those Who Have Heard About It:
53% “It has been described
fairly by history.”
41% “It was a myth or an exaggeration.”
The Index Statements Most Think Are Probably True:
“Jews think they are better than other people.”
37%
34%
“Jews are more loyal to Israel than to
this country/the countries they live in.”
M = million
19
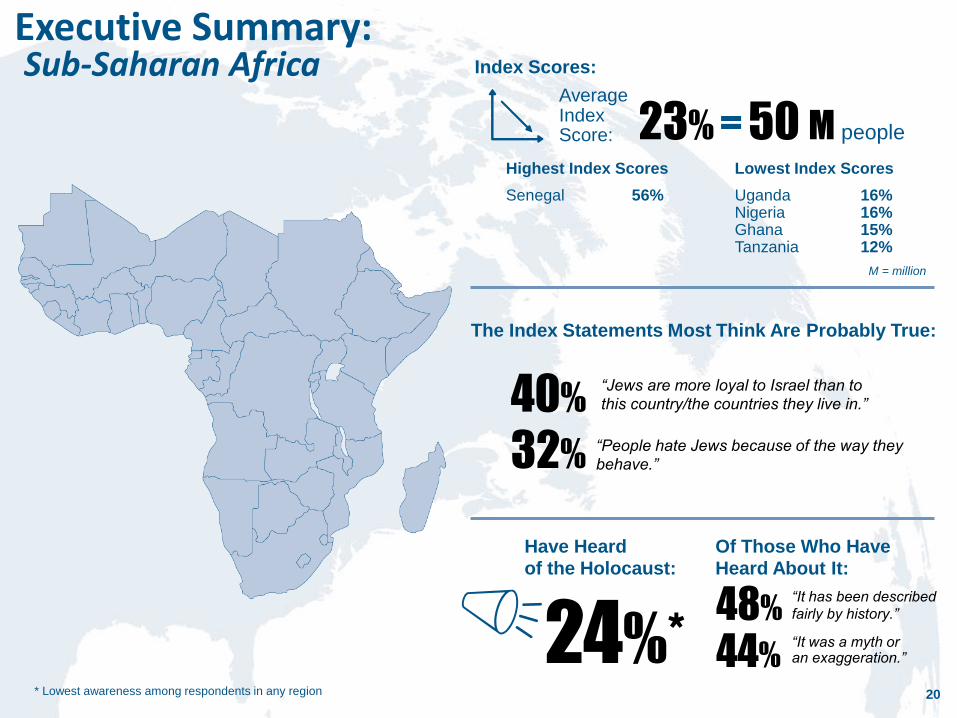
Highest Index Scores
Senegal 56%
Lowest Index Scores
Uganda 16% Nigeria 16% Ghana 15% Tanzania 12%
Average Index Score: 23% = 50 M people
Index Scores:
* Lowest awareness among respondents in any region
Executive Summary: Sub-Saharan Africa
Have Heard of the Holocaust:
24%*
Of Those Who Have Heard About It:
48% “It has been described
fairly by history.”
44% “It was a myth or an exaggeration.”
The Index Statements Most Think Are Probably True:
“People hate Jews because of the way they
behave.”
40%
32%
“Jews are more loyal to Israel than to
this country/the countries they live in.”
M = million
20
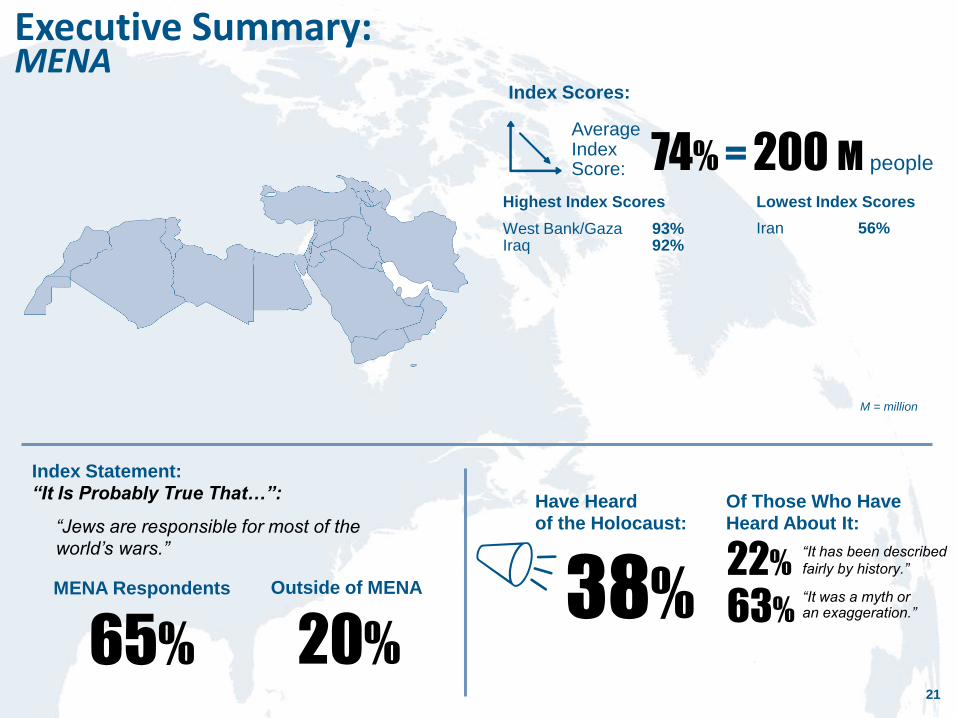
Index Scores:
Index Statement:
“It Is Probably True That…”:
“Jews are responsible for most of the
world’s wars.”
65%
MENA Respondents
20%
Outside of MENA
Average Index Score:
Highest Index Scores
West Bank/Gaza 93% Iraq 92%
74% = 200 M people
Lowest Index Scores
Iran 56%
Executive Summary: MENA
Have Heard of the Holocaust:
38%
Of Those Who Have Heard About It:
22% “It has been described
fairly by history.”
63% “It was a myth or an exaggeration.”
M = million
21
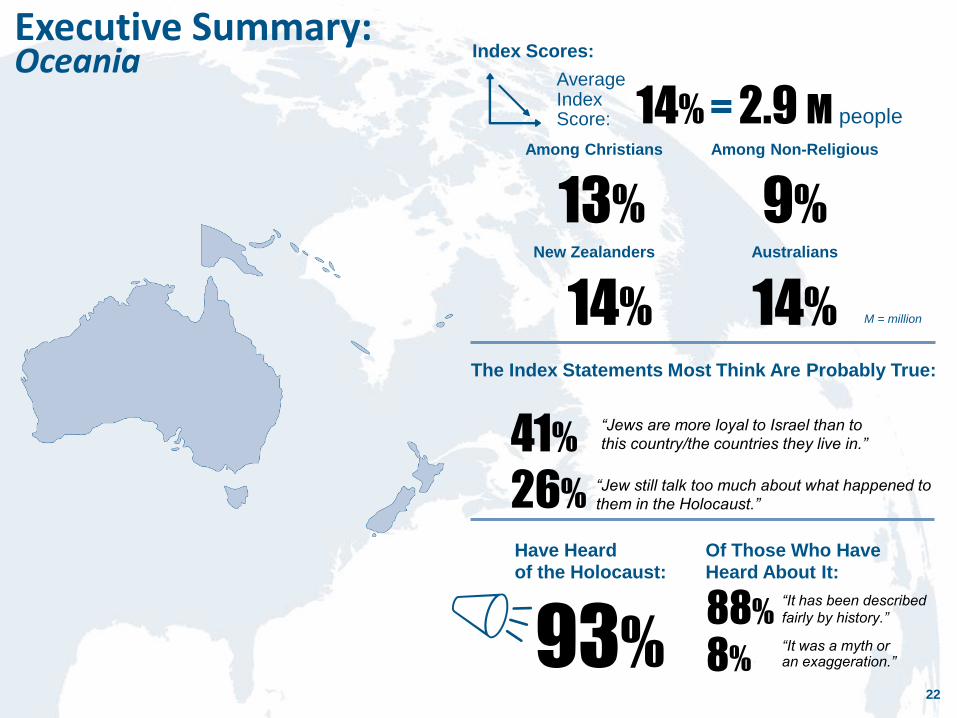
Average Index Score: 14% = 2.9 M people
Index Scores:
13%
Among Christians
9%
Among Non-Religious
14%
New Zealanders
14%
Australians
Executive Summary: Oceania
Have Heard of the Holocaust:
93%
Of Those Who Have Heard About It:
88% “It has been described
fairly by history.”
8% “It was a myth or an exaggeration.”
The Index Statements Most Think Are Probably True:
“Jew still talk too much about what happened to
them in the Holocaust.”
41%
26%
“Jews are more loyal to Israel than to this country/the countries they live in.”
M = million
22

Findings
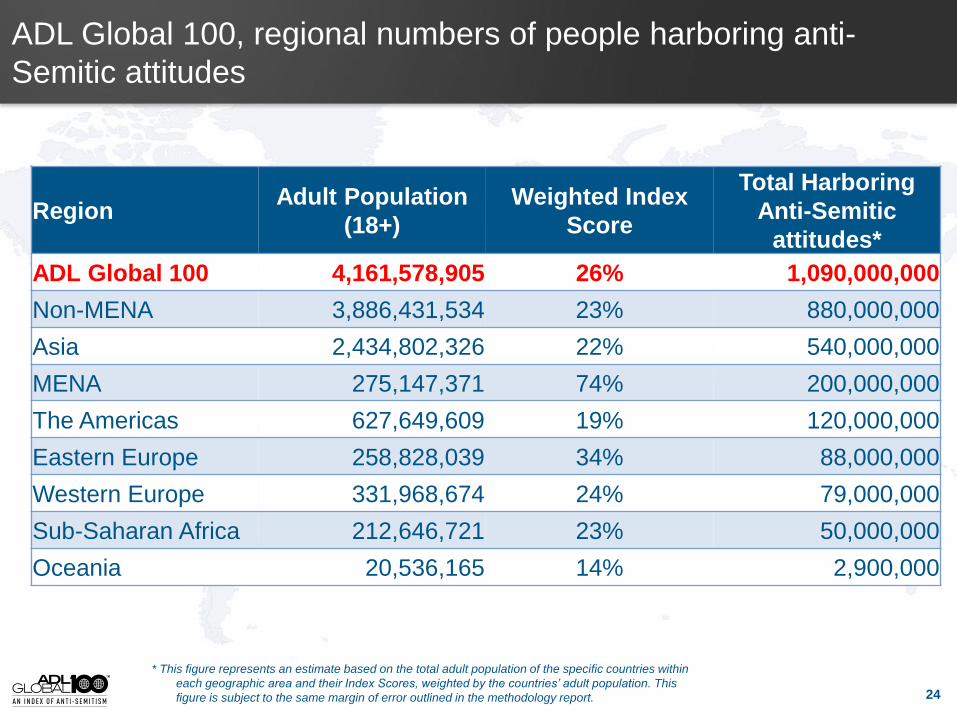
ADL Global 100, regional numbers of people harboring anti-
Semitic attitudes
Region Adult Population
(18+)
Weighted Index
Score
Total Harboring
Anti-Semitic
attitudes*
ADL Global 100 4,161,578,905 26% 1,090,000,000
Non-MENA 3,886,431,534 23% 880,000,000
Asia 2,434,802,326 22% 540,000,000
MENA 275,147,371 74% 200,000,000
The Americas 627,649,609 19% 120,000,000
Eastern Europe 258,828,039 34% 88,000,000
Western Europe 331,968,674 24% 79,000,000
Sub-Saharan Africa 212,646,721 23% 50,000,000
Oceania 20,536,165 14% 2,900,000
* This figure represents an estimate based on the total adult population of the specific countries within
each geographic area and their Index Scores, weighted by the countries’ adult population. This
figure is subject to the same margin of error outlined in the methodology report. 24
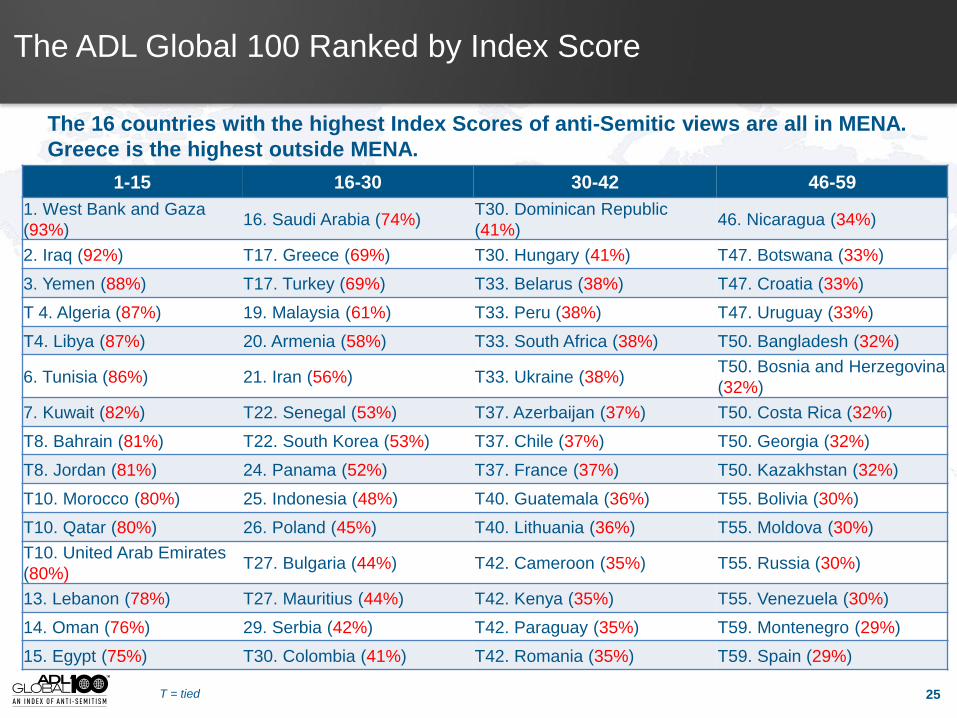
1-15 16-30 30-42 46-59
1. West Bank and Gaza
(93%) 16. Saudi Arabia (74%)
T30. Dominican Republic
(41%) 46. Nicaragua (34%)
2. Iraq (92%) T17. Greece (69%) T30. Hungary (41%) T47. Botswana (33%)
3. Yemen (88%) T17. Turkey (69%) T33. Belarus (38%) T47. Croatia (33%)
T 4. Algeria (87%) 19. Malaysia (61%) T33. Peru (38%) T47. Uruguay (33%)
T4. Libya (87%) 20. Armenia (58%) T33. South Africa (38%) T50. Bangladesh (32%)
6. Tunisia (86%) 21. Iran (56%) T33. Ukraine (38%) T50. Bosnia and Herzegovina
(32%)
7. Kuwait (82%) T22. Senegal (53%) T37. Azerbaijan (37%) T50. Costa Rica (32%)
T8. Bahrain (81%) T22. South Korea (53%) T37. Chile (37%) T50. Georgia (32%)
T8. Jordan (81%) 24. Panama (52%) T37. France (37%) T50. Kazakhstan (32%)
T10. Morocco (80%) 25. Indonesia (48%) T40. Guatemala (36%) T55. Bolivia (30%)
T10. Qatar (80%) 26. Poland (45%) T40. Lithuania (36%) T55. Moldova (30%)
T10. United Arab Emirates
(80%) T27. Bulgaria (44%) T42. Cameroon (35%) T55. Russia (30%)
13. Lebanon (78%) T27. Mauritius (44%) T42. Kenya (35%) T55. Venezuela (30%)
14. Oman (76%) 29. Serbia (42%) T42. Paraguay (35%) T59. Montenegro (29%)
15. Egypt (75%) T30. Colombia (41%) T42. Romania (35%) T59. Spain (29%)
The 16 countries with the highest Index Scores of anti-Semitic views are all in MENA.
Greece is the highest outside MENA.
The ADL Global 100 Ranked by Index Score
T = tied 25
The ADL Global 100 Ranked by Index Score
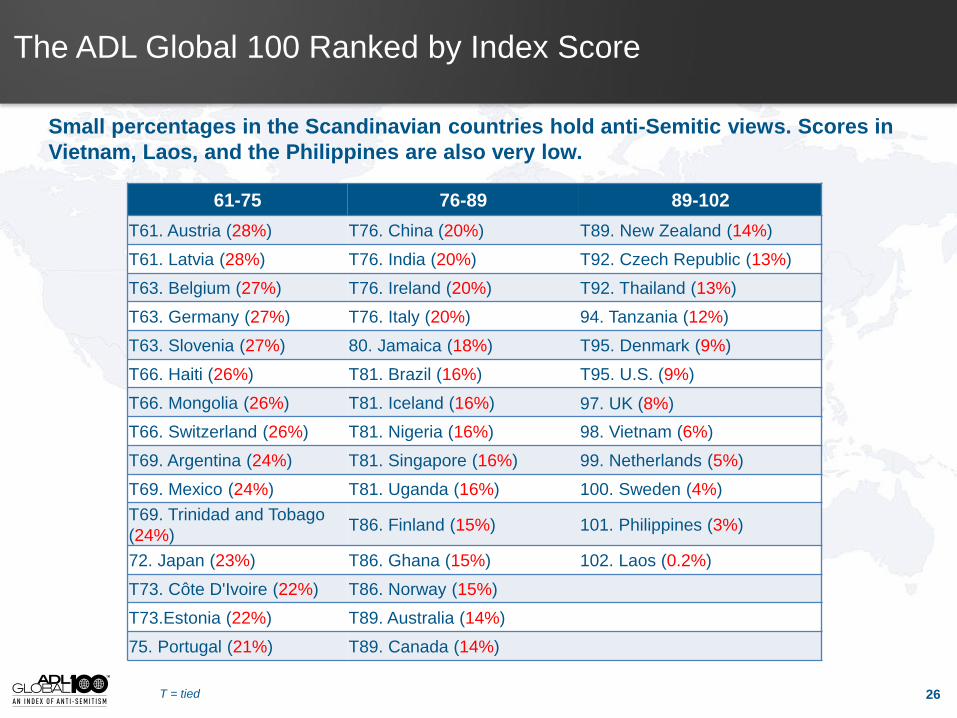
61-75 76-89 89-102
T61. Austria (28%) T76. China (20%) T89. New Zealand (14%)
T61. Latvia (28%) T76. India (20%) T92. Czech Republic (13%)
T63. Belgium (27%) T76. Ireland (20%) T92. Thailand (13%)
T63. Germany (27%) T76. Italy (20%) 94. Tanzania (12%)
T63. Slovenia (27%) 80. Jamaica (18%) T95. Denmark (9%)
T66. Haiti (26%) T81. Brazil (16%) T95. U.S. (9%)
T66. Mongolia (26%) T81. Iceland (16%) 97. UK (8%)
T66. Switzerland (26%) T81. Nigeria (16%) 98. Vietnam (6%)
T69. Argentina (24%) T81. Singapore (16%) 99. Netherlands (5%)
T69. Mexico (24%) T81. Uganda (16%) 100. Sweden (4%)
T69. Trinidad and Tobago
(24%) T86. Finland (15%) 101. Philippines (3%)
72. Japan (23%) T86. Ghana (15%) 102. Laos (0.2%)
T73. Côte D'Ivoire (22%) T86. Norway (15%)
T73.Estonia (22%) T89. Australia (14%)
75. Portugal (21%) T89. Canada (14%)
Small percentages in the Scandinavian countries hold anti-Semitic views. Scores in
Vietnam, Laos, and the Philippines are also very low.
T = tied 26
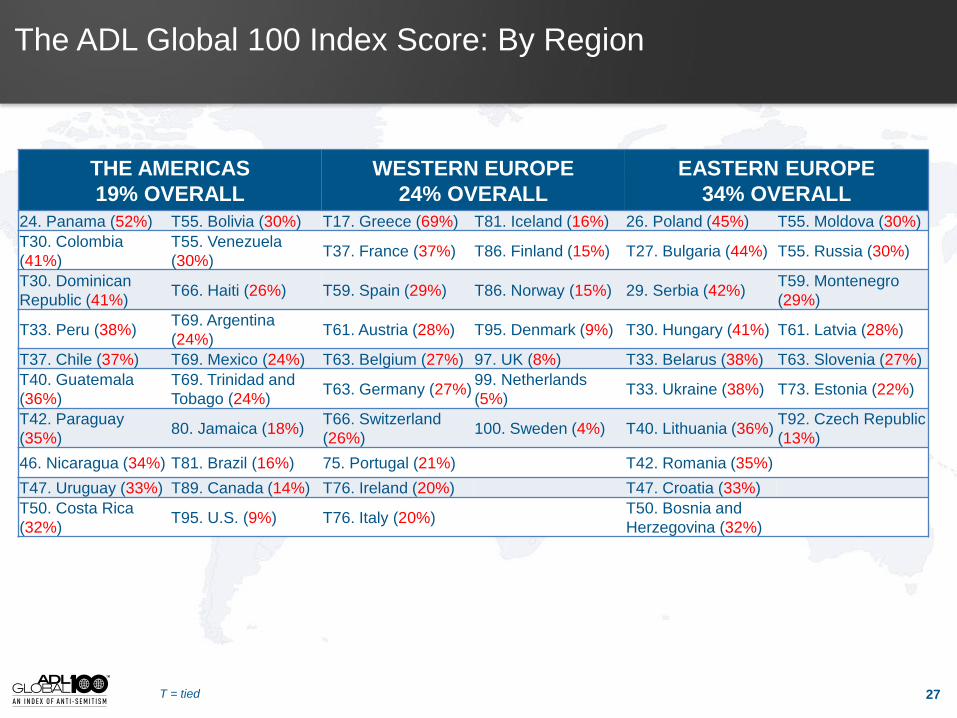
The ADL Global 100 Index Score: By Region
THE AMERICAS
19% OVERALL
WESTERN EUROPE
24% OVERALL
EASTERN EUROPE
34% OVERALL
24. Panama (52%) T55. Bolivia (30%) T17. Greece (69%) T81. Iceland (16%) 26. Poland (45%) T55. Moldova (30%)
T30. Colombia
(41%)
T55. Venezuela
(30%) T37. France (37%) T86. Finland (15%) T27. Bulgaria (44%) T55. Russia (30%)
T30. Dominican
Republic (41%) T66. Haiti (26%) T59. Spain (29%) T86. Norway (15%) 29. Serbia (42%)
T59. Montenegro
(29%)
T33. Peru (38%) T69. Argentina
(24%) T61. Austria (28%) T95. Denmark (9%) T30. Hungary (41%) T61. Latvia (28%)
T37. Chile (37%) T69. Mexico (24%) T63. Belgium (27%) 97. UK (8%) T33. Belarus (38%) T63. Slovenia (27%)
T40. Guatemala
(36%)
T69. Trinidad and
Tobago (24%) T63. Germany (27%)
99. Netherlands
(5%) T33. Ukraine (38%) T73. Estonia (22%)
T42. Paraguay
(35%) 80. Jamaica (18%)
T66. Switzerland
(26%) 100. Sweden (4%) T40. Lithuania (36%)
T92. Czech Republic
(13%)
46. Nicaragua (34%) T81. Brazil (16%) 75. Portugal (21%) T42. Romania (35%)
T47. Uruguay (33%) T89. Canada (14%) T76. Ireland (20%) T47. Croatia (33%)
T50. Costa Rica
(32%) T95. U.S. (9%) T76. Italy (20%)
T50. Bosnia and
Herzegovina (32%)
T = tied 27
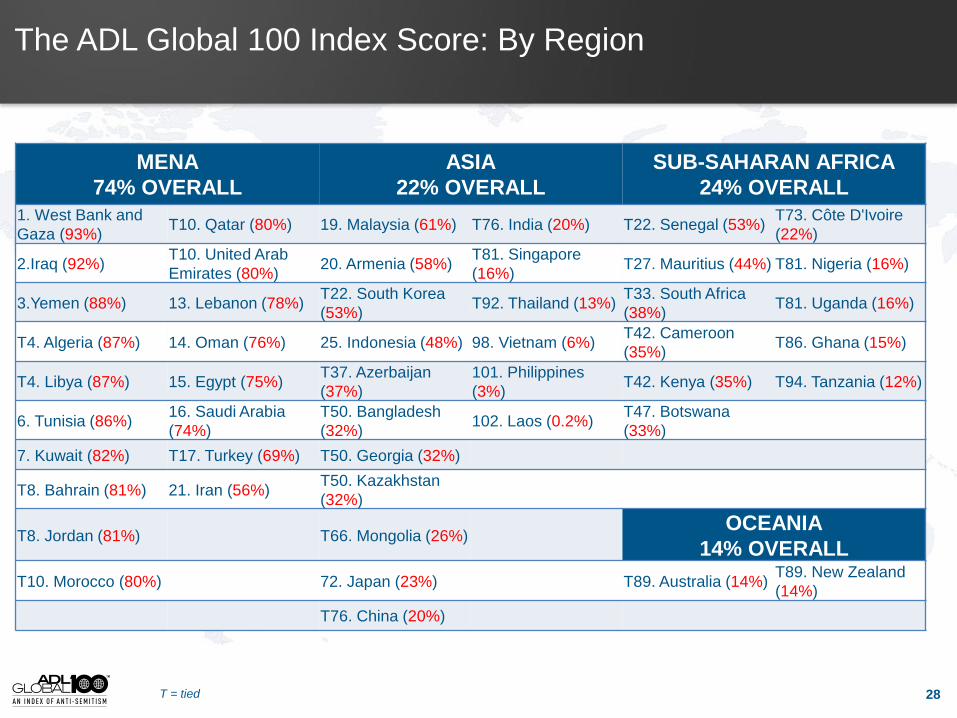
MENA
74% OVERALL
ASIA
22% OVERALL
SUB-SAHARAN AFRICA
24% OVERALL
1. West Bank and
Gaza (93%) T10. Qatar (80%) 19. Malaysia (61%) T76. India (20%) T22. Senegal (53%)
T73. Côte D'Ivoire
(22%)
2.Iraq (92%) T10. United Arab
Emirates (80%) 20. Armenia (58%)
T81. Singapore
(16%) T27. Mauritius (44%) T81. Nigeria (16%)
3.Yemen (88%) 13. Lebanon (78%) T22. South Korea
(53%) T92. Thailand (13%)
T33. South Africa
(38%) T81. Uganda (16%)
T4. Algeria (87%) 14. Oman (76%) 25. Indonesia (48%) 98. Vietnam (6%) T42. Cameroon
(35%) T86. Ghana (15%)
T4. Libya (87%) 15. Egypt (75%) T37. Azerbaijan
(37%)
101. Philippines
(3%) T42. Kenya (35%) T94. Tanzania (12%)
6. Tunisia (86%) 16. Saudi Arabia
(74%)
T50. Bangladesh
(32%) 102. Laos (0.2%)
T47. Botswana
(33%)
7. Kuwait (82%) T17. Turkey (69%) T50. Georgia (32%)
T8. Bahrain (81%) 21. Iran (56%) T50. Kazakhstan
(32%)
T8. Jordan (81%) T66. Mongolia (26%) OCEANIA
14% OVERALL
T10. Morocco (80%) 72. Japan (23%) T89. Australia (14%) T89. New Zealand
(14%)
T76. China (20%)
The ADL Global 100 Index Score: By Region
T = tied 28
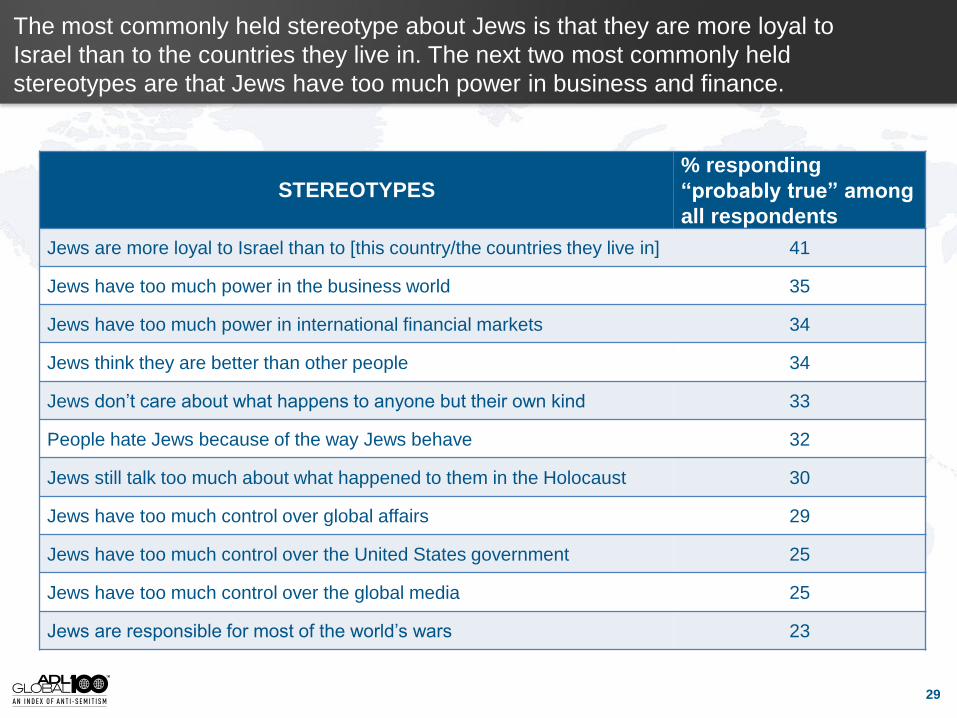
STEREOTYPES
% responding
“probably true” among
all respondents
Jews are more loyal to Israel than to [this country/the countries they live in] 41
Jews have too much power in the business world 35
Jews have too much power in international financial markets 34
Jews think they are better than other people 34
Jews don’t care about what happens to anyone but their own kind 33
People hate Jews because of the way Jews behave 32
Jews still talk too much about what happened to them in the Holocaust 30
Jews have too much control over global affairs 29
Jews have too much control over the United States government 25
Jews have too much control over the global media 25
Jews are responsible for most of the world’s wars 23
The most commonly held stereotype about Jews is that they are more loyal to
Israel than to the countries they live in. The next two most commonly held
stereotypes are that Jews have too much power in business and finance.
29
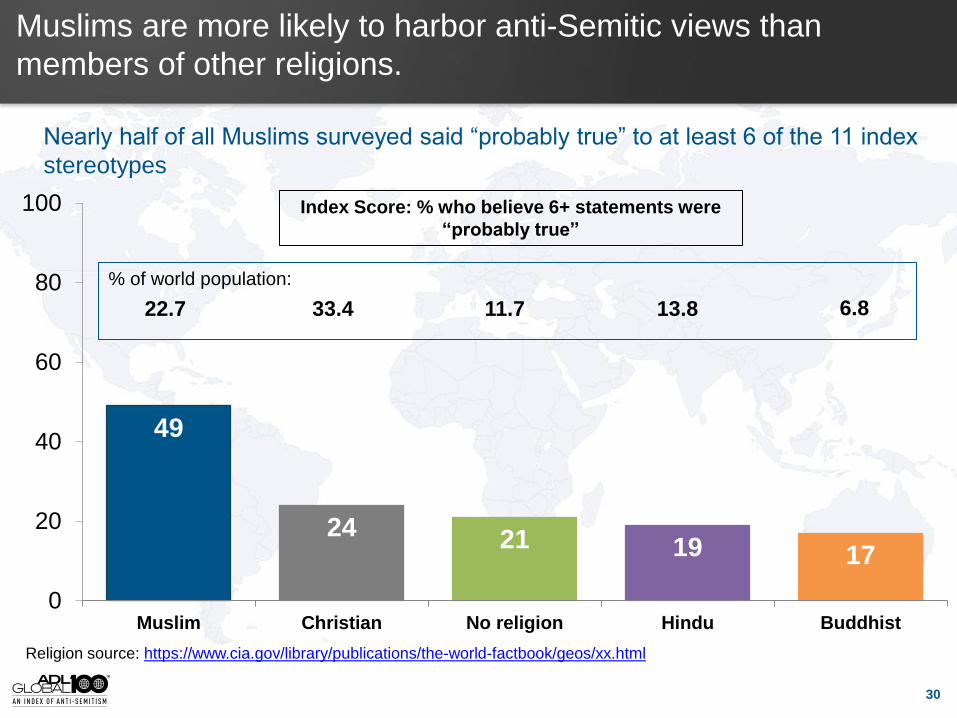
Muslims are more likely to harbor anti-Semitic views than
members of other religions.
Nearly half of all Muslims surveyed said “probably true” to at least 6 of the 11 index
stereotypes
49
24 21 19 17
0
20
40
60
80
100
Muslim Christian No religion Hindu Buddhist
Index Score: % who believe 6+ statements were
“probably true”
% of world population:
Religion source: https://www.cia.gov/library/publications/the-world-factbook/geos/xx.html
22.7 33.4 11.7 13.8 6.8
30
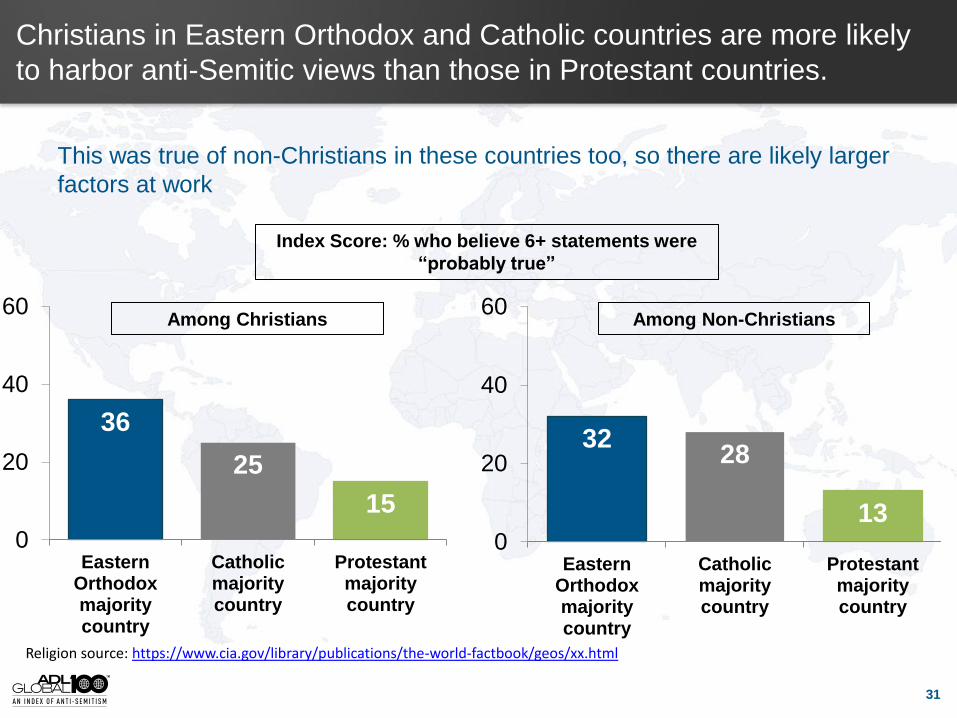
32 28
13 0
20
40
60
EasternOrthodoxmajoritycountry
Catholicmajoritycountry
Protestantmajoritycountry
Christians in Eastern Orthodox and Catholic countries are more likely
to harbor anti-Semitic views than those in Protestant countries.
36
25
15
0
20
40
60
EasternOrthodoxmajoritycountry
Catholicmajoritycountry
Protestantmajoritycountry
Index Score: % who believe 6+ statements were
“probably true”
Religion source: https://www.cia.gov/library/publications/the-world-factbook/geos/xx.html
Among Christians Among Non-Christians
This was true of non-Christians in these countries too, so there are likely larger
factors at work
31
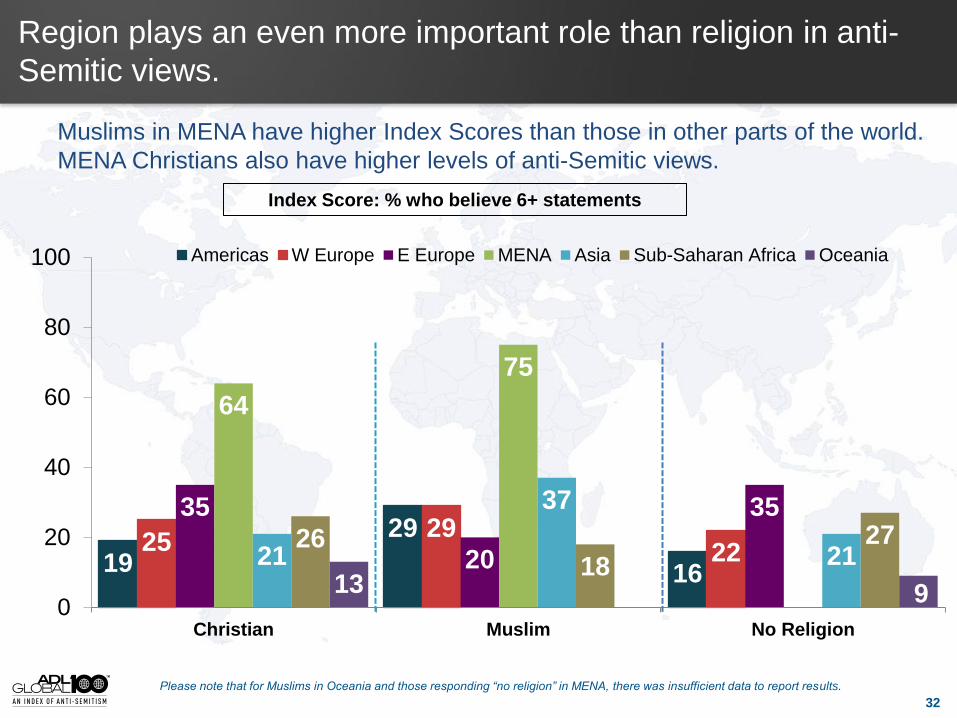
Region plays an even more important role than religion in anti-
Semitic views.
Muslims in MENA have higher Index Scores than those in other parts of the world.
MENA Christians also have higher levels of anti-Semitic views.
Index Score: % who believe 6+ statements
19
29
16
25 29
22
35
20
35
64
75
21
37
21 26
18
27
13 9 0
20
40
60
80
100
Christian Muslim No Religion
Americas W Europe E Europe MENA Asia Sub-Saharan Africa Oceania
32
Please note that for Muslims in Oceania and those responding “no religion” in MENA, there was insufficient data to report results.
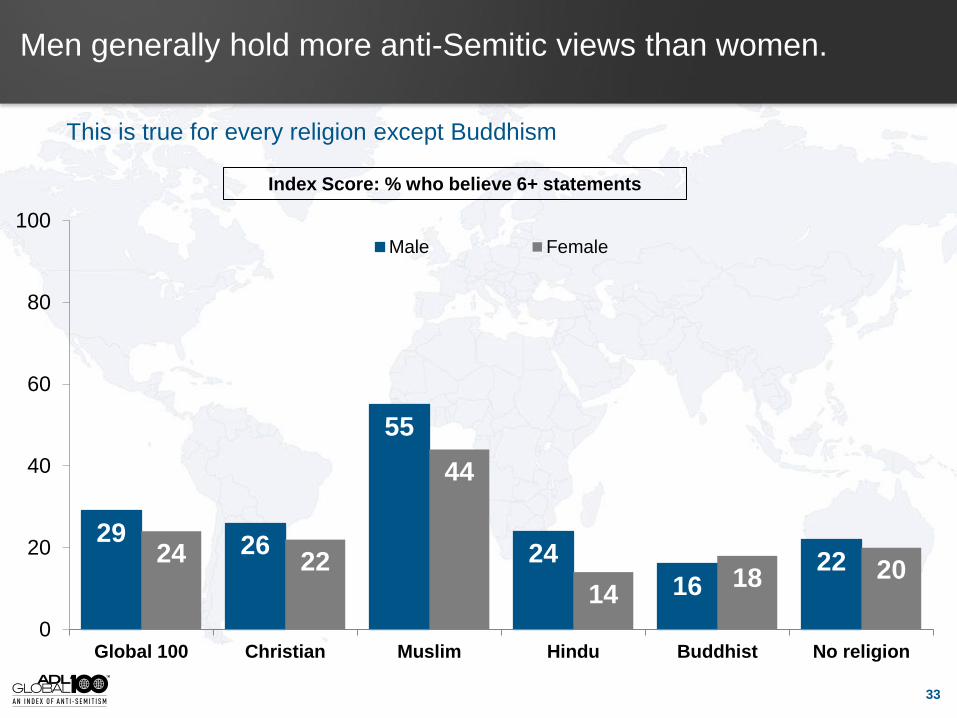
29 26
55
24
16 22 24 22
44
14 18 20
0
20
40
60
80
100
Global 100 Christian Muslim Hindu Buddhist No religion
Male Female
This is true for every religion except Buddhism
Men generally hold more anti-Semitic views than women.
Index Score: % who believe 6+ statements
33
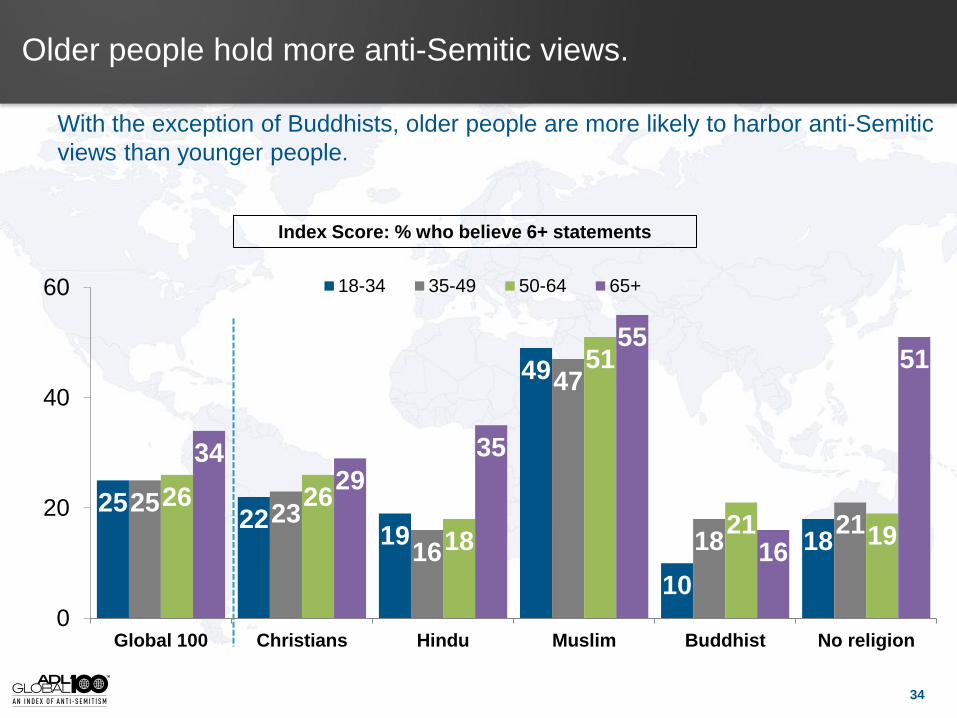
25 22
19
49
10
18
25 23
16
47
18 21
26 26
18
51
21 19
34 29
35
55
16
51
0
20
40
60
Global 100 Christians Hindu Muslim Buddhist No religion
18-34 35-49 50-64 65+
34
Older people hold more anti-Semitic views.
With the exception of Buddhists, older people are more likely to harbor anti-Semitic
views than younger people.
Index Score: % who believe 6+ statements
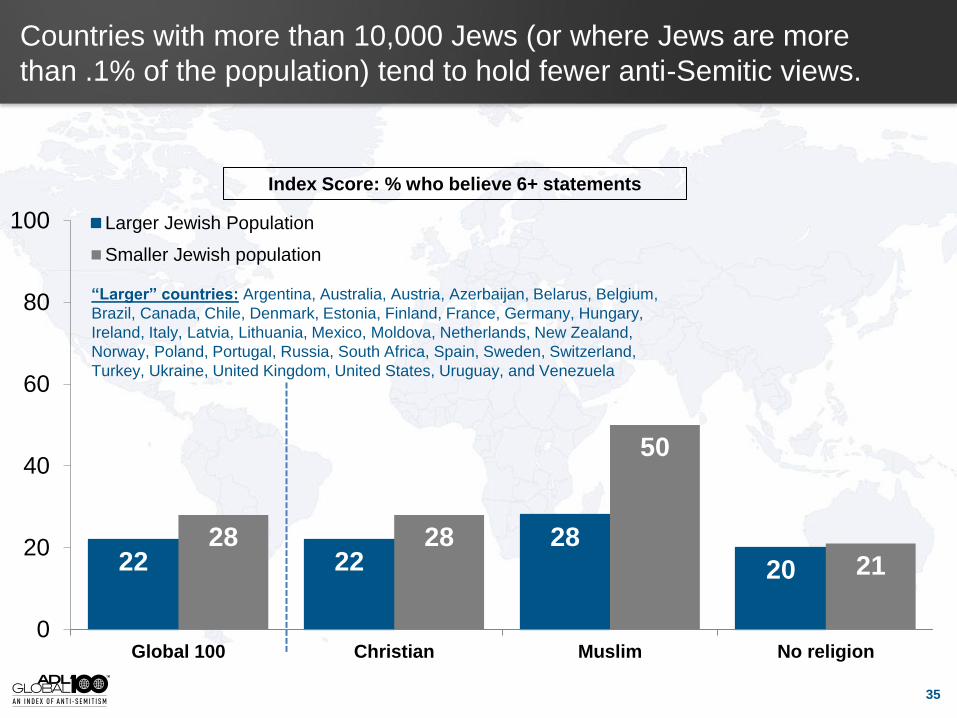
22 22 28
20
28 28
50
21
0
20
40
60
80
100
Global 100 Christian Muslim No religion
Larger Jewish Population
Smaller Jewish population
“Larger” countries: Argentina, Australia, Austria, Azerbaijan, Belarus, Belgium,
Brazil, Canada, Chile, Denmark, Estonia, Finland, France, Germany, Hungary,
Ireland, Italy, Latvia, Lithuania, Mexico, Moldova, Netherlands, New Zealand,
Norway, Poland, Portugal, Russia, South Africa, Spain, Sweden, Switzerland,
Turkey, Ukraine, United Kingdom, United States, Uruguay, and Venezuela
Countries with more than 10,000 Jews (or where Jews are more
than .1% of the population) tend to hold fewer anti-Semitic views.
Index Score: % who believe 6+ statements
35
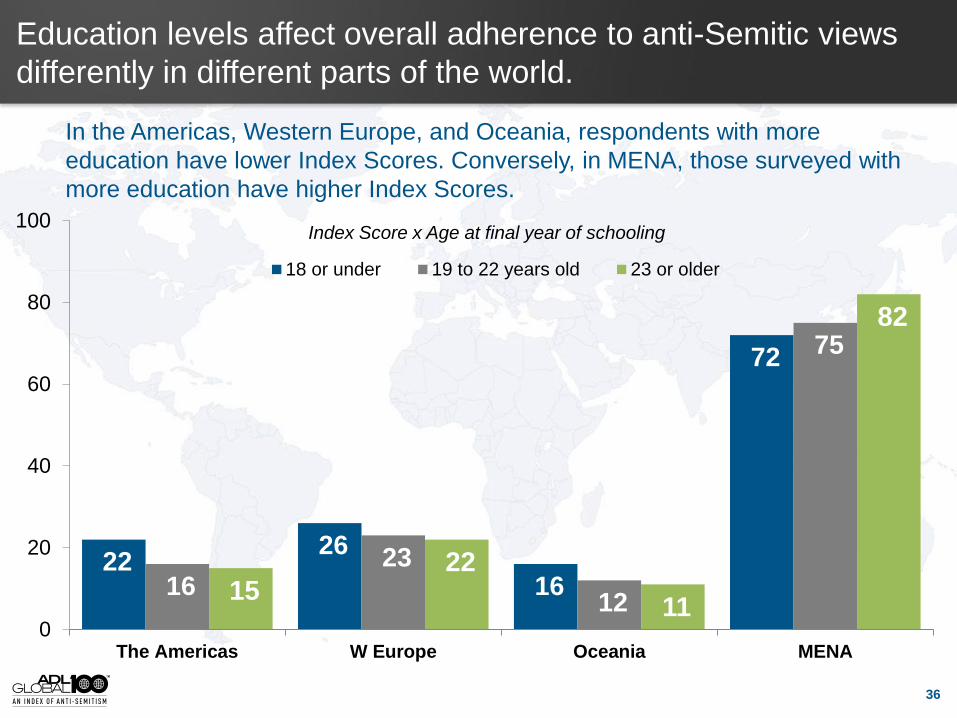
22 26
16
72
16 23
12
75
15 22
11
82
0
20
40
60
80
100
The Americas W Europe Oceania MENA
18 or under 19 to 22 years old 23 or older
Education levels affect overall adherence to anti-Semitic views
differently in different parts of the world.
Index Score x Age at final year of schooling
In the Americas, Western Europe, and Oceania, respondents with more
education have lower Index Scores. Conversely, in MENA, those surveyed with
more education have higher Index Scores.
36
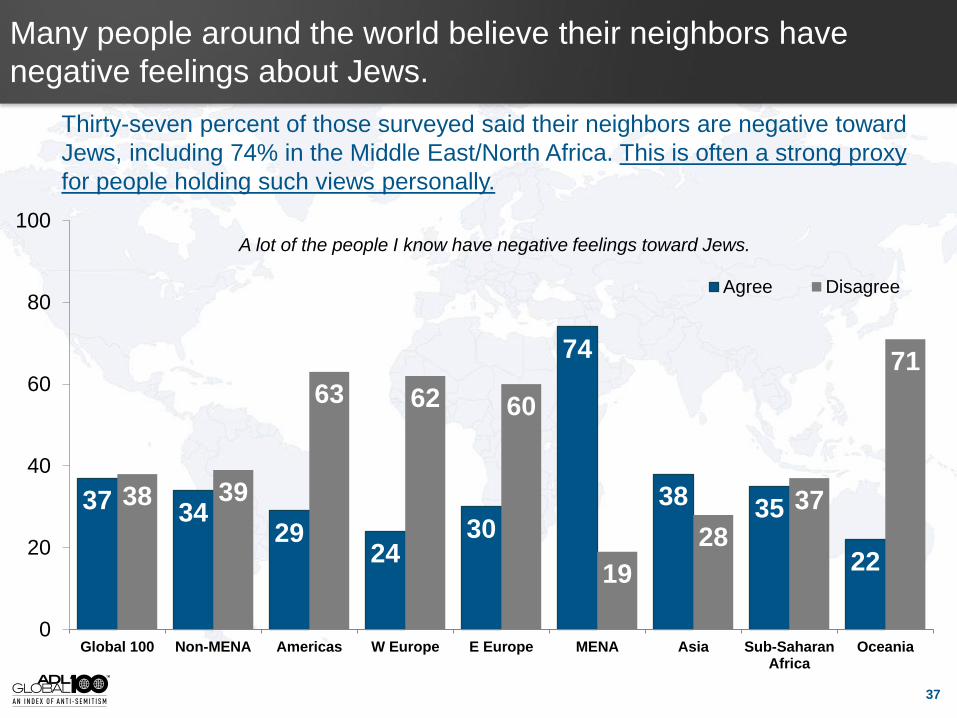
37 34 29
24 30
74
38 35
22
38 39
63 62 60
19
28
37
71
0
20
40
60
80
100
Global 100 Non-MENA Americas W Europe E Europe MENA Asia Sub-SaharanAfrica
Oceania
Agree Disagree
Thirty-seven percent of those surveyed said their neighbors are negative toward
Jews, including 74% in the Middle East/North Africa. This is often a strong proxy
for people holding such views personally.
Many people around the world believe their neighbors have
negative feelings about Jews.
A lot of the people I know have negative feelings toward Jews.
37
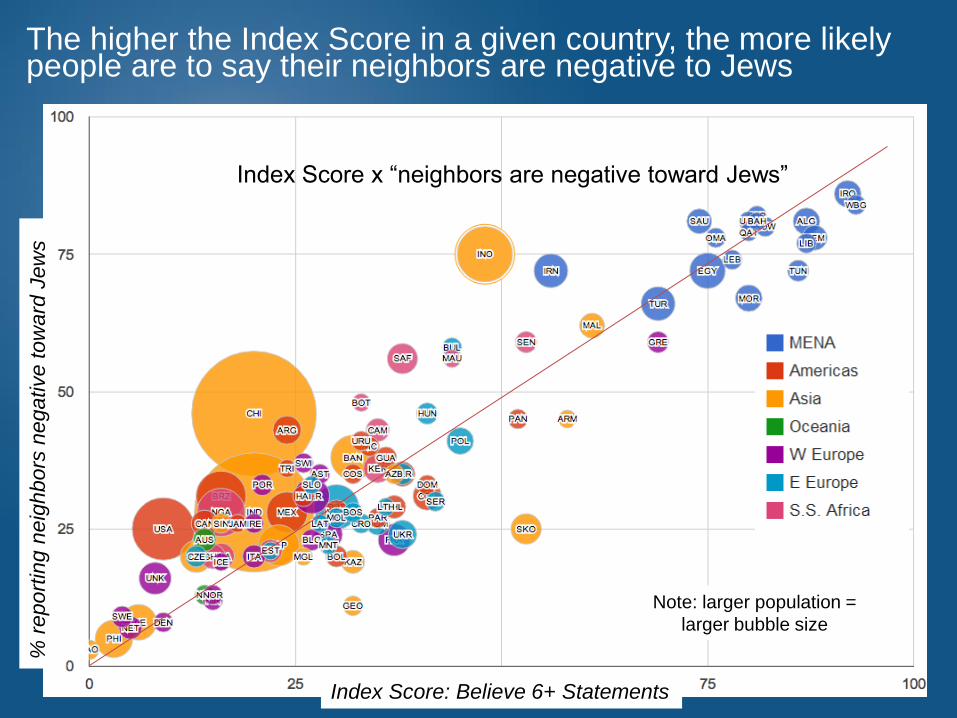
Index Score x “neighbors are negative toward Jews”
% r
eport
ing n
eig
hbors
negative tow
ard
Jew
s
Index Score: Believe 6+ Statements
Note: larger population =
larger bubble size
The higher the Index Score in a given country, the more likely people are to say their neighbors are negative to Jews
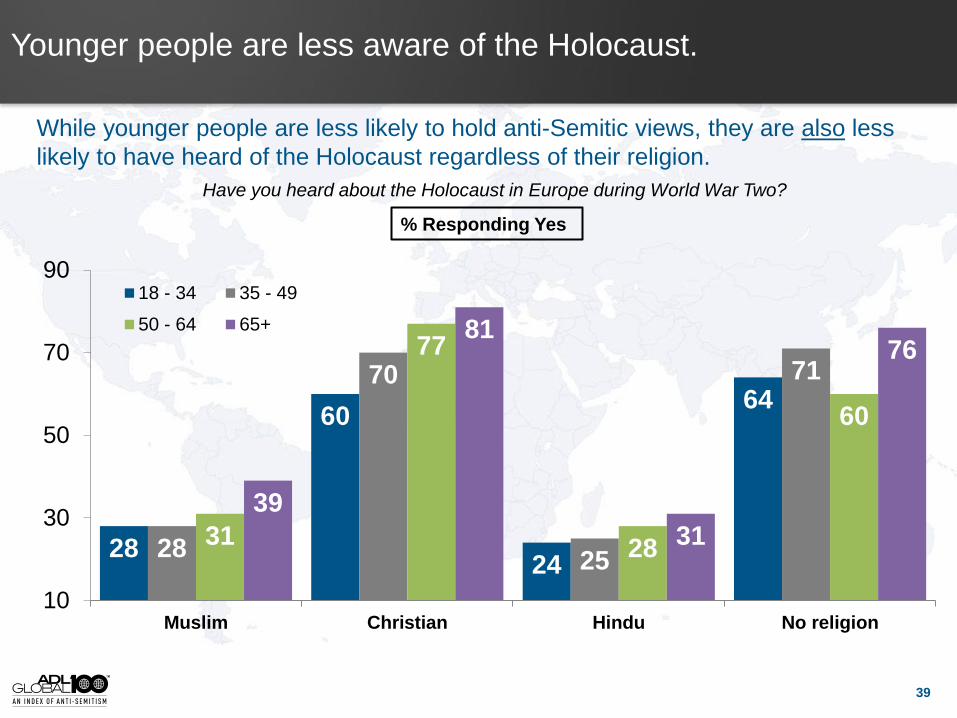
While younger people are less likely to hold anti-Semitic views, they are also less
likely to have heard of the Holocaust regardless of their religion.
Younger people are less aware of the Holocaust.
Have you heard about the Holocaust in Europe during World War Two?
28
60
24
64
28
70
25
71
31
77
28
60
39
81
31
76
10
30
50
70
90
Muslim Christian Hindu No religion
18 - 34 35 - 49
50 - 64 65+
39
% Responding Yes
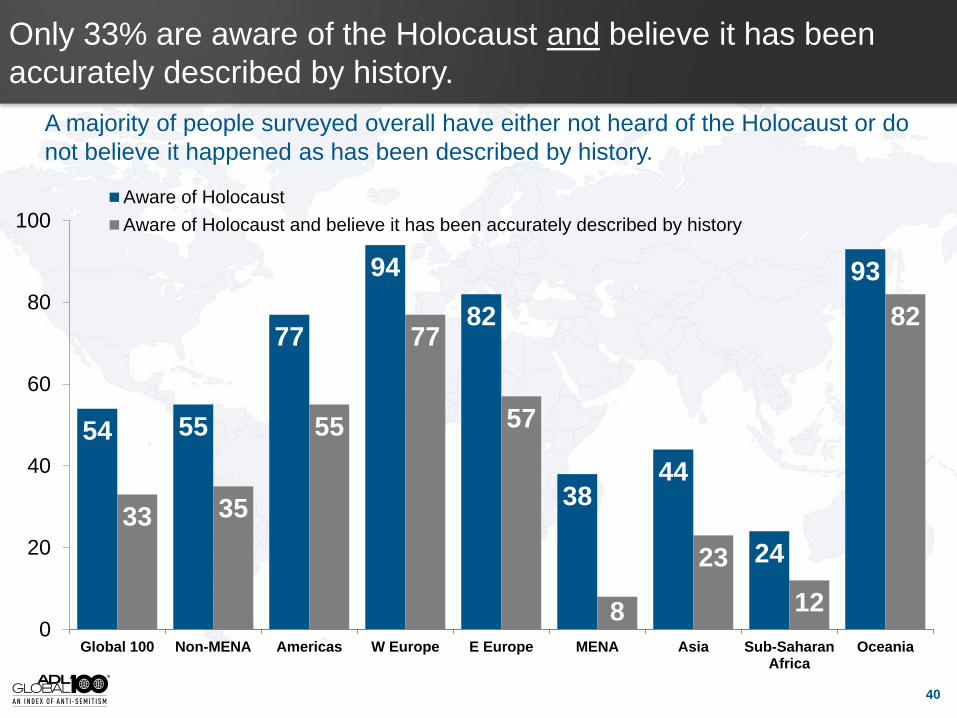
54 55
77
94
82
38 44
24
93
33 35
55
77
57
8
23
12
82
0
20
40
60
80
100
Global 100 Non-MENA Americas W Europe E Europe MENA Asia Sub-SaharanAfrica
Oceania
Aware of Holocaust
Aware of Holocaust and believe it has been accurately described by history
A majority of people surveyed overall have either not heard of the Holocaust or do
not believe it happened as has been described by history.
Only 33% are aware of the Holocaust and believe it has been
accurately described by history.
40
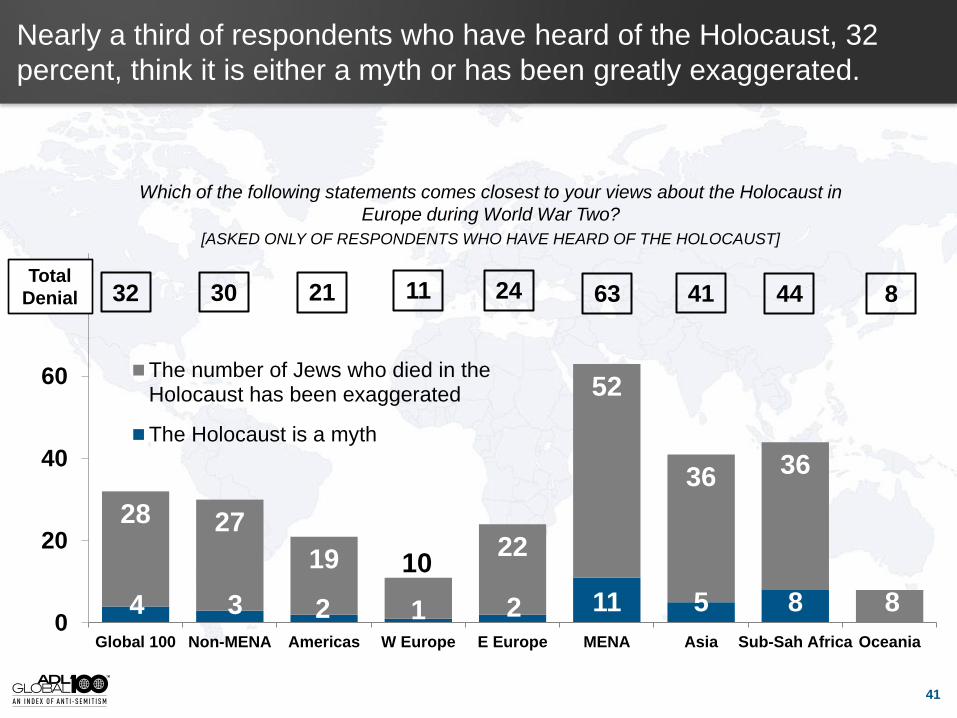
4 3 2 1 2 11 5 8
28 27
19 10 22
52
36 36
8 0
20
40
60
80
Global 100 Non-MENA Americas W Europe E Europe MENA Asia Sub-Sah Africa Oceania
The number of Jews who died in theHolocaust has been exaggerated
The Holocaust is a myth
Nearly a third of respondents who have heard of the Holocaust, 32
percent, think it is either a myth or has been greatly exaggerated.
Total
Denial 30 32 21 24 63 41 44 8 11
Which of the following statements comes closest to your views about the Holocaust in
Europe during World War Two?
[ASKED ONLY OF RESPONDENTS WHO HAVE HEARD OF THE HOLOCAUST]
41
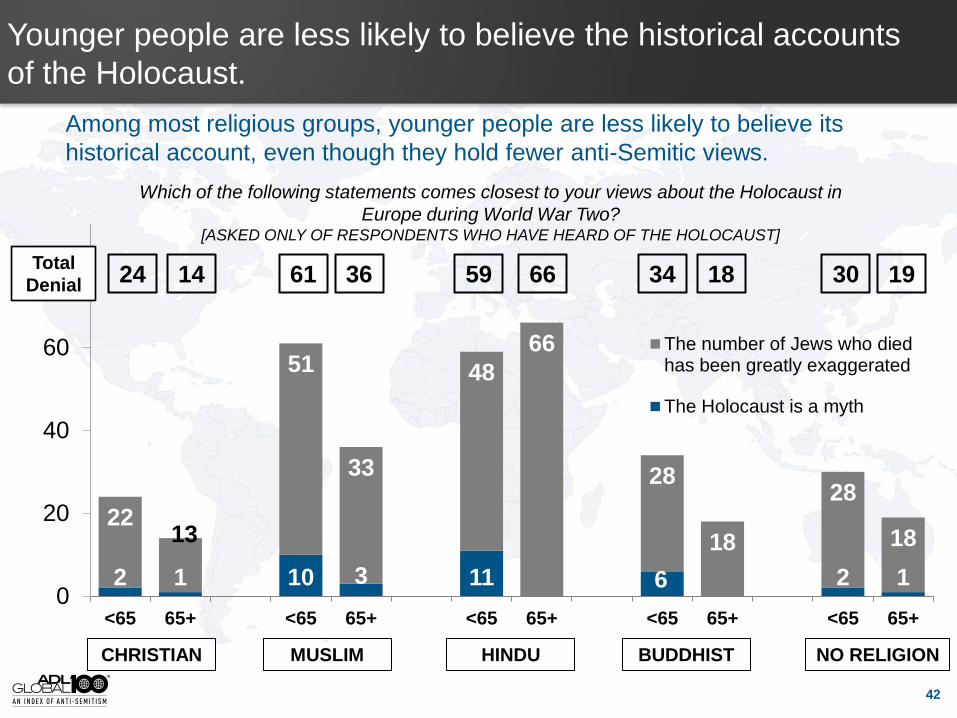
2 1 10 3 11 6 2 1
22 13
51
33
48
66
28
18
28
18
0
20
40
60
80
<65 65+ <65 65+ <65 65+ <65 65+ <65 65+
The number of Jews who diedhas been greatly exaggerated
The Holocaust is a myth
Total
Denial
Younger people are less likely to believe the historical accounts
of the Holocaust.
Among most religious groups, younger people are less likely to believe its
historical account, even though they hold fewer anti-Semitic views.
CHRISTIAN MUSLIM HINDU BUDDHIST NO RELIGION
Which of the following statements comes closest to your views about the Holocaust in
Europe during World War Two? [ASKED ONLY OF RESPONDENTS WHO HAVE HEARD OF THE HOLOCAUST]
24 14 61 36 59 66 34 18 19 30
42
18 17
33 27 26 27
10
24
33
30 31
28 34 33 25
32 23
35
0
20
40
60
80
100
Global 100 Non-MENA Americas W Europe E Europe MENA Asia Sub-SaharanAfrica
Oceania
More than 10% 1 - 10%
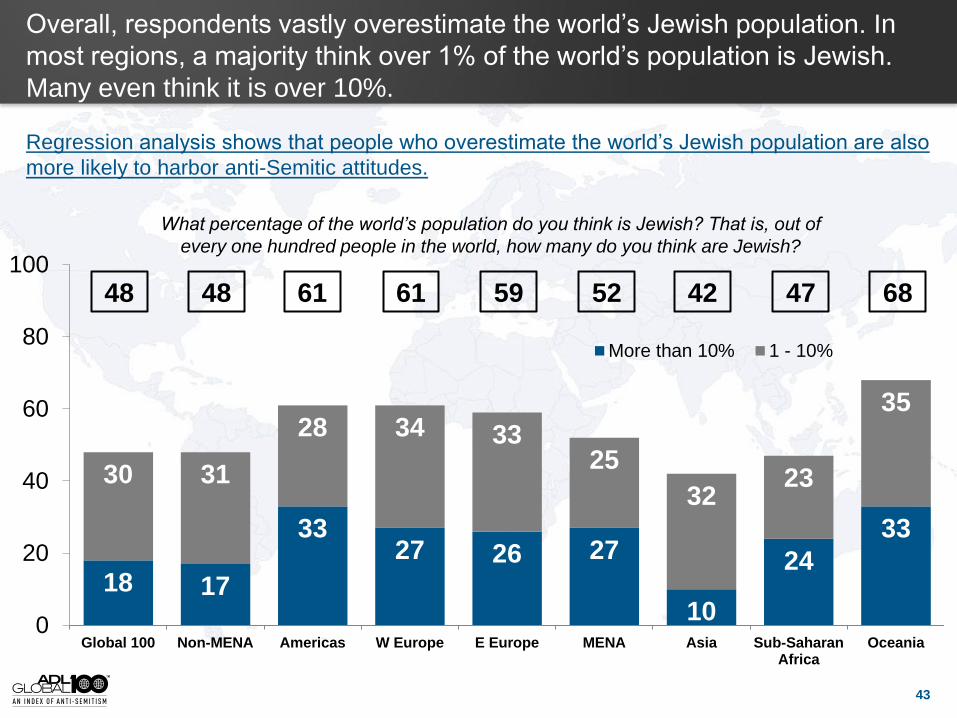
43
Overall, respondents vastly overestimate the world’s Jewish population. In
most regions, a majority think over 1% of the world’s population is Jewish.
Many even think it is over 10%.
Regression analysis shows that people who overestimate the world’s Jewish population are also
more likely to harbor anti-Semitic attitudes.
What percentage of the world’s population do you think is Jewish? That is, out of
every one hundred people in the world, how many do you think are Jewish?
48 48 61 61 59 52 42 47 68
36 30
16 9 9
0
20
40
60
80
100
Don't Know/Refused 0-2 Percent 2-10 Percent 10-20 Percent Greater than 20 Percent
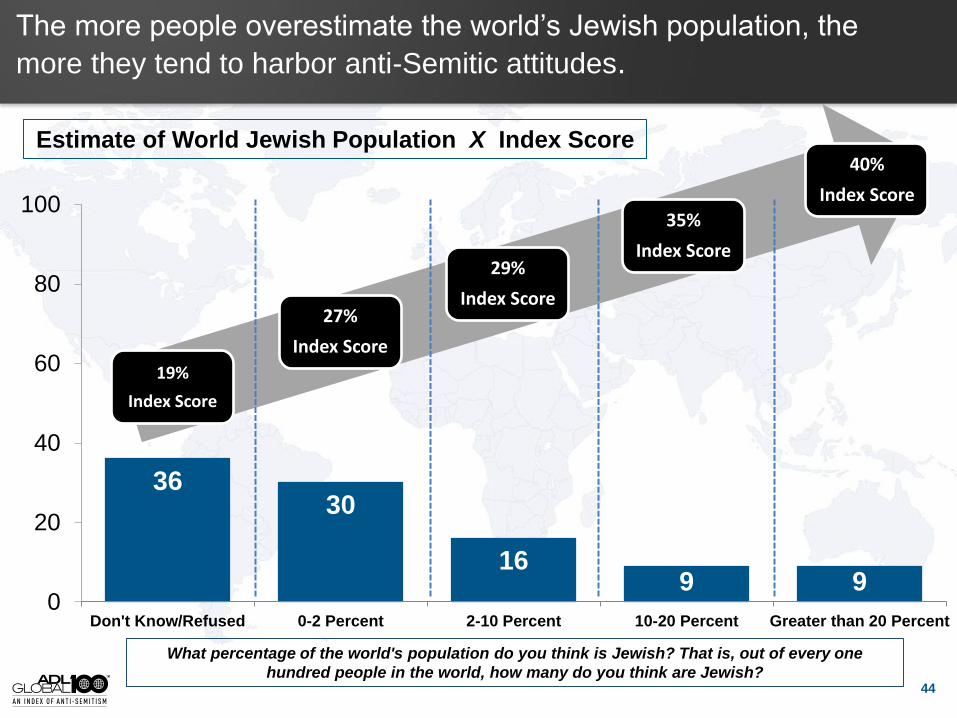
What percentage of the world's population do you think is Jewish? That is, out of every one
hundred people in the world, how many do you think are Jewish?
The more people overestimate the world’s Jewish population, the
more they tend to harbor anti-Semitic attitudes.
19%
Index Score
27%
Index Score
29%
Index Score
35%
Index Score
40%
Index Score
Estimate of World Jewish Population X Index Score
44
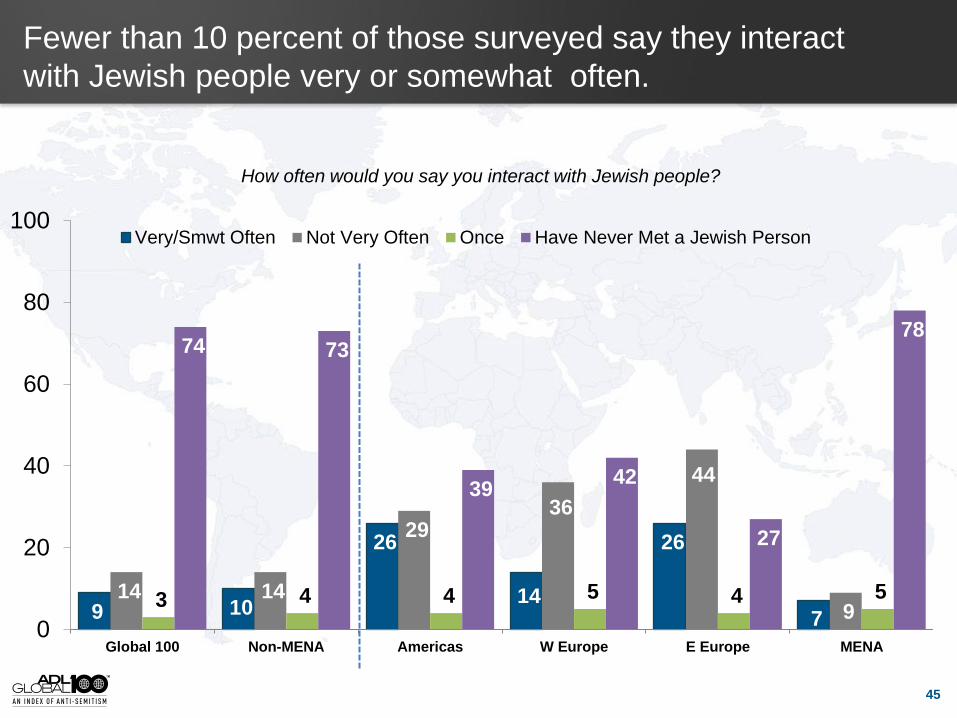
Fewer than 10 percent of those surveyed say they interact
with Jewish people very or somewhat often.
How often would you say you interact with Jewish people?
9 10
26
14
26
7
14 14
29 36
44
9 3 4 4 5 4 5
74 73
39 42
27
78
0
20
40
60
80
100
Global 100 Non-MENA Americas W Europe E Europe MENA
Very/Smwt Often Not Very Often Once Have Never Met a Jewish Person
45
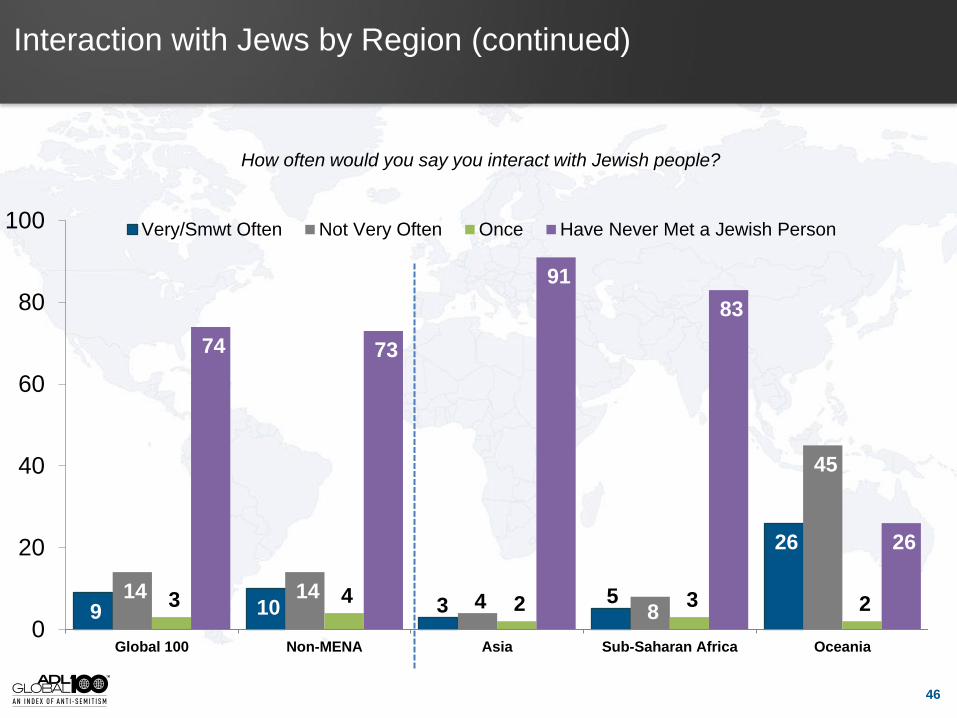
Interaction with Jews by Region (continued)
9 10 3 5
26
14 14 4
8
45
3 4 2 3 2
74 73
91
83
26
0
20
40
60
80
100
Global 100 Non-MENA Asia Sub-Saharan Africa Oceania
Very/Smwt Often Not Very Often Once Have Never Met a Jewish Person
How often would you say you interact with Jewish people?
46
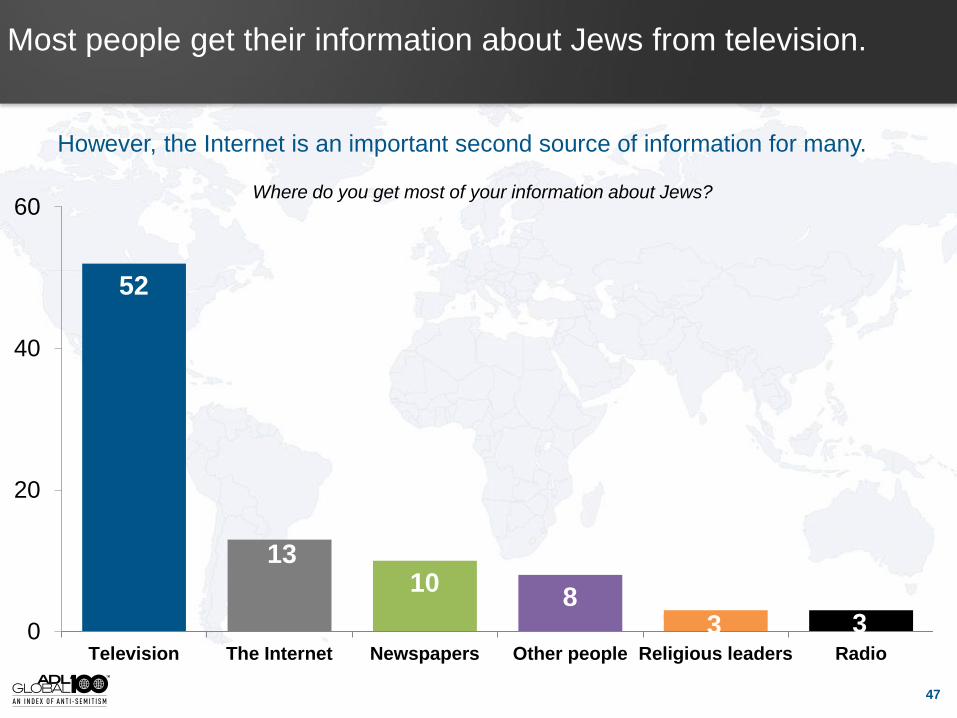
Most people get their information about Jews from television.
However, the Internet is an important second source of information for many.
52
13 10
8 3 3 0
20
40
60
Television The Internet Newspapers Other people Religious leaders Radio
Where do you get most of your information about Jews?
47
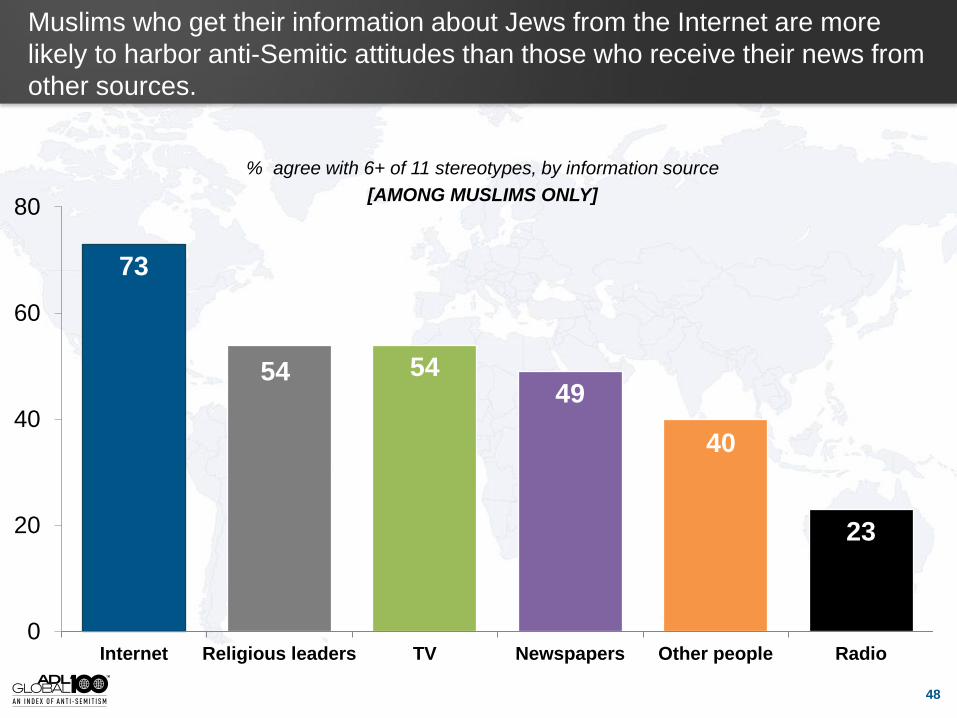
Muslims who get their information about Jews from the Internet are more
likely to harbor anti-Semitic attitudes than those who receive their news from
other sources.
73
54 54 49
40
23
0
20
40
60
80
Internet Religious leaders TV Newspapers Other people Radio
% agree with 6+ of 11 stereotypes, by information source
[AMONG MUSLIMS ONLY]
48

Methodology
Methodology
The Anti-Defamation League commissioned First International Resources to research attitudes
and opinions toward Jews in more than 100 countries around the world. Fieldwork and data
collection for this global public opinion project were conducted and coordinated by Anzalone
Liszt Grove Research. All interviews were conducted between July 2013 and February 2014.
The data is a result of 53,100 total interviews among citizens aged 18 and over, across 101
countries and the Palestinian Territories in the West Bank & Gaza. Expected margin of
sampling error for the weighted global average is +/- 0.97%, for the countries/territories
surveyed with n=500 interviews it is +/- 4.4% and for countries sampled with n=1,000
interviews it is +/- 3.2%. The margin of error is higher for sub-groups within each geography.
Interviews were conducted via landline telephones, mobile phones and face-to-face
discussions in 96 languages (including many dialects and pidgin/creole versions).
All respondents were selected at random. Telephone respondents were selected using
random-digit dial sampling; face-to-face respondents were selected using geographically
stratified, randomly-selected sampling points in each country and at the household level, using
a Kish grid.
50
Methodology
Telephone interviewing was only conducted in countries where the combined mobile phone +
landline penetration exceeded 90%. In all countries where telephone dialing was conducted,
interviews were collected using a combination of landline and mobile phone dialing, in
proportion to that particular country’s coverage rate for each telephone type. Within each
country, the data was weighted to be reflective of the national population on a number of
demographic measures, including age, gender, religion, urban/rural location, ethnicity, and
language spoken.
In an overwhelming majority of the countries/territories polled, the samples are fully nationally
representative. However, in some countries (China, India, Ghana, Indonesia, Nigeria,
Bangladesh, Laos, Malaysia, Mauritius, Uganda, and Vietnam), due to security concerns or
extreme logistical challenges, national coverage was not complete. In those situations,
sampling points were selected and the data was weighted to ensure the country’s interviews
were reflective of the national population on key demographic measures other than geography.
For regional and global averages, the data was weighted so that each country’s interviews
were represented proportionately to that country’s adult population.
The source for population data was the UN Department of Social and Economic Affairs -
Population Division.
51