Embed Size (px)
Citation preview
TM 5-813-8
TECHNICAL MANUAL
WATER DESALINATION
H E A D Q U A R T E R S , D E P A R T M E N T O F T H E A R M Y
SEPTEMBER 1986
TM 5-813-8
REPRODUCTION AUTHORIZATION/RESTRICTIONS
This manual has been prepared by or for the Government and, except to the extent indicatedbelow, is public property and not subject to copyright.
Copyrighted material included in the manual has been used with the knowledge and permissionof the proprietors and is acknowledged as such at point of use. Anyone wishing to make furtheruse of any copyrighted material, by itself and apart from this text, should seek necessarypermission directly from the proprietors.
Reprints or republications of this manual should include a credit substantially as follows:"Department of the Army, USA, Technical Manual TM 5-813-8, Water Desalination.
If the reprint or republication includes copyrighted material, the credit should also state:"Anyone wishing to make further use of copyrighted material, by itself and apart from this text,should seek necessary permission directly from the proprietors."
TM 5-813-8
TECHNICAL MANUAL HEADQUARTERSNo. 5--813-8 DEPARTMENT OF THE ARMY
WASHINGTON, D.C. 15 September 1986
WATER DESALINATION
Paragraph PageCHAPTER 1. GENERAL
Purpose ............................................................................................ 1-1 1-1General design considerations .......................................................... 1-2 1-1Special design considerations ........................................................... 1-3 1-1Economic considerations ................................................................. 1-4 1-1Appendices ...................................................................................... 1-5 1-1
CHAPTER 2. SITE SELECTIONSite technical requirements .............................................................. 2-1 2-1Water storage and system modularization ........................................ 2-2 2-1
CHAPTER 3. WATER SOURCE SELECTIONGeneral............................................................................................. 3-1 3-1Quality .............................................................................................. 3-2 3-1Selection versus rejection of potential raw water sources .................. 3-3 3-1
CHAPTER 4. PROCESS SELECTIONGeneral process selection................................................................. 4-1 4-1Process limitations............................................................................ 4-2 4-2Distillation/condensation energy........................................................ 4-3 4-3Membrane energy............................................................................. 4-4 4-5Waste disposal ................................................................................. 4-5 4-5Preliminary process selection............................................................ 4-6 4-5Process selection.............................................................................. 4-7 4-5
CHAPTER 5. PRETREATMENT CONSIDERATIONSGeneral............................................................................................. 5-1 5-1Chemical treatment........................................................................... 5-2 5-1Degasification and deaeration........................................................... 5-3 5-5Filtration with granular media ............................................................ 5-4 5-5Secondary filtration .......................................................................... 5-5 5-5Disinfection....................................................................................... 5-6 5-6
CHAPTER 6 DISTILLATION/CONDENSATION TECHNIQUESGeneral............................................................................................. 6-1 6-1High-temperature distillation ............................................................. 6-2 6-1Low-temperature distillation .............................................................. 6-3 6-1Mechanical distillation....................................................................... 6-4 6-1Thermal discharge ............................................................................ 6-5 6-7Design analysis................................................................................. 6-6 6-7Materials of construction ................................................................... 6-7 6-7Distillation/condensation system design ............................................ 6-8 6-7
CHAPTER 7. MEMBRANE TECHNIQUESElectrodialysis................................................................................... 7-1 7-1Electrodialysis-reversal design.......................................................... 7-2 7-1Reverse osmosis .............................................................................. 7-3 7-3Reverse osmosis membrane staging configurations.......................... 7-4 7-7Reverse osmosis system design ....................................................... 7-5 7-11Materials of construction ................................................................... 7-6 7-13
CHAPTER 8. ION EXCHANGEGeneral............................................................................................. 8-1 8-1Pretreatment..................................................................................... 8-2 8-1Desalination...................................................................................... 8-3 8-2Demineralization............................................................................... 8-4 8-5
i
TM 5-813-8
CHAPTER 9. POST-TREATMENTGeneral............................................................................................. 9-1 9-1Remineralization and aeration .......................................................... 9-2 9-1Post-treatment of distilled water ....................................................... 9-3 9-1Post-treatment of reverse osmosis product water ............................. 9-4 9-1Post-treatment of electrodialysis-reversal product water.................... 9-5 9-3
CHAPTER 10. WASTE DISPOSALGeneral............................................................................................. 10-1 10-1Pretreatment wastes ........................................................................ 10-2 10-2Distillation/condensation system wastes ........................................... 10-3 10-3Membrame system wastes ............................................................... 10-4 10-5Ion-exchange system wastes ........................................................... 10-5 10-6Ultimate disposal ............................................................................. 10-6 10-6
APPENDIX A. SAMPLE PROBLEMS ...................................................................... A-1APPENDIX B. WATER TESTING REQUIRED FOR DESALINATION TREATMENT B-1APPENDIX C. REFERENCES ................................................................................. C-1BIBLIOGRAPHY ......................................................................................................... Biblio-1
ii
TM 5-813-8
LIST OF FIGURES
FIGURE 2-1 Typical Desalination Flowsheet2-2 Typical Reverse Osmosis Desalination System4-1 Energy Consumption5-1 Pretreatment Techniques5-2 Approximate Concentration Factor Limits for Calcium Sulfate in Sea Water5-3 Disinfection Alternatives6-1 Three Methods of Vaporization6-2 Multiple-Effect Vertical-Tube Evaporation Process6-3 Multistage Flash Distillation Facility6-4 Waste Heat Recovery Evaporation Process6-5 Vapor-Compression Vertical-Tube Distillation System7-1 Principles of Electrodialysis Desalination7-2 Reverse Osmosis Principles7-3 Reverse Osmosis Desalination System7-4 Flow-Work Exchanger Principles7-5 Construction of a Tubular Reverse Osmosis Membrane7-6 Internal Construction of a Spiral-Wound Membrane7-7 Internal Construction of a Hollow Fine-Fiber Reverse Osmosis Membrane Module7-8 Reverse Osmosis Product Staging7-9 Reverse Osmosis Membrane Reject Staging8-1 Principles of Ion-Exchange Processes8-2 RDI Process8-3 Three-Unit Variation Desal Process8-4 Two-Unit Variation Desal Process8-5 Demineralization Two-Bed Flowsheet9-1 Break-Point Chlorination Curve
10-1 Waste Disposal Overview10-2 Pretreatment Sludge Disposal10-3 Deep-Well Disposal Unit10-4 Brine Waste DisposalA-1 Sample Use of Table 4-1A-2 Sample Use of Table 4-2A-3 Water Analysis (Sample Problem A-1a)A-4 Sample Use of Table 4-3A-5 Water Analysis (Sample Problem A-1b)A-6 Water Analysis (Sample Problem A-1c)A-7 Low-Pressure Reverse Osmosis SystemA-8 Sample Use of Table 4-1A-9 Water Analysis (Sample Problem A-2)
A-10 Sample Use of Table 4-2A-11 Sample Use of Table 4-3A-12 Plan View of Vapor Compression SystemA-13 Water Analysis (Sample Problem A-4)A-14 Amberlite IR-120 Plus Leakage Data Regeneration-5 lbs. H2S04 (66° Be)/cu. ft.A-15 Amberlite IR-120 Plus Iso-Capacity Data Regeneration-5 lbs. H2S04
(66° Be)/cu. ft.A-16 Amberlite IR-120 Plus Capacity Correction for AlkalinityA-17 Amberlite IR-120 Plus Leakage Data Regeneration-3 lbs. H2S04
(66° Be)/cu. ft.A-18 Amberlite IR-120 Plus Iso-Capacity Data Regeneration-3 lbs. H2S04
(66° Be)/cu. ft.A-19 Amberlite IR-120 Plus Capacity Correction for AlkalinityA-20 Cation Exchangers PlanA-21 Degasifier and Clearwell Plan
iii
TM 5-813-8
FIGURE A-22 Three Projections of the Water Blends That Satisfy TB MED 576 RequirementsA-23 Plan View of a Two-Pass Reverse Osmosis System
LIST OF TABLESTable 4-1 Preliminary Desalination Process Selection
4-2 Selecting Desalination Processes after Water Quality Data are Obtained4-3 Final Selection of a Desalination Technique from Treatability Data5-1 The Maximum Allowable Contaminants in the Feed Water Used
by Various Desalination ProcessesA-1 Water Constituents at Treatment Stages with 5 Pounds/Cubic Foot Acid
RegenerationA-2 Water Constituents at Treatment Stages with 3 Pounds/Cubic Foot Sulfuric Acid
RegenerationA-3 Cost Projections for Possible Optimum Blends
iv
TM 5-813-8
CHAPTER 1
GENERAL
1-1. Purpose. This manual describes the guidelinesto be followed in selecting a process capable ofproducing potable water supplies from brackish and seawater sources. Potable water is defined in TB MED 576.Army potable water quality requirements can be found inTB MED 576. Information on required pre- and post-treatment design, water distribution, and storage can befound in the TM 5-813 series.
1-2. General design considerations. Alldesalination facilities will be designed as simply aspossible and will produce a final product water inkeeping with operational needs. Desalination processselection will be site-specific and will include evaluationsof product quality and quantity, raw feed water sources,and available energy sources. Potable water willcontain less than 500 milligrams per liter of totaldissolved solids (TDS). (One milligram per liter is equalto one part per million.) Technological processes notcovered in this TM that are proposed for selection mustbe approved by DAENECE-G.
1-3. Special design considerations. Whenfacilities require improved water quality, such as boilerfeed water or medical facility waters, additional watertreatment systems will be installed.
1-4. Economic considerations. The selection ofone particular type of design for a water desalinationsystem/subsystem, when two or more types of designare known to be feasible, must be based on the resultsof an economic study, in accordance with therequirements of DOD 4270.1-M and PL 95-619, 9 Nov78. The results of these economic studies are to beincluded in the design/analysis documentation for theproject. All such studies are to be conducted inaccordance with HQDA's economic-studies criteria forMilitary Construction Program (MCP) designs.Clarification of HQDA criteria for a particular applicationor supplementary criteria and guidelines that may berequired for special cases may be obtained by requestthrough normal channels to HQDA (DAENECE-G),Wash. DC 20314-1000.
1-5. Appendices. Appendix A contains sampleproblems illustrating use of information presented in thisdocument. Various tests and analyses required or usedin desalination treatment of water are listed in AppendixB. Appendix C contains a list of references used in thisdocument.
1-1
TM 5-813-8
CHAPTER 2
SITE SELECTION
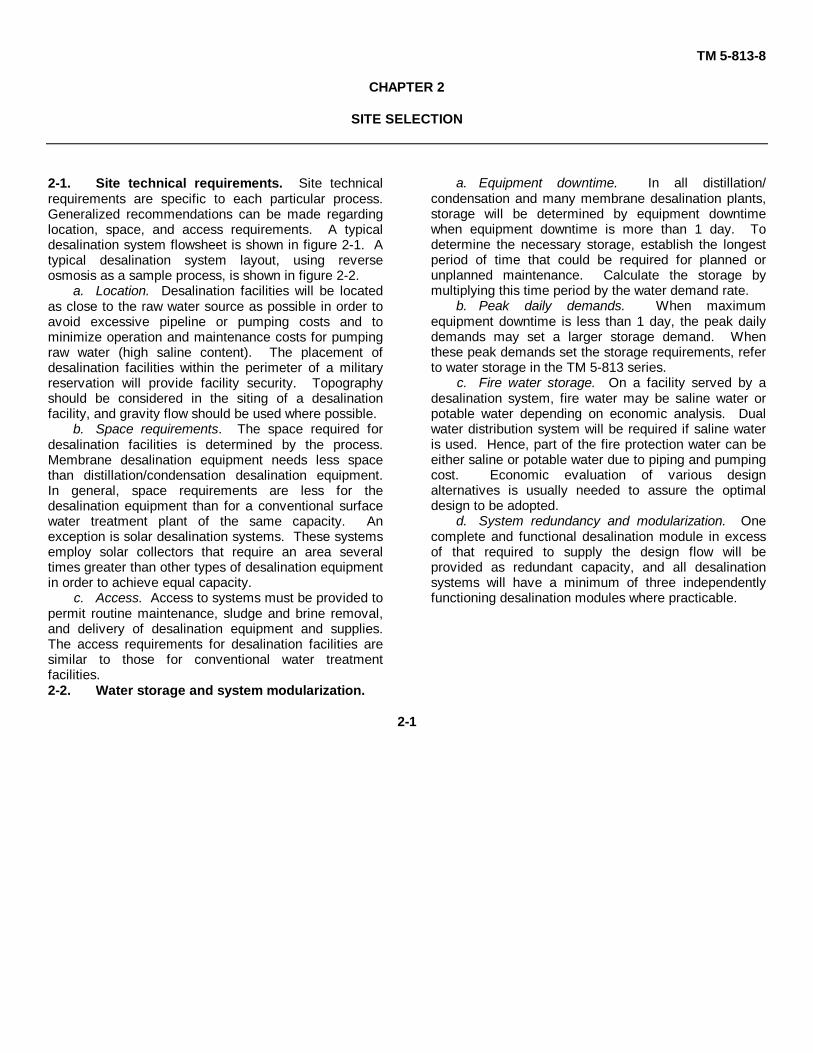
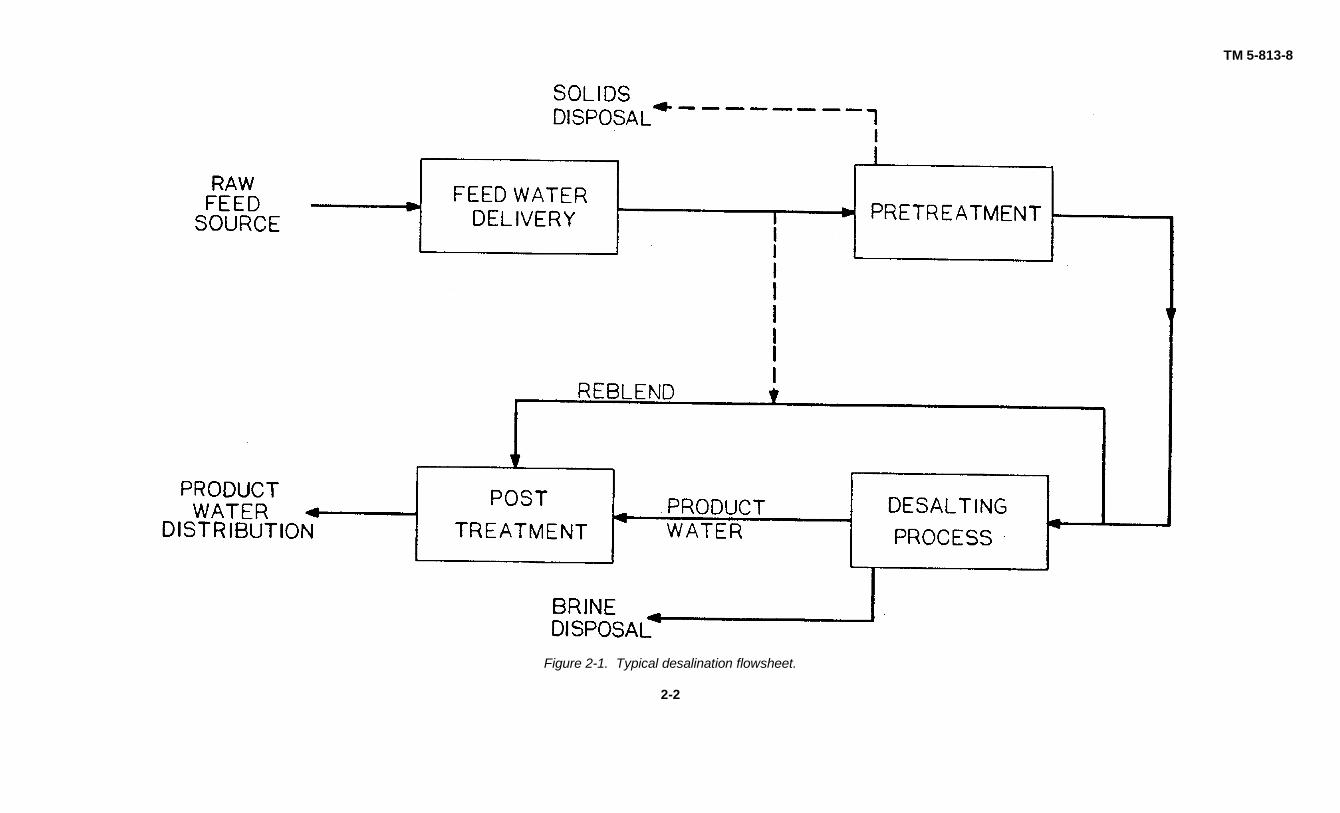
2-1. Site technical requirements. Site technicalrequirements are specific to each particular process.Generalized recommendations can be made regardinglocation, space, and access requirements. A typicaldesalination system flowsheet is shown in figure 2-1. Atypical desalination system layout, using reverseosmosis as a sample process, is shown in figure 2-2.
a. Location. Desalination facilities will be locatedas close to the raw water source as possible in order toavoid excessive pipeline or pumping costs and tominimize operation and maintenance costs for pumpingraw water (high saline content). The placement ofdesalination facilities within the perimeter of a militaryreservation will provide facility security. Topographyshould be considered in the siting of a desalinationfacility, and gravity flow should be used where possible.
b. Space requirements. The space required fordesalination facilities is determined by the process.Membrane desalination equipment needs less spacethan distillation/condensation desalination equipment.In general, space requirements are less for thedesalination equipment than for a conventional surfacewater treatment plant of the same capacity. Anexception is solar desalination systems. These systemsemploy solar collectors that require an area severaltimes greater than other types of desalination equipmentin order to achieve equal capacity.
c. Access. Access to systems must be provided topermit routine maintenance, sludge and brine removal,and delivery of desalination equipment and supplies.The access requirements for desalination facilities aresimilar to those for conventional water treatmentfacilities.2-2. Water storage and system modularization.
a. Equipment downtime. In all distillation/condensation and many membrane desalination plants,storage will be determined by equipment downtimewhen equipment downtime is more than 1 day. Todetermine the necessary storage, establish the longestperiod of time that could be required for planned orunplanned maintenance. Calculate the storage bymultiplying this time period by the water demand rate.
b. Peak daily demands. When maximumequipment downtime is less than 1 day, the peak dailydemands may set a larger storage demand. Whenthese peak demands set the storage requirements, referto water storage in the TM 5-813 series.
c. Fire water storage. On a facility served by adesalination system, fire water may be saline water orpotable water depending on economic analysis. Dualwater distribution system will be required if saline wateris used. Hence, part of the fire protection water can beeither saline or potable water due to piping and pumpingcost. Economic evaluation of various designalternatives is usually needed to assure the optimaldesign to be adopted.
d. System redundancy and modularization. Onecomplete and functional desalination module in excessof that required to supply the design flow will beprovided as redundant capacity, and all desalinationsystems will have a minimum of three independentlyfunctioning desalination modules where practicable.
2-1
TM 5-813-8
Figure 2-1. Typical desalination flowsheet.
2-2
TM 5-813-8
Figure 2-2. Typical reverse osmosis desalination system.
2-3
TM 5-813-8
CHAPTER 3
WATER SOURCE SELECTION
3-1. General. The selection of a water supply will bebased on available quantity, quality, and cost ofdevelopment. Investigate usable fresh surface waterand groundwater thoroughly, prior to consideration ofsources requiring desalination. When fresh watersources do not exist, consider saline water sources. Themost commonly used parameter to differentiate betweensaline water qualities is total dissolved solids (TDS).The total dissolved solids is defined as the sum of thedissolved organic materials and the inorganic salts.Fresh waters contain less than 1,000 milligrams per literof total dissolved solids. Brackish water contain 1,000-20,000 milligrams per liter of total dissolved solids. Seawater usually contains at least 20,000 milligrams perliter of total dissolved solids. Quantities of potable waterneeded will be determined by an analysis of the site inaccordance with TM 5-813-1. The quantity of salinefeed water necessary to produce the required quantity ofproduct water is addressed in Chapter 4.
3-2. Quality. The quality will be determined by theplanned use. Physical, chemical, and bacteriologicaltesting of source waters are required to determine thelevel of treatment to supply the necessary water quality.When the quantity withdrawn exceeds the recharge rate,quality inherently decreases; therefore, this must beconsidered during design.
a. Physical characteristics. The physicalcharacteristics of the raw water source that must beevaluated are total suspended solids (TSS) andtemperature. Turbidity and silt density index (SDI).
(1) Total suspended solids. The totalsuspended solids level of raw water sources must beevaluated to determine the level of pretreatmentprocesses required. Raw water having low totalsuspended solids levels generally requires lesspretreatment. The source with the lowest totalsuspended solids is preferred.
(2) Temperature. The temperature of the rawwater source must be matched to the specificdesalination process. In extreme cases, the watertemperature may control the desalination processselection. A climatological survey must be made priorto finalization of process selection to determine theseasonal maximum and minimum water temperatures ofthe proposed water sources.
(3) Turbidity and silt density index. These twocharacteristics provide two different measures of theamount of fine particulate matter in the water. Turbidityis measured in nephelometric turbidity units (a measureof the amount of light scattered by a known watersample thickness). Silt density index is a measure ofthe amount of 0.45-micron filter plugging caused bypassing a sample of water through the filter for 15minutes. Turbidity must be determined for alldesalination processes. Also, the silt density index mustbe determined for water being considered for reverseosmosis treatment.
b. Chemical constituents. The chemicalconstituents of the raw water must be determined toprovide information for treatment selection. Appendix Bshows the water testing analyses required fordesalination treatment.
c. Bacteriological quality. The bacteriologicaltesting of the raw water must include a type of acoliform indicator organism count. Procedures for filtermembrane, most probable number fermentation tube,and standard plate count, coliform organismbacteriological testing techniques can be found inStandard Methods for the Examination of Water andWastewater and TB Med 576. Manufacturers'recommendations as to the media and procedures usedto identify microbiological activity detrimental to theoperation of a particular desalination system shall befollowed.3-3. Selection versus rejection of potential rawwater sources. After the completion of physical,chemical, and bacteriological testing, a final watersource may be selected. Extreme care must be taken inthe selection of a source where the usage rate is greaterthan the recharge rate. In most cases, selection willinvolve choosing the brackish water with the lowest levelof total dissolved solids. When brackish water is notavailable, use sea water or water as saline as sea wateras the feed water source. When the coliform indicatororganism count of a water is greater than 10,000 mostprobable number (MPN), then the water source shouldbe rejected for sanitary reasons and a more saline waterchosen (per Standard Methods for the Examination ofWater and Wastewater and TB MED 576). If otherwater is available, a water containing more than 1,000nephelometric turbidity units should be rejected on thebasis of the high cost and difficulty of
3-1
TM 5-813-8
clarification, even if the alternative water is more saline.When the total delivery pumping pressure of a lesssaline water is greater than the operating pressure of areverse osmosis system, then the desalination of themore saline water by reverse osmosis may be moreeconomical than the combined cost of delivery and
desalination of the less saline source. The finalselection of a raw water source will be based oneconomic studies. In some cases, the decision cannotbe made until all systems are fully designed and lifecycle costed.
3-2
TM 5-813-8
CHAPTER 4
PROCESS SELECTION
4-1. General process selection. In selecting apotable water production system, it is important toestimate costs of various options. The conventional unitof comparison is cost in dollars per 1,000 gallons ofproduct water. Water quality and energy sources will beestimated from simple site reconnaissance. Forexample, a sea coast site where the water sourcetemperature exceeds 95 degrees Fahrenheit indicates ahigh-salinity high-temperature combination favoringdistillation/condensation processes. Reverse osmosisrequires a feed water temperature below 95 degreesFahrenheit. If local well testing indicates salinitybetween 500 and 3,000 milligrams per liter andelectricity is inexpensive, electrodialysis reversal orhighflux reverse osmosis is indicated.
a. Desalination requirements. The design of adesalination system requires a clear understanding ofthe following: the quantity of product water desired; thequality of the desired product; and the quality of the feedwater source. This manual addresses the production ofpotable water containing less than 500 milligrams perliter of total dissolved solids. Laundries, boilers, messhalls, and hospitals may require water purer than 500milligrams per liter of total dissolved solids. Potablewater from the desalination system may be furthertreated to meet these requirements in accordance withAR 420-46.
b. Saline feed water quantity. The production ofpotable water from saline water usually requires asignificantly larger quantity of saline feed water than thequantity of potable water produced. When desalinationis necessary to produce potable water, the process splitsthe feed water into two streams. One stream is theproduct water; the other stream is the brine that containsmost of the salts originally in the feed water. In watersthat need very little desalination, high-rate reverseosmosis may only reject 5 percent of the feed stream asbrine. In reverse osmosis of sea water, more than 70percent of the intake water may be rejected as brine.Multiply the required product quantity by the reciprocalof the product water recovery fraction to find thequantity of saline water that must be processed to yieldthe desired quantity of product water. In equation, form,it can be expressed as follows:
100%% recovery of product water
x water demand = saline feed water flow
In some cases, the limited quantity of an availablesaline water may require a decision to adopt a moreexpensive desalination process with a higher waterrecovery rate. However, it may require choosing adifferent and more saline feed water with a greateravailability.
c. Blending of waters. Blending a highconcentration stream with a low concentration streamwastes the osmotic pressure energy between the twostreams. Therefore, it is best to match the design of thedesalination system to the product quality desired.When a desalination process cannot be economicallymatched to the desired product quality, then a processthat yields water with a very low dissolved materialcontent must be used. To conserve capital andequipment costs and meet the desired water demand,the high purity product water can be blended with thepretreated saline feed water to produce the requiredproduct quantity and quality. The following equation canbe used to calculate the concentration of a blendedwater stream:
( Σ concentration i x flow i)/total flow =blended concentration
When only two streams are blended, the equation canbe rearranged to show the flow of concentrated waterthat when blended with a dilute flow will result in thedesired product concentration. This rearrangedequation is as follows:
(P - H)(D) =FC-P
Where:P = Desired product water
concentrationH = High purity water concentrationD = Flow of the high purity waterC = Concentration in the impure
concentrated streamF = Flow rate of the concentrated
streamReblending for remineralization is discussed in Chapter9. The same blend equations will apply to blending
4-1
i =n
i=1
TM 5-813-8
for remineralization, which is a more commonprocedure. See Appendix A for sample problems.4-2. Process limitations. The various desalinationprocesses presently available have limitations that mustbe considered prior to selecting a desalination processfor a particular site. These limitations apply only to thedesalination processes themselves; pretreatment can beand is often used to bring a saline feed water withinlimits so that a desalination process can be used. Theraw feed water chemistry for all desalination systemsmust be evaluated thoroughly for constituents that mayprecipitate in the desalination system.
a. High-temperature distillation. High-temperaturedistillation is limited by the saturation of alkaline earthmetal salts, such as CaSO4, BaSO4, SrSO4, CaCO3,BaCO3, and SrCO3. Carbonate salt scaling can becontrolled by acid addition. The recovery of water froma hightemperature distillation plant is usually limited bycalcium sulfate solubility. When the concentration ofthe sulfate and the limiting alkaline earth metal is one-third of the saturated condition at ambient temperature,distillation design must include pretreatment to reduceor inhibit the scaling ions. High-temperature distillationis also limited to oil and grease levels below 1 milligramper liter. All other limitations on the high-temperaturedistillation process are equipment specific and requireindividual evaluation.
b. Low-temperature and mechanical distillation.Low-temperature and mechanical distillation systemsare limited to operation below saturation of alkalineearth sulfates and carbonates. The lower operatingtemperature permits economical operation on watersthat are at or below half saturation at ambienttemperature. Oil and grease are limited to less than 1milligram per liter. Any other limitations are equipmentspecific.
c. Reverse osmosis. The most severe limitationon reverse osmosis is the maximum limit of 50,000milligrams per liter of total dissolved solids in the feedwater. Another limitation is that there must be no iron inthe feed water. This limitation is so rigid that onlystainless steel and nonferric materials will be useddownstream of the iron removal. The solubility ofalkaline earth sulfates and carbonates limits reverseosmosis treatment. Any water containing less than4,000 milligrams per liter of total dissolved solids thatwould be saturated with an alkaline earth sulfate whenthe concentration is multiplied by 1.5 should not beconsidered for reverse osmosis desalination. Reverseosmosis is limited to waters that do not have silicasaturation in the reject brine. Silica chemistry is
extremely complex. When the molybdenum reactivesilica concentration exceeds 30 milligrams per liter asSiO2 or the pH exceeds 8.3 in the brine stream, anenvironmental chemist or engineer should be consulted.Reverse osmosis is also limited to the treatment ofwaters with less than 1 milligram per liter of oil andgrease.
(1) Cellulose acetate membranes. Celluloseacetate membranes are usually limited to pH levelsbetween 4.0 and 7.5. Cellulose acetate membranesrequire some form of continuous disinfection with thefeed water to prevent microbial degradation of themembranes and can tolerate up to 1 milligram per literof free chlorine. Therefore, cellulose acetatemembranes are usually disinfected by maintaining 0.2 to0.9 milligrams per liter of free chlorine in the feed water.Cellulose acetate membranes cannot be used on waterswhere the temperature exceeds 88 degrees Fahrenheit.Cellulose acetate membranes should not be used atpressures greater than the manufacturer'srecommended pressure, since they are prone tomembrane degradation by pressure compaction.
(2) Polyaromatic amide membranes.Brackish water polyaromatic amide membranes aregenerally limited to operation in feed waters between pH4 and pH 11. Polyaromatic amide membranes are lesspH tolerant and should not be used outside of the rangepH 5 to pH 9. All polyaromatic amide membranes arelimited to use on feed streams that are free of residualchlorine. If chlorination is necessary or desirable as apretreatment option, complete dechlorination must beeffected. Polyaromatic amide membranes are tolerantof water temperatures up to 95 degrees Fahrenheit.While polyaromatic amide membranes are not asquickly or completely compacted as are celluloseacetate membranes, manufacturer's recommendedpressures must be followed to prevent mechanicaldamage to membrane modules.
d. Electrodialysis reversal. While electrodialysisreversal has been used to treat water as saline as seawater, 4,000 milligrams per liter of total dissolved solidsis considered to be an upper limit for economicaloperation. Some electrodialysis membranes cantolerate strong oxidants, like chlorine, but most cannot.The reversal of polarity used in electrodialysis reversalfor removal of scale allows operation on water that issaturated with alkaline earth carbonates. Saturation
4-2
TM 5-813-8
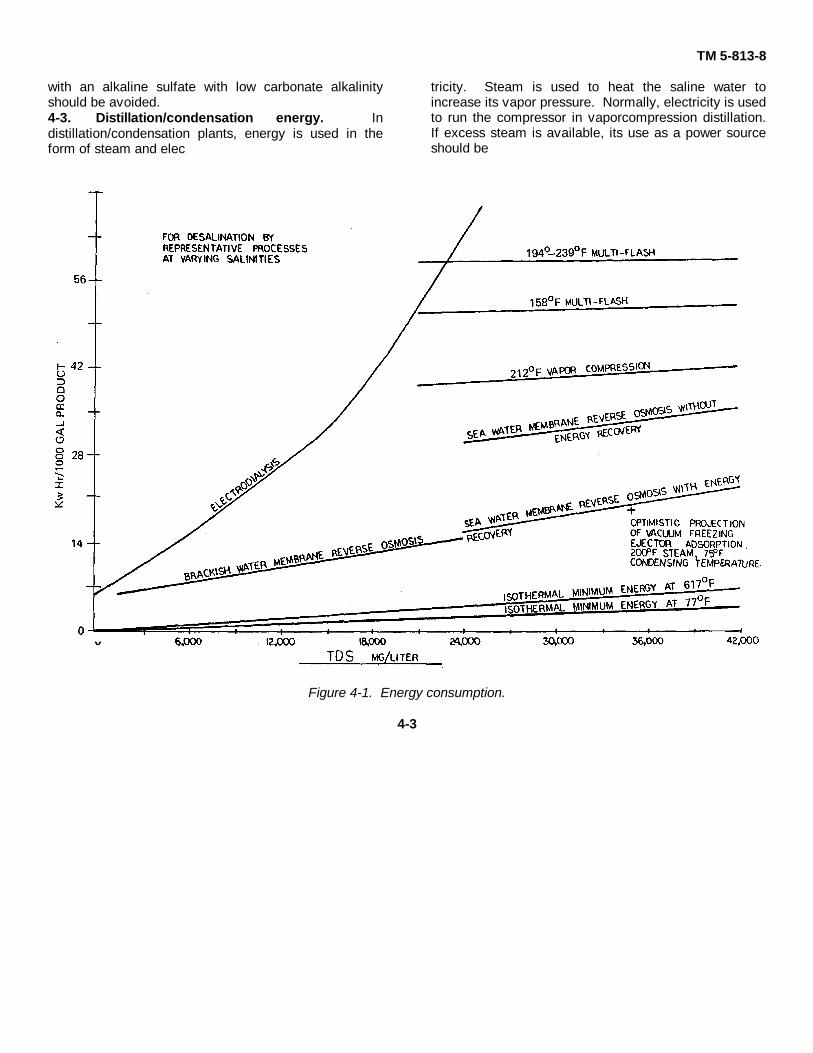
with an alkaline sulfate with low carbonate alkalinityshould be avoided.4-3. Distillation/condensation energy. Indistillation/condensation plants, energy is used in theform of steam and elec
tricity. Steam is used to heat the saline water toincrease its vapor pressure. Normally, electricity is usedto run the compressor in vaporcompression distillation.If excess steam is available, its use as a power sourceshould be
Figure 4-1. Energy consumption.
4-3
Appendix B
Appendix B
TM 5-813-8
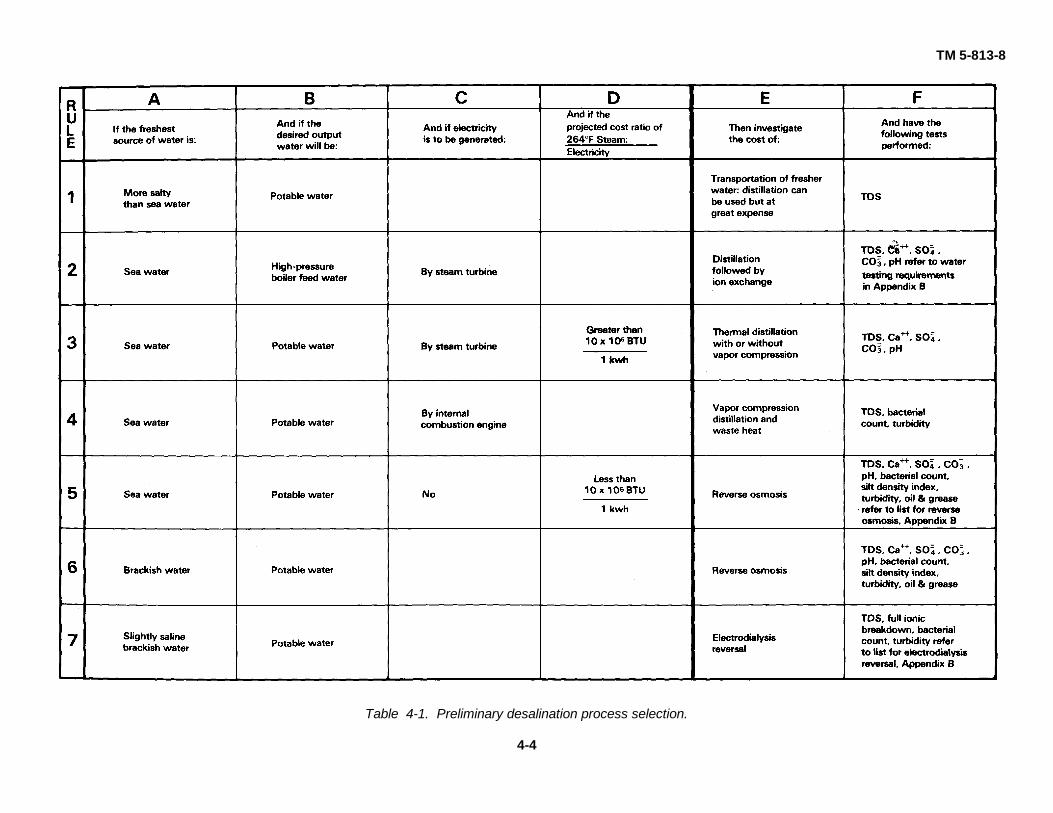
Table 4-1. Preliminary desalination process selection.
4-4
TM 5-813-8
investigated. The amount of electricity or mechanicalwork that steam will yield depends on its temperature aswell as the temperature to which it can be condensed.The energy consumption of both vapor compression andthermal distillation, as related to the total dissolvedsolids of feed water, is shown in figure 4-1.
4-4. Membrane energy. Historically, membranedesalination systems use less energy than othersystems. Brackish water disalination should beaccomplished by membrane separation processesbecause of the reduced energy requirement. Theenergy consumption of electrodialysis reversal can bemade to follow reduced or variable salinity, while theenergy consumption of reverse osmosis is set principallyby membrane water flux. Again, the energyconsumption of electrodialysis reversal and reverseosmosis as a function of the total dissolved solidscontent of the feed water is shown in figure 4-1. Asmembrane materials are developed, energyconsumption may be reduced.
4-5. Waste disposal. Waste disposal may influenceprocess selection. Since brine disposal costs can be animportant part of process economics, brine disposalalternatives must be explored while water qualityanalyses are being performed. For further information,refer to Chapter 10 on waste disposal.
4-6. Preliminary process selection. Usepreliminary site information to eliminate certaindesalination processes. A decision logic table for usewith preliminary information is shown in table 4-1.Decisions based upon table 4-1 are to be consideredpreliminary only. Necessary water quality tests tofurther support the recommedations made in Column Eof table 4-1 are in Column F.
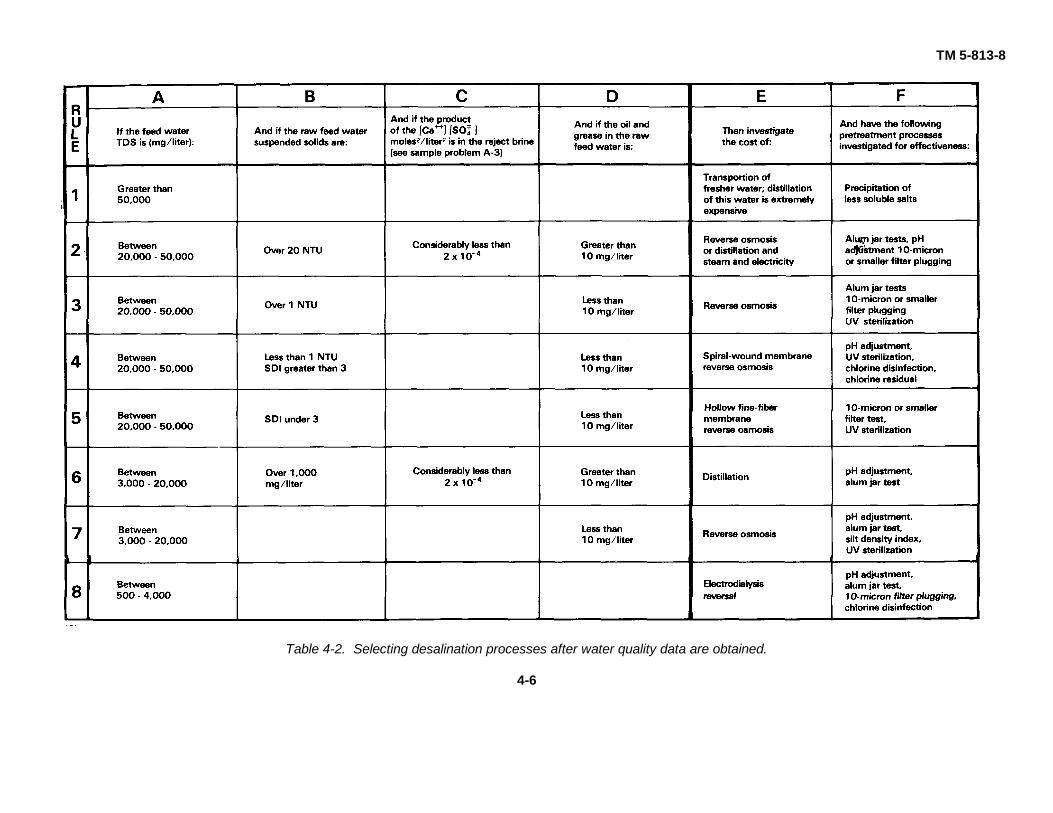
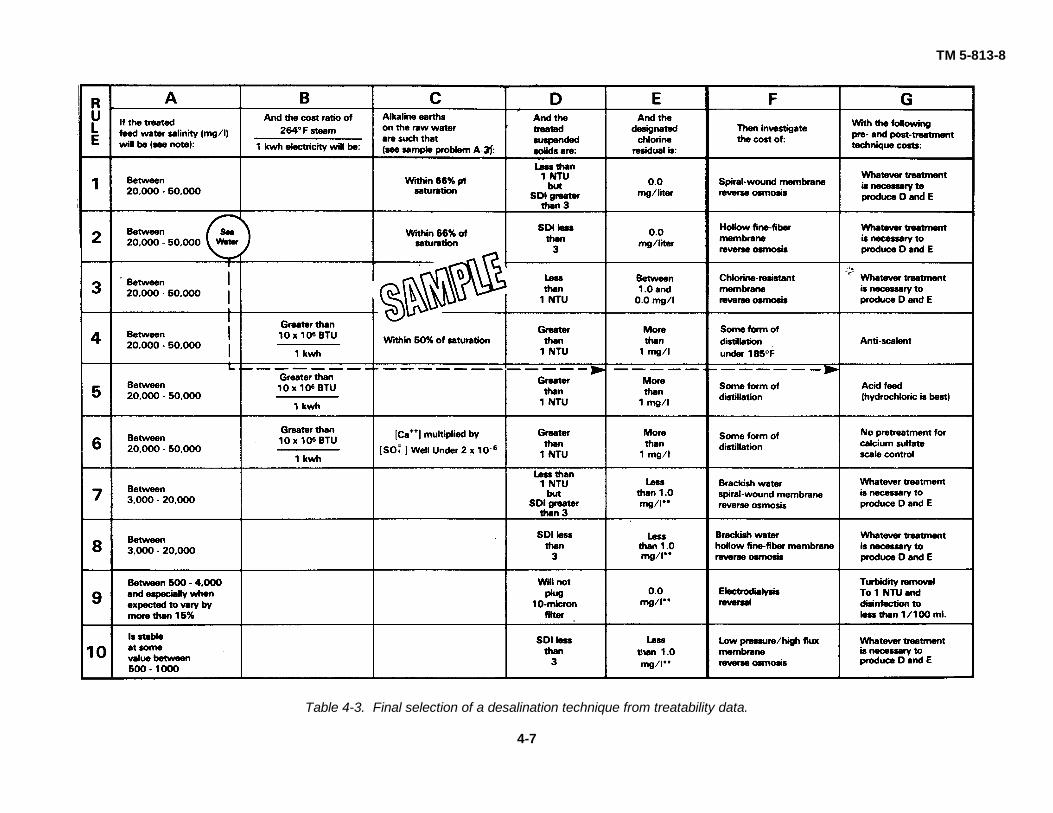
4-7. Process selection. When initial site and rawwater source selections have been made, usepreliminary water quality information with table 4-1 toassist in a preliminary process selection. As morespecific information is obtained from laboratory analysesof water quality, make an initial process selection usingthe second decision logic table, table 4-2. After atreatability investigation has been completed, select thefinal desalination process. A final decision logic table,table 4-3, assists in the final process selection. The useof the decision logic table sequence will only providegeneralized assistance in process selection; additionaleconomic, engineering, and environmental studies mayindicate that methods or combinations of methods mustbe used.
4-5
TM 5-813-8
Table 4-2. Selecting desalination processes after water quality data are obtained.
4-6
TM 5-813-8
Table 4-3. Final selection of a desalination technique from treatability data.
4-7
TM 5-813-8
CHAPTER 5
PRETREATMENT CONSIDERATIONS
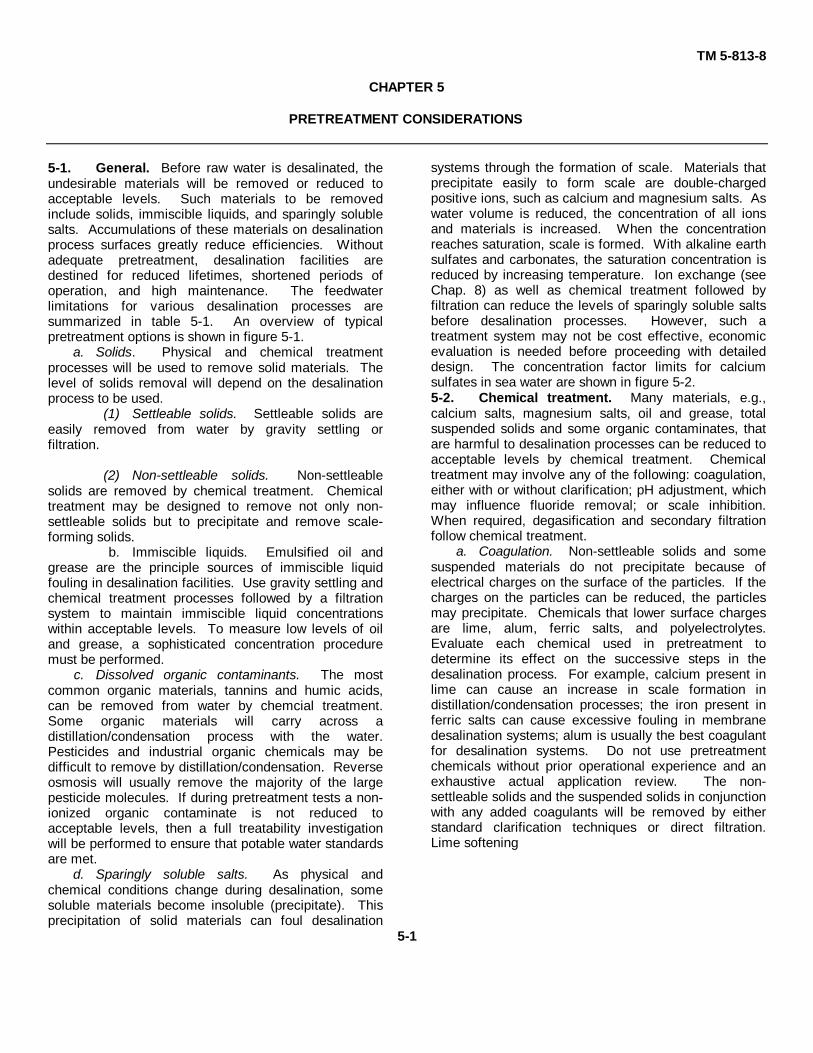
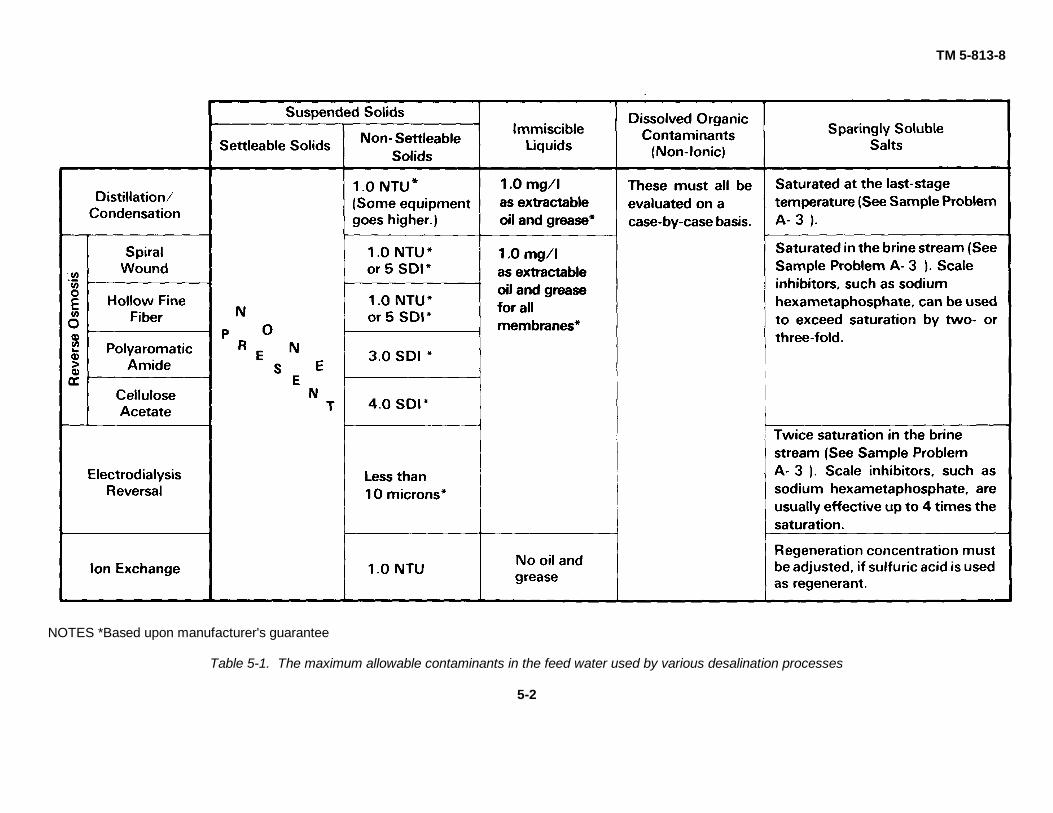
5-1. General. Before raw water is desalinated, theundesirable materials will be removed or reduced toacceptable levels. Such materials to be removedinclude solids, immiscible liquids, and sparingly solublesalts. Accumulations of these materials on desalinationprocess surfaces greatly reduce efficiencies. Withoutadequate pretreatment, desalination facilities aredestined for reduced lifetimes, shortened periods ofoperation, and high maintenance. The feedwaterlimitations for various desalination processes aresummarized in table 5-1. An overview of typicalpretreatment options is shown in figure 5-1.
a. Solids. Physical and chemical treatmentprocesses will be used to remove solid materials. Thelevel of solids removal will depend on the desalinationprocess to be used.
(1) Settleable solids. Settleable solids areeasily removed from water by gravity settling orfiltration.
(2) Non-settleable solids. Non-settleablesolids are removed by chemical treatment. Chemicaltreatment may be designed to remove not only non-settleable solids but to precipitate and remove scale-forming solids.
b. Immiscible liquids. Emulsified oil andgrease are the principle sources of immiscible liquidfouling in desalination facilities. Use gravity settling andchemical treatment processes followed by a filtrationsystem to maintain immiscible liquid concentrationswithin acceptable levels. To measure low levels of oiland grease, a sophisticated concentration proceduremust be performed.
c. Dissolved organic contaminants. The mostcommon organic materials, tannins and humic acids,can be removed from water by chemcial treatment.Some organic materials will carry across adistillation/condensation process with the water.Pesticides and industrial organic chemicals may bedifficult to remove by distillation/condensation. Reverseosmosis will usually remove the majority of the largepesticide molecules. If during pretreatment tests a non-ionized organic contaminate is not reduced toacceptable levels, then a full treatability investigationwill be performed to ensure that potable water standardsare met.
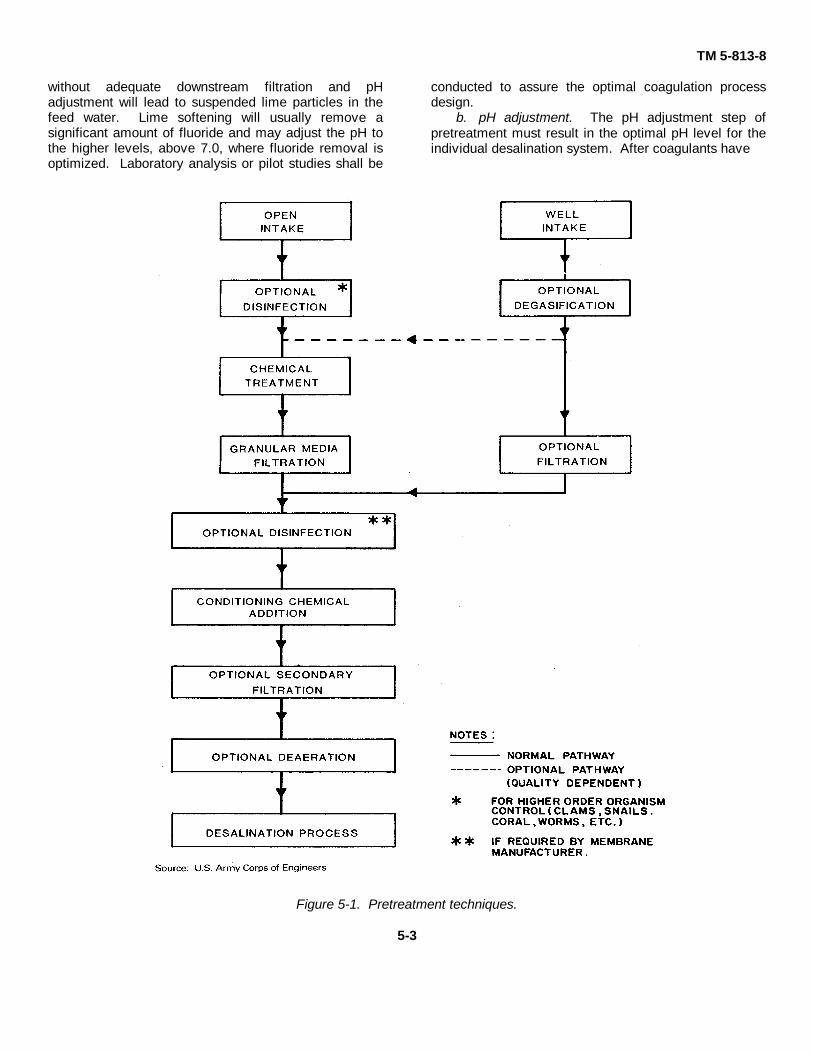
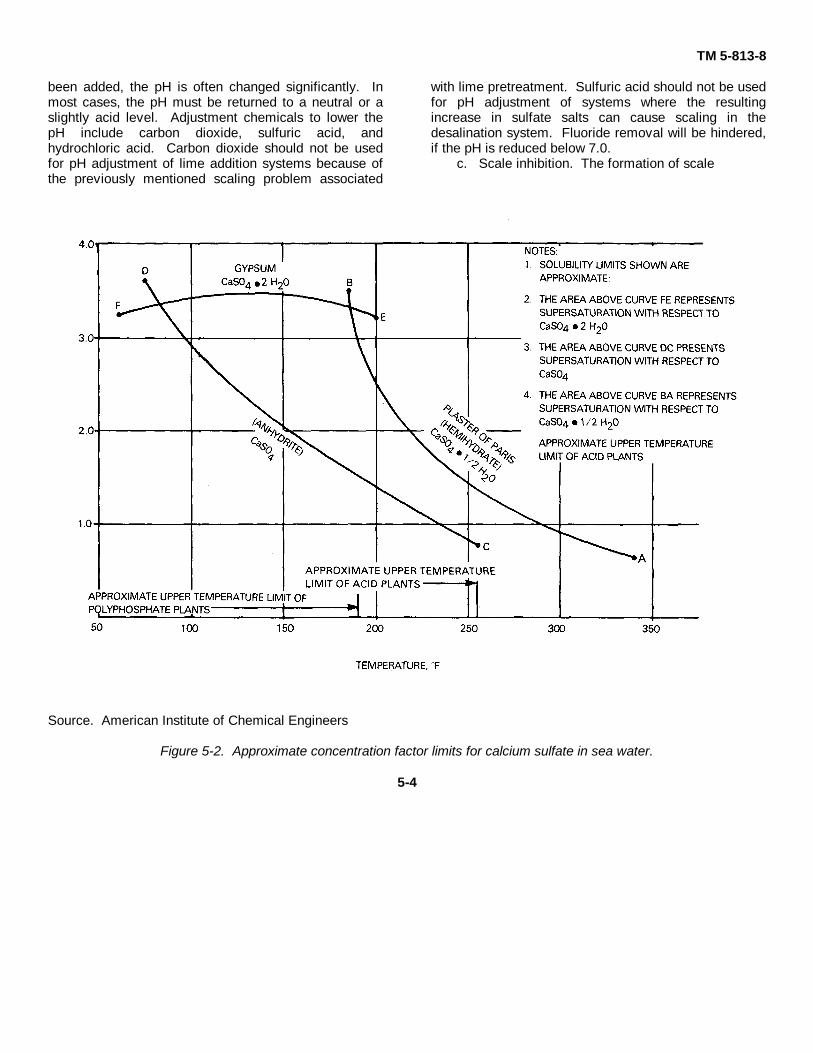
d. Sparingly soluble salts. As physical andchemical conditions change during desalination, somesoluble materials become insoluble (precipitate). Thisprecipitation of solid materials can foul desalination
systems through the formation of scale. Materials thatprecipitate easily to form scale are double-chargedpositive ions, such as calcium and magnesium salts. Aswater volume is reduced, the concentration of all ionsand materials is increased. When the concentrationreaches saturation, scale is formed. With alkaline earthsulfates and carbonates, the saturation concentration isreduced by increasing temperature. Ion exchange (seeChap. 8) as well as chemical treatment followed byfiltration can reduce the levels of sparingly soluble saltsbefore desalination processes. However, such atreatment system may not be cost effective, economicevaluation is needed before proceeding with detaileddesign. The concentration factor limits for calciumsulfates in sea water are shown in figure 5-2.5-2. Chemical treatment. Many materials, e.g.,calcium salts, magnesium salts, oil and grease, totalsuspended solids and some organic contaminates, thatare harmful to desalination processes can be reduced toacceptable levels by chemical treatment. Chemicaltreatment may involve any of the following: coagulation,either with or without clarification; pH adjustment, whichmay influence fluoride removal; or scale inhibition.When required, degasification and secondary filtrationfollow chemical treatment.
a. Coagulation. Non-settleable solids and somesuspended materials do not precipitate because ofelectrical charges on the surface of the particles. If thecharges on the particles can be reduced, the particlesmay precipitate. Chemicals that lower surface chargesare lime, alum, ferric salts, and polyelectrolytes.Evaluate each chemical used in pretreatment todetermine its effect on the successive steps in thedesalination process. For example, calcium present inlime can cause an increase in scale formation indistillation/condensation processes; the iron present inferric salts can cause excessive fouling in membranedesalination systems; alum is usually the best coagulantfor desalination systems. Do not use pretreatmentchemicals without prior operational experience and anexhaustive actual application review. The non-settleable solids and the suspended solids in conjunctionwith any added coagulants will be removed by eitherstandard clarification techniques or direct filtration.Lime softening
5-1
TM 5-813-8
NOTES *Based upon manufacturer's guarantee
Table 5-1. The maximum allowable contaminants in the feed water used by various desalination processes
5-2
TM 5-813-8
without adequate downstream filtration and pHadjustment will lead to suspended lime particles in thefeed water. Lime softening will usually remove asignificant amount of fluoride and may adjust the pH tothe higher levels, above 7.0, where fluoride removal isoptimized. Laboratory analysis or pilot studies shall be
conducted to assure the optimal coagulation processdesign.
b. pH adjustment. The pH adjustment step ofpretreatment must result in the optimal pH level for theindividual desalination system. After coagulants have
Figure 5-1. Pretreatment techniques.
5-3
TM 5-813-8
been added, the pH is often changed significantly. Inmost cases, the pH must be returned to a neutral or aslightly acid level. Adjustment chemicals to lower thepH include carbon dioxide, sulfuric acid, andhydrochloric acid. Carbon dioxide should not be usedfor pH adjustment of lime addition systems because ofthe previously mentioned scaling problem associated
with lime pretreatment. Sulfuric acid should not be usedfor pH adjustment of systems where the resultingincrease in sulfate salts can cause scaling in thedesalination system. Fluoride removal will be hindered,if the pH is reduced below 7.0.
c. Scale inhibition. The formation of scale
Source. American Institute of Chemical Engineers
Figure 5-2. Approximate concentration factor limits for calcium sulfate in sea water.
5-4
TM 5-813-8
limits the efficiency of product water recovery duringplant operation. The precipitation of calcium carbonate,magnesium hydroxide, and calcium sulfate can beprevented through the addition of scale-inhibitingchemicals. Two scale-inhibiting chemical types arecommonly used: polyphosphates and polyelectrolytes.The most commonly used scale inhibitors arepolyphosphate chemicals. Polyphosphates lose theireffectiveness above 190 degrees Fahrenheit, whichlimits upper operating temperatures. To prevent theformation of scale within desalination systems,polyphosphate-based chemicals are the best generalpurpose additive. The most commonly usedpolyphosphate compound is sodiumhexametaphosphate. Polyelectrolytes or organicpolymers are relatively new scale inhibitors. The use ofpolyelectrolytes in potable water shall be in accordancewith paragraph 7 of AR 420-46.5-3. Degasification and deaeration. The removalof dissolved gases from a feed water can beaccomplished in one of two ways. The dissolved gasmay be stripped out with another gas, or the dissolvedgas may be stripped out with water vapor. A forceddraft degasification tower will remove nonatmosphericgases. This is done by blowing air up through a tower ofpacking. The water to be degasified is then sprinkledover the packing. When full deaeration is required toprevent the interference of oxygen and nitrogen withwater vaporizaton or flashing, steam or water vapormust be used as the stripping gas. On high-temperaturedistillation systems, a steam deaerator may be used.On most distillation desalination systems, the onlyeconomical method of deaeration the water is to lowerthe pressure with a vacuum pump or venturi eductor orejector to produce enough water vapor to strip away alldissolved gases. There are two basic designs for waterdistribution in deaerators. A design that sprays thewater in the deaerator vessel will usually create themost complete deaeration. The other commonly useddesign involves cascading the water over trays. Whilethe internal design of this deaerator is prone to shortcircuiting and incomplete deaeration, it is more compactand requires no pressure to operate the sprayers.
5-4 Filtration with granular media. Before thefiltration is designed, the possibility of use ofwells/infiltration galleries shall be evaluated. Filtration isnecessary when the desalination process requires a lowlevel of particulate material. Primary filtration withgranular media removes particulate materials left afterlime, coagulates, or other chemicals have been addedto the feed waters. Single-or dual-media filtration
systems are generally used. In some cases, mixed-media filtration may be necessary. Filters may useeither pressure or gravity flow methods.
a. Single-media filtration. Single-media filtrationconsists of one media. This media is often small-grained silica sand; however, anthracite may be usedafter lime and lime-soda softening. Some desalinationpretreatment systems use an alternate media such asgreensand to remove iron compounds. Diatomaceousearth media is not recommended for primary filtrationbecause of its characteristic high head loss and shortfun times.
b. Dual-media filtration. Dual-media filtrationconsists of two media with different specific gravities.The difference creates a two-layer separation effect.Use silica sand or greensand for one layer; useanthracite for the other layer. The use of dual media willallow larger quantities of material to be filtered and willreduce head loss during operation. The use of twomedia types will provide a good coarse-of-fine filtrationprocess for desalination facilities.
c. Mixed-media filtration. When three media areused in filters, a better coarse-to-fine filtration patterncan be constructed. High-density silica sand, garnet,and anthracite are commonly used to provide the filterbed. The different media do not stratify completely.Instead, there is a small amount of intermixing amongthe different layers. This gradual change in media sizeprovides a gradient from coarse to fine and creates amedia flow pattern necessary to achieve a very low siltdensity index.
5-5. Secondary filtration. Secondary filtration isnecessary to ensure that particulate material does notpass from the pretreatment systems into a membranedesalination process. Secondary filtration is usednormally as a precautionary measure. Cartridge filtersare commonly used. Ultrafiltration systems can be usedas a process and precautionary measure.
a. Cartridge units. The necessary protection ismost easily accomplished with cartridge filters. Thecartridges are replaced easily, and the filter mesh canbe sized to remove from 20-micron to 0.05-micronparticles. Although some cartridge filters can bebackwashed, most are replaced when head loss reachesexcessive levels.
b. Ultrafiltration units. The newer process forsecondary filtration is ultrafiltration. New
5-5
TM 5-813-8
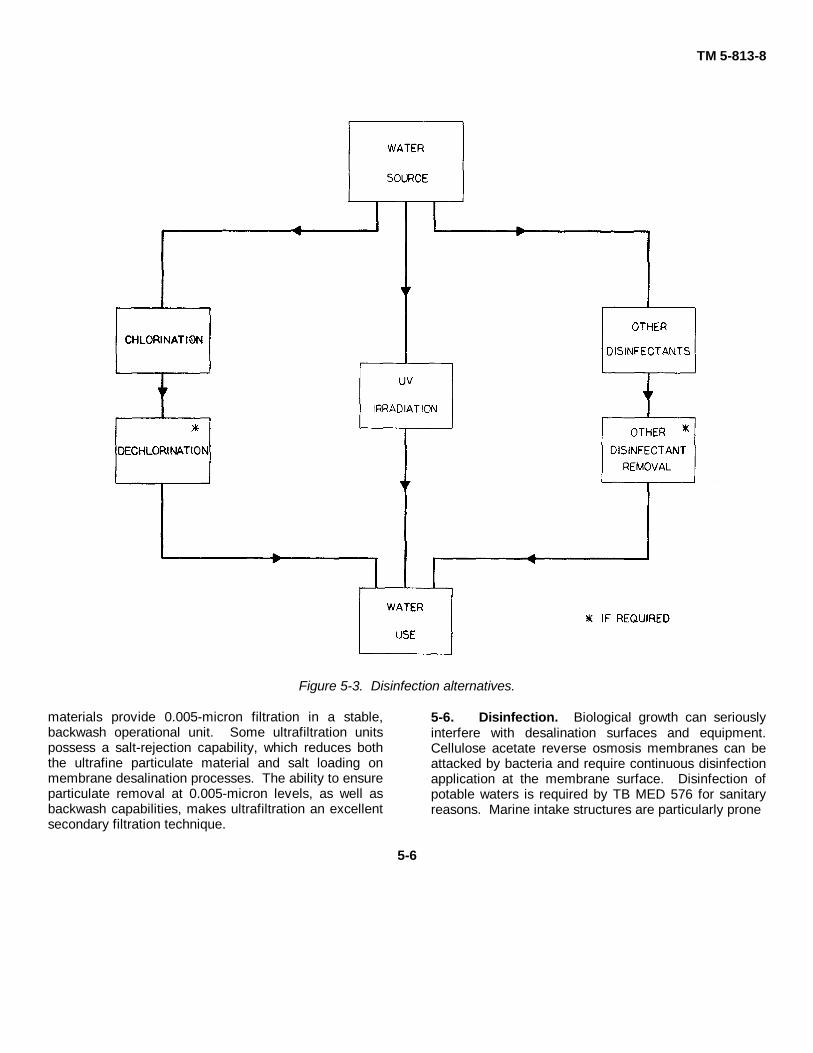
Figure 5-3. Disinfection alternatives.
materials provide 0.005-micron filtration in a stable,backwash operational unit. Some ultrafiltration unitspossess a salt-rejection capability, which reduces boththe ultrafine particulate material and salt loading onmembrane desalination processes. The ability to ensureparticulate removal at 0.005-micron levels, as well asbackwash capabilities, makes ultrafiltration an excellentsecondary filtration technique.
5-6. Disinfection. Biological growth can seriouslyinterfere with desalination surfaces and equipment.Cellulose acetate reverse osmosis membranes can beattacked by bacteria and require continuous disinfectionapplication at the membrane surface. Disinfection ofpotable waters is required by TB MED 576 for sanitaryreasons. Marine intake structures are particularly prone
5-6
TM 5-813-8
to biogrowths. A strong biocide is usually needed toprevent extensive marine growths from fouling intakes,piping and storage facilities. An overview of disinfectionalternatives can be found in figure 5-3. Chlorination isnot advisable in the pretreatment process when organiccontents are high.
a. Ultraviolet irradiation. One effective disinfectiontechnique is ultraviolet irradiation.Raw wafers flow through a chamber where they are exposed to ultraviolet lamps. The resulting disinfectionprevents bacterial destruction of cellulose acetate-basedmembrane systems and eliminates biofouling ofpolyaromatic-based membrane systems. Becausepolyaromatic fiber membranes are very susceptible tochemical oxidant attack, ultraviolet disinfection is thebest disinfection technique for these systems.
b. Oxidants. The addition of chemical oxidants,such as chlorine, bromine, iodine, or ozone, can providebiological disinfection before membrane processes. Theuse of oxidants must be monitored carefully to keep thechlorine below 1.0 milligrams per liter of free chlorineresidual that would even damage cellulose acetatemembrane systems. For cellulose acetate membranesystems, a carefully monitored oxidant addition is thebest technique for disinfection of biologically active feedwaters. When biological and other organic materials arechlorinated, the resulting chlorine oxidation generateshalogenated carbon compounds, such as thetrihalomethane class of compounds. While theplacement of chlorine disinfection upstream ofcoagulation of filtration will increase chlorine contact
time, which will increase the number of organismsdestroyed, it will also increase trihalomethane formation.When an open intake requires optional disinfection asshown in figure 5-1 and chlorination is shown bypretreatment investigation to bring the trihalomethanecontent above 0.1 milligrams per liter, then no form ofchlorine shall be used as a raw water disinfectant. Thelegal limit (per National Interim Drinking WaterRegulations) for trihalomethanes in potable watereffluents for communities and installations with aneffective population of 10,000 or more is 0.1 milligramsper liter.
c. Dechlorination. When chlorine is used as adisinfectant, complete dechlorination of pretreatedwaters must occur before desalination in polyaromaticmembrane systems. Dechlorination can beaccomplished chemically through sulfite compoundaddition or passage through granular-activated carbon.Complete dechlorination and destruction of the chlorineresidual by reducing compounds will ensure thatchemicals do not attack these sensitive membranesystems. When a chlorinated water source must beused and complete dechlorination below 1.0 milligramsper liter as free chlorine is not possible, usedistillation/condensation. When dechlorination is onlyeconomically practical to between 0.2 and 1.0milligrams per liter as free chlorine, a cellulose acetate-based membrane system may be used.
5-7
TM 5-813-8
CHAPTER 6
DISTILLATION/CONDENSATION TECHNIQUES
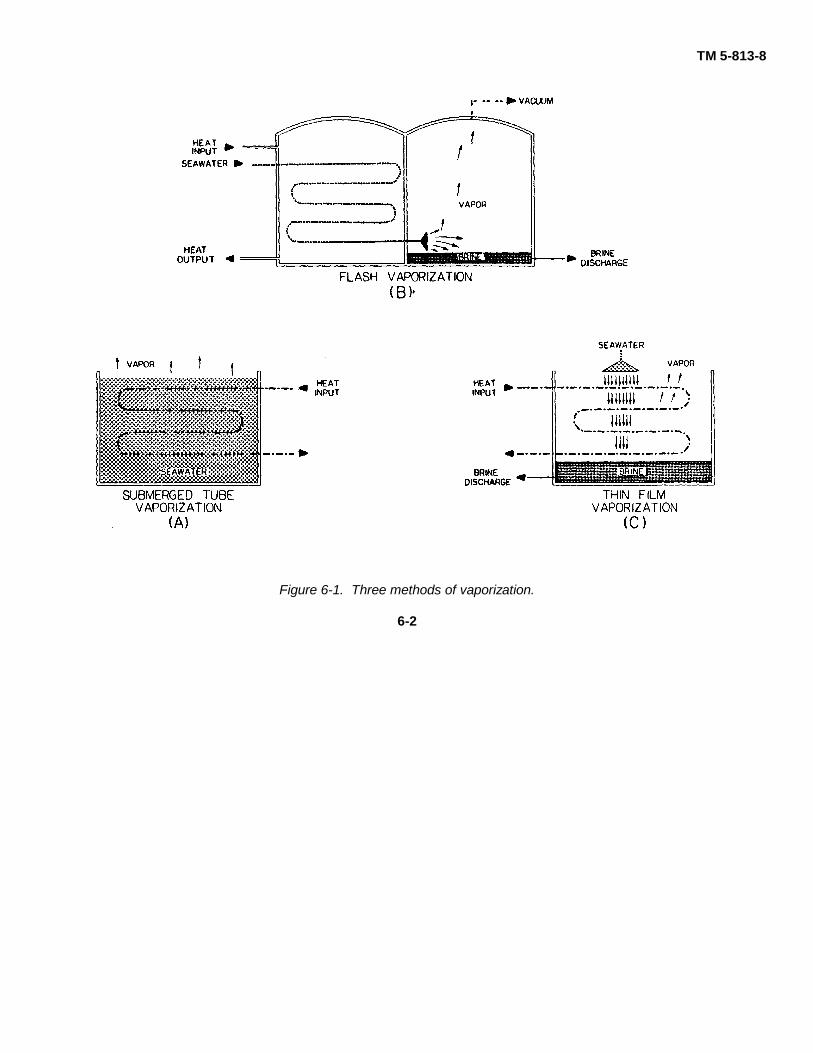
6-1. General. Distillation/condensation is the mostcommon desalination process. More than 70 percent ofall desalination facilities in use today employ somevariation of the distillation/condensation process.6-2. High-temperature distillation. High-temperature distillation faciilties that operate attemperatures greater than 205 degrees Fahrenheit arethe most prevalent desalination facilities in the worldtoday. There are three methods of vaporizaiton:submerged tube vaporization; flash vaporization; andthin-film vaporization. These methods are illustrated infigure 6-1. Submerged tube vaporization is the leastefficient vaporization technique, but it allows for easymaintenance. This type of vaporization system is mostoften used in exhaust gas waste heat recoverydistillation systems. The flash vaporization technique ispresently the most common technique in existingdistillation units. The impact of sprayed hot brine withinthe evaporator unit causes both erosion and corrosion ofmost metals. Using a thin-film sprayvaporizationprocess, the raw water is introduced at slightly less thanatmospheric pressure through an orifice onto heatexchanger tubes for immediate vaporization. Thecorrosive environment is reduced from the flashvaporization system, but scaling can occur on the heattransfer surfaces. These vaporization techniques areused in the two major high-temperature distillationprocesses, multiple-effect (ME) evaporation, andmultistage flash (MSF) evaporation.
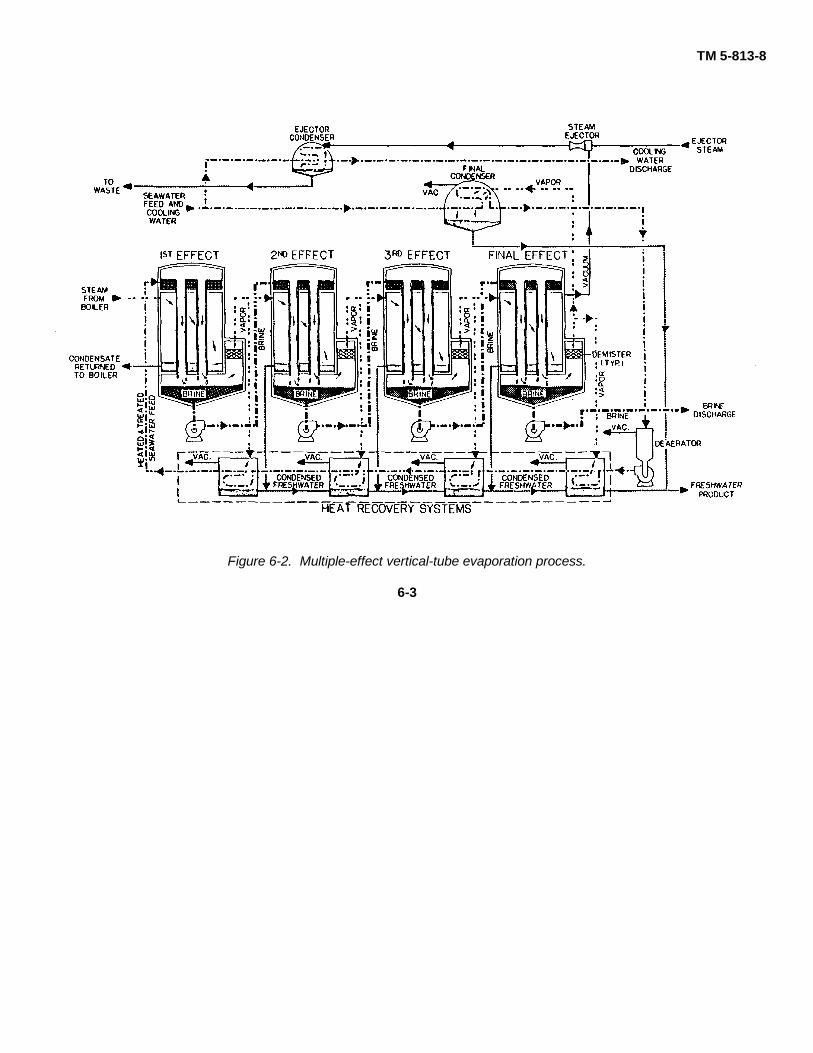
a. Multiple-effect evaporation units. To maximizethermal energy efficiency within adistillation/condensation system, several units or effectsare used. The heat from the condensation step of oneeffect is used to supply vaporization heat for thefollowing effect. The next effect is a slightly loweredpressure and temperature. This gradual reduction byheat transfer results in a much greater yield of productwater from a given quantity of thermal energy. A typicalmultiple-effect evaporation unit is shown in figure 6-2.
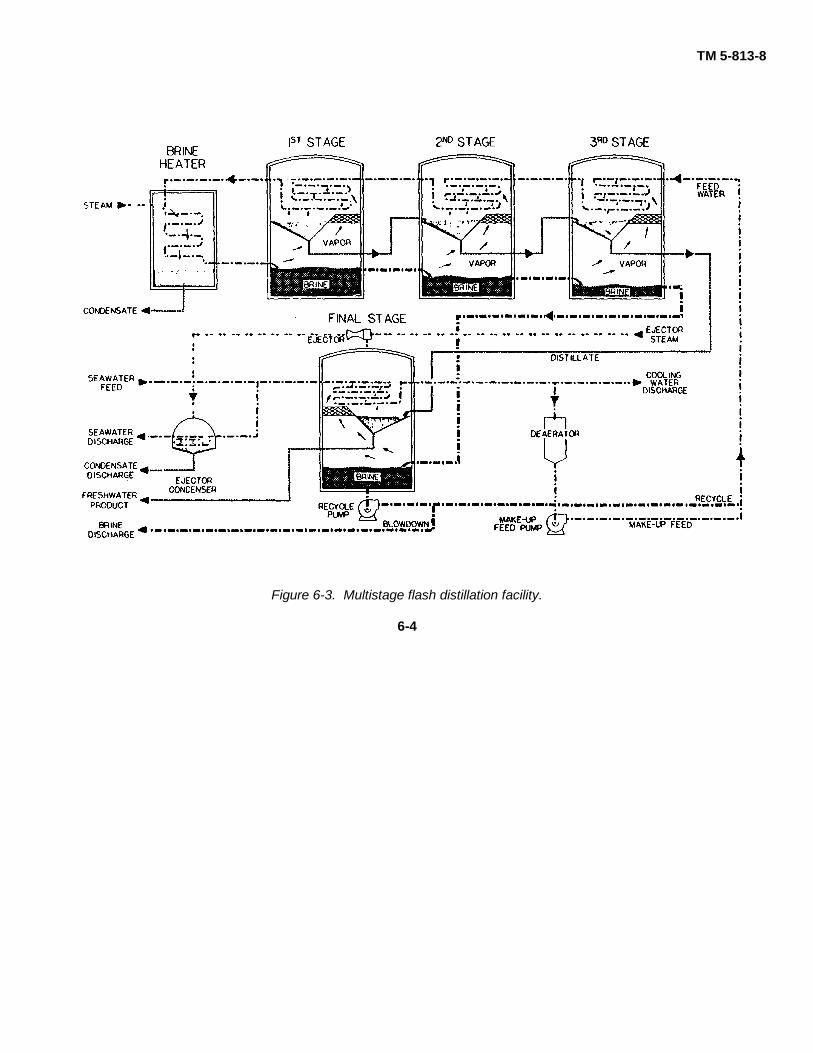
b. Multistage flash-evaporation units. Distillationtechnology was advanced through the development ofmultistage flash evaporation units. Stages of flashevaporation are operated using heat from an externalsource. Pressure is reduced gradually in eachsuccessive stage to continue flash operation atsuccessively lower temperatures and pressures.Because scaling is not a serious problem, this designhas become the most prevalent distillation process. Atypical multistage flash-evaporation unit is shown infigure 6-3. Although internal scaling is not a great
problem, corrosion of flash-evaporation units is ofconcern.
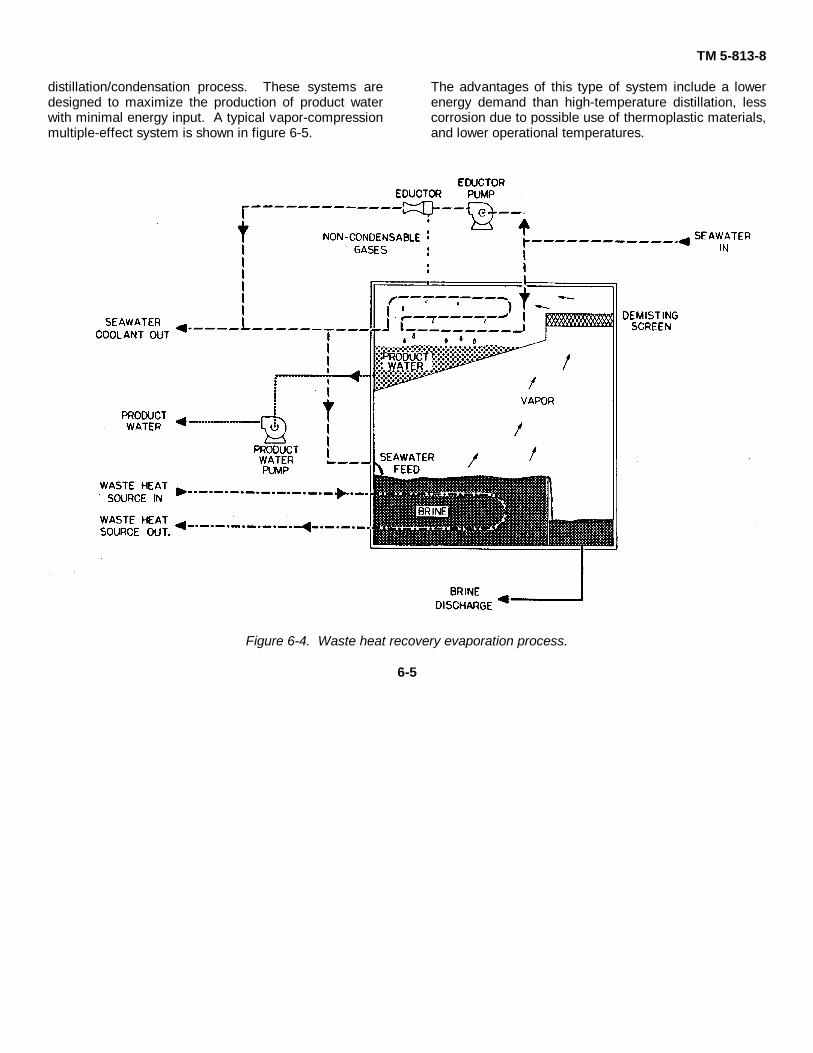
6-3. Low-temperature distillation. Distillation/condensation facilities that operate at temperatures lessthan 205 degrees Fahrenheit are low-temperature units.In situations where waste heat is plentiful, low-temperature waste-heat-recovery evaporation units areused. A waste-heat-recovery unit is shown in figure 6-4.For onshore application, low-pressure waste steam frompower generation facilities can provide the necessarythermal energy for desalination systems. The mostrecent developments in distillation/condensationtechnology involve the use of waste heat or lowpressuresteam with evaporation units and a mechanical vaporcompression system. Multiple stages then derive themaximum vapor and product water production from thesystem.
6-4. Mechanical distillation. The use ofmechanical methods for vapor production and heattransfer can result in a highly efficient desalinationsystem. These systems operate at temperatures lessthan atmospheric boiling point and use a variety ofmethods to vaporize raw waters. These mechanicalprocesses commonly use multiple effects to maximizethe efficiency of the applied mechanical energy.
a. Vapor compression. The technique of vaporcompression uses a mechanical energy source, such asan engine of electric motor, to power a compressionturbine. This turbine draws vapor from the distillationvessel and compresses it, which raises the temperatureof the exhaust vapor. The vapor is then passed over aheat exchanging condenser, where it returns to theliquid state as product water. The heat removed duringcondensation is returned to the raw water to assist in theproduction of more vapor. The more recent vapor-compression multiple-effect units produce aconcentrated brine byproduct that has had its excessheat reduced by the multiple effects.
b. Waste heat. Adding waste heat to vaporcompression systems results in a highly efficient
6-1
TM 5-813-8
Figure 6-1. Three methods of vaporization.
6-2
TM 5-813-8
Figure 6-2. Multiple-effect vertical-tube evaporation process.
6-3
TM 5-813-8
Figure 6-3. Multistage flash distillation facility.
6-4
TM 5-813-8
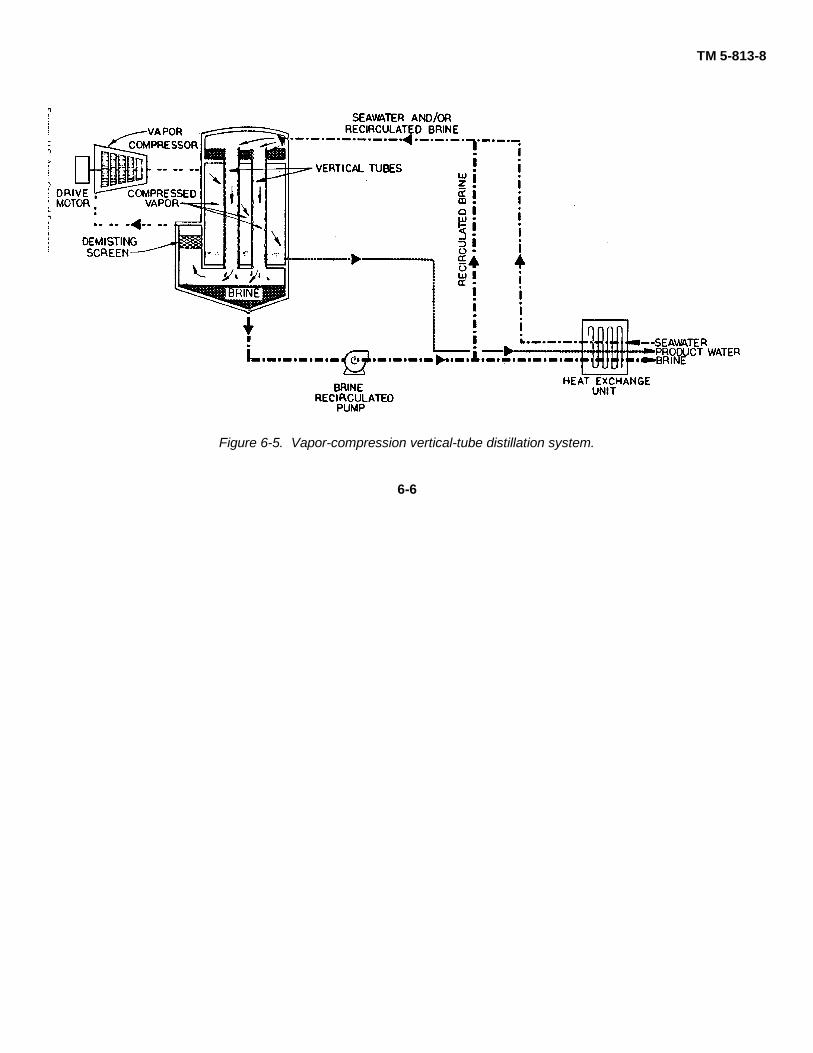
distillation/condensation process. These systems aredesigned to maximize the production of product waterwith minimal energy input. A typical vapor-compressionmultiple-effect system is shown in figure 6-5.
The advantages of this type of system include a lowerenergy demand than high-temperature distillation, lesscorrosion due to possible use of thermoplastic materials,and lower operational temperatures.
Figure 6-4. Waste heat recovery evaporation process.
6-5
TM 5-813-8
Figure 6-5. Vapor-compression vertical-tube distillation system.
6-6
TM 5-813-8
6-5. Thermal discharge. A problem resulting fromall distillation/condensation facilities is thermaldischarge of liquids. Older high temperature facilitiesproduce brine at very high temperatures. Coolingtowers, heat exchangers, or similar equipment must bedesigned into the process to handle the thermaldischarge from distillation/condensation facilities. Moresophisticated desalination units employ a system of heatexchange devices that use the raw feed water to coolthe brine and reclaim this waste heat to help providethermal energy for system operation.
6-6. Design analysis. When it is necessary toreview several water distillation/condensation designs,standard dimensionless analysis will be used for designcomparison. If dimensionless correlations for particularaspects of design do not exist, a bench- or pilot-scalestudy should be done.
6-7. Materials of construction . The corrosivenature of high-temperature brines, acid pretreatments,and chemical scaling can cause plant failure. Presently,the only acceptable construction materials for wettedsurfaces in high-temperature systems are an austeniticstainless steel, such as AISI Type 316L of titanium.Anodized aluminum and many thermoplastic materialsare acceptable for use in low-temperature systems.
6-8. Distillation/condensation system design .Pursuant to finalized site and process selection, onedistillation/condensation system will usually be chosen.When the process selection does not yield a singleprocess, then designs must be prepared for more thanone process.
a. Identification of work. When the base site hasbeen selected and a schedule for construction has beenprepared, this information will be made available to thewater treatment engineer. The identification of thelocation and the time schedule will be considered in thedesign; this includes the date the system must be online.The minimum number and minimum size of themodules will be determined. Any restrictions thatstorage will place on maximum allowable downtime willalso be determined. With distillation/ condensationsystems, the design must address the maximumallowable total dissolved solids and, where applicable,the minimum allowable rejection of distillable material.Distillable material is defined as nonaqueous, volatilewater contaminants.
b. Existing or planned facilities. Distillation/condensation systems design must include availabilityof energy information. See sample problem A-8.Alternative steam sources considered in the design mustinclude steam temperature, steam pressure, andavailable quantity of steam. The design must showavailable electrical power including voltage, amperage,phase of the available electricity, and frequency of theavailable electrical power.
c. Raw water information. One of twocircumstances will limit the quantity of raw waterconsumed. Both of these limitations must beconsidered in the design:
-The availability of raw water may place alimitation on the raw water used in theprocess.
-The maximum amount of waste brine thatcan be economically disposed of maylimit the raw water used in the process.
The principle requirement in a desalination design is anaccurate projection of the chemical makeup of the worstquality water that will be used as raw feed water at thesite being investigated. The design must includeconsideration of the maximum total dissolved solids,individual ions (see App. B), maximum amount of totalsuspended soiled present in the feed water, maximumorganic contaminant loading, and any gas or potentialcorrosive agent that may be in the feed water. Allknown or anticipated future qualities of the feed watershall be considered in the design.
d. Process design. When adistillation/condensation process has been identified asthe most economical, then the design will be limited tothe single process. The process design for anydistillation/condensation process will include a minimumrequired input temperature and some maximumrequired heat sink temperature. Between these twotemperature criteria, the process must be capable ofproducing the required product water quality andquantity. When a particular metallurgy is required forstrategic, corrosion design, or economic reasons, thismetallurgy shall be designated for all applicable parts,as well as spare parts. All required instrumentationmust be included in the design. The design must showthe required output water quality based on the worst rawwater input chemistry and quality. The system designmust be based on equipment with a history of successfulwater treatment system experience. The requiredexperience history should include a minimum of 2 yearsof operating experience meeting water quality andsystem design
6-7

TM 5-813-8
goals, treatment capacity, maximum allowable repairfrequency and duration, and a maximum allowable ratioof experienced capital cost to repair cost.
The requirement for successful experience will limit theamount of untested innovation used at a facility.
6-8
TM 5-813-8
CHAPTER 7
MEMBRANE TECHNIQUES
7-1. Electrodialysis. The ions in a water solutioncan be made to migrate by applying an electric field tothe solution. By arranging various barriers to the flow ofions, it is possible to directly desalinate water withelectricity. Such barriers are called ion-exchangemembranes. Membranes that allow a reasonable flowof cations, but block or reduce the flow of anions, arecalled cationic-exchange membranes. Membranes thatallow a reasonable flow of anions, but block or reducethe flow of cations, are called anion-exchangemembranes. Membranes that pass both anions andcations are called neutral membranes.
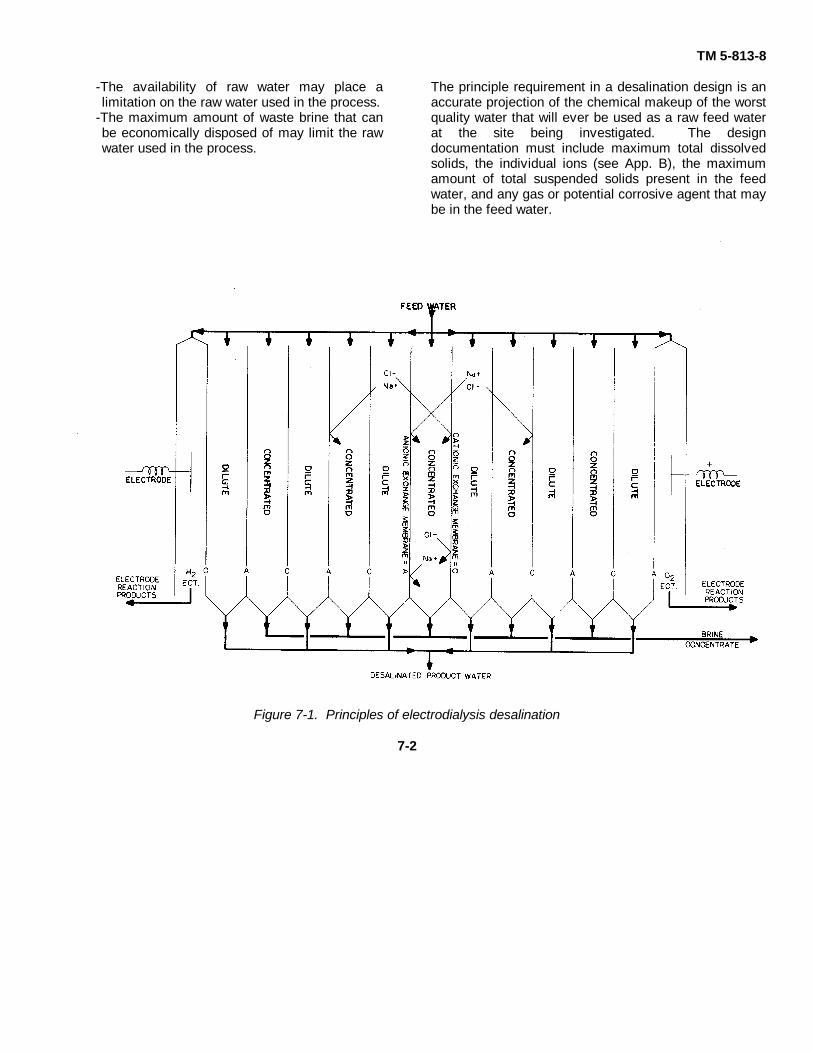
a. Theory. In solutions containing dissolved ions,electric currents are carried by movement of the ions.Positive ions migrate in the direction of the current flow,and negative ions migrate against the current direction.When the anions are blocked by a cationic-exchangemembrane, they stop and form a localized charge at themembrane face. This accumulated negative charge isneutralized by the flow of cations across the cationicmembrane. This generates a concentrated solution onthe side of a cationic-exchange membrane that facesthe negative electrode. It also generates a dilutesolution on the side of the cationic membrane that facesthe positive electrode as shown in figure 7-1.
b. Electrodialysis stack. If both a cationic andanionic membrane are placed across a current flow inan electrolyte solution, the side of the cationicmembrane facing the positive electrode and the side ofthe anionic membrane facing the negative electrode willbecome less saline. If the cationic membrane is closerto the negative electrode and the anionic membrane iscloser to the positive electrode, the solution between themembranes will become less saline as the ions migratein their respective directions. Any number of pairs ofcationic and anionic membranes can be placed across acurrent-carrying solution, such that the cationicmembrane is closest to the negative electrode, and thesolution between will be diluted (fig. 7-1). A battery ofseveral such membrane pairs is called an electrodialysisstack. Several variations of the standard electrodialysisstack have been developed, but none have been provensuperior to this standard stack of alternating cationic-and anionic-exchange membranes to desalinate naturalbrackish water.
c. Electrodialysis reversal. One importantimprovement now used in electrodialysis installations isto reverse the polarity periodically and move the ions inthe opposite direction. This returns anions across theanionic membranes and helps break up scale formed onthe concentrating face of the membranes. Water willflow osmotically across both membranes from the diluteproduct stream to the concentrated brine stream in anelectrodialysis-reversal stack. This osmotic productwater loss concentrates uncharged material, such asturbidity and bacteria. This concentration effect must beconsidered during the design to ensure meeting waterturbidity and product water bacterial count requirements.Most electrodialysis membranes are not tolerant ofchlorine. When possible, water desalinated byelectrodialysis reversal should be disinfected afterdesalination is completed. The membranes should beprotected by a 10-micron cartridge filter.
7-2. Electrodialysis-reversal design. Whenelectrodialysis reversal can be shown to be the mosteconomical process for desalination, then only anelectrodialysis-reversal system will be designed. Whenthe process selection does not yield a specific process,then designs must be prepared for more than oneprocess.
a. Identification of work. The design engineer willbe made aware of the base site and constructionschedule. The location and time schedule will beconsidered in the design; this includes the date thesystem must be online. The minimum number andminimum capacity of the modules will be determined.Any restrictions that storage will place on maximumallowable downtime will also be considered. Amaximum allowable output conductivity in the productwater will be determined, based on the worst possiblefeed water.
b. Existing on planned facilities. Whenelectrodialysis reversal is being designed, it is essentialto determine the types of available electrical power.The voltage, phase, frequency, and available amperageof all electrical power sources, planned or existing, mustbe considered in the design.
c. Raw water information. One of twocircumstances will limit the quantity of raw waterconsumed. Both of these limitations must beconsidered in the design:
7-1
TM 5-813-8
-The availability of raw water may place alimitation on the raw water used in the process.
-The maximum amount of waste brine that canbe economically disposed of may limit the rawwater used in the process.
The principle requirement in a desalination design is anaccurate projection of the chemical makeup of the worstquality water that will ever be used as a raw feed waterat the site being investigated. The designdocumentation must include maximum total dissolvedsolids, the individual ions (see App. B), the maximumamount of total suspended solids present in the feedwater, and any gas or potential corrosive agent that maybe in the feed water.
Figure 7-1. Principles of electrodialysis desalination
7-2
TM 5-813-8
d. Process specifications. When an electro-dialysis-reversal process has been identified as mosteconomical, the design will be limited to the singleprocess. The process design for any electrodialysis-reversal process will include a minimum/maximumallowed product water conductivity. The design mustshow the required product conductivity that must beobtainable at the required product flow, based on theworst conductivity raw water. A 10-micron cartridgefilter to be placed before the membranes must beincluded in the design. When a particular metallurgy ormaterial is required for strategic, corrosion design, orprocess economic reasons, this metallurgy or materialwill be designated for all applicable parts and spareparts and equipment. All required instrumentation,including a voltmeter and an ammeter, for eachelectrodialysis-reversal stack must be designed. Thesystem design must be based on equipment with ahistory of water treatment system experience. Therequired experience history should include a minimumof 2 years of operating experience meeting water qualityand system design goals, current operating capacity,maximum allowable repair frequency and duration, andmaximum allowable ratio of experienced capital cost torepair cost. The requirement for successful experiencewill limit the amount of untested innovation used at afacility.
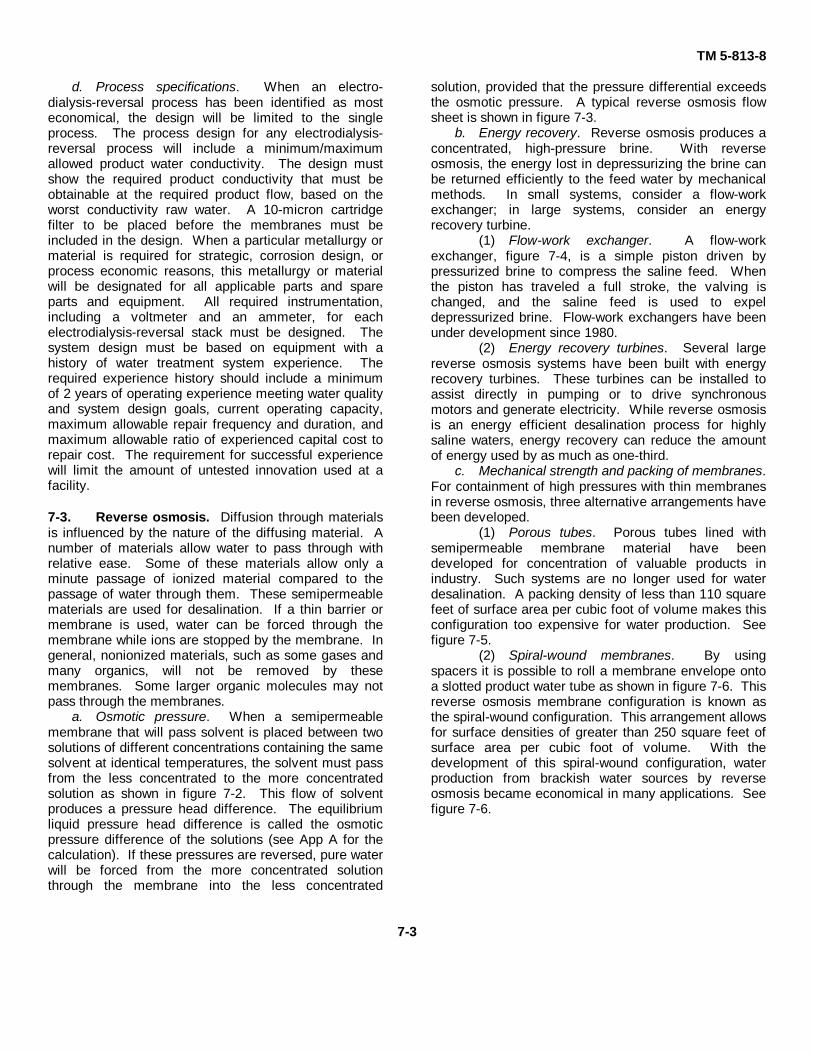
7-3. Reverse osmosis. Diffusion through materialsis influenced by the nature of the diffusing material. Anumber of materials allow water to pass through withrelative ease. Some of these materials allow only aminute passage of ionized material compared to thepassage of water through them. These semipermeablematerials are used for desalination. If a thin barrier ormembrane is used, water can be forced through themembrane while ions are stopped by the membrane. Ingeneral, nonionized materials, such as some gases andmany organics, will not be removed by thesemembranes. Some larger organic molecules may notpass through the membranes.
a. Osmotic pressure. When a semipermeablemembrane that will pass solvent is placed between twosolutions of different concentrations containing the samesolvent at identical temperatures, the solvent must passfrom the less concentrated to the more concentratedsolution as shown in figure 7-2. This flow of solventproduces a pressure head difference. The equilibriumliquid pressure head difference is called the osmoticpressure difference of the solutions (see App A for thecalculation). If these pressures are reversed, pure waterwill be forced from the more concentrated solutionthrough the membrane into the less concentrated
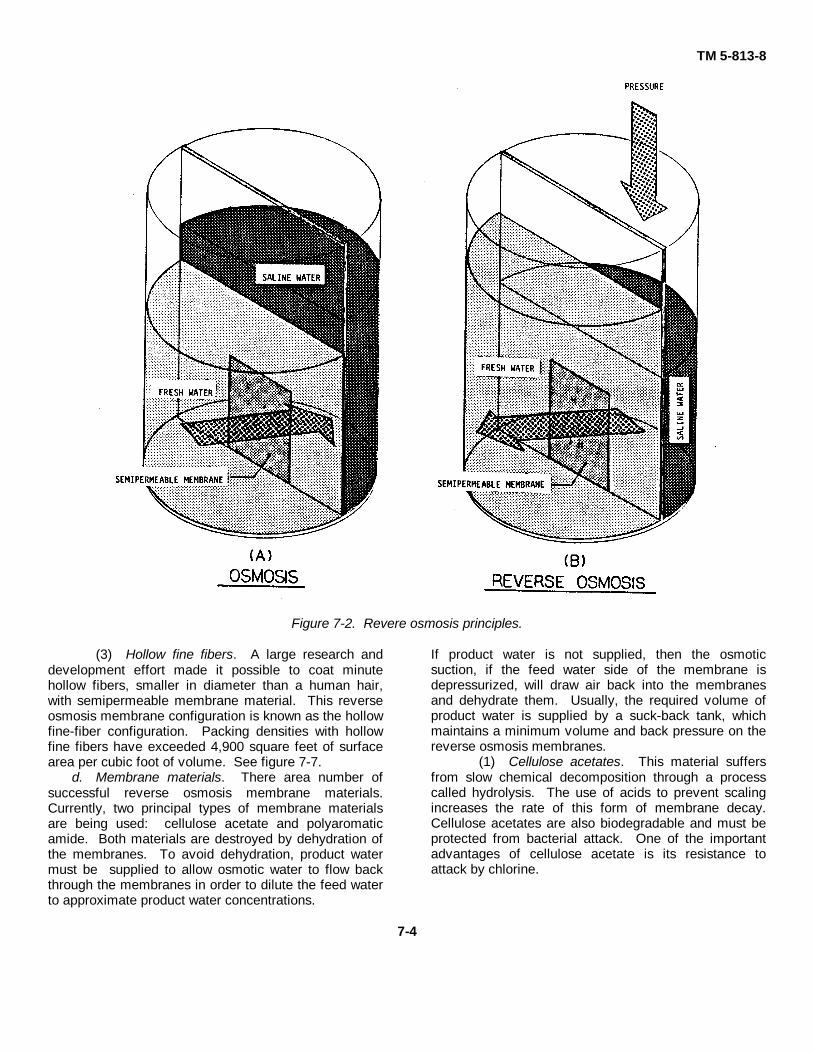
solution, provided that the pressure differential exceedsthe osmotic pressure. A typical reverse osmosis flowsheet is shown in figure 7-3.
b. Energy recovery. Reverse osmosis produces aconcentrated, high-pressure brine. With reverseosmosis, the energy lost in depressurizing the brine canbe returned efficiently to the feed water by mechanicalmethods. In small systems, consider a flow-workexchanger; in large systems, consider an energyrecovery turbine.
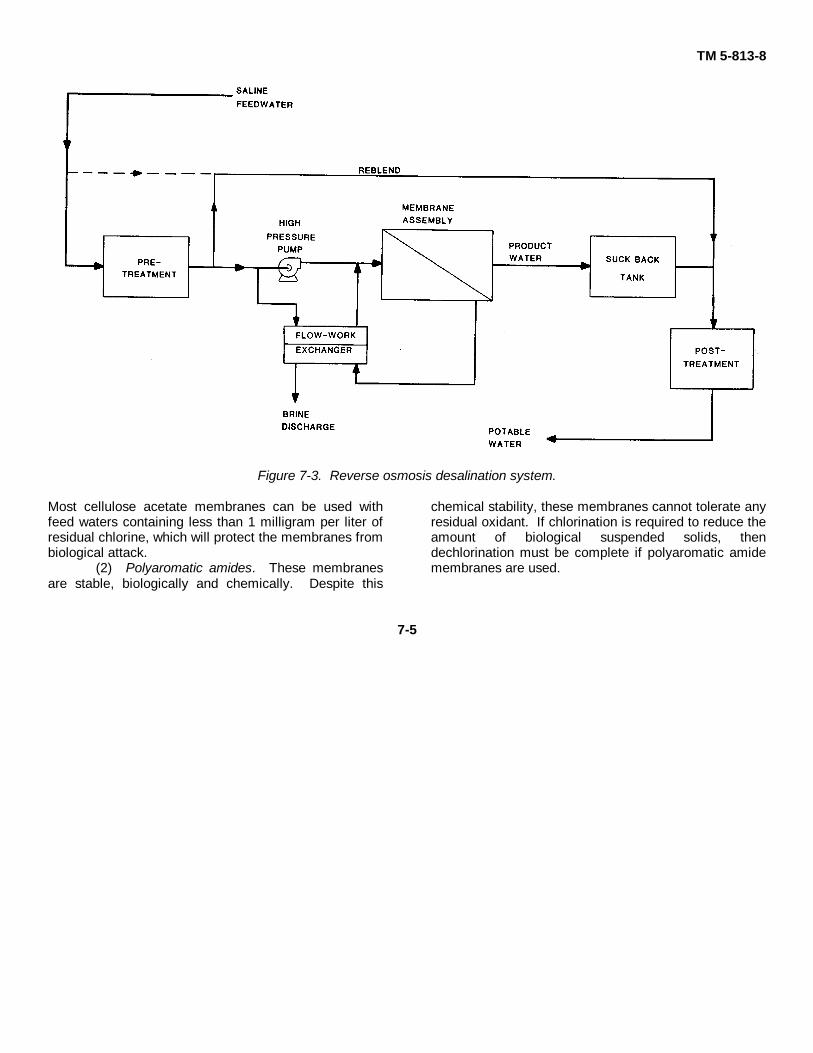
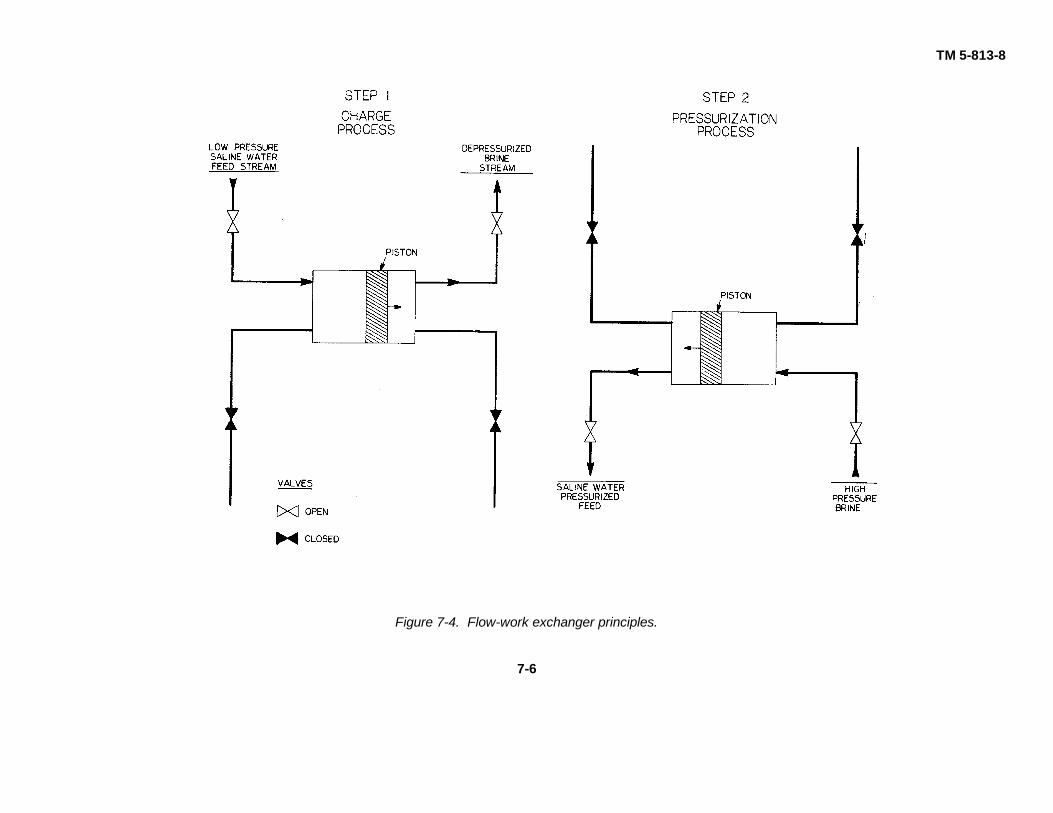
(1) Flow-work exchanger. A flow-workexchanger, figure 7-4, is a simple piston driven bypressurized brine to compress the saline feed. Whenthe piston has traveled a full stroke, the valving ischanged, and the saline feed is used to expeldepressurized brine. Flow-work exchangers have beenunder development since 1980.
(2) Energy recovery turbines. Several largereverse osmosis systems have been built with energyrecovery turbines. These turbines can be installed toassist directly in pumping or to drive synchronousmotors and generate electricity. While reverse osmosisis an energy efficient desalination process for highlysaline waters, energy recovery can reduce the amountof energy used by as much as one-third.
c. Mechanical strength and packing of membranes.For containment of high pressures with thin membranesin reverse osmosis, three alternative arrangements havebeen developed.
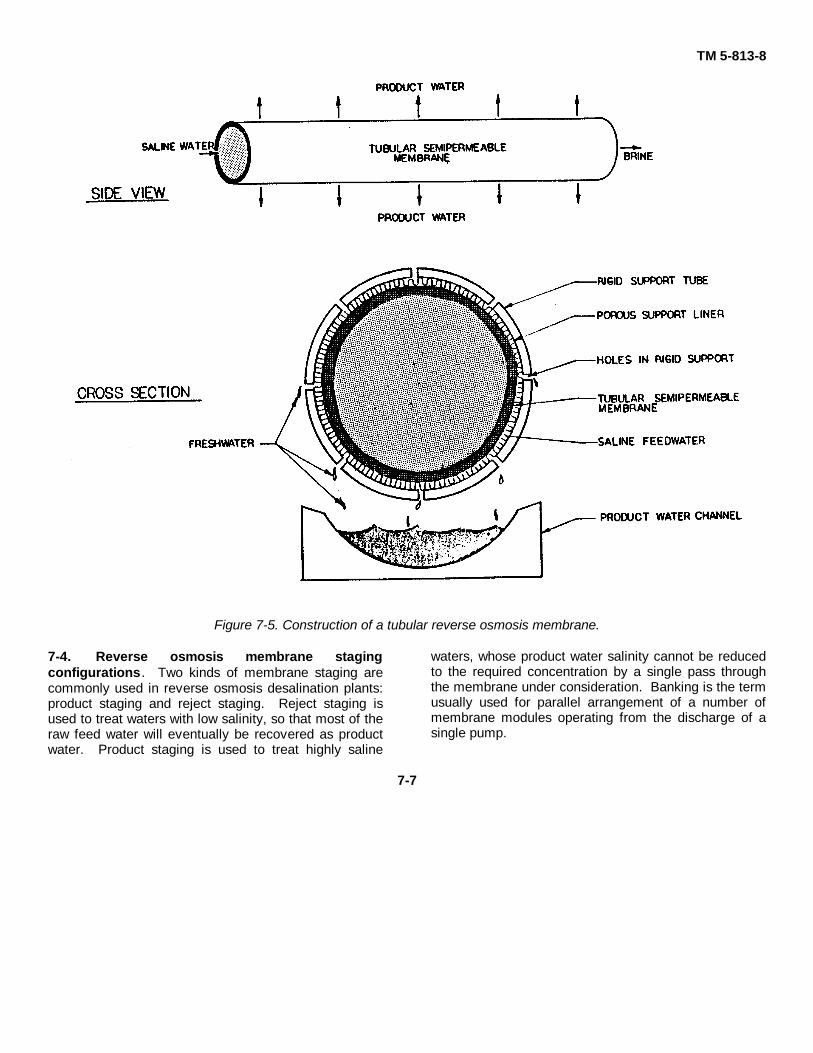
(1) Porous tubes. Porous tubes lined withsemipermeable membrane material have beendeveloped for concentration of valuable products inindustry. Such systems are no longer used for waterdesalination. A packing density of less than 110 squarefeet of surface area per cubic foot of volume makes thisconfiguration too expensive for water production. Seefigure 7-5.
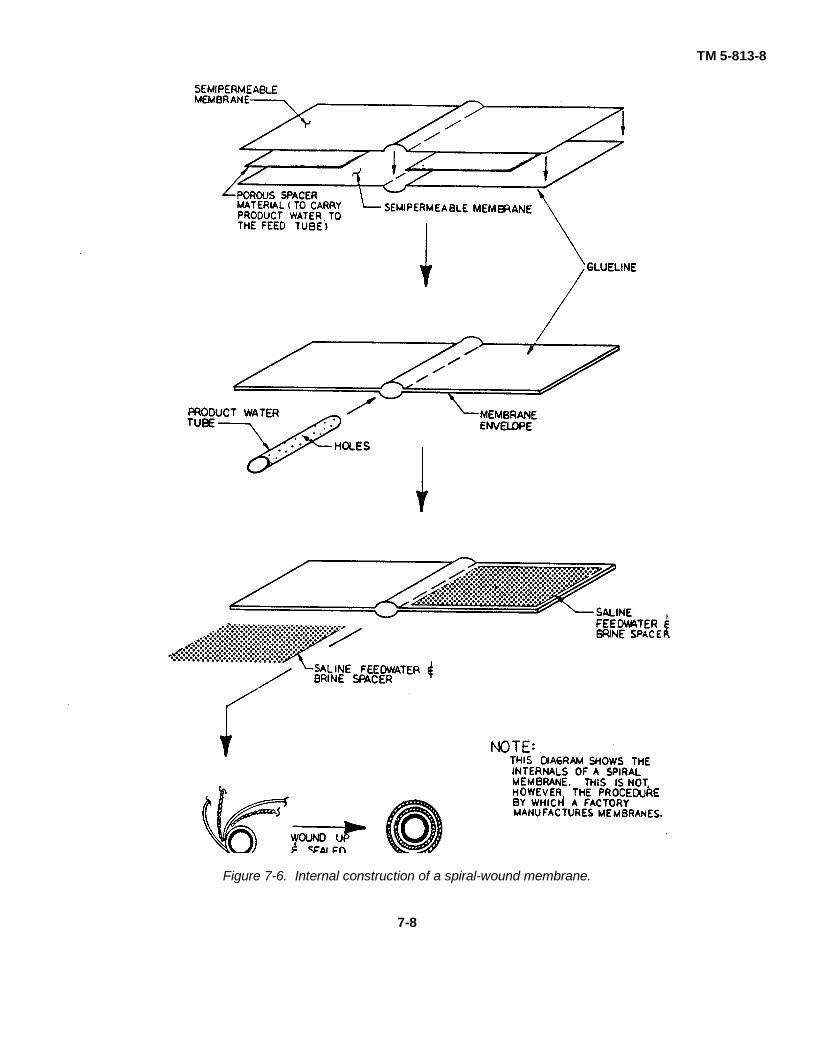
(2) Spiral-wound membranes. By usingspacers it is possible to roll a membrane envelope ontoa slotted product water tube as shown in figure 7-6. Thisreverse osmosis membrane configuration is known asthe spiral-wound configuration. This arrangement allowsfor surface densities of greater than 250 square feet ofsurface area per cubic foot of volume. With thedevelopment of this spiral-wound configuration, waterproduction from brackish water sources by reverseosmosis became economical in many applications. Seefigure 7-6.
7-3
TM 5-813-8
Figure 7-2. Revere osmosis principles.
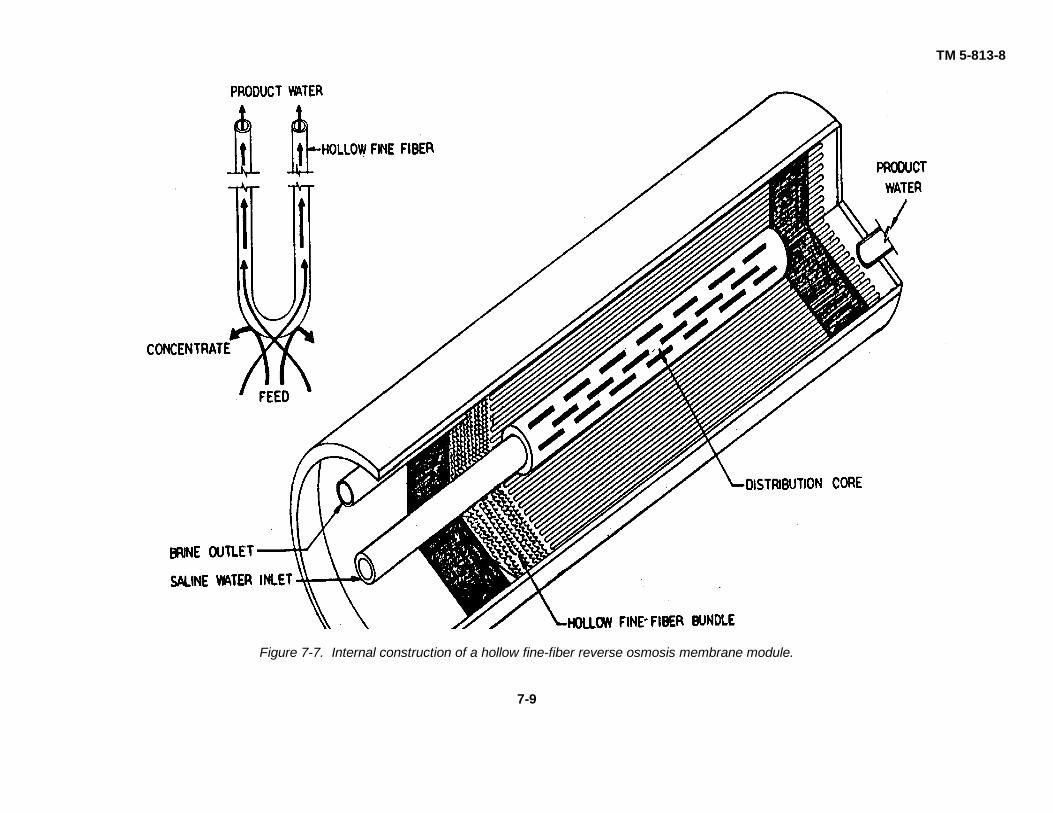
(3) Hollow fine fibers. A large research anddevelopment effort made it possible to coat minutehollow fibers, smaller in diameter than a human hair,with semipermeable membrane material. This reverseosmosis membrane configuration is known as the hollowfine-fiber configuration. Packing densities with hollowfine fibers have exceeded 4,900 square feet of surfacearea per cubic foot of volume. See figure 7-7.
d. Membrane materials. There area number ofsuccessful reverse osmosis membrane materials.Currently, two principal types of membrane materialsare being used: cellulose acetate and polyaromaticamide. Both materials are destroyed by dehydration ofthe membranes. To avoid dehydration, product watermust be supplied to allow osmotic water to flow backthrough the membranes in order to dilute the feed waterto approximate product water concentrations.
If product water is not supplied, then the osmoticsuction, if the feed water side of the membrane isdepressurized, will draw air back into the membranesand dehydrate them. Usually, the required volume ofproduct water is supplied by a suck-back tank, whichmaintains a minimum volume and back pressure on thereverse osmosis membranes.
(1) Cellulose acetates. This material suffersfrom slow chemical decomposition through a processcalled hydrolysis. The use of acids to prevent scalingincreases the rate of this form of membrane decay.Cellulose acetates are also biodegradable and must beprotected from bacterial attack. One of the importantadvantages of cellulose acetate is its resistance toattack by chlorine.
7-4
TM 5-813-8
Figure 7-3. Reverse osmosis desalination system.
Most cellulose acetate membranes can be used withfeed waters containing less than 1 milligram per liter ofresidual chlorine, which will protect the membranes frombiological attack.
(2) Polyaromatic amides. These membranesare stable, biologically and chemically. Despite this
chemical stability, these membranes cannot tolerate anyresidual oxidant. If chlorination is required to reduce theamount of biological suspended solids, thendechlorination must be complete if polyaromatic amidemembranes are used.
7-5
TM 5-813-8
Figure 7-4. Flow-work exchanger principles.
7-6
TM 5-813-8
Figure 7-5. Construction of a tubular reverse osmosis membrane.
7-4. Reverse osmosis membrane stagingconfigurations . Two kinds of membrane staging arecommonly used in reverse osmosis desalination plants:product staging and reject staging. Reject staging isused to treat waters with low salinity, so that most of theraw feed water will eventually be recovered as productwater. Product staging is used to treat highly saline
waters, whose product water salinity cannot be reducedto the required concentration by a single pass throughthe membrane under consideration. Banking is the termusually used for parallel arrangement of a number ofmembrane modules operating from the discharge of asingle pump.
7-7
TM 5-813-8
Figure 7-6. Internal construction of a spiral-wound membrane.
7-8
TM 5-813-8
Figure 7-7. Internal construction of a hollow fine-fiber reverse osmosis membrane module.
7-9
TM 5-813-8
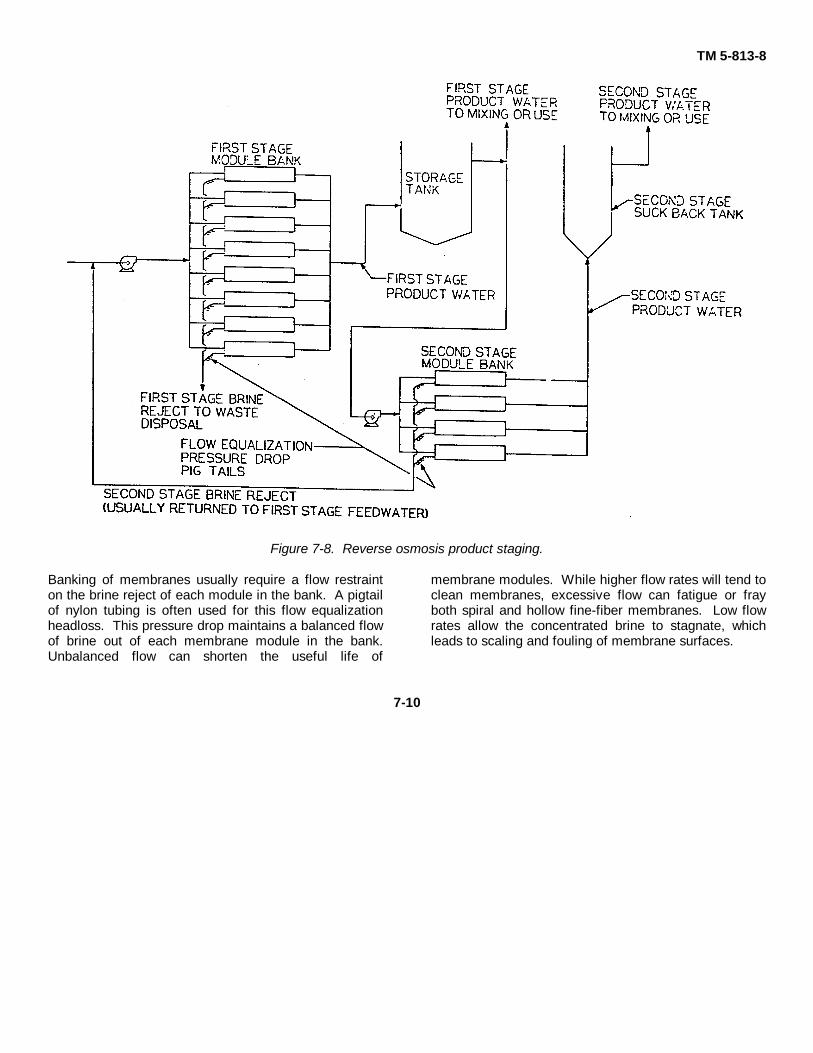
Figure 7-8. Reverse osmosis product staging.
Banking of membranes usually require a flow restrainton the brine reject of each module in the bank. A pigtailof nylon tubing is often used for this flow equalizationheadloss. This pressure drop maintains a balanced flowof brine out of each membrane module in the bank.Unbalanced flow can shorten the useful life of
membrane modules. While higher flow rates will tend toclean membranes, excessive flow can fatigue or frayboth spiral and hollow fine-fiber membranes. Low flowrates allow the concentrated brine to stagnate, whichleads to scaling and fouling of membrane surfaces.
7-10
TM 5-813-8
a. Product staging. Product staging is true seriesoperation of two or more reverse osmosis membranesystems, as shown in figure 7-8. Product staging isused when a single pass through one reverse osmosismembrane does not bring a constituent concentrationdown to specification. The second stage alwaysrequires its own pressurizing pump, taking suction fromthe suck-back or storage tank of the first stage reverseosmosis system. When the water produced from thesecond stage is significantly lower in dissolvedconstituents than required, the product water from thefirst stage may be blended with the second stageproduct to produce the desired water quality. Whenpotable water and other waters with lower dissolvedsolids content are required, a product staging systemcan be used to supply the desired quality or qualitiesbetween that of the first and second stage product. Lifecycle costing should be used to evaluate dual- andtriple-distribution systems where product staging isrequired.
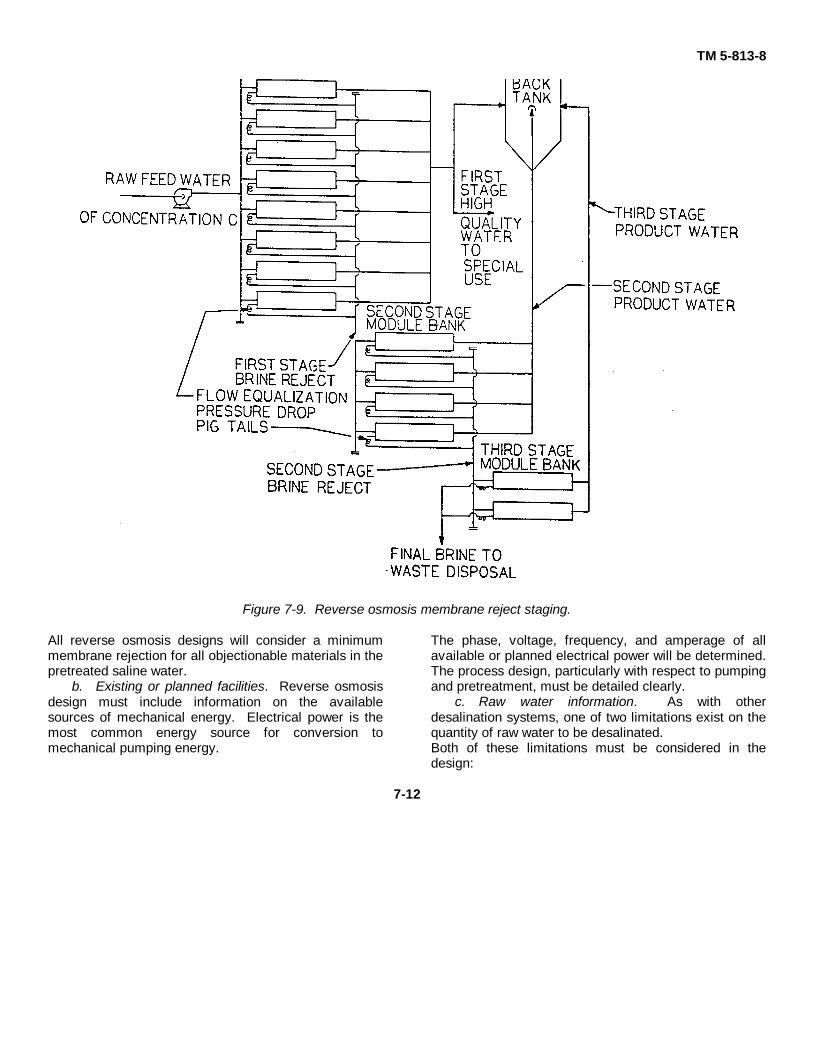
b. Reject staging. Reject staging, figure 7-9, isused when the low salinity of the raw water permits ahigh water-recovery ratio. Most membrane modulemanufacturers have a minimum allowable brine rejectflow for any given membrane of their manufacture. Themanufacturer's recommended maximum feed water flowrate and minimum recommended brine reject flow canbe used to calculate a maximum recommended singlestage recovery fraction by use of the following equation:
F - B =RF
Where:F = Maximum recommended feed flow per
moduleB = Minimum recommended brine reject flow
per moduleR = Maximum recommended recovery rate
This maximum single stage water recovery is onemeans of evaluating a membrane module beingconsidered for low salinity reverse osmosis desalination.When the reject stream is still diluted enough for furtherconcentration after the maximum recommendedrecovery ratio is reached, the brine can be piped directlyinto another membrane module for further waterrecovery. This is accomplished by combining the brineflow from a number of first stage modules onto a fewernumber of secondary membrane modules. It isoccasionally possible to further concentrate the brine ona third reject stage as shown in figure 7-9.
The design of reject staging, in order to balance theutilization of the membrane modules for optimumeconomical life cycle cost, is a complex activity to beperformed by the membrane manufacturer orOperations Engineering Manufacturer.
c. Combined product and reject staging. In thedesalination of highly saline waters such as seawater,product and reject staging can be effectively combined.The second stage of a product staged system can bedesigned as a reject staged subsystem. Any of threefactors may limit reverse osmosis water recovery:osmotic pressure; sparingly soluble salts; or turbidity.Water from a primary reverse osmosis treatment systemwill have three properties pertaining to these limitations:
-A lower osmotic pressure than the rawfeed water.
-A disaproportionately reduced concentra-tion of divalent ions.
-No turbidity.These qualities of primary reverse osmosis productwater can allow for greater water recovery from asecondary product staged reverse osmosis subsystemthan is allowed by the manufacturer's maximumrecommended recovery rate. When the water recoveryof the second stage of a product staged system can beincreased by reject staging, the secondary stage shallbe reject staged. When the brine from the secondarystage of a product staged system is less concentratedthan the primary stage feed water by more than 1,000milligrams of total dissolved solids per liter, the use ofdedicated desalination of this lower concentration watershall be life cycle costed. This life cycle cost fordedicated secondary stage brine desalination shall becompared with the life cycle cost of blending thesecondary stage brine into the primary stage feed water.
7-5. Reverse osmosis system design . Whenprocess selection does not yield a specific membrane oreven a particular process, then designs must beprepared for more than one process.
a. Identification of work. When a schedule and abase site have been selected, this information will bemade available to the design engineer. Theidentification of the location and the time schedule willbe considered in the design; this includes the date thesystem must be online. The minimum number ofindependently operable membrane banks and theminimum capacity of the banks must be determined.Any restrictions that storage will place on maximumallowable downtime will also be determined.
7-11
TM 5-813-8
Figure 7-9. Reverse osmosis membrane reject staging.
All reverse osmosis designs will consider a minimummembrane rejection for all objectionable materials in thepretreated saline water.
b. Existing or planned facilities. Reverse osmosisdesign must include information on the availablesources of mechanical energy. Electrical power is themost common energy source for conversion tomechanical pumping energy.
The phase, voltage, frequency, and amperage of allavailable or planned electrical power will be determined.The process design, particularly with respect to pumpingand pretreatment, must be detailed clearly.
c. Raw water information. As with otherdesalination systems, one of two limitations exist on thequantity of raw water to be desalinated.Both of these limitations must be considered in thedesign:
7-12
TM 5-813-8
-The maximum amount of waste brine thatcan be economically disposed of mayplace a limitation on the raw water used inthe process.
-Availability of the raw water may limit theraw water used in the process.
The principle requirement in a reverse osmosis design isan accurate projection of the chemical, biological, andphysical makeup of the poorest quality water that willever be used as raw feed water at the site beinginvestigated. The design documentation must includethe following:
-Maximum total dissolved solids.-Maximum concentration of every ion thatcould precipitate or influence the activitycoefficient of a precipitation reaction.(See App. B.)
-Maximum concentration of each ion thatmust be controlled in the product water.
-Concentration of both molybdate reactiveand molybdate nonreactive silica.
-Maximum allowable concentration ofnonionizable material.
-An oil and grease analysis to levels below10 milligrams per liter.
-Any gas or potential corrosive agent thatmay be in the feed water.
d. Process design. When a particular membranehas been identified as the most economic, the designwill be limited to the one membrane type. The processdesign for any reverse osmosis process will considerraw water quality and the required final product waterquality.
A suitable tank to meet suck-back requirements will bedesigned for all membranes that could be damaged bydehydration. The system design must be based onequipment with a history of successful water treatmentexperience. The required experience should include aminimum of 2 years of experience, treatment capacity,repair frequency and duration, and a ratio of repair costto capital cost. The requirement for successfulexperience will limit the amount of untested innovationused at a facility. When a particular metallurgy ormaterial is required for strategic, corrosion design, orprocess economic reasons, this metallurgy will beincluded for all applicable parts and spare parts andequipment.
7-6. Materials of construction.Ferric ions will cause severe problems in membranesystems. For this reason, never permit carbon steel tobe in contact with the feed water being supplied to amembrane desalination plant. Use nylon or otherplastics capable of maintaining the desired pressureswhenever possible. Use 316L stainless steel for pumpimpellers and other feed-water-contact metal surfaces ifhexametaphosphate is used for scale control. If noscale inhibition is necessary, use bronze for pumpimpellers.
7-13
TM 5-813-8
CHAPTER 8ION EXCHANGE
8-1. General. Some naturally occurring andsynthetic materials can exchange one type of ion foranother dissolved ion of like charge, e.g., one positiveion for another positive ion. The number of charges onthe ions removed from solution must equal the numberof charges on the ions exchanged from the material.The major types of synthetic ion-exchange resins thathave been developed are as follows: strong acid cationresins, weak acid cation resins, strong base anionresins, and weak base anion resins. Strong acid andweak acid cation resins exchange hydrogen ions (H+)for other cations. Strong acid cation resins may alsoexchange monovalent sodium ions (Na+) for suchdivalent cations as calcium (Ca+ +) and magnesium(Mg+ +). Strong base anion resins exchange hydroxyl(OH-) or bicarbonate (HCO3) ions for other anions.Weak base anion resins adsorb acidic ionic materials,such as hydrochloric acid, sulfuric acid, and carbonicacid from solutions. Once adsorbed on the weak baseanion resin, the anion part of the acid may beexchanged for other anions. These exchanges occurduring the service cycle when treated water is produced.When the capacities of resins have been used up orexhausted, they are regenerated with acid or base orsalt to restore the resin to the original ionic state.Illustrations of the strong acid cation resin hydrogen ion-cation exchange and the strong base anion hydroxyl ion-anion exchange that occur in the completedemineralization of water are shown in figure 8-1.8-2. Pretreatment. Ion exchange can be used as apretreatment method in the desalination process toreduce the levels of sparingly soluble salts. A strongacid cation resin in the sodium form and a weak acidcation resin in the hydrogen form can be used. In bothprocesses the levels of alkaline earth metal cations,such as calcium (Ca+ +) and magnesium (MG+ + ), arereduced. The use of the strong acid cation resin in thesodium form is called water softening, and the use ofthe weak acid cation resin in the hydrogen form inconjunction with a carbon dioxide degasifier is calleddealkalization-softening.
a. Softening. Water softening by sodium ionexchange can be used as a pretreatment method in adesalination process. During water softening,monovalent sodium ions on the strong acid cation resinare exchanged for the divalent calcium and magnesiumin the water.
Although not desalination, the exchange of sodium ionsfor divalent cations produces a change in the type ofsalinity. This change in the salinity reduces the levels ofthe calcium and magnesium ions, such that theconcentration of other ions in the reject or blowdownstream can be increased in the desalination process witha resultant increase in water recovery. Saturation ofscale-forming materials, such as calcium carbonate,calcium sulfate, and magnesium hydroxide, is stillreached, but the total concentration of salts in the rejectattains a higher overall level than would be possiblewithout softening.
b. Dealkalization-softening. Desalinationprocesses can best utilize dealkalization-softening as apretreatment method when the raw water contains highlevels of alkalinity, bicarbonate and carbonate ions, andhigh levels of hardness, calcium and magnesium ions.A properly operated pretreatment that utilizes a weakacid cation resin will produce water with an alkalinitylevel of no more than 10 parts per million (as CaCO3)and a residual hardness approximately equal to theoriginal raw water non-carbonate hardness.
(1) Treatment process. The major benefit ofdealkalization-softening using carboxylic (weak acidcation) resins lies in the actual reduction of thedissolved solids content of the water. Hydrogen (H+)ions from the resin exchange with the divalent calciumand magnesium ions in the water. This exchangeoccurs only if the anions of weak acid salts, such asbicarbonate or carbonate ions, are present. Carbonicacid is formed when the hydrogen and bicarbonate ionsreact. The carbonic acid is weakly ionized and revertsto its basic constituents of carbon dioxide and water.The dissolved carbon dioxide can be removed by usingdegasification methods, as discussed in paragraph 5-3.The combination of the weak acid cation exchange withdegasification reduces both the calcium and magnesiumlevels as well as the alkalinity level in the raw water.
(2) Dealkalization-softening uses. Thispretreatment should be investigated when pHadjustment of the raw water by an acid addition isindicated for the desalination process. Weak acid resinsuse about 10-percent more acid than that required forpH adjustment alone and will reduce the calcium andmagnesium concentration as an additional advantage.
8-1
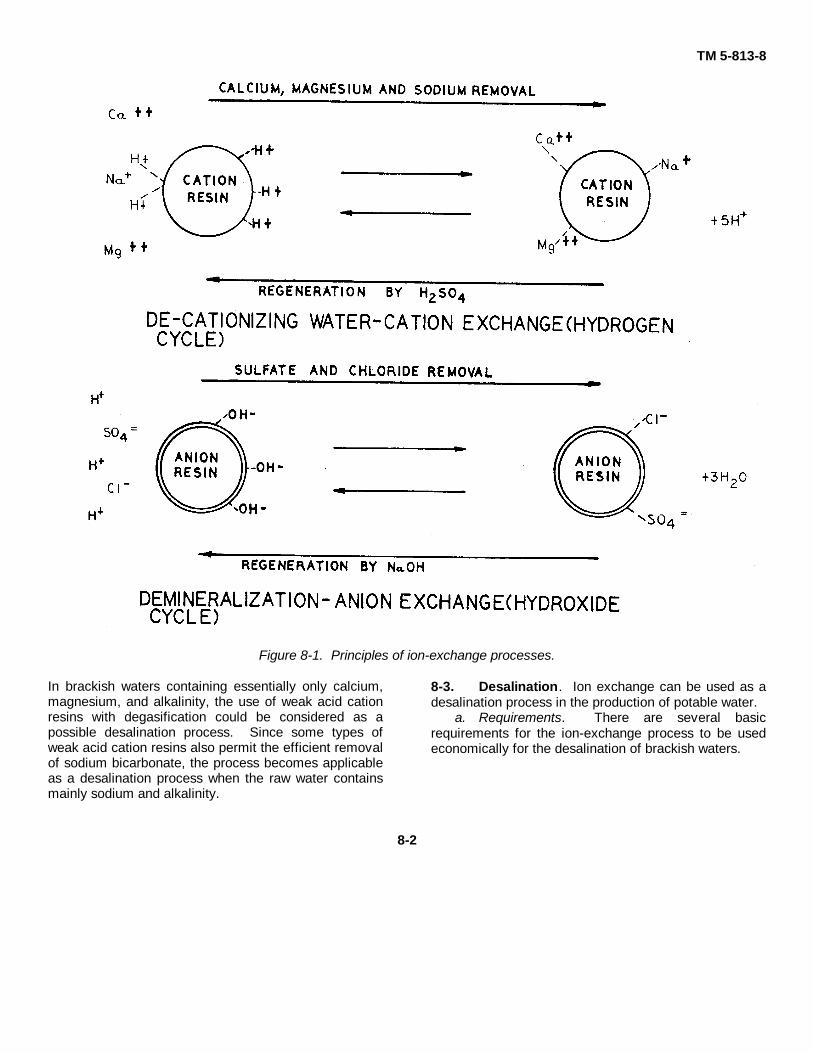
TM 5-813-8
Figure 8-1. Principles of ion-exchange processes.
In brackish waters containing essentially only calcium,magnesium, and alkalinity, the use of weak acid cationresins with degasification could be considered as apossible desalination process. Since some types ofweak acid cation resins also permit the efficient removalof sodium bicarbonate, the process becomes applicableas a desalination process when the raw water containsmainly sodium and alkalinity.
8-3. Desalination. Ion exchange can be used as adesalination process in the production of potable water.
a. Requirements. There are several basicrequirements for the ion-exchange process to be usedeconomically for the desalination of brackish waters.
8-2
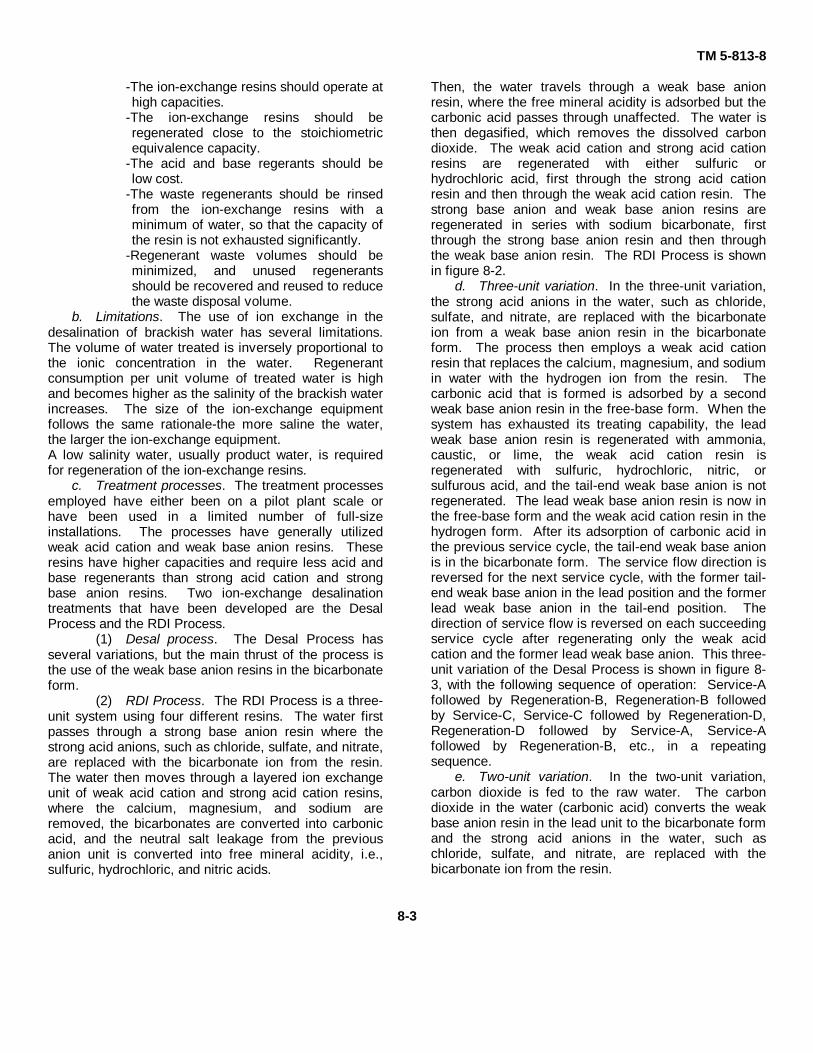
TM 5-813-8
-The ion-exchange resins should operate athigh capacities.
-The ion-exchange resins should beregenerated close to the stoichiometricequivalence capacity.
-The acid and base regerants should below cost.
-The waste regenerants should be rinsedfrom the ion-exchange resins with aminimum of water, so that the capacity ofthe resin is not exhausted significantly.
-Regenerant waste volumes should beminimized, and unused regenerantsshould be recovered and reused to reducethe waste disposal volume.
b. Limitations. The use of ion exchange in thedesalination of brackish water has several limitations.The volume of water treated is inversely proportional tothe ionic concentration in the water. Regenerantconsumption per unit volume of treated water is highand becomes higher as the salinity of the brackish waterincreases. The size of the ion-exchange equipmentfollows the same rationale-the more saline the water,the larger the ion-exchange equipment.A low salinity water, usually product water, is requiredfor regeneration of the ion-exchange resins.
c. Treatment processes. The treatment processesemployed have either been on a pilot plant scale orhave been used in a limited number of full-sizeinstallations. The processes have generally utilizedweak acid cation and weak base anion resins. Theseresins have higher capacities and require less acid andbase regenerants than strong acid cation and strongbase anion resins. Two ion-exchange desalinationtreatments that have been developed are the DesalProcess and the RDI Process.
(1) Desal process. The Desal Process hasseveral variations, but the main thrust of the process isthe use of the weak base anion resins in the bicarbonateform.
(2) RDI Process. The RDI Process is a three-unit system using four different resins. The water firstpasses through a strong base anion resin where thestrong acid anions, such as chloride, sulfate, and nitrate,are replaced with the bicarbonate ion from the resin.The water then moves through a layered ion exchangeunit of weak acid cation and strong acid cation resins,where the calcium, magnesium, and sodium areremoved, the bicarbonates are converted into carbonicacid, and the neutral salt leakage from the previousanion unit is converted into free mineral acidity, i.e.,sulfuric, hydrochloric, and nitric acids.
Then, the water travels through a weak base anionresin, where the free mineral acidity is adsorbed but thecarbonic acid passes through unaffected. The water isthen degasified, which removes the dissolved carbondioxide. The weak acid cation and strong acid cationresins are regenerated with either sulfuric orhydrochloric acid, first through the strong acid cationresin and then through the weak acid cation resin. Thestrong base anion and weak base anion resins areregenerated in series with sodium bicarbonate, firstthrough the strong base anion resin and then throughthe weak base anion resin. The RDI Process is shownin figure 8-2.
d. Three-unit variation. In the three-unit variation,the strong acid anions in the water, such as chloride,sulfate, and nitrate, are replaced with the bicarbonateion from a weak base anion resin in the bicarbonateform. The process then employs a weak acid cationresin that replaces the calcium, magnesium, and sodiumin water with the hydrogen ion from the resin. Thecarbonic acid that is formed is adsorbed by a secondweak base anion resin in the free-base form. When thesystem has exhausted its treating capability, the leadweak base anion resin is regenerated with ammonia,caustic, or lime, the weak acid cation resin isregenerated with sulfuric, hydrochloric, nitric, orsulfurous acid, and the tail-end weak base anion is notregenerated. The lead weak base anion resin is now inthe free-base form and the weak acid cation resin in thehydrogen form. After its adsorption of carbonic acid inthe previous service cycle, the tail-end weak base anionis in the bicarbonate form. The service flow direction isreversed for the next service cycle, with the former tail-end weak base anion in the lead position and the formerlead weak base anion in the tail-end position. Thedirection of service flow is reversed on each succeedingservice cycle after regenerating only the weak acidcation and the former lead weak base anion. This three-unit variation of the Desal Process is shown in figure 8-3, with the following sequence of operation: Service-Afollowed by Regeneration-B, Regeneration-B followedby Service-C, Service-C followed by Regeneration-D,Regeneration-D followed by Service-A, Service-Afollowed by Regeneration-B, etc., in a repeatingsequence.
e. Two-unit variation. In the two-unit variation,carbon dioxide is fed to the raw water. The carbondioxide in the water (carbonic acid) converts the weakbase anion resin in the lead unit to the bicarbonate formand the strong acid anions in the water, such aschloride, sulfate, and nitrate, are replaced with thebicarbonate ion from the resin.
8-3
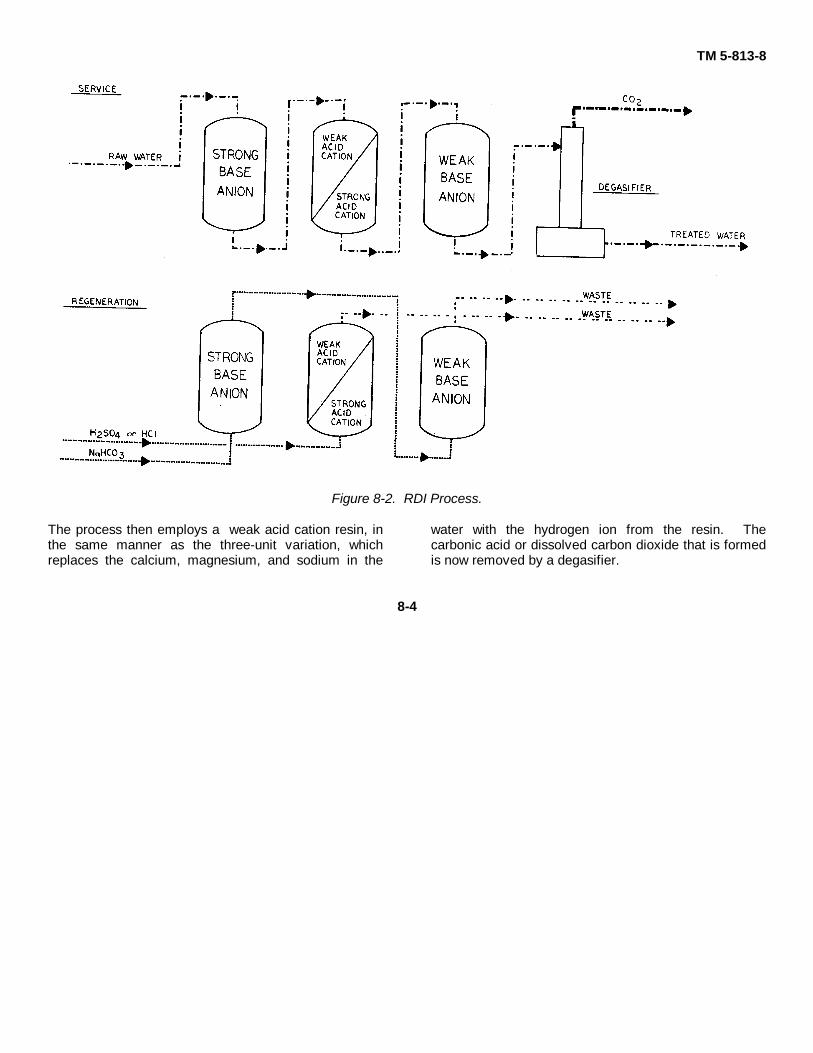
TM 5-813-8
Figure 8-2. RDI Process.
The process then employs a weak acid cation resin, inthe same manner as the three-unit variation, whichreplaces the calcium, magnesium, and sodium in the
water with the hydrogen ion from the resin. Thecarbonic acid or dissolved carbon dioxide that is formedis now removed by a degasifier.
8-4
TM 5-813-8
Ammonia, caustic, or lime can be used to regeneratethe weak base anion resin and sulfuric, hydrochloric,nitric, or sulfurous acid can be used to regenerate theweak acid cation resin. The two unit variation of theDesal Process is shown in figure 8-4.
8-4. Demineralization. No other demineralization ordesalination technique can, in a single pass, produce
water as pure as does ion exchange. In the productionof steam, it is sometimes necessary to use water with alower level of total dissolved solids. Ion exchangeshould be considered if water with less thanapproximately 300 milligrams per liter of total dissolvedsolids must be purified further.
Figure 8-3. Three-unit variation Desal Process.8-5
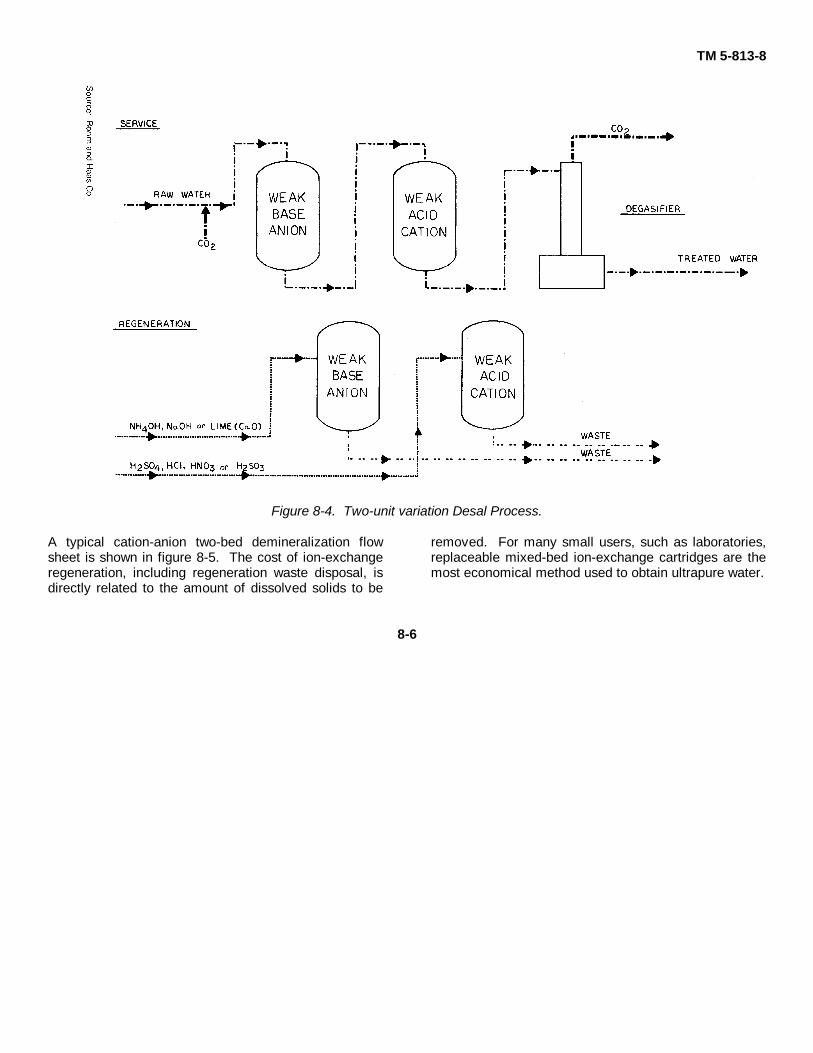
TM 5-813-8
Figure 8-4. Two-unit variation Desal Process.
A typical cation-anion two-bed demineralization flowsheet is shown in figure 8-5. The cost of ion-exchangeregeneration, including regeneration waste disposal, isdirectly related to the amount of dissolved solids to be
removed. For many small users, such as laboratories,replaceable mixed-bed ion-exchange cartridges are themost economical method used to obtain ultrapure water.
8-6
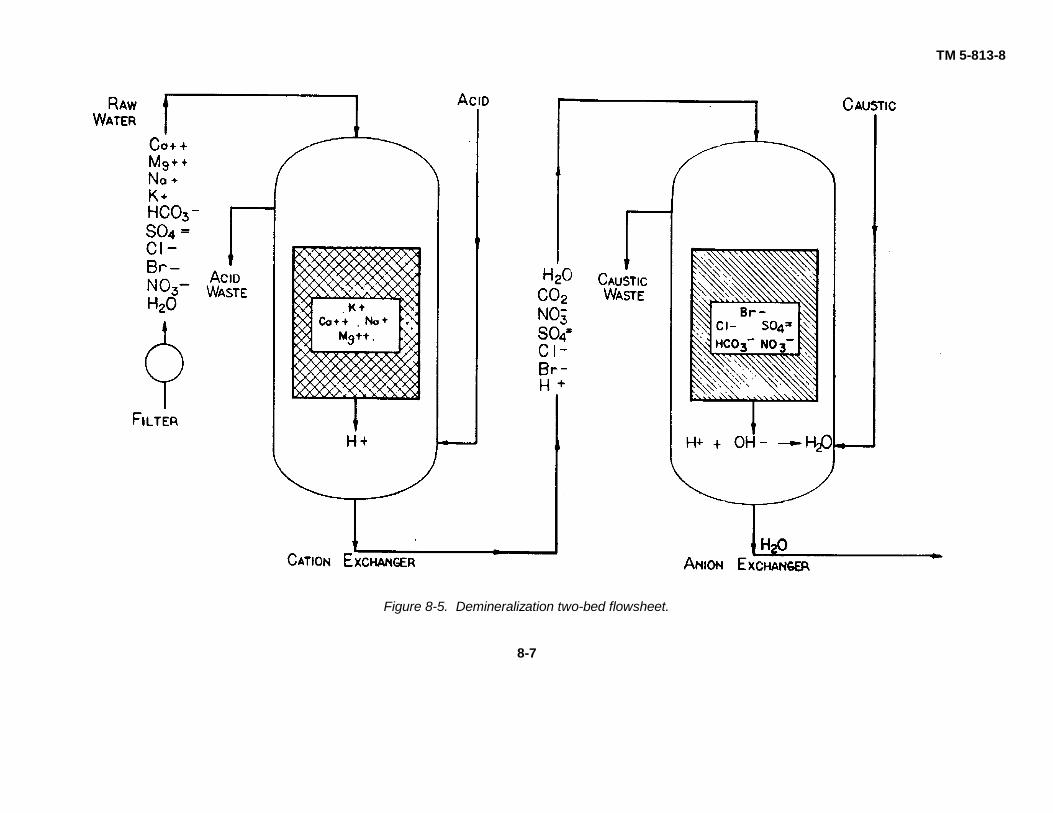
TM 5-813-8
Figure 8-5. Demineralization two-bed flowsheet.
8-7
TM 5-813-8
CHAPTER 9POST-TREATMENT
9-1. General. Desalination can and most often doesproduce water so free of dissolved material thatcorrosion and potential health problems are possible.Electrodialysis reversal is an exception to this generalrule. Electrodialysis reversal does not removemicroorganisms.9-2. Remineralization and aeration. Pure water isa relatively reactive chemical. When air is dissolved inextremely pure water, the resulting solution is extremelycorrosive. Water without dissolved air tastes flat andobjectionable. Water that contains very little hardnessappears to be unhealthy for drinking purposes.Therefore, the designer of a desalination system mustconsider some posttreatment options, such asremineralization and aeration, in order to produce ahealthful, noncorrosive, pleasant-tasting water.9-3. Post-treatment of distilled water. The mineralcontent of distilled water is much lower than isconsidered healthy for drinking purposes. Distilledpotable water should be aerated and remineralized forhealth, taste, and to prevent corrosion. Someradionuclides may not be removed bydistillation/condensation, which may require post-treatment by ion exchange, prior to all other post-treatment methods.
a. Reaeration. Distilled potable waters will bereaerated before use. Cascade, eductor, or sprayedaeration are acceptable but must be followed bydisinfection to prevent bacterial contamination.
b. Mineralization. Recent studies have indicatedthat the hardness of drinking water is important forhuman health. The Langelier Corrosion Index wasdeveloped to predict the tendency of water to deposit ordissolve calcium carbonate. Recalcification of distilledwater will be performed in order to reach a positiveLangelier Corrosion Index by adding lime. Fluoridationof Army potable water supplies is discussed in TB MED576.
c. Corrosion control. Distilled water has a greatercorrosion potential once it is aerated.Any boiler feed water should bypass reaeration wherepossible. Corrosion should be controlled by the additionof sodium hexametaphosphate or sodium silicate, inconjunction with remineralization, prior to entry into thedistribution system.
The Langelier Corrosion Index can be adjusted to aslightly positive value by pH adjustment. Theadjustment of the distilled water pH should occurimmediately after reaeration, prior to distribution, asairborne carbon dioxide may influence the pH.
d. Residual disinfection. Residual disinfectionshould be present in the active parts of the distributionsystem. A break-point chlorination curve is shown infigure 9-1. Chlorine disinfection of very pure waterleads to a chlorine residual that is free of combinedchlorine or chloramines. Chlorination of distilled watersystems should occur immediately prior to thedistribution system. Where it is convenient oreconomical, calcium hypochlorite should be used tocontrol pH to aid in recalcification and to disinfect thedistribution system. Disinfection of Army potable watersupplies is discussed in TB MED 229 and TB MED 576.
e. Reblending for remineralization. One of themost cost-effective ways to remineralize distilled wateris to blend a small stream of pretreated saline feedwater back into the distilled product water. Whenbacterial contamination is sufficiently low and hardnessis sufficiently high, then reblending is an acceptablemeans of distilled water remineralization. Whenreblending is practiced, boiler feed water should beremoved from the system upstream of the reblend point.Saline water used for reblending must have a 30-minutechlorine contact time. This chlorinated reblend streamis an excellent method of providing the total chlorinationfor the distribution system. As further discussed inChapter 10, brine can be used to electrolytically producehypochlorite ion for disinfection.9-4. Post-treatment of reverse osmosis productwater. Unlike distilled water, reverse osmosis productwater is not necessarily free of dissolved gases. Ifdegasification is not used as a pretreatment step, thedissolved gas content of the reverse osmosis productstream will be roughly that of the feed stream.Since divalent and trivalent ions are better eliminated byreverse osmosis than are monovalent ions, reverseosmosis product water is usually very soft and has ahardness level that is unhealthy when used as drinkingwater.
a. Corrosion control. As a consequence of thedissolved gas content of the reverse osmosis productwater, corrosion control should occur as close as isconvenient to the suck-back tank.
9-1
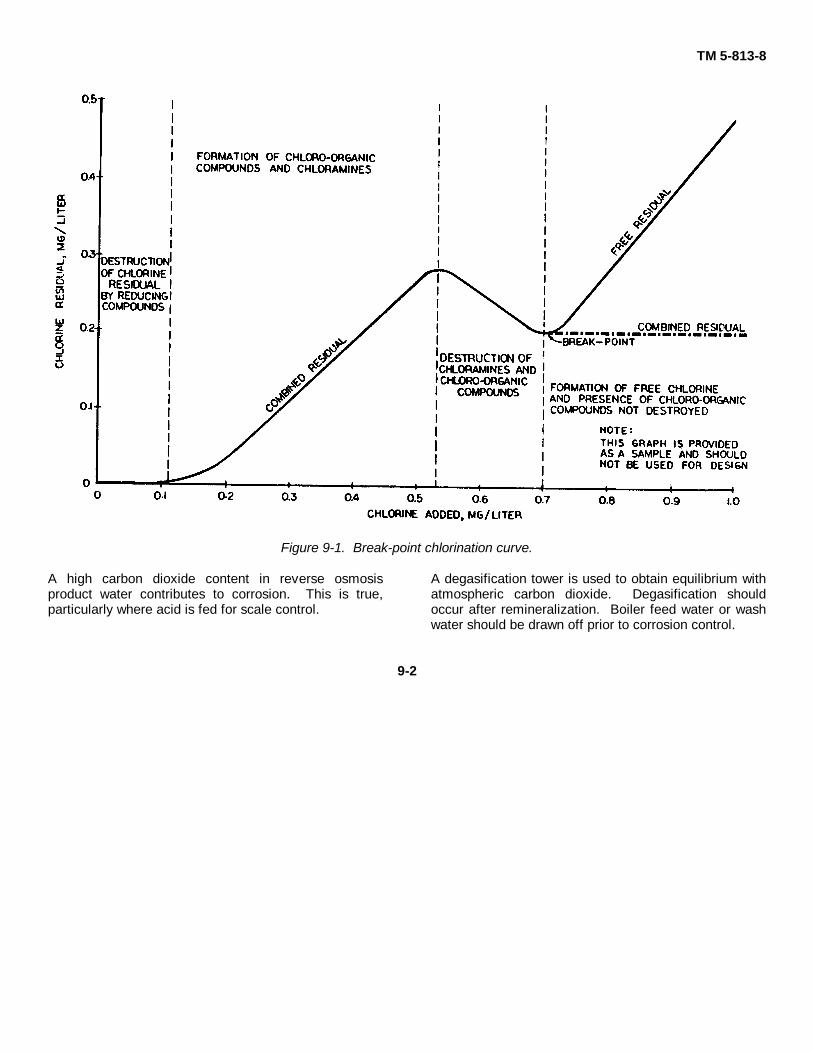
TM 5-813-8
Figure 9-1. Break-point chlorination curve.
A high carbon dioxide content in reverse osmosisproduct water contributes to corrosion. This is true,particularly where acid is fed for scale control.
A degasification tower is used to obtain equilibrium withatmospheric carbon dioxide. Degasification shouldoccur after remineralization. Boiler feed water or washwater should be drawn off prior to corrosion control.
9-2
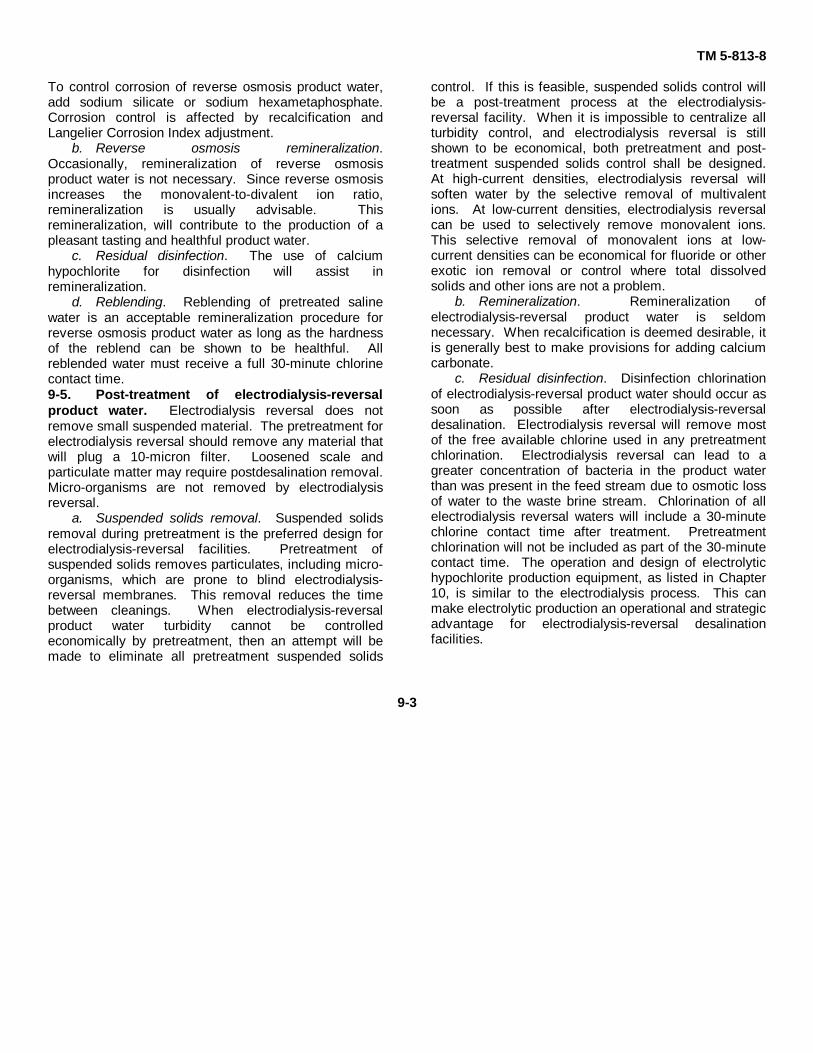
TM 5-813-8
To control corrosion of reverse osmosis product water,add sodium silicate or sodium hexametaphosphate.Corrosion control is affected by recalcification andLangelier Corrosion Index adjustment.
b. Reverse osmosis remineralization.Occasionally, remineralization of reverse osmosisproduct water is not necessary. Since reverse osmosisincreases the monovalent-to-divalent ion ratio,remineralization is usually advisable. Thisremineralization, will contribute to the production of apleasant tasting and healthful product water.
c. Residual disinfection. The use of calciumhypochlorite for disinfection will assist inremineralization.
d. Reblending. Reblending of pretreated salinewater is an acceptable remineralization procedure forreverse osmosis product water as long as the hardnessof the reblend can be shown to be healthful. Allreblended water must receive a full 30-minute chlorinecontact time.9-5. Post-treatment of electrodialysis-reversalproduct water. Electrodialysis reversal does notremove small suspended material. The pretreatment forelectrodialysis reversal should remove any material thatwill plug a 10-micron filter. Loosened scale andparticulate matter may require postdesalination removal.Micro-organisms are not removed by electrodialysisreversal.
a. Suspended solids removal. Suspended solidsremoval during pretreatment is the preferred design forelectrodialysis-reversal facilities. Pretreatment ofsuspended solids removes particulates, including micro-organisms, which are prone to blind electrodialysis-reversal membranes. This removal reduces the timebetween cleanings. When electrodialysis-reversalproduct water turbidity cannot be controlledeconomically by pretreatment, then an attempt will bemade to eliminate all pretreatment suspended solids
control. If this is feasible, suspended solids control willbe a post-treatment process at the electrodialysis-reversal facility. When it is impossible to centralize allturbidity control, and electrodialysis reversal is stillshown to be economical, both pretreatment and post-treatment suspended solids control shall be designed.At high-current densities, electrodialysis reversal willsoften water by the selective removal of multivalentions. At low-current densities, electrodialysis reversalcan be used to selectively remove monovalent ions.This selective removal of monovalent ions at low-current densities can be economical for fluoride or otherexotic ion removal or control where total dissolvedsolids and other ions are not a problem.
b. Remineralization. Remineralization ofelectrodialysis-reversal product water is seldomnecessary. When recalcification is deemed desirable, itis generally best to make provisions for adding calciumcarbonate.
c. Residual disinfection. Disinfection chlorinationof electrodialysis-reversal product water should occur assoon as possible after electrodialysis-reversaldesalination. Electrodialysis reversal will remove mostof the free available chlorine used in any pretreatmentchlorination. Electrodialysis reversal can lead to agreater concentration of bacteria in the product waterthan was present in the feed stream due to osmotic lossof water to the waste brine stream. Chlorination of allelectrodialysis reversal waters will include a 30-minutechlorine contact time after treatment. Pretreatmentchlorination will not be included as part of the 30-minutecontact time. The operation and design of electrolytichypochlorite production equipment, as listed in Chapter10, is similar to the electrodialysis process. This canmake electrolytic production an operational and strategicadvantage for electrodialysis-reversal desalinationfacilities.
9-3
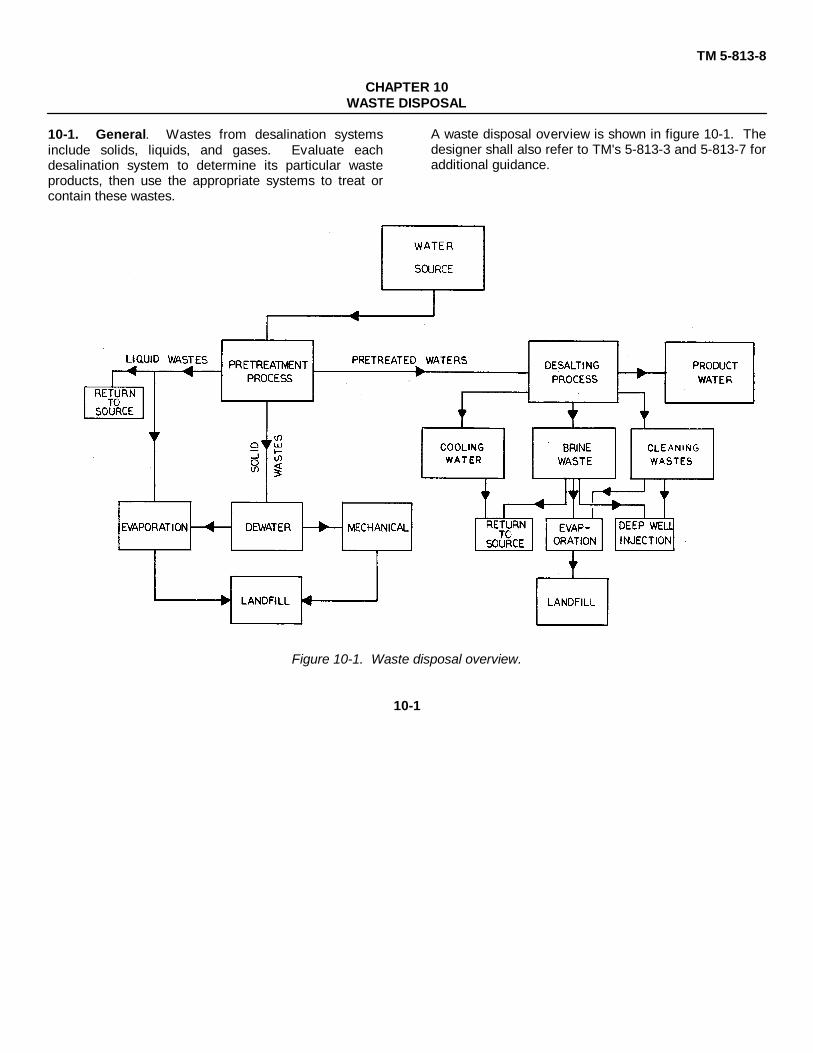
TM 5-813-8
CHAPTER 10WASTE DISPOSAL
10-1. General. Wastes from desalination systemsinclude solids, liquids, and gases. Evaluate eachdesalination system to determine its particular wasteproducts, then use the appropriate systems to treat orcontain these wastes.
A waste disposal overview is shown in figure 10-1. Thedesigner shall also refer to TM's 5-813-3 and 5-813-7 foradditional guidance.
Figure 10-1. Waste disposal overview.
10-1
TM 5-813-8
10-2. Pretreatment wastes. Systems that requirepretreatment processes produce pretreatment wastes.Solid materials, and the chemicals added to precipitatethem, form floc that will be removed from raw water byclarification. The sludges formed must undergodewatering and are sent to a landfill. Dewateringprocesses can be mechanical, which are centrifugation
or press operations, or evaporative, which are solarbeds or lagoon operations. The alternatives forpretreatment sludge disposal are shown in figure 10-2.In addition to solid wastes, pretreatment processes canproduce liquid wastes from filter backwash operations.These liquid wastes often can be reclaimed or treatedalong with other liquid wastes from desalination process.
Figure 10-2. Pretreatment sludge disposal.
10-2
TM 5-813-8
10-3. Distillation / condensation system wastes .The waste stream volume produced bydistillation/condensation systems is usually less thanthat produced by other desalination processes. Thevaporization process yields concentrated brine with areduced liquid waste loading. The use of less extensivepretreatment requirements for these systems generallyresults in a reduction of solid wastes. The cooling waterdischarge produced by many distillation processes doespresent a separate thermal discharge problem.
a. Brine return to source. The brines fromdistillation/condensation processes are highlyconcentrated. For this reason, brines will be dischargedwhere contamination of the intake water will not occur.The liquid brines will be returned to the raw water sourceif impact studies show there will be no significantenvironmental impact. Wetlands and estuarian areasthat are often used for discharge are usually productivegrowth sites for many valuable food species. Theseareas are easily damaged by thermal discharges andrequire study to ensure that they are acceptable disposalareas for concentrated desalination waste liquids.
b. Brine evaporation. If it is not feasible to returnthe brines to the raw water source, then consider the useof evaporation ponds to dry the liquid wastes. Thethermal nature of the brine from mostdistillation/condensation systems can aid evaporation ofthe wastes to dry salts. In areas where the netevaporation rate is low, but thermal energy sources areavailable, use thermal evaporation. Thermalevaporation has high energy requirements and usually isnot cost-effective.
c. Brine deep-well injection. If discharging thebrine to a surface water or evaporation is impractical oruneconomical, deep-well injection of brines is possible.The injection of liquid wastes to deep undergroundformations can provide a disposal alternative wherenone was previously available. To properly design andinstall a deep-well injection facility, a complete geologicand geochemical analysis of the reservoir formation isrequired. Volumes of less than 53 gallons per minutecan be disposed of practically in injection wells, whilevolumes in excess of 264 gallons per minute will bemuch more difficult to dispose of by use of this method.Compatibility tests must be run between the proposedwaste and a sample of the formation water. This testshould ensure that the two waters do not react to formprecipitates that may clog the receiving formation. Thereceiving formation must be separated from any freshwater or the desalination source water by an aquicludethat will ensure that the brine will not contaminate them.
The area must be checked for geologic faults and anymanmade penetrations of the aquiclude. The brinemust contain less than 15 milligrams per liter ofsuspended solids, with a maximum size of 20 microns.Figure 10-3 shows a typical injection well. Highconstruction and operating costs and the potential forserious operational problems usually cause deep-wellinjection to be the last process selected. If deep-wellinjection, evaporation, or return-to-source liquid-disposaloptions are not possible, review the entire facilitylocation.
d. Dried salts. When evaporation processes havereduced the brines to dry salts, make evaluations todetermine a market value for these salts, as some saltshave a value when dried. A landfill operation must bemaintained when no market value can be assigned tothe dried salts. An overview of brine wastes disposal isshown in figure 10-4.
e. Use of brine. Desalination evaporation pondsmake excellent solar stratification ponds. These pondscan be used to produce a stored thermal energygradient, which can be harvested with a Rankin cycleengine. Electricity from such a system can be used toelectrolytically produce chlorine. The total disposal ofbrine by chlorine production is not expected to ever beeconomical for the military. The internal production ofchlorine for water disinfection is strategic. Presently, thesmallest systems available produce over 22 pounds ofchlorine per day. The brine concentration must begreater than above 35,000 milligrams of total dissolvedsolids to be practical. Any hardness in the brine limitsefficiency and causes scaling.
f. Cleaning wastes. At regular intervals,distillation systems must be cleaned. This usuallyinvolves strong acid cleaning solutions. These solutionsmust be neutralized and may require lime precipitationof heavy metals before they can be discharged. Thesewastes can be dried in evaporation ponds or disposed ofin injection wells. The volume of cleaning waste is smallenough that transportation of the cleaning wastes tocommercial hazardous waste disposal facilities is a thirdalternative. The operation of pretreatment scale controlcan reduce the frequency of cleaning.
g. Gases. Gas wastes from desalinationprocesses are removed from the system duringdeaeration or distillation. These gases include
10-3
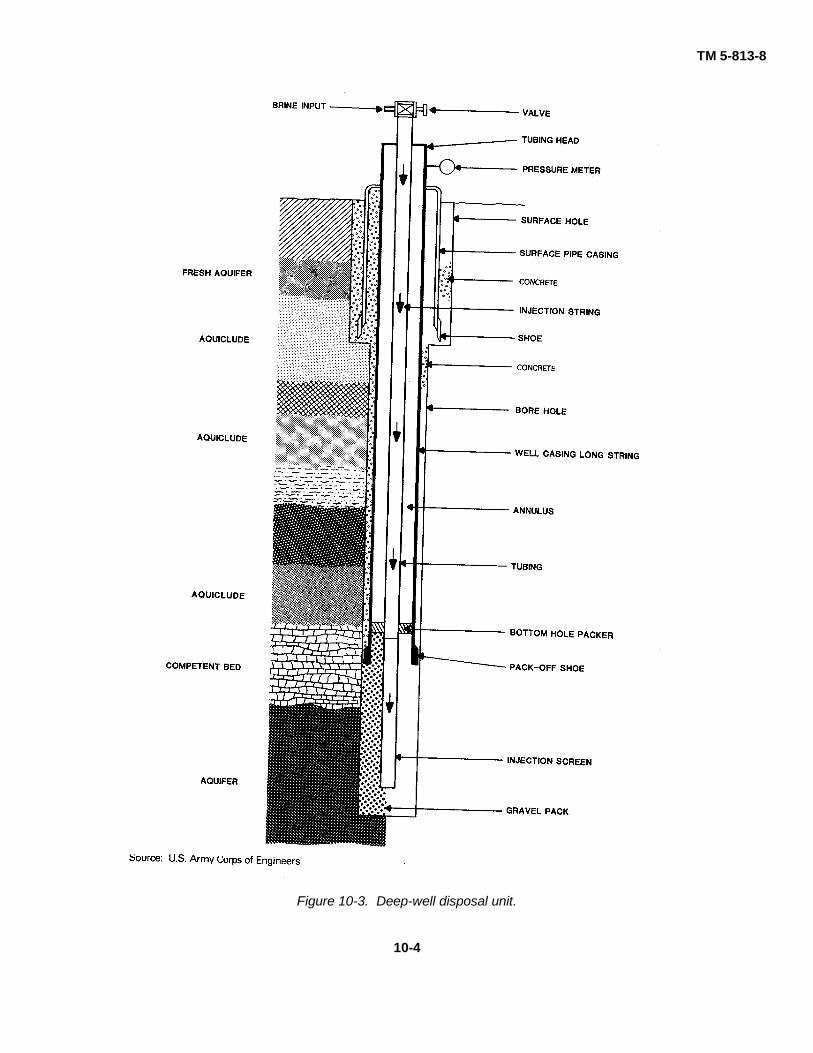
TM 5-813-8
Figure 10-3. Deep-well disposal unit.
10-4
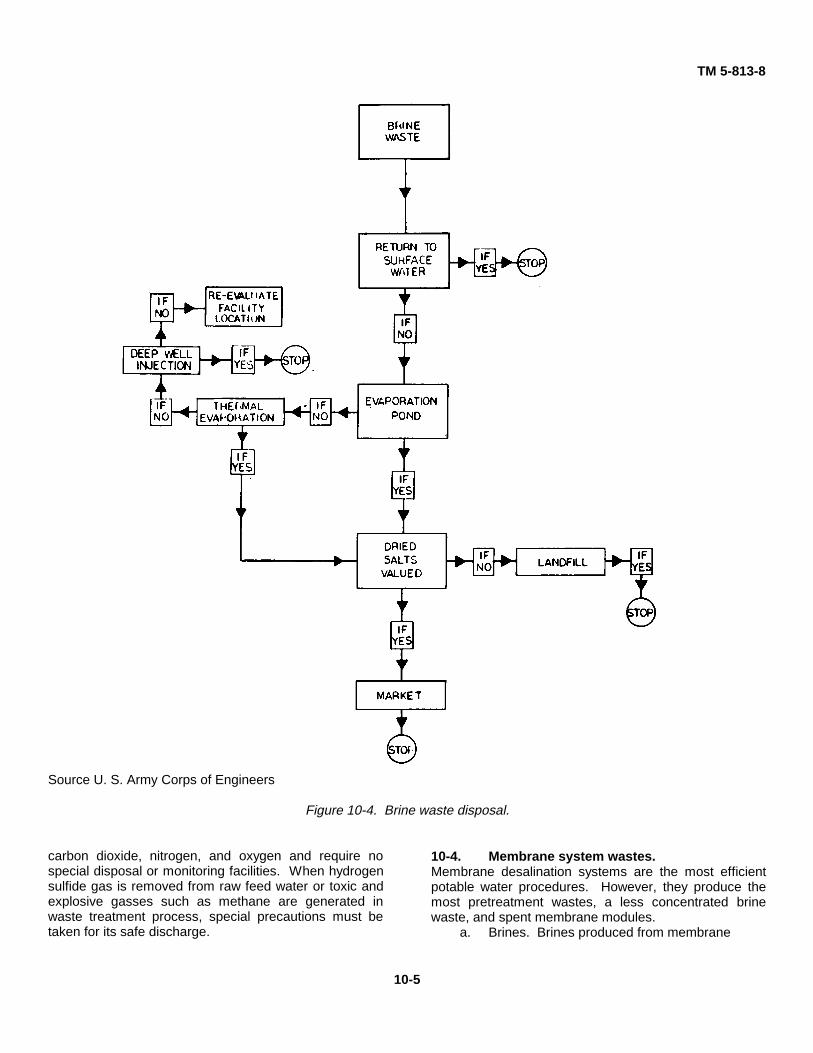
TM 5-813-8
Source U. S. Army Corps of Engineers
Figure 10-4. Brine waste disposal.
carbon dioxide, nitrogen, and oxygen and require nospecial disposal or monitoring facilities. When hydrogensulfide gas is removed from raw feed water or toxic andexplosive gasses such as methane are generated inwaste treatment process, special precautions must betaken for its safe discharge.
10-4. Membrane system wastes.Membrane desalination systems are the most efficientpotable water procedures. However, they produce themost pretreatment wastes, a less concentrated brinewaste, and spent membrane modules.
a. Brines. Brines produced from membrane
10-5
TM 5-813-8
desalination are usually less concentrated and are at alower temperature than distillation/ condensation systembrines. The concentration and temperature of thesemembrane brines make them ideal for disposal byreturn-to-source technology if it is approved by regulatoryauthorities. Other methods, such as evaporation orinjection, can be used.
b. Membrane modules. Membranes can becomefouled, compacted, or destroyed during the normalcourse of membrane desalination operation. None of themembrane systems in current use present health orenvironmental hazards when disposed in a landfill. It iscustomary for the membrane manufacturers to disposeof defective membranes and their modules whenreplacement is necessary.
10-5. Ion-exchange system wastes.Neutralize the acid and caustic solutions from ion-exchange regeneration. Then dispose of wastes asconcentrated brines. The only other major waste productfrom ion-exchange systems is the ion-exchange beditself. Resins that are spent and not to be regeneratedcan be placed in a landfill.
10-6. Ultimate disposal. All waste streams fromdesalination processes must reach a point of ultimate orfinal disposal. Without adequate waste disposalfacilities, site development cannot continue.
10-6

APPENDIX ASAMPLE PROBLEMS
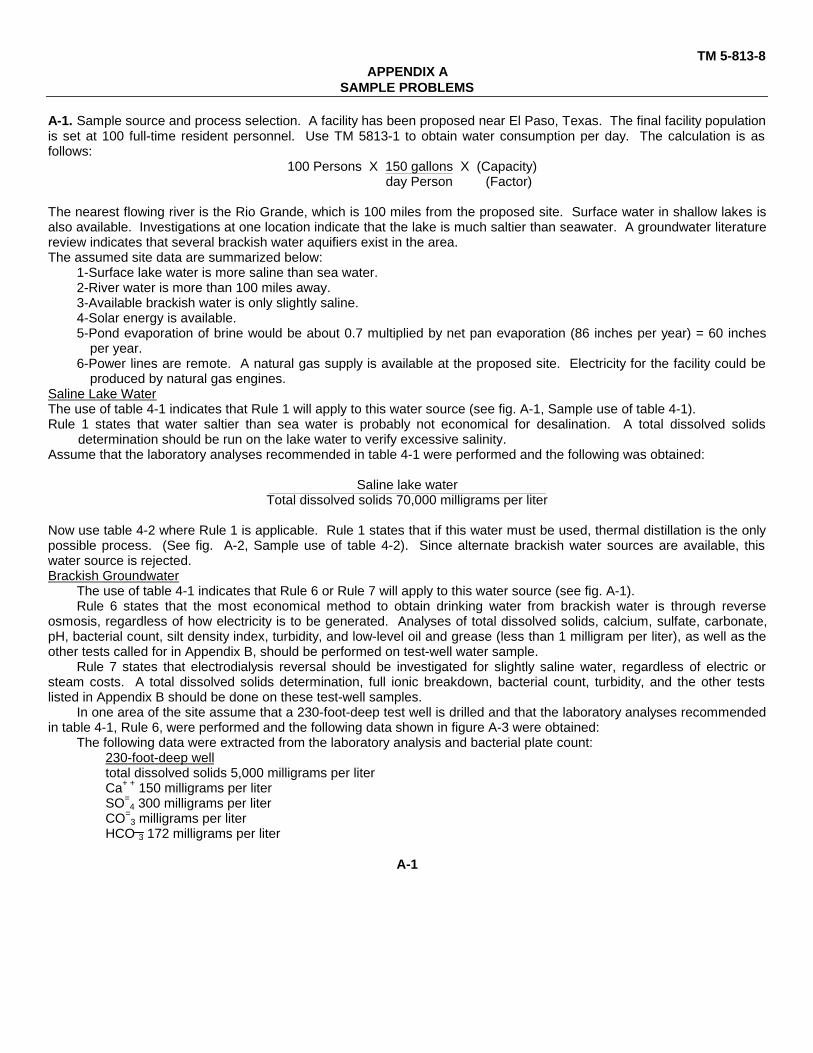
TM 5-813-8APPENDIX A
SAMPLE PROBLEMS
A-1. Sample source and process selection. A facility has been proposed near El Paso, Texas. The final facility populationis set at 100 full-time resident personnel. Use TM 5813-1 to obtain water consumption per day. The calculation is asfollows:
100 Persons X 150 gallons X (Capacity)day Person (Factor)
The nearest flowing river is the Rio Grande, which is 100 miles from the proposed site. Surface water in shallow lakes isalso available. Investigations at one location indicate that the lake is much saltier than seawater. A groundwater literaturereview indicates that several brackish water aquifiers exist in the area.The assumed site data are summarized below:
1-Surface lake water is more saline than sea water.2-River water is more than 100 miles away.3-Available brackish water is only slightly saline.4-Solar energy is available.5-Pond evaporation of brine would be about 0.7 multiplied by net pan evaporation (86 inches per year) = 60 inches
per year.6-Power lines are remote. A natural gas supply is available at the proposed site. Electricity for the facility could be
produced by natural gas engines.Saline Lake WaterThe use of table 4-1 indicates that Rule 1 will apply to this water source (see fig. A-1, Sample use of table 4-1).Rule 1 states that water saltier than sea water is probably not economical for desalination. A total dissolved solids
determination should be run on the lake water to verify excessive salinity.Assume that the laboratory analyses recommended in table 4-1 were performed and the following was obtained:
Saline lake waterTotal dissolved solids 70,000 milligrams per liter
Now use table 4-2 where Rule 1 is applicable. Rule 1 states that if this water must be used, thermal distillation is the onlypossible process. (See fig. A-2, Sample use of table 4-2). Since alternate brackish water sources are available, thiswater source is rejected.Brackish Groundwater
The use of table 4-1 indicates that Rule 6 or Rule 7 will apply to this water source (see fig. A-1).Rule 6 states that the most economical method to obtain drinking water from brackish water is through reverse
osmosis, regardless of how electricity is to be generated. Analyses of total dissolved solids, calcium, sulfate, carbonate,pH, bacterial count, silt density index, turbidity, and low-level oil and grease (less than 1 milligram per liter), as well as theother tests called for in Appendix B, should be performed on test-well water sample.
Rule 7 states that electrodialysis reversal should be investigated for slightly saline water, regardless of electric orsteam costs. A total dissolved solids determination, full ionic breakdown, bacterial count, turbidity, and the other testslisted in Appendix B should be done on these test-well samples.
In one area of the site assume that a 230-foot-deep test well is drilled and that the laboratory analyses recommendedin table 4-1, Rule 6, were performed and the following data shown in figure A-3 were obtained:
The following data were extracted from the laboratory analysis and bacterial plate count:230-foot-deep welltotal dissolved solids 5,000 milligrams per literCa+ + 150 milligrams per literSO=
4 300 milligrams per literCO=
3 milligrams per literHCO 3 172 milligrams per liter
A-1
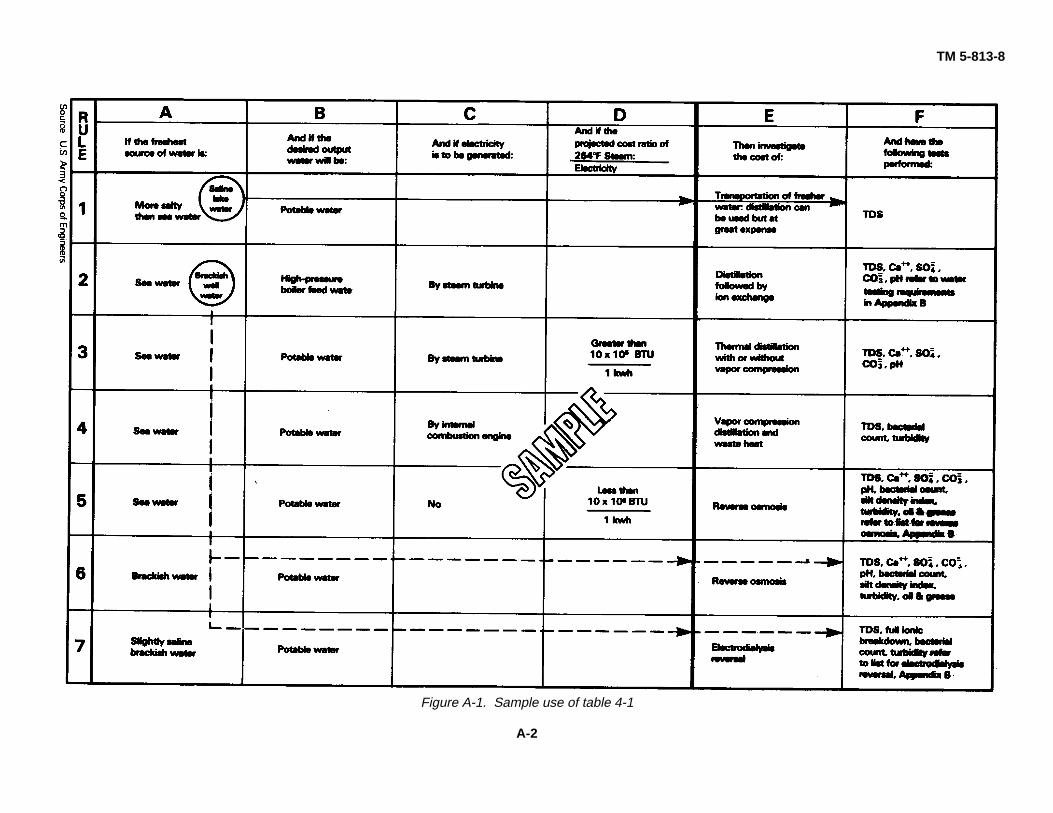
Appendix B
Appendix B
Appendix B
TM 5-813-8
Figure A-1. Sample use of table 4-1
A-2
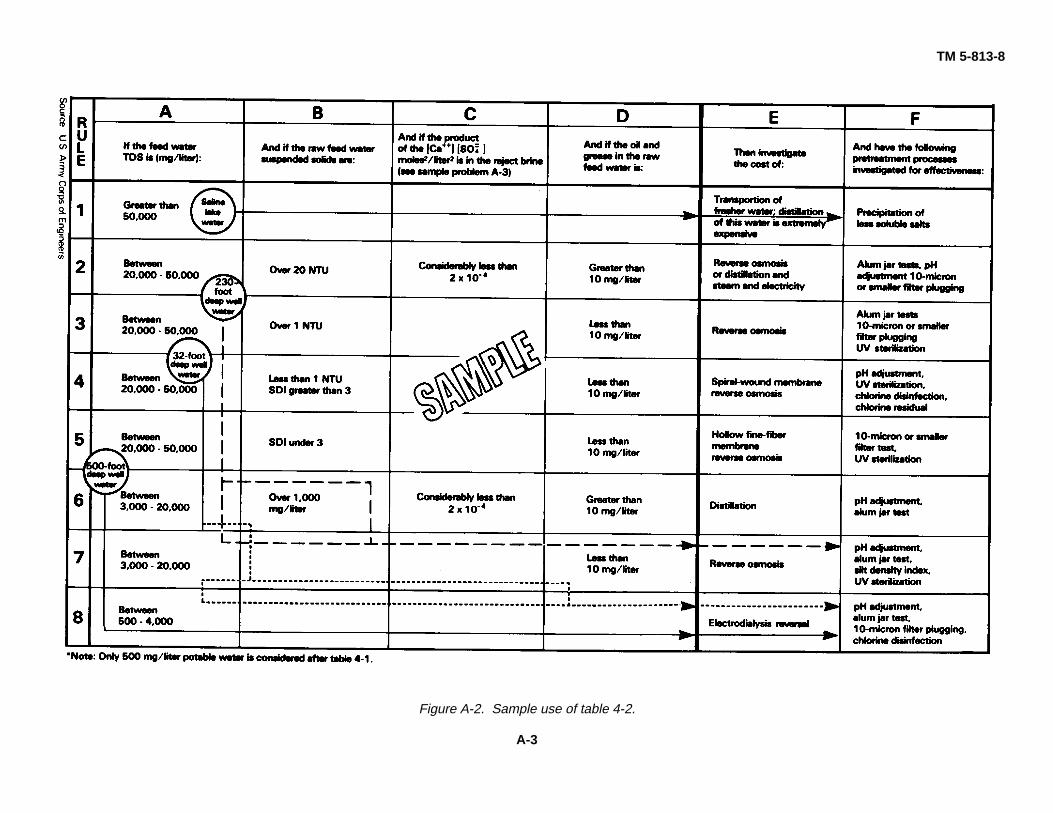
TM 5-813-8
Figure A-2. Sample use of table 4-2.
A-3
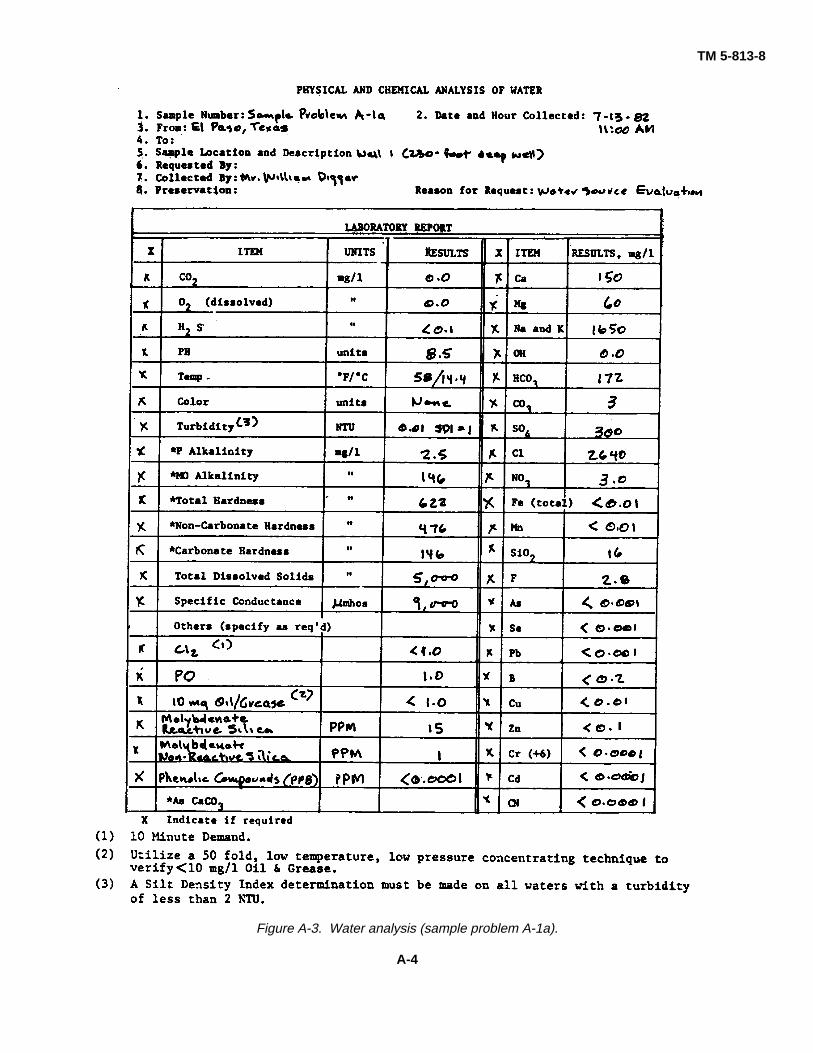
TM 5-813-8
Figure A-3. Water analysis (sample problem A-1a).
A-4
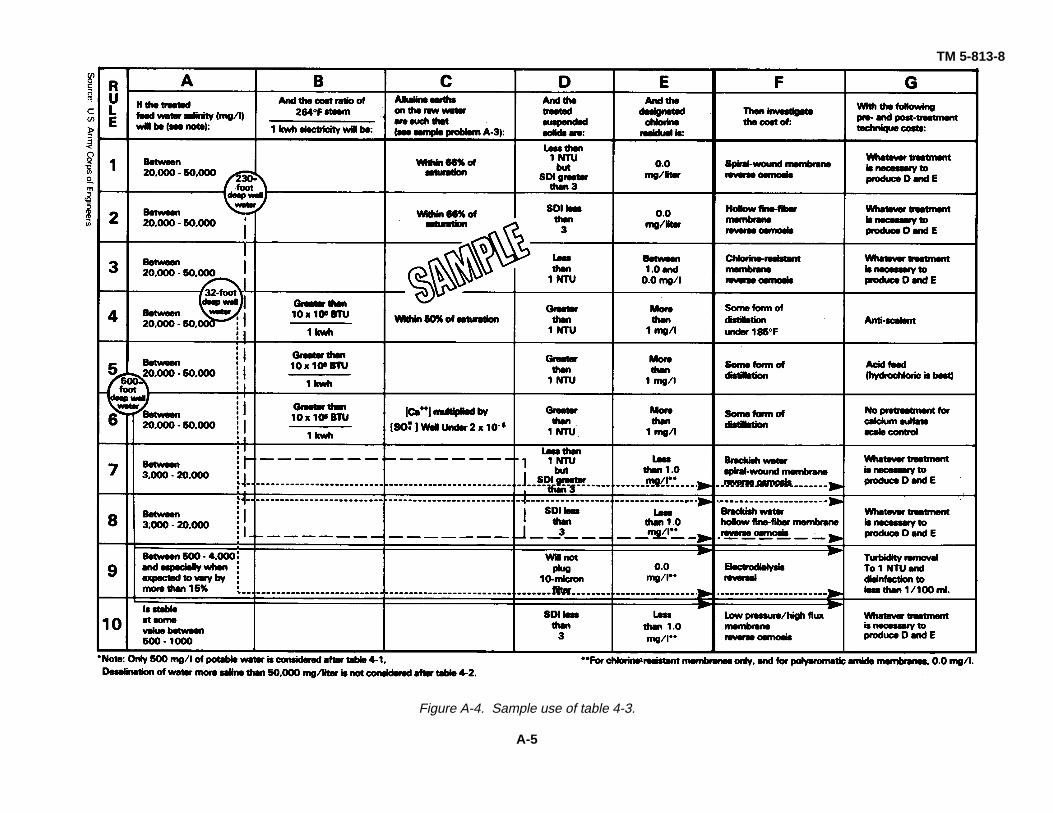
TM 5-813-8
Figure A-4. Sample use of table 4-3.
A-5
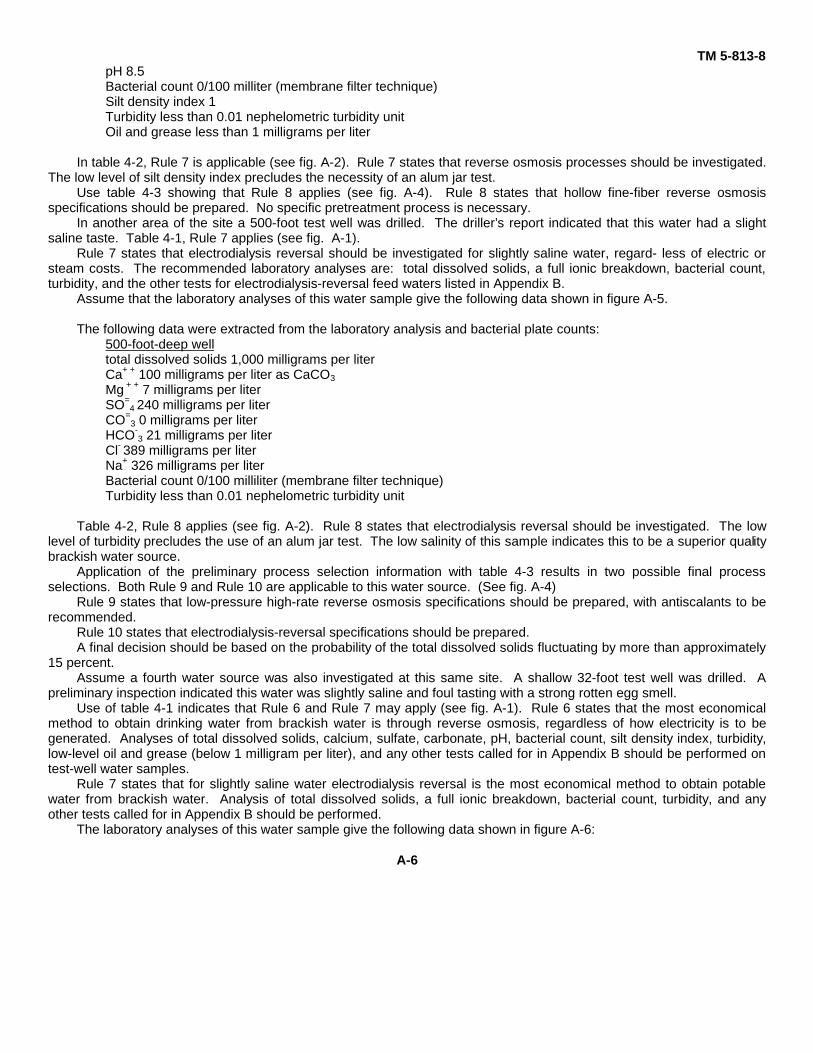
TM 5-813-8pH 8.5Bacterial count 0/100 milliter (membrane filter technique)Silt density index 1Turbidity less than 0.01 nephelometric turbidity unitOil and grease less than 1 milligrams per liter
In table 4-2, Rule 7 is applicable (see fig. A-2). Rule 7 states that reverse osmosis processes should be investigated.The low level of silt density index precludes the necessity of an alum jar test.
Use table 4-3 showing that Rule 8 applies (see fig. A-4). Rule 8 states that hollow fine-fiber reverse osmosisspecifications should be prepared. No specific pretreatment process is necessary.
In another area of the site a 500-foot test well was drilled. The driller’s report indicated that this water had a slightsaline taste. Table 4-1, Rule 7 applies (see fig. A-1).
Rule 7 states that electrodialysis reversal should be investigated for slightly saline water, regard- less of electric orsteam costs. The recommended laboratory analyses are: total dissolved solids, a full ionic breakdown, bacterial count,turbidity, and the other tests for electrodialysis-reversal feed waters listed in Appendix B.
Assume that the laboratory analyses of this water sample give the following data shown in figure A-5.
The following data were extracted from the laboratory analysis and bacterial plate counts:500-foot-deep welltotal dissolved solids 1,000 milligrams per literCa+ + 100 milligrams per liter as CaCO3
Mg + + 7 milligrams per literSO=
4 240 milligrams per literCO=
3 0 milligrams per literHCO-
3 21 milligrams per literCl- 389 milligrams per literNa+ 326 milligrams per literBacterial count 0/100 milliliter (membrane filter technique)Turbidity less than 0.01 nephelometric turbidity unit
Table 4-2, Rule 8 applies (see fig. A-2). Rule 8 states that electrodialysis reversal should be investigated. The lowlevel of turbidity precludes the use of an alum jar test. The low salinity of this sample indicates this to be a superior qualitybrackish water source.
Application of the preliminary process selection information with table 4-3 results in two possible final processselections. Both Rule 9 and Rule 10 are applicable to this water source. (See fig. A-4)
Rule 9 states that low-pressure high-rate reverse osmosis specifications should be prepared, with antiscalants to berecommended.
Rule 10 states that electrodialysis-reversal specifications should be prepared.A final decision should be based on the probability of the total dissolved solids fluctuating by more than approximately
15 percent.Assume a fourth water source was also investigated at this same site. A shallow 32-foot test well was drilled. A
preliminary inspection indicated this water was slightly saline and foul tasting with a strong rotten egg smell.Use of table 4-1 indicates that Rule 6 and Rule 7 may apply (see fig. A-1). Rule 6 states that the most economical
method to obtain drinking water from brackish water is through reverse osmosis, regardless of how electricity is to begenerated. Analyses of total dissolved solids, calcium, sulfate, carbonate, pH, bacterial count, silt density index, turbidity,low-level oil and grease (below 1 milligram per liter), and any other tests called for in Appendix B should be performed ontest-well water samples.
Rule 7 states that for slightly saline water electrodialysis reversal is the most economical method to obtain potablewater from brackish water. Analysis of total dissolved solids, a full ionic breakdown, bacterial count, turbidity, and anyother tests called for in Appendix B should be performed.
The laboratory analyses of this water sample give the following data shown in figure A-6:
A-6
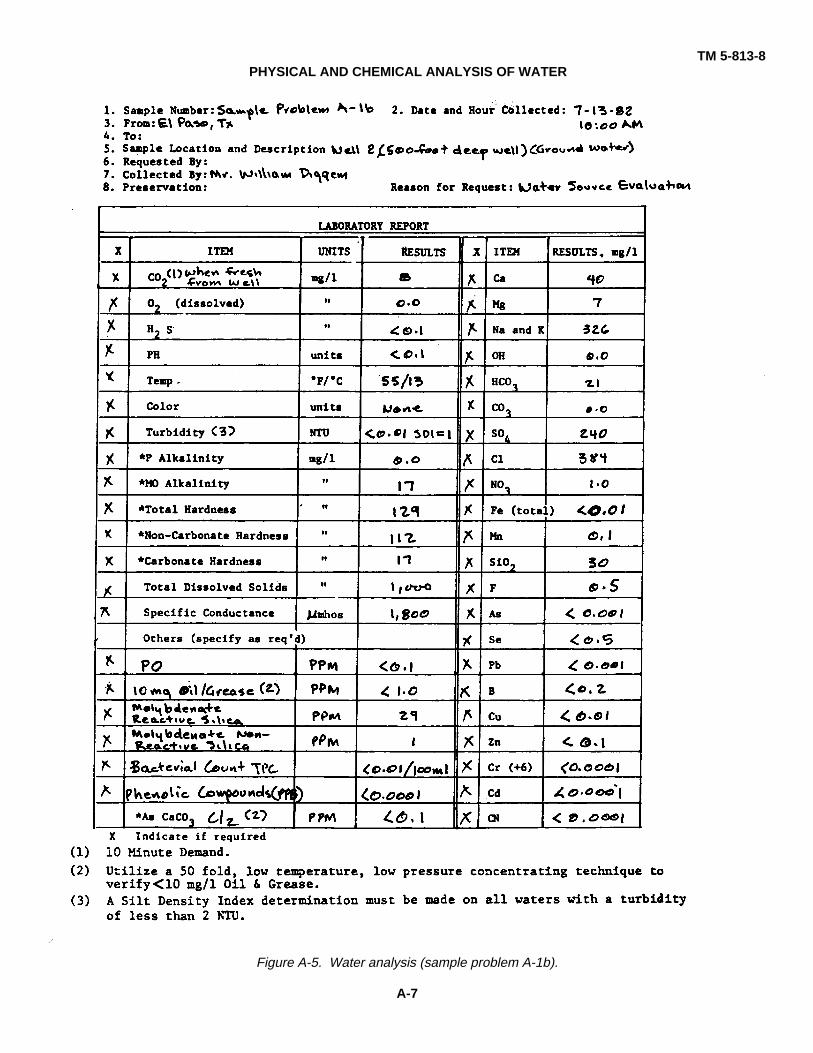
TM 5-813-8PHYSICAL AND CHEMICAL ANALYSIS OF WATER
Figure A-5. Water analysis (sample problem A-1b).
A-7
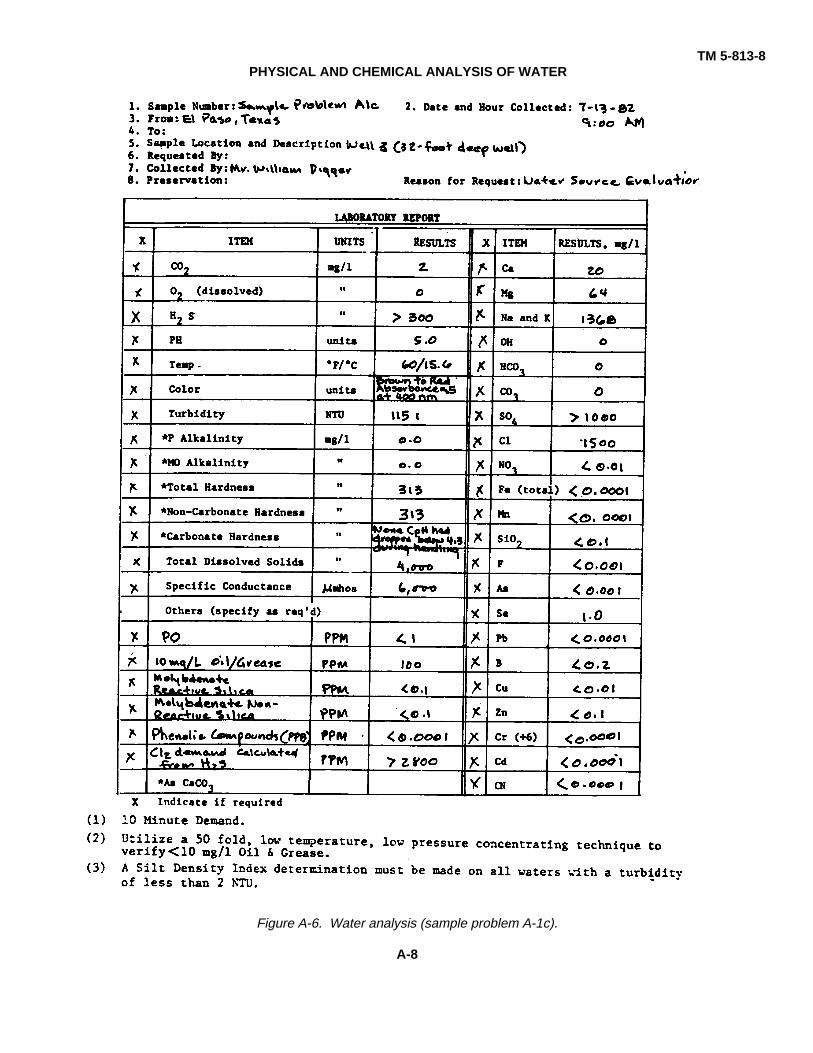
TM 5-813-8PHYSICAL AND CHEMICAL ANALYSIS OF WATER
Figure A-6. Water analysis (sample problem A-1c).
A-8
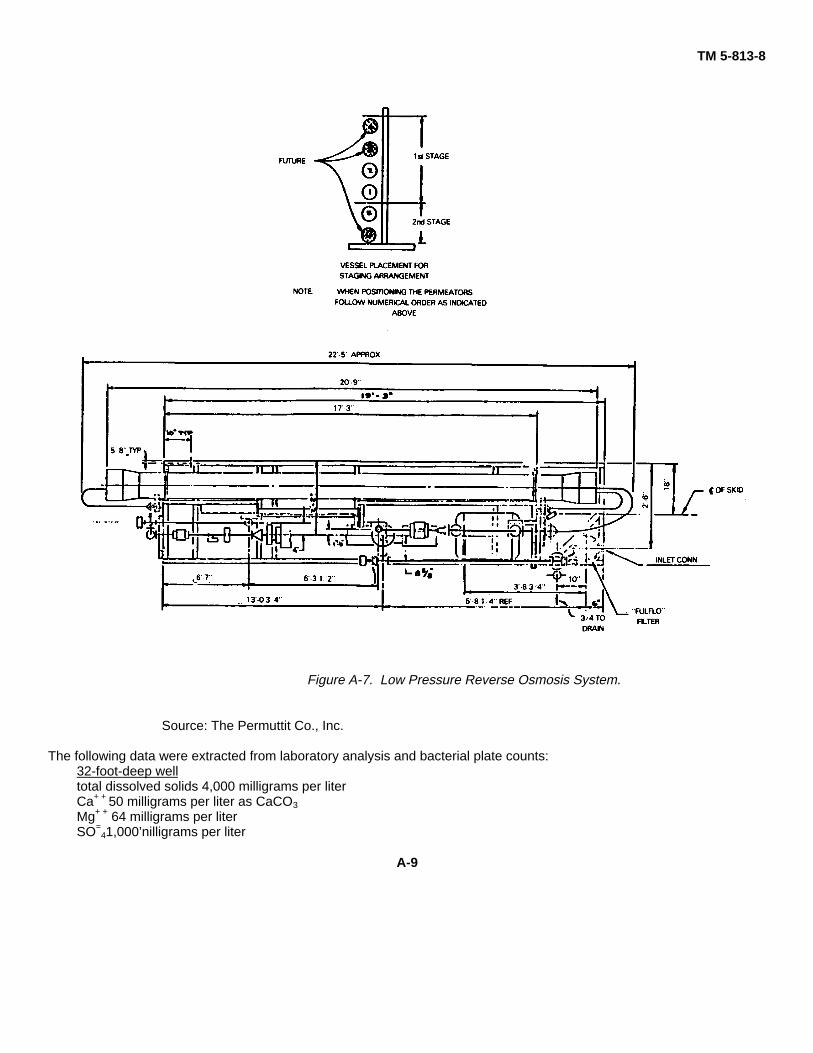
TM 5-813-8
Figure A-7. Low Pressure Reverse Osmosis System.
Source: The Permuttit Co., Inc.
The following data were extracted from laboratory analysis and bacterial plate counts:32-foot-deep welltotal dissolved solids 4,000 milligrams per literCa+ + 50 milligrams per liter as CaCO3
Mg+ + 64 milligrams per literSO=
41,000’nilligrams per liter
A-9
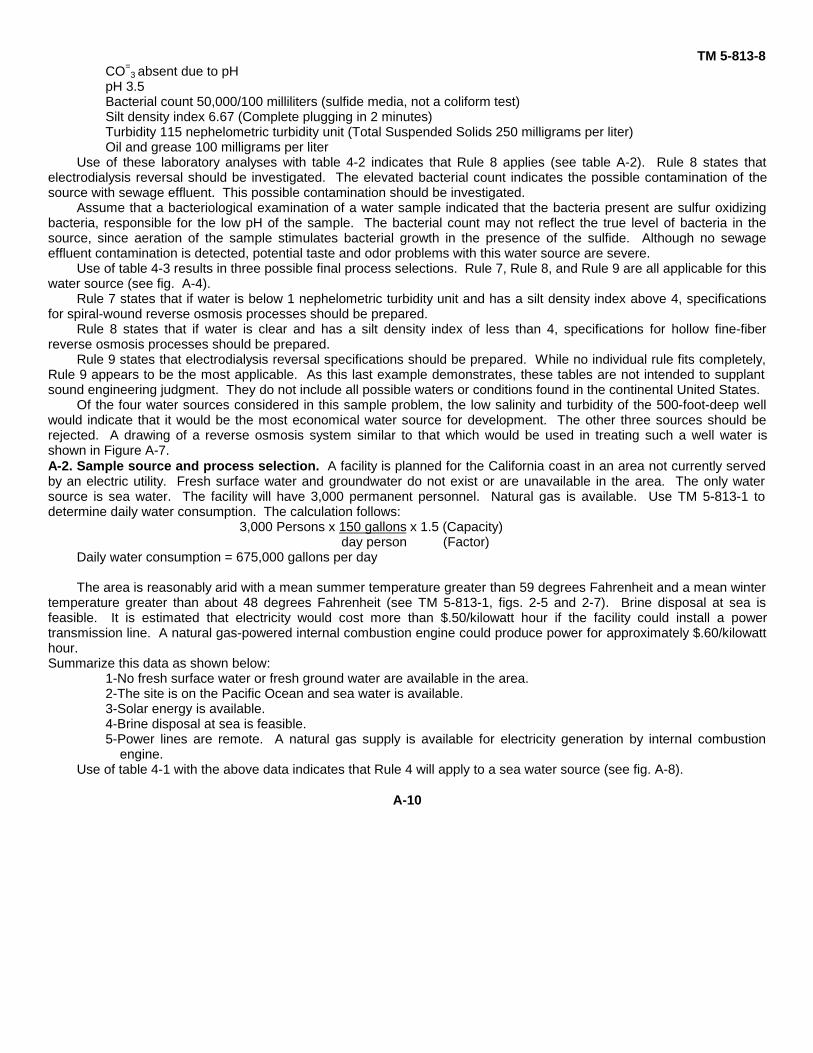
TM 5-813-8CO=
3 absent due to pHpH 3.5Bacterial count 50,000/100 milliliters (sulfide media, not a coliform test)Silt density index 6.67 (Complete plugging in 2 minutes)Turbidity 115 nephelometric turbidity unit (Total Suspended Solids 250 milligrams per liter)Oil and grease 100 milligrams per liter
Use of these laboratory analyses with table 4-2 indicates that Rule 8 applies (see table A-2). Rule 8 states thatelectrodialysis reversal should be investigated. The elevated bacterial count indicates the possible contamination of thesource with sewage effluent. This possible contamination should be investigated.
Assume that a bacteriological examination of a water sample indicated that the bacteria present are sulfur oxidizingbacteria, responsible for the low pH of the sample. The bacterial count may not reflect the true level of bacteria in thesource, since aeration of the sample stimulates bacterial growth in the presence of the sulfide. Although no sewageeffluent contamination is detected, potential taste and odor problems with this water source are severe.
Use of table 4-3 results in three possible final process selections. Rule 7, Rule 8, and Rule 9 are all applicable for thiswater source (see fig. A-4).
Rule 7 states that if water is below 1 nephelometric turbidity unit and has a silt density index above 4, specificationsfor spiral-wound reverse osmosis processes should be prepared.
Rule 8 states that if water is clear and has a silt density index of less than 4, specifications for hollow fine-fiberreverse osmosis processes should be prepared.
Rule 9 states that electrodialysis reversal specifications should be prepared. While no individual rule fits completely,Rule 9 appears to be the most applicable. As this last example demonstrates, these tables are not intended to supplantsound engineering judgment. They do not include all possible waters or conditions found in the continental United States.
Of the four water sources considered in this sample problem, the low salinity and turbidity of the 500-foot-deep wellwould indicate that it would be the most economical water source for development. The other three sources should berejected. A drawing of a reverse osmosis system similar to that which would be used in treating such a well water isshown in Figure A-7.A-2. Sample source and process selection. A facility is planned for the California coast in an area not currently servedby an electric utility. Fresh surface water and groundwater do not exist or are unavailable in the area. The only watersource is sea water. The facility will have 3,000 permanent personnel. Natural gas is available. Use TM 5-813-1 todetermine daily water consumption. The calculation follows:
3,000 Persons x 150 gallons x 1.5 (Capacity)day person (Factor)
Daily water consumption = 675,000 gallons per day
The area is reasonably arid with a mean summer temperature greater than 59 degrees Fahrenheit and a mean wintertemperature greater than about 48 degrees Fahrenheit (see TM 5-813-1, figs. 2-5 and 2-7). Brine disposal at sea isfeasible. It is estimated that electricity would cost more than $.50/kilowatt hour if the facility could install a powertransmission line. A natural gas-powered internal combustion engine could produce power for approximately $.60/kilowatthour.Summarize this data as shown below:
1-No fresh surface water or fresh ground water are available in the area.2-The site is on the Pacific Ocean and sea water is available.3-Solar energy is available.4-Brine disposal at sea is feasible.5-Power lines are remote. A natural gas supply is available for electricity generation by internal combustion
engine.Use of table 4-1 with the above data indicates that Rule 4 will apply to a sea water source (see fig. A-8).
A-10
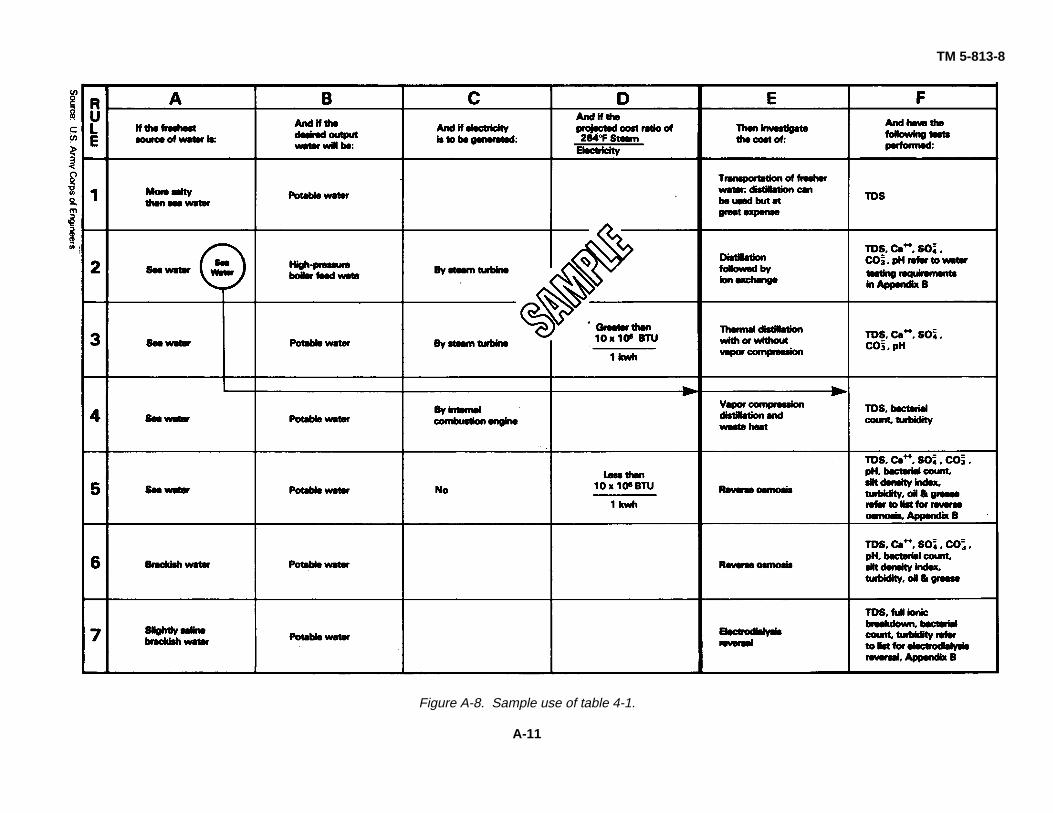
Appendix B
Appendix B
Appendix B
TM 5-813-8
Figure A-8. Sample use of table 4-1.
A-11
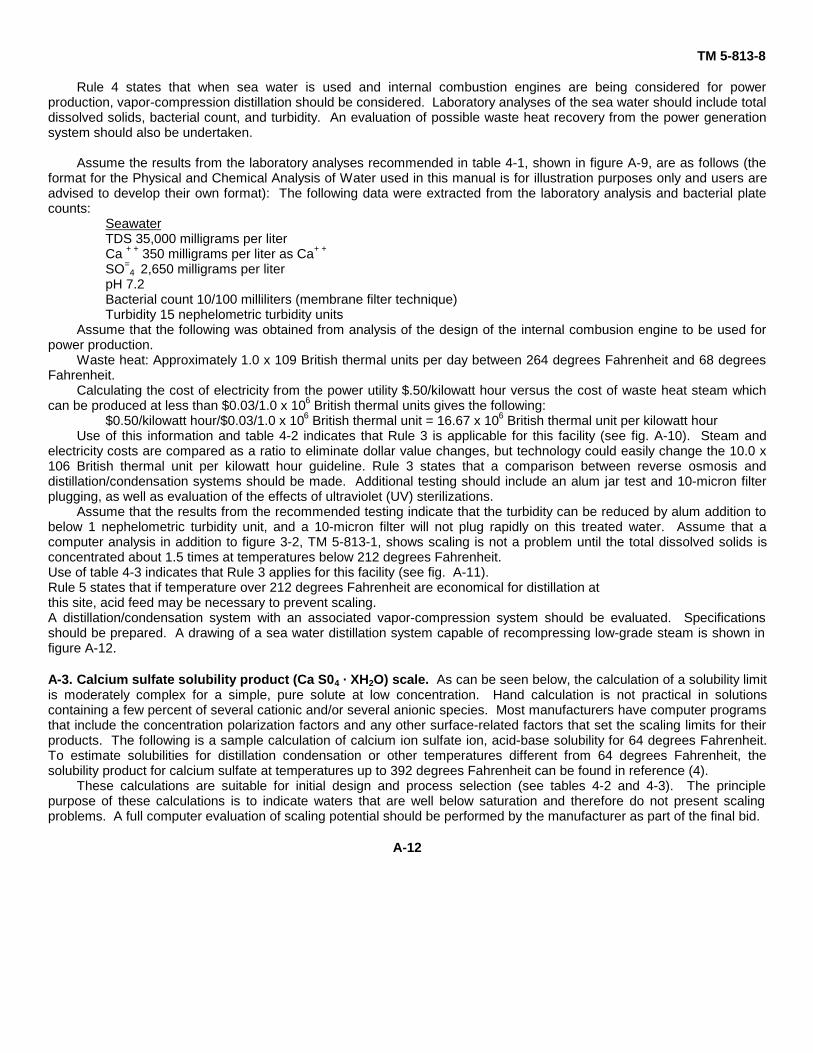
TM 5-813-8
Rule 4 states that when sea water is used and internal combustion engines are being considered for powerproduction, vapor-compression distillation should be considered. Laboratory analyses of the sea water should include totaldissolved solids, bacterial count, and turbidity. An evaluation of possible waste heat recovery from the power generationsystem should also be undertaken.
Assume the results from the laboratory analyses recommended in table 4-1, shown in figure A-9, are as follows (theformat for the Physical and Chemical Analysis of Water used in this manual is for illustration purposes only and users areadvised to develop their own format): The following data were extracted from the laboratory analysis and bacterial platecounts:
SeawaterTDS 35,000 milligrams per literCa + + 350 milligrams per liter as Ca+ +
SO=4 2,650 milligrams per liter
pH 7.2Bacterial count 10/100 milliliters (membrane filter technique)Turbidity 15 nephelometric turbidity units
Assume that the following was obtained from analysis of the design of the internal combusion engine to be used forpower production.
Waste heat: Approximately 1.0 x 10⁹ British thermal units per day between 264 degrees Fahrenheit and 68 degreesFahrenheit.
Calculating the cost of electricity from the power utility $.50/kilowatt hour versus the cost of waste heat steam whichcan be produced at less than $0.03/1.0 x 106 British thermal units gives the following:
$0.50/kilowatt hour/$0.03/1.0 x 106 British thermal unit = 16.67 x 10⁶ British thermal unit per kilowatt hourUse of this information and table 4-2 indicates that Rule 3 is applicable for this facility (see fig. A-10). Steam and
electricity costs are compared as a ratio to eliminate dollar value changes, but technology could easily change the 10.0 x10⁶ British thermal unit per kilowatt hour guideline. Rule 3 states that a comparison between reverse osmosis anddistillation/condensation systems should be made. Additional testing should include an alum jar test and 10-micron filterplugging, as well as evaluation of the effects of ultraviolet (UV) sterilizations.
Assume that the results from the recommended testing indicate that the turbidity can be reduced by alum addition tobelow 1 nephelometric turbidity unit, and a 10-micron filter will not plug rapidly on this treated water. Assume that acomputer analysis in addition to figure 3-2, TM 5-813-1, shows scaling is not a problem until the total dissolved solids isconcentrated about 1.5 times at temperatures below 212 degrees Fahrenheit.Use of table 4-3 indicates that Rule 3 applies for this facility (see fig. A-11).Rule 5 states that if temperature over 212 degrees Fahrenheit are economical for distillation atthis site, acid feed may be necessary to prevent scaling.A distillation/condensation system with an associated vapor-compression system should be evaluated. Specificationsshould be prepared. A drawing of a sea water distillation system capable of recompressing low-grade steam is shown infigure A-12.
A-3. Calcium sulfate solubility product (Ca S04 · XH2O) scale. As can be seen below, the calculation of a solubility limitis moderately complex for a simple, pure solute at low concentration. Hand calculation is not practical in solutionscontaining a few percent of several cationic and/or several anionic species. Most manufacturers have computer programsthat include the concentration polarization factors and any other surface-related factors that set the scaling limits for theirproducts. The following is a sample calculation of calcium ion sulfate ion, acid-base solubility for 64 degrees Fahrenheit.To estimate solubilities for distillation condensation or other temperatures different from 64 degrees Fahrenheit, thesolubility product for calcium sulfate at temperatures up to 392 degrees Fahrenheit can be found in reference (4).
These calculations are suitable for initial design and process selection (see tables 4-2 and 4-3). The principlepurpose of these calculations is to indicate waters that are well below saturation and therefore do not present scalingproblems. A full computer evaluation of scaling potential should be performed by the manufacturer as part of the final bid.
A-12
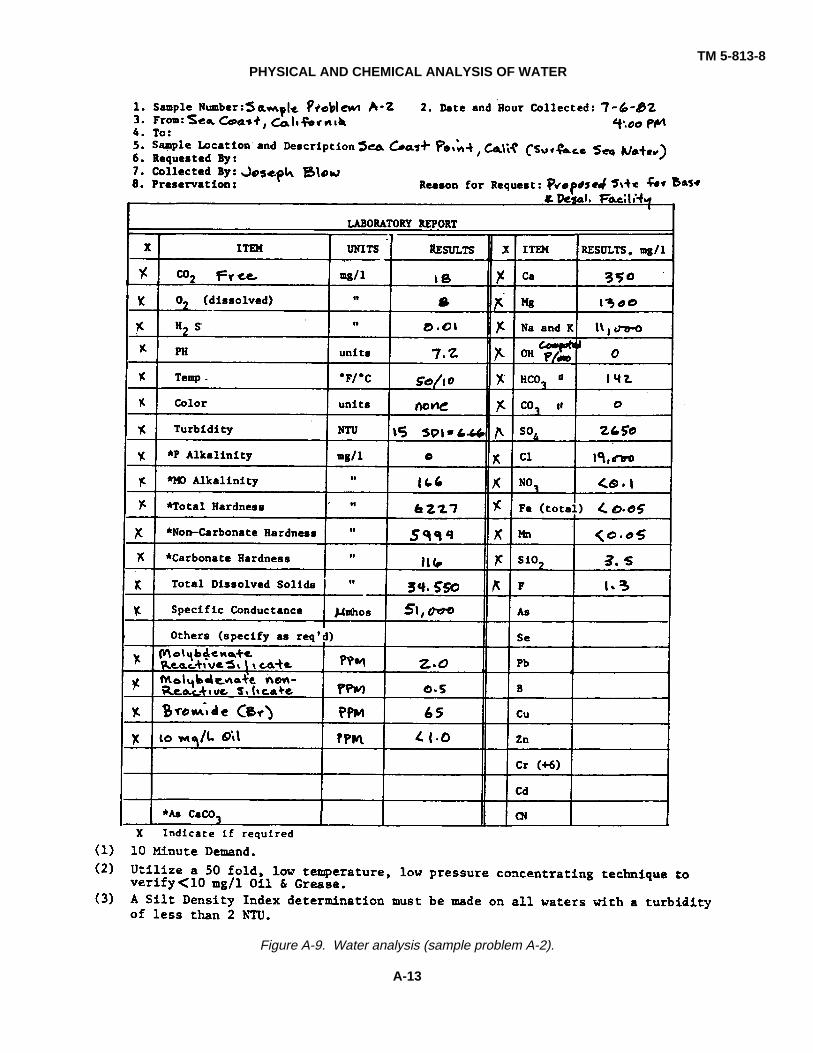
TM 5-813-8PHYSICAL AND CHEMICAL ANALYSIS OF WATER
Figure A-9. Water analysis (sample problem A-2).
A-13
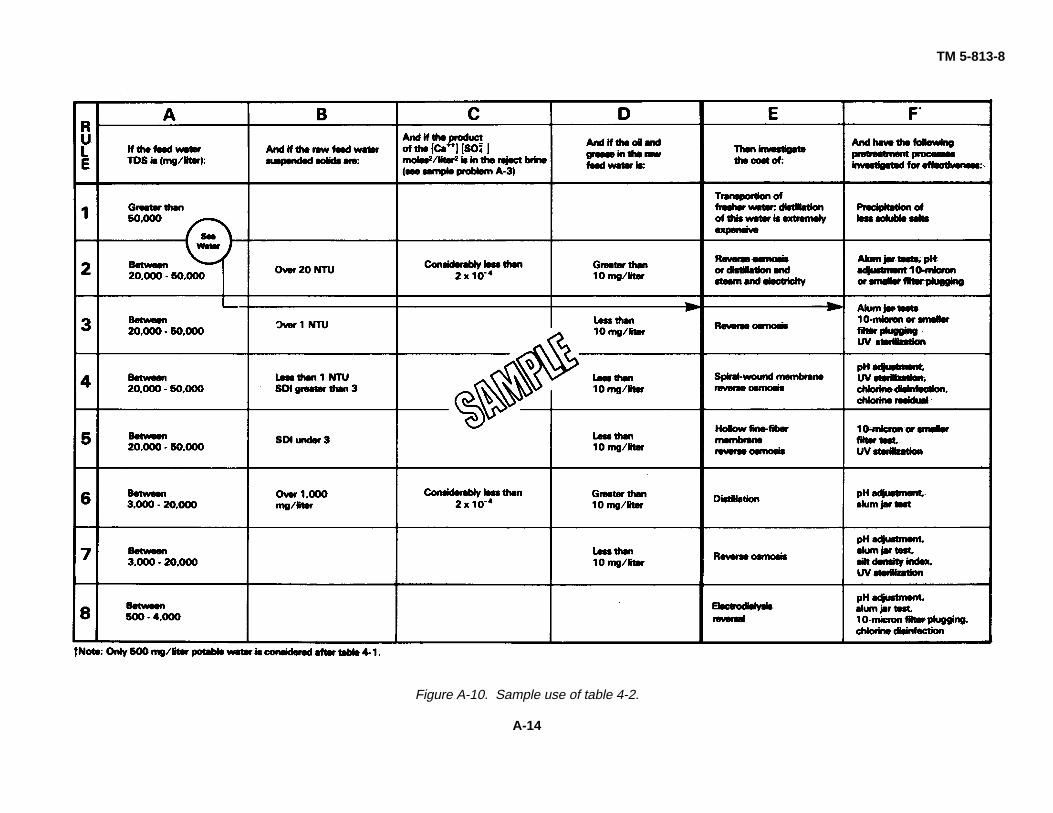
TM 5-813-8
Figure A-10. Sample use of table 4-2.
A-14
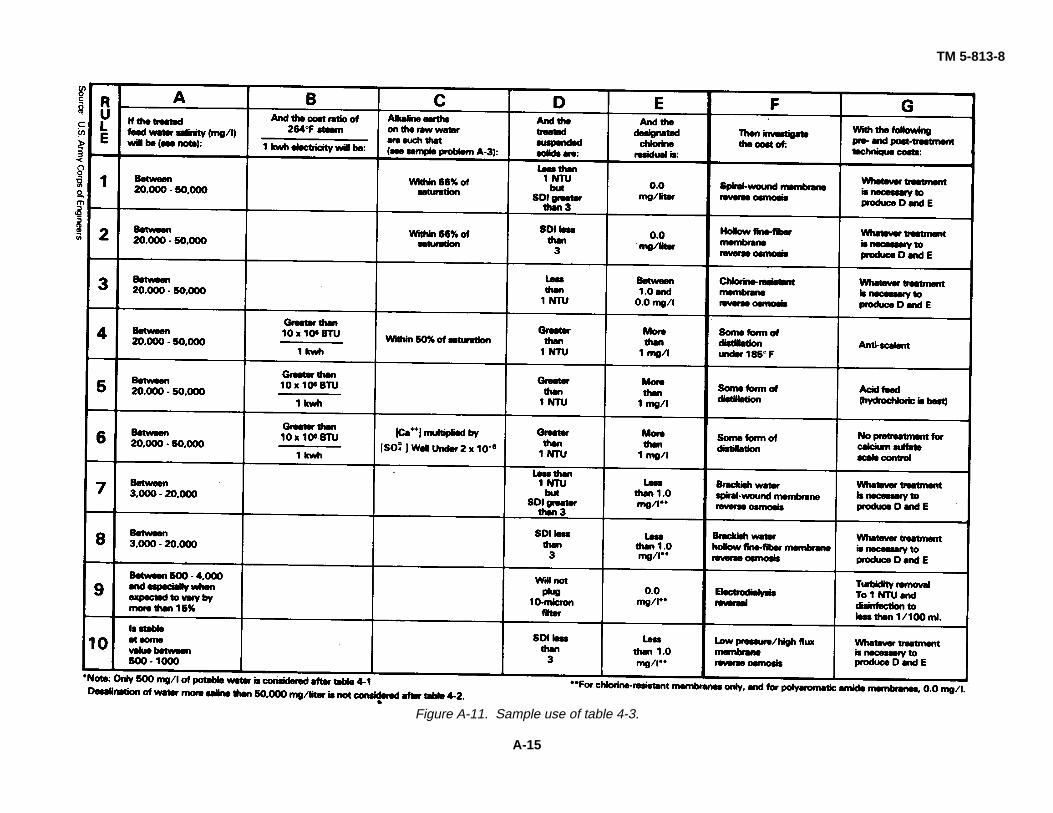
TM 5-813-8
Figure A-11. Sample use of table 4-3.
A-15
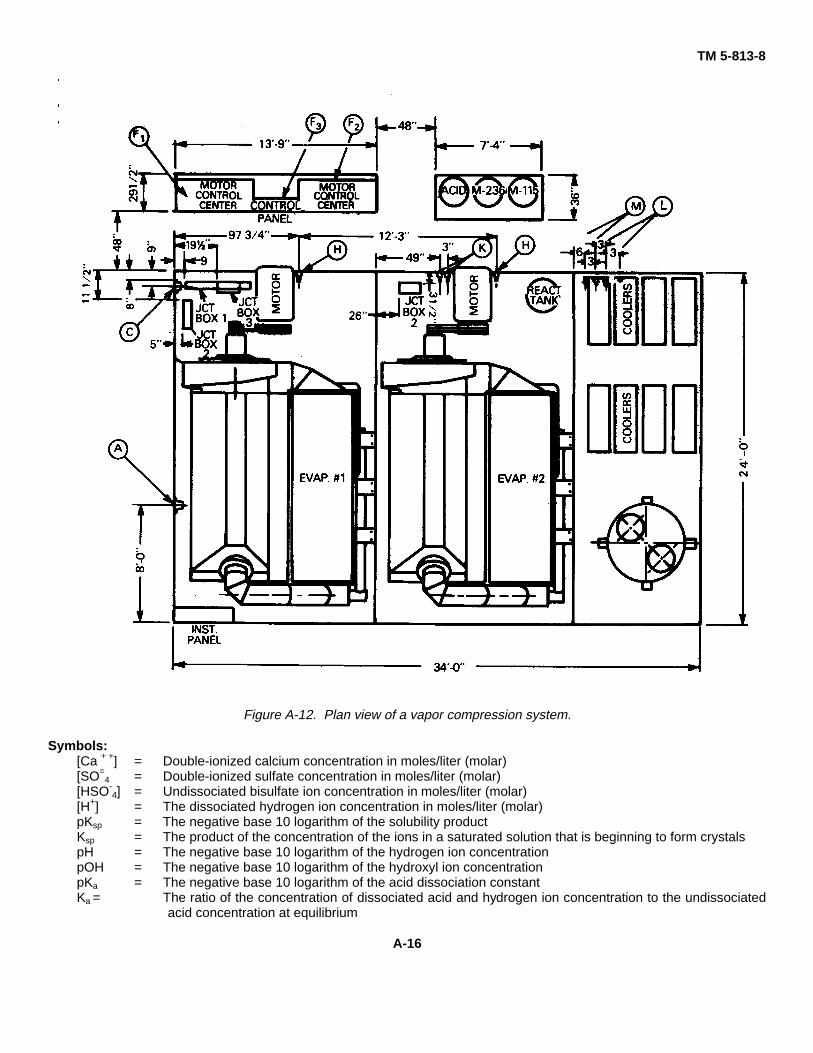
TM 5-813-8
Figure A-12. Plan view of a vapor compression system.
Symbols:[Ca + +] = Double-ionized calcium concentration in moles/liter (molar)[SO=
4 = Double-ionized sulfate concentration in moles/liter (molar)[HSO-
4] = Undissociated bisulfate ion concentration in moles/liter (molar)[H+] = The dissociated hydrogen ion concentration in moles/liter (molar)pKsp = The negative base 10 logarithm of the solubility productKsp = The product of the concentration of the ions in a saturated solution that is beginning to form crystalspH = The negative base 10 logarithm of the hydrogen ion concentrationpOH = The negative base 10 logarithm of the hydroxyl ion concentrationpKa = The negative base 10 logarithm of the acid dissociation constantKa = The ratio of the concentration of dissociated acid and hydrogen ion concentration to the undissociated
acid concentration at equilibrium
A-16
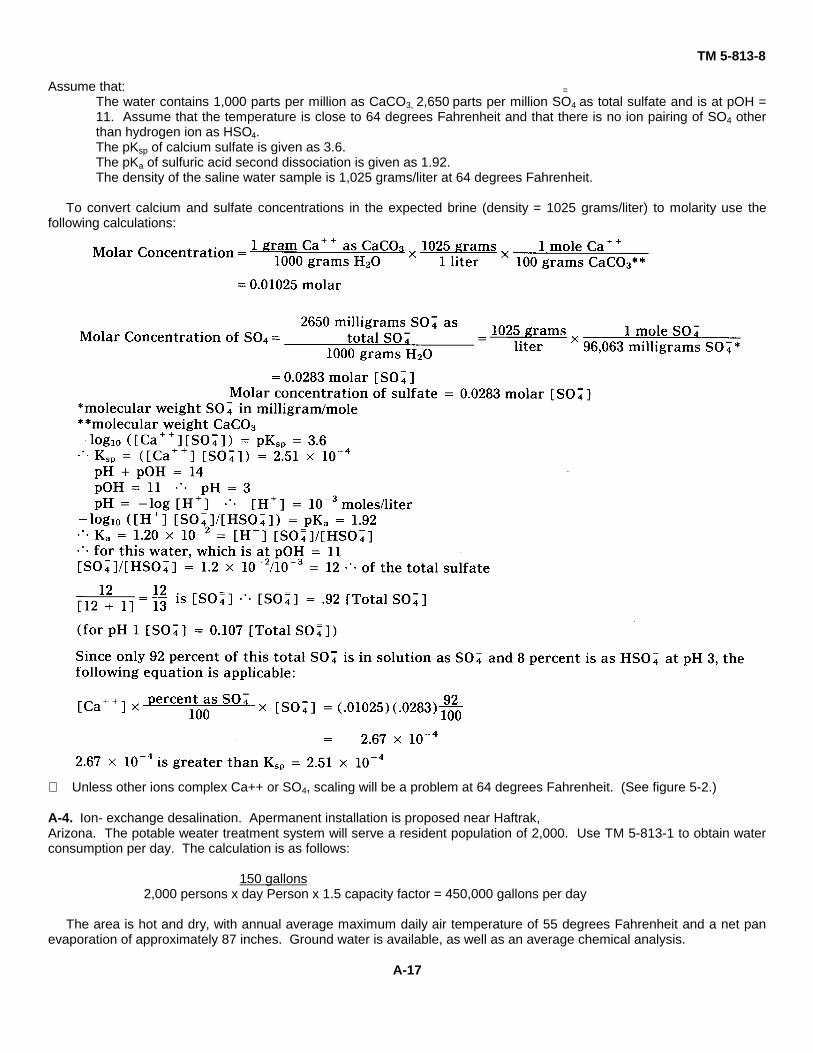
TM 5-813-8
Assume that: =
The water contains 1,000 parts per million as CaCO3, 2,650 parts per million SO4 as total sulfate and is at pOH =11. Assume that the temperature is close to 64 degrees Fahrenheit and that there is no ion pairing of SO4 otherthan hydrogen ion as HSO4.The pKsp of calcium sulfate is given as 3.6.The pKa of sulfuric acid second dissociation is given as 1.92.The density of the saline water sample is 1,025 grams/liter at 64 degrees Fahrenheit.
To convert calcium and sulfate concentrations in the expected brine (density = 1025 grams/liter) to molarity use thefollowing calculations:
∴ Unless other ions complex Ca++ or SO4, scaling will be a problem at 64 degrees Fahrenheit. (See figure 5-2.)
A-4. Ion- exchange desalination. Apermanent installation is proposed near Haftrak,Arizona. The potable weater treatment system will serve a resident population of 2,000. Use TM 5-813-1 to obtain waterconsumption per day. The calculation is as follows:
150 gallons2,000 persons x day Person x 1.5 capacity factor = 450,000 gallons per day
The area is hot and dry, with annual average maximum daily air temperature of 55 degrees Fahrenheit and a net panevaporation of approximately 87 inches. Ground water is available, as well as an average chemical analysis.
A-17
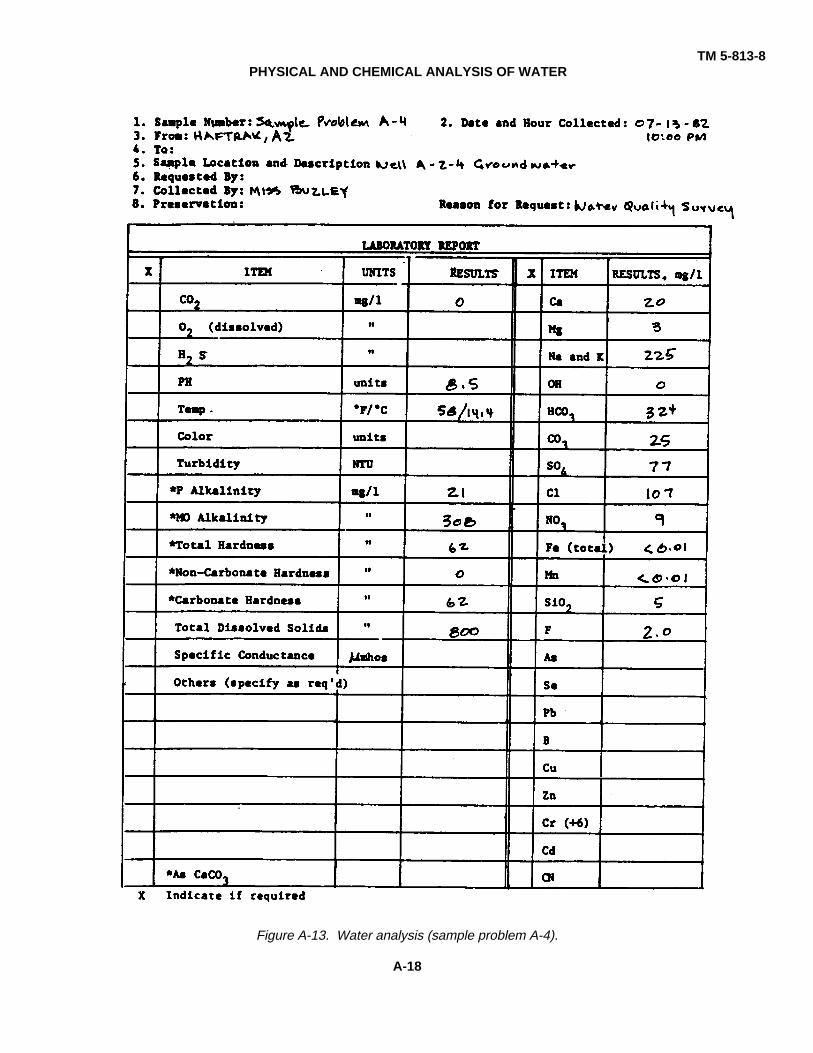
TM 5-813-8PHYSICAL AND CHEMICAL ANALYSIS OF WATER
Figure A-13. Water analysis (sample problem A-4).
A-18
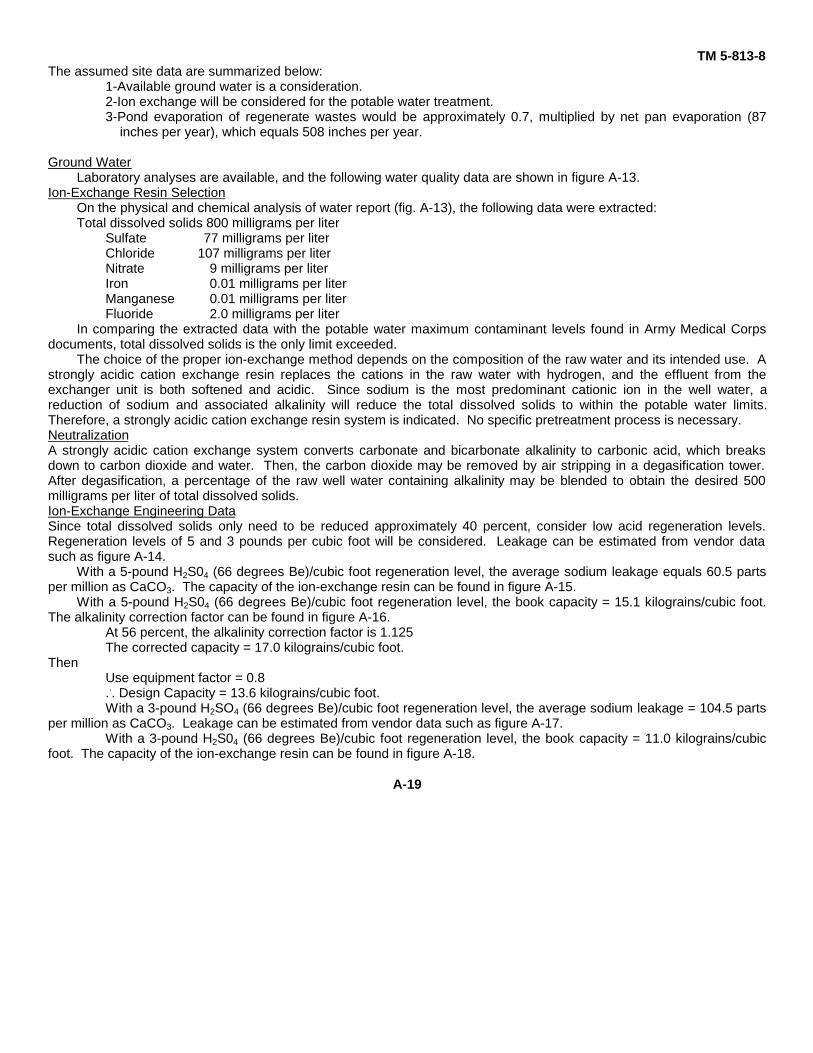
TM 5-813-8The assumed site data are summarized below:
1-Available ground water is a consideration.2-Ion exchange will be considered for the potable water treatment.3-Pond evaporation of regenerate wastes would be approximately 0.7, multiplied by net pan evaporation (87
inches per year), which equals 508 inches per year.
Ground WaterLaboratory analyses are available, and the following water quality data are shown in figure A-13.
Ion-Exchange Resin SelectionOn the physical and chemical analysis of water report (fig. A-13), the following data were extracted:Total dissolved solids 800 milligrams per liter
Sulfate 77 milligrams per literChloride 107 milligrams per literNitrate 9 milligrams per literIron 0.01 milligrams per literManganese 0.01 milligrams per literFluoride 2.0 milligrams per liter
In comparing the extracted data with the potable water maximum contaminant levels found in Army Medical Corpsdocuments, total dissolved solids is the only limit exceeded.
The choice of the proper ion-exchange method depends on the composition of the raw water and its intended use. Astrongly acidic cation exchange resin replaces the cations in the raw water with hydrogen, and the effluent from theexchanger unit is both softened and acidic. Since sodium is the most predominant cationic ion in the well water, areduction of sodium and associated alkalinity will reduce the total dissolved solids to within the potable water limits.Therefore, a strongly acidic cation exchange resin system is indicated. No specific pretreatment process is necessary.NeutralizationA strongly acidic cation exchange system converts carbonate and bicarbonate alkalinity to carbonic acid, which breaksdown to carbon dioxide and water. Then, the carbon dioxide may be removed by air stripping in a degasification tower.After degasification, a percentage of the raw well water containing alkalinity may be blended to obtain the desired 500milligrams per liter of total dissolved solids.Ion-Exchange Engineering DataSince total dissolved solids only need to be reduced approximately 40 percent, consider low acid regeneration levels.Regeneration levels of 5 and 3 pounds per cubic foot will be considered. Leakage can be estimated from vendor datasuch as figure A-14.
With a 5-pound H2S04 (66 degrees Be)/cubic foot regeneration level, the average sodium leakage equals 60.5 partsper million as CaCO3. The capacity of the ion-exchange resin can be found in figure A-15.
With a 5-pound H2S04 (66 degrees Be)/cubic foot regeneration level, the book capacity = 15.1 kilograins/cubic foot.The alkalinity correction factor can be found in figure A-16.
At 56 percent, the alkalinity correction factor is 1.125The corrected capacity = 17.0 kilograins/cubic foot.
ThenUse equipment factor = 0.8... Design Capacity = 13.6 kilograins/cubic foot.With a 3-pound H2SO4 (66 degrees Be)/cubic foot regeneration level, the average sodium leakage = 104.5 parts
per million as CaCO3. Leakage can be estimated from vendor data such as figure A-17.With a 3-pound H2S04 (66 degrees Be)/cubic foot regeneration level, the book capacity = 11.0 kilograins/cubic
foot. The capacity of the ion-exchange resin can be found in figure A-18.
A-19
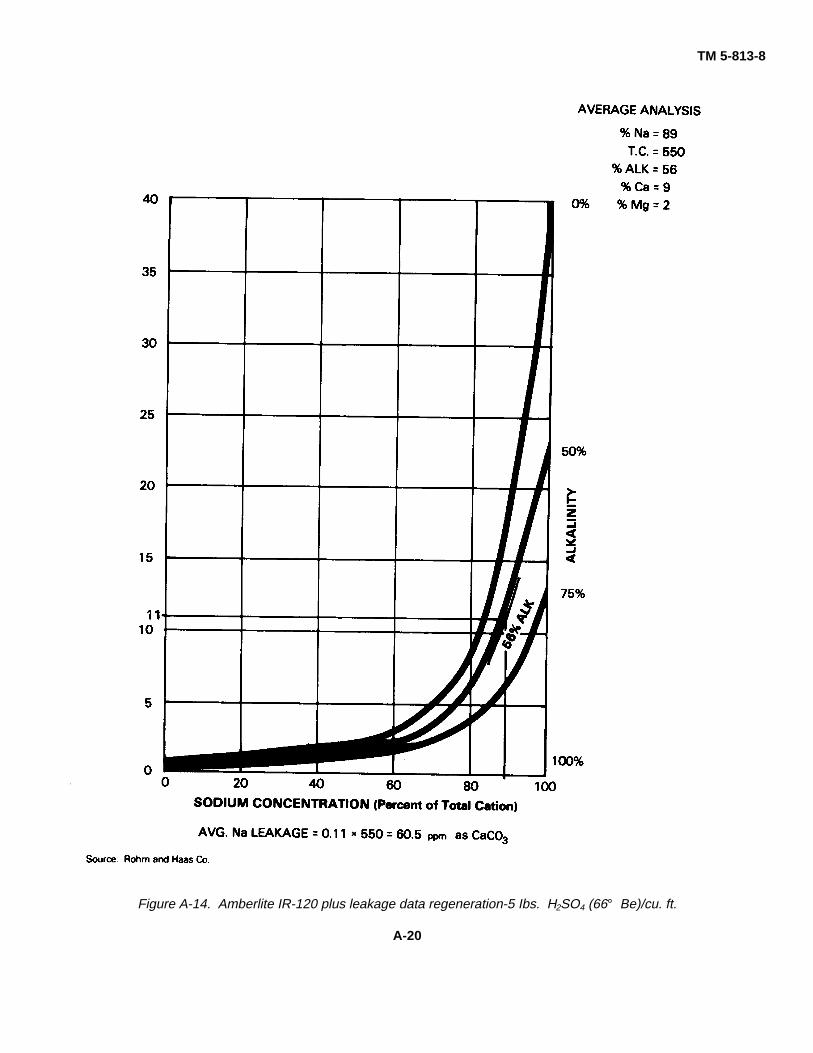
TM 5-813-8
Figure A-14. Amberlite IR-120 plus leakage data regeneration-5 Ibs. H2SO4 (66° Be)/cu. ft.
A-20
TM 5-813-8
BOOK CAPACITY = 15.1 KGR/Ft3
Source Rohm and Haas Co
Figure A-15. Amberlite IR-120 plus iso-capacity data regeneration-5 Ibs. H2S04 (66° Be)/cu. ft.
With a 5-pound H2SO4 (66 degrees Be)/cubic foot regeneration level, the book capacity = 15.1 kilograins/cubic foot.The alkalinity correction factor can be found in figure A-19.Then
The corrected capacity = 12.4 kilograins/cubic foot.Then
Use equipment factor = 0.8.... Design Capacity = 9.9 kilograins/cubic foot.
Water Analyses SummaryTable A-1 is a summary of the average water constituents at different stages in the ion-exchange treatment process.
A-21
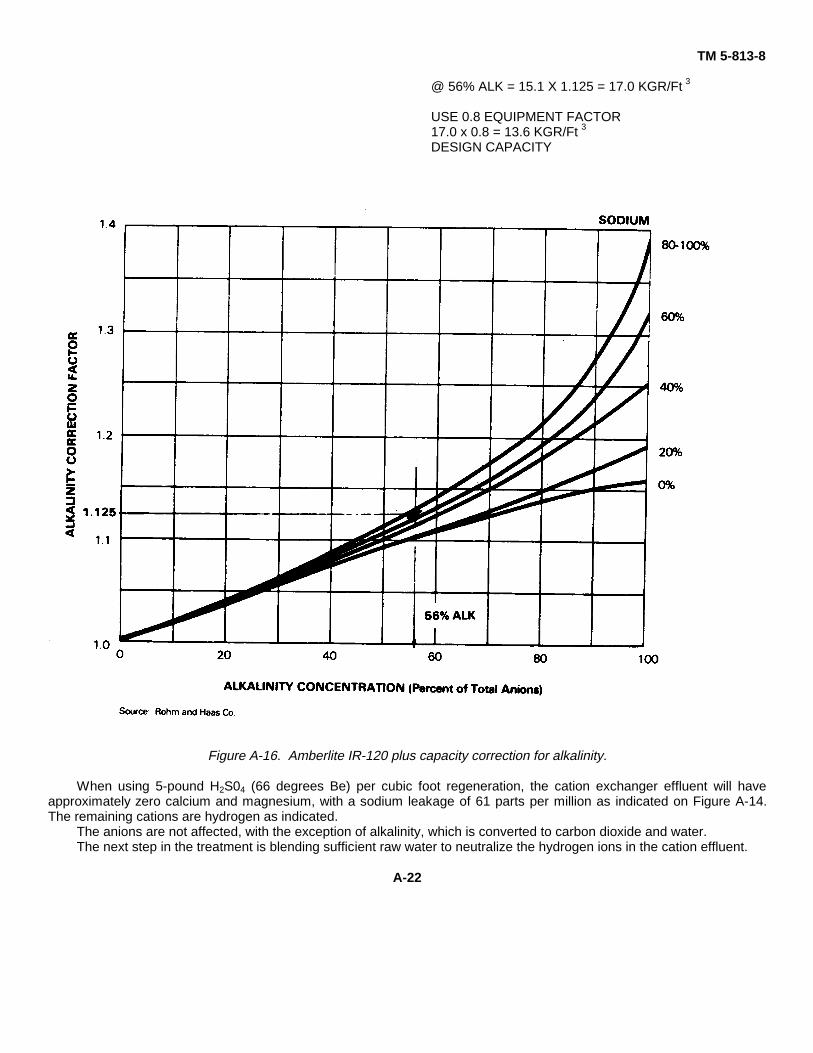
TM 5-813-8
@ 56% ALK = 15.1 X 1.125 = 17.0 KGR/Ft 3
USE 0.8 EQUIPMENT FACTOR17.0 x 0.8 = 13.6 KGR/Ft 3
DESIGN CAPACITY
Figure A-16. Amberlite IR-120 plus capacity correction for alkalinity.
When using 5-pound H2S04 (66 degrees Be) per cubic foot regeneration, the cation exchanger effluent will haveapproximately zero calcium and magnesium, with a sodium leakage of 61 parts per million as indicated on Figure A-14.The remaining cations are hydrogen as indicated.
The anions are not affected, with the exception of alkalinity, which is converted to carbon dioxide and water.The next step in the treatment is blending sufficient raw water to neutralize the hydrogen ions in the cation effluent.
A-22
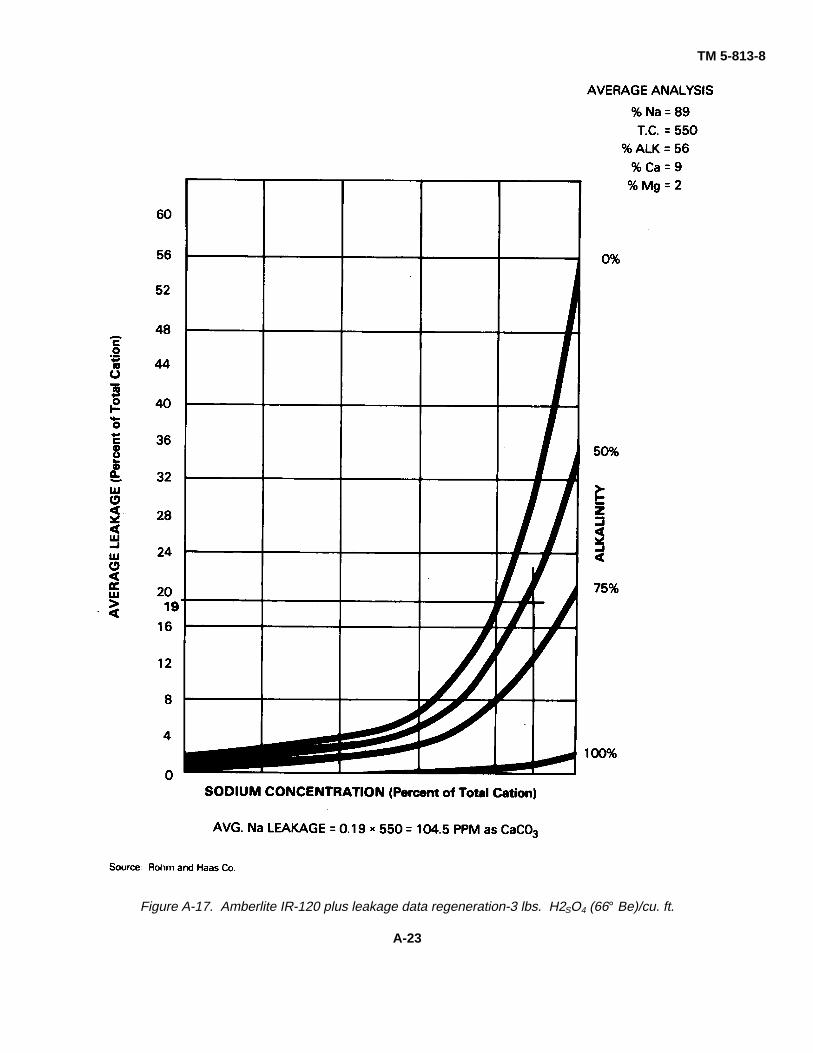
TM 5-813-8
Figure A-17. Amberlite IR-120 plus leakage data regeneration-3 lbs. H2SO4 (66° Be)/cu. ft.
A-23
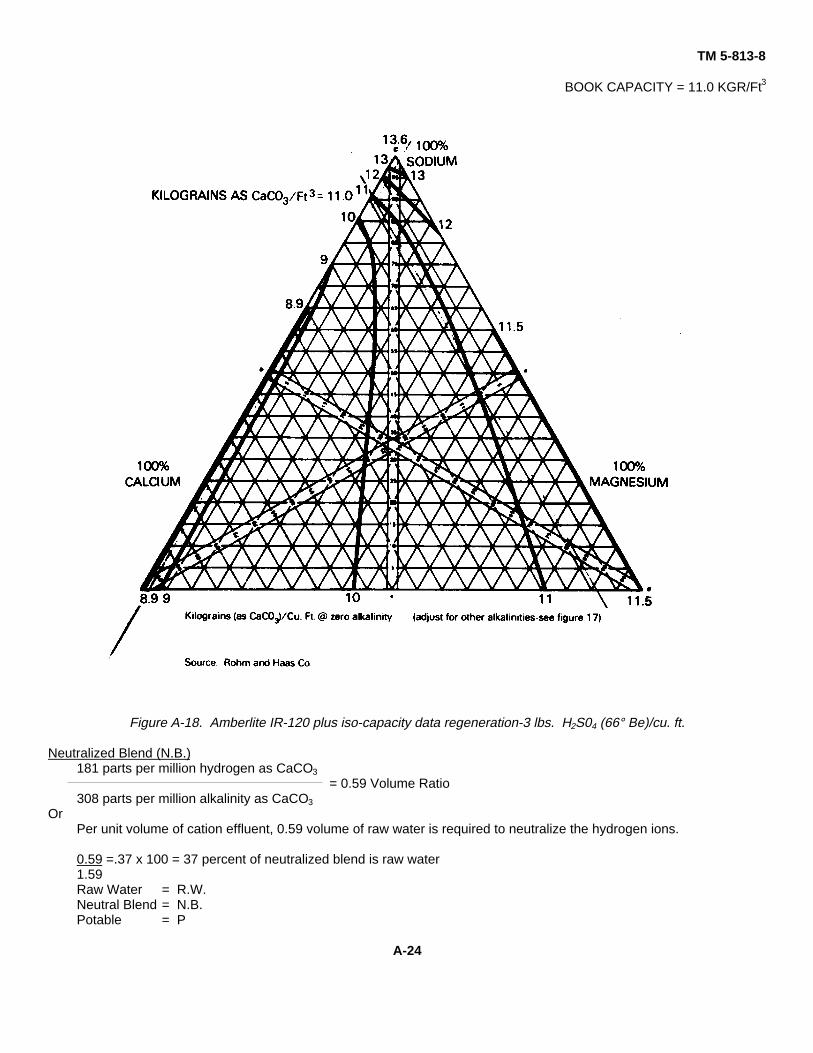
TM 5-813-8
BOOK CAPACITY = 11.0 KGR/Ft3
Figure A-18. Amberlite IR-120 plus iso-capacity data regeneration-3 lbs. H2S04 (66° Be)/cu. ft.
Neutralized Blend (N.B.)181 parts per million hydrogen as CaCO3
= 0.59 Volume Ratio308 parts per million alkalinity as CaCO3
OrPer unit volume of cation effluent, 0.59 volume of raw water is required to neutralize the hydrogen ions.
0.59 =.37 x 100 = 37 percent of neutralized blend is raw water1.59Raw Water = R.W.Neutral Blend = N.B.Potable = P
A-24
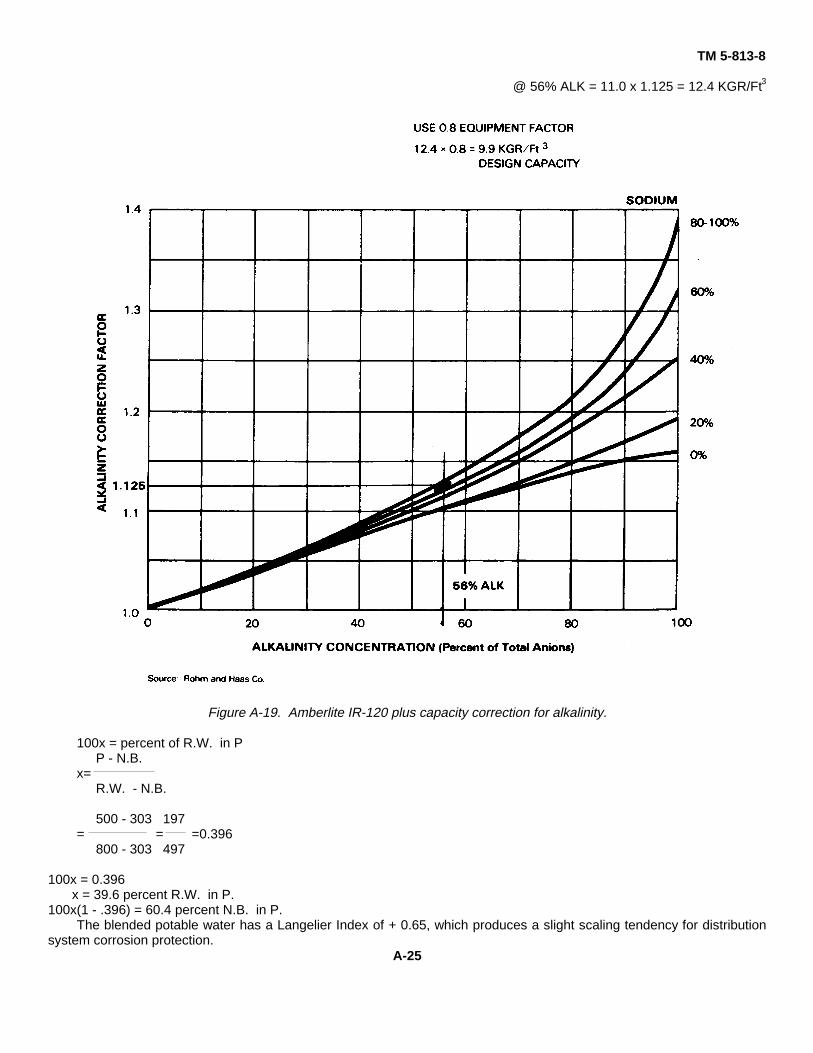
TM 5-813-8
@ 56% ALK = 11.0 x 1.125 = 12.4 KGR/Ft3
Figure A-19. Amberlite IR-120 plus capacity correction for alkalinity.
100x = percent of R.W. in PP - N.B.
x=R.W. - N.B.
500 - 303 197= = =0.396
800 - 303 497
100x = 0.396x = 39.6 percent R.W. in P.
100x(1 - .396) = 60.4 percent N.B. in P.The blended potable water has a Langelier Index of + 0.65, which produces a slight scaling tendency for distribution
system corrosion protection.A-25
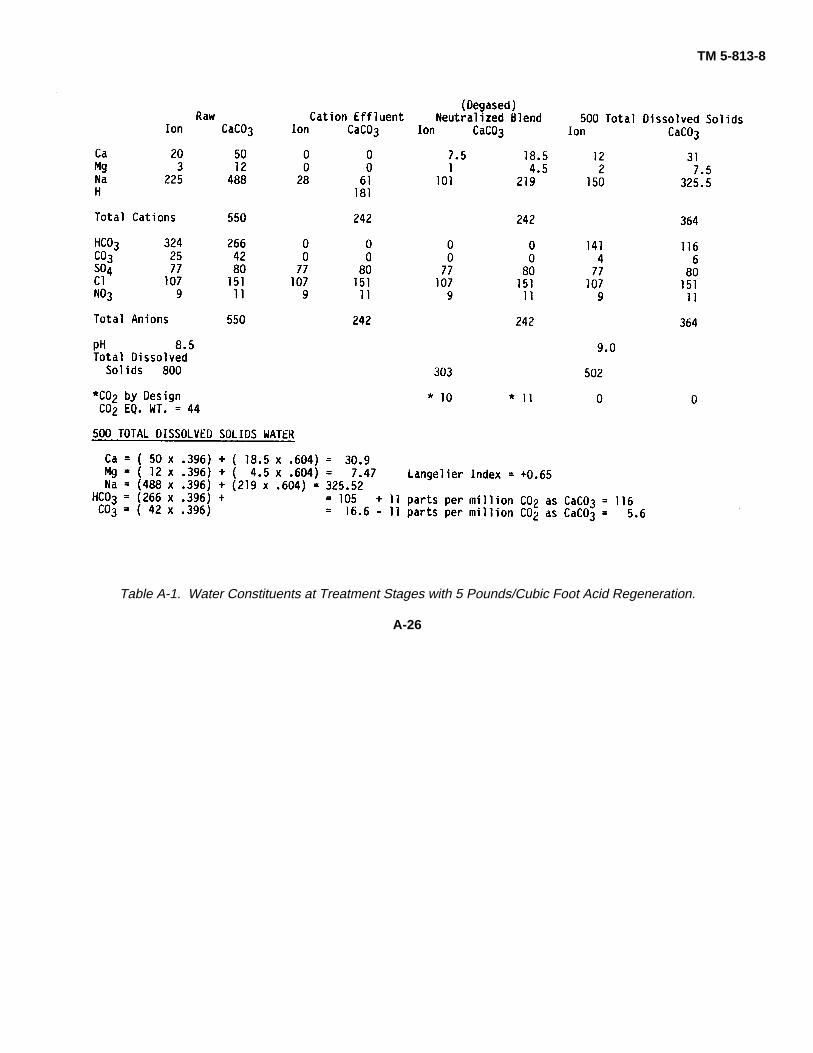
TM 5-813-8
Table A-1. Water Constituents at Treatment Stages with 5 Pounds/Cubic Foot Acid Regeneration.
A-26
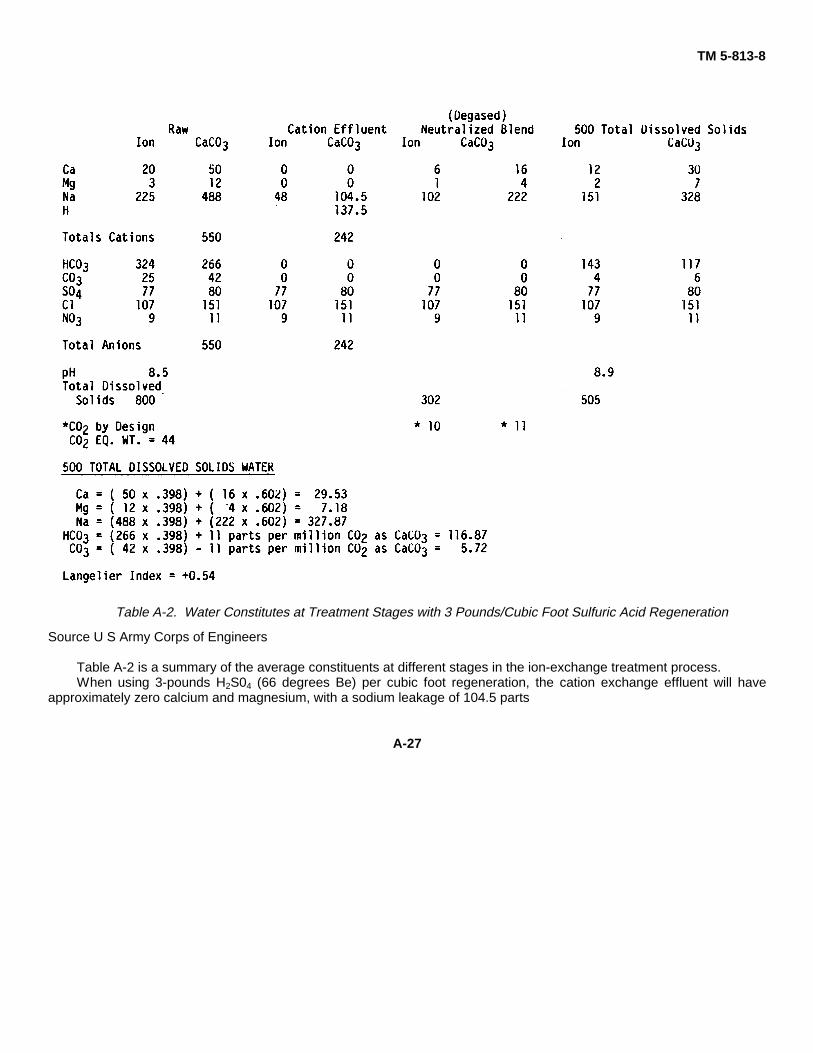
TM 5-813-8
Source U S Army Corps of Engineers
Table A-2 is a summary of the average constituents at different stages in the ion-exchange treatment process.When using 3-pounds H2S04 (66 degrees Be) per cubic foot regeneration, the cation exchange effluent will have
approximately zero calcium and magnesium, with a sodium leakage of 104.5 parts
A-27
Table A-2. Water Constitutes at Treatment Stages with 3 Pounds/Cubic Foot Sulfuric Acid Regeneration
TM 5-813-8
per million as indicated on figure A-17. The remaining cations are hydrogen as indicated.After degasification of the neutral blend, the carbon dioxide is 10 parts per million based on the degasifier design.
Raw water is again blended after degasification to achieve a 500 milligram per liter of total dissolved solids product.Neutralized Blend (N.B.)
137.5 parts per million hydrogen as CaCO3 0.45 volume ratio308 parts per million alkalinity as CaCO3
Or0.45 Volume1.45 Volume = 0.32 x 100 = 32 percent of neutralized blend is raw water
Two-step blending is considered to take advantage of the carbonate in the raw water, which will neutralize theremaining carbon dioxide and reduce potential corrosion in the distribution system.
Blend of Well Water and Neutral Degased Water
R.W. = 800 milligrams per liter of Total Dissolved SolidsN.B. = 302 milligrams per liter of Total Dissolved SolidsP = 500 milligrams per liter of Total Dissolved Solids100x = Percent of R.W. in P
P - N.B.= R.W. - N.B.
500 - 302x= 800 - 302 = 0.398100x = 0.398x = 39.8 R.W. in P100x (1 - .398) = 60.2 percent of N.B. in P
The blended potable water has a Langelier Index of +0.54, which indicates a slight scaling tendency for thedistribution system corrosion protection.Chemical Requirements
3 pounds/cubic foot regeneration level... In 1,000 gallons of potable water
398 gallons of raw water to 500 total milligrams per liter of dissolved solids+ (1,000 - 398) x .32 = 193 gallons to neutralize
Or398 + 193 = 591 gallons of raw water and 409 gallons of cation effluent
So40.9 percent of potable water is treated with the cation exchanger.
Acid UsageCation Regeneration Efficiency
50 grains CaCO3 x (3 pounds/cubic feet) (.93 pounds acid/pounds) (7 kilograins/pounds) = 2.0149 grains H2S04 9.9 kilograins/cubic feet
or 200-percent stoichiometric
A-28
TM 5-813-8Cations Removed Per Gallons of Potable Water
(409 gallons) 488 parts per million - 104.5 parts per million 1 poundkilogallon 17.1 parts per million/grains/gallon 7000 grains
1.31 pounds as CaCO3
1000 gallons potable water
At 200-percent regeneration efficiency:
Acid Required = 2.0 x 1.31 pounds as CaCO3 49 equivalent weight acidkilogallons potable water 50 equivalent weight CaCO3
x 1 pound H2S04
.995 percent H2S04
= 2.58 pounds 99.5 percent H2SO4 per 1000 gallons potable water
Waste Acid
(2.0 - 1.0)1.29 pounds acid 1.29 pounds 99.5 percent H2S04
kilogallons potable water 1000 gallons potable water
Chemical Costs
Acid Cost = 3 cents/pound 99.5 percent H2S04NaOH Cost = 10 cents/pound 100 percent NaOHRegeneration Acid = 1.29 pounds 99.5 percent H2SO4If neutralization of the waste acid is required prior to disposal:Waste Acid = 1.29 pounds 99.5 percent H2S04
1000 gallons potable waterIf we use 100 percent NaOH
40 equivalent weight NaOHNaOH = 1.32 pounds of 100% acid as CaCO3 x 50 equivalent weight CaCO3
= 1.05 pounds of 100 percent NaOH1000 gallons potable water
Summary of Cost Per 1000 Gallons of Potable WaterCation exchange acid usage = 1.29 pounds x 3.0 cents = 3.87 centsWaste acid = 1.29 pounds x 3.0 cents = 3.87 centsNeutralization NaOH = 1.05 pounds x 10 cents = 10.5 cents
5 Pounds/Cubic Foot Regeneration Level∴In 1000 gallons potable water
396 gallons raw water to 500 milligrams per liter of total dissolvedsolids + (1000 - 396) x .37 = 223.5 gallons to neutralization
Or396 + 223.5 = 619.5 gallons of raw water
And380.5 gallons of cation effluent
So:38 percent of potable water is treated with the cation exchanger
Acid UsageCation Regeneration Efficiency
A-29
x x
=
x
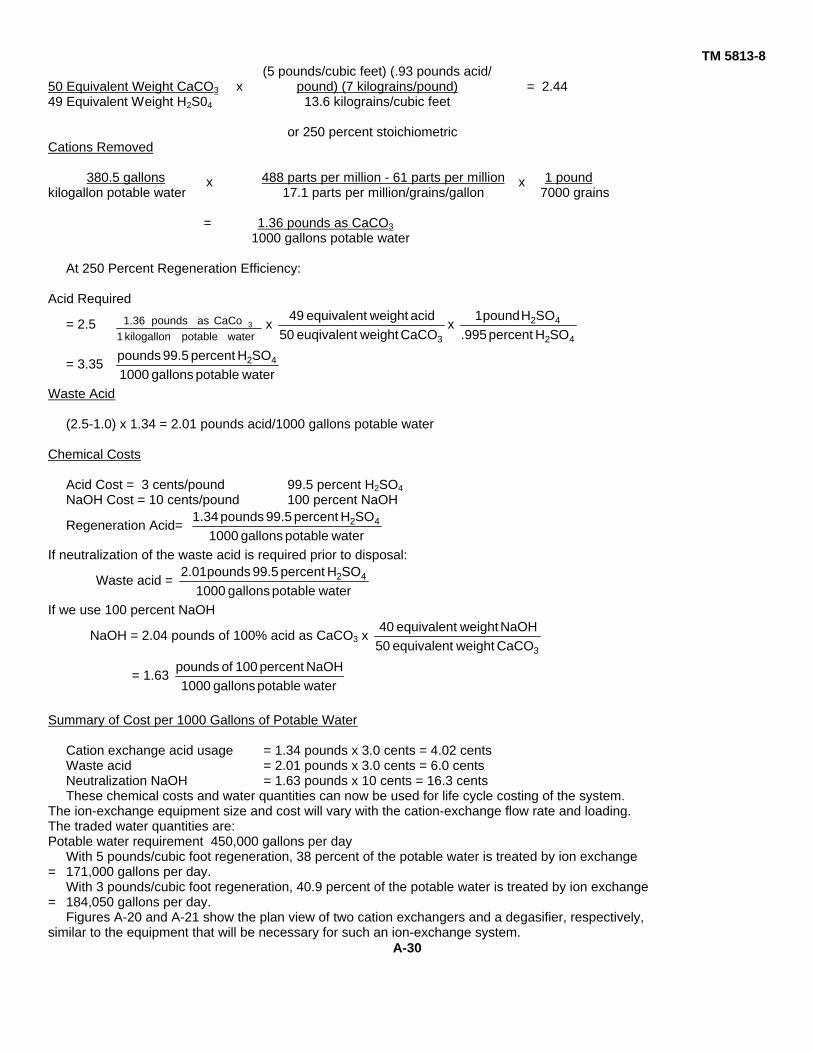
x
TM 5813-8(5 pounds/cubic feet) (.93 pounds acid/
50 Equivalent Weight CaCO3 x pound) (7 kilograins/pound) = 2.4449 Equivalent Weight H2S04 13.6 kilograins/cubic feet
or 250 percent stoichiometricCations Removed
380.5 gallons 488 parts per million - 61 parts per million 1 poundkilogallon potable water 17.1 parts per million/grains/gallon 7000 grains
= 1.36 pounds as CaCO3
1000 gallons potable water
At 250 Percent Regeneration Efficiency:
Acid Required
= 2.5 waterpotable kilogallon 1
CaCo as pounds 1.36 3 x 3CaCO weighteuqivalent 50
acid weightequivalent 49x
42
42
SOH percent 995.SOH pound 1
= 3.35 waterpotable gallons 1000
SOH percent 99.5 pounds 42
Waste Acid
(2.5-1.0) x 1.34 = 2.01 pounds acid/1000 gallons potable water
Chemical Costs
Acid Cost = 3 cents/pound 99.5 percent H2SO4
NaOH Cost = 10 cents/pound 100 percent NaOH
Regeneration Acid= waterpotable gallons 1000
SOH percent 99.5 pounds 1.34 42
If neutralization of the waste acid is required prior to disposal:
Waste acid = waterpotable gallons 1000
SOH percent 99.5 pounds 2.01 42
If we use 100 percent NaOH
NaOH = 2.04 pounds of 100% acid as CaCO3 x 3CaCO weightequivalent 50
NaOH weightequivalent 40
= 1.63 waterpotable gallons 1000NaOH percent 100 of pounds
Summary of Cost per 1000 Gallons of Potable Water
Cation exchange acid usage = 1.34 pounds x 3.0 cents = 4.02 centsWaste acid = 2.01 pounds x 3.0 cents = 6.0 centsNeutralization NaOH = 1.63 pounds x 10 cents = 16.3 centsThese chemical costs and water quantities can now be used for life cycle costing of the system.
The ion-exchange equipment size and cost will vary with the cation-exchange flow rate and loading.The traded water quantities are:Potable water requirement 450,000 gallons per day
With 5 pounds/cubic foot regeneration, 38 percent of the potable water is treated by ion exchange= 171,000 gallons per day.
With 3 pounds/cubic foot regeneration, 40.9 percent of the potable water is treated by ion exchange= 184,050 gallons per day.
Figures A-20 and A-21 show the plan view of two cation exchangers and a degasifier, respectively,similar to the equipment that will be necessary for such an ion-exchange system.
A-30
x
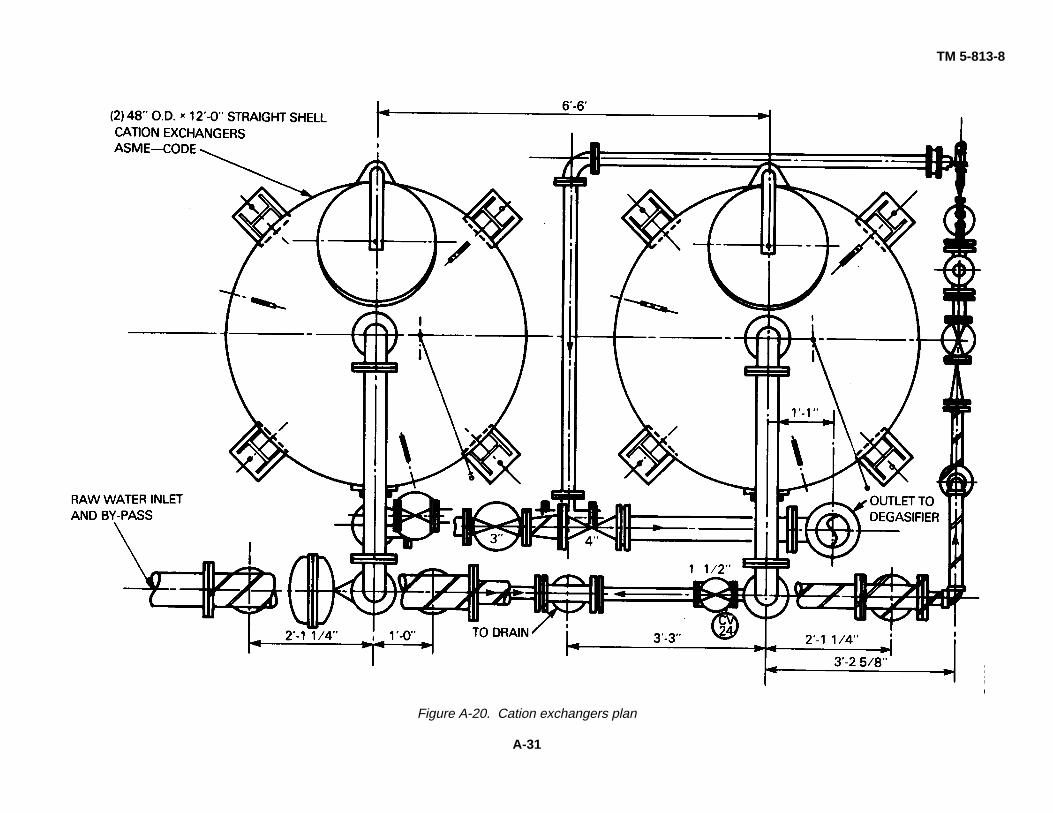
TM 5-813-8
Figure A-20. Cation exchangers plan
A-31
TM 5-813-8
.Figure A-21. Degasifier and clearwell plan.
A-32
TM 5-813-8A-5. Sample of multiple component water blend optimization. A base on a volcanic island in the Pacific is to beexpanded. While inadequate disinfection has often been blamed for the maladies of newcomers, the analysis requestedbefore pumping and drilling tests are continued indicate a hard, high total dissolved solids, sulfate-rich fresh water lens onthe island. For these reasons you have been assigned to direct a study to evaluate the various desalination options. Youhave good reason to believe that both water quantity and brine disposal will prevent the simple desalination of island wellwater to supply the projected 500 gallons per minute of potable water. A product-staged or double-pass reverse osmosissea water desalination facility will apparently be required.
Symbols: x = The flow rate of fully treated relatively pure second-stage reverse osmosis product water used inthe blend.
y = The flow rate of the first-stage reverse osmosis product water used to blend.z = The flow rate of island well water used to blend.Cx = The unit cost of second-stage reverse osmosis water (water x).Cy = The unit cost of first-stage reverse osmosis product water (water y).Cz = The unit cost of island well water (water z).C = The unit cost of final blended water.
SAMPLE PROBLEM ON BLENDING
Given: The high quality two-pass water (water x) contains:50.0 mg Cl-/liter1.2 mg SO4
=/literand 95.5 mg TDS/liter
The single-pass water (water y) contains:500 mg Cl-/liter30 mg SO4
=/liter85 mg TDS/liter
The well water presently being used (water z) contains:30 mg Cl-/liter400 mg SO4
=/liter729 mg TDS/liter
The final blend must meet TB MED 576 standards orCl- Û 250 mg Cl-/literSO4
= Û 250 mg SO4=/liter
TDS Û500 mg TDS/liter
i=n Σ Flowi Concentrationi ÷ Flow Total = Final Concentrationi=l
1=n Flowi Costi/Gallon ÷ Flow Total = Final Unit Water Cost = C Σ
Step 1: List Equationsa. Water Balance
x + y + z = 500b. Blend Concentration Constraints
Chloride 50x + 500y + 30z Û 500(250)Sulfate 1.2x + 30y + 400z Û 500(250)Total Dissolved Solids
95.5 + 851y + 729z Û 500(500)
A-33
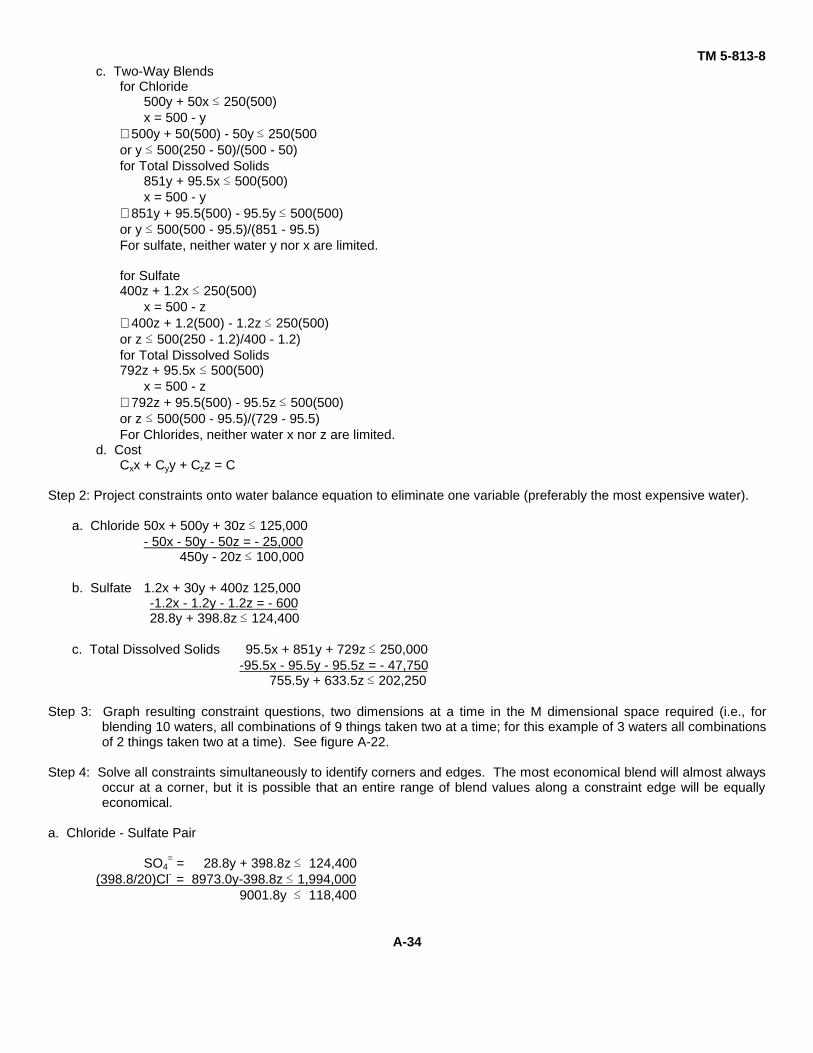
TM 5-813-8c. Two-Way Blends
for Chloride500y + 50x Û 250(500)x = 500 - y
∴500y + 50(500) - 50y Û 250(500or y Û 500(250 - 50)/(500 - 50)for Total Dissolved Solids
851y + 95.5x Û 500(500)x = 500 - y
∴851y + 95.5(500) - 95.5y Û 500(500)or y Û 500(500 - 95.5)/(851 - 95.5)For sulfate, neither water y nor x are limited.
for Sulfate400z + 1.2x Û 250(500)
x = 500 - z∴400z + 1.2(500) - 1.2z Û 250(500)or z Û 500(250 - 1.2)/400 - 1.2)for Total Dissolved Solids792z + 95.5x Û 500(500)
x = 500 - z∴792z + 95.5(500) - 95.5z Û 500(500)or z Û 500(500 - 95.5)/(729 - 95.5)For Chlorides, neither water x nor z are limited.
d. CostCxx + Cyy + Czz = C
Step 2: Project constraints onto water balance equation to eliminate one variable (preferably the most expensive water).
a. Chloride 50x + 500y + 30z Û 125,000- 50x - 50y - 50z = - 25,000
450y - 20z Û 100,000
b. Sulfate 1.2x + 30y + 400z 125,000-1.2x - 1.2y - 1.2z = - 60028.8y + 398.8z Û 124,400
c. Total Dissolved Solids 95.5x + 851y + 729z Û 250,000-95.5x - 95.5y - 95.5z = - 47,750
755.5y + 633.5z Û 202,250
Step 3: Graph resulting constraint questions, two dimensions at a time in the M dimensional space required (i.e., forblending 10 waters, all combinations of 9 things taken two at a time; for this example of 3 waters all combinationsof 2 things taken two at a time). See figure A-22.
Step 4: Solve all constraints simultaneously to identify corners and edges. The most economical blend will almost alwaysoccur at a corner, but it is possible that an entire range of blend values along a constraint edge will be equallyeconomical.
a. Chloride - Sulfate Pair
SO4= = 28.8y + 398.8z Û 124,400
(398.8/20)Cl- = 8973.0y-398.8z Û 1,994,0009001.8y Û 118,400
A-34
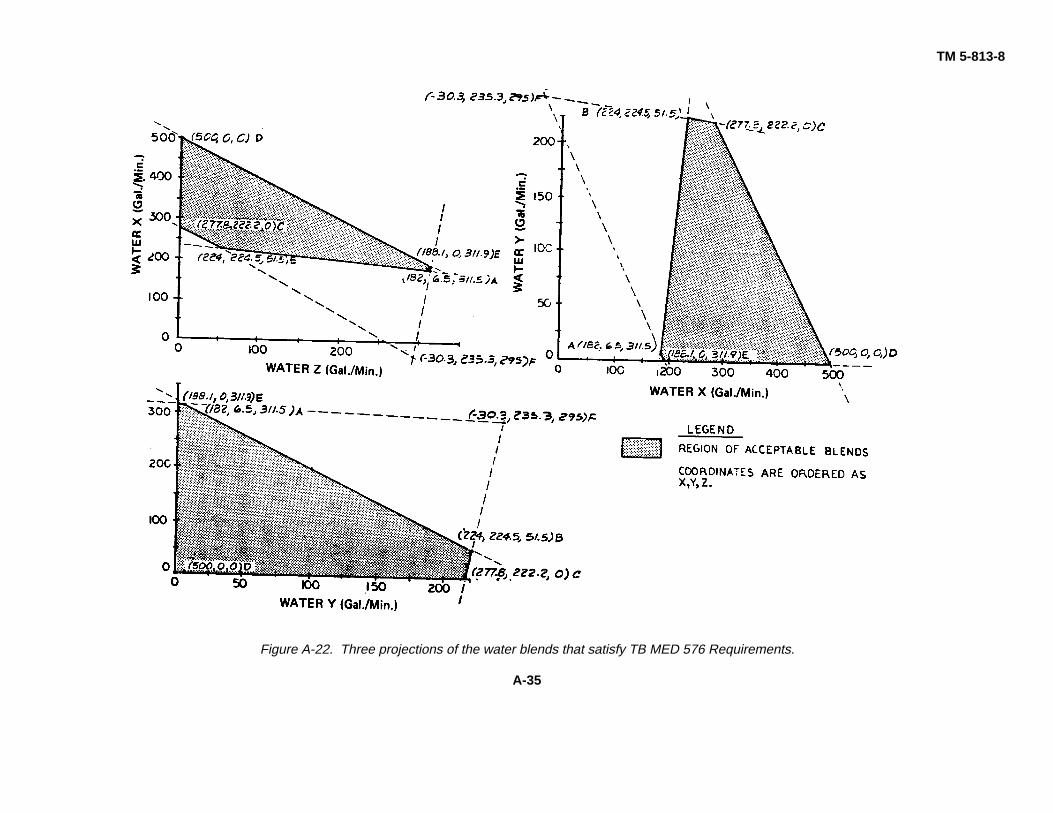
TM 5-813-8
Figure A-22. Three projections of the water blends that satisfy TB MED 576 Requirements.
A-35
TM 5-813-8
y Û 235.3z Û [124,400 - 28.8(235.3)]/398.8z Û 295x Û 500 - 235.3 - 295 = -30.3
but the Total Dissolved Solids in this corner is:-30.3(95.5) + 235.3(851) + 295(729) ?Û 250,000
412,401.65 Û 250,000Therefore, this corner is outside of the TDS constraint. See figure A-22 point F.
b. Total Dissolved Solids - Chloride Pair
Total Dissolved Solids 755.5y + 633.5z Û 202,250(633.5/20)Cl- = 14,253.75y - 633.5z Û 3,167,500
15,009.25y Û 3,369,750
y Û 224.5z Û [202,250 - 755.5(224.5)]/633.5z Û 51.5x Û 500 - 224.5 - 51.5 = 224
and for Sulfate SO4=;
224(1.2) + 224.5(30) + 51.5(400) ?Û 125,00027,603.8 Û 125,000
Therefore, this blend will have less than the maximum allowable sulfate concentration.
c. Total Dissolved Solids - Sulfate Pair
Total Dissolved Solids 755.5y Û 202,250 - 633.5z(755.5/28.8) SO4
= = -755.5y Û 3,263,340.3 - 10461.6z∴solving for the equal condition only202,250 - 633.5z = 3,263,340.3 - 10,461.6z
z = 311.5y Û [202,250 - 633.5(311.5)]/755.5y Û 6.5
using the equal condition makes z Û 311.5x Ú 500 - 311.5 - 6.5 = 182
and for chloride Cl-
182(50.0) + 6.5(500) + 311.5(30) Û 125,00021,695 Û 125,000
Therefore, this blend will have less than the maximum allowable chloride C1- concentration.Blends containing only high quality second-stage product water and one of the remaining waters x or y could bemost economical.
d. Well Water z and Water x1. Sulfate limited
z Û 500 (250 - 1.2)/(400 - 1.2)z Û 311.9 so x Ú 188.1
2. TDS limitedz Û 500(500 - 95.5)/729 - 95.5)z Û 319.25 so x Ú 180.75
3. Chloride cannot limit since both have chlorides below 250.
e. Single-Pass Reverse Osmosis Water y and Water x.
A-36
TM 5-813-81. Chloride limited
y < 500 (250 - 50.0)/(500 - 50.0)y < 222.2 so x Ú 277.8
2. TDS limitedy < 500(500 - 95.5)/(851 - 95.5)y < 267.7 so x > 232.3
3. Sulfate cannot limit since both waters have sulfates below 250. (The intercept at 4319.4 would require aremoval flow of -3819.4 of second-stage product water x to concentrate the split stream to 250 mg SO4/liter.)
f. Locate Inside Intercepts1. Since 311.9 < 319.25,
Sulfate limits use of waterz to z < 311.9 withx > 188.1
2. Since 222.2 < 267.7,Chloride limits use of watery to y < 222.2 withx > 277.8
Step 5: Identify the coordinates of the corners of the convex polyhedron of acceptable blends.In this case, the polyhedron is a pentagon with 5 corners.The coordinates of the corners of acceptability are:
x y z1- 500 0 02- 577.8 222.2 03- 188.1 0 311.94- 182 6.5 311.55- 224 224.5 51.5
Step 6: Use Cost Equation to make each corner and edge a minimum cost solution (use the graph to identify adjacentcorners).
a. All Second-Stage Product (No Blending)Cx 500 < 188.1 Cx + 311.9 Cz
and Cx 500 < 277.8 Cx + 222.2 CyTherefore, don’t blend at all if Cx < Cz and Cx < Cy
b. Blend of x and y Waters Only500Cx > 222.2 Cx + 277.8 Cy and 222.2 Cx + 277.8C y < 224 Cx + 224.5 Cy + 51.5 Cz
or Cx > Cyand 53.8 Cx < 2.3 Cy + 51.5 Czor Cx < 0.0427 Cy + 0.95725 CzTherefore, if the cost of water x was greater than the cost of water y, and less than 0.0427 Cy + 0.957 Cz then theblend of single- and double-pass sea water reverse osmosis products would be more economical than any blendcontaining well water.
c. Blend of x and z Water Only
500 Cx > 188.1 Cx + 311.9 Cz and 188.1 Cx + 311.9 Cz < 182 Cx + 6.5 Cy + 311.5 Cz
or Cx > Czand 6.1 Cx + .4 C2 < 6.5 Cyor Cx < 1.066 Cy - 0.066 Cz
Therefore, if the cost of water x was greater than the cost of water z, but less than 1.066 Cy - 0.066 Cz, then theblend of well water and double-pass sea water reverse osmosis product would be more economical than any blendcontaining any single-pass waters.
d. Blend at Point A Figure A-22 containing a small amount of single-pass reverse osmosis water y.
A-37
TM 5-813-8182 Cx + 6.5 Cy + 311.5 Cz < 224 Cx + 224.5 Cy + 51.5 Cz and 182 Cx + 6.5 Cy + 311.5 Cz< 188.1 CX + 311.9 Czor
260 Cz < 42 CX + 218 Cyand 0.4 Cz > 6.5 Cy - 6.1 Cxor16.25 Cy - 15.25 Cx < Cz c 0.1615 Cx + 0.838 CyTherefore, if the cost of well water is less than 0.1615 Cx + 0.838 Cy and greater than 16.25 Cy - 15.25 Cx, thenthe use of 6.5 gallons/minute of first-stage reverse osmosis product water in a blend to reduce the amount ofsecond-stage product needed, to dilute well water, from 188.1 gallons/minute to 182 gallons/minute will beeconomical.
e. Blending at Point B Figure A-22using 224 gallons/minute of water x
224.5 gallons/minute of water yand 51.5 gallons/minute of water x224 Cx + 224.5 Cy + 51.5 C, < 182 Cx + 6.5 Cy + 311.5 Cz, and 224 Cx + 224.5 Cy + 51.5 Cz< 277.8 Cx + 222.2 Cyor42 CX + 218 Cy < 260 Czand 51.5 Cz < 53.8 Cx - 23 Cyor0.1615 Cx + 0.838 Cy < Czand Cz < 1.0447 Cx - 0.0447 CyTherefore, if the cost of well water is greater than 0.1615 Cx + 0.838 Cy and less than 1.0447 Cx - 0.0447 Cy, thenthe use of a blend of 51.5 gallons/minute of product-staged double-pass reverse osmosis water, with 224.5gallons/minute of first-pass reverse osmosis product water and 224 gallons/minute of well water, would be themost economical blend.
Step 7: Make Reasonable Assumptions and Worst Case Scenariosa. The cost of second-stage reverse osmosis product water must be greater than the cost of first-stage reverse
osmosis product water, because second-stage water is made from first-stage water.b. The maximum recovery available with most triple-reject-staged reverse osmosis membrane module assemblies is
85%.c. The second-stage low-pressure desalination of first-stage product water is almost always less expensive than the
initial first-stage desalination of sea water.d. The expansion of a drain field collection or a well field system is almost always cheaper than the desalination of
even brackish water.
Step 8: Put Assumptions and Scenarios into Mathematical Forma. Using 2 from step 7
Cx > Cyb. Using a and b from step 7
CX > 1/.85 Cy = 1.176 Cyc. Using c and a from step 7
Cx < 2 Cy usuallyd. Using d from step 7
C2 < Cy usuallye. Using a and d above
Cx > Cy > Cz usuallyf. Using c and d above
1/2 Cx < Cy > Cy usuallyg. Using b and d above
.85 Cx > Cy > Cz usually
A-38
TM 5-813-8Step 9: Analyze the Minimum Corner and Edge Constraints Solutions from Step 6 with respect to the assumptions and
scenarios in Step 8.a. Since Cx > Cy and for the minimum cost solution to be all double-pass water such as Case a, Step 6, Cx > Cy,
blending should be done for economy.b. When water x and y are the only components of a blend Case B, Step 6 shows
Cx < 0.0427 Cy + .957 Czand Step 8, Case g shows.85 Cx > Cy > CzTherefore, 1.176 Cy 0.0427 Cy + .957 Czor 1.134 Cy < Cz,which violates the second half of Step 8, Case g, unless the cost of well water really is greater than 1.13 times thecost of first-stage reverse osmosis sea water desalination.
c. When water x and z are the only components of a blendCase C, Step 6 showsCx < 1.066 Cy - 0.066 Czand Step 8, Case b showsCx > 1.176 CyTherefore, 1.176 Cy < 1.066 Cy - 0.066 Czor 0.11 Cy < - 0.066z,so this cannot be an optimum solution unless someone is paying you to dispose of well water z.
d. When 6.5 gallons/minute of first-stage reverse osmosis product water is used in a triple blend Step 6, Case dshows16.25 Cy - 15.25 Cx < Cz < 0.1615 Cx
+ 0.838 Cyand Step 8, Case f shows.5 Cx < Cy > Cz usuallyTherefore,16.25 Cy - 15.25(2 Cy) < Cz < 0.1615(2Cy)
+ 0.838 Cyor - 14.25 Cy < Cz < 1.161 Cy,so for any cost from being paid 14.25 times the cost of water y to dispose of well water z to having water z cost1.161 times water y the optimum cost solution will be this triple blend.
e. When the acceptable triple blend of224 gallons/minute of water x224.5 gallons/minute of water y
and 51.5 gallons/minute of water zis most economical, Step 6, Case e shows0.1615 Cx + 0.838 Cy < Cz < 1.0447 Cx
- 0.0447 Cyand Step 8, Case f, shows.5 Cx < Cy > Cz usuallyand Step 8, Case g shows.85 Cx > Cy > Cz usuallyTherefore,(0.1615)(1.176 Cy) + 0.838 Cy < Cz 1.0447 (2 Cy)
- 0.0447 Cy1.0279 Cy < Cz < 2.0447 Cy
so this blend will be economical only if the cost of well water is greater than the cost of single-pass desalinated seawater by more than 1.03 times and less than 2.04 times as expensive as single-pass desalinated sea water. Theseconditions violate the second part of Step 8, Cases f and g.
Step 10: Draw Conclusions
a. The most economical blending strategy on the island will almost certainly be: 182 gallons/minute of high qualitysecond-stage, product-staged reverse osmosis desalinated sea water
A-39
TM 5-813-8
6.5 gallons/minute of high chloride high total dissolved solids single-or first-stage reverse osmosis desalinated seawater. 311.5 gallons/minute of high sulfate island well water
This blend will be most economical when:1. The cost of island well water is between 14.25 times single-or first-stage product water and 1.161 times the
cost of this first-stage product water.2. The removal of 311.5 gallons/minute of well water does not degrade the water quality in the wells.
b. The availability of up to 312 gallons/minute of island well water and the quality of island well water should beinvestigated extensively.
c. If over roughly (500) + 85 = 600 gallons/minute of island well water can easily be withdrawn without degrading thequality or quantity of island well water in the future, then the facility should be reviewed again for the installation ofelectrodialysis-reversal treatment at 85% recovery and disposal of the resulting high sulfate brine.
d. The use of a mere 6.5 gallons/minute of first-stage desalinated sea water will save at least (188.1 182)gallons/minute = 6.1 gallons/minute of second-stage reverse osmosis water plus (6.1) + 0.85 6.5 gallons/minute =0.68 gallons/minute first-stage reverse osmosis water. This savings is definitely worth the engineering,construction, and operation costs.
e. A table showing the final cost of blended waters consisting of the five possible minimum cost blends of $.10 wellwater, $4.00 single-pass reverse osmosis water, and $5.75 double-pass reverse osmosis water has beenprepared and is shown in table A-3. Figure A-23 shows a plan view of the desalination system of a two passreverse osmosis system.
A-6. Sample problem for simple blend. A base in the desert has a water with a total dissolved solids content of 907mg TDS/liter. If reverse osmosis is to be used as a desalination technique in this application, then the final product waterwill have far less than the required 500 mg TDS/liter. If 250,000 gallons/day of finished water will be required, how muchof the raw water can be reblended in meeting TB-MED 576 requirements?
Symbols:x = Amount of water that must be treated
Given:Daily flow is 250,000 gallons/dayFinished blend concentration is 500 mg TDS/liter.Initial feed concentration is 907 mg TDS/liter.
Flow Concentrated = (Desired Concentration - Dilute Concentration) Flow Dilute(High Concentration - Desired Concentration)
SAMPLE PROBLEM FOR SIMPLE BLENDAssumptions: a. The total dissolved solids rejection of a low-pressure membrane is about 90%, leaving .1 x TDS in the
dilute water stream.b. Total dissolved solids are the limiting factors in the reblending.
Therefore: The flow of raw undesalinated water used = 250,000 gallons/day - xAnd:
(250,000 gallons/day - x) = [500 - .1(907)]x(907 - 500)
250,000 gallons/day = x + (409.3/407)x250,000 gallons/day = 2.00565x·'. x = 124,000 gallons/day
A-7. Silt density index (SDI). This fouling index mentioned in Chapter 3, tables 4-2 and 4-3, and Chapter 5 ismeasured on a 47-millimeter-diameter 0.45-micron pore size membrane filter. The data used by the manufacturers tocalculate the index are the time (T1) necessary initially to force 500 milliliters of solution through a clean 0.45-micron filterwith a 30-pound-per-square-inch pressure differential across the filter, followed by the time (T2) required to force anadditional 500
A-40

TM 5-813-8
Table A-3. Cost projections for possible optimum blends.
A-41
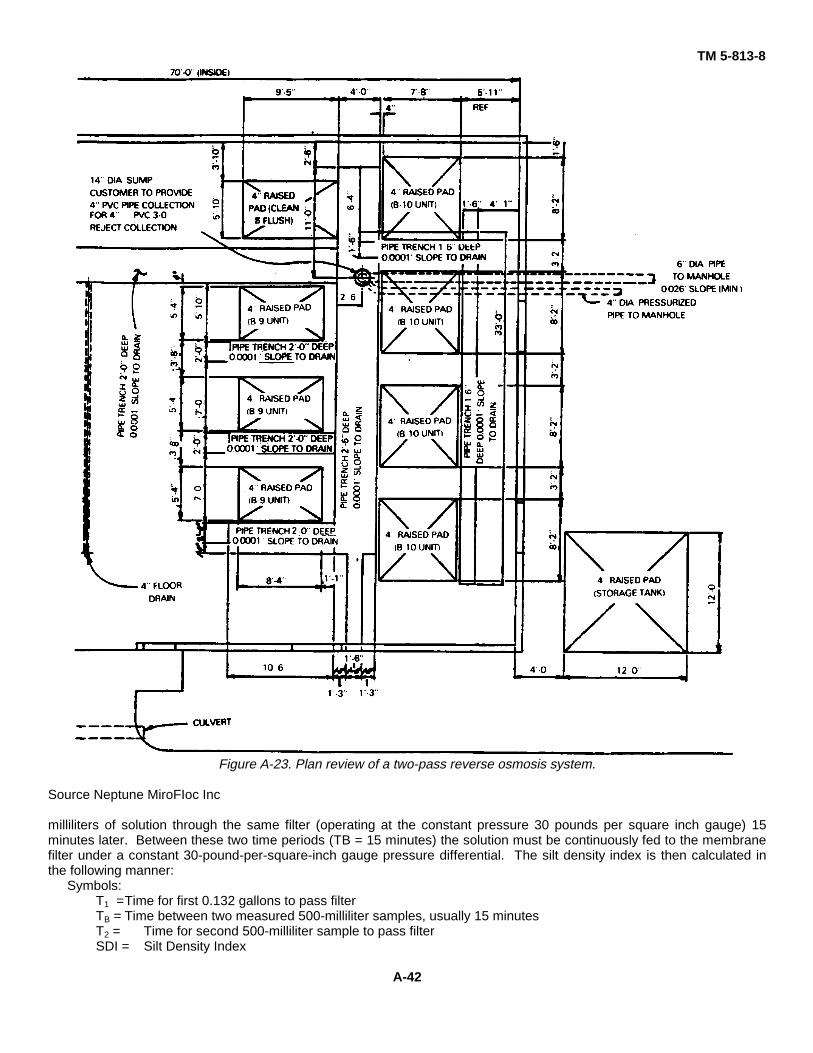
TM 5-813-8
Figure A-23. Plan review of a two-pass reverse osmosis system.
Source Neptune MiroFIoc Inc
milliliters of solution through the same filter (operating at the constant pressure 30 pounds per square inch gauge) 15minutes later. Between these two time periods (TB = 15 minutes) the solution must be continuously fed to the membranefilter under a constant 30-pound-per-square-inch gauge pressure differential. The silt density index is then calculated inthe following manner:
Symbols:T1 =Time for first 0.132 gallons to pass filterTB = Time between two measured 500-milliliter samples, usually 15 minutesT2 = Time for second 500-milliliter sample to pass filterSDI = Silt Density Index
A-42
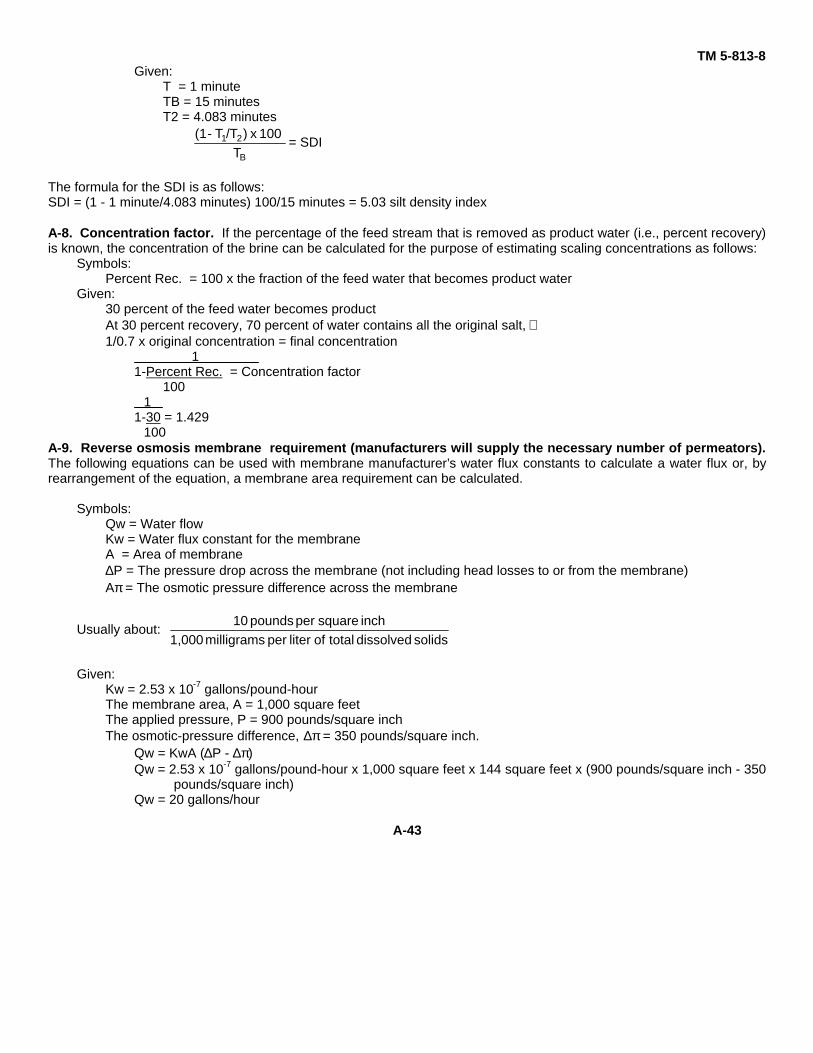
TM 5-813-8Given:
T = 1 minuteTB = 15 minutesT2 = 4.083 minutes
B
21
T 100 x )/TT - (1
= SDI
The formula for the SDI is as follows:SDI = (1 - 1 minute/4.083 minutes) 100/15 minutes = 5.03 silt density index
A-8. Concentration factor. If the percentage of the feed stream that is removed as product water (i.e., percent recovery)is known, the concentration of the brine can be calculated for the purpose of estimating scaling concentrations as follows:
Symbols:Percent Rec. = 100 x the fraction of the feed water that becomes product water
Given:30 percent of the feed water becomes productAt 30 percent recovery, 70 percent of water contains all the original salt, ∴1/0.7 x original concentration = final concentration
11-Percent Rec. = Concentration factor
1001
1-30 = 1.429100
A-9. Reverse osmosis membrane requirement (manufacturers will supply the necessary number of permeators).The following equations can be used with membrane manufacturer’s water flux constants to calculate a water flux or, byrearrangement of the equation, a membrane area requirement can be calculated.
Symbols:Qw = Water flowKw = Water flux constant for the membraneA = Area of membrane∆P = The pressure drop across the membrane (not including head losses to or from the membrane)Aπ = The osmotic pressure difference across the membrane
Usually about: solids dissolved total of liter per milligrams 1,000
inch square per pounds 10
Given:Kw = 2.53 x 10⁻⁷ gallons/pound-hourThe membrane area, A = 1,000 square feetThe applied pressure, P = 900 pounds/square inchThe osmotic-pressure difference, ∆π = 350 pounds/square inch.
Qw = KwA (∆P - ∆π)Qw = 2.53 x 10⁻⁷ gallons/pound-hour x 1,000 square feet x 144 square feet x (900 pounds/square inch - 350
pounds/square inch)Qw = 20 gallons/hour
A-43
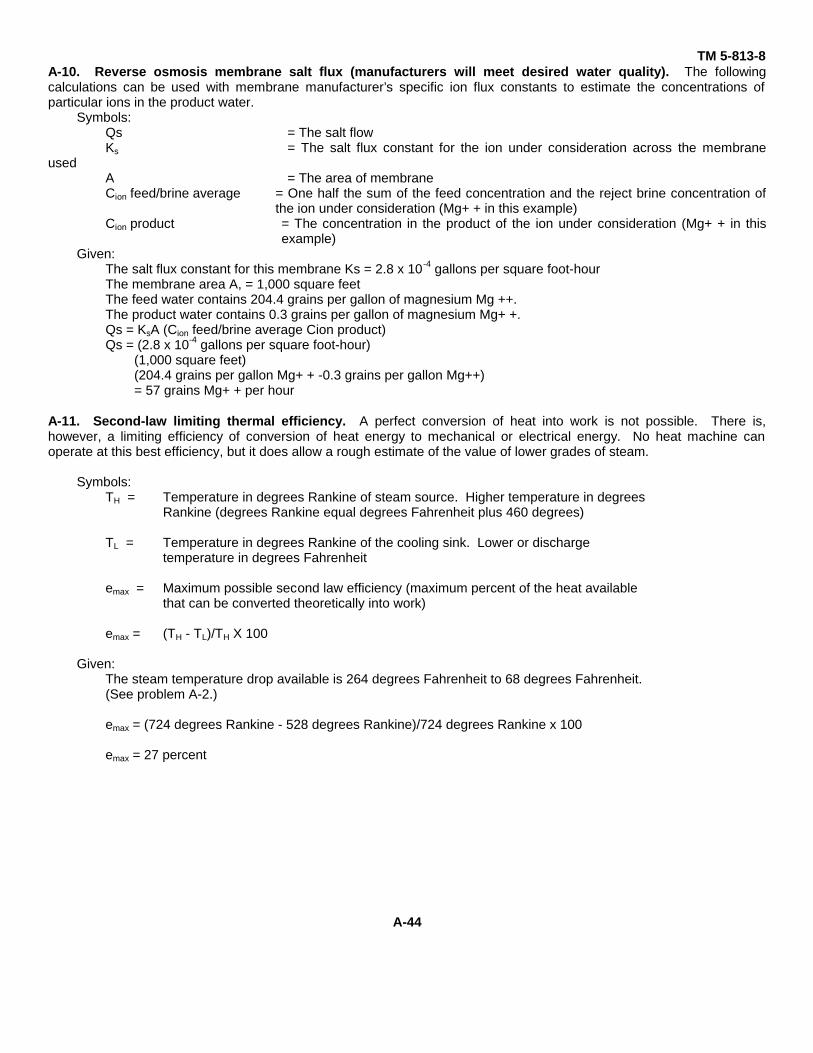
TM 5-813-8A-10. Reverse osmosis membrane salt flux (manufacturers will meet desired water quality). The followingcalculations can be used with membrane manufacturer’s specific ion flux constants to estimate the concentrations ofparticular ions in the product water.
Symbols:Qs = The salt flowKs = The salt flux constant for the ion under consideration across the membrane
usedA = The area of membraneCion feed/brine average = One half the sum of the feed concentration and the reject brine concentration of
the ion under consideration (Mg+ + in this example)Cion product = The concentration in the product of the ion under consideration (Mg+ + in this
example)Given:
The salt flux constant for this membrane Ks = 2.8 x 10⁻⁴ gallons per square foot-hourThe membrane area A, = 1,000 square feetThe feed water contains 204.4 grains per gallon of magnesium Mg ++.The product water contains 0.3 grains per gallon of magnesium Mg+ +.Qs = KsA (Cion feed/brine average Cion product)Qs = (2.8 x 10⁻⁴ gallons per square foot-hour)
(1,000 square feet)(204.4 grains per gallon Mg+ + -0.3 grains per gallon Mg++)= 57 grains Mg+ + per hour
A-11. Second-law limiting thermal efficiency. A perfect conversion of heat into work is not possible. There is,however, a limiting efficiency of conversion of heat energy to mechanical or electrical energy. No heat machine canoperate at this best efficiency, but it does allow a rough estimate of the value of lower grades of steam.
Symbols:TH = Temperature in degrees Rankine of steam source. Higher temperature in degrees
Rankine (degrees Rankine equal degrees Fahrenheit plus 460 degrees)
TL = Temperature in degrees Rankine of the cooling sink. Lower or dischargetemperature in degrees Fahrenheit
emax = Maximum possible second law efficiency (maximum percent of the heat availablethat can be converted theoretically into work)
emax = (TH - TL)/TH X 100
Given:The steam temperature drop available is 264 degrees Fahrenheit to 68 degrees Fahrenheit.(See problem A-2.)
emax = (724 degrees Rankine - 528 degrees Rankine)/724 degrees Rankine x 100
emax = 27 percent
A-44
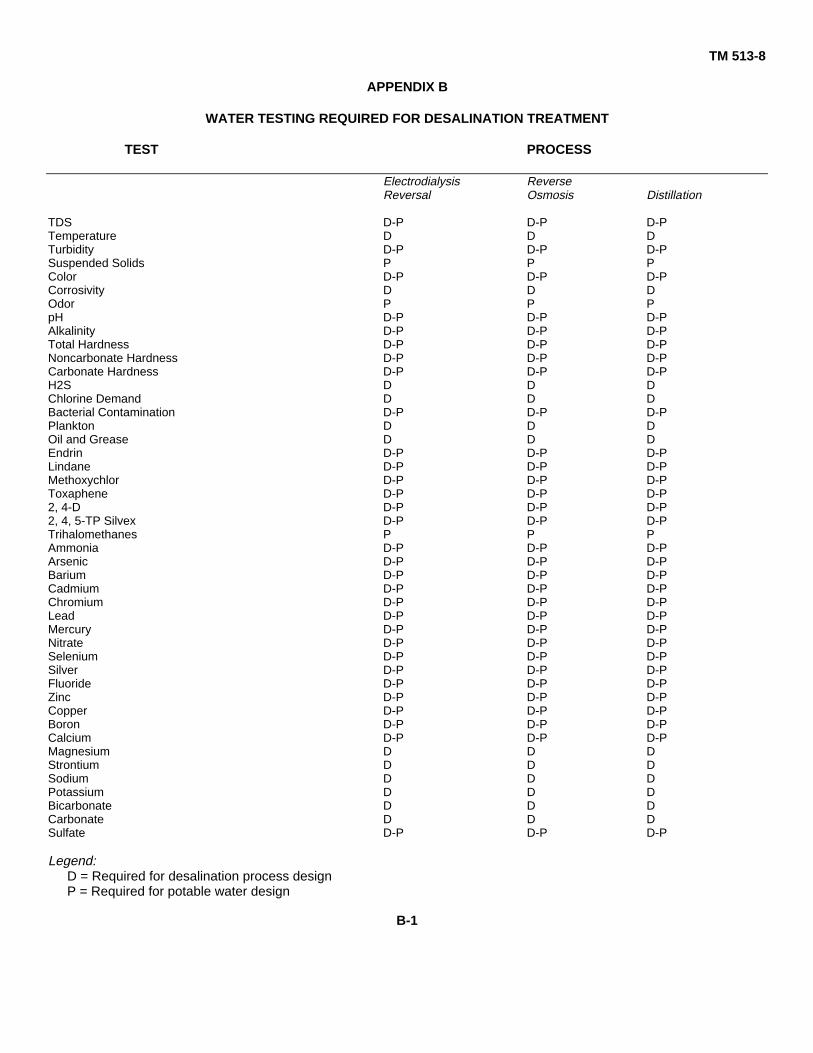
TM 513-8
APPENDIX B
WATER TESTING REQUIRED FOR DESALINATION TREATMENT
TEST PROCESS
Electrodialysis ReverseReversal Osmosis Distillation
TDS D-P D-P D-PTemperature D D DTurbidity D-P D-P D-PSuspended Solids P P PColor D-P D-P D-PCorrosivity D D DOdor P P PpH D-P D-P D-PAlkalinity D-P D-P D-PTotal Hardness D-P D-P D-PNoncarbonate Hardness D-P D-P D-PCarbonate Hardness D-P D-P D-PH2S D D DChlorine Demand D D DBacterial Contamination D-P D-P D-PPlankton D D DOil and Grease D D DEndrin D-P D-P D-PLindane D-P D-P D-PMethoxychlor D-P D-P D-PToxaphene D-P D-P D-P2, 4-D D-P D-P D-P2, 4, 5-TP Silvex D-P D-P D-PTrihalomethanes P P PAmmonia D-P D-P D-PArsenic D-P D-P D-PBarium D-P D-P D-PCadmium D-P D-P D-PChromium D-P D-P D-PLead D-P D-P D-PMercury D-P D-P D-PNitrate D-P D-P D-PSelenium D-P D-P D-PSilver D-P D-P D-PFluoride D-P D-P D-PZinc D-P D-P D-PCopper D-P D-P D-PBoron D-P D-P D-PCalcium D-P D-P D-PMagnesium D D DStrontium D D DSodium D D DPotassium D D DBicarbonate D D DCarbonate D D DSulfate D-P D-P D-P
Legend:D = Required for desalination process designP = Required for potable water design
B-1
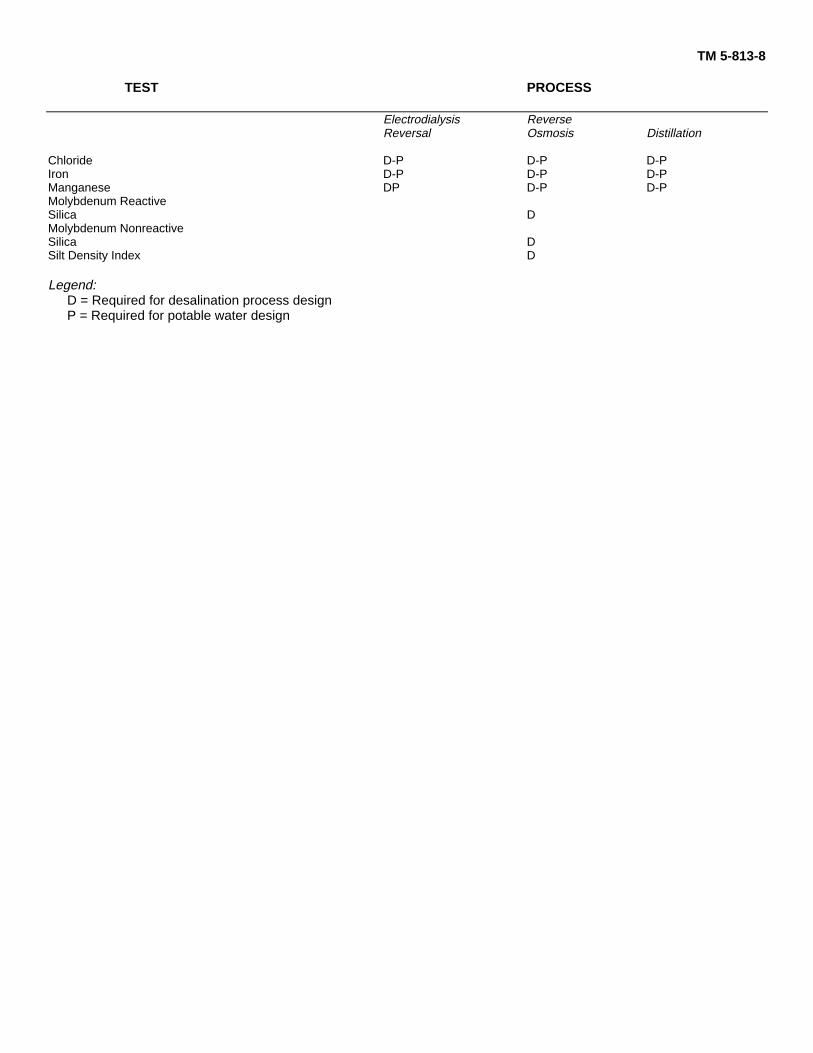
TM 5-813-8
TEST PROCESS
Electrodialysis ReverseReversal Osmosis Distillation
Chloride D-P D-P D-PIron D-P D-P D-PManganese DP D-P D-PMolybdenum ReactiveSilica DMolybdenum NonreactiveSilica DSilt Density Index D
Legend:D = Required for desalination process designP = Required for potable water design
TM 5-813-8
APPENDIX C
REFERENCES
Government Publications.Department of Defense.DOD 4270.1-M Construction Criteria ManualDepartment of the Army.AR 420-46 Water and SewageTB MED 229 Sanitary Control and Surveillance of Water
Supplies at Fixed and Field InstallationsTB MED 576 Sanitary Control and Surveillance of Water
Supplies at Fixed InstallationsTM 5-813-1 Water Supply Sources and General
ConsiderationsTM 5-813-3 Water TreatmentTM 5-813-4 Water Supply and Water StorageTM 5-813-7 Water Supply Special Projects
C-1
TM 5-813-8
BIBLIOGRAPHY
A. Books:
American Chemical Society, Journal of Chemical and Engineering Data, XIII, Aqueous Systems at High Temperature,American Chemical Society, 1155 16th St. N.W., Washington, DC (January 1968).
American Public Health Association, American Water Works Association, and Water Pollution Control Federation,Standard Methods for the Examination of Water and Wastewater (15th Edition). American Public Health Association,Washington, DC (1981).
Spiegler, K. S., and A. D. K. Laird, Principles of Desalination (2nd Edition). Parts A and B. Academic Press, New York(1980).
B. Manuals:
Desalting Handbook for Planner OWRT-8701 (1) NTIS PB80-202518. Office of Water Research and Technology andCatalytic, Inc. (1979).
Electrical Design Corrosion Control TM 5-811-4. Department of the Army (1962).Installation Master Planning Principles and Procedures TM5-803-1. Department of the Army (1970).The Decision Logic Table Technique PAM 310-11. Department of the Army (1967).U.S. A.I.D. Desalination Manual. United States International Development Cooperation Agency, Office of Engineering,
and CH2M Hill International Corp (1980).
Biblio-1
The proponent agency of this publication is the Office of the Chief of Engineers, United StatesArmy. Users are invited to send comments and suggested improvements on DA Form 2028(recommended Changes to Publications and Blank Forms) direct to HQDA (DAEN-ECE-G), WASHDC 20314-1000.
By Order of the Secretary of the Army:JOHN A. WICKHAM, JR.General, United States Army
Official: Chief of StaffR. L. DILWORTH
Brigadier General, United States ArmyThe Adjutant General
DISTRIBUTION:To be distributed in accordance with DA Form 12-34B requirements for Water Supply-Special Projects.
*U.S. GOVERNMENT PRINTING OFFICE 1995-388-421/40468

PIN: 060240-000