Embed Size (px)
Citation preview
| 1
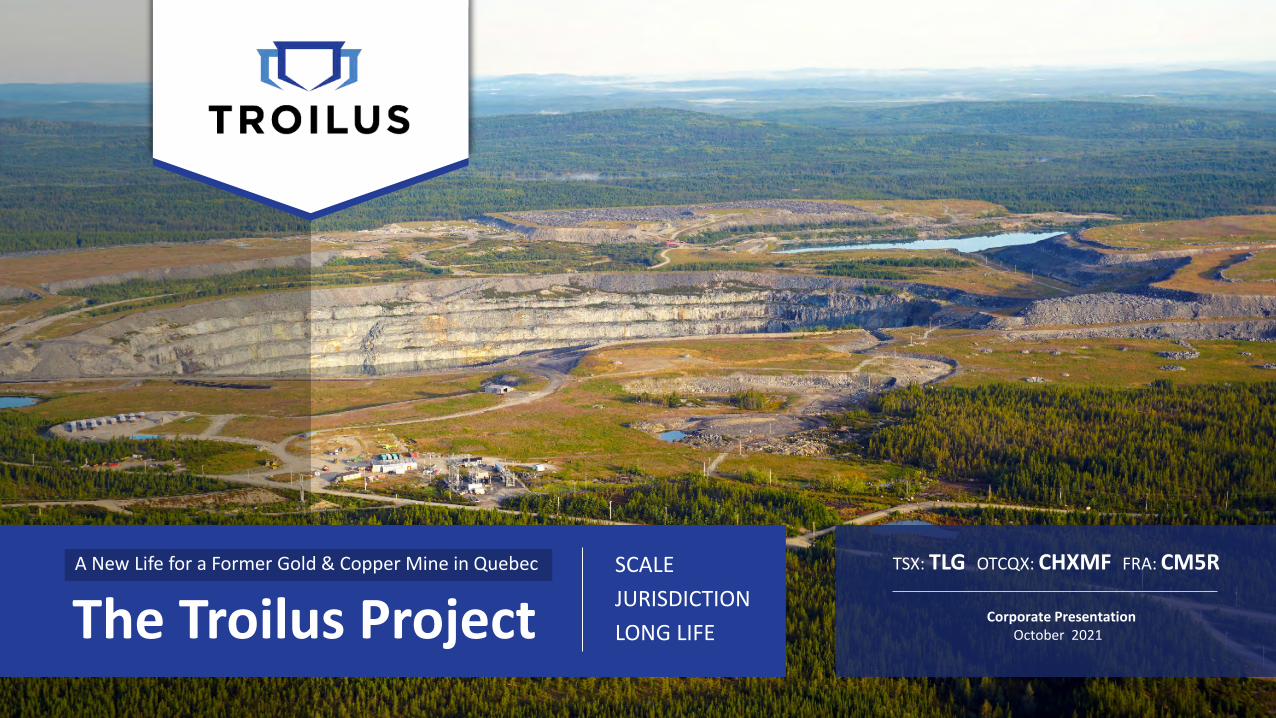
A New Life for a Former Gold & Copper Mine in QuebecThe Troilus ProjectSCALEJURISDICTIONLONG LIFE
TSX: TLG OTCQX: CHXMF FRA: CM5R
Corporate PresentationOctober 2021
A New Life for a Former Gold & Copper Mine in Quebec

| 2
v
Mineral Resources that are not Mineral Reserves do not have demonstrated economic viability. There is no certainty that the Indicated MineralResources will be converted to the Probable Mineral Reserve category, and there is no certainty that the updated Mineral Resource statementwill be realized.
The mineral resource estimates contained herein may be subject to legal, political, environmental or other risks that could materially affect thepotential development of such mineral resources. See the Resources Report filed on SEDAR (or the Technical Report, once filed), for moreinformation with respect to the key assumptions, parameters, methods and risks of determination associated with the foregoing.
The PEA is preliminary in nature, includes inferred mineral resources that are considered too speculative geologically to have the economicconsiderations applied to them that would enable them to be categorized as mineral reserves, and there is no certainty that the PEA will berealized. Mineral resources that are not mineral reserves do not have demonstrated economic viability. The PEA is subject to a number of risksand uncertainties. See below and the Technical Report, once filed, for more information with respect to the key assumptions, parameters,methods and risks of determination associated with the foregoing.
The Troilus project has not been the subject of a current feasibility study and as such there is no certainty that a potential mine will berealized. There is a significant risk that any production from the project will not be profitable with these risks elevated by the absence of acompliant NI 43 101 feasibility study.
The mineral resource estimate disclosed in this presentation was prepared by Mr. Paul Daigle, géo., Senior Associate Resource Geologist withAGP, and the supporting Technical Report was filed on SEDAR (www.sedar.com) under the Company’s issuer profile on August ,28, 2020. Mr.Paul Daigle, who is an independent Qualified Person as defined under NI 43-101, has reviewed and approved the mineral resource estimatedisclosed in this presentation.
The technical and scientific information in this presentation has been reviewed and approved by Kyle Frank, Senior Geologist for Troilus, who is aQualified Person as defined by NI 43-101. Mr. Frank has also verified the technical data contained in this presentation using industry acceptedstandards. Mr. Frank is an employee of Troilus and is not independent of the Company under NI 43-101.
The PEA was prepared under the direction and supervision of Gord Zurowski, P. Eng Principal Mining Engineer with AGP. The PEA report isavailable on SEDAR (www.sedar.com) under the Company’s issuer profile or on its website, www.troilusgold.com.
This presentation contains “forward-looking statements” within the meaning of applicable Canadian securities legislation. Forward-lookingstatements include, but are not limited to, the results of the PEA, statements regarding the impact and implications of the economic statementsrelated to the PEA, such as future projected production, costs, including without limitation, AISC, total cash costs, cash costs per ounce, capitalcosts and operating costs, statements with respect to Mineral Resource estimates, recovery rates, IRR, NPV, mine life, CAPEX, payback period,sensitivity analysis to gold prices, timing of future studies including the pre-feasibility study, environmental assessments (including the timing ofan environmental impact study) and development plans, the Company’s understanding of the project; the development potential and timetableof the project; the potential to extend mine life beyond the period contemplated in the PEA, opportunity to expand the scale of the project, theproject becoming a cornerstone mining project in Quebec and Canada, the estimation of mineral resources; realization of mineral resourceestimates; the timing and amount of estimated future exploration; the anticipated results of the Company’s planned 2020 drill program and theirpossible impact on the potential size of the mineral resource estimate; costs of future activities; capital and operating expenditures; success ofexploration activities; the anticipated ability of investors to continue benefiting from the Company’s low discovery costs, technical expertise andsupport from local communities; and the anticipated timing of filing the Technical Report. Generally, forward-looking statements can beidentified by the use of forward-looking terminology such as “plans”, “expects” or “does not expect”, “is expected”, “budget”, “scheduled”,
“estimates”, “forecasts”, “intends”, “contemplates”, “goal”, “continue”, “anticipates” or “does not anticipate”, or “believes”, or variations of suchwords and phrases or statements that certain actions, events or results “may”, “could”, “would”, “will”, “might” or “will be taken”, “occur” or “beachieved”. Forward-looking statements are made based upon certain assumptions and other important facts that, if untrue, could cause theactual results, performances or achievements of Troilus to be materially different from future results, performances or achievements expressed orimplied by such statements. Such statements and information are based on numerous assumptions regarding present and future businessstrategies and the environment in which Troilus will operate in the future. Certain important factors that could cause actual results,performances or achievements to differ materially from those in the forward-looking statements include, amongst others, currency fluctuations,the global economic climate, dilution, share price volatility and competition. Forward-looking statements are subject to known and unknownrisks, uncertainties and other important factors that may cause the actual results, level of activity, performance or achievements of Troilus to bematerially different from those expressed or implied by such forward-looking statements, including but not limited to: the impact the COVID 19pandemic may have on the Company’s activities (including without limitation on its employees and suppliers) and the economy in general; theimpact of the recovery post COVID 19 pandemic and its impact on gold and other metals; there being no assurance that the explorationprogram or programs of the Company will result in expanded mineral resources; risks and uncertainties inherent to mineral resource estimates;the high degree of uncertainties inherent to preliminary economic assessments and other mining and economic studies which are based to asignificant extent on various assumptions; variations in gold prices and other precious metals, exchange rate fluctuations; variations in cost ofsupplies and labour; receipt of necessary approvals; general business, economic, competitive, political and social uncertainties; future gold andother metal prices; accidents, labour disputes and shortages; environmental and other risks of the mining industry, including without limitation,risks and uncertainties discussed in the latest annual information form of the Company, in the Resources Report (and the Technical Report to befiled) and in other continuous disclosure documents of the Company available under the Company’s profile at www.sedar.com. Although Troilushas attempted to identify important factors that could cause actual results to differ materially from those contained in forward-lookingstatements, there may be other factors that cause results not to be as anticipated, estimated or intended. There can be no assurance that suchstatements will prove to be accurate, as actual results and future events could differ materially from those anticipated in such statements.Accordingly, readers should not place undue reliance on forward-looking statements. Troilus does not undertake to update any forward-lookingstatements, except in accordance with applicable securities laws.
Cautionary Note to U.S. Investors Concerning Estimates of Mineral Resources
Mineral resource estimates have been prepared in accordance with the requirements of Canadian securities laws, which differ from therequirements of U.S. securities laws. The terms “mineral resource”, “measured mineral resource”, “indicated mineral resource” and “inferredmineral resource” are defined in NI 43-101 and recognized by Canadian securities laws but are not defined terms or recognized under U.S.securities laws. U.S. investors are cautioned not to assume that any part or all of mineral deposits in these categories will ever be upgraded tomineral reserves. “Inferred mineral resources” have a great amount of uncertainty as to their existence, and great uncertainty as to theireconomic and legal feasibility. It cannot be assumed that all or any part of an “inferred mineral resource” will ever be upgraded to a highercategory. Under Canadian securities laws, estimates of “inferred mineral resources” may not form the basis of feasibility or pre-feasibility studies.U.S. investors are cautioned not to assume that all or any part of an inferred mineral resource exists or is economically or legally mineable.Accordingly, these mineral resource estimates and related information may not be comparable to similar information made public by U.S.companies subject to the reporting and disclosure requirements under the U.S. federal securities laws and the rules and regulations thereunder.
CAUTIONARY LANGUAGE, QP STATEMENTS AND LEGAL DISCLAIMERS
| 2

| 3
TROILUS GOLD CORP. IS GENERATING VALUE BY RESPONSIBLY DEVELOPING THE PAST-PRODUCINGGOLD-COPPERTROILUS PROJECT
THE LARGEST UNDEVELOPED GOLDDEPOSIT IN QUEBEC, CANADA
ESG LeadershipFirst mineral exploration company to obtain ECOLOGO certification
Strong Cash PositionCAD$56 million raised in June/July 2021
Located in Top Ranked Mining JurisdictionQuebec ranked #6 globally by the Fraser Institute in 2020
Quality Brownfield ProjectUS$350M of inherited infrastructure; streamlined permitting
Large and Growing Resource 4.96 Moz AuEq (Ind.), plus 3.15 Moz AuEq (Inf.)* Updated mineral resource expected in Q4 2021
Robust PEA; Pre-Feasibility underwayPEA results place Troilus among thetop 5 gold producers in Canada today
Experienced & Credible ManagementProven track-record of generating value

FAST-PACED ADVANCEMENT SINCE ACQUISITIONDelivering on our vision to become Quebec’s next multi-decade gold-copper producer
2017 2020 2021
Southwest expansion
Resources increase by another 20%
Robust PEA
Successful regional exploration on expanded property
Dewatering permit(Z87 & J4 pits)
Acquired UrbanGold
Appointed industry veteran as COO
~10,000m of drilling/month
UPCOMING:
Initiate Federal permitting process
Inaugural Reserve
Pre-Feasibility Study (Q1)
Initiate Provincial Permitting Process
Feasibility Study (H2)
Construction decisionby end of year
Acquisition of Brownfield Troilus Project in Dec. 2017
(From 1996-2010, the Troilus Mine produced +2Moz of gold and ~70,000t of copper)
2018 2019
TSX Listing
Drilling initiated
Pre-Development Agreement Signed with Cree Nation
Mineral Resources increase 85%
Significant expansion of J Zone & Z87 South
Resources increase by another 27%
Discovery & initial drilling of Southwest Zone
2022
| 4
EXPLORATION SUCCESS: Disciplined exploration (+150,000m), translating to significant mineral growth and evidence of a district scale, generational asset.
ROBUST ENGINEERING: Initial drilling to robust PEA in under 2 yrs. Inaugural Reserve and Pre-Feasibility underway, targeting a long-life open-pit mine producing +220,000oz AuEq/yr.*
LEADERSHIP TEAM: Assembled an experience and proven team to build the Troilus mine
STAGE of DEVELOPMENT: Federal permitting process initiates in Q4 2021
2017-2021:UNLOCKING VALUE & DE-RISKING
*Please see cautionary notes related to the PEA on p.2

| 5
LEADERSHIP TEAM IN PLACE TO ADVANCE TROILUS MINE RESTART
Board of Directors
Diane Lai, ICD.D, MBA – ChairpersonSeasoned executive and entrepreneur with +20 yrs of global marketing experience
Andrew Mark Cheatle, P.Geo. FGS, MBA30 yrs of international mining experience; consulting Geologist; former CEO of PDAC
Jamie Horvat, M.Sc.+20 yrs of experience in asset management, particularly resources and precious metals
Hon. Pierre Pettigrew, p.c.Former Minister of Foreign Affairs to three Prime Ministers; current Executive Advisor at Deloitte
Dr. John Hadjigeorgiou, PhD, P.Eng, FCIM, ICD.DPierre Lassonde Chair in Mining Engineering at UofT; consultant to many major mining companies
Dr. Eric Lamontagne, Eng.PhD.Former Superintendent of the Troilus mine; GM Greenstone JV (Equinox Gold/Orion)
Thomas Olesinski, CPA, CMA20 years of finance and management experience; former forensic accountant
Justin Reid, M.Sc., MBAGeologist and capital markets executive with +20 yrs of experience in the mineral resource space
Management Team
Justin Reid, President & CEO, Director
Richard Harrisson, COO
Denis Arsenault, CFO/SVP Qc.
Blake Hylands, SVP Exploration & Corp. Development
Ian Pritchard, SVP Technical Services
Jacqueline Leroux, VP Environment & Permitting
Catherine Stretch, VP Corporate Affairs
Brianna Davies, VP Legal & Corporate Secretary
Caroline Arsenault, VP Corporate Communications
Daniel Bergeron, VP Quebec Operations
John Matoush, Community Liaison Mistissini
Kyle Frank, Senior Geologist
| 5
Experienced EngineeringTeam, includes:
Richard Harrisson, COO
- Most recently oversaw the engineering and pre-development of the $1.7 billion Odyssey Project for Canadian Malartic from conception through to the current construction.
- Former Mining Director at Premier Gold Mines where he led the Feasibility Study for the Greenstone open pit project
- He also held a number of positions with Agnico Eagle including Engineering Superintendent at Goldex Mine in Val d’Or, Project Evaluation Engineer at CTMN and Underground Mine Manager at the Kittila Mine in Finland.
Jacqueline Leroux, VP Environment & Permitting
- Metallurgical engineer with +20 yrs of experience
- Formerly held senior positions at Goldcorp, Mason Graphite, and BlackRock Metals where she was responsible for exploration permits, environmental assessment processes and construction permits.

| 6
COMMITTED TO THE RESPONSIBLE DEVELOPMENT OF OUR PROJECT
Inaugural ESG Report launched in 2021. troilusgold.com/sustainability
Sustainable Development Policy implemented at Troilus in 2020, focuses on four pillars:
People Environment Health & Safety Communities
ECOLOGO Certificationin August 2020
Troilus proudly became the first company to obtain certification
for UL 2723 Certification Program for Responsible Development for
Mineral Exploration
Recipient of the 2020
EXCELLENCE IN SUSTAINABLE
DEVELOPMENT AWARDpresented annually by the
Quebec Mineral Exploration Association (AEMQ).
90% of water used at site is reused and recycled
83% of energy used at the Troilus site comes from renewable sources
30% of senior managementand Chair of the Board arewomen
Zero work related injuries at site
We are committed to creating value for our shareholders while operating in a safe, socially and environmentally responsible manner.
Implementation of the ONYEN ESG Reporting System in 2020
2020-2021 ESG MILESTONES
Local suppliers made up 62% of procurement spending
Internationally recognized reporting standards

| 7
LOCATED IN ONE OF THE WORLD’S BEST MINING JURISDICTIONS
Abundant, low-cost and clean energy.83% of energy currently used at the Troilus
site comes from renewable sources.
Fair and stabletaxation system
Strong collaborative efforts between Governments and mining industry to support
mineral development
Financial participation in mining projects by Government
Investment arms of the Qc. Gov. own ~12% of Troilus shares.
Quebec vision to develop the North in cooperation with First Nations and local communities
*According to the Fraser Institute’s annual survey of mining (2020)
Low-cost operation location
Quebec is ranked 6th globally on the “Investment Attractiveness Index”*
Established regulatory and permitting framework
Access to qualified mining labour, suppliers & contractors
Chibougamau (~170km south of Troilus)

| 8
STRONG & SUPPORTIVE SHAREHOLDER BASE
*Share ownership as at August 25, 2021. To the best of Troilus’ knowledgeSee press release dated July 15, 2021, for details of the strategic investment by the Quebec Government
60%INSTITUTIONAL
(+50 GLOBAL FUNDS)
8%MANAGEMENT
& INSIDERS
32%RETAIL &OTHER
OF WHICH
16%ARE
QUEBEC-BASED
| 8
We are proud to support the development of this promising gold project, led by a strong team. Troilus activities have a significant impact on employment and on the economy of
the Nord-du-Québec region and we are pleased to help solidify the financial health of the company to allow it to
continue its activities and carry out its project.
Eric GirardMinister of Finance & Minister of Economy and Innovation
Dany PelletierChief Investment Officer of the Fonds de solidarité FTQ
The mining potential of Nord-du-Québec and our mining industry are key to the sustainable recovery of Québec’s economy. That’s why we are helping Troilus carry out its gold project, which is expected to generate significant economic benefits and create good jobs in the region.
Strategic Partnership with the Quebec Government $11.15 million invested in Troilus in July
2021 through Investissement Québec
Defines a long-term strategic framework focused on outlining and establishing full project financing options for the development of the Troilus Project
Committed, Long-Term Shareholders & Partnerships
“.”
“
.”
| 9
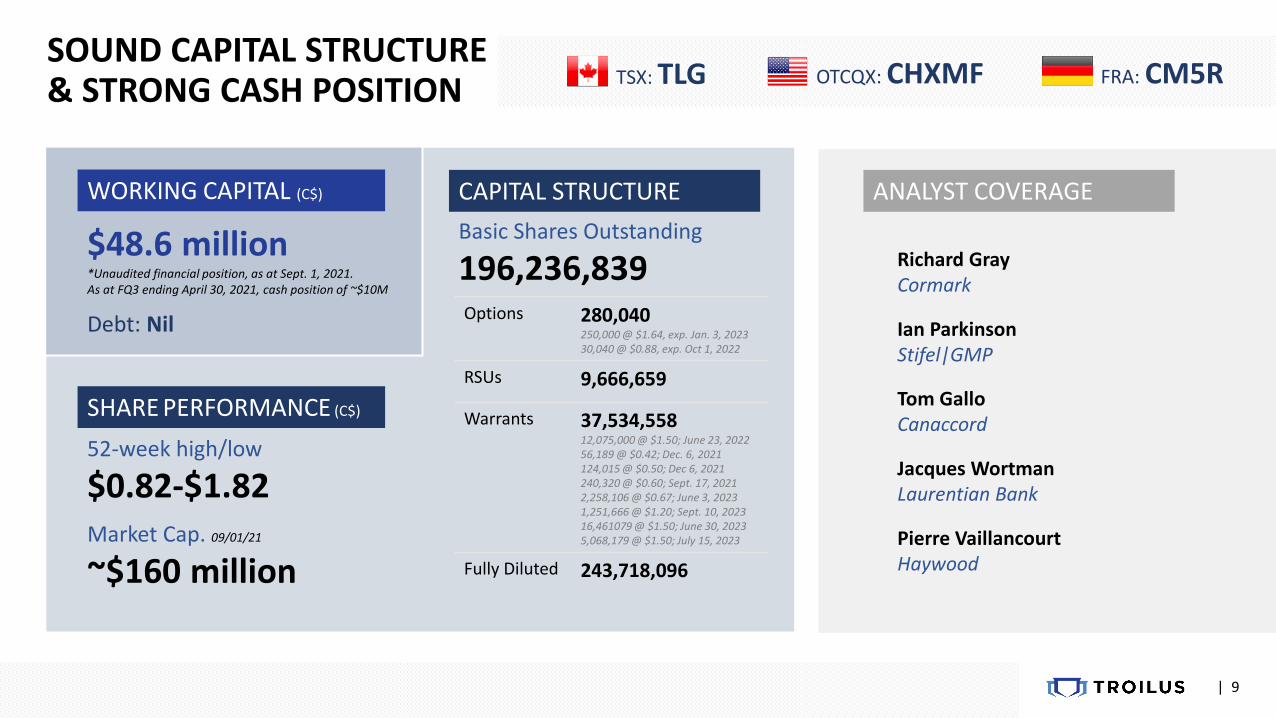
SOUND CAPITAL STRUCTURE& STRONG CASH POSITION
Richard GrayCormark
Ian ParkinsonStifel|GMP
Tom GalloCanaccord
Jacques WortmanLaurentian Bank
Pierre VaillancourtHaywood
TSX: TLG OTCQX: CHXMF FRA: CM5R
$48.6 million*Unaudited financial position, as at Sept. 1, 2021.As at FQ3 ending April 30, 2021, cash position of ~$10M
Debt: Nil
Basic Shares Outstanding
196,236,839
52-week high/low
$0.82-$1.82Market Cap. 09/01/21
~$160 million
WORKING CAPITAL (C$)
SHARE PERFORMANCE (C$)
CAPITAL STRUCTURE
Options 280,040250,000 @ $1.64, exp. Jan. 3, 202330,040 @ $0.88, exp. Oct 1, 2022
RSUs 9,666,659
Warrants 37,534,55812,075,000 @ $1.50; June 23, 202256,189 @ $0.42; Dec. 6, 2021124,015 @ $0.50; Dec 6, 2021240,320 @ $0.60; Sept. 17, 20212,258,106 @ $0.67; June 3, 20231,251,666 @ $1.20; Sept. 10, 202316,461079 @ $1.50; June 30, 20235,068,179 @ $1.50; July 15, 2023
Fully Diluted 243,718,096
ANALYST COVERAGE

| 10
142,000 hectares (1,420 km²) of contiguous land in the Frôtet-Evans Greenstone Belt
Frôtet-EvansGreenstone Belt
AbitibiGreenstone Belt
Mistissini
Chibougamau
Val-d’OrRouyn-Noranda
Gold MineGold Deposit
Eastmain
Quebec City
PLANNORD
Quebec
STRATEGIC LAND POSITION IN A HIGHLY PROSPECTIVE GREENSTONE BELT
Land position strategically increased 2,800% sinceacquisition of 4,700 haproperty in 2017.
Driven by our belief in the district-scale potential of the mineral system in this area.

| 11
Tailings Facility*with capacity to accommodate
PEA’s LOM production
Water Treatment Facility
50MW Substation Core Storage & Logging
Initial Construction Starter Camp *installed septic
60 km Power Line, Site Roads and River Crossings
APPROX.
US$350 MILLION OF INHERITED VALUE
BROWNFIELD ADVANTAGE
| 11

| 12
FORMER MINE SITE & MAIN MINERAL ZONES
| 12
Z87 pitJ4 pit
Formerly mined pits
Z87 pit
J4 pit
Enlarged Area
Southwest
Gap Zone
Z87 South
Z87
J Zone
Allongé
2020 Mineral Resource Wireframes & PEA Pit Shells
+20km Geophysical Trend
Defined Mineralized Zones
| 12

| 13
TRACK-RECORD OF MINERAL RESOURCE GROWTH+150,000 metres drilled since 2018; finding costs of <$5/oz
2.05
3.92
4.71 4.96
0.70
1.17
1.76
3.15
2016 2018 2019 2020 2021
44.0 121.7 159.1 177.3 -1.45 1.00 0.92 0.87 -18.7 36.1 52.7 116.7 -1.16 1.01 1.04 0.84 -
1. See NI43-101 Technical Report related to this Mineral Resource Estimate dated June 30, 2016 (RPA)2. See NI43-101 Technical Report related to this Mineral Resource Estimate dated January 1, 2019 (RPA)
+142%
+350%
Moz AuEq
Moz AuEq
Moz AuEqMoz AuEq
Moz AuEq
Moz AuEq
Moz AuEq
Moz AuEq
Ind. Inf. Ind. Inf. Ind. Inf. Ind. Inf.
Ind.
Inf.
Tonnage (Mt)
AuEq Grade (g/t)
Tonnage (Mt)
AuEq Grade (g/t)
+36,000m of drilling
+36,000m of drilling
+8,500m of drilling
+81,450m drilled since the 2020 resource estimate cut-off
(as of Sept. 21, 2021)
Acquisition of Troilus
Updated mineral resource and
inaugural Reserve
expected inQ4 2021
3. See NI43-101 Technical Report related to this Mineral Resource Estimate dated December 20, 2019 (RPA)4. See Appendix and press release dated July 28, 2020 for details and assumptions related to the 2020 mineral resource estimate
Metres of Drilling Added to Mineral Resource Estimate
| 13
+74,300m not included in the 2020 resource (as of Aug 17, 2021)

| 14
~300m
Z87 pitJ5 pit
200m
Z87 / Z87 South
~500m
Z87 Z87 South Southwest
~500m
J Zone
J Zone
2016 INHERITED RESOURCE 2019 NEAR-PIT GROWTH
2020 EXTENSIVE MINERAL SYSTEM UNCOVERED
THE BEST PLACE TO FIND GOLD IS WHERE GOLD WAS PRODUCED

| 15
2018-2021 NEAR-PIT RESOURCE EXPANSION
Gap Zone
*See Appendix and press release dated July 28, 2020 for details and assumptions related to the 2020 mineral resource estimate
Z87 J ZONE ALLONGÉ
Z87 pit
Z87 SOUTHSOUTHWEST ZONEActive Mining Lease
New discovery late 2019/early 2020 Similar geology to Z87 Accessible via road Priority growth target; multi-million oz potential
110 g/t Au grab sample (Dec. 2018)
Near-termgrowth target
PEA Pit Shell (2020)
2018-2021 Holes Drilled
2020 Resource Envelope
Formerly mined pits Significant near pit expansion Remains open on strike & at depth Infill & expansion drilling underway
GAP ZONE
J4 pit
Main Mineral Corridor, Long Section Facing Northwest
Z87 SOUTH - Z87 - J ZONE ALLONGÉSOUTHWEST ZONE - GAP ZONE
A
B
BA
1km

| 16
Z87 ALLONGÉZ87 SOUTHSOUTHWEST ZONE GAP ZONE
1km
TYPICAL CROSS-SECTION: THEN AND NOW
* See press release dated May 12, 2021, and Appendix for details and assumptions related to the 2020 mineral resource estimate
J ZONE
2021
New parallel zone of mineralization identified
over a strike length of ~1.6km, primarily within undrilled areas of the PEA pit shell
DRILL HIGHLIGHTS: 2.10 g/t AuEq/31m,
incl. 4.40 g/t AuEq/12
1.57 g/t AuEq/31m, incl. 4.72 g/t AuEq/7m and 22.51 g/t AuEq/1m
2.24 g/t AuEq/8m, incl. 5.06 g/t/3m
1.60 g/t AuEq/13m, incl. 3.2 g/t /3m
1.19 g/t AuEq/19m, incl. 3.3 g/t /4m
1.51 g/t AuEq/19m, incl. 2.3 g/t/8m
1.43 g/t AuEq/19.3m, incl. 1.7 g/t/3m and 2.29 g/t/4.5m
1.48 g/t AuEq/11m
1.21 g/t AuEq/23m, incl. 2.5 g/t/7m
1.10 g/t AuEq/68m, incl. 1.65 g/t/10m
2.23 g/t AuEq/3m
J ZONEHIGHLIGHTS
| 16
2016
| 17
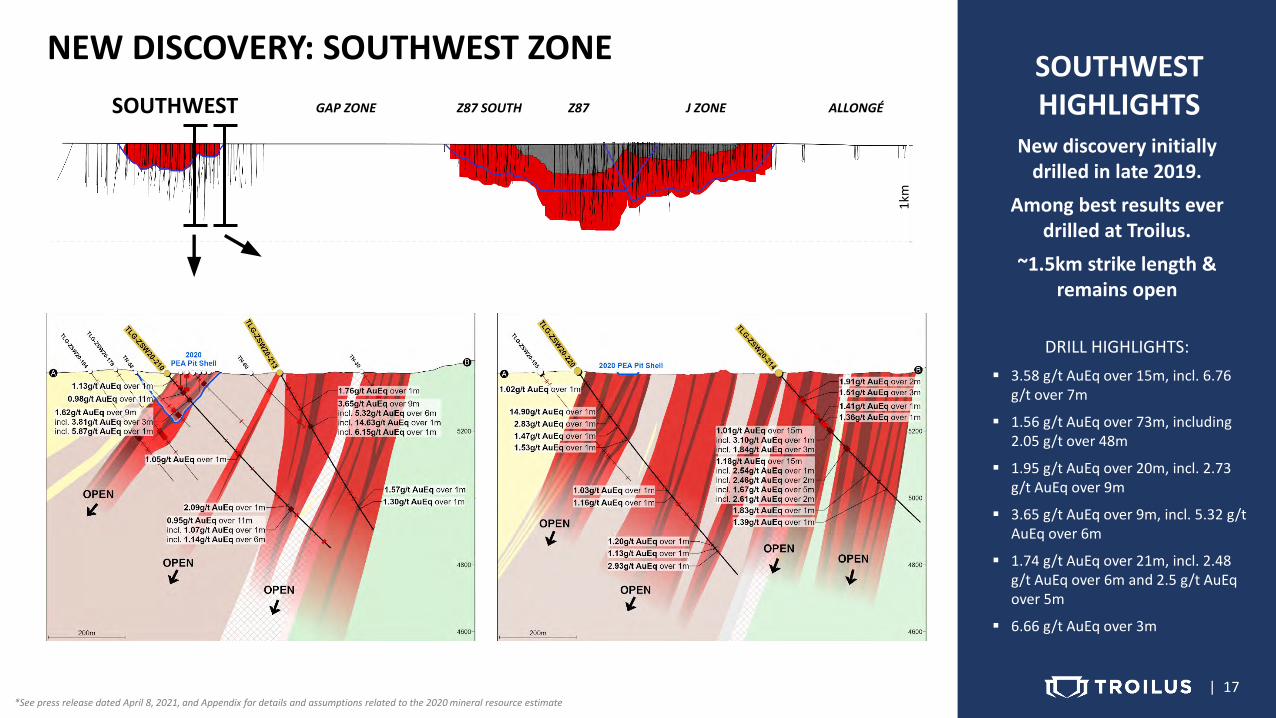
NEW DISCOVERY: SOUTHWEST ZONE
*See press release dated April 8, 2021, and Appendix for details and assumptions related to the 2020 mineral resource estimate
New discovery initiallydrilled in late 2019.
Among best results ever drilled at Troilus.
~1.5km strike length & remains open
DRILL HIGHLIGHTS: 3.58 g/t AuEq over 15m, incl. 6.76
g/t over 7m
1.56 g/t AuEq over 73m, including 2.05 g/t over 48m
1.95 g/t AuEq over 20m, incl. 2.73 g/t AuEq over 9m
3.65 g/t AuEq over 9m, incl. 5.32 g/t AuEq over 6m
1.74 g/t AuEq over 21m, incl. 2.48 g/t AuEq over 6m and 2.5 g/t AuEq over 5m
6.66 g/t AuEq over 3m
SOUTHWESTHIGHLIGHTS
| 17
Z87 ALLONGÉZ87 SOUTHGAP ZONE
1km
J ZONESOUTHWEST

| 18
MAJOR TECHNICAL ADVANCEMENTS IN 2020/2021J ZONE HANGING WALL SOUTHWEST ZONE EXPANSION
New parallel zone of mineralization confirmed over strike length of ~1.6km
Expected positive impact on upcoming PFS: New zone primarily located within undrilled areas of the PEA pit
Remains open on strike and at depth
Similar geology to main zone Z87 Higher-grade zone than rest of deposit:
Hole ZSW21-512
3.58 g/t AuEq over 15m, incl. 6.76 g/t over 7mHole ZSW20-189
1.56 g/t AuEq over 73m, incl. 2.05 g/t over 48m Remains open Multi-million-ounce potential

| 19
~30g/t gold
High-grade gold system associated with fold and shear patterns within a broad base ~1g/t deposit.
Identifiableand predictablethroughoutthe deposit.
HIGH GRADEAT TROILUS

| 20
MULTIPLE TARGETS TO SUPPORT GROWTH STRATEGY110 g/t Au grab sample (2018)
ALLONGÉ
BEYAN / CRESSIDADrill results: 1.62 g/t Au/ 34m1.23 g/t Au/ 21m1.11 g/t Au/ 19.3m1.0 g/t Au/ 44.6m
TESTARD / BULLSEYEDrilling Results:10.14 g/t Au/ 1.8m
Channel SampleHighlights:19.5 g/t Au over 0.5m12.2 g/t Au over 1.3m5.3 g/t Au over 2.1m
GOLDFIELD BOULDER ZONEGrab Samples: 26.2 g/t Au, 27.8 g/t Ag
PALLADOR-REGNAULTOn strike with recent Sumitomo/KLD discovery hole: 8.47 g/t Au over 29m
Drill Highlights:4.74g/t Au/ 2.5m, incl. 19.24 g/t Au/ 0.5m
Boulder Grab Samples:Up to 102 g/t gold
Grab Samples:12 g/t Au9.7 g/t Au32.5 g/t Ag
Grab SamplesHighlights:203 g/t Au2,440 g/t Ag1,020 g/t Ag6.02% Cu
1
2
3
4
5
1
2
3
4 5
Mineral Resource Zones
Indicated: 1.1 million tonnes grading 1.8% Cu, 3.65% Zn, 48.51 g/t Ag and 0.35 g/t AuInferred: 99,000 tonnes grading 1.19% Cu, 1.23% Zn, 12.45 g/t Ag and <0.1 g/t Au(NI 43-101 compliant mineral resource was completed by Beaufield Resources in 2014)
Tortigny Mineral Resource

| 21
PEA SUMMARY & SENSITIVITIES (AUGUST 2020)
246,000 oz AuAvg. Annual Production(first 14 years)
22 yearsMine Life(14 yrs Open Pit)
$333MCAPEX
$719/oz AuEqCash Operating Costs$850/oz AuEq AISC
*All figures reported in US$ unless stated otherwise. US$:C$ exchange of $0.74. $719/oz cash costs and $850/oz AISC are calculated on a pre-tax basis, in line with WGC guidelines, and include copper and silver credits. On a post-tax basis, cash operating costs are $919 and AISC are $1,051 per ounce of gold, not including copper and silver credits. Please see cautionary notes related to the PEA on p.2
AMONG THE TOP CANADIAN GOLD MINES, TROILUS’ ALL-IN-
SUSTAINING-COSTS (AISC) WOULD BE IN THE LOWER QUARTILE
| 21
$623 $760 $795 $835 $850
$975 $1,040
$1,120 $1,200 $1,200 $1,208 $1,225 $1,242 $1,282
$1,350 $1,426 $1,463
$1,650 $2,020
Moose River
Island
Seabee
Canadian Malartic
Troilus
Porcupine
Brucejack
New Afton
Young-Davidson
Young-Davidson
Timmins
Hemlo
Westwood
Meadowbank
Eleonore
Elder-Tagami
Casa Berardi
Rainy River
Musselwhite
2020 AISC Guidance (US$/oz)(1)
Source: Company disclosures. Based on 2020 actuals reported, management guidance if actuals not yet reported. Some companies do not provide AISC on an asset level. Troilus metrics based on September 2020 PEA
L O W E R C A S E$1,350/oz Au
$713MPre-Tax NPV5%
23.7%Pre-Tax IRR
$419MPost-Tax NPV5%
18.2%Post-Tax IRR
4.4 yearPayback
B A S E C A S E$1,475/oz Au
$971MPre-Tax NPV5%
29.6%Pre-Tax IRR
$576MPost-Tax NPV5%
22.9%Post-Tax IRR
4 yearPayback
C O N S E N S U S$1,750/oz Au
$1,538MPre-Tax NPV5%
41.8%Pre-Tax IRR
$915MPost-Tax NPV5%
32.2%Post-Tax IRR
3 yearPayback
H I G H E R C A S E$1,950/oz Au
$1,951MPre-Tax NPV5%
50.1%Pre-Tax IRR
$1,156MPost-Tax NPV5%
38.3%Post-Tax IRR
2.5 yearPayback
Not including 2.5% royalty buy-back completed in late 2020. PEA assumed copper price of $3.00/lb. IMMEDIATE OPTIMIZATION IN UPCOMING PFS:

| 22
PRODUCTION PROFILE – GOLD, COPPER & SILVER
Annual Production Guidance (2020; Koz Au) (1)
550
530
345
343
246
245
227
215
210
190
140
135
130
130
115
107
93
92
67
38
Canadian Malartic
Detour Lake
Brucejack
LaRonde
Troilus
Meadowbank
Rainy River
Macassa
Hemlo
Eleonore
Young-Davidson
Island
Lamaque
Hope Bay
Seabee
Moose River
Westwood
Eagle River
New Afton
Black Fox
TROILUS HAS THE POTENTIAL TO RANK AMONG THE TOP
CANADIAN GOLD PRODUCERS
| 22
-
5,000,000
10,000,000
15,000,000
20,000,000
25,000,000
30,000,000
35,000,000
-
50,000
100,000
150,000
200,000
250,000
300,000
350,000
Poun
ds (C
u)
Oun
ces (
Au/A
g)
Gold Silver Copper
220,000 oz AuAvg. Annual Production
(first 5 years)
246,000 oz AuAvg. Annual Production
(first 14 years)
Open Pit Operation (14 yrs, 35k tpd)Transition to Underground (9k tpd)
Near-pits Mineral Growth Opportunities
2020 PEA Resource PitsHistorical Drilling (>0.92g/t Au)
Gap Zone
Source: Company disclosures(1)Based on 2020 actuals reported, management guidance if actuals not yet reported; Troilus metrics based on September 2020 PEA

| 23
TROILUS STANDS OUT AMONG ADVANCED NORTH AMERICAN GOLD DEVELOPERS In
itial
Cap
ex (U
S$M
)
LoM Production (Au Ozs)
Initial CAPEX of US$333 million
BROWNFIELD ADVANTAGE
CAPITAL INTENSITY & LOM PRODUCTION OF NORTH AMERICAN GOLD DEVELOPERS

| 24
Canadian Copper Producing Assets – 2020 Cu Production (tonnes)
HIGHLY LEVERAGED TO COPPER
Copper production of 7,358 tonne per year (PEA 2020), placing Troilus among the top copper producers in Canada.
Copper is expected to contribute 15.5% to Troilus’ total revenue(PEA 2020).
PEA assumed copper price of $3.00/lb. Significantly positive impact on project economics using current copper prices.
15 assets currently producing copper in Canada
Troilus would be #12 based on years 1-14 avg. production of 7,358 tpa Cu
All figures reported in US$ unless stated otherwise. Please see cautionary notes related to the PEA on p.2| 24

| 25
UPCOMING PRE-FEASIBILITY STUDY:EXPECTATIONS & TARGETS
Open pit only mining scenario,targeting +220,000 oz annual production
Inaugural Reserve (Q4 2021) to feed into PFS;Targeting over 90% resource conversion from PEA
PFS to reflect 2.5% royalty buy-backcompleted in late 2020
Base case copper price expected to behigher than PEA assumed price of $3.00/lb
Targeting completion in Q1 2022; later than expected due to continued exploration success
| 25

| 26
RECENT MILESTONES & PATH FORWARD
Baseline studies & monitoring (since 2018)
2020 2021 2022 2023 2024
Southwest expansion& successful regional exploration onexpanded property
Mineral Resources increase by another 20%, 195% since acquiring Troilus
Robust PEA
Dewatering permit(Z87 & J4 pits)
ECOLOGO Certification
2.5% royalty buy-back
Recipient of AEMQ’s “Excellence in Sustainable Development Award”
Continuing to De-Risk and Unlock Value
Acquisition ofUrbanGold Minerals
Appointment of industry veteran as COO
Upgraded to OTCQXBest Market
Drilling @ 10,000m/mthfocused on resource expansion & infill
UPCOMING
New Resource Estimate& Inaugural Reserve
Initiate FederalPermitting Process
Pre-Feasibility Study(early 2022)
Feasibility Study
Construction Decision
| 26
Federal Approval
Construction Start
Initiate Provincial Permitting Process
Ongoing Drilling & Drill Results
Provincial Approval
Construction Financing
Infrastructure Upgrades
Pre-Feasibility Study

| 27
SABINA GOLD& SILVER CORP.
HOW DOESTROILUS STANDOUT AMONGTHE +3,500JUNIOR MINING COMPANIESOUT THERE?
ARTEMISGOLD INC.
TROILUS GOLD CORP.
Source: S&P Market Intelligence and company filings as of March 9, 2021. Long-term prices used for AuEq: Au $1,555/oz, Ag US$20.42/oz, Cu $3.04/lb, Zn $1.07/lb, Ni $7.36/lb, Mo $9.03/lb

| 28
Justin ReidPresident, CEO & Director(647) 276-0050, [email protected]
Blake HylandsVP Exploration(905) [email protected]
Caroline ArsenaultVP Corporate Communications(647) [email protected]
Corporate Headquarters400-36 Lombard Street, Toronto, Ontario M5C 2X3
Follow us:
| 28

| 29
Project History
Stakeholder Engagement
Regional Geology
Mineral Resource Summary
APPENDIX

| 30
TROILUS’ HISTORY AS A PAST-PRODUCER
$0$200$400$600$800
$1,000$1,200$1,400$1,600$1,800$2,000
1950’sInitial exploration
Gold Price
1996-2010Inmet Mining Corp. operated the Troilus mine;+2Moz of gold and ~70,000t of copper produced
1986Initial drilling
1993Positive
Feasibility Study
2017Troilus is acquired in Dec. 2017- $300,000 cash- 2.5% NSR (bought back in Nov. 2020)
2018Troilus Gold Corp. begins trading on the TSX
2011Failed merger with Lundin Mining
2012Hostile takeover of Inmet
by First Quantum Minerals
The Troilus Mine operated during a weak gold environment, which among other factors, resulted in minimal expansion drilling outside of the main mineralized zones to replace the mine’s reserves.

| 31
Signed Pre-Development Agreement (PDA) with the Cree Nation of Mistissini,the Grand Council of the Crees (Eeyou Istche) and the Cree Nation in July 2018¹
Establishes the framework for the on-going and mutually beneficial relationship regarding business and employment opportunities for the Cree
Facilitates continued support for exploration activities and preparation of the ESIA studies Illustrates the completion of the Impacts and Benefits Agreement (IBA) to show the economic
viability of the Troilus Project
(1) See news dated July 17, 2018
At Z87 during the Cree Site tour with council and Chief Thomas Neeposh
Justin Reid, CEO and John Matoush, Mistissini Community Liaison
At Z87 during the Cree Mineral Exploration Board’s student site tour
STAKEHOLDER ENGAGEMENT
| 31

| 32
PROJECT SITE PHOTOS

| 33
REGIONAL GEOLOGY

| 34
MINERAL RESOURCE SUMMARY – ALL ZONES
Total Open Pit & Underground
Total Open Pit
Total Underground
Tonnes (Mt)Gold
Equiv.(g/t)
Gold(g/t)
Copper(%)
Silver(g/t)
ContainedGold(Moz)
ContainedCopper
(Mlb)
Contained Silver (Moz)
Contained AuEq(Moz)
Indicated 177.30 0.87 0.75 0.08 1.17 4.30 322.60 6.66 4.96Inferred 116.70 0.84 0.73 0.07 1.04 2.76 189.73 3.91 3.15
Indicated 164.20 0.80 0.68 0.08 1.20 3.62 284.69 6.32 4.21Inferred 101.20 0.70 0.60 0.07 1.12 1.95 151.01 3.65 2.27
Indicated 13.10 1.79 1.61 0.13 0.81 0.68 37.91 0.34 0.75Inferred 15.50 1.77 1.62 0.11 0.52 0.81 38.72 0.26 0.88
Effective date of mineral resource: July 20, 2020
Mineral Resources that are not Mineral Reserves do not have demonstrated economic viability;Summation errors may occur due to rounding;Open pit mineral resources are reported within an optimized constraining shells. Open pit cut-off grade is 0.3 gpt AuEQ where the metal equivalents were calculated as follows:Z87 Zone: AuEq = Au grade + 1.2566 * Cu grade + 0.0103 * Ag gradeJ4/J5 Zone: AuEq = Au grade + 1.2979 * Cu grade + 0.0108 * Ag gradeSW Zone: AuEq = Au grade + 1.2768 * Cu grade + 0.0106 * Ag gradeMetal prices for the AuEQ formulas are: $US 1,600/ oz Au; $3.25/lb Cu, and $20.00/ oz Ag; with an exchange rate of US$1.00:CAD$1.30;Metal recoveries for the AuEQ formulas are:Z87 Zone: 83% for Au recovery, 92% for Cu recovery and 76% for Ag recoveryJ4/J5 Zone: 82% for Au recovery, 88% for Cu recovery and 76% for Ag recoverySW Zone: 82.5% for Au recovery, 90% for Cu recovery and 76% for Ag recoveryUnderground cut-off grade is 0.9 AuEQ at Z87 Zone and J4/J5 Zone*See additional disclosures related to the mineral resource calculation in Appendix

| 35
OPEN PIT MINERAL RESOURCES – BY ZONEEffective date of mineral resource: July 20, 2020
Mineral Resources that are not Mineral Reserves do not have demonstrated economic viability;Summation errors may occur due to rounding;Open pit mineral resources are reported within an optimized constraining shells. Open pit cut-off grade is 0.3 gpt AuEQ where the metal equivalents were calculated as follows:Z87 Zone: AuEq = Au grade + 1.2566 * Cu grade + 0.0103 * Ag gradeJ4/J5 Zone: AuEq = Au grade + 1.2979 * Cu grade + 0.0108 * Ag gradeSW Zone: AuEq = Au grade + 1.2768 * Cu grade + 0.0106 * Ag gradeMetal prices for the AuEQ formulas are: $US 1,600/ oz Au; $3.25/lb Cu, and $20.00/ oz Ag; with an exchange rate of US$1.00:CAD$1.30;Metal recoveries for the AuEQ formulas are:Z87 Zone: 83% for Au recovery, 92% for Cu recovery and 76% for Ag recoveryJ4/J5 Zone: 82% for Au recovery, 88% for Cu recovery and 76% for Ag recoverySW Zone: 82.5% for Au recovery, 90% for Cu recovery and 76% for Ag recoveryUnderground cut-off grade is 0.9 AuEQ at Z87 Zone and J4/J5 Zone*See additional disclosures related to the mineral resource calculation in Appendix
Indicated 84.60 0.92 0.79 0.09 1.39 2.15 169.54 3.77 2.50Inferred 32.70 0.70 0.60 0.07 1.50 0.63 49.34 1.57 0.73
Z87 & Z87 South
J Zone (J4 & J5)Indicated 79.60 0.67 0.57 0.07 1.00 1.47 115.16 2.55 1.71Inferred 45.90 0.65 0.55 0.07 0.96 0.82 65.94 1.42 0.96
Southwest Zone
Inferred 22.60 0.80 0.70 0.07 0.89 0.51 35.73 0.65 0.58
Tonnes (Mt)Gold
Equiv.(g/t)
Gold(g/t)
Copper(%)
Silver(g/t)
ContainedGold(Moz)
ContainedCopper
(Mlb)
Contained Silver (Moz)
Contained AuEq(Moz)
Total Open Pit – All ZonesIndicated 164.20 0.80 0.68 0.08 1.20 3.62 284.69 6.32 4.21Inferred 101.20 0.70 0.60 0.07 1.12 1.95 151.01 3.65 2.27

| 36
2020 MINERAL RESOURCE – GRADE DISTRIBUTION
Above 0.3 g/t AuEq (open pit) & above 0.9 g/t AuEq (underground)
Total Open Pit and Underground
Indicated 177.3 0.75 0.08 1.17 0.87 4.30 322.60 6.66 4.96Inferred 94.1 0.74 0.07 1.08 0.85 2.25 154.00 3.26 2.57
Tonnes(Mt)
Gold(g/t)
Copper(%)
Silver(g/t)
Gold Equiv.
(g/t)
ContainedGold(Moz)
ContainedCopper
(Mlb)
Contained Silver (Moz)
Contained AuEq(Moz)
Classification 0.30 g/t OP and 0.90 g/t UG
Limit of Resource Shell
J5285m
J4
Z87 UG
Z87South 485m
600m
870m from surface
g/t AuEq.0.3 – 0.50.5 – 0.9> 0.9
J4 UG
Z87, Z87 South and J Zone

| 37
MINERAL RESOURCE GRADE DISTRIBUTION, SOUTHWEST ZONE
Inferred 22.6 0.70 0.07 0.89 0.80 0.51 35.73 0.65 0.58
Tonnes(Mt)
Gold(g/t)
Copper(%)
Silver(g/t)
Gold Equiv.
(g/t)
ContainedGold(Moz)
ContainedCopper
(Mlb)
Contained Silver (Moz)
Contained AuEq(Moz)
Limit of Resource Shell
ZSW 280m
g/t AuEq.0.3 – 0.50.5 – 0.9> 0.9
130m
Above 0.3 g/t AuEq (open pit)

| 38
2020 MINERAL RESOURCE - ADDITIONAL DISCLOSURESEffective date of mineral resource: July 20, 2020
The resource constraining shells were generated with:Metal Prices of Gold $US 1600/oz, Copper $US 3.25/lb, Silver $US 20/oz
Mining Costs: J Zone and 87 Zone base cost $Cdn 1.71/t moved, SW Zone base cost $Cdn 1.66/t moved Incremental cost $Cdn 0.03/t waste moved, $Cdn 0.02/t feed moved
Process and G&A Costs:$Cdn 8.44/t processed
Wall slopes:Varied between 49.5 to 60 degrees depending on pit area and slope sector
Metal Recoveries: Gold: 90% all zones except in lower grade (Au<1/2 g/t) portions of SW zone = 88%Copper: 90% all zones except in higher grade (Cu%>0.13%) portions of SW zone = 92%Silver: all zones 40%