Embed Size (px)
Citation preview
vi
Computational fluid dynamics modeling of catalytic wet air oxidation of phenol in a
trickle bed reactor
Prepared by
Tladi Joas Makatsa
Submitted in accordance with the requirements for the degree of
MAGISTER TECHNOLOGIAE
In the subject
CHEMICAL ENGINEERING
At the
University of South Africa
Supervisor(s): Prof CM. Masuku
Co-Supervisor(s): Dr. TA. Ntho
: Dr.SJ. Baloyi
June 2020
ii
Abstract
In this study, phenol was oxidized in a trickle bed reactor operated in a continuous mode using
aluminum/zirconia pillared (Al/Zr-PILCs) catalyst. The reactor was connected to a gas
chromatography and a sample was taken every 1 h to analyze carbon dioxide emitted. A
commercial software (Ansys Fluent) was used to simulate experimental results obtained. The
powder catalyst (Al/Zr-PILCs) was wash-coated on a surface of cordierite monolith and dried
using different drying mediums. After wash-coating the catalyst, different drying methods
were used and two samples were dried in an oven at 40 °C and 60 °C while others were dried
using thermally assisted microwave and room temperature. X-ray diffraction peak of natural
bentonite shifted from 8.25° to lower angle of 7° and basal spacing increased from 12.44 to
15.15 A° confirming that natural clay was successfully pillared. However, montmorillonite
peak disappeared after wash-coating the catalyst on the surface of a support due to the
amorphous phase of SiO2 shielding the peak. The morphology of the catalyst was determined
using scanning electron microscopy (SEM) and the results clearly showed that the surface of
the catalyst was smooth and no cracks were observed when all drying mediums were used due
to hygroscopic nature of glycerol. The sample dried using thermally assisted microwave oven
was smoother compared to others due to heat that is homogeneously dispersed inside the
microwave.
To test catalyst activity and reaction kinetics, phenol was oxidized in a trickle bed reactor
operated at 10 bar and temperatures ranging between (120–160 °C) over Al/Zr-pillared clay
catalyst using monolith as a support. To understand the kinetics of the process, different
variables were studied including reaction temperature and liquid flow rate. It was concluded
that an increase in temperature has a positive impact on phenol conversion, whereas an
increase in liquid flow rate has a negative effect. A simple power law model was used to
model reaction kinetics and the activation energy was found to be 42.289 kJ/mol. To
understand the behaviour of the fluid inside the reactor, a computational fluid dynamics
(CFD) model was developed from experimental data using an Euler-Euler model. The model
indicated that a hot spot was formed near the center of the reactor due to liquid mal-
distribution. Moreover, incorporating monolithic structure in a reactor packing material
helped to lower pressure drop due to low velocities inside monolith channels. When the
reactor was modeled at 160°C and 10 bar phenol was completely oxidized to CO2.

iii
Keywords: Kinetics Modeling, Computational Fluid Dynamics modeling, Phenol
Oxidation, Reaction Mechanism.

iv
Acknowledgements
I’m very grateful to the National Research Foundation (NRF)/Thuthuka, NRF grant No.
113652 and Mineral Science Council of South Africa (Mintek) under CWO of Wastewater
Project No. ADR 31904 for financial support. I would also like to give special thanks to my
supervisors Prof Masuku, Dr Ntho and Dr Baloyi for their constructive criticism and
guidance, without their help I wouldn’t have accomplished what I have. Special thanks goes
to Mr. P. Mafulako, Mr. A. Corfield, Ms T. Khumalo, Mr. S Mavuso and Prof. B Patel for
assisting me with ball mill, SEM, BET, XRD analysis and administrative work.
Finally, I would like to thank my mom (Maseta Makatsa) and my siblings for their prayers
and support. I would also like to thank my wife (Mmabatho Kopung) and son for moral
support and financial assistance during difficult times. And lastly I would like to thank God
almighty for giving me strength and courage.
v
Publications and Presentations
Publications
1. T J Makatsa, J Baloyi, T Ntho and C M Masuku, Kinetic study of phenol oxidation in
a trickle bed reactor over Al/Zr-pillared clay catalyst, IOP Conf. Ser.:Mater.Sci.Eng
655 (2019). Doi: 10.1088/1757-899X/655/1/012050
2. Tladi J. Makatsa, Jeffrey Baloyi, Thabang Ntho and Cornelius M. Masuku, Catalytic
wet air oxidation of phenol: Review of the reaction mechanism, kinetics, and CFD
modeling, Critical Reviews in Environmental Science and Technology (2020).
Doi.org/10.1080/10643389.2020.1771886
3. Tladi J. Makatsa, Jeffrey Baloyi and Cornelius M. Masuku, Computational fluid
dynamics modelling of phenol oxidation in a trickle bed reactor using 3D Eulerian
model. Submitted for publication in Chemical Engineering Science.
Presentations
1. Title: Kinetic study of phenol oxidation in a trickle bed reactor over Al/Zr-pillared
clay catalyst. Oral presentation. Authors: T J Makatsa, S J Baloyi, T A Ntho and C
M Masuku: Conference: Conference of the South African advanced materials
initiative (CoSAami) October 23-25, 2019 Vanderbjlipark (South Africa).
2. Title: Wash-coating of cordierite monolith with novel Al/Zr pillared clay catalyst: For
wastewater treatment. Oral presentation. Authors: T J Makatsa, S J Baloyi, T A
Ntho and C M Masuku: Conference: Post graduate symposium for civil and chemical
engineering department, 7 November 2019, Florida (South Africa).
3. Title: Wash-coating of cordierite monolith with novel Al/Zr pillared clay catalyst:
Comparison of drying methods. Poster presentation. Authors: S J Baloyi, T J
Makatsa, M Govender, T A Ntho and C M Masuku: Conference: Conference of the
South African advanced materials initiative (CoSAami) October 23-25, 2019
Vanderbjlipark (South Africa).
vi
Contents
Abstract ...................................................................................................................................... ii Acknowledgements ................................................................................................................... iv
Publications and Presentations ................................................................................................... v Publications ................................................................................................................................ v Presentations ............................................................................................................................... v Chapter 1: Introduction .............................................................................................................. 1 1.1 Background ..................................................................................................................... 1
1.2 Research Motivation ............................................................................................................ 3 1.3 Problem statement and purpose of the study ........................................................................ 4 1.4 Research aim and objective(s): ............................................................................................ 5 1.5 Novelty of the study ............................................................................................................. 5 1.6 Research questions ............................................................................................................... 6
1.7 Outline of the dissertation .................................................................................................... 6 Chapter 2: Literature Review ..................................................................................................... 7
2.1 Homogenous and heterogeneous systems ....................................................................... 7 2.2 Reaction mechanism ....................................................................................................... 9 2.2.1. Indirect Mechanism ........................................................................................................ 10 2.2.2 Direct Mechanism ........................................................................................................... 16
2.3. Operating parameter .......................................................................................................... 20 2.3.1. Effect of temperature ...................................................................................................... 20 2.3.2. Effect of initial phenol concentration ............................................................................. 22
2.3.3. Effect of pH .................................................................................................................... 23 2.3.4. Effect of liquid and gas hourly space velocity ............................................................... 24
2.4. Kinetic Model .................................................................................................................... 25 2.5 CFD Modelling ............................................................................................................. 30
Chapter 3: Experimental Methods ............................................................................................ 33 3.1 Materials ........................................................................................................................ 33
3.2 Catalyst Preparation ...................................................................................................... 33 3.3 Acid treatment of cordierite monolith ........................................................................... 33 3.4 Wash-coating of cordierite monolith with Al/Zr-PILCs ............................................... 33
3.5 Characterization techniques .......................................................................................... 34 3.6 CWAO Experiment ....................................................................................................... 34
3.7 Computational fluid dynamics model ........................................................................... 35 3.7.1 Governing equations ....................................................................................................... 35 3.7.2 Mesh ................................................................................................................................ 36 3.7.3 Boundary conditions ....................................................................................................... 37 Chapter 4: Results and Discussion ........................................................................................... 38
4.1 Characterization of the catalyst .......................................................................................... 38 4.2 Catalyst activity test ........................................................................................................... 42
4.3 Influence of operating parameters ...................................................................................... 43 4.4 Kinetic model ..................................................................................................................... 44 4.5 Euler-Euler computational model ...................................................................................... 47 Chapter 5: Conclusions and Recommendations ....................................................................... 53 5.1 Conclusions ........................................................................................................................ 53
5.2 Potential for industrialization ............................................................................................. 53 5.3 Recommendations .............................................................................................................. 54 Reference .................................................................................................................................. 54
Appendix A: Experimental Parameters .................................................................................... 66
vii
List of figures
Figure 1: Schematic representation of bentonite clay pillaring process adopted from (Baloyi et
al., 2018c). .................................................................................................................................. 2
Figure 2: Fluid flow regimes inside the TBR (Ahmed ., 2012). ................................................ 3
Figure 3: Reaction mechanism for CWAO of phenol in a batch reactor using functionalized
carbon material as catalyst proposed by (Wang et al. 2014). ................................................... 11
Figure 4: Schematic diagram of CWAO of phenol reaction mechanism in the presence of
Fe/AC catalyst (Quintanilla et al, 2006). .................................................................................. 13
Figure 5: Proposed reaction pathway for the CWAO of phenol in the presence of CuSO4
catalyst (Lal & Garg 2014). ...................................................................................................... 15
Figure 6: CWAO of phenol oxidation reaction mechanism (Zapico et al. 2015). ................... 17
Figure 7: Reaction mechanism of phenol oxidation proposed by (Castaldo et al. 2019) ........ 19
Figure 8: 3D reactor geometry and mesh structure of (a) TBR and (b) monolith. ................... 37
Figure 9: XRD patterns of (a) Natural bentonite clay (b) Al/Zr pillared clay catalyst. ........... 38
Figure 10: XRD patterns of (a) Bare monolith, (b) monolith acid treated with oxalic acid and
calcined at 500 °C for 2 h, (c) Al/Zr-PILCs monolith dried at 60 °C, (d) Al/Zr-PILCs
monolith dried at 40 °C, (e) Al/Zr-PILCs monolith microwave dried, (f) Al/Zr-PILCs
monolith dried at room temperature for six weeks. ................................................................. 39
Figure 11: Cross-section SEM images of the bare monolith (a), monolith acid treated with
oxalic acid and calcined at 500° C for 2 h (b) zirconium mapping image (c) and wash coated
monolith (d). ............................................................................................................................. 40
Figure 12: Backscattered electron x-ray mapping images were taken on the surface of the bare
monolith (a), monolith acid treated with oxalic acid and calcined at 500° C for 2 h (b), wash
coated monolith (c), and zirconium mapping image (d). ......................................................... 40
Figure 13: Secondary electron images were taken on the surface of bare monolith (a),
monolith acid treated with oxalic acid and calcined at 500° C for 2 h (b), wash coated and
microwave dried (c), wash coated and oven-dried at 40° C (d), wash coated and oven-dried at
60° C (e) and wash coated and dried at room temperature (f). ................................................ 41
Figure 14: Phenol removal with time in a trickle bed reactor over Al/Zr-PILCs catalyst
supported on a monolith (Experimental conditions: 160 °C, 10 bar, 0.012 m/s). .................... 42
Figure 15: Amount of CO2 released with time during phenol oxidation in CWAO process. .. 43
Figure 16: Phenol conversion with liquid flow rate and change in reaction temperature. ....... 44
Figure 17: Graph of In(1-Xph) vs τ at 10 bar and temperatures ranging between 120, 140 and
160 °C. ...................................................................................................................................... 46
Figure 18: Plot of In(k) versus 1/T at a pressure of 10 bar and temperatures of 120, 140, and
160 °C. ...................................................................................................................................... 46
Figure 19: Contours of phenol mass fraction (a) and CO2 profile inside the reactor (b). ........ 47
Figure 20: Phenol mass fraction distribution in a radial direction. .......................................... 48
Figure 21: Mass fraction of phenol inside the reactor bed ....................................................... 49
Figure 22: Temperature profile along the reactor bed at 160 °C. ............................................ 50
Figure 23: Radial temperature profile inside the reactor at 160 °C. ........................................ 51
Figure 24: Axial pressure distribution profile inside the reactor. ............................................ 52
Figure 25: Pump calibration curve ........................................................................................... 66
Figure 26: Mass flow controller ............................................................................................... 66
Figure 27: HPLC phenol retention time. .................................................................................. 67
Figure 28: Reactor design. ....................................................................................................... 67

viii
List of tables
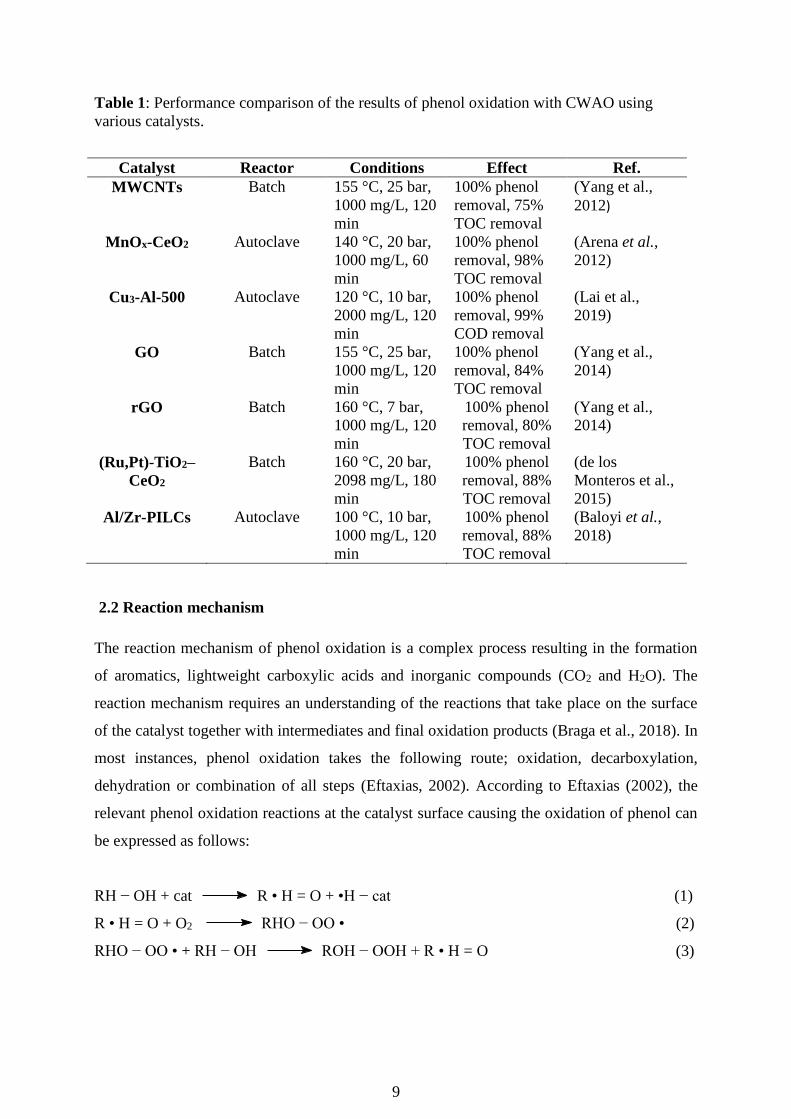
Table 1: Performance comparison of the results of phenol oxidation with CWAO using
various catalysts. ........................................................................................................................ 9 Table 2: Kinetic models proposed for heterogeneous CWAO reaction(Guo & Al-Dahhan
2003). ........................................................................................................................................ 28
Table 3: Activation energies and reaction orders found in literature using different reactors. 29 Table 4: Reactor dimensions and operating conditions .......................................................... 37 Table 5: BET results of the catalyst and support. .................................................................... 42
1
Chapter 1: Introduction
1.1 Background
Industrial processes use a lot of water which must be treated in the effluent plant before
discharging it to the municipal wastewater treatment plant (Adekola & Majozi 2017).
Industrial wastewater usually contains a high concentration of toxic organic compounds
including phenol and its derivatives (Lal and Garg, 2014; Zuo et al., 2017; Baloyi et al,
2018a, 2018b). Phenolic wastewaters originate from a number of industrial processes making
it a model pollutant for bio-toxic and non-biodegradable organic pollutants. Moreover, phenol
is an intermediate product found in the oxidation of aromatic hydrocarbons (Chicinaş, et al
2018). In addition, it is listed as a priority pollutant by the United States Environmental
Protection Agency (Lal & Garg 2014). The use of phenol in petroleum, petrochemical,
pharmaceutical, paint, pulp and paper, plastic and refinery industries is common (Masuku &
Biegler 2019; Baloyi et al. 2018a; Seadira et al. 2018; Villegas et al. 2016; Sun et al, 2015).
There are different wastewater treatment methods available such as, biological (Krastanov et
al, 2013; Pradeep et al., 2015; Alves et al., 2017; Zhou et al., 2018), adsorption (Frascari et
al. 2019; Sun et al. 2019; Luo, et al 2015), electrochemical oxidation (Abbas & Abbas 2019;
Liu et al. 2019), incineration (Wang, et al 2019; Ye, et al 2011), reverse osmosis (Al-Obaidi et
al., 2017; Al-obaidi et al., 2019a, 2019b) and advanced oxidation processes (Cao et al., 2018;
Dewidar et al., 2018; Radwan et al., 2018). Microbial degradation is unsuitable for
wastewater that has high concentration of phenol because of its toxicity. Moreover, the
process produces a byproduct that poses environmental problems such as activated sludge
(Krastanov et al., 2013; Yu et al., 2016; Guerra-que et al., 2019). Incineration is energy-
intensive and is only applicable when waste has a chemical oxygen demand (COD) of at least
300 g/L (Cybulski 2007). On the other hand, reverse osmosis produces a concentrated and
smaller waste making disposal easy however, the costs of membrane replacement and energy
requirement are high (Crini and Lichtfouse., 2019; Pervov and Nguyen., 2019; Tałałaj et al.,
2019). The incapability of traditional methods to effectively remove refractory organic
wastewater makes it clear that there is an urgent need to develop more efficient and economic
processes for treating refractory wastewater before discharging it to water bodies.
Advanced oxidation processes (AOPs) such as catalytic wet air oxidation (CWAO) offer an
alternative solution for treating refractory wastewater. CWAO gained a lot of interest over
the past two decades because of its ability to oxidize toxic wastewater and complete
mineralization of organic pollutants (Fortuny et al., 1995; Maugans and Akgerman., 2003;
2
Suárez-Ojeda et al., 2007; Monteros et al., 2015; Baloyi et al., 2018b). Moreover, CWAO is a
heterogeneous process, so an additional stage of separating the catalyst from the solution is
not required in most instances hence making the process more economic (Serra-Pérez et al.,
2019). However, the process has some disadvantages like leaching and sintering of active
material at high temperature and low pH. Therefore, the use of highly active, stable and
inexpensive catalysts will make the technology more feasible.
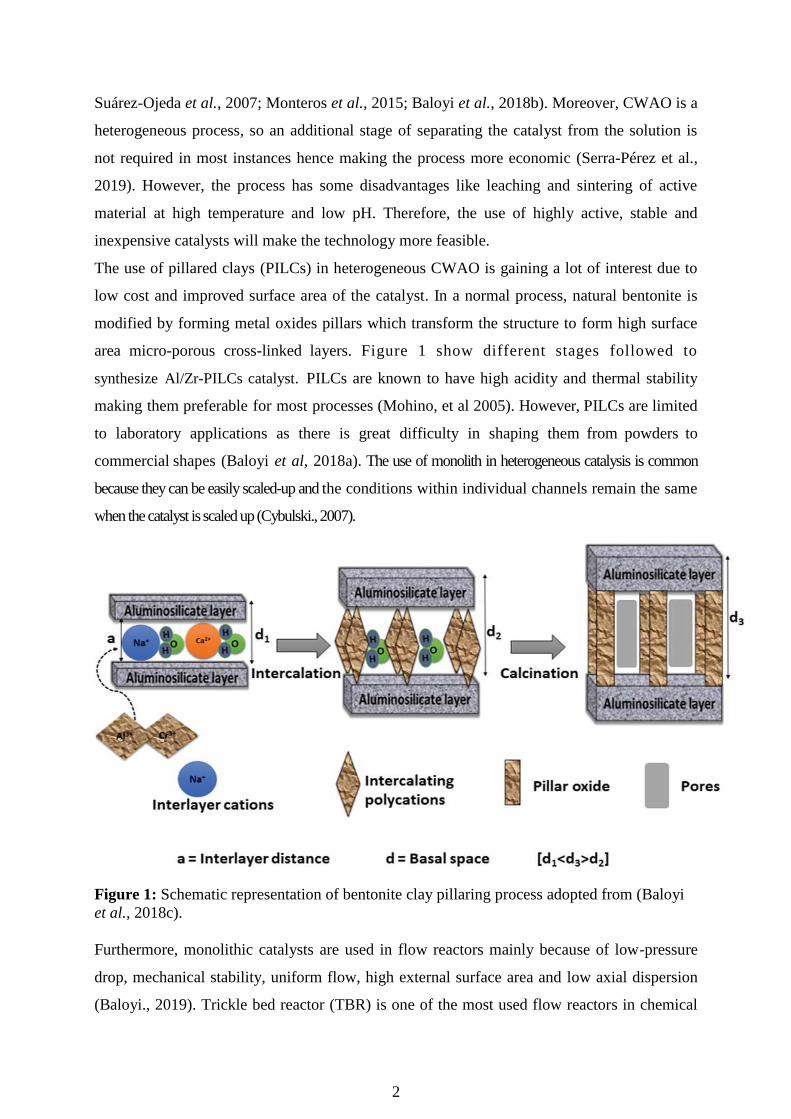
The use of pillared clays (PILCs) in heterogeneous CWAO is gaining a lot of interest due to
low cost and improved surface area of the catalyst. In a normal process, natural bentonite is
modified by forming metal oxides pillars which transform the structure to form high surface
area micro-porous cross-linked layers. Figure 1 show different stages followed to
synthesize Al/Zr-PILCs catalyst. PILCs are known to have high acidity and thermal stability
making them preferable for most processes (Mohino, et al 2005). However, PILCs are limited
to laboratory applications as there is great difficulty in shaping them from powders to
commercial shapes (Baloyi et al, 2018a). The use of monolith in heterogeneous catalysis is common
because they can be easily scaled-up and the conditions within individual channels remain the same
when the catalyst is scaled up (Cybulski., 2007).
Figure 1: Schematic representation of bentonite clay pillaring process adopted from (Baloyi
et al., 2018c).
Furthermore, monolithic catalysts are used in flow reactors mainly because of low-pressure
drop, mechanical stability, uniform flow, high external surface area and low axial dispersion
(Baloyi., 2019). Trickle bed reactor (TBR) is one of the most used flow reactors in chemical
3
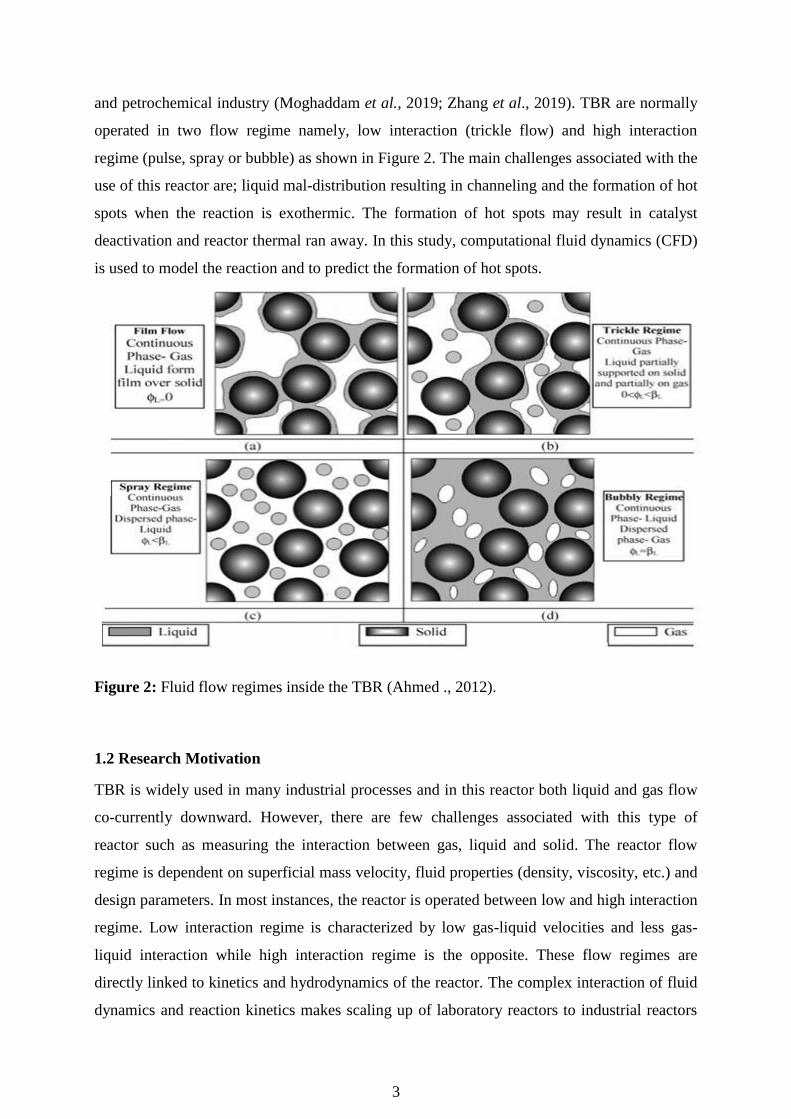
and petrochemical industry (Moghaddam et al., 2019; Zhang et al., 2019). TBR are normally
operated in two flow regime namely, low interaction (trickle flow) and high interaction
regime (pulse, spray or bubble) as shown in Figure 2. The main challenges associated with the
use of this reactor are; liquid mal-distribution resulting in channeling and the formation of hot
spots when the reaction is exothermic. The formation of hot spots may result in catalyst
deactivation and reactor thermal ran away. In this study, computational fluid dynamics (CFD)
is used to model the reaction and to predict the formation of hot spots.
Figure 2: Fluid flow regimes inside the TBR (Ahmed ., 2012).
1.2 Research Motivation
TBR is widely used in many industrial processes and in this reactor both liquid and gas flow
co-currently downward. However, there are few challenges associated with this type of
reactor such as measuring the interaction between gas, liquid and solid. The reactor flow
regime is dependent on superficial mass velocity, fluid properties (density, viscosity, etc.) and
design parameters. In most instances, the reactor is operated between low and high interaction
regime. Low interaction regime is characterized by low gas-liquid velocities and less gas-
liquid interaction while high interaction regime is the opposite. These flow regimes are
directly linked to kinetics and hydrodynamics of the reactor. The complex interaction of fluid
dynamics and reaction kinetics makes scaling up of laboratory reactors to industrial reactors
4
very difficult. Moreover, changes in hydrodynamic parameters are significant when
laboratory reactors are scaled up to commercial reactors and correlations developed in a
laboratory reactor might not work. Ranade et al, (2011) suggested that the scale of the reactor
affects the performance of a TBR and they also listed several factors that are directly affected.
These authors listed the following factors as the most affected during up-scaling; reactor to
particle diameter ratio, reactor volume, bed porosity, wetting, channeling, liquid mal-
distribution, dispersion and reactor operating mode (isothermal/adiabatic). Moreover, wall
effect is predominant in laboratory TBR whereas flow mal-distribution is common in
industrial reactors due to large bed diameter. On the other hand, CFD models should be
independent of the scale of the reactor when the design is correct. These models are based on
conservation of mass, energy and momentum. In this study, a CFD model was developed to
predict phenol degradation in a laboratory reactor and the results will be used to understand
the behavior of the process in the industrial scale.
1.3 Problem statement and purpose of the study
The High-Level Panel on Water (HLPW) estimated that 36 % of the world’s population
resides in water scares areas and half of the world’s population will be at risk by 2050
(Zhuwakinyu and the Research Unit of Creamer media., 2018). Over the last ten decades,
water usage increased by a factor of six and it is continuing to increase at a constant rate of
about 1 % annually due to population growth and economic developments (United Nations
World Water Assessment Programme., 2018). By 2017 world population was reported to be
7.7 billion and this number is expected to be between 9.4 and 10.2 billion by 2050 and more
than half of forecasted population growth is expected to be in Africa with population of
around 1.3 billion followed by Asia with 0.75 billion (United Nations Department of
Economic and Social Affairs., 2017). Currently, about 70 % of water worldwide is used for
agricultural purposes and 20 % is used for industrial applications and domestic activities
account for 10 %. Most of the industrial water is used in the energy sector which accounts for
75 % and the remaining 25 % is used in manufacturing ( Zhuwakinyu and the Research Unit
of Creamer media., 2018). Industrial wastewater usually contains a high concentration of
refractory organic compounds including phenol and its derivatives (Baloyi et al., 2018a,b;
Zuo et al., 2017; Lal & Garg., 2016). Phenol is highly soluble in water and industrial
wastewater contain phenol in the range of 200-1500 mg/l while Environmental Protection
Authority’s limit for wastewater discharge is 0.5 mg/L for surface water and 1 mg/L for
sewerage water (El-Ashtoukhy et al., 2013).
5
There are different methods available for the treatment of industrial water such as adsorption,
reverse osmosis, biological, incineration and CWAO. The use of these methods is constrained
by high capital cost, high maintenance cost, high energy consumption and expensive
catalysts. The use of heterogeneous catalysts in CWAO makes the process more attractive
because additional cost of separating the catalyst is eliminated. Baloyi (2019) reported that
South Africa has bentonite clay reserves that can last for more than 60 years if mined at the
current rate of 120 kiloton/annum. The application of pillared clays (PILCs) as a green
catalyst in AOPs, has gained a lot of interest because they are cheap, abundant and naturally
occurring. However, commercialization of PILCs is challenging because when the
conventional method is used production can take days and large volumes of water are used.
Another problem associated with the industrialization of PILCs is that the properties of the
powder catalyst must be exactly the same as the up-scaled commercially shaped catalyst
(pellet or monolith).
In this study naturally occurring South African bentonite clay was used to produce PILCs
catalyst and innovative techniques such as ultra-sonication were used to reduce processing
time. Furthermore, dry clay was added directly to the pillaring solution to lower water
consumption and cordierite monolith was used as catalyst support.
1.4 Research aim and objective(s):
The main aim of this research was to study hydrodynamics and kinetics of a trickle bed
monolith reactor and model the behavior of the process.
In order to achieve this aim, the specific objectives of this study are:
1. To synthesis and characterize Al/Zr pillared clay monolith catalyst
2. To investigating the kinetic parameters of the system (phenol) with effects of operating
conditions (Temperature and Liquid velocity).
3. To develop a CFD model using ANSYS Fluent software to predict phenol degradation and
temperature profile inside the reactor.
1.5 Novelty of the study
There are few studies that focus on preparation and characterization of PILCs catalyst and its
use in CWAO of refractory organic pollutants. However, no study in literature so far reported
on the use of South African bentonite clay PILC- monolithic catalyst used on CWAO of
phenol in a TBR. To the best of our knowledge, this is the first study to simulate CWAO of
phenol using a novel Al/Zr-PILC catalyst supported on a cordierite monolith.
6
1.6 Research questions
This study will attempt to answer the following questions;
I. What is the effect of temperature on phenol conversion?
II. What is the effect of liquid flow rate on phenol conversion?
III. Is there a difference between experimental and CFD results?
1.7 Outline of the dissertation
In Chapter 1, a detailed background, problem statement, research motivation, main and
specific objectives are covered.
In Chapter 2, detailed literature review about reaction mechanism, kinetics, homogeneous
and heterogeneous processes and CFD modeling. This chapter was published as; Tladi J.
Makatsa, Jeffrey Baloyi, Thabang Ntho and Cornelius M. Masuku, Catalytic wet air
oxidation of phenol: Review of the reaction mechanism, kinetics and CFD modeling, Critical
reviews in environmental science and technology (2020).
In Chapter 3, synthesis and characterization of Al/Zr pillared clay catalyst is presented. The
results of this chapter were presented in a conference of South African advanced material
initiative (CoSAami), 2019; SJ Baloyi, TJ Makatsa, M Govender, TA Ntho and CM
Masuku, Wash-coating of cordierite monolith with novel Al/Zr pillared clay catalyst:
Comparison of drying methods.
In Chapter 4, activity test and kinetics study of phenol was performed in a TBR over Al/Fe
pillared clay catalyst. This chapter has been published as; TJ Makatsa, J Baloyi, T Ntho and
CM Masuku, Kinetic study of phenol oxidation in a trickle bed reactor over Al/Zr-pillared
clay catalyst, IOP Conf.Ser:Mater.Sci.Eng (2019).
In Chapter 5 give a summary of conclusions and recommendations for future studies.
7
Chapter 2: Literature Review
2.1 Homogenous and heterogeneous systems
Numerous researchers have reported salts of Fe, Cu and Mn-based catalysts as commonly
used homogenous catalysts in CWAO process, due to remarkable performance for
degradation of phenol at lower temperature (120–180 °C) and lower pressure (5–80 bar) (Gao
et al., 2018; Trinidad et al., 2019; Guerra-que et al., 2019). Moreover, the process control and
reactor design of homogenous catalysts is reported to be less complex as compared to the
heterogeneous CWAO process. Arena et al., (2010) found that Fe-, Cu- and Mn-based
catalysts were able to remove phenol at oxygen partial pressure of 9 bar, temperature of 150
°C and reaction time of 360 min. Parvas et al., (2014) reported that the CuO/CeO2–ZrO2
nanocatalysts synthesized via co-precipitation and ultrasound-assisted method was able to
achieve complete conversion of phenol with initial phenol concentration of 1000 mg/L at 160
°C and atmospheric oxygen partial pressure after 180 min. Garg and Mishra (2013) reported
90% degradation of phenol over CuSO4 as homogenous catalyst by CWAO process at 120 °C
and 5 bar pressure after 4 h reaction time. The homogenous catalysts have proven to be
highly active for the phenol degradation and total organic carbon (TOC) removal at lower
temperature and lower pressure. However, the homogenous catalyst system is not
economically viable due to additional separation steps of dissolved ions after CWAO process
which would increase surplus equipment and cost required. Therefore, finding an alternative
catalytic system for phenol oxidation which is effective, high energy efficient and cheap with
the potential to treat phenol and other highly toxic organic pollutants is important. In this
case, the heterogeneous CWAO process has been reported by various researchers as the most
promising process for phenol oxidation on large scale applications due to its simplicity in
separation and operation.
Recently, numerous heterogeneous catalysts such as noble metals, non-noble metals and metal
oxides have been used. The catalytic activities of the various catalysts in the CWAO reaction
of phenol are summarized in Table 1. Various researchers have synthesized different
heterogeous catalysts with the aim of discovering robust, cheap and efficient solid catalysts,
ensuring the total oxidation of highly toxic and recalcitrant in wastewater at mild reaction
conditions (Davies et al 2018; Ukonu 2018). For example, Yang et al., 2012 studied the
CWAO of phenol at 155 °C and 25 bar pressure using Multi-walled carbon nanotubes
(MWCNTs) functionalized by different oxidants (HNO3/H2SO4,H2O2,O3 and air). All
8
functionalized catalysts showed good catalytic activity, whereas the O3-treated MWCNTs had
the highest activity with 100% phenol and 80% TOC removals after 120 min reaction.
Furthermore, the O3-treated MWCNTs showed high stability in the cyclic reactions. It was
suggested that the high amount of carboxylic acid groups and weakly acidic nature of the
surface on the functionalized MWCNTs play a significant role for the superior catalytic
activity of the MWCNTs. Arena et al., (2012) studied phenol oxidation over MnOx-CeO2
catalyst and found that the catalyst was highly active at mild temperatures of 100 °C and a
total pressure of 10 bar. It was reported that complete phenol removal was achieved within
40 min reaction time, while 80% of TOC conversion was achieved after 60 min. The high
catalytic performance of the catalyst was attributed to the rapid adsorption of phenol and its
intermediates. The treatment of phenol oxidation was studied by Lai et al., 2019 using Cu3-
Al-500 at 120 °C and 10 bar pressure. The catalyst was found to be stable and complete
conversion of phenol and 99% COD was achieved within 120 min. Good catalytic
performance was attributed to the redox transitions of Cu2+/Cu+ and/or the formation of H2O2
and the surface acidity of the catalyst in reaction mixture. Yang et al., 2014 studied the
treatment of phenol by CWAO process at 155°C and 25 bar pressure using graphene oxide
(GO) and chemically reduced graphene oxides (rGO). The phenol conversion of 100% and
mineralization of 84% and 80% was observed with GO and rGO, respectively. High catalytic
performance was because of increased surface area and big pore volume of graphene which
improves adsorption capacity of the catalyst. de los Monteros et al., 2015 studied CWAO of
phenol over Ru and Pt supported on TiO2–x wt% CeO2 at 155°C and 20 bar pressure. The
(Ru,Pt)-TiO2–CeO2 catalysts showed high activity towards oxidation of phenol by achieving
100% phenol conversion and 88% TOC removal. Baloyi et al, 2018 reported the complete
removal of phenol and 88% TOC removal after 120 min at 100 °C and 10 bar over low-cost
Al/Zr-PILCs catalyst. The catalyst was very stable and a negligible amount of Zr4+ was found
in the leachate after six runs.
9
Table 1: Performance comparison of the results of phenol oxidation with CWAO using
various catalysts.
Catalyst Reactor Conditions Effect Ref.
MWCNTs
Batch 155 °C, 25 bar,
1000 mg/L, 120
min
100% phenol
removal, 75%
TOC removal
(Yang et al.,
2012)
MnOx-CeO2 Autoclave 140 °C, 20 bar,
1000 mg/L, 60
min
100% phenol
removal, 98%
TOC removal
(Arena et al.,
2012)
Cu3-Al-500 Autoclave 120 °C, 10 bar,
2000 mg/L, 120
min
100% phenol
removal, 99%
COD removal
(Lai et al.,
2019)
GO Batch 155 °C, 25 bar,
1000 mg/L, 120
min
100% phenol
removal, 84%
TOC removal
(Yang et al.,
2014)
rGO Batch 160 °C, 7 bar,
1000 mg/L, 120
min
100% phenol
removal, 80%
TOC removal
(Yang et al.,
2014)
(Ru,Pt)-TiO2–
CeO2
Batch 160 °C, 20 bar,
2098 mg/L, 180
min
100% phenol
removal, 88%
TOC removal
(de los
Monteros et al.,
2015)
Al/Zr-PILCs Autoclave 100 °C, 10 bar,
1000 mg/L, 120
min
100% phenol
removal, 88%
TOC removal
(Baloyi et al.,
2018)
2.2 Reaction mechanism
The reaction mechanism of phenol oxidation is a complex process resulting in the formation
of aromatics, lightweight carboxylic acids and inorganic compounds (CO2 and H2O). The
reaction mechanism requires an understanding of the reactions that take place on the surface
of the catalyst together with intermediates and final oxidation products (Braga et al., 2018). In
most instances, phenol oxidation takes the following route; oxidation, decarboxylation,
dehydration or combination of all steps (Eftaxias, 2002). According to Eftaxias (2002), the
relevant phenol oxidation reactions at the catalyst surface causing the oxidation of phenol can
be expressed as follows:
RH − OH + cat R • H = O + •H − cat (1)
R • H = O + O2 RHO − OO • (2)
RHO − OO • + RH − OH ROH − OOH + R • H = O (3)
10
where RH − OH represents phenol, R • H = O is phenoxy radical while RHO − OO•
corresponds to peroxy radical.
Several studies have been conducted by different researchers with the aim of determining
intermediate species formed on the surface of the catalyst. The findings are still controversial
because some scholars reported that phenol can be directly oxidized to CO2 and H2O (Figure
6 & Figure 7) without the formation of intermediates while others claim the formation of
polymerization product (Figure 5) and acetic acid via an indirect mechanism. In some
instances, acetic acid can be fully oxidized to CO2 and H2O while in some cases it is resistant
to the oxidation process.
2.2.1. Indirect Mechanism
Wang et al., (2014) proposed a different mechanism from the ones in literature, they used
functionalized carbon materials as catalysts (multi-walled carbon nanotubes, nanofibers, and
graphite) to investigate phenol oxidation. Phenol was oxidized in a 1 L autoclave reactor
equipped with a stirrer, heating device and cooling coil. The reactor temperature and pressure
were kept constant at 160 °C and 25 bar. To identify intermediates they used HPLC with 60
% methanol in water plus 0.1 % acetic acid as mobile phase and ODS-3 column. The removal
of phenol over this catalyst reached almost 100 % after 120 min, suggesting that these
catalysts are very active. The results obtained can be attributed to carboxylic acids found on
the surface of functionalized carbon material improving their activity. In their study, catechol
was not detected like in most papers in open literature and they suggested that it might be
because of different catalysts used. Maleic, fumaric and very low concentrations of cis
butenedioic anhydride were also detected. To further understand the reaction path; pure
standards of maleic, malonic, acetic, oxalic and formic acid were also oxidized. In CWAO of
maleic acid, the following intermediates were found; malonic acid, oxalic acid, acetic acid,
and formic acid. Acetic acid was not detected in the first 30 min of the experiment showing
that it is not directly produced from the oxidation of maleic acid instead it might be produced
from malonic and oxalic acid. In the oxidation of malonic acid, a sharp decrease in
concentration was observed while both acetic and formic acids were shortly detected in the
solution suggesting that these two are direct products of malonic acid oxidation. Two peaks
were detected by HPLC when acetic acid was oxidized, one was assigned to acetic acid and
the other one was unknown. An assumption was made that this unknown peak belongs to
dioxirane but it was never confirmed since dioxirane of high purity was not available.
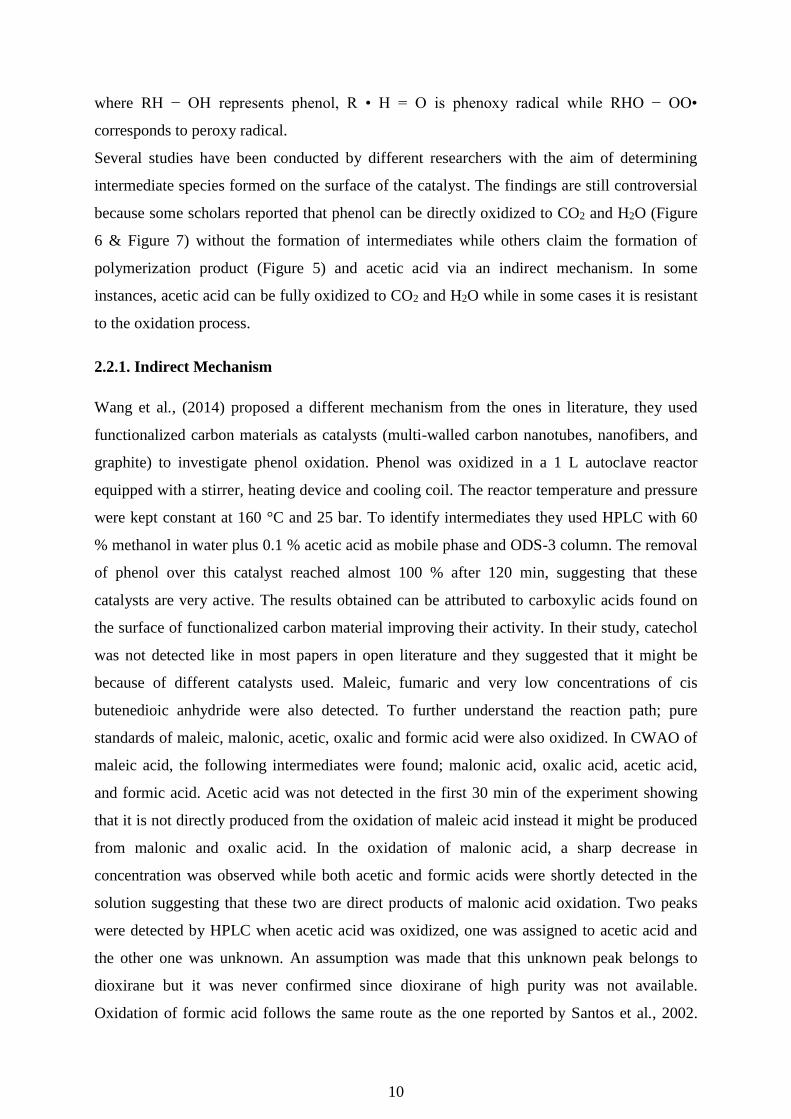
Oxidation of formic acid follows the same route as the one reported by Santos et al., 2002.
11
Santos et al., (2002) proposed a mechanism for formic acid oxidation and suggested that it
follows a termination path in the free radical mechanism whereby hydroxyl radical attacks it
to remove hydrogen bonded to carbon and the free radical •COOH to form oxalic acid.
Moreover, they found that when conditions are suitable, formic acid and oxalic acid mutually
interconvert. After careful considerations the authors proposed a reaction path in Figure 3.
OH OH
OH
O
O
CO2 H2O
HOOCCH2COOH HCOOH
HO
OH
O
O
OH
OH
O
O
O
O
O
HOOCCOOH
CH3COOH
CH2O2
O2
Figure 3: Reaction mechanism for CWAO of phenol in a batch reactor using functionalized
carbon material as catalyst proposed by (Wang et al. 2014).
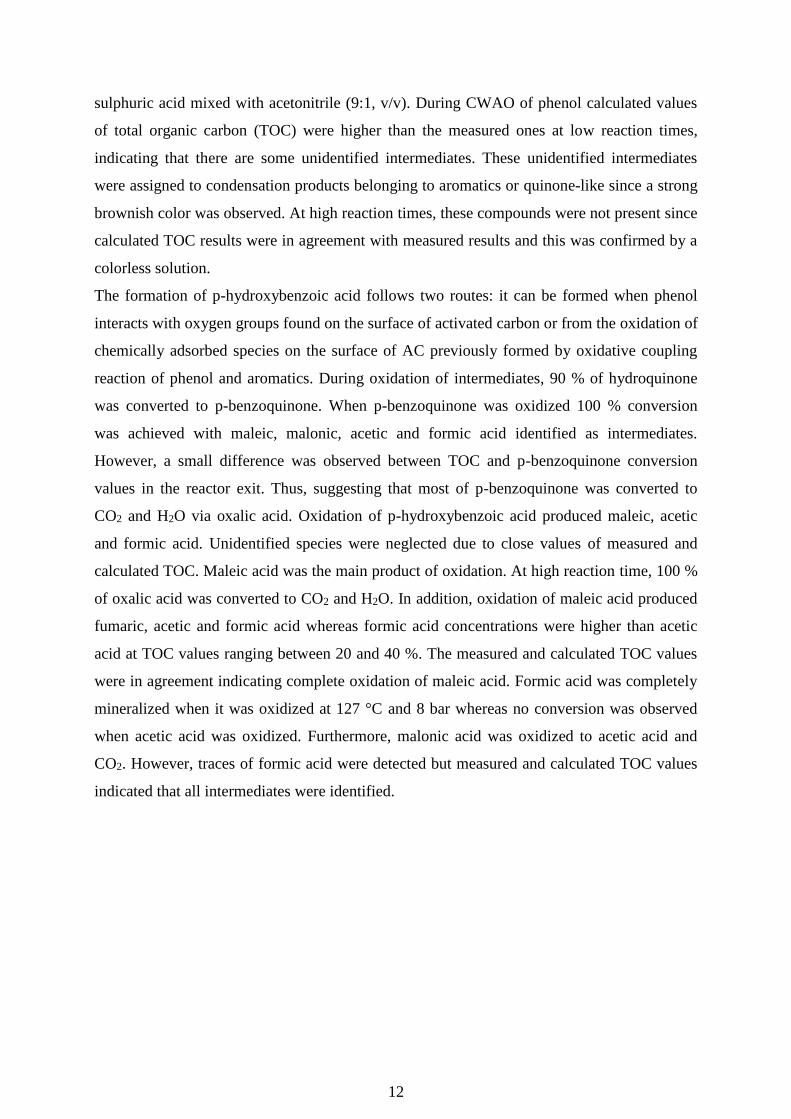
Quintanilla et al., (2006) proposed a reaction pathway shown in Figure 4 for phenol oxidation
over Fe supported on activated carbon (AC) catalyst. The proposed study was carried out in a
trickle bed reactor with an inside diameter of 8.5 and 305 mm length and the reactor was
operated between (100 °C, 127 °C and 8 bar), pressure and flow rates were kept constant by
mass flow controller and back pressure valve. Phenol and other intermediates were measured
by HPLC using Nucleosil C18 column (15 cm, 4.6 mm, 5 µm) with a mobile phase of 4 mM
12
sulphuric acid mixed with acetonitrile (9:1, v/v). During CWAO of phenol calculated values
of total organic carbon (TOC) were higher than the measured ones at low reaction times,
indicating that there are some unidentified intermediates. These unidentified intermediates
were assigned to condensation products belonging to aromatics or quinone-like since a strong
brownish color was observed. At high reaction times, these compounds were not present since
calculated TOC results were in agreement with measured results and this was confirmed by a
colorless solution.
The formation of p-hydroxybenzoic acid follows two routes: it can be formed when phenol
interacts with oxygen groups found on the surface of activated carbon or from the oxidation of
chemically adsorbed species on the surface of AC previously formed by oxidative coupling
reaction of phenol and aromatics. During oxidation of intermediates, 90 % of hydroquinone
was converted to p-benzoquinone. When p-benzoquinone was oxidized 100 % conversion
was achieved with maleic, malonic, acetic and formic acid identified as intermediates.
However, a small difference was observed between TOC and p-benzoquinone conversion
values in the reactor exit. Thus, suggesting that most of p-benzoquinone was converted to
CO2 and H2O via oxalic acid. Oxidation of p-hydroxybenzoic acid produced maleic, acetic
and formic acid. Unidentified species were neglected due to close values of measured and
calculated TOC. Maleic acid was the main product of oxidation. At high reaction time, 100 %
of oxalic acid was converted to CO2 and H2O. In addition, oxidation of maleic acid produced
fumaric, acetic and formic acid whereas formic acid concentrations were higher than acetic
acid at TOC values ranging between 20 and 40 %. The measured and calculated TOC values
were in agreement indicating complete oxidation of maleic acid. Formic acid was completely
mineralized when it was oxidized at 127 °C and 8 bar whereas no conversion was observed
when acetic acid was oxidized. Furthermore, malonic acid was oxidized to acetic acid and
CO2. However, traces of formic acid were detected but measured and calculated TOC values
indicated that all intermediates were identified.
13
OH
Phenol
p benzoquinone
CO2 H2O
O2 AC/O2
O2
COOH
OHp hydroxybenzoic acid
OH
OH
CHOOC
CCOOH
H H
O2
O
O
Hydroquinone
C
O
HO
C
O
OH
Oxalic acid
O2O2
Maleic Acid
C C
H
COOHH
HOOC
O2O2
Fumaric acid
CO2 C
O
OH
HO2
C CH2 C
OO
HO OH
Malonic acid
CH3C
O
OH
CO2
CO2
Formic acid
Acetic acid Figure 4: Schematic diagram of CWAO of phenol reaction mechanism in the presence of
Fe/AC catalyst (Quintanilla et al, 2006).
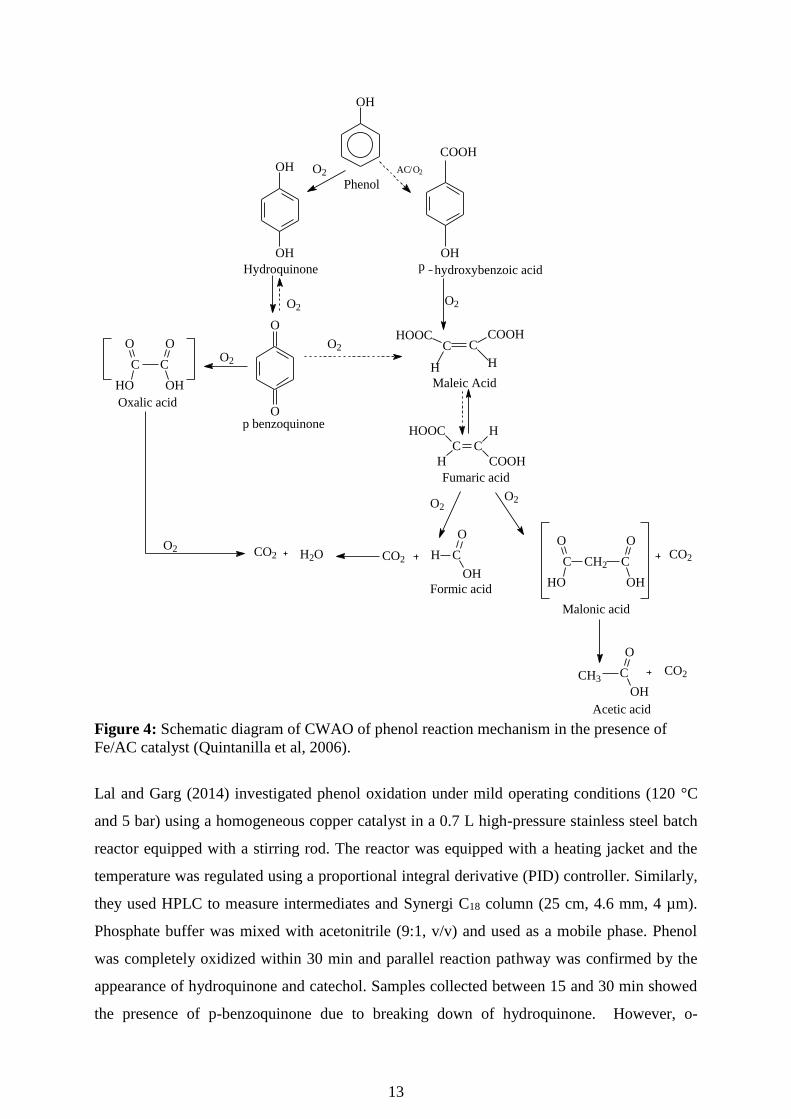
Lal and Garg (2014) investigated phenol oxidation under mild operating conditions (120 °C
and 5 bar) using a homogeneous copper catalyst in a 0.7 L high-pressure stainless steel batch
reactor equipped with a stirring rod. The reactor was equipped with a heating jacket and the
temperature was regulated using a proportional integral derivative (PID) controller. Similarly,
they used HPLC to measure intermediates and Synergi C18 column (25 cm, 4.6 mm, 4 µm).
Phosphate buffer was mixed with acetonitrile (9:1, v/v) and used as a mobile phase. Phenol
was completely oxidized within 30 min and parallel reaction pathway was confirmed by the
appearance of hydroquinone and catechol. Samples collected between 15 and 30 min showed
the presence of p-benzoquinone due to breaking down of hydroquinone. However, o-
14
benzoquinone was not detected when catechol was oxidized due to the unstable nature of this
compound caused by two adjacent C=O groups. All organic acids (oxalic, formic, malonic,
maleic and fumaric) were detected within 15 minutes except acetic acid which appeared after
30 min. Acetic acid is formed during decarboxylation of malonic acid and oxalic acid might
break down to formic acid during this process. Moreover, traces of maleic and fumaric acids
were also detected and a significant concentration of oxalic acid was found after 3 h. In
addition, formic acid was decarboxylated by hydroxyl radicals to form CO2 and H2O and the
authors proposed a mechanism in Figure 5. The reaction of hydroxyl radical can happen in
three ways: by hydroxyl addition, hydrogen abstraction or electron transfer. In the presence of
transition metals, CWAO follows auto-oxidation mechanism in this manner:
C6H5OH Cu2+
C6H5OH• + H• (4)
C6H5OH• + O2 C6H5OOO• (5)
C6H5OOO• + H2O C6H5OOOH + HO• (6)
C6H5OOOH C6H5O• + HO2• (7)
C6H5O• + C6H5O• C6H5OOC6H5 (8)
Hydroxyl radicals are known to be neutral electrons and they attack at the high electron
density area of the molecule. Phenolic compounds have high electron density available at
ortho and para positions because of the resonance effect. Due to this effect; hydroxyl radical
attacks these positions to remove hydrogen or add oxygen leading to the formation of catechol
or hydroquinone. The formation of p-benzoquinone is due to the formation of stable free
radical formed when hydroquinone is attacked by the free radical. Benzoquinone has six
carbon chains and two have low electron density caused by oxygen electronegativity. The
electron density of the other four carbons can be increased by the presence of oxygen by
resonance, causing ring opening when HO· attacks these carbons. Some polymers were also
identified by Fourier Transmission Infrared (FTIR) microscopy showing the presence of
aromatics, olefinic and alcohols.
15
Catechol
Hydroquinone
Acetic acid
CO2
H2O
OH
Phenol
OH
OH
OH
OH
Polymerized products(Aromatic alcohols/Polyphenols)
O
O
o Benzoquinone
O
Op Benzoquinone
HOOHO
O
Oxalic acidOH
OH
O
O
Fumaric acidO
OH
OH
O
CO2
H OH
O
Formic acid
CO2
Maleic acid
HO OH
OO
Malonic acid
OH
O
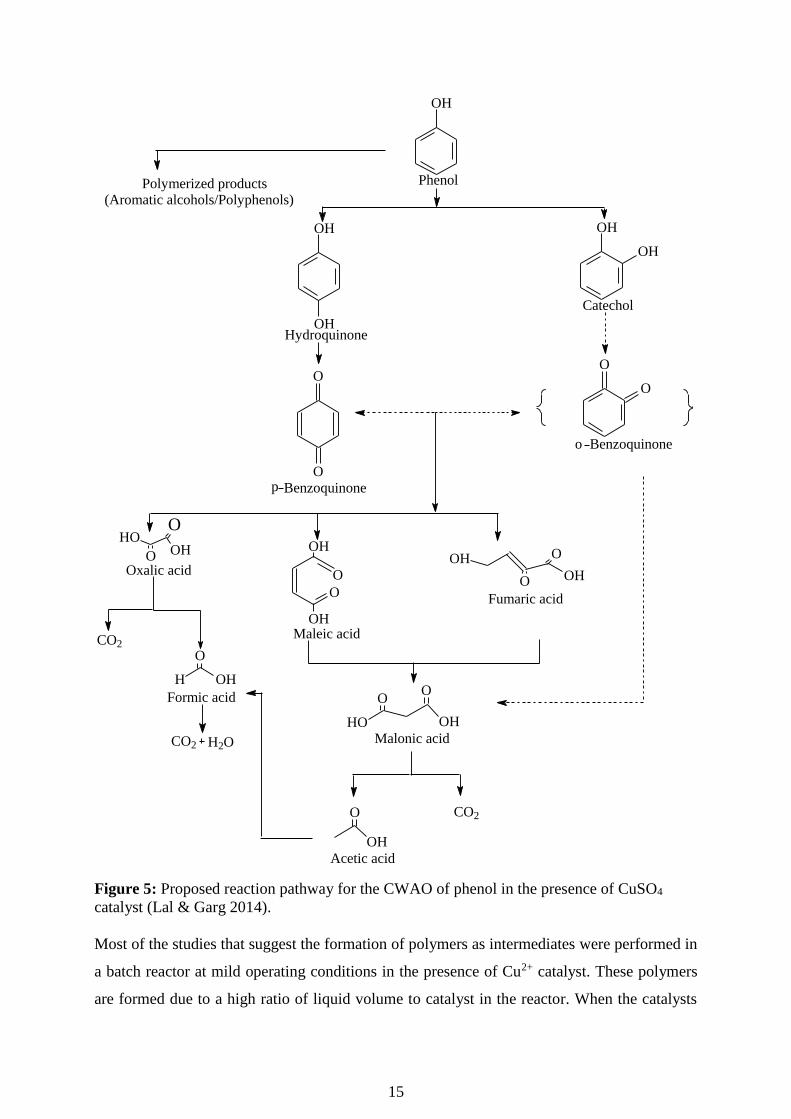
Figure 5: Proposed reaction pathway for the CWAO of phenol in the presence of CuSO4
catalyst (Lal & Garg 2014).
Most of the studies that suggest the formation of polymers as intermediates were performed in
a batch reactor at mild operating conditions in the presence of Cu2+ catalyst. These polymers
are formed due to a high ratio of liquid volume to catalyst in the reactor. When the catalysts
16
was characterized, the results indicated that polymerization products were present on the
surface of the catalyst. These polymerization products reduce the activity and reusability of
the catalyst by blocking access to active sites. However, when functionalized carbon materials
were used as catalysts at high pressure, polymerization products were not detected and phenol
was completely removed. Therefore, the use of a batch reactor in phenol oxidation is not
practical due to the high pressure required to avoid the formation of polymers and high costs
of catalyst regeneration. On the other hand, when TBR was used, polymerization products
were not formed and phenol was completely oxidized. However, when Cu2+ catalyst was
used, analysis results indicated that Cu2+ ions were present in the solution suggesting leaching
of the catalyst. Several studies reported that pillared clay (PILC) catalysts are stable and
leaching of active sites is insignificant (Guo and Al-Dahhan, 2003; Baloyi et al., 2018a;
Moma et al., 2018). Therefore, TBR should be used in the wastewater treatment of phenolic
compounds. In order to minimize leaching of active sites, it is advisable to use PILC catalyst
in CWAO of phenolic compounds.
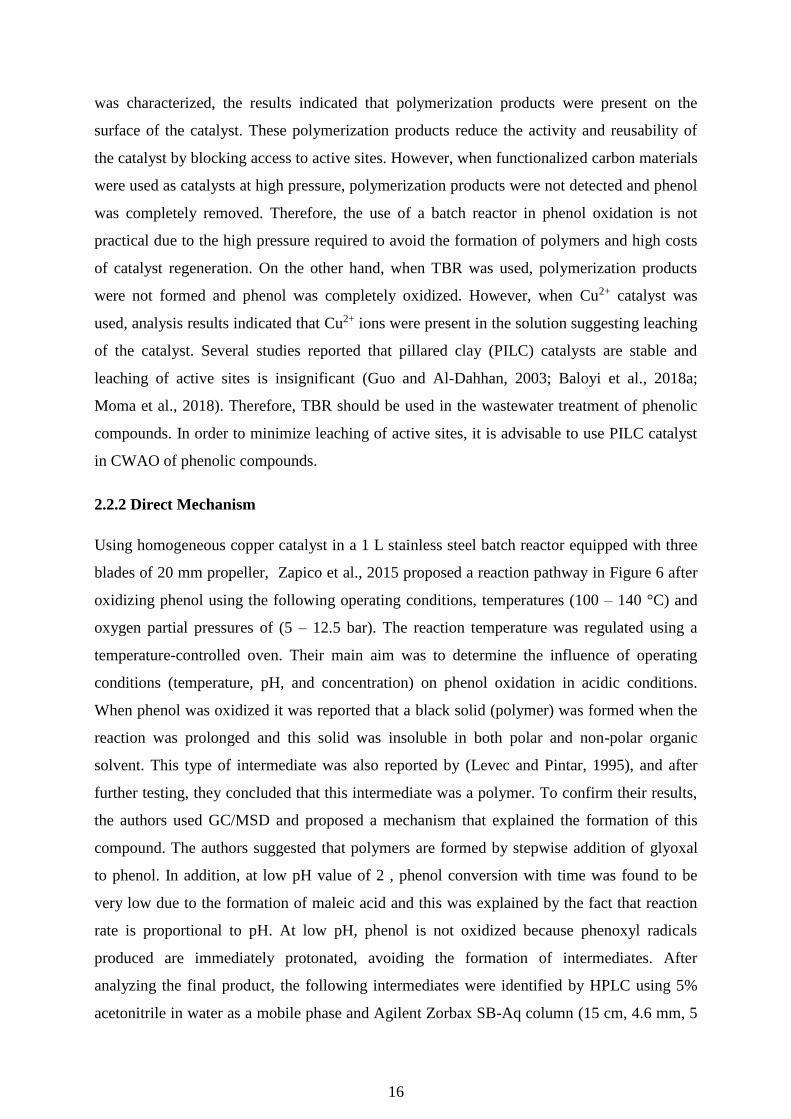
2.2.2 Direct Mechanism
Using homogeneous copper catalyst in a 1 L stainless steel batch reactor equipped with three
blades of 20 mm propeller, Zapico et al., 2015 proposed a reaction pathway in Figure 6 after
oxidizing phenol using the following operating conditions, temperatures (100 – 140 °C) and
oxygen partial pressures of (5 – 12.5 bar). The reaction temperature was regulated using a
temperature-controlled oven. Their main aim was to determine the influence of operating
conditions (temperature, pH, and concentration) on phenol oxidation in acidic conditions.
When phenol was oxidized it was reported that a black solid (polymer) was formed when the
reaction was prolonged and this solid was insoluble in both polar and non-polar organic
solvent. This type of intermediate was also reported by (Levec and Pintar, 1995), and after
further testing, they concluded that this intermediate was a polymer. To confirm their results,
the authors used GC/MSD and proposed a mechanism that explained the formation of this
compound. The authors suggested that polymers are formed by stepwise addition of glyoxal
to phenol. In addition, at low pH value of 2 , phenol conversion with time was found to be
very low due to the formation of maleic acid and this was explained by the fact that reaction
rate is proportional to pH. At low pH, phenol is not oxidized because phenoxyl radicals
produced are immediately protonated, avoiding the formation of intermediates. After
analyzing the final product, the following intermediates were identified by HPLC using 5%
acetonitrile in water as a mobile phase and Agilent Zorbax SB-Aq column (15 cm, 4.6 mm, 5
17
µm); hydroquinone, p-benzoquinone, catechol, maleic and oxalic acid. Hydroquinone, p-
benzoquinone and catechol were completely removed at pH 4 after 5 hours; at lower pH
values, high reaction time was required. When COD analysis was performed, it was
discovered that oxidation takes place via two paths, direct oxidation of phenol to CO2 and
H2O and indirect mechanism which involves the formation of intermediates.
OH
OH
OH
OH
OH
O
O
Catechol
Hydroquinone
Phenol
p benzoquinone
COOH
COOHMaleic acid
CO2 H2O
Polymer
k 8
k7
CO2 H2O
k5
k 6
HOOC COOH
Oxalic acid
k9
k 10
k 3
k 1 k 2
k 4
Figure 6: CWAO of phenol oxidation reaction mechanism (Zapico et al. 2015).
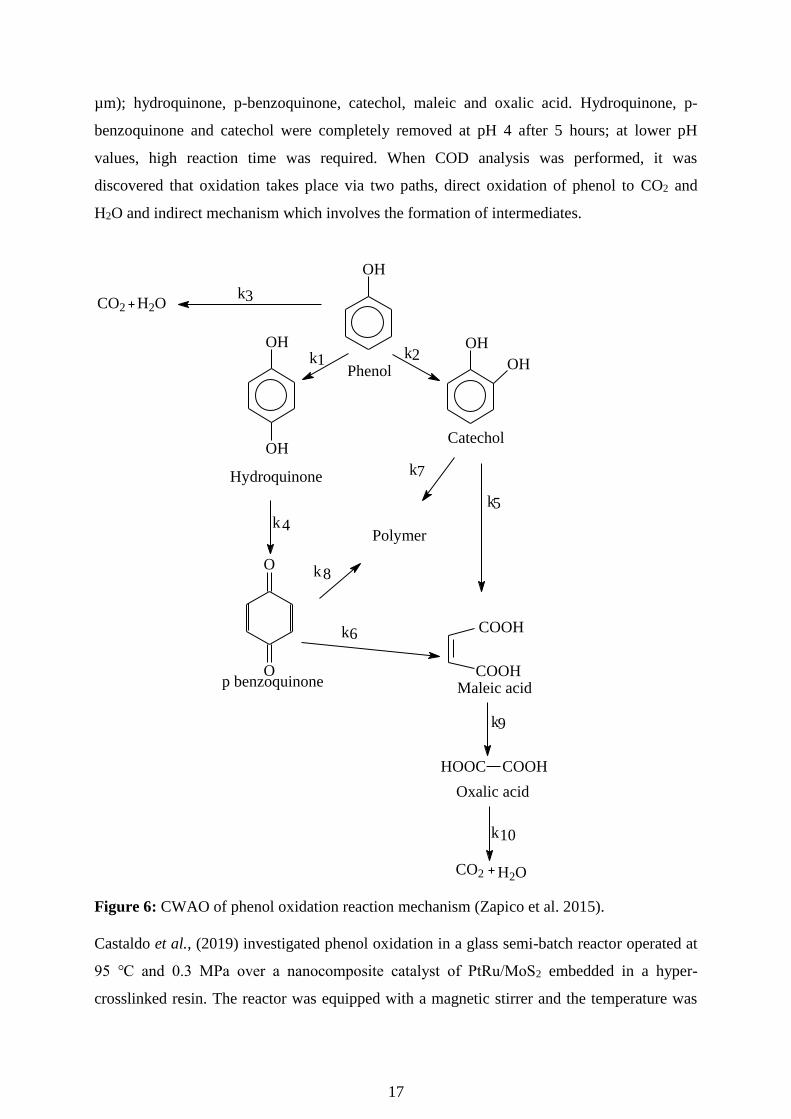
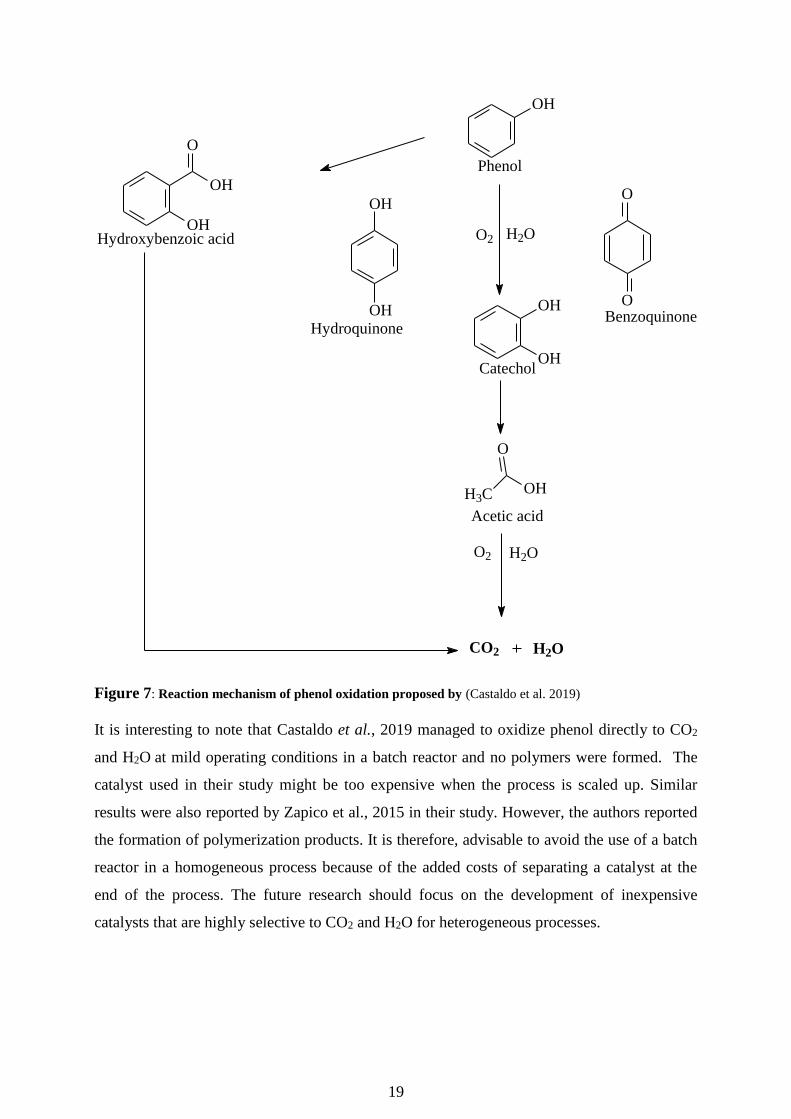
Castaldo et al., (2019) investigated phenol oxidation in a glass semi-batch reactor operated at
95 ℃ and 0.3 MPa over a nanocomposite catalyst of PtRu/MoS2 embedded in a hyper-
crosslinked resin. The reactor was equipped with a magnetic stirrer and the temperature was
18
controlled using a heating jacket. In contrast to (Lal and Garg, 2014, Quintanilla et al., 2006),
these authors used UV-vis spectra and gas chromatography coupled with a mass spectrometer
(GC-MS) to measure phenol conversion. Moreover, carbon dioxide evolution was measured
using Siemens Utramar 22 analyzer. To test catalyst activity; two experiments were conducted
at 1000 and 4000 mg/L of phenol concentration while keeping operating conditions the same
in all experiments. When the experiment was conducted at high concentrations (4000 mg/L)
both acetic acid and hydroquinone were detected by UV-vis at low and high wavelengths after
240 min and 99.9 % of phenol was removed. Further tests were performed using GC analyzer
and after 300 min, phenol content was 30.1 % and a high concentration of acetic acid (96.61
%) was detected whereas insignificant amounts of hydroquinone (2.98 %) and p-
benzoquinone (0.41 %) were detected. These authors proposed a reaction mechanism in
Figure 7 and suggested that hydroquinone was the primary intermediate and it oxidizes fast to
form p-benzoquinone. Moreover, this intermediate (p-benzoquinone) oxidizes to form CO2
and carboxylic acids. When low concentration (1000 mg/L) was used, UV-vis spectra
indicated the presence of low molecular weight organic acid (acetic) after 30 min and these
results were confirmed by GC-MS. Furthermore, 99.9 and 97.1 % of phenol and TOC were
removed.
19
OH
Phenol
O
OOH
OH
OH
OH BenzoquinoneHydroquinone
O2 H2O
Catechol
OH
OH
O
Hydroxybenzoic acid
H3C OH
O
Acetic acid
O2 H2O
CO2 H2O
Figure 7: Reaction mechanism of phenol oxidation proposed by (Castaldo et al. 2019)
It is interesting to note that Castaldo et al., 2019 managed to oxidize phenol directly to CO2
and H2O at mild operating conditions in a batch reactor and no polymers were formed. The
catalyst used in their study might be too expensive when the process is scaled up. Similar
results were also reported by Zapico et al., 2015 in their study. However, the authors reported
the formation of polymerization products. It is therefore, advisable to avoid the use of a batch
reactor in a homogeneous process because of the added costs of separating a catalyst at the
end of the process. The future research should focus on the development of inexpensive
catalysts that are highly selective to CO2 and H2O for heterogeneous processes.
20
2.3. Operating parameter
2.3.1. Effect of temperature
It is generally accepted that an increase in temperature will result in high phenol conversion
due to the fact that the reaction rate constant is a function of temperature and activation
energy, according to the Arrhenius equation:
(9)
Where k is the reaction rate constant, A is a pre-exponential factor, Ea is activation energy, R
is the gas constant and T is the temperature.
The increase in temperature also results in the formation of oxygen free radicals which can
react with oxygen and water to form peroxide (H2O2) and ozone (O3) radicals. These radicals
can participate in phenol oxidation, thus increasing the efficiency of the process (Mohammed,
et al, 2016a). The study by Eftaxias et al., 2005 proved that the performance of unsupported
commercial activated carbon as a catalyst is highly dependent on temperature. They
investigated phenol oxidation using activated carbon as a catalyst in a trickle bed reactor
operated between 120 °C - 160 °C. Phenol and COD conversion improved when temperature
and space-time were increased resulting in conversions higher than 99 % for phenol, 85 %
COD at 160 °C and space-time greater than 0.4 h. Similarly, Mohammed (2014) studied the
effect of temperature on phenol oxidation in a trickle bed reactor operated between (120 °C -
160 °C) using activated carbon as a catalyst. After 1 h they reached 100 % conversion at 160
°C while at low temperatures (120 and 140 °C) low conversions were reported (88.6 and 92.7
%). Yang et al., 2014 also used carbon-based catalysts (graphene oxide and reduced
graphene) in a batch reactor. The reactor temperature was kept constant at 155 °C and
graphene oxide (GO) was found to be the most active catalyst achieving 100 % phenol
conversion in 40 min while 120 min was required to remove all phenol when reduced
graphene oxide (rGO) was used. Furthermore, over 80 % of TOC was converted after 120
min in both cases. Wu et al, 2005 used copper supported on activated carbon as a catalyst in a
batch reactor with a temperature range of (140 °C - 160 °C) and a similar trend was also
reported.
Ahmed, 2012 investigated phenol oxidation using 0.5 % Pt supported on γ-Al2O3. Phenol was
oxidized in a trickle bed reactor operated between the temperatures of 85 °C and 140 °C.
They reported phenol conversions of 88.59 %, 75.6 %, 65 %, and 43.86 % at 140 °C, 120 °C,
100 °C and 85 °C, respectively. The formation of intermediates also increased with an
21
increase in temperature. Mohammed et al., 2016 developed a kinetic model for phenol
oxidation in a trickle bed reactor using 0.48 % Pt/ γ-Al2O3 spheres as a catalyst and the
reactor was operated between (120 °C - 160 °C). In their model kinetics parameters were
estimated based on experimental data and from the data obtained they up-scaled the reactor to
predict the behavior of phenol oxidation in industrial reactors. At a temperature of 120 °C
phenol conversion was 87.954 % and when the temperature was increased to 140 °C and 160
°C phenol conversion increased significantly to 90.878 % and 93.13 %. On the other hand,
several authors used less expensive catalysts like MnO2/CeO2, Al/Zr pillared clay (PILC),
Al/Cr pillared clay, Al/Fe pillared clay, and Al-Fe pillared clay (Hamoudi et al, 1998; Guo
and Al-Dahhan, 2003; Mohammed and Abdullah, 2008; Baloyi et al, 2018a; Moma et al,
2018). Baloyi et al, 2018a studied phenol oxidation in a batch reactor operated at 100 °C, over
single metal oxide pillared clay (Al-PILC & Zr-PILC)) and mixed metal oxides (Al/Zr-PILC)
pillared clay catalyst. After a reaction time of 180 min, 100 % conversion was attained when
both single and mixed metal oxide catalysts were used in separate experiments. However,
high TOC removal was achieved when the mixed metal oxide catalyst was used (88 %)
compared to single metal oxide (61 %) after 180 min. Similar results were also obtained by
Baloyi et al, 2018a . Phenol was oxidized in a batch reactor operated at 100 °C using single
metal oxide pillared clay (Al-PILC & Cr-PILC)) and mixed metal oxides (Al/Cr-PILC)
pillared clay catalyst. After 120 min 100 % phenol was removed when Al/Cr-PILC (1:1 molar
ratio) was used and approximately (ca.) 84% of TOC was converted after 180 min whereas
when single metal oxides were used TOC conversion decreased from 84 to 36 %. In their
study Guo and Al-Dahhan, 2003 studied wet air oxidation of phenol over Al-Fe pillared clay
catalyst extrudes. Phenol oxidation was investigated between 90 °C and 150 °C in a basket
stirred tank reactor. According to their findings, phenol and its intermediates are highly
influenced by temperature increase. Furthermore, it was concluded that a 20 °C increase in
temperature can result in double phenol conversion in 1 h. In addition, they managed to
remove 0.5 g/L of phenol completely when the reactor was operated at 90 °C for 300 min,
whereas at 130 °C phenol was completely removed within 100 min. Phenol conversion was
faster compared to intermediates degradation due to the fact that short-chained carboxylic
acids are more stable and oxidation rate increase with a molecular weight of the acid
(Klinghoffer et al., 1998). Hamoudi et al., (1998) investigated phenol oxidation in a batch
reactor under mild conditions (80 °C – 130 °C) using MnO2/CeO2 catalyst. They reported 100
% phenol removal at 130 °C after 30 min, while TOC conversion was more than 98 %. An
22
increase in temperature was less pronounced for intermediates compared to phenol removal
indicating the formation of carboxylic acids.
In summary, the studies that were conducted using carbon-based catalysts indicated that at
high-temperature phenol was completely removed in a short period. This is because phenol is
reduced in two ways, adsorption and catalytic activity. The same results are also evident when
PGMs and PILC catalysts are used. However, PGMs are expensive and the reaction
temperature required to completely remove the pollutant is high irrespective of the catalyst
used. Furthermore, many studies involving the use of PILC catalysts are conducted in a batch
reactor. Therefore, more studies should be conducted to develop catalysts that are cheap and
highly reactive (PILC) to reduce reaction temperature and space-time using a different reactor
configuration (TBR) instead of batch.
2.3.2. Effect of initial phenol concentration
The study of the effect of initial phenol concentration is significant both from a mechanistic
and application point of view to investigate the dependence of phenol reaction rate kinetics on
the substrate concentration. Mohammed et al., (2016) investigated phenol oxidation in a
trickle bed reactor using 0.48 % Pt/ γ-Al2O3 catalyst while varying initial phenol
concentration from, 0.001, 0.003 and 0.005 g/L. When phenol concentration was increased
from (0.001-0.005 g/L), conversion increased from 80.35 to 94.75 % due to increased phenol
molecules on the active sites of the catalyst. Similarly, Abid et al., 2014 investigated the
effect of initial phenol concentration in a trickle bed reactor over 0.5 % Pt/ γ-Al2O3 catalyst
while varying phenol concentration between, 0.9, 2.5 and 5 g/L. The authors reported that an
increase in phenol concentration has a negative impact on phenol conversion, contradicting
the results reported by Mohammed et al., 2016 . Moreover, the conversion of phenol at 0.9
g/L was 67.47 % and when the concentration was increased to 5 g/L the conversion
decreased to 59.44 % indicating 8 % reduction. Resini et al., (2008) also investigated the
effect of phenol concentration between (0.035-0.118 g/L) over lanthanum strontium
manganite catalyst in a batch reactor. According to their observations, phenol conversion
decreased with an increase in concentration and they attributed this occurrence to transport
limitations of phenol on the surface of a catalyst. Similar results were also reported by Lal
and Garg, (2014), the researchers investigated the effect of initial phenol concentration
between (1-10 g/L) over the homogeneous copper salt catalyst in a batch reactor. A significant
amount of phenol was removed after 3 h with an increase from approximately 60 to 96 %.
23
Moreover, phenol conversion increased with a decrease in concentration and similar trends
were also observed for TOC.
It is generally reported that the phenol oxidation rate increases with an increase in
concentration. However, this concept is true to a certain extend because a further increase in
concentration beyond a saturation point usually results in a decrease in phenol conversion.
This phenomenon is demonstrated in several studies conducted by different scholars to
determine the effect of phenol concentration. Their findings are still controversial because
some researchers claim that an increase in phenol concentration increases conversion while
others report the opposite. These controversial findings necessitate the need to investigate the
claim further to close the gap.
2.3.3. Effect of pH
At low pH values the following reaction takes place (Zapico et al. 2015):
PhO• + H+ PhOH•+ (10)
Zapico et al., 2015 investigated the effect of pH in a batch reactor operated between pH
values of (2- 4) using a homogeneous copper catalyst. According to their findings, phenol
conversion increased with an increase in pH. The induction period was also observed at pH 3
and 4 due to the initialization step of radical reactions and this phenomenon decreased with
increase in pH. This suggests that phenol is not oxidized at low pH values because
initialization reaction produces phenoxyl radicals that are immediately protonated avoiding
the formation of intermediates. The reaction rate is heavily dependent on pH, thus an increase
in pH affects the reaction rate positively. Abid et al., (2016) investigated the effect of pH in a
trickle bed reactor operated between pH values of (3- 10) using activated carbon (AC)
catalyst. The highest phenol conversion was achieved at pH 5 whereas when pH was
increased to 10, lowest conversions were observed. Furthermore, maximum adsorption was
recorded at pH 5 and when pH was increased above this point adsorption capacity decreased
and point of zero charge was found to be at pH 8. The catalyst surface was positively charged
during the reaction, therefore, experiencing high affinity for anions or ionized compounds.
Similarly, Guo and Al-Dahhan (2003) studied the effect of pH between 3.9-5.1 in a basket
stirred tank reactor over Al-Fe pillared clay catalyst. They studied phenol oxidation using two
solutions; in the first solution, pH was adjusted using sulfuric acid whereas in the second
solution pH was not adjusted. It was reported that when pH was adjusted, phenol removal rate
24
was 2 times higher compared to when pH was not adjusted and 100 % conversion was
achieved at pH 3.9. Yadav et al., (2016) studied the effect of pH between 2.8 -8 in a batch
reactor using Fe supported on carbon-containing nanoparticle catalysts. During phenol
oxidation, a decrease in pH from 6 to 2.8 was observed indicating the formation of carboxylic
acids and 100 % conversion was achieved at pH 2.8 after 210 min. However, for safety
reasons they adjusted the pH to 8 using KOH so that the final pH of the solution after
oxidation will be ca.5 and the oxidation rate remained the same when compared with the first
experiment without pH adjustment and complete removal of phenol was achieved at the same
reaction time of 210 min.
In summary, the studies indicate that the system performs better when the solution is acidic.
However, acidic solutions are highly corrosive and can damage the reactor, thus necessitating
the use of corrosion-resistant materials during reactor design (Resende et al. 2018).
Moreover, at low pH most catalysts are leached increasing the cost of the catalyst. It is
therefore advisable to invest in the development of a catalyst that will reduce phenol directly
to inorganic compounds without the formation of carboxylic acids to avoid low pH values in
the reactor.
2.3.4. Effect of liquid and gas hourly space velocity
Liquid hourly space velocity (LHSV) has a negative impact on phenol conversion. This is due
to the fact that an increase in LHSV reduces space-time resulting in less contact time between
the phases. An increase in LHSV also increases film thickness and liquid holdup which
decreases contact time between gas and liquid on the catalyst active sites therefore resulting in
high resistance to mass transfer. However, the effect of gas flow is the opposite of LHSV with
an increase in gas flow resulting in improved phenol removal due to decreased film thickness,
liquid holdup and enhanced mass transfer. Abid et al., (2016) investigated the effect of both
liquid and gas flow rates on phenol oxidation using a trickle bed reactor over activated carbon
catalyst. They studied liquid flow rate of 1.662, 0.996 and 0.6 ml/min while gas flow rates
were 10, 20, 30 and 60 ml/min. According to their observation, an increase in LHSV has a
negative influence on phenol conversion with 79 % reached at 1.662 ml/min while 86.8 % and
95.6 % were reached when LHSV was decreased to 0.996 and 0.6 ml/min. Furthermore,
phenol removal reached 79.7 %, 82.5 %, 86.8 % and 83.5 % at gas flow rate of 10, 20, 30 and
60 ml/min, respectively. The maximum conversion was reached at 30 ml/min of gas flow due
to the decrease in film thickness and liquid holdup, whereas the decrease in conversion at 60
ml/min was due to a decrease in wetting of the catalyst surface caused by liquid mal-
25
distribution. Similarly, Mohammed et al., 2016 investigated the effect of liquid and gas flow
on phenol oxidation in a trickle bed reactor using 0.48 % Pt/ γ-Al2O3 catalyst operated in the
following gas flow, 20, 40, 80 and 100 % and liquid hourly space velocity between 1, 2 and
3 h-1. The maximum conversion was reached at a gas flow rate of 80 % and a further increase
in gas flow resulted in a slight decrease in conversion due to the decreased spreading of the
liquid film. In their study Mohammed, 2014 studied the effect of gas and LHSV in a trickle
bed reactor that was operated between (60-100 %) stoichiometric oxygen excess (S.E) and
LHSV ranging from 1, 2 and 3 h-1 over activated carbon catalyst. It was reported that
maximum conversion was achieved when the gas flow rate was 80 % S.E and when the flow
rate was increased beyond this point, conversion was decreased due to the decreased.
However, phenol conversion increased with a decrease in LHSV and the following results
were reported when LHSV was 2 and 3 h-1, 87.16 and 82.5 %.
It can be concluded that an increase in gas flow has a positive influence whereas, LHSV has a
negative impact. A prior knowledge of the flow regime is required to choose the correct
design equation for TBR. Moreover, hydrodynamics and transport properties of the system
can change dramatically between the flow regimes impacting final results significantly.
Currently, empirical flow map or relationships are used to predict the flow patterns and there
is a limited theoretical foundation developed to predict the transition between the flow
regimes. On the other hand, an increase in computing memory and technological advances
saw an increase in the use of CFD and Tomography to understand the flow transition between
the regimes. For developing countries with limited resources, CFD is the cheapest technique
that can be used to understand the interaction between the phases.
2.4. Kinetic Model
Kinetics models are crucial for the design and up-scaling of laboratory reactors to industrial
reactors (Zarca et al, 2015). A simple power-law model can be used to determine the rate of
reaction in a trickle bed reactor as reported by (Eftaxias, 2002; Eftaxias et al., 2005; Abid et
al, 2014; Abid et al, 2016, Makatsa et al., 2019). The simple power law can be expressed as
follow:
(11)
26
Where, is reaction rate, is a frequency factor, is activation energy, R is ideal gas
constant, T is temperature, is dissolved molecular oxygen mole fraction, α is reaction order
with respect to oxygen concentration and is phenol concentration.
Abid et al, 2016 used a different catalyst and slightly higher temperature compared to their
previous study (Abid et al, 2014). In this study, they used activated carbon as a catalyst and
the reactor was operated between temperatures of (120 °C – 160 °C) and pressure of 2 to 9
bar. The activation energy was a bit higher (77.7 KJ/mol) and the reaction order with respect
to oxygen was 0.6. Abid et al, 2014 also used a power-law model to determine reaction rate
parameters using 0.5 % Pt/γ-Al2O3 catalyst in a trickle bed reactor operated between 85 – 140
°C and pressure of 1 to 6 bar. Oxygen reaction order was found to be 0.69 and activation
energy was 29.3 KJ/mol. Similarly, Eftaxias et al., 2005 used power law model to determine
reaction rate parameters over activated carbon (AC) catalyst in a trickle bed reactor operated
between temperatures of 120 – 160 °C and pressure of 1 and 2 bar. The kinetic model was
able to adequately predict phenol conversion only when the conversion was below 70 % and
for conversions above 70 %, the model overestimated experimental conversion. The deviation
was attributed to liquid maldistribution reinforced by the smaller reactor configuration.
Furthermore, phenol oxidation activation energy over the catalyst was found to be 69, 3 0.4
KJ/mol and the oxygen mole fraction was 1,015 0.02. Eftaxias, 2002 used both power-law
and Langmuir-Hinshelwood (L-H) model in a trickle bed reactor operated between
temperatures of (120 °C – 160 °C ) and pressure of 6 to 12 bar over two catalysts (CuO/γ-
Al2O3 and AC). It was reported that when power law model was used in the presence of CuO
catalyst; phenol and acetic acid were estimated very well, however, the model failed to predict
the remaining carboxylic acids and quinone-like compounds. In addition, L-H model was not
used for phenol oxidation because preliminary experiments obtained from adsorption
experiments indicated that phenol was not adsorbed on the surface of the catalyst. The
reaction activation energy was found to be 74.9 KJ/mol and the oxygen order was 0.311. In
contrast, when the AC catalyst was used, phenol destruction activation energy was slightly
lower (70.3 0.4 KJ/mol) and reaction order with respect to oxygen was 0.95 0.02.
Another model that is commonly used to correlate adsorption-desorption of heterogeneous
catalysts is Langmuir-Hinshelwood (L-H) or Langmuir-Hinshelwood-Hougen-Watson
(LHHW) reported by (Eftaxias et al., 2001, 2006; Guo and Al-Dahhan, 2003; Wu et al, 2005).
Langmuir-Hinshelwood (L-H) model can be expressed as follows:
27
(12)
Where is reaction rate, is reaction kinetics constant, and are adsorption
constants, and are species concentrations.
Eftaxias et al., 2001 used the L-H model to determine kinetics parameters using a copper-
based catalyst (CuO/ γ-Al2O3) with the temperature of the reactor between 120 °C – 160 °C.
They reported activation energy of 74.9 KJ/mol and an oxygen reaction order of 0.31. Table 2
summarizes kinetic models used by Guo and Al-Dahhan, 2003 in a basket stirred tank reactor
operated between 90 and 150 °C over Al-Fe pillared clay catalyst whereas Table 3 give a
summary of activation energies and reaction conditions. The power-law model (M1) is used
to correlate the simplest form of the surface reaction rate. As can be seen from the reaction
mechanism of model M2, adsorption and desorption of phenol and oxygen take place on the
same site and a more complex model like LHHW is used to model the process. The
mechanism of M3 is similar to M2 because of single-site adsorption. In contrast to M2,
oxygen molecules dissociate to allow surface reaction of physically adsorbed phenol and
oxygen to take place. The last model M4 is completely different from previous models
because dissociated molecules are adsorbed on two active sites. To check the quality of the
models, they were compared with experimental data. Parity plot was used to compare
experimental results with calculated results and experimental data was adequately fitted when
kinetic model M2-M4 was used whereas M1 under predicted phenol of high concentration.
When model M4 was used, the activation energy of 34.29 KJ/mol was reported.
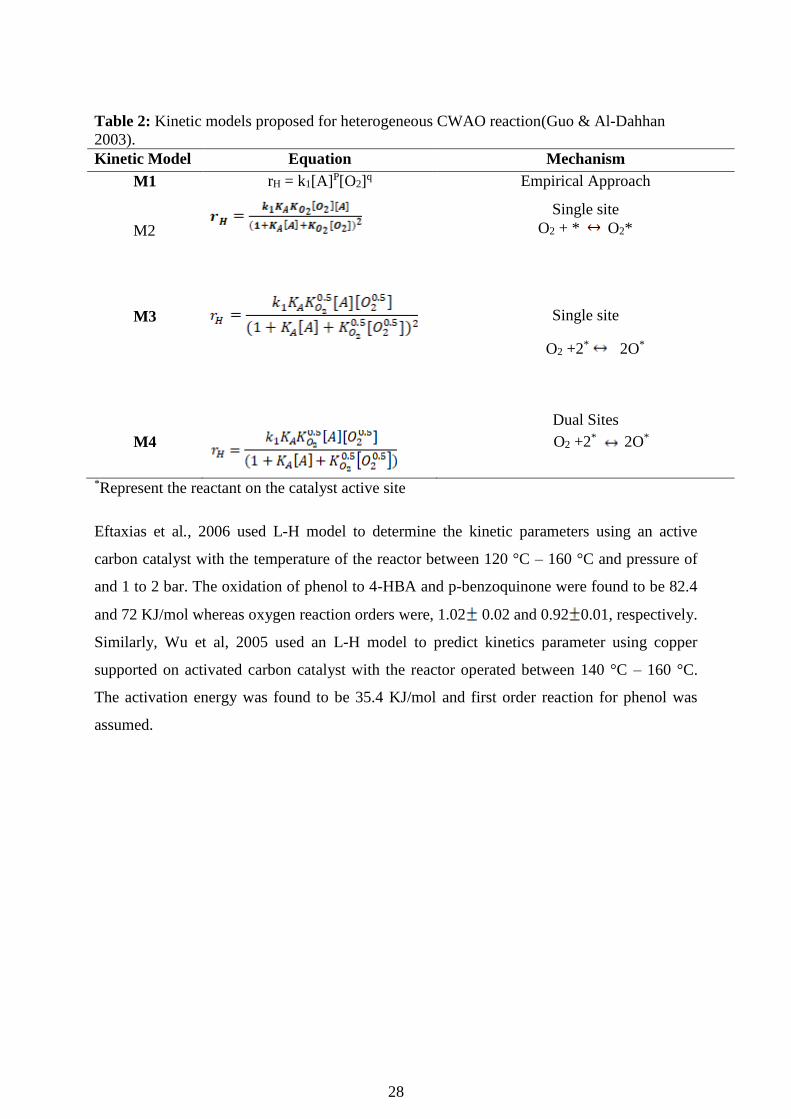
28
Table 2: Kinetic models proposed for heterogeneous CWAO reaction(Guo & Al-Dahhan
2003).
Kinetic Model Equation Mechanism
M1 rH = k1[A]P[O2]q Empirical Approach
M2
Single site
O2 + * O2*
M3
Single site
O2 +2* 2O*
Dual Sites
M4 O2 +2* 2O*
*Represent the reactant on the catalyst active site
Eftaxias et al., 2006 used L-H model to determine the kinetic parameters using an active
carbon catalyst with the temperature of the reactor between 120 °C – 160 °C and pressure of
and 1 to 2 bar. The oxidation of phenol to 4-HBA and p-benzoquinone were found to be 82.4
and 72 KJ/mol whereas oxygen reaction orders were, 1.02 0.02 and 0.92 0.01, respectively.
Similarly, Wu et al, 2005 used an L-H model to predict kinetics parameter using copper
supported on activated carbon catalyst with the reactor operated between 140 °C – 160 °C.
The activation energy was found to be 35.4 KJ/mol and first order reaction for phenol was
assumed.
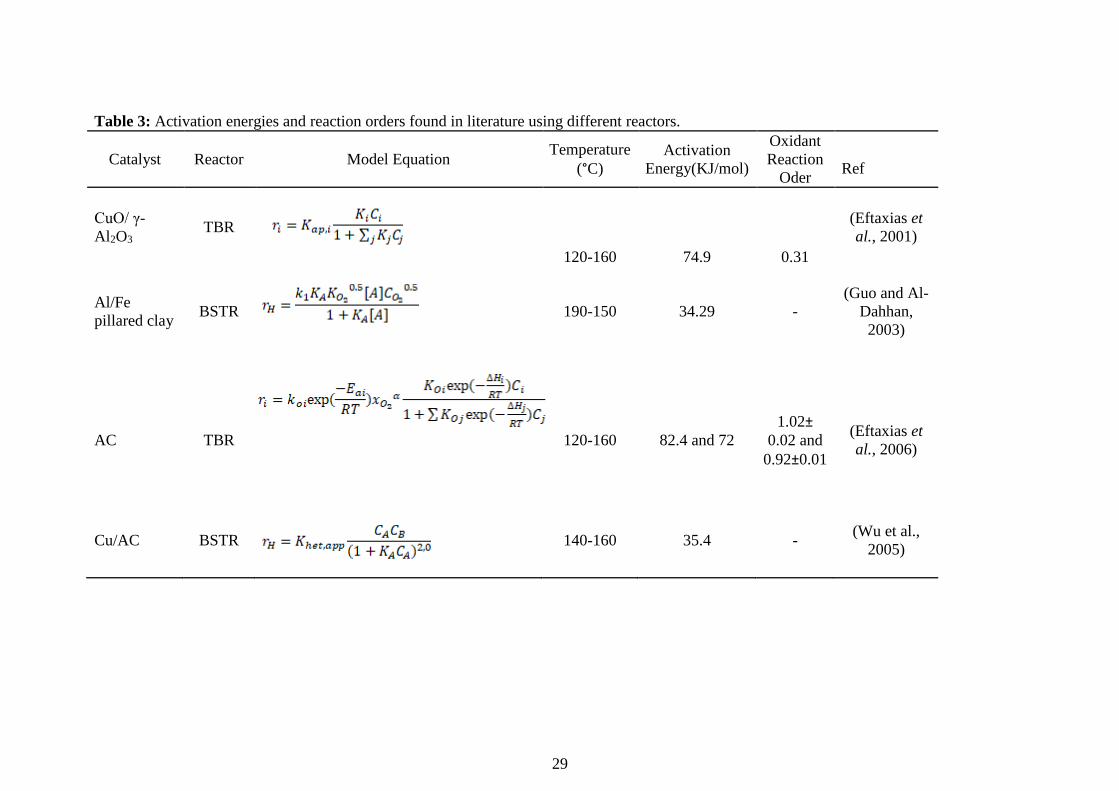
29
Table 3: Activation energies and reaction orders found in literature using different reactors.
Catalyst Reactor Model Equation Temperature
(°C)
Activation
Energy(KJ/mol)
Oxidant
Reaction
Oder
Ref
CuO/ γ-
Al2O3 TBR
120-160 74.9 0.31
(Eftaxias et
al., 2001)
Al/Fe
pillared clay BSTR
190-150 34.29 -
(Guo and Al-
Dahhan,
2003)
AC TBR
120-160 82.4 and 72
1.02±
0.02 and
0.92±0.01
(Eftaxias et
al., 2006)
Cu/AC BSTR
140-160 35.4 - (Wu et al.,
2005)
30
A complete reduction of phenol to CO2 and H2O is very complex and its reaction mechanism is
not yet fully understood. Some oxidation by-products are as toxic as phenol and therefore,
kinetic models accounting for all intermediates are very important. Most studies show that the
power law model can be used to predict phenol. However, this model has limitations because it
can’t be used when phenol and its intermediates are adsorbed on the surface of the catalyst. As
shown in Table 2, mathematical correlations (M2-M4) can be used to account for adsorption and
desorption of the organic pollutant on the surface of the catalyst. In conclusion, L-H model is the
most suitable kinetic model for the oxidation of phenol and its intermediates.
2.5 CFD Modelling
The use of TBR in heterogeneous catalysis is common, especially when gas and liquid react to
form products. However, most studies are conducted in a laboratory fixed bed reactors and the
scaling up of these reactors to industrial reactors is problematic due to complex interactions of
fluid dynamics with reaction kinetics. Moreover, the change in hydrodynamic parameters is
significant when laboratory reactors are scaled up to commercial reactors and correlations
developed in a laboratory reactor might not work. Ranade and Gunjal (2011) suggested that the
scale of the reactor affects its performance. In addition, these authors listed several factors that
are directly affected during reactor scaling-up as follows; reactor to particle diameter ratio,
reactor volume, bed porosity, wetting, channelling, liquid mal-distribution, dispersion and
reactor operating mode (isothermal/adiabatic). Moreover, these researchers concluded that wall
effect is predominant in laboratory TBR whereas flow mal-distribution is common in industrial
TBR due to large bed diameter. On the other hand, when CFD model is developed correctly, it
should be independent of the scale of the reactor because these models are based on conservation
of mass, energy and momentum. CFD simulations provide a time saving and cost-effective
approach in the reactor design. In a typical design, the software is used to solve a system of
complex mathematical equations (Haro et al., 2016). The software can be used to solve multiple
phase flows like gas-liquid, liquid-solid and gas-solid flows (Kapfunde et al., 2018, Makatsa et
al., 2020). Multi-phase flow systems can be modeled in three different ways using volume of
fluid (VOF), Eulerian–Lagrangian and Eulerian–Eulerian approach. The first method (VOF) is
the easiest and all phases are considered as a non-interpenetrating continuum. The method solves
31
a single set of momentum equations and tracks the volume of all phases in a computational
domain. The method is suitable for analysis of multiple phase systems of the small domain and
modeling the behavior of the interface. In addition, the method is used mostly when modeling
large scale systems. The Eulerian–Lagrangian method considers a fluid phase as a continuum
and solves a system of Navier–Stokes equations for the continuous phase while solving the
dispersed phase by tracking the particles through the calculated flow field. This model is
recommended for modeling of the multi-phase flow with less volume fraction of the dispersed
phase and for modeling liquid fuel and spray dryers. In contrast, the Eulerian-Eulerian method is
based on the assumption that every phase is an interpenetrating continuum. The method uses the
approach of single pressure for all phases. Governing equations are solved separately for each
phase (continuity, momentum, energy, and species transfer equations). This approach is suitable
for modeling of the multi-phase flow with volume fraction ranging from 0 to 1 and for multiple
phase reactors with more than one dispersed phase (Mousazadeh 2013).
Ranade et al., (2011) used a model developed by Attou and Ferschneider (1999) to simulate the
flow regime where the liquid flow was in the form of droplets. Mousazadeh (2013) used CFD to
predict the formation of hot spots in a trickle bed reactor. A hot spot was observed when there
was a local blockage preventing the fluid from flowing. Furthermore, there was a temperature
difference of 153 °C between the hot spot and the surrounding area. It was concluded that the hot
spots were formed when liquid cannot convect in the radial or axial direction. Lopes and Quinta-
Ferreira (2007) developed a computational fluid dynamics model of a trickle bed reactor
operated between the temperature of 170 °C – 200 °C and pressures of 10 – 30 bar. These
authors used FLUENT 6.1 and Euler–Euler multi-phase flow approach to model the behavior of
the fluid inside the reactor. Furthermore, the researchers studied the influence of gas and liquid
flow rate within the trickle flow regime ranging between (gas: 0.10 – 0.70 and liquid: 0.5 – 5
kg/m2s). In order to validate their findings for pressure drop and liquid holdup, a spherical
catalyst of a 2 mm diameter was used as a reactor packing. In addition, they mapped both gas
and liquid flow; and found maximum velocities to be 0.5 and 0.005 cm/s respectively. Their
results showed that the reactor was operated within a trickle flow regime. According to their
findings, an increase in liquid mass flux resulted in an increase in liquid holdup whereas an
increase in pressure resulted in a significant decrease of the liquid holdup. The increase in liquid
mass flux improves interaction between gas and liquid which causes turbulence and thickens the
32
liquid film. These changes resulted in an increase in liquid side shear stress due to high-pressure
drop and resistance became more pronounced in comparison to the driving force. Their results
were in agreement with (Beni & Khosravi-Nikou 2015; Mousazadeh 2013; Kuzeljevic 2010).
The researchers concluded that a change in reactor pressure is more pronounced on pressure drop
than liquid holdup. Similarly, Beni and Khosravi-Nikou (2015) modeled hydrodynamics of the
trickle bed reactor and used 300 spherical particles arranged in a hexagonal pattern with
maximum space between them, not exceeding 3 % of particle diameter. They simulated only 12
layers due to computational limitation and investigated the effect of pressure on hydrodynamics
parameters at lower pressures ranging between (0.1, 0.5 & 1 MPa). They also varied gas and
liquid superficial velocities between (0.086 & 0.25 m/sec) and (<0.005-0.03 m/s) respectively.
Regardless of mild pressure they also reached the same conclusion as (Lopes & Quinta-Ferreira
2007).
Accurate estimation of hydrodynamic parameters is an important step for reactor design and
performance evaluation of the catalyst. The complex internal bed structure and phase interaction
are the controlling factor in TBR. Hydrodynamics are affected by; particle properties, packing
characteristics of the bed and operating conditions. There are methods and correlations available
for determining hydrodynamic parameters such as liquid holdup, axial dispersion and CFD.
In summary, CFD can be used to model liquid mal-distribution and predict the formation of hot
spots. Hot spots are undesired because they may reduce production by deactivating the catalyst
or decrease the mechanical strength of the wall. It is recommended that a simulation of TBR
fitted with a mechanical liquid distributer at the top be simulated.
33
Chapter 3: Experimental Methods
3.1 Materials
The pillaring agent was prepared from sodium hydroxide (NaOH), anhydrous aluminum nitrate
Al(NO3)3·9H2O, and zirconium chloride (ZrOCl2·8H2O) which were purchased from Merck
Chemicals (Pty) Ltd. Natural bentonite clay used in this study was obtained from ECCA
Holdings (Pty) Ltd. Oxalic acid used for monolith acid treatment and silver nitrate (AgNO3)
were bought from Sigma-Aldrich Chemical Co. High purity water used to prepare solutions was
taken from Mintek laboratories. Cordierite monolith used as support was purchased from
Ghophin Chemical. All chemicals used in this study were used as received without modification.
3.2 Catalyst Preparation
A pillaring solution was prepared by mixing 83.3 mL of 0.1 M ZrOCl2·8H2O with 250 mL 0.1 M
Al(NO3)3·9H2O. In addition, a solution of 0.1 M NaOH was added dropwise to the mixture
prepared while stirring. After the complete addition of NaOH, the solution was stirred for
another 2 h at room temperature followed by ultrasonication for 10 min at 25 °C. To prepare
pillared clay catalyst, dry bentonite clay was added to the pillaring solution and the resulting
slurry was stirred at room temperature for 30 min followed by ultrasonication for 10 min at 25
°C. After sonication, the slurry was centrifuged for 8 min and the supernatant was discarded. The
sediment was washed with high purity water to remove any excess chlorides followed by oven
drying at 120 °C for 16 h. The oven-dried sample was calcined at 400 °C for 2 h.
3.3 Acid treatment of cordierite monolith
Before wash coating, honeycomb cordierite monoliths were acid treated with 20 % (w/v) oxalic
acid. The cordierite monoliths were immersed in the acid for 8 h to remove impurities and
improve surface area. This was followed by thoroughly washing of the monoliths with high
purity water. After washing, the monoliths were oven-dried at 120 °C for 16 h followed by
calcination in a muffle furnace at 500 °C for 2 h.
3.4 Wash-coating of cordierite monolith with Al/Zr-PILCs
34
The pillared clay catalyst prepared in the previous step was milled for 90 min in the Netzsch-
Feinmahltechnik GmbH LME1 wet grinding ball mill using ceria-zirconia beads as the grinding
media. This was done to achieve a particle size of 2-5 m. The beads were separated from the
slurry using fluidization. Excess water was decanted, the sample was then dried overnight at 120
°C. The wash-coating slurry was prepared using the milled pillared clay catalyst, high purity
water, 10 wt. % silica solution and glycerol in a ratio of (1:2:1.5:2).
Glycerol was used as a dispersant to ensure the wash-coat dries homogenously and silica was
used as a binding agent, to increase the adhesion of the wash-coat onto the surface of the
monolith. Four wash-coated monolith samples were prepared by dip-coating the monoliths in the
slurry three times, with an immersion time of 5 min per dip. The resulting samples were then
dried, two of which were dried in the oven at 40 °C and 60 °C for 30 min whereas the other two
were dried using thermally assisted microwave oven at 80 °C for 30 min and the other one was
dried at room temperature for six weeks. The dry samples were then calcined at 500 °C for 2 h.
3.5 Characterization techniques
The X-ray diffraction (XRD) patterns were attained using a Bruker AXS D8 X-ray advanced
powder diffractometer equipped with CoK -radiation, over a 2 range from 5 to 80 at 40kV
and 40mA with stepwise angle increment of 0.02 /s. The morphology of the wash-coated
monolithic catalyst was determined using Zeiss EVO MA15 scanning electron microscopy, with
a magnification of 20 μm. Micromeritics Tristar 3000 instrument was used to determine the
surface area of the catalyst. N2 adsorption-desorption isotherm experiment was conducted at -196
˚C using liquid nitrogen. Prior to the experiment the sample was degassed at 150 ˚C under
vacuum for 4 h.
3.6 CWAO Experiment
Phenol oxidation experiments were conducted in a stainless steel TBR of 56 mm diameter and
430 mm length shown in Figure 28 (Appendix A). The pollutant (phenol) was measured using
Shimadzu HPLC equipped with UV detector at wavelength of 210 nm. A mobile phase of
(65/35) % methanol in water was used and injected at 5µL, whereas the flow rate was set to 1
ml/min. A C18 (Waters spherisorb S5ODS2) column 25 cm x 4.6 mm x5 µm was used as a
stationary phase. Before the reaction start, the pump and mass flow controller were both
35
calibrated and the calibration curves are shown in Figure 25 and 26 in the appendix A. In
addition, a standard solution of phenol was ran to determine retention time and the results can be
found in appendix A (Figure 27). Catalyst activity was tested at 160 ˚C, 10 bar over Al/ Zr-PILC
catalyst and the reaction was stopped after 3 hrs.
3.7 Computational fluid dynamics model
3.7.1 Governing equations
A multiphase Eulerian CFD model of phenol oxidation in a TBR was developed using a
commercial software Fluent 2019R2. The following set of mathematical equations are
incorporated into a CFD code solver.
Mass conservation equation:
(12)
Momentum conservation equation:
(13)
Where is volume fraction for each phase, is the density of the k-th phase, is the cell
velocity of the k-th phase and is an interphase momentum exchange ( Ranade et al., 2011).
The interface coupling term can be expressed as follow
(14)
(15)
(16)
Where FGL, FGS, FLS are gas-liquid, gas-solid and liquid-solid momentum exchange terms. To
understand turbulence inside the reactor standard k-ɛ model was chosen and the software solved
the following mathematical equations (Lopes & Quinta-Ferreira, 2010);
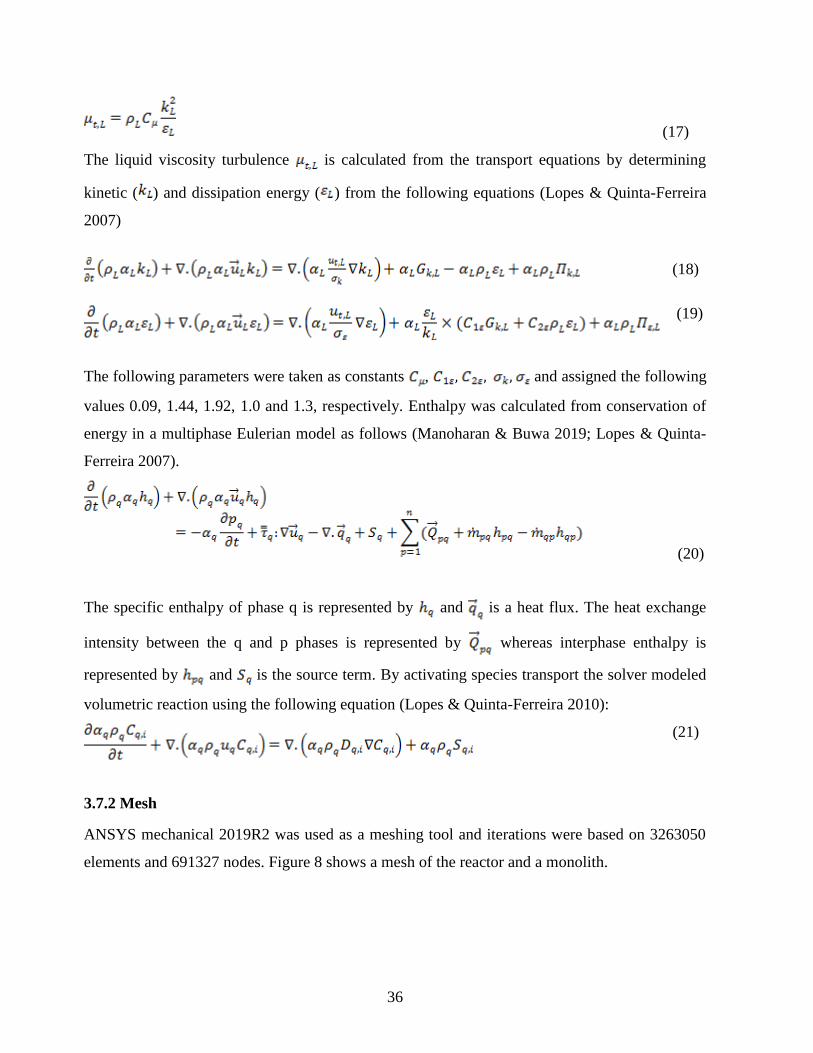
36
(17)
The liquid viscosity turbulence is calculated from the transport equations by determining
kinetic ( ) and dissipation energy ( ) from the following equations (Lopes & Quinta-Ferreira
2007)
(18)
(19)
The following parameters were taken as constants , , , , and assigned the following
values 0.09, 1.44, 1.92, 1.0 and 1.3, respectively. Enthalpy was calculated from conservation of
energy in a multiphase Eulerian model as follows (Manoharan & Buwa 2019; Lopes & Quinta-
Ferreira 2007).
(20)
The specific enthalpy of phase q is represented by and is a heat flux. The heat exchange
intensity between the q and p phases is represented by whereas interphase enthalpy is
represented by and is the source term. By activating species transport the solver modeled
volumetric reaction using the following equation (Lopes & Quinta-Ferreira 2010):
(21)
3.7.2 Mesh
ANSYS mechanical 2019R2 was used as a meshing tool and iterations were based on 3263050
elements and 691327 nodes. Figure 8 shows a mesh of the reactor and a monolith.
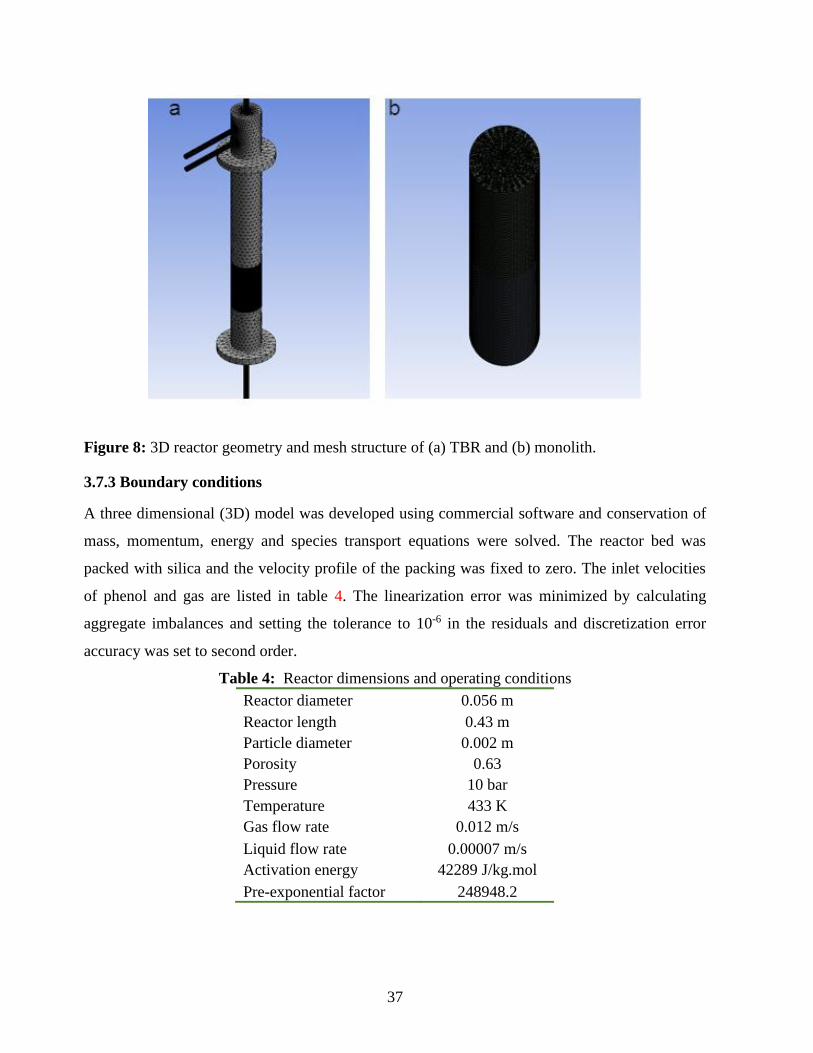
37
Figure 8: 3D reactor geometry and mesh structure of (a) TBR and (b) monolith.
3.7.3 Boundary conditions
A three dimensional (3D) model was developed using commercial software and conservation of
mass, momentum, energy and species transport equations were solved. The reactor bed was
packed with silica and the velocity profile of the packing was fixed to zero. The inlet velocities
of phenol and gas are listed in table 4. The linearization error was minimized by calculating
aggregate imbalances and setting the tolerance to 10-6 in the residuals and discretization error
accuracy was set to second order.
Table 4: Reactor dimensions and operating conditions
Reactor diameter 0.056 m
Reactor length 0.43 m
Particle diameter 0.002 m
Porosity 0.63
Pressure 10 bar
Temperature 433 K
Gas flow rate 0.012 m/s
Liquid flow rate 0.00007 m/s
Activation energy 42289 J/kg.mol
Pre-exponential factor 248948.2
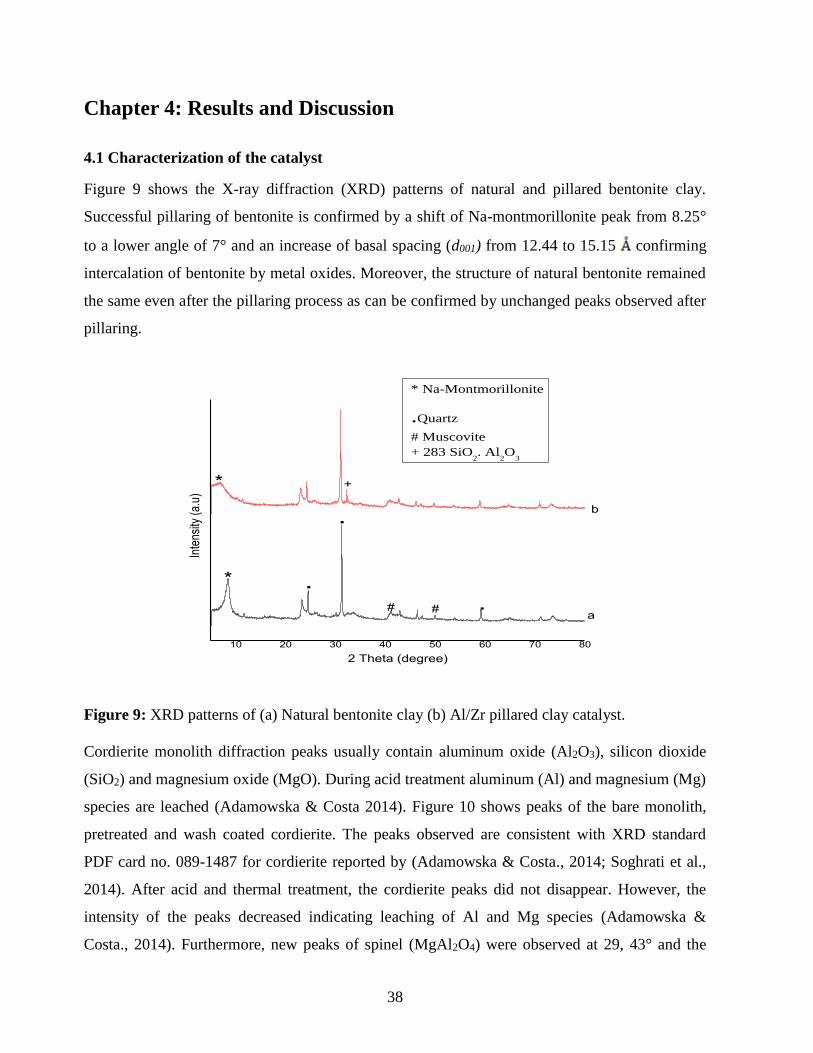
38
Chapter 4: Results and Discussion
4.1 Characterization of the catalyst
Figure 9 shows the X-ray diffraction (XRD) patterns of natural and pillared bentonite clay.
Successful pillaring of bentonite is confirmed by a shift of Na-montmorillonite peak from 8.25°
to a lower angle of 7° and an increase of basal spacing (d001) from 12.44 to 15.15 confirming
intercalation of bentonite by metal oxides. Moreover, the structure of natural bentonite remained
the same even after the pillaring process as can be confirmed by unchanged peaks observed after
pillaring.
10 20 30 40 50 60 70 80
# ..
*
Inte
nsity
(a.
u)
2 Theta (degree)
* Na-Montmorillonite
.Quartz
# Muscovite
+ 283 SiO2. Al
2O
3
a
*
.
#
b
+
Figure 9: XRD patterns of (a) Natural bentonite clay (b) Al/Zr pillared clay catalyst.
Cordierite monolith diffraction peaks usually contain aluminum oxide (Al2O3), silicon dioxide
(SiO2) and magnesium oxide (MgO). During acid treatment aluminum (Al) and magnesium (Mg)
species are leached (Adamowska & Costa 2014). Figure 10 shows peaks of the bare monolith,
pretreated and wash coated cordierite. The peaks observed are consistent with XRD standard
PDF card no. 089-1487 for cordierite reported by (Adamowska & Costa., 2014; Soghrati et al.,
2014). After acid and thermal treatment, the cordierite peaks did not disappear. However, the
intensity of the peaks decreased indicating leaching of Al and Mg species (Adamowska &
Costa., 2014). Furthermore, new peaks of spinel (MgAl2O4) were observed at 29, 43° and the
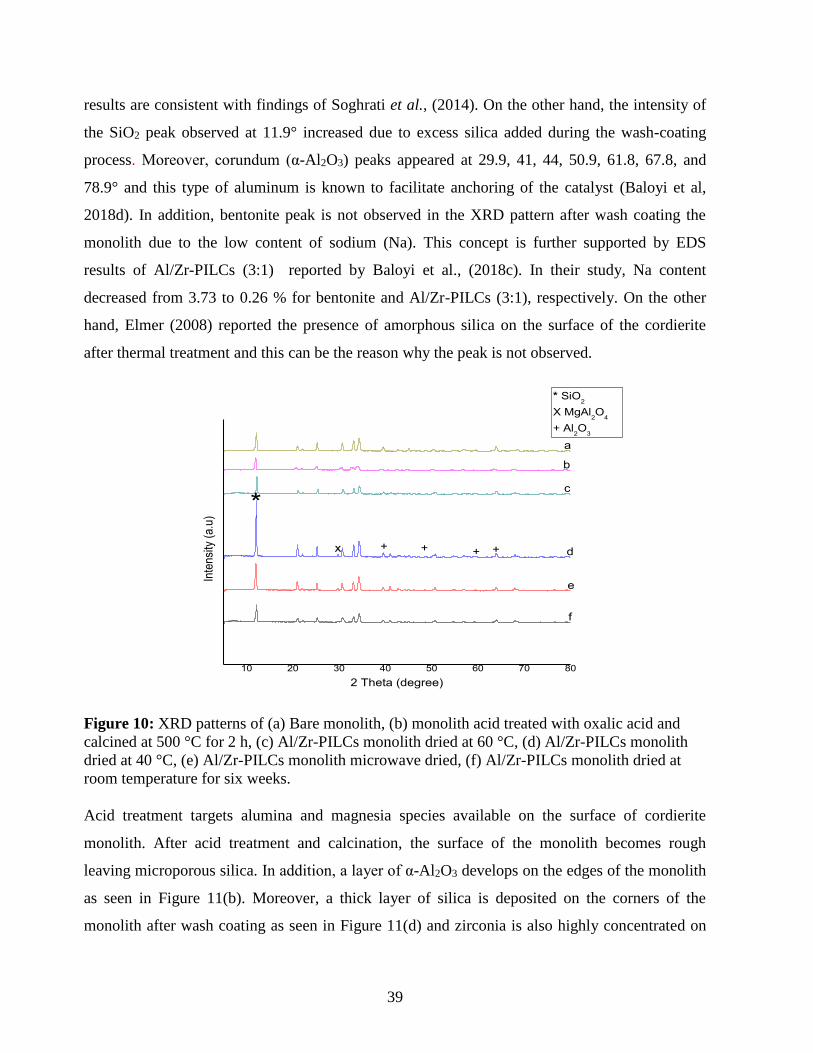
39
results are consistent with findings of Soghrati et al., (2014). On the other hand, the intensity of
the SiO2 peak observed at 11.9° increased due to excess silica added during the wash-coating
process. Moreover, corundum (α-Al2O3) peaks appeared at 29.9, 41, 44, 50.9, 61.8, 67.8, and
78.9° and this type of aluminum is known to facilitate anchoring of the catalyst (Baloyi et al,
2018d). In addition, bentonite peak is not observed in the XRD pattern after wash coating the
monolith due to the low content of sodium (Na). This concept is further supported by EDS
results of Al/Zr-PILCs (3:1) reported by Baloyi et al., (2018c). In their study, Na content
decreased from 3.73 to 0.26 % for bentonite and Al/Zr-PILCs (3:1), respectively. On the other
hand, Elmer (2008) reported the presence of amorphous silica on the surface of the cordierite
after thermal treatment and this can be the reason why the peak is not observed.
10 20 30 40 50 60 70 80
++++
Inte
nsi
ty (
a.u
)
2 Theta (degree)
* SiO2
X MgAl2O
4
+ Al2O
3
a
b
c
d
e
f
*
x
Figure 10: XRD patterns of (a) Bare monolith, (b) monolith acid treated with oxalic acid and
calcined at 500 °C for 2 h, (c) Al/Zr-PILCs monolith dried at 60 °C, (d) Al/Zr-PILCs monolith
dried at 40 °C, (e) Al/Zr-PILCs monolith microwave dried, (f) Al/Zr-PILCs monolith dried at
room temperature for six weeks.
Acid treatment targets alumina and magnesia species available on the surface of cordierite
monolith. After acid treatment and calcination, the surface of the monolith becomes rough
leaving microporous silica. In addition, a layer of α-Al2O3 develops on the edges of the monolith
as seen in Figure 11(b). Moreover, a thick layer of silica is deposited on the corners of the
monolith after wash coating as seen in Figure 11(d) and zirconia is also highly concentrated on
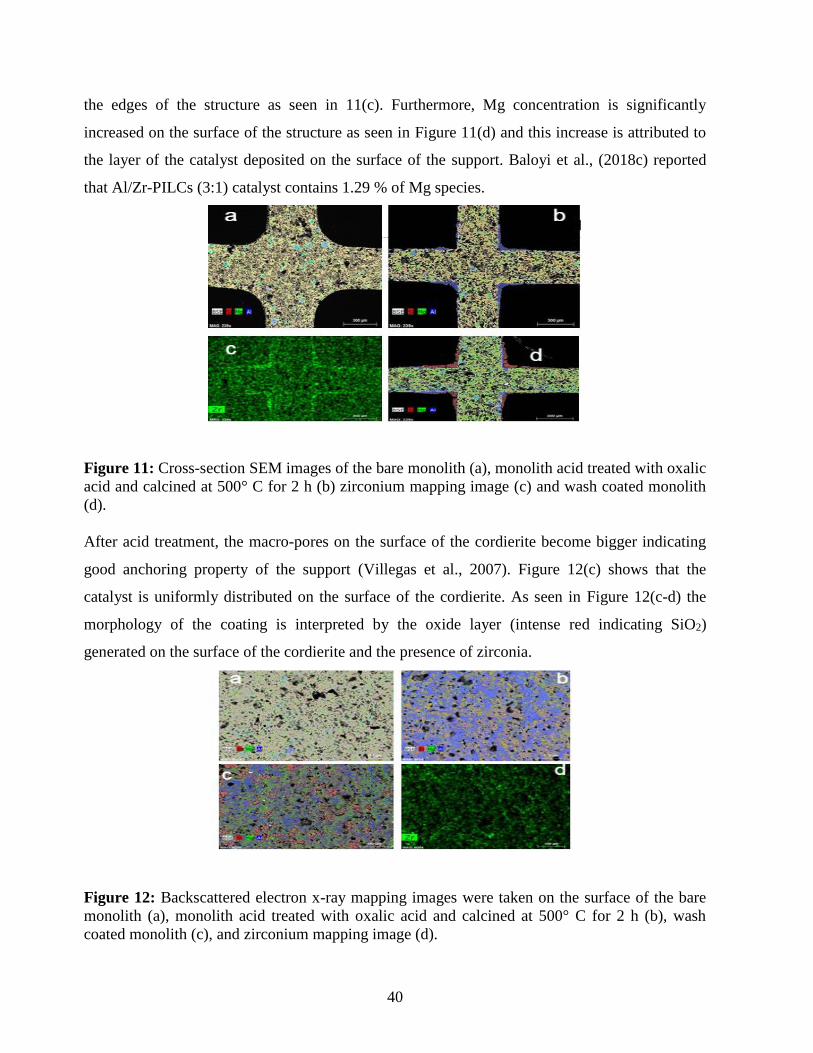
40
the edges of the structure as seen in 11(c). Furthermore, Mg concentration is significantly
increased on the surface of the structure as seen in Figure 11(d) and this increase is attributed to
the layer of the catalyst deposited on the surface of the support. Baloyi et al., (2018c) reported
that Al/Zr-PILCs (3:1) catalyst contains 1.29 % of Mg species.
Figure 11: Cross-section SEM images of the bare monolith (a), monolith acid treated with oxalic
acid and calcined at 500° C for 2 h (b) zirconium mapping image (c) and wash coated monolith
(d).
After acid treatment, the macro-pores on the surface of the cordierite become bigger indicating
good anchoring property of the support (Villegas et al., 2007). Figure 12(c) shows that the
catalyst is uniformly distributed on the surface of the cordierite. As seen in Figure 12(c-d) the
morphology of the coating is interpreted by the oxide layer (intense red indicating SiO2)
generated on the surface of the cordierite and the presence of zirconia.
Figure 12: Backscattered electron x-ray mapping images were taken on the surface of the bare
monolith (a), monolith acid treated with oxalic acid and calcined at 500° C for 2 h (b), wash
coated monolith (c), and zirconium mapping image (d).
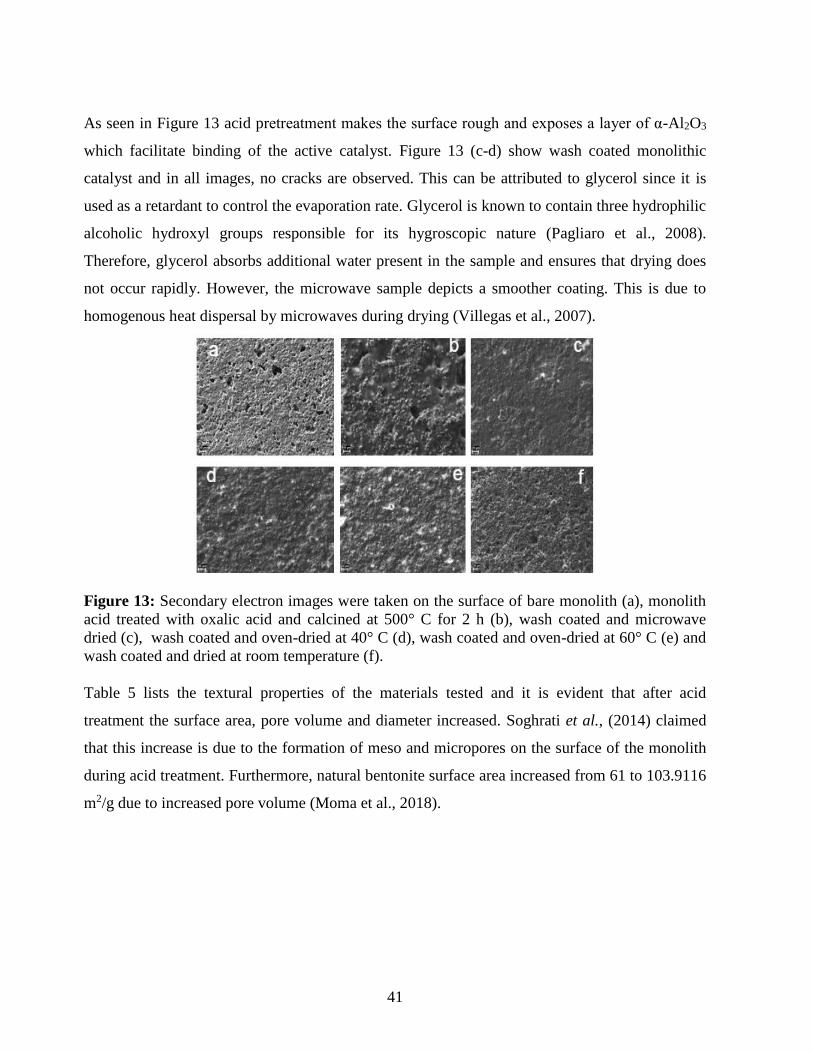
41
As seen in Figure 13 acid pretreatment makes the surface rough and exposes a layer of α-Al2O3
which facilitate binding of the active catalyst. Figure 13 (c-d) show wash coated monolithic
catalyst and in all images, no cracks are observed. This can be attributed to glycerol since it is
used as a retardant to control the evaporation rate. Glycerol is known to contain three hydrophilic
alcoholic hydroxyl groups responsible for its hygroscopic nature (Pagliaro et al., 2008).
Therefore, glycerol absorbs additional water present in the sample and ensures that drying does
not occur rapidly. However, the microwave sample depicts a smoother coating. This is due to
homogenous heat dispersal by microwaves during drying (Villegas et al., 2007).
Figure 13: Secondary electron images were taken on the surface of bare monolith (a), monolith
acid treated with oxalic acid and calcined at 500° C for 2 h (b), wash coated and microwave
dried (c), wash coated and oven-dried at 40° C (d), wash coated and oven-dried at 60° C (e) and
wash coated and dried at room temperature (f).
Table 5 lists the textural properties of the materials tested and it is evident that after acid
treatment the surface area, pore volume and diameter increased. Soghrati et al., (2014) claimed
that this increase is due to the formation of meso and micropores on the surface of the monolith
during acid treatment. Furthermore, natural bentonite surface area increased from 61 to 103.9116
m2/g due to increased pore volume (Moma et al., 2018).
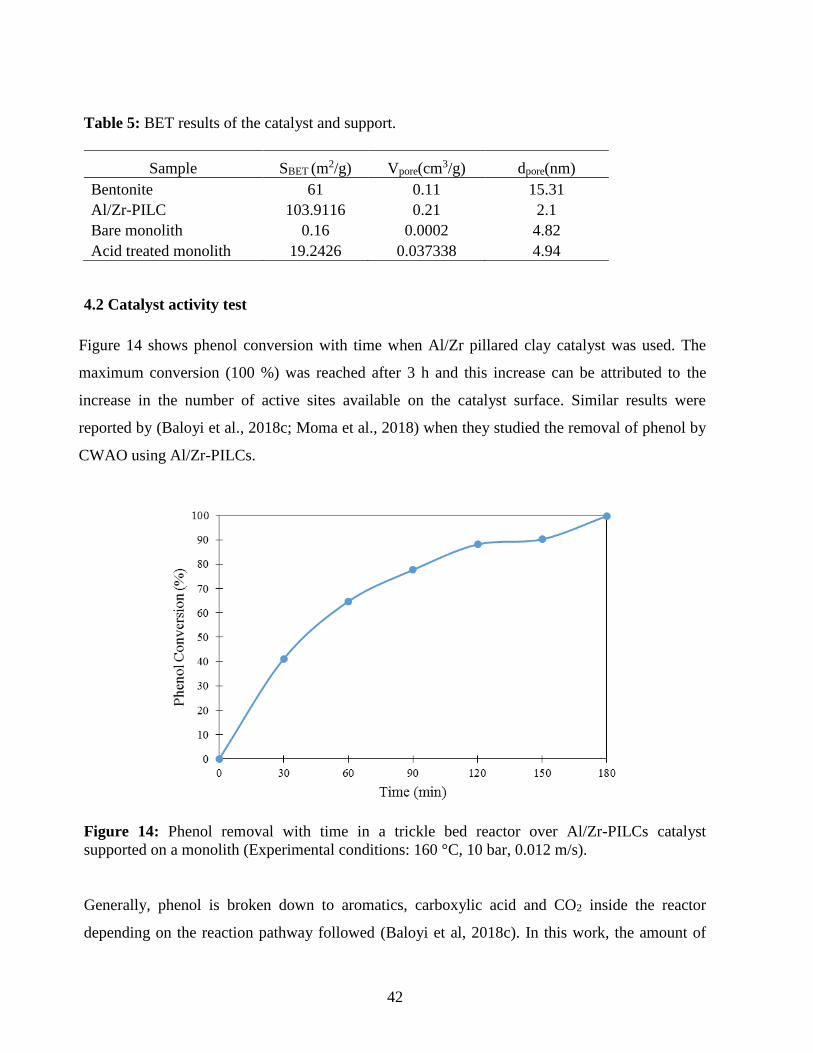
42
Table 5: BET results of the catalyst and support.
Sample SBET (m2/g) Vpore(cm3/g) dpore(nm)
Bentonite 61 0.11 15.31
Al/Zr-PILC 103.9116 0.21 2.1
Bare monolith 0.16 0.0002 4.82
Acid treated monolith 19.2426 0.037338 4.94
4.2 Catalyst activity test
Figure 14 shows phenol conversion with time when Al/Zr pillared clay catalyst was used. The
maximum conversion (100 %) was reached after 3 h and this increase can be attributed to the
increase in the number of active sites available on the catalyst surface. Similar results were
reported by (Baloyi et al., 2018c; Moma et al., 2018) when they studied the removal of phenol by
CWAO using Al/Zr-PILCs.
Figure 14: Phenol removal with time in a trickle bed reactor over Al/Zr-PILCs catalyst
supported on a monolith (Experimental conditions: 160 °C, 10 bar, 0.012 m/s).
Generally, phenol is broken down to aromatics, carboxylic acid and CO2 inside the reactor
depending on the reaction pathway followed (Baloyi et al, 2018c). In this work, the amount of
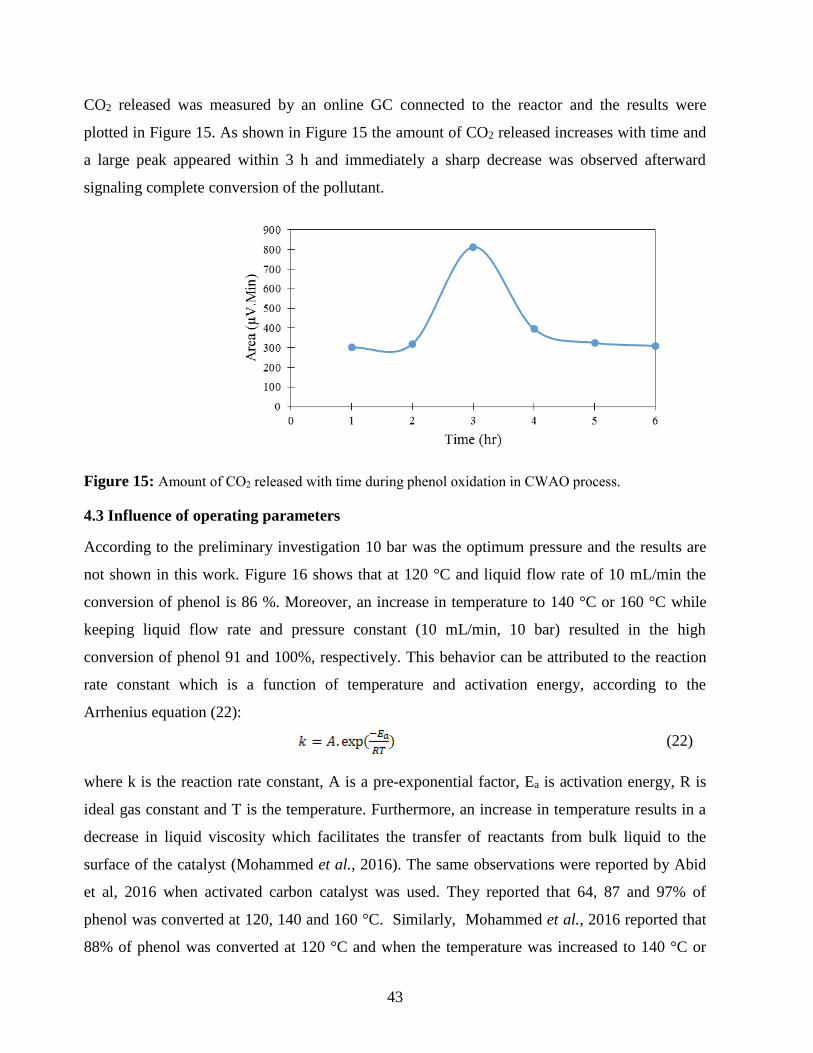
43
CO2 released was measured by an online GC connected to the reactor and the results were
plotted in Figure 15. As shown in Figure 15 the amount of CO2 released increases with time and
a large peak appeared within 3 h and immediately a sharp decrease was observed afterward
signaling complete conversion of the pollutant.
Figure 15: Amount of CO2 released with time during phenol oxidation in CWAO process.
4.3 Influence of operating parameters
According to the preliminary investigation 10 bar was the optimum pressure and the results are
not shown in this work. Figure 16 shows that at 120 °C and liquid flow rate of 10 mL/min the
conversion of phenol is 86 %. Moreover, an increase in temperature to 140 °C or 160 °C while
keeping liquid flow rate and pressure constant (10 mL/min, 10 bar) resulted in the high
conversion of phenol 91 and 100%, respectively. This behavior can be attributed to the reaction
rate constant which is a function of temperature and activation energy, according to the
Arrhenius equation (22):
(22)
where k is the reaction rate constant, A is a pre-exponential factor, Ea is activation energy, R is
ideal gas constant and T is the temperature. Furthermore, an increase in temperature results in a
decrease in liquid viscosity which facilitates the transfer of reactants from bulk liquid to the
surface of the catalyst (Mohammed et al., 2016). The same observations were reported by Abid
et al, 2016 when activated carbon catalyst was used. They reported that 64, 87 and 97% of
phenol was converted at 120, 140 and 160 °C. Similarly, Mohammed et al., 2016 reported that
88% of phenol was converted at 120 °C and when the temperature was increased to 140 °C or
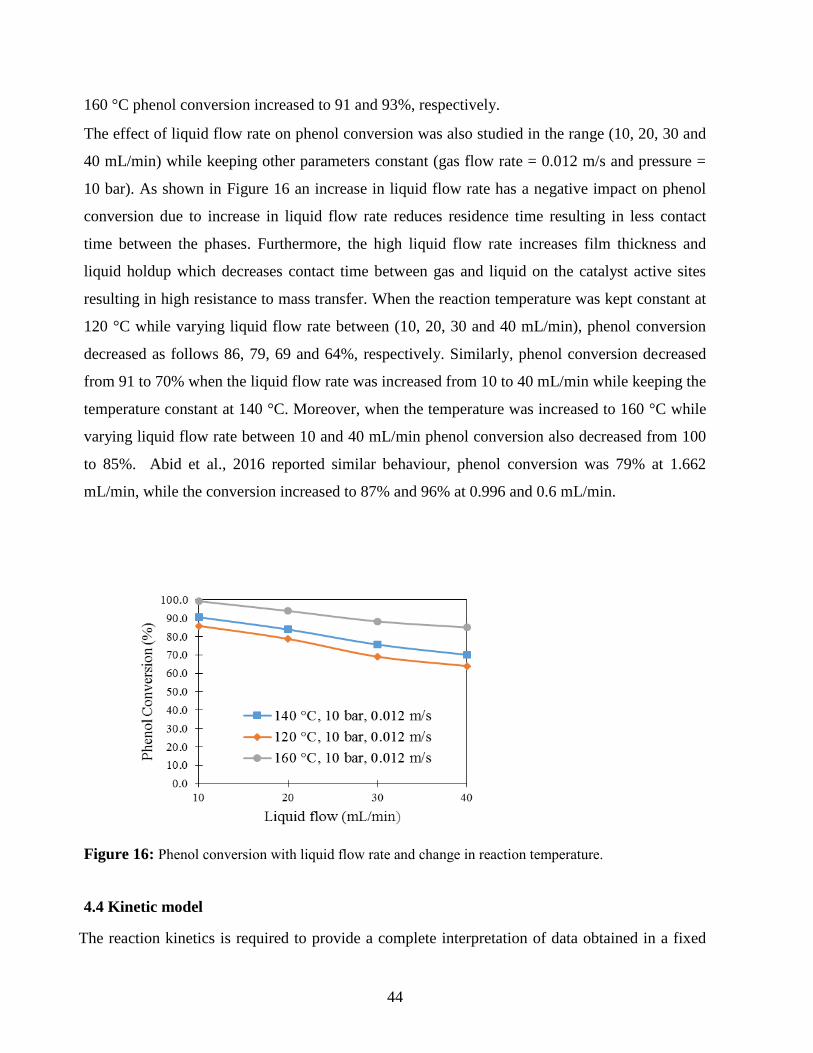
44
160 °C phenol conversion increased to 91 and 93%, respectively.
The effect of liquid flow rate on phenol conversion was also studied in the range (10, 20, 30 and
40 mL/min) while keeping other parameters constant (gas flow rate = 0.012 m/s and pressure =
10 bar). As shown in Figure 16 an increase in liquid flow rate has a negative impact on phenol
conversion due to increase in liquid flow rate reduces residence time resulting in less contact
time between the phases. Furthermore, the high liquid flow rate increases film thickness and
liquid holdup which decreases contact time between gas and liquid on the catalyst active sites
resulting in high resistance to mass transfer. When the reaction temperature was kept constant at
120 °C while varying liquid flow rate between (10, 20, 30 and 40 mL/min), phenol conversion
decreased as follows 86, 79, 69 and 64%, respectively. Similarly, phenol conversion decreased
from 91 to 70% when the liquid flow rate was increased from 10 to 40 mL/min while keeping the
temperature constant at 140 °C. Moreover, when the temperature was increased to 160 °C while
varying liquid flow rate between 10 and 40 mL/min phenol conversion also decreased from 100
to 85%. Abid et al., 2016 reported similar behaviour, phenol conversion was 79% at 1.662
mL/min, while the conversion increased to 87% and 96% at 0.996 and 0.6 mL/min.
Figure 16: Phenol conversion with liquid flow rate and change in reaction temperature.
4.4 Kinetic model
The reaction kinetics is required to provide a complete interpretation of data obtained in a fixed
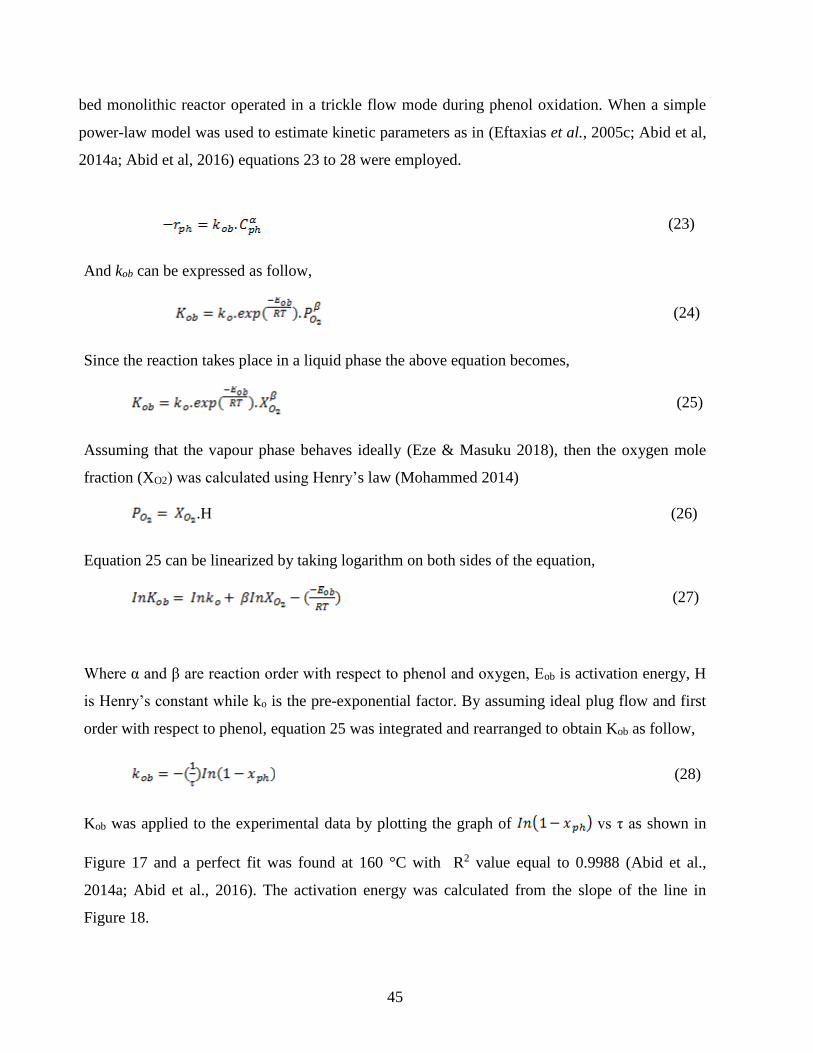
45
bed monolithic reactor operated in a trickle flow mode during phenol oxidation. When a simple
power-law model was used to estimate kinetic parameters as in (Eftaxias et al., 2005c; Abid et al,
2014a; Abid et al, 2016) equations 23 to 28 were employed.
(23)
And kob can be expressed as follow,
(24)
Since the reaction takes place in a liquid phase the above equation becomes,
(25)
Assuming that the vapour phase behaves ideally (Eze & Masuku 2018), then the oxygen mole
fraction (XO2) was calculated using Henry’s law (Mohammed 2014)
.H (26)
Equation 25 can be linearized by taking logarithm on both sides of the equation,
(27)
Where α and β are reaction order with respect to phenol and oxygen, Eob is activation energy, H
is Henry’s constant while ko is the pre-exponential factor. By assuming ideal plug flow and first
order with respect to phenol, equation 25 was integrated and rearranged to obtain Kob as follow,
(28)
Kob was applied to the experimental data by plotting the graph of vs τ as shown in
Figure 17 and a perfect fit was found at 160 °C with R2 value equal to 0.9988 (Abid et al.,
2014a; Abid et al., 2016). The activation energy was calculated from the slope of the line in
Figure 18.
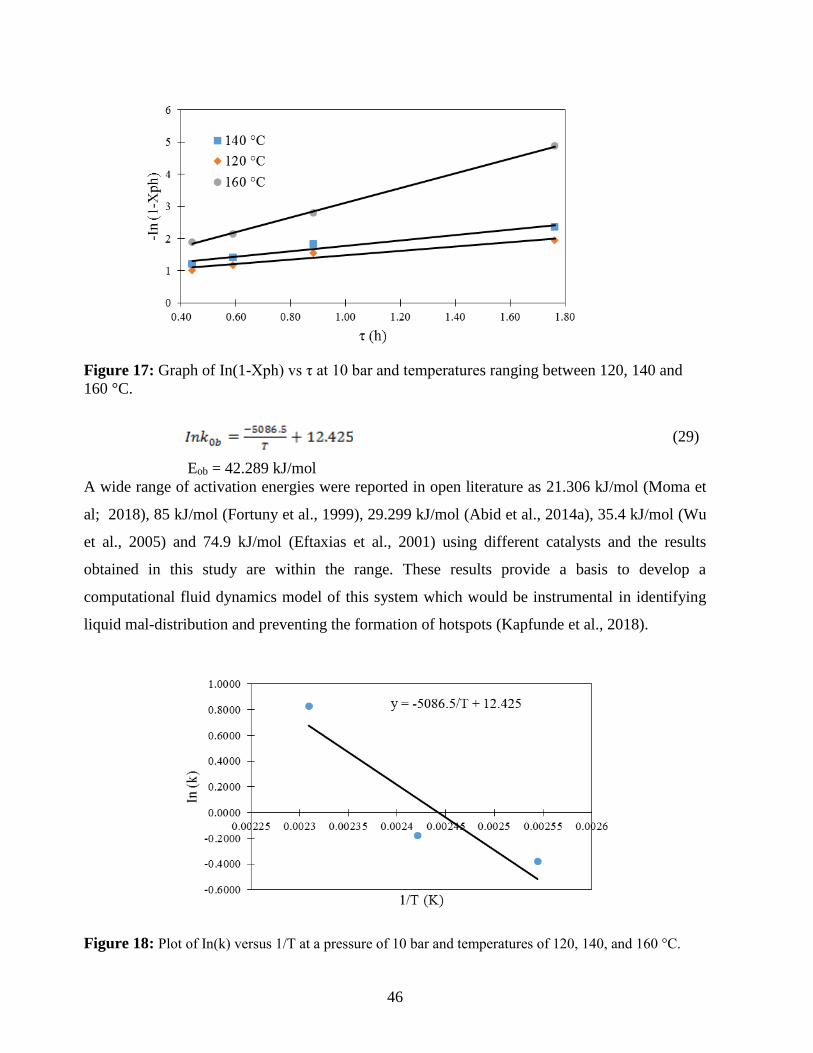
46
Figure 17: Graph of In(1-Xph) vs τ at 10 bar and temperatures ranging between 120, 140 and
160 °C.
(29)
Eob = 42.289 kJ/mol
A wide range of activation energies were reported in open literature as 21.306 kJ/mol (Moma et
al; 2018), 85 kJ/mol (Fortuny et al., 1999), 29.299 kJ/mol (Abid et al., 2014a), 35.4 kJ/mol (Wu
et al., 2005) and 74.9 kJ/mol (Eftaxias et al., 2001) using different catalysts and the results
obtained in this study are within the range. These results provide a basis to develop a
computational fluid dynamics model of this system which would be instrumental in identifying
liquid mal-distribution and preventing the formation of hotspots (Kapfunde et al., 2018).
Figure 18: Plot of In(k) versus 1/T at a pressure of 10 bar and temperatures of 120, 140, and 160 °C.
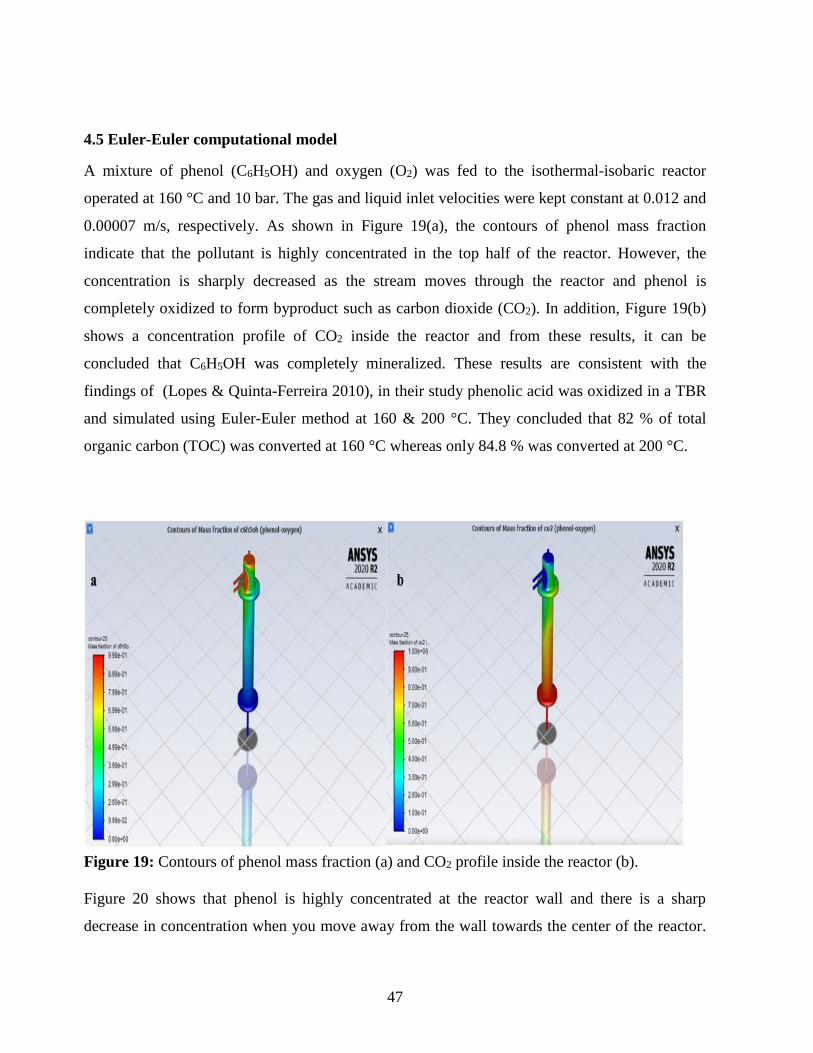
47
4.5 Euler-Euler computational model
A mixture of phenol (C6H5OH) and oxygen (O2) was fed to the isothermal-isobaric reactor
operated at 160 °C and 10 bar. The gas and liquid inlet velocities were kept constant at 0.012 and
0.00007 m/s, respectively. As shown in Figure 19(a), the contours of phenol mass fraction
indicate that the pollutant is highly concentrated in the top half of the reactor. However, the
concentration is sharply decreased as the stream moves through the reactor and phenol is
completely oxidized to form byproduct such as carbon dioxide (CO2). In addition, Figure 19(b)
shows a concentration profile of CO2 inside the reactor and from these results, it can be
concluded that C6H5OH was completely mineralized. These results are consistent with the
findings of (Lopes & Quinta-Ferreira 2010), in their study phenolic acid was oxidized in a TBR
and simulated using Euler-Euler method at 160 & 200 °C. They concluded that 82 % of total
organic carbon (TOC) was converted at 160 °C whereas only 84.8 % was converted at 200 °C.
Figure 19: Contours of phenol mass fraction (a) and CO2 profile inside the reactor (b).
Figure 20 shows that phenol is highly concentrated at the reactor wall and there is a sharp
decrease in concentration when you move away from the wall towards the center of the reactor.
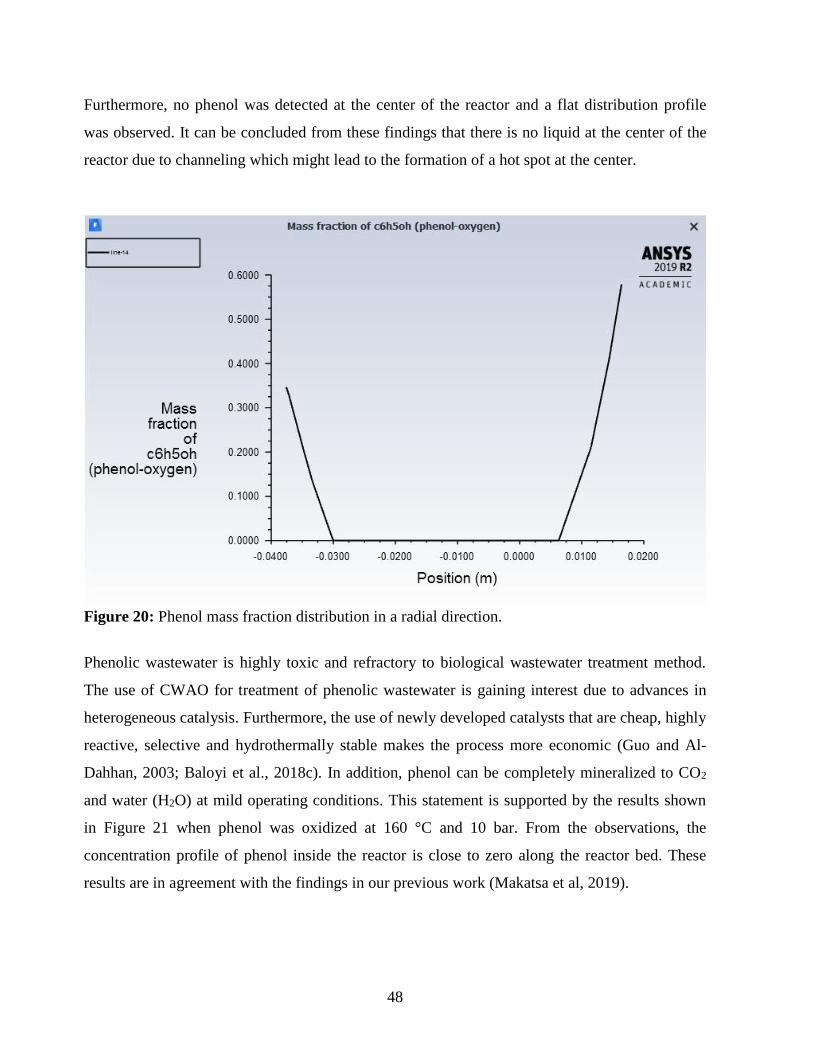
48
Furthermore, no phenol was detected at the center of the reactor and a flat distribution profile
was observed. It can be concluded from these findings that there is no liquid at the center of the
reactor due to channeling which might lead to the formation of a hot spot at the center.
Figure 20: Phenol mass fraction distribution in a radial direction.
Phenolic wastewater is highly toxic and refractory to biological wastewater treatment method.
The use of CWAO for treatment of phenolic wastewater is gaining interest due to advances in
heterogeneous catalysis. Furthermore, the use of newly developed catalysts that are cheap, highly
reactive, selective and hydrothermally stable makes the process more economic (Guo and Al-
Dahhan, 2003; Baloyi et al., 2018c). In addition, phenol can be completely mineralized to CO2
and water (H2O) at mild operating conditions. This statement is supported by the results shown
in Figure 21 when phenol was oxidized at 160 °C and 10 bar. From the observations, the
concentration profile of phenol inside the reactor is close to zero along the reactor bed. These
results are in agreement with the findings in our previous work (Makatsa et al, 2019).
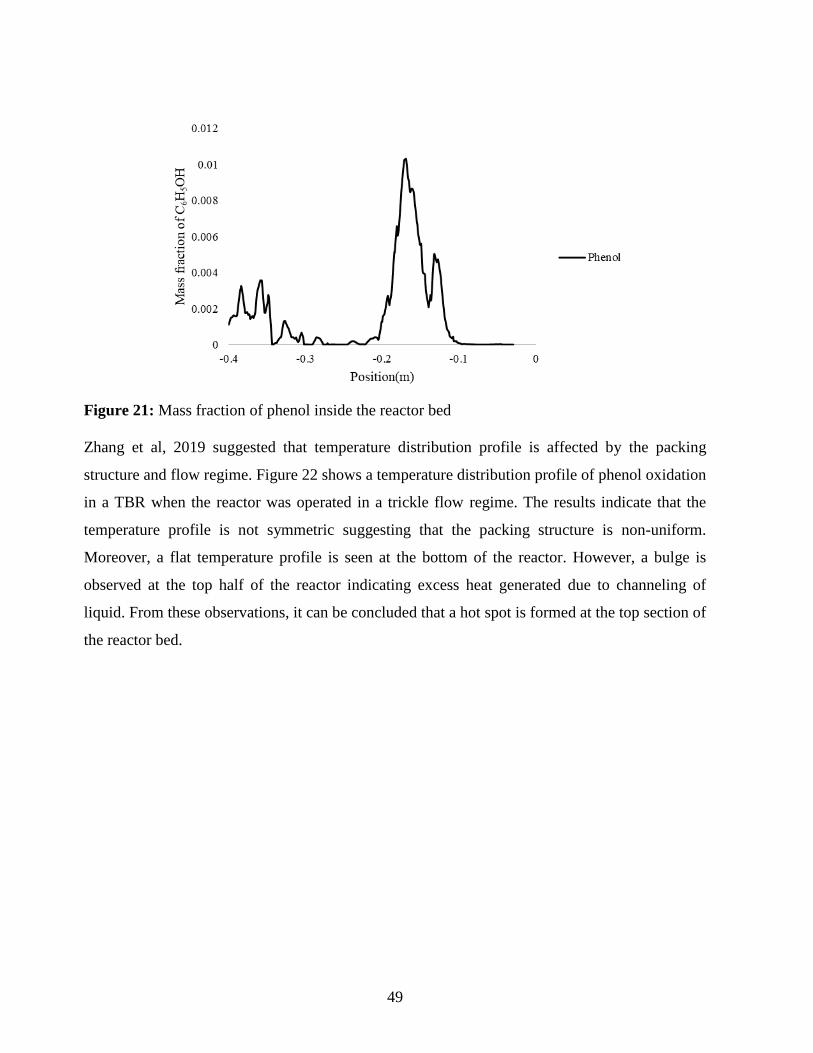
49
Figure 21: Mass fraction of phenol inside the reactor bed
Zhang et al, 2019 suggested that temperature distribution profile is affected by the packing
structure and flow regime. Figure 22 shows a temperature distribution profile of phenol oxidation
in a TBR when the reactor was operated in a trickle flow regime. The results indicate that the
temperature profile is not symmetric suggesting that the packing structure is non-uniform.
Moreover, a flat temperature profile is seen at the bottom of the reactor. However, a bulge is
observed at the top half of the reactor indicating excess heat generated due to channeling of
liquid. From these observations, it can be concluded that a hot spot is formed at the top section of
the reactor bed.
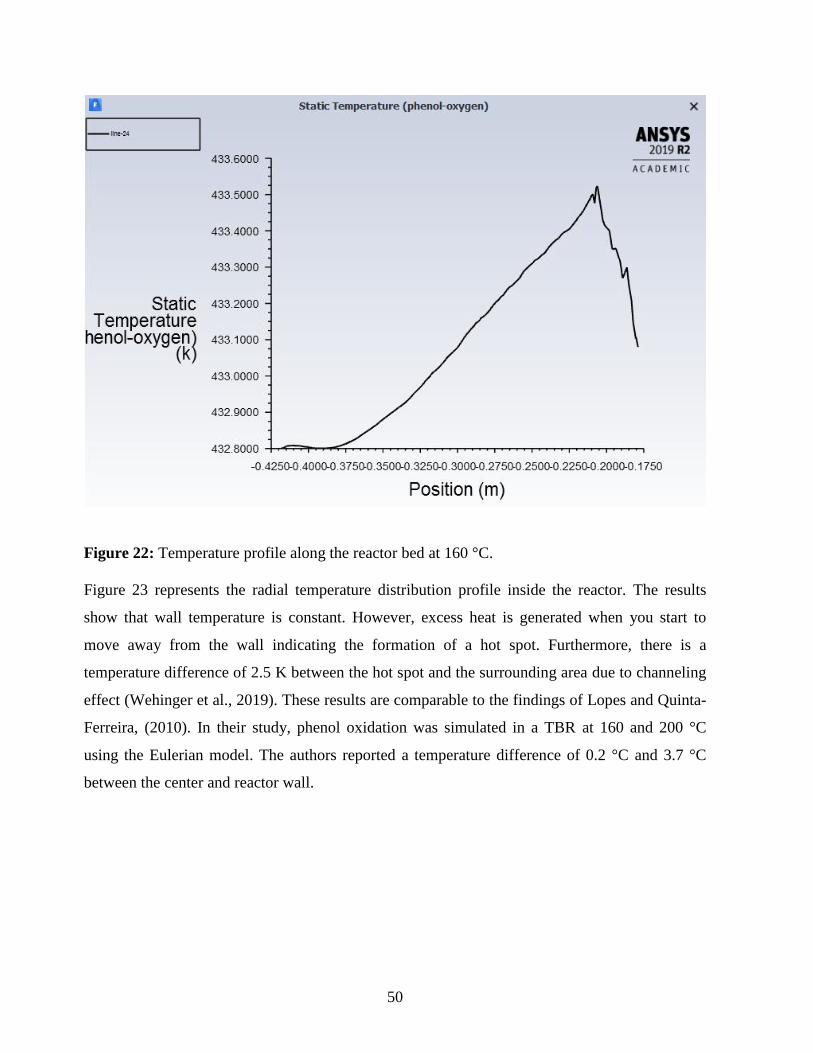
50
Figure 22: Temperature profile along the reactor bed at 160 °C.
Figure 23 represents the radial temperature distribution profile inside the reactor. The results
show that wall temperature is constant. However, excess heat is generated when you start to
move away from the wall indicating the formation of a hot spot. Furthermore, there is a
temperature difference of 2.5 K between the hot spot and the surrounding area due to channeling
effect (Wehinger et al., 2019). These results are comparable to the findings of Lopes and Quinta-
Ferreira, (2010). In their study, phenol oxidation was simulated in a TBR at 160 and 200 °C
using the Eulerian model. The authors reported a temperature difference of 0.2 °C and 3.7 °C
between the center and reactor wall.
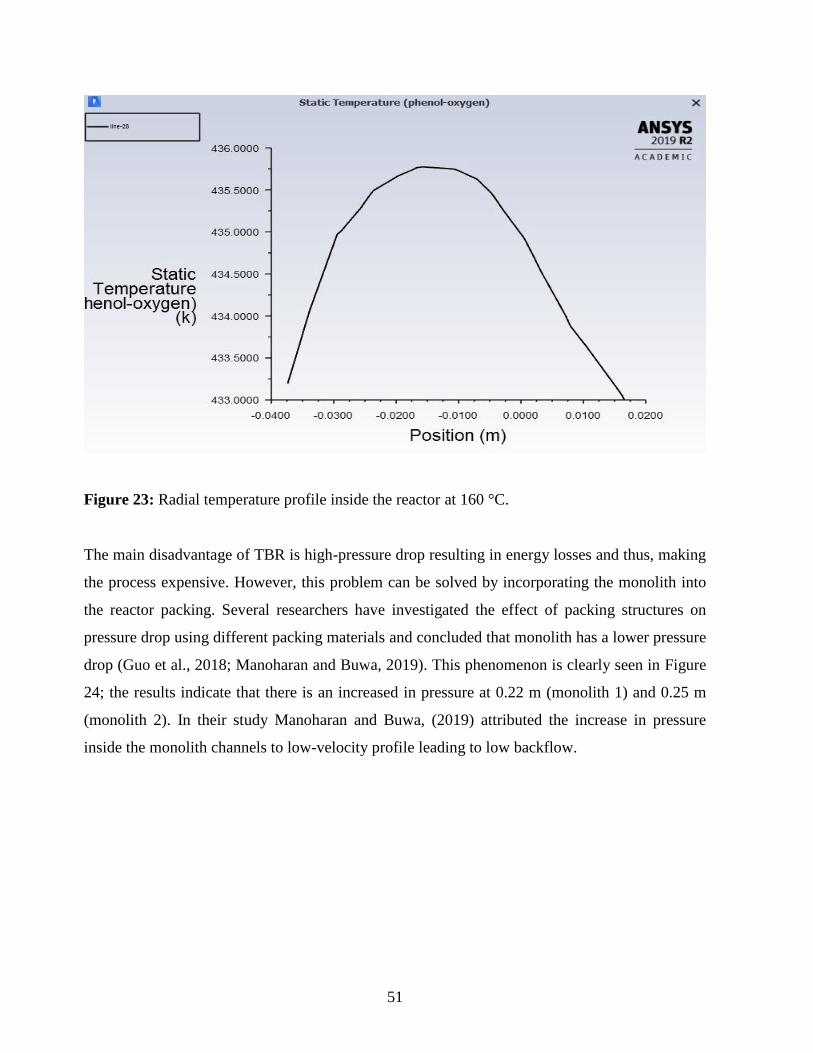
51
Figure 23: Radial temperature profile inside the reactor at 160 °C.
The main disadvantage of TBR is high-pressure drop resulting in energy losses and thus, making
the process expensive. However, this problem can be solved by incorporating the monolith into
the reactor packing. Several researchers have investigated the effect of packing structures on
pressure drop using different packing materials and concluded that monolith has a lower pressure
drop (Guo et al., 2018; Manoharan and Buwa, 2019). This phenomenon is clearly seen in Figure
24; the results indicate that there is an increased in pressure at 0.22 m (monolith 1) and 0.25 m
(monolith 2). In their study Manoharan and Buwa, (2019) attributed the increase in pressure
inside the monolith channels to low-velocity profile leading to low backflow.
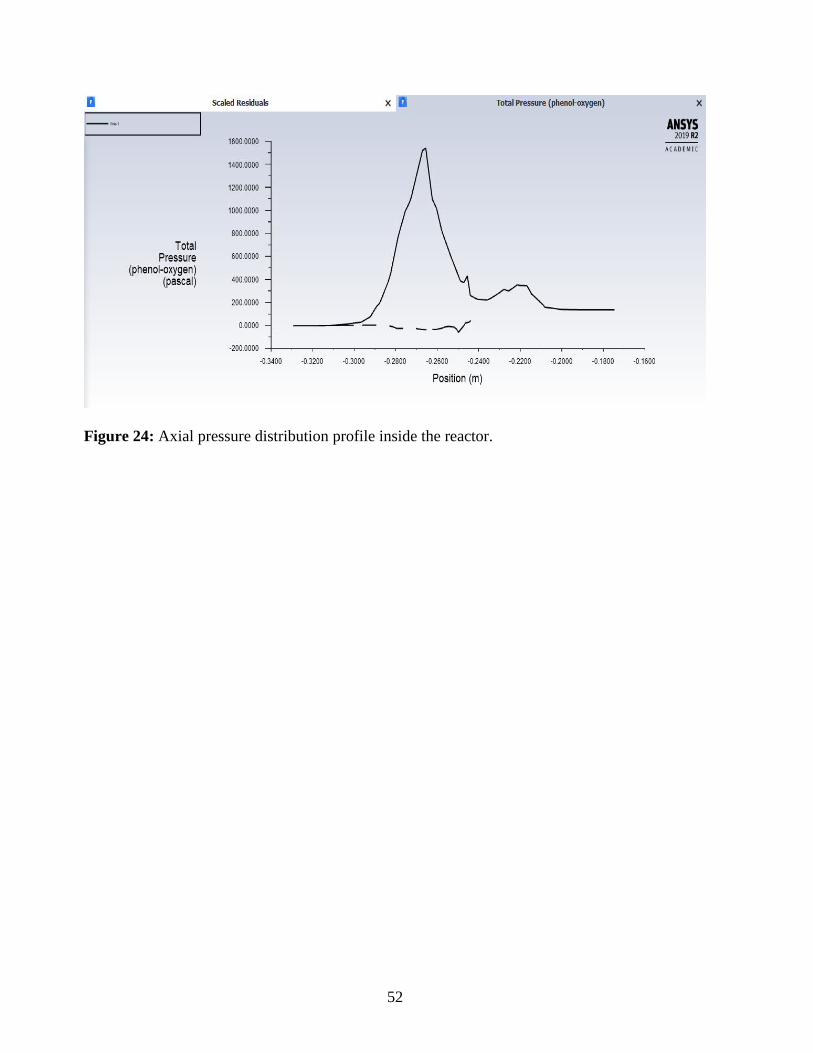
52
Figure 24: Axial pressure distribution profile inside the reactor.
53
Chapter 5: Conclusions and Recommendations
5.1 Conclusions
Bentonite clay was successfully pillared with metal oxides of alumina and zirconia. This is
confirmed by an increased surface area and a shift of montmorillonite peak from high to low
angle. After wash coating, the catalyst on the surface of the monolith, bentonite peaks
disappeared indicating the formation of amorphous SiO2. It can be concluded from SEM analysis
that no cracks are formed on the surface of the monolith and this can be attributed to the use of
glycerol. A sample dried using thermally assisted microwave oven is smoother compared to
others. This is due to heat that is homogeneously dispersed in the microwave.
Phenol oxidation was studied in a fixed bed monolithic reactor operated in a trickle flow mode
over Al/Zr pillared clay catalyst. The rate of phenol degradation was improved by an increase in
temperature whereas an increase in liquid flow rate showed an opposite trend. The complete
conversion was reached after 3 h. A simple power law model was used to determine activation
energy from a linear plot and found to be 42.289 kJ/mol.
After catalyst activity was tested in a TBR, CFD model (Euler-Euler) was developed from the
kinetics of the process. The reactor model was simulated at 160 °C, 10 bar and CFD results
showed that phenol was completely removed leaving significant amount of CO2. However,
temperature profile indicated that there is a hot spot near the center of the reactor which might
lead to catalyst deactivation. Furthermore, axial pressure profile showed that incorporating the
monolith in the packing structure helped to minimize pressure losses.
5.2 Potential for industrialization
For years industrialization of pillared clay catalyst has been hindered by prolonged synthesis
time (1-5 days) and a large amount of water used. Until recently, PILCs have been limited to
laboratory applications as there is great difficulty in shaping them from powders to commercial
shapes. However, recent studies indicated that the time taken to synthesize the catalyst can be
reduced significantly by ultra-sonication and direct addition of powder bentonite clay to the
pillaring solution. Furthermore, the catalyst can be easily scaled-up by wash coating the catalyst
on the surface of cordierite monolith support because the conditions inside the monolith channels
54
remain the same irrespective of size. The only challenges associated with industrialization of this
process will be, a large amount of wastewater generated in the washing process and ultra-
sonicating of an increased amount of catalyst slurry. A downstream process should be developed
to treat and recycle wastewater generated in the washing process because this will increase the
economics of the process.
5.3 Recommendations
1. The reactor must be fitted with liquid distributer
2. It is recommended that hydrodynamics of the process be investigated experimentally and the
results must be validated using CFD model.
3. The reactor bed must be fitted with at least three temperature probes to monitor bed
temperature.
4. The reactor must be fitted with differential pressure transducer to record pressure drop.
5. When the catalyst is commercialized a lot of wastewater will be generated from the washing
process and this waste should be treated before discharging it.
Reference
Abbas, ZI & Abbas, AS. 2019. Oxidative degradation of phenolic wastewater by electro-fenton
process using MnO 2 -graphite electrode. Journal of Environmental Chemical Engineering.
7(3):103108. doi.org/10.1016/j.jece.2019.103108.
Abid, MF, Jasim, FT & Ahmed, LS. 2014. Kinetic study of phenol removal from wastewater
over a 0 . 5 % Pt / γ -Al 2 O 3 catalyst in a trickle bed reactor. 13(5):2014.
Abid, MF, Alwan, GM & Abdul-Ridha, LA. 2016. Study on Catalytic Wet Air Oxidation
Process for Phenol Degradation in Synthetic Wastewater Using Trickle Bed Reactor. Arabian
Journal for Science and Engineering. 41(7):2659–2670. doi.org/10.1007/s13369-016-2171-x.
Adamowska, MB & Costa, P Da. 2014. Structured Pd / γ-Al 2 O 3 Prepared by Washcoated
Deposition on a Ceramic Honeycomb for Compressed Natural Gas Applications. Journal of
Nanoparticles. 2015:10–12. doi.org/http://dx.doi.org/10.1155/2015/601941.
Adekola, O & Majozi, T. 2017. Wastewater minimization in batch plants with sequence
dependent changeover. Computers & Chemical Engineering. 97:85–103.
doi.org/https://doi.org/10.1016/j.compchemeng.2016.11.016.
55
Ahmed, LS. 2012. Hydrodynamics and Kinetics Study of Phenol Removal Treatment in
wastewater in a Trickle Bed Reactor. Thesis.
Al-obaidi, MA, Kara-zaïtri, C & Mujtaba, IM. 2019a. Performance evaluation of multi-stage
reverse osmosis process with permeate and retentate recycling strategy for the removal of
chlorophenol from wastewater. Computers and Chemical Engineering. 121:12–26.
doi.org/10.1016/j.compchemeng.2018.08.035.
Al-obaidi, MA, Kara-zaïtri, C & Mujtaba, IM. 2019b. Evaluation of chlorophenol removal from
wastewater using multi-stage spiral-wound reverse osmosis process via simulation. Computers
and Chemical Engineering. 130:106522. doi.org/10.1016/j.compchemeng.2019.106522.
Al-Obaidi, MA, Kara-Zaïtri, C & Mujtaba, IM. 2017. Removal of phenol from wastewater using
spiral-wound reverse osmosis process: Model development based on experiment and simulation.
Journal of Water Process Engineering. 18:20–28.
doi.org/https://doi.org/10.1016/j.jwpe.2017.05.005.
Alves, APA, Lima, PS, Dezotti, M & Bassin, JP. 2017. Impact of phenol shock loads on the
performance of a combined activated sludge-moving bed bio film reactor system. International
Biodeterioration & Biodegradation. 123:146–155. doi.org/10.1016/j.ibiod.2017.06.015.
Arena, F, Italiano, C, Raneri, A & Saja, C. 2010. Mechanistic and kinetic insights into the wet air
oxidation of phenol with oxygen (CWAO) by homogeneous and heterogeneous transition-metal
catalysts. Applied Catalysis B: Environmental. 99(1–2):321–328.
doi.org/10.1016/j.apcatb.2010.06.039.
Arena, F, Italiano, C & Spadaro, L. 2012. Applied Catalysis B : Environmental Efficiency and
reactivity pattern of ceria-based noble metal and transition metal-oxide catalysts in the wet air
oxidation of phenol. “Applied Catalysis B, Environmental”. 115–116:336–345.
doi.org/10.1016/j.apcatb.2011.12.035.
Attou, A & Ferschneider, G. 1999. A two fluid model for flow regime transition in gas liquid
trickle-bed reactors. 54:5031–5037.
Baloyi, SJ. 2019. Pillared clays as “ green chemistry ’’ catalysts for wastewater treatment.
Witwatersrand.
Baloyi, J, Ntho, T & Moma, J. 2018a. Synthesis and application of pillared clay heterogeneous
catalysts for wastewater treatment: a review. RSC Advances. doi.org/10.1039/C7RA12924F.
Baloyi, J, Ntho, T & Moma, J. 2018b. Synthesis of highly active and stable Al/Zr pillared clay as
56
catalyst for catalytic wet oxidation of phenol. Journal of Porous Materials. (August).
doi.org/10.1007/s10934-018-0667-3.
Baloyi, J, Ntho, T & Moma, J. 2018c. A Novel Synthesis Method of Al/Cr Pillared Clay and its
Application in the Catalytic Wet Air Oxidation of Phenol. Catalysis Letters. 0(0):0.
doi.org/10.1007/s10562-018-2579-x.
Beni, AH & Khosravi-Nikou, MR. 2015. Modeling Hydrodynamics of Trickle-bed Reactors at
High and Low Pressure Using CFD Method. Petroleum Science and Technology. 33(20):1770–
1779. doi.org/10.1080/10916466.2011.588639.
Braga, A, Ribeiro, M, Noronha, FB, Maria, J, Bueno, C & Santos, JB. 2018. The effects of Co
addition to supported Ni catalysts on hydrogen production from oxidative steam reforming of
ethanol. Energy and Fuels. 32:12814–12825. doi.org/10.1021/acs.energyfuels.8b02727.
Cao, Y, Li, B, Zhong, G, Li, Y, Wang, H, Yu, H & Peng, F. 2018. Catalytic wet air oxidation of
phenol over carbon nanotubes: Synergistic effect of carboxyl groups and edge carbons. Carbon.
133:464–473. doi.org/10.1016/j.carbon.2018.03.045.
Castaldo, R, Iuliano, M, Cocca, M, Ambrogi, V, Gentile, G & Sarno, M. 2019. A New Route for
Low Pressure and Temperature CWAO: A PtRu/MoS2_Hyper-Crosslinked Nanocomposite.
Nanomaterials. 9(10):1477. doi.org/10.3390/nano9101477.
Cecilia Sánchez-Trinidad, Gloria del Angel, GT-T, Adrián Cervantes-Uribe, A. Abiu Silahua
Pavón, ZG-Q & Juan Carlos Arévalo-Pérez, and FJT-M. 2019. Effect of the CuAl2O4 and
CuAlO2 Phases in Catalytic Wet Air Oxidation of ETBE and TAME using CuO/γ‐Al2O3 catalysts.
Available from: https://onlinelibrary.wiley.com/doi/pdf/10.1002/open.201900080 [Accessed 15
January 2020].
Chicinaş, RP, Gál, E, Bedelean, H, Darabantu, M & Măicăneanu, A. 2018. Novel metal modified
diatomite, zeolite and carbon xerogel catalysts for mild conditions wet air oxidation of phenol:
Characterization, efficiency and reaction pathway. Separation and Purification Technology.
197:36–46. doi.org/https://doi.org/10.1016/j.seppur.2017.12.050.
Crini, G & Lichtfouse, E. 2019. Advantages and disadvantages of techniques used for
wastewater treatment. Environmental Chemistry Letters. 17(1):145–155.
doi.org/10.1007/s10311-018-0785-9.
Cybulski, A. 2007. Catalytic wet air oxidation: Are monolithic catalysts and reactors feasible?
Industrial and Engineering Chemistry Research. doi.org/10.1021/ie060906z.
57
Davies, D, Golunski, S, Johnston, P, Lalev, G & Taylor, SH. 2018. Dominant effect of support
wettability on the reaction pathway for catalytic wet air oxidation over Pt and Ru nanoparticle
catalysts. ACS Catalysis. 8(4):2730–2734. doi.org/10.1021/acscatal.7b04039.
Dewidar, H, Nosier, SA & El-Shazly, AH. 2018. Photocatalytic degradation of phenol solution
using Zinc Oxide/UV. Journal of Chemical Health and Safety. 25(1):2–11.
doi.org/10.1016/j.jchas.2017.06.001.
Eftaxias, A. 2002a. Catalytic wet air oxidation of phenol in a trickle bed reactor: Kinetics and
reactor modelling. Thesis.
Eftaxias, A. 2002b. Catalytic Wet Air Oxidation of Phenol in a Trickle Bed Reactor: Kinetics
and Reactor Modelling. (December):196.
Eftaxias, A, Font, J, Fortuny, A, Giralt, J, Fabregat, A & Stuber, F. 2001. Kinetic modelling of
catalytic wet air oxidation of phenol by simulated annealing. Applied Catalysis B-Environmental.
33(2):175–190.
Eftaxias, A, Font, J, Fortuny, A, Fabregat, A & Uber, FS. 2005. Kinetics of phenol oxidation in a
trickle bed reactor over active carbon catalyst. Journal of Chemical Technology and
Biotechnology J Chem Technol Biotechnol. 80:677–687. doi.org/10.1002/jctb.1250.
Eftaxias, A, Font, J, Fortuny, A, Fabregat, A & Stüber, F. 2005. Kinetics of phenol oxidation in a
trickle bed reactor over active carbon catalyst. Journal of Chemical Technology and
Biotechnology. doi.org/10.1002/jctb.1250.
Eftaxias, A, Font, J, Fortuny, A, Fabregat, A & Stu, F. 2006. Catalytic wet air oxidation of
phenol over active carbon catalyst Global kinetic modelling using simulated annealing. 67:12–
23. doi.org/10.1016/j.apcatb.2006.04.012.
El-Ashtoukhy, ESZ, El-Taweel, YA, Abdelwahab, O & Nassef, EM. 2013. Treatment of
petrochemical wastewater containing phenolic compounds by electrocoagulation using a fixed
bed electrochemical reactor. International Journal of Electrochemical Science. 8(1):1534–1550.
Elmer, TH. 2008. Selective leaching of extruded cordierite honeycomb structures. In:
Applications of Refractories: Ceramic Engineering and Science Proceedings. W. Smothers, Ed.
John Wiley & Sons, Ltd. 40–51. doi.org/10.1002/9780470320310.ch4.
Eze, PC & Masuku, CM. 2018. Vapour–liquid equilibrium prediction for synthesis gas
conversion using artificial neural networks. South African Journal of Chemical Engineering.
26:80–85. doi.org/https://doi.org/10.1016/j.sajce.2018.10.001.
58
Fortuny, A, Ferrer, C, Bengoa, C, Font, J & Fabregat, A. 1995. Catalytic removal of phenol from
aqueous-phase using oxygen or air as oxidant. Catalysis Today. 24(1–2):79–83.
Fortuny, A, Bengoa, C, Font, J, Castells, F & Fabregat, A. 1999. Water pollution abatement by
catalytic wet air oxidation in a trickle bed reactor. Catalysis Today. 53:107–114. Available from:
http://www.etseq.urv.cat/CREPI/webc/publipdf/027.pdf [Accessed 24 May 2018].
Frascari, D, Rubertelli, G, Arous, F, Ragini, A, Bresciani, L, Arzu, A & Pinelli, D. 2019.
Valorisation of olive mill wastewater by phenolic compounds adsorption : Development and
application of a procedure for adsorbent selection. Chemical Engineering Journal.
360(September 2018):124–138. doi.org/10.1016/j.cej.2018.11.188.
Gao, P, Song, Y, Wang, S, Descorme, C & Yang, S. 2018. Fe2O3 -CeO2 -Bi2O3 /γ-Al2O3 catalyst
in the catalytic wet air oxidation (CWAO) of cationic red GTL under mild reaction conditions.
Frontiers of Environmental Science and Engineering. 12(1). doi.org/10.1007/s11783-018-1025-
z.
Garg, A & Mishra, A. 2013. Degradation of organic pollutants by wet air oxidation using
nonnoble metal-based catalysts. Journal of Hazardous, Toxic, and Radioactive Waste. 17(2):89–
96. doi.org/10.1061/(ASCE)HZ.2153-5515.0000152.
Guerra-que, Z, Hermicenda, P, Abiu, A, Pav, S, Monteros, AEDL & Lunag, MA. 2019.
Treatment of phenol by catalytic wet air oxidation: A comparative study of copper and nickel
supported on γ-alumina, ceria and γ-alumina–ceria. Royal Society of Chemistry. 9:8463–8479.
doi.org/10.1039/c9ra00509a.
Guo, J & Al-Dahhan, M. 2003. Kinetics of Wet Air Oxidation of Phenol over a Novel Catalyst.
Industrial & Engineering Chemistry Research. 42(22):5473–5481. doi.org/10.1021/ie0302488.
Guo, Y, Dai, C & Lei, Z. 2018. Hydrodynamics and mass transfer in multiphase monolithic
reactors with different distributors: An experimental and modeling study. Chemical Engineering
and Processing: Process Intensification. 125(February):234–245.
doi.org/10.1016/j.cep.2018.01.026.
Hamoudi, S.; Larachi, F.;Graciela, C.;Myrian, C. 1998. Wet oxidation of phenol catalyzed by
unpromoted and platinum promoted manganese/cerium oxide. Industrial & Engineering
Chemistry Fundamentals. 37:3561.
Haro, P, Johnsson, F & Thunman, H. 2016. Improved syngas processing for enhanced Bio-SNG
production: A techno-economic assessment. Energy. 101:380–389.
59
doi.org/https://doi.org/10.1016/j.energy.2016.02.037.
John Moma; Thabang Ntho; Siwela Jeffrey Baloyi. 2018. Influence of operational parameters
and kinetic modelling of catalytic wet air oxidation of phenol by Al/Zr pillared clay catalyst.
Iranian Journal of chemistry and chemical engineering. 37.
Kapfunde, N, Masuku, CM & Hildebrandt, D. 2018. Optimization of the Thermal Efficiency of a
Fixed-Bed Gasifier using Computational Fluid Dynamics. In: 13th International Symposium on
Process Systems Engineering (PSE 2018). V. 44. M.R. Eden, M.G. Ierapetritou, & G.P. Towler,
Eds. (Computer Aided Chemical Engineering). Elsevier. 1747–1752.
doi.org/https://doi.org/10.1016/B978-0-444-64241-7.50286-X.
Klinghoffer, AA, Cerro, RL & Abraham, MA. 1998. Catalytic wet oxidation of acetic acid using
platinum on alumina monolith catalyst. 40:59–71.
Krastanov, A, Alexieva, Z & Yemendzhiev, H. 2013. Microbial degradation of phenol and
phenolic derivatives. 76–87. doi.org/10.1002/elsc.201100227.
Kuzeljevic, Z. 2010. Hydrodynamics Of Trickle Bed Reactors: Measurements And Modeling.
Available from: http://openscholarship.wustl.edu/etd.
Lai, C, He, T, Li, X, Chen, F, Yue, L & Hou, Z. 2019. Catalytic wet air oxidation of phenols
over porous plate Cu-based catalysts. Applied Clay Science. 181:105253.
doi.org/https://doi.org/10.1016/j.clay.2019.105253.
Lal, K & Garg, A. 2014. Catalytic wet oxidation of phenol under mild operating conditions :
development of reaction pathway and sludge characterization. (January 2015).
doi.org/10.1007/s10098-014-0777-9.
Lal, K & Garg, A. 2016. Catalytic wet oxidation of phenol under mild operating conditions :
development of reaction pathway and sludge characterization. (January 2015).
doi.org/10.1007/s10098-014-0777-9.
Levec, J. 1995. Catalytic oxidation of aqueous solutions of organics. An effective method for
removal of toxic pollutants from waste waters. 24:51–58.
Liu, C, Min, Y, Zhang, A, Si, Y, Chen, J & Yu, H. 2019. Electrochemical treatment of phenol-
containing wastewater by facet- tailored TiO2 : Efficiency , characteristics and mechanisms.
Water Research. 165:114980. doi.org/10.1016/j.watres.2019.114980.
Lopes, RJG & Quinta-Ferreira, RM. 2007. Trickle-bed CFD studies in the catalytic wet
oxidation of phenolic acids. Chemical Engineering Science. 62(24):7045–7052.
60
doi.org/10.1016/j.ces.2007.08.085.
Lopes, RJG & Quinta-Ferreira, RM. 2010. Assessment of CFD Euler-Euler method for trickle-
bed reactor modelling in the catalytic wet oxidation of phenolic wastewaters. Chemical
Engineering Journal. 160(1):293–301. doi.org/10.1016/j.cej.2010.03.024.
de los Monteros, AE, Lafaye, G, Cervantes, A, Angel, G Del, Jr., JB & Torres, G. 2015.
Catalytic wet air oxidation of phenol over metal catalyst (Ru,Pt) supported on TiO2–CeO2
oxides. Catalysis Today. 258:564–569. doi.org/https://doi.org/10.1016/j.cattod.2015.01.009.
Luo, Z, Gao, M, Yang, S & Yang, Q. 2015. Adsorption of phenols on reduced-charge
montmorillonites modified by bispyridinium dibromides: Mechanism, kinetics and
thermodynamics studies. Colloids and Surfaces A: Physicochemical and Engineering Aspects.
482:222–230. doi.org/10.1016/J.COLSURFA.2015.05.014.
Makatsa, TJ, Baloyi, SJ, Ntho, TA & Masuku, CM. 2019. Kinetic study of phenol oxidation in a
trickle bed reactor over Al/Zr-pillared clay catalyst. IOP Conference Series: Materials Science
and Engineering. 655:12050. doi.org/10.1088/1757-899x/655/1/012050.
Makatsa, TJ, Baloyi, J, Ntho, T & Masuku, CM. 2020. Catalytic wet air oxidation of phenol:
Review of the reaction mechanism, kinetics, and CFD modeling. Critical Reviews in
Environmental Science and Technology. (June, 11):1–33.
doi.org/10.1080/10643389.2020.1771886.
Manoharan, KG & Buwa, VV. 2019. Structure-resolved CFD simulations of different catalytic
structures in a packed bed. Industrial & Engineering Chemistry Research. 58(49):22363–22375.
doi.org/10.1021/acs.iecr.9b03537.
Martin Zhuwakinyu and the Research Unit of Creamer media. 2018. A review of South Africa ’ s
water sector. Research channel africa. (November).
Masuku, CM & Biegler, LT. 2019. Recent advances in gas-to-liquids process intensification with
emphasis on reactive distillation. Current Opinion in Chemical Engineering.
doi.org/https://doi.org/10.1016/j.coche.2018.12.009.
Maugans, CB & Akgerman, A. 2003. Catalytic wet oxidation of phenol in a trickle bed reactor
over a Pt/TiO2 catalyst. Water Research. 37(2):319–328. doi.org/10.1016/S0043-
1354(02)00289-0.
Minhua, Z, He, D & Zhongfeng, G. 2019. A particle-resolved CFD model coupling reaction-
diffusion inside fixed-bed reactor. Advanced Powder Technology. 30(6):1226–1238.
61
doi.org/10.1016/j.apt.2019.03.019.
Moghaddam, EM, Foumeny, EA, Stankiewicz, AI & Padding, JT. 2019. Fixed bed reactors of
non-spherical pellets: Importance of heterogeneities and inadequacy of azimuthal averaging.
Chemical Engineering Science: X. 1:100006. doi.org/https://doi.org/10.1016/j.cesx.2019.100006.
Mohammad F.Abid, FTJ & S.Ahmed, L. 2014. Kinetic study of phenol removal from wastewater
over a 0.5% Pt/γ-Al2O3 catalyst in a trickle bed reactor. Environmental Engineering and
Management. 13:1265–1275.
Mohammed, WT. 2014. Active Carbon from Date Stones for Phenol Oxidation in Trickle Bed
Reactor, Experimental and Kinetic Study. 20(4):120–160.
Mohammed, WT & Abdullah, SM. 2008. Kinetic Study on Catalytic Wet Air Oxidation of
Phenol in a Trickle Bed. 9(2).
Mohammed, AE, Jarullah, AT, Gheni, SA & Mujtaba, IM. 2016a. Optimal design and operation
of an industrial three phase reactor for the oxidation of phenol. Computers and Chemical
Engineering. 94:257–271. doi.org/10.1016/j.compchemeng.2016.07.018.
Mohino, F, Martin, AB, Salerno, P, Bahamonde, A & Mendioroz, S. 2005. High surface area
monoliths based on pillared clay materials as carriers for catalytic processes. 29:125–136.
doi.org/10.1016/j.clay.2004.12.003.
Moma, J, Baloyi, J & Ntho, T. 2018. Synthesis and characterization of an efficient and stable
Al/Fe pillared clay catalyst for the catalytic wet air oxidation of phenol †.
doi.org/10.1039/c8ra05825c.
Monteros, AEDL, Lafaye, G, Cervantes, A, Del Angel, G, Barbier, J & Torres, G. 2015.
Catalytic wet air oxidation of phenol over metal catalyst (Ru,Pt) supported on TiO2-CeO2oxides.
Catalysis Today. doi.org/10.1016/j.cattod.2015.01.009.
Mousazadeh, F. 2013. Hot spot formation in trickle bed reactors. Thesis.
Pagliaro, BM, Rossi, M & Pagliaro, M. 2008. Glycerol : Properties and Production. 1–18.
Parvas, M, Haghighi, M & Allahyari, S. 2014. Degradation of phenol via wet-air oxidation over
CuO/CeO 2-ZrO 2 nanocatalyst synthesized employing ultrasound energy: Physicochemical
characterization and catalytic performance. Environmental Technology (United Kingdom).
35(9):1140–1149. doi.org/10.1080/09593330.2013.863952.
Pervov, A & Nguyen, XQ. 2019. Application of reverse osmosis and nanofiltration techniques at
municipal drinking water facilities. E3S Web of Conferences. 97.
62
Pradeep, N V, Anupama, S, Navya, K, Shalini, HN, Idris, M & Hampannavar, US. 2015.
Biological removal of phenol from wastewaters : a mini review. 105–112.
doi.org/10.1007/s13201-014-0176-8.
Quintanilla, A, Casas, JA & Mohedano, AF. 2006. Reaction pathway of the catalytic wet air
oxidation of phenol with a Fe / activated carbon catalyst. 67:206–216.
doi.org/10.1016/j.apcatb.2006.05.003.
Radwan, M, Gar Alalm, M & Eletriby, H. 2018. Optimization and modeling of electro-Fenton
process for treatment of phenolic wastewater using nickel and sacrificial stainless steel anodes.
Journal of Water Process Engineering. 22(January):155–162.
doi.org/10.1016/j.jwpe.2018.02.003.
Resende, KA, Teles, CA, Jacobs, G, Davis, BH, Cronauer, DC, Kropf, AJ, Marshall, CL, Hori,
CE, et al. 2018. Hydrodeoxygenation of phenol over zirconia supported Pd bimetallic catalysts.
The effect of second metal on catalyst performance. Applied Catalysis B: Environmental.
232:213–231. doi.org/https://doi.org/10.1016/j.apcatb.2018.03.041.
Resini, C, Catania, F, Berardinelli, S, Paladino, O & Busca, G. 2008. Catalytic wet oxidation of
phenol over lanthanum strontium manganite. Applied Catalysis B: Environmental. 84(3–4):678–
683. doi.org/10.1016/j.apcatb.2008.06.005.
Santos, A, Yustos, P, Quintanilla, A, Rodr, S & Garc, F. 2002. Route of the catalytic oxidation of
phenol in aqueous phase. 39:97–113.
Seadira, T, Gullapelli, S, Abraham, NT, Xiaojun, L, M, MC & Mike, S. 2018.
doi.org/10.1515/revce-2016-0064.
Serra-Pérez, E, Álvarez-Torrellas, S, Águeda, VI, Delgado, JA, Ovejero, G & García, J. 2019.
Insights into the removal of Bisphenol A by catalytic wet air oxidation upon carbon nanospheres-
based catalysts: Key operating parameters, degradation intermediates and reaction pathway.
Applied Surface Science. 473:726–737. doi.org/https://doi.org/10.1016/j.apsusc.2018.12.205.
Soghrati, E, Kazemeini, M, Rashidi, AM & Jafari, K. 2014. Development of a structured
monolithic support with a CNT washcoat for the naphtha HDS process. Journal of Thaiwan
Institute of Chemical Engineers. (May). doi.org/10.1016/j.jtice.2013.08.009.
Suárez-Ojeda, ME, Fabregat, A, Stüber, F, Fortuny, A, Carrera, J & Font, J. 2007. Catalytic wet
air oxidation of substituted phenols: Temperature and pressure effect on the pollutant removal,
the catalyst preservation and the biodegradability enhancement. Chemical Engineering Journal.
63
132(1–3):105–115. doi.org/10.1016/j.cej.2007.01.025.
Sun, J, Liu, X, Zhang, F, Zhou, J, Wu, J & Alsaedi, A. 2019. Insight into the mechanism of
adsorption of phenol and resorcinol on activated carbons with different oxidation degrees.
Colloids and Surfaces A. 563(October 2018):22–30. doi.org/10.1016/j.colsurfa.2018.11.042.
Sun, X, Wang, C, Li, Y, Wang, W & Wei, J. 2015. Treatment of phenolic wastewater by
combined UF and NF/RO processes. Desalination. 355:68–74.
doi.org/https://doi.org/10.1016/j.desal.2014.10.018.
Tałałaj, IA & Biedka Paweł and Bartkowska, I. 2019. Treatment of landfill leachates with
biological pretreatments and reverse osmosis. Environmental Chemistry Letters. 17(3):1177–
1193. doi.org/10.1007/s10311-019-00860-6.
Ukonu, PN. 2018. Heterogeneous catalytic wet air oxidation of industrial wastewater pollutant
for environmental sustainability. University of Massachusetts Lowell.
United Nations Department of Economic and Social Affairs). 2017. World Population Prospects
The 2017 Revision: Key Findings and Advance Tables.
United Nations World Water Assessment Programme. 2018. The United Nations World Water
Development Report 2018: Nature-Based Solutions for Water.
Villegas, L, Masset, F & Guilhaume, N. 2007. Wet impregnation of alumina-washcoated
monoliths : Effect of the drying procedure on Ni distribution and on autothermal reforming
activity. 320:43–55. doi.org/10.1016/j.apcata.2006.12.011.
Villegas, L, Mashhadi, N, Chen, M, Mukherjee, D, Taylor, K & Biswas, N. 2016. A Short
Review of Techniques for Phenol Removal from Wastewater. Current Pollution Reports. 2.
doi.org/10.1007/s40726-016-0035-3.
Vivek V. Ranade, RVC & Gunjal, PR. 2011. Trickle bed reactors.
Wang, C, Xu, J, Yang, Z, Zhang, Z & Cai, Z. 2019. A field study of polychlorinated dibenzo-p-
dioxins and dibenzofurans formation mechanism in a hazardous waste incinerator : Emission
reduction strategies. Journal of Cleaner Production. 232:1018–1027.
doi.org/10.1016/j.jclepro.2019.06.020.
Wang, J, Fu, W, He, X, Yang, S & Zhu, W. 2014. Catalytic wet air oxidation of phenol with
functionalized carbon materials as catalysts: Reaction mechanism and pathway. Journal of
Environmental Sciences (China). 26(8):1741–1749. doi.org/10.1016/j.jes.2014.06.015.
Wehinger, GD, Kolaczkowski, ST, Schmalhorst, L, Beton, D & Torkuhl, L. 2019. Modeling fi
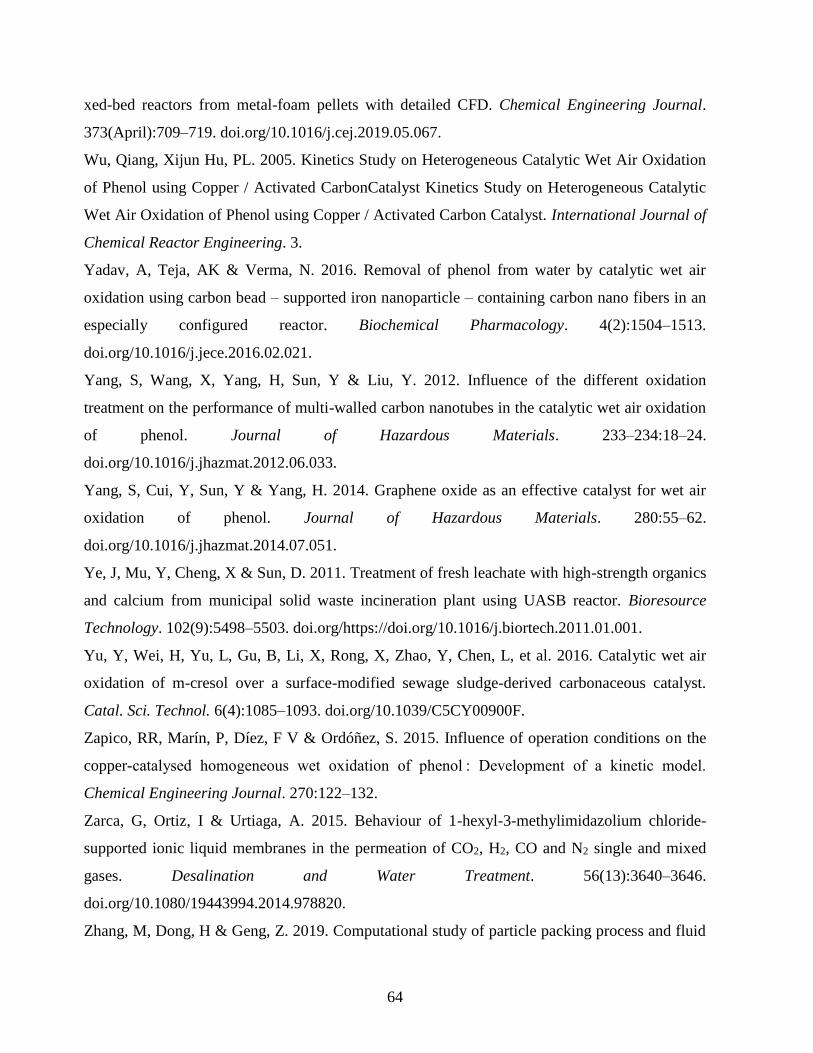
64
xed-bed reactors from metal-foam pellets with detailed CFD. Chemical Engineering Journal.
373(April):709–719. doi.org/10.1016/j.cej.2019.05.067.
Wu, Qiang, Xijun Hu, PL. 2005. Kinetics Study on Heterogeneous Catalytic Wet Air Oxidation
of Phenol using Copper / Activated CarbonCatalyst Kinetics Study on Heterogeneous Catalytic
Wet Air Oxidation of Phenol using Copper / Activated Carbon Catalyst. International Journal of
Chemical Reactor Engineering. 3.
Yadav, A, Teja, AK & Verma, N. 2016. Removal of phenol from water by catalytic wet air
oxidation using carbon bead – supported iron nanoparticle – containing carbon nano fibers in an
especially configured reactor. Biochemical Pharmacology. 4(2):1504–1513.
doi.org/10.1016/j.jece.2016.02.021.
Yang, S, Wang, X, Yang, H, Sun, Y & Liu, Y. 2012. Influence of the different oxidation
treatment on the performance of multi-walled carbon nanotubes in the catalytic wet air oxidation
of phenol. Journal of Hazardous Materials. 233–234:18–24.
doi.org/10.1016/j.jhazmat.2012.06.033.
Yang, S, Cui, Y, Sun, Y & Yang, H. 2014. Graphene oxide as an effective catalyst for wet air
oxidation of phenol. Journal of Hazardous Materials. 280:55–62.
doi.org/10.1016/j.jhazmat.2014.07.051.
Ye, J, Mu, Y, Cheng, X & Sun, D. 2011. Treatment of fresh leachate with high-strength organics
and calcium from municipal solid waste incineration plant using UASB reactor. Bioresource
Technology. 102(9):5498–5503. doi.org/https://doi.org/10.1016/j.biortech.2011.01.001.
Yu, Y, Wei, H, Yu, L, Gu, B, Li, X, Rong, X, Zhao, Y, Chen, L, et al. 2016. Catalytic wet air
oxidation of m-cresol over a surface-modified sewage sludge-derived carbonaceous catalyst.
Catal. Sci. Technol. 6(4):1085–1093. doi.org/10.1039/C5CY00900F.
Zapico, RR, Marín, P, Díez, F V & Ordóñez, S. 2015. Influence of operation conditions on the
copper-catalysed homogeneous wet oxidation of phenol : Development of a kinetic model.
Chemical Engineering Journal. 270:122–132.
Zarca, G, Ortiz, I & Urtiaga, A. 2015. Behaviour of 1-hexyl-3-methylimidazolium chloride-
supported ionic liquid membranes in the permeation of CO2, H2, CO and N2 single and mixed
gases. Desalination and Water Treatment. 56(13):3640–3646.
doi.org/10.1080/19443994.2014.978820.
Zhang, M, Dong, H & Geng, Z. 2019. Computational study of particle packing process and fluid
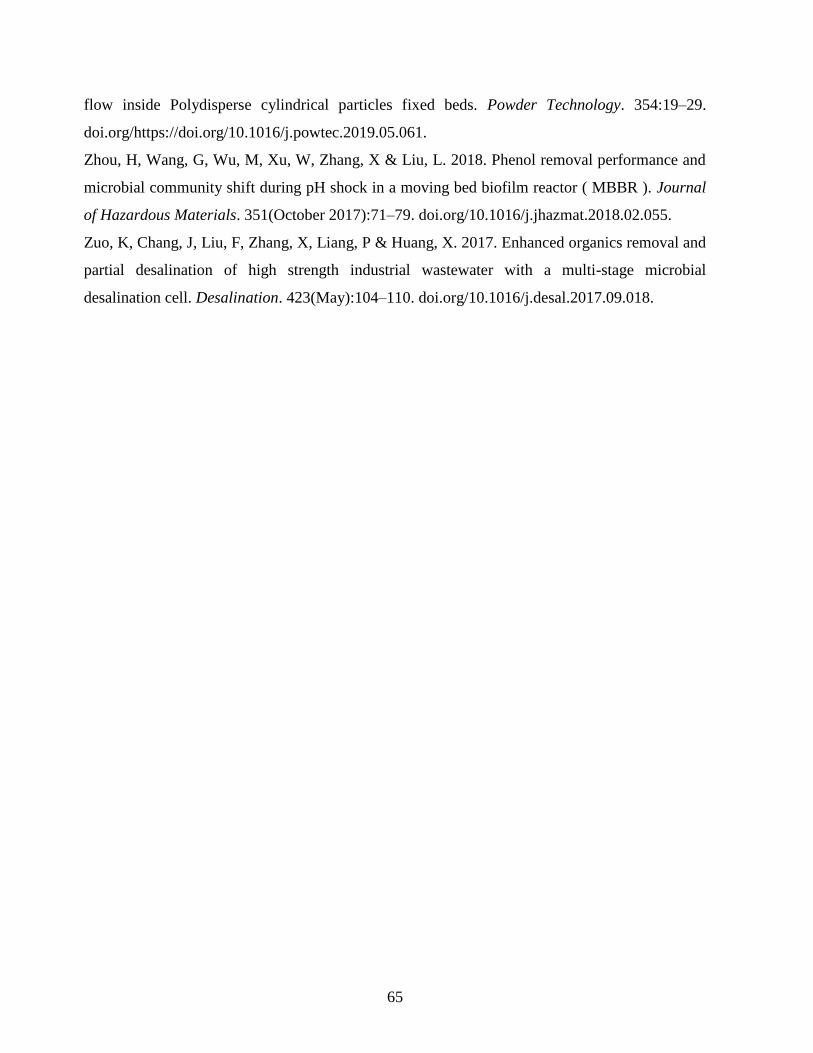
65
flow inside Polydisperse cylindrical particles fixed beds. Powder Technology. 354:19–29.
doi.org/https://doi.org/10.1016/j.powtec.2019.05.061.
Zhou, H, Wang, G, Wu, M, Xu, W, Zhang, X & Liu, L. 2018. Phenol removal performance and
microbial community shift during pH shock in a moving bed biofilm reactor ( MBBR ). Journal
of Hazardous Materials. 351(October 2017):71–79. doi.org/10.1016/j.jhazmat.2018.02.055.
Zuo, K, Chang, J, Liu, F, Zhang, X, Liang, P & Huang, X. 2017. Enhanced organics removal and
partial desalination of high strength industrial wastewater with a multi-stage microbial
desalination cell. Desalination. 423(May):104–110. doi.org/10.1016/j.desal.2017.09.018.
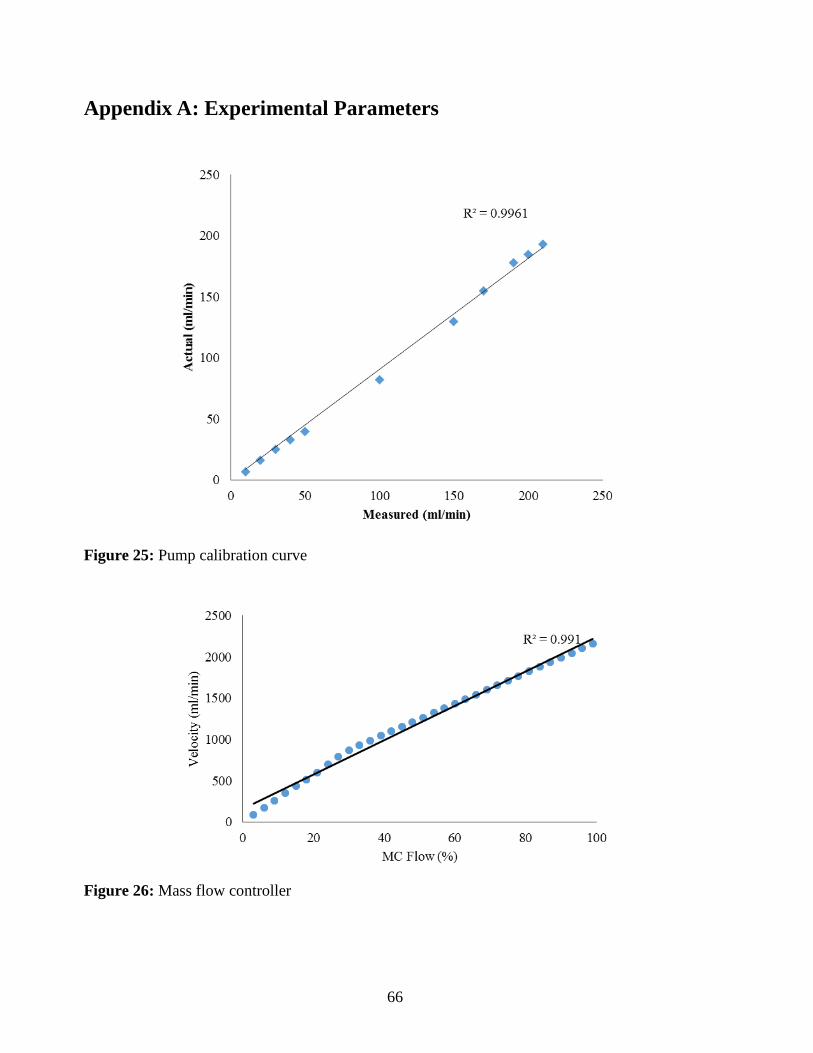
66
Appendix A: Experimental Parameters
Figure 25: Pump calibration curve
Figure 26: Mass flow controller
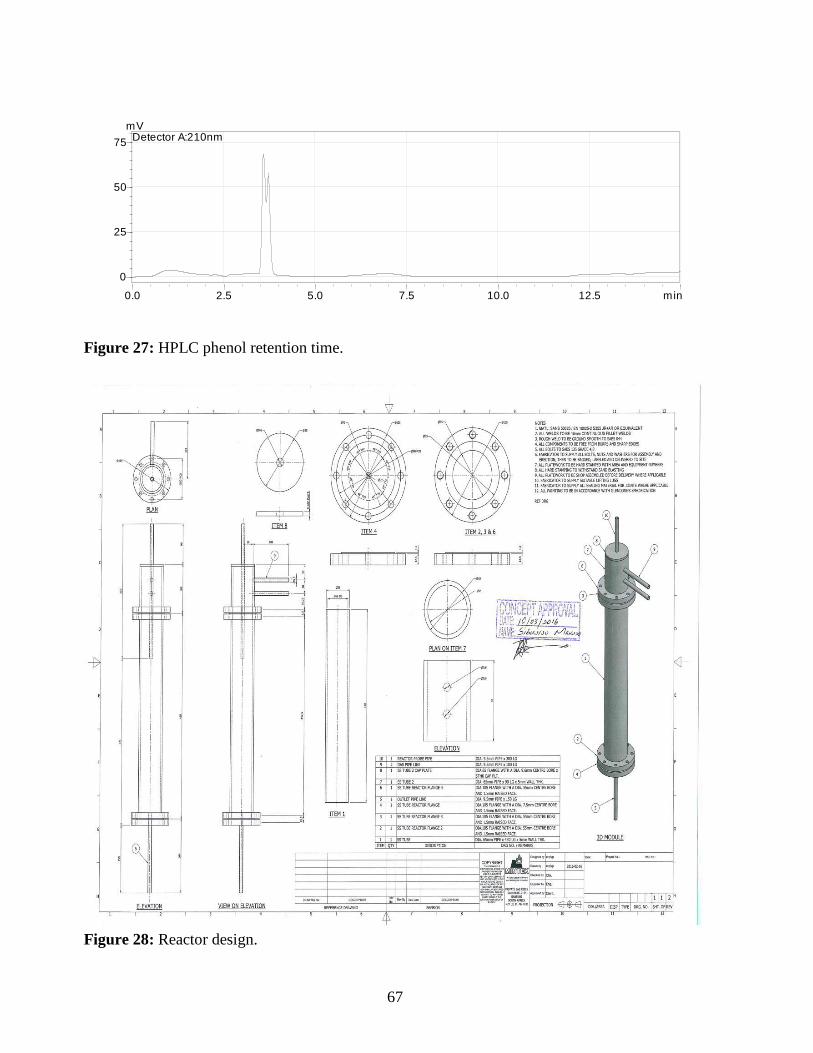
67
0.0 2.5 5.0 7.5 10.0 12.5 min
0
25
50
75
mVDetector A:210nm
Figure 27: HPLC phenol retention time.
Figure 28: Reactor design.