Embed Size (px)
Citation preview
KWR 2016.081 | September 2016
TKI Loop-closure Cleantech Playground
Local water and energy solutions

KWR 2016.081 | September 2016
TKI Loop-closure Cleantech Playground
KWR 2016.081 | September 2016
TKI Loop-closure Cleantech Playground
KWR 2016.081 | September 2016 © KWR
All rights reserved. No part of this publication may be reproduced, stored in an automatic database, or transmitted, in any form or by any means, be it electronic, mechanical, by photocopying, recording, or in any other manner, without the prior written permission of the publisher.
PO Box 1072 3430 BB Nieuwegein The Netherlands
T +31 (0)30 60 69 511 F +31 (0)30 60 61 165 E [email protected] I www.kwrwater.nl
TKI Loop-closure Cleantech
Playground
Local water and energy solutions
KWR 2016.081 | September 2016
Project number
400545
Project manager
Nellie Slaats
Client
TKI Watertechnology
Quality Assurance
Frank Oesterholt
Authors
Kees Roest, Patrick Smeets, Tessa van den Brand (KWR
Watercycle Research Institute), Hugo Cortial
(Metabolic) & Enna Klaversma (Waternet)
Sent to
This public report is send to the collaborating partners,
Waternet, Metablic, Advanced Waste Water Solutions &
KWR Watercycle Research Institute, and TKI
Watertechnology (www.tkiwatertechnologie.nl).
This activity is co-financed with TKI-funding from the Topconsortia for Knowledge &
Innovation (TKI’s) of the Ministry of Economic Affairs.
Year of publishing 2016 More information Dr. Ing. Kees Roest T +31 (0)30 606 95 31 E [email protected]

KWR 2016.081 | September 2016 2
TKI Loop-closure Cleantech Playground
KWR 2016.081 | September 2016 3
TKI Loop-closure Cleantech Playground
Summary
De Ceuvel in Amsterdam North is a former industrial plot that has been turned into a
sustainable urban development. The heavily polluted site features retrofitted houseboats as
offices, placed on land, surrounded by soil-cleaning plants. Because of the temporary
character of the site (it is rented for 10 years) and the polluted soil, the houseboats are not
connected to the sewer system. Instead they are provided with dry composting toilets and
individual biofilters for grey water treatment. The boats still use conventional delivered
drinking water. The primary goal of this pilot project, Cleantech Playground De Ceuvel, is to
achieve local loop-closure of cycles in the city by applying innovative concepts and
technological solutions. The performances of the water-related technology in particular, are
monitored in this TKI project and evaluated in order to show the applicability in a sustainable
circular economy. Self-sufficient neighbourhoods with their own, decentralised water supply
add to the image of the circular economy. Local production of drinking water is evaluated by
Life Cycle Assessment (LCA), Quantitative Microbial Risk Assessment (QMRA) and financial
aspects. The individual grey water treatment plants, consisting of a settling module and
biofilter module, as well as some other achievements of technology, like the applied
composting toilets and urine treatment are monitored. Beside assessment of technology
performance and development of new solutions for metropolitan areas, human aspects and
interactions between users and clean technologies are also studied, to understand how
communities can adapt to new systems and changes.
Composting toilets
Taking into account the goal of the research at De Ceuvel (local loop closure) and the lack of
a sewer connection, composting toilets are being used in the office boats, so the users have
to bring the faecal matter from the composting toilet periodically to a central composter.
After 11 months composting, the level of streptococci in the composter was reduced by log
1.9. This does not yet meet the WHO recommendation of log 6 reduction by composting.
Furthermore, user satisfaction regarding the composting toilets and the handling of human
excreta is low, while the costs are higher compared to other (conventional) sanitation
solutions. Application of composting toilets is not recommended in future developments.
Urine and nutrient recovery
Separately collected urine from the Café De Ceuvel was treated for nutrient recovery
resulting in the formation of struvite. Research was performed on enhancing the nutrient
content of struvite by using alternative nitrogen adsorbing materials (zeolite and biochar). In
pot tests, the nutrients in biochar-based fertiliser were shown to be less available than
zeolite-based fertilisers in the short-term. Urine was spiked with pharmaceuticals and
recovered fertilisers were applied on tomato plants. Nutritional value of the recovered
fertilisers was assessed through measures of plant growth. Uptake and accumulation of
pharmaceuticals were measured in the tomatoes. The concentration of pharmaceuticals in
tomatoes was below detection limits (0.02 mg/kg). These levels are far below the acceptable
daily intake (ADI), which is 1% of the minimum therapeutic dose.
Grey water treatment
Since the houseboats are used as offices they do not have showers or washing machines, so
only a minimum amount of five litres per capita per day is needed for drinking, food
preparation and personal hygiene, compared to the current average of 25 litres in
KWR 2016.081 | September 2016 4
TKI Loop-closure Cleantech Playground
conventional offices and 128 litres in households in The Netherlands (Pieterse-Quirijns et al.
2009). The produced grey water was treated in individual low-tech biofilters, consisting of
two pallet tanks filled with a mixture of gravel and sand, topped up with reed. The effluent
of the filters was monitored before it was infiltrated in the soil. The monitoring results
comply with the Dutch standards for individual wastewater treatment systems.
Life Cycle Assessment (LCA) of (de)centralised drinking water supply
A LCA study obtained information on the environmental impact of drinking water production
both in a centralised and decentralised scenario, specific for the operational aspects. The
goal of both scenarios is to produce drinking water according to Dutch quality standards.
For the centralised scenario the actual drinking water production at Weesperkarspel was
used as a model. For De Ceuvel the following treatment scheme was designed: 1) raw water
intake, 2) ultrafiltration, 3) nanofiltration, 4) UV disinfection and 5) remineralisation. The
environmental impact is expressed as Ecopoints1 for the production of 1m3 drinking water.
Although the absolute values itself are very low, the production of decentralised drinking
water has a higher environmental impact and corresponds to 0.104 Ecopoints. This is
approximately 25% more than the centralised situation (0.0762 Ecopoints). The difference
between these two scenarios becomes more significant (60%) when also the distribution
network is included in the calculation. The environmental impact is strongly affected by the
energy origin. Improvements in energy demand or (green) energy supply can be
implemented both at centralised and decentralised scale and as such there is no difference
in environmental impact. The fact that less drinking water is used at De Ceuvel does reduce
the environmental impact of operations. The impact of infrastructure, especially distribution,
is not affected by the use, since the momentary demand when opening a tap determines the
design of this infrastructure.
Quantitative Microbial Risk Assessment (QMRA) of decentralised drinking water supply
Water companies in the Netherlands perform quantitative microbial risk assessment (QMRA)
to verify that risk of infection is below 1 per 10,000 persons per year, which is the legal
requirement (Smeets et al., 2010). The QMRA for decentralised drinking water production at
De Ceuvel showed that it is possible to produce safe water in a decentralised system (risk of
7 infections per 100,000 persons). However, this requires advanced treatment technologies
and strict monitoring and maintenance. The latter may be challenging for consumers with
limited knowledge of health risks and applied technologies and results in high costs. Current
(online) monitoring technologies are not capable yet to guarantee continuous safety in an
independently operated decentralised system. Altogether, decentralised drinking water
production is not recommended.
Financial and legislative issues
To ensure that the drinking water quality is guaranteed, a comprehensive monitoring
program is needed, which will increase the costs, so it becomes difficult to still produce at
acceptable costs. Current quality monitoring regulations appear to make decentralised
drinking water production 3 to 10 fold more expensive compared to centralised drinking
water production. Legislation requires every Individual Wastewater Treatment (IWT) system
(15 small scale biofilters in the case of De Ceuvel) to be monitored 2 times per year on
effluent quality, but there is still no clear process and agreement for the stakeholders of De
Ceuvel project regarding who and how the quality monitoring of these systems should be
performed. When labour costs for operation and maintenance are minimized by the
deployment of volunteers in decentralised wastewater treatment, overall costs can be
comparable with centralised treatment, but such a comparison is not completely fair and
1 Thousand Ecopoints corresponds to the environmental impact of one Western European person per year.
KWR 2016.081 | September 2016 5
TKI Loop-closure Cleantech Playground
certainly not advisable from a risk point of view. Furthermore, the current costs for
centralised drinking water production and wastewater treatment includes several additional
aspects, like costs for environmental protection, research & development and additional tax.
User behaviour
Feedback from users on De Ceuvel allows for a better understanding of which aspects of the
clean technologies are problematic or satisfying. It is clear that the occurrence of
uncontrolled phenomena such as smells and flies are not acceptable for users. It breaches
the comfort level of conventional solutions they are used to. When solutions for each of
these issues are implemented, the users are as happy with the clean technologies as they are
with conventional systems. It can be concluded that a regular use of composting toilets is
not recommended in the Netherlands, because of discomfort of the users, higher costs and
the difficulty to safely reuse the compost. Taken into account the goal of the research at De
Ceuvel (local loop-closure) and the lack of a sewer connection, the previous choice for
composting toilets is understandable.
CONCLUSIONS
It can be concluded from this study that decentralised drinking water in an urban
environment as De Ceuvel, with a temporary office function, is less sustainable and more
costly than a centralised system and that the same level of safety cannot be guaranteed.
However, when connection to a centralised system isn’t possible or only at high cost,
decentralised solutions can provide an alternative. Decentralised drinking water treatment
systems generally have a higher energy requirement per cubic meter of water produced due
to the small scale. By reducing the amount of water used, the total use of energy and thus
environmental impact will be reduced. When sufficient, sustainable energy is available the
total environmental impact and total cost can remain low. For large scale systems, reduced
water use has limited effect since its costs and environmental impact depend more on the
fixed assets.
Individual wastewater treatment as performed on De Ceuvel is more costly than current
centralised wastewater treatment in The Netherlands. Nevertheless, grey water can be
treated with low-tech biofiltration in individual water treatment systems to achieve sufficient
water quality for discharge into the ground, based on Dutch regulation. The decentralised
system at De Ceuvel allows for direct reuse of resources by e.g. composting faeces and
recovering nutrients from urine. Composting of faecal matter in the Netherlands requires
over 11 months, after which streptococci reduction still did not meet WHO recommendations.
Short term experiments showed that urine-derived struvite is an excellent fertilizer. Struvite
from urine spiked with pharmaceuticals didn’t lead to detection of pharmaceuticals in
tomatoes. However the long-term effects of using urine-derived struvite-sorbent fertilisers on
soil quality should be investigated. Research should focus on uptake of contaminants by root
crops, such as carrots or radishes, and leafy vegetables, such as lettuces. The alternative of
using struvite to grow contaminated plant biomass as a feedstock for other purposes, such
as compost or animal feed should also be investigated for long term health risks. Struvite-
sorbent fertilisers could be developed further to optimize nutrient recovery from urine. Users
seem to accept these initiatives if the level of comfort is comparable to conventional systems.
Health and safety risks and related responsibilities for both water loop-closure and resource
recovery are points of concern for decentralised systems, which cannot be solved by
technology alone. New technologies need to address user behaviour and awareness to
achieve safe decentralised systems. Legal and institutional aspects regarding local water
treatment and loop-closure are under development and currently not always clear.
Technically local loop-closure is feasible, and technological developments can shift the
conditions at which decentralised systems are the preferred option in terms of costs and
KWR 2016.081 | September 2016 6
TKI Loop-closure Cleantech Playground
sustainability in the long term. Future research and experience with bigger, more
representative projects addressing technology and user behaviour can use and further
develop the decentralised concepts from the current study.
Overall, aspects that could be beneficially applied in future decentralised concepts can be
identified from this TKI project and currently include:
• Site specific risk- and sustainability assessment of decentralised systems and loop-
closure are needed to make appropriate choices for implementation.
• No decentralised drinking water production in an urban environment as De Ceuvel.
• No application of composting toilets, but more comfortable (new) sanitation solutions.
• Separated collection of wastewater streams and treatment has potential for e.g. direct
reuse of resources.
• There is interest in rainwater use for e.g. flushing toilets, gardening, showering, and
dish washers.
KWR 2016.081 | September 2016 7
TKI Loop-closure Cleantech Playground
Contents
Summary 3 Composting toilets 3 Urine and nutrient recovery 3 Grey water treatment 3 Life Cycle Assessment (LCA) of (de)centralised drinking
water supply 4 Quantitative Microbial Risk Assessment (QMRA) of
decentralised drinking water supply 4 Financial and legislative issues 4 User behaviour 5 CONCLUSIONS 5
Contents 7
1 Introduction 10 1.1 Circular economy 10 1.2 Colaborative project ‘TKI Loop-closure Cleantech
Playground’ 10 1.3 Goal 11 1.4 Approach 11 1.5 Structure 11
2 Cleantech Playground and wastewater
treatment 12 2.1 Introduction 12 2.2 The Cleantech Playground and De Ceuvel 12 2.3 Grey water treatment and monitoring 13 2.4 Composting toilets and processing of excreta 14 2.5 Urine and nutrient recovery 15
3 LCA: decentralised versus centralised drinking
water production 19 3.1 Introduction 19 3.2 Approach and methods 20 3.3 Results 25
4 Safe drinking water supply 32 4.1 Introduction to drinking water safety 32 4.2 Introduction to quantitative microbial risk
assessment 33 4.3 Centralised drinking water supply from surface
water 34 4.4 Decentralised drinking water supply from surface
water at De Ceuvel 34 4.5 Drinking water from grey wastewater at De Ceuvel 38

KWR 2016.081 | September 2016 8
TKI Loop-closure Cleantech Playground
4.6 Drinking water from harvested rainwater at De
Ceuvel 41 4.7 Conclusions on safety of local drinking water
supply options 43
5 Financial considerations, institutional aspects,
user and stakeholder experiences 44 5.1 Introduction 44 5.2 Financial considerations 44 5.3 Institutional aspects 47 5.4 User behaviour and satisfaction 53
6 Resume, recommendations and conclusions 60 6.1 Introduction 60 6.2 Resume 60 6.3 Recommendations 63 6.4 Conclusions 64
7 References 66
Appendix I Safe handling of dry toilet waste 70 • Conclusions and recommendations student
project (Academic Consultancy Training of
Wageningen University) 70 Conclusions 70 Recommendations 71
Appendix II Dutch regulation regarding Individual
Wastewater Treatment (IWT) 74
Appendix III Small-scale mobile wastewater treatment
system by AWWS 76 Introduction 76 Small-scale mobile wastewater treatment unit 76

KWR 2016.081 | September 2016 9
TKI Loop-closure Cleantech Playground
KWR 2016.081 | September 2016 10
TKI Loop-closure Cleantech Playground
1 Introduction
1.1 Circular economy
Cities consume natural resources. Energy and raw materials are consumed and waste is
produced. For more sustainable cities, it is necessary that water, food and energy are
produced as efficiently as possible. Renewable sources or reuse play an important role and
value elimination should be minimized in the system. The urban water cycle plays a crucial
role requiring resources for clean water production and treatment of wastewater, but also
containing resources such as essential nutrients for agriculture, energy, heat and water itself.
The urban water systems are currently linearly arranged from a systemic perspective.
Changing to an urban water cycle could lead to a more sustainable use of these resources.
The circular economy is an economic system that is designed to maximize reusability of
products and raw materials and minimize value destruction. This is different than in the
current linear system, in which raw materials are converted into products to be destroyed
after use. In the current system increasing urbanization leads to the deployment of raw
materials for the construction of urban infrastructure such as water supply and drainage
systems. In that perspective, the development of self-sufficient neighbourhoods with their
own, decentralised water supply add to the image of the circular economy. Currently, in the
Dutch water sector itself, several initiatives can be identified around the recovery and reuse
of energy and raw materials (such as phosphate) in centralized and decentralized systems.
1.2 Colaborative project ‘TKI Loop-closure Cleantech Playground’
This project was implemented within the Top Sector Water. Within the various Top Sectors
the government, entrepreneurs and scientists work together in so-called Topconsortia for
Knowledge and Innovation (TKI). This TKI project 'Loop-closure Cleantech Playground
Amsterdam' is part of the TKI Watertechnology programme and focuses on the water cycle of
De Ceuvel in Amsterdam North. The project is a typical TKI Watertechnology collaboration
with innovative water technology on the way to market launch in an innovative concept
(closure of cycles in practice), and with the business interacting with public organisations
and knowledge institutes. This offers advantages for all participating parties.
The company Advanced Waste Water Solutions is interested in the decentral concept and the
applicability of loop-closures in the urban environment. Therefore for them this project is a
nice demonstration. Metabolic has generated a lot of attention and work with the Cleantech
Playground (CTP) and for Waternet the CTP is a very suitable pilot location to investigate a
number of pressing questions, such as related to local drinking water production. KWR Water
Cycle Research Institute provides knowledge of the water cycle and (laboratory) research
facilities. This corresponds with the aim of KWR to bridge science to practice which can
result in the practical application of new technology. KWR connects the partners and ensures
the scientific component in this TKI project.
In this TKI project innovative Dutch technology is tested in practice. With a successful project
the concept and technology can not only be applied in the Netherlands but can be used
worldwide. Benefits and advantages will not only be achieved by the end user, but also the
environment and the position of the Dutch businesses improves.
KWR 2016.081 | September 2016 11
TKI Loop-closure Cleantech Playground
1.3 Goal
The primary goal of this project concerning a small-scale pilot in Amsterdam North is to
achieve closure of the cycle ‘as much as possible’ by applying innovative concepts and
technological solutions. The performance, of in particular water-related technology, was
monitored in this TKI project and evaluated in order to demonstrate the applicability in a
sustainable circular economy.
1.4 Approach The project combines innovative high-tech and low-tech installations, involves the (future) users/residents in the building process and the monitoring/evaluation of the concept and the technology and makes optimal use of waste materials. This is an example of a (future) sustainable circular economy. Local energy production (heat/electricity) and wastewater/organic waste treatment with nutrient recovery are applied. Research of the (im)possibilities of local drinking water production, including laws and regulations, is part of the project. There are several possible sources for local drinking water production; from rainwater and grey water, to local surface water. Health risks, sustainability aspects and financial consequences have been extensively investigated. Beside the study of technology performance and development of new solutions for metropolitan areas, human aspects and interactions between users and clean technologies are also studied, to understand how communities can adapt to new systems and changes. Additionally, new business models arising from integrated micro-utilities and institutional barriers are studied. In this way, the Cleantech Playground provides an ideal case for the circular re-development of metropolitan areas, through R&D activities in a real life environment.
1.5 Structure
A description of the Cleantech Playground and practical results of wastewater treatment are
given in Chapter 2. This includes the monitoring data from the individual grey water
treatment plants, consisting of a settling module and biofilter module, as well as some other
achievements of technology, like the applied composting toilets and urine treatment.
The sustainability aspects of centralised and decentralised drinking water production are
explored through Life Cycle Assessment (LCA). The results are described in Chapter 3.
In Chapter 4, the health risks of local drinking water production compared to the current
centralised drinking water production are considered. This is done using Quantitative
Microbial Risk Assessment (QMRA).
Financial considerations of local water treatment and loop-closure compared to the current
centralised water chain are provided in Chapter 5. Information about institutional aspects
related to local water treatment and local loop-closure, as well as user and stakeholder
experiences, including survey results about satisfaction of office renters on De Ceuvel are
discussed. At the end of the second project year a symposium about decentralised water and
energy solutions was organized. A short summary of the main findings of this symposium is
also given in Chapter 5.
Finally in Chapter 6 an overview of the results with the main conclusions of this TKI project,
including recommendations, are given.
KWR 2016.081 | September 2016 12
TKI Loop-closure Cleantech Playground
2 Cleantech Playground and wastewater treatment
2.1 Introduction
As a living lab, the Cleantech Playground (CTP) is a testing ground for innovative clean
technologies in the city center that aims to achieve sustainable cycle closure. The concept is
realized in Amsterdam North in two adjacent areas: a breeding ground for creative
entrepreneurs (De Ceuvel) with 16 offices, a restaurant and a biorefinery system in up-cycled
houseboats placed on land; and – not yet realised - a floating residential area for 47 families
(Schoonschip). Food production (partly under glass) is combined with decentralised power
generation, water treatment and processing of organic waste using innovative technology.
The first phase of development of De Ceuvel started in the spring of 2013 on a temporary
industrial area where offices are composed of recycled houseboats that are placed on land
for a period of ten years. De Ceuvel has been officially opened on June 21st 2014, while
Schoonschip is currently in the design phase and construction is projected to start in 2016.
This research focuses on the site of De Ceuvel.
2.2 The Cleantech Playground and De Ceuvel
De Ceuvel site in Amsterdam North is a former shipyard that was not used for years.
Nowadays completely renovated and insulated houseboats have been installed for a period
of 10 years. These houseboats are used as offices for a group of creative initiators. Due to
the temporary nature and the highly contaminated soil no underground infrastructure is
constructed. The boats have no gas and no sewage system. Instead, each boat has a heat
pump, solar panels, a dry composting toilet and a biofilter (small constructed wetland).
Offices are connected to the municipal power grid and drinking water supply, although
sustainable technologies ensure that the use of these common utilities is significantly lower
than in conventional offices. In addition, at the De Ceuvel site a cafe is situated, where urine
is collected separately. Centrally located on the grounds of the Cleantech Playground is a
composting plant, a struvite reactor and a greenhouse where vegetables are grown
potentially using the compost and struvite. The cafe has a conventional sewer connection
and water supply. TKI project 'Loop-closure Cleantech Playground' will focus on the water
cycle of the offices of De Ceuvel in Amsterdam.
The De Ceuvel project fits very well into the logic of decentralised micro-utilities, as the
community aims to achieve 100% renewable energy supply (heating and electricity), 100% on-
site wastewater and organic waste treatment and 100% on-site drinking water supply, with
the latter not realized due to legislative barriers. The CTP is a showcase location for applied
research and R & D. It provides space for testing and showcasing of new technologies that
are currently available or already on the market or close to market introduction, but which
are still not demand-driven integrated into new urban developments. New about this project
is the collaboration between public (research) organisations and private parties for testing
various ‘cleantech’ and socio-economic implications, by means of a real-life example in the
centre of Amsterdam, which shows how offices and homes can be newly built and rebuilt in a
circular city. Although De Ceuvel is a unique and temporary development, there are a wide
range of new applications for the used concepts and technologies. The CTP will be a
continuous laboratory for testing new technologies for further expansion and opportunities
in the circular economy. On De Ceuvel site, alternative solutions for water and energy
KWR 2016.081 | September 2016 13
TKI Loop-closure Cleantech Playground
management are investigated, focused on household and neighbourhood-scale systems with
low resource consumption and high nutrient recovery, combined with a strong and dynamic
community involvement. The developed and applied small-scale water purification and waste
(water) management systems, offer potential for further (inter)national valorisation.
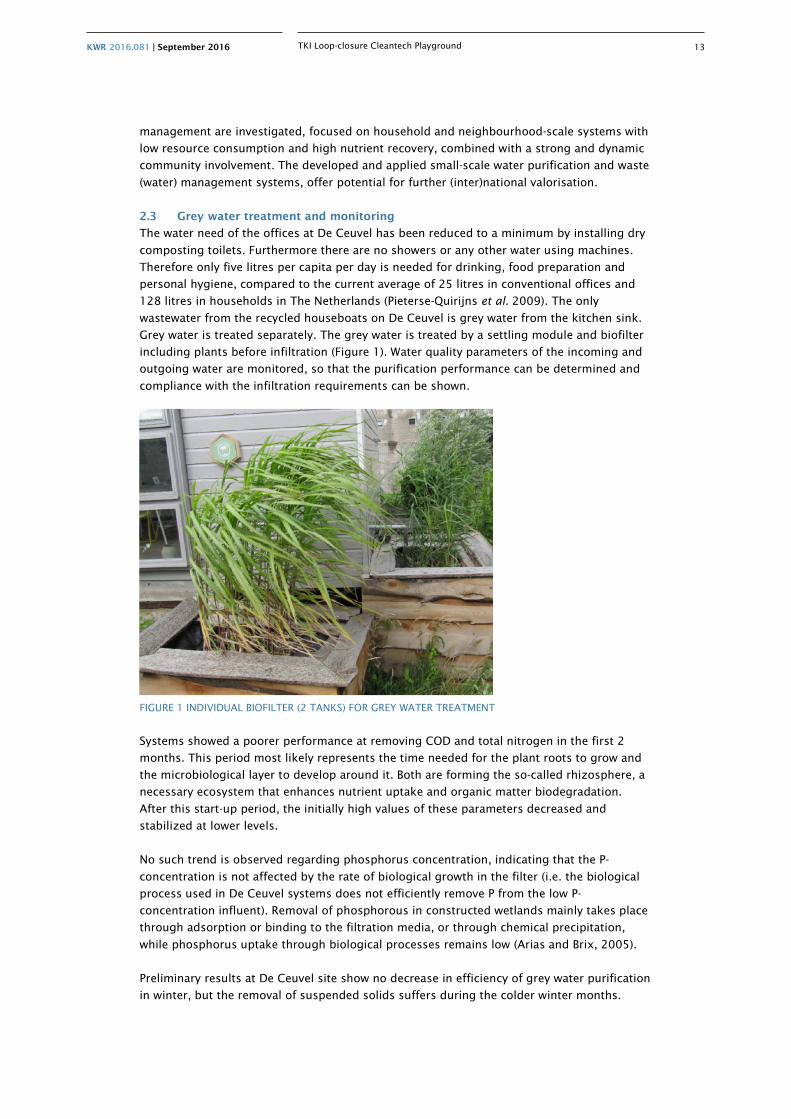
2.3 Grey water treatment and monitoring
The water need of the offices at De Ceuvel has been reduced to a minimum by installing dry
composting toilets. Furthermore there are no showers or any other water using machines.
Therefore only five litres per capita per day is needed for drinking, food preparation and
personal hygiene, compared to the current average of 25 litres in conventional offices and
128 litres in households in The Netherlands (Pieterse-Quirijns et al. 2009). The only
wastewater from the recycled houseboats on De Ceuvel is grey water from the kitchen sink.
Grey water is treated separately. The grey water is treated by a settling module and biofilter
including plants before infiltration (Figure 1). Water quality parameters of the incoming and
outgoing water are monitored, so that the purification performance can be determined and
compliance with the infiltration requirements can be shown.
FIGURE 1 INDIVIDUAL BIOFILTER (2 TANKS) FOR GREY WATER TREATMENT
Systems showed a poorer performance at removing COD and total nitrogen in the first 2
months. This period most likely represents the time needed for the plant roots to grow and
the microbiological layer to develop around it. Both are forming the so-called rhizosphere, a
necessary ecosystem that enhances nutrient uptake and organic matter biodegradation.
After this start-up period, the initially high values of these parameters decreased and
stabilized at lower levels.
No such trend is observed regarding phosphorus concentration, indicating that the P-
concentration is not affected by the rate of biological growth in the filter (i.e. the biological
process used in De Ceuvel systems does not efficiently remove P from the low P-
concentration influent). Removal of phosphorous in constructed wetlands mainly takes place
through adsorption or binding to the filtration media, or through chemical precipitation,
while phosphorus uptake through biological processes remains low (Arias and Brix, 2005).
Preliminary results at De Ceuvel site show no decrease in efficiency of grey water purification
in winter, but the removal of suspended solids suffers during the colder winter months.
KWR 2016.081 | September 2016 14
TKI Loop-closure Cleantech Playground
However, at this early stage it is not yet possible to definitively establish the impact of
temperature on the effectiveness of wastewater purification in biofilters. During the summer
phase of sampling, biofiltration was downstream of settling systems, located inside the
offices. These systems have been removed during fall 2014 (i.e. in between the summer and
winter sampling phases), because of (odour) nuisances they were causing. Thus, the removal
of these settling systems might have been the origin of the initial higher TSS levels reported
in the winter 2014 phase compared to those measured in the summer 2014. However,
already in spring 2015 lower TSS levels were detected again. Solids seepage from
surrounding soil in the sampling system, due to heavy precipitation during winter or
sampling variations of the grab samples might explain the measured variations.
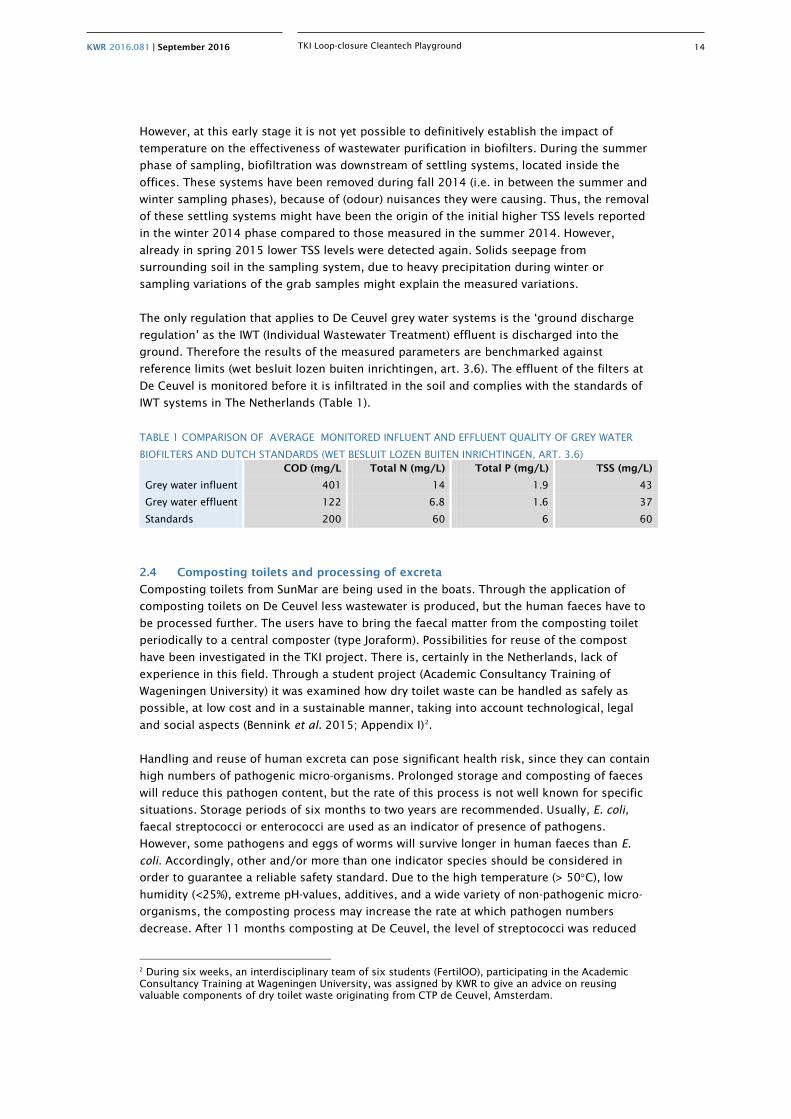
The only regulation that applies to De Ceuvel grey water systems is the ‘ground discharge
regulation’ as the IWT (Individual Wastewater Treatment) effluent is discharged into the
ground. Therefore the results of the measured parameters are benchmarked against
reference limits (wet besluit lozen buiten inrichtingen, art. 3.6). The effluent of the filters at
De Ceuvel is monitored before it is infiltrated in the soil and complies with the standards of
IWT systems in The Netherlands (Table 1).
TABLE 1 COMPARISON OF AVERAGE MONITORED INFLUENT AND EFFLUENT QUALITY OF GREY WATER
BIOFILTERS AND DUTCH STANDARDS (WET BESLUIT LOZEN BUITEN INRICHTINGEN, ART. 3.6) COD (mg/L Total N (mg/L) Total P (mg/L) TSS (mg/L)
Grey water influent 401 14 1.9 43
Grey water effluent 122 6.8 1.6 37
Standards 200 60 6 60
2.4 Composting toilets and processing of excreta
Composting toilets from SunMar are being used in the boats. Through the application of
composting toilets on De Ceuvel less wastewater is produced, but the human faeces have to
be processed further. The users have to bring the faecal matter from the composting toilet
periodically to a central composter (type Joraform). Possibilities for reuse of the compost
have been investigated in the TKI project. There is, certainly in the Netherlands, lack of
experience in this field. Through a student project (Academic Consultancy Training of
Wageningen University) it was examined how dry toilet waste can be handled as safely as
possible, at low cost and in a sustainable manner, taking into account technological, legal
and social aspects (Bennink et al. 2015; Appendix I)2.
Handling and reuse of human excreta can pose significant health risk, since they can contain
high numbers of pathogenic micro-organisms. Prolonged storage and composting of faeces
will reduce this pathogen content, but the rate of this process is not well known for specific
situations. Storage periods of six months to two years are recommended. Usually, E. coli,
faecal streptococci or enterococci are used as an indicator of presence of pathogens.
However, some pathogens and eggs of worms will survive longer in human faeces than E.
coli. Accordingly, other and/or more than one indicator species should be considered in
order to guarantee a reliable safety standard. Due to the high temperature (> 50°C), low
humidity (<25%), extreme pH-values, additives, and a wide variety of non-pathogenic micro-
organisms, the composting process may increase the rate at which pathogen numbers
decrease. After 11 months composting at De Ceuvel, the level of streptococci was reduced
2 During six weeks, an interdisciplinary team of six students (FertilOO), participating in the Academic Consultancy Training at Wageningen University, was assigned by KWR to give an advice on reusing valuable components of dry toilet waste originating from CTP de Ceuvel, Amsterdam.
KWR 2016.081 | September 2016 15
TKI Loop-closure Cleantech Playground
by log 1.9. This does not yet meet the WHO recommendation of log 6 reduction by
composting (WHO 2006).
The study suggested a change to vermicomposting at De Ceuvel (Bennink et al. 2015). With
'vermicomposting’, in which worms are used in the process, the amount of pathogens can be
reduced faster, providing a good soil conditioner. For optimum composting the C/N-ratio of
the starting material should be about 25. In general, it is advised for human faeces to be
composted for at least 2 years and urine should be stored for at least 3 months, with a
maximum of 6 months, for safe operation. Urine is in principle a high-grade fertiliser, and
can be obtained separate from faeces by means of a urine separating toilet.
Vermicomposting and urine separation in the houseboats has not been implemented at De
Ceuvel due to some practical limitations.
Practical experience was gained at De Ceuvel site with composting toilets that are used on a
daily basis in offices, processing excreta without use of flushing water. However, these
toilets are non-separating toilets (i.e. urine is mixed with faeces) and residual liquid in the
unit needs to be evaporated. These toilets have either natural or electrical ventilation, which
sometimes is not sufficient to evaporate residual liquid, especially for offices that are used
intensively. Thus, a solution for this potentially contaminated stream of residual liquid is
required, even though flows remain low: most of the offices do not even require toilet liquid
drain (drainage pipe was still dry 6 months after the toilet was first in use) while the
production of residual liquid is estimated to a maximum of 1 litre per week in the other
offices. Based on literature research and advice of composting toilets suppliers, the solution
installed on De Ceuvel site for processing the liquid drain of these toilets is
evapotranspiration beds. In this bed, built with sand and gravel, residual liquid is contained
in the soil within a waterproof plastic liner pond, while roots of specific bushes and plants
take up nutrients, the excess liquid is either evaporated or transpirated by the plants. On De
Ceuvel site, each of the offices has been provided with this technical solution to prevent any
seepage of residual liquid into the ground(water).
There are no Dutch regulations on composting of human waste. However for comparable
flows like sewage and livestock manure there is legislation, with the restriction that sewage
sludge is not being used as fertiliser in the Netherlands. Use of manure is allowed, but the
legislation is focused on the maximum amount of heavy metals and micro-contamination,
not on the presence of pathogens. The latter should certainly be considered as a concern
when using compost from faeces, because there are clear risks of contamination and
infection. Tenants on De Ceuvel are committed and feel responsible for their dry composting
toilets, but are generally not well informed of the risks inherent in the processing of human
waste (compost). Clear instructions and communication are certainly needed. Moreover, the
current composting tumbler is next to the cafe, leaving tenants embarrassed while dropping
off their dry faeces. This may be solved by placing the installation in a different location.
Because of the lack of legislation and regulation, and the clear risks, reusing dry faeces is
not recommended at this moment. However, by experimenting, it is possible to find out if
something works and the CTP is a suitable location to investigate this further.
2.5 Urine and nutrient recovery
One of the largest obstacles to the direct use of urine as a fertiliser is the presence of
pharmaceutical micro-pollutants, which are excreted in human urine. Application of urine to
crops causes the risk of accumulation of these micro-pollutants in agricultural soils and
uptake into edible crops. Phosphate (P) recovery by struvite precipitation excludes the
majority of micro-pollutants (Escher et al. 2006), but also the majority of available N.
KWR 2016.081 | September 2016 16
TKI Loop-closure Cleantech Playground
Approximately 100 million tons NH3-N per year is produced by the energy intensive Haber-
Bosch process, accounting for 2% of the world’s energy use and resulting in a drastic
imbalance of the natural N cycle. It is therefore equally urgent to recycle the reactive N
available in waste streams as it is to recover the P. The ratio of N to P in urine is
approximately 30:1, but only 1:1 in struvite, so other techniques are needed to supplement
N recovery. Clinoptilolite zeolite, purchased from Zeolite Products (Lireweg 5, 7051 HW
Varsseveld, Netherlands) and biochar, purchased from Sonnenerde (Oberwarterstraße 100,
7422 Riedlingsdorf, Austria) were used for adsorption experiments (Hammerton 2016).
Clinoptilolite zeolite is a naturally occurring volcanic rock, whose chemical properties make
it able to interact electrostatically with NH4
+. Biochar is an alternative to zeolite, produced out
of organic material. Both zeolite and biochar have application as soil conditioners, as their
porosity results in improved water retention. Furthermore, biochar addition to soils is a
possible carbon sequestration technique. However, the use of these materials also is also
risking the uptake of pharmaceutical micro-pollutants present in urine.
Pure urine from a waterless urinal at Café De Ceuvel was stored in two 100 L buffer tanks.
Nutrients were recovered from the urine using struvite (MgNH4PO
4.6H
2O) precipitation and
adsorbent materials (clinoptilolite zeolite and biochar) to generate fertilisers that were used
for production of tomatoes. Urine was pumped from the second buffer tank to the struvite
reactor after several days. Magnesium chloride was used for struvite precipitation.
In January 2015, struvite was legalized as a fertiliser in the Netherlands in an amendment to
the “Uitvoeringsbesluit Meststoffenwet”, with the restriction that the required micro-pollutant
limits for fertilisers are not exceeded. In this study pharmaceutical micro-pollutants
(carbamazepine (> 98%), (±)-propranolol-HCl (≥ 99%), diclofenac sodium (> 98%),
sulfamethoxazole (> 98%) and ibuprofen (> 98%)), obtained from Sigma Aldrich, were added
to the urine stream based on toxic potency and molar predicted urine concentrations (PUC),
calculated by Escher et al. (2006). Subsequently struvite crystallization was carried out in a
column reactor, using 25 L spiked urine and 32% MgCl2(aq.) in volumes determined by the
urine P concentration in Mg:P ratios shown in Table 2. For N sorption experiments,
subsequently 300 g zeolite or biochar was added to the reactor.
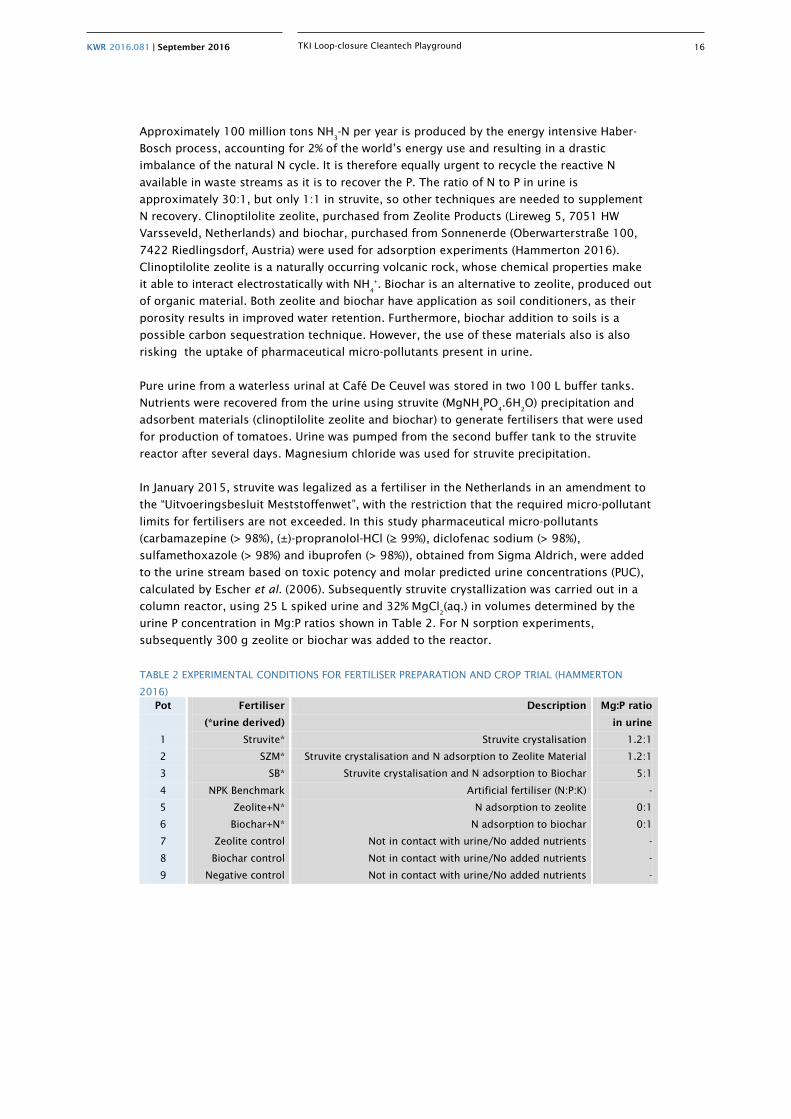
TABLE 2 EXPERIMENTAL CONDITIONS FOR FERTILISER PREPARATION AND CROP TRIAL (HAMMERTON
2016) Pot Fertiliser
(*urine derived)
Description Mg:P ratio
in urine
1 Struvite* Struvite crystalisation 1.2:1
2 SZM* Struvite crystalisation and N adsorption to Zeolite Material 1.2:1
3 SB* Struvite crystalisation and N adsorption to Biochar 5:1
4 NPK Benchmark Artificial fertiliser (N:P:K) -
5 Zeolite+N* N adsorption to zeolite 0:1
6 Biochar+N* N adsorption to biochar 0:1
7 Zeolite control Not in contact with urine/No added nutrients -
8 Biochar control Not in contact with urine/No added nutrients -
9 Negative control Not in contact with urine/No added nutrients -
KWR 2016.081 | September 2016 17
TKI Loop-closure Cleantech Playground
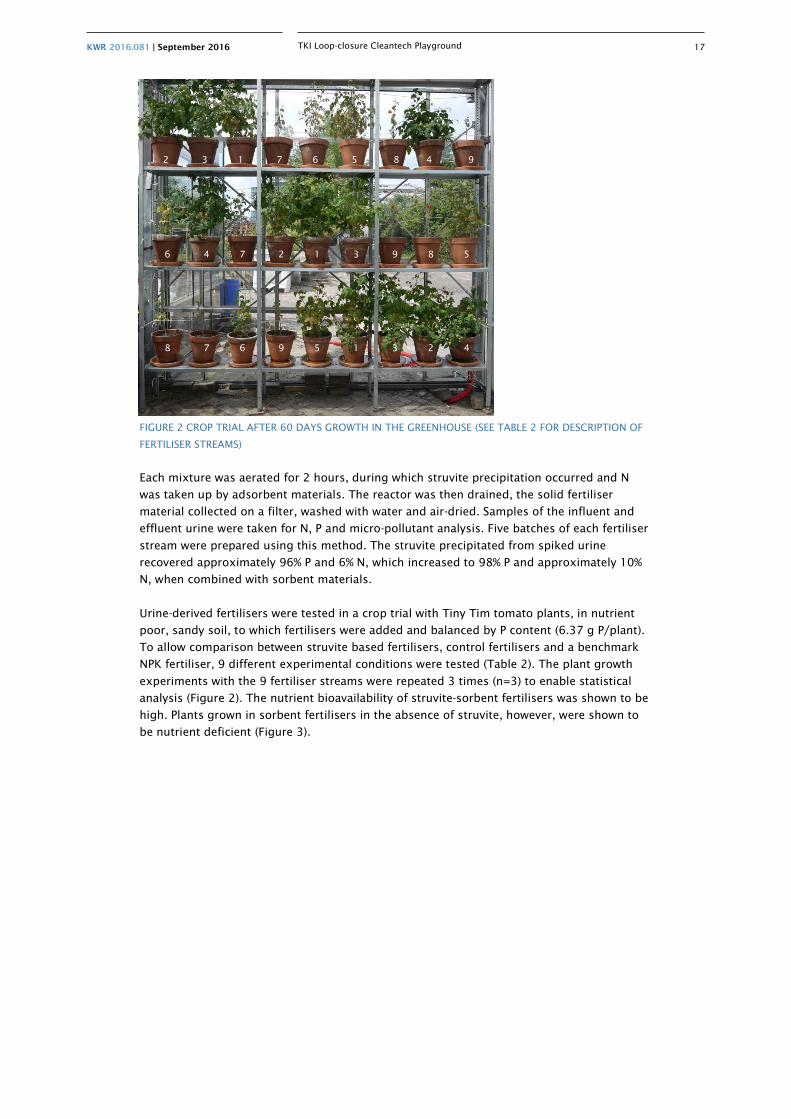
FIGURE 2 CROP TRIAL AFTER 60 DAYS GROWTH IN THE GREENHOUSE (SEE TABLE 2 FOR DESCRIPTION OF
FERTILISER STREAMS)
Each mixture was aerated for 2 hours, during which struvite precipitation occurred and N
was taken up by adsorbent materials. The reactor was then drained, the solid fertiliser
material collected on a filter, washed with water and air-dried. Samples of the influent and
effluent urine were taken for N, P and micro-pollutant analysis. Five batches of each fertiliser
stream were prepared using this method. The struvite precipitated from spiked urine
recovered approximately 96% P and 6% N, which increased to 98% P and approximately 10%
N, when combined with sorbent materials.
Urine-derived fertilisers were tested in a crop trial with Tiny Tim tomato plants, in nutrient
poor, sandy soil, to which fertilisers were added and balanced by P content (6.37 g P/plant).
To allow comparison between struvite based fertilisers, control fertilisers and a benchmark
NPK fertiliser, 9 different experimental conditions were tested (Table 2). The plant growth
experiments with the 9 fertiliser streams were repeated 3 times (n=3) to enable statistical
analysis (Figure 2). The nutrient bioavailability of struvite-sorbent fertilisers was shown to be
high. Plants grown in sorbent fertilisers in the absence of struvite, however, were shown to
be nutrient deficient (Figure 3).
2 3 1 7 6 5 8 4 9
6 4 7 2 1 3 9 8 5
8 7 6 9 5 1 3 2 4
KWR 2016.081 | September 2016 18
TKI Loop-closure Cleantech Playground
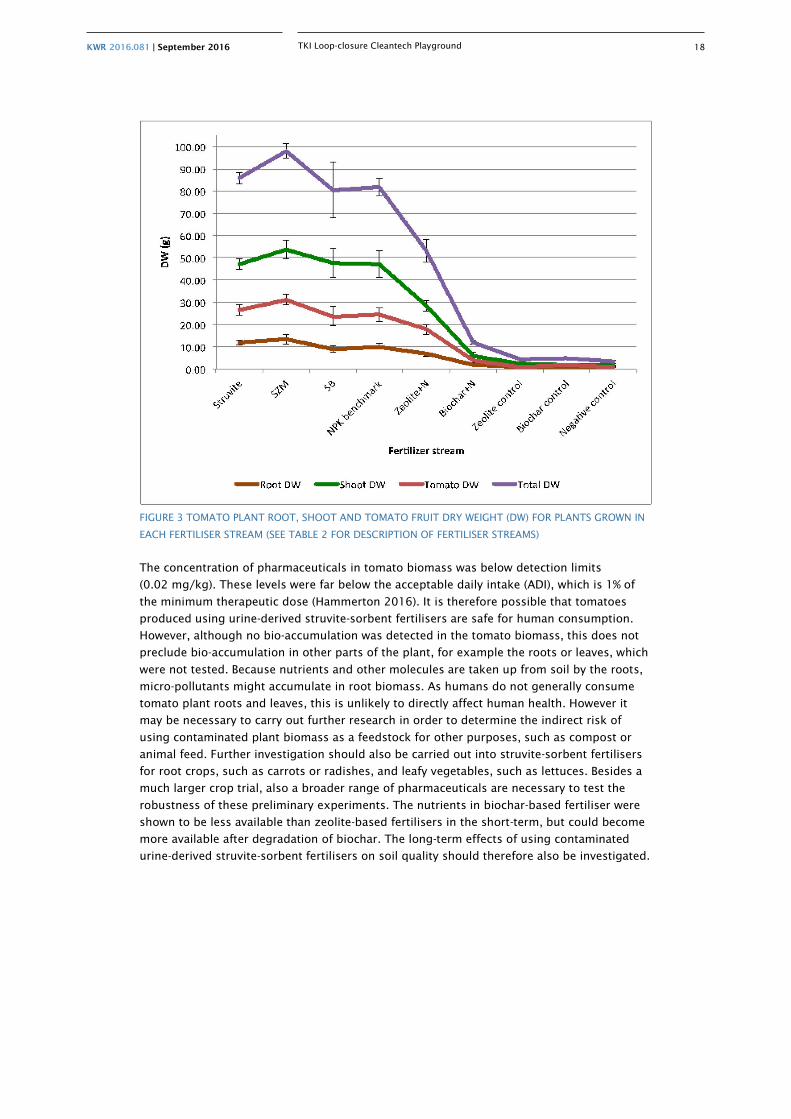
FIGURE 3 TOMATO PLANT ROOT, SHOOT AND TOMATO FRUIT DRY WEIGHT (DW) FOR PLANTS GROWN IN
EACH FERTILISER STREAM (SEE TABLE 2 FOR DESCRIPTION OF FERTILISER STREAMS)
The concentration of pharmaceuticals in tomato biomass was below detection limits
(0.02 mg/kg). These levels were far below the acceptable daily intake (ADI), which is 1% of
the minimum therapeutic dose (Hammerton 2016). It is therefore possible that tomatoes
produced using urine-derived struvite-sorbent fertilisers are safe for human consumption.
However, although no bio-accumulation was detected in the tomato biomass, this does not
preclude bio-accumulation in other parts of the plant, for example the roots or leaves, which
were not tested. Because nutrients and other molecules are taken up from soil by the roots,
micro-pollutants might accumulate in root biomass. As humans do not generally consume
tomato plant roots and leaves, this is unlikely to directly affect human health. However it
may be necessary to carry out further research in order to determine the indirect risk of
using contaminated plant biomass as a feedstock for other purposes, such as compost or
animal feed. Further investigation should also be carried out into struvite-sorbent fertilisers
for root crops, such as carrots or radishes, and leafy vegetables, such as lettuces. Besides a
much larger crop trial, also a broader range of pharmaceuticals are necessary to test the
robustness of these preliminary experiments. The nutrients in biochar-based fertiliser were
shown to be less available than zeolite-based fertilisers in the short-term, but could become
more available after degradation of biochar. The long-term effects of using contaminated
urine-derived struvite-sorbent fertilisers on soil quality should therefore also be investigated.
KWR 2016.081 | September 2016 19
TKI Loop-closure Cleantech Playground
3 LCA: decentralised versus centralised drinking water production
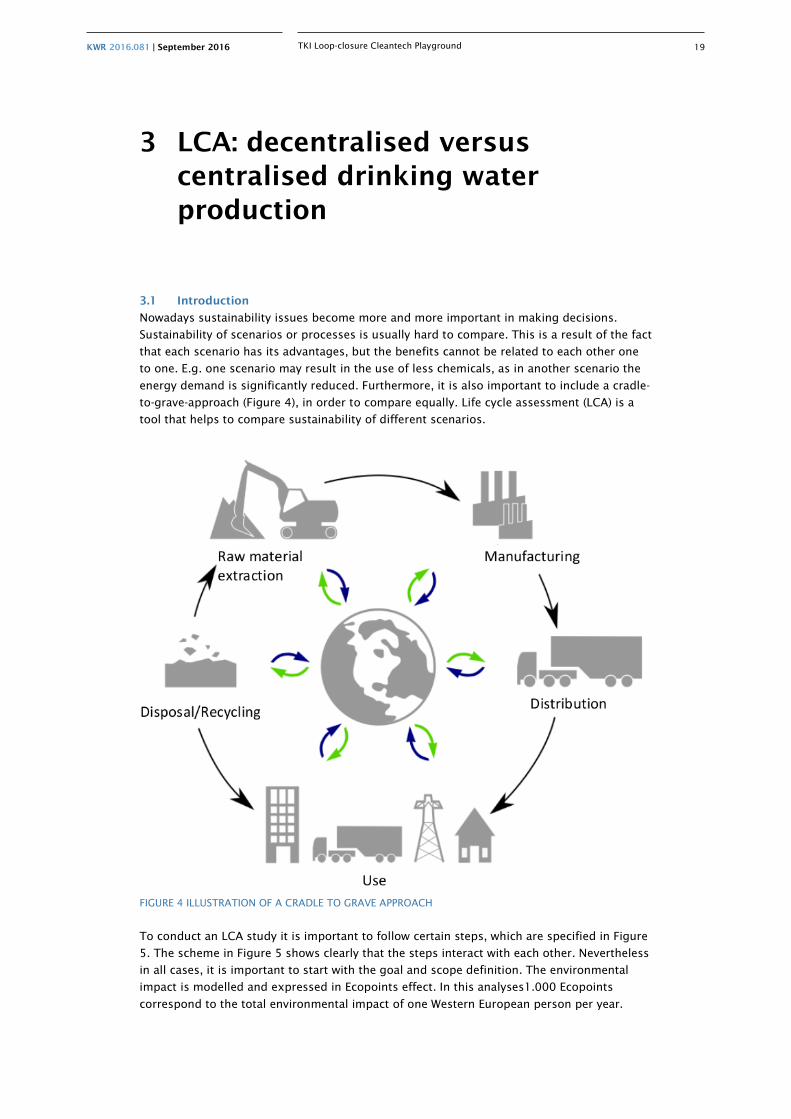
3.1 Introduction
Nowadays sustainability issues become more and more important in making decisions.
Sustainability of scenarios or processes is usually hard to compare. This is a result of the fact
that each scenario has its advantages, but the benefits cannot be related to each other one
to one. E.g. one scenario may result in the use of less chemicals, as in another scenario the
energy demand is significantly reduced. Furthermore, it is also important to include a cradle-
to-grave-approach (Figure 4), in order to compare equally. Life cycle assessment (LCA) is a
tool that helps to compare sustainability of different scenarios.
FIGURE 4 ILLUSTRATION OF A CRADLE TO GRAVE APPROACH
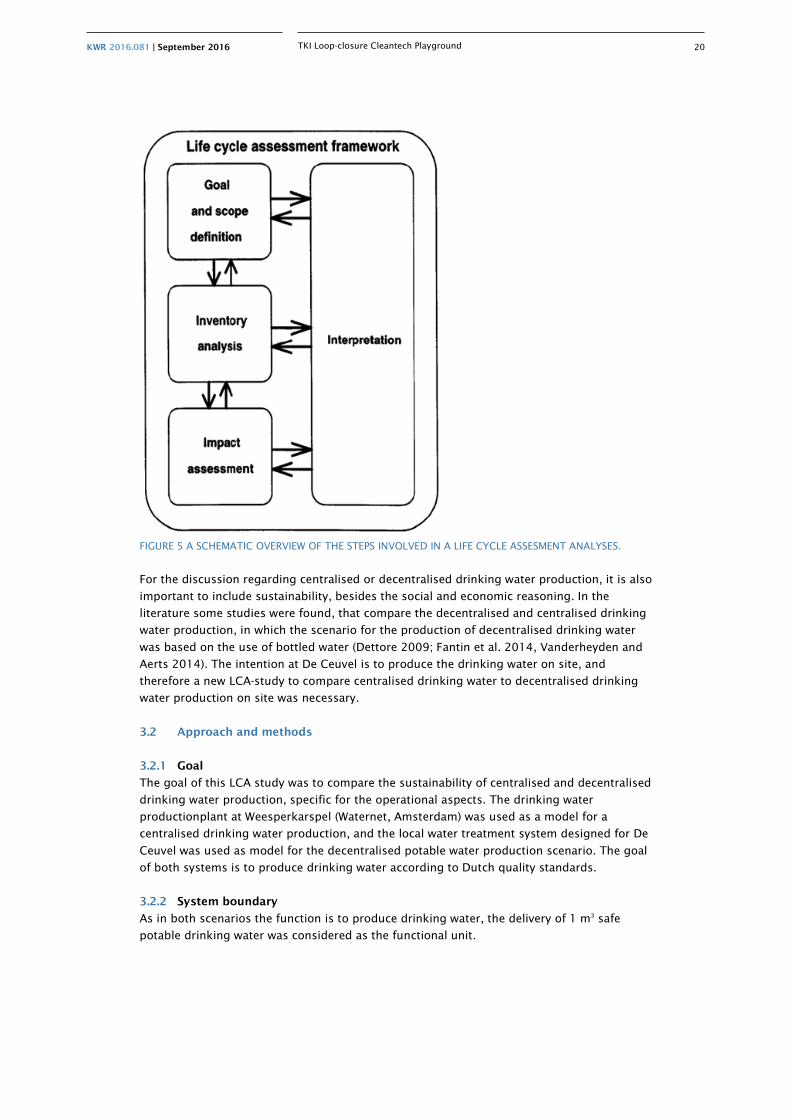
To conduct an LCA study it is important to follow certain steps, which are specified in Figure
5. The scheme in Figure 5 shows clearly that the steps interact with each other. Nevertheless
in all cases, it is important to start with the goal and scope definition. The environmental
impact is modelled and expressed in Ecopoints effect. In this analyses1.000 Ecopoints
correspond to the total environmental impact of one Western European person per year.
KWR 2016.081 | September 2016 20
TKI Loop-closure Cleantech Playground
FIGURE 5 A SCHEMATIC OVERVIEW OF THE STEPS INVOLVED IN A LIFE CYCLE ASSESMENT ANALYSES.
For the discussion regarding centralised or decentralised drinking water production, it is also
important to include sustainability, besides the social and economic reasoning. In the
literature some studies were found, that compare the decentralised and centralised drinking
water production, in which the scenario for the production of decentralised drinking water
was based on the use of bottled water (Dettore 2009; Fantin et al. 2014, Vanderheyden and
Aerts 2014). The intention at De Ceuvel is to produce the drinking water on site, and
therefore a new LCA-study to compare centralised drinking water to decentralised drinking
water production on site was necessary.
3.2 Approach and methods
3.2.1 Goal
The goal of this LCA study was to compare the sustainability of centralised and decentralised
drinking water production, specific for the operational aspects. The drinking water
productionplant at Weesperkarspel (Waternet, Amsterdam) was used as a model for a
centralised drinking water production, and the local water treatment system designed for De
Ceuvel was used as model for the decentralised potable water production scenario. The goal
of both systems is to produce drinking water according to Dutch quality standards.
3.2.2 System boundary
As in both scenarios the function is to produce drinking water, the delivery of 1 m3 safe
potable drinking water was considered as the functional unit.

KWR 2016.081 | September 2016 21
TKI Loop-closure Cleantech Playground
Functional unit: delivery of 1m3 drinking water
For De Ceuvel a usage of a few m3 per day of drinking water is expected. In case De Ceuvel is
enlarged, the potable water requirements will increase. Nevertheless, the impact of each
parameter is in the same order of magnitude, similar for each produced m3 potable water.
Therefore, the comparison between centralised and decentralised drinking water production,
which is based on the production of 1 m3 drinking water, remains equal.
The total requirements for the production of drinking water in both scenarios were
considered. The schemes of included units are given in the “required data” paragraph.
As only the effect of operational sustainability was taken into account, only consumables of
one year were included. Therefore, the pipes, tanks and housing, for instance, were not
included in the study.
3.2.3 Inventory data
For the analyses of this LCA study the SimaPro 8 software was used, combined with the
EcoInvent 3.0 database. For calculations the ReCiPe Endpoint € V1.10 / Europe ReCiPe E/A
was applied. If no data specific for the Netherlands were available in the EcoInvent 3.0
database, the following order was applied: Rer (rest of Europe), Ch (Switzerland) and then
RoW (Rest of the world).
Centralised drinking water production at Weesperkarspel
Centralised drinking water production at Weesperkarspel consists of two main treatment
processes. It is first pretreated at Loenderveen, according to the scheme presented as Figure
6, thereafter it is transported to Weesperkarspel. At Weesperkarspel other processes are
applied to complete drinking water production. These processes are presented in Figure 7.
FIGURE 6 SCHEMATIC OVERVIEW OF PRETREATMENT AT LOENDERVEEN
FIGURE 7 SCHEMATIC OVERVIEW OF DRINKING WATER PRODUCTION AT WEESPERKARSPEL
The data used for LCA analyses of the centralised drinking water treatment as performed at
Weesperkarspel are presented in Table 3. It includes both the original data and the
normalised values.
KWR 2016.081 | September 2016 22
TKI Loop-closure Cleantech Playground
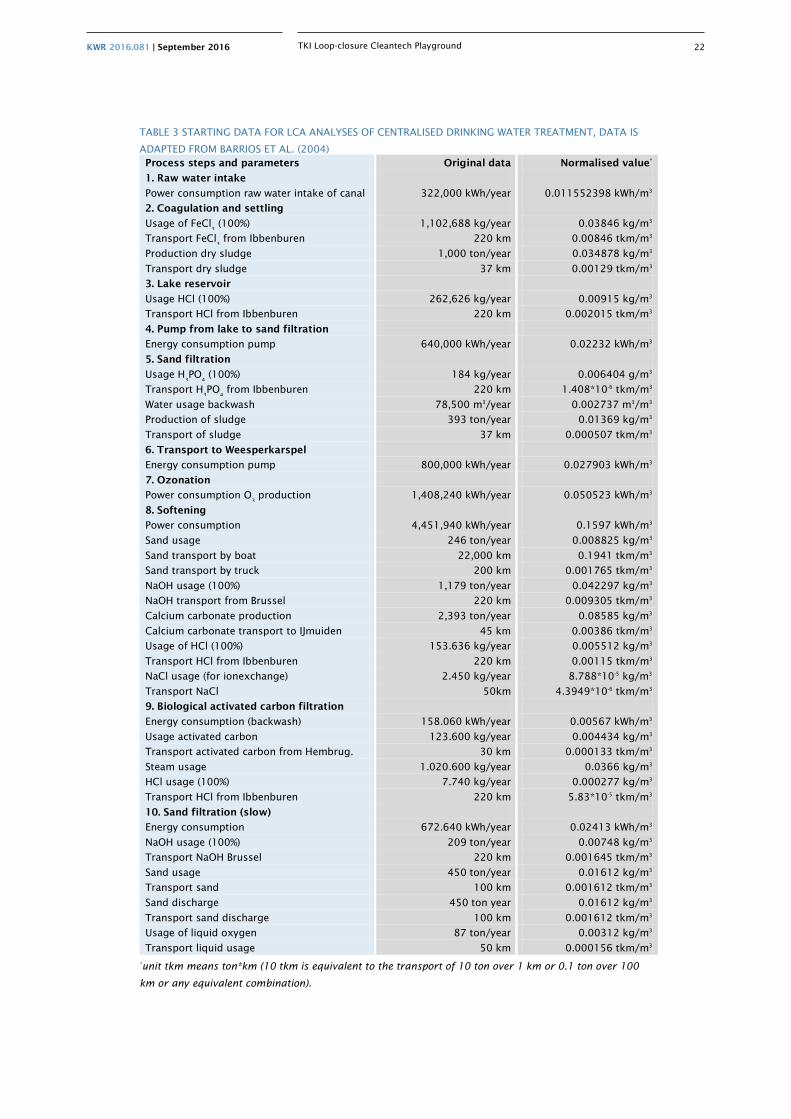
TABLE 3 STARTING DATA FOR LCA ANALYSES OF CENTRALISED DRINKING WATER TREATMENT, DATA IS
ADAPTED FROM BARRIOS ET AL. (2004) Process steps and parameters Original data Normalised value*
1. Raw water intake
Power consumption raw water intake of canal 322,000 kWh/year 0.011552398 kWh/m3
2. Coagulation and settling
Usage of FeCl3 (100%) 1,102,688 kg/year 0.03846 kg/m3
Transport FeCl3 from Ibbenburen 220 km 0.00846 tkm/m3
Production dry sludge 1,000 ton/year 0.034878 kg/m3
Transport dry sludge 37 km 0.00129 tkm/m3
3. Lake reservoir
Usage HCl (100%) 262,626 kg/year 0.00915 kg/m3
Transport HCl from Ibbenburen 220 km 0.002015 tkm/m3
4. Pump from lake to sand filtration
Energy consumption pump 640,000 kWh/year 0.02232 kWh/m3
5. Sand filtration
Usage H3PO
4 (100%) 184 kg/year 0.006404 g/m3
Transport H3PO
4 from Ibbenburen 220 km 1.408*10-6 tkm/m3
Water usage backwash 78,500 m3/year 0.002737 m3/m3
Production of sludge 393 ton/year 0.01369 kg/m3
Transport of sludge 37 km 0.000507 tkm/m3
6. Transport to Weesperkarspel
Energy consumption pump 800,000 kWh/year 0.027903 kWh/m3
7. Ozonation
Power consumption O3 production 1,408,240 kWh/year 0.050523 kWh/m3
8. Softening
Power consumption 4,451,940 kWh/year 0.1597 kWh/m3
Sand usage 246 ton/year 0.008825 kg/m3
Sand transport by boat 22,000 km 0.1941 tkm/m3
Sand transport by truck 200 km 0.001765 tkm/m3
NaOH usage (100%) 1,179 ton/year 0.042297 kg/m3
NaOH transport from Brussel 220 km 0.009305 tkm/m3
Calcium carbonate production 2,393 ton/year 0.08585 kg/m3
Calcium carbonate transport to IJmuiden 45 km 0.00386 tkm/m3
Usage of HCl (100%) 153.636 kg/year 0.005512 kg/m3
Transport HCl from Ibbenburen 220 km 0.00115 tkm/m3
NaCl usage (for ionexchange) 2.450 kg/year 8.788*10-5 kg/m3
Transport NaCl 50km 4.3949*10-6 tkm/m3
9. Biological activated carbon filtration
Energy consumption (backwash) 158.060 kWh/year 0.00567 kWh/m3
Usage activated carbon 123.600 kg/year 0.004434 kg/m3
Transport activated carbon from Hembrug.
30 km 0.000133 tkm/m3
Steam usage 1.020.600 kg/year 0.0366 kg/m3
HCl usage (100%) 7.740 kg/year 0.000277 kg/m3
Transport HCl from Ibbenburen 220 km 5.83*10-5 tkm/m3
10. Sand filtration (slow)
Energy consumption 672.640 kWh/year 0.02413 kWh/m3
NaOH usage (100%) 209 ton/year 0.00748 kg/m3
Transport NaOH Brussel 220 km 0.001645 tkm/m3
Sand usage 450 ton/year 0.01612 kg/m3
Transport sand 100 km 0.001612 tkm/m3
Sand discharge 450 ton year 0.01612 kg/m3
Transport sand discharge 100 km 0.001612 tkm/m3
Usage of liquid oxygen 87 ton/year 0.00312 kg/m3
Transport liquid usage 50 km 0.000156 tkm/m3 *unit tkm means ton*km (10 tkm is equivalent to the transport of 10 ton over 1 km or 0.1 ton over 100
km or any equivalent combination).
KWR 2016.081 | September 2016 23
TKI Loop-closure Cleantech Playground
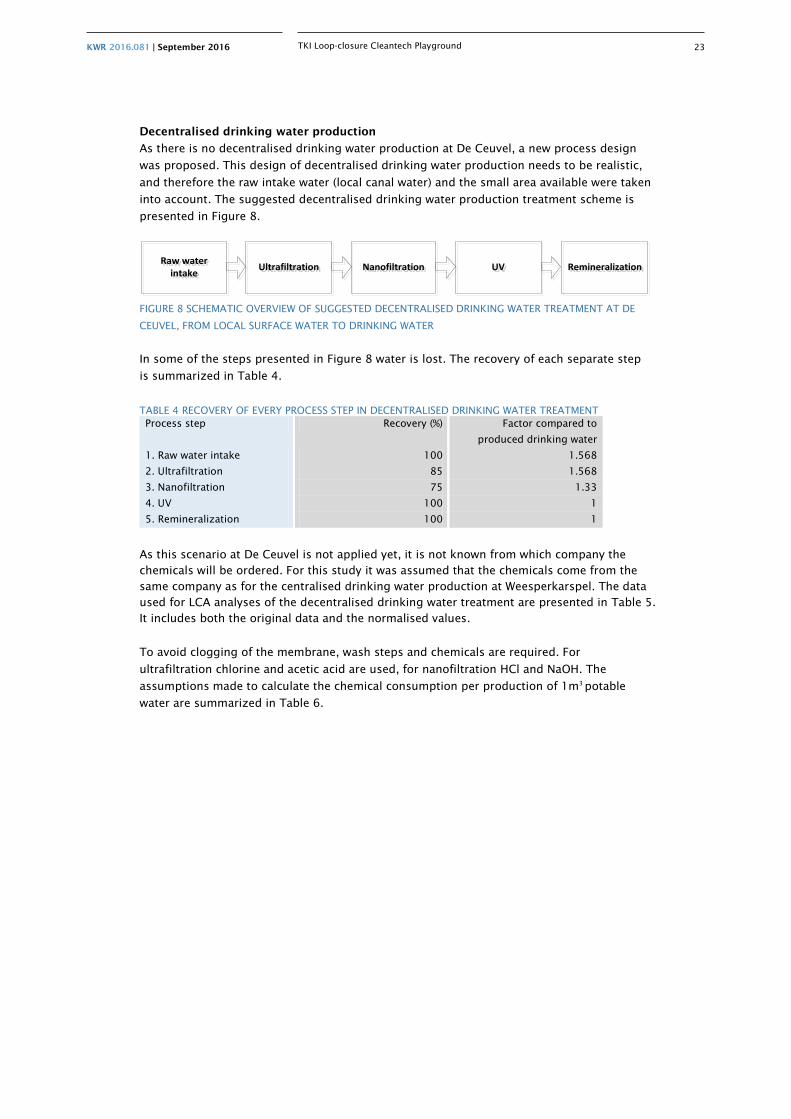
Decentralised drinking water production
As there is no decentralised drinking water production at De Ceuvel, a new process design
was proposed. This design of decentralised drinking water production needs to be realistic,
and therefore the raw intake water (local canal water) and the small area available were taken
into account. The suggested decentralised drinking water production treatment scheme is
presented in Figure 8.
Raw water intake
Raw water intake UltrafiltrationUltrafiltration NanofiltrationNanofiltration UVUV RemineralizationRemineralization
FIGURE 8 SCHEMATIC OVERVIEW OF SUGGESTED DECENTRALISED DRINKING WATER TREATMENT AT DE
CEUVEL, FROM LOCAL SURFACE WATER TO DRINKING WATER
In some of the steps presented in Figure 8 water is lost. The recovery of each separate step
is summarized in Table 4.
TABLE 4 RECOVERY OF EVERY PROCESS STEP IN DECENTRALISED DRINKING WATER TREATMENT Process step Recovery (%) Factor compared to
produced drinking water
1. Raw water intake 100 1.568
2. Ultrafiltration 85 1.568
3. Nanofiltration 75 1.33
4. UV 100 1
5. Remineralization 100 1
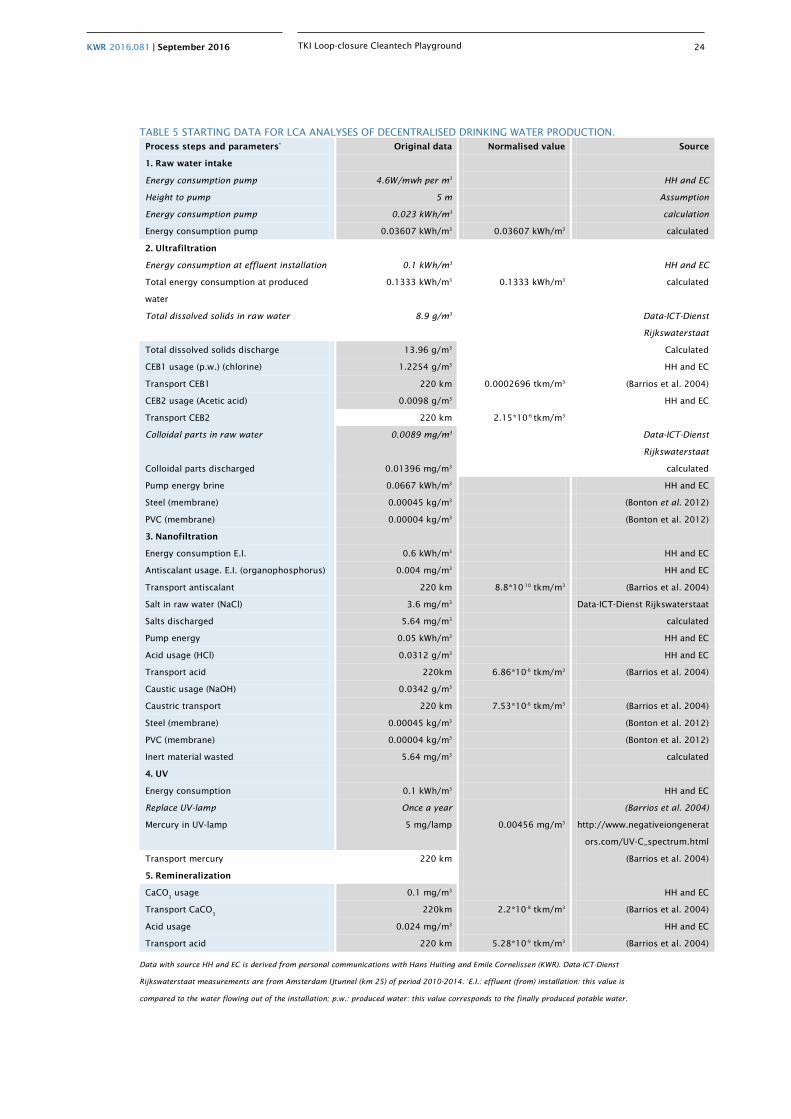
As this scenario at De Ceuvel is not applied yet, it is not known from which company the chemicals will be ordered. For this study it was assumed that the chemicals come from the same company as for the centralised drinking water production at Weesperkarspel. The data used for LCA analyses of the decentralised drinking water treatment are presented in Table 5. It includes both the original data and the normalised values.
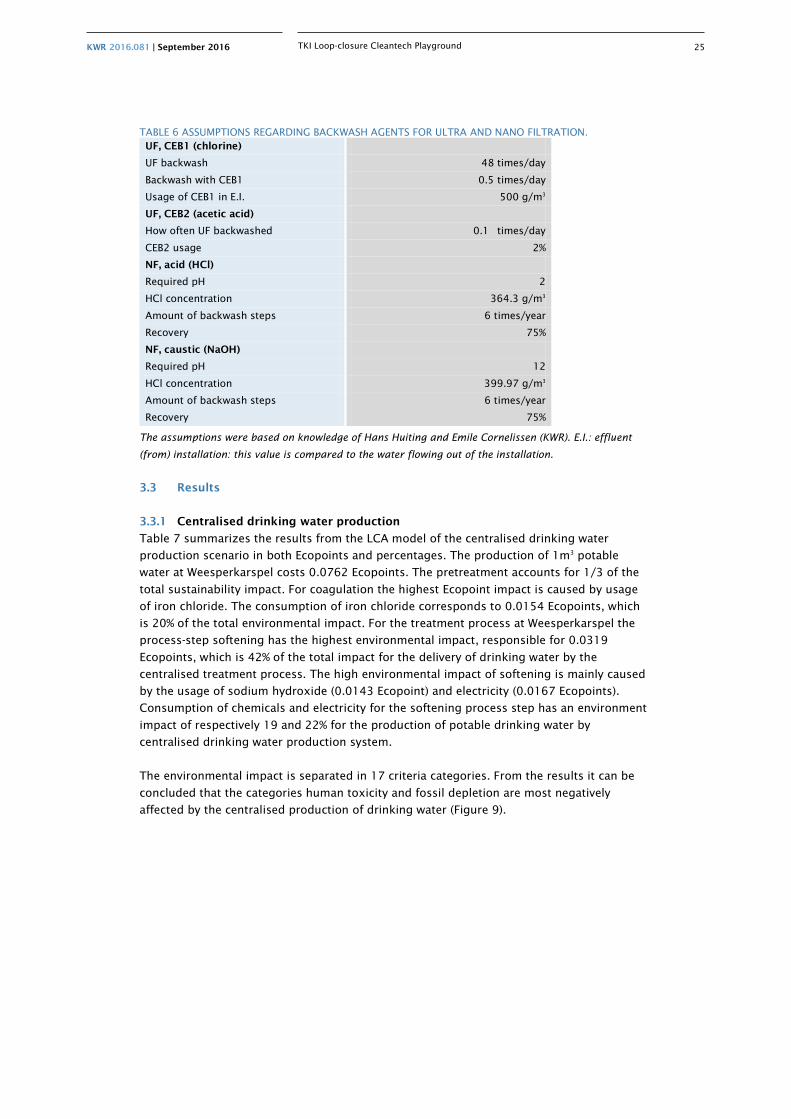
To avoid clogging of the membrane, wash steps and chemicals are required. For
ultrafiltration chlorine and acetic acid are used, for nanofiltration HCl and NaOH. The
assumptions made to calculate the chemical consumption per production of 1m3 potable
water are summarized in Table 6.
KWR 2016.081 | September 2016 24
TKI Loop-closure Cleantech Playground
TABLE 5 STARTING DATA FOR LCA ANALYSES OF DECENTRALISED DRINKING WATER PRODUCTION. Process steps and parameters* Original data Normalised value Source
1. Raw water intake
Energy consumption pump 4.6W/mwh per m3 HH and EC
Height to pump 5 m Assumption
Energy consumption pump 0.023 kWh/m3 calculation
Energy consumption pump 0.03607 kWh/m3 0.03607 kWh/m3 calculated
2. Ultrafiltration
Energy consumption at effluent installation 0.1 kWh/m3 HH and EC
Total energy consumption at produced
water
0.1333 kWh/m3 0.1333 kWh/m3 calculated
Total dissolved solids in raw water 8.9 g/m3 Data-ICT-Dienst
Rijkswaterstaat
Total dissolved solids discharge 13.96 g/m3 Calculated
CEB1 usage (p.w.) (chlorine) 1.2254 g/m3 HH and EC
Transport CEB1 220 km 0.0002696 tkm/m3 (Barrios et al. 2004)
CEB2 usage (Acetic acid) 0.0098 g/m3 HH and EC
Transport CEB2 220 km 2.15*10-6 tkm/m3
Colloidal parts in raw water 0.0089 mg/m3 Data-ICT-Dienst
Rijkswaterstaat
Colloidal parts discharged 0.01396 mg/m3 calculated
Pump energy brine 0.0667 kWh/m3 HH and EC
Steel (membrane) 0.00045 kg/m3 (Bonton et al. 2012)
PVC (membrane) 0.00004 kg/m3 (Bonton et al. 2012)
3. Nanofiltration
Energy consumption E.I. 0.6 kWh/m3 HH and EC
Antiscalant usage. E.I. (organophosphorus) 0.004 mg/m3 HH and EC
Transport antiscalant 220 km 8.8*10-10 tkm/m3 (Barrios et al. 2004)
Salt in raw water (NaCl) 3.6 mg/m3 Data-ICT-Dienst Rijkswaterstaat
Salts discharged 5.64 mg/m3 calculated
Pump energy 0.05 kWh/m3 HH and EC
Acid usage (HCl) 0.0312 g/m3 HH and EC
Transport acid 220km 6.86*10-6 tkm/m3 (Barrios et al. 2004)
Caustic usage (NaOH) 0.0342 g/m3
Caustric transport 220 km 7.53*10-6 tkm/m3 (Barrios et al. 2004)
Steel (membrane) 0.00045 kg/m3 (Bonton et al. 2012)
PVC (membrane) 0.00004 kg/m3 (Bonton et al. 2012)
Inert material wasted 5.64 mg/m3 calculated
4. UV
Energy consumption 0.1 kWh/m3 HH and EC
Replace UV-lamp Once a year (Barrios et al. 2004)
Mercury in UV-lamp 5 mg/lamp 0.00456 mg/m3 http://www.negativeiongenerat
ors.com/UV-C_spectrum.html
Transport mercury 220 km (Barrios et al. 2004)
5. Remineralization
CaCO3 usage 0.1 mg/m3 HH and EC
Transport CaCO3 220km 2.2*10-8 tkm/m3 (Barrios et al. 2004)
Acid usage 0.024 mg/m3 HH and EC
Transport acid 220 km 5.28*10-9 tkm/m3 (Barrios et al. 2004)
Data with source HH and EC is derived from personal communications with Hans Huiting and Emile Cornelissen (KWR). Data-ICT-Dienst
Rijkswaterstaat measurements are from Amsterdam IJtunnel (km 25) of period 2010-2014. *E.I.: effluent (from) installation: this value is
compared to the water flowing out of the installation; p.w.: produced water: this value corresponds to the finally produced potable water.
KWR 2016.081 | September 2016 25
TKI Loop-closure Cleantech Playground
TABLE 6 ASSUMPTIONS REGARDING BACKWASH AGENTS FOR ULTRA AND NANO FILTRATION. UF, CEB1 (chlorine)
UF backwash 48 times/day
Backwash with CEB1 0.5 times/day
Usage of CEB1 in E.I. 500 g/m3
UF, CEB2 (acetic acid)
How often UF backwashed 0.1 times/day
CEB2 usage 2%
NF, acid (HCl)
Required pH 2
HCl concentration 364.3 g/m3
Amount of backwash steps 6 times/year
Recovery 75%
NF, caustic (NaOH)
Required pH 12
HCl concentration 399.97 g/m3
Amount of backwash steps 6 times/year
Recovery 75%
The assumptions were based on knowledge of Hans Huiting and Emile Cornelissen (KWR). E.I.: effluent
(from) installation: this value is compared to the water flowing out of the installation.
3.3 Results
3.3.1 Centralised drinking water production
Table 7 summarizes the results from the LCA model of the centralised drinking water
production scenario in both Ecopoints and percentages. The production of 1m3 potable
water at Weesperkarspel costs 0.0762 Ecopoints. The pretreatment accounts for 1/3 of the
total sustainability impact. For coagulation the highest Ecopoint impact is caused by usage
of iron chloride. The consumption of iron chloride corresponds to 0.0154 Ecopoints, which
is 20% of the total environmental impact. For the treatment process at Weesperkarspel the
process-step softening has the highest environmental impact, responsible for 0.0319
Ecopoints, which is 42% of the total impact for the delivery of drinking water by the
centralised treatment process. The high environmental impact of softening is mainly caused
by the usage of sodium hydroxide (0.0143 Ecopoint) and electricity (0.0167 Ecopoints).
Consumption of chemicals and electricity for the softening process step has an environment
impact of respectively 19 and 22% for the production of potable drinking water by
centralised drinking water production system.
The environmental impact is separated in 17 criteria categories. From the results it can be
concluded that the categories human toxicity and fossil depletion are most negatively
affected by the centralised production of drinking water (Figure 9).
KWR 2016.081 | September 2016 26
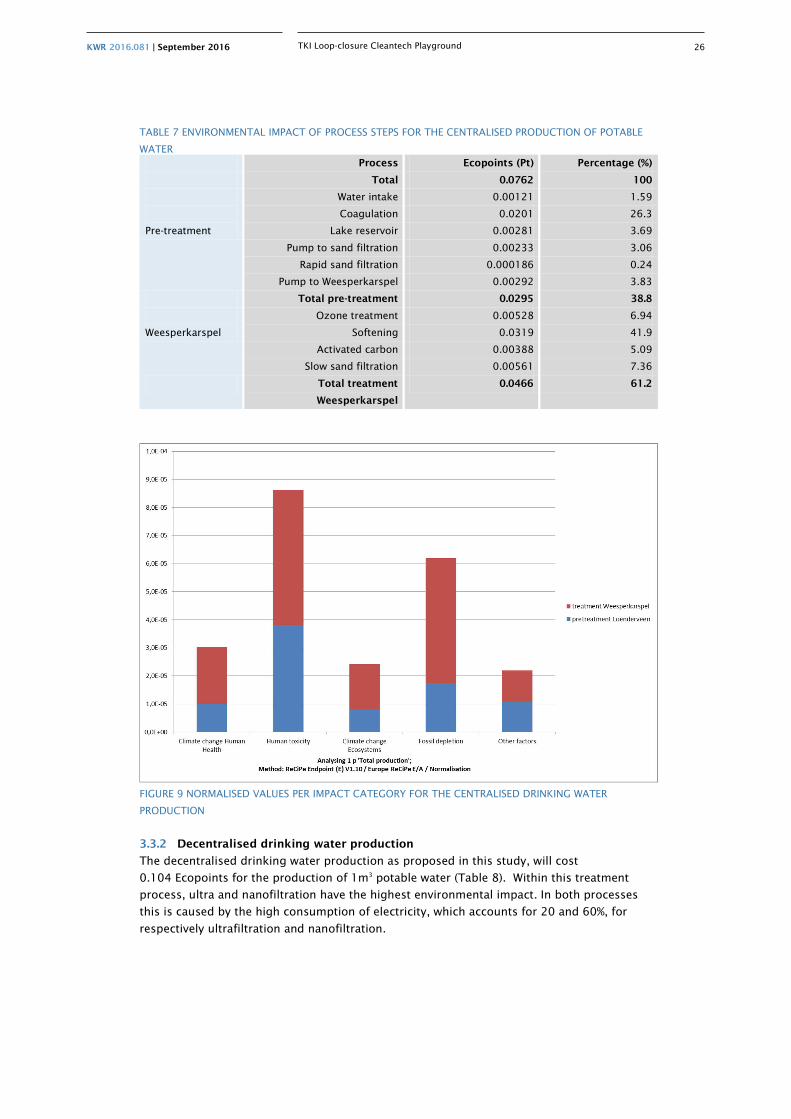
TKI Loop-closure Cleantech Playground
TABLE 7 ENVIRONMENTAL IMPACT OF PROCESS STEPS FOR THE CENTRALISED PRODUCTION OF POTABLE
WATER Process Ecopoints (Pt) Percentage (%)
Total 0.0762 100
Pre-treatment
Water intake 0.00121 1.59
Coagulation 0.0201 26.3
Lake reservoir 0.00281 3.69
Pump to sand filtration 0.00233 3.06
Rapid sand filtration 0.000186 0.24
Pump to Weesperkarspel 0.00292 3.83
Total pre-treatment 0.0295 38.8
Weesperkarspel
Ozone treatment 0.00528 6.94
Softening 0.0319 41.9
Activated carbon 0.00388 5.09
Slow sand filtration 0.00561 7.36
Total treatment
Weesperkarspel
0.0466 61.2
FIGURE 9 NORMALISED VALUES PER IMPACT CATEGORY FOR THE CENTRALISED DRINKING WATER
PRODUCTION
3.3.2 Decentralised drinking water production
The decentralised drinking water production as proposed in this study, will cost
0.104 Ecopoints for the production of 1m3 potable water (Table 8). Within this treatment
process, ultra and nanofiltration have the highest environmental impact. In both processes
this is caused by the high consumption of electricity, which accounts for 20 and 60%, for
respectively ultrafiltration and nanofiltration.
KWR 2016.081 | September 2016 27
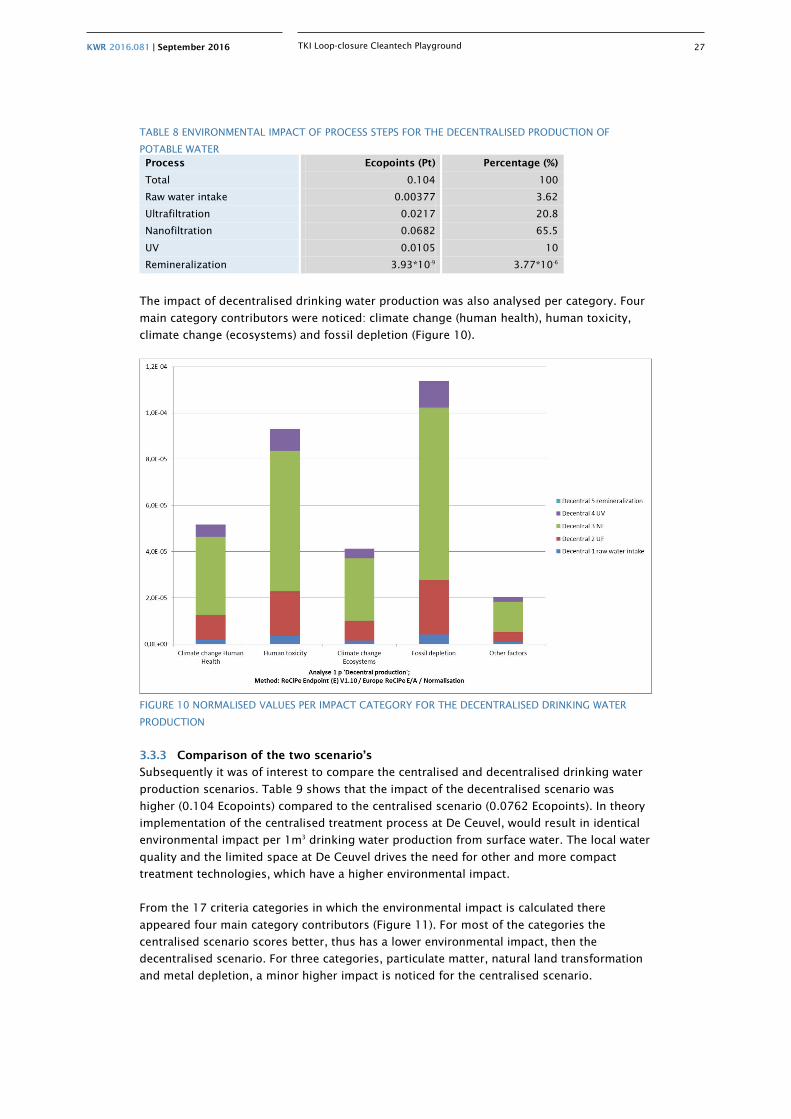
TKI Loop-closure Cleantech Playground
TABLE 8 ENVIRONMENTAL IMPACT OF PROCESS STEPS FOR THE DECENTRALISED PRODUCTION OF
POTABLE WATER Process Ecopoints (Pt) Percentage (%)
Total 0.104 100
Raw water intake 0.00377 3.62
Ultrafiltration 0.0217 20.8
Nanofiltration 0.0682 65.5
UV 0.0105 10
Remineralization 3.93*10-9 3.77*10-6
The impact of decentralised drinking water production was also analysed per category. Four
main category contributors were noticed: climate change (human health), human toxicity,
climate change (ecosystems) and fossil depletion (Figure 10).
FIGURE 10 NORMALISED VALUES PER IMPACT CATEGORY FOR THE DECENTRALISED DRINKING WATER
PRODUCTION
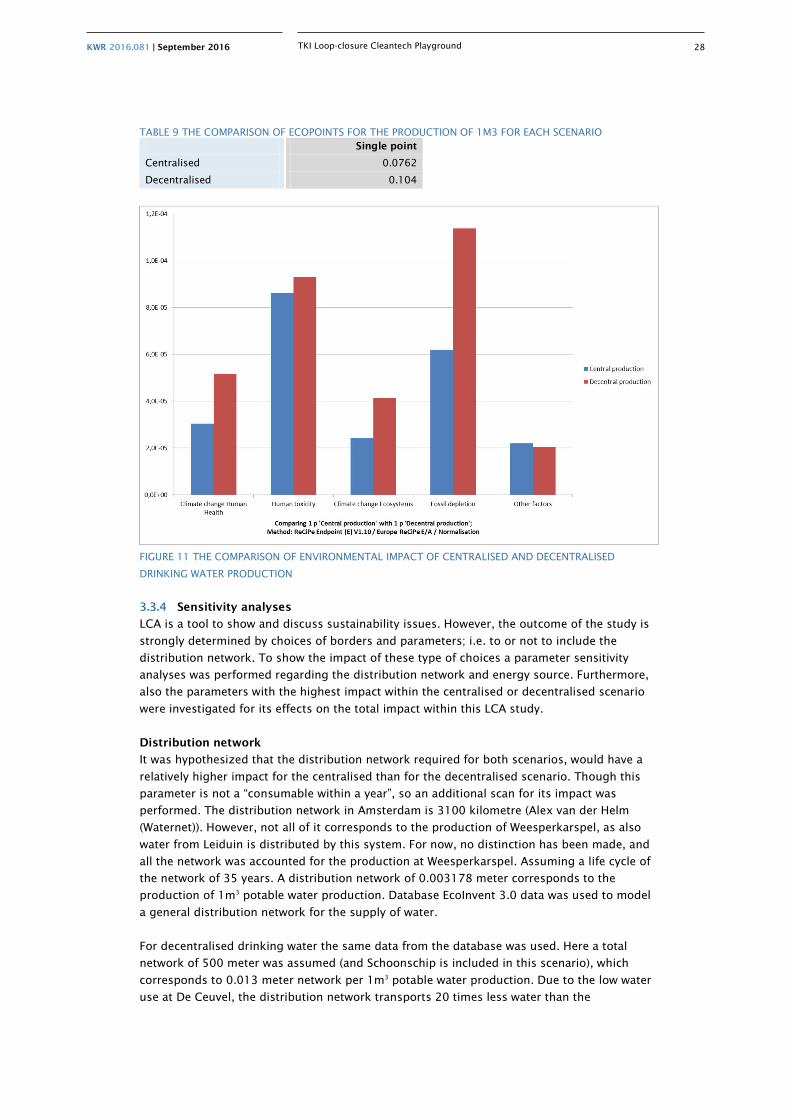
3.3.3 Comparison of the two scenario’s
Subsequently it was of interest to compare the centralised and decentralised drinking water
production scenarios. Table 9 shows that the impact of the decentralised scenario was
higher (0.104 Ecopoints) compared to the centralised scenario (0.0762 Ecopoints). In theory
implementation of the centralised treatment process at De Ceuvel, would result in identical
environmental impact per 1m3 drinking water production from surface water. The local water
quality and the limited space at De Ceuvel drives the need for other and more compact
treatment technologies, which have a higher environmental impact.
From the 17 criteria categories in which the environmental impact is calculated there
appeared four main category contributors (Figure 11). For most of the categories the
centralised scenario scores better, thus has a lower environmental impact, then the
decentralised scenario. For three categories, particulate matter, natural land transformation
and metal depletion, a minor higher impact is noticed for the centralised scenario.
KWR 2016.081 | September 2016 28
TKI Loop-closure Cleantech Playground
TABLE 9 THE COMPARISON OF ECOPOINTS FOR THE PRODUCTION OF 1M3 FOR EACH SCENARIO Single point
Centralised 0.0762
Decentralised 0.104
FIGURE 11 THE COMPARISON OF ENVIRONMENTAL IMPACT OF CENTRALISED AND DECENTRALISED
DRINKING WATER PRODUCTION
3.3.4 Sensitivity analyses
LCA is a tool to show and discuss sustainability issues. However, the outcome of the study is
strongly determined by choices of borders and parameters; i.e. to or not to include the
distribution network. To show the impact of these type of choices a parameter sensitivity
analyses was performed regarding the distribution network and energy source. Furthermore,
also the parameters with the highest impact within the centralised or decentralised scenario
were investigated for its effects on the total impact within this LCA study.
Distribution network
It was hypothesized that the distribution network required for both scenarios, would have a
relatively higher impact for the centralised than for the decentralised scenario. Though this
parameter is not a “consumable within a year”, so an additional scan for its impact was
performed. The distribution network in Amsterdam is 3100 kilometre (Alex van der Helm
(Waternet)). However, not all of it corresponds to the production of Weesperkarspel, as also
water from Leiduin is distributed by this system. For now, no distinction has been made, and
all the network was accounted for the production at Weesperkarspel. Assuming a life cycle of
the network of 35 years. A distribution network of 0.003178 meter corresponds to the
production of 1m3 potable water production. Database EcoInvent 3.0 data was used to model
a general distribution network for the supply of water.
For decentralised drinking water the same data from the database was used. Here a total
network of 500 meter was assumed (and Schoonschip is included in this scenario), which
corresponds to 0.013 meter network per 1m3 potable water production. Due to the low water
use at De Ceuvel, the distribution network transports 20 times less water than the
KWR 2016.081 | September 2016 29
TKI Loop-closure Cleantech Playground
conventional system. Still the length and diameter of the distribution system are similar,
since they are designed to provide sufficient water when opening a tap. In addition, the
population at De Ceuvel is less dense than the average in Amsterdam, where flats result in
high water consumption in a small area, and therefore relatively less distribution network.
The distribution network for the centralised scenario accounts for 37% of the environmental
impact, for de decentralised scenario it is 64%.
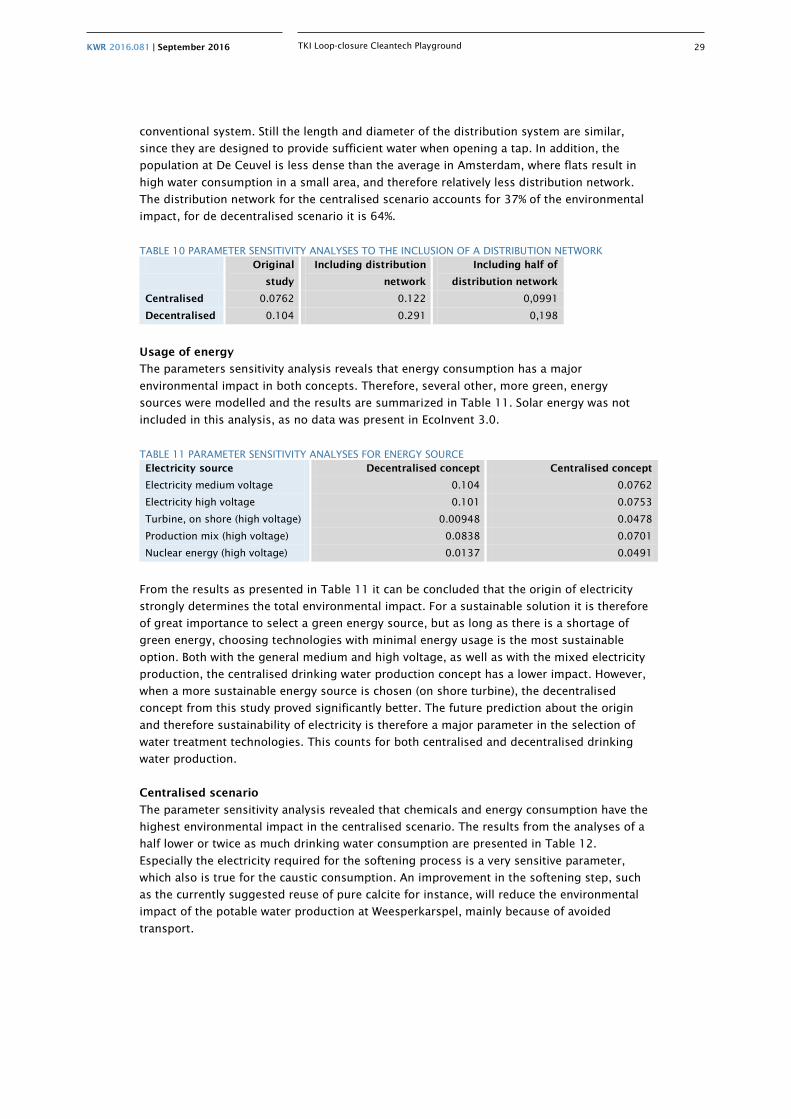
TABLE 10 PARAMETER SENSITIVITY ANALYSES TO THE INCLUSION OF A DISTRIBUTION NETWORK Original
study
Including distribution
network
Including half of
distribution network
Centralised 0.0762 0.122 0,0991
Decentralised 0.104 0.291 0,198
Usage of energy
The parameters sensitivity analysis reveals that energy consumption has a major
environmental impact in both concepts. Therefore, several other, more green, energy
sources were modelled and the results are summarized in Table 11. Solar energy was not
included in this analysis, as no data was present in EcoInvent 3.0.
TABLE 11 PARAMETER SENSITIVITY ANALYSES FOR ENERGY SOURCE Electricity source Decentralised concept Centralised concept
Electricity medium voltage 0.104 0.0762
Electricity high voltage 0.101 0.0753
Turbine, on shore (high voltage) 0.00948 0.0478
Production mix (high voltage) 0.0838 0.0701
Nuclear energy (high voltage) 0.0137 0.0491
From the results as presented in Table 11 it can be concluded that the origin of electricity
strongly determines the total environmental impact. For a sustainable solution it is therefore
of great importance to select a green energy source, but as long as there is a shortage of
green energy, choosing technologies with minimal energy usage is the most sustainable
option. Both with the general medium and high voltage, as well as with the mixed electricity
production, the centralised drinking water production concept has a lower impact. However,
when a more sustainable energy source is chosen (on shore turbine), the decentralised
concept from this study proved significantly better. The future prediction about the origin
and therefore sustainability of electricity is therefore a major parameter in the selection of
water treatment technologies. This counts for both centralised and decentralised drinking
water production.
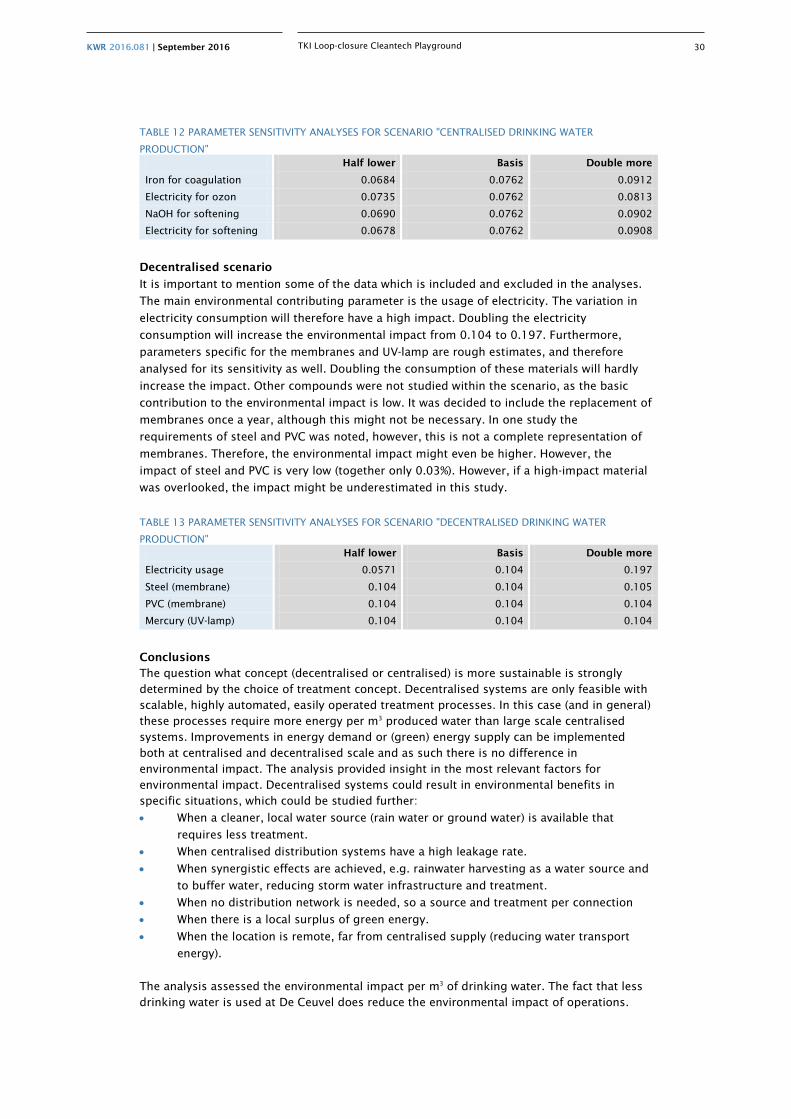
Centralised scenario
The parameter sensitivity analysis revealed that chemicals and energy consumption have the
highest environmental impact in the centralised scenario. The results from the analyses of a
half lower or twice as much drinking water consumption are presented in Table 12.
Especially the electricity required for the softening process is a very sensitive parameter,
which also is true for the caustic consumption. An improvement in the softening step, such
as the currently suggested reuse of pure calcite for instance, will reduce the environmental
impact of the potable water production at Weesperkarspel, mainly because of avoided
transport.
KWR 2016.081 | September 2016 30
TKI Loop-closure Cleantech Playground
TABLE 12 PARAMETER SENSITIVITY ANALYSES FOR SCENARIO "CENTRALISED DRINKING WATER
PRODUCTION" Half lower Basis Double more
Iron for coagulation 0.0684 0.0762 0.0912
Electricity for ozon 0.0735 0.0762 0.0813
NaOH for softening 0.0690 0.0762 0.0902
Electricity for softening 0.0678 0.0762 0.0908
Decentralised scenario
It is important to mention some of the data which is included and excluded in the analyses.
The main environmental contributing parameter is the usage of electricity. The variation in
electricity consumption will therefore have a high impact. Doubling the electricity
consumption will increase the environmental impact from 0.104 to 0.197. Furthermore,
parameters specific for the membranes and UV-lamp are rough estimates, and therefore
analysed for its sensitivity as well. Doubling the consumption of these materials will hardly
increase the impact. Other compounds were not studied within the scenario, as the basic
contribution to the environmental impact is low. It was decided to include the replacement of
membranes once a year, although this might not be necessary. In one study the
requirements of steel and PVC was noted, however, this is not a complete representation of
membranes. Therefore, the environmental impact might even be higher. However, the
impact of steel and PVC is very low (together only 0.03%). However, if a high-impact material
was overlooked, the impact might be underestimated in this study.
TABLE 13 PARAMETER SENSITIVITY ANALYSES FOR SCENARIO "DECENTRALISED DRINKING WATER
PRODUCTION" Half lower Basis Double more
Electricity usage 0.0571 0.104 0.197
Steel (membrane) 0.104 0.104 0.105
PVC (membrane) 0.104 0.104 0.104
Mercury (UV-lamp) 0.104 0.104 0.104
Conclusions The question what concept (decentralised or centralised) is more sustainable is strongly determined by the choice of treatment concept. Decentralised systems are only feasible with scalable, highly automated, easily operated treatment processes. In this case (and in general) these processes require more energy per m3 produced water than large scale centralised systems. Improvements in energy demand or (green) energy supply can be implemented both at centralised and decentralised scale and as such there is no difference in environmental impact. The analysis provided insight in the most relevant factors for environmental impact. Decentralised systems could result in environmental benefits in specific situations, which could be studied further:
• When a cleaner, local water source (rain water or ground water) is available that
requires less treatment.
• When centralised distribution systems have a high leakage rate.
• When synergistic effects are achieved, e.g. rainwater harvesting as a water source and
to buffer water, reducing storm water infrastructure and treatment.
• When no distribution network is needed, so a source and treatment per connection
• When there is a local surplus of green energy.
• When the location is remote, far from centralised supply (reducing water transport
energy).
The analysis assessed the environmental impact per m3 of drinking water. The fact that less drinking water is used at De Ceuvel does reduce the environmental impact of operations.

KWR 2016.081 | September 2016 31
TKI Loop-closure Cleantech Playground
The impact of infrastructure , especially distribution, is not affected by the use, since the momentary demand when opening a tap determines the design of this infrastructure. Nevertheless, the overall environmental impact of drinking water production is relatively low, since the total environmental impact of one Western European person corresponds to thousand Ecopoints per year.
KWR 2016.081 | September 2016 32
TKI Loop-closure Cleantech Playground
4 Safe drinking water supply
4.1 Introduction to drinking water safety
Water can contain microbial, chemical and radiological contaminants that can cause adverse
health effects when consumed. Providing water that is safe for drinking and other intended
uses is crucial to prevent diseases in the community. Chemical contaminants typically don’t
occur at levels that cause acute health effects, but long term exposure can lead to health
problems. Microbial contamination however can cause acute outbreaks of disease, even at
very low levels of contamination. Infected persons and animals shed high numbers of
pathogenic microorganisms in their faeces. These can be viruses, bacteria, protozoa or
helminths. Helminths are mostly an issue in hot climates, but the other three pathogens are
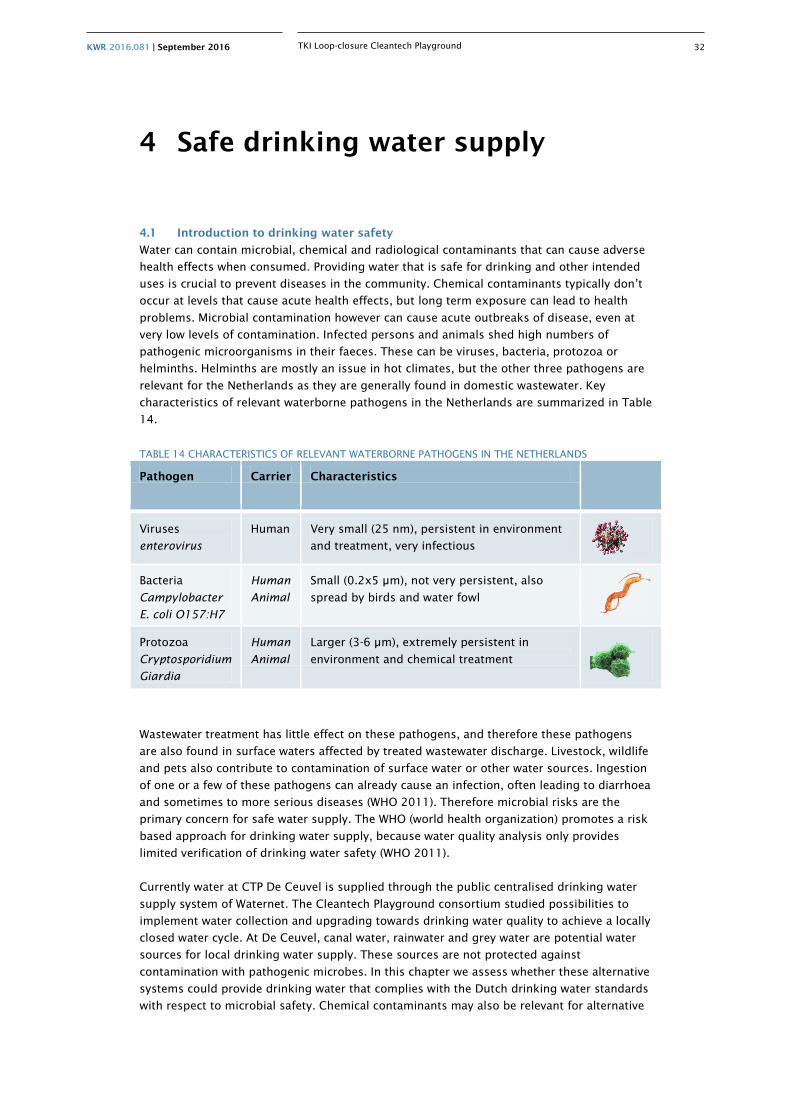
relevant for the Netherlands as they are generally found in domestic wastewater. Key
characteristics of relevant waterborne pathogens in the Netherlands are summarized in Table
14.
TABLE 14 CHARACTERISTICS OF RELEVANT WATERBORNE PATHOGENS IN THE NETHERLANDS
Pathogen Carrier Characteristics
Viruses
enterovirus
Human Very small (25 nm), persistent in environment
and treatment, very infectious
Bacteria
Campylobacter
E. coli O157:H7
Human
Animal
Small (0.2x5 µm), not very persistent, also
spread by birds and water fowl
Protozoa
Cryptosporidium
Giardia
Human
Animal
Larger (3-6 µm), extremely persistent in
environment and chemical treatment
Wastewater treatment has little effect on these pathogens, and therefore these pathogens
are also found in surface waters affected by treated wastewater discharge. Livestock, wildlife
and pets also contribute to contamination of surface water or other water sources. Ingestion
of one or a few of these pathogens can already cause an infection, often leading to diarrhoea
and sometimes to more serious diseases (WHO 2011). Therefore microbial risks are the
primary concern for safe water supply. The WHO (world health organization) promotes a risk
based approach for drinking water supply, because water quality analysis only provides
limited verification of drinking water safety (WHO 2011).
Currently water at CTP De Ceuvel is supplied through the public centralised drinking water
supply system of Waternet. The Cleantech Playground consortium studied possibilities to
implement water collection and upgrading towards drinking water quality to achieve a locally
closed water cycle. At De Ceuvel, canal water, rainwater and grey water are potential water
sources for local drinking water supply. These sources are not protected against
contamination with pathogenic microbes. In this chapter we assess whether these alternative
systems could provide drinking water that complies with the Dutch drinking water standards
with respect to microbial safety. Chemical contaminants may also be relevant for alternative
KWR 2016.081 | September 2016 33
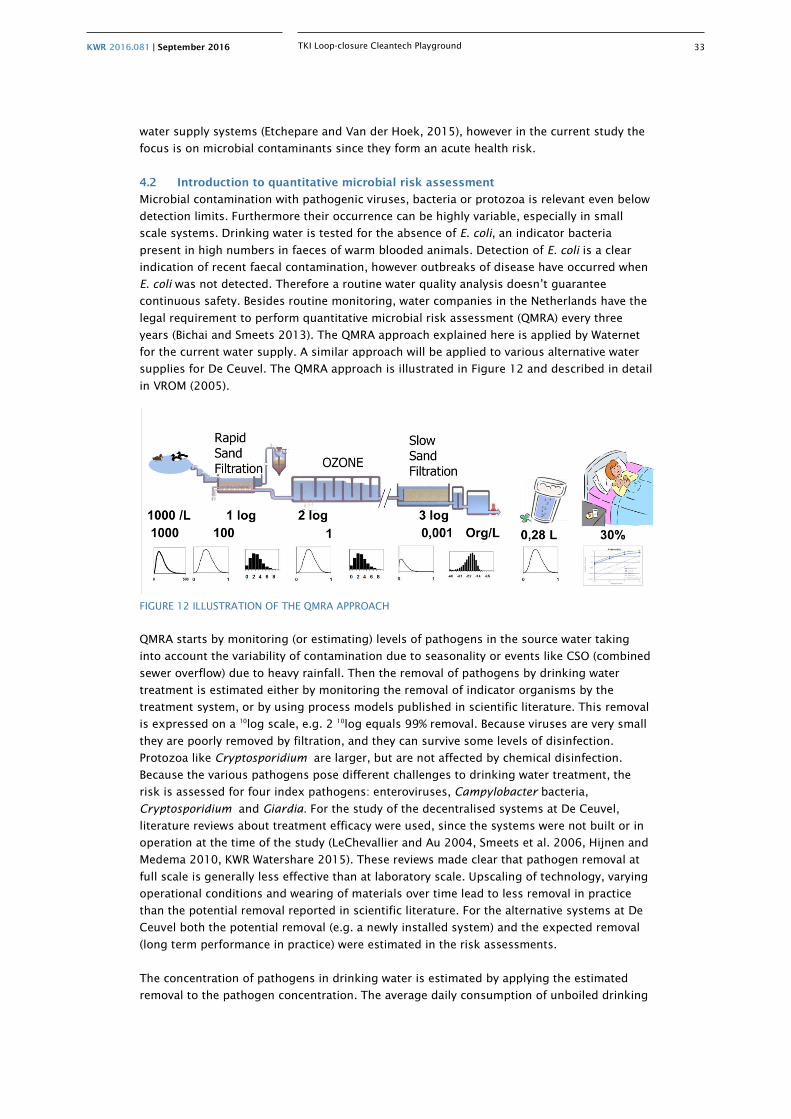
TKI Loop-closure Cleantech Playground
water supply systems (Etchepare and Van der Hoek, 2015), however in the current study the
focus is on microbial contaminants since they form an acute health risk.
4.2 Introduction to quantitative microbial risk assessment
Microbial contamination with pathogenic viruses, bacteria or protozoa is relevant even below
detection limits. Furthermore their occurrence can be highly variable, especially in small
scale systems. Drinking water is tested for the absence of E. coli, an indicator bacteria
present in high numbers in faeces of warm blooded animals. Detection of E. coli is a clear
indication of recent faecal contamination, however outbreaks of disease have occurred when
E. coli was not detected. Therefore a routine water quality analysis doesn’t guarantee
continuous safety. Besides routine monitoring, water companies in the Netherlands have the
legal requirement to perform quantitative microbial risk assessment (QMRA) every three
years (Bichai and Smeets 2013). The QMRA approach explained here is applied by Waternet
for the current water supply. A similar approach will be applied to various alternative water
supplies for De Ceuvel. The QMRA approach is illustrated in Figure 12 and described in detail
in VROM (2005).
FIGURE 12 ILLUSTRATION OF THE QMRA APPROACH
QMRA starts by monitoring (or estimating) levels of pathogens in the source water taking
into account the variability of contamination due to seasonality or events like CSO (combined
sewer overflow) due to heavy rainfall. Then the removal of pathogens by drinking water
treatment is estimated either by monitoring the removal of indicator organisms by the
treatment system, or by using process models published in scientific literature. This removal
is expressed on a 10log scale, e.g. 2 10log equals 99% removal. Because viruses are very small
they are poorly removed by filtration, and they can survive some levels of disinfection.
Protozoa like Cryptosporidium are larger, but are not affected by chemical disinfection.
Because the various pathogens pose different challenges to drinking water treatment, the
risk is assessed for four index pathogens: enteroviruses, Campylobacter bacteria,
Cryptosporidium and Giardia. For the study of the decentralised systems at De Ceuvel,
literature reviews about treatment efficacy were used, since the systems were not built or in
operation at the time of the study (LeChevallier and Au 2004, Smeets et al. 2006, Hijnen and
Medema 2010, KWR Watershare 2015). These reviews made clear that pathogen removal at
full scale is generally less effective than at laboratory scale. Upscaling of technology, varying
operational conditions and wearing of materials over time lead to less removal in practice
than the potential removal reported in scientific literature. For the alternative systems at De
Ceuvel both the potential removal (e.g. a newly installed system) and the expected removal
(long term performance in practice) were estimated in the risk assessments.
The concentration of pathogens in drinking water is estimated by applying the estimated
removal to the pathogen concentration. The average daily consumption of unboiled drinking
KWR 2016.081 | September 2016 34
TKI Loop-closure Cleantech Playground
water in the Netherlands is 0.28 litres per person per day, varying between 0 and 2 litres
(Mons et al. 2007). Using this variable consumption, the exposure (dose) to pathogens is
calculated. A dose-response relationship is used to calculate the risk of developing an
infection at this level of exposure. Thus the daily risk of infection is calculated and from that
the annual risk of infection. To incorporate variability and uncertainty in the risk estimate, a
stochastic approach is used. Each element in the risk assessment is described by a
probability density function and these are combined in a Monte Carlo simulation to estimate
the risk (Schijven et al. 2011). The theoretical risk of infection needs to comply with the legal
requirement of one infection per 10.000 persons per year, which roughly equals a
concentration of one pathogen in one million litres of water.
4.3 Centralised drinking water supply from surface water
The centralised water supply is fed by two water treatment systems, the Weesperkarspel
system treating polder-water (described in Chapter 3) and the Leiduin system treating water
from the river Rhine. Waternet monitors pathogen concentrations in the polder water, the
river Rhine water and the abstracted dune water every three years with biweekly samples.
Rhine river water is contaminated by sewage, and therefore the pathogens in Table 14 need
to be removed 99.999% to 99.9999999% (5 to 9 10log removal). This is achieved by a series
of water treatment processes including dune filtration, coagulation, sedimentation, rapid
sand filtration, ozonation, activated carbon filtration and slow sand filtration. The polder
water of the Weesperkaspel system is not directly contaminated by sewage, but zoonotic
pathogens from the livestock and water fowl in the area are present in the source water.
The pathogen removal by both treatment systems was assessed by monitoring indicator
organisms before and after each treatment barrier on a weekly basis. In addition tests were
conducted where pathogens and indicators were spiked in the feed water of small scale pilot
systems that represent the full scale systems. This information was combined with scientific
literature to develop mathematical models that predict pathogen removal by treatment
processes. By close monitoring and strict control of process conditions and strict operation
and maintenance procedures the required pathogen removal is achieved continuously. Every
three years a QMRA is preformed based on the collected information to verify that the
produced water complies with the health based target.
The water is distributed through a closed, pressurized distribution system to prevent
contamination of the drinking water. Maintenance and repairs are performed according to
strict hygiene codes to prevent contamination while working on the system (Meerkerk and
Kroesbergen, 2010). Random samples from home taps are taken as a final check of the
supplied water in the household. Only about 0.01% of these samples were positive for E. coli
indicating a possible contamination (Lieverloo et al. 2007).
4.4 Decentralised drinking water supply from surface water at De Ceuvel
Surface water at De Ceuvel is water from the river IJ. This river is fed from the Amsterdam-
Rijn Kanaal (ARK), the Zaan and indirectly from the IJsselmeer (through the Randmeren)
which is fed by the IJssel river, which comes from the river Rhine. The ARK, Rhine and
IJsselmeer have been monitored by the drinking water companies for the presence of index
pathogens over the last decades (Koenraad 1994, Hoogenboezem et al. 2000). Figure 13
shows the available data on the occurrence of pathogens in these waters combined as a
complementary cumulative distribution (chance of exceedance, CCDF). The QMRAspot
software (Schijven et al. 2011) was used to fit distribution functions to this data. Table 15
provides an overview of the fitted parameters and data characteristics.
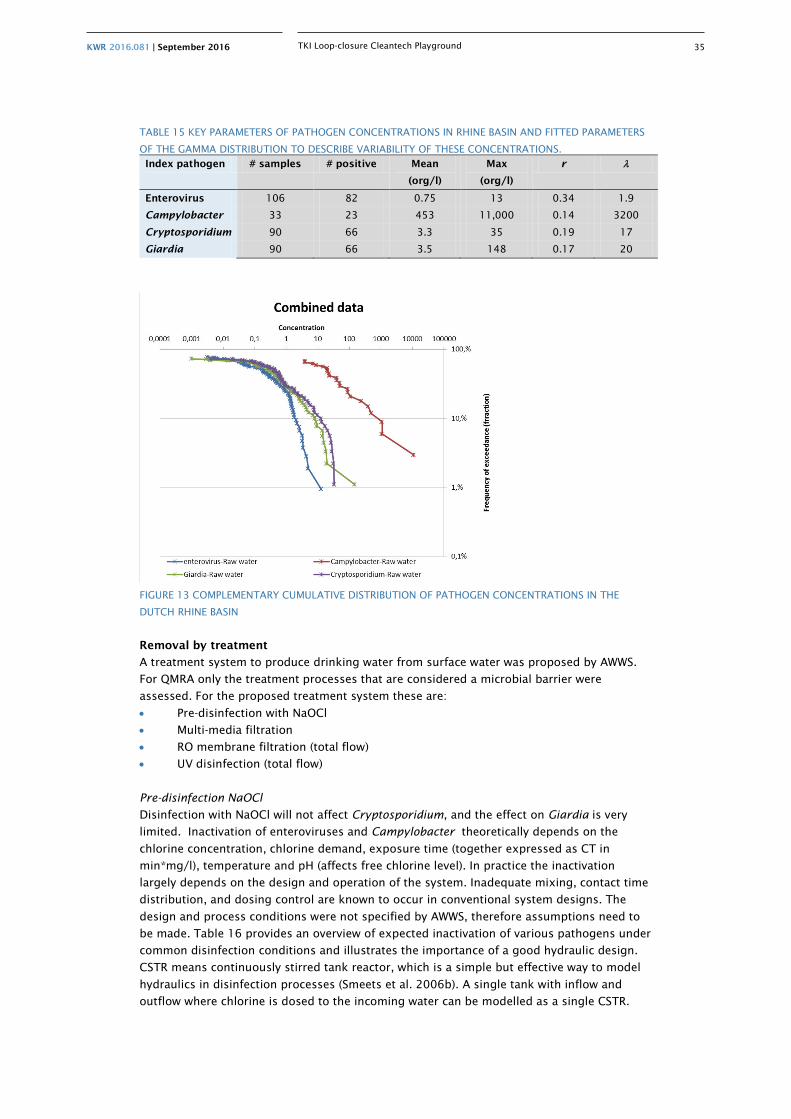
KWR 2016.081 | September 2016 35
TKI Loop-closure Cleantech Playground
TABLE 15 KEY PARAMETERS OF PATHOGEN CONCENTRATIONS IN RHINE BASIN AND FITTED PARAMETERS
OF THE GAMMA DISTRIBUTION TO DESCRIBE VARIABILITY OF THESE CONCENTRATIONS.
Index pathogen # samples # positive Mean
(org/l)
Max
(org/l)
r λ
Enterovirus 106 82 0.75 13 0.34 1.9
Campylobacter 33 23 453 11,000 0.14 3200
Cryptosporidium 90 66 3.3 35 0.19 17
Giardia 90 66 3.5 148 0.17 20
FIGURE 13 COMPLEMENTARY CUMULATIVE DISTRIBUTION OF PATHOGEN CONCENTRATIONS IN THE
DUTCH RHINE BASIN
Removal by treatment
A treatment system to produce drinking water from surface water was proposed by AWWS.
For QMRA only the treatment processes that are considered a microbial barrier were
assessed. For the proposed treatment system these are:
• Pre-disinfection with NaOCl
• Multi-media filtration
• RO membrane filtration (total flow)
• UV disinfection (total flow)
Pre-disinfection NaOCl
Disinfection with NaOCl will not affect Cryptosporidium, and the effect on Giardia is very
limited. Inactivation of enteroviruses and Campylobacter theoretically depends on the
chlorine concentration, chlorine demand, exposure time (together expressed as CT in
min*mg/l), temperature and pH (affects free chlorine level). In practice the inactivation
largely depends on the design and operation of the system. Inadequate mixing, contact time
distribution, and dosing control are known to occur in conventional system designs. The
design and process conditions were not specified by AWWS, therefore assumptions need to
be made. Table 16 provides an overview of expected inactivation of various pathogens under
common disinfection conditions and illustrates the importance of a good hydraulic design.
CSTR means continuously stirred tank reactor, which is a simple but effective way to model
hydraulics in disinfection processes (Smeets et al. 2006b). A single tank with inflow and
outflow where chlorine is dosed to the incoming water can be modelled as a single CSTR.
KWR 2016.081 | September 2016 36
TKI Loop-closure Cleantech Playground
When the tank is baffled, each compartment can be modelled as a CSTR in series. Table 16
illustrates that improving hydraulics by baffling potentially has a significant effect on the
level of inactivation that is achieved. The estimate of treatment efficacy can be made more
accurate when design details, operating strategies and conditions (e.g. temperature
variations) are known. For the current QMRA a design with 2 CSTR under the conditions in
Table 16 is assumed (constant log removal as indicated). When the system is operational,
microbial monitoring will be required to verify treatment efficacy.
TABLE 16 CALCULATED LOG INACTIVATION OF INDEXPATHOGENS UNDER ASSUMED PROCESS
CONDITIONS AND VARIOUS HYDRAULIC DESIGN CONDITIONS
Log inactivation
CSTR Free chlorine (Cl
2) (mg/l) pH (-)
Temp. (°C)
Ct (min*mg/l) Crypto. Giardia Virus E. coli
1 1 8 10 10 0 0,16 1,7 1,8
2 1 8 10 10 0 0,17 2,8 3,1
3 1 8 10 10 0 0,18 3,6 4,1
5 1 8 10 10 0 0,18 5,0 5,8
10 1 8 10 10 0 0,18 7,5 8,8
Multi-media filtration
The type of media is not specified, nor the media characteristics or operational conditions.
For the QMRA a rapid sand filtration is assumed. Such a filter can remove large pathogens
like Cryptosporidium and Giardia to some extent but bacteria and viruses are hardly
removed. Table 17 (from Smeets et al. 2006) provides an overview of published efficacy of
rapid sand filtration. The MEC is the most likely achieved removal in practice for a well-
designed, operated and maintained system. The range indicates the minimum and maximum
reported removal and provides an indication of the uncertainty about the actual efficacy of a
practical system. The MEC is used for the potential removal and the minimum for expected
removal. However, the range of reported efficacies in Table 17 makes clear that media
filtration may have no effect on any of the organisms. When the system is operational,
microbial monitoring will be required to assess treatment efficacy.
TABLE 17 EFFICACY OF RAPID SAND FILTRATION AS REPORTED IN LITERATURE (SMEETS ET AL. 2006)
RO Membrane filtration
Reverse osmosis (RO) membrane filtration in theory provides an absolute barrier against the
indicator organisms since the membrane even removes salts. In practice this is not the case
since leaking connections and seals can occur unnoticed and the membrane does not have
an absolute maximum pore size. Membranes are designed to remove salt using the
membrane material surface characteristics as well as the pore size (LeChevallier and Au
2004). A limited amount of leakage (e.g. 0.01%) hardly affects salt removal and will not be
detected by increase of conductivity. However it does mean that microbial removal is limited
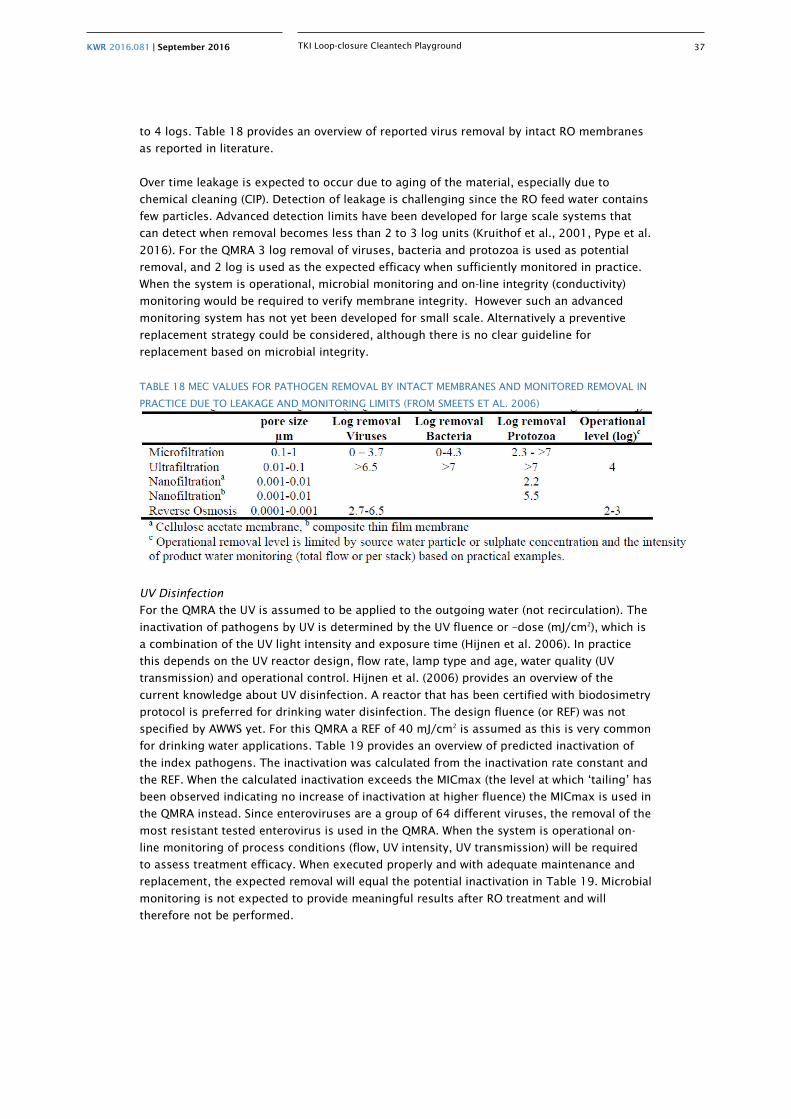
KWR 2016.081 | September 2016 37
TKI Loop-closure Cleantech Playground
to 4 logs. Table 18 provides an overview of reported virus removal by intact RO membranes
as reported in literature.
Over time leakage is expected to occur due to aging of the material, especially due to
chemical cleaning (CIP). Detection of leakage is challenging since the RO feed water contains
few particles. Advanced detection limits have been developed for large scale systems that
can detect when removal becomes less than 2 to 3 log units (Kruithof et al., 2001, Pype et al.
2016). For the QMRA 3 log removal of viruses, bacteria and protozoa is used as potential
removal, and 2 log is used as the expected efficacy when sufficiently monitored in practice.
When the system is operational, microbial monitoring and on-line integrity (conductivity)
monitoring would be required to verify membrane integrity. However such an advanced
monitoring system has not yet been developed for small scale. Alternatively a preventive
replacement strategy could be considered, although there is no clear guideline for
replacement based on microbial integrity.
TABLE 18 MEC VALUES FOR PATHOGEN REMOVAL BY INTACT MEMBRANES AND MONITORED REMOVAL IN
PRACTICE DUE TO LEAKAGE AND MONITORING LIMITS (FROM SMEETS ET AL. 2006)
UV Disinfection
For the QMRA the UV is assumed to be applied to the outgoing water (not recirculation). The
inactivation of pathogens by UV is determined by the UV fluence or –dose (mJ/cm2), which is
a combination of the UV light intensity and exposure time (Hijnen et al. 2006). In practice
this depends on the UV reactor design, flow rate, lamp type and age, water quality (UV
transmission) and operational control. Hijnen et al. (2006) provides an overview of the
current knowledge about UV disinfection. A reactor that has been certified with biodosimetry
protocol is preferred for drinking water disinfection. The design fluence (or REF) was not
specified by AWWS yet. For this QMRA a REF of 40 mJ/cm2 is assumed as this is very common
for drinking water applications. Table 19 provides an overview of predicted inactivation of
the index pathogens. The inactivation was calculated from the inactivation rate constant and
the REF. When the calculated inactivation exceeds the MICmax (the level at which ‘tailing’ has
been observed indicating no increase of inactivation at higher fluence) the MICmax is used in
the QMRA instead. Since enteroviruses are a group of 64 different viruses, the removal of the
most resistant tested enterovirus is used in the QMRA. When the system is operational on-
line monitoring of process conditions (flow, UV intensity, UV transmission) will be required
to assess treatment efficacy. When executed properly and with adequate maintenance and
replacement, the expected removal will equal the potential inactivation in Table 19. Microbial
monitoring is not expected to provide meaningful results after RO treatment and will
therefore not be performed.
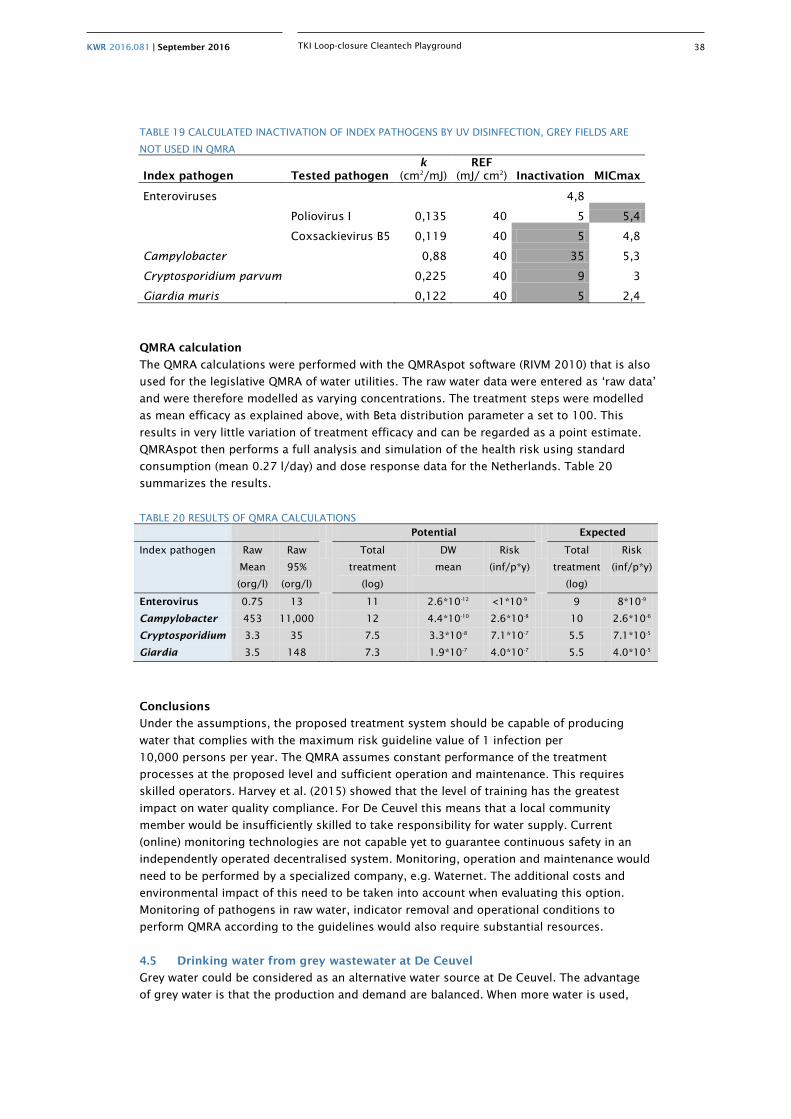
KWR 2016.081 | September 2016 38
TKI Loop-closure Cleantech Playground
TABLE 19 CALCULATED INACTIVATION OF INDEX PATHOGENS BY UV DISINFECTION, GREY FIELDS ARE
NOT USED IN QMRA
Index pathogen Tested pathogen k
(cm2/mJ) REF
(mJ/ cm2) Inactivation MICmax
Enteroviruses 4,8
Poliovirus I 0,135 40 5 5,4
Coxsackievirus B5 0,119 40 5 4,8
Campylobacter 0,88 40 35 5,3
Cryptosporidium parvum 0,225 40 9 3
Giardia muris 0,122 40 5 2,4
QMRA calculation
The QMRA calculations were performed with the QMRAspot software (RIVM 2010) that is also
used for the legislative QMRA of water utilities. The raw water data were entered as ‘raw data’
and were therefore modelled as varying concentrations. The treatment steps were modelled
as mean efficacy as explained above, with Beta distribution parameter a set to 100. This
results in very little variation of treatment efficacy and can be regarded as a point estimate.
QMRAspot then performs a full analysis and simulation of the health risk using standard
consumption (mean 0.27 l/day) and dose response data for the Netherlands. Table 20
summarizes the results.
TABLE 20 RESULTS OF QMRA CALCULATIONS
Potential Expected
Index pathogen Raw
Mean
(org/l)
Raw
95%
(org/l)
Total
treatment
(log)
DW
mean
Risk
(inf/p*y)
Total
treatment
(log)
Risk
(inf/p*y)
Enterovirus 0.75 13 11 2.6*10-12 <1*10-9 9 8*10-9
Campylobacter 453 11,000 12 4.4*10-10 2.6*10-8 10 2.6*10-6
Cryptosporidium 3.3 35 7.5 3.3*10-8 7.1*10-7 5.5 7.1*10-5
Giardia 3.5 148 7.3 1.9*10-7 4.0*10-7 5.5 4.0*10-5
Conclusions
Under the assumptions, the proposed treatment system should be capable of producing
water that complies with the maximum risk guideline value of 1 infection per
10,000 persons per year. The QMRA assumes constant performance of the treatment
processes at the proposed level and sufficient operation and maintenance. This requires
skilled operators. Harvey et al. (2015) showed that the level of training has the greatest
impact on water quality compliance. For De Ceuvel this means that a local community
member would be insufficiently skilled to take responsibility for water supply. Current
(online) monitoring technologies are not capable yet to guarantee continuous safety in an
independently operated decentralised system. Monitoring, operation and maintenance would
need to be performed by a specialized company, e.g. Waternet. The additional costs and
environmental impact of this need to be taken into account when evaluating this option.
Monitoring of pathogens in raw water, indicator removal and operational conditions to
perform QMRA according to the guidelines would also require substantial resources.
4.5 Drinking water from grey wastewater at De Ceuvel
Grey water could be considered as an alternative water source at De Ceuvel. The advantage
of grey water is that the production and demand are balanced. When more water is used,
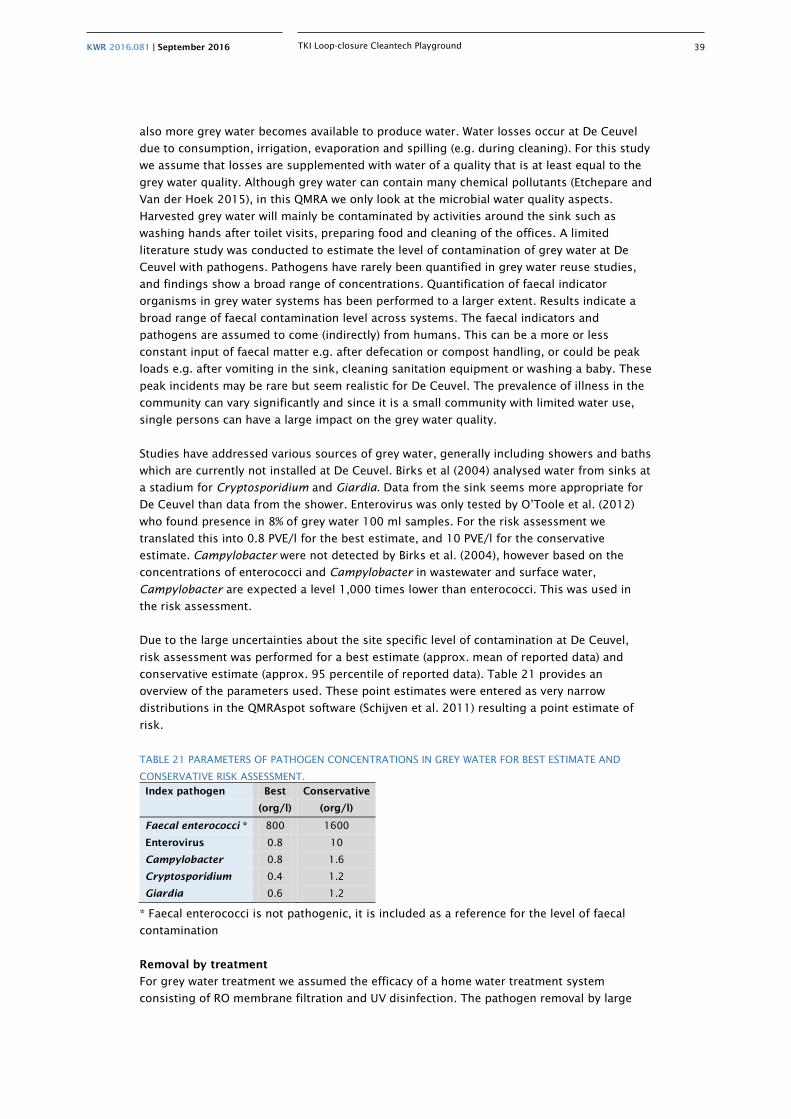
KWR 2016.081 | September 2016 39
TKI Loop-closure Cleantech Playground
also more grey water becomes available to produce water. Water losses occur at De Ceuvel
due to consumption, irrigation, evaporation and spilling (e.g. during cleaning). For this study
we assume that losses are supplemented with water of a quality that is at least equal to the
grey water quality. Although grey water can contain many chemical pollutants (Etchepare and
Van der Hoek 2015), in this QMRA we only look at the microbial water quality aspects.
Harvested grey water will mainly be contaminated by activities around the sink such as
washing hands after toilet visits, preparing food and cleaning of the offices. A limited
literature study was conducted to estimate the level of contamination of grey water at De
Ceuvel with pathogens. Pathogens have rarely been quantified in grey water reuse studies,
and findings show a broad range of concentrations. Quantification of faecal indicator
organisms in grey water systems has been performed to a larger extent. Results indicate a
broad range of faecal contamination level across systems. The faecal indicators and
pathogens are assumed to come (indirectly) from humans. This can be a more or less
constant input of faecal matter e.g. after defecation or compost handling, or could be peak
loads e.g. after vomiting in the sink, cleaning sanitation equipment or washing a baby. These
peak incidents may be rare but seem realistic for De Ceuvel. The prevalence of illness in the
community can vary significantly and since it is a small community with limited water use,
single persons can have a large impact on the grey water quality.
Studies have addressed various sources of grey water, generally including showers and baths
which are currently not installed at De Ceuvel. Birks et al (2004) analysed water from sinks at
a stadium for Cryptosporidium and Giardia. Data from the sink seems more appropriate for
De Ceuvel than data from the shower. Enterovirus was only tested by O’Toole et al. (2012)
who found presence in 8% of grey water 100 ml samples. For the risk assessment we
translated this into 0.8 PVE/l for the best estimate, and 10 PVE/l for the conservative
estimate. Campylobacter were not detected by Birks et al. (2004), however based on the
concentrations of enterococci and Campylobacter in wastewater and surface water,
Campylobacter are expected a level 1,000 times lower than enterococci. This was used in
the risk assessment.
Due to the large uncertainties about the site specific level of contamination at De Ceuvel,
risk assessment was performed for a best estimate (approx. mean of reported data) and
conservative estimate (approx. 95 percentile of reported data). Table 21 provides an
overview of the parameters used. These point estimates were entered as very narrow
distributions in the QMRAspot software (Schijven et al. 2011) resulting a point estimate of
risk.
TABLE 21 PARAMETERS OF PATHOGEN CONCENTRATIONS IN GREY WATER FOR BEST ESTIMATE AND
CONSERVATIVE RISK ASSESSMENT.
Index pathogen Best
(org/l)
Conservative
(org/l)
Faecal enterococci * 800 1600
Enterovirus 0.8 10
Campylobacter 0.8 1.6
Cryptosporidium 0.4 1.2
Giardia 0.6 1.2
* Faecal enterococci is not pathogenic, it is included as a reference for the level of faecal
contamination
Removal by treatment
For grey water treatment we assumed the efficacy of a home water treatment system
consisting of RO membrane filtration and UV disinfection. The pathogen removal by large
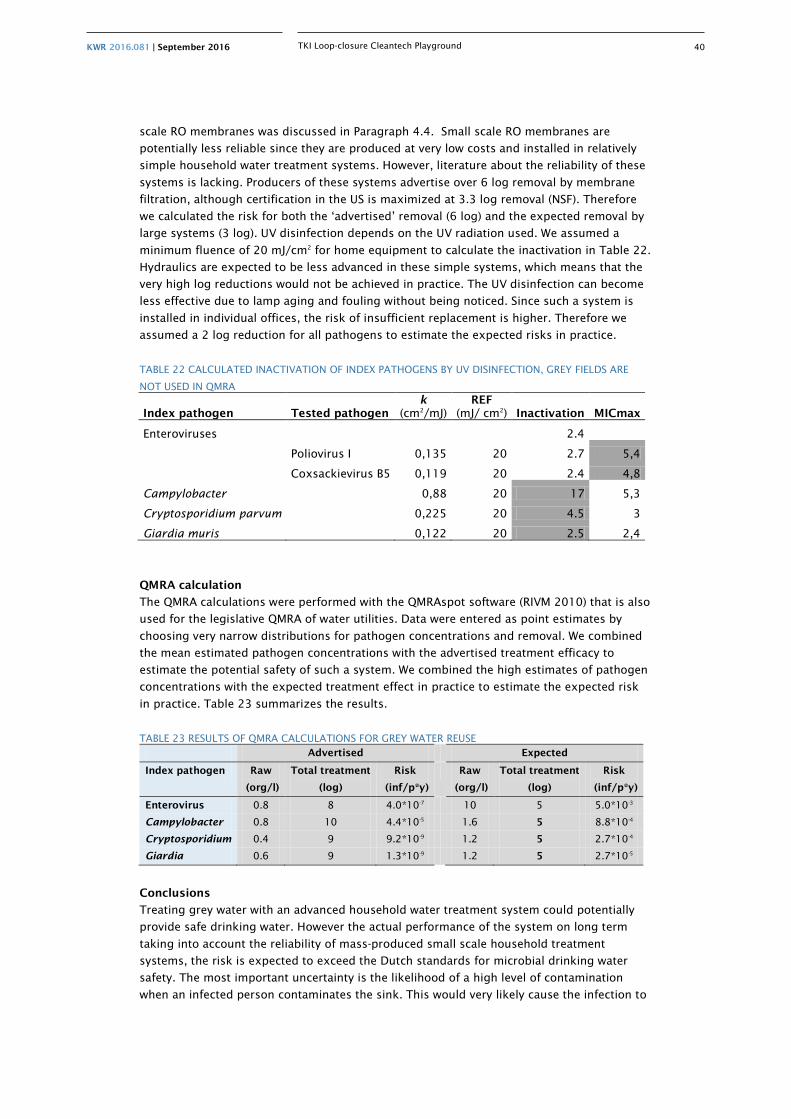
KWR 2016.081 | September 2016 40
TKI Loop-closure Cleantech Playground
scale RO membranes was discussed in Paragraph 4.4. Small scale RO membranes are
potentially less reliable since they are produced at very low costs and installed in relatively
simple household water treatment systems. However, literature about the reliability of these
systems is lacking. Producers of these systems advertise over 6 log removal by membrane
filtration, although certification in the US is maximized at 3.3 log removal (NSF). Therefore
we calculated the risk for both the ‘advertised’ removal (6 log) and the expected removal by
large systems (3 log). UV disinfection depends on the UV radiation used. We assumed a
minimum fluence of 20 mJ/cm2 for home equipment to calculate the inactivation in Table 22.
Hydraulics are expected to be less advanced in these simple systems, which means that the
very high log reductions would not be achieved in practice. The UV disinfection can become
less effective due to lamp aging and fouling without being noticed. Since such a system is
installed in individual offices, the risk of insufficient replacement is higher. Therefore we
assumed a 2 log reduction for all pathogens to estimate the expected risks in practice.
TABLE 22 CALCULATED INACTIVATION OF INDEX PATHOGENS BY UV DISINFECTION, GREY FIELDS ARE
NOT USED IN QMRA
Index pathogen Tested pathogen k
(cm2/mJ) REF
(mJ/ cm2) Inactivation MICmax
Enteroviruses 2.4
Poliovirus I 0,135 20 2.7 5,4
Coxsackievirus B5 0,119 20 2.4 4,8
Campylobacter 0,88 20 17 5,3
Cryptosporidium parvum 0,225 20 4.5 3
Giardia muris 0,122 20 2.5 2,4
QMRA calculation
The QMRA calculations were performed with the QMRAspot software (RIVM 2010) that is also
used for the legislative QMRA of water utilities. Data were entered as point estimates by
choosing very narrow distributions for pathogen concentrations and removal. We combined
the mean estimated pathogen concentrations with the advertised treatment efficacy to
estimate the potential safety of such a system. We combined the high estimates of pathogen
concentrations with the expected treatment effect in practice to estimate the expected risk
in practice. Table 23 summarizes the results.
TABLE 23 RESULTS OF QMRA CALCULATIONS FOR GREY WATER REUSE
Advertised Expected
Index pathogen Raw
(org/l)
Total treatment
(log)
Risk
(inf/p*y)
Raw
(org/l)
Total treatment
(log)
Risk
(inf/p*y)
Enterovirus 0.8 8 4.0*10-7 10 5 5.0*10-3
Campylobacter 0.8 10 4.4*10-5 1.6 5 8.8*10-4
Cryptosporidium 0.4 9 9.2*10-9 1.2 5 2.7*10-4
Giardia 0.6 9 1.3*10-9 1.2 5 2.7*10-5
Conclusions
Treating grey water with an advanced household water treatment system could potentially
provide safe drinking water. However the actual performance of the system on long term
taking into account the reliability of mass-produced small scale household treatment
systems, the risk is expected to exceed the Dutch standards for microbial drinking water
safety. The most important uncertainty is the likelihood of a high level of contamination
when an infected person contaminates the sink. This would very likely cause the infection to
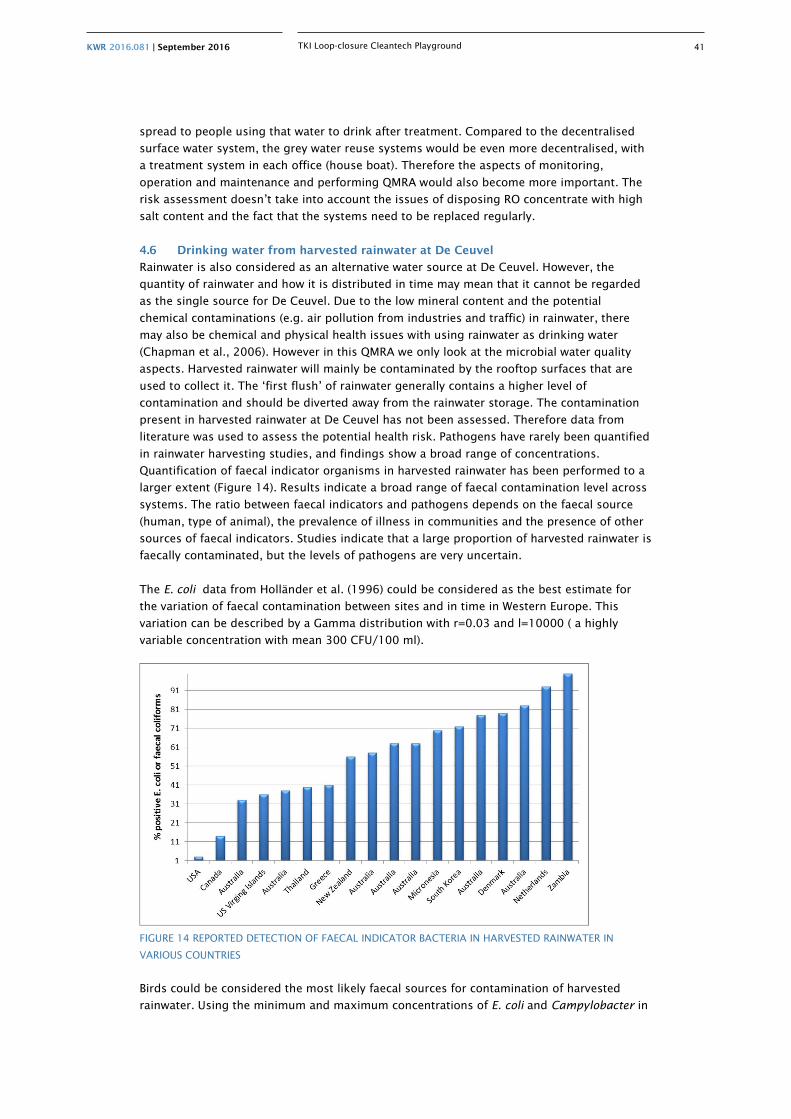
KWR 2016.081 | September 2016 41
TKI Loop-closure Cleantech Playground
spread to people using that water to drink after treatment. Compared to the decentralised
surface water system, the grey water reuse systems would be even more decentralised, with
a treatment system in each office (house boat). Therefore the aspects of monitoring,
operation and maintenance and performing QMRA would also become more important. The
risk assessment doesn’t take into account the issues of disposing RO concentrate with high
salt content and the fact that the systems need to be replaced regularly.
4.6 Drinking water from harvested rainwater at De Ceuvel
Rainwater is also considered as an alternative water source at De Ceuvel. However, the
quantity of rainwater and how it is distributed in time may mean that it cannot be regarded
as the single source for De Ceuvel. Due to the low mineral content and the potential
chemical contaminations (e.g. air pollution from industries and traffic) in rainwater, there
may also be chemical and physical health issues with using rainwater as drinking water
(Chapman et al., 2006). However in this QMRA we only look at the microbial water quality
aspects. Harvested rainwater will mainly be contaminated by the rooftop surfaces that are
used to collect it. The ‘first flush’ of rainwater generally contains a higher level of
contamination and should be diverted away from the rainwater storage. The contamination
present in harvested rainwater at De Ceuvel has not been assessed. Therefore data from
literature was used to assess the potential health risk. Pathogens have rarely been quantified
in rainwater harvesting studies, and findings show a broad range of concentrations.
Quantification of faecal indicator organisms in harvested rainwater has been performed to a
larger extent (Figure 14). Results indicate a broad range of faecal contamination level across
systems. The ratio between faecal indicators and pathogens depends on the faecal source
(human, type of animal), the prevalence of illness in communities and the presence of other
sources of faecal indicators. Studies indicate that a large proportion of harvested rainwater is
faecally contaminated, but the levels of pathogens are very uncertain.
The E. coli data from Holländer et al. (1996) could be considered as the best estimate for
the variation of faecal contamination between sites and in time in Western Europe. This
variation can be described by a Gamma distribution with r=0.03 and l=10000 ( a highly
variable concentration with mean 300 CFU/100 ml).
FIGURE 14 REPORTED DETECTION OF FAECAL INDICATOR BACTERIA IN HARVESTED RAINWATER IN
VARIOUS COUNTRIES
Birds could be considered the most likely faecal sources for contamination of harvested
rainwater. Using the minimum and maximum concentrations of E. coli and Campylobacter in
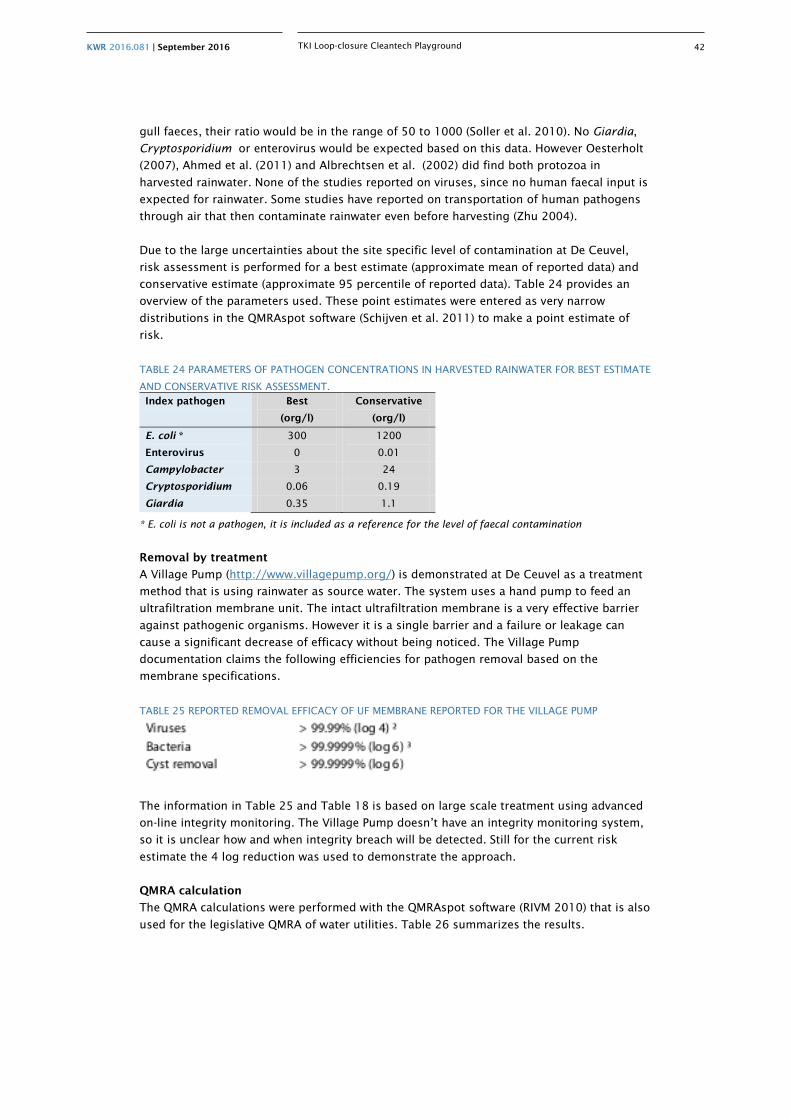
KWR 2016.081 | September 2016 42
TKI Loop-closure Cleantech Playground
gull faeces, their ratio would be in the range of 50 to 1000 (Soller et al. 2010). No Giardia,
Cryptosporidium or enterovirus would be expected based on this data. However Oesterholt
(2007), Ahmed et al. (2011) and Albrechtsen et al. (2002) did find both protozoa in
harvested rainwater. None of the studies reported on viruses, since no human faecal input is
expected for rainwater. Some studies have reported on transportation of human pathogens
through air that then contaminate rainwater even before harvesting (Zhu 2004).
Due to the large uncertainties about the site specific level of contamination at De Ceuvel,
risk assessment is performed for a best estimate (approximate mean of reported data) and
conservative estimate (approximate 95 percentile of reported data). Table 24 provides an
overview of the parameters used. These point estimates were entered as very narrow
distributions in the QMRAspot software (Schijven et al. 2011) to make a point estimate of
risk.
TABLE 24 PARAMETERS OF PATHOGEN CONCENTRATIONS IN HARVESTED RAINWATER FOR BEST ESTIMATE
AND CONSERVATIVE RISK ASSESSMENT.
Index pathogen Best
(org/l)
Conservative
(org/l)
E. coli *
Enterovirus
300
0
1200
0.01
Campylobacter 3 24
Cryptosporidium 0.06 0.19
Giardia 0.35 1.1
* E. coli is not a pathogen, it is included as a reference for the level of faecal contamination
Removal by treatment
A Village Pump (http://www.villagepump.org/) is demonstrated at De Ceuvel as a treatment
method that is using rainwater as source water. The system uses a hand pump to feed an
ultrafiltration membrane unit. The intact ultrafiltration membrane is a very effective barrier
against pathogenic organisms. However it is a single barrier and a failure or leakage can
cause a significant decrease of efficacy without being noticed. The Village Pump
documentation claims the following efficiencies for pathogen removal based on the
membrane specifications.
TABLE 25 REPORTED REMOVAL EFFICACY OF UF MEMBRANE REPORTED FOR THE VILLAGE PUMP
The information in Table 25 and Table 18 is based on large scale treatment using advanced
on-line integrity monitoring. The Village Pump doesn’t have an integrity monitoring system,
so it is unclear how and when integrity breach will be detected. Still for the current risk
estimate the 4 log reduction was used to demonstrate the approach.
QMRA calculation
The QMRA calculations were performed with the QMRAspot software (RIVM 2010) that is also
used for the legislative QMRA of water utilities. Table 26 summarizes the results.
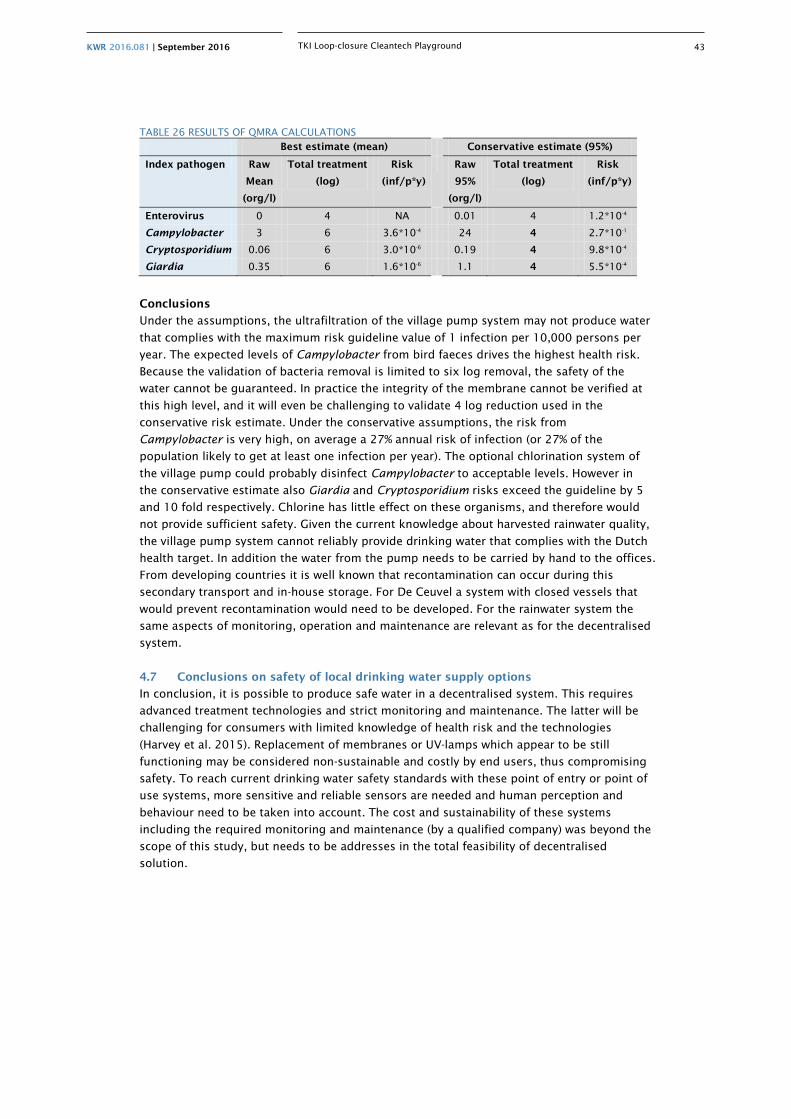
KWR 2016.081 | September 2016 43
TKI Loop-closure Cleantech Playground
TABLE 26 RESULTS OF QMRA CALCULATIONS
Best estimate (mean) Conservative estimate (95%)
Index pathogen Raw
Mean
(org/l)
Total treatment
(log)
Risk
(inf/p*y)
Raw
95%
(org/l)
Total treatment
(log)
Risk
(inf/p*y)
Enterovirus 0 4 NA 0.01 4 1.2*10-4
Campylobacter 3 6 3.6*10-4 24 4 2.7*10-1
Cryptosporidium 0.06 6 3.0*10-6 0.19 4 9.8*10-4
Giardia 0.35 6 1.6*10-6 1.1 4 5.5*10-4
Conclusions
Under the assumptions, the ultrafiltration of the village pump system may not produce water
that complies with the maximum risk guideline value of 1 infection per 10,000 persons per
year. The expected levels of Campylobacter from bird faeces drives the highest health risk.
Because the validation of bacteria removal is limited to six log removal, the safety of the
water cannot be guaranteed. In practice the integrity of the membrane cannot be verified at
this high level, and it will even be challenging to validate 4 log reduction used in the
conservative risk estimate. Under the conservative assumptions, the risk from
Campylobacter is very high, on average a 27% annual risk of infection (or 27% of the
population likely to get at least one infection per year). The optional chlorination system of
the village pump could probably disinfect Campylobacter to acceptable levels. However in
the conservative estimate also Giardia and Cryptosporidium risks exceed the guideline by 5
and 10 fold respectively. Chlorine has little effect on these organisms, and therefore would
not provide sufficient safety. Given the current knowledge about harvested rainwater quality,
the village pump system cannot reliably provide drinking water that complies with the Dutch
health target. In addition the water from the pump needs to be carried by hand to the offices.
From developing countries it is well known that recontamination can occur during this
secondary transport and in-house storage. For De Ceuvel a system with closed vessels that
would prevent recontamination would need to be developed. For the rainwater system the
same aspects of monitoring, operation and maintenance are relevant as for the decentralised
system.
4.7 Conclusions on safety of local drinking water supply options
In conclusion, it is possible to produce safe water in a decentralised system. This requires
advanced treatment technologies and strict monitoring and maintenance. The latter will be
challenging for consumers with limited knowledge of health risk and the technologies
(Harvey et al. 2015). Replacement of membranes or UV-lamps which appear to be still
functioning may be considered non-sustainable and costly by end users, thus compromising
safety. To reach current drinking water safety standards with these point of entry or point of
use systems, more sensitive and reliable sensors are needed and human perception and
behaviour need to be taken into account. The cost and sustainability of these systems
including the required monitoring and maintenance (by a qualified company) was beyond the
scope of this study, but needs to be addresses in the total feasibility of decentralised
solution.
KWR 2016.081 | September 2016 44
TKI Loop-closure Cleantech Playground
5 Financial considerations, institutional aspects, user and stakeholder experiences
5.1 Introduction
In urban areas, utilities such as power, heat and drinking water supply, but also wastewater
collection and treatment are usually centralised. Households and offices are connected to a
large scale network, operated and managed by centralised utility companies (e.g. Waternet)
that provide the different services households need. Centralised utilities for water, electricity
and heat in the developed world have been in place for decades and their business model
has not changed much since then. Robust, large-scale systems were built to supply as many
people as possible, who pay for their resource consumption and through periodic fees.
Products are generated in centralised plants – where safety and quality are closely monitored
- and delivered to customers through an extensive distribution network. End users pay not
only for the products itself, but also for the service of having it delivered, for operation and
maintenance of the plants and network, for safety and quality insurance.
An alternative to the centralised utility system is the implementation of decentralised
technologies - or micro-utilities - such as small scale solar and wind energy production, local
wastewater treatment or small scale drinking water production. These emerging
technologies are subject to optimisation, thus are not immune to failure with respect to
financial, social, health and safety aspects. Implementing micro-utilities increases the share
of operations users need to be responsible for, thus increasing the likelihood of failure of
the systems, due to less expertise. Finally, although the numbers of people affected by the
failure of one micro-utility is less than for one centralised utility, the likelihood of failure is
higher with micro-utilities since the number of systems is higher. Decentralised systems do
not necessarily suit the needs of any local community, as each of these technologies require
specific environmental, spatial or social conditions.
In this chapter financial considerations of centralised and decentralised utilities are
presented and discussed. Furthermore, the results of the research conducted on the legal
and institutional aspects of De Ceuvel are reported, as well as specific user behaviour and
experiences at De Ceuvel, including survey results.
5.2 Financial considerations
The De Ceuvel situation as it is today can be interpreted as a hybrid micro-utility system that
uses both on-grid and off-grid utility systems and remains in-between a conventional area
supplied with centralised utilities and an alternative area fully supplied with decentralised
utilities.
5.2.1 Centralised, hybrid (real) and decentralised De Ceuvel cases
To study the financial aspects of utility systems for De Ceuvel, 3 cases have been shaped:
1. Virtual De Ceuvel case, fully connected to the common centralised utilities.
2. Real De Ceuvel case, partially providing utilities in a decentralised manner.
3. Virtual De Ceuvel case, fully providing its utilities in a decentralised manner.
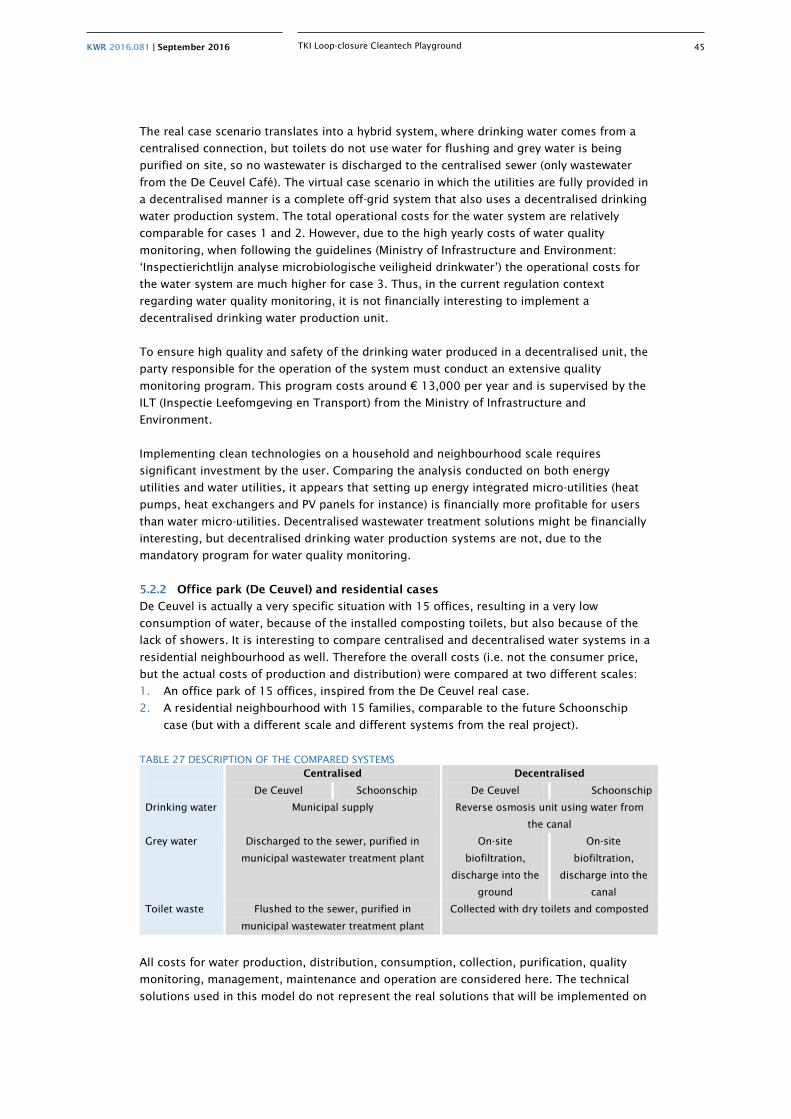
KWR 2016.081 | September 2016 45
TKI Loop-closure Cleantech Playground
The real case scenario translates into a hybrid system, where drinking water comes from a
centralised connection, but toilets do not use water for flushing and grey water is being
purified on site, so no wastewater is discharged to the centralised sewer (only wastewater
from the De Ceuvel Café). The virtual case scenario in which the utilities are fully provided in
a decentralised manner is a complete off-grid system that also uses a decentralised drinking
water production system. The total operational costs for the water system are relatively
comparable for cases 1 and 2. However, due to the high yearly costs of water quality
monitoring, when following the guidelines (Ministry of Infrastructure and Environment:
‘Inspectierichtlijn analyse microbiologische veiligheid drinkwater’) the operational costs for
the water system are much higher for case 3. Thus, in the current regulation context
regarding water quality monitoring, it is not financially interesting to implement a
decentralised drinking water production unit.
To ensure high quality and safety of the drinking water produced in a decentralised unit, the
party responsible for the operation of the system must conduct an extensive quality
monitoring program. This program costs around € 13,000 per year and is supervised by the
ILT (Inspectie Leefomgeving en Transport) from the Ministry of Infrastructure and
Environment.
Implementing clean technologies on a household and neighbourhood scale requires
significant investment by the user. Comparing the analysis conducted on both energy
utilities and water utilities, it appears that setting up energy integrated micro-utilities (heat
pumps, heat exchangers and PV panels for instance) is financially more profitable for users
than water micro-utilities. Decentralised wastewater treatment solutions might be financially
interesting, but decentralised drinking water production systems are not, due to the
mandatory program for water quality monitoring.
5.2.2 Office park (De Ceuvel) and residential cases
De Ceuvel is actually a very specific situation with 15 offices, resulting in a very low
consumption of water, because of the installed composting toilets, but also because of the
lack of showers. It is interesting to compare centralised and decentralised water systems in a
residential neighbourhood as well. Therefore the overall costs (i.e. not the consumer price,
but the actual costs of production and distribution) were compared at two different scales:
1. An office park of 15 offices, inspired from the De Ceuvel real case.
2. A residential neighbourhood with 15 families, comparable to the future Schoonschip
case (but with a different scale and different systems from the real project).
TABLE 27 DESCRIPTION OF THE COMPARED SYSTEMS Centralised Decentralised
De Ceuvel Schoonschip De Ceuvel Schoonschip
Drinking water Municipal supply Reverse osmosis unit using water from
the canal
Grey water Discharged to the sewer, purified in
municipal wastewater treatment plant
On-site
biofiltration,
discharge into the
ground
On-site
biofiltration,
discharge into the
canal
Toilet waste Flushed to the sewer, purified in
municipal wastewater treatment plant
Collected with dry toilets and composted
All costs for water production, distribution, consumption, collection, purification, quality
monitoring, management, maintenance and operation are considered here. The technical
solutions used in this model do not represent the real solutions that will be implemented on
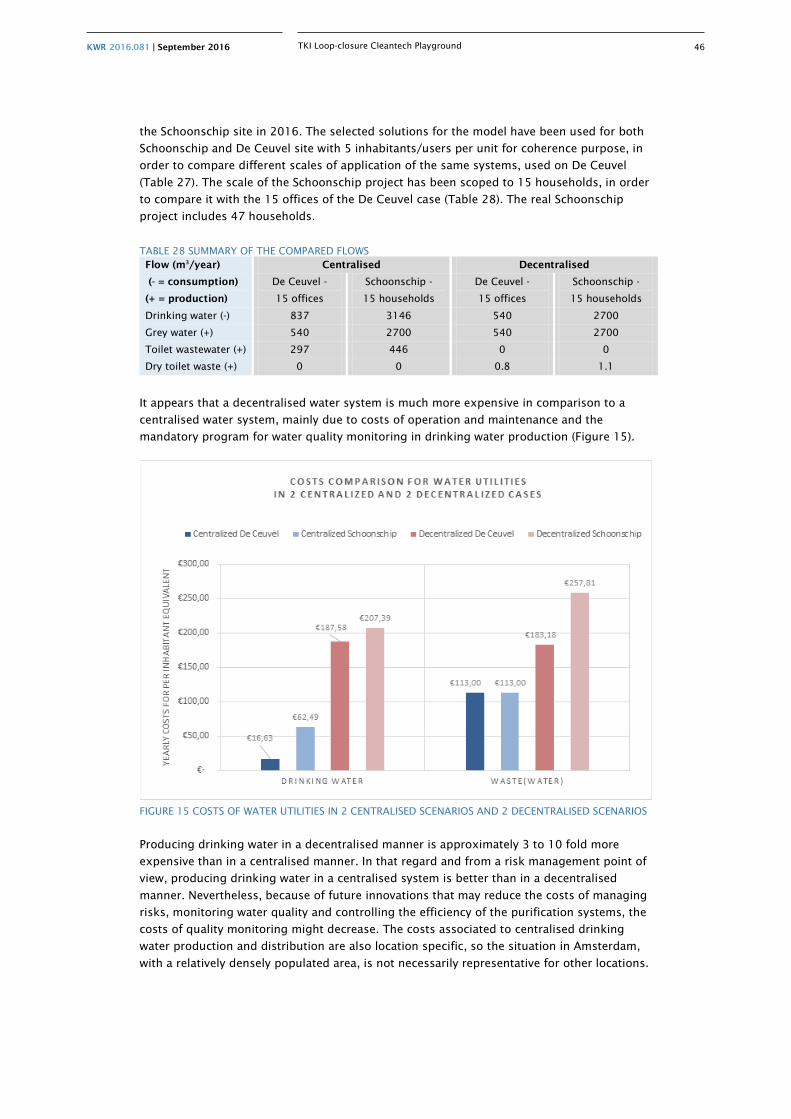
KWR 2016.081 | September 2016 46
TKI Loop-closure Cleantech Playground
the Schoonschip site in 2016. The selected solutions for the model have been used for both
Schoonschip and De Ceuvel site with 5 inhabitants/users per unit for coherence purpose, in
order to compare different scales of application of the same systems, used on De Ceuvel
(Table 27). The scale of the Schoonschip project has been scoped to 15 households, in order
to compare it with the 15 offices of the De Ceuvel case (Table 28). The real Schoonschip
project includes 47 households.
TABLE 28 SUMMARY OF THE COMPARED FLOWS Flow (m3/year)
(- = consumption)
(+ = production)
Centralised Decentralised
De Ceuvel -
15 offices
Schoonschip -
15 households
De Ceuvel -
15 offices
Schoonschip -
15 households
Drinking water (-) 837 3146 540 2700
Grey water (+) 540 2700 540 2700
Toilet wastewater (+) 297 446 0 0
Dry toilet waste (+) 0 0 0.8 1.1
It appears that a decentralised water system is much more expensive in comparison to a
centralised water system, mainly due to costs of operation and maintenance and the
mandatory program for water quality monitoring in drinking water production (Figure 15).
FIGURE 15 COSTS OF WATER UTILITIES IN 2 CENTRALISED SCENARIOS AND 2 DECENTRALISED SCENARIOS
Producing drinking water in a decentralised manner is approximately 3 to 10 fold more
expensive than in a centralised manner. In that regard and from a risk management point of
view, producing drinking water in a centralised system is better than in a decentralised
manner. Nevertheless, because of future innovations that may reduce the costs of managing
risks, monitoring water quality and controlling the efficiency of the purification systems, the
costs of quality monitoring might decrease. The costs associated to centralised drinking
water production and distribution are also location specific, so the situation in Amsterdam,
with a relatively densely populated area, is not necessarily representative for other locations.
KWR 2016.081 | September 2016 47
TKI Loop-closure Cleantech Playground
Based on the cost analysis, it appears that operation and maintenance carry a high share of
the costs associated with sanitation solutions (when choosing for dry sanitation, i.e.
composting toilets and individual grey water treatment). Results also show that in the real
case of De Ceuvel, dry sanitation happens to be a few euros more expensive per person per
year, compared to a centralised solution, even though the main operation and maintenance
tasks are being performed by volunteers from the community, as part of their involvement in
maintaining the site. When operation and maintenance labour costs are charged with a
conventional rate, the decentralised sanitation solutions used on De Ceuvel become more
expensive than the centralised solutions (€ 70 and € 144 per person per year difference for
De Ceuvel and Schoonschip case respectively).
5.2.3 Overall financial analysis results
Concerning drinking water production, quality monitoring appear to be the main costs
carrying aspect, making decentralised drinking water production 3 to 10 fold more
expensive compared to centralised drinking water production. Only when the costs for
quality monitoring are reduced with about 90%, decentralised drinking water production
might be economically more favourable, but this depends highly on the applied system and
e.g. intensity of use.
When labour costs for operation and maintenance are minimized by the deployment of
volunteers in decentralised wastewater treatment, overall costs can be comparable with
centralised treatment, but such a comparison is not completely fair. Furthermore, in the
current costs for centralised drinking water production and wastewater treatment, several
additional costs are included, like costs for environmental protection, research &
development and additional municipal and governmental tax.
5.3 Institutional aspects
Legislation and responsibilities regarding decentralised water technology are not very clear.
While seeking for information, the institutional environment around decentralised water
initiatives became clearer to the research consortium.
5.3.1 Individual Wastewater Treatment (IWT) and institutions
Under the Environmental Protection Act in the Netherlands, Dutch municipalities have a duty
to make effective arrangements for the collection and removal of all wastewater originating
from properties within their jurisdiction. According to Rijkswaterstaat, since January 1st
2005 all untreated discharges must be remediated, including in areas where there is no
sewerage present. In such areas, wastewater has to be treated in Individual Wastewater
Treatment, or ‘IWT’ (Individuele Behandeling van Afvalwater, ‘IBA’, in Dutch) facilities before
discharge into soil or surface-waters. IWT include different types of systems, the most
common is the septic tank. Biorotors, oxidation beds or constructed wetlands are other
examples of systems assimilated to IBA systems.
While Rijkswaterstaat is responsible for managing water quality throughout the Netherlands,
the water boards are in charge of the purification of municipal wastewater, and the
municipalities are responsible for collection of municipal wastewater, runoff and
groundwater. Thus, water boards and municipalities also have to cope with IWT systems
discharging purified wastewater into soil and groundwater.
According to the Environmental Protection Act (Wet Milieubeheer) Article 10.33,
municipalities are responsible for the maintenance of municipal IWTs as part of their
administrative duties. The standards that these facilities should meet are therefore stated in
the municipal sewage plan (Gemeentelijk RioleringsPlan, GRP). The 2016- 2021 municipal
KWR 2016.081 | September 2016 48
TKI Loop-closure Cleantech Playground
sewage plan for Amsterdam (https://www.waternet.nl/media/88323/grp_amsterdam_2016-
2021_-_definitieve_groene_boekje.pdf) does not specify regulations for IWTs outside of the
environmental boundaries set in the Environmental Protection Law. However, it does specify
the intention to increase the implementation of IWTs in innovative projects. Before 1st January
2008, newly implemented water discharging facilities were required to request a permit, for
which the requirements are described by the CIW/CUWVO (Co-ordination Committee on
water management and the implementation of the Pollution of Surface Water Act). In 1999,
the CIW/CUWVO published the latest report available on this topic, ‘Individuele Behandeling
van Afvalwater IBA-Systemen’, relating to discharges of domestic wastewater from private
homes. In this document the requirements for quality monitoring are described and the
specifications for maintenance of IWT systems are detailed in Appendix II.
5.3.2 Needed permits
The De Ceuvel association, this is the governing body uniting the renters, needed to get the
following permits before they were allowed to start building:
1. A change to the zoning plan (bestemmingsplan) for the whole ground;
2. A building permit for each individual boat;
3. A permit to discharge water (disposal of effluent).
Permits 1 and 2 were needed and obtained from the municipality (Stadsdeel Noord) and
permit 3 was obtained from the Omgevingsdienst Noordzeekanaal (ODNZK), but actually
instead an environmental permit (omgevingsloket vergunning) should have been obtained
from the Ministry of Infrastructure and Environment.
1. In the Netherlands, establishment of any installation or business at a particular location
must be in-line with the municipal zoning plan (bestemmingsplan). With zoning plans,
the municipality establishes the final destination of land and buildings. The plan
provides detailed rules on all kinds of issues, such as houses, streets, shops, factories,
forests and the like. The zoning plan is the only plan with regard to spatial planning,
which establishes rights and obligations. Industries impacting the environment or
considered as potentially dangerous for local citizens will have to be located further
than a certain distance from any living area, which also appeared as a main obstacle for
De Ceuvel implementation, due to the environmental activities on-site (e.g. waste
treatment). Because the De Ceuvel site was not zoned as a working area but only as
a ”road”, building creative offices was not in line with the Buiksloterham zoning plan.
Therefore, a submission for a zoning plan restructuration had to be submitted to the
local municipality (Stadsdeel Noord). In July 2013, the procedure with Stadsdeel Noord,
which lasted 9 months, ended with the approval of the zoning plan restructuration that
allowed De Ceuvel to be a building area. For individuals or organizations that would like
to build, demolish or modify a household, the zoning plan should not be an issue as
long as the location of the household fits into a “living area”, as defined in the local
zoning plan.
2. Before starting any construction, whether it is a boat on the ground, a house, a living or
working building, a building permit is required. The application for this building permit
has to be submitted to the municipality (Stadsdeel), and will be studied regarding the
relevant Housing Act and the relevant Building Decree (Bouwbesluit). This building
decree can be found on the VROM website. In the implementation and use of
decentralized clean technologies on a small scale, the first step in applying a building
permit is important. Because the Building Decree sets out technical requirements for
existing and new construction, including rules on every system providing basic utilities
(such as drinking water supply, wastewater treatment, sanitation, heating, ventilation,
KWR 2016.081 | September 2016 49
TKI Loop-closure Cleantech Playground
windows and others), the application for a building permit includes technical
descriptions of all these systems. For each of these basic utilities, different existing
solutions can be chosen (e.g. connection to the sewer for wastewater discharge) or the
project owner can propose its own unusual solution (e.g. no connection to the sewer
and on-site wastewater treatment). Hence, because municipality employees and
departments are not necessarily familiar with these new solutions, implementing
decentralised systems or clean technologies requires a significant amount of
information and description to prove that the suggested solutions or systems are as
efficient and safe as the common and well-known solutions. On the De Ceuvel site,
application for building permits was of course required for each retrofitted boat the
community wanted to install. The main difficulty was to change the application for each
boat. Because each boat installed on De Ceuvel was different, a custom process was
required for the design of the whole infrastructure installation (water, heat, aeration,
insulation). Therefore, building a robust application was the first significant step
Metabolic and the De Ceuvel community had to go through in order to be able to
implement decentralised solutions for wastewater treatment, electricity and heating
supply. The required level of specialized knowledge was quite advanced because of the
highly technical content. Thus, specialized professionals (architects, civil engineers)
must handle this part of the application for building permits pertaining to decentralised
technologies. In the end, the De Ceuvel community received building permits on October
22nd 2013 for all the boats after a 6 month procedure. After receiving the building
permits, people can note objections against the project within 6 weeks. No objections
were received by the De Ceuvel building permit changes.
3. According to the Dutch discharge decree (water handbook of Rijkswaterstaat, Ministry of
Infrastructure and Environment) a permit is required to discharge water. This permit is
different depending on whether a business (inrichtingen), a household (huishoudens) or
another actor (buiten inrichtingen en huishoudens) is enquiring it.
Metabolic asked for a license through the Omgevingsdienst Noordzeekanaal (ODNZK)
concerning purification and discharge of wastewater into the ground on De Ceuvel site.
The activity decree (activiteitenbesluit) that Metabolic filled was, in fact, for businesses,
although the De Ceuvel site fits into the “others” category (buiten inrichtingen en
huishoudens), instead of business category. Thus, the De Ceuvel community should have
enquired another specific license/permit for this activity: an environmental permit
(omgevingsloket vergunning), delivered by the Ministry of Infrastructure and
Environment and specific to this category of undefined actors (not households, not
businesses).
The activity decree (activiteitenbesluit) declaration was given quite easily by ODNZK, but
just after the start of the project, ODNZK started to ask questions. Metabolic and
Waternet could convince ODNZK that the infiltration of the effluents was done in a safe
and monitored way and that the infiltration was part of an innovative project. ODNZK
was flexible with the project; they accepted an easier way of monitoring the effluent
quality than what is normally required3. The monitoring activities according to the
normally required NEN norm (CIW 1999) are too costly to perform at De Ceuvel.
5.3.3 Quality monitoring of IWT
One main point arising after analysing the current legislation is that decentralised
wastewater solutions are still unclearly covered by regulation. It is difficult to identify who, in
the current legislative and institutional system, is responsible for monitoring and controlling
3 http://www.infomil.nl/onderwerpen/klimaat-lucht/handboek-water/activiteiten/lozen-per-activiteit/technische/iba/#ActiviteitenbesluitenhetBesluitlozingafvalwaterhuishoudens
KWR 2016.081 | September 2016 50
TKI Loop-closure Cleantech Playground
decentralised sanitation initiatives, since the number of such projects remains relatively low
(STOWA & Rioned 2015).
Concerning De Ceuvel project, for instance, it is still unclear who is responsible for the
quality monitoring of the decentralised systems. Throughout 2014, tests have been
performed within the research program to monitor the quality of wastewater effluent
discharged into the ground, but how will the monitoring of wastewater quality be conducted
on a longer term, when the research program ends or focuses on other research areas?
While the current legislation requires every IWT system (15 small scale biofilters in the case
of De Ceuvel) to be monitored twice a year on effluent quality, there is still no clear process
and agreement for the stakeholders of De Ceuvel project regarding who and how should the
quality monitoring of these systems be performed.
Based on our understanding of the mentioned legislation articles, the stakeholders who
should be involved in that matter are the following:
• the waterboard Amstel, Gooi en Vecht, as the party supervising wastewater
management in the area of Amsterdam;
• the municipality of Amsterdam, as the party responsible for individual wastewater
treatment systems, as part of the municipal sewage plan;
• the water utility company Waternet, as the party commissioned by the waterboard and
the municipality of Amsterdam to implement the municipal sewage plan;
• the De Ceuvel community, as initiator of the De Ceuvel project;
• Metabolic, as part of the project team, advisor and constructor of the sanitation
systems on De Ceuvel site.
5.3.4 Local drinking water production and delivery
According to article 4 in the Drinking water law (Drinkwaterwet), only the drinking water
companies are allowed to deliver drinking water. Therefore, decentralised drinking water
production and delivery by other organisations is not allowed, due to the monopoly position
of drinking water companies in the Netherlands. The only exceptions to this law are when
the centralised delivery of drinking water is not efficient and there are no issues for public
health.
By law, the priorities of the drinking water systems are:
1. the drinking water needs a guaranty that it is safe;
2. it needs to be produced in a sustainable manner and;
3. it needs to be produced against acceptable costs.
In theory, decentralised production of drinking water is allowed when these three priorities
are fulfilled. However, to ensure that the drinking water quality is guaranteed, a
comprehensive monitoring program is obliged, which will increase the costs, so it becomes
difficult to still produce at acceptable costs. However, local drinking water production from
ground water with a limited monitoring program is tolerated at camping sites in The
Netherlands.
5.3.5 Struvite
Since 2015 the fertiliser law was adapted to include recovered phosphorus as legal fertiliser.
In the Stowa 2015-34 report the following is written about struvite legislation:
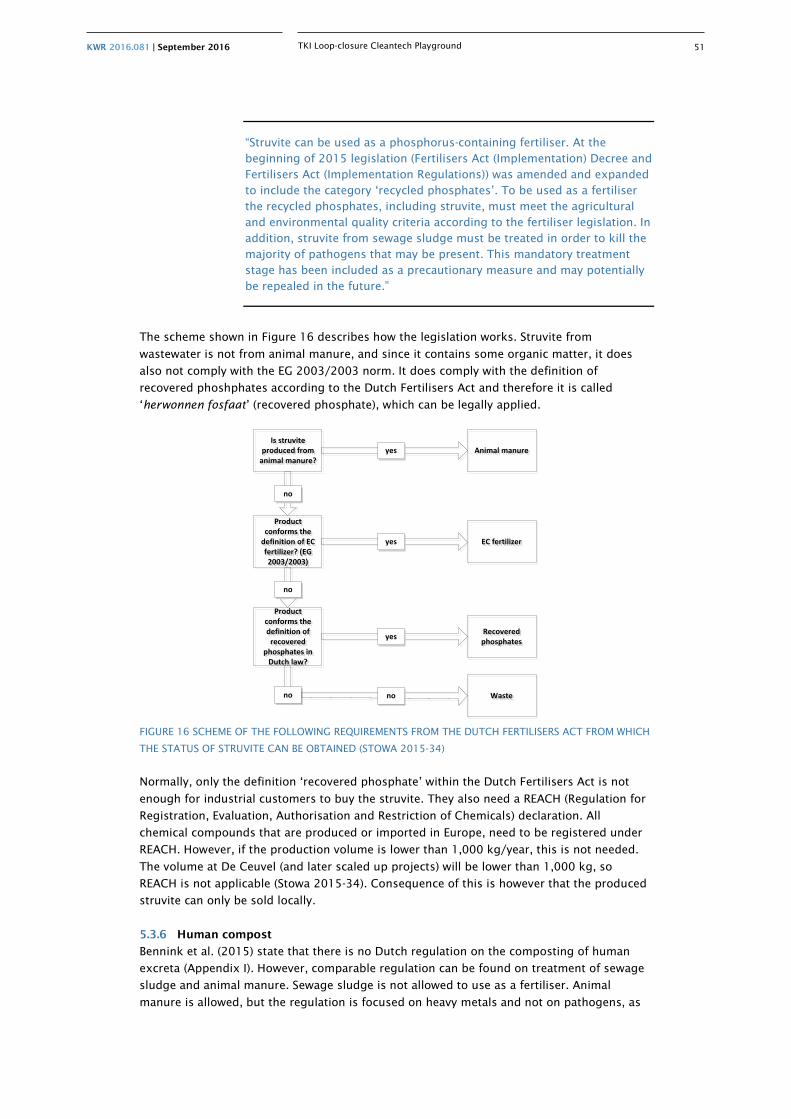
KWR 2016.081 | September 2016 51
TKI Loop-closure Cleantech Playground
“Struvite can be used as a phosphorus-containing fertiliser. At the beginning of 2015 legislation (Fertilisers Act (Implementation) Decree and Fertilisers Act (Implementation Regulations)) was amended and expanded to include the category ‘recycled phosphates’. To be used as a fertiliser the recycled phosphates, including struvite, must meet the agricultural and environmental quality criteria according to the fertiliser legislation. In addition, struvite from sewage sludge must be treated in order to kill the majority of pathogens that may be present. This mandatory treatment stage has been included as a precautionary measure and may potentially be repealed in the future.”
The scheme shown in Figure 16 describes how the legislation works. Struvite from
wastewater is not from animal manure, and since it contains some organic matter, it does
also not comply with the EG 2003/2003 norm. It does comply with the definition of
recovered phoshphates according to the Dutch Fertilisers Act and therefore it is called
‘herwonnen fosfaat’ (recovered phosphate), which can be legally applied.
Is struvite produced from
animal manure?
Is struvite produced from
animal manure?
Product conforms the
definition of EC fertilizer? (EG 2003/2003)
Product conforms the
definition of EC fertilizer? (EG 2003/2003)
Product conforms the definition of
recovered phosphates in
Dutch law?
Product conforms the definition of
recovered phosphates in
Dutch law?
Animal manureAnimal manure
EC fertilizerEC fertilizer
Recovered phosphatesRecovered phosphates
WasteWaste
yes
no
no
yes
yes
no no
FIGURE 16 SCHEME OF THE FOLLOWING REQUIREMENTS FROM THE DUTCH FERTILISERS ACT FROM WHICH
THE STATUS OF STRUVITE CAN BE OBTAINED (STOWA 2015-34)
Normally, only the definition ‘recovered phosphate’ within the Dutch Fertilisers Act is not
enough for industrial customers to buy the struvite. They also need a REACH (Regulation for
Registration, Evaluation, Authorisation and Restriction of Chemicals) declaration. All
chemical compounds that are produced or imported in Europe, need to be registered under
REACH. However, if the production volume is lower than 1,000 kg/year, this is not needed.
The volume at De Ceuvel (and later scaled up projects) will be lower than 1,000 kg, so
REACH is not applicable (Stowa 2015-34). Consequence of this is however that the produced
struvite can only be sold locally.
5.3.6 Human compost
Bennink et al. (2015) state that there is no Dutch regulation on the composting of human
excreta (Appendix I). However, comparable regulation can be found on treatment of sewage
sludge and animal manure. Sewage sludge is not allowed to use as a fertiliser. Animal
manure is allowed, but the regulation is focused on heavy metals and not on pathogens, as
KWR 2016.081 | September 2016 52
TKI Loop-closure Cleantech Playground
should be the case for human waste. To get application of human compost allowed in the
Netherlands, two options are possible: 1) the compost needs to get an ‘End-of-Waste’ status
or 2) the compost needs to comply with the ‘Keurcompost’ norms.
End-of-Waste
The European Waste Framework Directive (EWFD) provides a so-called End-of-Waste (EoW)
route. With an EoW status, potentially reusable waste streams like human faeces are no
longer classified as “waste” but as “products” and will be exempted from the European waste
regulations. Criteria for a waste stream to qualify for the EoW status are (Bennink et al.
2015):
• The waste stream is commonly used for specific purposes.
• There is a market or demand.
• The waste stream meets the technical requirements for the specific purposes and the
legislation and standards applicable to products.
• The use of the waste stream has on the whole no adverse environmental or health
effects.
The human compost at De Ceuvel is probably not safe enough to comply with the ‘no health
effects’ criteria. For this, a longer storage time is needed or a higher temperature during
composting. Because of the small scale and the possibility to use the compost locally, the
first two criteria are easier to comply with. Since the compost contains organic matter as well
as nutrients, it probably meets the technical requirements.
Keurcompost
Keurcompost is a certified high quality soil conditioner that is rich in stable organic matter.
Due to the strict production requirements for Keurcompost, the product is guaranteed to be
free of weed seeds, pathogens and non-soil components, unlike when raw organic streams
would be used as soil conditioner (Bennink et al. 2015).
The human compost at De Ceuvel did not comply with the strict Keurcompost norms. The
amount of detected indicator organisms for pathogens was too high, even after 11 months
of storage. Also the ratios of Copper and Zinc compared to the nutrients content were too
high in some samples. Other heavy metals were present in low enough concentrations.
It can be concluded that although there is no regulation in The Netherlands for human
compost, the chance that it is legally allowed to apply it for commercial purposes is small. It
is difficult to make the compost comply with the End-of-Waste or Keurcompost criteria.
5.3.7 Scalability and responsibilities
Research questions on the institutional aspect regarding scalability and responsibility were:
1. How can technologies on De Ceuvel be scaled to other projects?
2. What are the responsibilities of different stakeholders?
3. How can these responsibilities be developed towards the future?
Scalability
The De Ceuvel is a unique site, but the used technologies cannot be scaled up easily. The
user acceptance of the composting toilets was quite low (see Chapter 6.3), and therefore
these toilets probably will not be used at other sites. This means that the reduction in
flushing water will be lower at other sites and a sewer system will be necessary. The
production of grey water by households will be much higher, because they use showers and
washing machines. The grey water will also be more polluted with for example soaps. The
question is whether an individual grey water biofilter is still feasible then. The filters will
KWR 2016.081 | September 2016 53
TKI Loop-closure Cleantech Playground
require more space than the ones used at De Ceuvel, because of the higher amount of water
to be treated. On the other side, the monitoring at De Ceuvel proved that low-tech biofilters
are able to treat grey water. On other sites, shared biofilters might be suitable for grey water
treatment, however research is needed to prove that they are able to remove compounds like
soaps and personal care products. AWWS developed a small scale mobile wastewater
treatment system that can be used instead of biofilters (Appendix III). With this system, also
the toilet wastewater can be treated.
Local production of drinking water is not advised when scaling up. The research at De Ceuvel
showed that costs and the environmental impact of locally produced drinking water are not
lower than centrally produced water, and that safety cannot be guaranteed. Next to that, the
law in the Netherlands does not allow locally produced drinking water distributed by another
party than the conventional drinking water companies. Considering these results, Waternet
(as conventional drinking water company) will not continue with (research on) local drinking
water production.
Responsibilities
At De Ceuvel, Metabolic, under command of the de Ceuvel association, has installed the grey
water biofilters and the composting system. The association has become operator/manager
of the systems after realisation, even though it is difficult to identify who, in the current
legislative and institutional system, is responsible for monitoring and controlling
decentralised sanitation initiatives (see paragraph 5.3.3). At other sites, it is still an option
that a third party (e.g. a contractor) is doing this, but a more common option is that the
municipality is responsible for this, forced by the Environmental Protection Act (Wet
Milieubeheer). In Amsterdam, the water tasks of the municipality are executed by Waternet.
A trend is that citizens want to have more control of normally public utilities. However,
Waternet (on behalf of the municipality and water board) has the responsibility for ensuring
public health and therefore is collecting and treating wastewater. Technically, it is possible
that citizens are treating their own wastewater (like De Ceuvel). In that case, a future task of
Waternet can be to control whether this treatment is done in such a way that the risks for
public health are minimalized. At De Ceuvel, this task is not executed by Waternet, but by
the municipality (via the Omgevingsdienst Noordzeekanaal (ODNZK)), since the effluent of
the biofilters was infiltrated in the soil and the compost is not yet exposed of externally. For
future projects with individual wastewater treatment, it is therefore important to find out
who controls public health risks. That party should also receive a sort of tax income to fulfil
the control. This means that even when citizens are completely treating their own
wastewater, they still need to pay some tax.
Waternet does not have a vision yet on future tasks and responsibilities regarding this issue.
The experience on De Ceuvel helped to make a start getting such a vision, but more research
and experience with bigger, more representative projects, is needed to finalise it. An
important question is whether the responsibilities of Waternet can still be fulfilled, when
tasks are being executed by citizens or third parties.
5.4 User behaviour and satisfaction
One primary aim of the Cleantech Playground was to build a community project with the
involvement of participants who did not necessarily have specialized technical knowledge.
The objective was to showcase how people can reinvent their relationship with resources
(energy, water, food) around their domestic environments. From the beginning of this
project, future users were invited to participate in construction activities at this Do-It-
Yourself (DIY) eco-office park. Here information about user behaviour and survey results
KWR 2016.081 | September 2016 54
TKI Loop-closure Cleantech Playground
about satisfaction of office renters on De Ceuvel is presented. Surveys were conducted
during summer 2014 and December 2014. Results from the survey are shown as indicators
of the general opinion of renters. While during Summer 2014, 8 companies (and users
associated) completed the survey, this second survey was completed by 10 companies. The
difference in the number of answers is due to additional companies who settled on De
Ceuvel after the summer.
The survey of De Ceuvel renters showed that although high sustainability ambitions
influenced their interest to be involved in the project, money was also one of the main
motivating factors, as finding an office space in Amsterdam could sometimes be difficult and
expensive. Renter motivations were very diverse and had and still have repercussions on
their involvement in thinking, designing, prototyping De Ceuvel and technologies.
Users have been involved in different phases, but have significantly contributed to the
preparation of the boats and construction of different clean technologies (particularly the
water systems). The first milestone of their involvement is the signing of a sustainability
manifesto in August 2013, in which they committed to changing their daily habits in order to
fulfil the sustainability goals of the site. This includes reducing energy use in smart ways,
using compost toilets instead of flush toilets, and being careful not to disrupt the
functioning of the biological wastewater treatment system (i.e. biofiltration). In January 2014,
this commitment was strengthened with the signing of an additional and updated
sustainability agreement that came attached with an overview of the technologies installed
on site. One of the important points of this agreement was to provide the user awareness
about the proper functioning of the systems.
Updated Sustainability agreement for the Cleantech Playground at de Ceuvel - January 24th
2014:
“Vereniging De Ceuvel is committed to high levels of sustainability.”
“In becoming a member of the de Ceuvel community, all of us become co-owners of the Cleantech Playground experiment and have a shared responsibility to help realize the project’s ambitions. We agree to do our best to help achieve the collective targets for energy savings, responsible water management, nutrient cycling.”
“Collaboration is expected in user adjustments and research efforts.”
“To make the Cleantech Playground a success, we expect and require everyone’s collaboration in following the user guidelines for the site.”
“DIY constructions and technologies are not perfect, and installation of the technologies is done at own risk.”
“Just as any other system, DIY technologies will need repair over time and may fail. It is a collective responsibility to maintain and replace the basic systems on site.”
The average participation in the collaborative technical development was around 6 working
days. Volunteers also participated sometimes in community building days or technical
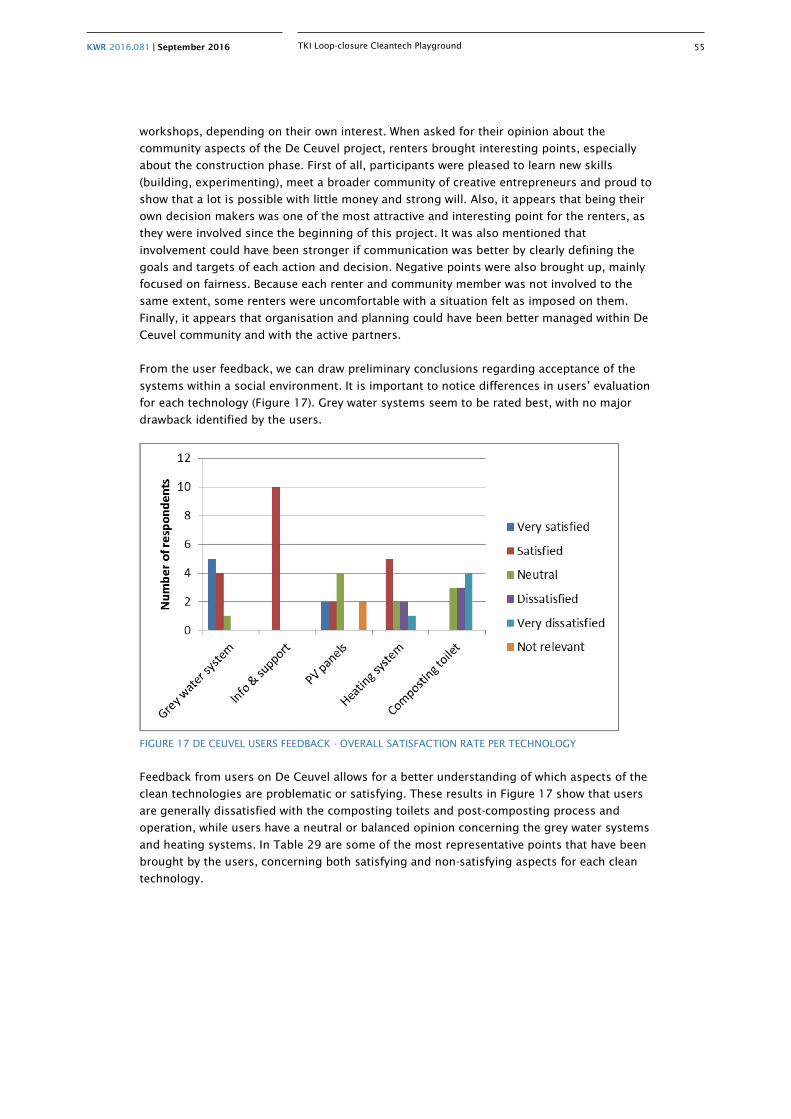
KWR 2016.081 | September 2016 55
TKI Loop-closure Cleantech Playground
workshops, depending on their own interest. When asked for their opinion about the
community aspects of the De Ceuvel project, renters brought interesting points, especially
about the construction phase. First of all, participants were pleased to learn new skills
(building, experimenting), meet a broader community of creative entrepreneurs and proud to
show that a lot is possible with little money and strong will. Also, it appears that being their
own decision makers was one of the most attractive and interesting point for the renters, as
they were involved since the beginning of this project. It was also mentioned that
involvement could have been stronger if communication was better by clearly defining the
goals and targets of each action and decision. Negative points were also brought up, mainly
focused on fairness. Because each renter and community member was not involved to the
same extent, some renters were uncomfortable with a situation felt as imposed on them.
Finally, it appears that organisation and planning could have been better managed within De
Ceuvel community and with the active partners.
From the user feedback, we can draw preliminary conclusions regarding acceptance of the
systems within a social environment. It is important to notice differences in users’ evaluation
for each technology (Figure 17). Grey water systems seem to be rated best, with no major
drawback identified by the users.
FIGURE 17 DE CEUVEL USERS FEEDBACK - OVERALL SATISFACTION RATE PER TECHNOLOGY
Feedback from users on De Ceuvel allows for a better understanding of which aspects of the
clean technologies are problematic or satisfying. These results in Figure 17 show that users
are generally dissatisfied with the composting toilets and post-composting process and
operation, while users have a neutral or balanced opinion concerning the grey water systems
and heating systems. In Table 29 are some of the most representative points that have been
brought by the users, concerning both satisfying and non-satisfying aspects for each clean
technology.
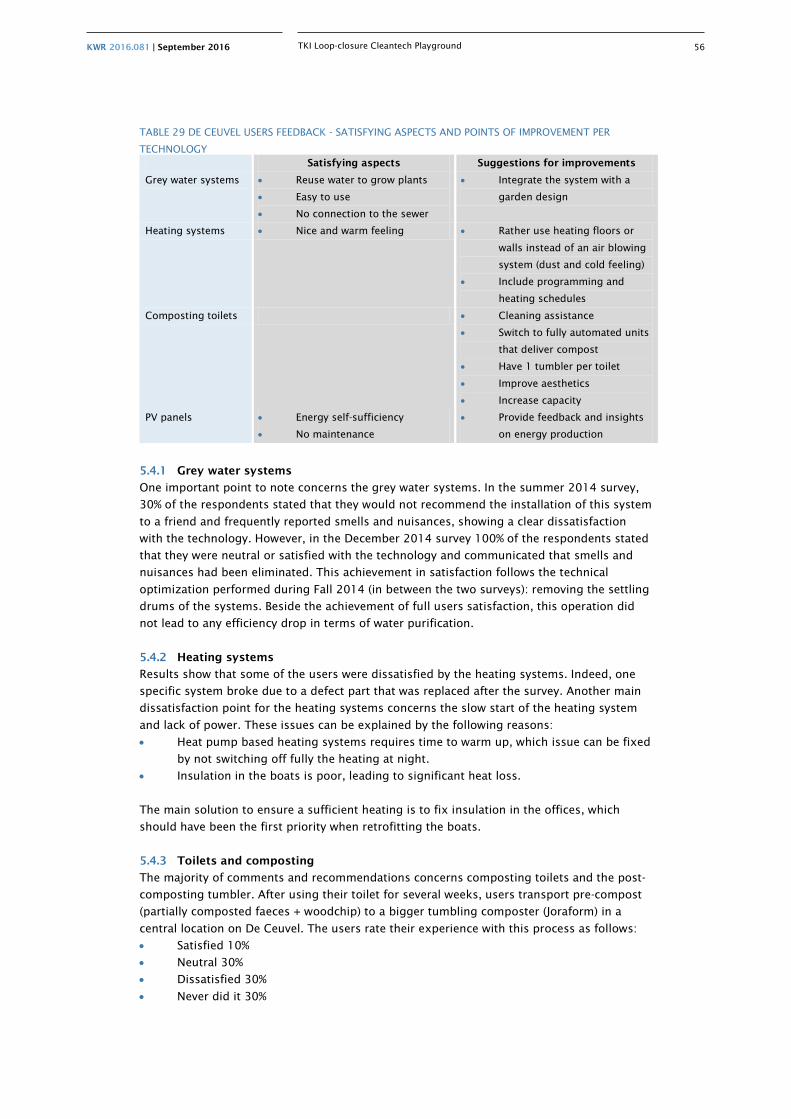
KWR 2016.081 | September 2016 56
TKI Loop-closure Cleantech Playground
TABLE 29 DE CEUVEL USERS FEEDBACK - SATISFYING ASPECTS AND POINTS OF IMPROVEMENT PER
TECHNOLOGY Satisfying aspects Suggestions for improvements
Grey water systems • Reuse water to grow plants
• Easy to use
• No connection to the sewer
• Integrate the system with a
garden design
Heating systems • Nice and warm feeling • Rather use heating floors or
walls instead of an air blowing
system (dust and cold feeling)
• Include programming and
heating schedules
Composting toilets • Cleaning assistance
• Switch to fully automated units
that deliver compost
• Have 1 tumbler per toilet
• Improve aesthetics
• Increase capacity
PV panels • Energy self-sufficiency
• No maintenance
• Provide feedback and insights
on energy production
5.4.1 Grey water systems
One important point to note concerns the grey water systems. In the summer 2014 survey,
30% of the respondents stated that they would not recommend the installation of this system
to a friend and frequently reported smells and nuisances, showing a clear dissatisfaction
with the technology. However, in the December 2014 survey 100% of the respondents stated
that they were neutral or satisfied with the technology and communicated that smells and
nuisances had been eliminated. This achievement in satisfaction follows the technical
optimization performed during Fall 2014 (in between the two surveys): removing the settling
drums of the systems. Beside the achievement of full users satisfaction, this operation did
not lead to any efficiency drop in terms of water purification.
5.4.2 Heating systems
Results show that some of the users were dissatisfied by the heating systems. Indeed, one
specific system broke due to a defect part that was replaced after the survey. Another main
dissatisfaction point for the heating systems concerns the slow start of the heating system
and lack of power. These issues can be explained by the following reasons:
• Heat pump based heating systems requires time to warm up, which issue can be fixed
by not switching off fully the heating at night.
• Insulation in the boats is poor, leading to significant heat loss.
The main solution to ensure a sufficient heating is to fix insulation in the offices, which
should have been the first priority when retrofitting the boats.
5.4.3 Toilets and composting
The majority of comments and recommendations concerns composting toilets and the post-
composting tumbler. After using their toilet for several weeks, users transport pre-compost
(partially composted faeces + woodchip) to a bigger tumbling composter (Joraform) in a
central location on De Ceuvel. The users rate their experience with this process as follows:
• Satisfied 10%
• Neutral 30%
• Dissatisfied 30%
• Never did it 30%
KWR 2016.081 | September 2016 57
TKI Loop-closure Cleantech Playground
The most commonly reported concerns and solutions regarding the toilets process in
general are reported in Table 30.
5.4.4 Why choosing clean technologies, if not for sustainability reasons?
It is interesting to understand which aspects of the daily-used appliances are the most
important for users, beside sustainability. Indeed, sustainable technologies and systems will
spread and be massively adopted by users, only if they meet basic needs and expectations
that conventional technologies fulfil.
Considering different criteria susceptible to push customers to purchase and install specific
technologies, respondents chose easy operation (22%) and efficiency (17%) as the two most
important criteria. Financial savings (14%), price (11%) and operation costs (8%) are important
economic drivers, followed by easy installation (11%) and aesthetics (11%). In the case of De
Ceuvel, it appears that composting toilets are not easy to operate, leading to a difficult
acceptation by the users. Of course these alternative systems require an adaptation period,
so acceptation might increase over time.
TABLE 30 DE CEUVEL USERS FEEDBACK - ACTION POINTS REGARDING TOILETS AND COMPOSTING
PROCESS Concerns Representatives feedback Solution
Technology related Capacity of the toilets is too low for
the number of users
No optimization possible/change the
type of toilet
Rotation direction is unclear Better written and oral communication
Handle piece is too weak No optimization possible/change the
type of toilet
Toilet is difficult to clean No optimization possible/change the
type of toilet
De Ceuvel related Cleaning materials are lacking Provide cleaning products
Bringing the compost to the tumbling
composter is uncomfortable
Improve safety by providing single-use
gloves and masks
Move tumbler to a dedicated location
(community platform)
Train one dedicated maintenance
person
One tumbler for the whole De Ceuvel is
not ideal
Provide more tumbling composters (to
discuss: more units will lead to more
maintenance on different locations)
Winter weather conditions might
reduce the efficiency of the treatment
Build rain and wind protection for the
tumbling composter (outdoor)
Improve insulation of the boats (will
improve the composting process
within the toilet)
5.4.5 Overall user satisfaction
It is clear that the occurrence of uncontrolled phenomena such as smells and flies are not
acceptable for users. It breaches the comfort level of conventional solutions they are used to.
When solutions for each of these issues are implemented, the users are as happy with the
clean technologies as they are with conventional systems. The first outcome of their
feedback is that grey water systems are well accepted among the community, since the
removal of the settling drums in Fall 2014. Most importantly, composting toilets are still not
well accepted by most of the users: emptying the composting toilets is uncomfortable for
users because it requires handling of human waste, as for cleaning the toilet; the toilet itself
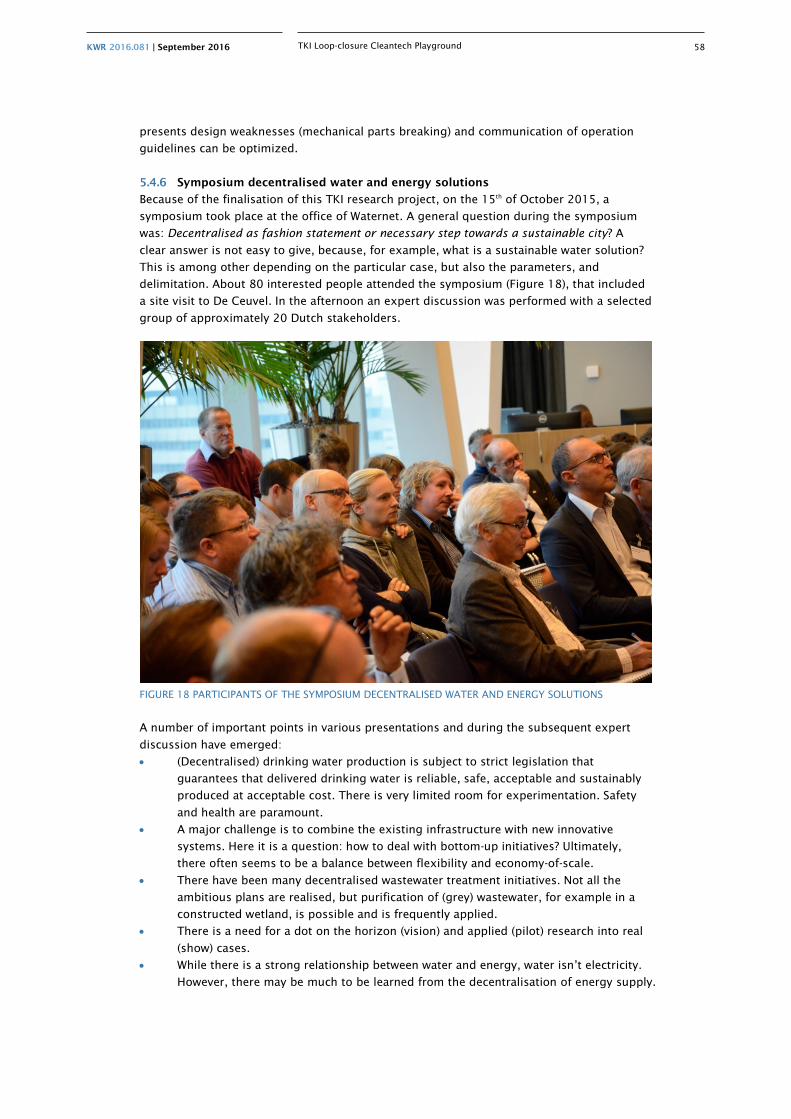
KWR 2016.081 | September 2016 58
TKI Loop-closure Cleantech Playground
presents design weaknesses (mechanical parts breaking) and communication of operation
guidelines can be optimized.
5.4.6 Symposium decentralised water and energy solutions
Because of the finalisation of this TKI research project, on the 15th of October 2015, a
symposium took place at the office of Waternet. A general question during the symposium
was: Decentralised as fashion statement or necessary step towards a sustainable city? A
clear answer is not easy to give, because, for example, what is a sustainable water solution?
This is among other depending on the particular case, but also the parameters, and
delimitation. About 80 interested people attended the symposium (Figure 18), that included
a site visit to De Ceuvel. In the afternoon an expert discussion was performed with a selected
group of approximately 20 Dutch stakeholders.
FIGURE 18 PARTICIPANTS OF THE SYMPOSIUM DECENTRALISED WATER AND ENERGY SOLUTIONS
A number of important points in various presentations and during the subsequent expert
discussion have emerged:
• (Decentralised) drinking water production is subject to strict legislation that
guarantees that delivered drinking water is reliable, safe, acceptable and sustainably
produced at acceptable cost. There is very limited room for experimentation. Safety
and health are paramount.
• A major challenge is to combine the existing infrastructure with new innovative
systems. Here it is a question: how to deal with bottom-up initiatives? Ultimately,
there often seems to be a balance between flexibility and economy-of-scale.
• There have been many decentralised wastewater treatment initiatives. Not all the
ambitious plans are realised, but purification of (grey) wastewater, for example in a
constructed wetland, is possible and is frequently applied.
• There is a need for a dot on the horizon (vision) and applied (pilot) research into real
(show) cases.
• While there is a strong relationship between water and energy, water isn’t electricity.
However, there may be much to be learned from the decentralisation of energy supply.

KWR 2016.081 | September 2016 59
TKI Loop-closure Cleantech Playground
'Smart' carefree systems are important for public acceptance and smooth larger-scale
deployment.
A multidisciplinary approach to the opportunities that arise remains necessary for further
development of sustainable and cost-effective water and energy solutions.
A summary of the symposium and an overview of the given presentations are available
online: http://www.kwrwater.nl/TKI_minisymposium_decentrale_water_en_energie-
oplossingen/
KWR 2016.081 | September 2016 60
TKI Loop-closure Cleantech Playground
6 Resume, recommendations and conclusions
6.1 Introduction
This project was implemented within the Top Sector Water. Within the various Top Sectors
the government, entrepreneurs and scientists work together in so-called Topconsortia for
Knowledge and Innovation (TKI). This TKI project 'Loop-closure Cleantech Playground
Amsterdam' is part of TKI Watertechnology and focuses on the water cycle of De Ceuvel in
Amsterdam North.
De Ceuvel is a workplace for creative and social enterprises in Amsterdam, the Netherlands.
The former industrial plot has been turned into a sustainable urban development. The
heavily polluted site features retrofitted houseboats as offices, placed on land, surrounded
by soil-cleaning plants. Because of the temporary character of the site (it is rented for 10
years) and the polluted soil, the houseboats are not connected to the sewer system. Instead
they are provided with dry composting toilets and individual biofilters for grey water
treatment. The boats use conventional delivered drinking water, but desk research was done
to study the feasibility of local drinking water production from a sustainability (by Life Cycle
Assessment (LCA)), risk (by Quantitative Microbial Risk Assessment (QMRA)), legal and
economical point of view. Although many sustainability issues are addressed at De Ceuvel
(e.g. energy and local food production), this study focuses on water aspects.
The primary goal of this project concerning a small-scale pilot in Amsterdam North is to
achieve closure of the cycle ‘as much as possible’ by applying innovative concepts and
technological solutions. The performances of in particular the water-related technology have
been monitored and evaluated in this TKI project in order to show clearly the applicability in
a sustainable circular economy.
6.2 Resume
6.2.1 Grey water
A minimum amount of grey water is produced at the houseboats, because of the application
of composting toilets and since the boats are used as office, they do not have showers or
washing machines. Only five litres per capita per day is needed for drinking, food
preparation and personal hygiene, compared to the current average of 25 litres in
conventional offices and 128 litres in households in The Netherlands (Pieterse-Quirijns et al.
2009). The grey water is treated in individual low-tech biofilters, consisting of two pallet
tanks filled with a mixture of gravel and sand, topped up with reed. The effluent of the filters
is monitored before it is infiltrated in the soil and complies with the norms of individual
wastewater treatment systems in The Netherlands.
6.2.2 Faecal matter
Composting toilets are being used in the boats on De Ceuvel, resulting in the production of
less wastewater, but the human faeces have to be processed further. The users at De Ceuvel
have to bring the faecal matter from their composting toilet periodically to a central
composter (type Joraform). Possibilities for reuse of (parts of) the compost have been
investigated in the TKI project. There is, certainly in the Netherlands, lack of experience in
KWR 2016.081 | September 2016 61
TKI Loop-closure Cleantech Playground
this field. Usually, E. coli is used as an indicator of pathogens in a given matrix. However,
several pathogenic microorganisms and eggs of worms will survive longer in human faeces
than E. coli. Accordingly, other and/or more than one indicator species should be considered
in order to guarantee a reliable safety standard. After 11 months of composting at De Ceuvel,
the level of streptococci was reduced by log 1.9. This does not meet the WHO
recommendation of log 6 reduction by composting.
6.2.3 Urine
Pure urine from a waterless urinal at Café De Ceuvel was used for nutrient recovery.
Tomatoes were grown with the recovered fertilisers and tests with pharmaceutical micro-
pollutants were performed to investigate contamination of the fertilisers. The concentration
of pharmaceuticals in tomatoes was below detection limits (0.02 mg/kg). These levels were
far below the acceptable daily intake (ADI), which is 1% of the minimum therapeutic dose. It
is therefore possible that tomatoes produced with urine-derived struvite-sorbent fertilisers
are safe for human consumption. However, although no bio-accumulation was detected in
the tomatoes, this does not preclude bio-accumulation in other parts of the plant, for
example the roots or leaves, which were not tested. Since nutrients and other molecules are
taken up from soil by the roots, micro-pollutants might accumulate in root biomass.
Therefore, further investigation should be carried out into struvite-sorbent fertilisers for root
crops, such as carrots or radishes, and leafy vegetables, such as lettuces. The nutrients in
biochar-based fertiliser were shown to be less available than zeolite-based fertilisers in the
short-term, but could become more available after degradation of biochar.
6.2.4 Life Cycle Assessment (LCA) Currently drinking water at De Ceuvel is supplied through the public centralised drinking water supply system of Waternet. Possibilities to implement local water collection and upgrading towards drinking water quality were studied. At De Ceuvel, canal water, rainwater and grey water are potential water sources for local drinking water supply. With the performed LCA study the environmental impact of centralised and decentralised drinking water production, specific for the operational aspects, is compared. The drinking water production at Weesperkarspel (Waternet, Amsterdam) was model for a centralised drinking water production, and De Ceuvel was used as model for the decentralised potable water production from canal water. The goal of both systems is to produce drinking water according to Dutch quality standards. The production of decentralised drinking water has a higher environmental impact and corresponds to 0.104 Ecopoints. This is approximately 25% more than the centralised situation (0.0762 Ecopoints). The difference between these two scenarios becomes more significant (60%) when also the distribution network is included in the calculation. The environmental impact is strongly affected by the energy origin. Improvements in energy demand or (green) energy supply can be implemented both at centralised and decentralised scale and as such there is no difference in environmental impact. The environmental impact was assessed per m3 of drinking water. The fact that less drinking water is used at De Ceuvel does reduce the environmental impact of operations. The impact of infrastructure, especially distribution, is not affected by the use, since the momentary demand when opening a tap determines the design of this infrastructure.
6.2.5 Quantitative Microbial Risk Assessment (QMRA)
Also from a safety perspective, possibilities to implement local water collection and
upgrading towards drinking water quality were studied. The proposed treatment system
should be capable of producing water that complies to the Dutch drinking water standards
with respect to microbial safety, with a maximum risk guideline value of 1 infection per
10,000 persons per year. Chemical contaminants may also be relevant for alternative water
supply systems (Etchepare and Van der Hoek, 2015), however in this study the focus was on
microbial contaminants since they form an acute health risk. It is possible to produce safe
KWR 2016.081 | September 2016 62
TKI Loop-closure Cleantech Playground
water in a decentralised system and in the case of De Ceuvel local canal water is the best
source. However, the QMRA assumes constant performance of the treatment processes at
the proposed level and sufficient operation and maintenance. This requires advanced
treatment technologies and strict monitoring and maintenance. The latter will be challenging
for consumers with limited knowledge of health risk and the technologies (Harvey et al.
2015). Replacement of membranes or UV-lamps which appear to be still functioning may be
considered non-sustainable and expensive by end users, thus compromising safety.
Therefore, monitoring, operation and maintenance would need to be performed by a
specialized company, e.g. Waternet. To reach current drinking water safety standards with
point of entry or point of use systems, more sensitive and reliable sensors are needed and
human perception and behaviour need to be taken into account. Even though the water
treatment technology could produce safe water, current monitoring technology is not
capable to guarantee this continuous safety in an independently operated decentralised
system.
6.2.6 Financial issues
Decentralised drinking water production is in theory allowed when the following three
priorities are fulfilled:
1. The drinking water needs a guaranty that it is safe.
2. It needs to be produced in a sustainable manner.
3. It needs to be produced against acceptable costs.
However, to ensure that the drinking water quality is guaranteed, a comprehensive
monitoring program is needed, which will increase the costs, so it becomes difficult to still
produce at acceptable costs. Current quality monitoring regulations appear to make
decentralised drinking water production 3 to 10 fold more expensive compared to
centralised drinking water production. Monitoring of pathogens in raw water, indicator
removal and operational conditions to perform QMRA according to the guidelines would also
require substantial resources. To reach current drinking water safety standards with point of
entry or point of use systems, more sensitive and reliable sensors are needed and human
perception and behaviour need to be taken into account. The cost and sustainability of these
additional systems including the required monitoring and maintenance (by a qualified
company) was beyond the scope of this study, but needs to be addresses in the total
feasibility of decentralised solution. Only when the costs for quality monitoring are reduced
with about 90%, decentralised drinking water production might be economically more
favourable compared to the current costs for centralised drinking water production.
When labour costs for operation and maintenance are minimized by the deployment of
volunteers in decentralised wastewater treatment, overall costs can be comparable with
centralised treatment, but such a comparison is not completely fair and certainly not
advisable from a risk point of view. Furthermore, the current costs for centralised drinking
water production and wastewater treatment includes several additional aspects, like costs for
environmental protection, research & development and additional tax.
6.2.7 Legislation
Regarding additional involved legislation, De Ceuvel association needed to get the following
permits and fulfil other activities concerned to regulation before they were allowed to start
building:
1. A change to the zoning plan (bestemmingsplan) for the whole ground;
2. A building permit for each individual boat;
3. A permit to discharge water (disposal of effluent).
KWR 2016.081 | September 2016 63
TKI Loop-closure Cleantech Playground
Permits 1 and 2 were needed from the municipality (Stadsdeel Noord) and permit 3 was
obtained from the Omgevingsdienst Noordzeekanaal (ODNZK), but actually an environmental
permit (omgevingsloket vergunning) should have been obtained from the Ministry of
Infrastructure and Environment. Investigation of the Dutch legislative environment brought
additional insights on the right procedure to follow when installing and using Individual
Wastewater Treatment (IWT). While the current legislation requires every IWT system (15
small scale biofilters in the case of De Ceuvel) to be monitored 2 times per year on effluent
quality, there is still no clear process and agreement for the stakeholders of De Ceuvel
project regarding who and how should the quality monitoring of these systems be performed.
6.2.8 User behaviour
Finally, user behaviour and satisfaction were investigated. It is clear that the occurrence of
uncontrolled phenomena such as smells and flies are not acceptable for users. It breaches
the comfort level of conventional solutions they are used to. When solutions for each of
these issues are implemented, the users are as happy with the clean technologies as they are
with conventional systems. The first outcome of their feedback is that grey water systems
are well accepted among the community, since the removal of the settling drums in Fall
2014. It can be concluded that a regular use of composting toilets is not recommended in
the Netherlands, because of discomfort of the users, higher costs and the difficulty to safely
reuse the compost. Taken into account the goal of the research at De Ceuvel (local loop
closure) and the lack of a sewer connection, the use of composting toilets is understandable.
6.3 Recommendations
The biofilters installed on De Ceuvel site (grey water purification systems) ensure sufficient
water effluent quality for the water to be discharged into the ground without threatening the
environment, based on Dutch regulation. Still, further research could be conducted on one
specific parameter of water quality (Total Suspended Solids) for which some variable results
have been obtained.
Concerning toilet waste composting, results on biological indicators show that toilet waste
needs to be composted for a longer period of time in order to ensure safe handling and
reuse as a soil conditioner. Aside from biological safety, level of metals in toilet waste need
to be assessed. In that respect, the analysed toilet waste contains 2 metals (Zinc and Copper)
out of the 8 metals regulated by the Dutch fertiliser act. For these 2 detected metals,
concentrations vary significantly; while average concentrations remain below regulation
limits, some of the maximum values for metal-to-nutrient ratios are above regulation limits.
The reasons for this observation are not known and could be further investigated, but also in
the surplus sludge of wastewater treatment plants and digested sludge the Zinc and Copper
levels are often found to be above the regulation limits. Whether the metals levels would be
an issue from environmental, human safety and legal standpoints, if the compost produced
from toilet waste were to be reused as a soil conditioner, should also be assessed.
The long-term effects of using contaminated urine-derived struvite-sorbent fertilisers on soil
quality should be investigated. It may be necessary to carry out further research in order to
determine the indirect risk of using contaminated plant biomass as a feedstock for other
purposes, such as compost or animal feed. Further investigation should also be carried out
into struvite-sorbent fertilisers for root crops, such as carrots or radishes, and leafy
vegetables, such as lettuces. Besides a much larger crop trial, also a broader range of
pharmaceuticals are necessary to test the robustness of the preliminary performed
experiments.
KWR 2016.081 | September 2016 64
TKI Loop-closure Cleantech Playground
In addition, feedback from users on De Ceuvel allows for a better understanding of which
aspects of the clean technologies are problematic or satisfying. Composting toilets are not
well accepted by most of the users. Technical improvements, user-friendly handling and
better communication (e.g. operation guidelines) could improve the acceptance, but it is
strongly recommended to use other (new) sanitation solutions. Technically local loop-closure
is feasible, but user acceptance and especially legislation issues are still challenging.
Furthermore, even though the water treatment technology could produce safe drinking water,
current monitoring technology is not capable to guarantee its continuous safety in an
independently operated decentralised system. However, resource recovery and recycling
from waste streams is an important issue in the needed circular economy and several
promising options are available. Nevertheless, the experiences on De Ceuvel showed that it
is currently not easy to apply complete local loop-closure in The Netherlands, but more
research and experience with bigger, more representative projects, is needed (e.g. new
sanitation pilot in Buiksloterham). Important issues regarding responsibilities, user-
acceptance, health and safety risks, sustainability and cost reduction should be taken into
account.
6.4 Conclusions
It can be concluded from this study that decentralised drinking water in an urban
environment as De Ceuvel, with a temporary office function, is less sustainable and more
costly than a centralised system and that the same level of safety cannot be guaranteed.
However, when connection to a centralised system isn’t possible or only at high cost,
decentralised solutions can provide an alternative. Decentralised drinking water treatment
systems generally have a higher energy requirement per cubic meter of water produced due
to the small scale. By reducing the amount of water used, the total use of energy and thus
environmental impact will be reduced. When sufficient, sustainable energy is available the
total environmental impact and total cost can remain low. For large scale systems, reduced
water use has limited effect since its costs and environmental impact depend more on the
fixed assets.
Individual wastewater treatment as performed on De Ceuvel is more costly than current
centralised wastewater treatment in The Netherlands. Nevertheless, grey water can be
treated with low-tech biofiltration in individual water treatment systems to achieve sufficient
water quality for discharge into the ground, based on Dutch regulation. The decentralised
system at De Ceuvel allows for direct reuse of resources by e.g. composting faeces and
recovering nutrients from urine. Composting of faecal matter in the Netherlands requires
over 11 months, after which streptococci reduction still did not meet WHO recommendations.
Short term experiments showed that urine-derived struvite is an excellent fertilizer. Struvite
from urine spiked with pharmaceuticals didn’t lead to detection of pharmaceuticals in
tomatoes. However the long-term effects of using urine-derived struvite-sorbent fertilisers on
soil quality should be investigated. Research should focus on uptake of contaminants by root
crops, such as carrots or radishes, and leafy vegetables, such as lettuces. The alternative of
using struvite to grow contaminated plant biomass as a feedstock for other purposes, such
as compost or animal feed should also be investigated for long term health risks. Struvite-
sorbent fertilisers could be developed further to optimize nutrient recovery from urine. Users
seem to accept these initiatives if the level of comfort is comparable to conventional systems.
Health and safety risks and related responsibilities for both water loop-closure and resource
recovery are points of concern for decentralised systems, which cannot be solved by
technology alone. New technologies need to address user behaviour and awareness to
achieve safe decentralised systems. Legal and institutional aspects regarding local water
treatment and loop-closure are under development and currently not always clear.
Technically local loop-closure is feasible, and technological developments can shift the
KWR 2016.081 | September 2016 65
TKI Loop-closure Cleantech Playground
conditions at which decentralised systems are the preferred option in terms of costs and
sustainability in the long term. Future research and experience with bigger, more
representative projects addressing technology and user behaviour can use and further
develop the decentralised concepts from the current study.
Overall, aspects that could be beneficially applied in future decentralised concepts can be
identified from this TKI project and currently include:
• Site specific risk- and sustainability assessment of decentralised systems and loop-
closure are needed to make appropriate choices for implementation.
• No decentralised drinking water production in an urban environment as De Ceuvel.
• No application of composting toilets, but more comfortable (new) sanitation solutions.
• Separated collection of wastewater streams and treatment has potential for e.g. direct
reuse of resources.
• There is interest in rainwater use for e.g. flushing toilets, gardening, showering, and
dish washers.
KWR 2016.081 | September 2016 66
TKI Loop-closure Cleantech Playground
7 References
Ahmed, W., Gardner, T., & Toze, S. (2011). Microbiological quality of roof-harvested rainwater and health risks: a review. [Research Support, Non-U.S. Gov't Review]. J Environ Qual, 40(1), 13-21.
Ahmed, W., Vieritz, A., Goonetilleke, A., & Gardner, T. (2010). Health risk from the use of roof-harvested rainwater in Southeast Queensland, Australia, as potable or nonpotable water, determined using quantitative microbial risk assessment. [Research Support, Non-U.S. Gov't]. Appl Environ Microbiol, 76(22), 7382-7391. doi: 10.1128/AEM.00944-10
Albrechtsen, H. (2002). Microbiological investigations of rainwater and graywater collected for toilet flushing. Water Science & Technology, 46(6-7), 311-316.
Anastasia and Dorp (2015). Interview eco village. interview.
Arias CA, Brix H. (2005) - Phosphorus removal in constructed wetlands: can suitable alternative media be identified? - Water Sci. Technol. 2005;51(9):267-73. Barrios, R. B., M. A. Siebel & A. van der Helm (2004) Environmental and financial impact assessment of two plants of Amsterdam water supply. Thesis, UNESCO-IHE.
Bennink, V., Kluijver, T., Mulder, J., van Oeveren, D., Sun, M., de Swart, M. (2015) Safe
composting of dry-toilet waste at CTP de Ceuvel, Amsterdam. ACT-project group 1577:
"FertilOO".
Bonton, A., C. Bouchard, B. Barbeau & S. Jedrzejak (2012) Comparative life cycle assessment of water treatment plants. Desalination, 284, 42-54. Bichai, F., & Smeets, P. W. M. H. (2013). Using QMRA-based regulation as a water quality management tool in the water security challenge: Experience from the Netherlands and Australia. Water Res, 47(20), 7315-7326. doi: http://dx.doi.org/10.1016/j.watres.2013.09.062
Birks, R., Colbourne, J., Hills, S., & Hobson, R. (2004). Microbiological water quality in a large in-building, water recycling facility. Water Science & Technology, 50(2), 165-172.
Chapman, H., Cartwright, T., Huston, R., & O’Toole, J. (2006). Water Quality and Health Risks from Urban Rainwater Tanks (pp. 97). Salisbury, Australia: Cooperative Research Centre for Water Quality and Treatment.
CIW (Commissie Integraal Waterbeheer) (1999) Individuele Behandeling van Afvalwater IBA-systemen - Handreiking voor de uitvoering van het Lozingenbesluit WVO huishoudelijk afvalwater en het Lozingenbesluit bodembescherming: http://www.infomil.nl/publish/pages/71428/ciw_individuele_behandeling_van_afvalwater_iba_systemen1.pdf
Dettore, C.G. (2009). Comparative Life-Cycle Assessment of Bottled vs. Tap Water Systems. Center for Sustainable Systems, University of Michigan. Report No. CSS09-11.
KWR 2016.081 | September 2016 67
TKI Loop-closure Cleantech Playground
Dimp , M. and Moran, S. (2014). Waste matters: compost, domestic practice, and the
transformation of alternative toilet cultures around Skaneateles lake, New York. Environment
and Planning D: Society and Space, 32(4):721-738.
Escher, B.I., Pronk, W., Suter, MJ.-F., Maurer, M. (2006), Monitoring the Removal Efficiency of
Pharmaceuticals and Hormones in Different Treatment Processes of Source-Separated Urine
with Bioassays. Environ. Sci. Technol., 40, 5095-5101
Etchepare, R., & van der Hoek, J. P. (2015). Health risk assessment of organic micropollutants in grey water for potable reuse. Water Res, 72, 186-198.
Fantin, V., Scalbi, S., Ottaviano, G., Masoni, P. (2014). A method for improving reliability and relevance of LCA reviews: The case of life-cycle greenhouse gas emissions of tap and bottled water. Science of the Total Environment 476-477, 228-241.
Vanderheyden, G. and Aerts, J. (2014). Comparative LCA assessment of Fontinet filtered tap water vs. Natural sourced water in a PET bottle. Futureproofed.
Hammerton, M. (2016). Struvite-Sorbent Fertilisers - A bioavailability study of recovered nutrients and pharmaceutical micro-pollutants from human urine. Masters Thesis.
Harvey, R., Murphy, H. M., McBean, E. A., & Gharabaghi, B. (2015). Using Data Mining to Understand Drinking Water Advisories in Small Water Systems: a Case Study of Ontario First Nations Drinking Water Supplies. Water Resources Management, 29(14), 5129-5139.
Hijnen, W. A., Beerendonk, E. F., & Medema, G. J. (2006). Inactivation credit of UV radiation for viruses, bacteria and protozoan (oo)cysts in water: a review. Water Res, 40(1), 3-22.
Hijnen, W. A. M., & Medema, G. J. (2010). Elimination of micro-organisms by water treatment processes. London: IWA Publishing.
Holländer, R., Bullermann, M., Gross, C., Hartung, H., König, K., Lücke, F., & Nolde, E. (1996). [Microbiological public health aspects in the use of rain water as water reservoirs for toilet flushing, garden irrigation and laundry]. Gesundheitswesen (Bundesverband der Arzte des Offentlichen Gesundheitsdienstes (Germany)), 58(5), 288-293.
Hoogenboezem, W., Ketelaars, H., Medema, G., Rijs, G., & Schijven, J. (2000). Cryptosporidium en Giardia: voorkomen in rioolwater, mest en oppervlaktewater met zwem-en drinkwaterfunctie. RlWA/RIVM/RIZA-rapport. ISBN, 447018732.
Jönsson, H., Stintzing, A. R., Vinner as, B., and Salomon, E. (2004). Guidelines on the use of
urine and faeces in crop production. EcoSanRes Programme.
Kruithof, J. C., Kamp, P. C., Folmer, H. C., Nederlof, M. M., & van Hoof, S. C. J. M. (2001). Development of a membrane integrity monitoring strategy for the UF/RO Heemskerk drinking water treatment plant. Water Sci Technol: Wat Sup, 1(5/6).
KWR. (2015). Watershare Treatment Calculator website Retrieved 30 June, 2015, from http://www.watershare.eu/tool/qmra-treatment-calculator/start/
LeChevallier, M., & Au, K. K. (Eds.). (2004 ). Water Treatment and Pathogen Control Process; Efficiency in Achieving Safe Drinking Water. . London, UK.: IWA publishing.
KWR 2016.081 | September 2016 68
TKI Loop-closure Cleantech Playground
Meerkerk, M. A., & Kroesbergen, J. (2010). Hygiënecode Drinkwater; Opslag, transport en distributie (2e editie ed., pp. 103). Nieuwegein: KWR.
Mons, M. N., van der Wielen, J. M., Blokker, E. J., Sinclair, M. I., Hulshof, K. F., Dangendorf, F., . . . Medema, G. J. (2007). Estimation of the consumption of cold tap water for microbiological risk assessment: an overview of studies and statistical analysis of data. [Research Support, Non-U.S. Gov't Review]. J Water Health, 5 Suppl 1, 151-170. doi: 10.2166/wh.2007.141
Niwagaba, C. (2007). Human excreta treatment technologies: Prerequisites, constraints and
performance. Department of Biometry and Engineering.
NSF. NSF/ANSI 53: Drinking Water Treatment Units - Health Effects: NSF International.
O’Toole, J., Sinclair, M., Malawaraarachchi, M., Hamilton, A., Barker, S. F., & Leder, K. (2012). Characterising microbial quality of household grey water. Water Research, 46 (13), 4301-4313.
Oesterholt, F., Martijnse, G., Medema, G., & Van Der Kooij, D. (2007). Health risk assessment of non-potable domestic water supplies in the Netherlands. Journal of Water Supply: Research & Technology- AQUA, 56(3), 171-179.
Peasey, A. et al. (2000). Health aspects of dry sanitation with waste reuse. Water and
Environmental Health at London and Loughborough. Task.
Pieterse-Quirijns, E. J., Blokker, E. J. M. and Vogelaar, A. J. (2009). Modelleren van niet-
huishoudelijk waterverbruik; waterverbruik van kantoren, hotels, zorginstellingen en
veehouderij, KWR, Nieuwegein. BTO 2009.013.
P.M.F.J., K. (1994). Prevalence of Campylobacter in Dutch sewage purification plants. (PhD), Landbouwuniversiteit Wageningen, Wageningen.
Pype, M.-L., Lawrence, M. G., Keller, J., & Gernjak, W. (2016). Reverse osmosis integrity monitoring in water reuse: The challenge to verify virus removal–A review. Water Res, 98, 384-395
Schijven, J. F., Teunis, P. F., Rutjes, S. A., Bouwknegt, M., & de Roda Husman, A. M. (2011). QMRAspot: a tool for Quantitative Microbial Risk Assessment from surface water to potable water. Water Res, 45(17), 5564-5576. doi: 10.1016/j.watres.2011.08.024
Schijven, J. F., Teunis, P. F., Rutjes, S. A., Bouwknegt, M., & de Roda Husman, A. M. (2011). QMRAspot: a tool for Quantitative Microbial Risk Assessment from surface water to potable water. Water Res, 45(17), 5564-5576. doi: 10.1016/j.watres.2011.08.024
Smeets, P. W., van der Helm, A. W., Dullemont, Y. J., Rietveld, L. C., van Dijk, J. C., & Medema, G. J. (2006). Inactivation of Escherichia coli by ozone under bench-scale plug flow and full-scale hydraulic conditions. [Research Support, Non-U.S. Gov't]. Water Res, 40(17), 3239-3248. doi: 10.1016/j.watres.2006.06.025
Smeets, P. W. M. H., Rietveld, L. C., Hijnen, W., Medema, G., & Stenstrom, T. A. (2006). Efficacy of water treatment processes Microrisk Final Report (pp. 70). www.microrisk.com: Kiwa Water Research.
KWR 2016.081 | September 2016 69
TKI Loop-closure Cleantech Playground
Soller, J. A., Schoen, M. E., Bartrand, T., Ravenscroft, J. E., & Ashbolt, N. J. (2010). Estimated human health risks from exposure to recreational waters impacted by human and non-human sources of faecal contamination. [Research Support, U.S. Gov't, Non-P.H.S.]. Water Res, 44(16), 4674-4691. doi: 10.1016/j.watres.2010.06.049
Stowa 2015-34 Verkenning van de kwaliteit van struviet uit de communale afvalwaterketen.
Stowa & Rioned 2015-39 Keuzeproces Afvalwater Buitengebied.
Tilley, E., Ulrich, L., Lüthi, C., Reymond, P., and Zurbrügg, C. (2014). Compendium of
sanitation systems and technologies. EAWAG.
van Lieverloo, J. H., Blokker, E. J., & Medema, G. (2007). Quantitative microbial risk assessment of distributed drinking water using faecal indicator incidence and concentrations. [Research Support, Non-U.S. Gov't]. J Water Health, 5 Suppl 1, 131-149. doi: 10.2166/wh.2007.134
VROM-Inspectorate. (2005). Inspectorate guideline; Assessment of the microbial safety of drinking water. the Netherlands.
Westrell, T., Schonning, C., Stenstrom, T. A., & Ashbolt, N. J. (2004). QMRA (quantitative microbial risk assessment) and HACCP (hazard analysis and critical control points) for management of pathogens in wastewater and sewage sludge treatment and reuse. [Research Support, Non-U.S. Gov't]. Water Sci Technol, 50(2), 23-30.
Visitor (2015). Interview visitor. interview.
WHO (Ed.). (2011). Guidelines for Drinking Water Quality, fourth edition World health organization, Geneva, Switzerland.
Zhu, K., Zhang, L., Hart, W., Liu, M., & Chen, H. (2004). Quality issues in harvested rainwater in arid and semi-arid Loess Plateau of northern China. Journal of Arid Environments, 57(4), 487-505.
KWR 2016.081 | September 2016 70
TKI Loop-closure Cleantech Playground
Appendix I Safe handling of dry toilet waste
Conclusions and recommendations
student project (Academic
Consultancy Training of
Wageningen University)
The following conclusions and recommendations are directly copied from the final student
report, which has been prepared with guidance and advice from the TKI project team.
Conclusions
This project has aimed to find an advice on reusing valuable components of dry toilet waste,
originating from the CTP de Ceuvel, as safely, low-costly and sustainable as possible. In this
conclusion, the answer on the different sub questions will be listed to show how FertilOO
came to its advice. The subsequent recommendations can be found in the next section.
1. Which components are valuable in (dry) toilet waste and which human pathogens
and toxins are major (safety) risk factors? Human excreta contain valuable
potassium, phosphorus and nitrogen that can be very useful in reusing the human
waste as compost. Urine contains a higher concentration of these nutrients than
faeces. Heavy metals are not considered a risk, since animal manure contains higher
heavy metal concentrations than human faeces and can still be used for composting
purposes. More pathogen species are excreted via human faeces than via urine.
Different bacteria, viruses, protozoa and helminths can pose a threat to human
health if someone is infected by wrong exposure to the human waste or compost.
Especially helminths can pose a risk, since the eggs of Ascaris are able to survive
the longest in human faeces of the pathogens studied and even longer in soil.
2. How to implement and improve techniques that modern society uses to make toilet
waste usable to CTP De Ceuvel and how can the quality be controlled? There is a
large variety of techniques available in modern society that range from high-tech to
low-tech technologies and processes. Specifically evaluated are the technologies of
the urine diverting dry toilet (UDDT) and the process of vermicomposting. The
installation of a UDDT requires the urine and faeces to be treated separately.
Vermicomposting is a process that can be used with source separating technologies
as well as mixed source technologies. Learnt from practice in Anastasiadorp
(Anastasia and Dorp, 2015), two containers of approximately 5 m2, with a height of
1.5 m are required to compost the faeces at CTP De Ceuvel for 2 years. Especially
with vermicomposting the proceedings need to be reported with use of these forms
where the time and layer that has been added are noted. After two years, the
compost is considered to be safe to use. The quality of the excreta can be
controlled through measuring for indicator species in the compost.
3. What are current legislations for the use of animal manure as a fertiliser/soil
conditioner and how could it be applied to human faeces? Legislation on animal
KWR 2016.081 | September 2016 71
TKI Loop-closure Cleantech Playground
manure is mainly focussed on the heavy metals that are present in animal manure.
Animal manure can be used if it is treated biologically, chemically or with heat. It is
difficult to apply these regulations to the reuse of dry toilet waste because animal
manure does not take pathogens into account. Pathogens are a bigger concern than
heavy metals in human waste. Human excreta contain more pathogens than animal
manure (Niwagaba, 2007) (see Appendix Table 6). Another waste stream that does
contain human waste is sewage sludge. Current legislations on sewage sludge are
stated in the Dutch waste management plan (Landelijk afvalbeheerplan). It states
that it can only be treated by thermal processing, gasification and hydrostab. With
the thermal processing, the nutrients are still available in the ash, but the nitrogen
will be lost about 10 % to 50 % during this process, because of the high temperature,
pH and high aeration (Jönsson et al., 2004). Other options for legally using human
waste compost is to apply for an `End-of-Waste'-status.
4. To what extent are (safety) risks communicated to the users of CTP De Ceuvel and
to what extent are they aware of the risks in relation to dry toilet waste? From
interviews with the users of CTP De Ceuvel it became clear that users do feel
responsible for maintaining their toilet and handling the waste. However, they feel
responsibilities for maintenance of bigger issues, education and general help lie
somewhere else. They do feel that Metabolic has tried to empower them, yet at the
same time they think this was not done successfully and could be improved.
Recommendations
There are several suggestions to improve the current safety and composting processes at
CTP de Ceuvel in the most sustainable, low-tech, low-cost way. To start with, the addition of
pieces of paper instead of wood chips are advised, in order to lower the lignin content that is
hard to degrade biologically and to repel flies, without losing the advantage of enhancing
the C/N ratio of the starting substrate. Addition of plant ash and/or lime to increase the pH
can be considered as well, since they will speed up pathogen die-off.
Another improvement would be to introduce vermicomposting with backslashing at the
centralised treatment point. It is a pathogen reducing, low-cost, fast, energy saving, easy to
handle, cheap and zero-waste process in which earthworms are able to convert new compost,
combined with old compost, into soil conditioner and/or fertiliser. Backslashed
vermicompost can be accomplished with excreta, as well as with faeces only. The size of the
two containers that will be required are difficult to calculate, since the compost subsidence
rate is difficult to determine. However, based on the size of the vermicomposting system we
have seen in Deventer4. To make sure that the compost produced is approved to use, it is
advised to apply for an `End-of-Waste' status that will transfer humanure from a `waste'
status to a `product' status, whereafter the product can be used with legal approvement. We
advise to request this approval specifically for CTP de Ceuvel via the province Noord-Holland
and for `humanure' in general via the government as well. Moreover, a `Keurcompost'
certificate can be applied for, which if approved will show that `humanure' is safe and
profitable to use. Through these different applications, insight can be gained on the
achievability of using `humanure' in the future.
Regarding safety risks involved at CTP de Ceuvel, it is recommended to periodically measure
the concentration of different pathogens. Identify beforehand the pathogens present in the
4 2/3 of the normal amount of poop because of working instead of living. In Anastasiadorp, the sizes were 1 m * 1 m = 1m2 for approx. 6 people; In CTP de Ceuvel, live 50 people. This means that (33/6) * 1 m2 = 5.5 m2 is needed. From experiments at Anastasiadorp it is estimated that the size per container should be 5.5 m2 and a height of 1.5 m to accommodate vermicomposting for CTP de Ceuvel for a two year time span.
KWR 2016.081 | September 2016 72
TKI Loop-closure Cleantech Playground
excreta, in order to know what to look for in the compost. Furthermore, safety of the excreta
can be increased when people follow all technical and behavioural measures that are
prescribed.
Communication with local businesses at CTP de Ceuvel must be improved in order to
guarantee handling safety. Using a sound communication plan and frequent face-to-face
communication for updates and questions can help with this. It is also recommended to
create an A4-sized manual with the most important do's and do not for using and
maintaining a composting toilet and post them in every toilet stall, as was done in the
Skaneateles project (Dimp and Moran, 2014). To quickly improve the user experience at CTP
de Ceuvel, the tumbler should be relocated to the other side of the terrain. This may also
help to prevent or at least minimize the misuse from visitors (Visitor, 2015). Furthermore,
another information day or workshop to increase awareness might be considered.
Provision of gloves and face masks at the tumbler, in case people forget to put them on, is
advised. When users take their bucket out they can at least put a face mask on when opening
the tumbler. Regarding the techniques and composting processes, some factors for wrong
handling measures could be taken into consideration to ensure a safe end product even if
not all measurements are taken (Peasey et al., 2000). Finally, it should be taken into account
that it may take several years for behaviour to change and before it can truly be said that a
project is successful.
As a more drastic change, it is proposed to the current system is to exchange the current
non-separating dry toilet for a urine diverting dry toilet (UDDT), because urine is almost
sterile and contains most of the nutrients in excreta. This way, the urine can be stored for
12-26 weeks instead of a treatment of 1-2 years before use. BioLan UDDT's are
recommended because of high chance of eliminating possible flies from the faeces and the
prevention of odours by a ventilation pipe and no electricity is needed for operating this
toilet. What needs to be taken into account is that beddings should be added after every
defecation; no other covering material is needed (?). To make this system work, besides two
containers for vermicomposting, two containers for urine storage are required. Two urine
tanks of about 7 m3 each should be used, where the urine can be stored up to 6 months to
make it free of pathogens5 . After 12-26 weeks the urine can be used as a fertiliser when
diluted with water. Meanwhile the other urine tank can then be filled until it is full and can be
stored for maximally 6 months as well.
The most important limitations and solutions for the current situation at CTP de Ceuvel as
summarised in the table on the next page (Table 31). Finally, all that can be said is that
literature and theories can only give you so much information, but in the end the only way to
find out what really works, is by experimenting. We therefore encourage CTP de Ceuvel to
keep doing this.
5 The size of this tank is calculated by using the formula (2/3) * 1.2 L/p/d * (365/2) d * 50 p = 7300 L = 7.3 m3 , where it is assumed that people will excrete 2/3 of its total urine production (1.2 L/day according to (Tilley et al., 2014)) at CTP de Ceuvel during half a year . Roughly 50 persons are estimated to make use of these toilets. All parameters are over-estimated in order to make sure that the tanks will be large enough.
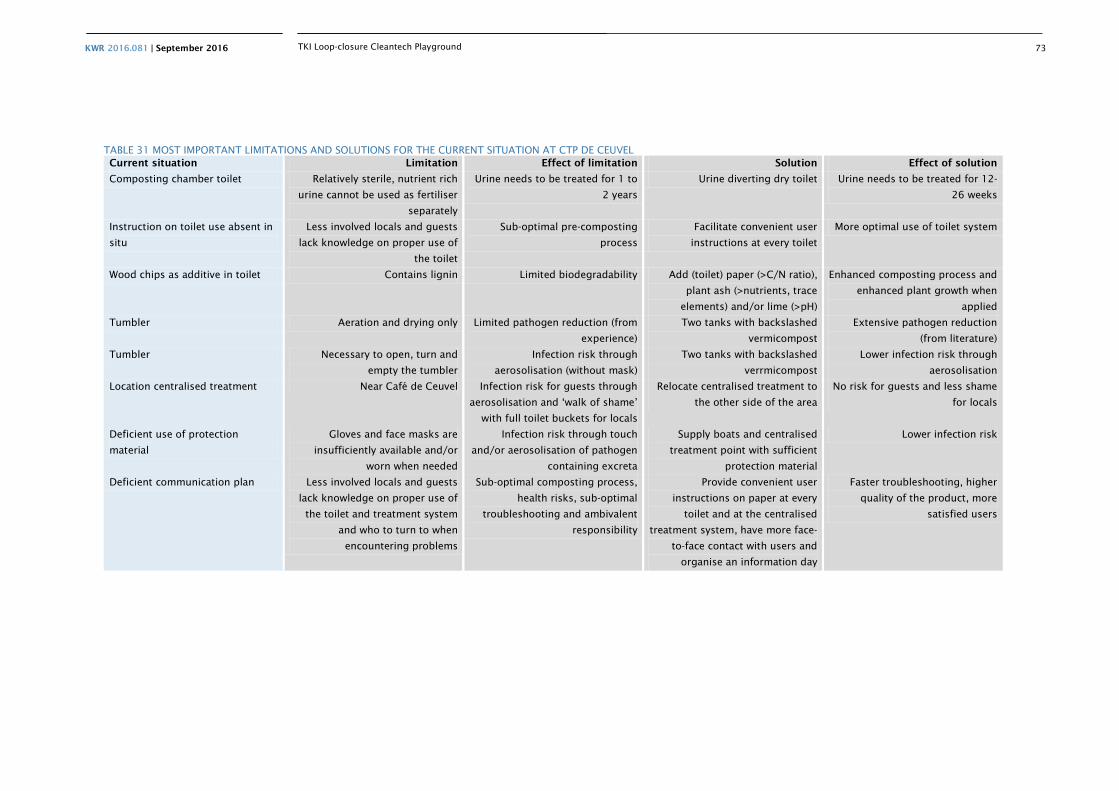
KWR 2016.081 | September 2016 73
TKI Loop-closure Cleantech Playground
TABLE 31 MOST IMPORTANT LIMITATIONS AND SOLUTIONS FOR THE CURRENT SITUATION AT CTP DE CEUVEL Current situation Limitation Effect of limitation Solution Effect of solution
Composting chamber toilet Relatively sterile, nutrient rich
urine cannot be used as fertiliser
separately
Urine needs to be treated for 1 to
2 years
Urine diverting dry toilet Urine needs to be treated for 12-
26 weeks
Instruction on toilet use absent in
situ
Less involved locals and guests
lack knowledge on proper use of
the toilet
Sub-optimal pre-composting
process
Facilitate convenient user
instructions at every toilet
More optimal use of toilet system
Wood chips as additive in toilet Contains lignin Limited biodegradability Add (toilet) paper (>C/N ratio),
plant ash (>nutrients, trace
elements) and/or lime (>pH)
Enhanced composting process and
enhanced plant growth when
applied
Tumbler Aeration and drying only Limited pathogen reduction (from
experience)
Two tanks with backslashed
vermicompost
Extensive pathogen reduction
(from literature)
Tumbler Necessary to open, turn and
empty the tumbler
Infection risk through
aerosolisation (without mask)
Two tanks with backslashed
verrmicompost
Lower infection risk through
aerosolisation
Location centralised treatment Near Café de Ceuvel Infection risk for guests through
aerosolisation and ‘walk of shame’
with full toilet buckets for locals
Relocate centralised treatment to
the other side of the area
No risk for guests and less shame
for locals
Deficient use of protection
material
Gloves and face masks are
insufficiently available and/or
worn when needed
Infection risk through touch
and/or aerosolisation of pathogen
containing excreta
Supply boats and centralised
treatment point with sufficient
protection material
Lower infection risk
Deficient communication plan Less involved locals and guests
lack knowledge on proper use of
the toilet and treatment system
and who to turn to when
encountering problems
Sub-optimal composting process,
health risks, sub-optimal
troubleshooting and ambivalent
responsibility
Provide convenient user
instructions on paper at every
toilet and at the centralised
treatment system, have more face-
to-face contact with users and
organise an information day
Faster troubleshooting, higher
quality of the product, more
satisfied users
KWR 2016.081 | September 2016 74
TKI Loop-closure Cleantech Playground
Appendix II Dutch regulation regarding Individual Wastewater Treatment (IWT)
Based on the Commissie Integraal Waterbeheer report ‘Individuele Behandeling van
Afvalwater IBA-systemen’ (1999), which content is reproduced in Dutch below, the effluent of
individual wastewater treatment systems has to be analyzed twice a year.
“3.6.3 Wat en hoe wordt gecontroleerd?
Bij niet gecertificeerde IBA-systemen wordt de zuiverende werking van het systeem met
grotere regelmaat gecontroleerd. Bij nadere eis of in vergunningvoorschriften zal de lozer
bovendien een meetverplichting opgelegd krijgen. Een lozer dat een gecertificeerd IBA-
systeem gebruikt krijgt geen eigen meetverplichting. Zie voor de frequentie van
monstername door de lozer hoofdstuk 4, paragraaf 4.7.
Het is mogelijk dat feitelijke controle van de werking van het IBAsysteem door het jaar heen
plaatsvindt door bedrijven gespecialiseerd in de aanleg en het onderhoud van
(gecertificeerde) IBA-systemen of door de lozer. De controlegegevens worden bijgehouden in
een logboek. In het logboek zijn gegevens terug te vinden over onderhoudcontroles, aard,
data en herstel van storingen, afvoer van drijvend materiaal en slib. De handhaver zal bij
controle uitgaan van de gegevens uit het logboek. Het effluent wordt gecontroleerd via
steekmonsters. Indien een gecertificeerd IBA-systeem in gebruik is zal bij controle door
gemeente of waterschap niet standaard een steekmonster genomen worden en op
parameters worden getest. Bij omvangrijke bodemlozingen worden ten behoeve van de
tweejaarlijkse keuring van het IBA-systeem monsters genomen. Indien geen gecertificeerd
IBA-systeem is geplaatst, wordt van de lozer verwacht dat hij zelf het effluent via
steekmonsters laat controleren. De wijze waarop monsters worden genomen en
gecontroleerd vereist de goedkeuring van het bevoegd gezag.“
The parameters to measure are stated in the Law Decree for discharge outside the common
established systems (Wet Besluit lozen buiten inrichtingen, artikel 3.6, Lozen op of in de
bodem of in een aangewezen oppervlaktewaterlichaam). See Tabel 1and Tabel 2 on the next
page for the exact parameters.
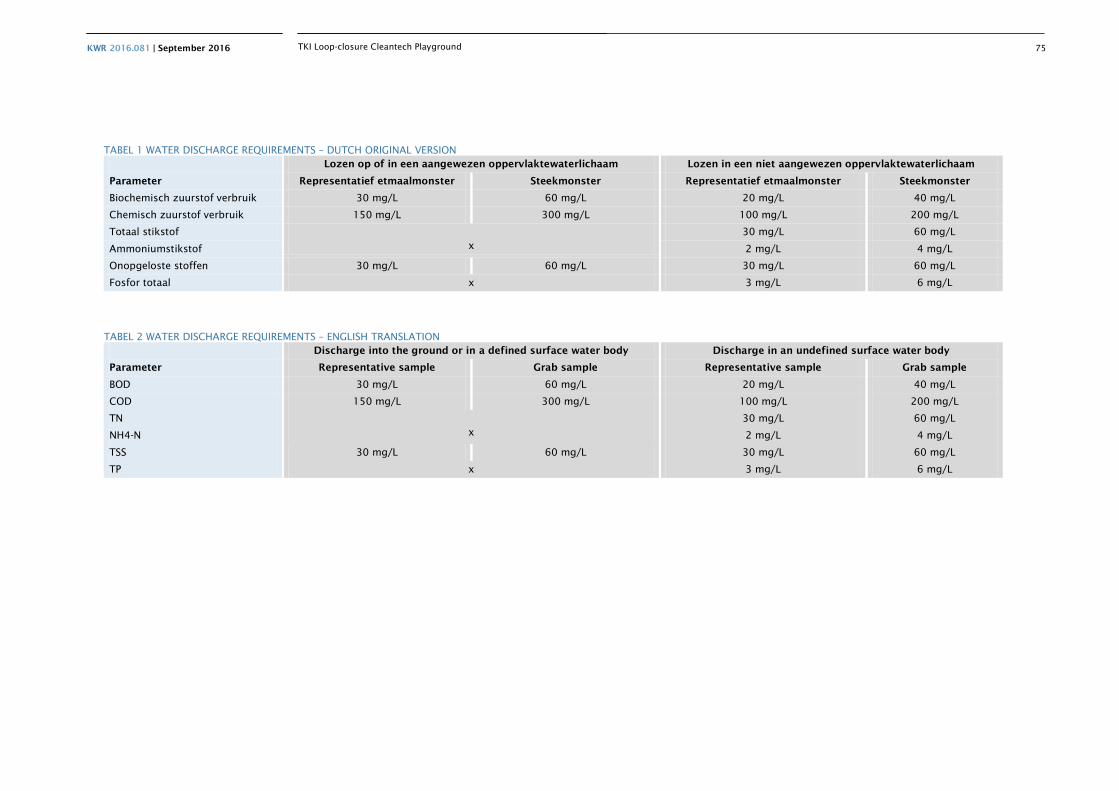
KWR 2016.081 | September 2016 75
TKI Loop-closure Cleantech Playground
TABEL 1 WATER DISCHARGE REQUIREMENTS – DUTCH ORIGINAL VERSION Lozen op of in een aangewezen oppervlaktewaterlichaam Lozen in een niet aangewezen oppervlaktewaterlichaam
Parameter Representatief etmaalmonster Steekmonster Representatief etmaalmonster Steekmonster
Biochemisch zuurstof verbruik 30 mg/L 60 mg/L 20 mg/L 40 mg/L
Chemisch zuurstof verbruik 150 mg/L 300 mg/L 100 mg/L 200 mg/L
Totaal stikstof x
30 mg/L 60 mg/L
Ammoniumstikstof 2 mg/L 4 mg/L
Onopgeloste stoffen 30 mg/L 60 mg/L 30 mg/L 60 mg/L
Fosfor totaal x 3 mg/L 6 mg/L
TABEL 2 WATER DISCHARGE REQUIREMENTS – ENGLISH TRANSLATION Discharge into the ground or in a defined surface water body Discharge in an undefined surface water body
Parameter Representative sample Grab sample Representative sample Grab sample
BOD 30 mg/L 60 mg/L 20 mg/L 40 mg/L
COD 150 mg/L 300 mg/L 100 mg/L 200 mg/L
TN x
30 mg/L 60 mg/L
NH4-N 2 mg/L 4 mg/L
TSS 30 mg/L 60 mg/L 30 mg/L 60 mg/L
TP x 3 mg/L 6 mg/L
KWR 2016.081 | September 2016 76
TKI Loop-closure Cleantech Playground
Appendix III Small-scale mobile wastewater treatment system by AWWS
Introduction
Many places around the world are not connected to the grid of sewerage pipes for the safe
discharge of their wastewater. Furthermore, in many European countries, where sewerage
ground pipes are present, these are over 50 years of age and in need of replacement or
reparation. This entails large investment costs. For example, the necessary investments for
the USA are calculated at $500 billion to be invested in the next 20 years. AWWS believes
that decentralised wastewater treatment units are the just answer to these present-day and
upcoming problems. Decentralised units largely eliminate extensive piping networks and
hence excluding the need for the respective investments. Smart engineering of these units
into containers or on trailers enables their easy installation all over the world.
De Ceuvel is an interesting site since it comprises only offices, but no households.
Furthermore, the wastewater consists of only grey water due to the implementation of
composting toilets. The lack of showers and washing machines extremely lowers the on-site
water consumption and respective (grey) wastewater production. It is agreed that for these
low volumes, AWWS technologies are too complex and expensive as compared to the low-
tech and low-cost biofilters used currently on-site. However, household communities, or
combinations of households and business locations, touristic places such as hotels, or
events like festivals, often produce higher volumes of wastewater that can consist of only
grey water, only black water (i.e. toilet water), or (and most probably) a combination of both.
For these situations, AWWS developed a small-scale mobile wastewater treatment unit.
Small-scale mobile wastewater treatment unit
In the AWWS small-scale mobile wastewater treatment unit (Figure 19) the water is first
biologically treated in a moving Bed Bio-Reactor (MBBR). Micro-organisms adhered to carrier
material remove the organic load in the water. The organic load can be human excrements,
soaps, etc. The micro-organisms use the organic load for their own growth, meanwhile
converting it into CO2 and new biological cells. Superfluous biomass coming off the carrier
material is led to the second step: the sludge-water separator tank. Here, the sludge is
separated from the water using AWWS advanced microbubble concentrator technology. The
latter ensures higher dry matter contents of the removed sludge (60 g L-1 versus 15 g L-1 in
conventional techniques). This results in 4 times more concentrated sludge and hence, lower
sludge volumes to be handled for discharge or further processing (e.g. energy and nutrient
recovery). Also, no membranes are used in this separation step, eliminating the risk of
clogging and service-stops. The obtained effluent quality comprises to the European
legislation for surface water discharge.
The small-scale wastewater treatment unit of 2.2 m (height) by 3.3 m (length) by 1.6 m
(width) fits on a trailer for easy transportation. This mobile unit can be equipped with solar
panels (such as the ones produced by Metabolic) to ensure its entire off-the-grid functioning.
When employing the unit for the treatment of shower water (for example on festivals), the
daily amount of grey water produced by 6 showers can be handled. This is equivalent to 43
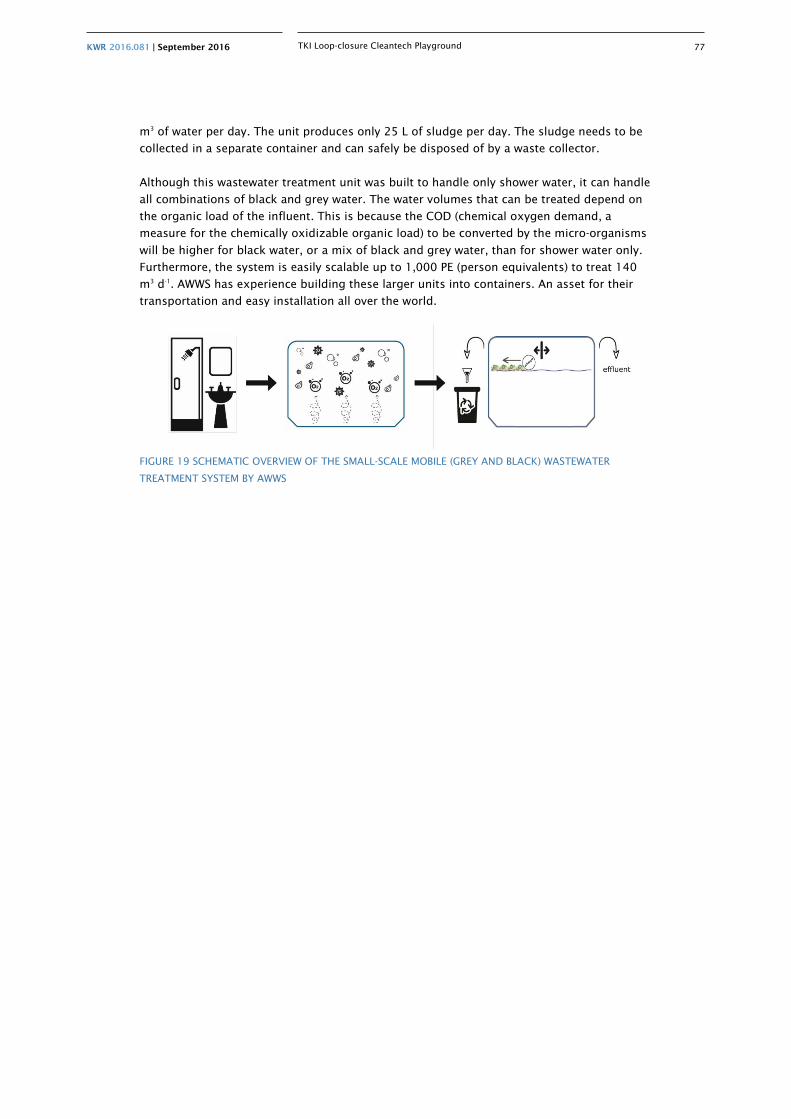
KWR 2016.081 | September 2016 77
TKI Loop-closure Cleantech Playground
m3 of water per day. The unit produces only 25 L of sludge per day. The sludge needs to be
collected in a separate container and can safely be disposed of by a waste collector.
Although this wastewater treatment unit was built to handle only shower water, it can handle
all combinations of black and grey water. The water volumes that can be treated depend on
the organic load of the influent. This is because the COD (chemical oxygen demand, a
measure for the chemically oxidizable organic load) to be converted by the micro-organisms
will be higher for black water, or a mix of black and grey water, than for shower water only.
Furthermore, the system is easily scalable up to 1,000 PE (person equivalents) to treat 140
m3 d-1. AWWS has experience building these larger units into containers. An asset for their
transportation and easy installation all over the world.
FIGURE 19 SCHEMATIC OVERVIEW OF THE SMALL-SCALE MOBILE (GREY AND BLACK) WASTEWATER
TREATMENT SYSTEM BY AWWS

KWR 2016.081 | September 2016 78
TKI Loop-closure Cleantech Playground