Embed Size (px)
Citation preview

Preface
What is an RTPO?A Regional Transportation Planning Organization (RTPO) is formed through a voluntary association of local governments within a county or contiguous counties. RTPO members include cities, counties, WSDOT, tribal governments, ports, transportation service providers, private employers and other organizations.
What is the purpose of an RTPO?RTPOs were authorized as part of the 1990 Growth Management Act to ensure local and regional coordination of transportation plans.
What do RTPOs do?RTPO planning must involve cities, counties, WSDOT, transit agencies, ports and private employers. Among other duties individual RTPOs may perform to serve their membership, RTPOs are required to:
● Prepare a Regional Transportation Plan● Certify that county wide planning policies and the transportation element of local comprehensive
plans are consistent with the Regional Transportation Plan● Develop and maintain a six-year Regional Transportation Improvement Program
How are RTPOs different than Metropolitan Planning Organizations (MPOs)?State legislation (GMA) created RTPOs. An RTPO covers both urban and rural areas and receives state funding in support of its planning efforts. Federal legislation created Metropolitan Planning Organizations (MPOs). An MPO covers an urbanized area and receives federal funding in support of its planning efforts.
MPOs and RTPOs serve the same basic transportation planning functions - develop a long-range plan, coordinate within a region, and prepare a transportation improvement program. The federal MPO and state RTPO requirements of these organizations are complementary. The lead agency for an RTPO is also the lead agency for the MPO within the region (except Lewis-Clark Valley MPO and Walla Walla Valley MPO because they are cross state boundaries and thus are bi-state organizations).
1 | P a g e N o r t h e a s t W a s h i n g t o n R T P OR e g i o n a l T r a n s p o r t a ti o n P l a n : 2 0 1 4 - 2 0 1 8

IntroductionHistory of the NEW Regional Transportation Planning Organization
On October 22, 1990, the Commissioners of Ferry, Pend Oreille and Stevens Counties, by resolution, formed The Northeast Washington Regional Transportation Planning Organization (NEW RTPO) under the provisions of the 1990 Growth Management Act (SHB 2929). They designated the Tri County Economic Development District (TEDD) as the lead agency for this organization. These three counties are included in the Eastern Region of the Washington State Department of Transportation (WSDOT).
The NEW RTPO was created so that the region could use its resources more efficiently to meet growing transportation needs. This Regional Transportation Plan is a result of the organization evaluating these needs.
The NEW RTPO is advised by a Regional Transportation Policy Board and a Technical Advisory Committee (TAC). The NEW RTPO is made up of duly-elected officials that represent each member jurisdiction within the three-county region. They represent regional jurisdictions, a port district, the U.S. Forest Service, private businesses, and the Department of Transportation. The TAC is represented by staff that are technically proficient in planning or engineering from member jurisdictions. Current membership of the RTPO Policy Board and Transportation Advisory Committee is available on the TEDD website.
The preparation of RTPs involve meetings with elected officials, stakeholders, and the general public. Meetings were held with city and county elected officials, planners and engineers, and input was sought from various city representatives and special districts. Elected county officials are invited along with other stakeholders representing various interests including: cities, the Washington State Department of Transportation, Chambers of Commerce, special districts, transit, airports, trucking companies, major employers, tribes and others. Participants representing many transportation and community interests review findings and provide feedback and commentary on the issues contained in the plan preparation and development plan described in this document. Meetings with the full RTPO Board were also held to provide an update on the process. Significant public input from earlier RTP update processes and associated plans are incorporated into plan updates.
Mission StatementThe mission of the Northeast Washington Regional Transportation Planning Organization is to provide a Regional Transportation Plan and associated plans that foster a positive quality of life, encourages economic development and provides a safe, reliable, efficient system to transport people, goods and services.
OrganizationA Regional Transportation Policy Board (RTPB) directs the NEW RTPO. It is made up of elected local officials, three Tribal representatives, and a local community transportation provider, who are responsible to oversee the planning process. The RTPB meets on the 4 th Wednesday of each month, unless there are no agenda items pending, to review program activities and take formal actions as required. Also, a Technical Advisory Committee (TAC), consisting of professional and technical staff members representing regional and local agencies participates in all phases of the transportation
2 | P a g e N o r t h e a s t W a s h i n g t o n R T P OR e g i o n a l T r a n s p o r t a ti o n P l a n : 2 0 1 4 - 2 0 1 8

planning process. The TAC also meets on the 4th Wednesday of each month, or as needed.
Intergovernmental CoordinationThe development of transportation facilities in the Northeast Washington Region has historically been fostered by a cooperative effort from all levels of government. As needs became apparent, local citizens, working individually or in cooperation with their neighbors worked to provide access to and from their homes, work places, commercial and industrial sites. Often this effort has taken the form of organizing and influencing city, county, tribal and state authorities to develop and apply program solutions to meet their needs.
These agencies have worked diligently within their resources to meet ever-increasing needs and have struggled with the limitations of both their jurisdictional and fiscal authority. The value of coordination with other agencies to meet growing transportation needs has always been highly regarded. The creation of the NEW RTPO is an extension of this ongoing coordination process.
The level of coordination between local, county, state, tribal and federal entities marks the quality and viability of this plan and the accomplishments of the regional program. It is the nature of this broad range of involvement that provides the opportunity for a high degree of success in identifying and addressing the needs of the region.
3 | P a g e N o r t h e a s t W a s h i n g t o n R T P OR e g i o n a l T r a n s p o r t a ti o n P l a n : 2 0 1 4 - 2 0 1 8

Figure 1: Northeast Washington Region Study Area
4 | P a g e N o r t h e a s t W a s h i n g t o n R T P OR e g i o n a l T r a n s p o r t a ti o n P l a n : 2 0 1 4 - 2 0 1 8
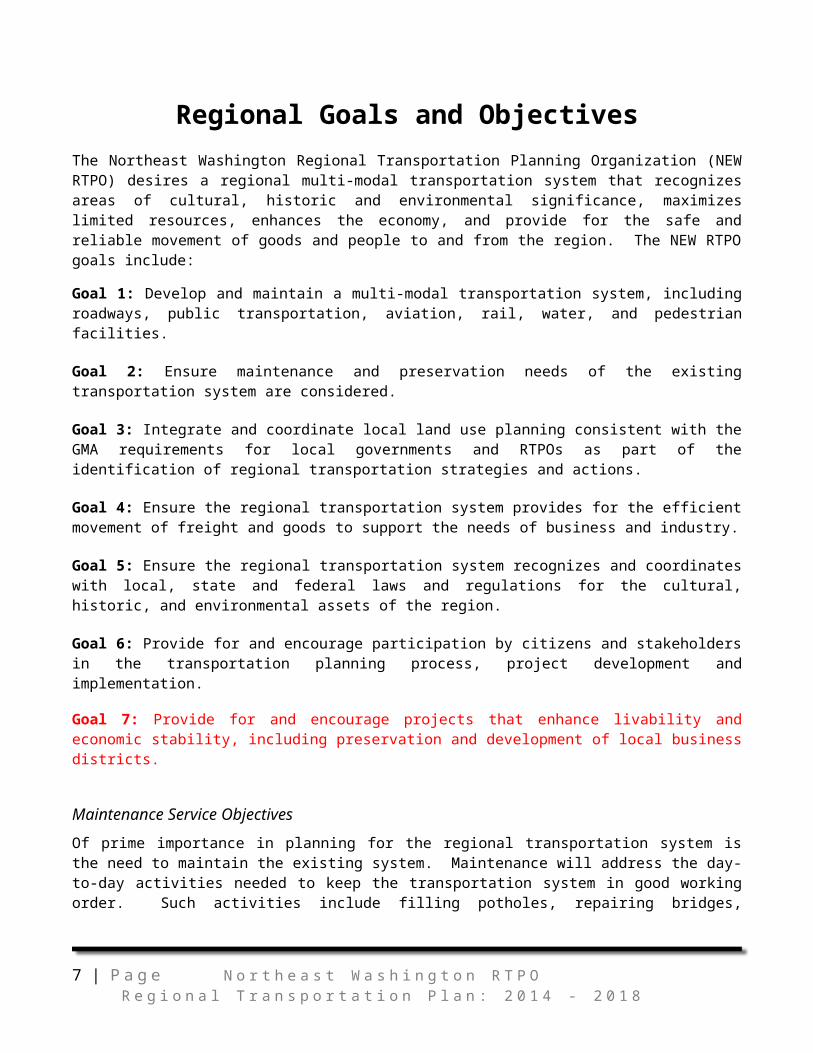
Regional Goals and ObjectivesThe Northeast Washington Regional Transportation Planning Organization (NEW RTPO) desires a regional multi-modal transportation system that recognizes areas of cultural, historic and environmental significance, maximizes limited resources, enhances the economy, and provide for the safe and reliable movement of goods and people to and from the region. The NEW RTPO goals include:
Goal 1: Develop and maintain a multi-modal transportation system, including roadways, public transportation, aviation, rail, water, and pedestrian facilities.
Goal 2: Ensure maintenance and preservation needs of the existing transportation system are considered.
Goal 3: Integrate and coordinate local land use planning consistent with the GMA requirements for local governments and RTPOs as part of the identification of regional transportation strategies and actions.
Goal 4: Ensure the regional transportation system provides for the efficient movement of freight and goods to support the needs of business and industry.
Goal 5: Ensure the regional transportation system recognizes and coordinates with local, state and federal laws and regulations for the cultural, historic, and environmental assets of the region.
Goal 6: Provide for and encourage participation by citizens and stakeholders in the transportation planning process, project development and implementation.
Goal 7: Provide for and encourage projects that enhance livability and economic stability, including preservation and development of local business districts.
Maintenance Service ObjectivesOf prime importance in planning for the regional transportation system is the need to maintain the existing system. Maintenance will address the day-to-day activities needed to keep the transportation system in good working order. Such activities include filling potholes, repairing bridges, repairing drainage ditches, repairing guardrails, maintain all weather roadway, control roadside vegetation, removing rocks, keep airport facilities in landable conditions, maintain all At-Grade Railroad crossings, and operating traffic signals efficiently. Washington State Department of Transportation and local jurisdictions monitor the condition and operation of the existing system and program projects to maintain the system. This Plan supports high priority for routine, regularly scheduled and necessary maintenance work identified by local jurisdictions.
Preservation Service ObjectivesAnother primary consideration in planning for the regional transportation system is the need to preserve the existing system and protect the heavy investments that have already been made to the system. Preservation can prolong the life of the existing transportation system through such projects as repaving roads, stabilize known unstable slopes, protecting against rock falls, rehabilitating bridges, and refurbish airport facilities. Preservation needs are identified through a Pavement Management System, Bridge Management System, and local needs analysis. This transportation plan supports
5 | P a g e N o r t h e a s t W a s h i n g t o n R T P OR e g i o n a l T r a n s p o r t a ti o n P l a n : 2 0 1 4 - 2 0 1 8

giving preservation projects prime consideration.
Profile of Northeast WashingtonTopography & Physical Features
NEW RTPO covers an area of 6,085 square miles (nearly 10% of the state’s total land area) in northeastern Washington. In general, the region is bounded by Canada to the north, the state of Idaho to the east, Okanogan County to the west, and Lincoln and Spokane counties to the south.
This area of Washington is also known as the Upper Highlands, with the rolling Selkirk Mountains running north-south. It is part of the northern Rocky Mountains. Two major rivers run north-south through this area: the Columbia River running south and the Pend Oreille River running north. The Spokane River traverses the southernmost boundary of Stevens County, and flows into the Columbia River.
Colville, the region’s largest city, sits in the Colville River Valley which flows into the Columbia River. The river valley's elevation is 1,584 feet. At the Colville Municipal Airport on the east side of town, the elevation is 1,856. The mountains surrounding Colville include Colville Mountain at 3,375 feet, Mingo Mountain at 5,534 feet, Dominion Mountain at 5,773 feet, and Gillette Mountain at 5,557 feet elevation.
The northern half of both Ferry and Stevens counties and most of Pend Oreille County are dominated by dense, rugged, mountainous terrain that makes up much of the Colville National Forest. Among the highest peaks is Sherman Pass (5,575 feet) in Ferry County, which is the highest year-round mountain pass in Washington State. Also interspersed throughout the higher country are numerous pristine lakes. As you travel south from the mountainous terrain the terrain gives way to forested foothills, drier hills and valleys dotted with low-lying vegetation.
1. Lakes and rivers significantly influence the region, particularly in the southern lowlands. 2. The Columbia River cuts a swath from the northernmost reaches of Stevens County down to
where Roosevelt Lake divides Ferry and Stevens counties.3. The boundary of Ferry County and Stevens County is delineated by the 150-mile long Franklin
D. Roosevelt Lake and National Recreation Area, which was created by backwater from Grand Coulee Dam on the Columbia River.
4. The Spokane River represents the divide between Stevens County and parts of Lincoln and Spokane counties to the south.
5. The Pend Oreille River traverses almost the entire latitudinal distance of Pend Oreille County.
Columbia River & Lake RooseveltWater ResourcesMost of the annual precipitation of the Columbia River Basin is concentrated in the winter months with the bulk of the precipitation falling in mountainous areas as snow to be stored in deep snowpacks awaiting the warmth of spring for its release. As a result, winter streamflows are generally low with high sustained runoff flows occurring in the spring and early summer. This runoff pattern of the Columbia River exemplifies a major seasonal maldistribution of flow with about 60 percent of the natural runoff of the Columbia occurring during the months of May, June, and July. The Columbia has an average annual runoff at the mouth of about 198,000,000 acre-feet (275,000 cfs) making it second only to the
6 | P a g e N o r t h e a s t W a s h i n g t o n R T P OR e g i o n a l T r a n s p o r t a ti o n P l a n : 2 0 1 4 - 2 0 1 8
Missouri-Mississippi River System in the United States (611,000 cfs) in average annual runoff. The Canadian portion of the basin generally contributes about 50,200,000 acre-feet annually, or about 25 percent of the basin total.
Drainage BasinThe Columbia River watershed covers a major portion of North America; its tributaries form the dominant water system in the Pacific Northwest Region. The headwaters of the Columbia River rises in Columbia Lake on the west slope of the Rocky Mountain Range in British Columbia. It comprises
260,452 square miles as it flows south to its mouth at Astoria, Oregon, bordering Washington and Oregon State. From the headwaters, the river flows 600 miles downstream and serves as part of the natural border between Ferry County and Stevens County. As it continues south from Canada it eventually swells behind Grand Coulee Dam, creating Lake Roosevelt. After following a circuitous path for about 1,200 miles, 415 miles of which are in Canada, it joins the Pacific Ocean near Astoria, Oregon. The river drains an area of approximately 219,000 square miles in the States of Washington, Oregon, Idaho, Montana, Wyoming, Nevada, and Utah. An additional 39,500 square mile portion of the basin, or about 15%, is within Canada and 19% is with in Washington.
Figure 2. Columbia River Drainage Basin This diagram and the “drainage basin” text were taken from "Columbia River and Tributaries Review Study: Project Data and Operating Limits", US Army Corps of Engineers, North Pacific Division, CRT 69, July 1989. Both the map and text have been slightly modified from the original source.
Columbia River System UsesThe Columbia River is a very complex and heavily utilized resource. No other single resource in the Pacific Northwest influences the character and way of life of people in the region as much as the Columbia River and its major tributaries. The Pacific Northwest is dependent to a large extent upon the Columbia River for its power, food and fiber through irrigation, transportation through navigation, recreation, fisheries, and to a lesser extent, municipal and industrial water supply. Development of
7 | P a g e N o r t h e a s t W a s h i n g t o n R T P OR e g i o n a l T r a n s p o r t a ti o n P l a n : 2 0 1 4 - 2 0 1 8

dams and storage reservoirs within the Columbia River Basin has taken place to meet the often competing needs and uses of the Columbia River and its major tributaries. How these various projects are operated determines the extent to which certain river uses can be met.Lake RooseveltFranklin D. Roosevelt Lake (also called Lake Roosevelt) is the reservoir created in 1941 by the impoundment of the Columbia River by the Grand Coulee Dam in Washington State. The river swelled behind the dam to create a 151-mile-long reservoir and was named Franklin D. Roosevelt Lake, in honor of the 32nd President of the United States, who was President during the construction of the dam. Covering 125 square miles (80,000 acres), it stretches from the Canadian border to Grand Coulee Dam, with over 600 miles of shoreline; it is the largest lake and reservoir in Washington, and home of Lake Roosevelt National Recreation Area. The Lake Roosevelt watershed drains about 44,969 square miles, 88% of which is Canada. Close to 89% of Lake Roosevelt’s water comes from the Columbia River, 7% comes from the Spokane River and 4% comes from a combination of the Colville, Kettle, and Sanpoil Rivers. The reservoir lies in parts of five counties in northeastern Washington; roughly in descending order of lake acreage they are Ferry, Stevens, Lincoln, Okanogan, and Grant counties.
RecreationThe northeast region is rich in natural recreation opportunities. It is well known for a wide variety of outdoor activities and economic growth in the area has used this resource as one of its foundations. Planning efforts for recreation development have been done by the National Park Service for the Lake Roosevelt area, the U.S. Forest Service for the Colville and Kaniksu National Forests, 49 Degrees North Ski Resort, and by Tri-County Economic Development District (TEDD) for the region. Other recreation planning has been done by the respective counties and cities in the region. Discussion of transportation issues in documents related to recreation and tourism is limited.
Scenic Byways & Recreational HighwaysThe Washington State Department of Transportation has recognized the scenic value of the region in designating portions of SR 20 (from Newport west to the Ferry County line), SR 211 (from Hwy 2 to SR 20), SR 31 (from SR 20 to Canadian border), and SR 25 (from Spokane River to Canadian border) as part of the Scenic Byways and Recreational Highways system. Further, a portion of SR 20 between Kettle Falls and Republic has been identified as the Sherman Pass Scenic Byway under the National Scenic Byways Program. All ferry routes within the state are recognized as part of this system, which would include the Gifford-Inchelium Ferry (GIF) and the Keller Ferry (KF). There are four Scenic Byways in our region and they are
8 | P a g e N o r t h e a s t W a s h i n g t o n R T P OR e g i o n a l T r a n s p o r t a ti o n P l a n : 2 0 1 4 - 2 0 1 8
31
21
25
20
20
GIF
KF
25

described in the section “Highways of Statewide and Regional Significance”.
Figure 3: Scenic Byways & Recreational HighwaysSource: WSDOT Scenic & Recreational Highways Plan 2010National, Conservation, and Recreation Lands
Colville National ForestPrior to the formation of the U.S. Forest Service, the Colville Forest Reserve was created on March 1, 1907 and later became Colville National Forest. The Forest boundary, a part of the Pacific Northwest Region (Region 6), included 700,000 acres of lands north of the Colville Indian Reservation to the Canadian Border, and was bounded east and west by the Columbia and Okanogan rivers, respectively.
Presently, the Colville National Forest has 1.1 million acres in northeastern Washington and includes the Kettle River, Selkirk mountain ranges, and the upper reaches of the Columbia River. The forest has a supervisor's office in Colville and four ranger stations that administer the forest's four districts: Three Rivers Ranger Station in Kettle Falls, Republic Ranger Station in Republic, Newport Ranger Station in Newport, and Sullivan Lake Ranger Station in Metaline Falls. The greater populated areas close to the Colville National Forest and within the US perimeter are Ferry, Stevens, and Pend Oreille Counties, the Kalispel Indian Community of the Kalispel Reservation, the Confederated Tribes of the Colville Reservation, and the Spokane Tribe of the Spokane Reservation. A portion of the Kaniksu National Forest lies in eastern Pend Oreille County and is managed by the staff of Colville National Forest.
Residents and visitors enjoy the Colville National Forest's wild huckleberries, camping, hiking trails (486 miles), OHV trails, mountain biking, horse trails, lakes, rivers, and streams. The forest also boasts exciting wildlife such as the grizzly and black bears, cougars, bald eagles and the last remaining herd of caribou in the U.S. (http://www.fs.usda.gov/main/colville/home).
Lake Roosevelt National Recreation AreaLake Roosevelt is located in Stevens County and is a sought after camping location not only for the locals but for many people from the surrounding area as well as campers traveling from British Columbia. The Lake Roosevelt National Recreation Area is approximately 36 miles from the City of Chewelah, 42 miles from the City of Colville and Kettle Falls, 18 miles from the Town of Inchelium, and across the waterway from the Colville Indian Reservation.
The upper Columbia River gorge, within which Lake Roosevelt is contained, stands in stark testimony to its geology and climate. The national recreation area spans three distinct physiographic provinces: the Okanogan Highlands, the Kootenay Arc, and the Columbia Plateau. The geologic features of these three regions are radically different and the juxtaposition of these landforms is a major factor that contributes to the unique character of the area.
In 1941 the Grand Coulee Dam was built on the Columbia River as part of the Columbia River Basin project, creating a 130-mile-long lake. Lake Roosevelt National Recreation Area provides opportunities for boating, fishing, swimming, camping, canoeing, and hunting. Visitors can also explore historic sites such as Fort Spokane and St. Paul's Mission. Lake Roosevelt is the primary flood control reservoir on the Columbia River. The lake level can rise up to 4 feet per day in spring and drop 1 foot per day in summer.
There are numerous and diverse outdoor recreational opportunities with over 130 miles of water, 27 campgrounds (open year-round), 22 boat launches, 10 swim beaches, and historical sites such as Fort Spokane Visitor Center and Museum and St. Paul's Mission. The 22 public boat launches offer a wide
9 | P a g e N o r t h e a s t W a s h i n g t o n R T P OR e g i o n a l T r a n s p o r t a ti o n P l a n : 2 0 1 4 - 2 0 1 8

variety of opportunities for every type of watercraft from canoes and kayaks to houseboats and recreational fishing and ski boats.
Wildlife species are abundant and varied in the Lake Roosevelt area. More than 75 species of mammals, 200 species of birds, 15 species of reptiles, and 10 species of amphibians may occur here. Lake Roosevelt and its tributaries in the national recreation area support a varied fish community that today is considerably different from the native fish community of the early 1900s. More than 30 species of fish inhabit LR NRA. Some common ones encountered are: walleye, rainbow trout, sturgeon, kokanee, and yellow trout. (http://www.nps.gov/laro).
Lake Roosevelt, as well as the Columbia River, are highly sought out locations for summer tourism and they are the homes of many residents residing there year round. Much of the transportation facilities are not suitable for this influx of traffic and people during the summer months. Additionally, with the influx of summer excursionists there is much economic development but there is not the infrastructure to meet those needs and retain visitors.
The transportation facilities that serve the population visiting Lake Roosevelt National Recreation Area (LR NRA) to the west of the lake include service roads that run north and south along the river; the east side of the lake is primarily served by State Route 25. In order to understand the influx of summer recreationists traveling to the area, a report by the National Park Service (NPS) indicated there were more than 1.7 million visitors visiting Lake Roosevelt NRA in 2012 who spent over $71 million in communities near the park. That spending supported 899 jobs in the local area. This report was conducted by U.S. Geological Survey economists Catherine Cullinane Thomas and Christopher Huber and Lynne Koontz for the National Park Service. The report shows $14.7 billion of direct spending by 283 million park visitors in communities within 60 miles of a national park. This spending supported 243,000 jobs nationally, with 201,000 jobs found in these gateway communities, and had a cumulative benefit to the U.S. economy of $26.75 billion. According to the report, most visitor spending supported jobs in restaurants, grocery and convenience stores at 39%, hotels, motels and B&Bs at 27%, and other amusement and recreation at 20%.
Little Pend Oreille National Wildlife RefugeThe Little Pend Oreille National Wildlife Refuge is one of over 500 NWR units and part of a national system of lands managed primarily for wildlife. The Refuge can be accessed from the International Selkirk Loop. It is located in northeast Washington, 13 miles southeast of Colville in Stevens County. It is on the west slope of the Selkirk Mountain Range, and is the only mountainous, mixed-conifer forest refuge in the lower 48 states. It was established in 1939 to provide a refuge and breeding ground for migratory birds and other wildlife. With over 41,500 acres, the elevation ranges from 1800 feet on the western lowlands to 5600 feet on the eastern boundary at Olson Peak.
The following recreational activities are permitted: fishing, hunting, photography, wildlife observation, camping, hiking, horseback riding, mountain biking, cross-country skiing, snowshoeing, and environmental education and interpretation. Birding allows visitors to explore the Refuge in search of the 206 bird species that have been recorded here. Species of special interest here include: bald and golden eagle, northern goshawk, flammulated owl, Vaux swift, and white-headed, pileated, Lewis, black-backed, and three-toed woodpeckers.
Hiking is encouraged on the Mill Butte Trail which starts at the Refuge Headquarters. The trail gains almost 600 feet in elevation with the trail difficulty level being moderate. Trail length is about 3 miles. The McDowell Marsh Environmental Education Trail goes around McDowell Marsh; a wheelchair-
10 | P a g e N o r t h e a s t W a s h i n g t o n R T P OR e g i o n a l T r a n s p o r t a ti o n P l a n : 2 0 1 4 - 2 0 1 8

accessible boardwalk spans the wetland habitat, to McDowell Lake - about one mile. Camping is allowed in six, established, no fee campgrounds from April 14 – December 31. These campgrounds have vault toilets and metal fire rings. Potable water is not available. Hunting is a popular activity on the Refuge, especially for grouse, turkey, and white-tailed deer.Fishing is also a popular activity. There are two fly-fishing only lakes that are mainly catch and release. Potter’s Pond is general fishing water with a wheelchair-accessible fishing dock. A nearby restroom is also wheelchair-accessible. The Little Pend Oreille River, its tributary streams and scattered beaver ponds, are also open to fishing. With 206 bird and 58 mammal species, there are many opportunities for viewing and photographing wildlife. Biking and horseback riding are permitted on established roads. Snowmobiles are only permitted on Olson Creek Road. (http://www.fws.gov/littlependoreille).
49 Degrees North Mountain Resort 49 Degrees North Mountain Resort is Washington State’s best kept secret and is located on the east face of Chewelah Peak at 5,773 feet. The resort is about 32 miles from the City of Colville, 10 miles from the City of Chewelah and 50 miles from north Spokane. There are approximately 2,005 acres of US Forest Service land within and surrounding the Mountain Resort. 49 Degrees North Mountain Resort operates under a 40-year special use permit from the US Forest Service. Currently there is a new development slated for this mountainous location. The new development will provide for up to 2,700 ski-in/ski-out residential and hotel units, a resort village, and an integrated system of open spaces to accommodate year-round resort activity. Ultimately, through the Resort’s Master Plan, this location will include an Alpine Village, a sports and fitness center, and a concert amphitheater. Phase I of the resort will include sites for approximately 360 residential units; there will also be condominium rental housing at the Founders Lodge, which will be located at the base of an existing new quad chairlift.
Currently, Flowery Trail Road that serves the resort is approximately 25.4 miles long and spans east to west between the City of Chewelah and State Route 20 near the town of Usk. Flowery Trail Road is an all-weather surfaced road; however the portion on the east side of the mountain pass requires further maintenance. Though the resort would bring much economic growth and development to this region of Stevens County and Pend Oreille County there are concerns as to whether the other roadways can handle this increased traffic.
Land Use & Ownership
Existing and proposed land uses are an integral component of transportation planning. The Growth Management Act requires that the transportation plan and projects to be implemented are consistent with the land use element of the local comprehensive plans.
The coordination of land use and transportation requires that those concerned with the well-being of a community assess and evaluate how land use decisions affect the transportation system and can increase viable options for people to access opportunities, goods, services, and other resources to improve the quality of their lives. In turn, the transportation sector should be aware of the effects the existing and future transportation systems may have on land use development demand, choices, and patterns.
Land Use InteractionIt can be shown that land use and transportation are inter-related and that land use activities largely determine the travel demand. The linkage between land use and transportation can be thought of as working in two ways:
11 | P a g e N o r t h e a s t W a s h i n g t o n R T P OR e g i o n a l T r a n s p o r t a ti o n P l a n : 2 0 1 4 - 2 0 1 8

1. The spatial distribution and type of land use activity influences both the demand for travel and travel characteristics. Different types of land use generate and attract differing traffic rates. For example, retail land uses will generate more trips than residential land uses.
2. Improving access by expanding the transportation system can allow for the development of land that was formerly inaccessible.
Figure 3. Transportation-Land Use Interaction
Source: Adapted from. Giuliano, G. (1995) "Land Use Impacts of Transportation Investments: Highway and Transit", in S. Hanson (ed) The Geography of Urban Transportation, New York: The Guilford Press, p. 307.
Changes in transportation technology, investment and service characteristics can alter overall accessibility levels as well as the relative accessibility of different locations. Land use changes also affect activity patterns. Of special importance are the changes in trip generation, both for passenger and freight. Trip patterns may change in a number of ways: number of trips, timing of trips, origin-destination patterns, mode, and trip chaining. These changes in travel demand exert considerable influence on the development of new transportation infrastructure or services.
"You can start with land use, or you can start with transportation; in either case, the basic feedback lead inevitably to a hierarchy of central places and transportation links connecting them" [Moore and Thorsnes, 1994].
Ownership DistributionA relatively large percentage of the region is publicly owned, particularly in Ferry and Pend Oreille counties. The majority of property in the region is held either as public property managed primarily by the US Forest Service or as Tribal Lands. Private land is becoming more and more expensive as the population grows and more property is developed. This factor, combined with the mountainous nature of the geography, is expected to produce significantly higher demands on privately held land in the future.
Three-fifths of the NEW RTPO’s entire land mass is under public ownership. Over one-third of region’s land is owned by the Federal government, largely under the control of the US Forest Service. Two National Forests—Colville and Kaniksu—span the three county area. The National Park Service, U.S. Bureau of Land Management, and U.S. Fish & Wildlife Service also have sizable land holdings in the region. Washington State government controls approximately 365 square miles of the Tri-County region’s land mass.
Fourteen (14) tribes – which include the Confederated Tribes of the Colville Reservation (12), the Kalispel, and the Spokane – have extensive land holdings in the region. Combined, reservation lands
12 | P a g e N o r t h e a s t W a s h i n g t o n R T P OR e g i o n a l T r a n s p o r t a ti o n P l a n : 2 0 1 4 - 2 0 1 8

for these tribes total 1,200 square miles in the three counties. More than half of the Colville Indian Reservation is located in southern half of Ferry County, while the entire Spokane and Kalispel Indian Reservations are located within south Stevens County and Pend Oreille County respectively.
Management of access and use of both publicly owned lands and Tribal lands in the future is also a major factor affecting the adequacy of transportation facilities serving those areas.
Table 1: Land Distribution in Northeast Washington Region
Figure 4: Land Distribution by County
Sources: Washington Office of Financial Management
Through coordinated efforts by the RTPO and local jurisdictions/tribes they are able to help create a systematic approach for identifying transportation related issues and problematic areas for inclusion into the RTP. This identification process provides rural communities information regarding travel demand management (TDM) can help achieve the following objectives:
● Increase Transportation Options● Provide Basic Access● Improve Transportation Affordability● Increase opportunities for enjoyable and Healthy exercise
13 | P a g e N o r t h e a s t W a s h i n g t o n R T P OR e g i o n a l T r a n s p o r t a ti o n P l a n : 2 0 1 4 - 2 0 1 8

● Address traffic congestion and parking problems associated with Tourist and Special Event transportation
● Create attractive Bus and Rail Stations where residents can wait in comfort and security.● Improve Community Livability● Help preserve special community and environmental features● Improve Transportation Safety
Population TrendsChanges in population and resulting population densities are major factors affecting transportation needs in more urbanized areas. Traditional transportation study methods use these factors as primary indicators for developing travel forecasts to identify future transportation needs.
For rural areas with urbanized populations under 50,000, the accuracy of such forecasts tend to become very unstable because error margins, normally acceptable when dealing with large numbers, reflect a disproportionate impact for smaller populations. As a result a different methodology for evaluating rural transportation issues must be identified.
Table 2: Population Trends 1990 – 2014 for Tri-County Region
Table X. Historical Population by Jurisdiction & Tri-County
14 | P a g e N o r t h e a s t W a s h i n g t o n R T P OR e g i o n a l T r a n s p o r t a ti o n P l a n : 2 0 1 4 - 2 0 1 8
CensusPopulation
Current Population
Percent Change
Counties & Municipalities
1990 2000 2010 2014 1990 - 2000
2000 - 2010
2010 - 2014
Ferry 6,925 7,260 7,551 7,660 15.33 4.01 1.44Unincorporated
5,985 6,306 6,478 6,560 17.76 2.73 1.27
Republic 940 954 1,073 1,100 1.49 12.47 2.52Incorporated 940 954 1,073 1,100 1.49 12.47 2.52
Pend Oreille 8,915 11,732 13,001 13,210 31.60 10.82 1.61Unincorporated
6,114 8,735 9,810 9,985 42.87 12.31 1.78
Cusick 195 212 207 205 8.72 -2.36 -.01Ione 507 479 447 445 -5.52 -6.68 -.004Metaline 198 162 173 185 -18.18 6.79 6.94Metaline Falls 210 223 238 240 6.19 6.73 .01Newport 1,691 1,921 2,126 2,150 13.60 10.67 1.13Incorporated 2,801 2,997 3,191 3,225 7.00 6.47 1.07
Stevens 30,948 40,066 43,351 43,900 29.46 8.20 1.27Unincorporated
22,668 30,629 33,713 34,230 35.11 10.07 1.53
Chewelah 1,945 2,186 2,607 2,615 12.39 19.25 .003Colville 4,360 4,988 4,673 4,690 14.40 -6.32 .004Kettle Falls 1,272 1,527 1,595 1,610 20.05 4.45 .01Marcus 135 117 183 180 -13.33 56.41 1.64Northport 308 336 295 290 9.10 12.20 1.69Springdale 260 283 285 285 8.85 .01 0Incorporated 8,280 9,437 9,638 9,670 13.97 2.13 .003
Tri-County 46,788 59,058 63,903 64,770 26.22 8.20 1.36

Source: U.S. Census Bureau and Washington State Office of Financial Management (OFM)
15 | P a g e N o r t h e a s t W a s h i n g t o n R T P OR e g i o n a l T r a n s p o r t a ti o n P l a n : 2 0 1 4 - 2 0 1 8

With nearly 10% of Washington State's land area, the region has only 1% of the state's population resulting in a low population density of 9.3 persons per square mile. As evidenced by the population table, the majority of the residents live in the unincorporated regions of each county. Due to the way the population is dispersed and the low density, rural areas tend to be more automobile dependent. Most trips are made by personal automobile and there is often relatively little demand for alternative modes, such as ridesharing, transit, and cycling. Though there is little demand for the alternative modes of transportation it is still an obstacle for special populations and industries within the regional counties, cities and tribes.
By comparison, Washington State's population density is 88.5 persons per square mile. This low population density is a primary factor inhibiting the region's ability to compete for transportation improvement funding. Some transportation-funding allocations have use population as the basic criteria, while others utilize levels of service to allocate funding.
From 1950 through 1970 the region of northeast Washington experienced gradual population decline following the traditional rural to urban migration pattern common to the rest of the United States. As shown on Table 2 on the previous page, the population of this region has experienced periods of high growth, followed by slower growth cycles and/or population decline.
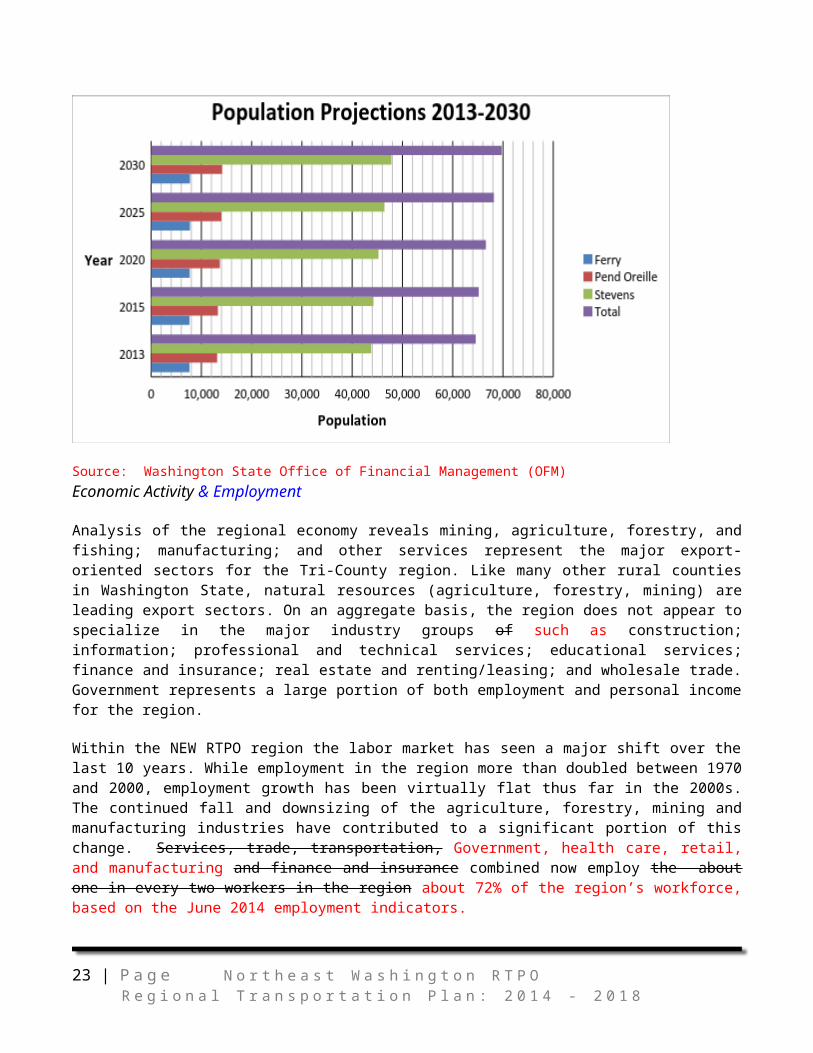
The Office of Financial Management (OFM) in Washington continues to hold the stance that the population will continue to grow over the next few decades. Based on the actual growth rates experienced in recent years, the chart in Figure 5 is showing population forecasts up to the year 2030 was based on projections from the OFM for medium population increases rather than high rates. Overall, the increase is expected to be approximately 8% for the region.
Figure 5: Population Projections for Tri-County Region 2013 - 2030
Source: Washington State Office of Financial Management (OFM)
16 | P a g e N o r t h e a s t W a s h i n g t o n R T P OR e g i o n a l T r a n s p o r t a ti o n P l a n : 2 0 1 4 - 2 0 1 8

Economic Activity & Employment
Analysis of the regional economy reveals mining, agriculture, forestry, and fishing; manufacturing; and other services represent the major export-oriented sectors for the Tri-County region. Like many other rural counties in Washington State, natural resources (agriculture, forestry, mining) are leading export sectors. On an aggregate basis, the region does not appear to specialize in the major industry groups of such as construction; information; professional and technical services; educational services; finance and insurance; real estate and renting/leasing; and wholesale trade. Government represents a large portion of both employment and personal income for the region.
Within the NEW RTPO region the labor market has seen a major shift over the last 10 years. While employment in the region more than doubled between 1970 and 2000, employment growth has been virtually flat thus far in the 2000s. The continued fall and downsizing of the agriculture, forestry, mining and manufacturing industries have contributed to a significant portion of this change. Services, trade, transportation, Government, health care, retail, and manufacturing and finance and insurance combined now employ the about one in every two workers in the region about 72% of the region’s workforce, based on the June 2014 employment indicators.
In 2011, the total number of firms in the Tri-County area was 2,012. This represents a decrease of 197 firms, or 9%, since 2003, and a slight decrease from 2010. Statewide, there were 235,350 firms in 2011, representing an overall 2% increase since 2003 and a 4% increase from 2010.
While employment has not increased slightly in recent years (there was a .7% increase in jobs created in the region between 2013 and 2014) and the number of firms overall has declined, there has been a marked increase in self-employment. Compared with the state and other counties, self-employed workers in the region compose a significant share (nearly a third) of total employment. In Stevens County alone, for the time period of 2007 through 2009, 11.1 percent were self-employed compared to 6.6 percent for Washington State and 6.5 percent in the U.S.
Recreation and tourism activities in the area also generate a large number of trips that either originate or are destined towards the region’s many lakes, rivers and mountains. Major activities include skiing, boating, camping, hiking, fishing, and hunting. These activities supplement various sectors of businesses in the region such as transportation, retail, lodging, and eateries. However, with the trend in recent years towards “staycations” – whereby local residents utilize local recreational facilities rather than traveling long distances for vacations to save expenses – sales related to lodging and fuel consumption would suffer somewhat.
An upcoming trend in commuting, recreation, and tourism is bicycling. There are a few different sides to this trend. There has been an increase in bicycling as a form of transportation to offset costs of driving. Another aspect is a desire to increase one’s health by using bicycle riding as a form of exercise. Yet another aspect is to use bicycling as a form of recreation. All of these require the provision of facilities for safe travel, such as properly marked bicycle lanes; designated paths or trails for bicycle or pedestrian use; and safe places to park and secure bicycles.
The tri-county region is beginning to attract more long-range cyclists to the area. U.S. Bike Route 10 (USBR10) has been approved for official recognition as of May 28, 2014 (WAbikes.org). The route traverses our region, following Highway 20 across the state from Anacortes on the west coast to Newport on the eastern border. Portions of this trail have already been renovated to accommodate this use, such as the upgrades made in Republic, WA, in recent years.
17 | P a g e N o r t h e a s t W a s h i n g t o n R T P OR e g i o n a l T r a n s p o r t a ti o n P l a n : 2 0 1 4 - 2 0 1 8

Another subset of cyclists are those that enjoy mountain biking. Again, our region is conducive to this activity and warrants serious consideration of providing adequate facilities to encourage visitors and residents alike to partake in it.
Since Beginning in 1990, the unemployment rate for the Tri-County region has had consistently been higher than the Washington State rate by an average of 4 percentage points. However, this trend started to change by 2010; the unemployment rates for the region in 2010 reached 12.5 percent, compared to that of Washington State at 9.2 percent and the U.S. at 9.6 percent. This gap has continued to narrow in recent years. As of June 2014, the unemployment rate for the region stands at 7.9%, compared to 5.8% for the state and 6.1% for the nation. Although this is a decrease from 2010, as shown on Figure __, this region remains among the high end of the unemployment rate for the state.
Figure 6: June 2014 Unemployment Rates for Washington State
Source: Washington State Employment Security Department; Local Unemployment Statistics
The recent labor statistics for our region are encouraging, nonetheless. In order to continue to promote a positive economic growth pattern for our region, it is crucial to provide adequate and all-weather transportation facilities, to accommodate motorized and non-motorized modes for commercial, private, and public use.
(Sources: Washington State Employment Security Department: Labor Market and Economic Analysis Branch; Northeast Washington Trends, www.northeastwashingtontrends.org; U.S. Census Bureau; American Community Survey; and emsi Analyst at www.economicmodeling.com/analyst).
18 | P a g e N o r t h e a s t W a s h i n g t o n R T P OR e g i o n a l T r a n s p o r t a ti o n P l a n : 2 0 1 4 - 2 0 1 8

Regional Transportation SystemIn order to fully understand the magnitude of the task of providing an operable transportation system in each county, it is important to consider the full transportation system of county roadways. The Northeast Washington Regional Transportation System is comprised of a multimodal transportation system which moves both people and goods. This includes roadway networks for passenger cars, buses and trucks. Bicycle and pedestrian systems, public transportation services, ferry services, and airports serve needs for the movement of passengers as well as some freight and crop services. Railroads also meet a significant need and provide linkages to the rest of the state and country to move important timber, mining, and agricultural products from the region to outside markets. Each of these modes will be discussed in more detail below.
Roadway Transportation Network ComponentsRoadwaysThere are many miles of county roadways in the region as well as local, state and federal roads that are operated and maintained within the region. State highways provide a critical component of the transportation system in linking the region internally as well as to the rest of the state and nation. Typically roadways are functionally classified within each jurisdiction as to the type of service provided. Table 3 summarizes the mileage of city streets, county roads and state highways by functional classification.
Table 3: Roadway - Functionally Classified - Mileage by CountyOwner/Functional Classification Ferry Pend Oreille Stevens TOTALCities (all combined) 12.0 47.0 94.9 153.9County Roads
Arterial - - - -Collector 231.3 180.8 564.7 976.7Local Access 507.7 370.5 928.6 1,806.8
Total 738.9 551.3 1,493.3 2,783.5State Roads
Interstate Highways - - - -Principal State Highways 28.7 19.5 57.9 106.0Minor State Highways 44.8 96.1 126.4 267.4Collector State Highways 82.1 - 58.4 140.5
Total 155.6 115.6 242.7 513.9OtherWA State Parks and Recreation 2.1 0.4 - 2.6WA State Department of Natural Resources 359.2 536.6 119.7 1,015.6WA State Fish and Wildlife 0.5 108.1 0.4 109.0US Forest Service 167.9 208.0 74.9 450.8National Fish and Wildlife Service - - 58.5 58.5Bureau of Indian Affairs 368.6 21.7 254.7 645.0
Total 898.3 874.8 508.2 2,281.4COMBINED TOTAL 1,804.9 1,588.7 2,339.1 5,732.7
Source: County Road Administration Board 2008 Annual Report; 2008 Data from WSDOT Transportation Data Office
19 | P a g e N o r t h e a s t W a s h i n g t o n R T P OR e g i o n a l T r a n s p o r t a ti o n P l a n : 2 0 1 4 - 2 0 1 8

20 | P a g e N o r t h e a s t W a s h i n g t o n R T P OR e g i o n a l T r a n s p o r t a ti o n P l a n : 2 0 1 4 - 2 0 1 8

In some areas of the region there are roadways that have significant grades. There are also many roadways that have frequent significant horizontal alignment changes to follow valleys or hillsides. The challenges that arise from such roadways are not insignificant in that they pose maintenance and safety issues. Each of the counties in the region has stewardship of some roadways that have some or all of the following characteristics: gravel surface, narrow lanes, small or non-existent shoulders, no guardrails, seasonal weight restrictions.
Aside from a six-mile section of four-lane divided highway on US Hwy 2 in southern Pend Oreille County and the urban portion of US Hwy 395 in Colville, all highways and roads within the region are two lanes. Truck climbing and passing lanes are scattered along portions of US Hwy 395.
There are five Border Crossings at the US/Canadian Border within the northeast Washington region: Danville, Midway, Northport, Boundary/Waneta and Metaline Falls. These crossings provide for significant opportunities for the movement of freight and people between the two countries.
The tri-county region’s eastern boundary extends to the Washington/Idaho border and north to the US/Canadian border. Several State Highways connect the region north to south: Hwy 395 (a NAFTA route), US 2, SR 25, SR 31 while SR 21 and SR 20 connect the region east to west.
Tables 4 were prepared to shows the extent of roadway surface type for each county within the region.
Table 4: Roadway Surface Type and Total Mileage of County Roads
System Component
County Ferry Pend Oreille Stevens TotalAccess Roads 507.7 370.5 928.8 1,806.9Arterial Roads 231.3 180.8 561.7 973.7 TOTAL System 738.9 551.3 1,490.5 2,780.7
Paved Arterial 176.8 167.4 465.1 809.3Unpaved Arterial 54.5 13.4 96.6 164.4Other Paved 24.7 131.4 196.8 352.9Other Gravel 359.2 217.6 687.5 1,264.3Dirt 123.9 21.4 44.5 189.8 TOTAL System 738.9 551.3 1,490.5 2,780.7
Source: County Road Administration Board Certified County Road Log
Ferry County has nearly 740 miles of roadway with 200 miles paved. The Colville Confederated Tribes maintains a road system in the south half of Ferry County. The mileage is undetermined at this time, but is estimated to be between 100 and 150 miles. The Bureau of Indian Affairs (BIA) maintains almost an additional 370 miles of roadway within the reservation and the Washington State Department of Natural Resources (DNR) maintains another 360 miles of roadways. Stevens County has the most roadway miles in the region with approximately 1,490, with 662 miles paved. The Spokane Indian Reservation in southern Stevens County has 453 miles of existing and proposed roads; 56.2 miles of these are Stevens County roads. Additionally, the Tribe has 251 miles of BIA and Tribal roads. Pend Oreille County has the least amount of roadway miles with just over 550 miles with approximately 300
21 | P a g e N o r t h e a s t W a s h i n g t o n R T P OR e g i o n a l T r a n s p o r t a ti o n P l a n : 2 0 1 4 - 2 0 1 8
miles being paved. The Department of Natural Resources has an additional 536 miles of roadway and the USFS has over 200 miles of roads in Pend Oreille County. WSDOT is responsible for just over 510 miles of highways in the region and all state routes are paved.
Further examination of Tables 3 and 4 reveals several important characteristics of each county roadway network:
● Total roadway mileage within the three counties of all state and local roads combined is nearly 5,800 centerline miles.
● Combined city roadway mileage makes up approximately 3% of the region’s total.● County roadway mileage for the three counties combined makes up nearly 50% of the mileage
in the region at nearly 2,800 centerline miles, with 1,162 miles (42%) paved.● Nearly 17% of the county arterial roadways are unpaved, with Ferry County having the largest
percentage at nearly 24%, while Pend Oreille County has only 8% of arterial roads as gravel.● Nearly 60% of the county roadways are unpaved, with Ferry County having the largest
percentage at nearly 75%. ● State highways make up 9% of the regions roadway mileage, while other state and federal
roadways (Department of Natural Resources and US Forest Service) make up 40%.
Highways of Statewide and Regional Significance
US Highway 395US 395 from Spokane to the Canadian border at Laurier has been identified as a High Priority Corridor in the Transportation Equity Act for the 21st Century (TEA-21) and is named as a route on the National Highway System, which is the top priority classification for highways. It has been recognized as an important economic link to Spokane for Stevens, Ferry, and northern Pend Oreille counties, as well as a large area of southeastern British Columbia. It is also recognized that US Hwy 395 will be an important part of the development of the north Spokane Corridor. The growth of northern Spokane and southern Stevens counties is causing the need for capacity improvements on US Hwy 395 in the near future. Substantial public support for these improvements has been seen.
These issues and others, regarding US Hwy 395, were the subject of a corridor study performed by WSDOT in 1995 and has not been updated. The results of that study addressed potential transportation alternatives within Chewelah, Colville and Kettle Falls. The recommendations were to maintain the existing alignment; consideration should be given to the following upgrades: SR 25 from Kettle Falls to Northport to a principal arterial highway and its associated design standards. In addition, the Northport to Waneta road should be considered as an addition to the state highway system and upgraded using the same principal arterial design standards. Further study should be done on both of these important routes.
Of critical concern to the region, is to insure that incremental improvement of US Hwy 395 in the form of additional lanes, truck climbing lanes, and intersection channelization occurs in a timely manner to improve safety, traffic flow, and faster mobility.
At present, an Inland Pacific Hub Regional Transportation Study is being conducted. This study is a collaborative effort by the Inland Pacific Hub Advisory Board and regional membership (Washington, Idaho, and Kootenai area in Canada) to assist in establishing the Inland Pacific Region as a multimodal global gateway designed to increase international commerce and enhance the regional economy. US
22 | P a g e N o r t h e a s t W a s h i n g t o n R T P OR e g i o n a l T r a n s p o r t a ti o n P l a n : 2 0 1 4 - 2 0 1 8
Hwy 395 corridor is critical to this effort.
Other Regional HighwaysHighways of Statewide Significance (HSS) include interstate highways and other principal arterials that are needed to connect major communities in the state. The designation helps assist with the allocation and direction of funding. The HSS was mandated by the 1998 legislature through enactment of House Bill 1487 and codified into RCW 47.06.140. In 1999 the legislature passed House Joint Memorial 4006 requesting that WSDOT, with the assistance of Regional Transportation Planning Organizations, update the HSS at least every five years.
The HSS was designated by the Transportation Commission through Resolution #660 on January 21, 2004. The Legislature concurred and adopted the HSS, including a map and route list through Engrossed House Bill 1433 on March 31, 2004. In 2006 the legislature adopted House Bill 3266 adding SR 169 to the route list of highways of statewide significance. In 2009 the legislature adopted SB 5642 adding SR 164 to the route list of highways of statewide significance.
By definition all state highways are considered to have regional significance. Since many roads are used to transport timber and other products to market outside the region all roads on the Freight and Goods System are also considered to be of regional significance. Other functionally classified roads provide access to recreational facilities in the region that attract visitors statewide as well. All railroads, airports, river transportation systems, transit systems, and non-motorized facilities are considered to be regionally significant as well. Regionally significant roads and other transportation system components are discussed below. are shown. The Goods and Freight Systems Roadways and the classifications are shown in Figure __.
Figure 7: Highways of Statewide Significance
23 | P a g e N o r t h e a s t W a s h i n g t o n R T P OR e g i o n a l T r a n s p o r t a ti o n P l a n : 2 0 1 4 - 2 0 1 8

Source: www.wsdot.wa.govIndian Reservation Roads (IRR)The Colville Confederated, Spokane, and Kalispel reservation lands cover a large area within the Northeast Washington region. Within each reservation there are three types of roadways: tribally owned roads; BIA owned roads; and County, State and City owned roads. Each of these roadways are maintained by their respective owners and designated as a full public use road. All three types of roads are designated as inventory in the IRR.
An IRR is defined by the BIA as a public road that is located within or provides access to: an Indian reservation or Indian trust land; or restricted Indian land that is not subject to fee title alienation without the approval of the Federal government; or Indian or Alaska Native Villages, groups, or communities in which Indians and Alaska Natives reside, whom the Secretary of the Interior has determined are eligible for services generally available to Indians under Federal laws specifically applicable to Indians.
The IRR Inventory means a comprehensive database of all transportation facilities eligible for IRR program funding by tribe, reservation, BIA agency and region, Congressional District, State, and County. Other specific information collected and maintained under the IRR Program includes classification, route number, bridge number, current and future traffic volumes, maintenance responsibility, and ownership.
The BIA office in Portland provides technical assistance on IRR road improvements projects in Northern Utah, Western Montana, Southeast Alaska, Oregon, Washington and Idaho. Funding is available for IRR type road projects through the Department of Interior for road maintenance projects on BIA owned roads and Federal gas tax dollars for new or reconstructed road funds for all IRR type road projects.
The Northwest Tribal Technical Assistance Program (NWTTAP), located at Eastern Washington University, is a program funded by Cooperative Agreements with the Federal Highways Administration (FHWA) to assist tribes in developing transportation resources, infrastructure, and development opportunities for Northwest Tribes. NWTTAP publishes a quarterly newsletter, the Northwest Tribal Transportation News; provides technology transfer materials, including films, books and pamphlets dealing with road and highway planning to interested local and tribal governments; provides information services, including training on intergovernmental transportation planning; and conducts or arranges
24 | P a g e N o r t h e a s t W a s h i n g t o n R T P OR e g i o n a l T r a n s p o r t a ti o n P l a n : 2 0 1 4 - 2 0 1 8

seminars and training sessions on topics of concern to American Indian tribal governments.
Forest Highways The following section is derived, in part, from the Washington Forest Highway Plan 2012-2032:
In 1891, Congress authorized the creation of Forest Reserves, now called National Forests. Forests were to be conserved to assure a permanent national timber supply; to preserve scenic and wilderness areas for recreational use by the public; and to safeguard the steady flow of streams that supplied water for domestic, farm, and industrial use. Federal participation in forest road construction began when Congress passed the Federal-Aid Road Act in 1916. This act appropriated $10 million ($1 million per year for 10 years) for the "…survey, construction, and maintenance of roads and trails within or only partly within the national forests when necessary for the use and development of resources upon which communities within and adjacent to the national forests are dependent…"
It was not until the passage of the Federal Highway Act of 1921 that two types of forest roads were defined:
o Forest Development Roads - those forest roads that are needed primarily for management of the national forests
o Forest Highways (FH) - those forest roads which must serve the national forests and also serve the communities within and adjacent to the national forests
During the first 50+ years of the program, most of the funds were expended on routes which were of primary importance to the states, counties, or communities within or adjacent to the national forests. Most of those routes were of statewide importance and were then, or later became, State Primary Highways.
The 1978 Surface Transportation Assistance Act (STAA) changed the direction of the Forest Highway Program by redefining Forest Roads, Forest Development Roads, and Forest Highways:
The term "forest road or trail" means a road or trail wholly or partly within, or adjacent to, and serving the National Forest system and which is necessary for the protection, administration, and utilization of the National Forest system and the use and development of its resources.
The term "forest development road and trail" means a forest road or trail under the jurisdiction of the Forest Service."
The term "Forest Highway" means a forest road under the jurisdiction of, and maintained by, a public authority, and open to public travel.
The Forest Highway Plan describes the process for coordinated planning and decision-making among the agencies responsible for the Washington Forest Highway Program. Those agencies are:
o Washington State Department of Transportation (WSDOT);o US Department of Agriculture, Forest Service (USFS), Pacific Northwest Region (Region 6);o Federal Highway Administration (FHWA), Western Federal Lands Highway Division (WFLHD).
The WFLHD administers the Washington Forest Highway Program in partnership with the USFS and WSDOT, collectively called the Tri-Agency. In addition, the Washington State County Road Administration Board (CRAB) attends Tri-Agency meetings to represent the counties in the state. A member of CRAB is involved in the Washington Forest Highway Program discussions, but does not
25 | P a g e N o r t h e a s t W a s h i n g t o n R T P OR e g i o n a l T r a n s p o r t a ti o n P l a n : 2 0 1 4 - 2 0 1 8
have decision-making authority.
This Washington Forest Highway Long-Range Transportation Coordination Plan (Coordination Plan) is intended to help the Tri-Agency make investment decisions for planning, multi-modal alternatives, transportation enhancements, safety management, preservation, and construction on Forest Highways in Washington. Because funds are limited, it is essential to assess needs, set priorities, and manage and leverage funds efficiently from a variety of sources to meet transportation needs. This Coordination Plan provides a 20-year vision and mission for the Washington Forest Highway Program, as well as goals, a funding and investment strategy, criteria, and guidance—all of which are to be used to select projects that will receive Washington Forest Highway Program funding.
Another purpose of this document is to help transportation planners, transportation professionals, forest professionals, community representatives, and citizens who have an interest in improving Forest Highways understand the Forest Highway Program, thereby helping them to understand the types of projects eligible for program funding as well as how to participate in the planning and decision-making processes.
The Tri-Agency drafted this Coordination Plan. The plan was then made available for review and comment by other agencies and the public. Based upon input received during the comment period, this Coordination Plan was revised and finalized. However, this plan is intended to be a “living” document and, as such, will be reviewed and updated periodically (such as when new legislation is enacted) to remain current and relevant to the Washington Forest Highway Program. Figure __, below, is included in the Coordination Plan.
Figure 8: Washington Forest Highways by Jurisdiction
26 | P a g e N o r t h e a s t W a s h i n g t o n R T P OR e g i o n a l T r a n s p o r t a ti o n P l a n : 2 0 1 4 - 2 0 1 8

Source: Washington Forest Highway Long-Range Transportation Coordination Plan 2011 to 2013.
What Are Forest Highways?A “Forest Highway” is a forest road under the jurisdiction of and maintained by a public authority and open to public travel. A total of approximately 31,200 miles of roadway are designated as Forest Highways in the United States. In general, Forest Highways must:
be within or adjacent to National Forest System (NFS) lands;be necessary for access to protect, administer, utilize, and develop National Forest resources;be open to public travel; andprovide a connection to other transportation systems (e.g., public roads, shipping points, etc.).
Forest Highways are a subset of Washington’s overall road system. They comprise about 1,860 miles of roadway in Washington, ranging from single-lane rural roads to state highways.
A Forest Highway is managed by a public authority other than FHWA. In Washington, Forest Highways are managed by WSDOT, the USFS, or a local (county) government. A Forest Highway may comprise several segments, each managed by a different authority, and a Forest Highway project may receive funding from several sources.
Some examples of Forest Highways in Washington include roads that cross the Cascade Mountains (like portions of US Highway 12, and SR 410,) and that travel through scenic areas, like the Columbia River Gorge (SR 14). Forest Highways also provide access to popular recreation areas such as Olympic National Park (like portions of US Highway 101) and North Cascades National Park (like portions of SR 20). Forest Highways are also roads that lead directly into the forest, like Wind River
27 | P a g e N o r t h e a s t W a s h i n g t o n R T P OR e g i o n a l T r a n s p o r t a ti o n P l a n : 2 0 1 4 - 2 0 1 8

Road (National Forest Service Route 30) leading to the south side of the Gifford Pinchot National Forest.
Why Are Forest Highways Important?Forest Highways derive their importance from the National Forest System (NFS) lands to which they provide access. Forest Reserves, the precursors to today’s National Forests, were established in 1891, through the National Forest Reserve Act. Through that act, forested lands could be kept in public ownership and managed for the good of all people, including future generations. With the establishment of the Forest Service in 1905, it was the first Chief Forester, Gifford Pinchot, who stated that the purpose of the National Forests is to provide the “greatest good for the greatest number in the long run.” Pinchot’s conservation philosophy is echoed in today’s Forest Service mission, to “sustain the health, diversity, and productivity of the Nation’s forests and grasslands to meet the needs of present and future generations.”
Integral to fulfilling the Forest Service’s mission, is providing access to NFS lands. Accessing those lands is part of our heritage, our culture, and our economy. We access NFS lands for recreation, resource extraction to support local economies, scientific research, education, and numerous other activities. People appreciate and have concern for their NFS lands when they can reach them, spend time in them, and enjoy them.
In addition, population growth and continuing human development are increasing the demand for access to NFS lands. More people are living closer to NFS and other federal lands as urban and suburban development expands. In Washington, Forest Highways are particularly important where almost 22 percent of the land is NFS lands. Approximately 9.3 million acres of NFS lands are within Washington’s boundaries.
What Is the Washington Forest Highway Program?The Washington Forest Highway Program addresses the need for safe and adequate transportation access to and through NFS lands for visitors, recreationists, resource users, and others that are not specifically addressed by other transportation programs. It provides funding and technical assistance to resurface, restore, rehabilitate, or reconstruct designated public roads that provide access to or are within NFS lands. Nationally, 41 states have Forest Highway Programs. Washington has approximately 1,860 miles of designated Forest Highways.
A reliable source of funding has not always been available to Forest Highways. Although Forest Highways were first defined in the Federal Highway Act of 1921, funding needed to develop and maintain the roads was small and inconsistent because selection for funding was based on the extent to which the roads were “of primary importance to the States, Counties, or communities ... and on the Federal-Aid System.” Because Forest Highways tended to be low-volume roads, they rarely ranked high using that criterion. Passage of the Surface Transportation Assistance Act in 1978 and its amendment in 1982 established the current Forest Highway Program, providing a specific funding source for Forest Highways so they no longer had to compete against state routes for funds. The legislation resulted in a consistent and reliable source of funding for the development and improvement of Forest Highways.
Typically Forest Highway funding is provided for the planning, design, construction, reconstruction, or improvement of designated Forest Highways, including bridges. Additionally, funds can be used to pay for any transportation project authorized in Title 23 of the United States Code (USC), such as transit facilities. Through the federal tax on gasoline, the Washington Forest Highway Program provides approximately $11 million of federal transportation funding to Washington each year for Forest
28 | P a g e N o r t h e a s t W a s h i n g t o n R T P OR e g i o n a l T r a n s p o r t a ti o n P l a n : 2 0 1 4 - 2 0 1 8

Highways. The Forest Highway funding is in addition to the approximately $600 million of annual federal funding provided to WSDOT for transportation projects in the state. Projects funded by the Washington Forest Highway Program occur on Forest Highways under various jurisdictions.
Figure 9: National Forests in Northeast Washington
Source: National Forest Service, Colville, WA
Why Do We Need Coordinated Transportation Planning?The Forest Highway Program requires transportation planning that is consistent with state and local transportation planning processes, and that clearly defines and offers opportunities for public input. The main objectives of such a planning process are:
to develop and maintain a coordinated, “seamless” transportation system for public use, even though various segments of the system are under different jurisdiction;
to help ensure that the most-needed projects receive funding and are implemented, so that the infrastructure remains in place to access Washington’s NFS resources and communities; and
to lay the foundation for streamlined environmental review.Residents and visitors in Washington want to get to their destinations safely and experience a quality natural environment when they arrive. To provide appropriate access to NFS lands, planners and decision-makers must consider a complex balance among transportation effectiveness, human safety, and environmental care. The Tri-Agency partners need to work together to effectively manage and implement the Washington Forest Highway Program and to wisely invest Forest Highway Program funds.
Forest Highways may be under the jurisdiction of one or more agencies, and they serve multiple purposes and a variety of users. Therefore, Forest Highway projects need to address multiple objectives. Limited funding and increased use of the Forest Highway transportation system contribute
29 | P a g e N o r t h e a s t W a s h i n g t o n R T P OR e g i o n a l T r a n s p o r t a ti o n P l a n : 2 0 1 4 - 2 0 1 8

additional challenges to Forest Highway Program planning. The potential environmental effects of Forest Highway projects also need to be considered. Coordination among the Tri-Agency partners, as well as environmental resource and permitting agencies and the public, is required to implement projects efficiently and effectively, while addressing the vision, mission, and goals of the Washington Forest Highway Program.
Some general requirements for coordinated Forest Highway planning are set forth in Title 23 of the Code of Federal Regulations (CFR) Part 660, Subpart A – Forest Highways, which is provided in Appendix D of WSFHP. Additional requirements are listed in Title 23 of the United States Code (23 USC), which is the federal surface transportation act.
In 23 USC 135 (statewide planning for highways), the language related to the transportation planning requires each state to consider the concerns of Indian tribal governments and federal land management agencies that have jurisdiction over land within the boundaries of the state. In accordance with 23 USC 204, Forest Highway planning should follow a process consistent with the statewide and metropolitan planning organization (MPO) processes to ensure coordination for all public roads in a State. Also, Forest Highway planning requires consultation with Federal land management agencies.
Scenic BywaysThere are several four designated Scenic Byways within the northeast Washington Region. These include:
● The Sherman Pass Scenic Byway stretches 40 miles across NE Washington connecting the communities of Republic on the west and Kettle Falls on the east. Along this section of State Route 20, the Byway passes through the Kettle Mountain Range and 35 miles of the Colville National Forest. Sherman Pass, at an elevation of 5575 feet, is the highest pass in the State of Washington and is kept open year round. It is named for General William T. Sherman, who passed through the area in 1883, when the route was a wagon road used by pioneers.
Washington State designated the route in 1967 as a State Scenic Byway, and the U.S. Forest Service – Colville National Forest designated the route in 1990 as a National Forest Scenic Byway. Bicyclists are frequent users of Sherman Pass because it is recognized as part of the most scenic routes available in the State of Washington.
● The North Pend Oreille Scenic Byway is located one hundred miles northeast of Spokane, WA. The 27-mile corridor (SR 31) begins at the Tiger Junction (SR 20) and proceeds north along Pend Oreille River to the Canadian border. The area’s scenic, natural, and recreational qualities led to State scenic route designation in 1993.
● Pend Oreille Valley Scenic Byway follows the Pend Oreille River from Newport, Washington north to Tiger Junction, along SR 20. The name Pend Oreille is said to have come from a French trapper's description of the dangling earring pendants worn by a local Indian tribe. The route travels through beautiful river valleys and goes by the small communities of Usk and Cusick. This sparsely populated roadway offers several accesses to the river, such as an off-road ATV Park north of Cusick and recreational access for hiking and fishing into the Colville National Forest. The NF may be accessed from both the west side of the byway as well as from LeClerc Road on the east side of the river, which is on the Kalispel Indian Reservation. The tribe recently opened a rest stop on SR 20, about a mile north of Cusick, known as “Kalispel Kafe”. It offers amenities for travelers 24/7/365.
30 | P a g e N o r t h e a s t W a s h i n g t o n R T P OR e g i o n a l T r a n s p o r t a ti o n P l a n : 2 0 1 4 - 2 0 1 8
● The International Selkirk Loop Scenic Byway on the U.S. half of the Loop is 161 miles, with another 242 miles of “Super Side Trips,” one of which includes the Pend Oreille National Scenic Byway. In the U.S., the main Loop route is composed of four State Scenic Byways: the North Pend Oreille Scenic Byway and the Pend Oreille Valley Scenic Byway in Washington, and the Panhandle Historic Rivers Passage and the Wild Horse Trail in Idaho. The area covered includes Pend Oreille County in Washington, and Bonner and Boundary Counties in Idaho. (www.fhwa.dot.gov/byways.org).
Alternate Transportation Modes
Railroads Figure 10: Regional Railroad Facilities The tri-county region is served by three railroads: Burlington Northern Santa Fe (BNSF), Kettle Falls International Railway (KFR) and the Pend Oreille Valley Railroad (POVA).
Burlington Northern Railroad Company is the product of nearly 400 different railroad lines that merged or were acquired over the course of 160 years has 50 active spurs in Stevens County that carry wood products, rocks, limestone and fertilizer. Burlington Northern Santa Fe (BNSF) and Kettle Falls International Railway (KFR) lines have two access points into British Columbia, Canada.
The Kettle Falls International Railway (KFR) operates over Source: 2011 Washington State Rail System Map160 miles of former Burlington Northern Santa Fe track in Northeastern Washington and Southeastern British Columbia. KFR operates from the BNSF interchange at Chewelah, Washington in Stevens County, to Columbia Gardens, British Columbia. BNSF then makes connections in Spokane County where there are direct lines from Union Pacific, Burlington Northern Santa Fe and Amtrak to Seattle and Chicago, serving as a gateway to and from the interior U.S. and the Pacific Rim. A second line operates from Kettle Falls, Washington to Grand Forks, British Columbia.
KFR has a very diverse traffic base, including lumber, plywood, wood products, minerals, metals, fertilizer, industrial chemicals, and abrasives. Key customers include ATCO Lumber, Teck Resources Ltd., Boise Cascade, International Raw Materials, Pacific Abrasives, Stimson Lumber, Vaagen Bros Lumber, and Columbia Gardens Reload. KFR works closely with local economic development agencies on new business opportunities and with five days per week rail connections with BNSF, KFR is an excellent choice for new plant locations.
31 | P a g e N o r t h e a s t W a s h i n g t o n R T P OR e g i o n a l T r a n s p o r t a ti o n P l a n : 2 0 1 4 - 2 0 1 8
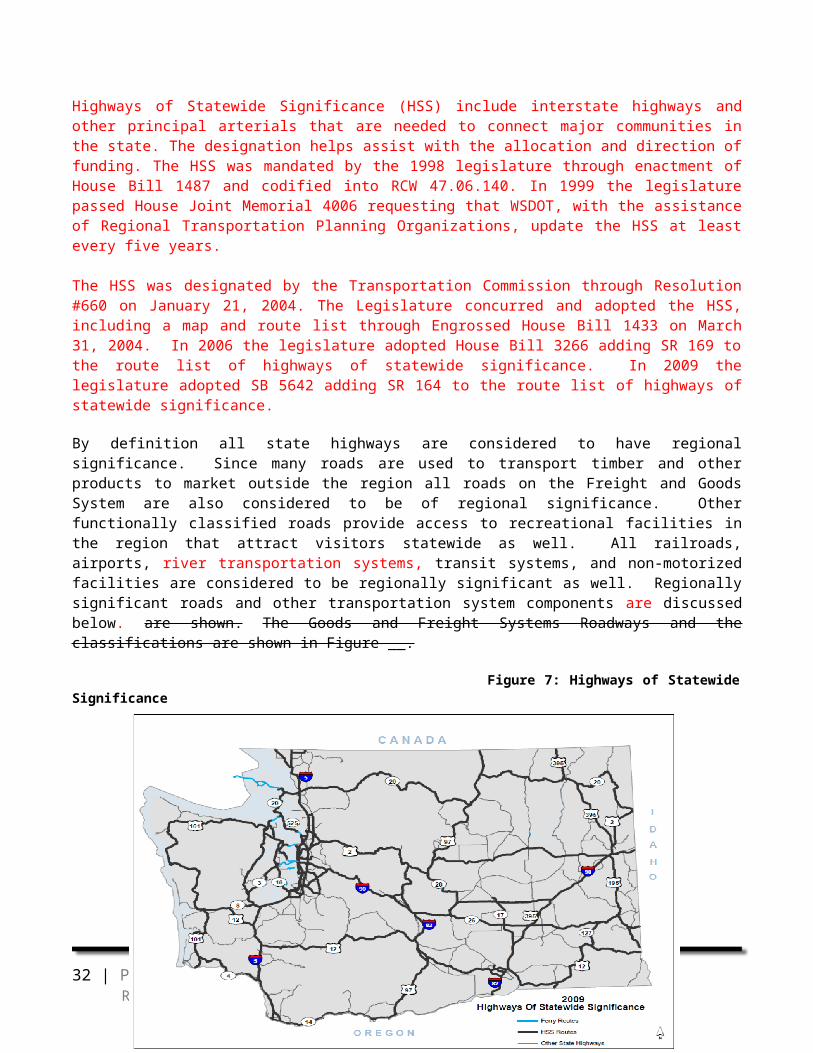
The Port of Pend Oreille owns and operates the Pend Oreille Valley Railroad (POVA). There is freight rail service by the POVA from Newport to Metaline Falls; however, the line is mostly used for tourist rides between the towns of Ione and Metaline Falls. POVA also provides switching operations to shippers; leases track from BNSF from Newport, WA to Dover, ID; and operates “over-trackage rights” into Sandpoint, ID, in order to interchange with BNSF. Air ServiceThe 2005 Washington State Long-Term Air Transportation Study (LATS) identified 139 general aviation airports statewide with six airports in the northeast Washington region capable of accommodating small aircraft, with two in each county. These public airports serve an important function of the overall regional transportation system. Airport locations in the tri-county region are shown in Figure __. Of the six airports in the NEW RTPO region, two are included in the Federal Aviation Administration’s National Plan of Integrated Airport Systems (NPIAS). The NPIAS identifies more than 3,300 airports that are significant to national air transportation and thus eligible to receive Federal grants under the Airport Improvement Program (AIP). The remaining four non-NPIAS airports are not eligible to receive Federal grants and must fund planning and improvement projects locally. Funding assistance can also be obtained from the State, when available, through the Washington State Department of Transportation’s Local Airport Aid Grant Program.
Figure 11: State Recognized Airports in Northeast Washington
Source: WSDOT Aviation at http://www.wsdot.wa.gov/aviation/AllStateAirports/WashAirports_Eastern.htmA summary of basic airport information is listed in Table__ along with information about the estimated total number of aircraft based at each airport and the total annual airport operations in 2012. Airport operations consist of the number of take-offs and landings at an airport. The definition of one operation is either a take-off or landing. Operations are grouped into two types of operations: local and itinerant.
(1) Local operations mean operations performed by aircraft that: (i) Operate in the local traffic pattern or within sight of the airport;
(ii) Are known to be departing for, or arriving from flight in local practice areas located within a 20-mile radius of the airport; or
32 | P a g e N o r t h e a s t W a s h i n g t o n R T P OR e g i o n a l T r a n s p o r t a ti o n P l a n : 2 0 1 4 - 2 0 1 8
(iii) Execute simulated instrument approaches or low passes at the airport.
(2) Itinerant operations mean all aircraft operations other than local.
The total annual operations for the northeast Washington Region airports in 2012, were estimated to be 11,565 units of operation.
Table 5: Airport Details Summary
Airport &Location Owner
NPIAS Airport
2012Annual
OperationsLocal Based
Aircraft
Runway length/width, surface type
Avey FieldLaurier WSDOT Aviation No 20 0 1,975/40 gravel
Colville MunicipalColville City of Colville Yes 5,000 38 2,700/45 asphalt
Ferry CountyRepublic Ferry County No 850 6 3,480/60 asphalt
Ione MunicipalIone City of Ione Yes 1,770 5 4,046/45 asphalt
Sand CanyonChewelah City of Chewelah No 3,625 17 3,515/48 asphalt
Sullivan Lake StateMetaline Falls WSDOT Aviation No 300 0 1,765/150 turf
Totals: 11,565 66Source: WSDOT Aviation: 2012 Economic Activity Reports
Although these airports can service small aircraft, they will not accommodate small jet business and/or commercial commuter aircraft. As seen on the following page in Table 6, the activity at each of the region’s airports is limited. Additional airport functions monitored by WSDOT, such as airplane parts manufacturing, aerial tours, parachuting, air freight and other commercial air services, could be considered if the local facilities were able to be expanded to accommodate them. Facilities in this region are restricted by topography; therefore, any plans for expanding air service and related activities would likely require relocation.
33 | P a g e N o r t h e a s t W a s h i n g t o n R T P OR e g i o n a l T r a n s p o r t a ti o n P l a n : 2 0 1 4 - 2 0 1 8

Table 6: Airport Operations Activity for 2012
Operations Activity in 2012
Airport Agricultural Spraying
Air Ambulance
Aerial Surveying
Civil Air Patrol
Flight Training
Medical Transport
Wildland Fire
Fighting
Avey Field XColville Municipal X X X X XFerry County X X X X XIone Municipal X X XSand Canyon X X XSullivan Lake X X
Source: WSDOT Aviation: 2012 Economic Activity Reports
The City of Colville, is currently in the recent past, had actively pursued the process of determining the feasibility of properly siting and constructing a new airport. This controversial subject resulted in a vote in the community and the idea of a regional airport in Colville was voted down.
There is still a need for a regional airport in northeast Washington. The facility would need to be capable of providing additional service for business, corporate, and commercial commuter type aircraft that would play a significant role relative to regional economic development, business expansion, and tourism. A new airport to accommodate small jet and larger propeller type planes will also provide increased efficiency for regional medical services and services to the northeast Washington region.
River TransportationThere are also 2 two ferries operating in the Tri-County area. Both are free of charge and operate year-round. Their schedules fluctuate depending upon the time of year.
The Gifford–Inchelium Ferry (GIF), also known as GIF “The Columbia Princess”, is a ferry across the Columbia River in Washington State, located by the community of Gifford approximately 23 miles south of Kettle Falls. The Colville Confederated Tribes operate this ferry across Roosevelt Lake on the upper Columbia River. It connects Inchelium, which is on the Colville Reservation in Ferry County, to State Route 25, which is in Stevens County across the lake.
The Martha S., also known as the Keller Ferry, is owned and operated by Washington State Department of Transportation (WSDOT). The ferry crosses the Columbia River (Franklin D. Roosevelt Lake) between Lincoln County and Ferry County at the confluence of the Columbia and the Sanpoil River. In August 2013, the newest vessel -- known as “The Sanpoil” -- replaced the Martha S. which had been in operation since 1948. This construction project included the new vessel and associated loading terminals. The total project cost was $11,339,000, which included a contribution of $2M from the Colville Confederated Tribe. (http://www.wsdot.wa.gov/projects/sr21/kellerferry/) These facilities provide vital access to and from southern Ferry County.
Other waterborne transportation includes tourism and some commercial shipping service on Lake Roosevelt and the Pend Oreille River.
34 | P a g e N o r t h e a s t W a s h i n g t o n R T P OR e g i o n a l T r a n s p o r t a ti o n P l a n : 2 0 1 4 - 2 0 1 8
Non-Motorized Modes Transportation (Bicycle/Pedestrian)The region has experienced a growth in bicycling in the recent past. While there are three primary categories of bicycling as a means of transportation, touring, recreation and commuting, only touring has demonstrated a level of activity that merits consideration on a regional scale.
State Route 20, which crosses all three counties in the region, has been identified among the top ten routes nationally for cross country touring. As of May 28, 2014, this route was become officially recognized by the American Association of State Highway and Transportation Officials (AASHTO) as U.S. Bike Route 10 (USBR10). This is the first formal designation of an interstate bicycle route in the state of Washington (WAbikes.org). Growing numbers of touring groups are using this route and other links, such as US Hwy 395, SR 21, and SR 25. WSDOT has recognized the significance of bicycling on a statewide level and has included improvements to accommodate projects when funding is available. The bicycling public should also evaluate other regionally significant routes for access and safety.
The Washington State Department of Transportation produces a State Bicycle Map that indicates the average daily traffic on all state highways and also shows which state highways have shoulders less than two feet in width. Bicyclists wishing to travel in the area are encouraged to consult this state map. Given the relatively light traffic volumes on many of the roadways in the region, bicycle travel is considered a relatively safe activity; however many of the state highways in the region are identified as having shoulders less than two feet wide.
Input received from the public outreach process consistently expressed concerns about pedestrian and bicycle safety. These concerns included issues such as narrow or non-existent bike lanes or sidewalks; pathways that were obstructed or not cleared of debris; potholes in paved areas; and pavement markings that were not adequate to properly direct traffic or were faded. Having access to these facilities year-round was also a concern. In most cases, the lack of maintenance during the winter restricts their use.
Significant effort has been put forth to establish a non-motorized trail from Kettle Falls to Colville. A Phase I Master Plan was developed which evaluated the different alignments options, with the alignment that generally follows US Hwy 395 appearing to be the most viable. This route has been generally identified to be within the WSDOT right-of-way along the highway, but without the potential of being used for roadway expansion in the near future. Further investigation is in progress to clarify the ownership of the proposed trail location. If the project is able to move forward, the local Rotary Club has offered to provide monitoring and maintenance of the trail.
In addition, a substantial effort has been made to establish a trail (use has not yet been determined) on the 30 28-mile railroad corridor between Republic and Danville, WA. This rail line was previously has been rail-banked to Ferry County. In April 2014, the first phase of the trail was dedicated, which includes approximately 2.5 miles of paved pathway and a 770-foot long railroad trestle that has been converted to a decked pedestrian bridge with safety rails. The bridge decking on the north end of Curlew Lake was a significant part of this phase of the project. (WAbikes.org)
There are also several off-road unpaved trails used for mountain biking and hiking through the region such as are common to National Forests. Significant trails within the region include:
● The recently created Pacific Northwest Trail (see www.pnt.org) stretches from the Pacific Ocean to Montana and connects the Pacific Crest Trail with the Continental Divide Trail. Through the northeast Washington region it heads southwest of Republic, then eastward and continues north
35 | P a g e N o r t h e a s t W a s h i n g t o n R T P OR e g i o n a l T r a n s p o r t a ti o n P l a n : 2 0 1 4 - 2 0 1 8

over Sherman Pass and Copper Butte, then eastward again through the cities of Northport and Metaline Falls.
● Two of Washington’s 25 Centennial Trails reside within the northeast Washington Region. The Kettle Crest Trail is 40 miles long and is part of a 110 mile network of trails. The most popular access is at Sherman Pass. The other Centennial Trail is the Shedroof Divide near Sullivan Lake in Pend Oreille County.
Recent efforts have begun to establish a network of trails just north of the Colville city limits on Colville Mountain. Even though this area is outside of the city, a large portion of the land holding belongs to the city. Intervening property owners on already-utilized roads and trails on the mountain are being contacted for potential cooperation and formal establishment of this trail system. At the north end of this system, on the south slope of the mountain, is a large white cross and a covered pavilion known as the “Vista House” where visitors to rest from their trek up the mountain.
Providing safe travel for pedestrians is an ongoing challenge. Separate paved off-road facilities for pedestrian and bicycle use are sparse throughout the region and is limited to points within city limits. In many of the communities sidewalks are the only type of separate facility for non-motorized transportation, and in most areas, sidewalks are non-existent. Within the urban areas where sidewalks do exist, they are often very old, worn, broken, or buckled, due to frost heave and exposure to severe winter weather.
Efforts to increase the quality and quantity of sidewalks have been made in recent years, particularly with the Surface Transportation Program – Enhancement funds made available by the federal government. Most of the communities have projects included in their Transportation Improvement Program to expand their sidewalk system.
Typically, pedestrians are thought of as persons traveling by foot; however, consideration should also be given to pedestrians who use “electric personal mobility assistive devices”, also known as EPMADs or scooters. These devices may be legally used on sidewalks, under pedestrian regulations, or along the sides of the road, under bicycle regulations. In either case, individuals that use these devices depend on them for mobility and require safe access in their travels.
There have been recent improvements to increasing safety while crossing high-traffic areas in the various communities. Most of the communities in our region are considered “Main Street” cities, whereby the main thoroughfare is usually a highway that traverses their community. This increases the potential for encounters between non-motorized users and vehicle traffic traveling through. Uses include the installation of bulb-outs, to decrease travel distance crossing roads; increased visibility in crosswalk signage and markings; and adding lighting to alert vehicles of pedestrian crossings.
Public Transportation At this time, there is no public transit agency within the northeast Washington Region; however, there are several other types of public transportation options available to residents. All of these agencies have been involved in a subcommittee of the NEW RTPO, known as the “Human Transit Committee” to improve and enhance the provision of public transportation in the region.
Rural Resources Community Action provides transportation services for the public and people with special transportation needs (including those persons that are unable to provide their own transportation due to age, disability or income). Services include:
36 | P a g e N o r t h e a s t W a s h i n g t o n R T P OR e g i o n a l T r a n s p o r t a ti o n P l a n : 2 0 1 4 - 2 0 1 8

● Public commuter routes between Chewelah and Colville and Kettle Falls in the morning and evening.
● Diners Choice transportation for seniors in Republic, Kettle Falls, Colville, Newport, and Chewelah.
● Dial-a-ride transportation for the public to access basic services including shopping, nutrition, social service appointments, medical care (for non-Medicaid eligible clients) adult education, job training, or employment. These services are provided in Ferry County between Republic and Curlew, in Stevens County between Kettle Falls and Colville and in Pend Oreille County between Cusick, Usk, the Kalispel Indian Reservation, and Newport as well as between Metaline Falls and Newport.
● Public demand response transportation is provided for passengers living outside of the regularly scheduled dial-a-ride areas.
● Twice monthly public demand response service is provided for outlying residents to Colville, Chewelah and Kettle Falls. Five separate routes reach remote locations in all three counties.
● Head Start transportation services for enrolled children three to four years old children between home, daycare and the Head Start Centers throughout the tri county area.
Special Mobility Services is the Medicaid Broker for the tri-county region and uses a combination of their own vehicles, volunteers and contractors to provide transportation for Medicaid recipients to access Medicaid paid services. Their services are also available for the general public.
NEW Alliance (formerly Ferry County Community Services) provides transportation to seniors and disabled persons for meeting basic needs.
Career Path Services provides transportation assistance to disabled adults, helping them access supported employment and training.
Catholic Charities/Volunteer Chore provides transportation to seniors and adult disabled clients helping these community members meet basic needs and keeping them living independently.
Multiple organizations have emerged in recent years to cater to the transportation needs of veterans. The tri-county region has an unusually high veteran population, and it has become apparent that there is an increased need to coordinate efforts between the various transportation providers for all users.
The Kalispel Tribe of Indians initiated the Kalispel Tribal Transit System (KALTRAN) to provide public transportation services for both Tribal members and the surrounding regional communities of Spokane and Pend Oreille Counties in May of 2009. The service is operated by the Kalispel Tribal Planning Department under the auspices of the Kalispel Tribal Business Council. The existing vehicle fleet consists of (2) 22-passenger buses and (1) 7-passenger mini-van. The fleet is operational 4 days per week (Monday- Thursday), from 6am to 6pm. The existing routes operated by KALTRAN include service as follows:
● North Spokane to the Wellness Center (3) Round trips per day● Wellness Center to Ione (3) Round trips per day● Newport to the Wellness Center (1) Reverse commute trip per day● Cusick/Usk to the Wellness Center (2) Round Trips per day● Deviated Route service is offered up to ¾ of a mile off the regularly scheduled route or within
the boundaries of the Kalispel Indian Reservation.
37 | P a g e N o r t h e a s t W a s h i n g t o n R T P OR e g i o n a l T r a n s p o r t a ti o n P l a n : 2 0 1 4 - 2 0 1 8

KALTRAN will continue to evaluate the potential for route expansion from the Kalispel Tribal reservation to the surrounding communities, as an effort to try to meet the ongoing transportation needs of the community. Transportation service provision from the Northern Tribal lands to those located south in Airway Heights, will be one such expansion in the review and planning process. Other such projects related to KALTRAN include the plans to remodel and build a bus housing and maintenance facility and office space, sufficient to meet the increasing needs of KALTRAN.
KALTRAN works in conjunction with both the Spokane Regional Transportation Coalition (SRTC) and the Regional Transportation Planning Organization (RTPO) to enhance the delivery of transportation services for its rider populations. Primary sources of funding for KALTRAN are the Kalispel Tribal set aside, the Federal Transportation Administration (FTA) 5311(c), and the Washington State Department of Transportation (WSDOT).
The Spokane Tribe has no formal public transit service but has limited informal transit services to meet the needs of ill, disabled and elderly residents. With federal 2009 FTA funds, the Spokane Tribe completed an in-house preliminary transit need and feasibility study in 2009. Currently, the Tribe is undertaking development of an overall Transit Plan. With other FTA funds, the Tribe is beginning implementation of an employee/student vanpool project that will utilize six vans. With six vans. With 2009 capital and operations grants from WSDOT, the Tribe is also beginning implementation of a two bus fixed route general public transit pilot project. recently established a public transit system, known as “The Moccasin Express”. The service has three routes; the Chokeberry, Bitterroot, and Tule runs. Together they connect the residents of the Spokane Indian Reservation with the city of Wellpinit, where their business and commerce center is located. They also provide ADA paratransit service and deviated service, upon request. (www.spokanetribe.com) The Moccasin Express provides a run to the casino in Airway Heights once a week. It is their desire to expand their services to include commuter service five days a week to other locations outside of their reservation, such as Chewelah, Reardon, and Spokane.
The Colville Confederated Tribe (CCT) provides a deviated, fixed-route shuttle service for their residents within the Colville Indian Reservation between the communities of Omak to Nespelem as well as Nespelem to Inchelium five days a week, Monday through Friday. The CCT also operate the Gifford-Inchelium and Keller ferries. (www.colvilletribes.com)
The Washington State Department of Transportation has an Intercity Bus Program that began in 2007. It is funded with a Federal Transit Administration grant and helps to replace service in many smaller communities no longer served by national bus lines. There are currently three four fixed routes serving various parts of the state. The route from Kettle Falls to Spokane is known as “The Gold Line” and it began in 2010. Currently, the Gold Line has two round trips daily, with only a few holidays off per year. This service has multiple stops along its route and is able to connect area residents with Amtrak, Northwest Trailways, the Spokane International Airport, Greyhound Bus, and the Spokane Transit Authority (www.gold-line.us).
In 2013, the NEW RTPO began an extensive outreach program to identify the transit needs of the tri-county region. Committee members attended three public events within each county to conduct in-person surveys and dialogue about regional public transit. In addition to this, TEDD staff members and contracted Welch-Comer and Plangineering out of Spokane to assist with outreach to representatives of public agencies in the region and public workshops to solicit further input from area residents. The result of this outreach program will be a revised Coordinated Public Transit-Human Services Transportation Plan for Northeast Washington.
38 | P a g e N o r t h e a s t W a s h i n g t o n R T P OR e g i o n a l T r a n s p o r t a ti o n P l a n : 2 0 1 4 - 2 0 1 8
An attempt was made by the NEW RTPO to solicit for a grant from Washington State Department of Transportation to conduct a public transportation feasibility study in 2011. Although that was not realized, there may still be continued interest to determine whether there is enough support to establish a Public Transportation Improvement Conference (PTIC), and which geographic areas would be included. Based on the needs identified in such a feasibility study, and the options for transportation service, the PTIC would determine whether or not to establish a transit authority of some form.
39 | P a g e N o r t h e a s t W a s h i n g t o n R T P OR e g i o n a l T r a n s p o r t a ti o n P l a n : 2 0 1 4 - 2 0 1 8

Freight & Goods SystemThis section of the document is a duplicated excerpt of information obtained from the Washington State County Road Administration Board (CRAB). It has been incorporated into this document in order to clarify the systems of classification and evaluation that are used by the various jurisdictions for highway construction and/or maintenance. This website, http://www.crab.wa.gov/County/county_data.cfm, may be used to compare information and data outlined in this section.
Freight transportation is an important component of the larger transportation system, as it underpins the national and state economies, supports national defense and facilitates the distribution of goods and services to all residents on a daily basis. Because of this, the freight transportation system in Washington must function at all levels of government from international, national, to state and local. Internationally, Washington is a “gateway” state connecting Asian & Canadian trade flows to the U.S. economy. Nationally, Washington's freight system facilitates trade from Alaska and along the west coast. Additionally, the state's producers (firms and/or farmers) rely upon the freight transportation system to access distant markets across the country and around the world for Washington-made products. And lastly, Washington's freight transportation system serves as a local utility, vital for access and mobility for citizens throughout the state as they meet their consumption needs. As a result, the planning of transportation and freight improvement projects should be multi-faceted so as to include these various government jurisdictions and their specific needs.
According to the WSDOT's Washington Transportation Plan, “Globalization, competitive industry trends, and new technologies are pushing freight volumes up twice as fast as Washington's overall population and passenger traffic growth”. Whereas, the state population is projected to grow 34 percent by 2030, growth in the freight system, in part as measured by truck trips and freight volumes, is expected to increase by nearly 80 percent (Washington State Office of Financial Management, 2004). In order to meet this growing demand on the freight transportation system, it will become imperative to employ coordinated decision-making and coordinated collection and presentation of transportation projects, priorities, and information.
The projected increased demand for freight transportation for commerce all across the state is increasing the need for the state and local governments to appropriately anticipate and provide for current and future freight transportation infrastructure, especially as it relates to improved freight mobility.
The Washington State Legislature has recognized that Washington State is uniquely positioned as a gateway to the global economy. As one of the most trade-dependent states per capita in the nation, Washington’s economy is highly dependent on an efficient multimodal transportation network in order to remain competitive. The vitality of the state's economy is placed at risk by growing traffic congestion that impedes the safe and efficient movement of goods. Freight corridors that serve international and domestic interstate and intrastate trade and those freight corridors that enhance the state's competitive position through regional and global gateways are strategically important.
Ownership of the freight mobility network is fragmented and spread across various public jurisdictions, private companies, and state and national borders. Transportation projects have grown in complexity and size, requiring more resources and longer implementation time frames. State investments in projects that enhance or mitigate freight movements should pay special attention to solutions that utilize a corridor solution to address freight mobility issues with important transportation and economic impacts well beyond any local area.
40 | P a g e N o r t h e a s t W a s h i n g t o n R T P OR e g i o n a l T r a n s p o r t a ti o n P l a n : 2 0 1 4 - 2 0 1 8
The County Freight and Goods System (CFGS) is made up of 11,727 centerline miles of county roads – which is 29.8% of the 39,337 total miles of county roads in the state. There are 9,866 miles of the CFGS roads that are classified as arterials and collectors. This represents 84.1% of the County Freight and Goods System.
The purpose of the County Freight and Goods System (CFGS) Status Report is:
1. To develop criteria for determining which roads should be included in the CFGS;2. To obtain the field data necessary to determine which roads are CFGS routes;3. To establish the CFGS network, statewide;4. To develop criteria to evaluate deficiencies in the CFGS;5. To obtain a needs assessment to determine the costs to improve the CFGS to all-weather
standards; and6. To provide information on County Roads Strategic Freight Corridors.
The counties will monitor changes in their truck routes and obtain truck classification and volume information on new and existing truck routes annually. This information is used by each county to develop their priority arrays, deficiency and needs analysis, six-year programs, and annual road improvement programs. This information will also be used to provide an updated annual status report on the County Freight and Goods System; be provided to WSDOT to update the Freight and Goods Transportation System (FGTS) inventory; and be provided to the Freight Mobility Strategic Investment Board (FMSIB) to update their Strategic Corridors inventory.
Truck Route Classifications
In order to be integrated with the statewide FGTS, the CFGS uses the same method of classification as the FGTS. The current FGTS classes are based on gross annual tons of freight and goods on the route. To determine gross annual tons on each road, every county must have accurate truck volumes and classification information on its road system. All counties are obtaining the needed information as part of their annual traffic counting and classification program.
Within the three counties there are almost 3,000 miles of county roadways included in the statewide Freight and Goods System. Of that, approximately 786 miles are reported within the first five tiers of truck route classifications. Table 7 shows the corresponding data, as reported in 2012 by the County Road Administration Board for this region.
Table 7: Freight & Goods System of NEW Roads
F&GS CountyTruck Route Classification Ferry Pend Oreille StevensT-1: >10 million tons/year 0 0 0T-2: 4 – 10 million tons/year 0 0 0T-3: 300,000 – 4 million tons/year 108.86 38.39 79.72T-4: 100,000 – 300,000 tons/year 115.60 125.40 184.56T-5: 20,000 tons in 60 days 0 62.21 71.12Total F&GS Mileage (T-1 to T-5) 224.46 226.00 335.40Total Adequate 27.31 0.49 12.82Percent Adequate 2012 12.2% 0.2% 3.8%
Source: County Road Administration Certified County Road Log, January 1, 2012
41 | P a g e N o r t h e a s t W a s h i n g t o n R T P OR e g i o n a l T r a n s p o r t a ti o n P l a n : 2 0 1 4 - 2 0 1 8

Three additional truck route classes, T-6, T-7, and T-8 have been created for the purposes of allowing the counties to better classify County Freight and Goods System (CFGS) routes in the future. The inclusion of T-6, T-7, and T-8 will allow these routes to be identified and properly managed. Class T-1 through T-5 are the same as the current Freight and Goods Transportation System (FGTS) truck route classes established by the Transportation Commission.
T-6 is a road that has over 100,000 gross annual tons, but not in every year. These are cyclical truck routes. An example is lowland logging. Certain roads will carry many loaded trucks during the year(s) that their tributary areas are being logged, but these areas are logged only once every 10 to 25 years. During the harvest years, these roads will likely meet the criteria for a FGTS/CFGS route, but only in those years. While there may be better ways to manage these routes than reconstruction to FGTS standards (e.g., haul road agreements), this classification will provide an inventory of these routes.
T-7 is a route that would be an FGTS route but there is some problem with the road that prevents truck traffic from using it. If these problems were eliminated, the roads would become preferred truck routes with a savings of time and/or distance over currently used routes. An example of such a route comes from Spokane County: There is a road, the use of which would save trucks both time and distance, but there is an inadequate railroad crossing that prevents use of the route. If the railroad crossing were improved, trucks would use the road. Using this classification will provide a list of road improvements that would benefit the movement of freight and goods.
T-8 was created for the Lower Snake River Drawdown Study (1999), to inventory those county roads that would become an FGTS route if barge traffic were removed from the Snake River. As grain is hauled from farm or storage to the Tri-Cities or beyond, rather than to the barge loading facilities on the Snake River, truck travel patterns will change. Truck Route Class T-8 will identify those routes that will likely become FGTS/CFGS routes if this happens.
County Data Collection and Analysis
Annually, counties conduct traffic counts on a portion of their road system and conduct volume and classification studies on many roads that are existing and/or potential truck routes. To provide the best information possible, some counties work with trucking concerns (haulers, grain co-ops, and industry representatives) to develop tonnage data.
The field data obtained provides the number of truck-by-truck classifications. The methodology developed by WSDOT, described in “Instructions for FGTS Truck Tonnage Estimation”, is used to convert this information to Gross Annual Tons. The WSDOT methodology was used so that the designation of Truck Route Classes would be consistent between the state and the counties.
Counties submit an annual Road Log update to CRAB that includes all changes made to their road systems during the year. The update contains road and usage information for all identified CFGS routes which CRAB extracts for each CFGS route. This information provides an inventory of the CFGS routes and a deficiency elimination evaluation and maintenance needs evaluation for each county’s system. This is the basis for the CFGS Annual Status Report. The following describes the methodology used for this evaluation process.
RoadsOne of the tasks of the Cost Responsibility Study was to define a set of “Minimum Tolerable Conditions” (MTC) that a FGTS route must meet to be deemed ‘adequate’. The MTCs were established
42 | P a g e N o r t h e a s t W a s h i n g t o n R T P OR e g i o n a l T r a n s p o r t a ti o n P l a n : 2 0 1 4 - 2 0 1 8

for Roadway Width and Structural Adequacy.1. Roadway Width is a measure of the safety and ease of operation of trucks. A narrower roadway
provides operational impediments to safe and efficient operation of trucks. Pavement Width and Shoulder Width are required fields in the Road Log, and are certified correct by the County Engineer.
2. Structural Adequacy is the ability of the pavement and base to adequately support the number of heavy loads on the road. Weeks of Weight Restriction (how many weeks in a typical average year the road is restricted to lighter loads) and Base Adequacy (an evaluation of the adequacy of the road base to support the volume of heavy trucks using the road) are not required fields. The counties are encouraged to enter correct data in these fields. However, due to data and staff limitations, some information may not be current.
A scenario approach was adopted by the Cost Responsibility Study (CRS) to produce estimates of needs under alternative sets of minimum tolerable conditions. This provides policy makers with a range of options and information on how the needs vary depending on the MTCs selected. Scenario 1 is "all weight restrictions addressed", and assumes that all FGTS segments with weight restrictions will be upgraded to all-weather roads. Scenario 2 is "some weight restrictions addressed", and assumes that minimal weight restrictions would be allowed in the lower truck route classes (T-3 thru T-5). Scenario 3 is "most severe weight restrictions addressed", and assumes moderate weight restrictions will be allowed in all truck route classes. Deficiencies are determined by comparing the data in the Road Log with the Minimum Tolerable Condition, established in the CRS.
The costs for improvements to ensure that minimum tolerable conditions exist were originally determined in the Road Jurisdiction Study (1988), reviewed and updated for the Cost Responsibility Study (1993), and adopted for use in the Needs Assessment Evaluation (1994). They represent standards of design and construction that existed at that time. These costs have been adjusted to 2012 dollars using WSDOT Planning and Programming Service Center, Economics Branch, implicit price deflators.
These cost estimates are conservative. The costs assume structural adequacy and adequate width. They do not include costs that are necessary for other safety improvements or upgrades to improve truck operational efficiencies, currently required environmental permitting, mitigation, project delays or other potential restrictions. The emphasis on environmental concerns has dramatically escalated since these cost factors were developed.
BridgesBridges on the state and county roadway systems have been constructed in order serve a vital role to make important connections between areas of the county and to provide a complete roadway system that accesses farms and cities throughout the region. These bridges must be maintained as well. Table 8 summarizes the number of bridges by county.
Bridge restrictions are a major impediment to truck traffic. Removing bridge restrictions can provide (1) alternate truck routes that save time and/or distance and (2) truck routes that can carry both legal and oversized/overweight permitted loads. Both result in more efficient truck travel.
Bridges are also evaluated by scenario. In Scenario 1, all bridge deficiencies will be removed (load postings, narrow widths, and vertical clearance problems). In Scenario 2, load limit and vertical clearance deficiencies will be removed. In Scenario 3, only load limit deficiencies will be removed. The current WSDOT bridge inventory system provides counties with an automated inspection form. Each county inspects its bridges on a regular basis and submits the data to WSDOT. Analysis and
43 | P a g e N o r t h e a s t W a s h i n g t o n R T P OR e g i o n a l T r a n s p o r t a ti o n P l a n : 2 0 1 4 - 2 0 1 8
management functions are performed by WSDOT. Structurally DeficientStructurally deficient means that a bridge requires repair or replacement of a certain component. This may include cracked or spalled concrete, the bridge deck, the support structure, or the entire bridge itself. If the condition is such that it no longer is able to carry its intended traffic loads it may be weight restricted. Being structurally deficient does not imply that the bridge is in danger of collapse or unsafe to the traveling public.
Functionally ObsoleteFunctional obsolescence is assessed by comparing the existing configuration of each bridge to current standards and demands. A bridge can be categorized functionally obsolete a number of ways like having substandard lane widths, or narrow shoulders. Another example would be a bridge that doesn’t have enough vertical clearance for large trucks to pass under, causing repeat hits and damage to the bridge.
Examination of Table__ shows that both Ferry and Pend Oreille County each has 21 and 23 bridges to maintain, with Stevens County having the most with 49. Overall, year-to-year comparisons show many that the number of county owned bridges and the number of deficient bridges remained fairly constant throughout the last 10 years.
Table 8: County-Owned Bridge Data by Year
Number of Bridges
Per CountyPosted or May Consider
PostingPosting Not Required
Deficient Bridges
Year Ferry FAR NFAR FAR NFAR2003 21 1 1 4 15 62005 21 1 1 4 15 62007 21 1 1 4 15 52008 21 0 1 5 15 52012 21 0 3 5 13 6Year Pend Oreille FAR NFAR FAR NFAR2003 21 1 0 9 11 62005 22 1 0 9 12 52007 22 2 0 8 12 62008 22 2 0 8 12 72012 26 2 1 9 14 7Year Stevens FAR NFAR FAR NFAR2003 51 2 1 5 43 92005 49 2 1 5 41 102007 49 1 1 6 41 102008 51 0 1 6 40 92012 49 0 1 7 41 6
Source: County Road Administration Board Annual Report 2008 & 2012 Bridges are 20 Feet or Greater in Length FAR = Federal Aid NFAR = Non-Federal Aid Deficient Bridges are listed as Structurally Deficient or Functionally Obsolete. Per WSDOT, structurally deficient means
that a bridge requires repair or replacement of a certain component, such as cracked or spalled concrete, or the entire bridge itself. Being structurally deficient does not imply that the bridge is in danger of collapse or unsafe to the traveling public.
44 | P a g e N o r t h e a s t W a s h i n g t o n R T P OR e g i o n a l T r a n s p o r t a ti o n P l a n : 2 0 1 4 - 2 0 1 8

Also it is important to note that a significant aspect in the maintaining of the roadway system is the number of structures less than 20 feet in length. The replacement of these structures does not have a designated funding source and can expend a significant portion of county maintenance funds. It is certain that both the cities and counties maintain many of these structures, however data is not as readily accessible.
Railroad CrossingsRailroad crossing deficiencies can impede truck traffic in several ways:
1. Steep approach grades to the crossing;2. Sight distance restrictions;3. Narrow and/or height restricted under crossings that constrict the free flow of traffic; 4. Lack of warning lights, gates, and other safety devices.
Washington Utilities and Transportation Commission (WUTC) and WSDOT cooperate to improve railroad crossings on a priority basis. CRAB does not have the ability to segregate the railroad crossings on the CFGS to develop an inventory, deficiency listing or a needs analysis.
Maintenance Needs EvaluationThe Road Jurisdiction Study (RJS) included an evaluation of annual maintenance needs. It identified a reasonable standard for road maintenance for a typical local agency and determined costs required to achieve that standard. The CRS used those standards and costs to determine annual maintenance needs for the FGTS. For the Needs Assessment Study, CRAB used the RJS and CRS standards and costs to develop a maintenance needs assessment routine applicable to county roads.
This evaluation was used (with costs updated to reflect 2011 costs) to determine the estimated annual maintenance needs on the County Freight and Goods system. It must be noted that these costs are 'not unreasonable' estimates of the total statewide annual maintenance needs for counties, based on the criteria established by the RJS and CRS.
Strategic Freight CorridorsRCW 47.06A.010 (6) defines Strategic Freight Corridors as: “… a transportation corridor of great economic importance within an integrated freight system that:(a) Serves international and domestic interstate and intrastate trade;(b) Enhances the state’s competitive position through regional and global gateways;(c) Carries freight tonnages of at least:(i) Four million gross tons annually on state highways, city streets, and county roads;(ii) Five million gross tons annually on railroads; or(iii) Two and one-half million net tons on waterways; and(d) Has been designated a strategic corridor by the board under RCW 47.06A.020 (3). However, new alignments to, realignments of, and new links to strategic corridors that enhance freight movement may qualify, even though no tonnage data exists for facilities to be built in the future.”
Two hundred and sixteen (216) miles of county roads, in 15 counties, have been classified as Strategic Freight Corridors. These are the routes that are classified Truck Route Class T-1 or T-2.
Strategic Freight Corridors are eligible for FMSIB funding. However, the FMSIB funding rating method is based on reduction of congestion, measured by delay. A review of the “Freight Mobility Strategic Investment Board – 2012 Activities and Recommendations Report” indicates that their current priorities are improvements at railroad crossings, which reduce congestion and delay of both trucks and trains.
45 | P a g e N o r t h e a s t W a s h i n g t o n R T P OR e g i o n a l T r a n s p o r t a ti o n P l a n : 2 0 1 4 - 2 0 1 8
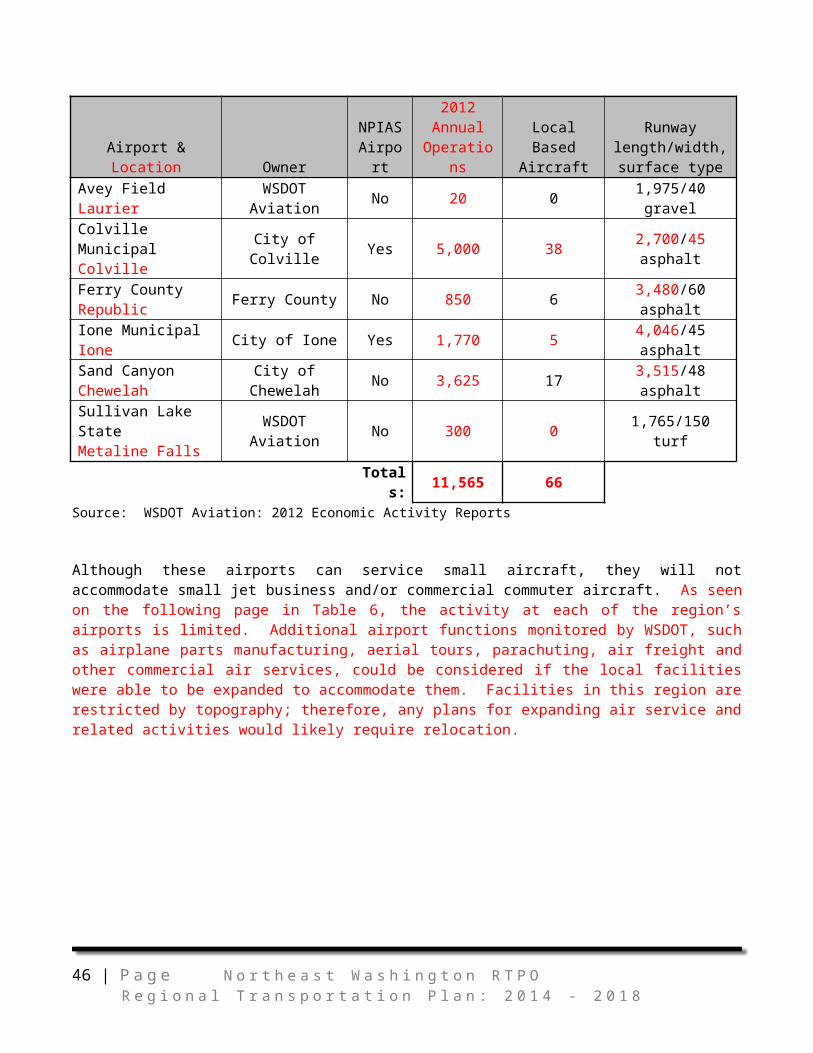
Figure 12: Freight & Goods System Roadway Network in NEW
Source: www.wsdot.wa.gov
US Hwy 395 is a high priority corridor under the National Highway System (NHS), which serves as a major north-south facility for freight movement throughout eastern Washington and south through Oregon and California. US Hwy 395 is also designated as a Highway of Statewide Significance by WSDOT. The primary purpose of the US Hwy 395 corridor is to facilitate transportation of people and goods in the western United States between the Mexican border on the south and the Canadian border on the north. Other Highways of Statewide Significance within the region include: SR 2 and SR 20. These highways provide corridors for inter-regional transportation of products passing through the state from destinations as varied as Asia, Mexico, Canada, and the Eastern Seaboard.
For more information: http://www.wsdot.wa.gov/Freight/FGTS/default.htm.
46 | P a g e N o r t h e a s t W a s h i n g t o n R T P OR e g i o n a l T r a n s p o r t a ti o n P l a n : 2 0 1 4 - 2 0 1 8
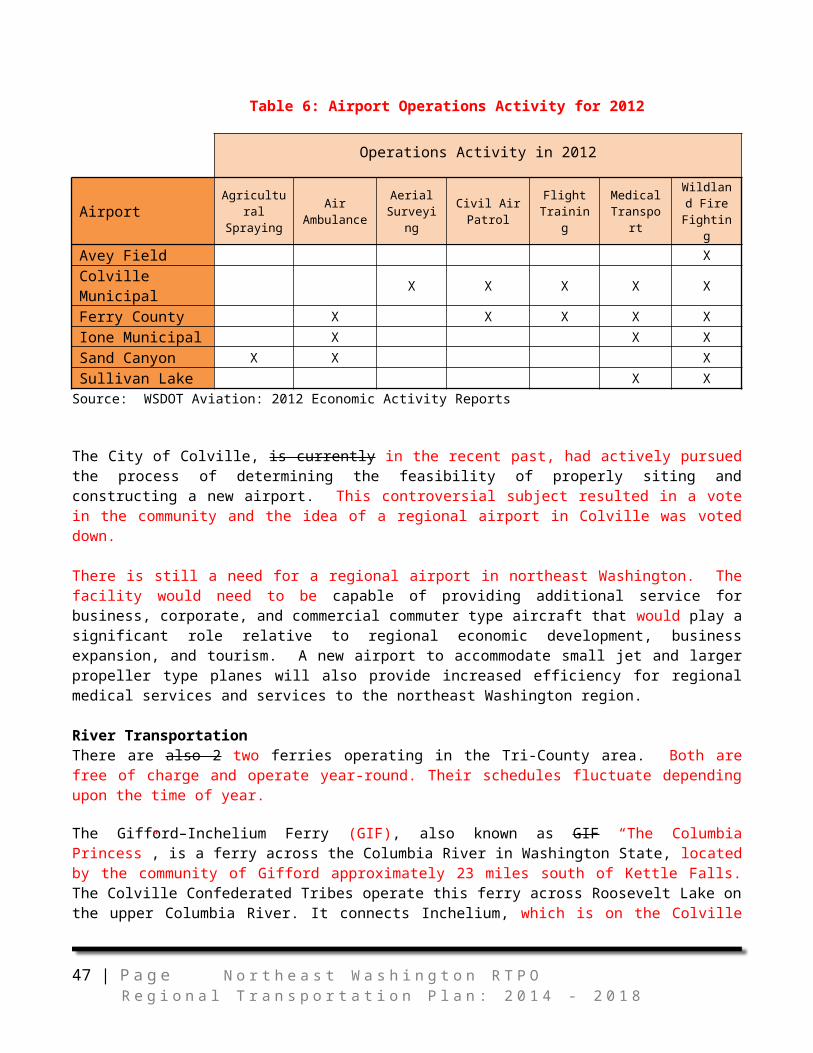
Issues of Regional SignificanceAll Weather Surfaces for State Roads
There is a need for the development of a core statewide system of county all weather roads in Washington. One definition of an all weather road is a road that is used to haul freight, crop or product that does not require emergency weight restrictions.
Sections of SR 31, SR 20, and SR 21 in northeast Washington, are not capable of carrying truck traffic during all seasons of the year. Placing weight restrictions on these roads during freeze/thaw cycles to prevent road wear results in economic hardships on regional employers, and hence the economy of the region.
Seasonal road closures affect a diverse group of people - growers, harvesters, shippers, distributors, and ultimately, consumers. The establishment and funding of a statewide all weather county road system was identified as an unfunded category of need in the 2007-2026 Washington Transportation Plan (WTP). That need was reinforced in the Draft WTP Freight Movement Update, released in August 2008, which identified the issue as one of twelve statewide priorities.
Regional Transportation Planning Organizations (RTPOs) sponsored the Statewide All Weather Roads Roundtable as a forum to broaden understanding of the topic. The purpose of the roundtable was to start a discussion to highlight and resolve issues associated with the maintenance and improvement of a statewide core all weather county road network.
Additional concerns expressed from agencies and the public indicated issues with pedestrian access during the winter and in early spring. The lack of safety for non-motorized travelers in the winter indicates that the various jurisdictions may not have the ability to properly accommodate them. The early spring concerns occur when the snow and ice melts and it leaves behind excessive amounts of sand and gravel from winter maintenance. This creates a safety hazard for pedestrians and bicyclists.
The sand and gravel that is left behind after snow melt also affects vehicle traffic. Input received from agencies and the public indicate that the sand and gravel can damage pavement markings, which requires they be replaced regularly; and it causes damage to vehicles when the debris is thrown into windshields and other parts of the vehicles.
Specific measures to resolve this problem have been discussed with WSDOT and potential solutions have been identified. However, justification of funding for these projects in a competitive process is difficult. There is high regional emphasis for an expedited solution to this problem.
Local ProjectsHigh priority local projects are generally seeking additional funding sources. A number of projects in the region have been identified through the local planning process and TIP development process. Through the public participation process, many of these needs were validated by citizens and local agencies. Other needs were identified, such as non-motorized facilities, to enable safe and efficient transportation modes of all types. These are high priority projects and include:
● Replacement of the Usk Bridge; to include expansion with pedestrian walkways ● Construction of the Inchelium-Gifford Bridge
47 | P a g e N o r t h e a s t W a s h i n g t o n R T P OR e g i o n a l T r a n s p o r t a ti o n P l a n : 2 0 1 4 - 2 0 1 8

● Completion of the eastern section of Flowery Trail Roadway● US Hwy 395 widen to 4 lanes, or increased passing lanes, from Spokane to Kettle Falls ● Scenic Byway improvements within all three counties ● Comprehensive community revitalization efforts in Newport, Ione, Usk, Cusick, Metaline,
Metaline Falls, Springdale, Chewelah, Colville, Kettle Falls, Marcus, Northport and Republic ● Kettle Falls to Colville Non-Motorized Trail (aka “Alternative Transportation Path”)● Local sidewalk projects and pedestrian/bicycle facilities within all three counties● Public transportation enhancements and expansions; include mobility management and
connectivity● Freight Mobility Issues; including sufficient facilities to accommodate overnight truck traffic● Regional Airport: Need sponsorship within Tri-County Region● Ferry County Rail Abandonment Issues● Permitting access for Off-Road Vehicles (ORVs) in all three counties● Provide or upgrade road culverts at streams and rivers for safe fish passage● Increased focus on providing and improving pedestrian and bicycle facilities along state
highways and arterials
There have been numerous projects of regional significance that have been authorized for funding through the STIP over the next biennium, such as:
US Hwy 395 sidewalk improvements, in Chewelah Hawthorne Avenue, partial reconstruction project, in Colville Boulder Creek roadway partial reconstruction project, in Ferry County Meyers Street resurfacing project, in Kettle Falls US Highway 2 roadway illumination systems, in Pend Oreille County Multiple chip seal projects on roads throughout NE Washington from WSDOT
However, there are many other projects that continue to need attention that have impacts to transportation on a regional basis. An example of these projects are:
Boulder Creek roadway, continuing reconstruction project, in Ferry County Main Street, from SR 31 to the city park at the Pend Oreille River, in Ione Houghton Street, stabilize base and add sidewalks, in Ione Hawthorne Avenue, continuing reconstruction project, in Colville 7th Avenue, prelevel, mat, and overlay project, in Colville US Highway 395 & Sand Canyon Rd round about construction, in Chewelah Main Street upgraded to all-weather road all the way to ski resort, in Chewelah SR 25 Walking Pedestrian Path construction, in Marcus Addy-Gifford Road resurfacing, in Stevens County Aladdin Road continuing rehabilitation project, in Stevens County
The NEW RTPO strives to collaborate on regional needs to evaluate, rank, and provide assistance for funding such projects through state and federal grant opportunities. Recently completed projects are shown in Appendix D, to demonstrate the various needs that have been met through this collaboration.
48 | P a g e N o r t h e a s t W a s h i n g t o n R T P OR e g i o n a l T r a n s p o r t a ti o n P l a n : 2 0 1 4 - 2 0 1 8

Relationship to other Planning Efforts
Environmental Assessments for Development (EIS Required) One aspect of a project proposal is to determine the potential impact it may have on the environment. This usually generates an assumption that the “environment” means protection and conservation of the natural environment; however, these assessments actually involve much more than that.
Since the adoption of the Growth Management Act in 1990, the scope of projects must also consider how it will impact existing and potential traffic access, volume, and circulation. If additional transportation facilities are required as a result of the project, then other considerations come into play, such as storm water management. This process involves not only how to direct and/or retain storm water, but how to filter the runoff that becomes contaminated with pollutants from motor vehicle use.
Each of the following categories typically require an environmental assessment to some degree or another, depending on the scope of the project. The descriptions relate specifically to transportation issues for the purpose of this document.
Industrial A review of available environmental impact assessments and statements for major industrial development in the region between 1970 and 1990 shows that transportation issues were typically addressed in a generic manner assuming that the impacts of development would not significantly affect existing transportation facilities. In all cases, little or no comment on these statements is evident. Emphasis on transportation issues in rural areas has only recently become a criteria for extensive evaluation in such developments.
Commercial Because of the rural nature of the region (having no city over population 5,000) commercial development has typically occurred on a small scale and only occasionally has a project been developed that required transportation site analysis. Typically, these projects are located along State routes and within incorporated cities. Normal State Environmental Policy Act (SEPA) review, in these cases by local agencies, has included site analysis by the Washington State Department of Transportation resulting in recommendations and or conditions to minimize the impacts of the project on transportation. During the past several years few projects have been proposed and/or constructed that included such analysis. Since 1990 these types of development appear to be increasing such as seen in the Wal-Mart, Arby’s Colville Commercial Center, and Hearth & Home Technologies developments west of Colville and adjacent to US Hwy 395.
Recreational The northeast region is rich in natural recreation opportunities. It is well known for a wide variety of outdoor activities and economic growth in the area has used this resource as one of its foundations. Planning efforts for recreation development have been done by the National Park Service for the Lake Roosevelt area, the U.S. Forest Service for the Colville National Forest and by Tri-County Economic Development District (TEDD) for the region. The NEW RTPO has facilitated some recreation projects in recent years, such as the Ferry County Rail Trail, Phase I; the U.S. Highway 395 sidewalk restoration project to aid pedestrian access during Chataqua and other festivities in their city park; and improvements for pedestrian access to the city park in Marcus, which borders SR 25.
49 | P a g e N o r t h e a s t W a s h i n g t o n R T P OR e g i o n a l T r a n s p o r t a ti o n P l a n : 2 0 1 4 - 2 0 1 8

Other recreation planning has been done by the respective counties and cities in the region by including a park and recreation element in their respective comprehensive plans. The use or creation of recreational facilities tends to have considerable transportation issues; they tend to attract large groups of people for events. This requires planning for traffic circulation and sufficient parking, as well as safety for pedestrian traffic that is generated. Discussion of transportation issues in these documents is limited focused on recreation and tourism.
The Washington State Department of Transportation has recognized the scenic value of the region in designating portions of SR 20, SR 21, SR 31, and SR 25 as part of the Scenic Highways system. Further, a portion of SR 20 between Kettle Falls and Republic has been identified as the Sherman Pass Scenic Byway under the National Scenic Byways Program. Pend Oreille, Stevens and Ferry County, City and Tribal representatives also recognize the designated recreational tourism routes as identified by WSDOT. These routes are seen important factors to their economic development.
Additionally, The Pacific Northwest National Scenic Trail has designated a national cycling route that will pass through the three counties. Though the trail would bring cyclists from near and far into the region, there is much concern for safety along this route. Much of the designated route has a very narrow shoulder and does not allow for any refuge for cyclists. Many portions of the route are shared by logging trucks and other fast moving freight traffic; this poses a great concern regarding safety for cyclists and passing motorists. Many representatives feel that priority should be given to making these routes safer for other modes of transportation.
HousingCommercial development of housing in the region has had and will continue to have impacts on the regional transportation system. Review of the impact is handled by the applicable city or county planning agency with technical review by WSDOT, Eastern Region, when projects are anticipated to affect state routes.
Cultural Resource and Historic sitesThe Washington State Department of Transportation has identified fourteen historical and cultural resource sites within the region. Because of their ability to attract visitors, the transportation facilities serving them should be evaluated recognizing existing and future service needs. Additionally, there are other sites that are being identified and/or developed that should be included as well.
Food HubThe provision of access to healthy food has become integrated into planning systems around the globe. It has been discovered that the lack of farm-fresh food to certain segments of the population not only impacts good health, but impacts the ability for individuals or communities to be economically viable. “… food access is not simply a health issue but also a community development and equity issue. For this reason, access to healthy, affordable, and culturally appropriate food is a key component not only in a healthy, sustainable local food system, but also in a healthy, sustainable community” (APA Planning for Food Access, 2012).
This type of effort requires the collaboration of many individuals and groups, such as farmers, shipping companies, a facility for food storage and distribution, and manpower to manage all of it. In our region, a project known as the “Food Hub” has begun. The location in the city of Colville, referred to as “the old county shop and Avista property” is being investigated for such a facility. It is sited at the northern round about along the intersection of U.S. Highway 395 and the truck route, so it is accessible for the
50 | P a g e N o r t h e a s t W a s h i n g t o n R T P OR e g i o n a l T r a n s p o r t a ti o n P l a n : 2 0 1 4 - 2 0 1 8
shipment of incoming/outgoing goods. It is also accessible to residents of the region by public transportation, automobile, or non-motorized means.
Relationship to Existing Comprehensive PlansEstablished Goals and Objectives
Review of available planning documents revealed that all three counties and a number of the incorporated cities of the region have addressed transportation issues. Specific goals, policies and objectives stress the importance of transportation safety, efficiency, convenience, and maximum circulation.
Cities, Towns and CountiesAs cities, towns and counties update their Comprehensive Land Use Plans, the RTPO will review and certify that the transportation element of the plan reflects, and are consistent with, the regional transportation plan. The legislation requires that each RTPO certify that the transportation element of all comprehensive plans for cities and counties planning under the Growth Management Act meet the following requirements. The plans must:
• Reflect the transportation guidelines and principles established in the regional transportation plan.• Be consistent with the adopted regional transportation plan.• Conform with the requirements of RCW 36.70A.070.• Reflect consistency between the countywide and multi-county planning policies adopted under RCW 36.70A.210 and the adopted regional transportation plan.
State of WashingtonThe Washington State Department of Transportation and the Department of Natural Resources both have extensive program responsibilities in the area. These agencies have established on-going statewide goals and objectives applicable to the region.
WSDOT Policy Goals:In 2010, six statewide transportation policy goals were reaffirmed in statute to guide the planning for, operation and performance of, and investment in the state’s transportation system.
● Preservation: To maintain, preserve and extend the life and utility of prior investments in transportation systems and services.
● Safety: To provide for and improve the safety and security of transportation customers and the transportation system.
● Mobility (addressing congestion): To improve the predictable movement of goods and people throughout Washington state.
● Environment: To enhance Washington's quality of life through transportation investments that promote energy conservation, enhance healthy communities and protect the environment.
● Stewardship: To continuously improve the quality, effectiveness and efficiency of the transportation system.
● Economic Vitality: To promote and develop transportation systems that stimulate, support, and enhance the movement of people and goods to ensure a prosperous economy.
51 | P a g e N o r t h e a s t W a s h i n g t o n R T P OR e g i o n a l T r a n s p o r t a ti o n P l a n : 2 0 1 4 - 2 0 1 8
52 | P a g e N o r t h e a s t W a s h i n g t o n R T P OR e g i o n a l T r a n s p o r t a ti o n P l a n : 2 0 1 4 - 2 0 1 8

Department of Natural Resources Guiding Principles Manage The State’s Resources Sustainably.
o Through our sustainable management of resources entrusted to our care, future generations will have ample opportunities to enjoy and benefit from Washington’s rich natural heritage. We will also ensure that revenues for our trusts will be stable or growing and that associated industries will thrive for generations to come.
Make Decisions Based On Sound Science.o Using sound science, data, and information to guide our decisions will result in the best
possible outcomes for the State of Washington. Make Decisions In The Public Interest And With The Public’s Knowledge.
o Transparency and accountability are vital to earn the public’s trust and appropriately manage shared resources. Decisions should be made for the benefit of current and future generations.
Indian Tribes The Bureau of Indian Affairs (BIA) has an ongoing transportation planning process that addresses the jurisdictional responsibilities and improvement efforts to be accomplished on highways and roads to, from and within the Kalispel, Spokane and the Confederated Tribes of the Colville Reservations. Transportation plans have been developed for each of the three reservations within the region and are an integral part of the development of county road improvements on the reservations. The relationship between this plan and the improvement plans of the BIA will be coordinated to fully compliment the needs and goals of the tribes, as well as, the region. Further, each tribal government has developed or is in the process of developing comprehensive plans for their jurisdictions and has addressed transportation issues in them.
Kalispel TribeThe Kalispel Tribe has identified transportation needs on the reservation. Within the reservation there are many pedestrians that cross the Usk bridge by foot. This bridge is very narrow and does not provide a safe passage designated for pedestrians. Safety is of high importance to the tribe. Increased roadway designations for cyclists and pedestrians, along with wayfinding signage across the reservation land, is a need for the community.
Though Le Clerc Road passes through the reservation, the road is maintained by Pend Oreille County. The winter maintenance of laying loose gravel over the icy roadway has a negative impact on the upkeep of the road. The Tribe has expressed that the gravel is doing more harm than good to the road. In addition, it has been expressed by KALTRAN, the transit system within Pend Oreille County, that the gravel annually contributes to cracked windshields on their buses which need immediate replacement.
Bringing tourism to the reservation land is also of significant value. The reservation is divided by the Pend Oreille River, which attracts many tourists annually to Cusick and Usk. Most of the access points to the river on the reservation land are only accessible to people living on the reservation. Those areas that are not on the reservation may be suitable for camping and boating activities; access to these alternative sites should be considered.
Spokane TribeMany of the roadways within the Spokane Reservation lands are maintained by the county and the state. These circumstances require much cooperative planning, programming, and funding between the tribe and government agencies.
53 | P a g e N o r t h e a s t W a s h i n g t o n R T P OR e g i o n a l T r a n s p o r t a ti o n P l a n : 2 0 1 4 - 2 0 1 8

Colville TribeThe Colville Tribe is divided between Ferry County to the east (where Nespelem and Inchelium are located) and Okanogan County to the west (where Omak is located). Much of the population resides in the western half of the reservation. The Colville Transit system primarily runs between three (3) Health Clinics located in Inchelium, Nespelem, and Omak. Many tribal members have requested that the frequency for these trips increase. The transit service runs a direct route to and from the Health Clinics that doesn't deviate to accommodate travelers. Many transit users must meet the transit service provider on the route that it travels. In doing so, commuters must get a ride to the pick up location or leave their personal vehicle at the bus stop.
The tribe has identified that there is a need for better signage within the reservation; the existing signage is very limited signage which creates safety concerns for vehicles, pedestrians, and cyclists on the road.
Federal AgenciesThe U.S. Forest Service, the National Park Service, and the Bureau of Indian Affairs all have program responsibilities in the region with broader goals and objectives applied to the area.
Growth Management
Concurrency RequirementConcurrency is one of 14 goals identified in the Growth Management Act (GMA - RCW36.70A) and refers to the timely provision of public facilities and services relative to the demand for them. Concurrency is a land use policy used by local governments to coordinate transportation and land use. Washington law also provides a number of ways for the state to address land use impacts on its transportation system. To maintain concurrency means that adequate public facilities are in place to serve new development as it occurs or within a specified time period. The Growth Management Act (GMA) gives special attention to concurrency for transportation.
Concurrency is not a guarantee of system performance, rather, concurrency is achieved when adequate public facilities are in place and functioning at the adopted level-of-service (LOS) at the time development occurs. The GMA requires that transportation improvements or strategies to accommodate development impacts need to be made concurrently with land development. RCW 36.70A.070(6)(b).“Concurrent with the development” is defined by the GMA to mean that any needed "improvements or strategies are in place at the time of development, or that a financial commitment is in place to complete the improvements or strategies within six years." RCW 36.70A.070(6)(b). Local governments have flexibility regarding how to apply concurrency within their plans, regulations, and permit systems.
As part of the requirement to develop a comprehensive plan, jurisdictions are required to establish level-of-service standards (LOS) for arterials, transit service, and other facilities (RCW 36.70A.070(6)(a)). Under the GMA, the adopted LOS serves as the local jurisdiction’s standard to measure the impacts new development would have on the local transportation system. If the impacts of a development request would result in LOS dropping below the standard, the local jurisdiction must change the standard or deny the development application unless the appropriate transportation improvements are made concurrently (within six years) with the development.
54 | P a g e N o r t h e a s t W a s h i n g t o n R T P OR e g i o n a l T r a n s p o r t a ti o n P l a n : 2 0 1 4 - 2 0 1 8

Once a jurisdiction sets an LOS, it is used to determine whether the impacts of a proposed development can be met through existing capacity and/or to decide what level of additional facilities will be required. Transportation is the only area of concurrency that specifies denial of development if LOS standards cannot be met. However, local jurisdictions must have a program to correct existing deficiencies and bring existing transportation facilities and services up to locally adopted standards. A developer may not be required to pay for improvements to correct existing deficiencies.
In Washington, the responsibility for land use planning and regulation resides with local governments. While local land use choices directly affect the capacity and safety of the state transportation system, the role of the Washington State Department of Transportation (WSDOT) in local land use is largely advisory. WSDOT encourages local governments to preserve the public’s investment in the state transportation system and delay the need for costly improvements by adopting transportation-efficient land use policies, mitigating development impacts on the state system, and practicing appropriate access control. Most cities and counties plan under the Growth Management Act (GMA), adopted by the Washington State Legislature in 1990. The GMA is a state policy framework for local comprehensive planning and land use regulation. The GMA identifies 14 statewide planning goals and prescribes a process and certain minimum requirements for the adoption and update of land use plans and development regulations by local governments.
The GMA emphasizes local discretion over state control. Local land use plans and regulations do not require state approval, with the exception of Shoreline Master Programs. The GMA does require local governments to submit proposed land use plans and regulations to state agencies for review. During review, WSDOT can encourage good local land use decisions by providing technical assistance, written comment, or oral testimony to cities and counties. Local governments are not required to take action based on agency comments. However, state agencies or other parties with standing can appeal a locally adopted plan or regulation to the Growth Management Hearings Board.
Sources:1. RCW 36.70A.020(12)2. The Building Association of Clark County et al. v. Clark County and the State of Washington, Office of Financial Management. 04-2-0038c, WWGMHB (November 23, 2005).3. McVittie, et al. v. Snohomish County, 99-3-0016c, CPSGMHB (February 9, 2000).4. Taxpayers for Responsible Govt. v. City of Oak Harbor, 96-2-0002, WWGMHB (July 16, 1996).5. McVittie, et al. v. Snohomish County, 99-3-0016c, CPSGMHB (February 9, 2000).
Linkages to Growth Management and Other Future Planning Goals
Critical Areas and Resource LandsUnder the conditions of the 1990 Growth Management Act, all three counties in the region have identified the critical areas and resource lands located within their jurisdictions. Those areas will be considered in the development of transportation projects in the region by each jurisdiction.
Countywide Planning PoliciesPlanning under Growth Management, Ferry, Stevens and Pend Oreille Counties have undertaken the development of planning policies to act as guideline during the development of their Comprehensive Plans. Those policies will reflect consideration of local and regional transportation issues.
In 1991, the GMA was amended to require that counties adopt county-wide planning policies, whereby, they would work in cooperation with their municipalities in order to support coordinated regulations relating to development, particularly in Urban Growth Areas (UGAs).
55 | P a g e N o r t h e a s t W a s h i n g t o n R T P OR e g i o n a l T r a n s p o r t a ti o n P l a n : 2 0 1 4 - 2 0 1 8

At a minimum, County-Wide Planning Policies are to address the following: Implement RCW 36.70A.110 (Urban Growth Areas), Promote the contiguous and orderly development and provision of urban services to such
development, Provide for public capital facilities of a county-wide or state nature, Provide for county-wide transportation facilities, Consider the need for affordable housing, Provide for joint county and city planning within urban growth areas, Provide for economic development and employment, and Analyze fiscal impact.
As a result of this requirement, the incorporated cities within the tri-county region have entered into Memorandums of Understanding with their respective counties to maintain communication regarding project proposals in the UGAs.
Comprehensive PlansWith the development of each county's Comprehensive Plan under GMA, a separate transportation element will address the transportation concerns and needs of each city, town, and county. Those elements will be integrated into this regional transportation plan upon their adoption.
Water QualityThe State of Washington's Water Resources Act of 1971, states that "perennial rivers and streams be retained with base flows necessary to provide for preservation of wildlife, fish, aesthetic and other environmental values, and other navigational values" (RCW 90.54). Also, lakes and ponds are to be retained substantially in their natural condition.
The State of Washington has an anti-degradation policy which states: "Existing beneficial uses shall be maintained and protected and no further degradation which would interfere with or become injurious to existing beneficial uses will be allowed” (WAC 173-201-035 [8][a]). State policy also provides for reduction in the quantity of high quality waters when "it is clear that overriding considerations of the public interest will be served" (WAC 173-201-035 [8] [c]).
The Washington Forest Practices Rules and Regulations (1/88), written to comply with State water quality laws, regulate timber management activities, including road construction, on non-federal lands -- except the Colville Indian Reservation -- throughout the region.
The State of Washington, the Bureau of Land Management, the Province of British Columbia, the Colville Confederated Tribes, the Spokane Tribe of Indians, the Kalispel Tribe of Indians, the U.S. Government, and the State of Idaho all own land in or adjacent to the northeast region. Their plans, policies and controls vary from agency to agency, but all address water quality issues as they are affected by road construction.
Non-point source pollution refers to general pollution that cannot be traced or pinpointed to a specific source. Highways and motorized traffic are known contributors as highway runoff carries pollutants to waterways through both infiltration and uncontrolled drainage ways. The State of Washington reviews monitoring information, addresses revisions or additions, identifies problems, proposes treatment, and writes and submits reports to the Environmental Protection Agency. Water Quality Standards for waters of the State of Washington (Washington Administrative Code Chapter 173-201 WAC) are intended to be met through the application of Best Management Practices.
56 | P a g e N o r t h e a s t W a s h i n g t o n R T P OR e g i o n a l T r a n s p o r t a ti o n P l a n : 2 0 1 4 - 2 0 1 8

The State also manages impacts on water quality through the development and implementation of the Shorelines Master Program, which requires counties to develop guidelines and regulations to protect the quality of the State's waterways.
The U.S. Army, Corps of Engineers, under the provisions of Section 404 of the Clean Water Act, monitors and regulates the placement of fill materials in "Waters of the United States". Their jurisdiction extends to streams with flows greater than 5 cubic feet per second and to adjacent and contiguous wetlands greater than 5 acres in size. Water quality is one of the specific issues addressed in the Corps' permitting process.
Air QualityThe region has not been identified as having any non-attainment areas as defined by national standards for air quality.
A factor affecting air quality, especially in rural areas, is dust produced by traffic on unimproved roads. To date, only two regionally significant roads, Flowery Trail and Meadow Creek/Smackout Pass (Chewelah) are unpaved. Air quality concerns have been raised because of dust on these roads.
Noise AbatementNoise abatement measures are typically required only when high volume facilities are constructed near residential areas. No facilities within the region have been identified that would require such action.
Economic Development Plans and StrategiesTri-County Economic Development District (TEDD) prepares an annual Comprehensive Economic Development Strategy (CEDS) for the region, addressing a broad range of issues that affect economic development. This document reviews previous actions, addresses known conditions, identifies potential solutions and establishes goals for future implementation.
As a direct result of long-term regional economic instability and the need to diversify the region's economic base, The District has an ongoing priority of encouraging the formation, retention, recruitment and expansion of existing business/industry. The CEDS identified adverse economic conditions that are causes of the underdeveloped nature of the region's economy. These conditions have been addressed in six goals established in the CEDS. Among these goals are specific transportation improvements that are considered essential to the economic well-being of the region and its communities.
Other organizations within the region are actively engaged in developing and promoting economic growth in their respective areas. These groups include local business organizations, such as Pend Oreille Economic Development Council, Colville Economic Development Committee, Chewelah Economic Development Committee, Republic Public Development Authority, respective Chambers of Commerce established in the regions, cities, towns, and tribal business development organizations.
Appendix A outlines the level of Transportation and Warehouse Industries (Logistics) in the NE Washington Tri-County region. As of 2014, the statistics show a slight increase in the number of workers at .4% in this industry for NE Washington, and a 1.3% increase for the state, compared to 2013 numbers; as well as an overall increase in the average annual wage of $50,956 in 2014, compared to $46212 in 2013. In 2014, the state showed an average of $67,489 for similar jobs. Part of the economic development strategy could benefit our region by promoting the logistics industry. A critical factor would be an adequate and efficient transportation infrastructure.Level of Service StandardsThe Level of Service Standards (LOS) establish a gauge for evaluating the performance of existing
57 | P a g e N o r t h e a s t W a s h i n g t o n R T P OR e g i o n a l T r a n s p o r t a ti o n P l a n : 2 0 1 4 - 2 0 1 8
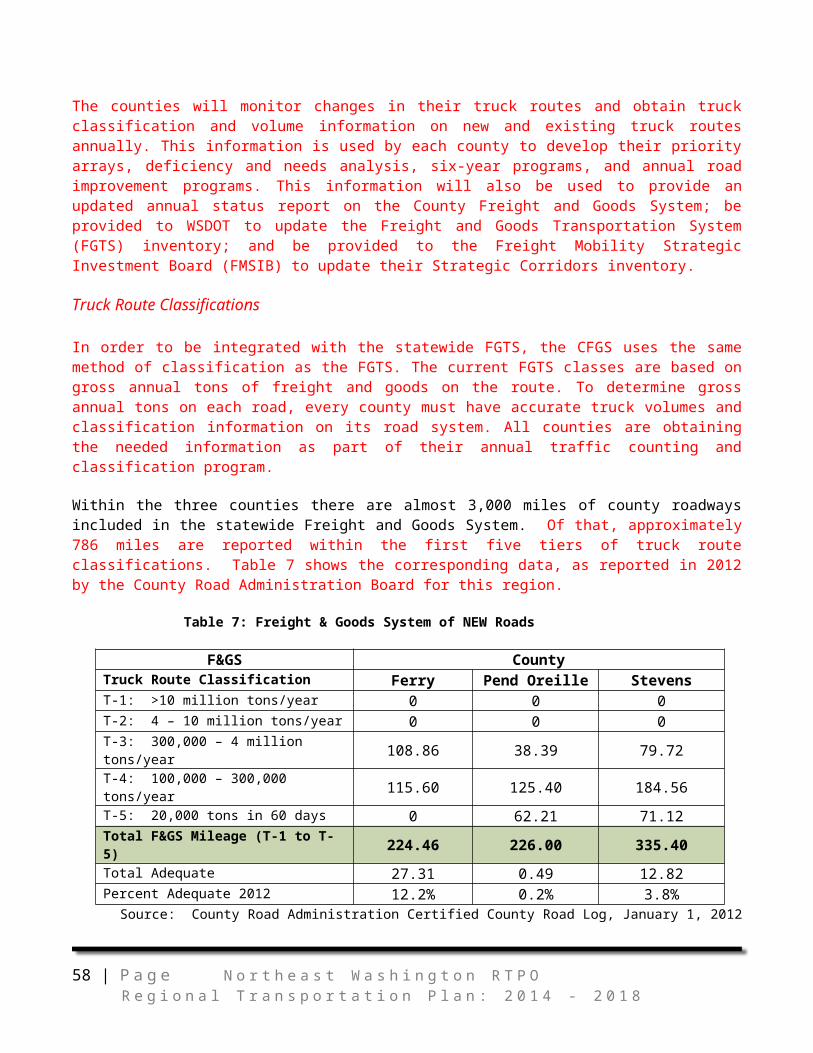
systems and planning for future systems to meet future needs. Essentially, level of service is defined as a qualitative measure describing operational conditions within the traffic stream or on the transit system, and the perception by motorists and/or passengers. A “level of service” generally describes these conditions in terms of such factors as speed and travel times, freedom to maneuver, traffic interruptions, comfort and convenience, and safety.
The NEW RTPO considered the different level of service categories and adopted the standards as shown below. Because of Due to the lack of local highway development funds, a higher LOS could not be considered. Also, a higher LOS could hamper economic development in the region.
Therefore, the following LOS has been established for the three-county area:1. LOS C for rural areas; 2. LOS D for urban areas is established for all State Highways; and3. LOS D is established for all other designated regionally significant transportation systems.
Level of Service ADescribes completely free-flow conditions. The operation of vehicles is virtually unaffected by the presence of other vehicles, and operations are constrained only by the geometric features of the highway.
Level of Service B Also indicates free flow, although the presence of other vehicles becomes noticeable. Average travel speeds are the same as in LOS A, but drivers have slightly less freedom to maneuver.
Level of Service CThe influence of traffic density of operations becomes marked. The ability to maneuver within the traffic stream is clearly affected by other vehicles.
Level of Service DThe ability to maneuver is severely restricted due to traffic congestion. Travel speed is reduced by the increasing volume. Only minor disruptions can be absorbed without extensive queues forming and the service deteriorating.
Level of Service E Represents operations at or near capacity, at an unstable level. The densities vary, depending on the FFS. Vehicles are operating with the minimum spacing for maintaining uniform flow. Disruptions cannot be dissipated readily, often causing queues to form and service to deteriorate to LOS F.
Level of Service F Represents forced or breakdown flow. It occurs either when vehicles arrive at a rate greater than the rate at which they are discharged or when the forecast demand exceeds the computed capacity of a planned facility.
Cities and Counties throughout the region also use national standards published by the American Association of State Highway and Transportation Officials as well as the Local Agency Guidelines established by the Washington State Department of Transportation. These standards cover a wide variety of construction and operational standards.
58 | P a g e N o r t h e a s t W a s h i n g t o n R T P OR e g i o n a l T r a n s p o r t a ti o n P l a n : 2 0 1 4 - 2 0 1 8
Performance MonitoringPerformance monitoring should focus on the accuracy of the regional data and priorities compared to jurisdictional application and the ability of the participants to access alternative funding sources to complete regional priority projects. It is projected that those actions incorporated into the ongoing regional planning process will accurately monitor the implementation of the Regional Transportation Plan and lead to the overall success in addressing the significant transportation needs of the region.
The graphs on the following pages were obtained from the County Road Administration Board’s Dashboard website, using 2012 reporting data. They demonstrate how the agencies in our region are making every effort to maintain a high level of performance in their transportation systems.
Overview of Ownership, Surface Type, and Traffic Volume
As demonstrated in the following data, the rural nature of the three counties in northeast Washington is very evident. All three counties show a majority of their roadways as being unpaved, including Stevens County with the highest population and traffic activity. In contrast to this, the majority of traffic volume is carried on their respective arterial roadways. This would indicate a need to maintain and preserve a smaller percentage of the roadway network and still provide the highest degree of benefit for the region as a whole.
Ferry County In 2012, Ferry County roads included:
o Paved and unpaved arterials are 31% of all roads (24% paved, 7% unpaved) o Paved and unpaved local roads are 68% of all roads (3% paved, 65% unpaved)
In 2012, 72% of all Ferry County roads were unpaved Paved local roads make up 19% of the network Paved arterials carry 69% of all traffic in Ferry County
Figure 13: Ferry County Owned Roadways & ADTs
Ferry County Owned Network: Total 737 Miles Ferry County Average Daily Traffic Counts
59 | P a g e N o r t h e a s t W a s h i n g t o n R T P OR e g i o n a l T r a n s p o r t a ti o n P l a n : 2 0 1 4 - 2 0 1 8

60 | P a g e N o r t h e a s t W a s h i n g t o n R T P OR e g i o n a l T r a n s p o r t a ti o n P l a n : 2 0 1 4 - 2 0 1 8
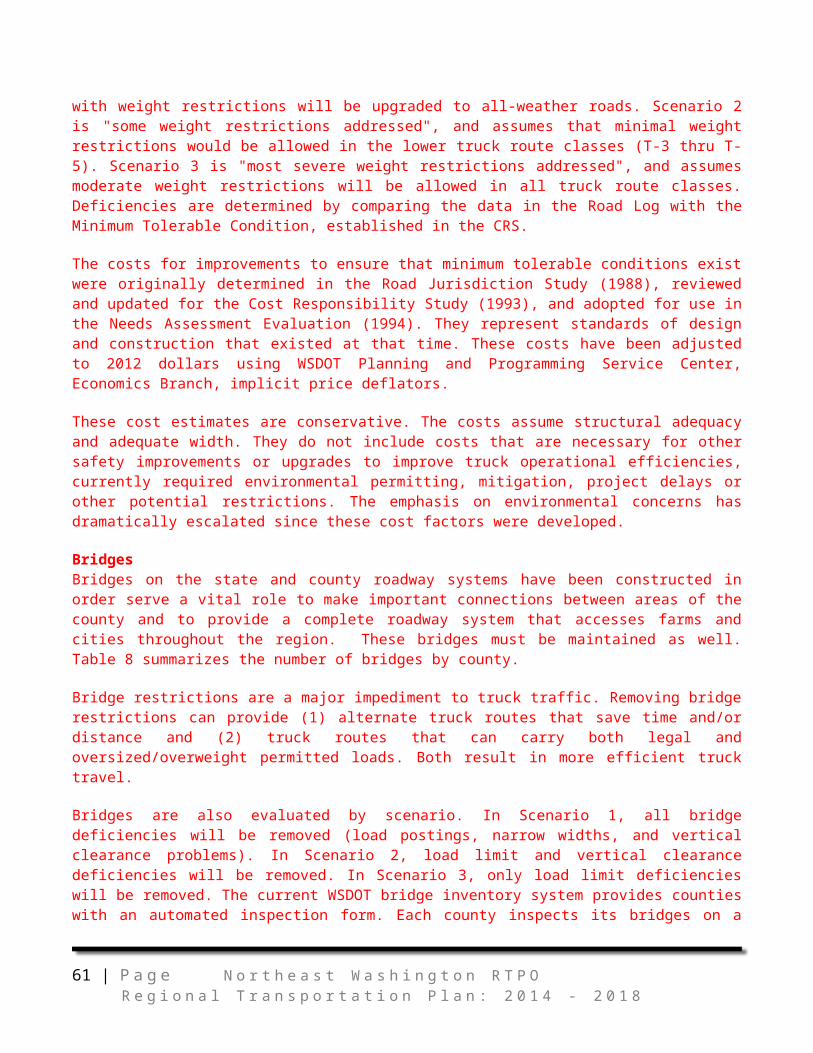
Pend Oreille County In 2012, Pend Oreille County roads included:
o Paved and unpaved arterial roads are 32% of roads (30% paved, 2% unpaved) o Paved and unpaved local roads are 68% of roads (24% paved, 44% unpaved).
In 2012, 46% of all Pend Oreille County roads were unpaved Paved local roads are 24% of the network Paved arterials carry 61% of all traffic in Pend Oreille County
Figure 14: Pend Oreille County Owned Roadways & ADTs
Pend Oreille County Owned Network: Total 560 Miles Pend Oreille County Average Daily Traffic Counts
Stevens County In 2012, Stevens County roads included:
o Paved and unpaved arterial roads are 37% of roads (31% paved, 6% unpaved) o Paved and unpaved local roads are 62% of roads (13% paved, 49% unpaved).
In 2012, 55% of all Stevens County roads were unpaved Paved local roads are 24% of the network Paved arterials carry 60% of all traffic in Stevens County
Figure 13: Stevens County Owned Roadways & ADTs
61 | P a g e N o r t h e a s t W a s h i n g t o n R T P OR e g i o n a l T r a n s p o r t a ti o n P l a n : 2 0 1 4 - 2 0 1 8

Stevens County Owned Network: Total 1488 Miles Stevens County Average Daily Traffic Counts
62 | P a g e N o r t h e a s t W a s h i n g t o n R T P OR e g i o n a l T r a n s p o r t a ti o n P l a n : 2 0 1 4 - 2 0 1 8
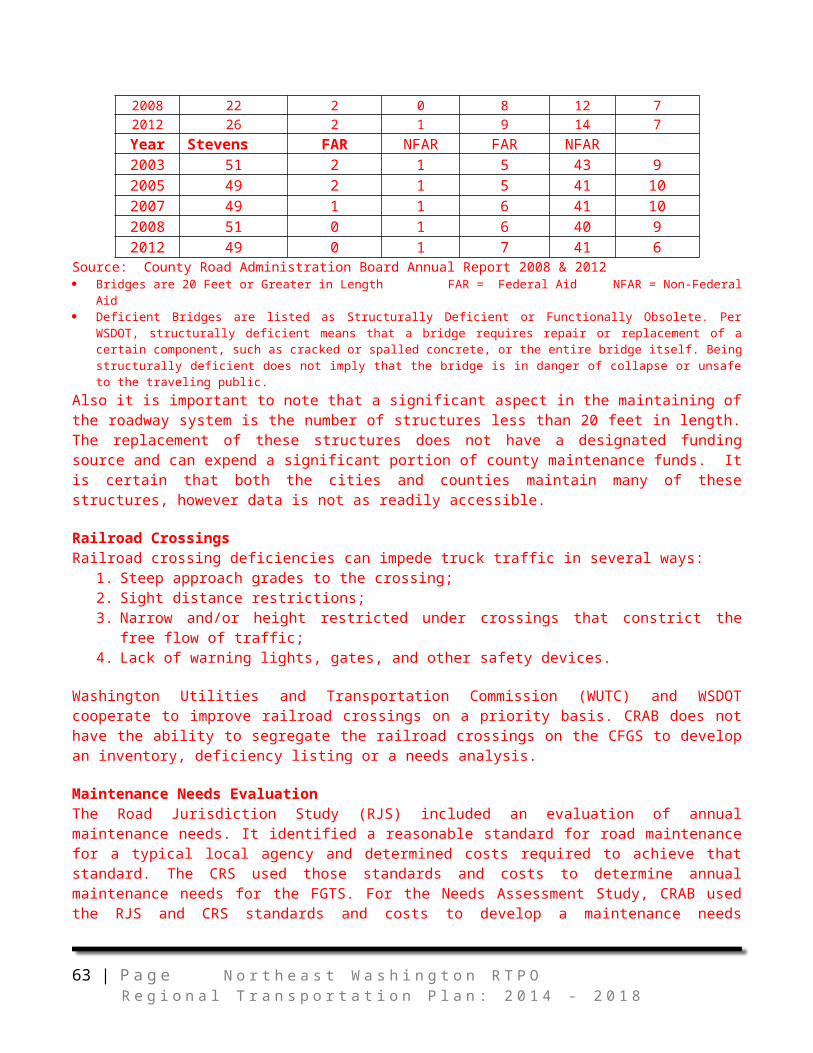
Preservation & Safety
Ferry County:
Figure 16: Ferry County Graph Series for Preservation & Safety Ratings
63 | P a g e N o r t h e a s t W a s h i n g t o n R T P OR e g i o n a l T r a n s p o r t a ti o n P l a n : 2 0 1 4 - 2 0 1 8

Pend Oreille County:
Figure 17: Pend Oreille County Graph Series for Preservation & Safety Ratings
Stevens County:
64 | P a g e N o r t h e a s t W a s h i n g t o n R T P OR e g i o n a l T r a n s p o r t a ti o n P l a n : 2 0 1 4 - 2 0 1 8

Figure 18: Stevens County Graph Series for Preservation & Safety Ratings
Stewardship: Funding & Administration
65 | P a g e N o r t h e a s t W a s h i n g t o n R T P OR e g i o n a l T r a n s p o r t a ti o n P l a n : 2 0 1 4 - 2 0 1 8

Ferry County:
Figure 19: Ferry County Allocation of Revenue & Expenditures for 2012
2012 Revenue:
$815,000 from local revenues
$3,000,000 from the state
$1,259,000 from other sources
$572,000 from the federal government
2012 Expenditures:
$2,229,120 for maintenance
$1,486,080 for construction
$619,200 for operations
$1,857,600 for other expenses
66 | P a g e N o r t h e a s t W a s h i n g t o n R T P OR e g i o n a l T r a n s p o r t a ti o n P l a n : 2 0 1 4 - 2 0 1 8

Pend Oreille County:
Figure 20: Pend Oreille County Allocation of Revenue & Expenditures for 2012
2012 Revenue:
$1,249,000 from local revenues
$1,802,000 from the state
$477,000 from other sources
$2,707,000 from the federal government
2012 Expenditures: $2,031,160 for maintenance
$2,628,560 for construction
$776,620 for operations
$477,920 for other expenses
67 | P a g e N o r t h e a s t W a s h i n g t o n R T P OR e g i o n a l T r a n s p o r t a ti o n P l a n : 2 0 1 4 - 2 0 1 8

Stevens County:
Figure 21: Stevens County Allocation of Revenue & Expenditures for 2012
2012 Revenue:
$4,880,000 from local revenues
$6,452,000 from the state
$1,151,000 from other sources
$1,087,000 from the federal government
2012 Expenditures:
$6,003,310for maintenance
$5,875,580 for construction
$894,110 for operations
$0 for other expenses
68 | P a g e N o r t h e a s t W a s h i n g t o n R T P OR e g i o n a l T r a n s p o r t a ti o n P l a n : 2 0 1 4 - 2 0 1 8

Financial PlanAnalysis of Funding Capability
The responsibility for determining the application of funding for transportation projects (programming) in rural areas is significantly different from urban areas. In urban areas over population 50,000, a federally mandated regional Metropolitan Planning Organization performs planning and some programming functions. In rural areas, there are no such federal mandates and individual state and local jurisdictions are required to plan and program for their own specific projects. Consequently, the involvement of the RTPO in planning and programming is on the basis of support and recommendation to its participating members.
Each jurisdiction in the region funds its projects through a variety of sources. Often the type of project determines the source of funding.
Application of Future Funding to needsComplicating the funding issue are the varying sets of construction standards and regulations that apply to federal, state and local projects. As an example, while federal funding may be more readily available for state and county projects, the extensive list of federal project standards and conditions tend to drive project costs significantly higher than state or locally funded work.
As a result, the cost of any given project, regardless of priority, may range widely from as little as a few thousand dollars per mile to over one million dollars per mile.
Another consideration in funding a given project is the determination of when the project is required. A project with high regional priority may not receive the same ranking from the responsible jurisdiction; therefore, a regional project with a high regional priority may not be constructed as early as a regional project with a lower regional priority.
These conditions again point to the programming jurisdiction as a key factor in determining the specifics of how and when funds will be applied to projects.
The County Road Administration Board manages three grant programs to help counties meet their transportation needs. The programs are administered with maximum flexibility and minimum overhead.
Rural Arterial Program - RAPThe Rural Arterial Program is a road and bridge reconstruction funding program that counties compete for every two years within their respective regions. Taken from fuel tax revenues, the account generates approximately $40 million per biennium. Less than 3% is used for administration of the program (WAC 136-100).
County Arterial Preservation Program - CAPPThe County Arterial Preservation Program is similar to the Department of Transportation's Highway Preservation Program. The CAPP program is designed to help counties preserve their existing paved arterial road networks. The program generates approximately $30 million per biennium. Less than 3% of the revenue is spent for administration (WAC 136-300).
69 | P a g e N o r t h e a s t W a s h i n g t o n R T P OR e g i o n a l T r a n s p o r t a ti o n P l a n : 2 0 1 4 - 2 0 1 8

Regional Transportation System Improvement StrategyIdentification of Future Projects ImplementationEach City, County and Tribe maintains a current six-year Transportation Improvement Plan (TIP). Each project is listed with its corresponding regional road segment. The purpose of this comparison is to match planned projects with regional needs and to show where additional funding and programming are required.
Identification of Alternative SolutionsIt is recognized that some regionally prioritized needs will be difficult to program. In these cases, consideration of alternative sources of funding or other means of meeting those needs must be found. These include the Enhancement, Statewide and Safety elements of the Surface Transportation Program of the federal SAFETEA-LU. At present, SAFETEA-LU is in process of reauthorization.
The SAFETEA-LU program has been replaced by MAP-21, which was approved by legislature in 2012, and stands for “Moving Ahead for Progress in the 21st Century”. These are funds that were set aside for transportation needs for 2013 and 2014.
For projects that may not meet criteria for funding based on regional significance, the RTPO may consider them under the TA grants, which are “Transportation Alternative” funds that are provided by the state. These funds are allocated based on the population base for the region; NEW does not receive a significant amount, but it has been enough to complete or begin a few projects in the region. An example of these projects are Phase I of the Ferry County Rail-Trail project; the sidewalk reconstruction for Chewelah along their city park; and some improvements to pedestrian facilities at the Marcus city park.
All alternatives should be considered and the most viable should be actively pursued to successful resolution. Some alternatives may not appear to meet the apparent need, but should be evaluated until they’re shown to be inapplicable. Cost benefit analyses or least cost planning must be used when determining project outcomes and funding.
Regional Transportation Plan ImplementationIn the region, each jurisdiction is responsible for identifying, planning, programming and constructing any transportation projects within the scope of their responsibility. The RTPO has no specific authority to fund or direct jurisdictional transportation improvements. The involvement of each jurisdiction in the RTPO (with the exception of WSDOT) is voluntary and consequently the results of the regional planning process takes the form of recommendations for consideration in each jurisdiction's overall program responsibilities.
Consequently, this plan is a tool to be used by those participating jurisdictions to assist them in programming efforts. For cities and counties, these recommendations should be viewed as positive options that recognize their own needs as well as their neighbors’ needs and the needs of the region as a whole.
The same perspective is true for WSDOT with the additional consideration that state legislation requires the incorporation of these recommendations in WSDOT plans for transportation improvements on state routes within the region. Implementation of the Regional Plan following its adoption will consist of the following elements:
70 | P a g e N o r t h e a s t W a s h i n g t o n R T P OR e g i o n a l T r a n s p o r t a ti o n P l a n : 2 0 1 4 - 2 0 1 8
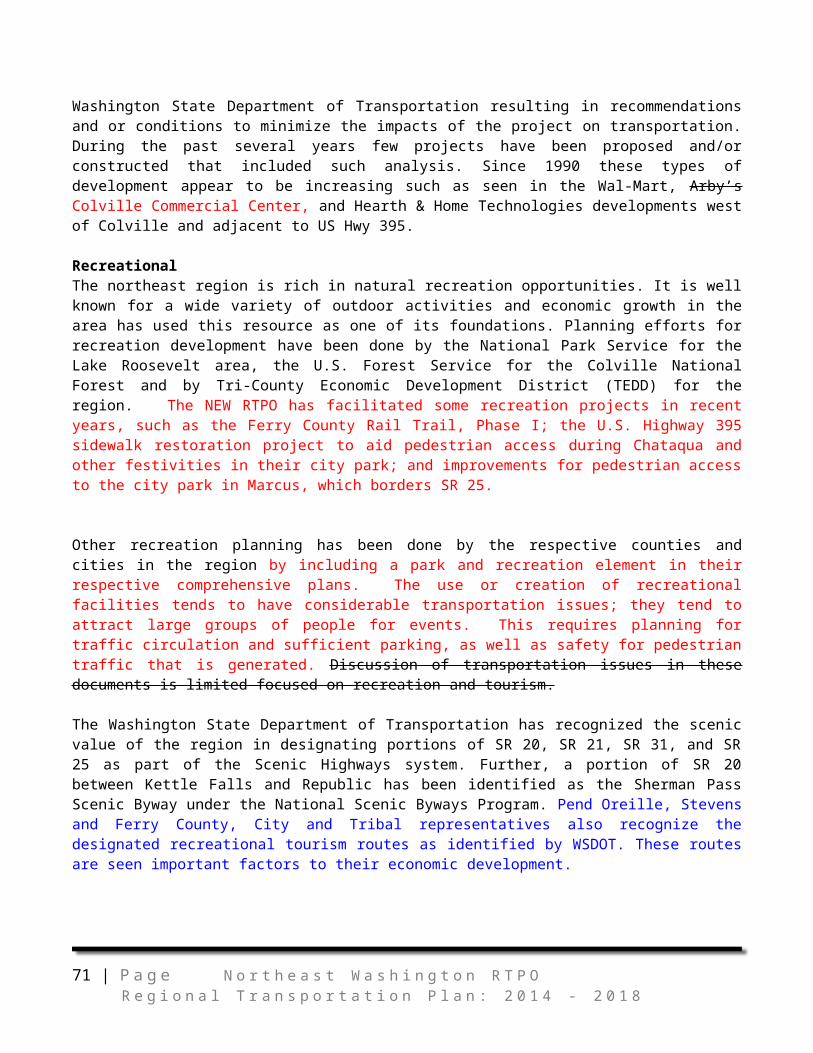
71 | P a g e N o r t h e a s t W a s h i n g t o n R T P OR e g i o n a l T r a n s p o r t a ti o n P l a n : 2 0 1 4 - 2 0 1 8
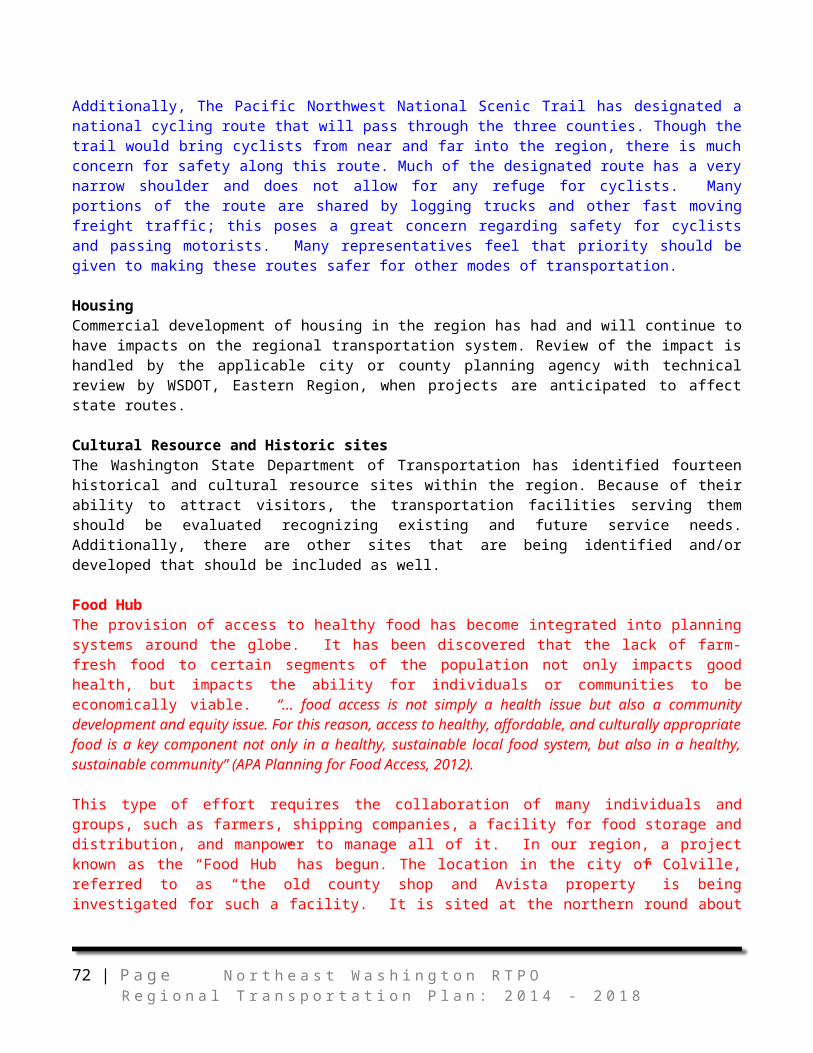
A. Consideration of regionally significant (prioritized) projects in city, county and WSDOT TIPs. This action should include scheduling and programming as appropriate within each jurisdiction.
B. Action by the RTPO, its lead agency and member jurisdictions to seek and obtain alternative funding for regionally significant projects not fundable under normal programs and not programmed in the TIPs.
C. Review of the inventory and data to verify accuracy and improve forecasted needs. Verification shall be an ongoing cooperative process involving appropriate members of the RTPO to insure consistency with State and local guidelines.
D. Continuation of public involvement that includes open opportunities for review and comment on the scope and actions of the plan and allows for timely revision of relevant aspects of the document in conformance with State guidelines and the desires of member jurisdictions.
E. Amendments to the Regional Transportation Plan may be requested, at any time, by the public, the RTPO Technical Advisory Committee or the Regional Transportation Governing/Policy Board. The RTPO will consider amendments to the plan concurrently with its biennial review of the plan and annual review of the TIPs of the participating jurisdictions.
The amendment process for the plan shall include timely (30 day) public notification to the regions newspapers in coordination with the Washington State Department of Transportation.
72 | P a g e N o r t h e a s t W a s h i n g t o n R T P OR e g i o n a l T r a n s p o r t a ti o n P l a n : 2 0 1 4 - 2 0 1 8

APPENDICES
73 | P a g e N o r t h e a s t W a s h i n g t o n R T P OR e g i o n a l T r a n s p o r t a ti o n P l a n : 2 0 1 4 - 2 0 1 8

Appendix A
Transportation and Warehousing Industries (Logistics)in NEW RTPO – Tri-County Region
Basic Information2001 Industry Jobs 5212022 Industry Jobs 465Total Change -56Total % Change -11.51%2014 Average Earnings per Worker $50,956
Description 2001 Jobs 2022 Jobs
Change
% Chang
e
2013 Avera
ge Earnin
gs
2012 Establishm
ents
Regional Total 521 465 -56 -11% $46,212 33
State Total 98,312 122,206 23,894 24% $58,854 4,208
National Total 5,095,800 6,132,578 1,036,778 20% $54,31
1 218,431
74 | P a g e N o r t h e a s t W a s h i n g t o n R T P OR e g i o n a l T r a n s p o r t a ti o n P l a n : 2 0 1 4 - 2 0 1 8
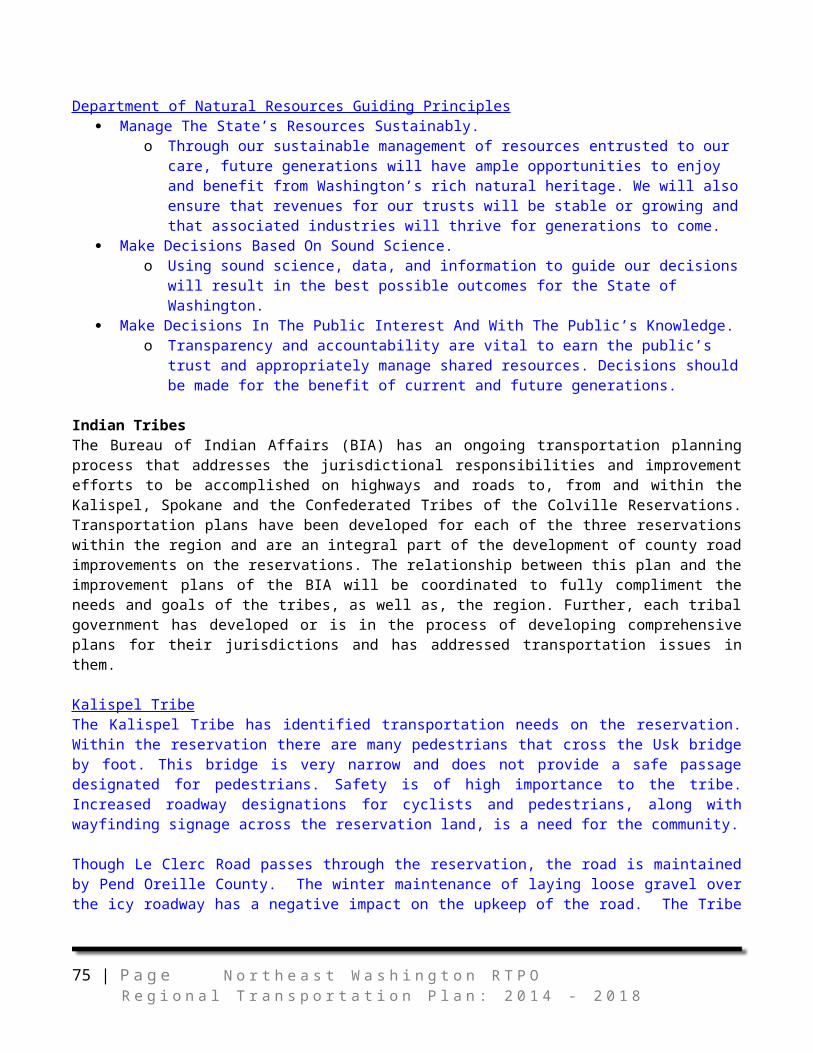
NAICS Code
Description 2001 Jobs
2022 Jobs
2013 Averag
e Earnin
gs
2012 Establish
ments
481111 Scheduled Passenger Air Transportation <10 <10 -- 0481112 Scheduled Freight Air Transportation 0 <10 -- 0481211
Nonscheduled Chartered Passenger Air Transportation <10 <10 -- 0
481212 Nonscheduled Chartered Freight Air Transportation 30 0 $0 0481219 Other Nonscheduled Air Transportation <10 <10 -- 0482110 Rail Transportation 51 58 $85,717 0483111 Deep Sea Freight Transportation 0 <10 -- 0483211 Inland Water Freight Transportation 0 0 $0 0483212 Inland Water Passenger Transportation 0 0 $0 0484110 General Freight Trucking, Local 54 16 $20,495 2484121 General Freight Trucking, Long-Distance, Truckload 161 55 $39,264 3484122
General Freight Trucking, Long-Distance, Less Than Truckload 11 39 $44,547 1
484210 Used Household and Office Goods Moving <10 <10 -- 0484220
Specialized Freight (except Used Goods) Trucking, Local 54 110 $49,031 12
484230
Specialized Freight (except Used Goods) Trucking, Long-Distance 26 50 $47,934 3
485112 Commuter Rail Systems 0 0 $0 0485510 Charter Bus Industry <10 0 -- 0485999
All Other Transit and Ground Passenger Transportation <10 <10 -- 0
488190 Other Support Activities for Air Transportation <10 0 -- 0488210 Support Activities for Rail Transportation 15 <10 -- 1488310 Port and Harbor Operations 0 0 $0 0488320 Marine Cargo Handling 0 0 $0 0
75 | P a g e N o r t h e a s t W a s h i n g t o n R T P OR e g i o n a l T r a n s p o r t a ti o n P l a n : 2 0 1 4 - 2 0 1 8

488330 Navigational Services to Shipping 0 0 $0 0488390 Other Support Activities for Water Transportation 0 0 $0 0488410 Motor Vehicle Towing <10 12 -- 5488510 Freight Transportation Arrangement <10 <10 -- 0488991 Packing and Crating 0 0 $0 0488999 All Other Support Activities for Transportation <10 0 -- 0492110 Couriers and Express Delivery Services 54 41 $61,959 3492210 Local Messengers and Local Delivery <10 20 -- 1493110 General Warehousing and Storage <10 12 -- 1493120 Refrigerated Warehousing and Storage 0 <10 -- 0493130 Farm Product Warehousing and Storage 13 23 $37,333 1493190 Other Warehousing and Storage 17 <10 -- 0532411
Commercial Air, Rail, and Water Transportation Equipment Rental and Leasing <10 <10 -- 0
541614
Process, Physical Distribution, and Logistics Consulting Services <10 <10 -- 0
561910 Packaging and Labeling Services <10 <10 -- 0
Total 521 465 $46,182 33
Source: EMSI Complete Employment - 2013.2 – Data from WA Employment Security Dept, Labor Market and Economic Analysis Branch.Appendix B
Abbreviations and Acronyms
ADT average daily traffic
CFR Code of Federal Regulations
CPTHSTP Coordinated Public Transit – Human Services Transportation Plan
CRAB County Road Administration Board
76 | P a g e N o r t h e a s t W a s h i n g t o n R T P OR e g i o n a l T r a n s p o r t a ti o n P l a n : 2 0 1 4 - 2 0 1 8

DNR Washington State Department of Natural Resources
FHWA Federal Highway Administration
GMA Growth Management Act
HSP Highway Safety Program
HUD (Department of) Housing and Urban Development
LOS Level of Service
MPO Metropolitan Planning Organization
NEPA National Environmental Policy Act
NEW RTPO Northeast Washington Regional Transportation Planning Organization
NAICS North American Industry Classification System
NFS National Forest System
PTBA Public Transportation Benefit Area
PTFS Public Transportation Feasibility Study
RCW Revised Code of Washington
PMS pavement management system
RSA road safety audit
RTP Regional Transportation Plan
RTPB Regional Transportation Policy Board
RTPO Regional Transportation Planning Organization
SAFETEA-LU Safe, Accountable, Flexible, Efficient Transportation Equity Act: ALegacy for Users
SHSP Washington State Strategic Highway Safety Plan: Target Zero
STIP State Transportation Improvement Plan
SR State Route (State Highway Number)
TAC Technical Advisory Committee
77 | P a g e N o r t h e a s t W a s h i n g t o n R T P OR e g i o n a l T r a n s p o r t a ti o n P l a n : 2 0 1 4 - 2 0 1 8

TAP Transportation Alternatives Program
TEA-21 Transportation Equity Act for the 21st Century
TEDD Tri County Economic Development District
TIP Transportation Improvement Program
TMR Travel Management Rule
UPWP Unified Planning Work Program
US 395/US Hwy United States Highway (Route Number)
USFS US Department of Agriculture, Forest Service
VMT Vehicle Miles Traveled
WAC Washington Administrative Code
WDFW Washington Department of Fish and Wildlife
WHCWG Washington Wildlife Habitat Connectivity Working Group
WFLHD FHWA Western Federal Lands Highway Division
WSDOT Washington State Department of Transportation
WTP Washington Transportation Plan
78 | P a g e N o r t h e a s t W a s h i n g t o n R T P OR e g i o n a l T r a n s p o r t a ti o n P l a n : 2 0 1 4 - 2 0 1 8

Appendix C
GLOSSARY OF TERMS
The following terms may be used throughout this report and are provided to clarify the meaning of the data, or may be included herein to further define other terms.
ALTERNATIVE MODES: Those non-highway surface modes, such as rail, transit, walking and bicycling.
AMERICANS WITH DISABILITIES ACT (ADA): Federal legislation outlining specific rights of persons with disabilities, and providing that publicly funded mass transit agencies must provide complementary paratransit service within the fixed-route service area to those persons unable to use fixed-route service because of a disability.
AVERAGE ANNUAL DAILY TRAFFIC (AADT): The total volume of traffic on a highway segment for one year, divided by the number of days in the year.
AVERAGE DAILY TRAFFIC: The total traffic volume during a given period (from 1 to 364 days) divided by the number of days in that period. Current ADT volumes can be determined by continuous traffic counts or periodic counts. Where only periodic traffic counts are taken, ADT volume can be established by applying correction factors such as for season or day of week. For roadways having traffic in two directions, the ADT includes traffic in both directions unless specified otherwise.
BICYCLE: Every vehicle propelled exclusively by human power upon which any person may ride, having two tandem wheels, except scooters and similar devices.
BICYCLE FACILITIES: A general term denoting improvements and provisions made by public agencies to accommodate or encourage bicycling, including parking and storage facilities, and shared roadways not specifically designated for bicycle use.
BIKE LANE: An undivided, paved, signed and marked portion of a roadway, sharing the same right-ofway with motorized vehicles but designated for the preferential or exclusive use of bicyclists.
CAPACITY: Usually expressed in person per hour or vehicle per hour, capacity is defined as the maximum traffic flow designation for a segment of roadway or a lane, within the control conditions for that particular segment of roadway or lane. Traffic flow could be of transportation units, transit, or bike/pedestrian.
COLLISION (TRAFFIC): An unintended event that causes a death, injury, or damage and involves a motor vehicle on a public roadway.
COMMUNITY: A physical or cultural grouping of stakeholders with common interests created by shared proximity or use. Community can be defined at various levels within a larger context (e.g., neighborhood, city, metropolitan area, or region).
79 | P a g e N o r t h e a s t W a s h i n g t o n R T P OR e g i o n a l T r a n s p o r t a ti o n P l a n : 2 0 1 4 - 2 0 1 8

COMMUNITY LIVABILITY: Encompasses those elements of home and neighborhood that contribute to welfare, health, convenience, mobility and recreation.
CONCURRENCY: As used in growth management, the requirement that public facilities and services needed to support development shall be available at the same time the impacts of such development will occur. For transportation facilities and services, there are specific legal criteria that address the time requirements for providing services and facilities, jurisdiction over level of service standards for specific portions of the highway and road system, and other issues.
CONGESTION: The level at which transportation system performance is no longer acceptable due to traffic interference. The level of acceptable system performance may vary by type of transportation facility, state or local government policy, geographic location, or time of day.
CONGESTION MANAGEMENT SYSTEM (CMS): A systematic process designed to emphasize effective management of existing transportation facilities through the use of travel demand and operational strategies.
CSS (Context Sensitive Solutions): The Federal Highway Administration defines CSS as “a collaborative, interdisciplinary approach that involves all stakeholders in developing a transportation facility that complements its physical setting and preserves scenic, aesthetic, historic and environmental resources while maintaining safety and mobility.”
CONTROLLED ACCESS FACILITY: A roadway where the spacing and design of driveways, medians, median openings, traffic signals and intersections are strictly regulated by consideration of such factors as traffic volume, number of lanes and adjacent land use.
COORDINATION: The comparison of plans, programs and schedules of one agency with related plans, programs and schedules of other agencies or entities with legal standing, and adjustment of plans, programs and schedules to achieve general consistency.
CORRIDOR: A term used in reference to highways, rail lines or waterways and the adjacent land that connect major travel markets within the region, the state or the nation.
DEMAND MANAGEMENT: A set of strategies that promote increased efficiency of the transportation system by influencing individual travel behavior.
DRIVER CONDITION: The condition of the driver which may have contributed to the crash.
DRIVER (OPERATOR): Every person who is in actual physical control of a motor vehicle upon a highway.
ENHANCEMENT FUNDING PROGRAM: A federal funding program under TEA-21 [23USC133(d)(2)] 1570 that apportions a 10% set-aside of the Surface Transportation Funding Program to transportation enhancements such as provision of bicycle and pedestrian facilities, provision of safety and educational activities for pedestrian and bicyclists, acquisition of scenic easements and scenic or historic sites, scenic or historic highway programs.
80 | P a g e N o r t h e a s t W a s h i n g t o n R T P OR e g i o n a l T r a n s p o r t a ti o n P l a n : 2 0 1 4 - 2 0 1 8
FATAL CRASH: Any motor vehicle collision that resulted in the death of one or more persons due to injuries received from the collision within 30 days of the collision.
FATALITY: An individual involved in a motor vehicle collision who died within 30 days of the collision as a result of injuries sustained in the collision.
FIRST HARMFUL EVENT: The first injury or damage producing event which characterizes the crash type and identifies the nature of the first harmful event.
FUNCTIONAL CLASSIFICATION: The assignment of roads into categories according to the character of service they provide in relation to the total road network to assist in determining appropriate regulatory controls and roadway design criteria.
GEOGRAPHIC INFORMATION SYSTEM (GIS): A computer system capable of assembling, storing, manipulating and displaying geographically referenced information, i.e. data identified according to their locations. Practitioners also regard the GIS as including operating personnel and the data that go into the system.
HIGH-OCCUPANCY VEHICLE (HOV): Any vehicle carrying two or more passengers. The term usually refers to private vehicles.
IMPACTS: The effects of a transportation project, including a) direct (primary) effects; b) indirect
(secondary) effects; and c) cumulative effects.
INJURY: Bodily harm to a person as a result of a motor vehicle collision.
INJURY SEVERITY:
Fatal Injury (Death) - Any injury that results in the death of a person within 30 days of the collision in which the injury was sustained.
Serious Injury - Any injury, other than a fatal injury, which prevents the injured person from walking, driving, or normally continuing the activities the person was capable of performing before the injury occurred.
Visible Injury - Any injury, other than a fatal injury or incapacitating injury, which is evident to observers at the scene of the collision in which the injury occurred.
Possible Injury - Any injury reported or claimed which is not a fatal injury, incapacitating injury, or non-incapacitating, evident injury.
INTELLIGENT TRANSPORTATION SYSTEMS (ITS): Encompasses a broad range of communications based information, control and electronics technologies. When integrated into the transportation system infrastructure, and in vehicles themselves, these technologies help monitor and manage traffic flow, reduce congestion, provide alternate routes to travelers, enhance productivity, response to incidents, adverse weather and other road capacity constricting events.
81 | P a g e N o r t h e a s t W a s h i n g t o n R T P OR e g i o n a l T r a n s p o r t a ti o n P l a n : 2 0 1 4 - 2 0 1 8
INTERMODAL: Denotes the seamless movement of people or cargo between transport modes.
INTERMODAL FACILITIES: Transportation facilities that provide for linkages between travel modes, such as rail or bus stations at airports.
LEVEL OF SERVICE (LOS): A qualitative measure of roadway performance expressed in letter grades ranging from A through F, with A roads operating under optimum free-flow conditions and F roads operating under the most deficient conditions characterized by considerable traffic delays.
LIMITED ACCESS: A street or highway especially designed for through traffic and to which owners or occupants of abutting land or other persons have no right or easement of access.
LIVABLE COMMUNITY: A neighborhood, community or region with compact, multidimensional land use patterns that ensure a mix of uses, minimize the impact of cars, and promote walking, bicycling and transit access to employment, education, recreation, entertainment, shopping and services.
OCCUPANT: A person who is in or on a motor vehicle.
METROPOLITAN PLANNING ORGANIZATION (MPO): An organization made up of local elected and appointed officials responsible for developing, in cooperation with the state, transportation plans and programs in metropolitan areas containing 50,000 or more residents. MPOs are responsible for the development of transportation facilities that will function as an intermodal transportation system and the coordination of transportation planning and funding decisions.
MIXED-USE DEVELOPMENT: Defined by the Urban Land Institute as developments with three or more significant revenue-producing uses, such as office, retail, residential, hotel/motel, entertainment, cultural, recreation, etc., which are mutually supportive in well-planned projects.
MOBILITY: The degree to which the demand for the movement of people and goods can be satisfied. Mobility may be measured by the quantity, quality, accessibility and utilization of transportation facilities and services.
MODE: Any one of the following means of moving people or goods: aviation, bicycle, highway, paratransit, pedestrian, pipeline, rail (commuter, intercity passenger and freight), transit, space and water.
MULTIMODAL: Any planning process, capital improvement, or transportation system which takes into account all available modes of travel, including vehicle, mass transit, rail, aviation, bicycle, and pedestrian activity.
MULTIMODAL TRANSPORTATION: Denotes the use of more than one mode to serve transportation needs in a given area.
PARATRANSIT SERVICE: Demand-response transportation provided in lieu of fixed-route bus service, including taxi and wheelchair van transportation.
PASSENGER: Any occupant of a vehicle other than its driver.
82 | P a g e N o r t h e a s t W a s h i n g t o n R T P OR e g i o n a l T r a n s p o r t a ti o n P l a n : 2 0 1 4 - 2 0 1 8
PEDESTRIAN: Any person afoot and any person operating a wheelchair or motorized wheelchair.
PREFERRED ALTERNATIVE: A recommended course of action to implement a transit alternative that was developed through a study of alternative multi-modal strategies to deal with future traffic congestion based upon the effect of and on land use patterns, local transportation policies, development regulations, and the environment.
PROPERTY DAMAGE ONLY (PDO): Any collision in which there was property damage of $751 or more to any one person but no injuries or fatalities.
QUALITY OF LIFE : All of the characteristics of an area’s living conditions, including such things as housing, education, transportation infrastructure, leisure time offerings, climate, employment opportunities, medical and health care infrastructure and environmental resources.
RELATION TO JUNCTION: The location of a crash in relation to an intersection or the connection between a driveway access and a roadway other than a driveway access.
SLACK-WATER NAVIGATION: Navigation in a stream the depth of which has been increased, and the current diminished, by a dam or dams.
STATE HIGHWAY SYSTEM: Includes all Interstate, U.S. and State highways
SURFACE TRANSPORTATION PROGRAM (STP): One of the key federal funding programs in TEA-21. It provides flexibility in expenditure of "road" funds for non-motorized and transit modes and for a category of activities known as transportation enhancements. It also broadens the definition of eligible transportation activities to include pedestrian and bicycle facilities and enhancement of community and environmental quality with 10 categories of activities. The STP provides flexible funding that may be used by States and localities for projects on any Federal-aid highway, including the National Highway System, bridge projects on any public road, transit capital projects, and intra-city and inter-city bus terminals and facilities.
TELECOMMUTING: An arrangement whereby employees work at a location other than the conventional office site, usually from home or an office close to home, resulting in the electronic transfer of information rather than movement of people to and from the workplace.
TRAFFIC ANALYSIS ZONE (TAZ): A traffic analysis zone is a special area delineated by state and/or metropolitan planning organizations for compiling and tabulating traffic-related land use and socioeconomic data - used as planning assumptions to forecast travel demand. Traffic analysis zones are also used as the origin and/or destination for trip making. A TAZ usually consists of one or more census blocks, block groups, or census tracts.
TRANSIT: Mass transportation by bus, rail or other conveyance that provides general or special services to the public on a regular and continuing basis. Transit does not include school buses, charter services, or sightseeing services.
83 | P a g e N o r t h e a s t W a s h i n g t o n R T P OR e g i o n a l T r a n s p o r t a ti o n P l a n : 2 0 1 4 - 2 0 1 8
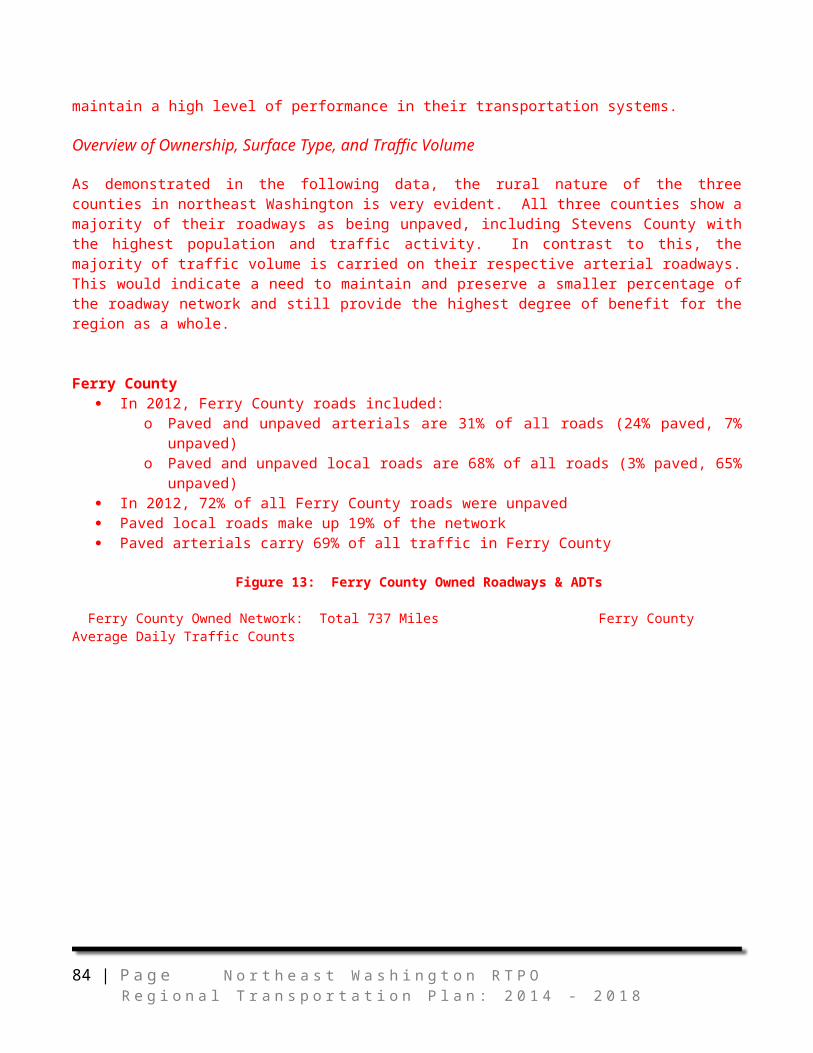
TRANSPORTATION DISADVANTAGED: Those persons who, because of physical or mental disability, income status, or age are unable to transport themselves or to purchase transportation and are, therefore, dependent on others to obtain access to health care, employment, education, shopping, social activities, or other life-sustaining activities.
TRANSPORTATION IMPROVEMENT PROGRAM (TIP): A five-year program of transportation improvements adopted annually by the MPO that incorporates State and Federal work programs along with the capital improvement programs/elements of local governments within the MPO’s jurisdiction.
TRANSPORTATION MANAGEMENT AREA (TMA): Areas subject to special requirements under TEA-21 that benefit from preferential treatment with regard to air quality needs and local authority to select transportation projects. Any urban area over 200,000 population is automatically a Transportation Management Area, which subjects it to additional planning requirements but also entitles it to funds earmarked for large urbanized areas under the Surface Transportation Program. Metropolitan Planning Organizations in TMAs are required to implement Congestion Management Systems.
TRANSPORTATION SYSTEM MANAGEMENT (TSM): A program involving the implementation of traffic control measures, such as high-occupancy vehicle (HOV) lanes, signal timing adjustments, median closings, and access management strategies to increase the operating efficiency of the traffic circulation system.
TRAVEL TIME: The total time taken to complete a trip from origin to destination.
TRUCK (HEAVY): A motor vehicle exceeding 8,000 pounds gross weight, has two or more wheels per axle or has more than two axles, and is designed, used, or maintained primarily for the transportation of property.
URBANIZED AREA: An area with a population of 50,000 or more designated by the US Bureau of the Census within boundaries to be fixed by responsible State and local officials in cooperation with each other, subject to the approval by the Secretary of the US Department of Transportation
VOLUME TO CAPACITY (V/C) RATIO: A measure of traffic congestion along a roadway, expressed as the ratio of traffic on a particular segment of road to the total capacity of that roadway segment.
84 | P a g e N o r t h e a s t W a s h i n g t o n R T P OR e g i o n a l T r a n s p o r t a ti o n P l a n : 2 0 1 4 - 2 0 1 8

Appendix D
Recently Completed Projects in Eastern Washington Project Title CountyUS 395 - Columbia River at Kettle Falls - Bridge Deck FerryUS 395 - SR 292 Junction to Colville-Centerline Rumble Strips - Complete June 2010 FerrySR 21 - Curlew State Park to North of Rin Con Creek FerrySR 21 - Keller Ferry Replacement - Completed August 2013 FerrySR 21 - Rin Con to Canada - complete September 2013 FerrySR 21 - South Nanamkin Creek-Culvert Replacement - Complete October 2013 FerryEastern Region 2012 Safety Restoration FerryEastern Region HMA Conversion Chip Seal - Complete November 2011 Ferry
Eastern Region HMA Conversion Chip Seal - Complete November 2011 Pend Oreille
SR 291 - Route Development Plan - Complete Stevens
US 395 - Columbia River at Kettle Falls - Bridge Deck StevensEastern Region 2011 Chip Seal - Complete November 2011 StevensEastern Region HMA Conversion Chip Seal - Complete November 2011 StevensEastern Region Unstable Slopes-Rock Scaling - Complete September 2011 StevensUS 395 - Loon Lake to Immel Road Paving - Complete November 2009 StevensUS 395 - Spokane Co Line To Loon Lake Paving - Complete September 2009 StevensSource: WSDOT, 2013
85 | P a g e N o r t h e a s t W a s h i n g t o n R T P OR e g i o n a l T r a n s p o r t a ti o n P l a n : 2 0 1 4 - 2 0 1 8