Embed Size (px)
Citation preview
1
TK inhibitor pazopanib primes DCs by downregulation of the -catenin pathway
Ilaria Grazia Zizzari1*
, Chiara Napoletano1, Andrea Botticelli
2, Salvatore Caponnetto
3, Fabio
Calabrò4, Alain Gelibter
3, Aurelia Rughetti
1, Ilary Ruscito
1, Hassan Rahimi
1, Ernesto Rossi
5,
Giovanni Schinzari5, Paolo Marchetti
2, Marianna Nuti
1.
1. Laboratory of Tumor Immunology and Cell Therapy, Department of Experimental Medicine,
Policlinico Umberto I, “Sapienza” University of Rome;
2. Division of Oncology, Department of Clinical and Molecular Medicine, Ospedale Sant'Andrea,
“Sapienza” University of Rome;
3. Division of Oncology, Department of Radiological, Oncological and Pathological Science,
Policlinico Umberto I, “Sapienza” University of Rome;
4. Division of Medical Oncology B, San Camillo Forlanini Hospital Rome;
5. Department of Medical Oncology, Fondazione Policlinico A.Gemelli Rome;
Running title: Immune priming of DCs by pazopanib
*Corresponding author:
Ilaria Grazia Zizzari PhD
Laboratory of Tumor Immunology and Cell Therapy
Department of Experimental Medicine
“Sapienza” University of Rome
viale Regina Elena 324, 00161 Rome
e-mail: [email protected]
Phone: +39 0649973025
Conflict of interest: The authors declare no potential conflicts of interest
Keywords: Dendritic cells, TKis, mRCC, VEGFR,
on April 9, 2019. © 2018 American Association for Cancer Research. cancerimmunolres.aacrjournals.org Downloaded from
Author manuscripts have been peer reviewed and accepted for publication but have not yet been edited. Author Manuscript Published OnlineFirst on April 26, 2018; DOI: 10.1158/2326-6066.CIR-17-0594
2
Abstract
Tyrosine kinase inhibitors (TKIs) target angiogenesis by affecting, for example, the VEGF
receptors in tumors and have improved outcomes for patients with metastatic renal cell carcinoma
(mRCC). Immune checkpoint inhibitors (ICIs) have also been proposed for treatment of mRCC
with encouraging results. A better understanding of the activity of immune cells in mRCC, the
immuneomodulatory effects of TKIs, and the characteristics defining patients most likely to benefit
from various therapies will help optimize immunotherapeutic approaches. In this study we
investigated the influence of the TKI pazopanib on dendritic cell (DC) performance and immune
priming. Pazopanib improved DC differentiation and performance by promoting upregulation of the
maturation markers HLA-DR, CD40, and CCR7; decreasing IL10 production and endocytosis; and
increasing T-cell proliferation. PD-L1 expression was also downregulated. Our results demonstrate
that pazopanib inhibits the Erk/-catenin pathway, suggesting this pathway might be involved in
increased DC activation. Similar results were confirmed in DCs differentiated from mRCC patients
during pazopanib treatment. In treated patients pazopanib appeared to enhance a circulating CD4+
T-cell population that expresses CD137 (4-1BB). These results suggest that a potentially exploitable
immunomodulatory effect induced by pazopanib could improve responses of patients with mRCC
in customized protocols combining TKIs with ICI immunotherapy.
Introduction
Tumor progression requires angiogenesis. Pro-angiogenic factors such as VEGF that are induced by
hypoxia or oncoproteins can alter the equilibrium between pro- and anti-angiogenic factors resulting
in the generation of new blood vessels, mostly with altered endothelium structure. Pro-angiogenic
factors are involved in the generation of immunosuppression in tumors. Tumor neoangiogenesis is
associated with immature and tolerogenic DCs, and increased number of myeloid-derived
suppressor cells (MDSCs), the activation of regulatory T cells (Tregs), and recruitment of tumor-
associated macrophages (TAMs) in the tumor bed (1).
Various anti-angiogenic and multitargeted compounds, including bevacizumab, sunitinib,
pazopanib, sorafenib, axitinib, lenvatinib, and cabozantinib, have entered the clinic for use against
tumors that depend on angiogenesis (2-4). For metastatic renal cell carcinoma (mRCC), VEGFR-
directed tyrosine kinase inhibitors (TKIs) have demonstrated clinical benefits including
improvements in progression-free survival and overall survival (5). These compounds, which target
VEGF and its receptors, are likely to affect the immune repertoire of cells and molecules that
on April 9, 2019. © 2018 American Association for Cancer Research. cancerimmunolres.aacrjournals.org Downloaded from
Author manuscripts have been peer reviewed and accepted for publication but have not yet been edited. Author Manuscript Published OnlineFirst on April 26, 2018; DOI: 10.1158/2326-6066.CIR-17-0594
3
interact with the growing tumor. Immunosuppression appears to be downregulated in mRCC
patients treated with sunitinib or axitinib, whose Treg and MSDC cell populations are affected.
Sorafenib has the opposite effect by reducing antigen-specific T-cell induction in vitro (6-11). The
different selectivities and affinities of the various drugs are thought to account for the diverse
effects on myelopoiesis and immune cells (12).
As immunotherapy using immune check-point inhibitors is moving to clinical application
for mRCC, we must understand the immune consequences of TKI therapy. In the CheckMate 025
randomized phase 3 trial, Escudier et al. observed in mRCC patients improved overall survival and
favorable hazard ratio for the anti-PD-1 Nivolumab group that had previously received first-line
treatment with pazopanib (HR 0.60 95% CI 0.42-0.84); such results suggest an immune effect on
the tumor microenvironment (13).
TKIs seem to be more effective in mRCC, suggesting that the requirement for angiogenesis
increases as the disease progresses. In order to achieve maximum response from anti-PD-1
immunotherapy, the patient must be prepared to receive an immunotherapeutic regime that will
expand activated and specific T cells. We have addressed this issue by studying DC performance at
concentration of sunitinib and pazopanib found in plasma. DCs are antigen-presenting cells that
prime antigen-naive T cells and perform cross-priming, thus presenting antigens both in HLA class
I and II to activate immune responses. Optimal DCs express costimulatory molecules such as CD40,
CD83, CD86, HLA-DR, and to a lesser extent CD14 and PD-L1. In order to migrate to the lymph
node for cross talk with effector cells, DCs must express the CCR7 marker. These parameters relate
to T-cell priming and activation. Failure to sustain these hallmarks will lead to tolerogenic DCs that
will dampen antitumor immunity (14, 15).
We report here results that identify the TKI pazopanib as an immune stimulator, which
exerts its effects by influencing DC differentiation and maturation. This activation is mediated by
targeting and downregulating p-Erk and-catenin pathway. The impact of this immune activation
mediated by DCs was investigated in mRCC patients undergoing TKI treatment. Our results might
influence the design of first- and second-line therapies for mRCC.
Materials and Methods
Generation of DCs
Human monocyte-derived DCs were generated from Peripheral Blood Mononuclear Cells (PBMCs)
of healthy donors (Ethical Committee Protocol, RIF.CE: 4212) and of mRCC patients (Ethical
Committee Protocol, RIF.CE: 4181). Monocytes (CD14+) were purified from PBMCs after Ficoll-
on April 9, 2019. © 2018 American Association for Cancer Research. cancerimmunolres.aacrjournals.org Downloaded from
Author manuscripts have been peer reviewed and accepted for publication but have not yet been edited. Author Manuscript Published OnlineFirst on April 26, 2018; DOI: 10.1158/2326-6066.CIR-17-0594
4
Hypaque gradient (1077 g/mL; Pharmacia LKB) by Human CD14 Positive Selection Kit (StemCell
Technologies) and cultured (5x10⁵ cells/ml) in RPMI 1640 (Hyclone) supplemented with 2 mM L-
glutamine, penicillin 100 U/ml, streptomycin 100 g/ml (Sigma-Aldrich), with 5% heat-inactivated
Fetal Calf Serum (FCS) (Hyclone). Fifty ng/ml rhGM-CSF (R&D System) and 2000U/ml rhIL4
(R&D System) were added at day 0 and 2. Immature DCs (iDCs) were collected at day 5 and
matured with cytokine cocktail (rhIL1, IL6, TNF and PGE2) (all purchased by R&D System) for
16 hours. Sunitinib (50ng/ml) (Sigma-Aldrich) and pazopanib (19 μg/ml) (Sigma-Aldrich) were
dissolved in dimethyl sulfoxide (DMSO) (Euroclone) and added to the culture during DC
differentiation.
Immune phenotype
DC phenotype was analyzed by flow cytometry employing the following monoclonal antibodies
(mAbs): anti-HLAII-DR-FITC, anti-CD86-FITC, from BD Biosciences, anti-CD14-PE, anti-CCR7-
FITC, anti-CD83-PE,anti-CD40-PE, anti-PD-L1-PE from Biolegend and anti-VEGR-1 from R&D
System. MoAbs anti-IgG1-FITC and anti-IgG1-PE (Biolegend) were employed as isotype controls.
For immune profile evaluation, PBMCs were isolated from blood samples (50 ml) from six mRCC
patients by Ficoll-Hypaque at different times (Ethical Committee Protocol, RIF.CE: 4181): before
treatment with sunitinib or pazopanib (T0), during treatment (T1: 1 month of treatment, T2: 2
months, T3: 3 months etc.) and during progression. Various T-cell subsets were analyzed:
T-cell subpopulations: anti-CD3-APC-H7/CCR7-PE/CD8 PerCp-Cy5.5/CD45RA-BB15
Treg cells: anti-CD4-APC-H7/CD25-PE/CD45RA-BB15/FoxP3-Alexa647
T-cell activation/proliferation: anti-CD3-APC-H7/CD8-PerCp-Cy5.5/CD137-APC/Ki67-PeCy7
T-cell exhaustion: anti-CD3-APC-H7/CD8-PerCpCy5.5/PD1-PE/CTLA4-APC/Tim3-BB15
All MoAbs were purchased by BD Biosciences and Biolegend. Flow cytometric analysis was
performed using FACSCanto flow cytometer running FACS Diva data acquisition and analysis
software (BD Biosciences). Catalog numbers and clones for every antibody used are listed in
Supplementary Table S1.
Microvesicle isolation
Microvesicles were isolated from supernatants of DCs differentiated with and without suninitib and
pazopanib. Supernatants were centrifuged at 13000g for 30 minutes at 4°C. Microvescicles were
then stained with anti-PD-L1 (Biolegend) and acquired by FACSCanto flow cytometer and
analyzed by FACS Diva software. Anti-IgG1-PE (BD Biosciences) was employed as isotype
on April 9, 2019. © 2018 American Association for Cancer Research. cancerimmunolres.aacrjournals.org Downloaded from
Author manuscripts have been peer reviewed and accepted for publication but have not yet been edited. Author Manuscript Published OnlineFirst on April 26, 2018; DOI: 10.1158/2326-6066.CIR-17-0594
5
control. Fluorescent Nile Red Particles (0.1-0.3 m, Spherotech Inc.) were used as size control.
Western blot analysis
Immature DCs and mature DCs (iDCs and mDCs, respectively) with and without sunitinb and
pazopanib were lysed using the NP-40 solution (Biocompare) in the presence of
phenylmethylsulfonyl fluoride (1 mM, PMES) and protease inhibitors (1X) (Sigma). Proteins
obtained were resolved using 4–12% SDS-PAGE gel and transferred to nitrocellulose. After
blocking, membranes were incubated with rabbit anti-β-catenin (Bethyl Laboratories Inc.) (1:1000),
rabbit anti-pErk42/44 (Erk1/2) (Cell Signaling Technologies) (1:1000), mouse anti-β-actin (Cell
Signaling Technologies) (1:1000) and mouse anti-NF-B (p105/p50) (Cell Signaling Technologies)
(1:1000), followed by peroxidase-conjugated goat anti-rabbit or anti-mouse IgG (H+L) (Jackson
Immuno Research Laboratories) (1:20000). Protein bands were detected with Immobilon Western
(Millipore Corporation) following the manufacturer’s instructions. The density of protein bands
was analyzed by Image J software and was normalized in terms of average intensity of bands of
each protein per average intensity of bands of β-actin.
Endocytosis assay
FITC-dextran (1 mg/mL) (Molecular Probes) was added to untreated iDCs and mDCs and
differentiated with sunitinib and pazopanib for 2 h at 37◦C. After washing, cells were acquired by
FACSCantoII flow cytometer and analyzed by FACSDiva software. DCs incubated with FITC-
dextran for 2 h at 4°C were used as negative controls.
Cytokine production
Culture supernatants from iDCs and mDCs untreated or differentiated with sunitib and pazopanib
and sera from mRCC patients were collected and analyzed using the ProcartaPlex Human
Inflammation Panel (20 Plex) (eBioscence). Samples were measured by BioPlex Magpix Multiplex
Reader (Bio-Rad) and data analysis was performed using Bioplex Manager MP software (Bio-Rad).
T-cell proliferation
T lymphocytes were purified from Ficoll-Hypaque gradient (1077 g/mL; Pharmacia LKB) followed
by CD3 immunomagnetic isolation (StemCell). T cells were then cocultured in a 96-well round-
on April 9, 2019. © 2018 American Association for Cancer Research. cancerimmunolres.aacrjournals.org Downloaded from
Author manuscripts have been peer reviewed and accepted for publication but have not yet been edited. Author Manuscript Published OnlineFirst on April 26, 2018; DOI: 10.1158/2326-6066.CIR-17-0594
6
bottom microplate (Costar) with allogeneic iDC and mDCs differentiated with and without sunitinib
and pazopanib (DCs : T cells, 1:5) in presence of PHA (5 μg/ml) for 4 days at 37°C. T cells were
pre-treated with CarboxyFluorescein Succinimidyl Ester (1 μM, CFSE) (Life Technologies) and
cell proliferation was monitored through progressive halving of fluorescence using FACSCantoII
flow cytometer and analyzed by FACSDiva software (BD Biosciences). Results were reported as
the percentage of proliferation increase of T cells cultured with DCs treated with sunitinib and
pazopanib compared to T cells cultured with DCs alone.
T cells were also cultured in 6-well round-bottom microplates (Costar) in the presence of sunitinib
(50ng/ml) and pazopanib (19 ug/ml) up to 24 hours. Proliferation was evaluated by FACSCantoII
flow cytometer and analyzed by FACSDiva software
Statistical Analysis
Descriptive statistics (average and standard deviation) were used to describe the various data.
ANOVA test was used to analyze statistical differences between three groups. Student’s paired t-
test was used to compare two groups. Significance is indicated when the P value was less than 0.05.
Results
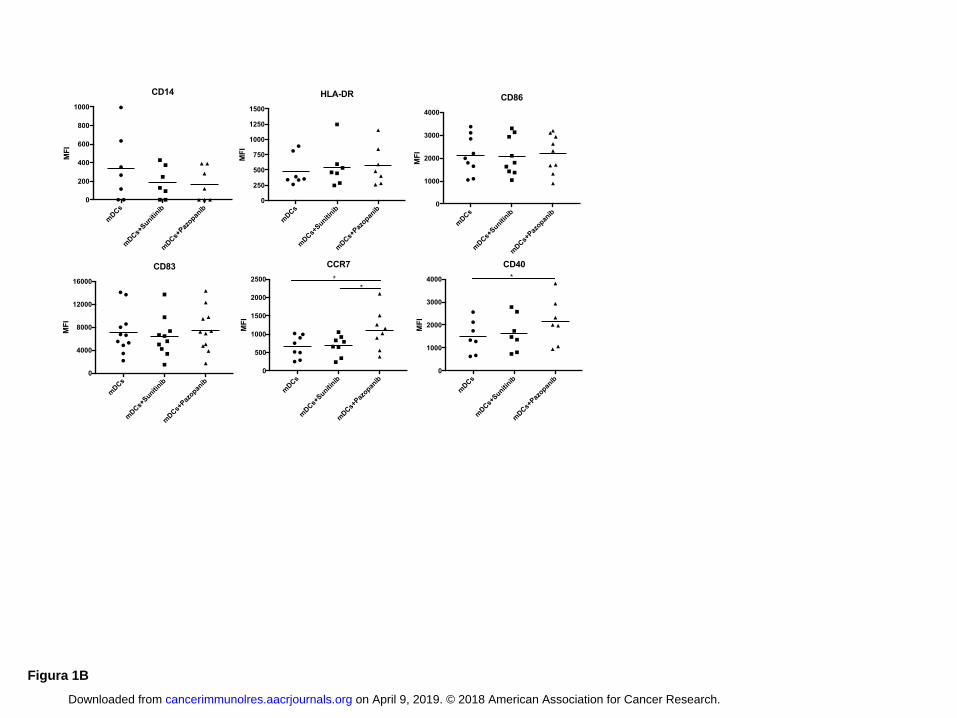
Pazopanib improves DC activation and increases expression of DC-maturation markers
To investigate the capacity of TKIs to influence DC differentiation and maturation in vitro, the
expression of CD14, HLA-DR, CD86, CD83, CCR7 and CD40 was evaluated by flow cytometry
on monocyte-derived DCs of healthy donors. Untreated DCs were used as control. The exposure to
concentrations of sunitinib and pazopanib found in plasma affected the phenotype of immature and
mature DCs differently (Fig. 1 A, B). Sunitinib did not affect DC differentiation and maturation, but
DCs cultured in the presence of pazopanib were more activated. Pazopanib modified iDC
phenotype, significantly increasing the expression of HLA-DR and CD40 molecules, compared
with that of iDCs alone (HLA-DR P < 0.01) and iDC treated with sunitinib (HLA-DR P < 0.05;
CD40 P < 0.05) (Fig. 1A). The average values of mean fluorescence intensity (MFI) indicated
upregulation of CD83 in DCs differentiated with pazopanib. On the other hand, CD14 expression
was dowregulated by pazopanib during differentiation. Similar results were obtained after DC
maturation (Fig. 1B). mDCs cultured in presence of pazopanib significantly upregulated the
expression of CCR7 and CD40 molecules compared to untreated mDCs (CCR7 P < 0.05; CD40 P <
on April 9, 2019. © 2018 American Association for Cancer Research. cancerimmunolres.aacrjournals.org Downloaded from
Author manuscripts have been peer reviewed and accepted for publication but have not yet been edited. Author Manuscript Published OnlineFirst on April 26, 2018; DOI: 10.1158/2326-6066.CIR-17-0594
7
0.05) and sunitinib-treated mDCs (CCR7 P < 0.05), suggesting that pazopanib enhances activation
status of both immature and mature DCs.
VEGF-R1 expression, which is the target of both TKIs, was unaltered by treatment of DCs with
pazopanib or sunitib (Supplementary Fig. S1A)
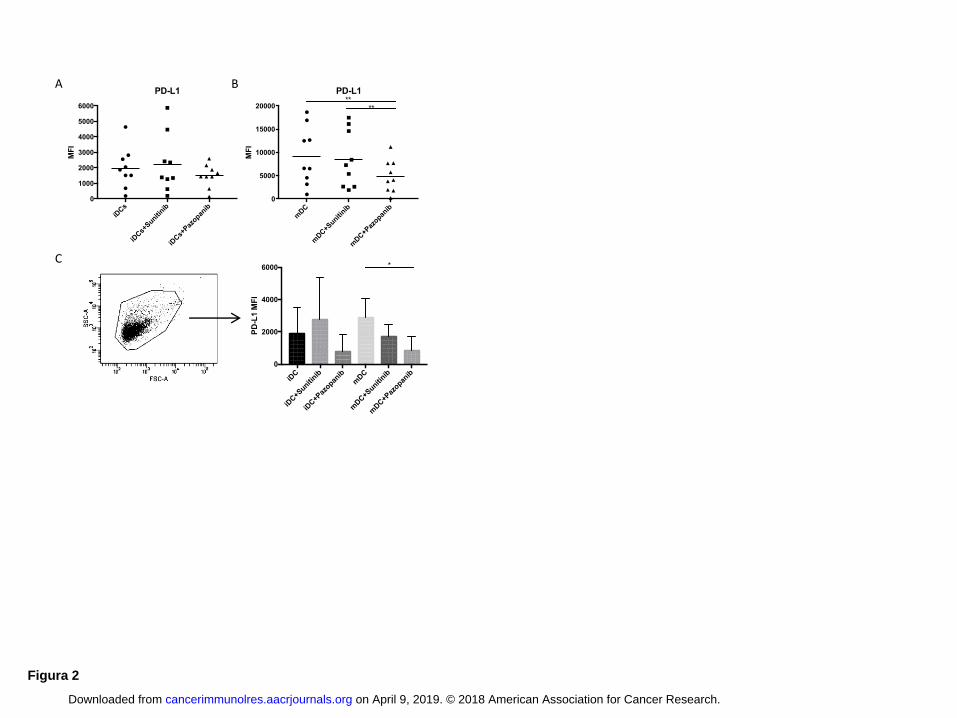
PD-L1 is down regulated in Pazopanib generated DCs
The capacity of DCs to stimulate T cells depends on the balance between costimulatory and co-
inhibitory signals. Increased expression of costimulatory marker such as CD40 or CD83 can
facilitate T-cell activation, whereas increased expression of inhibitory markers such as PD-L1
contributes to T cell-negative regulation (16). To evaluate the expression of co-inhibitory signals in
DCs in response to TKI treatment, we analyzed the expression of the PD-L1 both on DCs and on
shed microvescicles (Fig. 2). During iDC differentiation, only pazopanib began to decrease PD-L1
expression, compared to untreated DC and DCs differentiated with sunitinib (Fig. 2A). The
decrease in expression became significant (P < 0.01) in DCs after maturation (Fig. 2B).
Microvesicles released by the DCs also showed a decrease in PD-L1 expression: PD-L1 expression
on microvesicles released by DCs treated with pazopanib was lower than that on microvesicles
obtained by untreated DCs and DCs treated with sunitinib (Fig. 2C). The difference in expression of
PD-L1 between microvesicles of mDCs and mDCs treated with pazopanib was statistically
significant (P < 0.05).
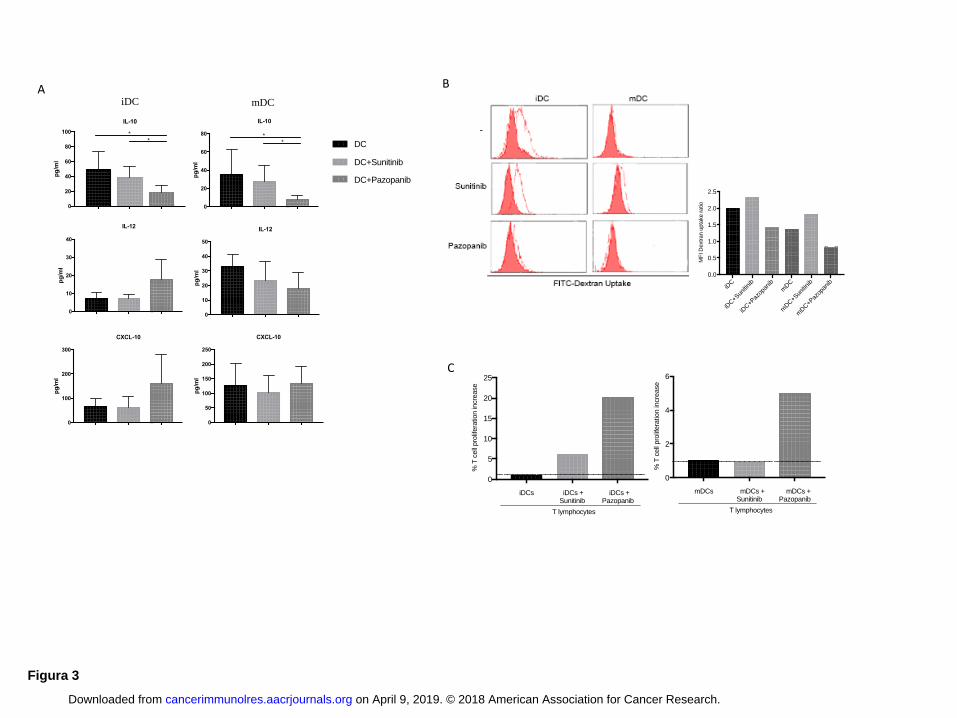
Pazopanib treatment reduces immunosuppression down-regulating IL10 production by DCs
The production of cytokines such as IL10 and IL12 during DC maturation can influence the
capacity of DCs to alter Th1 or Th2 immune responses (17). Several chemokines released by DCs,
such as CXCL-10, promote tumor-reactive effector T-cell recruitment (18). Thus we evaluated
cytokines and chemokines released by untreated DCs and DCs treated with TKIs (Fig. 3A). We
observed a significant reduction (P < 0.05) of IL10 in iDCs and mDCs treated with pazopanib
compared to untreated DCs (both iDC and mDCs) and DCs treated with sunitinib (both iDC and
mDCs). The balance between IL12/IL10 and CXCL-10/IL10 favored immune activation when DCs
were generated with pazopanib (Supplementary Fig. S1B)
Pazopanib-treated DCs are able to increase T-cell activity
DCs must possess specialized features to act as good antigen-presenting cells. In addition to
expression of costimulatory molecules and release of cytokines, other indicators of DC function and
on April 9, 2019. © 2018 American Association for Cancer Research. cancerimmunolres.aacrjournals.org Downloaded from
Author manuscripts have been peer reviewed and accepted for publication but have not yet been edited. Author Manuscript Published OnlineFirst on April 26, 2018; DOI: 10.1158/2326-6066.CIR-17-0594
8
quality include their capacity for endocytosis and T-cell activation. The exposure to maturation
stimuli induces changes including down regulation of endocytosis and increase of antigen
presentation to T cells. We evaluated the endocytic capacity of DCs treated with TKIs and untreated
DCs by fluorescein isothiocyanate (FITC)-dextran uptake and followed by flow cytometry (Fig.
3B). We determined the ratio of the fluorescence from positive (dextran uptake obtained after 2
hours at 37◦C) and negative (dextran uptake after 2 hours at 4°C) samples. The results show that
pazopanib reduced endocytosis capacity by 29% for iDCs treated with pazopanib compared to
untreated DCs (1.42 ratio versus 2, respectively), and by 40% compared to iDCs treated with
sunitinib (1.42 vs 2.33). The trend persisted after maturation: the endocytic capacity of pazopanib-
treated mDCs was 42% lower than that of mDCs (0.8 ratio vs 1.37) and 57% lower than that of
sunitinib-treated mDCs (0.8 vs 1.82).
We then analyzed the capacity of DCs to stimulate the proliferation of allogeneic T cells (Fig. 3C).
Lymphocytes, pretreated with CFSE, were cocultured with DCs and proliferation was evaluated
after 4 days through progressive halving of fluorescence by flow cytometry. The results, plotted as
percentage of fold increase (% of proliferation obtained as ratio between T cells stimulated by
pazopanib-DCs/DCs or sunitinib-DCs/DCs), showed that when DCs were differentiated in the
presence of pazopanib, they acquired a greater capacity to stimulate T cells than either untreated
DCs (20% fold increase for iDCs, 5% for mDCs) or sunitinib-treated DCs (14% for iDC, 5,1% for
mDCs). No effect was observed on T cells cultured alone for up to 24 hours in the presence of
either TKI (Supplementary Fig. S2).
Pazopanib affects DC differentiation by inhibiting p-Erk/-catenin signaling
The Wnt--catenin pathway, particularly in DCs, regulates the balance between tolerance and
immune response (19). Loss of -catenin impairs the ability of DCs to induce Tregs (20), instead
the activation of -catenin pathway increases the capacity of DC to release IL10 and promote
immune tolerance ,(21, 22). In DCs, -catenin signaling synergizes with other pathways, such as the
Erk pathway, to induce anti-inflammatory cytokines and proliferation of Tregs. Erk1/2 signaling
retards the phenotypic and functional maturation of monocyte-derived human DCs (23).
To evaluate whether changes in DC functional activity were due to signaling differences, we
examined DC intracellular pathways. Untreated DCs or DCs differentiated in the presence of
sunitinb or pazopanib were lysed and probed with anti-p-Erk 1/2, anti--catenin and anti-NF-κB by
western blot (Fig. 4). DCs treated with pazopanib expressed less p-Erk 1/2 than did DCs treated
with sunitinib or untreated DCs. This downregulation associated with a significant reduction of -
catenin expression (iDCs and sunitinib-iDCs vs pazopanib-iDCs P < 0.05; mDCs vs pazopanib-
on April 9, 2019. © 2018 American Association for Cancer Research. cancerimmunolres.aacrjournals.org Downloaded from
Author manuscripts have been peer reviewed and accepted for publication but have not yet been edited. Author Manuscript Published OnlineFirst on April 26, 2018; DOI: 10.1158/2326-6066.CIR-17-0594
9
mDCs P < 0.05). In both pazopanib-iDCs and pazopanib-mDCs, p-Erk1,2 and -catenin antibodies
detected a weaker signal than in untreated DCs and DCs treated with sunitinib, suggesting that
pazopanib could act through these pathways. We analyzed the activation of NF-κB, which is
essential for DC development and survival and regulates DC maturation. Results indicated that NF-
κB activation was similar in all iDCs tested. Although the p50 signal was weaker in mDCs treated
with pazopanib, the balance between all intracellular pathways favored the activation pathway.
Modulation of DCs generated from mRCC patients treated with pazopanib or sunitinib
To confirm the pazopanib immune-priming effect in patients, we analyzed monocyte-derived DCs
differentiated from mRCC patients during TKI treatment. DCs were differentiated in vitro by
standard methodology without the addition of TKIs. Fig. 5 shows the phenotype of DCs generated
from PBMCs of RCC patients after one month of pazopanib or sunitinib treatment. CD14, a marker
of DC immaturity, was less expressed in iDCs from patients treated with pazopanib (P < 0.01) than
patients treated with sunitinib confirming data obtained in vitro. Moreover DCs (both iDCs and
mDCs) from pazopanib-treated patients expressed more of the activation markers HLA-DR and
CCR7 and less PD-L1 (mDCs) (P < 0.01) as compared to DCs generated from sunitinib-treated
patients.
For one patient, we evaluated the modulation of some DC markers differentiated before (T0) and
during pazopanib therapy (T1: after 1 month of treatment, T2: after 2 months) and results are shown
in Supplementary Fig. S3A. As with DCs generated in vitro with pazopanib, iDCs from this mRCC
patient in treatment with pazopanib showed increased expression of HLA-DR at T2 and CD40 at T1
and T2. Expression of the co-inhibitory molecule PD-L1 decreased during pazopanib treatment,
both in iDCs and mDCs, confirming that pazopanib boosts DC activity.
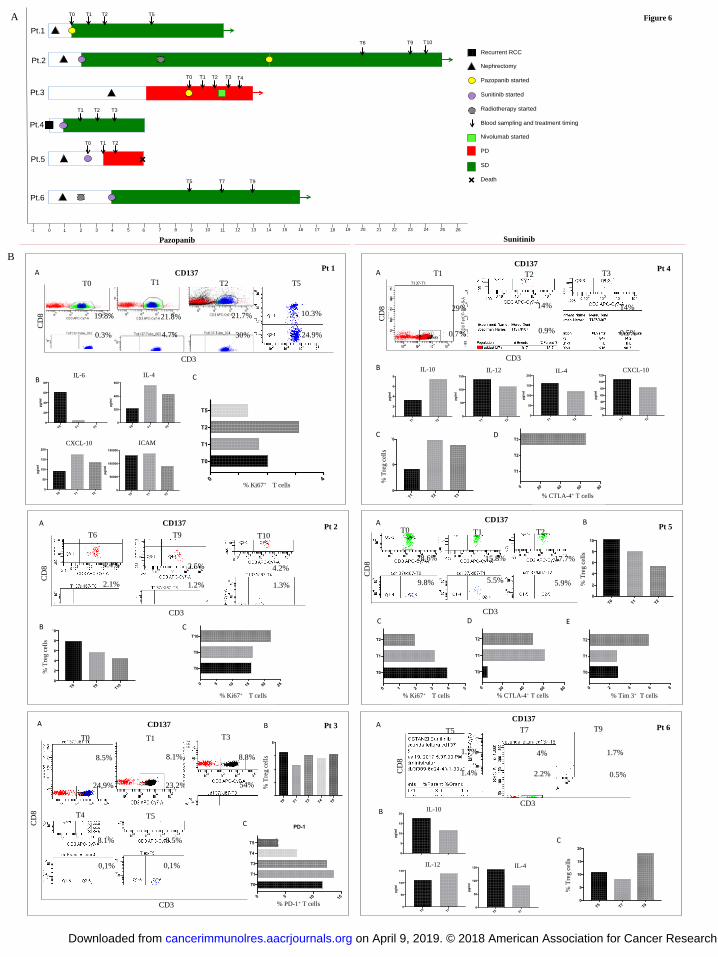
Immune profile of mRCC patients during TKI treatment
The priming of DCs by pazopanib could impact the immune repertoire in the peripheral blood of
mRCC patients. To verify this hypothesis, we followed and monitored longitudinally mRCC
patients undergoing TKI therapy, either pazopanib or sunitinib. Patients had different previous
therapies although all of patients belonged to the same risk group. Six patients in treatment with
TKIs for mRCC underwent peripheral blood sampling at different time points and PBMCs were
isolated and analyzed by flow cytometer in order to investigate the evolution of patients’
immunological profile during TKI administration. The clinical profile and the schedule of blood
sampling is showed in Fig. 6A. Patients 1, 2, and 3 received pazopanib, whereas patients 4, 5, and 6
on April 9, 2019. © 2018 American Association for Cancer Research. cancerimmunolres.aacrjournals.org Downloaded from
Author manuscripts have been peer reviewed and accepted for publication but have not yet been edited. Author Manuscript Published OnlineFirst on April 26, 2018; DOI: 10.1158/2326-6066.CIR-17-0594
10
received sunitinib, The immunoassays were performed when possible at different time points, as
shown in the figure. Two patients (patient 3 and 5) showed progressive disease and one of these
died from the disease. The other four are still in treatment with TKIs.
Several immunological parameters were evaluated for each patient at each time point considering
the limited amount of blood sampling (Fig. 6). In particular, we analyzed T-cell subpopulations,
their activation status (CD137 expression), their proliferation ability as assessed by expression of
Ki67, the immunosuppression as a percentage of Tregs, and T-cell exhaustion as assessed by
expression of checkpoint inhibitors such as PD-1, CTLA-4, and Tim-3. Pro- and anti-inflammatory
cytokines were evaluated in serum of patients. Only the assays for which we had sufficient patient
samples are shown in Fig. 6.
We observed that pazopanib seemed to induce an increased number of CD3+CD137
+ T cells (Fig.
6B). In patient 1, for example, activated (CD137+) CD4
+ T cells were 30% of the activated CD3
+ T
cells at time T2, compared to T0 (before pazopanib therapy, 0.3% of activated CD3+ T cells) and T1
(4.7% of CD3+ T cells). At T5 we observed a decrease of CD4
+ and CD8
+ CD137
+ T-cell
populations. In the same patient, plasma levels of IL6 dropped from T0 to T2, both IL4 and CXCL-
10 increased at T1 and T2, and ICAM decreased at T2. Ki67 expression, a proliferation signal for T
cells, was higher at T2 than at other time points. Patient 2 had fewer CD137+
T cells from time T0
forward. Regulatory T cells decreased during treatment and Ki67+ T cells increased. Patient 3, who
was monitored during pazopanib treatment and immediately after progression, showed
enhancement of CD4+CD137
+ T cells at T3 (54%) compared to T0 (24.9%) and T1 (23.2%). This
population decreased during progression under nivolumab treatment (T4, T5). This patient’s Treg
population was unchanged. PD1+ T cells increased slightly from T0 to T1, then decreased during
pazopanib and nivolumab treatment.
When we analyzed mRCC patients treated with sunitinib, we observed that CD137+ T cells were
less evident, thus suggesting that this population could be influenced by the effect of pazopanib. In
Patient 4, under sunitinb therapy, CD4+CD137
+ T cells were barely detectable at all three time
points. This patient presented with 29% of T cells being CD8+CD137
+ T cells at T1, however this
population decreased to 14% at T2 and T3. In the same patient the serum concentrations of IL10
were increased at T2 compared to T1, whereas serum concentrations of IL12, IL4, and CXCL-10
decreased. In accordance with the increase of IL10, we observed an increase of Treg cells during
sunitinb treatment, accompanied by up-regulation of CTLA-4 expression on T cells at T3. Patient 5
showed a similar decreasing trend in CD137+ T-cell population. Co-inhibitory markers, such as
CTLA-4 and Tim-3, increased during sunitinb treatment. Ki67+ T cells were decreased, and Treg
cells were reduced. Patient 6 presented low and stable fractions of CD137+ T cells during sunitinb
on April 9, 2019. © 2018 American Association for Cancer Research. cancerimmunolres.aacrjournals.org Downloaded from
Author manuscripts have been peer reviewed and accepted for publication but have not yet been edited. Author Manuscript Published OnlineFirst on April 26, 2018; DOI: 10.1158/2326-6066.CIR-17-0594
11
treatment when there timepoints were analyzed, although CD3+CD137
+ T cells doubled at T7. At
the same time IL10 and IL4 decreased compared to T5, and IL12 slightly increased. Tregs
decreased at T7 but increased at T9.
DISCUSSION
RCC is the tumor that has most benefited from clinical use of TKIs. The clear cell histotype
drives VEGF overproduction via inactivation of the tumor-suppressor Hippel-Lindau (VHL) gene
(24, 25). Immune-targeting molecules have added additional possible treatment choices for RCC.
The increase in treatment options has added complexity to clinical questions on how to choose first
line treatment and treatments after recurrence (26). Although VEGF- and mTOR-targeted therapies
have improved clinical outcome in metastatic RCC, durable responses remain rare despite efforts to
design sequential or combined treatment modalities.
RCC is been considered an immunogenic tumor and therapy with cytokines such as IL2 and
IFN has been used although the responses have been mild and associated with toxicity. Long term
responses and complete remissions have been occasionally observed in mRCC patients treated with
immunotherapy (27, 28). The induction of an immune response such as the one elicited by the
multipeptide IMA901 vaccine was associated with a clinical benefit. Over the next decade,
immunotherapy trials in kidney cancer will focus on learning how to combine PD-1/PD-L1
inhibitors with immune modifying agents such as those targeting the VEGF pathway (29, 30).
In this scenario, and with the possibility to introduce the immune checkpoint inhibitors in
RCC patient treatment, we must consider the impact of TKIs on the immune system of the patient.
TKIs currently approved for first line treatment of mRCC inhibit tumor cell growth and
angiogenesis but also show immune-regulatory effects. How these immune effects impact
subsequent immune-targeted therapies and affect treatment outcome needs to be understood.
Several molecules and immune cell types are involved in the interaction between the growing tumor
and the immune system. The balance between immunosuppression and immune activation dictates
to some extent the prognosis and the response to treatment, particularly for immune-based
treatments. Several biomarkers and or immune-molecular portraits have been studied in the attempt
to identify responder patients, such as those who most likely will benefit from anti-PD-L1 treatment
(31). One of the mechanism of tumor silencing of immunity involves DCs, the main orchestrators of
the immune system (32, 33). DCs in the tumor microenvironment may be tolerized and therefore
unable to present tumor antigens or unable to present antigens in the appropriate setting within a
costimulatory background. Several molecules released by the tumor can induce this freezing effect
on April 9, 2019. © 2018 American Association for Cancer Research. cancerimmunolres.aacrjournals.org Downloaded from
Author manuscripts have been peer reviewed and accepted for publication but have not yet been edited. Author Manuscript Published OnlineFirst on April 26, 2018; DOI: 10.1158/2326-6066.CIR-17-0594
12
(34, 35). VEGF is one of them and this mechanism has been well characterized in RCC (36). The
immediate consequence of induction of tolerogenic DCs will be the lack of T-cell infiltration,
particularly tumor-specific T cells that represent the target for ICI immunotherapy.
Results reported in this paper show that the TKI pazopanib could potentiate and differentiate
human DCs. Immature and mature DCs showed increased expression of HLA-DR, CCR7, CD40.
PD-L1 decreased in the DCs after maturation, as compared to untreated mature DC or DC
differentiated in the presence of sunitinib. PD-L1 was expressed in microvesicles released by DCs
confirming the role of cell particles in delivering remote signaling (37). The phenotypic changes
observed in the pazopanib-treated DCs were accompanied with biological behavior consistent with
an immunopriming effect. IL10 production was reduced, whereas IL12 and CXCL10 production
increased. The process of endocytosis was reduced as well, and amplified MLRs indicated an
overall acquisition of immunogenicity by DCs.
DCs are the critical cells in immune activation as they are responsible for antigen
processing/presentation, cross-priming and trafficking to the lymph nodes (38, 39). The pazopanib
in vitro and in vivo "treated" DCs, both from donors and from patients, have all these hallmarks.
Sunitinib, another TKI used in mRCC treatment, did not have the effects on DC differentiation as
have been described by others (11). Sunitinib and pazopanib have a similar pattern of receptor
recognition but display different affinities for VEGF-R1, which could explain the diversity of
immune modulation effect (12). In particular, sunitinib affects the immunosuppressive repertoire,
Treg and MSDC, in RCC patients. The two drugs appear, however, to be similar in terms of clinical
outcome when used in first line therapy in mRCC (40, 41). Immunologically this could be
explained by arguing that one (pazopanib) is more active in the rescue of DC from a tolerogenic
state, inducing activation signals, whereas the other (sunitinib) is more efficient in making space for
the antitumor effector cells by eliminating immunosuppression in the microenvironment.
The consequences of receptor inhibition were studied in the pazopanib-treated DC, as we
investigated the signal transduction involved. We found that Erk signaling was shut down, leading
to downregulation of -catenin. Wnt/-catenin signaling plays a role in cell differentiation,
proliferation, survival, and immune cell function. In tumors, the Wnt/-catenin pathway is
activated in DCs leading to immune tolerance and immune evasion. This results in suppression of
effector T cells and recruitment of Treg cells. Increased Wnt ligands released in the tumor
microenvironment activate -catenin signaling in DCs, resulting in production of IL10 and
induction of tumor tolerance (22). In melanoma, intrinsic activation of the Wnt/-catenin pathway
correlates with absence of T cells in the microenvironment (42). The same pathway is involved in
bladder cancers, generating the non-T cell–inflamed tumors that represent most cases in which
on April 9, 2019. © 2018 American Association for Cancer Research. cancerimmunolres.aacrjournals.org Downloaded from
Author manuscripts have been peer reviewed and accepted for publication but have not yet been edited. Author Manuscript Published OnlineFirst on April 26, 2018; DOI: 10.1158/2326-6066.CIR-17-0594
13
tumors are unresponsive to ICI therapy (43). A DC subtype is enriched in RCC that expresses
CD14, high TNF- and low CXCL-10, which is responsible for preventing a T-cell infiltrate from
mediating antitumor functions (35). Indeed, the presence of circulating, intratumoral, and
peritumoral CD14+ cells was a prognostic factor for decreased survival in a cohort of 375 RCC
patients (44).
Pazopanib can therefore have an antagonistic effect in the tumor, releasing DCs from the
tolerogenic/immature/CD14+ state and tentatively restoring antitumor immune activation. The goal
of such therapy is to turn cold tumors into hot tumors, which would be more responsive to ICI
therapy. To understand if pazopanib treatment could indeed exert this effect in vivo, we utilized two
different approaches. First, we selected CD14+ cells from peripheral blood of mRCC patients during
treatment with pazopanib or sunitinib. The immune-priming effect of pazopanib in DCs was
confirmed. DCs derived from mRCC patients in treatment with sunitinib expressed high amounts of
CD14+ marker and PD-L1. This may suggest no effect by sunitinib on the DCs that remain in a
more immature state as seen in other cancer patients (44).
The second approach was to longitudinally follow and monitor mRCC patients undergoing
TKI therapy. This was not a homogeneous patient population since patients had different previous
therapies, although all of them belong to the same risk group. Nevertheless we wanted to assess if
we could detect immunological changes in the peripheral blood that could be associated with
pazopanib treatment. Various conclusions are supported although results are preliminary. First,
patients 1, 2, and 3 who received pazopanib showed a CD137+ T-cell population. Patient 1
presented an ideal setting to study the effect of pazopanib in vivo since this patient had no previous
possibly confounding therapy. Patient 2 had a recent radiotherapy to control bone pain, which might
have influenced the immune system (45). Patient 3 is the only patient we have monitored during
anti-PD-1 nivolumab treatment. This patient had a drop of CD137+
CD4+
T-cell population at time
T4 and T5 just after treatment with ICIs for progression. PD-1 expression also decreased. This
could be explained by recruitment of exhausted T cells to the tumor or by difficulty in detecting
PD-1 cells due to the covering of the circulating nivolumab antibody.
CD137 (4-1BB, a member of the TNF-receptor family) is considered a biomarker of tumor-
reactive cells. The signaling with its ligand or an agonistic antibody promotes expansion of T cells,
sustains survival and enhances cytolytic function. This marker has been used to select tumor-
specific T cells and can be upregulated in an antigen-dependent fashion (46, 47). Agonist antibodies
recognizing the CD137 receptor are part of the vast repertoire of immune-modulatory antibodies
being prepared for the clinic. The Treg population was unchanged or diminished in all mRCC
patients. Immune monitoring on patient 4, the only patient with recurrent mRCC we tested, showed
on April 9, 2019. © 2018 American Association for Cancer Research. cancerimmunolres.aacrjournals.org Downloaded from
Author manuscripts have been peer reviewed and accepted for publication but have not yet been edited. Author Manuscript Published OnlineFirst on April 26, 2018; DOI: 10.1158/2326-6066.CIR-17-0594
14
the worst-case scenario during sunitinib treatment, characterized by no CD137+ T cells, high IL10,
high percentages of Treg, low IL12, and upregulation of CTLA-4 at 3 months of therapy.
The other consideration is the upregulation of checkpoint inhibition markers on T cells as a sign of
T-cell exhaustion. This evaluation is relevant for clinical decisions since ICI are proposed as second
line therapies for mRCC after TKIs. We saw upregulation of CTLA-4 early in 2 of 3 sunitinib-
treated patients. In patient 5, we observed upregulation of both CTLA-4 and Tim-3. This patient
progressed rapidly and died from the disease.
Pazopanib can have an immunological effect as early as the second month of treatment. Our
experience with ICIs showed that immune modifications can happen sooner than their impact on the
tumor becomes evident (48). Our data is part of an ever-evolving clinical arena. CheckMate 214, a
phase 3, randomized, open-label study evaluating the combination of nivolumab (anti-PD1) plus
ipilimumab (anti-CTLA-4) versus sunitinib in patients with previously untreated advanced or
mRCC, showed improved OS, ORR, and PFS in the nivolumab plus ipilimumab group in
intermediate/poor risk patients, with the greatest improvements in those with PD-L1 expression on
≥ 1% of biopsied tumor cells. These data suggest that ICIs could be used as front-line treatment in
mRCC even though only the knowledge of the biological and immunological features of the tumor
and patient could indicate the best individual sequence/combination of treatment.
In this context we are recruiting mRCC patients with no previous therapies and collecting
tumor specimens to confirm the immunological observations that we observed from this preliminary
study. Longitudinal study methods combined with an individualized approach based on the
immunological fitness of the patient hold the greatest likelihood of clinical success. Confounding
influences that might affect the immune status of the patient, such as other therapies, could limit our
understanding of the activity and efficacy of the immune-modulating agents we wish to study.
In conclusion, the immune-priming effects of pazopanib open therapeutic avenues for this TKI in
the mRCC and probably for other cancers. Variations of treatment sequences, schedules, doses, and
combinations with other TKIs or immunotherapy compounds or vaccines should be tested, taking
into account the immunological effects of TKIs and the updated insights into oncology and the
interactive tumor microenvironment.
Grant Support
This work was supported by Associazione Italiana per la Ricerca sul Cancro (MN: AIRC/2015),
Ricerche Universitarie (MN: Sapienza University 2015; IGZ: Sapienza University “Start up” 2016).
Acknowledgements
on April 9, 2019. © 2018 American Association for Cancer Research. cancerimmunolres.aacrjournals.org Downloaded from
Author manuscripts have been peer reviewed and accepted for publication but have not yet been edited. Author Manuscript Published OnlineFirst on April 26, 2018; DOI: 10.1158/2326-6066.CIR-17-0594
15
The authors would like to thank Mr. Alessio Ugolini and Dr. Alessandra Di Filippo for their
support.
References
1. Jain RK. Antiangiogenesis Strategies Revisited: From Starving Tumors to Alleviating
Hypoxia. Cancer Cell. 2014;26:605–22.
2. Choueiri TK, Escudier B, Powles T, et al. Cabozantinib versus everolimus in advanced renal-
cell carcinoma. N Engl J Med 2015; 373(19): 1814–1823.
3. Terme M, Colussi O, Marcheteau E, Tanchot C, Tartour E, Taieb J. Modulation of immunity
by antiangiogenic molecules in cancer. Clin. Dev. Immunol. 2012.
4. Cascinu S. Sunitinib, pazopanib or sorafenib for the treatment of patients with late relapsing
metastatic renal cell carcinoma. J Urol. 2015;193:41–7.
5. Bueno MJ, Mouron S, Quintela-Fandino M. Personalising and targeting antiangiogenic
resistance: a complex and multifactorial approach. Br J Cancer. 2017;116:1119–25.
6. Draghiciu O, Nijman HW, Hoogeboom BN, Meijerhof T, Daemen T. Sunitinib depletes
myeloid-derived suppressor cells and synergizes with a cancer vaccine to enhance antigen-
specific immune responses and tumor eradication. Oncoimmunology. 2015;4:e989764.
7. Adotevi O, Pere H, Ravel P, Haicheur N, Badoual C, Merillon N, et al. A decrease of
regulatory T cells correlates with overall survival after sunitinib-based antiangiogenic
therapy in metastatic renal cancer patients. J Immunother. 2010;33:991–8.
8. Alfaro C, Suarez N, Gonzalez A, Solano S, Erro L, Dubrot J, et al. Influence of bevacizumab,
sunitinib and sorafenib as single agents or in combination on the inhibitory effects of VEGF
on human dendritic cell differentiation from monocytes. Br J Cancer. 2009;100:1111–9.
9. Finke JH, Rini B, Ireland J, Rayman P, Richmond A, Golshayan A, et al. Sunitinib reverses
type-1 immune suppression and decreases T-regulatory cells in renal cell carcinoma patients.
Clin Cancer Res. 2008;14:6674–82.
10. Yuan H, Cai P, Li Q, Wang W, Sun Y, Xu Q, et al. Axitinib augments antitumor activity in
renal cell carcinoma via STAT3-dependent reversal of myeloid-derived suppressor cell
accumulation. Biomed Pharmacother. 2014;68:751–6.
11. Hipp MM, Hilf N, Walter S, Werth D, Brauer KM, Radsak MP, et al. Sorafenib, but not
sunitinib, affects function of dendritic cells and induction of primary immune responses.
Blood. 2008;111:5610–20.
12. Kumar R, Crouthamel M-C, Rominger DH, Gontarek RR, Tummino PJ, Levin RA, et al.
Myelosuppression and kinase selectivity of multikinase angiogenesis inhibitors. Br J Cancer.
2009;101:1717–23.
13. Escudier B, Sharma P, McDermott DF, George S, Hammers HJ, Srinivas S, et al. CheckMate
025 Randomized Phase 3 Study: Outcomes by Key Baseline Factors and Prior Therapy for
Nivolumab Versus Everolimus in Advanced Renal Cell Carcinoma. Eur Urol. 2017;
14. Pulendran B. The Varieties of Immunological Experience: Of Pathogens, Stress, and
Dendritic Cells. Annu Rev Immunol. 2015;33:563–606.
15. Palucka K, Banchereau J. Cancer immunotherapy via dendritic cells. Nat Rev Cancer.
2012;12:265–77.
16. Steinman RM. Some interfaces of dendritic cell biology. Apmis. 2003;111:675–97.
17. Moser M, Murphy KM. Dendritic cell regulation of TH1-TH2 development. Nat Immunol.
2000;1:199–205.
18. Pfirschke C, Siwicki M, Liao H-W, Pittet MJ. Tumor Microenvironment: No Effector T
Cells without Dendritic Cells. Cancer Cell. 2017;31:614–5.
19. Swafford D, Manicassamy S. Wnt signaling in dendritic cells: its role in regulation of
immunity and tolerance. Discov Med. 2015;19:303–10.
on April 9, 2019. © 2018 American Association for Cancer Research. cancerimmunolres.aacrjournals.org Downloaded from
Author manuscripts have been peer reviewed and accepted for publication but have not yet been edited. Author Manuscript Published OnlineFirst on April 26, 2018; DOI: 10.1158/2326-6066.CIR-17-0594
16
20. Hong Y, Manoharan I, Suryawanshi A, Majumdar T, Angus-Hill ML, Koni PA, et al. β-
catenin promotes regulatory T-cell responses in tumors by inducing vitamin a metabolism in
dendritic cells. Cancer Res. 2015;75:656–65.
21. Manoharan I, Hong Y, Suryawanshi A, Angus-Hill ML, Sun Z, Mellor AL, et al. TLR2-
Dependent Activation of β-Catenin Pathway in Dendritic Cells Induces Regulatory
Responses and Attenuates Autoimmune Inflammation. J Immunol. 2014;193:4203–13.
22. Shan MM, Gentile M, Yeiser JR, Walland AC, Bornstein VU, Chen K, et al. Mucus
enhances gut homeostasis and oral tolerance by delivering immunoregulatory signals.
Science. 2013; 342:447–53.
23. Puig-Kroger A, Relloso M, Fernandez-Capetillo O, Zubiaga A, Silva A, Bernabeu C, et al.
Extracellular signal-regulated protein kinase signaling pathway negatively regulates the
phenotypic and functional maturation of monocyte-derived human dendritic cells. Blood.
2001;98:2175–82.
24. Capitanio U, Montorsi F. Renal cancer. Lancet. 2016. page 894–906.
25. Wizigmann-Voos S, Breier G, Risau W, Plate KH. Up-regulation of vascular endothelial
growth factor and its receptors in von Hippel-Lindau disease-associated and sporadic
hemangioblastomas. Cancer Res. 1995;55:1358-64.
26. Choueiri TK, Motzer RJ. Systemic Therapy for Metastatic Renal-Cell Carcinoma. N Engl J
Med. 2017;376:354–66.
27. Laudano MA, Klafter FE, Katz M, McCann TR, Desai M, Benson MC, et al. Pathological
tumour diameter predicts risk of conventional subtype in small renal cortical tumours. BJU
Int. 2008;102:1385–8.
28. Rini BI, Stenzl A, Zdrojowy R, Kogan M, Shkolnik M, Oudard S, et al. IMA901, a
multipeptide cancer vaccine, plus sunitinib versus sunitinib alone, as first-line therapy for
advanced or metastatic renal cell carcinoma (IMPRINT): a multicentre, open-label,
randomised, controlled, phase 3 trial. Lancet Oncol. 2016;17:1599–611.
29. Brahmer JR, Drake CG, Wollner I, Powderly JD, Picus J, Sharfman WH, et al. Phase I study
of single-agent anti-programmed death-1 (MDX-1106) in refractory solid tumors: Safety,
clinical activity, pharmacodynamics, and immunologic correlates. J Clin Oncol.
2010;28:3167–75.
30. Topalian SL, Hodi FS, Brahmer JR, Gettinger SN, Smith DC, McDermott DF, et al. Safety,
Activity, and Immune Correlates of Anti–PD-1 Antibody in Cancer. N Engl J Med.
2012;366:2443–54.
31. Massari F, Santoni M, Ciccarese C, Santini D, Alfieri S, Martignoni G, et al. PD-1 blockade
therapy in renal cell carcinoma: Current studies and future promises. Cancer Treat. Rev.
2015. page 114–21.
32. Banchereau J, Steinman RM. Dendritic cells and the control of immunity. Nature.
1998;392:245–52.
33. Hanks BA. Immune Evasion Pathways and the Design of Dendritic Cell- based Cancer
Vaccines. Discov Med. 2016;21:135–42.
34. Gabrilovich DI, Chen HL, Girgis KR, Cunningham HT, Meny GM, Nadaf S, et al.
Production of vascular endothelial growth factor by human tumors inhibits the functional
maturation of dendritic cells. Nat Med. 1996;2:1096–103.
35. Noessner E, Brech D, Mendler AN, Masouris I, Schlenker R, Prinz PU. Intratumoral
alterations of dendritic-cell differentiation and CD8(+) T-cell anergy are immune escape
mechanisms of clear cell renal cell carcinoma. Oncoimmunology. 2012;1:1451–3.
36. Li C, Liu B, Dai Z, Tao Y. Knockdown of VEGF receptor-1 (VEGFR-1) impairs
macrophage infiltration, angiogenesis and growth of clear cell renal cell carcinoma (CRCC).
Cancer Biol Ther. 2011; 12: 872-80.
37. Rughetti A, Rahimi H, Belleudi F, Napoletano C, Battisti F, Zizzari IG, et al. Microvesicle
Cargo of Tumor-Associated MUC1 to Dendritic Cells Allows Cross-presentation and
on April 9, 2019. © 2018 American Association for Cancer Research. cancerimmunolres.aacrjournals.org Downloaded from
Author manuscripts have been peer reviewed and accepted for publication but have not yet been edited. Author Manuscript Published OnlineFirst on April 26, 2018; DOI: 10.1158/2326-6066.CIR-17-0594
17
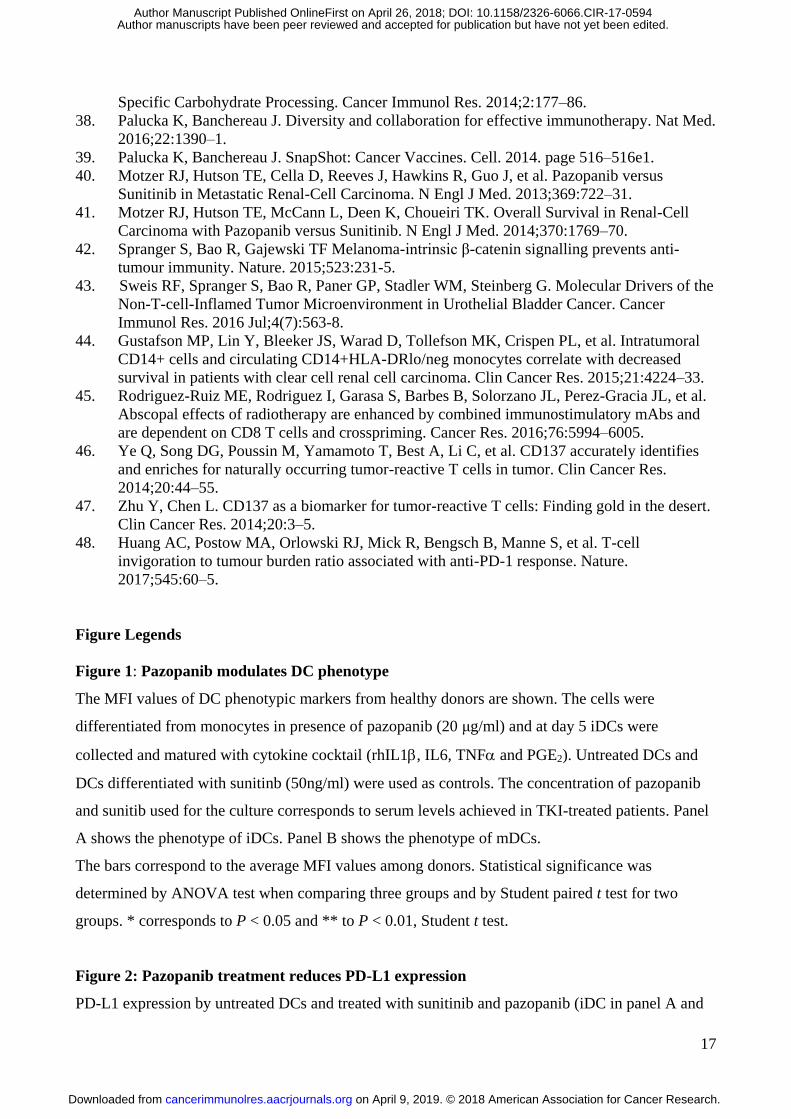
Specific Carbohydrate Processing. Cancer Immunol Res. 2014;2:177–86.
38. Palucka K, Banchereau J. Diversity and collaboration for effective immunotherapy. Nat Med.
2016;22:1390–1.
39. Palucka K, Banchereau J. SnapShot: Cancer Vaccines. Cell. 2014. page 516–516e1.
40. Motzer RJ, Hutson TE, Cella D, Reeves J, Hawkins R, Guo J, et al. Pazopanib versus
Sunitinib in Metastatic Renal-Cell Carcinoma. N Engl J Med. 2013;369:722–31.
41. Motzer RJ, Hutson TE, McCann L, Deen K, Choueiri TK. Overall Survival in Renal-Cell
Carcinoma with Pazopanib versus Sunitinib. N Engl J Med. 2014;370:1769–70.
42. Spranger S, Bao R, Gajewski TF Melanoma-intrinsic β-catenin signalling prevents anti-
tumour immunity. Nature. 2015;523:231-5.
43. Sweis RF, Spranger S, Bao R, Paner GP, Stadler WM, Steinberg G. Molecular Drivers of the
Non-T-cell-Inflamed Tumor Microenvironment in Urothelial Bladder Cancer. Cancer
Immunol Res. 2016 Jul;4(7):563-8.
44. Gustafson MP, Lin Y, Bleeker JS, Warad D, Tollefson MK, Crispen PL, et al. Intratumoral
CD14+ cells and circulating CD14+HLA-DRlo/neg monocytes correlate with decreased
survival in patients with clear cell renal cell carcinoma. Clin Cancer Res. 2015;21:4224–33.
45. Rodriguez-Ruiz ME, Rodriguez I, Garasa S, Barbes B, Solorzano JL, Perez-Gracia JL, et al.
Abscopal effects of radiotherapy are enhanced by combined immunostimulatory mAbs and
are dependent on CD8 T cells and crosspriming. Cancer Res. 2016;76:5994–6005.
46. Ye Q, Song DG, Poussin M, Yamamoto T, Best A, Li C, et al. CD137 accurately identifies
and enriches for naturally occurring tumor-reactive T cells in tumor. Clin Cancer Res.
2014;20:44–55.
47. Zhu Y, Chen L. CD137 as a biomarker for tumor-reactive T cells: Finding gold in the desert.
Clin Cancer Res. 2014;20:3–5.
48. Huang AC, Postow MA, Orlowski RJ, Mick R, Bengsch B, Manne S, et al. T-cell
invigoration to tumour burden ratio associated with anti-PD-1 response. Nature.
2017;545:60–5.
Figure Legends
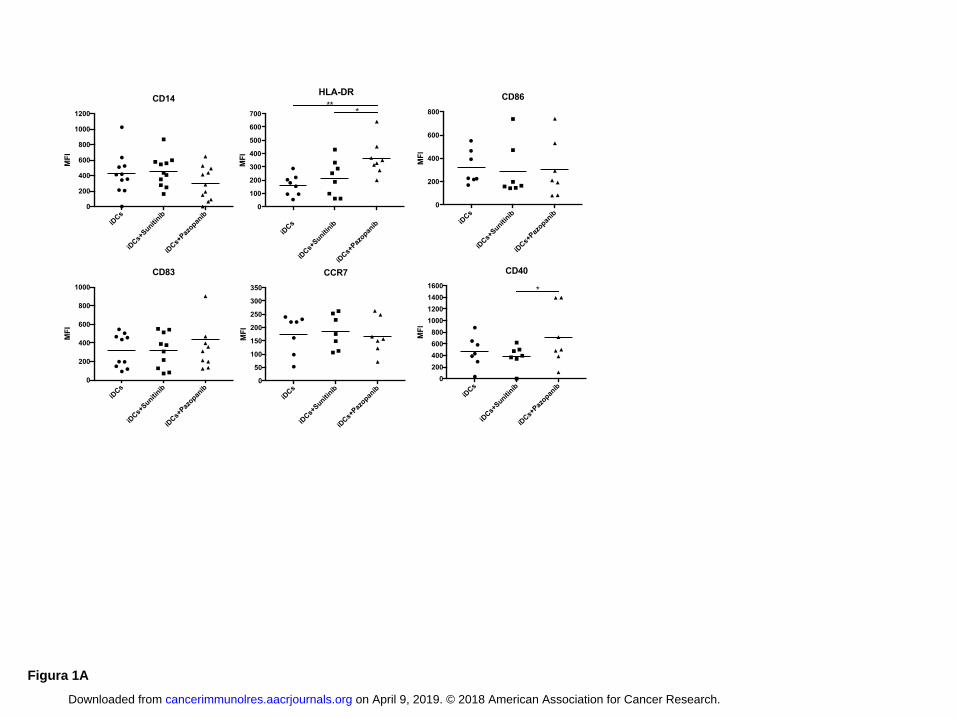
Figure 1: Pazopanib modulates DC phenotype
The MFI values of DC phenotypic markers from healthy donors are shown. The cells were
differentiated from monocytes in presence of pazopanib (20 μg/ml) and at day 5 iDCs were
collected and matured with cytokine cocktail (rhIL1, IL6, TNF and PGE2). Untreated DCs and
DCs differentiated with sunitinb (50ng/ml) were used as controls. The concentration of pazopanib
and sunitib used for the culture corresponds to serum levels achieved in TKI-treated patients. Panel
A shows the phenotype of iDCs. Panel B shows the phenotype of mDCs.
The bars correspond to the average MFI values among donors. Statistical significance was
determined by ANOVA test when comparing three groups and by Student paired t test for two
groups. * corresponds to P < 0.05 and ** to P < 0.01, Student t test.
Figure 2: Pazopanib treatment reduces PD-L1 expression
PD-L1 expression by untreated DCs and treated with sunitinib and pazopanib (iDC in panel A and
on April 9, 2019. © 2018 American Association for Cancer Research. cancerimmunolres.aacrjournals.org Downloaded from
Author manuscripts have been peer reviewed and accepted for publication but have not yet been edited. Author Manuscript Published OnlineFirst on April 26, 2018; DOI: 10.1158/2326-6066.CIR-17-0594
18
mDC in panel B). Data are reported as values of MFI and the bars correspond to average of these
values. (C) Microvesicles released by DCs and analyzed by flow cytometry are represented on
forward scatter/side scatter dot plot. The histogram shows the expression of PD-L1 in terms of MFI
on microvesicles obtained by untreated DCs (black columns), by DCs differentiated with sunitinib
(light grey column) and by DCs differentiated with pazopanib (dark grey column). ANOVA test
was used to compare three groups. Student’s paired t-test for two groups. * P < 0.05, ** P < 0.01,
Student t test.
Figure 3: DCs activated by pazopanib modulate cytokine and chemokine release, reduce
endocytic capacity and increase T-cell proliferation.
(A) The amount of IL10, IL12 and CXCL-10 were evaluated in differently generated DC
supernatant by Luminex multiplex beads analysis. The results correspond to the mean obtained
from ten independent experiments ± SD. (B) The endocytic capacity of iDCs and mDCs differently
generated was evaluated as FITC-dextran uptake (1mg/mL/106 cells). Open histograms represent
the dextran uptake obtained after 2 h at 37◦C (positive), whereas filled histograms show the dextran
endocytosis after 2 h at 4◦C (negative control). Results are representative of one donor out of four.
The values reported on histogram indicate the ratio between MFI of positive and negative control of
four independent experiments for each DC condition. (C) The capacity of DCs to prime allogenic T-
cell response in vitro was tested evaluating T-cell proliferation ability through progressive halving
of CFSE fluorescence using FACSCanto flow cytometry. Results are reported as % of increase of
T-cell proliferation capacity of three independent experiments of DCs treated with pazopanib
compared to sunitinib-differentiated DCs and untreated DCs.
ANOVA test was used to compare three groups. Student paired t test for two groups. * P < 0.05.
Figure 4: Pazopanib modulates DC signaling turning off p-Erk/-catenin pathway
Western blotting of iDCs (left) and mDCs (right) untreated and generated in presence of sunitinb
and pazopanib. Samples were analyzed for p-Erk 1/2 (42–44 kDa), -catenin and for the presence
of NF-B. β-actin was used as a loading control. Proteins were resolved in 4-12% SDS-PAGE gel.
Densitometric evaluation of the signals for β-catenin, p-Erk1/2 and p50 were normalized to the
levels of β-actin (under the blot). ANOVA test was used to compare three groups. Student’s paired
t-test for two groups. * P < 0.05.
Figure 5: DC phenotype obtained from TKI-treated patients
Comparison of iDCs and mDCs at T1 of pazopanib (black column) and sunitinib (grey column)
on April 9, 2019. © 2018 American Association for Cancer Research. cancerimmunolres.aacrjournals.org Downloaded from
Author manuscripts have been peer reviewed and accepted for publication but have not yet been edited. Author Manuscript Published OnlineFirst on April 26, 2018; DOI: 10.1158/2326-6066.CIR-17-0594
19
treatment. Data are reported as values of MFI ± SD. Statistical significance was determined by
Student paired t test. * corresponds to P < 0.05 and ** to P < 0.01.
Figure 6: Immunological profile of six mRCC patients during TKI treatment
A) Swimmer Plot showing the clinical history and the blood sampling of six mRCC patients:
Patients 1, 2 and 3 treated with pazopanib, patients 4, 5 and 6 with sunitinib. B) Immunological
analysis performed on PBMCs and sera collected from blood samples for each patient. Sera were
used to evaluate cytokines and chemokines released during TKIs treatment and analyzed by
Luminex multiplex beads. Immune cell subpopulations were monitored by flow cytometer and
analyzed to FACSDiva Software. To analyze CD137+
T cells, lymphocytes were first gated on FSC-
A and SSC-A, then the CD3+
T-cell subpopulation was selected on lymphocytes. These
CD137+CD3
+ T cells were then selected and analyzed for CD4 and CD8 (gating scheme in
Supplementary Fig. S3B).
on April 9, 2019. © 2018 American Association for Cancer Research. cancerimmunolres.aacrjournals.org Downloaded from
Author manuscripts have been peer reviewed and accepted for publication but have not yet been edited. Author Manuscript Published OnlineFirst on April 26, 2018; DOI: 10.1158/2326-6066.CIR-17-0594
iDCs
iDCs+Sunitinib
iDCs+Pazopanib
0
200
400
600
800
1000
1200
MFI
CD14
iDCs
iDCs+Sunitinib
iDCs+Pazopanib
0
100
200
300
400
500
600
700
MFI
***
iDCs
iDCs+Sunitinib
iDCs+Pazopanib
0
200
400
600
800
MFI
CD86
iDCs
iDCs+Sunitinib
iDCs+Pazopanib
0
200
400
600
800
1000
MFI
CD83
iDCs
iDCs+Sunitinib
iDCs+Pazopanib
0
50
100
150
200
250
300
350
MFI
CCR7
iDCs
iDCs+Sunitinib
iDCs+Pazopanib
0
200
400
600
800
1000
1200
1400
1600
MFI
CD40
*
Figura 1A
iDC
iDC+Sunitinib
iDC+Pazopanib
0
200
400
600
MFI
HLA-DR
***
on April 9, 2019. © 2018 American Association for Cancer Research. cancerimmunolres.aacrjournals.org Downloaded from
Author manuscripts have been peer reviewed and accepted for publication but have not yet been edited. Author Manuscript Published OnlineFirst on April 26, 2018; DOI: 10.1158/2326-6066.CIR-17-0594
mDCs
mDCs+Sunitinib
mDCs+Pazopanib
0
200
400
600
800
1000
MFI
CD14
mDCs
mDCs+Sunitinib
mDCs+Pazopanib
0
250
500
750
1000
1250
1500
MFI
HLA-DR
mDCs
mDCs+Sunitinib
mDCs+Pazopanib
0
4000
8000
12000
16000
MFI
CD83
mDCs
mDCs+Sunitinib
mDCs+Pazopanib
0
1000
2000
3000
4000
MFI
CD86
mDCs
mDCs+Sunitinib
mDCs+Pazopanib
0
500
1000
1500
2000
2500
CCR7
MFI
**
mDCs
mDCs+Sunitinib
mDCs+Pazopanib
0
1000
2000
3000
4000
MFI
CD40
*
Figura 1B
on April 9, 2019. © 2018 American Association for Cancer Research. cancerimmunolres.aacrjournals.org Downloaded from
Author manuscripts have been peer reviewed and accepted for publication but have not yet been edited. Author Manuscript Published OnlineFirst on April 26, 2018; DOI: 10.1158/2326-6066.CIR-17-0594
mDC
mDC+S
unitinib
mDC+P
azopan
ib
0
5000
10000
15000
20000
MF
I
PD-L1**
**
iDCs
iDCs+
Suniti
nib
iDCs+
Paz
opanib
0
1000
2000
3000
4000
5000
6000
MF
I
PD-L1A B
C
Figura 2
iDC
iDC+S
unitinib
iDC+P
azopan
ib
mDC
mDC+S
unitinib
mDC+P
azopan
ib
0
2000
4000
6000
PD
-L1 M
FI
*
on April 9, 2019. © 2018 American Association for Cancer Research. cancerimmunolres.aacrjournals.org Downloaded from
Author manuscripts have been peer reviewed and accepted for publication but have not yet been edited. Author Manuscript Published OnlineFirst on April 26, 2018; DOI: 10.1158/2326-6066.CIR-17-0594
DC+Pazopanib
DC+Sunitinib
DC
0
20
40
60
80
100
pg
/ml
IL-10
**
0
20
40
60
80
pg
/ml
IL-10
**
0
10
20
30
40
pg
/ml
IL-12
0
10
20
30
40
50
pg
/ml
IL-12
0
100
200
300
pg
/ml
CXCL-10
0
50
100
150
200
250
pg
/ml
CXCL-10
Figura 3
B
C
0
2
4
6
% T
cell
pro
lifera
tion in
cre
ase
mDCs mDCs +Sunitinib
mDCs +Pazopanib
T lymphocytes
0
5
10
15
20
25
% T
cell
pro
lifera
tion in
cre
ase
iDCs iDCs +Sunitinib
iDCs +Pazopanib
T lymphocytes
iDC
iDC+S
unitinib
iDC+P
azop
anib
mDC
mDC+S
unitinib
mDC+P
azop
anib
0.0
0.5
1.0
1.5
2.0
2.5
MF
I D
extr
an u
pta
ke r
atio
AiDC mDC
on April 9, 2019. © 2018 American Association for Cancer Research. cancerimmunolres.aacrjournals.org Downloaded from
Author manuscripts have been peer reviewed and accepted for publication but have not yet been edited. Author Manuscript Published OnlineFirst on April 26, 2018; DOI: 10.1158/2326-6066.CIR-17-0594
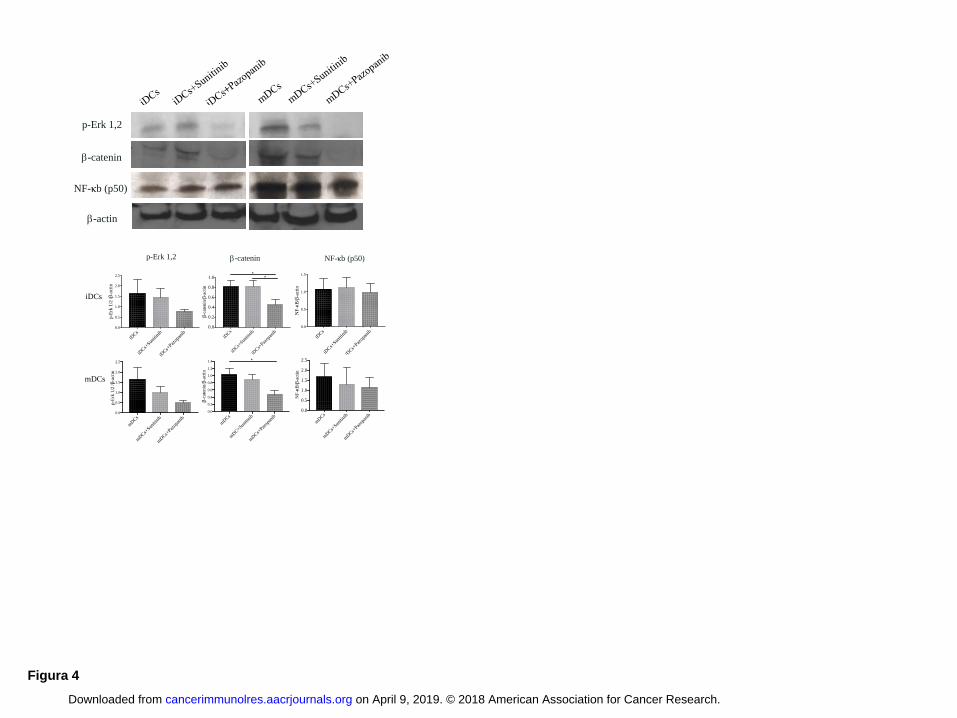
Figura 4
p-Erk 1,2 b-catenin NF-κb (p50)
iDCs
mDCs
iDCs
iDCs+
Suniti
nib
iDCs+
Pazop
anib
0.0
0.5
1.0
1.5
2.0
2.5
p-E
rk 1
/2 /b
-act
in
iDCs
iDCs+
Suniti
nib
iDCs+
Pazop
anib
0.0
0.2
0.4
0.6
0.8
1.0
b-c
aten
in/b
-act
in
**
iDCs
iDCs+
Suniti
nib
iDCs+
Pazop
anib
0.0
0.5
1.0
1.5
NF
-kB
/b-a
ctin
mD
Cs
mD
Cs+
Suniti
nib
mD
Cs+
Pazop
anib
0.0
0.5
1.0
1.5
2.0
2.5
p-E
rk 1
/2 /b
-act
in
mD
Cs
mD
C+Sun
itini
b
mD
Cs+
Pazop
anib
0.0
0.2
0.4
0.6
0.8
1.0
1.2
1.4
b-c
aten
in/b
-act
in
*
mD
Cs
mD
Cs+
Suniti
nib
mD
Cs+
Pazop
anib
0.0
0.5
1.0
1.5
2.0
2.5
NF
-kB
/b-a
ctin
p-Erk 1,2
b-actin
NF-κb (p50)
b-catenin
Figura 4
p-Erk 1,2 b-catenin Nf-κb (p50)
iDCs
mDCs
p-Erk 1,2
b-actin
Nf-κb (p50)
b-catenin
iDCs
iDCs+
Suniti
nib
iDCs+
Pazop
anib
0.0
0.5
1.0
1.5
2.0
2.5
p-E
rk 1
/2 /b
-act
in
iDCs
iDCs+
Suniti
nib
iDCs+
Pazop
anib
0.0
0.2
0.4
0.6
0.8
1.0
b-c
aten
in/b
-act
in
**
iDCs
iDCs+
Suniti
nib
iDCs+
Pazop
anib
0.0
0.5
1.0
1.5
NF
-kB
/b-a
ctin
mD
Cs
mD
Cs+
Suniti
nib
mD
Cs+
Pazop
anib
0.0
0.5
1.0
1.5
2.0
2.5
p-E
rk 1
/2 /b
-act
in
mDCs
mD
C+Sun
itini
b
mD
Cs+
Pazop
anib
0.0
0.2
0.4
0.6
0.8
1.0
1.2
1.4
b-c
aten
in/b
-act
in
*
mD
Cs
mD
Cs+
Suniti
nib
mD
Cs+
Pazop
anib
0.0
0.5
1.0
1.5
2.0
2.5
NF
-kB
/b-a
ctin
on April 9, 2019. © 2018 American Association for Cancer Research. cancerimmunolres.aacrjournals.org Downloaded from
Author manuscripts have been peer reviewed and accepted for publication but have not yet been edited. Author Manuscript Published OnlineFirst on April 26, 2018; DOI: 10.1158/2326-6066.CIR-17-0594
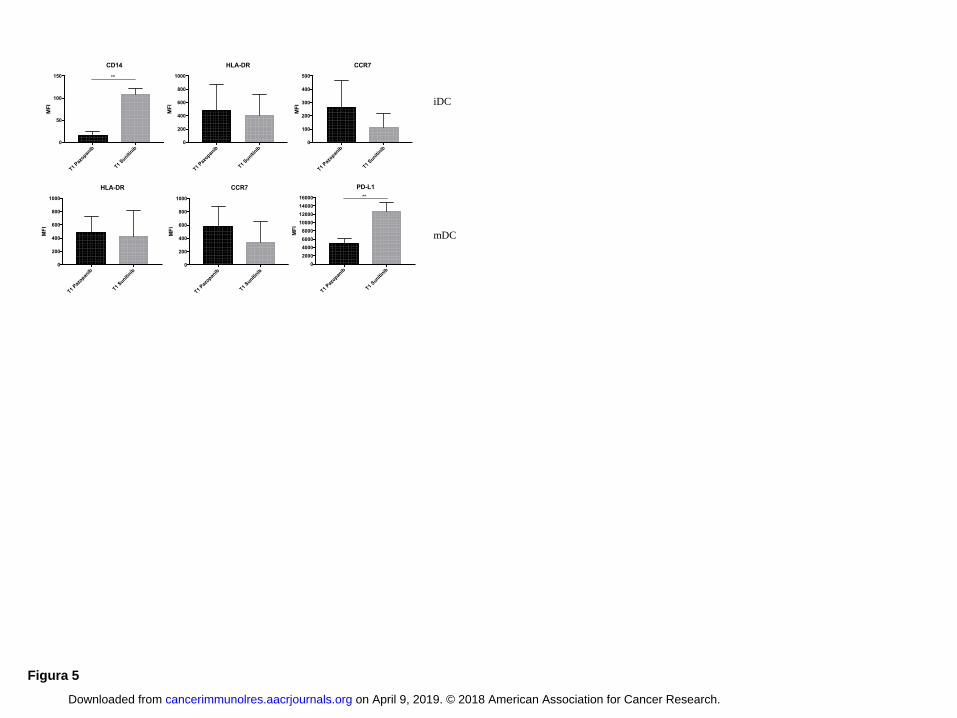
Figura 5
T1 Paz
opanib
T1 Suniti
nib
0
50
100
150
MF
I
CD14
**
T1 Paz
opanib
T1 Suniti
nib
0
200
400
600
800
1000
HLA-DR
MF
I iDC
T1 Paz
opanib
T1 Suniti
nib
0
200
400
600
800
1000
HLA-DR
MF
I
T1 Paz
opanib
T1 Suniti
nib
0
200
400
600
800
1000
MF
I
CCR7
T1 Paz
opanib
T1 Suniti
nib
0
2000
4000
6000
8000
10000
12000
14000
16000
MF
I
PD-L1
**
mDC
T1 Paz
opanib
T1 Suniti
nib
0
100
200
300
400
500
MF
I
CCR7
on April 9, 2019. © 2018 American Association for Cancer Research. cancerimmunolres.aacrjournals.org Downloaded from
Author manuscripts have been peer reviewed and accepted for publication but have not yet been edited. Author Manuscript Published OnlineFirst on April 26, 2018; DOI: 10.1158/2326-6066.CIR-17-0594
CD
8
CD3
0.3% 4.7% 30%
T0 T1 T2 T5
24.9%
19.8% 21.8% 21.7% 10.3%
T0 T1 T2
0
20
40
60
80
IL-6
pg
/ml
T0 T1 T2
0
200
400
600
IL-4
pg
/ml
T0 T1 T2
0
50
100
150
200
CXCL-10
pg
/ml
T0 T1 T2
0
50000
100000
150000
ICAM
pg
/ml
0 1 2 3 4
T0
T1
T2
T5
% T cells
Ki67
T1 T2 T3
0.7%
CD
8
CD3
0.9% 0.5%
29% 14% 14%
T1 T2
0
2
4
6
8
IL-10
pg
/ml
T1 T2
0
50
100
150
IL-12
pg
/ml
T1 T2
0
50
100
150
200
IL-4
pg
/ml
T1 T2
0
20
40
60
80
100
120
pg
/ml
CXCL10
T1 T2 T3
0
5
10
% T
reg
cells
A
B
C D
A
B C
Pt 1 CD137
T6
4.4%
2.1%
2.5%
1.2%
T9 T10
4.2%
1.3%
CD3
CD
8
A CD137
CD137
T6 T9T10
0
2
4
6
8
10
% T
reg
cells
B C
0 5 10 15 20 25
T6
T9
T10
% Ki67+ T cells
T0 T1 T2
0
2
4
6
8
10
% T
reg
cells
A B
CD
8
CD3
CD137
T0 T1 T2
C
T0 T1 T3 T4 T5
0
2
4
6
8
% T
reg
cells
D
C
CD3
CD
8
T0 T1 T3
T4 T5
CD137
24,9%
8.5%
23,2%
8.1%
T5 T7 T9
0
5
10
15
20
% T
reg
cells
T5 T7
0
5
10
15
20
IL-10
pg
/ml
T5 T70
50
100
150
IL-12
pg
/ml
T5
1.7%
1.4%
4%
2.2%
T7
28.6%
9.8%
15.8%
5.5% 5.9%
A A
C
Pt 2
Pt 3
Pt 4
Pt 5
Pt 6
Pazopanib Sunitinib
Recurrent RCC Nephrectomy
Pazopanib started
Sunitinib started
Radiotherapy started
Blood sampling and treatment timing Nivolumab started
PD
SD
Death ×
-1 0 1 2 3 4 5 6 7 8 9 10 11 12 13 14 15 16 17 18 19 20
Pt.1
×
21 22 23 24 25 26
T0 T1 T2 T5
T6 T9 T10
T5 T7 T9
T3 T2 T1
T0 T1 T2
T0 T1 T2
Pt.2
Pt.3
Pt.4
Pt.5
Pt.6
T3 T4
Figure 6 A
B
B
8.1% 8.5%
0,1% 0,1%
T9
1.7%
0.5% CD
8
CD3
CD137
B
IL-6 IL-4
CXCL-10 ICAM
IL-10 IL-12 IL-4 CXCL-10
% T
reg c
ells
% Ki67+ T cells
% CTLA-4+ T cells
% Ki67+ T cells
% T
reg c
ells
% Ki67+ T cells
0 20 40 60 80
T1
T2
T3
% T
cells
CTLA-4
% CTLA-4+ T cells
0 1 2 3 4 5
T0
T1
T2
% Ki67+ T cells
0 20 40 60 80
T0
T1
T2
% CTLA-4+ T cells % Tim 3+ T cells
0 2 4 6 8
T0
T1
T2
% Tim3+ T cells
% PD-1+ T cells
0 5 10 15
T0
T1
T3
T4
T5
PD-1
% PD-1+ T cells
% T
reg c
ells
54%
8.8%
IL-10
IL-12
T5 T7
0
50
100
150
IL-4
pg
/ml
IL-4
% T
reg c
ells
E
% T
reg c
ells
17.7%
on April 9, 2019. © 2018 American Association for Cancer Research. cancerimmunolres.aacrjournals.org Downloaded from
Author manuscripts have been peer reviewed and accepted for publication but have not yet been edited. Author Manuscript Published OnlineFirst on April 26, 2018; DOI: 10.1158/2326-6066.CIR-17-0594
Published OnlineFirst April 26, 2018.Cancer Immunol Res Ilaria Grazia Zizzari, Chiara Napoletano, Andrea Botticelli, et al. -catenin pathwayβ
TK inhibitor pazopanib primes DCs by downregulation of the
Updated version
10.1158/2326-6066.CIR-17-0594doi:
Access the most recent version of this article at:
Material
Supplementary
C1
http://cancerimmunolres.aacrjournals.org/content/suppl/2018/06/28/2326-6066.CIR-17-0594.DAccess the most recent supplemental material at:
Manuscript
Authorbeen edited. Author manuscripts have been peer reviewed and accepted for publication but have not yet
E-mail alerts related to this article or journal.Sign up to receive free email-alerts
Subscriptions
Reprints and
To order reprints of this article or to subscribe to the journal, contact the AACR Publications
Permissions
Rightslink site. Click on "Request Permissions" which will take you to the Copyright Clearance Center's (CCC)
.http://cancerimmunolres.aacrjournals.org/content/early/2018/04/26/2326-6066.CIR-17-0594To request permission to re-use all or part of this article, use this link
on April 9, 2019. © 2018 American Association for Cancer Research. cancerimmunolres.aacrjournals.org Downloaded from
Author manuscripts have been peer reviewed and accepted for publication but have not yet been edited. Author Manuscript Published OnlineFirst on April 26, 2018; DOI: 10.1158/2326-6066.CIR-17-0594