Embed Size (px)
Citation preview
Epigenetic memory in induced pluripotent stem cells
K Kim1, A Doi2, B Wen2, K Ng1, R Zhao1, P Cahan1, J Kim3, MJ Aryee2,4, H Ji2, L Ehrlich5, AYabuuchi1, A Takeuchi1, KC Cunniff1, H Hongguang1, S Mckinney-Freeman1, O Naveiras1,TJ Yoon6,#, RA Irizarry2, N Jung2, J Seita5, J Hanna7, P Murakami2, R Jaenisch7, RWeissleder6, SH Orkin3, IL Weissman5, AP Feinberg2,*, and GQ Daley1,*
1Stem Cell Transplantation Program, Division of Pediatric Hematology/Oncology, Manton Centerfor Orphan Disease Research, Howard Hughes Medical Institute, Children’s Hospital Boston andDana Farber Cancer Institute; Division of Hematology, Brigham and Women’s Hospital;Department of Biological Chemistry and Molecular Pharmacology, Harvard Medical School;Harvard Stem Cell Institute; Boston, MA 02115, USA2Center for Epigenetics and Department of Medicine, Johns Hopkins University School ofMedicine, Baltimore, Maryland, USA3Department of Pediatric Oncology, Howard Hughes Medical Institute, Children’s Hospital Bostonand Dana Farber Cancer Institute; Boston, MA 02115, USA4Department of Biostatistics, Johns Hopkins Bloomberg School of Public Health, Sidney KimmelComprehensive Cancer Center, Johns Hopkins University, Baltimore, Maryland, USA5Institute for Stem Cell Biology and Regenerative Medicine, Stanford University School ofMedicine, Stanford, California 94305, USA6Center for Systems Biology, Massachusetts General Hospital / Harvard Medical School, 185Cambridge Street, CPZN 5206, Boston, MA 02114, USA7Whitehead Institute for Biomedical Research, Department of Biology, Massachusetts Institute ofTechnology, Cambridge, Massachusetts, USA
SummarySomatic cell nuclear transfer and transcription factor-based reprogramming revert adult cells to anembryonic state, and yield pluripotent stem cells that can generate all tissues. These tworeprogramming methods reset genomic methylation, an epigenetic modification of DNA thatinfluences gene expression, by different mechanisms and kinetics, leading us to hypothesize thatthe resulting pluripotent stem cells might have different properties. Here we observe that lowpassage induced pluripotent stem cells (iPSC) derived by factor-based reprogramming harbor
*To Whom Correspondence should be Addressed: George Q. Daley, Phone: (617) 919-2013, Fax: (617) 730-0222,[email protected], Andrew P. Feinberg, Phone: (410) 614-3489, Fax: (410) 614-9819, [email protected].#Present address: Department of Applied Bioscience, CHA University, Seoul 135-081, KoreaAuthor Information CHARM microarray data are deposited at the Gene Expression Omnibus (http://www.ncbi.nlm.nih.gov/geo)under accession number GSE22851. Reprints and permissions information is available at www.nature.com/reprints. G.Q.D. is amember of the Scientific Advisory Boards of MPM Capital, Inc., Epizyme, Inc., and iPierian, Inc. R.J. is a member of the ScientificAdvisory Boards of Fate Therapeutics, Inc. and StemGent, Inc. I.R.W is a member of the Scientific Advisory Boards of Cellerant, Inc,and Stem Cells, Inc. Readers are welcome to comment on the online version of this article at www.nature.com/nature. Correspondenceand requests for materials should be addressed to A.P.F ([email protected]) and G.Q.D. ([email protected]).
Supplementary Information is linked to the online version of the paper at www.nature.com/nature.
Author Contributions K.K. and G.Q.D. conceived the experimental plan. K.K., A.D., B.W., K.N., Z.R., H.J., L.E., A.Y., A.T.,KC.C., H.H., S.MF., O.N., TJ.Y., R.I., N.J., J.S., and J.H. performed the experiments. P.C., J.K., and M.J.A. performed statisticalanalysis. A.D., B.W., and A.F. performed CHARM and guided analysis of methylation. K.K., A.D., B.W., K.N., P.C., J.K., H.J., T.Y.,A.P.F., and G.Q.D. wrote the manuscript.
NIH Public AccessAuthor ManuscriptNature. Author manuscript; available in PMC 2011 August 05.
Published in final edited form as:Nature. 2010 September 16; 467(7313): 285–290. doi:10.1038/nature09342.
NIH
-PA Author Manuscript
NIH
-PA Author Manuscript
NIH
-PA Author Manuscript
residual DNA methylation signatures characteristic of their somatic tissue of origin, which favorstheir differentiation along lineages related to the donor cell, while restricting alternative cell fates.Such an “epigenetic memory” of the donor tissue could be reset by differentiation and serialreprogramming, or by treatment of iPSC with chromatin-modifying drugs. In contrast, thedifferentiation and methylation of nuclear transfer-derived pluripotent stem cells were moresimilar to classical embryonic stem cells than were iPSC, consistent with more effectivereprogramming. Our data demonstrate that factor-based reprogramming can leave an epigeneticmemory of the tissue of origin that may influence efforts at directed differentiation forapplications in disease modeling or treatment.
IntroductionDirect reprogramming of somatic cells with the transcription factors Oct4, Sox2, Klf4, andc-Myc1 yields induced pluripotent stem cells (iPSC) with striking similarity to embryonicstem cells from fertilized embryos (fESC). Like fESC, iPSC form teratomas, differentiatedtumors with tissues from all three embryonic germ layers, and when injected into murineblastocysts contribute to all tissues, including the germ line. iPSC from mouse embryofibroblasts generate “all-iPSC mice” following injection into tetraploid blastocysts2, therebysatisfying the most stringent criterion of pluripotency3. Embryonic tissues are the mostefficiently reprogrammed, producing iPSC that are nearly identical to fESC. In contrast,reprogramming from accessible adult tissues, most applicable for modeling diseases andgenerating therapeutic cells, is inefficient and limited by barriers related to thedifferentiation state and age of the donor’s cells456. Aged cells have higher levels of Ink4/Arf, which limits the efficiency and fidelity of reprogramming5. Moreover, terminallydifferentiated blood cells reprogram less efficiently than blood progenitors6. As with cloningby nuclear transfer in frogs and mice, the efficiency and yield of reprogrammed genomesdeclines with increasing age and differentiation status of the donor cell7, and varies with themethylation state of the donor nucleus8.
Different tissues show variable susceptibility to reprogramming. Keratinocytes reprogrammore readily than fibroblasts9, and iPSC from stomach or liver cells harbor fewer integratedproviruses than fibroblasts, suggesting they require lower levels of the reprogrammingfactors to achieve pluripotency10. When differentiated into neurospheres, iPSC from adulttail-tip fibroblasts retain more teratoma-forming cells than iPSC from embryonic fibroblasts,again indicating heterogeneity based on the tissue of origin11. Moreover, cells can exist inintermediate states of reprogramming that interconvert with continuous passage or treatmentwith chromatin-modifying agents1213. Although generic iPSC are highly similar to fESC, inpractice iPSC generated from various tissues may harbor significant differences, bothfunctional and molecular.
Transcription factor reprogramming differs markedly from nuclear transfer, particularly withregard to DNA demethylation, which commences immediately upon transfer of a somaticnucleus into ooplasm14, but occurs over days to weeks during the derivation of iPSC13.Because demethylation is a slow and inefficient process in factor-based reprogramming, wepostulated that residual methylation might leave iPSC with an “epigenetic memory,” andthat methylation might be more effectively erased by nuclear transfer. Here we compare thedifferentiation potential and genomic methylation of pluripotent stem cells (iPSC, ntESC,and fESC), and find evidence that iPSC indeed retain a methylation signature of their tissueof origin.
Kim et al. Page 2
Nature. Author manuscript; available in PMC 2011 August 05.
NIH
-PA Author Manuscript
NIH
-PA Author Manuscript
NIH
-PA Author Manuscript
ResultsInitially we sought to compare the in vivo engraftment potential of hematopoietic stem cellsderived from fESC, ntESC, and iPSC in a mouse model of thalassemia. However, even invitro we observed strikingly different blood-forming potential; thus, we focused here insteadon understanding this phenomenon. Our initial set of pluripotent stem cells were derivedfrom the hybrid C57BL/6 x CBA (B6/CBAF1) strain carrying a deletion in the beta-globinlocus15, which is otherwise irrelevant to this study (Fig. 1a). We isolated fESC cells fromnaturally fertilized embryos and derived ntESC cells from nuclei of dermal fibroblasts8. Weinfected early bone marrow cells (Kit+, Lin−, CD45+) or dermal fibroblasts from aged micewith retroviral vectors carrying Oct4, Sox2, Klf4, and Myc, and selected blood-derived andfibroblast-derived iPSC colonies (B-iPSC, F-iPSC). Hematopoietic progenitors andfibroblasts yielded a comparable frequency of reprogrammed colonies (0.02%), whichconsistent with prior reports5, was lower than the yield from fibroblasts of a juvenile mouse(0.1%). We characterized the fESC, ntESC, and iPSC lines for expression of Oct4 andNanog by immunohistochemistry, and demonstrated multi-lineage differentiation potentialin teratomas (Fig. 1b, c; Supplementary Fig. 1). By criteria typically applied to humansamples and appropriate for a therapeutic model3, all stem cell lines manifest pluripotency.
Differentiation of pluripotent stem cellsTo test blood potential, we differentiated multiple pluripotent stem cell clones into embryoidbodies (EBs), dissociated cells, and assayed for hematopoietic colony forming cells16. Allpluripotent cells generated comparable EBs but markedly different numbers ofhematopoietic colonies. Consistently, blood-derived B-iPSC yielded more hematopoieticcolonies than F-iPSC (Fig. 2a). Hematopoietic colony formation from ntESC and fESC werehigher than the iPSC lines.
We then tested differentiation into osteoblasts, a mesenchymal lineage that can be derivedfrom fibroblasts1718. By alizarin red staining, a marker of osteogenic cells19, F-iPSCproduced more sharply defined osteogenic colonies (Fig. 2b), deposited more elementalcalcium (Fig. 2c), and showed higher expression of three osteoblast-associated genes (Fig.2d) than B-iPSC. By these criteria, F-iPSC show enhanced osteogenic potential, reflecting apropensity to differentiate towards a mesenchymal lineage. In contrast, ntESC cells behavedcomparably to fESC in hematopoietic and osteogenic assays.
DNA methylation of pluripotent stem cellsWe hypothesized that the different pluripotent cells might harbor different patterns ofgenomic DNA methylation; thus, we performed Comprehensive High-throughput Array-based Relative Methylation (CHARM) analysis, which interrogates ~4.6 million CpG sites,including almost all CpG islands and nearby sequences termed shores2021, but does notassess non-CpG methylation. We determined the number of differentially methylatedregions (DMRs) between pair-wise comparisons, using a threshold area cutoff of 2,corresponding to a 5% false discovery rate (FDR22; Supplementary Table 1a). By thisanalysis, ntESC were most similar to fESC (only 229 DMRs), whereas F-iPSC differed mostextensively (5304 DMRs). Relative to fESC, hypermethylated DMRs predominated for F-iPSC (3349=63%) and B-iPSC (516=74%). Highlighting their functional differences, 5202DMRs were identified between B-iPSC and F-iPSC. We confirmed the results of CHARManalysis by bisulfite pyrosequencing of multiple loci (Supplementary Fig. 2).
Unsupervised hierarchical clustering of DMRs between B-iPSC and F-iPSC easilydistinguished iPSC from ntESC and fESC, which cluster together (Fig. 3a). B-iPSC clusternearer to ntESC and fESC than do F-iPSC, which represent a strikingly separate cluster.
Kim et al. Page 3
Nature. Author manuscript; available in PMC 2011 August 05.
NIH
-PA Author Manuscript
NIH
-PA Author Manuscript
NIH
-PA Author Manuscript
These data indicate that the methylation patterns of ntESC are more like fESC than areeither iPSC.
Several lines of evidence support a mechanistic link between differential methylation andhematopoietic propensity of iPSC lines. First, literature survey of genes for the top 24DMRs that distinguish B-iPSC and F-iPSC links 11 to hematopoiesis and 3 to osteogenesis(Supplementary Table 2). Of the 11 hematopoietic loci, 10 are hypermethylated in F-iPSCrelative to B-iPSC. Second, of 74 hematopoietic transcription factors23, 20 are in or nearDMRs that are hypermethylated in F-iPSC versus B-iPSC, twice that predicted by chance(p=0.0034; Fig. 3b left panel, Supplementary Fig. 3a, and Supplementary Table 3).Similarly, of 764 fibroblast-specific genes, 115 are hypermethylated in B-iPSC, twice thatpredicted by chance (p=10−5; Fig 3b right panel). Given the correlation between methylationand transcriptional silencing24, our data suggest that iPSC harbor epigenetic marksantagonistic to cell lineages distinct from the donor cell type.
We asked whether DMRs that distinguish B-iPSC from fESC might allow us to identifytheir hematopoietic lineage of origin. In a separate CHARM experiment 25, we examinedgenome-wide methylation in highly purified multipotent and lineage-specific hematopoieticprogenitors. Comparing DMRs in B-iPSC to those that define hematopoietic progenitors, weobserved that B-iPSC cluster alongside Common Myeloid Progenitors (CMP) and distantfrom Common Lymphoid Progenitors (CLP; Supplementary Fig. 4a and SupplementaryTable 4), which is notable given that B-iPSC were derived from Kit+, lineage-negativemyeloid marrow precursors. Next, we asked whether the tissue of origin (bone marrow vsfibroblast) could be identified by the methylation state of tissue specific DMRs in F-iPSC,B-iPSC, and Bl-iPSC (a B lymphocyte-derived iPSC line described below). Using DMRsthat distinguish fibroblast and bone marrow, and examining methylation in iPSCs andsomatic cells from two different genetic backgrounds (B6CBA and B6129), we found thatF-iPSC cluster alongside fibroblasts, and distant from bone marrow (Supplementary Fig.4b). Similarly, the hematopoietic-derived B-iPSC and Bl-iPSC grouped with somatic cellsfrom bone marrow. Thus, residual methylation indicates the tissue of origin of iPSC, and forblood-derivatives even their precise lineage, further supporting the phenomenon ofepigenetic memory in iPSC.
Reprogrammed state of iPSC and ntESCWe postulated that the differing methylation signatures of B-iPSC, F-iPSC, and ntESCreflect disparate reprogramming, and confirmed this by two independent computationalanalyses. First, we overlapped DMRs that distinguish B-iPSC, F-iPSC, and ntESC fromfESC with genes specifically expressed in undifferentiated murine fESC26. By this analysis,ntESC showed the fewest DMRs at loci corresponding to the most highly expressed fESC-specific genes, and B-iPSC showed fewer DMRs at these loci than F-iPSC (SupplementaryFig. 5a). Second, we overlapped DMRs with the DNA binding locations for seventranscription factors that compose a core protein network of pluripotency27, and found thefewest DMRs at core transcription factor binding sites in ntESC, and less overlap in B-iPSCthan in F-iPSC (Supplementary Table 5). These analyses indicate that F-iPSC harbor moreresidual methylation than B-iPSC at loci directly linked to the gene expression andpluripotency networks of fESC, whereas ntESC show the least differential methylation andappear closest to fESC at these critical loci.
Further analysis of Oct4 and Nanog indicates that although both are detected byimmunohistochemistry in B-iPSC and F-iPSC (Fig. 1b), Oct4 mRNA is fully expressedfrom a demethylated promoter in both types of iPSC, whereas Nanog mRNA is sub-optimally expressed from a promoter that retains considerable methylation in F-iPSC(Supplementary Fig. 6). When assessed by blastocyst chimerism, B-iPSC contribute to all
Kim et al. Page 4
Nature. Author manuscript; available in PMC 2011 August 05.
NIH
-PA Author Manuscript
NIH
-PA Author Manuscript
NIH
-PA Author Manuscript
tissues, including the germ line, whereas F-iPSC contribute only poorly (Supplementary Fig.7a), although they can be found in SSEA1+ germ cells of the gonadal ridge (SupplementaryFig. 7b). Thus, while both B-iPSC and F-iPSC generate robust multi-lineage teratomas,satisfying criteria for pluripotency typically applied to human cells3, broader functionalassessments available in the mouse system confirm their differential degree ofreprogramming. In this comparison of iPSC derived from accessible tissues of aged adultmice, bone marrow yields stem cells with superior features of pluripotency, but neither iPSCis equivalent to ntESC or fESC.
Stringently-defined pluripotent stem cellsTo determine if blood-forming potential differs among cell lines that satisfy more stringentcriteria for pluripotency, we analyzed lines derived from a uniform genetic background(B6/129F1) that all express a Nanog-eGFP reporter gene28, and for which pluripotency wasdemonstrated by blastocyst chimerism and transmission through the germ line (Fig. 4a,upper schema; Supplementary Table 6). These studies involve “secondary” iPSC linesderived from neural progenitor cells (NP-iPSC29) and B-lymphocytes (Bl-iPSC30) of micechimerized with iPSC carrying proviruses that express doxycycline-induciblereprogramming factors from identical proviral integration sites. NP-iPSC and Bl-iPSC werecompared to ntESC generated from neural progenitor cells (NP-ntESC8), blood progenitorcells (B-ntESC31), and fibroblasts (F-ntESC31, 32), as well as fESC.
All cell lines were differentiated into embryoid bodies and assayed for hematopoietic colonyforming activity16. Across multiple clones, we observed higher blood forming potential ofiPSC derived from B lymphocytes (Bl-iPSC) than from neural progenitors (NP-iPSC; Fig.4b). In contrast, we observed that ntESC, regardless of tissue origin (fibroblasts, neuralprogenitors, or T-cells), and fESC displayed an equivalently robust blood forming potential(Fig. 4b). In this independent set of iPSC lines, qualified as pluripotent by stringent criteria,we again observed consistent differences in blood formation, with blood derivativesshowing more robust hematopoiesis in vitro than neural derivatives.
Resetting differentiation propensityFinally, we asked whether we could rescue the poor blood-forming potential of NP-iPSC bydifferentiation into hematopoietic lineages1633, followed by a tertiary round ofreprogramming back to pluripotency by doxycycline induction of the endogenousreprogramming factors (Fig. 4a, lower schema). As a control, we differentiated NP-iPSCsinto neural stem cells8, followed by tertiary reprogramming to pluripotency. Resulting iPSCclones were selected for expression of the Nanog-eGFP reporter and shown to express Oct4and Nanog by immunohistochemistry (Supplementary Fig. 8) and to chimerize murineblastocysts (Supplementary Fig. 9). The tertiary blood-derived B-NP-iPSC showed higherhematopoietic colony-forming potential than the tertiary NSC-NP-iPSC (Fig. 4b), andgenerated larger hematopoietic colonies with more cells per colony (Supplementary Fig.10a, b). These data indicate that the poor blood-forming potential of secondary NP-iPSC canbe enhanced by differentiation into hematopoietic progeny, followed by tertiaryreprogramming. In contrast, tertiary reprogramming via neural intermediates yields iPSCthat retain poor hematopoietic potential.
The reduced blood potential of NP-iPSC might be explained by residual epigenetic marksthat restrict blood fates or a lack of epigenetic marks that enable blood formation. We soughtto determine whether treatment of NP-iPSC with pharmacologic modulators of geneexpression and DNA methylation might reactivate latent hematopoietic potential. We treatedNP-iPSC in vitro with Trichostatin A (TSA), a potent inhibitor of histone deacetylase34, and5-azacytidine (AZA), a methylation-resistant cytosine analogue35. After 18 days of drug
Kim et al. Page 5
Nature. Author manuscript; available in PMC 2011 August 05.
NIH
-PA Author Manuscript
NIH
-PA Author Manuscript
NIH
-PA Author Manuscript
treatment, the resulting cells displayed higher blood forming activity (NP-iPSC-TSA-AZA;Fig. 4b). For unclear reasons, tertiary reprogramming through blood intermediates or drugtreatment of NP-iPSC produced altered ratios of colony sub-types, perhaps suggestingdifferent efficiencies of lineage reprogramming.
Methylation in secondary and tertiary iPSCWe used CHARM to examine the methylome of the germ-line competent pluripotent stemcells, the tertiary reprogrammed B-NP-iPSC and NSC-NP-iPSC, and the drug-treated NP-iPSC (Fig. 4a). In pair-wise comparisons (Supplementary Table 1b), the NP-iPSC showedonly a small number of DMRs relative to fESC (553), fewer than the numbers of DMRsdistinguishing ntESC from fESC (679), indicating that selection using the Nanog-GFPreporter and derivation from young donor tissue yields more equivalently reprogrammedcells. Despite equivalent Nanog-GFP expression, B lymphocyte-derived Bl-iPSC harboredmore DMRs (1485) relative to fESC than did the NP-iPSC. Cluster dendrogram analysis,employing the most variable DMRs that distinguish Bl-iPSC and NP-iPSC, showed NP-iPSC to be more similar to fESC than are Bl-iPSC, which represent a distinct cluster (Fig.4c). These data suggest that neural progenitors are more completely reprogrammed to anESC-like state than blood donor cells. Cluster dendrogram analysis failed to distinguishamong NP-iPSC, ntESC, and fESC, but assessment of the overlap of DMRs with loci forhighly expressed ESC-specific genes26 and core pluripotency transcription factor bindingsites27 indicated differences among these three pluripotent cell types, and reveal that ntESChave the fewest DMRs affecting these critical loci (Supplementary Fig. 5b).
Relative to fESC, hypermethylated DMRs predominated in NP-iPSC and Bl-iPSC (417(75%) and 1423 (96%), respectively; Supplementary Table 1b), confirming that even whenpluripotency is documented by stringent criteria, iPSC retain residual methylation. Byanalysis of overlapping DMRs, Bl-iPSC cluster with progenitors of the lymphoid lineage(CLP) rather than the myeloid lineage (Supplementary Fig. 4a; Supplementary Table 425).To illustrate this point, the Gcnt2 gene, which encodes the enzyme responsible for the bloodgroup I antigen, and Gata2, a regulator of hematopoiesis and erythropoiesis, are bothhypermethylated and transcriptionally silent in the lymphoid lineage25. Bl-iPSC showedhypermethylation at these loci relative to fESC, whereas the myeloid-derived B-iPSC didnot (Supplementary Fig. 11). Thus, a methylation signature correctly identifies the bloodlineage of origin of B-lymphocyte derived iPSC.
Furthermore, we found that neural-related genes tended to be differentially methylatedbetween Bl-iPSC and NP-iPSC (Supplementary Fig. 3b). Treatment of NP-iPSC with TSAand AZA enhances blood-forming potential and increases hypomethylated DMRs (626;Supplementary Table 1c). We found significant overlap between these DMRs and genesenriched in mouse hematopoietic stem cells (MSigDG signatureSTEMCELL_HEMATOPOIETIC_UP; Supplementary Fig. 3c), suggesting that drugtreatment erases inhibitory methylation signatures at hematopoietic loci.
We compared DMRs in iPSCs with high hematopotietic potential (B-NP-iPSC and NP-iPSC-TSA-AZA) to those with low hematopoietic potential (NP-iPSC and NSC-NP-iPSC),and found that B-NP-iPSC and NP-iPSC-TSA-AZA harbored higher gene-body methylationof Wnt3 (Supplementary Fig. 12), a gene which along with its homologue Wnt3a plays amajor role in blood development from fESC36. The blood-deficient NP-iPSC and NSC-NP-iPSC lines lacked gene body methylation. While promoter methylation is repressive, genebody methylation is seen in active genes37. When iPSC were differentiated into embryoidbodies, the blood-prone NP-iPSC-TSA-AZA showed higher levels of Wnt3/3a expressionthan the blood-deficient NP-iPSC (Supplementary Fig. 13a). Interestingly, supplementationof the culture media with Wnt3a during embryoid body differentiation restored blood-
Kim et al. Page 6
Nature. Author manuscript; available in PMC 2011 August 05.
NIH
-PA Author Manuscript
NIH
-PA Author Manuscript
NIH
-PA Author Manuscript
forming potential in the blood-deficient NP-iPSC and NSC-NP-iPSC lines, but had littleeffect on the already robust hematopoietic potential of B-NP-iPSC (Supplementary Fig.13b). Albeit preliminary, these data correlate differential gene body methylation andexpression of the Wnt3 locus with enhanced blood-forming potential in iPSC lines.
DiscussionHere we demonstrate that iPSC retain an epigenetic memory of their tissue of origin. Ourdata reveal several important principles that relate to the technical limitations inherent in theprocess of reprogramming, and which in practice influence the differentiation propensity ofspecific isolates of iPSC.
First, tissue source influences the efficiency and fidelity of reprogramming91011. From agedmice, blood cells were reprogrammed more closely to fESC than dermal fibroblasts, whichyielded only incompletely reprogrammed cells. Neural progenitor-derived iPSC were mostsimilar to fESC, consistent with evidence that such cells can be reprogrammed with fewertranscription factors38. Whereas neural progenitors are not readily accessible, iPSC can begenerated by direct reprogramming of human blood39.
Second, analysis of DNA methylation reveals substantial differences between iPSC andembryo-derived ESC (ntESC and fESC). iPSC derived from non-hematopoietic cells (neuralprogenitors and fibroblasts) retain residual methylation at loci required for hematopoieticfate, which manifests as reduced blood-forming potential in vitro. Residual methylationsignatures link iPSC to their tissue of origin, and even discriminate between the myeloid andlymphoid origins of blood-derived iPSC. Prior studies reporting residual hypermethylationin iPSC3722 did not establish a link between DMRs at specific loci, tissue of origin, andaltered differentiation potential. While residual methylation is mostly repressive, we haveshown for Wnt3 that residual gene body methylation in blood-derived iPSC is associatedwith enhanced blood potential. Interestingly, the poor blood potential of neural progenitor-derived iPSC, which lack this epigenetic mark and express lower levels of endogenousWnt3, can be enhanced by supplementing differentiating cultures with exogenous Wnt3acytokine, indicating that manipulating culture conditions can overcome epigenetic barriers.
Third, the differentiation propensity and methylation profile of iPSC can be reset. Whenblood-deficient neural progenitor-derived iPSC (NP-iPSC) are differentiated into blood andthen reprogrammed to pluripotency, their blood-forming potential is markedly increased.Alternatively, treatment of NP-iPSC with chromatin-modifying compounds increases blood-forming potential and is associated with reduced methylation at hematopoietic loci. Forsome applications, epigenetic memory of the donor cell may be advantageous, as directeddifferentiation to specific tissue fates remains a challenge.
Fourth, nuclear transfer-derived ESC are more faithfully reprogrammed than most iPSCgenerated from adult somatic tissues. Like the immediate and rapid demethylation of thesperm pronucleus following fertilization, somatic nuclei are rapidly demethylated by nucleartransfer into ooplasm, prompting speculation that the egg harbors an active demethylase14.In contrast, demethylation is a late phenomenon in factor-based reprogramming, and likelyoccurs passively13. Studying how ooplasm erases methylation might identify biochemicalfunctions that would enhance factor-based reprogramming. Failure to demethylatepluripotency genes is associated with intermediate or partial states of reprogramming122940,and knock-down of the maintenance methyltranferase DNMT1 or treatment with thedemethylating agent 5-AZA can convert intermediate states to full pluripotency.Demethylation appears passage dependent13, and reprogramming efficiency correlates withthe rate of cell division and the passage number41. In our experiments, we compared
Kim et al. Page 7
Nature. Author manuscript; available in PMC 2011 August 05.
NIH
-PA Author Manuscript
NIH
-PA Author Manuscript
NIH
-PA Author Manuscript
pluripotent stem cells of comparable low passage number (Supplemental Table 5), butcontinued serial passage may homogenize the differentiation potential of pluripotent celltypes.
The mRNA expression program of iPSC and fESC are strikingly similar42. Minordifferences in mRNA and microRNA expression have been reported40, but removal oftransgenes reduces the differences43. The Dlk1-Dio3 locus, whose expression correlateswith capacity to generate “all-iPSC” mice44, is not differentially methylated and expressedin at least some iPSC lines that manifest epigenetic memory (our unpublished observations).Thus even the most stringently-defined iPSC might retain epigenetic memory. Importantly,differences between iPSC and fESC may not manifest until differentiation, when the specificloci that retain residual epigenetic marks are expressed, influencing cell fates. Methylation isbut one molecular feature of “epigenetic memory” in iPSC. Faulty restoration of bivalentdomains, which mark developmental loci with both active and repressive histonemodifications 45, and loss of pioneer factors, which in fESC and iPSC occupy enhancers ofgenes expressed only in differentiated cells46, represent two other potential mechanisms.
Although ideal, generic iPSC may be functionally and molecularly indistinguishable fromfESC, we have shown in practice that even rigorously selected iPSC can retain epigeneticmarks characteristic of the donor cell that influence differentiation propensity. Epigeneticdifferences are unlikely to be essential features of iPSC, but rather reflect stochasticvariations associated with the technical challenges of achieving complete reprogramming.Given that we lack reporter genes for selecting human iPSC, and cannot qualify theirpluripotency by assaying embryo chimerism, the behavior of human cells will likely beinfluenced by epigenetic memory. Human ESC can also manifest variable differentiationpotential47. These data highlight our limited understanding of the epigenetic heterogeneityof pluripotent stem cells, and the need for improved methods to ensure reprogramming ofsomatic cells to a fully naïve, “ground state” of pluripotency48.
METHODS SUMMARYES cells and iPSCs were cultured in ESC media containing 15% FBS, and 1,000 U/ml ofLIF. For the reprogramming of somatic cells, retrovirus expressing Oct4, Sox2, Klf4, andMyc were introduced. For the somatic cells containing inducible reprogramming factors, themedia was supplemented with 2 ng/ml of doxycycline. For DNA and RNA isolation, fESCor iPSCs were trypsinized and re-plated onto new tissue culture dishes for 45 minutes toremove feeder cells, and nucleic acids were extracted from the non-adherent cell suspension.Genomic DNA methylation analysis and pyrosequencing were performed by previouslypublished methods2021.
Full Methods and any associated references are available in the online version of the paperat www.nature.com/nature.
Supplementary MaterialRefer to Web version on PubMed Central for supplementary material.
AcknowledgmentsG.Q.D is an investigator of the Howard Hughes Medical Institute and was supported by NIH grants RO1-DK70055and RO1-DK59279, and special funds received under the American Recovery and Reinvestment Act (RC2-HL102815). K.K. was supported by NIH (K99HL093212-01), LLS (3567-07), and Cooley’s Anemia Foundation.A.P.F was funded by NIH grants R37CA054358 and P50HG003233. I.L.W. was funded by NIH grantsR01AI047457, R01AI047458, CA86065, and HL099999, and the Thomas and Stacey Siebel Foundation. L.I.R.E.
Kim et al. Page 8
Nature. Author manuscript; available in PMC 2011 August 05.
NIH
-PA Author Manuscript
NIH
-PA Author Manuscript
NIH
-PA Author Manuscript
was supported by Special Fellow Career Development award from the Leukemia and Lymphoma Society. J.S. issupported by a fellowship from the California Institute for Regenerative Medicine (T1-00001).
APPENDIX
METHODSTissue culture
Bl-iPSC and NP-iPSC have been described305051. The cells were cultured in standard ESmaintenance media.
Generation of B-iPSC and F-iPSCB-iPSC were generated from bone marrow cells collected from one-year-old B6CBAF1mice. Early progenitor cells (lin−, CD45+, and cKit+) were sorted by FACS (HemNeoFlowFacility at the Dana Farber Cancer Institute) and stained with lineage-specific antibodies(B220;RA3-6B2, CD19;1D3, CD3;145-2c11, CD4;GK1.5, CD8;536.7, Ter119;ter119,Gr-1;RB6-8C5), CD45 specific antibody (30-F11), and cKit antibody (2B8). 105 sorted cellswere infected with retrovirus generated from pMXOct4, pMXSox2, pMXKlf41, andpEYK3.1cMyc52 in 6 well dishes with 0.5 ml of each viral supernatant (total 2 ml per well),and spun at 2500 rpm at 20C for 90 minutes (BenchTop Centrifuge, BeckmanCoulter,Allegra-6R). cMyc was cloned into pEYK3.1 containing two loxp sites to enable removal ofthe cMyc by Cre treatment. The reprogramming factor-infected cells were plated on toirradiated OP9 feeder cells in 10 cm tissue culture dish in IMDM media (Invitrogen)supplemented with 10% FBS, 1x penicillin/streptomycin/glutamine (Invitrogen), VEGF(R&D Systems, 40ng/ml), Flt (R&D Systems, 100 ng/ml), TPO (R&D Systems, 100ng/ml),and SCF (R&D Systems, 40ng/ml) on day 0. The media were changed on day 2. Cells werecollected by media centrifugation and returned to culture during media changes. On day 5,cultured cells were trypsinized and replated on to four 10 cm dishes pre-coated withirradiated mouse embryonic fibroblast in ES maintenance media. Media were changed dailyuntil ES-like colonies were observed. F-iPSC were generated from tail tip fibroblasts of one-year-old B6CBAF1 mice. 106 fibroblast cells were plated onto all wells of a 6 well plate andspin-infected with the four viral supernatants, as for the generation of B-iPSC. Cells werecultured further in DMEM media (Invitrogen) supplemented with 15% FBS, 1x penicillin/streptomycin/glutamine (Invitrogen). On day 5, the cultured cells were trypsinized, andreplated in four 10 cm dishes on irradiated mouse embryonic fibroblast with ES maintenancemedia. Media was changed every day until ES-like colonies were observed.
Differentiation of iPSC to hematopoietic and osteogenic lineagesHematopoietic colony forming activity of d6 EBs differentiated from pluripotent stem cellswas measured in methylcellulose medium with IL3, IL6, Epo, and SCF (M3434, StemCellTech.) as described16. Hematopoietic colony type was determined on day 10. Colonyidentity was confirmed by leukostain analysis of cytospin preparation of the methylcellulosecolonies. Osteogenic differentiation was performed by culturing pluripotent stem cells in 15μl hanging drops (800 cells/drop) in ES differentiation media16. Embryoid bodies (EB) fromhanging drops were collected at 2 days, transferred to a 10 cm dish of non-tissue culturegrade plastic with 10−6 M of retinoic acid, and cultured for 3 days on the shaker (50 rpm) inan incubator. EBs were equally distributed among 3 wells of a 6-well tissue culture dish, andcultured in αMEM media supplemented with 10 % FBS, 1x penicillin/streptomycin/glutamine (Invitrogen), 2 nM triiodothyronine, 1x insulin/transferrin/triacostatin A (Gibco,#51300-044). The media were changed every other day. On day 11, one well of each samplewas used to measure calcium concentration, osteogenic gene expression (RNA isolation),and for Alizarin Red staining. For Alizarin Red staining, cells were washed with PBS and
Kim et al. Page 9
Nature. Author manuscript; available in PMC 2011 August 05.
NIH
-PA Author Manuscript
NIH
-PA Author Manuscript
NIH
-PA Author Manuscript
fixed with 4% paraformaldehyde for 5 minutes at 20C. Fixed cells were incubated for 15minutes in Alizarin Red staining solution (Alizarin Red (Sigma, A5533) 2% in H2O, pH4-4.3 adjusted with NH4OH, filtered with 0.45uM membrane), and washed with Tris-HCl,pH4.0. Elemental calcium concentrations were measured by inductively coupled plasma –atomic emission spectroscopy (ICP-AES, HORIBA Jobin Yvon Activa-M)49 at the Centerfor Materials Science and Engineering at MIT, and three measurements were conducted toobtain mean and standard deviation values. To measure ionized calcium, cells were treatedwith 5% HNO3 (for dissolution of calcium molecules) and 10% HClO4 acid solutions (toremove organic compounds) in a cell culture flask and then briefly sonicated for 10 min.The solution was incubated for > 3 hrs on the titer plate shaker. The obtained values wereconverted to calcium concentration using a reference solution made by Fluka (CalciumStandard for AAS, TraceCERT®), and normalized by 5 × 10⁵ initiated cells.
Quantitative RT-PCR AnalysisThe expression levels of osteogenic genes (Runx2, Sp7, and Bglap) were quantified by real-time RT-PCR with Quantifast SYBR Green RT-PCR kit (Qiagen, Hilden, Germany). TotalRNAs (2 ug) were reverse-transcribed in a volume of 20 ul by using the SuperScript IIIFirst-Strand Synthesis System (Invitrogen, Carlsbad, California, USA), and the resultingcDNA was diluted into a total volume of 500 ul. 5 ul of this synthesized cDNA solution wasused for analysis. For osteogenic genes, each reaction was performed in a 25 ul volumeusing the Quantifast SYBR Green RT-PCR kit (Qiagen, Hilden, Germany). The conditionswere programmed as follows: initial denaturation at 95C for 5 min followed by 40 cycles of10 s at 95C and 30 s at 60C, then 1 min at 95C, 30 s at 55C, and 30 sec at 95C. Forpluripotent genes, each reaction was performed in a 25 ul volume using using the BrilliantSYBR Green QPCR master mix kit (Stratagene, Cedar Creek, TX, USA). The conditionswere programmed as follows: initial denaturation at 95C for 10 min followed by 40 cyclesof 30 s at 95C, 1 min at 55C, and 1 min at 72C, then 1 min at 95C, 30 s at 55C, and 30 sec at95C. Primers used in the quantitative RT-PCR are listed in Supplementary Table 7. All ofthe samples were duplicated, and the PCR reaction was performed using an Mx3005P(Stratagene, Cedar Creek, TX, USA), which can detect the amount of synthesized signalsduring each PCR cycle. The relative amounts of the mRNAs were determined using theMxPro program (Stratagene, Cedar Creek, TX, USA). The amount of PCR product wasnormalized to a percentage of the expression level of b-Actin. The RT-PCR products ofOct4, Nanog, and b-Actin were also evaluated on 0.8% agarose gels after staining withethidium bromide. The cycle numbers of the PCR were reduced in order to optimize thedifference in band intensities (Oct4, Nanog, and b-Actin were 29, 33, and 28, respectively)(Supplementary Table 7).
DNA methylation analysis5ug of genomic DNA from each sample was fractionated, digested with McrBC, gelpurified, labeled and hybridized to a CHARM microarray as previously described20, 21. Foreach probe, the averaged methylation values across the same cell type were computed andconverted to percent methylation (p). p was used to find regions of differential methylation(Δp) for each pairwise cell type comparison and the absolute area of each region wascalculated by multiplying the number of probes by Δp. For data analysis, we used area value2 as the cutoff to define differentially methylated regions (DMRs). Our previous studyindicated that this cutoff corresponds to 5% false discovery rate (Doi et al. unpublisheddata). Bisulfite pyrosequencing analysis of individual regions was performed as previouslydescribed21. Primer sequences are provided in Supplementary Table 7.
Kim et al. Page 10
Nature. Author manuscript; available in PMC 2011 August 05.
NIH
-PA Author Manuscript
NIH
-PA Author Manuscript
NIH
-PA Author Manuscript
Teratoma and chimera analysisTeratomas were assessed by injecting 106 undifferentiated cells into the subcutaneous tissueabove the rear haunch of Rag2/γC immunodeficient mice (Taconic), and teratoma formationwas monitored for 3 months post injection. Collected tumors were processed by thePathology Core of the Dana-Farber/Harvard Cancer Center. Chimera analysis of pluripotentcells was conducted by injecting GFP+ or GFP− cells into blastocysts isolated from C57BL/6 (GFP− or GFP+) embryos, which were collected at the two-cell stage. The fertilizedembryo was collected from the oviduct and cultured in KSOM media (Specialty Media). Amouse strain expressing GFP from the human ubiquitin promoter (Jackson Laboratory) wasused to ensure maximum expression in various tissues, and enabled injected cells to bedistinguished from host cells. The reconstituted blastocysts were implanted into 2.5 daypseudopregnant CD1 females. Chimeras were allowed to develop to adulthood to gauge skinchimerism and germ cell transmission, or were dissected at embryonic day 12.5 to isolategonad, liver, heart, and MEF for flow analysis. Gonads were stained with SSEA1 antibody(Hybridoma Bank) for 1 hour, and treated with APC-conjugated mouse IgM antibody (BDPharmingen, #550676) to detect SSEA1 positive germ cells by flow cytometry (LSRII, BDBiosciences, Hematology/Oncology Flow Cytometry Core Facility of Children’s HospitalBoston).
Generation of NSC-NP-iPSC, B-NP-iPSC, and NP-iPSC-TSA-AZANeural Progenitor (NP) iPSC harboring integrated proviruses carrying the fourreprogramming factrors29 were differentiated to neural stem cells (NSC) as described53.Reprogramming factors in cultured NSC were induced by doxycycline, and coloniesexpressing GFP from the nanog-reporter were selected to yield NSC-NP-iPSC. NP-iPSCfrom blood lineages (B-NP-iPSC) were obtained by differentiating the NP-iPSC via EB for6 days, infecting with HoxB4ERT retrovirus54, and co-culturing on OP9 in the presence of4-hydroxytamoxifen (4-HT) to enable isolation of hematopoietic cells16. Day 15hematopoietic cells were harvested, stained with CD45+ (BD Pharmingen, #557659), andsorted for hematopoietic cells. Only minimal hematopoietic colonies were observed on OP9culture in the absence of 4-HT. Harvested CD45+ hematopoietic cells were induced bydoxycycline and colonies expressing GFP from the nanog-reporter were selected to yield B-NP-iPSC. Methylcellulose hematopoietic colony analysis was conducted in the absence of4-HT as a negative control. The dissociated EBs (2×10⁵ cells) from NP-iPSC were infectedwith HoxB4-ERT virus and then plated on methylcellulose media. Only 1.7 +/− 1.2 colonies(n=3) were formed in the absence of hydroxytamoxifen, which indicates the limitedfunctional HoxB4 expression in the absence of 4-HT. NP-iPSC-TSA-AZA cells wereisolated by treating cells for 9 days with Trichostatin A (TSA, 100nM) and 5-azacytidine(AZA, 1mM), in 3-day cycles: drug treatment occurred on two consecutive days, followedby one day of non-treatment. Undifferentiated colonies were recovered to conductmethylcellulose analysis. Wnt3a (R&D System, 1324-WN-002/CF, 40ng/ml) was added toEB culture media between day 2 and 4, and hematopoietic potential was tested by plating onmethylcellulose media as described above.
Gene Enrichment analysisWe took a permutation approach to assess the enrichment of hematopoiesis and fibroblastrelated genes in DMRs. Gene lists were derived from MSigDB (http://www.broadinstitute.org/gsea/msigdb/index.jsp) for Supplementary Figure 3c, and cell-typesignatures are described in Cahan et al.23 for all other enrichment analyses. To identify cell-type signatures, gene expression profiles of more than 80 distinct cell types weredownloaded from Gene Expression Omnibus, normalized, and searched for sets of genesthat exhibit cell type-specific expression patterns, using the template matching methoddescribed in Pavlidis et al.55. Enrichment P-values were calculated as the number of times
Kim et al. Page 11
Nature. Author manuscript; available in PMC 2011 August 05.
NIH
-PA Author Manuscript
NIH
-PA Author Manuscript
NIH
-PA Author Manuscript
that a random selection of genes from the 13,931 profiled met or exceeded the observedoverlap based on 100,000 random selections. The number of randomly selected genes wasthe same as the number of genes in the DMR list. Fig. 3b (left panel): 20/74 hematopoiesis-related transcription factors are among the 1,997 genes hypermethylated in F-iPSC vs B-iPSC (P-value=0.00337). Fig. 3b (right panel): 115/562 fibroblast-specific genes are amongthe 1,589 genes hypermethylated in B-iPSC vs F-iPSC (P-value=0.00001). SupplementaryFigure 3A: 12/130 liver-specific genes are among the 1,321 differentially methylated in F-iPSC vs B-iPSC (P-value=0.58178). Supplementary Figure 3B: 250/1764 neural-specificgenes are among the 1,805 differentially methylated in Bl-iPSC vs. NP-iPSC (P-value=0.05813). Supplementary Figure 3C: 63/526 genes up-regulated in hematopoieticstem cells are among the 1,133 genes hypomethylated in NP-iPSC-TSA-AZA vs NP-iPSC(P-value=0.00116).
Method Reference
50. Kirov G, et al. Variation in the protocadherin gamma A gene cluster. Genomics. 2003; 82:433–440. [PubMed: 13679023]
51. Markoulaki S, et al. Transgenic mice with defined combinations of drug-inducible reprogrammingfactors. Nat Biotechnol. 2009; 27:169–171. Epub 2009 Jan 2018. [PubMed: 19151700]
52. Koh EY, Chen T, Daley GQ. Novel retroviral vectors to facilitate expression screens inmammalian cells. Nucleic Acids Res. 2002; 30:e142. [PubMed: 12490733]
53. Conti L, et al. Niche-independent symmetrical self-renewal of a mammalian tissue stem cell. PLoSBiol. 2005; 3:e283. Epub 2005 Aug 2016. [PubMed: 16086633]
54. Schiedlmeier B, et al. HOXB4’s road map to stem cell expansion. Proc Natl Acad Sci U S A. 2007;104:16952–16957. Epub 12007 Oct 16916. [PubMed: 17940039]
55. Pavlidis P, Noble WS. Analysis of strain and regional variation in gene expression in mouse brain.Genome biology. 2001:2. RESEARCH0042.
References1. Takahashi K, Yamanaka S. Induction of pluripotent stem cells from mouse embryonic and adult
fibroblast cultures by defined factors. Cell. 2006; 126:663–676. Epub 2006 Aug 2010. [PubMed:16904174]
2. Zhao XY, et al. iPS cells produce viable mice through tetraploid complementation. Nature. 2009;461:86–90. [PubMed: 19672241]
3. Daley GQ, et al. Broader implications of defining standards for the pluripotency of iPSCs. Cell StemCell. 2009; 4:200–201. author reply 202. [PubMed: 19265657]
4. Marion RM, et al. A p53-mediated DNA damage response limits reprogramming to ensure iPS cellgenomic integrity. Nature. 2009; 460:1149–1153. [PubMed: 19668189]
5. Li H, et al. The Ink4/Arf locus is a barrier for iPS cell reprogramming. Nature. 2009; 460:1136–1139. [PubMed: 19668188]
6. Eminli S, et al. Differentiation stage determines potential of hematopoietic cells for reprogramminginto induced pluripotent stem cells. Nat Genet. 2009; 41:968–976. [PubMed: 19668214]
7. Gurdon JB, Melton DA. Nuclear reprogramming in cells. Science. 2008; 322:1811–1815. [PubMed:19095934]
8. Blelloch R, et al. Reprogramming efficiency following somatic cell nuclear transfer is influenced bythe differentiation and methylation state of the donor nucleus. Stem Cells. 2006; 24:2007–2013.Epub 2006 May 2018. [PubMed: 16709876]
9. Maherali N, et al. A high-efficiency system for the generation and study of human inducedpluripotent stem cells. Cell stem cell. 2008; 3:340–345. [PubMed: 18786420]
10. Aoi T, et al. Generation of pluripotent stem cells from adult mouse liver and stomach cells.Science. 2008; 321:699–702. Epub 2008 Feb 2014. [PubMed: 18276851]
11. Miura K, et al. Variation in the safety of induced pluripotent stem cell lines. Nat Biotechnol. 2009;27:743–745. [PubMed: 19590502]
Kim et al. Page 12
Nature. Author manuscript; available in PMC 2011 August 05.
NIH
-PA Author Manuscript
NIH
-PA Author Manuscript
NIH
-PA Author Manuscript
12. Chan EM, et al. Live cell imaging distinguishes bona fide human iPS cells from partiallyreprogrammed cells. Nat Biotechnol. 2009
13. Mikkelsen TS, et al. Dissecting direct reprogramming through integrative genomic analysis.Nature. 2008; 454:49–55. [PubMed: 18509334]
14. Santos F, Hendrich B, Reik W, Dean W. Dynamic reprogramming of DNA methylation in theearly mouse embryo. Dev Biol. 2002; 241:172–182. [PubMed: 11784103]
15. Skow LC, et al. A mouse model for beta-thalassemia. Cell. 1983; 34:1043–1052. [PubMed:6313205]
16. Kyba M, Perlingeiro RC, Daley GQ. HoxB4 confers definitive lymphoid-myeloid engraftmentpotential on embryonic stem cell and yolk sac hematopoietic progenitors. Cell. 2002; 109:29–37.[PubMed: 11955444]
17. Bourne S, Polak JM, Hughes SP, Buttery LD. Osteogenic differentiation of mouse embryonic stemcells: differential gene expression analysis by cDNA microarray and purification of osteoblasts bycadherin-11 magnetically activated cell sorting. Tissue Eng. 2004; 10:796–806. [PubMed:15265297]
18. Wdziekonski B, Villageois P, Dani C. Differentiation of mouse embryonic stem cells and ofhuman adult stem cells into adipocytes. Curr Protoc Cell Biol. 2007 Chapter 23, Unit 23.24.
19. Hood RC, Neill WM. A modification of alizarin red S technic for demonstrating bone formation.Stain Technol. 1948; 23:209–218. [PubMed: 18884571]
20. Irizarry RA, et al. Comprehensive high-throughput arrays for relative methylation (CHARM).Genome Res. 2008; 18:780–790. [PubMed: 18316654]
21. Irizarry RA, et al. The human colon cancer methylome shows similar hypo- and hypermethylationat conserved tissue-specific CpG island shores. Nat Genet. 2009; 41:178–186. [PubMed:19151715]
22. Doi A, et al. Differential methylation of tissue- and cancer-specific CpG island shoresdistinguishes human induced pluripotent stem cells, embryonic stem cells and fibroblasts. NatGenet. 2009
23. Cahan P, Li H, Collins JJ, Daley QG. Tissue-specific gene expression and autoregulatory loops.2010 manuscript in preparation.
24. Turker MS. Gene silencing in mammalian cells and the spread of DNA methylation. Oncogene.2002; 21:5388–5393. [PubMed: 12154401]
25. Ji H, et al. A comprehensive methylome map of myeloid and lymphoid commitment inhematopoietic progenitors. 2010 Submitted.
26. Perez-Iratxeta C, et al. Study of stem cell function using microarray experiments. FEBS Lett. 2005;579:1795–1801. [PubMed: 15763554]
27. Kim J, Chu J, Shen X, Wang J, Orkin SH. An extended transcriptional network for pluripotency ofembryonic stem cells. Cell. 2008; 132:1049–1061. [PubMed: 18358816]
28. Wernig M, et al. In vitro reprogramming of fibroblasts into a pluripotent ES- cell-like state. Nature.2007; 448:318–324. Epub 2007 Jun 2006. [PubMed: 17554336]
29. Wernig M, et al. A drug-inducible transgenic system for direct reprogramming of multiple somaticcell types. Nat Biotechnol. 2008; 26:916–924. Epub 2008 Jul 2001. [PubMed: 18594521]
30. Hanna J, et al. Direct reprogramming of terminally differentiated mature B lymphocytes topluripotency. Cell. 2008; 133:250–264. [PubMed: 18423197]
31. Brambrink T, Hochedlinger K, Bell G, Jaenisch R. ES cells derived from cloned and fertilizedblastocysts are transcriptionally and functionally indistinguishable. Proc Natl Acad Sci U S A.2006; 103:933–938. Epub 2006 Jan 2017. [PubMed: 16418286]
32. Eggan K, et al. Hybrid vigor, fetal overgrowth, and viability of mice derived by nuclear cloningand tetraploid embryo complementation. Proc Natl Acad Sci U S A. 2001; 98:6209–6214.[PubMed: 11331774]
33. Nadin BM, Goodell MA, Hirschi KK. Phenotype and hematopoietic potential of side populationcells throughout embryonic development. Blood. 2003; 102:2436–2443. Epub 2003 Jun 2412.[PubMed: 12805065]
Kim et al. Page 13
Nature. Author manuscript; available in PMC 2011 August 05.
NIH
-PA Author Manuscript
NIH
-PA Author Manuscript
NIH
-PA Author Manuscript
34. Eden S, Hashimshony T, Keshet I, Cedar H, Thorne AW. DNA methylation models histoneacetylation. Nature. 1998; 394:842. [PubMed: 9732866]
35. Chiu CP, Blau HM. 5-Azacytidine permits gene activation in a previously noninducible cell type.Cell. 1985; 40:417–424. [PubMed: 2578323]
36. Lengerke C, et al. BMP and Wnt specify hematopoietic fate by activation of the Cdx-Hox pathway.Cell stem cell. 2008; 2:72–82. [PubMed: 18371423]
37. Ball MP, et al. Targeted and genome-scale strategies reveal gene-body methylation signatures inhuman cells. Nat Biotechnol. 2009; 27:361–368. [PubMed: 19329998]
38. Kim JB, et al. Oct4-induced pluripotency in adult neural stem cells. Cell. 2009; 136:411–419.[PubMed: 19203577]
39. Loh YH, et al. Generation of induced pluripotent stem cells from human blood. Blood. 2009;113:5476–5479. [PubMed: 19299331]
40. Chin MH, et al. Induced pluripotent stem cells and embryonic stem cells are distinguished by geneexpression signatures. Cell stem cell. 2009; 5:111–123. [PubMed: 19570518]
41. Hanna J, et al. Direct cell reprogramming is a stochastic process amenable to acceleration. Nature.2009; 462:595–601. [PubMed: 19898493]
42. Okita K, Ichisaka T, Yamanaka S. Generation of germline-competent induced pluripotent stemcells. Nature. 2007; 448:313–317. Epub 2007 Jun 2006. [PubMed: 17554338]
43. Soldner F, et al. Parkinson’s disease patient-derived induced pluripotent stem cells free of viralreprogramming factors. Cell. 2009; 136:964–977. [PubMed: 19269371]
44. Stadtfeld M, et al. Aberrant silencing of imprinted genes on chromosome 12qF1 in mouse inducedpluripotent stem cells. Nature. 465:175–181. [PubMed: 20418860]
45. Bernstein BE, et al. A bivalent chromatin structure marks key developmental genes in embryonicstem cells. Cell. 2006; 125:315–326. [PubMed: 16630819]
46. Xu J, et al. Transcriptional competence and the active marking of tissue-specific enhancers bydefined transcription factors in embryonic and induced pluripotent stem cells. Genes Dev. 2009;23:2824–2838. [PubMed: 20008934]
47. Osafune K, et al. Marked differences in differentiation propensity among human embryonic stemcell lines. Nat Biotechnol. 2008; 26:313–315. [PubMed: 18278034]
48. Silva J, et al. Promotion of reprogramming to ground state pluripotency by signal inhibition. PLoSBiol. 2008; 6:e253. [PubMed: 18942890]
49. Nomlru T, Kaneco S, Tanaka T, I to S, Kawaguchi H. Determination of Calcium Content in Cellsby Inductively Coupled Plasma Spectrometry Individual BiologicalAtomic Emission. Anal. Chem.1994; 66:3000–3004.
Kim et al. Page 14
Nature. Author manuscript; available in PMC 2011 August 05.
NIH
-PA Author Manuscript
NIH
-PA Author Manuscript
NIH
-PA Author Manuscript
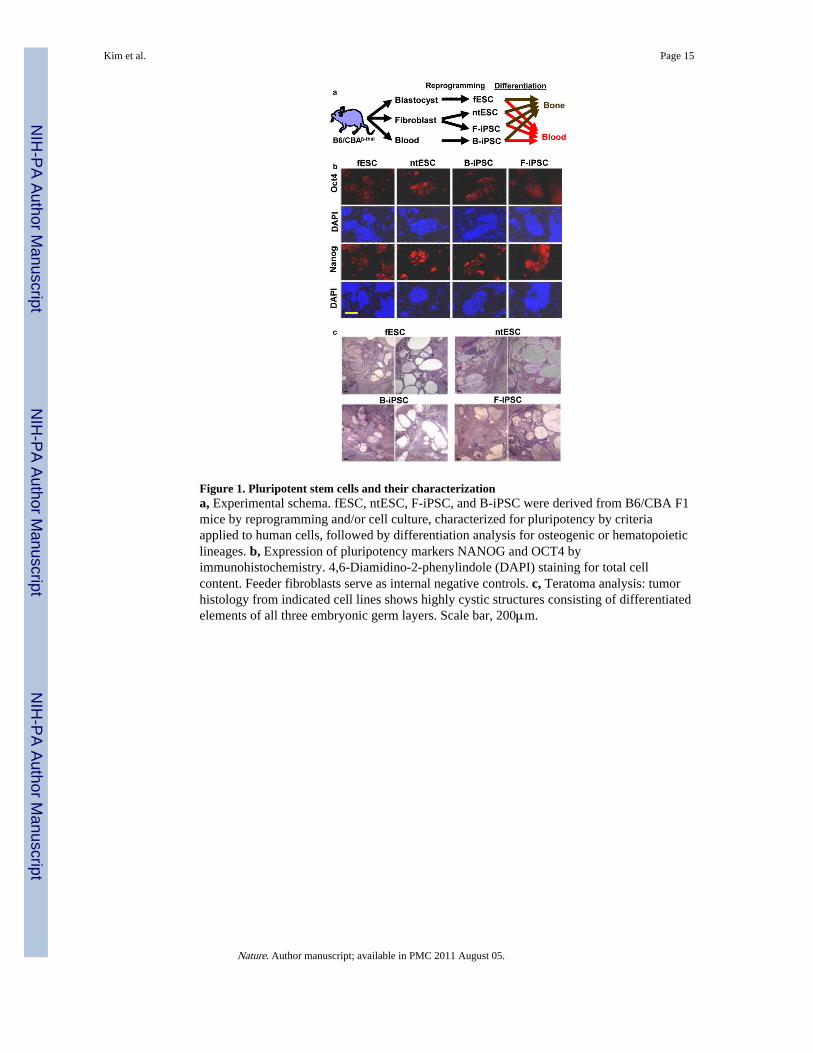
Figure 1. Pluripotent stem cells and their characterizationa, Experimental schema. fESC, ntESC, F-iPSC, and B-iPSC were derived from B6/CBA F1mice by reprogramming and/or cell culture, characterized for pluripotency by criteriaapplied to human cells, followed by differentiation analysis for osteogenic or hematopoieticlineages. b, Expression of pluripotency markers NANOG and OCT4 byimmunohistochemistry. 4,6-Diamidino-2-phenylindole (DAPI) staining for total cellcontent. Feeder fibroblasts serve as internal negative controls. c, Teratoma analysis: tumorhistology from indicated cell lines shows highly cystic structures consisting of differentiatedelements of all three embryonic germ layers. Scale bar, 200μm.
Kim et al. Page 15
Nature. Author manuscript; available in PMC 2011 August 05.
NIH
-PA Author Manuscript
NIH
-PA Author Manuscript
NIH
-PA Author Manuscript
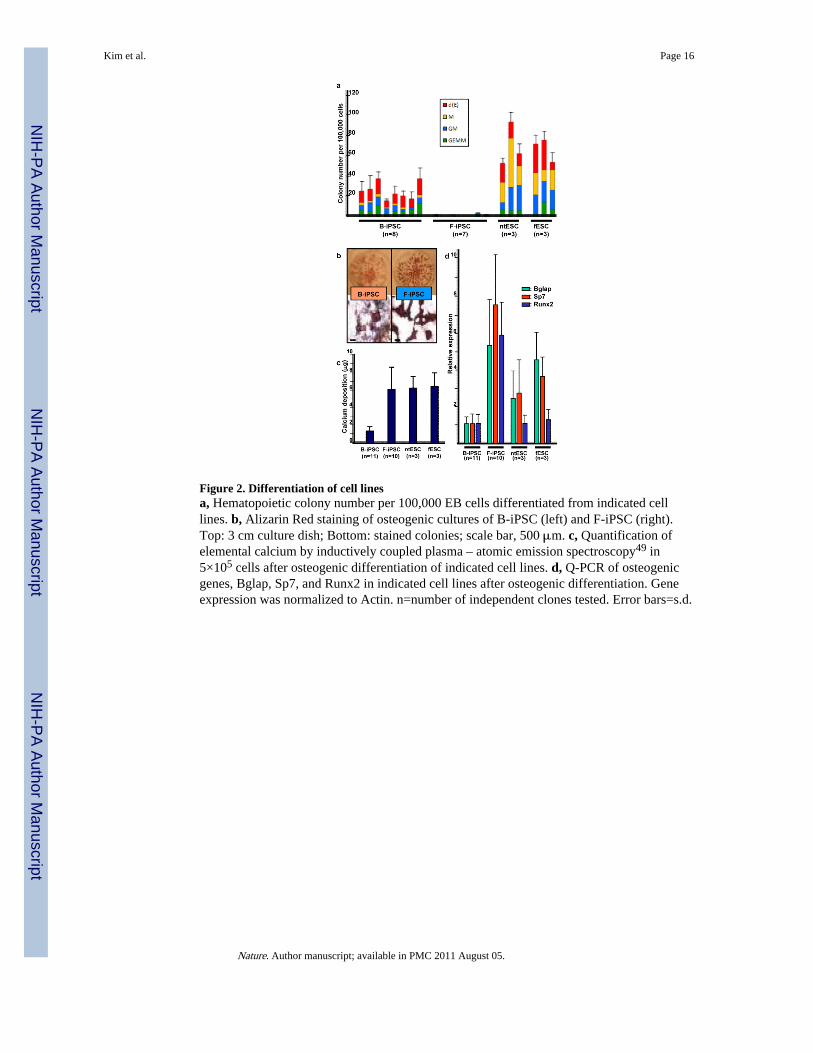
Figure 2. Differentiation of cell linesa, Hematopoietic colony number per 100,000 EB cells differentiated from indicated celllines. b, Alizarin Red staining of osteogenic cultures of B-iPSC (left) and F-iPSC (right).Top: 3 cm culture dish; Bottom: stained colonies; scale bar, 500 μm. c, Quantification ofelemental calcium by inductively coupled plasma – atomic emission spectroscopy49 in5×105 cells after osteogenic differentiation of indicated cell lines. d, Q-PCR of osteogenicgenes, Bglap, Sp7, and Runx2 in indicated cell lines after osteogenic differentiation. Geneexpression was normalized to Actin. n=number of independent clones tested. Error bars=s.d.
Kim et al. Page 16
Nature. Author manuscript; available in PMC 2011 August 05.
NIH
-PA Author Manuscript
NIH
-PA Author Manuscript
NIH
-PA Author Manuscript
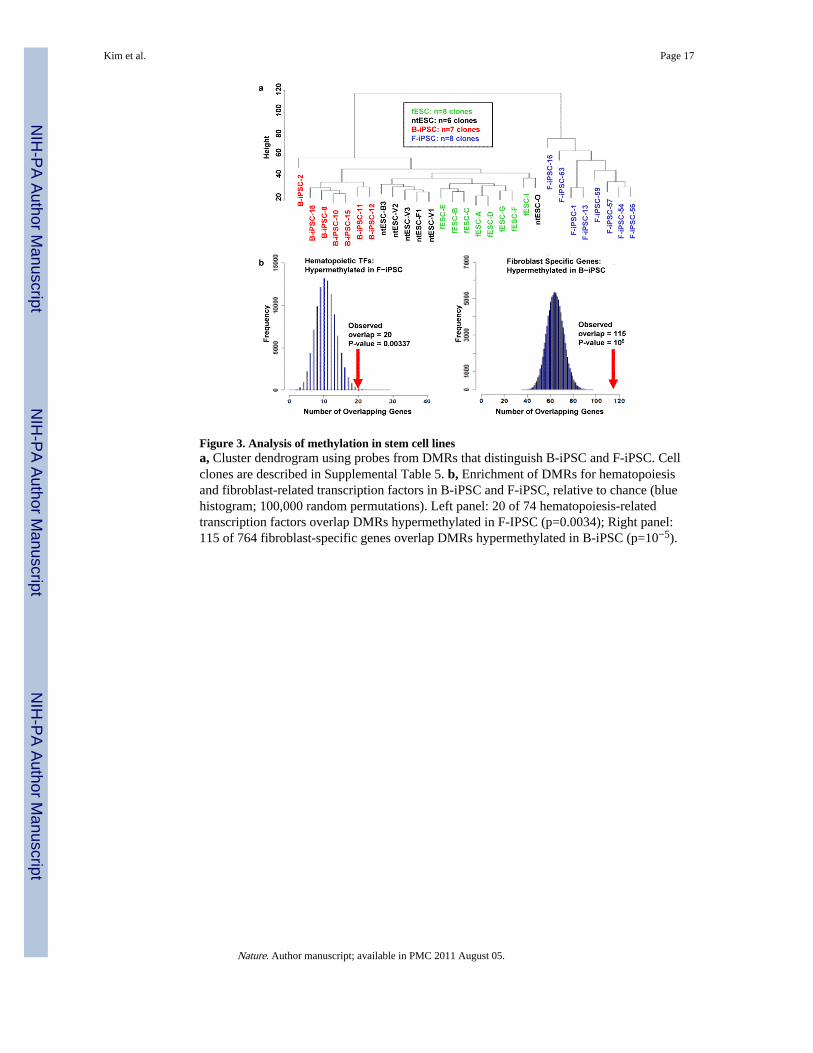
Figure 3. Analysis of methylation in stem cell linesa, Cluster dendrogram using probes from DMRs that distinguish B-iPSC and F-iPSC. Cellclones are described in Supplemental Table 5. b, Enrichment of DMRs for hematopoiesisand fibroblast-related transcription factors in B-iPSC and F-iPSC, relative to chance (bluehistogram; 100,000 random permutations). Left panel: 20 of 74 hematopoiesis-relatedtranscription factors overlap DMRs hypermethylated in F-IPSC (p=0.0034); Right panel:115 of 764 fibroblast-specific genes overlap DMRs hypermethylated in B-iPSC (p=10−5).
Kim et al. Page 17
Nature. Author manuscript; available in PMC 2011 August 05.
NIH
-PA Author Manuscript
NIH
-PA Author Manuscript
NIH
-PA Author Manuscript
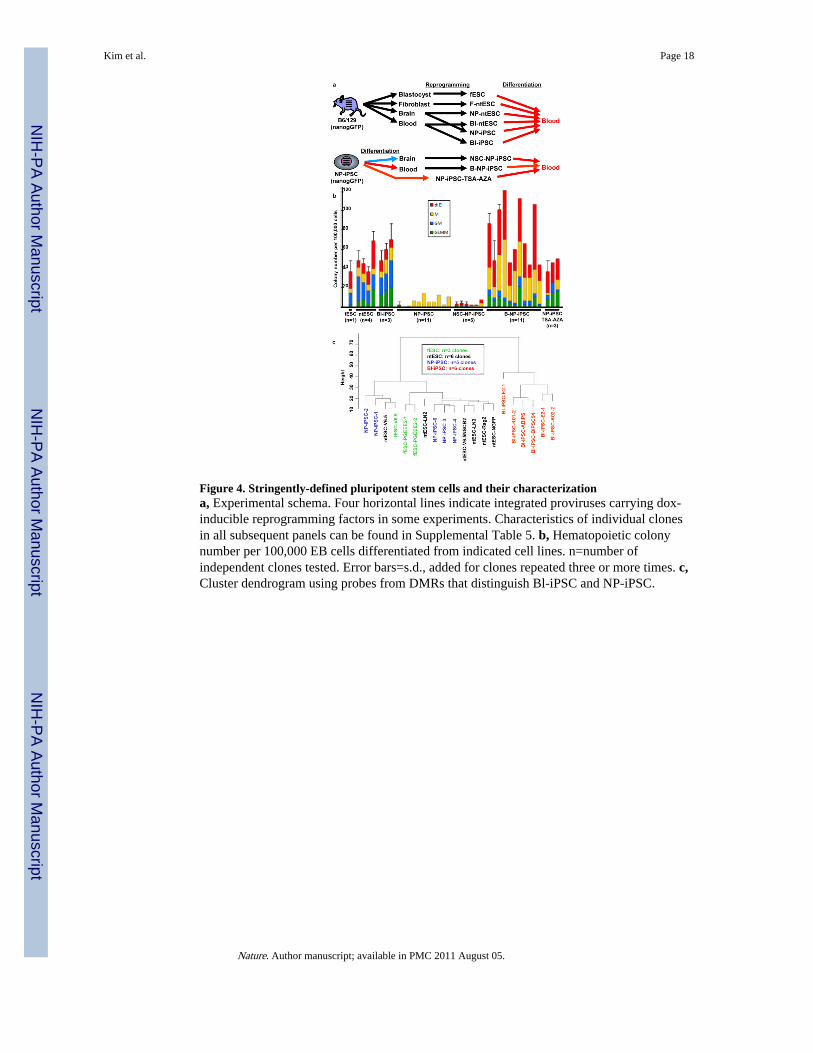
Figure 4. Stringently-defined pluripotent stem cells and their characterizationa, Experimental schema. Four horizontal lines indicate integrated proviruses carrying dox-inducible reprogramming factors in some experiments. Characteristics of individual clonesin all subsequent panels can be found in Supplemental Table 5. b, Hematopoietic colonynumber per 100,000 EB cells differentiated from indicated cell lines. n=number ofindependent clones tested. Error bars=s.d., added for clones repeated three or more times. c,Cluster dendrogram using probes from DMRs that distinguish Bl-iPSC and NP-iPSC.
Kim et al. Page 18
Nature. Author manuscript; available in PMC 2011 August 05.
NIH
-PA Author Manuscript
NIH
-PA Author Manuscript
NIH
-PA Author Manuscript