Embed Size (px)
Citation preview

Tivoli Manager for Oracle**Reference GuideVersion 2.0


Tivoli Manager for Oracle**Reference GuideVersion 2.0

Tivoli Manager for Oracle** Reference Guide (December 2000)
Copyright Notice
© Copyright IBM Corporation 2000 All rights reserved. May only be used pursuant to a TivoliSystems Software License Agreement, an IBM Software License Agreement, or Addendum forTivoli Products to IBM Customer or License Agreement. No part of this publication may bereproduced, transmitted, transcribed, stored in a retrieval system, or translated into any computerlanguage, in any form or by any means, electronic, mechanical, magnetic, optical, chemical,manual, or otherwise, without prior written permission of IBM Corporation. IBM Corporationgrants you limited permission to make hardcopy or other reproductions of any machine-readabledocumentation for your own use, provided that each such reproduction shall carry the IBMCorporation copyright notice. No other rights under copyright are granted without prior writtenpermission of IBM Corporation. The document is not intended for production and is furnished“as is” without warranty of any kind. All warranties on this document are hereby disclaimed,including the warranties of merchantability and fitness for a particular purpose.
U.S. Government Users Restricted Rights—Use, duplication or disclosure restricted by GSAADP Schedule Contract with IBM Corporation.
Trademarks
IBM, the IBM logo, Tivoli, the Tivoli logo, AIX, Cross-Site, NetView, OS/2, Planet Tivoli,RS/6000, Tivoli Certified, Tivoli Enterprise, Tivoli Ready, and TME are trademarks or registeredtrademarks of International Business Machines Corporation or Tivoli Systems Inc. in the UnitedStates, other countries, or both.
Microsoft, Windows, Windows NT, and the Windows logo are trademarks of MicrosoftCorporation in the United States, other countries, or both.
UNIX is a registered trademark of The Open Group in the United States and other countries.
Oracle is a registered trademark of Oracle Corporation.
Other company, product, and service names may be trademarks or service marks of others.Notices
References in this publication to Tivoli Systems or IBM products, programs, or services do notimply that they will be available in all countries in which Tivoli Systems or IBM operates. Anyreference to these products, programs, or services is not intended to imply that only TivoliSystems or IBM products, programs, or services can be used. Subject to valid intellectualproperty or other legally protectable right of Tivoli Systems or IBM, any functionally equivalentproduct, program, or service can be used instead of the referenced product, program, or service.The evaluation and verification of operation in conjunction with other products, except thoseexpressly designated by Tivoli Systems or IBM, are the responsibility of the user. Tivoli Systemsor IBM may have patents or pending patent applications covering subject matter in thisdocument. The furnishing of this document does not give you any license to these patents. Youcan send license inquiries, in writing, to the IBM Director of Licensing, IBM Corporation, NorthCastle Drive, Armonk, New York 10504-1785, U.S.A.

Contents
Preface. . . . . . . . . . . . . . . . . . . . . . . . . . . . . . . . . . . . . . . . . . . . . . . . . . . . . xiWho Should Read This Guide. . . . . . . . . . . . . . . . . . . . . . . . . . . . . . . . . . . xi
Prerequisite and Related Documents. . . . . . . . . . . . . . . . . . . . . . . . . . . . . . . xi
What This Guide Contains. . . . . . . . . . . . . . . . . . . . . . . . . . . . . . . . . . . . . xii
Viewing the Guide Online. . . . . . . . . . . . . . . . . . . . . . . . . . . . . . . . . . . . .xiii
Getting Online Help. . . . . . . . . . . . . . . . . . . . . . . . . . . . . . . . . . . . . . . . . .xiii
Typeface Conventions. . . . . . . . . . . . . . . . . . . . . . . . . . . . . . . . . . . . . . . . . xiv
Contacting Customer Support. . . . . . . . . . . . . . . . . . . . . . . . . . . . . . . . . . . xiv
Chapter 1. Introduction . . . . . . . . . . . . . . . . . . . . . . . . . . . . . . . . . . . . 1Using the Reference Manual. . . . . . . . . . . . . . . . . . . . . . . . . . . . . . . . . . . . . 2
How this Manual is Organized. . . . . . . . . . . . . . . . . . . . . . . . . . . . . . . 2
Using the Desktop or Command Line Interface. . . . . . . . . . . . . . . . . . . . . . . 3
Specifying Path Names. . . . . . . . . . . . . . . . . . . . . . . . . . . . . . . . . . . . . 3
Using the Tivoli Desktop. . . . . . . . . . . . . . . . . . . . . . . . . . . . . . . . . . . . 3
Using the Command Line. . . . . . . . . . . . . . . . . . . . . . . . . . . . . . . . . . . 3
Command Line Syntax. . . . . . . . . . . . . . . . . . . . . . . . . . . . . . . . . . . . . 4
Using the waddmon Command. . . . . . . . . . . . . . . . . . . . . . . . . . . . . . . 5
Using the wruntask Command. . . . . . . . . . . . . . . . . . . . . . . . . . . . . . . . 5
Script for Creating Sample Monitoring Profiles. . . . . . . . . . . . . . . . . . . . . . . 6
Understanding Monitor Output. . . . . . . . . . . . . . . . . . . . . . . . . . . . . . . . . . . 6
Using Distributed Monitoring Logging. . . . . . . . . . . . . . . . . . . . . . . . . . . . . . 9
Configuring Distributed Monitoring Logging on the TMR Server. . . . . . 9
Configuring Distributed Monitoring Logging on the Endpoint. . . . . . . 10
References to Oracle Commands, Tables, and Logs. . . . . . . . . . . . . . . . . . . 11
Chapter 2. Database Monitors . . . . . . . . . . . . . . . . . . . . . . . . . . . 13
iiiTivoli Manager for Oracle** Reference Guide

List of OracleDatabaseManager Monitoring Sources. . . . . . . . . . . . . . . . . . . 13
Advanced Queue Propagation Status (8i). . . . . . . . . . . . . . . . . . . . . . . . . . . 16
AQ (Advanced Queue) Schedule Propagation errors (8i). . . . . . . . . . . . . . . 19
Alerts . . . . . . . . . . . . . . . . . . . . . . . . . . . . . . . . . . . . . . . . . . . . . . . . . . . . . 22
Archive Free Space. . . . . . . . . . . . . . . . . . . . . . . . . . . . . . . . . . . . . . . . . . . 26
Archive Percent Free Space. . . . . . . . . . . . . . . . . . . . . . . . . . . . . . . . . . . . . 29
Archive Space (Number of Redo Logs). . . . . . . . . . . . . . . . . . . . . . . . . . . . 32
Archive Used Space. . . . . . . . . . . . . . . . . . . . . . . . . . . . . . . . . . . . . . . . . . 35
Average Message Propagation Rate (across schedule) (8i). . . . . . . . . . . . . . 37
Average waiting time of“READY” messages (8i). . . . . . . . . . . . . . . . . . . . 40
Background Dump Space. . . . . . . . . . . . . . . . . . . . . . . . . . . . . . . . . . . . . . 43
Blocked Transactions. . . . . . . . . . . . . . . . . . . . . . . . . . . . . . . . . . . . . . . . . . 46
Chained Rows (cluster). . . . . . . . . . . . . . . . . . . . . . . . . . . . . . . . . . . . . . . . 49
Chained Rows (table). . . . . . . . . . . . . . . . . . . . . . . . . . . . . . . . . . . . . . . . . 53
Currently running Heterogeneous Services (8i). . . . . . . . . . . . . . . . . . . . . . . 58
Extents. . . . . . . . . . . . . . . . . . . . . . . . . . . . . . . . . . . . . . . . . . . . . . . . . . . . 61
Extents by Tablespace. . . . . . . . . . . . . . . . . . . . . . . . . . . . . . . . . . . . . . . . . 64
Extents by User. . . . . . . . . . . . . . . . . . . . . . . . . . . . . . . . . . . . . . . . . . . . . . 68
Free Space Deficit. . . . . . . . . . . . . . . . . . . . . . . . . . . . . . . . . . . . . . . . . . . . 71
Free Space Deficit by Tablespace. . . . . . . . . . . . . . . . . . . . . . . . . . . . . . . . . 75
Free Space Deficit by User. . . . . . . . . . . . . . . . . . . . . . . . . . . . . . . . . . . . . 80
Free Space Fragmentation. . . . . . . . . . . . . . . . . . . . . . . . . . . . . . . . . . . . . . 84
Free Space Fragmentation by Tablespace. . . . . . . . . . . . . . . . . . . . . . . . . . . 87
Free Tablespace. . . . . . . . . . . . . . . . . . . . . . . . . . . . . . . . . . . . . . . . . . . . . . 91
Free Tablespace by Tablespace. . . . . . . . . . . . . . . . . . . . . . . . . . . . . . . . . . . 95
Index Statistics. . . . . . . . . . . . . . . . . . . . . . . . . . . . . . . . . . . . . . . . . . . . . . 99
Long Running Transactions. . . . . . . . . . . . . . . . . . . . . . . . . . . . . . . . . . . . 102
iv Version 2.0

Maximum Extents. . . . . . . . . . . . . . . . . . . . . . . . . . . . . . . . . . . . . . . . . . . 105
Maximum Extents by Tablespace. . . . . . . . . . . . . . . . . . . . . . . . . . . . . . . . 109
Maximum Extents by User. . . . . . . . . . . . . . . . . . . . . . . . . . . . . . . . . . . . . 113
NT Service Status. . . . . . . . . . . . . . . . . . . . . . . . . . . . . . . . . . . . . . . . . . . 117
Number of Datafiles. . . . . . . . . . . . . . . . . . . . . . . . . . . . . . . . . . . . . . . . . 120
Rows in DUAL Table. . . . . . . . . . . . . . . . . . . . . . . . . . . . . . . . . . . . . . . . 123
SQL Number. . . . . . . . . . . . . . . . . . . . . . . . . . . . . . . . . . . . . . . . . . . . . . . 125
SQL String. . . . . . . . . . . . . . . . . . . . . . . . . . . . . . . . . . . . . . . . . . . . . . . . 129
Temporary Extents. . . . . . . . . . . . . . . . . . . . . . . . . . . . . . . . . . . . . . . . . . . 133
Temporary Extents by Tablespace. . . . . . . . . . . . . . . . . . . . . . . . . . . . . . . 136
Temporary Extents by User. . . . . . . . . . . . . . . . . . . . . . . . . . . . . . . . . . . . 141
Total waiting time of READY messages. . . . . . . . . . . . . . . . . . . . . . . . . . 145
Unix Core Dump Space. . . . . . . . . . . . . . . . . . . . . . . . . . . . . . . . . . . . . . . 148
Unix SQL*Net V1 TCP/IP Listener. . . . . . . . . . . . . . . . . . . . . . . . . . . . . . 151
Unix SQL*Net V2 Listener. . . . . . . . . . . . . . . . . . . . . . . . . . . . . . . . . . . . 154
User Dump Space. . . . . . . . . . . . . . . . . . . . . . . . . . . . . . . . . . . . . . . . . . . 158
Chapter 3. Instance Monitors. . . . . . . . . . . . . . . . . . . . . . . . . . . 161Value Ranges. . . . . . . . . . . . . . . . . . . . . . . . . . . . . . . . . . . . . . . . . . . . . . . 161
List of OracleInstanceManager Monitoring Sources. . . . . . . . . . . . . . . . . . 162
Active Transactions. . . . . . . . . . . . . . . . . . . . . . . . . . . . . . . . . . . . . . . . . . 165
Any v$lock . . . . . . . . . . . . . . . . . . . . . . . . . . . . . . . . . . . . . . . . . . . . . . . . 168
Any v$sysstat. . . . . . . . . . . . . . . . . . . . . . . . . . . . . . . . . . . . . . . . . . . . . . 172
Average Redo Entry Size. . . . . . . . . . . . . . . . . . . . . . . . . . . . . . . . . . . . . . 174
Block Changes Per Transaction. . . . . . . . . . . . . . . . . . . . . . . . . . . . . . . . . 176
Block Get Rate. . . . . . . . . . . . . . . . . . . . . . . . . . . . . . . . . . . . . . . . . . . . . 178
Buffer Cache Hit Ratio. . . . . . . . . . . . . . . . . . . . . . . . . . . . . . . . . . . . . . . 180
vTivoli Manager for Oracle** Reference Guide

Buffer Cache Hit Ratio (Interval). . . . . . . . . . . . . . . . . . . . . . . . . . . . . . . . 183
Buffer Waits Ratio. . . . . . . . . . . . . . . . . . . . . . . . . . . . . . . . . . . . . . . . . . . 186
Call Rate. . . . . . . . . . . . . . . . . . . . . . . . . . . . . . . . . . . . . . . . . . . . . . . . . . 189
Calls Per Transaction. . . . . . . . . . . . . . . . . . . . . . . . . . . . . . . . . . . . . . . . . 192
Changed Block Ratio. . . . . . . . . . . . . . . . . . . . . . . . . . . . . . . . . . . . . . . . . 194
Cluster Key Ratio. . . . . . . . . . . . . . . . . . . . . . . . . . . . . . . . . . . . . . . . . . . 196
Completed Background Checkpoints. . . . . . . . . . . . . . . . . . . . . . . . . . . . . 198
Consistent Change Ratio. . . . . . . . . . . . . . . . . . . . . . . . . . . . . . . . . . . . . . 201
Continued Row Ratio. . . . . . . . . . . . . . . . . . . . . . . . . . . . . . . . . . . . . . . . 203
DBWR Checkpoints. . . . . . . . . . . . . . . . . . . . . . . . . . . . . . . . . . . . . . . . . 206
Dictionary Cache Hit Ratio. . . . . . . . . . . . . . . . . . . . . . . . . . . . . . . . . . . . 208
Dictionary Cache Hit Ratio (Interval). . . . . . . . . . . . . . . . . . . . . . . . . . . . . 211
Dispatcher Busy Rate. . . . . . . . . . . . . . . . . . . . . . . . . . . . . . . . . . . . . . . . 214
Dispatcher Wait Times. . . . . . . . . . . . . . . . . . . . . . . . . . . . . . . . . . . . . . . . 217
DML Locks Ratio. . . . . . . . . . . . . . . . . . . . . . . . . . . . . . . . . . . . . . . . . . . 220
Enqueue Timeouts. . . . . . . . . . . . . . . . . . . . . . . . . . . . . . . . . . . . . . . . . . . 223
Freelist Waits Ratio. . . . . . . . . . . . . . . . . . . . . . . . . . . . . . . . . . . . . . . . . . 226
Library Cache Hit Ratio. . . . . . . . . . . . . . . . . . . . . . . . . . . . . . . . . . . . . . 229
Library Cache Hit Ratio (Interval). . . . . . . . . . . . . . . . . . . . . . . . . . . . . . . 232
Lock Hit Ratio — Parallel Description. . . . . . . . . . . . . . . . . . . . . . . . . . . . 235
Long Table Full Table Scans (Interval). . . . . . . . . . . . . . . . . . . . . . . . . . . . 237
Number of Deadlocks. . . . . . . . . . . . . . . . . . . . . . . . . . . . . . . . . . . . . . . . 239
Open Cursors. . . . . . . . . . . . . . . . . . . . . . . . . . . . . . . . . . . . . . . . . . . . . . 242
PCM Conversion Waits. . . . . . . . . . . . . . . . . . . . . . . . . . . . . . . . . . . . . . . 245
PCM Lock Conversion Time. . . . . . . . . . . . . . . . . . . . . . . . . . . . . . . . . . . 247
Percentage of False Pings. . . . . . . . . . . . . . . . . . . . . . . . . . . . . . . . . . . . . 249
Physical I/O Reads. . . . . . . . . . . . . . . . . . . . . . . . . . . . . . . . . . . . . . . . . . 251
vi Version 2.0
Physical I/O Writes. . . . . . . . . . . . . . . . . . . . . . . . . . . . . . . . . . . . . . . . . . 254
Ping Rate. . . . . . . . . . . . . . . . . . . . . . . . . . . . . . . . . . . . . . . . . . . . . . . . . 257
Process Ratio. . . . . . . . . . . . . . . . . . . . . . . . . . . . . . . . . . . . . . . . . . . . . . . 259
RDBMS State. . . . . . . . . . . . . . . . . . . . . . . . . . . . . . . . . . . . . . . . . . . . . . 262
Recursive Call Rate. . . . . . . . . . . . . . . . . . . . . . . . . . . . . . . . . . . . . . . . . . 265
Recursive Calls. . . . . . . . . . . . . . . . . . . . . . . . . . . . . . . . . . . . . . . . . . . . . 268
Recursive To User Calls Ratio. . . . . . . . . . . . . . . . . . . . . . . . . . . . . . . . . . 271
Redo Allocation Latch Ratio. . . . . . . . . . . . . . . . . . . . . . . . . . . . . . . . . . . 274
Redo Copy Latch Ratio. . . . . . . . . . . . . . . . . . . . . . . . . . . . . . . . . . . . . . . 277
Redo Log Space Waits. . . . . . . . . . . . . . . . . . . . . . . . . . . . . . . . . . . . . . . . 279
Redo Logs Not Archived. . . . . . . . . . . . . . . . . . . . . . . . . . . . . . . . . . . . . . 282
Redo Small Copy Ratio. . . . . . . . . . . . . . . . . . . . . . . . . . . . . . . . . . . . . . . 285
Rollback Waits. . . . . . . . . . . . . . . . . . . . . . . . . . . . . . . . . . . . . . . . . . . . . 288
Row Source Ratio. . . . . . . . . . . . . . . . . . . . . . . . . . . . . . . . . . . . . . . . . . . 290
Shared Server Process Ratio. . . . . . . . . . . . . . . . . . . . . . . . . . . . . . . . . . . 293
Shared Server Wait Time. . . . . . . . . . . . . . . . . . . . . . . . . . . . . . . . . . . . . . 296
Sort Overflow Ratio. . . . . . . . . . . . . . . . . . . . . . . . . . . . . . . . . . . . . . . . . 298
User Rollback Ratio. . . . . . . . . . . . . . . . . . . . . . . . . . . . . . . . . . . . . . . . . 301
Chapter 4. Async Monitors . . . . . . . . . . . . . . . . . . . . . . . . . . . . . 303List of OracleManagerAsync Monitoring Sources. . . . . . . . . . . . . . . . . . . . 303
Extents— Background and Asynchronous. . . . . . . . . . . . . . . . . . . . . . . . . 306
Extents— Background. . . . . . . . . . . . . . . . . . . . . . . . . . . . . . . . . . . 308
Extents— Asynchronous. . . . . . . . . . . . . . . . . . . . . . . . . . . . . . . . . . 309
Extents by Tablespace— Background and Asynchronous. . . . . . . . . . . . . . 311
Extents by Tablespace— Background. . . . . . . . . . . . . . . . . . . . . . . . 312
Extents by Tablespace— Asynchronous. . . . . . . . . . . . . . . . . . . . . . . 314
Extents by User— Background and Asynchronous. . . . . . . . . . . . . . . . . . 316
viiTivoli Manager for Oracle** Reference Guide

Extents by User— Background. . . . . . . . . . . . . . . . . . . . . . . . . . . . . 317
Extents by User— Asynchronous. . . . . . . . . . . . . . . . . . . . . . . . . . . 319
Free Space Deficit— Background and Asynchronous. . . . . . . . . . . . . . . . 321
Free Space Deficit— Background. . . . . . . . . . . . . . . . . . . . . . . . . . . 323
Free Space Deficit— Asynchronous. . . . . . . . . . . . . . . . . . . . . . . . . 324
Free Space Deficit by Tablespace— Background and Asynchronous. . . . . 326
Free Space Deficit by Tablespace— Background. . . . . . . . . . . . . . . . 328
Free Space Deficit by Tablespace— Asynchronous. . . . . . . . . . . . . . 330
Free Space Deficit by User— Background and Asynchronous. . . . . . . . . . 332
Free Space Deficit by User— Background. . . . . . . . . . . . . . . . . . . . 334
Free Space Deficit by User— Asynchronous. . . . . . . . . . . . . . . . . . . 335
Index Statistics— Background and Asynchronous. . . . . . . . . . . . . . . . . . . 337
Index Statistics— Background. . . . . . . . . . . . . . . . . . . . . . . . . . . . . 338
Index Statistics— Asynchronous. . . . . . . . . . . . . . . . . . . . . . . . . . . . 339
Maximum Extents— Background and Asynchronous. . . . . . . . . . . . . . . . . 341
Maximum Extents— Background. . . . . . . . . . . . . . . . . . . . . . . . . . . 343
Maximum Extents— Asynchronous. . . . . . . . . . . . . . . . . . . . . . . . . 344
Maximum Extents by Tablespace— Background and Asynchronous. . . . . 346
Maximum Extents by Tablespace— Background. . . . . . . . . . . . . . . . 348
Maximum Extents by Tablespace—Asynchronous. . . . . . . . . . . . . . . 350
Maximum Extents by User— Background and Asynchronous. . . . . . . . . . 352
Maximum Extents by User— background. . . . . . . . . . . . . . . . . . . . . 354
Maximum Extents by User— Asynchronous. . . . . . . . . . . . . . . . . . . 355
SQL Number— Background and Asynchronous. . . . . . . . . . . . . . . . . . . . 357
SQL Number— Background. . . . . . . . . . . . . . . . . . . . . . . . . . . . . . . 359
SQL Number— Asynchronous. . . . . . . . . . . . . . . . . . . . . . . . . . . . . 361
SQL String— Background and Asynchronous. . . . . . . . . . . . . . . . . . . . . . 363
SQL String— Background. . . . . . . . . . . . . . . . . . . . . . . . . . . . . . . . 365
SQL String— Asynchronous. . . . . . . . . . . . . . . . . . . . . . . . . . . . . . . 367
viii Version 2.0
Temporary Extents— Background and Asynchronous. . . . . . . . . . . . . . . . 369
Temporary Extents— Background. . . . . . . . . . . . . . . . . . . . . . . . . . . 371
Temporary Extents— Asynchronous. . . . . . . . . . . . . . . . . . . . . . . . . 372
Temporary Extents by Tablespace— Background and Asynchronous. . . . . 374
Temporary Extents by Tablespace— Background. . . . . . . . . . . . . . . 376
Temporary Extents by Tablespace— Asynchronous. . . . . . . . . . . . . . 378
Temporary Extents by User— Background and Asynchronous. . . . . . . . . . 380
Temporary Extents by User— Background. . . . . . . . . . . . . . . . . . . . 382
Temporary Extents by User— Asynchronous. . . . . . . . . . . . . . . . . . . 383
Unix SQL*Net V1 TCP/IP Listener— Background and Asynchronous 385
Unix SQL*Net V1 TCP/IP Listener— Background. . . . . . . . . . . . . . 387
Unix SQL*Net V1 TCP/IP Listener— Asynchronous. . . . . . . . . . . . 388
Unix SQL*Net V2 Listener— Background and Asynchronous. . . . . . . . . . 390
Unix SQL *Net V2 Listener— Background. . . . . . . . . . . . . . . . . . . 392
Unix SQL *Net V2 Listener— Asynchronous. . . . . . . . . . . . . . . . . . 393
Chapter 5. Tasks . . . . . . . . . . . . . . . . . . . . . . . . . . . . . . . . . . . . . . . . 395List of Tasks by GUI and CLI Names. . . . . . . . . . . . . . . . . . . . . . . . . . . . 395
Common Task Dialogs. . . . . . . . . . . . . . . . . . . . . . . . . . . . . . . . . . . . . . . . 396
Using the Create a Report File Dialog. . . . . . . . . . . . . . . . . . . . . . . . 396
Using the TEC Dialog. . . . . . . . . . . . . . . . . . . . . . . . . . . . . . . . . . . . 398
ConfigureTECOracle. . . . . . . . . . . . . . . . . . . . . . . . . . . . . . . . . . . . . . . . . 399
CurrentRunningSQL. . . . . . . . . . . . . . . . . . . . . . . . . . . . . . . . . . . . . . . . . 407
DisableMonitoring. . . . . . . . . . . . . . . . . . . . . . . . . . . . . . . . . . . . . . . . . . . 411
EnableMonitoring. . . . . . . . . . . . . . . . . . . . . . . . . . . . . . . . . . . . . . . . . . . 416
Listener. . . . . . . . . . . . . . . . . . . . . . . . . . . . . . . . . . . . . . . . . . . . . . . . . . . 420
Appendix A. Running Tivoli Commands . . . . . . . . . . . . . . . 425Running Tivoli Commands on UNIX. . . . . . . . . . . . . . . . . . . . . . . . . . . . . 426
ixTivoli Manager for Oracle** Reference Guide

Running Tivoli Commands on Windows NT. . . . . . . . . . . . . . . . . . . . . . . 426
Where to Find Additional Information about Shells. . . . . . . . . . . . . . . . . . 426
Establishing the Tivoli Environment within a Shell. . . . . . . . . . . . . . . . . . . 427
Setting the Tivoli Environment on UNIX. . . . . . . . . . . . . . . . . . . . . . 427
Setting the Tivoli Environment on Windows NT. . . . . . . . . . . . . . . . 428
Establishing the Tivoli Environment on an Endpoint. . . . . . . . . . . . . . . . . 428
Appendix B. Classes of Instance Monitors . . . . . . . . . . . . 431Cache Monitors. . . . . . . . . . . . . . . . . . . . . . . . . . . . . . . . . . . . . . . . . . . . . 432
Cumulative Monitors. . . . . . . . . . . . . . . . . . . . . . . . . . . . . . . . . . . . . . . . . 432
Interval Monitors. . . . . . . . . . . . . . . . . . . . . . . . . . . . . . . . . . . . . . . . . . . . 433
Point-in-Time Monitors. . . . . . . . . . . . . . . . . . . . . . . . . . . . . . . . . . . . . . . 434
Rate-based Monitors. . . . . . . . . . . . . . . . . . . . . . . . . . . . . . . . . . . . . . . . . 435
Appendix C. Operator Groups (Monitor Triggers) 437
Index . . . . . . . . . . . . . . . . . . . . . . . . . . . . . . . . . . . . . . . . . . . . . . . . . . . . . 443
x Version 2.0

Preface
The Tivoli Manager for Oracle Reference Guide provides detailedinformation about the tasks and monitors for Tivoli Manager forOracle. Use this manual in conjunction with theTivoli Manager forOracle User’s Guide.
Who Should Read This GuideThis manual is intended for system architects (for planning) andsystem administrators and database administrators (forimplementation and operation). Readers should haveadministrator-level understanding of the Windows NT or UNIXoperating system, Tivoli software, and Oracle software.
Prerequisite and Related DocumentsThe Tivoli Manager for Oracle User’s Guide describes how to installand use Tivoli Manager for Oracle.
The Tivoli Manager for Oracle User Management Guide describeshow to use the Tivoli Manager for Oracle User Managementapplication to manage Oracle users, roles, and resource profiles forOracle databases.
The Tivoli Framework User’s Guide contains more detailedinformation about profiles and profile management.
The Tivoli Framework Planning and Installation Guide containsmore detailed information about server and hardware requirements.
The Tivoli Framework Reference Guide contains additionalinformation about command line commands, such as thewinstallcommand.
The Tivoli Distributed Monitoring User’s Guide contains moreinformation about distributed monitoring.
xiTivoli Manager for Oracle** Reference Guide

The Tivoli Enterprise Console User’s Guide contains more detailedinformation about using the Tivoli Enterprise Console.
The Tivoli Software Installation Service (SIS) User’s Guide, Version4.0contains detailed information about using SIS to install the TivoliManager for Oracle software.
For information about administering the Oracle server, refer to theServer Administrator’s Guide for the relevant version of Oracle.
For general information about the Oracle server and how it works,refer to theServer Concepts Manual for the relevant version ofOracle.
For descriptions of Structured Query Language (SQL) used tomanage information in Oracle databases, refer to theServer SQLReference for the relevant version of Oracle.
What This Guide ContainsThis guide contains the following sections:
¶ “Introduction” on page 1, describes how the manual isorganized. This chapter also describes commands, monitoroutput, and distributed monitoring logging.
¶ “Database Monitors” on page 13, describes how to use theOracleDatabaseManager monitors to manage different aspects ofan Oracle database, such as tablespaces, extents, and archive logspace. You can also use theSQL Number, SQL String, andother user-defined monitoring sources.
¶ “Instance Monitors” on page 161, describes how to use theOracleInstanceManager monitors to manage different aspects ofan Oracle instance, such as server processes, cache hit ratios,and transactions.
¶ “Async Monitors” on page 303, describes how to use theOracleManagerAsync monitors to manage very large databases.
¶ “Tasks” on page 395, describes how to run the Tivoli Managerfor Oracle tasks in the OracleManagerTasks library.
xii Version 2.0

¶ “Running Tivoli Commands” on page 425, describes how torun Tivoli commands within shells.
¶ “Classes of Instance Monitors” on page 431, defines the fiveclasses of instance monitors and lists the monitors according totheir class.
¶ “Operator Groups (Monitor Triggers)” on page 437, describesthe operators that allow you to define the conditions that mustoccur for a monitor to send an alert.
Viewing the Guide OnlineA PDF file of this manual is provided on the product CD. UseAdobe Acrobat Reader Version 3.0 or later to view and print themanual. Acrobat Reader is available free from Adobe athttp://www.adobe.com.
Acrobat Reader provides navigational features that make accessingthe manual more convenient:
¶ Navigation: SelectView → Bookmarks and Page from themenu to see a hierarchical table of contents to the left of themanual pages. Clicking on an item in the contents scrolls themanual to the corresponding page. You can open and closehigher levels to show and hide lower levels.
¶ Hyperlinks: The table of contents, index, table of entries (tasksor monitors), cross references in text, and entries in the“SeeAlso” section of the book contain hyperlinks. Click on a link togo to the page it refers to.
¶ Search: ChooseTools → Find from the menu to search themanual.
Getting Online HelpOnline help has been provided for each task and monitor. The helpconsists of the reference entry from theTivoli Manager for OracleReference Guide, formatted to be viewed online.
Help is available online from the desktop as follows:
xiiiTivoli Manager for Oracle** Reference Guide

¶ Tasks: In the task argument dialog, click theTask Descriptionbutton.
¶ Monitors:
1. In a profile manager, double-click a profile to open it.
2. In theTME 10 Distributed Monitoring Profile Propertieswindow, click Add Monitor.
3. In theAdd Monitor dialog, select the desired collection andmonitor, then click theAbout This Monitor button.
Typeface ConventionsThe guide uses several typeface conventions for special terms andactions. These conventions have the following meaning:
Bold Commands, keywords, file names, authorization roles, URLs,or other information that you must use literally appear inbold. Names of windows, dialogs, and other controls alsoappear inbold.
Italics Variables and values that you must provide appear initalics.Words and phrases that are emphasized also appear initalics.
Bold ItalicsNew terms appear inbold italics when they are defined inthe text.
MonospaceCode examples, output, and system messages appear in amonospace font.
Contacting Customer SupportIf you encounter difficulties with any Tivoli products, you can go tohttp://www.support.tivoli.com to view the Tivoli Support homepage. After you link to and submit the customer registration form,you will be able to access many customer support services on theWeb.
xiv Version 2.0

Use the following phone numbers to contact customer support in theUnited States: the Tivoli number is 1-800-848-6548(1-800-TIVOLI8) and the IBM number is 1-800-237-5511 (press orsay 8 after you reach this number). Both of these numbers directyour call to the Tivoli Customer Support Call Center.
We are very interested in hearing from you about your experiencewith Tivoli products and documentation. We welcome yoursuggestions for improvements. If you have comments or suggestionsabout this documentation, please send e-mail [email protected].
xvTivoli Manager for Oracle** Reference Guide

xvi Version 2.0

Introduction
A monitor captures and returns information about a resource orapplication in the Tivoli management environment, such as thedatabase status or whether or not a server is available. Atask is anoperation, such as backing up a database, that must be performedroutinely on various managed nodes throughout the managementenvironment.
The monitors and tasks included with Tivoli Manager for Oracleenable you to manage distributed Oracle computing resourceseffectively and to the granularity that you need. The set of databasemanagement tasks enables you to define operations that can run onany machine without consideration of platform type. These tasksautomate repetitive database administrator (DBA) tasks. You candefine tasks once and then perform them on multiple servers anddatabases in a single action.
Tivoli Manager for Oracle provides the ability to manage andmonitor Oracle databases by providing extensions to the TivoliFramework, Tivoli Distributed Monitoring, Tivoli EnterpriseConsole, and Tivoli User Administration.
1
1Tivoli Manager for Oracle** Reference Guide
1.In
trod
uctio
n

Using the Reference ManualThis section contains information on how to use this referencemanual. It includes the following information:
¶ How this manual is organized
¶ How to use the desktop or command line interface (CLI)
How this Manual is OrganizedThe manual is organized alphabetically by task and monitoringcollection. Each task or monitor is divided into the followingsections:
¶ Description. A brief description of the task or monitor.
¶ Authorization Role. The permissions an administrator needs torun the task or monitor.
¶ Target Endpoint. The Tivoli resource to which a monitor ortask is distributed.
¶ GUI Data Entry Fields. A description of each field on aspecific monitor or task dialog.
¶ CLI Syntax. The CLI (command line interface) syntax thatcorresponds to the GUI Data Entry Fields. This section isprovided for users who prefer using the CLI. It includesdefinitions for each of the arguments and an example of thesyntax.
¶ CLI Example. An example CLI for configuring the monitor.
¶ Suggested Response Levels. The suggested monitor thresholdvalues. For more information, see“Setting Up MonitoringProfiles” in the Tivoli Manager for Oracle User’s Guide.
¶ Output. An example output for each task and monitor.
¶ Usage Notes. Any additional information about a task ormonitor.
¶ See Also. A list of related tasks and monitors.
2 Version 2.0

Using the Desktop or Command Line InterfaceYou can work with monitors and tasks from both the desktop dialogor the command line (CLI). You may choose to use the desktopwhen you want to take advantage of visual input prompting, whichincludes drop-down lists of options and the defaults provided byoptions such as theNotify TEC button. Use the CLI when you wantto create scripts, respond to distributed monitoring monitors, orrapidly enter commands.
Note: The commands in this guide assume a Bourne shell. From aWindows NT command prompt, adjust the command syntaxas necessary, or to access a Tivoli-ported version of theBourne shell, enter the commandsh before entering othercommands in this chapter. For more information on shells, see“Running Tivoli Commands” on page 425.
Specifying Path NamesDepending on the platform on which you run this product, use eitherforward (/) or backward slashes (\) in path names. Examples in thisdocumentation use both forward and backward slashes.
Using the Tivoli DesktopYou can set up and run tasks and monitors using the proceduresdescribed in theTivoli Manager for Oracle User’s Guide.
Each task or monitor in this manual has a section called“GUI DataEntry Fields.” This section has a screen capture (if applicable) of thedialog that is displayed when you select the task or monitor.Following the screen capture is a detailed explanation of each fieldand button on the dialog.
Using the Command LineYou also can run monitors and tasks from the command line insteadof the Tivoli desktop. This chapter defines the command syntax andprovides a script for creating sample profiles with monitors.
For detailed information about Tivoli commands, refer to the UNIXonline manual pages or to one of the following manuals:
3Tivoli Manager for Oracle** Reference Guide
1.In
trod
uctio
n

¶ Tivoli Management Framework Reference Manual
¶ Tivoli Enterprise Console Reference Manual
¶ Tivoli Distributed Monitoring User’s Guide
Command Line SyntaxThis guide uses the following special characters to define thecommand syntax:
[ ] Identifies optional arguments. Arguments notenclosed in brackets are required.
... Indicates that you can specify multiple values for theprevious argument. Separate multiple values with aspace, unless you are instructed otherwise.
| Indicates mutually exclusive arguments or responses.You can use the argument to the left of the separator(|) or the argument to its right. You cannot use botharguments in a single use of the command.
{ } Delimits a set of mutually exclusive arguments whenone of the arguments is required. If the argumentsare optional, they are enclosed in[ ] (brackets).
<variable> Indicates a variable response, such as the subscribername or the name of the database you want tomonitor.
For example:
wsetfpprgs{ –t type | –T type}[<keyword_option ...>]<fp_name>
In this example, the–t type and–T type arguments are mutuallyexclusive; you must use one or the other. The <keyword_option>argument is an optional argument; you can specify it more thanonce. The<fp_name> argument is required.
4 Version 2.0

Using the waddmon CommandYou can create a monitor with thewaddmon command. Eachmonitor description in this manual includes a section called“CLISyntax” that supplies the arguments for thewaddmon command. Asection called“CLI Example” provides an example of how you canenter thewaddmon command and the monitoring arguments at thecommand line.
For more information on thewaddmon command, see theTivoliManagement Framework Reference Manual or refer to its manualpage.
Using the wruntask CommandThere are a number of commands that you can use to run tasks andjobs from the command line. These include the following:
¶ The wruntask command, which you use to run a task from thecommand line.
Because not all customers use the same task library, thedocumentation for thewruntask command in theTivoliManagement Framework Reference Manual does not provideinformation for specific tasks, such as those in the Oracle library.“Tasks” on page 395 includes a“CLI Syntax” section, whichsupplies the syntax for tasks in the Oracle library. It alsoincludes a“CLI Example” section, which provides an exampleof how to enter thewruntask command and the task argumentsat the command line.
¶ The wcrtjob command creates a job from a task. See the manualpage for this command or theTivoli Management FrameworkReference Manual.
¶ The wrunjob command runs a job from the command line. Formore information, see the manual page for thewrunjobcommand or theTivoli Management Framework ReferenceManual.
¶ The wschedjob command schedules an existing job. For moreinformation, see the manual page for thewschedjob commandor theTivoli Management Framework Reference Manual.
5Tivoli Manager for Oracle** Reference Guide
1.In
trod
uctio
n

Script for Creating Sample Monitoring ProfilesThe Best Practices script (install_oraclebestpractices_monitors.sh)installs a set of preconfigured database and instance monitors. Thesemonitors are a good starting point for setting up Oracle databasemonitoring. The Best Practices script is described in theTivoliManager for Oracle User’s Guide.
Understanding Monitor OutputAfter a monitor runs on a database, it returns with outputinformation. Although much of this output information is generic,data that is specific to a monitor is described in the“Output” sectionfor that monitor.
Note: The monitor outputs shown in this guide are generalexamples, and may differ from the outputs you receive inyour environment.
The following shows an example output of theExtents monitor fromthe OracleDatabaseManager monitor collection and describes thegeneric output.
Distributed Monitoring chad/Extents on host manzana-2
¶ chad is the name of the profile.
6 Version 2.0

¶ Extents is the name of the monitor.
¶ manzana-2 is the TMA endpoint on which the Oracledatabase resource resides
03/13/2000 04:06:00The date and time when the monitor was run.
Status The returned response level on which the monitor triggered.Response levels are defined when adding a monitor.Depending on the monitor, response levels may be a defaultvalue or a user-defined value. For more information onresponse levels, see“Specifying Response Levels” inChapter 6 of theTivoli Manager for Oracle User’s Guide.
Normal is returned only when no severity levels areexceeded and the monitor is set to always return a value.
E.EXEC is returned when, based on the value returned bythe monitor, a response level cannot be determined.
Warning, Severe, or Critical is returned when a severitythreshold is broken.
PreviousThe value returned by the preceding monitor probe. Forexample, if the monitor ran at 4:55 p.m., 5:00 p.m., and 5:05p.m., theprevious value for the 5:05 probe would be thatvalue returned by the 5:00 p.m. probe.
Note: The first time the monitor runs in any monitoringsession, this field will have no value and returnempty.
CurrentThe value returned by the most recent monitor probe. Forexample, if the monitor last ran at 5:05 p.m., thecurrentvalue would be that of the 5:05 p.m. probe.
EffectiveFor most monitors, this value is the same as theCurrentvalue. However, if you are monitoring a trend, for examplethe percentage change between thePrevious andCurrent
7Tivoli Manager for Oracle** Reference Guide
1.In
trod
uctio
n

monitor values, theEffective value will be that value asdefined when adding the monitor.
ORACLE_SIDThe Oracle Server ID.
ORACLE_HOMEThe location of the Oracle binaries and libraries.
HOSTThe TMA endpoint on which the Oracle database resourceresides.
ENDPOINT_OIDThe OracleDatabaseManager or OracleInstanceManagerprofile endpoint object ID. It is used internally by Tivoli andcan be used for tracing activities with this object.
INTERPThe type of operating system on which the monitor executes,such as Solaris or Windows NT.
MONITOR_NUMBERAn identifier that is assigned to each monitor. This numberis used for the new“Distributed Monitoring Logging”functionality.
TRIGGER_INFOUnless otherwise noted, TRIGGER_INFO is the same datathat is returned as theCurrent value. When it differs, a noteunder the monitor output tells the significance ofTRIGGER_INFO. For example, in the previous monitoroutput, the TRIGGER_INFO is the object with the greatestnumber of extents.
UserinfoAny additional information returned by the monitor isreferred to as userinfo and appears below theTRIGGER_INFO field. For example, in the previous monitoroutput, the userinfo is the number of extents, object name,object owner, and tablespace name.
8 Version 2.0

Using Distributed Monitoring LoggingFor diagnostic purposes, you may need to view the SQL statementon which a monitor executes. Distributed Monitoring Logging is atool unique to Tivoli Manager for Oracle that allows you to see theSQL statements of certain monitors. A table at the beginning of eachmonitoring chapter lists whether or not a monitor is logging enabled.You can configure Distributed Monitoring Logging on the TMRserver (if you want to activate every logging-enabled endpoint in theTMR) or on a specific endpoint. The SQL statements for DistributedMonitoring Logging appear in the following directory:
$lcf_datadir/AMSMonitorLogging/OracleManagerCollection.log
Configuring Distributed Monitoring Logging on theTMR Server
The following procedure guides you through editing theOracleManagerCollection.sh script so you can enable distributedmonitoring logging on the TMR server.
Note: When you distribute to endpoints from the TMR Server, youwill overwrite theOracleManagerCollection.sh script on theendpoints on which you’re enabling logging.
1. Using a text editor, access theOracleManagerCollection.shscript in the following directory:
$BINDIR/../lcf_bundle/generic/OracleManagerMonitoring
2. You can enable logging for all monitors, or for specific monitors.
¶ To enable logging for all supported monitors across allOracle monitoring collections, remove the # character fromthe following lines:
COLLECTION_LOG=1
COLLECTION_LOGGING
—OR—
¶ To enable logging to specific monitors, do the following:
a. Remove the # character from the following lines:
COLLECTION_LOG=1
9Tivoli Manager for Oracle** Reference Guide
1.In
trod
uctio
n

COLLECTION_LOGGING
LOG_MONITORS=
b. Enter the specific monitor number you want to log in theLOG_MONITORS= field. Use spaces to separatemonitor numbers.
Note: Tivoli assigns each monitor a unique number thatappears in the monitor output. In addition, a tableat the beginning of each monitor chapter in thisreference guide lists monitor numbers and whetherthe monitor supports Distributed MonitoringLogging.
You are now ready to distribute logging from the TMR server tothe endpoints.
3. To distribute logging from the TMR Server to the endpoints, youneed the OID (object identifier) of the instance objects to whichyou want to distribute logging. To obtain the OID, do one of thefollowing:
a. At the command line, enterwlookup –arOracleInstanceManager to see a list of all instance objectsand their OID.
— OR —
b. Enterwlookup –r OracleInstanceManager<label_of_Oracle_Instance_Object> to choose a specificOracle instance object.
4. Using the OID you obtained in the previous step, run theidlcallOID InitializeEndpoint command to enable logging on theendpoint.
Configuring Distributed Monitoring Logging on theEndpoint
1. Access the$LCF_DATDIR/generic/OracleManagerMonitoringdirectory on the endpoint on which you want to enabledistributed monitor logging.
10 Version 2.0

2. Edit theOracleManagerCollection.sh script:
a. To enable logging for all supported monitors across all Oraclemonitoring collections, remove the # character from in frontof the following lines:
COLLECTION_LOG=1
export COLLECTION_LOGGING
— OR —
b. To enable logging to specific monitors, remove the #character from in front of the following lines:
COLLECTION_LOG=1
export COLLECTION_LOGGING
LOG_MONITORS=
In the LOG_MONITORS= field, fill in the specific monitornumbers you want to log. Use spaces to separate monitornumbers.
Note: Tivoli assigns each monitor a unique number thatappears in the monitor output. In addition, a table atthe beginning of each monitor chapter in this referenceguide lists monitor numbers and whether the monitorsupports Distributed Monitoring Logging.
References to Oracle Commands, Tables, and LogsThis manual refers to Oracle commands, tables, and logs. Althoughyou can use either UPPERCASE, lowercase, or Mixed Case, thismanual usesUPPERCASE for Oracle commands, tables, and logs.For additional information on these commands, tables, and logs,refer to the Oracle documentation.
11Tivoli Manager for Oracle** Reference Guide
1.In
trod
uctio
n

12 Version 2.0

Database Monitors
The OracleDatabaseManager Monitoring Collection providesmonitoring sources for managing Oracle databases, includingtablespaces, extents, and archive log space. This collection alsoprovidesSQL Number, SQL String, and other monitoring sourcesthat you define to create your own Oracle monitoring sources.Profiles containingOracleDatabaseManager monitors should bedistributed to Oracle database endpoints.
List of OracleDatabaseManager Monitoring SourcesThe following table lists the monitoring sources in this collectionalphabetically by their graphical user interface (GUI) names. It alsoincludes their command line interface (CLI) names, monitornumbers, and whether they support Distributed Monitoring Logging.Monitors that support Distributed Monitoring Logging have a“Yes”in the Log File column. For more information, see“UsingDistributed Monitoring Logging” on page 9.
GUI Name CLI Name MonitorNumber
Log File
Advanced Queue PropagationStatus (8i)
aqpropagationstatus 122 Yes
AQ (Advanced Queue)Schedule Propagation errors(8i)
aqschpropagationerrors 123 Yes
Alerts alerts 2 No
2
13Tivoli Manager for Oracle** Reference Guide
2.D
atabase
Mo
nito
rs

GUI Name CLI Name MonitorNumber
Log File
Archive Free Space archivespace 5 No
Archive Percent Free Space archivespacepercent 200 No
Archive Space (Number ofRedo Logs)
archivespacerl 75 No
Archive Used Space archiveusedspace 72 No
Average Message PropagationRate (across schedule) (8i)
aqpropagationrate 121 Yes
Average waiting time of“READY” messages (8i)
avgwaittimereadymsg 124 Yes
Background Dump Space backgrounddumpspace 7 No
Blocked Transactions blockedtransaction 131 Yes
Chained Rows (cluster) chainedclus 14 No
Chained Rows (table) chainedrows 15 No
Currently runningHeterogeneous Services (8i)
heterogeneousservices 129 Yes
Extents extents 69 Yes
Extents by Tablespace extentsbytablespace 70 Yes
Extents by User extentsbyuser 71 Yes
Free Space Deficit freespacedef 27 Yes
Free Space Deficit byTablespace
freespacedeft 81 Yes
Free Space Deficit by User freespacedefu 80 Yes
Free Space Fragmentation freespacefragmentation 28 Yes
Free Space Fragmentation byTablespace
tfreespacefragmentation 56 Yes
Free Tablespace freetablespace 29 Yes
Free Tablespace by Tablespace freetablespacet 61 Yes
Index Statistics indexstatistics 150 No
Long Running Transactions longrunningtransaction 130 Yes
Maximum Extents maximumextents 34 Yes
14 Version 2.0

GUI Name CLI Name MonitorNumber
Log File
Maximum Extents byTablespace
maximumextentst 66 Yes
Maximum Extents by User maximumextentstu 67 Yes
NT Service Status ntservicestatus 65 No
Number of Datafiles numberoffiles 35 Yes
Rows in DUAL Table rowsindual 50 Yes
SQL Number freeformsqln 30 Yes
SQL String freeformsqls 31 Yes
Temporary Extents temporaryextents 57 Yes
Temporary Extents byTablespace
temporaryextentst 58 Yes
Temporary Extents by User temporaryextentsu 68 Yes
Total waiting time of READYmessages
totwaittimereadymsg 125 Yes
Unix Core Dump Space coredumpspace 62 No
Unix SQL*Net V1 TCP/IPListenerr
netonetcpip 54 No
Unix SQL*Net V2 Listener nettwolistener 55 No
User Dump Space userdumpspace 59 No
15Tivoli Manager for Oracle** Reference Guide
2.D
atabase
Mo
nito
rs

Advanced Queue Propagation Status (8i)
DescriptionMonitors the number of messages in a user-specified queue that arein one of the following states: WAITING, READY or EXPIRED.
This monitor checks on the progress of a queue’s propagation. Itshows any anomalies caused by the network or with the destinationto which the queue is attempting to propagate.
Authorization Roleuser andoracle_monitor
Target EndpointOracleDatabaseManager
GUI Data Entry FieldsThe following shows the GUI fields on theAdd monitor to TME10Distributed Monitoring Profile dialog for theAdvanced QueuePropagation Status monitor; a description of each field follows.
Status Specifies the appropriate message status that is to bemonitored. If you do not select a message status from thedropdown list, the monitor defaults to EXPIRED status.
Queue NameDetermines which objects are to be checked. If you leavethis field blank, the monitor checks all queues.
CLI Syntaxaqpropagationstatus
–a { READY | WAITING | EXPIRED}
–a <queue_name>
16 Version 2.0

The following briefly describes the arguments for this monitor.
{READY | WAITING | EXPIRED}Specifies the appropriate message status that is to bemonitored.
GUI Name:Status
<queue_name>Determines which objects are to be checked. If you leavethis field blank, the monitor checks all queues.
GUI Name:Queue Name
CLI Examplewaddmon ’OracleDatabaseManager’ ’aqpropagationstatus’-a ’READY’-a ’MESSAGE_QUEUE_1’-t ’1 hours’-c ’critical’ -R ’>’ ’100’ -n ’OracleManager Sentry’-c ’always’ -f "manzana:/data/monitor_output/oracle/message_status.log""ProfileName"
Suggested Response LevelsThere are no default actions for this monitor.
Monitors that are defined with this monitoring source use operatorsto evaluate data. For information about these operators, seeAppendix C,“Operator Groups (Monitor Triggers).”
OutputNo output available for this monitor.
The TRIGGER_INFO line for this monitor’s output contains thetotal number of messages per queue that were in the user-specifiedstate (WAITING, READY, or EXPIRED) when the monitortriggered. The total number of messages is followed by a list of allthe queues that have messages in the user-specified state. Queueswith the greatest number of messages in the user-specified stateappear at the top of the list. The information for all queues isreported as text on the userinfo lines, in the following format:
Queue Name, Message Status, Number of Messages
17Tivoli Manager for Oracle** Reference Guide
2.D
atabase
Mo
nito
rs
For a description of the monitor output, see“Understanding MonitorOutput” on page 6.
Views AccessedDBA_QUEUES
GV$AQ
Usage NotesIf too many messages return in the READY state, the monitor showsan anomaly with the message processing. This might be caused by aknown outage, but if not, the DBA should be alerted that there is aproblem.
Note: For more accurate propagation results, run this monitor withthe Average Message Propagation Rate (across schedule)(8i) monitor and theAQ (Advanced Queue) SchedulePropagation errors (8i) monitor.
See AlsoThe following monitors in this chapter:Average MessagePropagation Rate (across schedule) (8i) andAQ (AdvancedQueue) Schedule Propagation errors (8i).
18 Version 2.0

AQ (Advanced Queue) Schedule Propagation errors(8i)
DescriptionMonitors messages that could not be propagated and have beenrecorded as errors.
Authorization Roleuser andoracle_monitor
Target EndpointOracleDatabaseManager
GUI Data Entry FieldsThe following shows the GUI fields on theAdd monitor to TME10 Distributed Monitoring Profile dialog for theAQ SchedulePropagation Errors monitor; a description of each field follows.
Queue NameDetermines which objects are to be checked. If you leavethis field blank, the monitor checks all queues.
CLI Syntaxaqschpropagationerrors
–a <queue_name>
The following briefly describes the argument for this monitor.
<queue_name>Determines which objects are to be checked. If you leavethis field blank, the monitor checks all queues.
GUI Name:Queue Name
19Tivoli Manager for Oracle** Reference Guide
2.D
atabase
Mo
nito
rs

CLI Examplewaddmon ’OracleDatabaseManager’ ’aqschpropagationerrors’-a ’MESSAGE_QUEUE_1’-t ’1 hours’-c ’critical’ -R ’>’ ’1’ -n ’OracleManager Sentry’-c ’always’-f "manzana:/data/monitor_output/oracle/dangling_refs.log""ProfileName"
Suggested Response LevelsThere are no default actions for this monitor.
Monitors that are defined with this monitoring source use operatorsto evaluate data. For information about these operators, seeAppendix C,“Operator Groups (Monitor Triggers)”.
OutputNo output available for this monitor.
The TRIGGER_INFO line for this monitor’s output contains thetotal number of propagation errors found within the user-specifiedmessage queue. The total number of propagation errors is followedby a list of columns that contain the errors and their details. Queueswith the most propagation errors appear at the top of the list.
The information for all propagation errors is reported as text on theuserinfo lines, in the following format:
Error Count, Queue Name, Destination, Failures, Error Date, ErrorTime, Error Message
For a description of the monitor output, see“Understanding MonitorOutput” on page 6.
Views AccessedDBA_QUEUE_SCHEDULES
Usage NotesWhen a message cannot be propagated, it is recorded as an error in atable.
20 Version 2.0

This monitor displays any of these error messages that are associatedwith the user-specified queue or, if no queue is specified, all thequeues in the schedule. Error messages will apply only to enabledqueues or queues that have been disabled due to a maximum numberof failures. This monitor determines any errors or delays withmessages propagating from one application to another. Errors inmessage propagation can indicate problems with the enqueue ordequeue process or other issues, such as network problems.
See AlsoThe following monitors in this chapter:Advanced QueuePropagation Status (8i) andAverage Message Propagation Rate(across schedule) (8i).
21Tivoli Manager for Oracle** Reference Guide
2.D
atabase
Mo
nito
rs

Alerts
DescriptionMonitors the alert log for Oracle errors.
Authorization Roleoracle_user anduser
Target EndpointOracleDatabaseManager
GUI Data Entry FieldsNone
CLI Syntaxalerts
CLI Examplewaddmon ’OracleDatabaseManager’ ’alerts’-t ’1 hours’-c ’critical’-R ’==’ ’1’-n ’OracleManager Sentry’-c ’severe’-R ’==’ ’2’-n ’OracleManager Sentry’-c ’warning’-R ’==’ ’3’-n ’OracleManager Sentry’-c ’normal’-c ’always’"ProfileName"
Suggested Response LevelsThe following table shows suggested threshold values for severitylevels. See“Specifying Response Levels” in Chapter 6 of theTivoliManager for Oracle User’s Guide.
Severity Trigger When Default Actions
Critical Any Oracle error inGroup 1
Send OracleManager Sentrynotice
22 Version 2.0

Severity Trigger When Default Actions
Severe Any Oracle error inGroup 2
Send OracleManager Sentrynotice
Warning Any Oracle error inGroup 3
Send OracleManager Sentrynotice
Normal N/A None
Always N/A None
Monitors that are defined with this monitoring source use operatorsto evaluate data. For information about these operators, seeAppendix C,“Operator Groups (Monitor Triggers)”.
Suggested monitoring schedule: Every 5 minutes.
OutputThe following shows an example output from this monitor.
The TRIGGER_INFO line contains the latest error of the highestseverity found in the alert log. If no error was found, theTRIGGER_INFO line is left blank.
The userinfo line reports the BACKGROUND_DUMP_DEST.
For a description of the monitor output, see“Understanding MonitorOutput” on page 6.
23Tivoli Manager for Oracle** Reference Guide
2.D
atabase
Mo
nito
rs

Views AccessedNone
Usage NotesThis monitor checks the alert log for the following errors:
Note: Any ORA- errors not explicitly stated in the following list aretreated as group 4 errors and are ignored unless you changeone of the thresholds to include those errors.
¶ Group 1 (Critical)
ORA-0204 error in reading control file
ORA-0206 error in writing control file
ORA-0210 cannot open control file
ORA-0257 archiver is stuck
ORA-0333 redo log read error
ORA-0345 redo log write error
ORA-0440– ORA-0485 background process failure
ORA-0600– ORA-0639 internal errors
ORA-1114 datafile I/O write error
ORA-1115 datafile I/O read error
ORA-1116 cannot open datafile
ORA-1118 cannot add a data file
ORA-1578 data block corruption
¶ Group 2 (Severe)
ORA-1135 file accessed for query is offline
ORA-1547 tablespace is full
ORA-1555 snapshot too old
ORA-1562 failed to extend rollback segment
ORA-1628– ORA-1632 maximum extents exceeded
ORA-1650– ORA-1656 tablespace is full
ORA-4031 out of shared memory.
¶ Group 3 (Warning)
24 Version 2.0

ORA-3113 end of file on communication channel
ORA-6501 PL/SQL internal error
‘cannot allocate new log’ - this error indicates that Oracle isunable to perform a log switch. Increase the number of redo logsto resolve this problem.
¶ Group 4 (Others)
Any other ORA- error
If the monitor reports any errors, check theALERT log and anyassociated trace files for the instance. The OracleALERT log isnamedalertsid.log on UNIX (sidALRT.LOG on Windows NT). It islocated in the directory specified by theinit.ora parameterBACKGROUND_DUMP_DEST, which defaults to$ORACLE_HOME/rdbms/log on UNIX (\ORANT\RDBMSnn onWindows NT, wherenn is the release number of Oracle).
The monitor only reports an error once and only checks for newentries in theALERT log the next time the monitor is run.
The Alerts monitor will be enhanced in a future release to enableusers to add their own alerts to the list of monitors.
See AlsoThe following monitors in this chapter:Archive Free Space,Archive Space (Number of Redo Logs), Archive Used Space,Free Space Deficit, Free Tablespace, Maximum Extents, NTService Status, Number of Datafiles, andTemporary Extents.
25Tivoli Manager for Oracle** Reference Guide
2.D
atabase
Mo
nito
rs

Archive Free Space
DescriptionMonitors the amount of free space (in kilobytes) on the archivedestination device. The destination device is controlled by theLOG_ARCHIVE_DEST parameter in theinit.ora file for theinstance.
This monitor is only applicable when the database is running inARCHIVELOG mode. If the database is running inNOARCHIVELOG mode, the monitor returns a value of zero. Usethe LOG_ARCHIVE_DEST parameter in theinit.ora file for theinstance to specify the location of the archiving device.
Note: This monitor does not support the evaluation of free spacewhen archiving to tape.
Authorization Roleoracle_user anduser
Target EndpointOracleDatabaseManager
GUI Data Entry FieldsNone
CLI Syntaxarchivespace
CLI Examplewaddmon ’OracleDatabaseManager’ ’archivespace’-t ’1 hours’-c ’critical’ -R ’<’ ’1048576’-n ’OracleManager Sentry’-c ’severe’ -R ’<’ ’2097152’-n ’OracleManager Sentry’-c ’warning’ -R ’<’ ’3145728’-n ’OracleManager Sentry’-c ’normal’-c ’always’"ProfileName"
26 Version 2.0

Suggested Response LevelsThere are no default actions for this monitor.
Monitors that are defined with this monitoring source use operatorsto evaluate data. For information about these operators, seeAppendix C,“Operator Groups (Monitor Triggers)”.
OutputThe following shows an example output from this monitor.
The percent used figure is reported as text on the userinfo lines inthe following format:
Available KB, % Free, %Used, MountPoint
For a description of the monitor output, see“Understanding MonitorOutput” on page 6.
Views AccessedNone
Usage NotesIf the archive process cannot archive a redo log because ofinsufficient space on the destination device, the database hangs until
27Tivoli Manager for Oracle** Reference Guide
2.D
atabase
Mo
nito
rs
space is made available. When necessary, back up existing archivelogs and remove the files from the destination device to make roomfor the next archived redo log.
See AlsoThe following monitors in this chapter:Archive Used Space andArchive Percent Free Space.
The following monitor in the OracleInstanceManager MonitoringCollection:Average Redo Entry Size.
28 Version 2.0

Archive Percent Free Space
DescriptionMonitors the percent of free space on the archive destination device.The destination device is controlled by the LOG_ARCHIVE_DESTparameter in theinit.ora file for the instance.
This monitor is only applicable when the database is running inARCHIVELOG mode. If the database is running inNOARCHIVELOG mode, the monitor returns a value of zero. Usethe LOG_ARCHIVE_DEST parameter in theinit.ora file for theinstance to specify the location of the archiving device.
Note: This monitor does not support the evaluation of free spacewhen archiving to tape.
Authorization Roleoracle_user anduser
Target EndpointOracleDatabaseManager
GUI Data Entry FieldsNone
CLI Syntaxarchivespacepercent
CLI Examplewaddmon ’OracleDatabaseManager’ ’archivespacepercent’-t ’1 minutes’-c ’critical’ -R ’<’ ’15’ -n ’OracleManager Sentry’-c ’severe’ -R ’<’ ’20’ -n ’OracleManager Sentry’-c ’warning’ -R ’<’ ’25’ -n ’OracleManager Sentry’-c ’normal’-c ’always’"ProfileName"
Suggested Response LevelsThe following table shows suggested threshold values for severitylevels. See“Specifying Response Levels” in Chapter 6 of theTivoli
29Tivoli Manager for Oracle** Reference Guide
2.D
atabase
Mo
nito
rs

Manager for Oracle User’s Guide.
Severity Trigger When Default Actions
Critical Less than 15 Send OracleManager Sentry notice
Severe Less than 20 Send OracleManager Sentry notice
Warning Less than 25 Send OracleManager Sentry notice
Normal N/A None
Always N/A None
Monitors that are defined with this monitoring source use operatorsto evaluate data. For information about these operators, seeAppendix C,“Operator Groups (Monitor Triggers)”.
OutputThe following shows an example output from this monitor.
The percent-used figure is reported as text on the userinfo lines inthe following format:
Available KB, %Free, %Used, MountPoint
For a description of the monitor output, see“Understanding MonitorOutput” on page 6.
30 Version 2.0

Views AccessedNone
Usage NotesIf the archive process cannot archive a redo log because ofinsufficient space on the destination device, the database hangs untilspace is made available. When necessary, back up existing archivelogs and remove the files from the destination device to make roomfor the next archived redo log.
See AlsoThe following monitor in this chapter:Archive Used Space andArchive Free Space.
The following monitor in the OracleInstanceManager MonitoringCollection:Average Redo Entry Size.
31Tivoli Manager for Oracle** Reference Guide
2.D
atabase
Mo
nito
rs

Archive Space (Number of Redo Logs)
DescriptionMonitors the space available, in kilobytes, in theLOG_ARCHIVE_DEST directory to determine how many additionalredo logs can be created before the disk is full.
This monitor is only applicable when the database is running inARCHIVELOG mode. If the database is running inNOARCHIVELOG mode, the monitor returns a value of 100. Usethe LOG_ARCHIVE_DEST parameter in theinit.ora file for theinstance to specify the location of the archiving device.
Note: This monitor does not support the evaluation of free spacewhen archiving to tape.
Authorization Roleoracle_user anduser
Target EndpointOracleDatabaseManager
GUI Data Entry FieldsNone
CLI Syntaxarchivespacerl
CLI Examplewaddmon ’OracleDatabaseManager’ ’archivespacerl’-t ’1 hours’-c ’critical’ -R ’<’ ’3’ -n ’OracleManager Sentry’-c ’severe’ -R ’<’ ’5’ -n ’OracleManager Sentry’-c ’warning’ -R ’<’ ’10’ -n ’OracleManager Sentry’-c ’normal’-c ’always’"ProfileName"
Suggested Response LevelsThe following table shows suggested threshold values for severitylevels. See“Specifying Response Levels” in Chapter 6 of theTivoli
32 Version 2.0

Manager for Oracle User’s Guide.
Severity Trigger When Default Actions
Critical Less than 3 logs Send OracleManager Sentry notice
Severe Less than 5 logs Send OracleManager Sentry notice
Warning Less than 10 logs Send OracleManager Sentry notice
Normal N/A None
Always N/A None
Monitors that are defined with this monitoring source use operatorsto evaluate data. For information about these operators, seeAppendix C,“Operator Groups (Monitor Triggers)”.
Suggested monitoring schedule: Every 30 minutes.
OutputThe following shows an example output from this monitor.
The path name of the archive directory appears in theTRIGGER_INFO field. Additional information for this monitor isreported as text on the userinfo lines in the following format:
Available KB, MaxRedoLogSizeBytes, MountPoint
33Tivoli Manager for Oracle** Reference Guide
2.D
atabase
Mo
nito
rs

For a description of the monitor output, see“Understanding MonitorOutput” on page 6.
Views AccessedNone
Usage NotesIf the archive process cannot archive a redo log because ofinsufficient space on the destination device, the database will hanguntil space is made available. When necessary, back up existingarchive logs and remove the files from the destination device tomake room for the next archived redo log.
See AlsoThe following monitors in this chapter:Archive Used Space.
The following monitor in the OracleInstanceManager MonitoringCollection:Average Redo Entry Size.
34 Version 2.0

Archive Used Space
DescriptionMonitors the space, in kilobytes, used by archived redo logs in theLOG_ARCHIVE_DEST directory.
This monitor is only applicable when the database is running inARCHIVELOG mode. If the database is running inNOARCHIVELOG mode, the monitor returns a value of zero. Thismonitor can be used to indicate how fast redo logs are beingarchived and when they should be backed up to tape or another diskon the local system or on a remote system.
Authorization Roleoracle_user anduser
Target EndpointOracleDatabaseManager
GUI Data Entry FieldsNone
CLI Syntaxarchiveusedspace
CLI Examplewaddmon ’OracleDatabaseManager’ ’archiveusedspace’-t ’1 hour’-c ’critical’-c ’severe’-c ’warning’-c ’normal’-c ’always’"ProfileName"
Suggested Response LevelsThere are no default actions for this monitor.
Monitors that are defined with this monitoring source use operatorsto evaluate data. For information about these operators, seeAppendix C,″Operator Groups (Monitor Triggers)″.
35Tivoli Manager for Oracle** Reference Guide
2.D
atabase
Mo
nito
rs

OutputThe following shows an example output from this monitor.
For a description of the monitor output, see“Understanding MonitorOutput” on page 6.
Views AccessedNone
Usage NotesNone
See AlsoThe following monitors in this chapter:Archive Space (Number ofRedo Logs).
The following monitor in the OracleInstanceManager MonitoringCollection:Average Redo Entry Size.
36 Version 2.0

Average Message Propagation Rate (acrossschedule) (8i)
DescriptionMonitors the number of bytes-per-second that have been propagatedover all enabled schedules or over a particular queue in auser-specified schedule.
Authorization Roleuser andoracle_monitor
Target EndpointOracleDatabaseManager
GUI Data Entry FieldsThe following shows the GUI fields on theAdd monitor to TME10 Distributed Monitoring Profile dialog for theAverage MessagePropagation Rate monitor. A description of each field follows.
Queue NameThe name of the queue to be monitored. If this field is leftblank, the monitor checks every schedule.
CLI Syntaxaqpropagationrate
–a <queue_name>
The following briefly describes the argument for this monitor.
<queue_name>The name of the queue to be monitored. If this field is leftblank, the monitor checks every schedule.
GUI Name:Queue name
37Tivoli Manager for Oracle** Reference Guide
2.D
atabase
Mo
nito
rs

CLI Examplewaddmon ’OracleDatabaseManager’ ’aqpropagationrate’-a ’MESSAGE_QUEUE_1’-t ’1 hours’-c ’critical’ -R ’<’ ’7000’ -n ’OracleManager Sentry’-c ’severe’ -R ’<’ ’8000’ -n ’OracleManager Sentry’-c ’warning’ -R ’<’ ’9000’ -n ’OracleManager Sentry’-c ’always’ -f "manzana:/data/monitor_output/oracle/prop_rate.log""ProfileName"
Suggested Response LevelsThere are no default actions for this monitor.
Monitors that are defined with this monitoring source use operatorsto evaluate data. For information about these operators, seeAppendix C,“Operator Groups (Monitor Triggers)”.
OutputNo output available for this monitor.
The TRIGGER_INFO line for this monitor’s output contains thelowest propagation rate of messages on which the monitor triggered.This is followed by a list of user-specified message queues and theirrespective propagation rates. The queues with the lowest propagationrate appear at the top.
The information for all message queues is reported as text on theuserinfo lines, in the following format:
Propagation Rate, Queue Name, Propagation Destination
For a description of the monitor output, see“Understanding MonitorOutput” on page 6.
Views AccessedDBA_QUEUE_SCHEDULES
Usage NotesOutput from this monitor can be used to tune the various parametersin the schedule and ensure that the schedule is optimized. Forexample, if a queue should propagate data at a certain rate, the user
38 Version 2.0

can run the monitor on a regular basis and alert the DBA ifpropagation falls below the normal rate. A drop in propagation ratecan indicate network problems with operations between instances.
See AlsoThe following monitors in this chapter:Advanced QueuePropagation Status andAQ Schedule Propagation Errors.
39Tivoli Manager for Oracle** Reference Guide
2.D
atabase
Mo
nito
rs

Average waiting time of “READY” messages (8i)
DescriptionMonitors the number of messages in the READY state in eachqueue, and the average waiting time of each message in days, hours,minutes, or seconds. This monitor can be used to find out ifmessages have been waiting for an inordinate amount of time and ifthere are potential performance bottlenecks. Messages in theREADY state are available for propagation across schedules as soonas a dequeue operation is started. A queue with multiple messages inthe READY state can indicate problems with the dequeue process orproblems with the queue destination.
Authorization Roleuser andoracle_monitor
Target EndpointOracleDatabaseManager
GUI Data Entry FieldsThe following shows the GUI fields on theAdd monitor to TME10 Distributed Monitoring Profile dialog for theAverage waitingtime of “READY” messages (8i) monitor; a description of eachfield follows.
Queue NameThe name of the queue to be monitored. If this is left blank,the monitor executes on the entire database.
Time IntervalThis interval can be set for days (D), hours (H), minutes(M), or seconds (S).
40 Version 2.0

CLI Syntaxavgwaittimereadymsg
–a <queue_name>
–a { D | H | M | S}
The following briefly describes the arguments for this monitor.
<queue_name>The name of the queue to be monitored. If this is left blank,the monitor executes on the entire database.
GUI Name:Queue Name
{D | H | M | S}The time interval can be set for days (D), hours (H), minutes(M), or seconds (S).
GUI Name:Time Interval
CLI Examplewaddmon ’OracleDatabaseManager’ ’avgwaittimereadymsg’-a ’MESSAGE_QUEUE_1’-a ’S’-t ’1 hours’-c ’critical’ -R ’>’ ’1’ -n ’OracleManager Sentry’-c ’always’-f "manzana:/data/monitor_output/oracle/dangling_refs.log""ProfileName"
Suggested Response LevelsThere are no default actions for this monitor.
Monitors that are defined with this monitoring source use operatorsto evaluate data. For information about these operators, seeAppendix C,“Operator Groups (Monitor Triggers)”.
OutputNo output available for this monitor.
The TRIGGER_INFO line for this monitor’s output contains thelongest average waiting time for READY messages on which themonitor triggered. It is followed by a list of columns that contain
41Tivoli Manager for Oracle** Reference Guide
2.D
atabase
Mo
nito
rs

queue names and the average waiting times of the messagescurrently in the READY state. Queue names with the longestaverage waiting times appear at the top of the list.
The information for all waiting messages is reported as text on theuserinfo lines, in the following format:
Queue Name, Average Wait Time, Number of READY Messages
For a description of the monitor output, see“Understanding MonitorOutput” on page 6.
Views AccessedDBA_QUEUES
GV$AQ
Usage NotesNone
See AlsoThe following monitors in this chapter:Average MessagePropagation Rate (across schedule) (8i) andAQ (AdvancedQueue) Schedule Propagation errors (8i).
42 Version 2.0

Background Dump Space
DescriptionMonitors the percentage of the allocated space that is used on thebackground dump destination device. The destination device iscontrolled by the BACKGROUND_DUMP_DEST parameter in theinit.ora file for the instance.
Authorization Roleoracle_user anduser
Target EndpointOracleDatabaseManager
GUI Data Entry FieldsNone
CLI Syntaxbackgrounddumpspace
CLI Examplewaddmon ’OracleDatabaseManager’ ’backgrounddumpspace’-t ’1 hours’-c ’critical’ -R ’>’ ’95’ -n ’OracleManager Sentry’-c ’severe’ -R ’>’ ’90’ -n ’OracleManager Sentry’-c ’warning’ -R ’>’ ’85’ -n ’OracleManager Sentry’-c ’normal’-c ’always’"ProfileName"
Suggested Response LevelsThe following table shows suggested threshold values for severitylevels. See“Specifying Response Levels” in Chapter 6 of theTivoliManager for Oracle User’s Guide.
Severity Trigger When Default Actions
Critical Greater than 95% Send OracleManager Sentry notice
Severe Greater than 90% Send OracleManager Sentry notice
Warning Greater than 85% Send OracleManager Sentry notice
Normal N/A None
43Tivoli Manager for Oracle** Reference Guide
2.D
atabase
Mo
nito
rs

Severity Trigger When Default Actions
Always N/A None
Monitors that are defined with this monitoring source use operatorsto evaluate data. For information about these operators, seeAppendix C,“Operator Groups (Monitor Triggers)”.
Suggested monitoring schedule: Every 30 minutes.
OutputThe following shows an example output from this monitor.
The percent-used figure is reported as text on the userinfo lines, inthe following format:
Available KB, %Used, MountPoint
For a description of the monitor output, see“Understanding MonitorOutput” on page 6.
Views AccessedNone
Usage NotesOracle writes to the alert log and creates trace files for thebackground processes in the BACKGROUND_DUMP_DESTdirectory. If this parameter is not set in theinit.ora file, the tracefiles are stored in$ORACLE_HOME/rdbms/log on a UNIXsystem (\ORANT\RDBMSnn\TRACE on a Windows NT system,
44 Version 2.0

wherenn is the release of Oracle). If this directory is full, Oraclewill be unable to create these files, which might result in instancefailure and will make debugging more difficult.
See AlsoThe following monitor in this chapter:Alerts.
45Tivoli Manager for Oracle** Reference Guide
2.D
atabase
Mo
nito
rs

Blocked Transactions
DescriptionMonitors whether any transactions are locked by another user, andreturns the longest time, in seconds, that a transaction has beenblocked. Transactions can become blocked when a user writesfreeform SQL that is not optimized or that locks itself and otherusers. Blocked transactions can also occur when users connect to thesystem, run some SQL, and do not commit or roll back theirtransactions, thus stopping others from operating certain tasks on theobjects.
When configuring the monitor, you should specify an acceptabletime limit in seconds that a transaction should wait for an unreleasedlock before the monitor triggers.
Authorization Roleuser andoracle_monitor
Target EndpointOracleDatabaseManager
GUI Data Entry FieldsNone
CLI Syntaxblockedtransaction
CLI Examplewaddmon ’OracleDatabaseManager’ ’blockedtransaction’-t ’30 minutes’-c ’critical’ -R ’>’ ’60’ -n ’OracleManager Sentry’-c ’severe’ -R ’>’ ’30’ -n ’OracleManager Sentry’-c ’warning’ -R ’>’ ’15’ -n ’OracleManager Sentry’-c ’normal’-c ’always’"ProfileName"
Suggested Response LevelsThe following table shows suggested threshold values for severitylevels. See“Specifying Response Levels” in Chapter 6 of theTivoli
46 Version 2.0

Manager for Oracle User’s Guide.
Severity Trigger When Default Actions
Critical Greater than 60seconds
Send OracleManager Sentrynotice
Severe Greater than 30seconds
Send OracleManager Sentrynotice
Warning Greater than 15seconds
Send OracleManager Sentrynotice
Normal N/A None
Always N/A None
Monitors that are defined with this monitoring source use operatorsto evaluate data. For information about these operators, seeAppendix C,“Operator Groups (Monitor Triggers)”.
Suggested monitoring schedule: Every 30 minutes.
OutputThe following shows an example output from this monitor.
Results from this monitor are reported as text on the userinfo lines inthe following format:
Waiting Time, Username, SID, Object, Lock_ID, SQL
47Tivoli Manager for Oracle** Reference Guide
2.D
atabase
Mo
nito
rs

For a description of the monitor output, see“Understanding MonitorOutput” on page 6.
Views AccessedV$SQLTEXT
V$SESSION
V$ACCESS
V$LOCK
Usage NotesNone
See AlsoThe following monitor in this chapter:Long Running Transactions.
The following monitor in the OracleInstanceManager MonitoringCollection:Any v$lock.
48 Version 2.0

Chained Rows (cluster)
DescriptionMonitors the number of chained rows calculated for a specifiedcluster in the endpoint database. Chaining occurs when rows areupdated and become too large to be stored on a single Oracledatablock. Chained rows double the amount of I/O required toretrieve data and should be avoided.
Authorization Roleoracle_user anduser
Target EndpointOracleDatabaseManager
GUI Data Entry FieldsThe following shows the GUI fields on theAdd monitor to TME10 Distributed Monitoring Profile dialog for theChained rows(Cluster) monitor; a description of each field follows.
Cluster NameDesignates the schema and cluster name of the cluster themonitor checks for chained rows.
CLI Syntaxchainedclus
–a <cluster_name>
The following briefly describes the argument for this monitor.
<cluster_name>Designates the schema and cluster name of the cluster themonitor checks for chained rows.
49Tivoli Manager for Oracle** Reference Guide
2.D
atabase
Mo
nito
rs

GUI Name:Cluster Name
CLI Examplewaddmon ’OracleDatabaseManager’ ’chainedclus’-a ’finance.CLUSTER_ACCOUNT’-t ’1 hours’-c ’critical’ -R ’>’ ’5’ -n ’OracleManager Sentry’-c ’severe’ -R ’>’ ’3’ -n ’OracleManager Sentry’-c ’warning’ -R ’>’ ’0’ -n ’OracleManager Sentry’-c ’normal’-c ’always’"ProfileName"
Suggested Response LevelsThere are no default actions for this monitor.
The following table shows suggested threshold values for severitylevels. See“Specifying Response Levels” in Chapter 6 of theTivoliManager for Oracle User’s Guide.
Severity Trigger When Default Actions
Critical Greater than 5 Send OracleManager Sentry notice
Severe Greater than 3 Send OracleManager Sentry notice
Warning Greater than 0 Send OracleManager Sentry notice
Normal N/A None
Always N/A None
Monitors that are defined with this monitoring source use operatorsto evaluate data. For information about these operators, seeAppendix C,“Operator Groups (Monitor Triggers)”.
Suggested monitoring schedule: Once every day.
50 Version 2.0

OutputThe following shows an example output from this monitor.
The user-specified argument appears as TRIGGER_INFO. Thetrigger value is repeated as userinfo.
For a description of the monitor output, see“Understanding MonitorOutput” on page 6.
Views AccessedNone
Usage NotesIf chaining is occurring for a cluster, consider recreating the clusterwith a larger SIZE parameter. See theCluster Key Ratio monitor inthe OracleInstanceManager collection for further information on thisparameter.
To run this monitor, there must be a CHAINED_ROWS table tostore the information. This is created by running$ORACLE_HOME/rdbms/admin/utlchain.sql as the Oracle userSYS.
Note: Chaining is unavoidable if a table has a LONG column or if arow is larger than a block in size (known as aspanned row).
51Tivoli Manager for Oracle** Reference Guide
2.D
atabase
Mo
nito
rs

See AlsoThe following monitor in this chapter:Chained Rows (table).
52 Version 2.0

Chained Rows (table)
DescriptionMonitors the number of chained rows, calculated for a specifiedtable in the endpoint database. Chaining occurs when rows areupdated and become too large to be stored on a single Oracledatablock. Chained rows double the amount of I/O required toretrieve data and should be avoided.
Authorization Roleoracle_user anduser
Target EndpointOracleDatabaseManager
GUI Data Entry FieldsThe following shows the GUI fields on theAdd Monitor to TME10 Distributed Monitoring Profile dialog for theChained rows(Table) monitor; a description of each field follows.
Table NameDesignates the schema and table name to check for chainedrows.
CLI Syntaxchainedrows
–a <table_name>
The following briefly describes the argument for this monitor.
<table_name>Specifies the schema and table name of the table to checkfor chained rows.
53Tivoli Manager for Oracle** Reference Guide
2.D
atabase
Mo
nito
rs
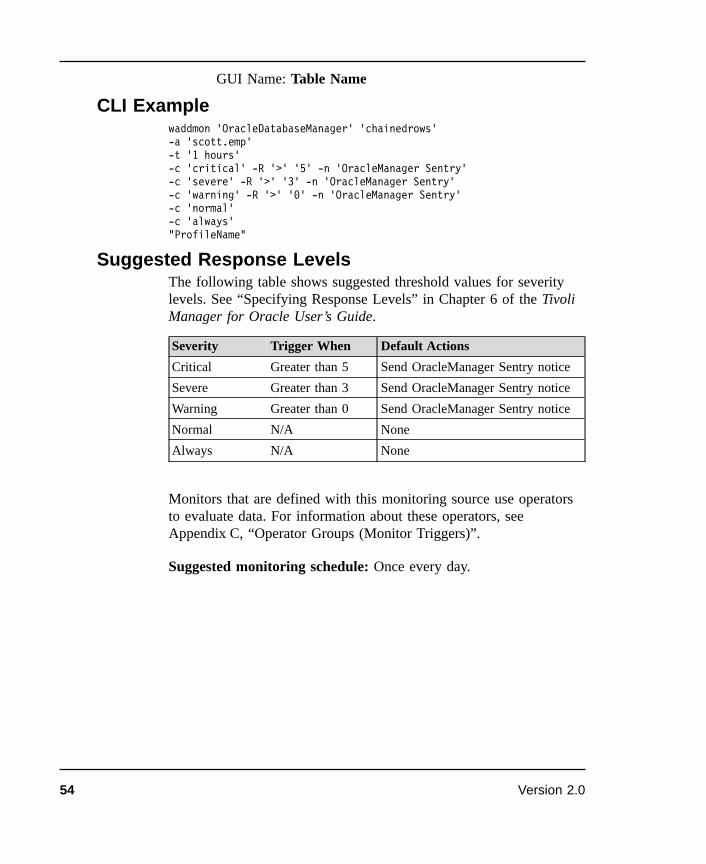
GUI Name:Table Name
CLI Examplewaddmon ’OracleDatabaseManager’ ’chainedrows’-a ’scott.emp’-t ’1 hours’-c ’critical’ -R ’>’ ’5’ -n ’OracleManager Sentry’-c ’severe’ -R ’>’ ’3’ -n ’OracleManager Sentry’-c ’warning’ -R ’>’ ’0’ -n ’OracleManager Sentry’-c ’normal’-c ’always’"ProfileName"
Suggested Response LevelsThe following table shows suggested threshold values for severitylevels. See“Specifying Response Levels” in Chapter 6 of theTivoliManager for Oracle User’s Guide.
Severity Trigger When Default Actions
Critical Greater than 5 Send OracleManager Sentry notice
Severe Greater than 3 Send OracleManager Sentry notice
Warning Greater than 0 Send OracleManager Sentry notice
Normal N/A None
Always N/A None
Monitors that are defined with this monitoring source use operatorsto evaluate data. For information about these operators, seeAppendix C,“Operator Groups (Monitor Triggers)”.
Suggested monitoring schedule: Once every day.
54 Version 2.0

OutputThe following shows an example output from this monitor.
The user-specified argument appears as TRIGGER_INFO. Thetrigger value is repeated as userinfo.
For a description of the monitor output, see“Understanding MonitorOutput” on page 6.
Views AccessedNone
Usage NotesThis monitor should be run at non-peak times because it issues anANALYZE TABLE LIST CHAINED ROWS command, whichperforms a full-table scan and could have a performance impact ifthe table is large. This command does not generate statistics for thetable and does not affect the Oracle optimizer.
If the total number of chained rows is small in comparison to thetotal number of rows on the table, chaining can be corrected througha copy-out/copy-in sequence for the chained rows (an example ofhow to do this follows). If there are a considerable number ofchained rows, export the data, drop and re-create the table with alargerpctfree storage clause, and then import the data.
55Tivoli Manager for Oracle** Reference Guide
2.D
atabase
Mo
nito
rs

To run this monitor, there must be a CHAINED_ROWS table tostore the information on the chained rows. This is created by running$ORACLE_HOME/rdbms/admin/utlchain.sql as the Oracle userSYS.
Note that chaining is unavoidable if a table has a LONG column orif a row is larger than a block in size (known as aspanned row).
The copy-out and copy-in sequence to eliminate chained rows is asfollows:1. ANALYZE TABLE INVOICES LIST CHAINED ROWS;
2. SELECT OWNER_NAME, TABLE_NAME, HEAD_ROWID, TIMESTAMPFROM CHAINED_ROWSWHERE TABLE_NAME = ‘INVOICES’;
Owner_name Cluster_name Head_ROWID Timestamp---------- -------------- ------------------- --------------DBMX INVOICES 00000D9E.0040.0001 21-AUG-95DBMX INVOICES 00000D9E.004E.0001 21-AUG-95DBMX INVOICES 00000D9E.005C.0001 21-AUG-95DBMX INVOICES 00000D9E.006A.0001 21-AUG-95
3. Create an intermediate table to hold the chained rowsCREATE TABLE INV_TEMP ASSELECT * FROM INVOICESWHERE ROWID IN(SELECT HEAD_ROWIDFROM CHAINED_ROWSWHERE TABLE_NAME = ‘INVOICES’);
4. Delete the chained rows from the existing table.DELETE FROM INVOICEWHERE ROWID IN(SELECT HEAD_ROWIDFROM CHAINED_ROWSWHERE TABLE_NAME = ‘INVOICES’);
5. Insert the rows of the intermediate table into the existing table.INSERT INTO INVOICESSELECT * FROM INV_TEMP;
6. Drop the intermediate table.DROP TABLE INV_TEMP;
7. Clean out the CHAINED_ROWS table.
56 Version 2.0

DELETE FROM CHAINED_ROWSWHERE TABLE_NAME = ‘INVOICES’;
Repeat step 1 to verify that the rows have been unchained.
See AlsoThe following monitor in this chapter:Chained Rows (cluster).
57Tivoli Manager for Oracle** Reference Guide
2.D
atabase
Mo
nito
rs

Currently running Heterogeneous Services (8i)
DescriptionHeterogeneous services connect Oracle and non-Oracle systems. Thismonitor looks at the heterogeneous services accessing the Oracleinstance at the monitoring interval and reports how long the servicehas been running. The monitor enables the user to filter on aparticular service. If no filter is entered, the monitor triggers on allservices.
Authorization Roleuser andoracle_monitor
Target EndpointOracleDatabaseManager
GUI Data Entry FieldsThe following shows the GUI fields on theAdd Monitor to TME10 Distributed Monitoring Profile dialog for theCurrentlyrunning Heterogeneous Services monitor; a description of eachfield follows.
Service NameThe name of the heterogeneous service on which the monitorreports. If this parameter is omitted, the monitor reports onall currently active heterogeneous services.
CLI Syntaxheterogeneousservices
–a <service_name>
The following briefly describes the argument for this monitor.
58 Version 2.0

<service_name>The name of the heterogeneous service on which the monitorreports. If this parameter is omitted, the monitor reports onall currently running heterogeneous services.
GUI Name:Service Name
CLI Examplewaddmon ’OracleDatabaseManager’ ’heterogeneousservices’-a ’Faustina’-t ’1 minutes’-c ’critical’-c ’severe’-c ’warning’-c ’normal’-c ’always’"ProfileName"
Suggested Response LevelsThere are no default actions for this monitor.
Monitors that are defined with this monitoring source use operatorsto evaluate data. For information about these operators, seeAppendix C,“Operator Groups (Monitor Triggers)”.
OutputNo output available for this monitor.
Results from this monitor are reported as text on the userinfo lines inthe following format:
Session ID, Oracle Username, OS Username, OS Program_name,Agent Type, Agent Program, Running Time
For a description of the monitor output, see“Understanding MonitorOutput” on page 6.
Views AccessedV$HS_SESSION
V$SESSION
59Tivoli Manager for Oracle** Reference Guide
2.D
atabase
Mo
nito
rs

V$HS_AGENT
Usage NotesNone
See AlsoNone
60 Version 2.0
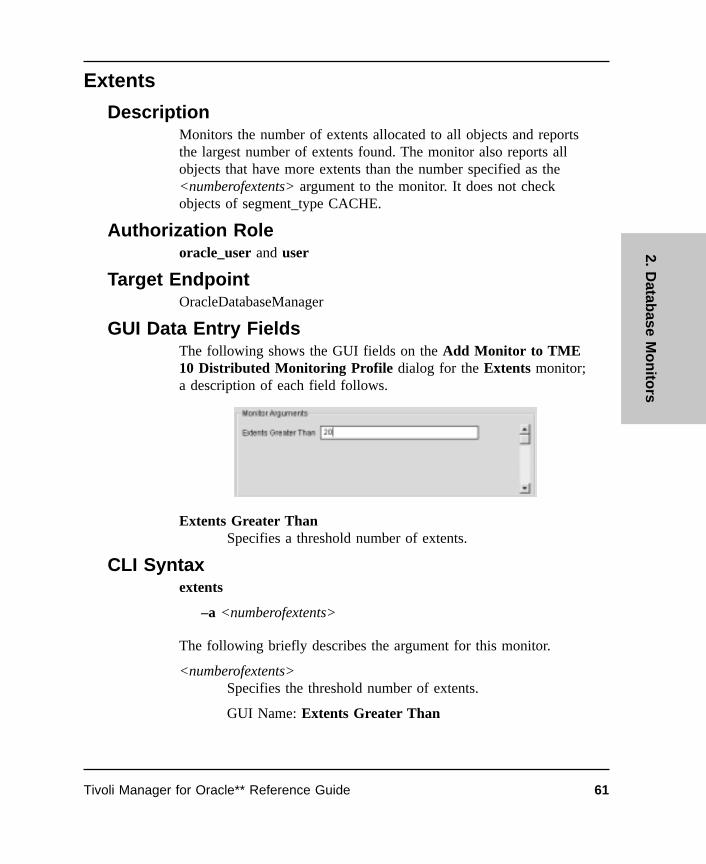
Extents
DescriptionMonitors the number of extents allocated to all objects and reportsthe largest number of extents found. The monitor also reports allobjects that have more extents than the number specified as the<numberofextents> argument to the monitor. It does not checkobjects of segment_type CACHE.
Authorization Roleoracle_user anduser
Target EndpointOracleDatabaseManager
GUI Data Entry FieldsThe following shows the GUI fields on theAdd Monitor to TME10 Distributed Monitoring Profile dialog for theExtents monitor;a description of each field follows.
Extents Greater ThanSpecifies a threshold number of extents.
CLI Syntaxextents
–a <numberofextents>
The following briefly describes the argument for this monitor.
<numberofextents>Specifies the threshold number of extents.
GUI Name:Extents Greater Than
61Tivoli Manager for Oracle** Reference Guide
2.D
atabase
Mo
nito
rs

CLI Examplewaddmon ’OracleDatabaseManager’ ’extents’-a ’20’-t ’30 minutes’-c ’critical’ -R ’>’ ’30’ -n ’OracleManager Sentry’-p ’Root_jpc_at_home-region’-c ’severe’-c ’warning’ -R ’>’ ’20’ -n ’OracleManager Sentry’-c ’normal’-c ’always’"ProfileName"
Suggested Response LevelsThere are no default actions for this monitor.
Monitors that are defined with this monitoring source use operatorsto evaluate data. For information about these operators, seeAppendix C,“Operator Groups (Monitor Triggers)”.
OutputThe following shows an example output from this monitor.
The object with the greatest number of extents appears in theTRIGGER_INFO field. Information for all extents within thespecified extents limit is reported as text on the userinfo lines, in thefollowing format:
62 Version 2.0

Number of Extents, Object Name, Object Owner, Tablespace Name
Note: Objects are displayed in descending order based on number ofextents. If Oracle does not return any rows, it reports an error.
For a description of the monitor output, see“Understanding MonitorOutput” on page 6.
Views AccessedDBA_SEGMENTS
Usage NotesYou can use this monitor to see which objects in a database have alarge number of extents. This information can be used to chart thegrowth of objects. This information also can be used in conjunctionwith the Maximum Extents monitors to predict when an object isgoing to run out of extents. You might need to allocate additionalextents to the object, or export it and recreate it with a larger extentsize.
See AlsoThe following monitors in this chapter:Extents by Tablespace,Extents by User, Maximum Extents, Maximum Extents byTablespace, andMaximum Extents by User.
63Tivoli Manager for Oracle** Reference Guide
2.D
atabase
Mo
nito
rs

Extents by Tablespace
DescriptionMonitors how many extents are allocated to all database objectswithin specified tablespaces and reports the largest number of extentsfound.
Authorization Roleoracle_user anduser
Target EndpointOracleDatabaseManager
GUI Data Entry FieldsThe following shows the GUI fields on theAdd Monitor to TME10 Distributed Monitoring Profile dialog for theExtents bytablespace monitor; a description of each field follows.
Extents Greater ThanSpecifies the threshold number of extents.
Include/ExcludeIncludes or excludes the contents of the tablespace namesfield.
Tablespace NamesDesignates the tablespace names you want to include orexclude. Use spaces to separate names.
Note: Keywords have been defined for several classes ofPeopleSoft and SAP tables. When you enter one ofthe keywords as a tablespace, it calls all of the tablesassociated with the keyword. Using this approach mayslightly reduce system performance. Refer to the
64 Version 2.0

appendix titled“Best Practices Script” in the TivoliManager for Oracle User’s Guide.
CLI Syntaxextentsbytablespace
–a <numberofextents>
–a { in | not in}
–a <tablespaces>
The following briefly describes the arguments for this monitor.
<numberofextents>Specifies the threshold number of extents.
GUI Name:Extents Greater Than
{in | not in}Includes or excludes the contents of the tablespace namesfield.
GUI Name:Include/Exclude
<tablespaces>Designates the tablespace names you want to include orexclude. Use spaces to separate names.
GUI Name:Tablespace Names
Note: Keywords have been defined for several classes ofPeopleSoft and SAP tables. When you enter one ofthe keywords as a tablespace, it calls all of the tablesassociated with the keyword. Using this approach mayslightly reduce system performance. Refer to theappendix titled“Best Practices Script” in the TivoliManager for Oracle User’s Guide.
CLI Examplewaddmon ’OracleDatabaseManager’ ’extentsbytablespace’-a ’0’-a ’in’
65Tivoli Manager for Oracle** Reference Guide
2.D
atabase
Mo
nito
rs

-a ’RBS’-t ’30 minutes’-c ’always’"ProfileName"
Suggested Response LevelsThere are no default actions for this monitor.
Monitors that are defined with this monitoring source use operatorsto evaluate data. For information about these operators, seeAppendix C,“Operator Groups (Monitor Triggers)”.
OutputThe following shows an example output from this monitor.
The object with the greatest number of extents appears in theTRIGGER_INFO field. Information for all extents within thespecified extents limit is reported on the userinfo lines, in thefollowing format:
Number of Extents, Object Name, Object Owner
Note: Objects are displayed in descending order based on number ofextents. If Oracle does not return any rows, it reports an error.
66 Version 2.0

For a description of the monitor output, see“Understanding MonitorOutput” on page 6.
Views AccessedDBA_SEGMENTS
Usage NotesYou can use this monitor to see which objects in a database have alarge number of extents. This information can be used to chart thegrowth of objects. This information also can be used in conjunctionwith the Maximum Extents monitors to predict when an object isgoing to run out of extents. You might need to allocate additionalextents to the object, or export it and recreate it with a larger extentsize.
See AlsoThe following monitors in this chapter:Extents, Extents by User,Maximum Extents, Maximum Extents by Tablespace, andMaximum Extents by User.
67Tivoli Manager for Oracle** Reference Guide
2.D
atabase
Mo
nito
rs

Extents by User
DescriptionMonitors how many extents have been allocated to all databaseobjects for a specified user and reports the largest number of extentsfound.
Authorization Roleoracle_user anduser
Target EndpointOracleDatabaseManager
GUI Data Entry FieldsThe following shows the GUI fields on theAdd Monitor to TME10 Distributed Monitoring Profile dialog for theExtents by usermonitor; a description of each field follows.
Extents Greater ThanSpecifies the threshold number of extents.
User NameSpecifies the Oracle user name.
CLI Syntaxextentsbyuser
–a <numberofextents>
–a <username>
The following briefly describes the arguments for this monitor.
<numberofextents>Specifies the threshold number of extents.
68 Version 2.0

GUI Name:Extents Greater Than
<username>Specifies the Oracle user name.
GUI Name:User
CLI Examplewaddmon ’OracleDatabaseManager’ ’extentsbyuser’-a ’50’-a ’sys’-t ’30 minutes’-c ’always’"ProfileName"
Suggested Response LevelsThere are no default actions for this monitor.
Monitors that are defined with this monitoring source use operatorsto evaluate data. For information about these operators, seeAppendix C,“Operator Groups (Monitor Triggers)”.
OutputThe following shows an example output from this monitor.
69Tivoli Manager for Oracle** Reference Guide
2.D
atabase
Mo
nito
rs

The object with the greatest number of extents appears in theTRIGGER_INFO field. Information for all extents within thespecified extents limit is reported as text on the userinfo lines, in thefollowing format:
Number of Extents, Object Name, Tablespace Name
Note: Objects are displayed in descending order based on number ofextents. If Oracle does not return any rows, it reports an error.
For a description of the monitor output, see“Understanding MonitorOutput” on page 6.
Views AccessedDBA_SEGMENTS
Usage NotesYou can use this monitor to see which objects in a database have alarge number of extents. This information can be used to chart thegrowth of objects. This information also can be used in conjunctionwith the Maximum Extents monitors to predict when an object isgoing to run out of extents. You might need to allocate additionalextents to the object, or export it and recreate it with a larger extentsize.
See AlsoThe following monitors in this chapter:Extents, Extents byTablespace, Maximum Extents, Maximum Extents by Tablespace,andMaximum Extents by User.
70 Version 2.0

Free Space Deficit
DescriptionChecks whether any segments are unable to allocate their next extentbecause of insufficient free space in the tablespace, and not becausethe segments reached MAXEXTENTS. The reported trigger valuerepresents the worst-caseequity (available space less required space);a negative equity figure means that the next extent for that segmentwill fail. It does not check objects of segment_type CACHE. If theExclude Rollback Segments argument is set toYes, the monitordoes not check the free space in any rollback segments.
Authorization Roleoracle_user anduser
Target EndpointOracleDatabaseManager
GUI Data Entry FieldsThe following shows the GUI fields on theAdd Monitor to TME10 Distributed Monitoring Profile dialog for theFree space deficitmonitor; a description of each field follows.
Exclude Rollback SegmentsYes ignores rollback segments.
No does not ignore rollback segments.
CLI Syntaxfreespacedef
–a { Yes | No}
The following briefly describes the argument for this monitor.
71Tivoli Manager for Oracle** Reference Guide
2.D
atabase
Mo
nito
rs

{Yes | No}Yes ignores rollback segments.
No does not ignore rollback segments.
GUI Name:Exclude Rollback Segments
CLI Examplewaddmon ’OracleDatabaseManager’ ’freespacedef’-a ’No’-t ’1 hours’-c ’critical’ -R ’<’ ’0’ -n ’OracleManager Sentry’-c ’severe’-c ’warning’-c ’normal’-c ’always’"ProfileName"
Suggested Response LevelsThe following table shows suggested threshold values for severitylevels. See“Specifying Response Levels” in Chapter 6 of theTivoliManager for Oracle User’s Guide.
Severity Trigger When Default Actions
Critical Less than 0 Send OracleManager Sentry notice
Severe N/A None
Warning N/A None
Normal N/A None
Always N/A None
Monitors that are defined with this monitoring source use operatorsto evaluate data. For information about these operators, seeAppendix C,“Operator Groups (Monitor Triggers)”.
Suggested monitoring schedule: Every 30 minutes.
72 Version 2.0

OutputThe following shows an example output from this monitor.
The object with the worst-case equity is reported asTRIGGER_INFO. Additional information for all objects returnedappears as text in the userinfo lines in the following format:
Equity, Object Name, Tablespace Name, Object Owner
For a description of the monitor output, see“Understanding MonitorOutput” on page 6.
Views AccessedDBA_SEGMENTS
DBA_FREE_SPACE
Usage NotesA table is created with an initial extent of 1 MB, next extent 1 MB,and PCTINCREASE of 25%. If the table grows to six extents, theextent sizes are as follows:
Extent Number Extent Size (bytes)
1 1,024,000
73Tivoli Manager for Oracle** Reference Guide
2.D
atabase
Mo
nito
rs

Extent Number Extent Size (bytes)
2 1,024,000
3 1,280,000
4 1,600,000
5 2,000,000
6 2,500,000
The size of the seventh extent is 3,125,000 bytes. If the free space inthe tablespace is 3 MB (3,072,000 bytes), the table will not be ableto allocate its seventh extent. The equity is (3,072,000 - 3,125,000) =-53,000 bytes. This is the figure that is checked by the monitor.
If a segment is unable to allocate another extent, there are a numberof corrective actions you can take: add another file to the relevanttablespace, change the size of the next extent using ALTER TABLEALLOCATE EXTENT, or export the segment and recreate it withdifferent storage parameters. Tivoli recommends that all segments becreated with a PCTINCREASE of 0.
See AlsoThe following monitors in this chapter:Free Space Deficit byTablespace, Free Space Deficit by User, Free Tablespace, andNumber of Datafiles.
74 Version 2.0

Free Space Deficit by Tablespace
DescriptionChecks whether any segments, within specified tablespaces, areunable to allocate their next extent because of insufficient free spacein the tablespace, and not because the segments reachedMAXEXTENTS. The reported trigger value represents theworst-caseequity (available space less required space); a negativeequity figure means that the next extent for that segment will fail.The monitor does not check objects of segment_type CACHE.
Authorization Roleoracle_user anduser
Target EndpointOracleDatabaseManager
GUI Data Entry FieldsThe following shows the GUI fields on theAdd Monitor to TME10 Distributed Monitoring Profile dialog for theFree space deficitby tablespace monitor; a description of each field follows.
Include/ExcludeIncludes or excludes the contents of the tablespace namesfield.
Tablespace NamesDesignates the tablespace names you want to include orexclude. Use spaces to separate names.
Note: Keywords have been defined for several classes ofPeopleSoft and SAP tables. When you enter one ofthe keywords as a tablespace, it calls all of the tablesassociated with the keyword. Using this approach may
75Tivoli Manager for Oracle** Reference Guide
2.D
atabase
Mo
nito
rs

slightly reduce system performance. Refer to theappendix titled“Best Practices Script” in the TivoliManager for Oracle User’s Guide.
CLI Syntaxfreespacedeft
–a { in | not in}
–a <tablespaces>
The following briefly describes the arguments for this monitor.
{in | not in}Includes or excludes the contents of the tablespace namesfield.
GUI Name:Include/Exclude
<tablespaces>Designates the tablespace names you want to include orexclude. Use spaces to separate names.
GUI Name:Tablespace Names
Note: Keywords have been defined for several classes ofPeopleSoft and SAP tables. When you enter one ofthe keywords as a tablespace, it calls all of the tablesassociated with the keyword. Using this approach mayslightly reduce system performance. Refer to theappendix titled“Best Practices Script” in the TivoliManager for Oracle User’s Guide.
CLI Examplewaddmon ’OracleDatabaseManager’ ’freespacedeft’-a ’in’-a ’users system’-t ’1 hours’-c ’critical’ -R ’<’ ’0’ -n ’OracleManager Sentry’-c ’severe’-c ’warning’-c ’normal’-c ’always’"ProfileName"
76 Version 2.0

Suggested Response LevelsThe following table shows suggested threshold values for severitylevels. See“Specifying Response Levels” in Chapter 6 of theTivoliManager for Oracle User’s Guide.
Severity Trigger When Default Actions
Critical Less than 0 Send OracleManager Sentry notice
Severe N/A None
Warning N/A None
Normal N/A None
Always N/A None
Monitors that are defined with this monitoring source use operatorsto evaluate data. For information about these operators, seeAppendix C,“Operator Groups (Monitor Triggers)”.
Suggested monitoring schedule: Every 30 minutes.
OutputThe following shows an example output from this monitor.
77Tivoli Manager for Oracle** Reference Guide
2.D
atabase
Mo
nito
rs
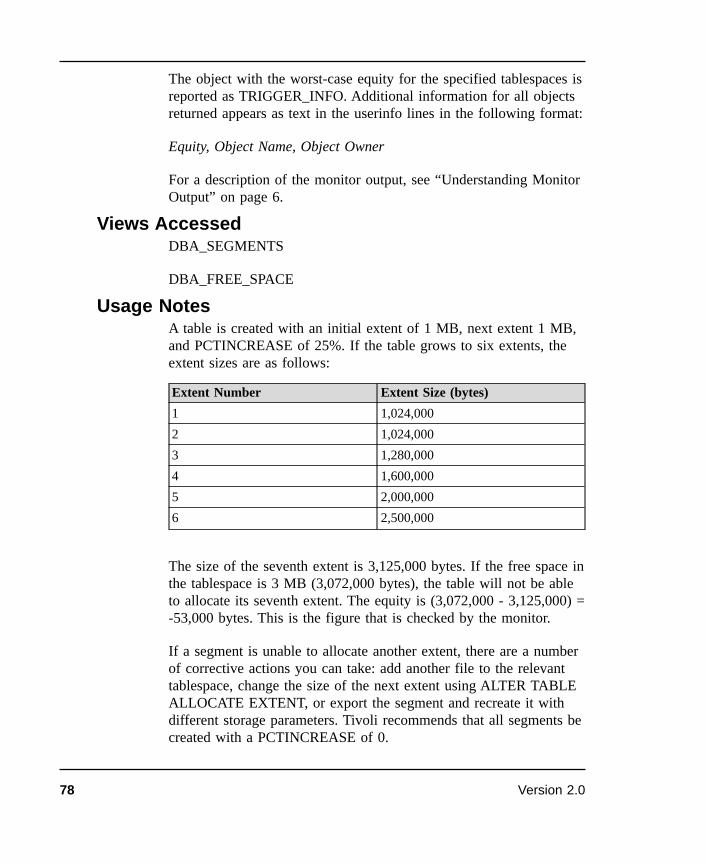
The object with the worst-case equity for the specified tablespaces isreported as TRIGGER_INFO. Additional information for all objectsreturned appears as text in the userinfo lines in the following format:
Equity, Object Name, Object Owner
For a description of the monitor output, see“Understanding MonitorOutput” on page 6.
Views AccessedDBA_SEGMENTS
DBA_FREE_SPACE
Usage NotesA table is created with an initial extent of 1 MB, next extent 1 MB,and PCTINCREASE of 25%. If the table grows to six extents, theextent sizes are as follows:
Extent Number Extent Size (bytes)
1 1,024,000
2 1,024,000
3 1,280,000
4 1,600,000
5 2,000,000
6 2,500,000
The size of the seventh extent is 3,125,000 bytes. If the free space inthe tablespace is 3 MB (3,072,000 bytes), the table will not be ableto allocate its seventh extent. The equity is (3,072,000 - 3,125,000) =-53,000 bytes. This is the figure that is checked by the monitor.
If a segment is unable to allocate another extent, there are a numberof corrective actions you can take: add another file to the relevanttablespace, change the size of the next extent using ALTER TABLEALLOCATE EXTENT, or export the segment and recreate it withdifferent storage parameters. Tivoli recommends that all segments becreated with a PCTINCREASE of 0.
78 Version 2.0

See AlsoThe following monitors in this chapter:Free Space Deficit, FreeSpace Deficit by User, Maximum Extents by Tablespace, andFree Tablespace.
79Tivoli Manager for Oracle** Reference Guide
2.D
atabase
Mo
nito
rs

Free Space Deficit by User
DescriptionChecks whether any segments, for a specified user, are unable toallocate their next extent because of insufficient free space in thetablespace, and not because the segments reached MAXEXTENTS.The reported trigger value represents the worst-caseequity (availablespace less required space); a negative equity figure means that thenext extent for that segment will fail. The monitor does not checkobjects of segment_type CACHE.
Authorization Roleoracle_user anduser
Target EndpointOracleDatabaseManager
GUI Data Entry FieldsThe following shows the GUI fields on theAdd Monitor to TME10 Distributed Monitoring Profile dialog for theFree space deficitby user monitor; a description of each field follows.
User NameSpecifies the Oracle user name.
CLI Syntaxfreespacedefu
–a <username>
The following briefly describes the argument for this monitor.
<username>Specifies the Oracle user name.
80 Version 2.0

GUI Name:User Name
CLI Examplewaddmon ’OracleDatabaseManager’ ’freespacedefu’-a ’SCOTT’-t ’1 hours’-c ’critical’ -R ’<’ ’0’ -n ’OracleManager Sentry’-c ’severe’-c ’warning’-c ’normal’-c ’always’"ProfileName"
Suggested Response LevelsThe following table shows suggested threshold values for severitylevels. See“Specifying Response Levels” in Chapter 6 of theTivoliManager for Oracle User’s Guide.
Severity Trigger When Default Actions
Critical Less than 0 Send OracleManager Sentry notice
Severe N/A None
Warning N/A None
Normal N/A None
Always N/A None
Monitors that are defined with this monitoring source use operatorsto evaluate data. For information about these operators, seeAppendix C,“Operator Groups (Monitor Triggers)”.
Suggested monitoring schedule: Every 30 minutes.
81Tivoli Manager for Oracle** Reference Guide
2.D
atabase
Mo
nito
rs

OutputThe following shows an example output from this monitor.
The object with the worst-case equity for the specified user isreported as TRIGGER_INFO. Additional information for all objectsreturned appears as text in the userinfo lines in the following format:
Equity, Object Name, Tablespace Name
For a description of the monitor output, see“Understanding MonitorOutput” on page 6.
Views AccessedDBA_SEGMENTS
DBA_FREE_SPACE
Usage NotesA table is created with an initial extent of 1 MB, next extent 1 MB,and PCTINCREASE of 25%. If the table grows to six extents, theextent sizes are as follows:
Extent Number Extent Size (bytes)
1 1,024,000
2 1,024,000
82 Version 2.0

Extent Number Extent Size (bytes)
3 1,280,000
4 1,600,000
5 2,000,000
6 2,500,000
The size of the seventh extent is 3,125,000 bytes. If the free space inthe tablespace is 3 MB (3,072,000 bytes), the table will not be ableto allocate its seventh extent. The equity is (3,072,000 - 3,125,000) =-53,000 bytes. This is the figure that is checked by the monitor.
If a segment is unable to allocate another extent, there are a numberof corrective actions you can take: add another file to the relevanttablespace, change the size of the next extent using ALTER TABLEALLOCATE EXTENT, or export the segment and recreate it withdifferent storage parameters. Tivoli recommends that all segments becreated with a PCTINCREASE of 0.
See AlsoThe following monitors in this chapter:Free Space Deficit, FreeSpace Deficit by Tablespace, Maximum Extents by User, andFree Tablespace.
83Tivoli Manager for Oracle** Reference Guide
2.D
atabase
Mo
nito
rs

Free Space Fragmentation
DescriptionMonitors the free space fragmentation index for all tablespaces.
Authorization Roleoracle_user anduser
Target EndpointOracleDatabaseManager
GUI Data Entry FieldsNone
CLI Syntaxfreespacefragmentation
CLI Examplewaddmon ’OracleDatabaseManager’ ’freespacefragmentation’-t ’1 hours’-c ’critical’ -R ’<’ ’10’ -n ’OracleManager Sentry’-c ’severe’ -R ’<’ ’20’ -n ’OracleManager Sentry’-c ’warning’ -R ’<’ ’30’ -n ’OracleManager Sentry’-c ’normal’-c ’always’"ProfileName"
Suggested Response LevelsThe following table shows suggested threshold values for severitylevels. See“Specifying Response Levels” in Chapter 6 of theTivoliManager for Oracle User’s Guide.
Severity Trigger When Default Actions
Critical Less than 10 Send OracleManager Sentry notice
Severe Less than 20 Send OracleManager Sentry notice
Warning Less than 30 Send OracleManager Sentry notice
Normal N/A None
Always N/A None
84 Version 2.0

Monitors that are defined with this monitoring source use operatorsto evaluate data. For information about these operators, seeAppendix C,“Operator Groups (Monitor Triggers)”.
Suggested monitoring schedule: Once every day.
OutputThe following shows an example output from this monitor.
The tablespace with the worst-case Free Space Fragmentation Index(FSFI) appears as TRIGGER_INFO. The information for alltablespaces is reported as text on the userinfo lines, in the followingformat:
FSFI, Tablespace Name
For a description of the monitor output, see“Understanding MonitorOutput” on page 6.
Views AccessedDBA_FREE_SPACE
Usage NotesThis monitor employs an arbitrary scoring system to establishwhether a tablespace is in need of a free-space rebuild. The systemused is that defined by Loney inOracle DBA Handbook by Oracle
85Tivoli Manager for Oracle** Reference Guide
2.D
atabase
Mo
nito
rs
Press, ISBN 0-07-881182-1. TheFree Space Fragmentation Index(FSFI) calculates the size of the largest extent as a percentage of thetotal free space and does not consider the number of extents in atablespace. This index is not a monitor of the amount of free spaceavailable. It is an indication of the structure of the free space. Fordetails on monitoring free space in a database, see“Free Tablespace”on page 91.
The best-case response from this monitor is 100%. As the totalnumber of extents increases for a tablespace, the FSFI rating dropsaccordingly. Use this monitor with thealways andLog To Fileoption to establish a base line. In general, a tablespace withsufficient free space and an FSFI rating of above 30 should notexperience free space availability problems.
See AlsoThe following monitors in this chapter:Free Space Fragmentationby Tablespace andFree Tablespace.
86 Version 2.0

Free Space Fragmentation by Tablespace
DescriptionMonitors the free space fragmentation index for specifiedtablespaces.
Authorization Roleoracle_user anduser
Target EndpointOracleDatabaseManager
GUI Data Entry FieldsThe following shows the GUI fields on theAdd Monitor to TME10 Distributed Monitoring Profile dialog for theFree spacefragmentation by tablespace monitor; a description of each fieldfollows.
Include/ExcludeIncludes or excludes the contents of the tablespace namesfield.
Tablespace NamesDesignates the tablespace names you want to include orexclude. Use spaces to separate names.
Note: Keywords have been defined for several classes ofPeopleSoft and SAP tables. When you enter one ofthe keywords as a tablespace, it calls all of the tablesassociated with the keyword. Using this approach mayslightly reduce system performance. Refer to theappendix titled“Best Practices Script” in the TivoliManager for Oracle User’s Guide.
87Tivoli Manager for Oracle** Reference Guide
2.D
atabase
Mo
nito
rs

CLI Syntaxtfreespacefragmentation
–a { in | not in}
–a <tablespaces>
The following briefly describes the arguments for this monitor.
{in | not in}Includes or excludes the contents of the tablespace namesfield.
GUI Name:Include/Exclude
<tablespaces>Designates the tablespace names you want to include orexclude. Use spaces to separate names.
GUI Name:Tablespace Names
Note: Keywords have been defined for several classes ofPeopleSoft and SAP tables. When you enter one ofthe keywords as a tablespace, it calls all of the tablesassociated with the keyword. Using this approach mayslightly reduce system performance. Refer to theappendix titled“Best Practices Script” in the TivoliManager for Oracle User’s Guide.
CLI Examplewaddmon ’OracleDatabaseManager’ ’tfreespacefragmentation’-a ’not in’-a ’users system’-t ’1 hours’-c ’critical’ -R ’<’ ’10’ -n ’OracleManager Sentry’-c ’severe’ -R ’<’ ’20’ -n ’OracleManager Sentry’-c ’warning’ -R ’<’ ’30’ -n ’OracleManager Sentry’-c ’normal’ -c ’always’"ProfileName"
Suggested Response LevelsThe following table shows suggested threshold values for severitylevels. See“Specifying Response Levels” in Chapter 6 of theTivoliManager for Oracle User’s Guide.
88 Version 2.0
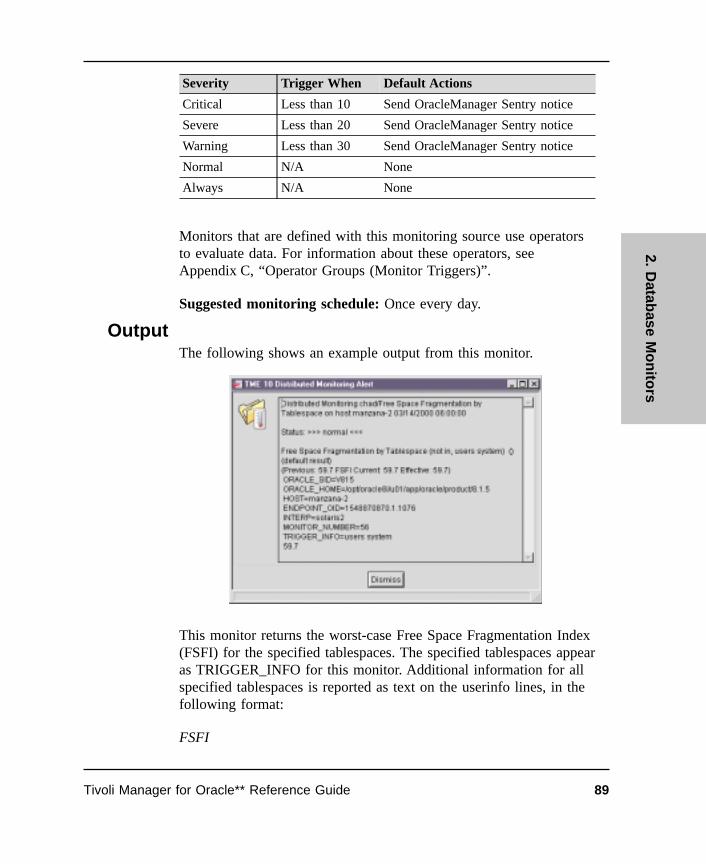
Severity Trigger When Default Actions
Critical Less than 10 Send OracleManager Sentry notice
Severe Less than 20 Send OracleManager Sentry notice
Warning Less than 30 Send OracleManager Sentry notice
Normal N/A None
Always N/A None
Monitors that are defined with this monitoring source use operatorsto evaluate data. For information about these operators, seeAppendix C,“Operator Groups (Monitor Triggers)”.
Suggested monitoring schedule: Once every day.
OutputThe following shows an example output from this monitor.
This monitor returns the worst-case Free Space Fragmentation Index(FSFI) for the specified tablespaces. The specified tablespaces appearas TRIGGER_INFO for this monitor. Additional information for allspecified tablespaces is reported as text on the userinfo lines, in thefollowing format:
FSFI
89Tivoli Manager for Oracle** Reference Guide
2.D
atabase
Mo
nito
rs
For a description of the monitor output, see“Understanding MonitorOutput” on page 6.
Views AccessedDBA_FREE_SPACE
Usage NotesThis monitor employs an arbitrary scoring system to establish if atablespace is in need of a free space rebuild. The system used is thatdefined by Loney inOracle DBA Handbook by Oracle Press, ISBN0-07-881182-1. ThisFree Space Fragmentation Index (FSFI)calculates the size of the largest extent as a percentage of the totalfree space and does not consider the number of extents in atablespace. It should be noted that this index is not a monitor of theamount of free space available. It is an indication of the structure ofthe free space.
The best-case response from this monitor is 100%. As the totalnumber of extents increases for a tablespace, the FSFI rating dropsaccordingly. Use this monitor with thealways andLog To Fileoption to establish a base line. In general, a tablespace withsufficient free space and an FSFI rating of above 30 should notexperience free space availability problems.
See AlsoThe following monitors in this chapter:Free Space FragmentationandFree Tablespace.
90 Version 2.0

Free Tablespace
DescriptionMonitors the percentage of free space in all tablespaces in adatabase. The monitor reports percent-free figure for a worst-casetablespace. If theExclude TS With Rollback Segments argument isset toYes, the monitor does not check the free space in anytablespaces that contain rollback segments.
Authorization Roleoracle_user anduser
Target EndpointOracleDatabaseManager
GUI Data Entry FieldsThe following shows the GUI fields on theAdd Monitor to TME10 Distributed Monitoring Profile dialog for theFree tablespacemonitor; a description of each field follows.
Exclude TS With Rollback SegmentsYes ignores tablespaces that contain rollback segments.
No includes tablespaces that contain rollback segments.
CLI Syntaxfreetablespace
–a { Yes | No}
The following briefly describes the argument for this monitor.
{Yes | No}Specifies whether tablespaces that contain rollback segmentsshould be ignored.
91Tivoli Manager for Oracle** Reference Guide
2.D
atabase
Mo
nito
rs

GUI Name:Exclude TS With Rollback Segments
CLI Examplewaddmon ’OracleDatabaseManager’ ’freetablespace’-a ’No’-t ’10 minutes’-c ’critical’ -R ’<’ ’5’ -n ’OracleManager Sentry’-c ’severe’ -R ’<’ ’10’ -n ’OracleManager Sentry’-c ’warning’ -R ’<’ ’20’ -n ’OracleManager Sentry’-c ’normal’-c ’always’"ProfileName"
Suggested Response LevelsThe following table shows suggested threshold values for severitylevels. See“Specifying Response Levels” in Chapter 6 of theTivoliManager for Oracle User’s Guide.
Severity Trigger When Default Actions
Critical Less than 5% Send OracleManager Sentry notice
Severe Less than 10% Send OracleManager Sentry notice
Warning Less than 20% Send OracleManager Sentry notice
Normal N/A None
Always N/A None
Monitors that are defined with this monitoring source use operatorsto evaluate data. For information about these operators, seeAppendix C,“Operator Groups (Monitor Triggers)”.
Suggested monitoring schedule: Every 10 minutes.
92 Version 2.0

OutputThe following shows an example output from this monitor.
The percent-free figures for all tablespaces are reported as text onthe userinfo lines, in the following format:
%Free, MB Free, MB Allocated, Tablespace Name
For a description of the monitor output, see“Understanding MonitorOutput” on page 6.
Views AccessedDBA_DATA_FILES
DBA_FREE_SPACE
Usage NotesA database always contains the SYSTEM rollback segment in theSYSTEM tablespace, so ifExclude TS With Rollback Segments isset toYes, the SYSTEM tablespace will not be checked. When freespace becomes low in a tablespace, either add a new datafile to theoffending tablespace or drop unwanted database objects.
93Tivoli Manager for Oracle** Reference Guide
2.D
atabase
Mo
nito
rs

With Oracle Version 7.2 and higher, it is possible for datafiles to beautomatically extended using the following SQL command:ALTERTABLESPACE tsname ADD DATAFILE ‘file’ AUTOEXTENDON;
See AlsoThe following monitors in this chapter:Free Space Deficit, FreeTablespace by Tablespace, Maximum Extents, andNumber ofDatafiles.
94 Version 2.0

Free Tablespace by Tablespace
DescriptionMonitors the percentage of free space for the specified tablespaces.
Authorization Roleoracle_user anduser
Target EndpointOracleDatabaseManager
GUI Data Entry FieldsThe following shows the GUI fields on theAdd Monitor to TME10 Distributed Monitoring Profile dialog for theFree tablespaceby tablespace monitor; a description of each field follows.
Include/ExcludeIncludes or excludes the contents of the tablespace namesfield.
Tablespace NamesDesignates the tablespace names you want to include orexclude. Use spaces to separate names.
Note: Keywords have been defined for several classes ofPeopleSoft and SAP tables. When you enter one ofthe keywords as a tablespace, it calls all of the tablesassociated with the keyword. Using this approach mayslightly reduce system performance. Refer to theappendix titled“Best Practices Script” in the TivoliManager for Oracle User’s Guide.
95Tivoli Manager for Oracle** Reference Guide
2.D
atabase
Mo
nito
rs

CLI Syntaxfreetablespacet
–a { in | not in}
–a <tablespaces>
The following briefly describes the arguments for this monitor.
{in | not in}Includes or excludes the contents of the tablespace namesfield.
GUI Name:Include/Exclude
<tablespaces>Designates the tablespace names you want to include orexclude. Use spaces to separate names.
GUI Name:Tablespace Names
Note: Keywords have been defined for several classes ofPeopleSoft and SAP tables. When you enter one ofthe keywords as a tablespace, it calls all of the tablesassociated with the keyword. Using this approach mayslightly reduce system performance. Refer to theappendix titled“Best Practices Script” in the TivoliManager for Oracle User’s Guide.
CLI Examplewaddmon ’OracleDatabaseManager’ ’freetablespacet’-a ’in’-a ’system’-t ’10 minutes’-c ’critical’ -R ’<’ ’5’ -n ’OracleManager Sentry’-c ’severe’ -R ’<’ ’10’ -n ’OracleManager Sentry’-c ’warning’ -R ’<’ ’20’ -n ’OracleManager Sentry’-c ’normal’-c ’always’"ProfileName"
Suggested Response LevelsThere are no default actions for this monitor.
96 Version 2.0

The following table shows suggested threshold values for severitylevels. See“Specifying Response Levels” in Chapter 6 of theTivoliManager for Oracle User’s Guide.
Severity Trigger When Default Actions
Critical Less than 5% Send OracleManager Sentry notice
Severe Less than 10% Send OracleManager Sentry notice
Warning Less than 20% Send OracleManager Sentry notice
Normal N/A None
Always N/A None
Monitors that are defined with this monitoring source use operatorsto evaluate data. For information about these operators, seeAppendix C,“Operator Groups (Monitor Triggers)”.
Suggested monitoring schedule: Every 10 minutes.
OutputThe following shows an example output from this monitor.
The percent-free figure for the specified tablespaces is reported astext on the userinfo lines, in the following format:
Tablespace Name, File ID, Bytes Allocated, Bytes Free, % Free
97Tivoli Manager for Oracle** Reference Guide
2.D
atabase
Mo
nito
rs

For a description of the monitor output, see“Understanding MonitorOutput” on page 6.
Views AccessedDBA_TABLESPACES
DBA_DATA_FILES
DBA_FREE_SPACE
Usage NotesWhen free space becomes low in a tablespace, either add a newdatafile to the offending tablespace or drop unwanted databaseobjects.
With Oracle Version 7.2 and higher, it is possible for datafiles to beautomatically extended using the following SQL command:ALTERTABLESPACE tsname ADD DATAFILE ‘file’ AUTOEXTENDON;
See AlsoThe following monitors in this chapter:Free Space Deficit, FreeTablespace, Maximum Extents, andNumber of Datafiles.
98 Version 2.0

Index Statistics
DescriptionMonitors the percentage of deleted rows from the user-specifiedindex that have not been repopulated.
Authorization Roleuser andoracle_monitor
Target EndpointOracleDatabaseManager
GUI Data Entry FieldsThe following shows the GUI fields on theAdd Monitor to TME10 Distributed Monitoring Profile dialog for theIndex statisticsmonitor; a description of each field follows.
Index NameThe name of the index to be monitored.
CLI Syntaxindexstatistics
–a <index_name>
The following briefly describes the argument for this monitor.
<index_name>The name of the index to be monitored.
GUI Name:Index name
CLI Examplewaddmon ’OracleDatabaseManager’ ’indexstatistics’-a ’SCOTT.PK_DEPT’-t ’1 hours’
99Tivoli Manager for Oracle** Reference Guide
2.D
atabase
Mo
nito
rs
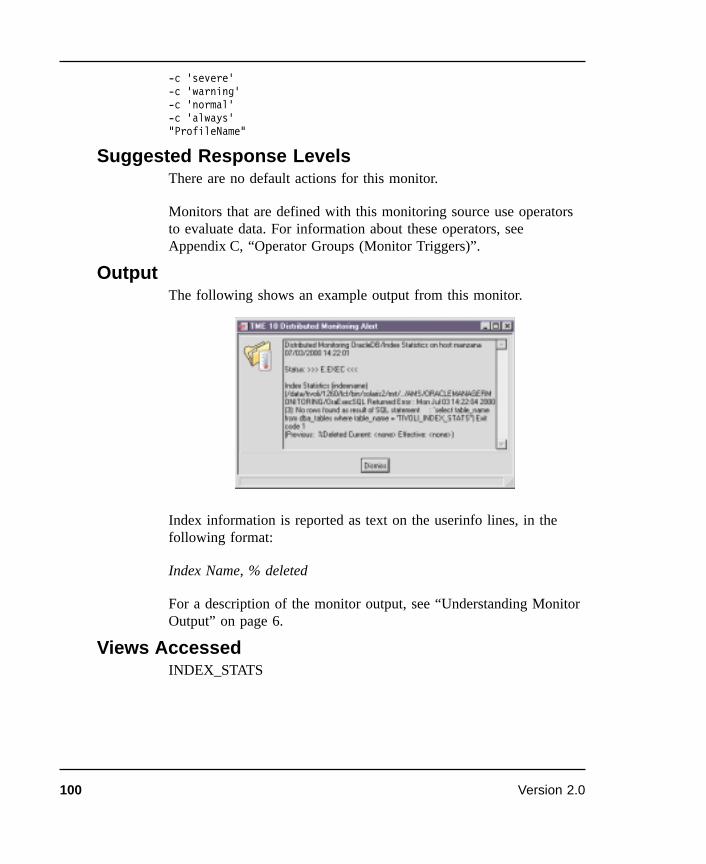
-c ’severe’-c ’warning’-c ’normal’-c ’always’"ProfileName"
Suggested Response LevelsThere are no default actions for this monitor.
Monitors that are defined with this monitoring source use operatorsto evaluate data. For information about these operators, seeAppendix C,“Operator Groups (Monitor Triggers)”.
OutputThe following shows an example output from this monitor.
Index information is reported as text on the userinfo lines, in thefollowing format:
Index Name, % deleted
For a description of the monitor output, see“Understanding MonitorOutput” on page 6.
Views AccessedINDEX_STATS
100 Version 2.0

Usage NotesThe percentage of space used by an index determines if it needs tobe rebuilt or coalesced. To prevent uneven growth of indexes, runthis monitor on indexes that will be inserted to and deleted fromfrequently.
See AlsoNone
101Tivoli Manager for Oracle** Reference Guide
2.D
atabase
Mo
nito
rs

Long Running Transactions
DescriptionThis monitor can indicate possible issues and bottlenecks in the SQLor database design. The monitor can be used to determine theidentity of long-running transactions and how long those transactionshave been running. Set up the response level thresholds to suit yourparticular environment.
Note: If a batch process occurs while this monitor is scheduled, thethresholds might not be valid during the time when the batchprocess is running.
Authorization Roleuser andoracle_monitor
Target EndpointOracleDatabaseManager
GUI Data Entry FieldsNone
CLI Syntaxlongrunningtransaction
CLI Examplewaddmon ’OracleDatabaseManager’ ’longrunningtransaction’-t ’1 minutes’-c ’critical’ -R ’>’ ’180’-c ’severe’ -R ’>’ ’120’-c ’warning’ -R ’>’ ’60’-c ’normal’-c ’always’"ProfileName"
Suggested Response LevelsThere are no default actions for this monitor.
The following table shows suggested threshold values for severitylevels. See“Specifying Response Levels” in Chapter 6 of theTivoliManager for Oracle User’s Guide.
102 Version 2.0

Severity Trigger When Default Actions
Critical Greater than 180seconds
Send OracleManager Sentrynotice
Severe Greater than 120seconds
Send OracleManager Sentrynotice
Warning Greater than 60seconds
Send OracleManager Sentrynotice
Normal N/A None
Always N/A None
Monitors that are defined with this monitoring source use operatorsto evaluate data. For information about these operators, seeAppendix C,“Operator Groups (Monitor Triggers)”.
Suggested monitoring schedule: Site specific.
OutputThe following shows an example output from this monitor.
Information returned by this monitor is reported on the userinfolines, in the following format:
Time Running, SID, Serial #, Username, SQL
103Tivoli Manager for Oracle** Reference Guide
2.D
atabase
Mo
nito
rs

For a description of the monitor output, see“Understanding MonitorOutput” on page 6.
Views AccessedV$SESSION
V$SQLTEXT
V$TRANSACTION
Usage NotesNone
See AlsoThe following monitors in the OracleInstanceManager MonitoringCollection:Active Transactions, Block Get Rate, andBuffer WaitsRatio.
104 Version 2.0

Maximum Extents
DescriptionThis monitor returns the smallest number of free extents found for asegment. This monitor also checks how close each object is to thevalue of MAXEXTENTS and reports the number of extents that canstill be allocated. It does not check objects of segment_type CACHE.If the Exclude Rollback Segments argument is set toYes, themonitor does not check the number of extents in any rollbacksegments.
Authorization Roleoracle_user anduser
Target EndpointOracleDatabaseManager
GUI Data Entry FieldsThe following shows the GUI fields on theAdd Monitor to TME10 Distributed Monitoring Profile dialog for theMaximumextents monitor; a description of each field follows.
Exclude Rollback SegmentsYes ignores rollback segments;No does not ignore rollbacksegments.
CLI Syntaxmaximumextents
–a { Yes | No}
The following briefly describes the argument for this monitor.
105Tivoli Manager for Oracle** Reference Guide
2.D
atabase
Mo
nito
rs
{Yes | No}Yes ignores rollback segments.No does not ignore rollbacksegments.
GUI Name:Exclude Rollback Segments
CLI Examplewaddmon ’OracleDatabaseManager’ ’maximumextents’-a ’No’-t ’1 hours’-c ’critical’ -R ’<’ ’1’ -n ’OracleManager Sentry’-c ’severe’ -R ’<’ ’3’ -n ’OracleManager Sentry’-c ’warning’ -R ’<’ ’5’ -n ’OracleManager Sentry’-c ’normal’-c ’always’"ProfileName"
Suggested Response LevelsThe following table shows suggested threshold values for severitylevels. See“Specifying Response Levels” in Chapter 6 of theTivoliManager for Oracle User’s Guide.
Severity Trigger When Default Actions
Critical Less than 1 Send OracleManager Sentry notice
Severe Less than 3 Send OracleManager Sentry notice
Warning Less than 5 Send OracleManager Sentry notice
Normal N/A None
Always N/A None
Monitors that are defined with this monitoring source use operatorsto evaluate data. For information about these operators, seeAppendix C,“Operator Groups (Monitor Triggers)”.
Suggested monitoring schedule: Once every hour.
106 Version 2.0

OutputThe following shows an example output from this monitor.
The segment with the smallest number of free extents is reported asTRIGGER_INFO. The free extents for additional segments are listedin ascending order in the userinfo lines, in the following format:
Free Extents, Segment Name, Tablespace Name, Object Owner,Segment Type
For a description of the monitor output, see“Understanding MonitorOutput” on page 6.
Views AccessedDBA_SEGMENTS
Usage NotesIf the number of extents for an object reaches the value of theMAXEXTENTS storage parameter and the object needs to allocatean additional extent, the operation will fail. If the value ofMAXEXTENTS is less than the maximum allowable (see the
107Tivoli Manager for Oracle** Reference Guide
2.D
atabase
Mo
nito
rs

following table), increase the value of MAXEXTENTS. Otherwise,export the object, drop and recreate the object with larger extentsizes, and import the data.
Block Size MAXEXTENTS
1 KB 57
2 KB 121
4 KB 249
8 KB 505
See AlsoThe following monitors in this chapter:Free Tablespace, MaximumExtents by Tablespace, Maximum Extents by User, andNumberof Datafiles.
108 Version 2.0

Maximum Extents by Tablespace
DescriptionThis monitor returns the smallest number of free extents found for asegment within the specified tablespaces. This monitor also checkshow close each object within the specified tablespaces is to the valueof MAXEXTENTS and reports the number of extents that can stillbe allocated. It does not check objects of segment_type CACHE.
Authorization Roleoracle_user anduser
Target EndpointOracleDatabaseManager
GUI Data Entry FieldsThe following shows the GUI fields on theAdd Monitor to TME10 Distributed Monitoring Profile dialog for theMaximumextents by tablespace monitor; a description of each field follows.
Include/ExcludeIncludes or excludes the contents of the tablespace namesfield.
Tablespace NamesDesignates the tablespace names you want to include orexclude. Use spaces to separate names.
Note: Keywords have been defined for several classes ofPeopleSoft and SAP tables. When you enter one ofthe keywords as a tablespace, it calls all of the tablesassociated with the keyword. Using this approach mayslightly reduce system performance. Refer to the
109Tivoli Manager for Oracle** Reference Guide
2.D
atabase
Mo
nito
rs

appendix titled“Best Practices Script” in the TivoliManager for Oracle User’s Guide.
CLI Syntaxmaximumextentst
–a { in | not in}
–a <tablespaces>
The following briefly describes the arguments for this monitor.
{in | not in}Includes or excludes the contents of the tablespace namesfield.
GUI Name:Include/Exclude
<tablespaces>Designates the tablespace names you want to include orexclude. Use spaces to separate names.
GUI Name:Tablespace Names
Note: Keywords have been defined for several classes ofPeopleSoft and SAP tables. When you enter one ofthe keywords as a tablespace, it calls all of the tablesassociated with the keyword. Using this approach mayslightly reduce system performance. Refer to theappendix titled“Best Practices Script” in the TivoliManager for Oracle User’s Guide.
CLI Examplewaddmon ’OracleDatabaseManager’ ’maximumextentst’-a ’in’-a ’system’-t ’1 hours’-c ’critical’ -R ’<’ ’1’ -n ’OracleManager Sentry’-c ’severe’ -R ’<’ ’3’ -n ’OracleManager Sentry’-c ’warning’ -R ’<’ ’5’ -n ’OracleManager Sentry’-c ’normal’-c ’always’"ProfileName"
110 Version 2.0

Suggested Response LevelsThe following table shows suggested threshold values for severitylevels. See“Specifying Response Levels” in Chapter 6 of theTivoliManager for Oracle User’s Guide.
Severity Trigger When Default Actions
Critical Less than 1 Send OracleManager Sentry notice
Severe Less than 3 Send OracleManager Sentry notice
Warning Less than 5 Send OracleManager Sentry notice
Normal N/A None
Always N/A None
Monitors that are defined with this monitoring source use operatorsto evaluate data. For information about these operators, seeAppendix C,“Operator Groups (Monitor Triggers)”.
Suggested monitoring schedule: Once every hour.
OutputThe following shows an example output from this monitor.
111Tivoli Manager for Oracle** Reference Guide
2.D
atabase
Mo
nito
rs

The segment with the least amount of free extents for the specifiedtablespaces is reported as TRIGGER_INFO. The free extents foradditional segments are listed in ascending order in the userinfolines, in the following format:
Free Extents, Segment Name, Object Owner, Segment Type
For a description of the monitor output, see“Understanding MonitorOutput” on page 6.
Views AccessedDBA_SEGMENTS
Usage NotesIf the number of extents for an object reaches the value of theMAXEXTENTS storage parameter, and the object needs to allocatean additional extent, the operation will fail. If the value ofMAXEXTENTS is less than the maximum allowable (see thefollowing table), increase the value of MAXEXTENTS. Otherwise,export the object, drop and recreate the object with larger extentsizes, and import the data.
Block Size MAXEXTENTS
1 KB 57
2 KB 121
4 KB 249
8 KB 505
See AlsoThe following monitors in this chapter:Free Tablespace byTablespace, Maximum Extents, Maximum Extents by User, andNumber of Datafiles.
112 Version 2.0

Maximum Extents by User
DescriptionThis monitor returns the smallest number of free extents found for asegment of a specified user. This monitor checks how close eachobject for a specified user is to the value of MAXEXTENTS andreports the number of extents that can still be allocated. It does notcheck objects of segment_type CACHE.
Authorization Roleoracle_user anduser
Target EndpointOracleDatabaseManager
GUI Data Entry FieldsThe following shows the GUI fields on theAdd Monitor to TME10 Distributed Monitoring Profile dialog for theMaximumextents by user monitor; a description of each field follows.
User NameSpecifies the Oracle user name.
CLI Syntaxmaximumextentsu
–a <username>
The following briefly describes the argument for this monitor.
<username>Specifies the Oracle user name.
GUI Name:User Name
113Tivoli Manager for Oracle** Reference Guide
2.D
atabase
Mo
nito
rs

CLI Examplewaddmon ’OracleDatabaseManager’ ’maximumextentsu’-a ’SYS’-t ’1 hours’-c ’critical’ -R ’<’ ’1’ -n ’OracleManager Sentry’-c ’severe’ -R ’<’ ’3’ -n ’OracleManager Sentry’-c ’warning’ -R ’<’ ’5’ -n ’OracleManager Sentry’-c ’normal’-c ’always’"ProfileName"
Suggested Response LevelsThe following table shows suggested threshold values for severitylevels. See“Specifying Response Levels” in Chapter 6 of theTivoliManager for Oracle User’s Guide.
Severity Trigger When Default Actions
Critical Less than 1 Send OracleManager Sentry notice
Severe Less than 3 Send OracleManager Sentry notice
Warning Less than 5 Send OracleManager Sentry notice
Normal N/A None
Always N/A None
Monitors that are defined with this monitoring source use operatorsto evaluate data. For information about these operators, seeAppendix C,“Operator Groups (Monitor Triggers)”.
Suggested monitoring schedule: Once every hour.
114 Version 2.0

OutputThe following shows an example output from this monitor.
The segment with the fewest number free extents (worst-case) forthe specified user is reported as TRIGGER_INFO. The free extentsfor additional segments are listed in ascending order in the userinfolines, in the following format:
Free Extents, Segment Name, Segment Owner, Segment Type
For a description of the monitor output, see“Understanding MonitorOutput” on page 6.
Views AccessedDBA_SEGMENTS
Usage NotesIf the number of extents for an object reaches the value of theMAXEXTENTS storage parameter, and the object needs to allocatean additional extent, the operation will fail. If the value ofMAXEXTENTS is less than the maximum allowable (see thefollowing table), increase the value of MAXEXTENTS. Otherwise,export the object, drop and recreate the object with larger extentsizes, and import the data.
115Tivoli Manager for Oracle** Reference Guide
2.D
atabase
Mo
nito
rs

Block Size MAXEXTENTS
1 KB 57
2 KB 121
4 KB 249
8 KB 505
See AlsoThe following monitors in this chapter:Free Tablespace, MaximumExtents, Maximum Extents by Tablespace, andNumber ofDatafiles.
116 Version 2.0

NT Service Status
DescriptionReports the availability status of an NT service— for example, alistener service named SQL*Net V2. This monitor returns one of thefollowing states: Is up/available, Is down/unavailable, Becomesavailable, and Becomes unavailable.
Note: For more information on the availability states for thismonitor, see Appendix C,“Operator Groups (MonitorTriggers)”.
Use this monitor to check whether a specific listener is running bypassing the service name as the argument to this monitor. Thisservice is namedOracleTNSListenerid, whereid is the name orabbreviated ID associated with the network listener.
Note: Do not attempt to run this monitor on a UNIX machine.
Authorization Roleoracle_user anduser
Target EndpointOracleDatabaseManager
GUI Data Entry FieldsThe following shows the GUI fields on theAdd Monitor to TME10 Distributed Monitoring Profile dialog for theNT service statusmonitor; a description of each field follows.
Service NameSpecifies the name of the service on the NT computer forwhich you want the monitor to check the status.
117Tivoli Manager for Oracle** Reference Guide
2.D
atabase
Mo
nito
rs

CLI Syntaxntservicestatus
–a <servicename>
The following briefly describes the argument for this monitor.
<servicename>Specifies the name of the service on the NT computer forwhich you want the monitor to check the status.
GUI Name:Service Name
CLI Examplewaddmon ’OracleDatabaseManager’ ’ntservicestatus’-a ’OracleTNSListener’-t ’1 hours’-c ’critical’ -R ’==’ ’down’ -n ’OracleManager Sentry’-c ’severe’-c ’warning’-c ’normal’-c ’always’"ProfileName"
Suggested Response LevelsThe following table shows suggested threshold values for severitylevels. See“Specifying Response Levels” in Chapter 6 of theTivoliManager for Oracle User’s Guide.
Severity Trigger When Default Actions
Critical Is down/unavailable Send OracleManager Sentry notice
Severe N/A None
Warning N/A None
Normal N/A None
Always N/A None
Monitors that are defined with this monitoring source use operatorsto evaluate data. For information about these operators, seeAppendix C,“Operator Groups (Monitor Triggers)”.
Suggested monitoring schedule: Every 5 minutes.
118 Version 2.0

OutputThe following shows an example output from this monitor.
Views AccessedNone
Usage NotesNone
See AlsoThe following monitors in this chapter:Unix SQL*Net V1 TCP/IPListener andUnix SQL*Net V2 Listener.
119Tivoli Manager for Oracle** Reference Guide
2.D
atabase
Mo
nito
rs

Number of Datafiles
DescriptionMonitors how many more datafiles can be added before the databasereaches the maximum number of datafiles allowed. When you createthe database, you must define the maximum number of datafiles. Ifthe database reaches its limit, it will not be possible to add anadditional file to the database.
Authorization Roleoracle_user anduser
Target EndpointOracleDatabaseManager
GUI Data Entry FieldsThe following shows the GUI fields on theAdd Monitor to TME10 Distributed Monitoring Profile dialog for theNumber ofdatafiles monitor; a description of each field follows.
Maximum DatafilesDesignates the maximum number of datafiles allowable inthe database.
CLI Syntaxnumberoffiles
–a <maxdatafiles>
The following briefly describes the argument for this monitor.
<maxdatafiles>Designates the maximum number of datafiles allowable inthe database.
120 Version 2.0

GUI Name:Maximum Datafiles
CLI Examplewaddmon ’OracleDatabaseManager’ ’numberoffiles’-a ’50’-t ’1 weeks’-c ’critical’ -R ’>’ ’40’ -n ’OracleManager Sentry’-c ’severe’ -R ’>’ ’30’ -n ’OracleManager Sentry’-c ’warning’ -R ’>’ ’25’ -n ’OracleManager Sentry’-c ’normal’-c ’always’"ProfileName"
Suggested Response LevelsThere are no default actions for this monitor.
Monitors that are defined with this monitoring source use operatorsto evaluate data. For information about these operators, seeAppendix C,“Operator Groups (Monitor Triggers)”.
OutputThe following shows an example output from this monitor.
The number of current datafiles used appears in the userinfo field.
For a description of the monitor output, see“Understanding MonitorOutput” on page 6.
121Tivoli Manager for Oracle** Reference Guide
2.D
atabase
Mo
nito
rs

Views AccessedNone
Usage NotesWhen a database is created, the MAXDATAFILES parameterdetermines the limit on how many files the database can have. Thedefault is operating-system dependent. The control file has a slot foreach datafile, so the only way to increase the number of datafiles isto recreate the control file with a larger value for MAXDATAFILES.It is important not to let the database reach the value ofMAXDATAFILES; otherwise, it would be impossible to add anadditional file to a tablespace if the tablespace ran out of space.
With this release of Tivoli Manager for Oracle, you must specify thevalue of MAXDATAFILES as an argument when configuring themonitor. You can find this value by typingALTER DATABASEBACKUP CONTROLFILE TO TRACE at the SQL*Plus promptand by looking for the MAXDATAFILES line in the resulting tracefile, which is namedORACLE_SID_ora_UNIXpid.trc in theUSER_DUMP_DEST directory on UNIX platforms, andORA_pid.TRC in the \ORANT\RDBMSnn\TRACE directory on aWindows NT system, wherenn is the release of Oracle.
Note: This monitor will only give the correct results if the actualvalue of MAXDATAFILES is supplied as the argument forthe monitor. If there are, for example, 20 datafiles in thedatabase, and you specify MAXDATAFILES equal to 15, thevalue checked by the monitor would be −5.
See AlsoThe following monitors in this chapter:Free Space Deficit, FreeTablespace, Extents, andMaximum Extents.
122 Version 2.0
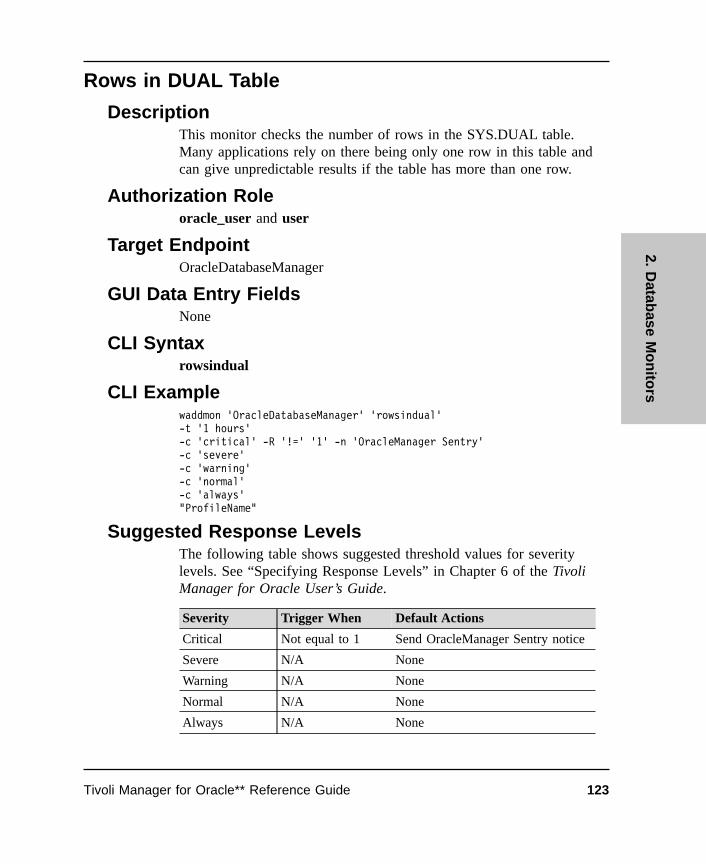
Rows in DUAL Table
DescriptionThis monitor checks the number of rows in the SYS.DUAL table.Many applications rely on there being only one row in this table andcan give unpredictable results if the table has more than one row.
Authorization Roleoracle_user and user
Target EndpointOracleDatabaseManager
GUI Data Entry FieldsNone
CLI Syntaxrowsindual
CLI Examplewaddmon ’OracleDatabaseManager’ ’rowsindual’-t ’1 hours’-c ’critical’ -R ’!=’ ’1’ -n ’OracleManager Sentry’-c ’severe’-c ’warning’-c ’normal’-c ’always’"ProfileName"
Suggested Response LevelsThe following table shows suggested threshold values for severitylevels. See “Specifying Response Levels” in Chapter 6 of the TivoliManager for Oracle User’s Guide.
Severity Trigger When Default Actions
Critical Not equal to 1 Send OracleManager Sentry notice
Severe N/A None
Warning N/A None
Normal N/A None
Always N/A None
123Tivoli Manager for Oracle** Reference Guide
2.D
atabase
Mo
nito
rs

Monitors that are defined with this monitoring source use operatorsto evaluate data. For information about these operators, seeAppendix C, “Operator Groups (Monitor Triggers)” .
Suggested monitoring schedule: Once every hour.
OutputThe following shows an example output from this monitor.
For a description of the monitor output, see “Understanding MonitorOutput” on page 6.
Views AccessedNone
Usage NotesDUAL is a one-column, one-row dummy table containing the valueX. Use it to test SQL SELECT statements or date manipulationoperations without having to modify user tables. If the table has zerorows, or more than one row, the query returns incorrect results.
See AlsoNone
124 Version 2.0

SQL Number
DescriptionUsing SQL*Plus syntax, this monitor allows you to define a SQLselect statement as the basis of a monitor.
Authorization Roleoracle_user and user
Target EndpointOracleDatabaseManager
GUI Data Entry FieldsThe following shows the GUI fields on the Add Monitor to TME10 Distributed Monitoring Profile dialog for the SQL numbermonitor; a description of each field follows.
Monitor LabelIdentifies the freeform SQL monitor that the user creates.
SQL StatementSpecifies the selection and calculation criteria, in SQL*Plussyntax, of tables and columns for monitoring. The statementmust return a numeric value.
Index Specifies the column number, within the first row returned,that is to contain the trigger value for the monitor. Thecolumns are numbered from zero upward.
No Rows AsSpecifies the value to be returned if no rows are returnedfrom SQL Statement.
125Tivoli Manager for Oracle** Reference Guide
2.D
atabase
Mo
nito
rs

CLI Syntaxfreeformsqln
–a <name>
–a <SQL_select_statement>
–a <index>
–a <value>
The following briefly describes the arguments for this monitor.
<name>Identifies the freeform SQL monitor that the user creates.
GUI Name: Monitor Label
<SQL_select_statement>Specifies the selection and calculation criteria, in SQL*Plussyntax, of tables and columns for monitoring. The statementmust return a numeric value.
GUI Name: SQL Statement
<index>Specifies the column number, within the first row returned,that is to contain the trigger value for the monitor. Thecolumns are numbered from zero upward.
GUI Name: Index
<value>Specifies the value to be returned if no rows are returnedfrom the SQL_select_statement.
GUI Name: No Rows As
CLI Examplewaddmon ’OracleDatabaseManager’ ’freeformsqln’-a ’test’-a ’select count(*) from dba_data_files’-a ’0’-a ’0’-t ’1 minutes’-c ’critical’ -R ’>’ ’20’ -n ’OracleManager Sentry’-c ’severe’ -R ’>’ ’15’ -n ’OracleManager Sentry’
126 Version 2.0

-c ’warning’-c ’normal’-c ’always’"ProfileName"
Suggested Response LevelsThere are no default actions for this monitor.
Monitors that are defined with this monitoring source use operatorsto evaluate data. For information about these operators, seeAppendix C, “Operator Groups (Monitor Triggers)” .
OutputThe following shows an example output from this monitor.
The user-specified arguments are reported as TRIGGER_INFO.Information in the userinfo lines appears in the following format:
Trigger Value
For a description of the monitor output, see “Understanding MonitorOutput” on page 6.
Views AccessedNone
127Tivoli Manager for Oracle** Reference Guide
2.D
atabase
Mo
nito
rs

Usage NotesDo not terminate the SQL statement with a semicolon (;) or forwardslash (/). The select statement might return multiple columns andmultiple rows. The trigger value (the value against which themonitoring criteria are evaluated) must be one of the columns in thefirst row returned by the statement, and must be a numeric value.
The <index> parameter defines which column within the first rowcontain the trigger value (zero-based).
A SQL select statement might return no rows. By default, TivoliManager for Oracle treats this as an error. You can override thedefault behavior with the –a <value> option, in which case themonitor returns the value specified by the argument <value>.
The ability to define a freeform SQL select statement allows for theintegration of existing performance monitoring tools (particularlythose reporting monitored values to internal Oracle tables within thesubscribing database).
See AlsoThe following monitor in this chapter: SQL String.
128 Version 2.0

SQL String
DescriptionUsing SQL*Plus syntax, this monitor enables you to define a SQLselect statement as the basis of a monitor.
Authorization Roleoracle_user and user
Target EndpointOracleDatabaseManager
GUI Data Entry FieldsThe following shows the GUI fields on the Add Monitor to TME10 Distributed Monitoring Profile dialog for the SQL stringmonitor; a description of each field follows.
Monitor LabelIdentifies the freeform SQL monitor that the user creates.
SQL StatementSpecifies the selection and calculation criteria, in SQL*Plussyntax, of tables and columns for monitoring. The statementmust return a string.
Index Specifies the column number, within the first row returned,that is to contain the trigger value for the monitor. Thecolumns are numbered from zero upwards.
No Rows AsSpecifies the value to be returned if no rows are returnedfrom SQL Statement.
129Tivoli Manager for Oracle** Reference Guide
2.D
atabase
Mo
nito
rs

CLI Syntaxfreeformsqls
–a <name>
–a <SQL_select_statement>
–a <index>
–a <value>
The following briefly describes the arguments for this monitor.
<name>Identifies the freeform SQL monitor that the user creates.
GUI Name: Monitor Label
<SQL_select_statement>Specifies the selection and calculation criteria, in SQL*Plussyntax, of tables and columns for monitoring. The statementmust return a string.
GUI Name: SQL Statement
<index>Specifies the column number, within the first row returned,that is to contain the trigger value for the monitor. Thecolumns are numbered from zero upwards.
GUI Name: Index
<value>Specifies the value to be returned if no rows are returnedfrom the SQL_select_statement.
GUI Name: No Rows As
CLI Examplewaddmon ’OracleDatabaseManager’ ’freeformsqls’-a ’Archive Status’-a ’select value from v$parameter where name = log’-a ’0’-a ’unknown’-t ’1 minutes’-c ’critical’ -R ’==’ ’SCOTT’ -n ’OracleManager Sentry’ -p’Root_manzana-region’
130 Version 2.0
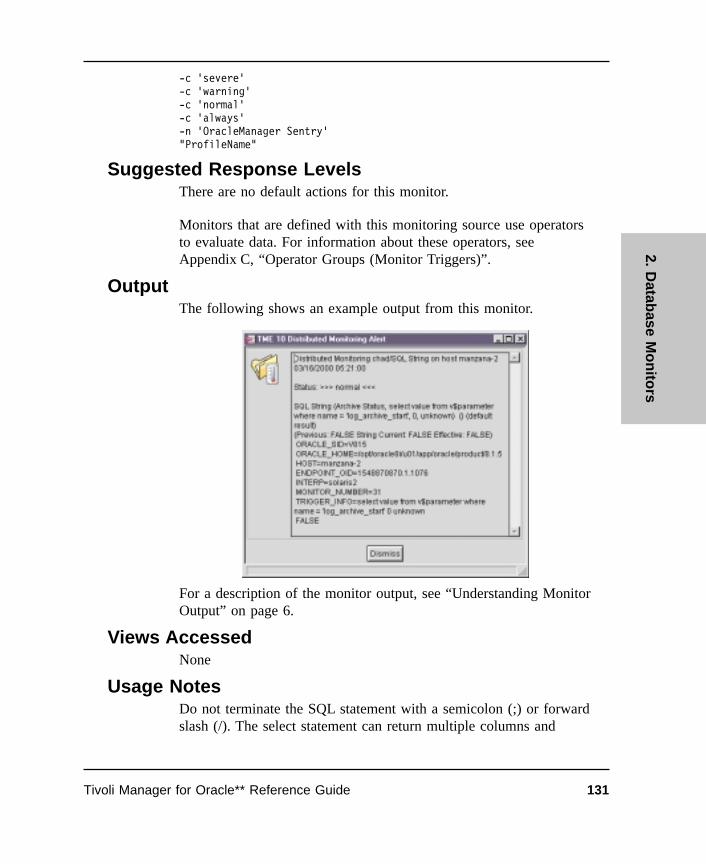
-c ’severe’-c ’warning’-c ’normal’-c ’always’-n ’OracleManager Sentry’"ProfileName"
Suggested Response LevelsThere are no default actions for this monitor.
Monitors that are defined with this monitoring source use operatorsto evaluate data. For information about these operators, seeAppendix C, “Operator Groups (Monitor Triggers)” .
OutputThe following shows an example output from this monitor.
For a description of the monitor output, see “Understanding MonitorOutput” on page 6.
Views AccessedNone
Usage NotesDo not terminate the SQL statement with a semicolon (;) or forwardslash (/). The select statement can return multiple columns and
131Tivoli Manager for Oracle** Reference Guide
2.D
atabase
Mo
nito
rs

multiple rows. The trigger value (the value against which themonitoring criteria are evaluated) must be one of the columns in thefirst row returned by the statement, and must be a string value.
The index parameter defines which column within the first rowcontains the trigger value (zero-based).
A SQL select statement can return no rows. By default, TivoliManager for Oracle treats this as an error. You can override thedefault behavior with the –a value option in, which case the monitorreturns the value specified by the argument value.
The ability to define a freeform SQL select statement allows for theintegration of existing performance monitoring tools (particularlythose reporting monitored values to internal Oracle tables within thesubscribing database).
See AlsoThe following monitor in this chapter: SQL Number.
132 Version 2.0
Temporary Extents
DescriptionMonitors how close temporary segments are to their maximumextents limit (the ratio, as a percentage, of extents to the maximumextents limit).
A temporary segment is used whenever sorts are too large to beperformed in memory; that is, the amount of space required isgreater than the value of the init.ora parameter SORT_AREA_SIZE.Oracle creates a segment in the temporary tablespace of the userwho performs the sort operation.
Authorization Roleoracle_user and user
Target EndpointOracleDatabaseManager
GUI Data Entry FieldsNone
CLI Syntaxtemporaryextents
CLI Examplewaddmon ’OracleDatabaseManager’ ’temporaryextents’-t ’1 hours’-c ’critical’ -R ’>’ ’95’ -n ’OracleManager Sentry’-c ’severe’ -R ’>’ ’85’ -n ’OracleManager Sentry’-c ’warning’ -R ’>’ ’75’ -n ’OracleManager Sentry’-c ’normal’-c ’always’"ProfileName"
Suggested Response LevelsThe following table shows suggested threshold values for severitylevels. See “Specifying Response Levels” in Chapter 6 of the TivoliManager for Oracle User’s Guide.
133Tivoli Manager for Oracle** Reference Guide
2.D
atabase
Mo
nito
rs

Severity Trigger When Default Actions
Critical Greater than 95% used Send OracleManager Sentrynotice
Severe Greater than 85% used Send OracleManager Sentrynotice
Warning Greater than 75% used Send OracleManager Sentrynotice
Normal N/A None
Always N/A None
Monitors that are defined with this monitoring source use operatorsto evaluate data. For information about these operators, seeAppendix C, “Operator Groups (Monitor Triggers)” .
Suggested monitoring schedule: Every 10 minutes.
OutputNo output available for this monitor.
Segments are reported in descending order in the monitor output,based on the percentage of extents allocated, in the following format:
Percent Used, Segment Name, Owner, Tablespace Name
For a description of the monitor output, see “Understanding MonitorOutput” on page 6.
Views AccessedDBA_SEGMENTS
Usage NotesIf the number of extents for an object reaches the value of theMAXEXTENTS storage parameter, and the object needs to allocatean additional extent, the operation will fail. Check the storageparameters for the temporary tablespace, and ensure that they areappropriate for your applications.
134 Version 2.0

Block Size MAXEXTENTS
1 KB 57
2 KB 121
4 KB 249
8 KB 505
Over time, the temporary tablespace will become fragmented, andshould be dropped and recreated periodically. You can reduce theamount of fragmentation by running the command:
alter tablespace [tablespacename] coalesce;
You can create a dedicated temporary tablespace, in which a singletemporary segment is created. This segment does not get droppedand avoids the costs associated with creating and dropping temporarysegments.
See AlsoThe following monitors in this chapter: Free Tablespace byTablespace, Temporary Extents by Tablespace, and TemporaryExtents by User.
135Tivoli Manager for Oracle** Reference Guide
2.D
atabase
Mo
nito
rs

Temporary Extents by Tablespace
DescriptionFor specified tablespaces, monitors how close temporary segmentsare to their maximum extents limit (the ratio, as a percentage, ofextents to the maximum extents limit).
A temporary segment is used whenever sorts are too large to beperformed in memory; that is, the amount of space required isgreater than the value of the init.ora parameter SORT_AREA_SIZE.Oracle creates a segment in the temporary tablespace of the userwho performs the sort operation.
Authorization Roleoracle_user and user
Target EndpointOracleDatabaseManager
GUI Data Entry FieldsThe following shows the GUI fields on the Add Monitor to TME10 Distributed Monitoring Profile dialog for the Temporaryextents by tablespace monitor; a description of each field follows.
Include/ExcludeIncludes or excludes the contents of the tablespace namesfield.
Tablespace NamesDesignates the tablespace names you want to include orexclude. Use spaces to separate names.
Note: Keywords have been defined for several classes ofPeopleSoft and SAP tables. When you enter one of
136 Version 2.0

the keywords as a tablespace, it calls all of the tablesassociated with the keyword. Using this approach mayslightly reduce system performance. Refer to theappendix titled “Best Practices Script” in the TivoliManager for Oracle User’s Guide.
CLI Syntaxtemporaryextentst
–a {in | not in}
–a <tablespaces>
The following briefly describes the arguments for this monitor.
{in | not in}Includes or excludes the contents of the tablespace namesfield.
GUI Name: Include/Exclude
<tablespaces>Designates the tablespace names you want to include orexclude. Use spaces to separate names.
GUI Name: Tablespace Names
Note: Keywords have been defined for several classes ofPeopleSoft and SAP tables. When you enter one ofthe keywords as a tablespace, it calls all of the tablesassociated with the keyword. Using this approach mayslightly reduce system performance. Refer to theappendix titled “Best Practices Script” in the TivoliManager for Oracle User’s Guide.
CLI Examplewaddmon ’OracleDatabaseManager’ ’temporaryextentst’-a ’in’-a ’TEMP’-t ’1 hours’-c ’critical’ -R ’>’ ’95’ -n ’OracleManager Sentry’-c ’severe’ -R ’>’ ’85’ -n ’OracleManager Sentry’
137Tivoli Manager for Oracle** Reference Guide
2.D
atabase
Mo
nito
rs

-c ’warning’ -R ’>’ ’75’ -n ’OracleManager Sentry’-c ’normal’-c ’always’"ProfileName"
Suggested Response LevelsThere are no default actions for this monitor.
The following table shows suggested threshold values for severitylevels. See “Specifying Response Levels” in Chapter 6 of the TivoliManager for Oracle User’s Guide.
Severity Trigger When Default Actions
Critical Greater than 95% used Send OracleManager Sentrynotice
Severe Greater than 85% used Send OracleManager Sentrynotice
Warning Greater than 75% used Send OracleManager Sentrynotice
Normal N/A None
Always N/A None
Monitors that are defined with this monitoring source use operatorsto evaluate data. For information about these operators, seeAppendix C, “Operator Groups (Monitor Triggers)” .
Suggested monitoring schedule: Every 10 minutes.
138 Version 2.0

OutputThe following shows an example output from this monitor.
The segment with the highest percentage of allocated extents, withinthe specified tablespaces, is reported as TRIGGER_INFO. Themonitor may also return additional temporary segments in theuserinfo lines. Segments are reported in descending order, based onthe percentage of extents allocated, in the following format:
% Extents Allocated, Segment Name, Segment Owner
For a description of the monitor output, see “Understanding MonitorOutput” on page 6.
Views AccessedDBA_SEGMENTS
Usage NotesIf the number of extents for an object reaches the value of theMAXEXTENTS storage parameter, and the object needs to allocatean additional extent, the operation will fail. Check the storageparameters for the temporary tablespace, and ensure that they areappropriate for your applications.
Block Size MAXEXTENTS
1 KB 57
139Tivoli Manager for Oracle** Reference Guide
2.D
atabase
Mo
nito
rs

Block Size MAXEXTENTS
2 KB 121
4 KB 249
8 KB 505
Over time, the temporary tablespace will become fragmented andshould be dropped and recreated periodically. You can reduce theamount of fragmentation by running the command:
alter tablespace [tablespacename] coalesce;
You can create a dedicated temporary tablespace, in which a singletemporary segment is created. This segment does not get droppedand avoids the costs associated with creating and dropping temporarysegments.
See AlsoThe following monitors in this chapter: Free Tablespace byTablespace, Temporary Extents, and Temporary Extents by User.
140 Version 2.0

Temporary Extents by User
DescriptionFor a specified user, monitors how close temporary segments are totheir maximum extents limit (the ratio, as a percentage, of extents tothe maximum extents limit).
A temporary segment is used whenever sorts are too large to beperformed in memory; that is, the amount of space required isgreater than the value of the init.ora parameter SORT_AREA_SIZE.Oracle creates a segment in the temporary tablespace of the userwho performs the sort operation.
Authorization Roleoracle_user and user
Target EndpointOracleDatabaseManager
GUI Data Entry FieldsThe following shows the GUI fields on the Add Monitor to TME10 Distributed Monitoring Profile dialog for the Temporaryextents by user monitor; a description of each field follows.
User NameSpecifies the Oracle user name.
CLI Syntaxtemporaryextentsu
–a <username>
The following briefly describes the argument for this monitor.
141Tivoli Manager for Oracle** Reference Guide
2.D
atabase
Mo
nito
rs

<username>Specifies the Oracle user name.
GUI Name: User Name
CLI Examplewaddmon ’OracleDatabaseManager’ ’temporaryextentsu’-a ’SYS’-t ’1 hours’-c ’critical’ -R ’>’ ’95’ -n ’OracleManager Sentry’-c ’severe’ -R ’>’ ’85’ -n ’OracleManager Sentry’-c ’warning’ -R ’>’ ’75’ -n ’OracleManager Sentry’-c ’normal’-c ’always’"ProfileName"
Suggested Response LevelsThe following table shows suggested threshold values for severitylevels. See “Specifying Response Levels” in Chapter 6 of the TivoliManager for Oracle User’s Guide.
Severity Trigger When Default Actions
Critical Greater than 95% used Send OracleManager Sentrynotice
Severe Greater than 85% used Send OracleManager Sentrynotice
Warning Greater than 75% used Send OracleManager Sentrynotice
Normal N/A None
Always N/A None
Monitors that are defined with this monitoring source use operatorsto evaluate data. For information about these operators, seeAppendix C, “Operator Groups (Monitor Triggers)” .
Suggested monitoring schedule: Every 10 minutes.
142 Version 2.0

OutputThe following shows an example output from this monitor.
The segment with the highest percentage of allocated extents for aspecified user is reported as TRIGGER_INFO. The monitor may alsoreturn additional temporary segments in the userinfo lines. Segmentsare reported in descending order, based on the percentage of extentsallocated, in the following format:
% Extents Allocated, Segment Name, Tablespace Name
For a description of the monitor output, see “Understanding MonitorOutput” on page 6.
Views AccessedDBA_SEGMENTS
Usage NotesIf the number of extents for an object reaches the value of theMAXEXTENTS storage parameter, and the object needs to allocatean additional extent, the operation will fail. Check the storageparameters for the temporary tablespace, and ensure that they areappropriate for your applications.
Block Size MAXEXTENTS
1 KB 57
143Tivoli Manager for Oracle** Reference Guide
2.D
atabase
Mo
nito
rs

Block Size MAXEXTENTS
2 KB 121
4 KB 249
8 KB 505
Over time, the temporary tablespace will become fragmented andshould be dropped and recreated periodically. You can reduce theamount of fragmentation by running the command:
alter tablespace [tablespacename] coalesce;
You can create a dedicated temporary tablespace, in which a singletemporary segment is created. This segment does not get droppedand avoids the costs associated with creating and dropping temporarysegments.
See AlsoThe following monitors in this chapter: Free Tablespace,Temporary Extents, and Temporary Extents by Tablespace.
144 Version 2.0

Total waiting time of READY messages
DescriptionThis monitor details the number of messages in the READY state ineach queue and the total waiting time of each message in days,hours, minutes, or seconds.
Use this monitor to find out if messages have been waiting for aninordinate amount of time and if there are potential performancebottlenecks. Messages in the READY state are available forpropagation across schedules as soon as a dequeue operation isstarted. A queue with multiple messages in the READY state canindicate problems with the dequeue process or problems with thedestination.
Authorization Roleuser and oracle_monitor
Target EndpointOracleDatabaseManager
GUI Data Entry FieldsThe following shows the GUI fields on the Add Monitor to TME10 Distributed Monitoring Profile dialog for the Total waitingtime of READY messages monitor; a description of each fieldfollows.
Queue NameThe name of the queue to be monitored. If this is left blank,the monitor executes on the entire database.
Time IntervalThis interval can be set for days (D), hours (H), minutes(M), or seconds (S).
145Tivoli Manager for Oracle** Reference Guide
2.D
atabase
Mo
nito
rs

CLI Syntaxtotwaittimereadymsg
–a <queue_name>
–a {D | H | M | S}
The following briefly describes the arguments for this monitor.
<queue_name>The name of the queue to be monitored. If this is left blank,the monitor executes on the entire database.
GUI Name: Queue Name
{D | H | M | S}The time interval can be set for days (D), hours (H), minutes(M), or seconds (S).
GUI Name: Time Interval
CLI Examplewaddmon ’OracleDatabaseManager’ ’totwaittimereadymsg’-a ’queue’-a ’S’-t ’1 hours’-c ’critical’ -R ’>’ ’1’ -n ’OracleManager Sentry’-c ’always’ -f"ProfileName"
Suggested Response LevelsThere are no default actions for this monitor.
Monitors that are defined with this monitoring source use operatorsto evaluate data. For information about these operators, seeAppendix C, “Operator Groups (Monitor Triggers)” .
OutputNo output available for this monitor.
The specified queue name appears as TRIGGER_INFO in themonitor output. Additional information is reported on the userinfolines in the following format:
146 Version 2.0

Queue Name, Total Wait Time, Time Interval Value, No. of READYMessages
For a description of the monitor output, see “Understanding MonitorOutput” on page 6.
Views AccessedDBA_QUEUES
GV$AQ
Usage NotesNone
See AlsoThe following monitors in this chapter: Average waiting time of“READY” messages (8i), Advanced Queue Propagation Status(8i), and AQ (Advanced Queue) Schedule Propagation errors (8i).
147Tivoli Manager for Oracle** Reference Guide
2.D
atabase
Mo
nito
rs

Unix Core Dump Space
DescriptionMonitors the percentage of space used on the device assigned forOracle core dumps. The destination device is controlled by theCORE_DUMP_DEST parameter in the init.ora file for the instance.
Note: This monitor should not be run on Windows NT systems thatdo not have a CORE_DUMP_DEST parameter.
Authorization Roleoracle_user and user
Target EndpointOracleDatabaseManager
GUI Data Entry FieldsNone
CLI Syntaxcoredumpspace
CLI Examplewaddmon ’OracleDatabaseManager’ ’coredumpspace’-t ’1 hours’-c ’critical’ -R ’>’ ’95’ -n ’OracleManager Sentry’-c ’severe’ -R ’>’ ’90’ -n ’OracleManager Sentry’-c ’warning’ -R ’>’ ’85’ -n ’OracleManager Sentry’-c ’normal’-c ’always’"ProfileName"
Suggested Response LevelsThe following table shows suggested threshold values for severitylevels. See “Specifying Response Levels” in Chapter 6 of the TivoliManager for Oracle User’s Guide.
Severity Trigger When Default Actions
Critical Greater than 95% Send OracleManager Sentry notice
Severe Greater than 90% Send OracleManager Sentry notice
148 Version 2.0

Severity Trigger When Default Actions
Warning Greater than 85% Send OracleManager Sentry notice
Normal N/A None
Always N/A None
Monitors that are defined with this monitoring source use operatorsto evaluate data. For information about these operators, seeAppendix C, “Operator Groups (Monitor Triggers)” .
Suggested monitoring schedule: Every 30 minutes.
OutputThe following shows an example output from this monitor.
The path to the core dump destination device appears asTRIGGER_INFO. Additional information concerning the core dumpdestination is reported on the userinfo lines in the following format:
Available KB, % Free, %Used, Mount Point
For a description of the monitor output, see “Understanding MonitorOutput” on page 6.
Views AccessedNone
149Tivoli Manager for Oracle** Reference Guide
2.D
atabase
Mo
nito
rs

Usage NotesOracle writes core files for background processes in theCORE_DUMP_DEST directory. If this parameter is not set in theinit.ora file, the core files are stored in $ORACLE_HOME/dbs ona UNIX system. If this directory is full, Oracle will be unable tocreate these files, which will make debugging more difficult.
See AlsoNone
150 Version 2.0

Unix SQL*Net V1 TCP/IP Listener
DescriptionThis monitor determines whether the UNIX SQL*Net Version 1TCP/IP listener process (orasrv) is running. If this process is notrunning, the machine cannot accept SQL*Net Version 1 TCP/IPconnections from any clients. This monitor returns one of thefollowing states: Is up/available, Is down/unavailable, Becomesavailable, and Becomes unavailable.
Note: For more information on the availability states for thismonitor, see Appendix C, “Operator Groups (MonitorTriggers)” .
Authorization Roleoracle_user and user
Target EndpointOracleDatabaseManager
GUI Data Entry FieldsNone
CLI Syntaxnetonetcpip
CLI Examplewaddmon ’OracleDatabaseManager’ ’netonetcpip’-t ’1 hours’-c ’critical’ -R ’==’ ’down’ -n ’OracleManager Sentry’-c ’severe’-c ’warning’-c ’normal’-c ’always’"ProfileName"
Suggested Response LevelsThe following table shows suggested threshold values for severitylevels. See “Specifying Response Levels” in Chapter 6 of the TivoliManager for Oracle User’s Guide.
151Tivoli Manager for Oracle** Reference Guide
2.D
atabase
Mo
nito
rs

Severity Trigger When Default Actions
Critical Is down/unavailable Send OracleManager Sentry notice
Severe N/A None
Warning N/A None
Normal N/A None
Always N/A None
Monitors that are defined with this monitoring source use operatorsto evaluate data. For information about these operators, seeAppendix C, “Operator Groups (Monitor Triggers)” .
Suggested monitoring schedule: Every 5 minutes.
OutputNo output available for this monitor.
For a description of the monitor output, see “Understanding MonitorOutput” on page 6.
Views AccessedNone
Usage NotesThe trigger value can be set to Becomes unavailable, which willonly report an error when the listener goes down. This preventsmessages from appearing on an administrator’s desktop each timethe monitor is run and the listener is not running. The monitorchecks if the listener is running and whether it has hung by runningthe command tcpctl stat. You can restart the listener by logging inas the Oracle owner and typing tcpctl start. This monitor will onlywork if it is distributed to an endpoint that has the SQL*Net V1software installed, because it must be able to locate the$ORACLE_HOME/bin/tcpctl program. The monitor should only bedistributed once on each machine, regardless of the number of thedatabases on the machine.
152 Version 2.0

Note: This monitor is only for UNIX systems; do not run it onWindows NT.
See AlsoThe following monitors in this chapter: Unix SQL*Net V2 Listener.
153Tivoli Manager for Oracle** Reference Guide
2.D
atabase
Mo
nito
rs

Unix SQL*Net V2 Listener
DescriptionThis monitor determines whether a UNIX SQL*Net Version 2listener process (tnslsnr) is running. If this process is not running,the machine cannot accept SQL*Net Version 2 connections from anyclients. This monitor returns one of the following states: Isup/available, Is down/unavailable, Becomes available, and Becomesunavailable.
Note: For more information on the availability states for thismonitor, see Appendix C, “Operator Groups (MonitorTriggers)” .
Authorization Roleoracle_user and user
Target EndpointOracleDatabaseManager
GUI Data Entry FieldsThe following shows the GUI fields on the Add Monitor to TME10 Distributed Monitoring Profile dialog for the UNIX SQL *NetV2 listener monitor; a description of each field follows.
Listener NameSpecifies the name of a SQL*Net listener. You can leave thisblank if there is only one listener running.
CLI Syntaxnettwolistener
–a <listener_name>
154 Version 2.0
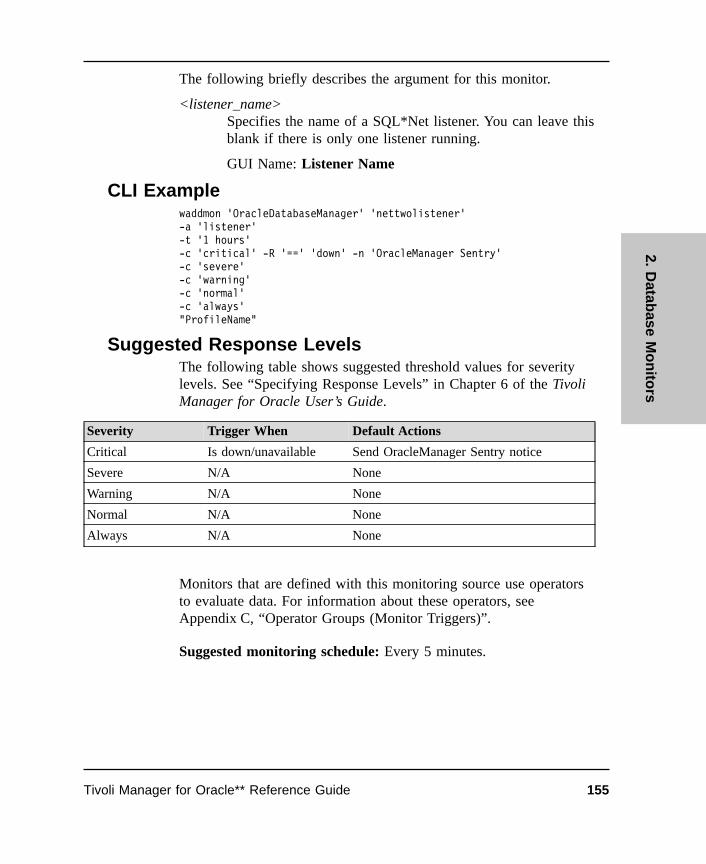
The following briefly describes the argument for this monitor.
<listener_name>Specifies the name of a SQL*Net listener. You can leave thisblank if there is only one listener running.
GUI Name: Listener Name
CLI Examplewaddmon ’OracleDatabaseManager’ ’nettwolistener’-a ’listener’-t ’1 hours’-c ’critical’ -R ’==’ ’down’ -n ’OracleManager Sentry’-c ’severe’-c ’warning’-c ’normal’-c ’always’"ProfileName"
Suggested Response LevelsThe following table shows suggested threshold values for severitylevels. See “Specifying Response Levels” in Chapter 6 of the TivoliManager for Oracle User’s Guide.
Severity Trigger When Default Actions
Critical Is down/unavailable Send OracleManager Sentry notice
Severe N/A None
Warning N/A None
Normal N/A None
Always N/A None
Monitors that are defined with this monitoring source use operatorsto evaluate data. For information about these operators, seeAppendix C, “Operator Groups (Monitor Triggers)” .
Suggested monitoring schedule: Every 5 minutes.
155Tivoli Manager for Oracle** Reference Guide
2.D
atabase
Mo
nito
rs

OutputThe following shows an example output from this monitor.
Results for this monitor appear in the TRIGGER_INFO in thefollowing format:
Listener Name, TNS_Admin
For a description of the monitor output, see “Understanding MonitorOutput” on page 6.
Views AccessedNone
Usage NotesThe trigger value can be set to Becomes unavailable, which willonly report an error when the listener goes down. This preventsmessages from appearing on an administrator’s desktop each timethe monitor is run and the listener is not running. The monitorchecks if the listener is running, and whether it has hung, by runningthe command lsnrctl stat <listener_name>. You can restart thelistener by logging in as the Oracle owner and typing lsnrctl start<listener_name>. If the TNS_ADMIN parameter is entered atregistration, the monitor will look in this location for theLISTENER.ORA file. If this parameter has not been entered, theLISTENER.ORA file should be in one of the standard locations;that is, /etc or /var/opt/oracle (the same directory as the oratab
156 Version 2.0

file), or $ORACLE_HOME/network/admin. The monitor shouldonly be distributed once on each machine, regardless of the numberof the databases on the machine.
If multiple listeners are running, this monitor must be configuredseparately for each listener.
Note: For NT systems, use the NT service status monitor to checkwhether a SQL*Net listener is running.
See AlsoThe following monitor in this collection: Unix SQL*Net V1TCP/IP Listener.
157Tivoli Manager for Oracle** Reference Guide
2.D
atabase
Mo
nito
rs

User Dump Space
DescriptionThis monitor reports the percentage of the allocated space that isused on the user dump destination device. The destination device iscontrolled by the USER_DUMP_DEST parameter in the init.ora filefor the instance.
Authorization Roleoracle_user and user
Target EndpointOracleDatabaseManager
GUI Data Entry FieldsNone
CLI Syntaxuserdumpspace
CLI Examplewaddmon ’OracleDatabaseManager’ ’userdumpspace’-t ’1 hours’-c ’critical’ -R ’>’ ’95’ -n ’OracleManager Sentry’-c ’severe’ -R ’>’ ’90’ -n ’OracleManager Sentry’-c ’warning’ -R ’>’ ’85’ -n ’OracleManager Sentry’-c ’normal’-c ’always’"ProfileName"
Suggested Response LevelsThe following table shows suggested threshold values for severitylevels. See “Specifying Response Levels” in Chapter 6 of the TivoliManager for Oracle User’s Guide.
Severity Trigger When Default Actions
Critical Greater than 95% Send OracleManager Sentry notice
Severe Greater than 90% Send OracleManager Sentry notice
Warning Greater than 85% Send OracleManager Sentry notice
Normal N/A None
158 Version 2.0

Severity Trigger When Default Actions
Always N/A None
Monitors that are defined with this monitoring source use operatorsto evaluate data. For information about these operators, seeAppendix C, “Operator Groups (Monitor Triggers)” .
Suggested monitoring schedule: Once every hour.
OutputThe following shows an example output from this monitor.
The path to the user dump destination device appears in theTRIGGER_INFO field. Additional information concerning the userdump destination is reported as text on the userinfo lines, in thefollowing format:
Available KB, %Free, % Used, Mount Point
For a description of the monitor output, see “Understanding MonitorOutput” on page 6.
Views AccessedNone
159Tivoli Manager for Oracle** Reference Guide
2.D
atabase
Mo
nito
rs

Usage NotesOracle creates trace files for the user processes in theUSER_DUMP_DEST directory. If this parameter is not set in theinit.ora file, the trace files are stored in$ORACLE_HOME/rdbms/log on a UNIX system and\ORANT\RDBMSnn\TRACE on a Windows NT system, where nnis the release of Oracle. If this directory is full, Oracle will beunable to create these files, which may result in process failure andwill make debugging more difficult.
See AlsoNone
160 Version 2.0

Instance Monitors
The OracleInstanceManager Monitoring Collection providesmonitoring sources for managing Oracle instances, including serverprocesses, cache hit ratios, and transactions. All of the instancemonitors (excluding RDBMS State) collect data from the Oracle v$views. Profiles containing OracleInstanceManager monitors shouldbe distributed to Oracle instance endpoints.
Value RangesIf a monitor produces an unexpected result, it may be because thenumber stored in the v$ view is incorrect. When you select fromSQL*Plus, the numbers are returned as signed 32-bit counters, sonumbers greater than 1,034,741,823 are displayed as negativenumbers. Any calculations using negative numbers return incorrectvalues, which can cause Oracle to erroneously respond as if athreshold has been exceeded. The longer the database has beenrunning, the greater the chance this will occur. For example, the idletime for dispatcher processes is stored in hundredths of a secondand, after a period of approximately 110 days, the idle time statisticcould display a negative number. If you suspect that the valuesreturned by a monitor are incorrect, query the underlying v$ viewsand check for negative numbers. To resolve this problem, restart thedatabase. Restarting the database resets the statistics in the v$ views.
3
161Tivoli Manager for Oracle** Reference Guide
3.In
stance
Mo
nito
rs

List of OracleInstanceManager Monitoring SourcesThe following table lists the monitoring sources in this collectionalphabetically by their graphical user interface (GUI) names. It alsoincludes their command line interface (CLI) names, monitornumbers, and whether they support Distributed Monitoring Logging.Monitors that support Distributed Monitoring Logging have a “Yes”in the Log File column. For more information, see “UsingDistributed Monitoring Logging” on page 9.
GUI Name CLI Name MonitorNumber
Log File
Active Transactions activetrans 1 Yes
Any v$lock readlock 3 Yes
Any v$sysstat readsysstat 4 Yes
Average Redo Entry Size averageredosize 6 Yes
Block Changes Per Transaction blockchanges 8 Yes
Block Get Rate blockgetrate 9 Yes
Buffer Cache Hit Ratio bufcachehitratio 11 Yes
Buffer Cache Hit Ratio (Interval) bufcachehitratioi 76 No
Buffer Waits Ratio bufferwaits 10 Yes
Call Rate callrate 12 Yes
Calls Per Transaction callspertransaction 13 Yes
Changed Block Ratio changedblockratio 16 Yes
Cluster Key Ratio clusterkeyratio 17 Yes
Completed BackgroundCheckpoints
readsysstatc 18 Yes
Consistent Change Ratio consistentchangeratio 19 Yes
Continued Row Ratio continuedrowratio 20 Yes
DBWR Checkpoints readsysstatw 21 Yes
Dictionary Cache Hit Ratio dictcachehitratio 22 Yes
Dictionary Cache Hit Ratio dictcachehitratioi 77 No
Dispatcher Busy Rate dispatchbusyrate 23 Yes
Dispatcher Wait Times dispatchwaits 24 Yes
162 Version 2.0

GUI Name CLI Name MonitorNumber
Log File
DML Locks Ratio dmllocks 25 Yes
Enqueue Timeouts enqueuetimeouts 26 Yes
Freelist Waits Ratio freelistwaits 32 Yes
Library Cache Hit Ratio libcachehitratio 33 Yes
Library Cache Hit Ratio (Interval) libcachehitratioi 78 No
Lock Hit Ratio — ParallelDescription
lockhitratiopar 142 Yes
Long Table Full Table Scans(Interval)
longtabscansi 79 No
Number of Deadlocks readsysstatd 36 Yes
Open Cursors opencursors 37 No
PCM Conversion Waits pcmconversionwaits 144 Yes
PCM Lock Conversion Time pcmlockconversiontime 143 Yes
Percentage of False Pings percentfalsepings 140 Yes
Physical I/O Reads physicalreads 63 Yes
Physical I/O Writes physicalwrites 64 Yes
Ping Rate pingrate 141 Yes
Process Ratio processratio 38 Yes
RDBMS State rdbmsstate 39 No
Recursive Call Rate recursivecallrate 40 Yes
Recursive Calls readsysstatr 41 Yes
Recursive To User Calls Ratio recursivetousercalls 42 Yes
Redo Allocation Latch Ratio redolatchratio 43 Yes
Redo Copy Latch Ratio redoclatchratio 44 Yes
Redo Log Space Waits redologwaits 45 Yes
Redo Logs Not Archived redosnotarchived 46 Yes
Redo Small Copy Ratio redosmallcopyratio 47 Yes
Rollback Waits rollbackwaits 48 Yes
Row Source Ratio rowsourceratio 49 Yes
Shared Server Process Ratio sharedserverratio 51 Yes
163Tivoli Manager for Oracle** Reference Guide
3.In
stance
Mo
nito
rs

GUI Name CLI Name MonitorNumber
Log File
Shared Server Wait Time sharedserverwait 52 Yes
Sort Overflow Ratio sortoverflowratio 53 Yes
User Rollback Ratio userrollbackratio 60 Yes
164 Version 2.0

Active Transactions
DescriptionMonitors the total number of active transactions as a percentage ofthe TRANSACTIONS parameter in the init.ora file for the instance.
Authorization Roleoracle_monitor and user
Target EndpointOracleInstanceManager
GUI Data Entry FieldsNone
CLI Syntaxactivetrans
CLI Examplewaddmon ’OracleInstanceManager’ ’activetrans’-t ’1 hours’-c ’critical’-R ’>’ ’95’-n ’OracleManager Sentry’-c ’severe’-R ’>’ ’90’-n ’OracleManager Sentry’-c ’warning’-R ’>’ ’85’-n ’OracleManager Sentry’-c ’normal’-c ’always’"ProfileName"
Suggested Response LevelsThe following table lists the default actions for this monitoringsource.
Severity Trigger When Default Actions
Critical Greater than 95% Send OracleManager Sentry notice
Severe Greater than 90% Send OracleManager Sentry notice
Warning Greater than 85% Send OracleManager Sentry notice
165Tivoli Manager for Oracle** Reference Guide
3.In
stance
Mo
nito
rs

Severity Trigger When Default Actions
Normal N/A None
Always N/A None
Monitors that are defined with this monitoring source use operatorsto evaluate data. For information about these operators, seeAppendix C, “Operator Groups (Monitor Triggers)” .
Suggested monitoring schedule: Every 10 minutes.
OutputThe following shows an example output from this monitor.
For a description of the monitor output, see “Understanding MonitorOutput” on page 6.
Views AccessedV$TRANSACTION
V$PARAMETER
Usage NotesIf this monitor regularly reports a 90% usage figure, increase theTRANSACTIONS parameter in the init.ora file for the instance(default of 1.1*PROCESSES). If the number of transactions is
166 Version 2.0
increasing, it might be necessary to add rollback segments. Use theRollback Waits monitor to determine if there is contention forrollback segments.
See AlsoThe following monitor in this chapter: Rollback Waits.
167Tivoli Manager for Oracle** Reference Guide
3.In
stance
Mo
nito
rs

Any v$lock
DescriptionMonitors the number of active locks of a user-specified type.
Authorization Roleoracle_monitor and user
Target EndpointOracleInstanceManager
GUI Data Entry FieldsThe following shows the GUI fields on the Add Monitor to TME10 Distributed Monitoring Profile dialog for the Any v$lockmonitor; a description of each field follows.
Lock TypeSpecifies the lock type. See the description of the v$locktable in the following section or in the ServerAdministrator’s Guide for the relevant version of Oracle.
CLI Syntaxreadlock
–a <lock_type>
The following briefly describes the argument for this monitor.
<lock_type>Specifies the lock type (refer to the following table).
GUI Name: Lock Type
168 Version 2.0

The following table provides the CLI and GUI arguments for theAny v$lockmonitor. For more information, see the ServerAdministrator’s Guide for the relevant version of Oracle.
CLI GUI Description
RW Row Row wait enqueue lock
TM DML DML enqueue lock
TX Transaction Transaction enqueue lock
UL User User supplied lock
BL Buffer Buffer hash table instance lock
CF Cross-instance Cross-instance function invocation instance lock
CI Control (CI) Control file schema global enqueue lock
CS Control (CS) Control file schema global enqueue lock
DF Data Data file instance lock
DM Mount/startup Mount/ startup db primary/ secondary instancelock
DR Distributed (DR) Distributed recovery process lock
DX Distributed (DX) Distributed transaction entry lock
FI SGA SGA open-file information lock
FS File File set lock
IR Instance Instance recovery serialization global enqueuelock
IV Library Library cache invalidation instance lock
LS Log Log start/ log switch enqueue lock
MB Master Master buffer hash table instance lock
MM Mount Mount definition global enqueue lock
MR Media Media recovery lock
RE USE_ROW_ENQUEUE USE_ROW_ENQUEUE enforcement lock
RT Redo Redo thread global enqueue lock
SC System (SC) System commit number instance lock
SH System (SH) System commit number high-water mark enqueuelock
SN Sequence (SN) Sequence number instance lock
169Tivoli Manager for Oracle** Reference Guide
3.In
stance
Mo
nito
rs

CLI GUI Description
SQ Sequence (SQ) Sequence number enqueue lock
ST Space Space transaction enqueue lock
SV Sequence (SV) Sequence number value lock
TA Generic Generic enqueue lock
TD DDL DDL enqueue lock
TE Extend-segment Extend-segment enqueue lock
TS Temporary (TS) Temporary segment enqueue lock
TT Temporary (TT) Temporary table enqueue lock
UN User User name lock
WL Being-written Being-written redo log instance lock
WS Write-atomic-log-switch Write-atomic-log-switch global enqueue lock
CLI Examplewaddmon ’OracleInstanceManager’ ’readlock’-a ’MB’-t ’1 hours’-c ’critical’ -R ’>’ ’95’ -n ’OracleManager Sentry’-c ’severe’ -R ’>’ ’90’ -n ’OracleManager Sentry’-c ’warning’ -R ’>’ ’80’ -n ’OracleManager Sentry’-c ’normal’-c ’always’"ProfileName"
Suggested Response LevelsThere are no default actions for this monitor.
Monitors that are defined with this monitoring source use operatorsto evaluate data. For information about these operators, seeAppendix C, “Operator Groups (Monitor Triggers)” .
170 Version 2.0

OutputThe following shows an example output from this monitor.
The specified lock type appears as TRIGGER_INFO. The triggervalue is repeated in the userinfo line.
For a description of the monitor output, see “Understanding MonitorOutput” on page 6.
Views AccessedV$LOCK
Usage NotesNone
See AlsoThe following monitors in this chapter: DML Locks Ratio, ActiveTransactions, and Open Cursors.
171Tivoli Manager for Oracle** Reference Guide
3.In
stance
Mo
nito
rs

Any v$sysstat
DescriptionMonitors the current system-wide value from v$sysstat for thespecified statistic. Valid stat_name parameters are taken from thev$statname table.
Authorization Roleoracle_monitor and user
Target EndpointOracleInstanceManager
GUI Data Entry FieldsThe following shows the GUI fields on the Add Monitor to TME10 Distributed Monitoring Profile dialog for the Any v$sysstatmonitor; a description of each field follows.
Stat NameSpecifies the statistic names from v$statname(case-sensitive). See the description of the v$ tables in theServer Administrator’s Guide for the relevant version ofOracle.
CLI Syntaxreadsysstat
–a <stat_name>
The following briefly describes the argument for this monitor.
<stat_name>Specifies the statistic names from v$statname
172 Version 2.0

(case-sensitive). See the description of the v$ tables in theServer Administrator’s Guide for the relevant version ofOracle.
GUI Name: Stat Name
CLI Examplewaddmon ’OracleInstanceManager’ ’readsysstat’-a ’user rollbacks’-t ’1 hours’-c ’critical’ -R ’>=’ ’200’ -n ’OracleManager Sentry’-c ’severe’ -R ’>=’ ’180’ -n ’OracleManager Sentry’-c ’warning’ -R ’>=’ ’150’ -n ’OracleManager Sentry’-c ’normal’-c ’always’"ProfileName"
Suggested Response LevelsThere are no default actions for this monitor.
Monitors that are defined with this monitoring source use operatorsto evaluate data. For information about these operators, seeAppendix C, “Operator Groups (Monitor Triggers)” .
OutputNo output available for this monitor.
For a description of the monitor output, see “Understanding MonitorOutput” on page 6.
Views AccessedV$SYSSTAT
Usage NotesNone
See AlsoThe following monitors in this chapter: Completed BackgroundCheckpoints, DBWR Checkpoints, Active Transactions, andRecursive Calls.
173Tivoli Manager for Oracle** Reference Guide
3.In
stance
Mo
nito
rs

Average Redo Entry Size
DescriptionMonitors the average size of a redo entry, which is calculated as thetotal redo size in bytes, divided by the number of redo entries. Thisinformation can be useful in calculating the size of the online redologs or the log buffer in the system global area (SGA).
Authorization Roleoracle_monitor and user
Target EndpointOracleInstanceManager
GUI Data Entry FieldsNone
CLI Syntaxaverageredosize
CLI Examplewaddmon ’OracleInstanceManager’ ’averageredosize’-t ’1 hours’-c ’critical’ -R ’>’ ’50000’ -n ’OracleManager Sentry’-c ’severe’ -R ’>’ ’20000’ -n ’OracleManager Sentry’-c ’warning’ -R ’>’ ’15000’ -n ’OracleManager Sentry’-c ’normal’-c ’always’"ProfileName"
Suggested Response LevelsThere are no default actions for this monitor.
Monitors that are defined with this monitoring source use operatorsto evaluate data. For information about these operators, seeAppendix C, “Operator Groups (Monitor Triggers)” .
174 Version 2.0

OutputThe following shows an example output from this monitor.
For a description of the monitor output, see “Understanding MonitorOutput” on page 6.
Views AccessedV$SYSSTAT
Usage NotesIn order to estimate the number of redo logs and the size of the redologs for a database, you need to know:
¶ The total amount of redo generated for a particular time period
¶ The average amount of redo per transaction
Use the archive log list command from within sqldba to determinethe number of redo logs generated. Use this statistic to determine theaverage redo size per transaction — this could be multiplied by thetransaction rate to estimate the total amount of redo generated.
See AlsoThe following monitors in this chapter: Redo Log Space Waits andRedo Logs Not Archived .
175Tivoli Manager for Oracle** Reference Guide
3.In
stance
Mo
nito
rs

Block Changes Per Transaction
DescriptionMeasures the amount of DML (Data Manipulation Language) workthat each transaction performs.
Authorization Roleoracle_monitor and user
Target EndpointOracleInstanceManager
GUI Data Entry FieldsNone
CLI Syntaxblockchanges
CLI Examplewaddmon ’OracleInstanceManager’ ’blockchanges’-t ’1 hours’-c ’critical’ -R ’>’ ’3’ -n ’OracleManager Sentry’-c ’severe’ -R ’>’ ’2’ -n ’OracleManager Sentry’-c ’warning’ -R ’>’ ’1’ -n ’OracleManager Sentry’-c ’normal’-c ’always’"ProfileName"
Suggested Response LevelsThere are no default actions for this monitor.
Monitors that are defined with this monitoring source use operatorsto evaluate data. For information about these operators, seeAppendix C, “Operator Groups (Monitor Triggers)” .
176 Version 2.0

OutputThe following shows an example output from this monitor.
For a description of the monitor output, see “Understanding MonitorOutput” on page 6.
Views AccessedV$SYSSTAT
Usage NotesCreating or dropping indexes impacts this value considerably andmight lead to inconclusive values because the figure also includeschanges to index blocks.
See AlsoThe following monitors in this chapter: Active Transactions.
177Tivoli Manager for Oracle** Reference Guide
3.In
stance
Mo
nito
rs

Block Get Rate
DescriptionMonitors the block get rate, which is the basic measure of the rate atwhich the application system references the database.
Authorization Roleoracle_monitor and user
Target EndpointOracleInstanceManager
GUI Data Entry FieldsNone
CLI Syntaxblockgetrate
CLI Examplewaddmon ’OracleInstanceManager’ ’blockgetrate’-t ’1 hours’-c ’critical’ -R ’<’ ’0.4’ -n ’OracleManager Sentry’-c ’severe’ -R ’<’ ’0.6’ -n ’OracleManager Sentry’-c ’warning’ -R ’<’ ’0.8’ -n ’OracleManager Sentry’-c ’normal’-c ’always’"ProfileName"
Suggested Response LevelsThere are no default actions for this monitor.
Monitors that are defined with this monitoring source use operatorsto evaluate data. For information about these operators, seeAppendix C, “Operator Groups (Monitor Triggers)” .
178 Version 2.0

OutputThe following shows an example output from this monitor.
For a description of the monitor output, see “Understanding MonitorOutput” on page 6.
Views AccessedV$SYSSTAT
Usage NotesBlock get rate is calculated as:
(db block gets + consistent gets) / second
See AlsoThe following monitors in this chapter: Buffer Cache Hit Ratio(Interval) and Buffer Cache Hit Ratio.
179Tivoli Manager for Oracle** Reference Guide
3.In
stance
Mo
nito
rs

Buffer Cache Hit Ratio
DescriptionMonitors the rate at which Oracle finds the data blocks it needs inmemory over the lifetime of an instance. This monitor indicates thecurrent ratio of buffer cache hits to total requests. The goal of thisperformance test is to achieve 100% hits, which is to have the entireapplication in memory. A correctly tuned buffer cache cansignificantly improve overall database performance.
Authorization Roleoracle_monitor and user
Target EndpointOracleInstanceManager
GUI Data Entry FieldsNone
CLI Syntaxbufcachehitratio
CLI Examplewaddmon ’OracleInstanceManager’ ’bufcachehitratio’-t ’1 hours’-c ’critical’ -R ’<’ ’70’ -n ’OracleManager Sentry’-c ’severe’ -R ’<’ ’80’ -n ’OracleManager Sentry’-c ’warning’ -R ’<’ ’90’ -n ’OracleManager Sentry’-c ’normal’-c ’always’"ProfileName"
Suggested Response LevelsThe following table lists the default actions for this monitoringsource.
Severity Trigger When Default Actions
Critical Less than 70% Send OracleManager Sentry notice
Severe Less than 80% Send OracleManager Sentry notice
Warning Less than 90% Send OracleManager Sentry notice
180 Version 2.0

Severity Trigger When Default Actions
Normal N/A None
Always N/A None
Monitors that are defined with this monitoring source use operatorsto evaluate data. For information about these operators, seeAppendix C, “Operator Groups (Monitor Triggers)” .
Suggested monitoring schedule: Every 10 minutes.
OutputThe following shows an example output from this monitor.
For a description of the monitor output, see “Understanding MonitorOutput” on page 6.
Views AccessedV$SYSSTAT
Usage NotesThe hit ratio is calculated as:
[(Logical Reads - Physical Reads) / Logical Reads] * 100
where Logical Reads = consistent gets + db block gets
181Tivoli Manager for Oracle** Reference Guide
3.In
stance
Mo
nito
rs

In general, if the hit ratio is below 90%, and the dictionary cachehas been tuned, increase the init.ora parameterDB_BLOCK_BUFFERS to increase the hit ratio. However, note thatincreasing this parameter also increases the size of the SGA. Use thex$kcbrbh table to determine how many extra buffers are required.See the Server Administrator’s Guide for the relevant version ofOracle.
Do not run the monitor until the instance has run long enough tohave a representative workload. When an instance is started, theOracle caches are empty and the cache hit rate is low, so running themonitor at this time returns misleading results.
See AlsoThe following monitors in this chapter: Buffer Cache Hit Ratio(Interval), Dictionary Cache Hit Ratio, Dictionary Cache HitRatio (Interval), Library Cache Hit Ratio and Library Cache HitRatio (Interval).
182 Version 2.0

Buffer Cache Hit Ratio (Interval)
DescriptionMonitors the rate at which Oracle finds the data blocks it needs inmemory over the current monitoring interval. This monitor indicatesthe current ratio of buffer cache hits to total requests. The goal ofthis performance test is to achieve 100% hits, which is to have theentire application in memory. A correctly tuned buffer cache cansignificantly improve overall database performance.
Authorization Roleoracle_monitor and user
Target EndpointOracleInstanceManager
GUI Data Entry FieldsNone
CLI Syntaxbufcachehitratioi
CLI Examplewaddmon ’OracleInstanceManager’ ’bufcachehitratioi’-t ’1 hours’-c ’critical’ -R ’<’ ’70’ -n ’OracleManager Sentry’-c ’severe’ -R ’<’ ’75’ -n ’OracleManager Sentry’-c ’warning’ -R ’<’ ’85’ -n ’OracleManager Sentry’-c ’normal’-c ’always’"ProfileName"
Suggested Response LevelsThe following table lists the default actions for this monitoringsource.
Severity Trigger When Default Actions
Critical Less than 70% Send OracleManager Sentry notice
Severe Less than 75% Send OracleManager Sentry notice
Warning Less than 85% Send OracleManager Sentry notice
183Tivoli Manager for Oracle** Reference Guide
3.In
stance
Mo
nito
rs

Severity Trigger When Default Actions
Normal N/A None
Always N/A None
Monitors that are defined with this monitoring source use operatorsto evaluate data. For information about these operators, seeAppendix C, “Operator Groups (Monitor Triggers)” .
Suggested monitoring schedule: Every 10 minutes.
OutputThe following shows an example output from this monitor.
For a description of the monitor output, see “Understanding MonitorOutput” on page 6.
Views AccessedV$SYSSTAT
Usage NotesThe hit ratio is calculated as:
[(Logical Reads - Physical Reads) / Logical Reads] * 100
where Logical Reads = consistent gets + db block gets
In general, if the hit ratio is below 90%, and the dictionary cachehas been tuned, increase the init.ora parameter
184 Version 2.0

DB_BLOCK_BUFFERS to increase the hit ratio. However, note thatincreasing this parameter also increases the size of the SGA. Use thex$kcbrbh table to determine how many extra buffers are required.See the Server Administrator’s Guide for the relevant version ofOracle.
Do not run the monitor until the instance has run long enough tohave a representative workload. When an instance is started, theOracle caches are empty and the cache hit rate is low, so running themonitor at this time returns misleading results.
See AlsoThe following monitors in this chapter: Buffer Cache Hit Ratio,Dictionary Cache Hit Ratio, Dictionary Cache Hit Ratio(Interval), Library Cache Hit Ratio and Library Cache Hit Ratio(Interval).
185Tivoli Manager for Oracle** Reference Guide
3.In
stance
Mo
nito
rs

Buffer Waits Ratio
DescriptionMonitors the ratio of buffer busy waits to logical reads. Thisindicates that a user process attempted to acquire a buffer but had towait because the buffer was held in an incompatible mode.
Authorization Roleoracle_monitor and user
Target EndpointOracleInstanceManager
GUI Data Entry FieldsNone
CLI Syntaxbufferwaits
CLI Examplewaddmon ’OracleInstanceManager’ ’bufferwaits’-t ’1 hours’-c ’critical’ -R ’>’ ’15’ -n ’OracleManager Sentry’-c ’severe’ -R ’>’ ’10’ -n ’OracleManager Sentry’-c ’warning’ -R ’>’ ’5’ -n ’OracleManager Sentry’-c ’normal’-c ’always’"ProfileName"
Suggested Response LevelsThe following table lists the default actions for this monitoringsource:
Severity Trigger When Default Actions
Critical Greater than 15% Send OracleManager Sentry notice
Severe Greater than 10% Send OracleManager Sentry notice
Warning Greater than 5% Send OracleManager Sentry notice
Normal N/A None
Always N/A None
186 Version 2.0

Monitors that are defined with this monitoring source use operatorsto evaluate data. For information about these operators, seeAppendix C, “Operator Groups (Monitor Triggers)” .
Suggested monitoring schedule: Every 30 minutes.
OutputThe following shows an example output from this monitor.
The information for all buffer waits is reported as text on theuserinfo lines, in the following format:
busy_waits
consistent_gets
db_block_gets
For a description of the monitor output, see “Understanding MonitorOutput” on page 6.
Views AccessedV$SYSTEM_EVENT
V$SYSSTAT
187Tivoli Manager for Oracle** Reference Guide
3.In
stance
Mo
nito
rs

Usage NotesA non-zero value for this ratio indicates that block contention isoccurring. The ratio is calculated as:
buffer busy waits / logical reads
where logical reads = consistent gets + db block gets
Query the v$waitstat table to determine what kind of waits areoccurring. Having studied this table, note the following:
¶ Avoid resource waits of any kind. If undo rollback segmentwaits are occurring, increase the number of private rollbacksegments the monitored database contains. Run the RollbackWaits monitor to examine rollback segment waits.
¶ If data block waits are occurring, increase the FREELISTparameter for heavily inserted tables. If in doubt, set FREELISTto 2 for tables suspected of being an insert or update bottleneck.Use the Freelist Waits Ratio monitor to specifically check forthis form of block contention.
See AlsoThe following monitors in this chapter: Freelist Waits Ratio andRollback Waits.
188 Version 2.0

Call Rate
DescriptionProvides an overview of the work rate being run against theinstance. Calls do any of the following: describe, parse, open, fetch,close, or execute. The call rate is dependent on the design of anapplication. Use of an array interface will also affect this figure.
Authorization Roleoracle_monitor and user
Target EndpointOracleInstanceManager
GUI Data Entry FieldsNone
CLI Syntaxcallrate
CLI Examplewaddmon ’OracleInstanceManager’ ’callrate’-t ’1 hours’-c ’critical’ -R ’>’ ’0.9’ -n ’OracleManager Sentry’-c ’severe’ -R ’>’ ’0.7’ -n ’OracleManager Sentry’-c ’warning’ -R ’>’ ’0.5’ -n ’OracleManager Sentry’-c ’normal’-c ’always’"ProfileName"
Suggested Response LevelsThere are no default actions for this monitor.
Monitors that are defined with this monitoring source use operatorsto evaluate data. For information about these operators, seeAppendix C, “Operator Groups (Monitor Triggers)” .
Because this monitor operates in the context of the monitoringschedule, the first execution of the monitor will return an invalidvalue and the following text on the userinfo lines:!!RATE_BASED_MONITOR_STARTUP!!
189Tivoli Manager for Oracle** Reference Guide
3.In
stance
Mo
nito
rs

OutputThe following shows an example output from this monitor.
The sum of the cumulative counters of the recursive calls and usercalls obtained from the v$sysstat appears as TRIGGER_INFO.
For a description of the monitor output, see “Understanding MonitorOutput” on page 6.
Views AccessedV$SYSSTAT
Usage NotesCall rate is calculated as:
(r + u) / t
where:
r is the recursive calls for the period
u is the user calls for the period
t is the time in seconds since the last monitor probe
190 Version 2.0

See AlsoThe following monitor in this chapter: Recursive Call Rate.
191Tivoli Manager for Oracle** Reference Guide
3.In
stance
Mo
nito
rs

Calls Per Transaction
DescriptionMonitors the number of client requests made per transaction. Callsdo any of the following: describe, parse, open, fetch, close, orexecute. Calls per transaction can be used to detect changes in theapplication, or in the way in which it is being used. The reportedvalue can change considerably when ad hoc queries are issued.
Authorization Roleoracle_monitor and user
Target EndpointOracleInstanceManager
GUI Data Entry FieldsNone
CLI Syntaxcallspertransaction
CLI Examplewaddmon ’OracleInstanceManager’ ’callspertransaction’-t ’1 hours’-c ’critical’ -R ’>’ ’1500’ -n ’OracleManager Sentry’-c ’severe’ -R ’>’ ’900’ -n ’OracleManager Sentry’-c ’warning’ -R ’>’ ’500’ -n ’OracleManager Sentry’-c ’normal’-c ’always’"ProfileName"
Suggested Response LevelsThere are no default actions for this monitor.
Monitors that are defined with this monitoring source use operatorsto evaluate data. For information about these operators, seeAppendix C, “Operator Groups (Monitor Triggers)” .
192 Version 2.0

OutputThe following shows an example output from this monitor.
For a description of the monitor output, see “Understanding MonitorOutput” on page 6.
Views AccessedV$SYSSTAT
Usage NotesNone
See AlsoThe following monitors in this chapter: Call Rate and ActiveTransactions.
193Tivoli Manager for Oracle** Reference Guide
3.In
stance
Mo
nito
rs

Changed Block Ratio
DescriptionMonitors the percentage of blocks accessed that have been updated.
Authorization Roleoracle_monitor and user
Target EndpointOracleInstanceManager
GUI Data Entry FieldsNone
CLI Syntaxchangedblockratio
CLI Examplewaddmon ’OracleInstanceManager’ ’changedblockratio’-t ’1 hours’-c ’critical’ -R ’>’ ’20’ -n ’OracleManager Sentry’-c ’severe’ -R ’>’ ’15’ -n ’OracleManager Sentry’-c ’warning’ -R ’>’ ’10’ -n ’OracleManager Sentry’-c ’normal’-c ’always’"ProfileName"
Suggested Response LevelsThere are no default actions for this monitor.
Monitors that are defined with this monitoring source use operatorsto evaluate data. For information about these operators, seeAppendix C, “Operator Groups (Monitor Triggers)” .
194 Version 2.0

OutputThe following shows an example output from this monitor.
For a description of the monitor output, see “Understanding MonitorOutput” on page 6.
Views AccessedV$SYSSTAT
Usage NotesThis monitor reports the balance between queries made and theDML within the database application. Changes in this ratio indicateand quantify changes to index structures or application usage. Theratio is calculated as:
[db block changes / (db block gets + consistent gets)] * 100
See AlsoThe following monitors in this chapter: DBWR Checkpoints andCompleted Background Checkpoints.
195Tivoli Manager for Oracle** Reference Guide
3.In
stance
Mo
nito
rs

Cluster Key Ratio
DescriptionMonitors the ratio of cluster key scan block gets to cluster keyscans. If the ratio is greater than one, the rows for a cluster key arestored in multiple data blocks. To analyze the cluster for rowchaining, use the Chained Rows (cluster) monitor.
Authorization Roleoracle_monitor and user
Target EndpointOracleInstanceManager
GUI Data Entry FieldsNone
CLI Syntaxclusterkeyratio
CLI Examplewaddmon ’OracleInstanceManager’ ’clusterkeyratio’-t ’10 minutes’-c ’critical’ -R ’>’ ’5’ -n ’OracleManager Sentry’-c ’severe’ -R ’>’ ’3’ -n ’OracleManager Sentry’-c ’warning’ -R ’>’ ’1’ -n ’OracleManager Sentry’-c ’normal’-c ’always’"ProfileName"
Suggested Response LevelsThere are no default actions for this monitor.
Monitors that are defined with this monitoring source use operatorsto evaluate data. For information about these operators, seeAppendix C, “Operator Groups (Monitor Triggers)” .
Suggested monitoring schedule: Every 10 minutes.
196 Version 2.0

OutputThe following shows an example output from this monitor.
For a description of the monitor output, see “Understanding MonitorOutput” on page 6.
Views AccessedV$SYSSTAT
Usage NotesCluster key ratio is calculated as:
cluster key scan block gets / cluster key scans
The SIZE parameter specified during the CREATE CLUSTERcommand determines the number of cluster keys per block. Thedefault is one data block per cluster key value. If all the data for acluster key does not fit into a block, multiple blocks are read,resulting in additional I/O. Recreate the cluster with a larger SIZEvalue.
See AlsoThe following monitor in this chapter: Long Table Full Table Scans(Interval).
197Tivoli Manager for Oracle** Reference Guide
3.In
stance
Mo
nito
rs

Completed Background Checkpoints
DescriptionMonitors the number of times a database writer (DBWR) checkpointis completed. Frequent checkpoints can reduce recovery time in theevent of a system failure; this is offset by the momentary reductionin runtime performance while the checkpoint is carried out.
Authorization Roleoracle_monitor and user
Target EndpointOracleInstanceManager
GUI Data Entry FieldsNone
CLI Syntaxreadsysstatc
CLI Examplewaddmon ’OracleInstanceManager’ ’readsysstatc’-t ’1 hours’-c ’critical’ -R ’<’ ’5’ -n ’OracleManager Sentry’-c ’severe’ -R ’<’ ’7’ -n ’OracleManager Sentry’-c ’warning’ -R ’<’ ’10’ -n ’OracleManager Sentry’-c ’normal’-c ’always’"ProfileName"
Suggested Response LevelsThere are no default actions for this monitor.
Monitors that are defined with this monitoring source use operatorsto evaluate data. For information about these operators, seeAppendix C, “Operator Groups (Monitor Triggers)” .
198 Version 2.0

OutputThe following shows an example output from this monitor.
The trigger value is returned as TRIGGER_INFO.
For a description of the monitor output, see “Understanding MonitorOutput” on page 6.
Views AccessedV$SYSSTAT
Usage NotesChoose the checkpoint frequency based on performance concerns;the frequency is controlled by means of theLOG_CHECKPOINT_INTERVAL andLOG_CHECKPOINT_TIMEOUT parameters in the init.ora file forthe instance. You can reduce the number of checkpoints byincreasing the size of the redo log files and by settingLOG_CHECKPOINT_INTERVAL to a value greater than the size ofthe redo log files. Also, consider starting the instance with a CKPTbackground process, which will write the checkpoint information tothe database files (if the CKPT process does not exist, LGWR mustperform this task). This procedure reduces the time a checkpointtakes to complete.
199Tivoli Manager for Oracle** Reference Guide
3.In
stance
Mo
nito
rs

See AlsoThe following monitors in this chapter: DBWR Checkpoints andProcess Ratio.
200 Version 2.0

Consistent Change Ratio
DescriptionMonitors the ratio of consistent changes to consistent gets.
Authorization Roleoracle_monitor and user
Target EndpointOracleInstanceManager
GUI Data Entry FieldsNone
CLI Syntaxconsistentchangeratio
CLI Examplewaddmon ’OracleInstanceManager’ ’consistentchangeratio’-t ’1 hours’-c ’critical’ -R ’>=’ ’15’ -n ’OracleManager Sentry’-c ’severe’ -R ’>=’ ’10’ -n ’OracleManager Sentry’-c ’warning’ -R ’>=’ ’5’ -n ’OracleManager Sentry’-c ’normal’-c ’always’"ProfileName"
Suggested Response LevelsThere are no default actions for this monitor.
Monitors that are defined with this monitoring source use operatorsto evaluate data. For information about these operators, seeAppendix C, “Operator Groups (Monitor Triggers)” .
201Tivoli Manager for Oracle** Reference Guide
3.In
stance
Mo
nito
rs

OutputThe following shows an example output from this monitor.
For a description of the monitor output, see “Understanding MonitorOutput” on page 6.
Views AccessedV$SYSSTAT
Usage NotesThis monitor reports the extent to which the applications mustexercise the read consistency mechanism.
Consistent change ratio is calculated as:
(consistent changes / consistent gets) * 100
See AlsoThe following monitor in this chapter: Changed Block Ratio.
202 Version 2.0

Continued Row Ratio
DescriptionMonitors the percentage of rows retrieved that extend over morethan one block, which is called chained rows. The ratio should bevery close to 0, except in applications that have long columns, orrows that are larger than one block (spanned rows), where chainingis unavoidable.
Authorization Roleoracle_monitor and user
Target EndpointOracleInstanceManager
GUI Data Entry FieldsNone
CLI Syntaxcontinuedrowratio
CLI Examplewaddmon ’OracleInstanceManager’ ’continuedrowratio’-t ’10 minutes’-c ’critical’ -R ’>’ ’1’ -n ’OracleManager Sentry’-c ’severe’ -R ’>’ ’0.5’ -n ’OracleManager Sentry’-c ’warning’ -R ’>’ ’0’ -n ’OracleManager Sentry’-c ’normal’-c ’always’"ProfileName"
Suggested Response LevelsThe following table lists the default actions for this monitoringsource.
Severity Trigger When Default Actions
Critical Greater than 1% Send OracleManager Sentrynotice
Severe Greater than 0.5% Send OracleManager Sentrynotice
203Tivoli Manager for Oracle** Reference Guide
3.In
stance
Mo
nito
rs

Severity Trigger When Default Actions
Warning Greater than 0% Send OracleManager Sentrynotice
Normal N/A None
Always N/A None
Monitors that are defined with this monitoring source use operatorsto evaluate data. For information about these operators, seeAppendix C, “Operator Groups (Monitor Triggers)” .
Suggested monitoring schedule: Every 10 minutes.
OutputThe following shows an example output from this monitor.
For a description of the monitor output, see “Understanding MonitorOutput” on page 6.
Views AccessedV$SYSSTAT
204 Version 2.0

Usage NotesIf the monitor reports a ratio steadily increasing over time, identifywhich tables are experiencing chaining (use the Chained Rows(cluster) monitor) and increase the PCTFREE for these tables.
Note: A row is recorded as chained only if the access is performedby RowID. Full table scans of tables that contain chainedrows do not cause the v$sysstat statistic table fetch continuedrow to increase.
See AlsoThe following monitors in the OracleDatabaseManager MonitoringCollection: Chained Rows (cluster) and Chained Rows (table).
205Tivoli Manager for Oracle** Reference Guide
3.In
stance
Mo
nito
rs

DBWR Checkpoints
DescriptionMonitors the number of database writer (DBWR) checkpointsrequested by the server. Frequent checkpoints can reduce recoverytime in the event of a system failure; this is offset by the momentaryreduction in runtime performance while the checkpoint is carried out.
Authorization Roleoracle_monitor and user
Target EndpointOracleInstanceManager
GUI Data Entry FieldsNone
CLI Syntaxreadsysstatw
CLI Examplewaddmon ’OracleInstanceManager’ ’readsysstatw’-t ’1 hours’-c ’critical’ -R ’>=’ ’50’ -n ’OracleManager Sentry’-c ’severe’ -R ’>=’ ’40’ -n ’OracleManager Sentry’-c ’warning’ -R ’>=’ ’30’ -n ’OracleManager Sentry’-c ’normal’-c ’always’"ProfileName"
Suggested Response LevelsThere are no default actions for this monitor.
Monitors that are defined with this monitoring source use operatorsto evaluate data. For information about these operators, seeAppendix C, “Operator Groups (Monitor Triggers)” .
206 Version 2.0

OutputThe following shows an example output from this monitor.
For a description of the monitor output, see “Understanding MonitorOutput” on page 6.
Views AccessedV$SYSSTAT
Usage NotesChoose the checkpoint frequency based on performance concerns;the frequency is controlled by means of theLOG_CHECKPOINT_INTERVAL andLOG_CHECKPOINT_TIMEOUT parameters in the init.ora file forthe instance. You can reduce the number of checkpoints byincreasing the size of the redo log files and by settingLOG_CHECKPOINT_INTERVAL to a value greater than the size ofthe redo log files. Also, consider starting the instance with a CKPTbackground process, which will write the checkpoint information tothe database files (if the CKPT process does not exist, LGWR mustperform this task). This procedure reduces the time a checkpointtakes to complete.
See AlsoThe following monitor in this chapter: Process Ratio.
207Tivoli Manager for Oracle** Reference Guide
3.In
stance
Mo
nito
rs

Dictionary Cache Hit Ratio
DescriptionMonitors the effectiveness of the dictionary cache over the lifetimeof an instance. This monitor shows the ratio, as a percentage, ofdictionary cache hits to total requests. A correctly tuned dictionarycache can significantly improve overall database performance.
Authorization Roleoracle_monitor and user
Target EndpointOracleInstanceManager
GUI Data Entry FieldsNone
CLI Syntaxdictcachehitratio
CLI Examplewaddmon ’OracleInstanceManager’ ’dictcachehitratio’-t ’10 minutes’-c ’critical’ -R ’<’ ’70’ -n ’OracleManager Sentry’-c ’severe’ -R ’<’ ’80’ -n ’OracleManager Sentry’-c ’warning’ -R ’<’ ’90’ -n ’OracleManager Sentry’-c ’normal’-c ’always’"ProfileName"
Suggested Response LevelsThe following table lists the default actions for this monitoringsource.
Severity Trigger When Default Actions
Critical Less than 70% Send OracleManager Sentrynotice
Severe Less than 80% Send OracleManager Sentrynotice
Warning Less than 90% Send OracleManager Sentrynotice
208 Version 2.0
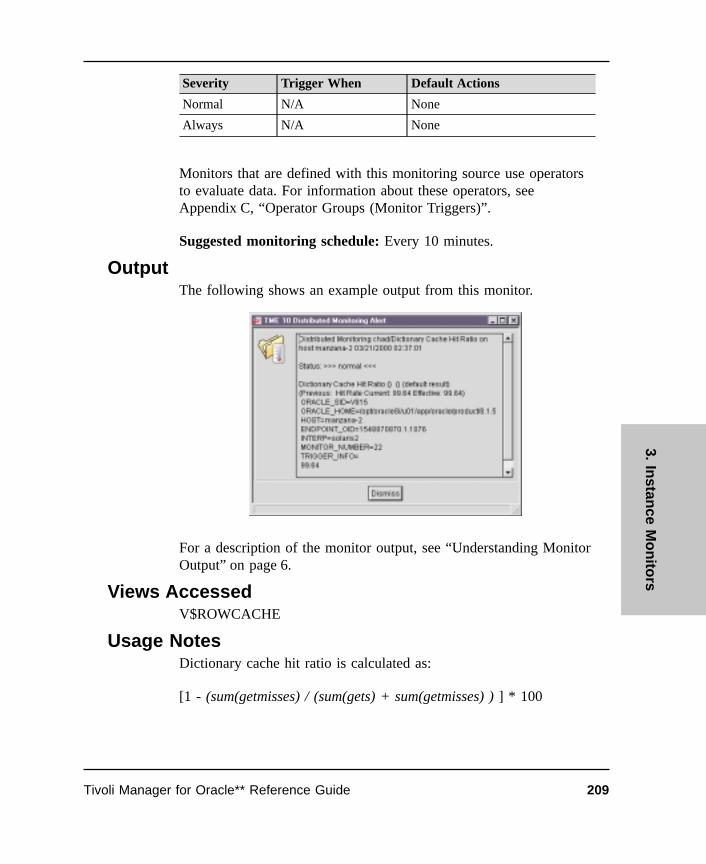
Severity Trigger When Default Actions
Normal N/A None
Always N/A None
Monitors that are defined with this monitoring source use operatorsto evaluate data. For information about these operators, seeAppendix C, “Operator Groups (Monitor Triggers)” .
Suggested monitoring schedule: Every 10 minutes.
OutputThe following shows an example output from this monitor.
For a description of the monitor output, see “Understanding MonitorOutput” on page 6.
Views AccessedV$ROWCACHE
Usage NotesDictionary cache hit ratio is calculated as:
[1 - (sum(getmisses) / (sum(gets) + sum(getmisses) ) ] * 100
209Tivoli Manager for Oracle** Reference Guide
3.In
stance
Mo
nito
rs

If the hit ratio is less than 70%, increase the value of the init.oraparameter SHARED_POOL_SIZE. Tivoli recommends that theSHARED_POOL_SIZE be at least 4 MB in size. Large databasesmight require a shared pool of at least 10 MB. Note that increasingSHARED_POOL_SIZE will increase the size of the SGA (if this ismade unnecessarily large, it will impact the amount of memory thatis available to other processes).
Do not run the monitor until the instance has run long enough tohave a representative workload. When an instance is started, theOracle caches are empty and the cache hit rate is low, so running themonitor at this time returns misleading results.
See AlsoThe following monitors in this chapter: Buffer Cache Hit Ratio,Buffer Cache Hit Ratio (Interval), Dictionary Cache Hit Ratio(Interval), Library Cache Hit Ratio and Library Cache Hit Ratio(Interval).
210 Version 2.0

Dictionary Cache Hit Ratio (Interval)
DescriptionMonitors the effectiveness of the dictionary cache for the currentmonitoring interval. This monitor shows the ratio, as a percentage, ofdictionary cache hits to total requests. A correctly tuned dictionarycache can significantly improve overall database performance.
Authorization Roleoracle_monitor and user
Target EndpointOracleInstanceManager
GUI Data Entry FieldsNone
CLI Syntaxdictcachehitratioi
CLI Examplewaddmon ’OracleInstanceManager’ ’dictcachehitratioi’-t ’30 minutes’-c ’critical’ -R ’<’ ’70’ -n ’OracleManager Sentry’-c ’severe’ -R ’<’ ’80’ -n ’OracleManager Sentry’-c ’warning’ -R ’<’ ’90’ -n ’OracleManager Sentry’-c ’normal’-c ’always’"ProfileName"
Suggested Response LevelsThe following table lists the default actions for this monitoringsource.
Severity Trigger When Default Actions
Critical Less than 70% Send OracleManager Sentrynotice
Severe Less than 80% Send OracleManager Sentrynotice
Warning Less than 90% Send OracleManager Sentrynotice
211Tivoli Manager for Oracle** Reference Guide
3.In
stance
Mo
nito
rs
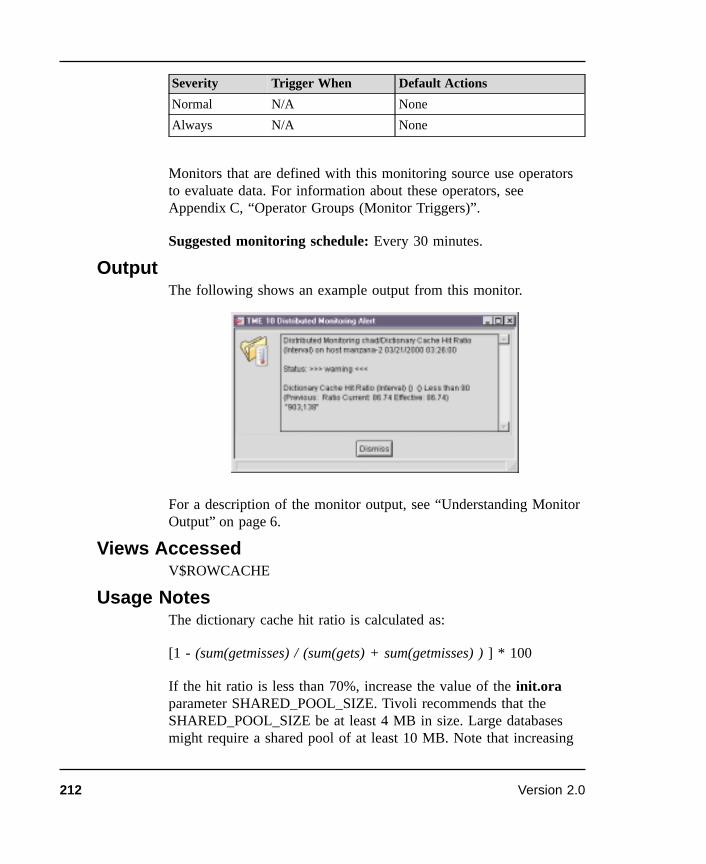
Severity Trigger When Default Actions
Normal N/A None
Always N/A None
Monitors that are defined with this monitoring source use operatorsto evaluate data. For information about these operators, seeAppendix C, “Operator Groups (Monitor Triggers)” .
Suggested monitoring schedule: Every 30 minutes.
OutputThe following shows an example output from this monitor.
For a description of the monitor output, see “Understanding MonitorOutput” on page 6.
Views AccessedV$ROWCACHE
Usage NotesThe dictionary cache hit ratio is calculated as:
[1 - (sum(getmisses) / (sum(gets) + sum(getmisses) ) ] * 100
If the hit ratio is less than 70%, increase the value of the init.oraparameter SHARED_POOL_SIZE. Tivoli recommends that theSHARED_POOL_SIZE be at least 4 MB in size. Large databasesmight require a shared pool of at least 10 MB. Note that increasing
212 Version 2.0

SHARED_POOL_SIZE will increase the size of the SGA (if this ismade unnecessarily large, it will impact the amount of memory thatis available to other processes).
Do not run the monitor until the instance has run long enough tohave a representative workload. When an instance is started, theOracle caches are empty and the cache hit rate is low, so running themonitor at this time returns misleading results.
See AlsoThe following monitors in this chapter: Buffer Cache Hit Ratio,Buffer Cache Hit Ratio (Interval), Dictionary Cache Hit Ratio,Library Cache Hit Ratio and Library Cache Hit Ratio (Interval).
213Tivoli Manager for Oracle** Reference Guide
3.In
stance
Mo
nito
rs

Dispatcher Busy Rate
DescriptionThis monitor reports the percentage of time that dispatcher processesfor the protocol with the most contention are busy.
Authorization Roleoracle_monitor and user
Target EndpointOracleInstanceManager
GUI Data Entry FieldsNone
CLI Syntaxdispatchbusyrate
CLI Examplewaddmon ’OracleInstanceManager’ ’dispatchbusyrate’-t ’10 minutes’-c ’critical’ -R ’>’ ’90’ -n ’OracleManager Sentry’-c ’severe’ -R ’>’ ’70’ -n ’OracleManager Sentry’-c ’warning’ -R ’>’ ’50’ -n ’OracleManager Sentry’-c ’normal’-c ’always’"ProfileName"
Suggested Response LevelsThe following table lists the default actions for this monitoringsource.
Severity Trigger When Default Actions
Critical Greater than 90% Send OracleManager Sentrynotice
Severe Greater than 70% Send OracleManager Sentrynotice
Warning Greater than 50% Send OracleManager Sentrynotice
Normal N/A None
214 Version 2.0

Severity Trigger When Default Actions
Always N/A None
Monitors that are defined with this monitoring source use operatorsto evaluate data. For information about these operators, seeAppendix C, “Operator Groups (Monitor Triggers)” .
Suggested monitoring schedule: Every 10 minutes.
OutputThe following shows an example output from this monitor.
Information for the busiest network protocol appears asTRIGGER_INFO. Additional information for all protocols is givenin the userinfo lines in the following format:
%Busy, Network protocol
For a description of the monitor output, see “Understanding MonitorOutput” on page 6.
215Tivoli Manager for Oracle** Reference Guide
3.In
stance
Mo
nito
rs

Views AccessedV$DISPATCHER
Usage NotesIf the dispatcher processes for a specific protocol are busy for morethan 50% of the time, you can improve performance by adding moredispatcher processes. Do this by increasing the value of the init.oraparameter MTS_MAX_DISPATCHERS.
This monitor is only relevant if the instance has been configured forthe multi-threaded server.
See AlsoThe following monitor in this chapter: Dispatcher Wait Times.
216 Version 2.0

Dispatcher Wait Times
DescriptionThis monitor reports the time (in hundredths of a second) that aresponse waits in the response queue for a dispatcher process toroute it, for the protocol with the longest average wait time.
Note: This monitor is only relevant if the instance is configured forthe multi-threaded server.
Authorization Roleoracle_monitor and user
Target EndpointOracleInstanceManager
GUI Data Entry FieldsNone
CLI Syntaxdispatchwaits
CLI Examplewaddmon ’OracleInstanceManager’ ’dispatchwaits’-t ’10 minutes’-c ’critical’ -R ’>’ ’25’ -n ’OracleManager Sentry’-c ’severe’ -R ’>’ ’18’ -n ’OracleManager Sentry’-c ’warning’ -R ’>’ ’10’ -n ’OracleManager Sentry’-c ’normal’-c ’always’"ProfileName"
Suggested Response LevelsThe following table lists the default actions for this monitoringsource.
Severity Trigger When Default Actions
Critical Greater than 25 Send OracleManager Sentrynotice
Severe Greater than 18 Send OracleManager Sentrynotice
217Tivoli Manager for Oracle** Reference Guide
3.In
stance
Mo
nito
rs

Severity Trigger When Default Actions
Warning Greater than 10 Send OracleManager Sentrynotice
Normal N/A None
Always N/A None
Monitors that are defined with this monitoring source use operatorsto evaluate data. For information about these operators, seeAppendix C, “Operator Groups (Monitor Triggers)” .
Suggested monitoring schedule: Every 10 minutes.
OutputThe following shows an example output from this monitor.
The network protocol with the longest average wait time appears asthe TRIGGER_INFO. Information for each network protocolreturned appears in the userinfo lines. Results are reported indescending order, based on the length of wait time, in the followingformat:
218 Version 2.0
Average wait time, Network protocol
For a description of the monitor output, see “Understanding MonitorOutput” on page 6.
Views AccessedV$QUEUE
V$DISPATCHER
Usage NotesIf the longest average wait time is greater than 0.1 seconds, you canimprove performance by adding more dispatcher processes. Do thisby increasing the value of the init.ora parameterMTS_MAX_DISPATCHERS.
See AlsoThe following monitor in this chapter: Dispatcher Busy Rate.
219Tivoli Manager for Oracle** Reference Guide
3.In
stance
Mo
nito
rs

DML Locks Ratio
DescriptionMonitors the current number of Data Manipulation Language (DML)locks as a percentage of the maximum number of locks defined forthe instance.
Authorization Roleoracle_monitor and user
Target EndpointOracleInstanceManager
GUI Data Entry FieldsNone
CLI Syntaxdmllocks
CLI Examplewaddmon ’OracleInstanceManager’ ’dmllocks’-t ’10 minutes’-c ’critical’ -R ’>’ ’95’ -n ’OracleManager Sentry’-c ’severe’ -R ’>’ ’90’ -n ’OracleManager Sentry’-c ’warning’ -R ’>’ ’80’ -n ’OracleManager Sentry’-c ’normal’-c ’always’"ProfileName"
Suggested Response LevelsThe following table lists the default actions for this monitoringsource.
Severity Trigger When Default Actions
Critical Greater than 95% Send OracleManager Sentrynotice
Severe Greater than 90% Send OracleManager Sentrynotice
Warning Greater than 80% Send OracleManager Sentrynotice
220 Version 2.0

Severity Trigger When Default Actions
Normal N/A None
Always N/A None
Monitors that are defined with this monitoring source use operatorsto evaluate data. For information about these operators, seeAppendix C, “Operator Groups (Monitor Triggers)” .
Suggested monitoring schedule: Every 10 minutes.
OutputThe following shows an example output from this monitor.
Results in the userinfo lines appear in the following format:
a = current number of DML locks
b = maximum number of DML locks defined for the instance
For a description of the monitor output, see “Understanding MonitorOutput” on page 6.
221Tivoli Manager for Oracle** Reference Guide
3.In
stance
Mo
nito
rs
Views AccessedV$PARAMETER
V$LOCK
Usage NotesThe instance limit is set through the DML_LOCKS parameter in theinit.ora file and represents the maximum number of locks that canbe placed on all tables by all users at any one time. The default isfour times the maximum number of transactions. When the limit isreached, processing stops and an Oracle error is produced.
Within the bounds of the maximum limit, the setting of theDML_LOCKS parameter has little or no effect on the performanceof the server. Therefore, it should be set artificially high to preventhitting the maximum limit, which is operating-system specific.
See AlsoThe following monitors in this chapter: Any v$sysstat, ActiveTransactions, and Enqueue Timeouts.
222 Version 2.0
Enqueue Timeouts
DescriptionThis monitor displays the number of times an enqueue lock wasrequested and was not granted immediately.
Authorization Roleoracle_monitor and user
Target EndpointOracleInstanceManager
GUI Data Entry FieldsNone
CLI Syntaxenqueuetimeouts
CLI Examplewaddmon ’OracleInstanceManager’ ’enqueuetimeouts’-t ’1 hours’-c ’critical’ -R ’->>’ ’2’ -n ’OracleManager Sentry’-c ’severe’ -R ’- >=’ ’2’ -n ’OracleManager Sentry’-c ’warning’ -R ’- >=’ ’1’ -n ’OracleManager Sentry’-c ’normal’-c ’always’"ProfileName"
Suggested Response LevelsThe following table lists the default actions for this monitoringsource.
Severity Trigger When Default Actions
Critical Increase beyond 2 Send OracleManager Sentrynotice
Severe Increase of 2 Send OracleManager Sentrynotice
Warning Increase of 1 Send OracleManager Sentrynotice
Normal N/A None
223Tivoli Manager for Oracle** Reference Guide
3.In
stance
Mo
nito
rs

Severity Trigger When Default Actions
Always N/A None
Monitors that are defined with this monitoring source use operatorsto evaluate data. For information about these operators, seeAppendix C, “Operator Groups (Monitor Triggers)” .
Suggested monitoring schedule: Every 10 minutes.
OutputThe following shows an example output from this monitor.
For a description of the monitor output, see “Understanding MonitorOutput” on page 6.
Views AccessedV$SYSSTAT
Usage NotesThe default value of the init.ora parameterENQUEUE_RESOURCES is derived from the init.ora parameterPROCESSES. For three or fewer processes, the default value is 20.For four to 10 processes, the default value is ((PROCESSES - 3) *5) + 20, and for more than 10 processes, the default value is((PROCESSES - 10) * 2) + 55. If applications are using a largenumber of tables, increase this value.
224 Version 2.0

See AlsoThe following monitor in this chapter: Any v$sysstat.
225Tivoli Manager for Oracle** Reference Guide
3.In
stance
Mo
nito
rs

Freelist Waits Ratio
DescriptionMonitors the ratio, as a percentage, of freelist waits to the totalnumber of requests for data.
Authorization Roleoracle_monitor and user
Target EndpointOracleInstanceManager
GUI Data Entry FieldsNone
CLI Syntaxfreelistwaits
CLI Examplewaddmon ’OracleInstanceManager’ ’freelistwaits’-t ’10 minutes’-c ’critical’ -R ’>’ ’2’ -n ’OracleManager Sentry’-c ’severe’ -R ’>’ ’1’ -n ’OracleManager Sentry’-c ’warning’ -R ’>’ ’0.5’ -n ’OracleManager Sentry’-c ’normal’-c ’always’"ProfileName"
Suggested Response LevelsThere are no default actions for this monitor.
Monitors that are defined with this monitoring source use operatorsto evaluate data. For information about these operators, seeAppendix C, “Operator Groups (Monitor Triggers)” .
Suggested monitoring schedule: Every 10 minutes.
226 Version 2.0

OutputThe following shows an example output from this monitor.
Information is reported in the TRIGGER_INFO field in thefollowing format:
a = the number of free list waits
b = the total number of requests for data
For a description of the monitor output, see “Understanding MonitorOutput” on page 6.
Views AccessedV$WAITSTAT
V$SYSSTAT
Usage NotesThis monitor calculates the freelist waits ratio as:
(number of free list waits / total number of requests for data) * 100
If the ratio is greater than 1%, increase the number of freelists forthe relevant tables.
227Tivoli Manager for Oracle** Reference Guide
3.In
stance
Mo
nito
rs

An Oracle table is created with a default of one freelist. This mightnot be enough for insert- and update-intensive tables. When two ormore processes are searching the freelist at the same time, a processmight need to request additional information from disk, which canresult in a resource wait. To avoid this problem, export the data fromthe insert- and update-intensive tables, drop the tables, recreate themwith a bigger FREELIST parameter, and import the data.
See AlsoThe following monitor in this chapter: DML Locks Ratio.
228 Version 2.0

Library Cache Hit Ratio
DescriptionMonitors the percentage of entries in the library cache that wereparsed more than once (reloads) over the lifetime of the instance.
Authorization Roleoracle_monitor and user
Target EndpointOracleInstanceManager
GUI Data Entry FieldsNone
CLI Syntaxlibcachehitratio
CLI Examplewaddmon ’OracleInstanceManager’ ’libcachehitratio’-t ’10 minutes’-c ’critical’ -R ’<’ ’90’ -n ’OracleManager Sentry’-c ’severe’ -R ’<’ ’92’ -n ’OracleManager Sentry’-c ’warning’ -R ’<’ ’95’ -n ’OracleManager Sentry’-c ’normal’-c ’always’"ProfileName"
Suggested Response LevelsThe following table lists the default actions for this monitoringsource.
Severity Trigger When Default Actions
Critical Less than 90% Send OracleManager Sentrynotice
Severe Less than 92% Send OracleManager Sentrynotice
Warning Less than 95% Send OracleManager Sentrynotice
Normal N/A None
229Tivoli Manager for Oracle** Reference Guide
3.In
stance
Mo
nito
rs
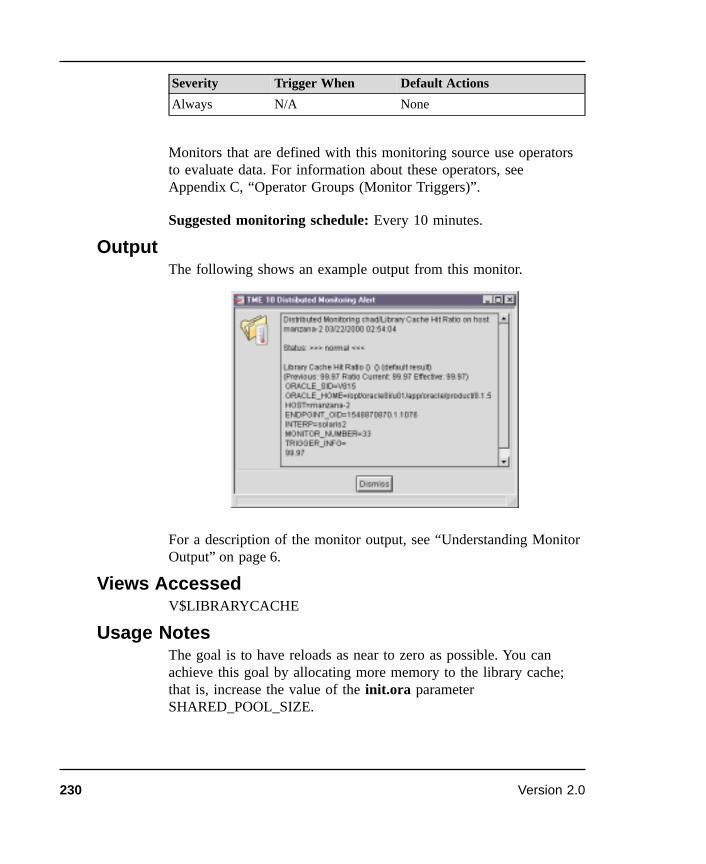
Severity Trigger When Default Actions
Always N/A None
Monitors that are defined with this monitoring source use operatorsto evaluate data. For information about these operators, seeAppendix C, “Operator Groups (Monitor Triggers)” .
Suggested monitoring schedule: Every 10 minutes.
OutputThe following shows an example output from this monitor.
For a description of the monitor output, see “Understanding MonitorOutput” on page 6.
Views AccessedV$LIBRARYCACHE
Usage NotesThe goal is to have reloads as near to zero as possible. You canachieve this goal by allocating more memory to the library cache;that is, increase the value of the init.ora parameterSHARED_POOL_SIZE.
230 Version 2.0

The hit ratio is calculated as:
[sum(pins) / (sum(pins) + sum(reloads))] * 100
A pin is the number of times an item in the cache was executed.
In general, if the hit ratio is below 90%, increase the value ofSHARED_POOL_SIZE.
Do not run the monitor until the instance has run long enough tohave a representative workload. When an instance is started, theOracle caches are empty and the cache hit rate is low, so running themonitor at this time returns misleading results.
See AlsoThe following monitors in this chapter: Buffer Cache Hit Ratio,Buffer Cache Hit Ratio (Interval), Dictionary Cache Hit Ratio,Dictionary Cache Hit Ratio (Interval), and Library Cache HitRatio (Interval).
231Tivoli Manager for Oracle** Reference Guide
3.In
stance
Mo
nito
rs

Library Cache Hit Ratio (Interval)
DescriptionMonitors the percentage of entries in the library cache that wereparsed more than once (reloads) for the current monitoring interval.
Authorization Roleoracle_monitor and user
Target EndpointOracleInstanceManager
GUI Data Entry FieldsNone
CLI Syntaxlibcachehitratioi
CLI Examplewaddmon ’OracleInstanceManager’ ’libcachehitratioi’-t ’10 minutes’-c ’critical’ -R ’<’ ’90’ -n ’OracleManager Sentry’-c ’severe’ -R ’<’ ’92’ -n ’OracleManager Sentry’-c ’warning’ -R ’<’ ’95’ -n ’OracleManager Sentry’-c ’normal’-c ’always’"ProfileName"
Suggested Response LevelsThe following table lists the default actions for this monitoringsource.
Severity Trigger When Default Actions
Critical Less than 90% Send OracleManager Sentrynotice
Severe Less than 92% Send OracleManager Sentrynotice
Warning Less than 95% Send OracleManager Sentrynotice
Normal N/A None
232 Version 2.0

Severity Trigger When Default Actions
Always N/A None
Monitors that are defined with this monitoring source use operatorsto evaluate data. For information about these operators, seeAppendix C, “Operator Groups (Monitor Triggers)” .
Suggested monitoring schedule: Every 10 minutes.
OutputThe following shows an example output from this monitor.
For a description of the monitor output, see “Understanding MonitorOutput” on page 6.
Views AccessedV$LIBRARYCACHE
Usage NotesThe goal is to have reloads as near to zero as possible. You canachieve this goal by allocating more memory to the library cache;that is, increase the value of the init.ora parameterSHARED_POOL_SIZE.
The hit ratio is calculated as:
[sum(pins) / (sum(pins) + sum(reloads))] * 100
233Tivoli Manager for Oracle** Reference Guide
3.In
stance
Mo
nito
rs
A pin is the number of times an item in the cache was executed.
In general, if the hit ratio is below 90%, increase the value ofSHARED_POOL_SIZE.
Do not run the monitor until the instance has run long enough tohave a representative workload. When an instance is started, theOracle caches are empty and the cache hit rate is low, so running themonitor at this time returns misleading results.
See AlsoThe following monitors in this chapter: Buffer Cache HitRatio,Buffer Cache Hit Ratio (Interval), Dictionary Cache HitRatio, Dictionary Cache Hit Ratio (Interval) and Library CacheHit Ratio.
234 Version 2.0

Lock Hit Ratio — Parallel Description
DescriptionMonitors the proportion of data block accesses that do not requirelock conversions. Lock hit ratio indicates how efficiently userprocesses are distributed across multiple instances.
Authorization Roleoracle_monitor and user
Target EndpointOracleInstanceManager
GUI Data Entry FieldsNone
CLI Syntaxlockhitratiopar
CLI Examplewaddmon ’OracleInstanceManager’ ’lockhitratiopar’-t ’1 minutes’-c ’critical’ -R ’<’.8 -n ’OracleManager Sentry’"ProfileName"
Suggested Response LevelsThere are no default actions for this monitor.
Monitors that are defined with this monitoring source use operatorsto evaluate data. For information about these operators, seeAppendix C, “Operator Groups (Monitor Triggers)” .
OutputNo output available for this monitor.
For a description of the monitor output, see “Understanding MonitorOutput” on page 6.
Views AccessedV$SYSSTAT
235Tivoli Manager for Oracle** Reference Guide
3.In
stance
Mo
nito
rs

Usage NotesAn efficient parallel node configuration returns a lock hit ratio, ortrigger value, near one. The lock hit ratio is calculated as:
(consistent_gets - async_global_lock_converts) / consistent_gets
See AlsoThe following monitors in this chapter: PCM Conversion Waits andPCM Lock Conversion Time.
236 Version 2.0

Long Table Full Table Scans (Interval)
DescriptionMonitors the percentage of full table scans that come from longtables for the current monitoring interval.
Authorization Roleoracle_monitor and user
Target EndpointOracleInstanceManager
GUI Data Entry FieldsNone
CLI Syntaxlongtabscansi
CLI Examplewaddmon ’OracleInstanceManager’ ’longtabscansi’-t ’1 hours’-c ’critical’ -R ’%>=’ 20’ -n ’OracleManager Sentry’-c ’severe’ -R ’%>=’ ’15’ -n ’OracleManager Sentry’-c ’warning’ -R ’%>=’ ’10’ -n ’OracleManager Sentry’-c ’normal’-c ’always’"ProfileName"
Suggested Response LevelsThere are no default actions for this monitor.
Monitors that are defined with this monitoring source use operatorsto evaluate data. For information about these operators, seeAppendix C, “Operator Groups (Monitor Triggers)” .
237Tivoli Manager for Oracle** Reference Guide
3.In
stance
Mo
nito
rs
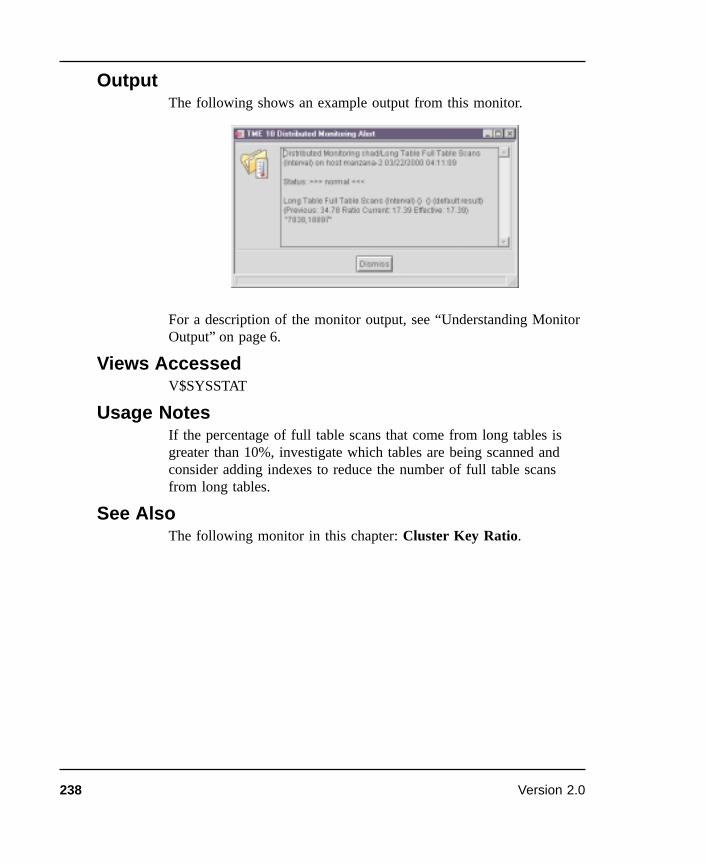
OutputThe following shows an example output from this monitor.
For a description of the monitor output, see “Understanding MonitorOutput” on page 6.
Views AccessedV$SYSSTAT
Usage NotesIf the percentage of full table scans that come from long tables isgreater than 10%, investigate which tables are being scanned andconsider adding indexes to reduce the number of full table scansfrom long tables.
See AlsoThe following monitor in this chapter: Cluster Key Ratio.
238 Version 2.0

Number of Deadlocks
DescriptionMonitors the total number of deadlocks detected since the instancewas started.
Authorization Roleoracle_monitor and user
Target EndpointOracleInstanceManager
GUI Data Entry FieldsNone
CLI Syntaxreadsysstatd
CLI Examplewaddmon ’OracleInstanceManager’ ’readsysstatd’-t ’30 minutes’-c ’critical’ -R ’% >=’ ’5’ -n ’OracleManager Sentry’-c ’severe’ -R ’% >=’ ’2’ -n ’OracleManager Sentry’-c ’warning’ -R ’% >=’ ’1’ -n ’OracleManager Sentry’-c ’normal’-c ’always’"ProfileName"
Suggested Response LevelsThe following table lists the default actions for this monitoringsource.
Severity Trigger When Default Actions
Critical Increase greater than 5 Send OracleManager Sentry notice
Severe Increase greater than 2 Send OracleManager Sentry notice
Warning increase greater than 0 Send OracleManager Sentry notice
Normal N/A None
Always N/A None
239Tivoli Manager for Oracle** Reference Guide
3.In
stance
Mo
nito
rs
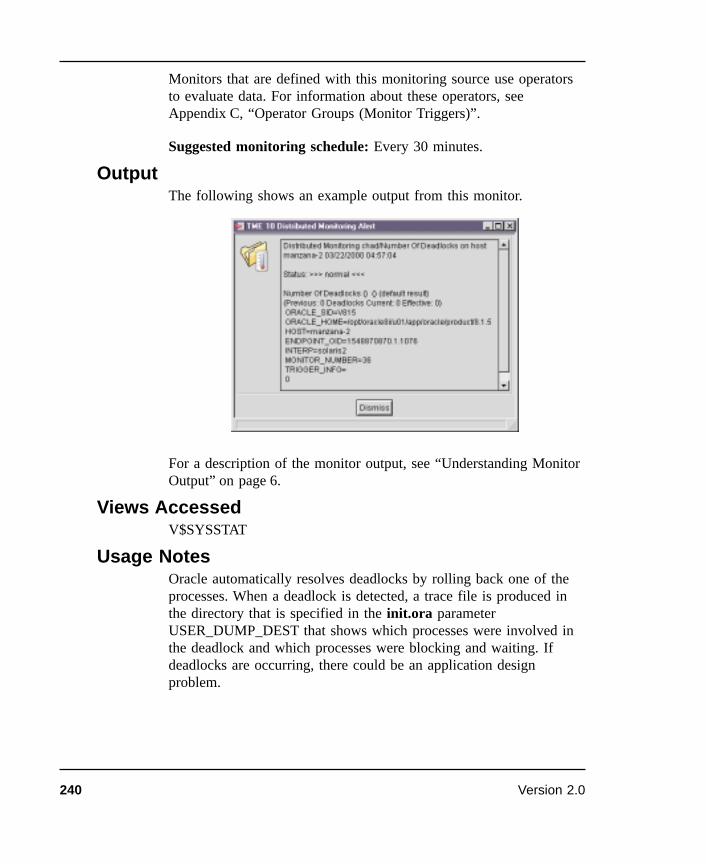
Monitors that are defined with this monitoring source use operatorsto evaluate data. For information about these operators, seeAppendix C, “Operator Groups (Monitor Triggers)” .
Suggested monitoring schedule: Every 30 minutes.
OutputThe following shows an example output from this monitor.
For a description of the monitor output, see “Understanding MonitorOutput” on page 6.
Views AccessedV$SYSSTAT
Usage NotesOracle automatically resolves deadlocks by rolling back one of theprocesses. When a deadlock is detected, a trace file is produced inthe directory that is specified in the init.ora parameterUSER_DUMP_DEST that shows which processes were involved inthe deadlock and which processes were blocking and waiting. Ifdeadlocks are occurring, there could be an application designproblem.
240 Version 2.0

See AlsoThe following monitors in this chapter: Any v$sysstat and BufferWaits Ratio.
241Tivoli Manager for Oracle** Reference Guide
3.In
stance
Mo
nito
rs

Open Cursors
DescriptionThis monitor determines which session has the greatest number ofopen cursors, and reports this as a percentage of the limit defined bythe OPEN_CURSORS parameter in the init.ora file for the instance.
Authorization Roleoracle_monitor and user
Target EndpointOracleInstanceManager
GUI Data Entry FieldsNone
CLI Syntaxopencursors
CLI Examplewaddmon ’OracleInstanceManager’ ’opencursors’-t ’10 minutes’-c ’critical’ -R ’>’ ’95’ -n ’OracleManager Sentry’-c ’severe’ -R ’>’ ’90’ -n ’OracleManager Sentry’-c ’warning’ -R ’>’ ’85’ -n ’OracleManager Sentry’-c ’normal’-c ’always’"ProfileName"
Suggested Response LevelsThe following table lists the default actions for this monitoringsource.
Severity Trigger When Default Actions
Critical Greater than 95% Send OracleManager Sentrynotice
Severe Greater than 90% Send OracleManager Sentrynotice
Warning Greater than 85% Send OracleManager Sentrynotice
242 Version 2.0

Severity Trigger When Default Actions
Normal N/A None
Always N/A None
Monitors that are defined with this monitoring source use operatorsto evaluate data. For information about these operators, seeAppendix C, “Operator Groups (Monitor Triggers)” .
Suggested monitoring schedule: Every 10 minutes.
OutputThe following shows an example output from this monitor.
The TRIGGER_INFO is the username with the most open cursors.
The number of open cursors for each session is reported as text onthe userinfo lines in the following format:
Open Cursors, Username, Session ID
For a description of the monitor output, see “Understanding MonitorOutput” on page 6.
243Tivoli Manager for Oracle** Reference Guide
3.In
stance
Mo
nito
rs

Views AccessedV$PARAMETER
V$OPEN_CURSOR
Usage NotesThe location of private SQL areas is dependent on the use of amulti-threaded or dedicated server. A multi-threaded server uses theshared buffer pool to store private SQL; a dedicated server uses theuser’s Program Global Area (PGA). In both cases, the maximumnumber of private SQL areas that an individual session can processis defined by the OPEN_CURSORS parameter in the init.ora file(default of 50).
Within the bounds of the maximum limit, the setting of thisparameter has little or no effect on the performance of the server;therefore, it should be set artificially high to prevent hitting themaximum limit. The maximum is operating-system dependent.
See AlsoNone
244 Version 2.0

PCM Conversion Waits
DescriptionMonitors the sessions that are waiting for a PCM lock and reportshow long (in seconds) those sessions have been waiting.
Authorization Roleoracle_monitor and user
Target EndpointOracleInstanceManager
GUI Data Entry FieldsNone
CLI Syntaxpcmconversionwaits
CLI Examplewaddmon ’OracleInstanceManager’ ’pcmconversionwaits’-t ’10 minutes’-c ’critical’-c ’severe’-c ’warning’-c ’normal’-c ’always’-f ’manzana:/data/oracle_logging/pcmconversionwaits.log’ "ProfileName"
Suggested Response LevelsThere are no default actions for this monitor.
Monitors that are defined with this monitoring source use operatorsto evaluate data. For information about these operators, seeAppendix C, “Operator Groups (Monitor Triggers)” .
OutputNo output available for this monitor.
Results from this monitor are reported as text on the userinfo linesof the output in the following format:
245Tivoli Manager for Oracle** Reference Guide
3.In
stance
Mo
nito
rs

Wait_time_secs, Session_id, DB_Username, Event, File #, Block #,Lock_element_#, State
For a description of the monitor output, see “Understanding MonitorOutput” on page 6.
Views AccessedV$SESSION_WAIT
V$SESSION
Usage NotesIf the waiting time is longer than usual for your application, youmight need to increase the value of the GC_FILES_TO_LOCKS,GC_RELEASABLE_LOCKS, or GC_ROLLBACK_LOCKSparameter in the init<SID>.ora file. These parameters are static andcannot be changed dynamically; the instance must be shut down andrestarted before the parameter changes take effect. Parameter valuesmust be the same for each instance within the same Oracle ParallelServer environment.
See AlsoThe following monitor in this chapter: PCM Lock ConversionTime.
246 Version 2.0

PCM Lock Conversion Time
DescriptionMonitors the time in seconds it takes for a PCM lock conversion totake place.
Authorization Roleoracle_monitor and user
Target EndpointOracleInstanceManager
GUI Data Entry FieldsNone
CLI Syntaxpcmlockconversiontime
CLI Examplewaddmon ’OracleInstanceManager’ ’pcmlockconversiontime’-t ’10 minutes’-c ’critical’-c ’severe’-c ’warning’-c ’normal’-c ’always’ -f ’manzana:/data/oracle_logging/pcmlockconversiontime.log’"ProfileName"
Suggested Response LevelsThere are no default actions for this monitor.
Monitors that are defined with this monitoring source use operatorsto evaluate data. For information about these operators, seeAppendix C, “Operator Groups (Monitor Triggers)” .
OutputNo output available for this monitor.
The PCM lock conversion time appears in the output asTRIGGER_INFO.
247Tivoli Manager for Oracle** Reference Guide
3.In
stance
Mo
nito
rs

For a description of the monitor output, see “Understanding MonitorOutput” on page 6.
Views AccessedV$SYSTEM_EVENT
Usage NotesIf lock conversions are taking a long time, relative to yourenvironment, you might have resource problems such as network,user process, or memory issues.
See AlsoThe following monitor in this chapter: Any v$lock, Lock Hit Ratio— Parallel Description and PCM Conversion Waits.
248 Version 2.0
Percentage of False Pings
DescriptionFalse Pinging occurs when two or more blocks are accessed by twonodes concurrently, where each node is updating a separate block.For each node to access these blocks, the lock on each block mustbe converted to a shared lock. This lock conversion must occur foreach block being accessed, even though not all the blocks are beingupdated by each node. Run this monitor if you are experiencing aninordinate number of lock conversions.
Authorization Roleoracle_monitor and user
Target EndpointOracleInstanceManager
GUI Data Entry FieldsNone
CLI Syntaxpercentfalsepings
CLI Examplewaddmon ’OracleInstanceManager’ ’percentfalsepings’-t ’5 minutes’-c ’critical’-c ’severe’-c ’warning’-c ’normal’-c ’always’-f "manzana:/data/oracle_logging/percentfalsepings.log’"ProfileName"
Suggested Response LevelsThere are no default actions for this monitor.
Monitors that are defined with this monitoring source use operatorsto evaluate data. For information about these operators, seeAppendix C, “Operator Groups (Monitor Triggers)” .
249Tivoli Manager for Oracle** Reference Guide
3.In
stance
Mo
nito
rs

OutputNo output available for this monitor.
Results for this monitor appear in the userinfo lines of the output inthe following format:
Percentage of False Pings, Ping Rate, False Pings
For a description of the monitor output, see “Understanding MonitorOutput” on page 6.
Views AccessedV$LOCK_ACTIVITY
V$SYSSTAT
Usage NotesNone
See AlsoThe following monitor in this chapter: Any v$lock.
250 Version 2.0

Physical I/O Reads
DescriptionThis monitor reports the number of physical reads for the worst-casedatafile in a database; that is, the datafile with the highest number ofphysical reads.
Use this monitor to determine if any particular datafile is beingaccessed more than other datafiles. This data can be useful indetermining whether a datafile should be moved to another diskbecause one of the disks is an I/O bottleneck, caused by anexcessive number of reads from a datafile. The data can also be usedfor capacity planning by charting the growth in I/O over time.
Authorization Roleoracle_monitor and user
Target EndpointOracleInstanceManager
GUI Data Entry FieldsNone
CLI Syntaxphysicalreads
CLI Examplewaddmon ’OracleInstanceManager’ ’physicalreads’-t ’1 hours’-c ’critical’ -R ’>’ ’1500’ -n ’OracleManager Sentry’-c ’severe’ -R ’>’ ’1200’ -n ’OracleManager Sentry’-c ’warning’ -R ’>’ ’900’ -n ’OracleManager Sentry’-c ’normal’-c ’always’"ProfileName"
Suggested Response LevelsThere are no default actions for this monitor.
251Tivoli Manager for Oracle** Reference Guide
3.In
stance
Mo
nito
rs

Monitors that are defined with this monitoring source use operatorsto evaluate data. For information about these operators, seeAppendix C, “Operator Groups (Monitor Triggers)” .
OutputThe following shows an example output from this monitor.
The datafile with the highest number of physical reads appears asTRIGGER_INFO. Additional datafiles may appear in the userinfolines. The cumulative number of reads for each datafile is reportedin descending order in the following format:
Number of Reads, Filename
For a description of the monitor output, see “Understanding MonitorOutput” on page 6.
Views AccessedV$DATAFILE
V$FILESTAT
252 Version 2.0

Usage NotesNone
See AlsoThe following monitor in this chapter: Physical I/O Writes.
253Tivoli Manager for Oracle** Reference Guide
3.In
stance
Mo
nito
rs

Physical I/O Writes
DescriptionThis monitor reports the number of physical writes for theworst-case datafile in a database; that is, the datafile with the highestnumber of physical writes.
Use this monitor to determine if any particular datafile is beingwritten to more than other datafiles. This data can be useful indetermining whether a datafile should be moved to another diskbecause one of the disks is an I/O bottleneck caused by an excessivenumber of writes to a datafile. The data can also be used forcapacity planning by charting the growth in I/O over time.
Authorization Roleoracle_monitor and user
Target EndpointOracleInstanceManager
GUI Data Entry FieldsNone
CLI Syntaxphysicalwrites
CLI Examplewaddmon ’OracleInstanceManager’ ’physicalwrites’-t ’1 hours’-c ’critical’ -R ’>’ ’500’ -n ’OracleManager Sentry’-c ’severe’ -R ’>’ ’400’ -n ’OracleManager Sentry’-c ’warning’ -R ’>’ ’300’ -n ’OracleManager Sentry’-c ’normal’-c ’always’"ProfileName"
Suggested Response LevelsThere are no default actions for this monitor.
254 Version 2.0

Monitors that are defined with this monitoring source use operatorsto evaluate data. For information about these operators, seeAppendix C, “Operator Groups (Monitor Triggers)” .
OutputThe following shows an example output from this monitor.
The datafile with the highest number of physical writes appears asTRIGGER_INFO. Additional datafiles may appear in the userinfolines. The cumulative number of writes for each datafile is reportedin descending order in the following format:
Number of Writes, Filename
For a description of the monitor output, see “Understanding MonitorOutput” on page 6.
Views AccessedV$DATAFILE
V$FILESTAT
Usage NotesNone
255Tivoli Manager for Oracle** Reference Guide
3.In
stance
Mo
nito
rs

See AlsoThe following monitor in this chapter: Physical I/O Reads.
256 Version 2.0

Ping Rate
DescriptionMonitors the rate of pinging across instances. Use this monitor todetermine how efficiently the user, application, and batch processeshave been distributed across instances in the parallel environmentyou are monitoring.
Authorization Roleoracle_monitor and user
Target EndpointOracleInstanceManager
GUI Data Entry FieldsNone
CLI Syntaxpingrate
CLI Examplewaddmon ’OracleInstanceManager’’pingrate’-t ’1 minutes’-c ’critical’-c ’severe’-c ’warning’-c ’normal’-c ’always’-p ’ProfileName’
Suggested Response LevelsThere are no default actions for this monitor.
Monitors that are defined with this monitoring source use operatorsto evaluate data. For information about these operators, seeAppendix C, “Operator Groups (Monitor Triggers)” .
OutputNo output available for this monitor.
257Tivoli Manager for Oracle** Reference Guide
3.In
stance
Mo
nito
rs

For a description of the monitor output, see “Understanding MonitorOutput” on page 6.
Views AccessedV$SYSSTAT
V$LOCK_ACTIVITY
Usage NotesA high ping rate can indicate the need to redistribute the user-accessconfiguration so that users who access the same information can doso through the same instances.
See AlsoThe following monitor in this chapter: Any v$lock and Percentageof False Pings.
258 Version 2.0

Process Ratio
DescriptionMonitors the current number of Oracle processes as a percentage ofthe instance maximum.
Authorization Roleoracle_monitor and user
Target EndpointOracleInstanceManager
GUI Data Entry FieldsNone
CLI Syntaxprocessratio
CLI Examplewaddmon ’OracleInstanceManager’ ’processratio’-t ’1 hours’-c ’critical’ -R ’>’ ’95’ -n ’OracleManager Sentry’-c ’severe’ -R ’>’ ’90’ -n ’OracleManager Sentry’-c ’warning’ -R ’>’ ’85’ -n ’OracleManager Sentry’-c ’normal’-c ’always’"ProfileName"
Suggested Response LevelsThe following table lists the default actions for this monitoringsource.
Severity Trigger When Default Actions
Critical Greater than 95% Send OracleManager Sentrynotice
Severe Greater than 90% Send OracleManager Sentrynotice
Warning Greater than 85% Send OracleManager Sentrynotice
Normal N/A None
259Tivoli Manager for Oracle** Reference Guide
3.In
stance
Mo
nito
rs

Severity Trigger When Default Actions
Always N/A None
Monitors that are defined with this monitoring source use operatorsto evaluate data. For information about these operators, seeAppendix C, “Operator Groups (Monitor Triggers)” .
Suggested monitoring schedule: Every 10 minutes.
OutputThe following shows an example output from this monitor.
For a description of the monitor output, see “Understanding MonitorOutput” on page 6.
Views AccessedV$PARAMETER
V$PROCESS
260 Version 2.0

Usage NotesThis monitor reports the current total number of Oracle processesrunning on the instance, as a percentage of the maximum. Themaximum is set by the PROCESSES parameter in the init.ora filefor the instance (default of 50).
When setting this parameter, consider the following:
¶ One process for each connected user
¶ One process for each background process
Each instance has at least four background processes (SMON,DBWR, LGWR, and PMON), but there can be a number ofadditional background processes, including the following:
¶ ARCH — If the database is running in ARCHIVELOG mode
¶ RECO — If the distributed option has been installed
¶ CKPT — If the checkpoint process is running
¶ DBnn — One process for each additional database writer
¶ Dnn — One process for each dispatcher
¶ Snn — One process for each shared server
¶ LCKn — One process for each parallel server lock process
Note: If you increase the value of the PROCESSES parameter, youshould also increase the value of SESSIONS if it is explicitlyset in init.ora. Otherwise, SESSIONS defaults toPROCESSES * 1.1, which is acceptable.
See AlsoNone
261Tivoli Manager for Oracle** Reference Guide
3.In
stance
Mo
nito
rs

RDBMS State
DescriptionMonitors the availability of an Oracle instance. This monitor returnsone of the following states: Is Up, Is Shutdown, Is Failed, IsUnavailable, Becomes Up, Becomes Shutdown, Becomes Failed,Becomes Unavailable.
Note: For more information on the availability states for thismonitor, see Appendix C, “Operator Groups (MonitorTriggers)” .
Authorization Roleuser, admin, and oracle_monitor
Target EndpointOracleInstanceManager
GUI Data Entry FieldsNone
CLI Syntaxrdbmsstate
CLI Examplewaddmon ’OracleInstanceManager’ ’rdbmsstate’-t ’5 minutes’-c ’critical’ -R ’!=’ ’up’ -n ’OracleManager Sentry’-c ’severe’-c ’warning’-c ’normal’-c ’always’"ProfileName"
Suggested Response LevelsThe following table lists the default actions for this monitoringsource.
Severity Trigger When Default Actions
Critical Is unavailable Send OracleManager Sentrynotice
262 Version 2.0

Severity Trigger When Default Actions
Severe N/A None
Warning N/A None
Normal N/A None
Always N/A None
Monitors that are defined with this monitoring source use operatorsto evaluate data. For information about these operators, seeAppendix C, “Operator Groups (Monitor Triggers)” .
Suggested monitoring schedule: Every 5 minutes.
OutputThe following shows an example output from this monitor.
The availability state of the instance is reported as TRIGGER_INFO.
For a description of the monitor output, see “Understanding MonitorOutput” on page 6.
Views AccessedNone
Usage NotesThis monitor checks the availability of the instance. You can set thetrigger on the following values:
263Tivoli Manager for Oracle** Reference Guide
3.In
stance
Mo
nito
rs
¶ Is Up
¶ Is Shutdown
¶ Is Failed
¶ Is Unavailable
¶ Becomes Up
¶ Becomes Shutdown
¶ Becomes Failed
¶ Becomes Unavailable
If you set the trigger value to Becomes ..., the monitor only reports acritical event the first time it is unable to connect to the instance.This prevents the same message from repeatedly being displayed onan administrator’s desktop. If you set the trigger value to ... Failed,the monitor only reports a critical event if the instance crashes,rather than being shut down by an administrator.
Running this monitor changes the icon of the database instance toreflect the state returned by the monitor. When a database is running,no status is displayed. When the database is shut down by a DBA,the status SHUTDOWN appears across the icon. When the databasecrashes, the status FAILED appears across the icon. It might beappropriate to set the critical level to Becomes Failed and thewarning level to Becomes Shutdown. This combination of eventsgives a critical error when a database crashes and a warning when aninstance is shut down by a DBA.
See AlsoThe following monitor from the OracleDatabaseManagerMonitoring Collection: Alerts.
264 Version 2.0

Recursive Call Rate
DescriptionReports the number of recursive calls per second. A recursive calloccurs when one SQL statement requires the execution of a furtherseparate SQL statement. A continued increase in the reported figureindicates poor or decreasing system performance. Some recursiveactivity is unavoidable.
Authorization Roleoracle_monitor and user
Target EndpointOracleInstanceManager
GUI Data Entry FieldsNone
CLI Syntaxrecursivecallrate
CLI Examplewaddmon ’OracleInstanceManager’ ’recursivecallrate’-t ’1 hours’-c ’critical’ -R >=’ ’10’ -n ’OracleManager Sentry’-c ’severe’ -R ’>=’ ’7’ -n ’OracleManager Sentry’-c ’warning’ -R ’>=’ ’5’ -n ’OracleManager Sentry’-c ’normal’-c ’always’"ProfileName"
Suggested Response LevelsThere are no default actions for this monitor.
Monitors that are defined with this monitoring source use operatorsto evaluate data. For information about these operators, seeAppendix C, “Operator Groups (Monitor Triggers)” .
265Tivoli Manager for Oracle** Reference Guide
3.In
stance
Mo
nito
rs

OutputThe following shows an example output from this monitor.
The cumulative number of calls during the lifetime of the instance isreported as userinfo.
For a description of the monitor output, see “Understanding MonitorOutput” on page 6.
Views AccessedV$SYSSTAT
Usage NotesRecursive calls can be generated by the following activities:
¶ An object requiring an additional extent for storage (dynamicextension)
¶ Misses on the dictionary cache
¶ Firing of database triggers
¶ DDL statements
¶ Execution of SQL statements within stored procedures, packages,functions, and anonymous PL/SQL blocks
¶ Enforcement of referential integrity constraints
266 Version 2.0

If Oracle is making an inordinate number of recursive calls, try todetermine which of the previously listed activities is causing most ofthe recursive calls. Run the application through TKPROF withEXPLAIN PLAN to see what the application is doing. Also, monitorthe number of extents in the database to see if there is noticeabledynamic extension. If the recursive calls are caused by dynamicextension, you can reduce the number of calls by allocating largerextents to the relevant objects. A dictionary cache that is too smallcan also cause recursive calls.
See AlsoThe following monitor in this chapter: Recursive Calls.
267Tivoli Manager for Oracle** Reference Guide
3.In
stance
Mo
nito
rs

Recursive Calls
DescriptionReports the number of recursive calls for the instance. A recursivecall occurs when one SQL statement requires the execution of afurther separate SQL statement. Some recursive activity isunavoidable.
Authorization Roleoracle_monitor and user
Target EndpointOracleInstanceManager
GUI Data Entry FieldsNone
CLI Syntaxreadsysstatr
CLI Examplewaddmon ’OracleInstanceManager’ ’readsysstatr’-t ’1 hours’-c ’critical’ -R ’>=’ ’20000’ -n ’OracleManager Sentry’-c ’severe’ -R ’>=’ ’15000’ -n ’OracleManager Sentry’-c ’warning’ -R ’>=’ ’12000’ -n ’OracleManager Sentry’-c ’normal’-c ’always’"ProfileName"
Suggested Response LevelsThere are no default actions for this monitor.
Monitors that are defined with this monitoring source use operatorsto evaluate data. For information about these operators, seeAppendix C, “Operator Groups (Monitor Triggers)” .
268 Version 2.0
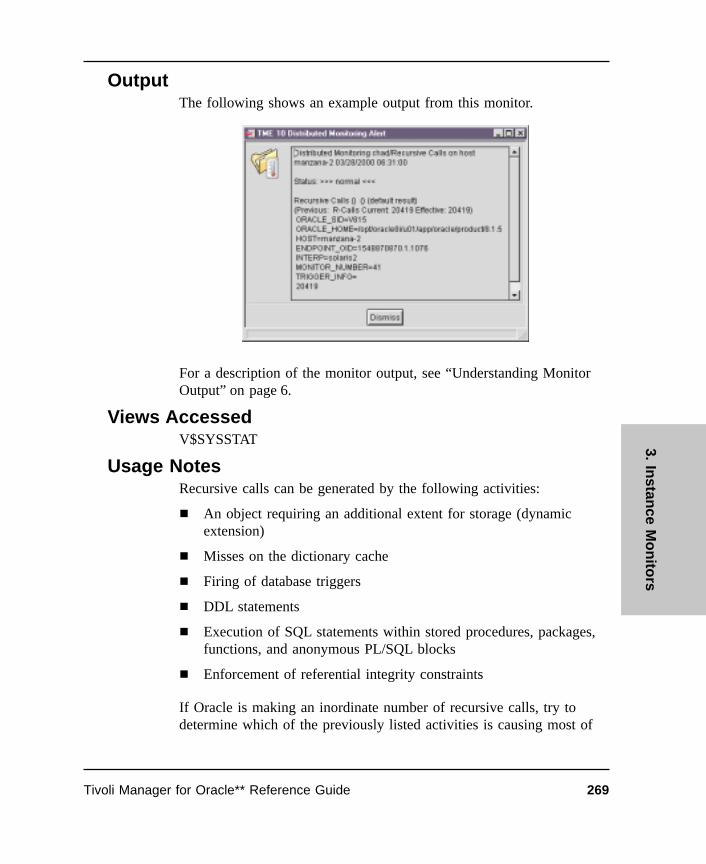
OutputThe following shows an example output from this monitor.
For a description of the monitor output, see “Understanding MonitorOutput” on page 6.
Views AccessedV$SYSSTAT
Usage NotesRecursive calls can be generated by the following activities:
¶ An object requiring an additional extent for storage (dynamicextension)
¶ Misses on the dictionary cache
¶ Firing of database triggers
¶ DDL statements
¶ Execution of SQL statements within stored procedures, packages,functions, and anonymous PL/SQL blocks
¶ Enforcement of referential integrity constraints
If Oracle is making an inordinate number of recursive calls, try todetermine which of the previously listed activities is causing most of
269Tivoli Manager for Oracle** Reference Guide
3.In
stance
Mo
nito
rs

the recursive calls. Run the application through TKPROF withEXPLAIN PLAN to see what the application is doing. Also, monitorthe number of extents in the database to see if there is noticeabledynamic extension. If the recursive calls are caused by dynamicextension, you can reduce the number of calls by allocating largerextents to the relevant objects. A dictionary cache that is too smallcan also cause recursive calls.
See AlsoThe following monitor in this chapter: Recursive Call Rate.
270 Version 2.0
Recursive To User Calls Ratio
DescriptionMonitors the number of recursive calls as a ratio of the number ofuser calls.
Authorization Roleoracle_monitor and user
Target EndpointOracleInstanceManager
GUI Data Entry FieldsNone
CLI Syntaxrecursivetousercalls
CLI Examplewaddmon ’OracleInstanceManager’ ’recursivetousercalls’-t ’10 minutes’-c ’critical’ -R ’% >=’ ’12’ -n ’OracleManager Sentry’-c ’severe’ -R ’% >=’ ’10’ -n ’OracleManager Sentry’-c ’warning’ -R ’% >=’ ’8’ -n ’OracleManager Sentry’-c ’normal’-c ’always’"ProfileName"
Suggested Response LevelsThe following table lists the default actions for this monitoringsource.
Severity Trigger When Default Actions
Critical % Increase of 12 Send OracleManager Sentrynotice
Severe % Increase of 10 Send Oracle Sentry notice
Warning % Increase of 8 Send Oracle Sentry notice
Normal N/A None
Always N/A None
271Tivoli Manager for Oracle** Reference Guide
3.In
stance
Mo
nito
rs

Monitors that are defined with this monitoring source use operatorsto evaluate data. For information about these operators, seeAppendix C, “Operator Groups (Monitor Triggers)” .
Suggested monitoring schedule: Every 10 minutes.
OutputThe following shows an example output from this monitor.
For a description of the monitor output, see “Understanding MonitorOutput” on page 6.
Views AccessedV$SYSSTAT
Usage NotesA change in this ratio can reflect an application change or the needto increase the size of the shared buffer pool.
Note: A marked change in the data definition language (DDL)workload on the database will also affect this ratio.
Use the % Increase of operator to monitor changes in this ratio, andin conjunction with other monitors, to tune theSHARED_POOL_SIZE parameter in the init.ora file for theinstance.
272 Version 2.0

See AlsoThe following monitors in this chapter: Call Rate, Calls PerTransaction, Recursive Calls, and Recursive Call Rate.
273Tivoli Manager for Oracle** Reference Guide
3.In
stance
Mo
nito
rs
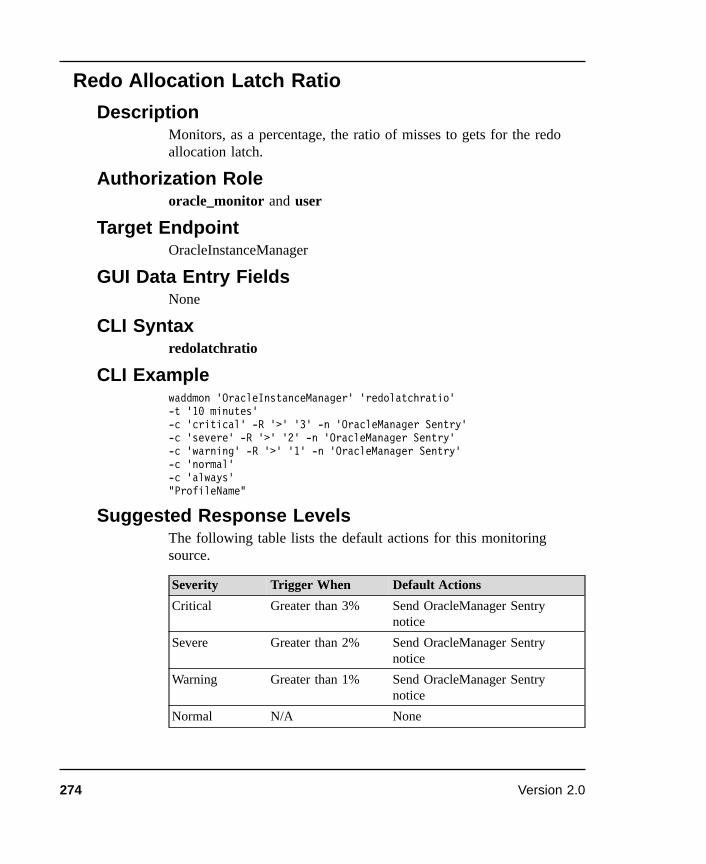
Redo Allocation Latch Ratio
DescriptionMonitors, as a percentage, the ratio of misses to gets for the redoallocation latch.
Authorization Roleoracle_monitor and user
Target EndpointOracleInstanceManager
GUI Data Entry FieldsNone
CLI Syntaxredolatchratio
CLI Examplewaddmon ’OracleInstanceManager’ ’redolatchratio’-t ’10 minutes’-c ’critical’ -R ’>’ ’3’ -n ’OracleManager Sentry’-c ’severe’ -R ’>’ ’2’ -n ’OracleManager Sentry’-c ’warning’ -R ’>’ ’1’ -n ’OracleManager Sentry’-c ’normal’-c ’always’"ProfileName"
Suggested Response LevelsThe following table lists the default actions for this monitoringsource.
Severity Trigger When Default Actions
Critical Greater than 3% Send OracleManager Sentrynotice
Severe Greater than 2% Send OracleManager Sentrynotice
Warning Greater than 1% Send OracleManager Sentrynotice
Normal N/A None
274 Version 2.0
Severity Trigger When Default Actions
Always N/A None
Monitors that are defined with this monitoring source use operatorsto evaluate data. For information about these operators, seeAppendix C, “Operator Groups (Monitor Triggers)” .
Suggested monitoring schedule: Every 10 minutes.
OutputNo output available for this monitor.
For a description of the monitor output, see “Understanding MonitorOutput” on page 6.
Views AccessedV$LATCH
Usage NotesOn single-CPU systems, all writes are small and are made on theredo allocation latch. You can improve performance by decreasingthe value of the init.ora parameterLOG_SMALL_ENTRY_MAX_SIZE.
Before a process changes information in a block, it must create theredo record in the log buffer. The allocation of space in the logbuffer is controlled by the redo allocation latch. The process mustacquire this latch and can copy it while holding it if the size of theredo entry is smaller than LOG_SMALL_ENTRY_MAX_SIZE.Otherwise, the process must acquire a redo copy latch to create theredo record. Decrease the value ofLOG_SMALL_ENTRY_MAX_SIZE to reduce the redo allocationlatch contention. This forces Oracle to use more redo copy latches.
Note: For best results, run this monitor only on multiple-CPUsystems.
275Tivoli Manager for Oracle** Reference Guide
3.In
stance
Mo
nito
rs

See AlsoThe following monitor in this chapter: Redo Copy Latch Ratio andRedo Small Copy Ratio.
276 Version 2.0

Redo Copy Latch Ratio
DescriptionMonitors, as a percentage, the ratio of misses to gets for the redocopy latch.
Authorization Roleoracle_monitor and user
Target EndpointOracleInstanceManager
GUI Data Entry FieldsNone
CLI Syntaxredoclatchratio
CLI Examplewaddmon ’OracleInstanceManager’ ’redoclatchratio’-t ’10 minutes’-c ’critical’ -R ’%>=’ ’3’ -n ’OracleManager Sentry’-c ’severe’ -R ’%>=’ ’2’ -n ’OracleManager Sentry’-c ’warning’ -R ’%>=’ ’1’ -n ’OracleManager Sentry’-c ’normal’-c ’always’"ProfileName"
Suggested Response LevelsThe following table lists the default actions for this monitoringsource.
Severity Trigger When Default Actions
Critical % Increase of 3 Send OracleManager Sentrynotice
Severe % Increase of 2 Send OracleManager Sentrynotice
Warning % Increase of 1 Send OracleManager Sentrynotice
Normal N/A None
277Tivoli Manager for Oracle** Reference Guide
3.In
stance
Mo
nito
rs

Severity Trigger When Default Actions
Always N/A None
Monitors that are defined with this monitoring source use operatorsto evaluate data. For information about these operators, seeAppendix C, “Operator Groups (Monitor Triggers)” .
Suggested monitoring schedule: Every 10 minutes.
OutputNo output available for this monitor.
For a description of the monitor output, see “Understanding MonitorOutput” on page 6.
Views AccessedV$LATCH
Usage NotesIf there are an increasing number of timeouts, increase the value ofthe init.ora parameter LOG_SIMULTANEOUS_COPIES.
On a system with multiple CPUs, it is possible to have more thanone redo copy latch per CPU.
LOG_SIMULTANEOUS_COPIES defaults to the number of CPUs,but must be increased to twice the number of CPUs on the system ifyou are experiencing redo copy latch contention. Do not rely on theinit.ora parameter CPU_COUNT to tell you how many CPUs amachine has. On many Oracle platforms, CPU_COUNT is set tozero and Oracle works out how many CPUs the machine actuallyhas.
Note: Run this monitor only on multiple-CPU systems.
See AlsoThe following monitor in this chapter: Redo Allocation Latch Ratioand Redo Copy Latch Ratio.
278 Version 2.0

Redo Log Space Waits
DescriptionThis monitor measures the number of times that a user process wasunable to allocate space in the redo log buffer.
Authorization Roleoracle_monitor and user
Target EndpointOracleInstanceManager
GUI Data Entry FieldsNone
CLI Syntaxredologwaits
CLI Examplewaddmon ’OracleInstanceManager’ ’redologwaits’-t ’10 minutes’-c ’critical’ -R ’->>’ ’4’ -n ’OracleManager Sentry’-c ’severe’ -R ’->>’ ’2’ -n ’OracleManager Sentry’-c ’warning’ -R ’->>’ ’0’ -n ’OracleManager Sentry’-c ’normal’-c ’always’"ProfileName"
Suggested Response LevelsThe following table lists the default actions for this monitoringsource.
Severity Trigger When Default Actions
Critical Increases beyond 4 Send OracleManager Sentrynotice
Severe Increases beyond 2 Send OracleManager Sentrynotice
Warning Increases beyond 0 Send OracleManager Sentrynotice
Normal N/A None
279Tivoli Manager for Oracle** Reference Guide
3.In
stance
Mo
nito
rs

Severity Trigger When Default Actions
Always N/A None
Monitors that are defined with this monitoring source use operatorsto evaluate data. For information about these operators, seeAppendix C, “Operator Groups (Monitor Triggers)” .
Suggested monitoring schedule: Every 10 minutes.
OutputThe following shows an example output from this monitor.
For a description of the monitor output, see “Understanding MonitorOutput” on page 6.
Views AccessedV$SYSSTAT
Usage NotesIf this value increments constantly, increase the size of the redo logbuffer by increasing the value of the init.ora parameterLOG_BUFFER. Increasing the size of the online redo log files canreduce the number of redo log space waits.
280 Version 2.0

This monitor uses the redo log space requests statistic. The size ofthe LOG_BUFFER parameter must always be a multiple of thedatabase block size. Increasing the size of the online redo log filesmay also decrease the number of redo log space waits.
See AlsoThe following monitor in this chapter: Average Redo Entry Size.
The following monitors in the OracleDatabaseManager MonitoringCollection: Archive Free Space and Archive Space (Number ofRedo Logs).
281Tivoli Manager for Oracle** Reference Guide
3.In
stance
Mo
nito
rs

Redo Logs Not Archived
DescriptionThis monitor reports the number of redo log files that have not beenarchived, which indicates that the archive process is falling behind.This monitor is applicable only when the database is running inARCHIVELOG mode. If the database is in NOARCHIVELOGmode, the monitor returns a value of zero.
Authorization Roleoracle_monitor and user
Target EndpointOracleInstanceManager
GUI Data Entry FieldsNone
CLI Syntaxredosnotarchived
CLI Examplewaddmon ’OracleInstanceManager’ ’redosnotarchived’-t ’10 minutes’-c ’critical’ -R ’>’ ’3’ -n ’OracleManager Sentry’-c ’severe’ -R ’>’ ’2’ -n ’OracleManager Sentry’-c ’warning’ -R ’>’ ’1’ -n ’OracleManager Sentry’-c ’normal’-c ’always’"ProfileName"
Suggested Response LevelsThe following table lists the default actions for this monitoringsource.
Severity Trigger When Default Actions
Critical Greater than 3 Send OracleManager Sentrynotice
Severe Greater than 2 Send OracleManager Sentrynotice
282 Version 2.0

Severity Trigger When Default Actions
Warning Greater than 1 Send OracleManager Sentrynotice
Normal N/A None
Always N/A None
Monitors that are defined with this monitoring source use operatorsto evaluate data. For information about these operators, seeAppendix C, “Operator Groups (Monitor Triggers)” .
Suggested monitoring schedule: Every 10 minutes.
OutputThe following shows an example output from this monitor.
For a description of the monitor output, see “Understanding MonitorOutput” on page 6.
Views AccessedV$PARAMETER
V$LOG
283Tivoli Manager for Oracle** Reference Guide
3.In
stance
Mo
nito
rs

Usage NotesIf this monitor returns a non-zero value, the ARCH process is havingdifficulty keeping up with the LGWR process. It is not possible tohave multiple ARCH processes, so the workaround is to connect tothe instance and issue the following command:
ALTER SYSTEM ARCHIVE LOG ALL
This should help the system catch up to the rate at which redo logsare being created.
See AlsoThe following monitors in this chapter: Active Transactions andBlock Changes Per Transaction.
284 Version 2.0

Redo Small Copy Ratio
DescriptionMonitors, as a percentage, the ratio of the total number of redo smallcopies to the total number of redo entries.
A redo small copy is a redo entry that is smaller than theLOG_SMALL_ENTRY_MAX_SIZE parameter in the init.ora filefor the instance. Small copy redo entries are copied on the redoallocation latch. If the redo entry is larger than this parameter, copiesare made using a redo copy latch on multiple processor systems. Onsingle-CPU systems, all writes are small and are made on the redoallocation latch.
Authorization Roleoracle_monitor and user
Target EndpointOracleInstanceManager
GUI Data Entry FieldsNone
CLI Syntaxredosmallcopyratio
CLI Examplewaddmon ’OracleInstanceManager’ ’redosmallcopyratio’-t ’10 minutes’-c ’critical’ -R ’>’ ’3’ -n ’OracleManager Sentry’-c ’severe’ -R ’>’ ’2’ -n ’OracleManager Sentry’-c ’warning’ -R ’>’ ’1’ -n ’OracleManager Sentry’-c ’normal’-c ’always’"ProfileName"
Suggested Response LevelsThe following table lists the default actions for this monitoringsource.
285Tivoli Manager for Oracle** Reference Guide
3.In
stance
Mo
nito
rs

Severity Trigger When Default Actions
Critical Greater than 3 Send OracleManager Sentry notice
Severe Greater than 2 Send OracleManager Sentry notice
Warning Greater than 1 Send OracleManager Sentry notice
Normal N/A None
Always N/A None
Monitors that are defined with this monitoring source use operatorsto evaluate data. For information about these operators, seeAppendix C, “Operator Groups (Monitor Triggers)” .
Suggested monitoring schedule: Every 10 minutes.
OutputThe following shows an example output from this monitor.
For a description of the monitor output, see “Understanding MonitorOutput” on page 6.
Views AccessedV$SYSSTAT
286 Version 2.0

Usage NotesIf there are a noticeable number of redo small copies and there is aredo allocation latch contention problem (see the Redo AllocationLatch Ratio monitor), decrease the value of theLOG_SMALL_ENTRY_MAX_SIZE parameter in the init.ora filefor the instance.
See AlsoThe following monitor in this chapter: Redo Copy Latch Ratio andRedo Allocation Latch Ratio.
287Tivoli Manager for Oracle** Reference Guide
3.In
stance
Mo
nito
rs

Rollback Waits
DescriptionMonitors, as a percentage, the ratio of rollback segment header waitsto rollback segment header gets.
Authorization Roleoracle_monitor and user
Target EndpointOracleInstanceManager
GUI Data Entry FieldsNone
CLI Syntaxrollbackwaits
CLI Examplewaddmon ’OracleInstanceManager’ ’rollbackwaits’-t ’10 minutes’-c ’critical’ -R ’>’ ’5’ -n ’OracleManager Sentry’-c ’severe’ -R ’>’ ’3’ -n ’OracleManager Sentry’-c ’warning’ -R ’>’ ’2’ -n ’OracleManager Sentry’-c ’normal’-c ’always’"ProfileName"
Suggested Response LevelsThe following table lists the default actions for this monitoringsource.
Severity Trigger When Default Actions
Critical Greater than 5 Send OracleManager Sentry notice
Severe Greater than 3 Send OracleManager Sentry notice
Warning Greater than 2 Send OracleManager Sentry notice
Normal N/A None
Always N/A None
288 Version 2.0

Monitors that are defined with this monitoring source use operatorsto evaluate data. For information about these operators, seeAppendix C, “Operator Groups (Monitor Triggers)” .
Suggested monitoring schedule: Every 10 minutes.
OutputNo output available for this monitor.
For a description of the monitor output, see “Understanding MonitorOutput” on page 6.
Views AccessedV$ROLLSTAT
Usage NotesThe ratio is calculated as:
(Average_waits / Average_gets) * 100
If this monitor reports a regularly increasing rollback wait ratio,create additional rollback segments in the database.
See AlsoNone
289Tivoli Manager for Oracle** Reference Guide
3.In
stance
Mo
nito
rs

Row Source Ratio
DescriptionThis monitor reports the percentage of total rows retrieved that camefrom full-table scans. Ideally, this percentage should be small, but itis dependent on the application design.
Authorization Roleoracle_monitor and user
Target EndpointOracleInstanceManager
GUI Data Entry FieldsNone
CLI Syntaxrowsourceratio
CLI Examplewaddmon ’OracleInstanceManager’ ’rowsourceratio’-t ’1 hours’-c ’critical’ -R ’>’ ’15’ -n ’OracleManager Sentry’-c ’severe’ -R ’>’ ’12’ -n ’OracleManager Sentry’-c ’warning’ -R ’>’ ’10’ -n ’OracleManager Sentry’-c ’normal’-c ’always’"ProfileName"
Suggested Response LevelsThere are no default actions for this monitor.
Monitors that are defined with this monitoring source use operatorsto evaluate data. For information about these operators, seeAppendix C, “Operator Groups (Monitor Triggers)” .
290 Version 2.0

OutputThe following shows an example output from this monitor.
For a description of the monitor output, see “Understanding MonitorOutput” on page 6.
Views AccessedV$SYSSTAT
Usage NotesRow source ratio is calculated as:
100 * S / (S + R)
where:
S = rows obtained by table scans
R = rows obtained by rowid
If more than 10 percent (or whatever figure is deemed to beunacceptable) of the rows are retrieved from full table scans, use theLong Table Full Table Scans (Interval) monitor to determine the
291Tivoli Manager for Oracle** Reference Guide
3.In
stance
Mo
nito
rs

percentage of full-table scans that are from short tables. If a tablehas a small number of rows, a full-table scan may be more efficientthan an index scan.
See AlsoThe following monitor in this chapter: Long Table Full Table Scans(Interval).
292 Version 2.0

Shared Server Process Ratio
DescriptionMonitors the current number of shared-server processes as apercentage of the instance limit.
Authorization Roleoracle_monitor and user
Target EndpointOracleInstanceManager
GUI Data Entry FieldsNone
CLI Syntaxsharedserverratio
CLI Examplewaddmon ’OracleInstanceManager’ ’sharedserverratio’-t ’10 minutes’-c ’critical’ -R ’>’ ’95’ -n ’OracleManager Sentry’-c ’severe’ -R ’>’ ’90’ -n ’OracleManager Sentry’-c ’warning’ -R ’>’ ’85’ -n ’OracleManager Sentry’-c ’normal’-c ’always’"ProfileName"
Suggested Response LevelsThe following table lists the default actions for this monitoringsource.
Severity Trigger When Default Actions
Critical Greater than 95% Send OracleManager Sentry notice
Severe Greater than 90% Send OracleManager Sentry notice
Warning Greater than 85% Send OracleManager Sentry notice
Normal N/A None
Always N/A None
293Tivoli Manager for Oracle** Reference Guide
3.In
stance
Mo
nito
rs

Monitors that are defined with this monitoring source use operatorsto evaluate data. For information about these operators, seeAppendix C, “Operator Groups (Monitor Triggers)” .
Suggested monitoring schedule: Every 10 minutes.
OutputThe following shows an example output from this monitor.
For a description of the monitor output, see “Understanding MonitorOutput” on page 6.
Views AccessedV$PARAMETER
V$SHARED_SERVER
Usage NotesThe instance limit is set through the MTS_MAX_SERVERSparameter in the init.ora file for the instance. This controls themaximum number of shared server processes allowed to runsimultaneously (the default is 20).
If the shared server process ratio is greater than 85%, considerincreasing the MTS_MAX_SERVERS parameter in the init.ora filefor the instance.
294 Version 2.0

Note: This monitor is relevant only if the instance is configured forthe multi-threaded server.
See AlsoNone
295Tivoli Manager for Oracle** Reference Guide
3.In
stance
Mo
nito
rs

Shared Server Wait Time
DescriptionThis monitor reports the average wait time (in hundredths of asecond) that a request waits in the request queue.
Note: This monitor is relevant only if the instance is configured forthe multi-threaded server.
Authorization Roleoracle_monitor and user
Target EndpointOracleInstanceManager
GUI Data Entry FieldsNone
CLI Syntaxsharedserverwait
CLI Examplewaddmon ’OracleInstanceManager’ ’sharedserverwait’-t ’10 minutes’-c ’critical’ -R ’>’ ’25’ -n ’OracleManager Sentry’-c ’severe’ -R ’>’ ’18’ -n ’OracleManager Sentry’-c ’warning’ -R ’>’ ’10’ -n ’OracleManager Sentry’-c ’normal’-c ’always’"ProfileName"
Suggested Response LevelsThe following table lists the default actions for this monitoringsource.
Severity Trigger When Default Actions
Critical Greater than 25 Send OracleManager Sentrynotice
Severe Greater than 18 Send OracleManager Sentrynotice
296 Version 2.0

Severity Trigger When Default Actions
Warning Greater than 10 Send OracleManager Sentrynotice
Normal N/A None
Always N/A None
Monitors that are defined with this monitoring source use operatorsto evaluate data. For information about these operators, seeAppendix C, “Operator Groups (Monitor Triggers)” .
Suggested monitoring schedule: Every 10 minutes.
OutputNo output available for this monitor.
For a description of the monitor output, see “Understanding MonitorOutput” on page 6.
Views AccessedV$QUEUE
Usage NotesIf the average request time is greater than 0.1 seconds, you canimprove performance by adding more shared-server processes. Toadd more shared-server processes, increase the value of the init.oraparameter MTS_MAX_SERVERS.
If the average request time is greater than 0.1 seconds, considerincreasing the MTS_MAX_SERVERS parameter in the init.ora filefor the instance.
See AlsoThe following monitor in this chapter: Dispatcher Busy Rate.
297Tivoli Manager for Oracle** Reference Guide
3.In
stance
Mo
nito
rs

Sort Overflow Ratio
DescriptionThis monitor reports the sort overflow ratio. This ratio yields thenumber of sorts that are using temporary segments.
Authorization Roleoracle_monitor and user
Target EndpointOracleInstanceManager
GUI Data Entry FieldsNone
CLI Syntaxsortoverflowratio
CLI Examplewaddmon ’OracleInstanceManager’ ’sortoverflowratio’-t ’10 minutes’-c ’critical’ -R ’>’ ’.2’ -n ’OracleManager Sentry’-c ’severe’ -R ’>’ ’.1’ -n ’OracleManager Sentry’-c ’warning’ -R ’>’ ’.05’ -n ’OracleManager Sentry’-c ’normal’-c ’always’"ProfileName"
Suggested Response LevelsThe following table lists the default actions for this monitoringsource.
Severity Trigger When Default Actions
Critical Greater than .2 Send OracleManager Sentrynotice
Severe Greater than .1 Send OracleManager Sentrynotice
Warning Greater than .05 Send OracleManager Sentrynotice
Normal N/A None
298 Version 2.0

Severity Trigger When Default Actions
Always N/A None
Monitors that are defined with this monitoring source use operatorsto evaluate data. For information about these operators, seeAppendix C, “Operator Groups (Monitor Triggers)” .
Suggested monitoring schedule: Every 10 minutes.
OutputThe following shows an example output from this monitor.
For a description of the monitor output, see “Understanding MonitorOutput” on page 6.
Views AccessedV$SYSSTAT
Usage NotesFor a system running mainly medium-sized sorts, increasing theSORT_AREA_SIZE can improve performance.
The sort overflow ratio is calculated as:
299Tivoli Manager for Oracle** Reference Guide
3.In
stance
Mo
nito
rs
Sorts(disk) / (Sorts(memory) + Sorts(disk))
Disk sorts require creation of temporary segments on disk to storethe intermediate sort results. This happens if the amount of databeing sorted is greater than the value of the init.ora parameterSORT_AREA_SIZE. Ideally, the ratio of disk sorts to memory sortsshould be less than 5%. To increase the percentage of memory sorts,increase the value of SORT_AREA_SIZE. However, the sort area isallocated on a per-user basis, so increase the value in smallincrements to avoid allocating too much memory to sort areas.
See AlsoThe following monitor in the OracleDatabaseManager MonitoringCollection: Temporary Extents.
300 Version 2.0

User Rollback Ratio
DescriptionMonitors the ratio of user rollbacks to the total number oftransactions.
Authorization Roleoracle_monitor and user
Target EndpointOracleInstanceManager
GUI Data Entry FieldsNone
CLI Syntaxuserrollbackratio
CLI Examplewaddmon ’OracleInstanceManager’ ’userrollbackratio’-t ’1 hours’-c ’critical’ -R ’>’ ’.2’ -n ’OracleManager Sentry’-c ’severe’ -R ’>’ ’.1’ -n ’OracleManager Sentry’-c ’warning’ -R ’>’ ’.05’ -n ’OracleManager Sentry’-c ’normal’-c ’always’"ProfileName"
Suggested Response LevelsThere are no default actions for this monitor.
Monitors that are defined with this monitoring source use operatorsto evaluate data. For information about these operators, seeAppendix C, “Operator Groups (Monitor Triggers)” .
OutputNo output available for this monitor.
For a description of the monitor output, see “Understanding MonitorOutput” on page 6.
301Tivoli Manager for Oracle** Reference Guide
3.In
stance
Mo
nito
rs

Views AccessedV$SYSSTAT
Usage NotesUser rollback ratio is calculated as:
Rollbacks / (Commits + Rollbacks)
This ratio indicates that application transactions are failing, or thatusers are rolling back transactions. When a rollback occurs,considerable system resource is required.
See AlsoThe following monitor in this chapter: Block Changes PerTransaction
302 Version 2.0

Async Monitors
The OracleManagerAsync monitoring collection providesmonitoring sources for managing large databases with thousands ofsegments and objects.
The monitors in this collection cannot complete monitoring withinone minute. For these monitors to return results, you must use anasynchronous monitor and a background monitor for each source.You set the arguments with the background monitor and set thetrigger and response criteria with the asynchronous monitor. Youmust use these monitors in conjunction to receive valid results;however, you can distribute only one instance of each asynchronousmonitor to each database endpoint.
Profiles that contain OracleManagerAsync monitors should bedistributed to Oracle database endpoints.
List of OracleManagerAsync Monitoring SourcesThe following table lists the monitoring sources in this collectionalphabetically by their graphical user interface (GUI) names. It alsoincludes their command line interface (CLI) names, monitornumbers, and whether they support Distributed Monitoring Logging.Monitors that support Distributed Monitoring Logging have a “Yes”in the Log File column. For more information, see “UsingDistributed Monitoring Logging” on page 9.
4
303Tivoli Manager for Oracle** Reference Guide
4.A
sync
Mo
nito
rs

GUI Name CLI Name MonitorNumber
Log File
Extents — Background andAsynchronous
extentsBackgroundextentsAsync
94 n/a Yes
Extents by Tablespace —Background and Asynchronous
extentsbytablespaceBackgroundextentsbytablespaceAsync
100 n/a Yes
Extents by User — Backgroundand Asynchronous
extentsbyuserBackgroundextentsbyuserAsync
101 n/a Yes
Free Space Deficit —Background and Asynchronous
freespacedefBackgroundfreespacedefAsync
93 n/a Yes
Free Space Deficit byTablespace — Background andAsynchronous
freespacedeftBackgroundfreespacedeftAsync
106 n/a Yes
Free Space Deficit by User —Background and Asynchronous
freespacedefuBackgroundfreespacedefuAsync
107 n/a Yes
Index Statistics — Backgroundand Asynchronous
indexstatisticsBackgroundindexstatisticsAsync
151 n/a No
Maximum Extents —Background and Asynchronous
maximumextentsBackgroundmaximumextentsAsync
92 n/a Yes
Maximum Extents byTablespace — Background andAsynchronous
maximumextentstBackgroundmaximumextentstAsync
102 n/a Yes
Maximum Extents by User —Background and Asynchronous
maximumextentsuBackgroundmaximumextentsuAsync
103 n/a Yes
SQL Number — Backgroundand Asynchronous
freeformsqlnBackgroundfreeformsqlnAsync
96 n/a Yes
SQL String — Background andAsynchronous
freeformsqlsBackgroundfreeformsqlsAsync
97 n/a Yes
Temporary Extents —Background and Asynchronous
temporaryextentsBackgroundtemporaryextentsAsync
95 n/a Yes
Temporary Extents byTablespace — Background andAsynchronous
temporaryextentstBackgroundtemporaryextentstAsync
104 n/a Yes
Temporary Extents by User —Background and Asynchronous
temporaryextentsuBackgroundtemporaryextentsuAsync
105 n/a Yes
304 Version 2.0

GUI Name CLI Name MonitorNumber
Log File
Unix SQL*Net V1 TCP/IPListener — Background andAsynchronous
netonetcpipBackgroundnetonetcpipAsync
98 n/a No
Unix SQL*Net V2 Listener —Background and Asynchronous
nettwolistenerBackgroundnettwolistenerAsync
99 n/a No
305Tivoli Manager for Oracle** Reference Guide
4.A
sync
Mo
nito
rs

Extents — Background and Asynchronous
DescriptionMonitors the number of extents allocated to all objects and reportsthe largest number of extents found. The monitor also reports allobjects that have more extents than the number specified as the<numberofextents> argument to the monitor. It does not checkobjects of segment_type CACHE.
Use the Extents — Background monitor to set arguments. Use theExtents — Asynchronous monitor to set the trigger and responsecriteria. You must use these two monitors in conjunction for validreturn values.
Authorization Roleoracle_user and user
Target EndpointOracleDatabaseManager
Views AccessedDBA_SEGMENTS
Usage NotesYou can use this monitor to see which objects in a database have alarge number of extents. This information can be used to chart thegrowth of objects. This information also can be used in conjunctionwith the Maximum Extents — Background and Asynchronousmonitors to predict when an object is going to run out of extents.You might need to allocate additional extents to the object, or exportit and recreate it with a larger extent size.
See AlsoThe following monitors in this chapter:
Extents by Tablespace — Background and Asynchronous,Extents by User — Background and Asynchronous, MaximumExtents — Background and Asynchronous, Maximum Extents byTablespace — Background and Asynchronous, Maximum Extents
306 Version 2.0

by User — Background and Asynchronous.
307Tivoli Manager for Oracle** Reference Guide
4.A
sync
Mo
nito
rs

Extents — Background
CLI SyntaxextentsBackground
–a <numberofextents>
The following briefly describes the argument for this monitor.
<numberofextents>Specifies the threshold number of extents.
GUI Name: Extents Greater Than
CLI Examplewaddmon ’OracleManagerAsync’ ’extentsBackground’-a ’20’-t ’30 minutes’"ProfileName"
Suggested Monitoring ScheduleSite specific
GUI Data Entry FieldsThe following shows the GUI fields on the Add Monitor to TME10 Distributed Monitoring Profile dialog for the Extents —Background monitor; a description of each field follows.
Extents Greater ThanSpecifies the threshold number of extents.
OutputNone
308 Version 2.0

Extents — Asynchronous
CLI SyntaxextentsAsync
CLI Examplewaddmon ’OracleManagerAsync’ ’extentsAsync’-c ’critical’-c ’severe’-c ’warning’-c ’normal’-c ’always’"ProfileName"
Suggested Response LevelsThere are no default actions for this monitor.
Monitors that are defined with this monitoring source use operatorsto evaluate data. For information about these operators, seeAppendix C, “Operator Groups (Monitor Triggers)” .
GUI Data Entry FieldsNone
309Tivoli Manager for Oracle** Reference Guide
4.A
sync
Mo
nito
rs

OutputThe following shows an example output from this monitor.
This monitor returns, as its trigger value, the largest number ofextents for an object. The object with the largest number of extentsis reported as TRIGGER_INFO. The monitor may also returnadditional objects in the userinfo lines. Information for all objects isreported in descending order, based on the number of extents, in thefollowing format:
Number of Extents, Object Name, Object Owner, Tablespace Name
For a description of the monitor output, see “Understanding MonitorOutput” on page 6.
310 Version 2.0

Extents by Tablespace — Background andAsynchronous
DescriptionMonitors how many extents are allocated to all database objectswithin specified tablespaces and reports the largest number of extentsfound.
Use the Extents by Tablespace — Background monitor to setarguments. Use the Extents by Tablespace — Asynchronousmonitor to set the trigger and response criteria. You must use thesetwo monitors in conjunction for valid return values.
Authorization Roleoracle_user and user
Target EndpointOracleDatabaseManager
Views AccessedDBA_SEGMENTS
Usage NotesYou can use this monitor to see which objects in a database have alarge number of extents. This information can be used to chart thegrowth of objects. This information also can be used in conjunctionwith the Maximum Extents — Background and Asynchronousmonitors to predict when an object is going to run out of extents.You might need to allocate additional extents to the object, or exportit and recreate it with a larger extent size.
See AlsoThe following monitors in this chapter: Extents — Background andAsynchronous, Extents by User — Background andAsynchronous, Maximum Extents — Background andAsynchronous, Maximum Extents by Tablespace — Backgroundand Asynchronous, Maximum Extents by User — Backgroundand Asynchronous.
311Tivoli Manager for Oracle** Reference Guide
4.A
sync
Mo
nito
rs
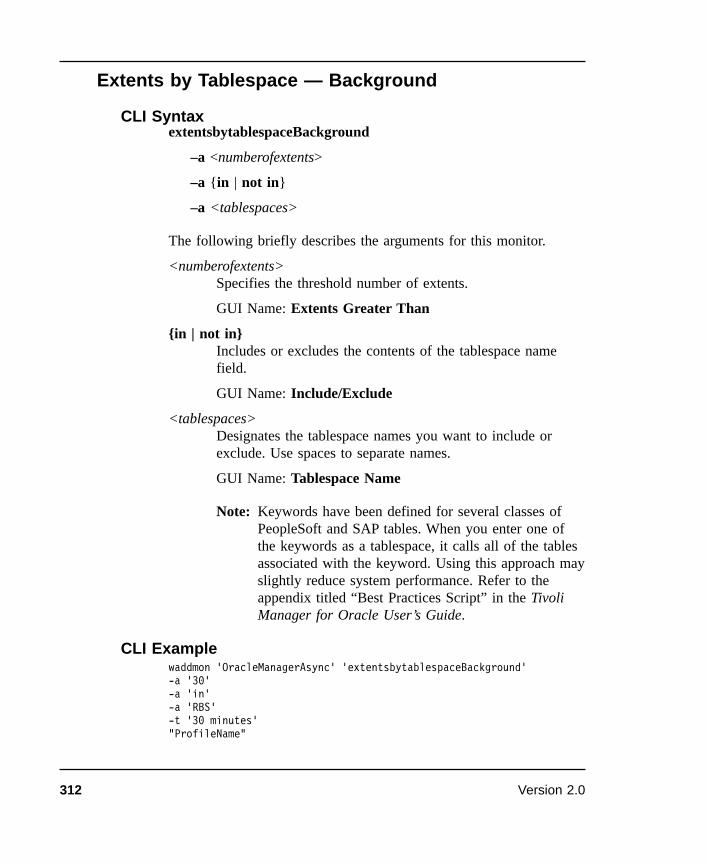
Extents by Tablespace — Background
CLI SyntaxextentsbytablespaceBackground
–a <numberofextents>
–a {in | not in}
–a <tablespaces>
The following briefly describes the arguments for this monitor.
<numberofextents>Specifies the threshold number of extents.
GUI Name: Extents Greater Than
{in | not in}Includes or excludes the contents of the tablespace namefield.
GUI Name: Include/Exclude
<tablespaces>Designates the tablespace names you want to include orexclude. Use spaces to separate names.
GUI Name: Tablespace Name
Note: Keywords have been defined for several classes ofPeopleSoft and SAP tables. When you enter one ofthe keywords as a tablespace, it calls all of the tablesassociated with the keyword. Using this approach mayslightly reduce system performance. Refer to theappendix titled “Best Practices Script” in the TivoliManager for Oracle User’s Guide.
CLI Examplewaddmon ’OracleManagerAsync’ ’extentsbytablespaceBackground’-a ’30’-a ’in’-a ’RBS’-t ’30 minutes’"ProfileName"
312 Version 2.0

Suggested Monitoring ScheduleSite specific
GUI Data Entry FieldsThe following shows the GUI fields on the Add Monitor to TME10 Distributed Monitoring Profile dialog for the Extents bytablespace — Background monitor; a description of each fieldfollows.
Extents Greater ThanSpecifies the threshold number of extents.
Include/ExcludeIncludes or excludes the contents of the tablespace namefield.
Tablespace NameDesignates the tablespace names you want to include orexclude. Use spaces to separate names.
Note: Keywords have been defined for several classes ofPeopleSoft and SAP tables. When you enter one ofthe keywords as a tablespace, it calls all of the tablesassociated with the keyword. Using this approach mayslightly reduce system performance. Refer to theappendix titled “Best Practices Script” in the TivoliManager for Oracle User’s Guide.
OutputNone
313Tivoli Manager for Oracle** Reference Guide
4.A
sync
Mo
nito
rs

Extents by Tablespace — Asynchronous
CLI SyntaxextentsbytablespaceAsync
CLI Examplewaddmon ’OracleManagerAsync’ ’extentsbytablespaceAsync’-c ’critical’-c ’severe’-c ’warning’-c ’normal’-c ’always’"ProfileName"
Suggested Response LevelsThere are no default actions for this monitor.
Monitors that are defined with this monitoring source use operatorsto evaluate data. For information about these operators, seeAppendix C, “Operator Groups (Monitor Triggers)” .
GUI Data Entry FieldsNone
OutputThe following shows an example output from this monitor.
314 Version 2.0

This monitor returns, as its trigger value, the largest number ofextents for an object in the specified tablespaces. The object with themost extents in the specified tablespaces is reported asTRIGGER_INFO. The monitor may also return additional objects inthe userinfo lines. Information for all objects is reported indescending order, based on the number of extents, in the followingformat:
Number of Extents, Object Name, Object Owner
Note: If SQL does not return any rows, it reports an error.
For a description of the monitor output, see “Understanding MonitorOutput” on page 6.
315Tivoli Manager for Oracle** Reference Guide
4.A
sync
Mo
nito
rs

Extents by User — Background and Asynchronous
DescriptionMonitors how many extents have been allocated to all databaseobjects for a specified user and reports the largest number of extentsfound.
Use the Extents by User — Background monitor to set arguments.Use the Extents by User — Asynchronous monitor to set thetrigger and response criteria. You must use these two monitors inconjunction for valid return values.
Authorization Roleoracle_user and user
Target EndpointOracleDatabaseManager
Views AccessedDBA_SEGMENTS
Usage NotesYou can use this monitor to see which objects in a database have alarge number of extents. This information can be used to chart thegrowth of objects. This information also can be used in conjunctionwith the Maximum Extents — Background and Asynchronousmonitors to predict when an object is going to run out of extents.You might need to allocate additional extents to the object, or exportit and recreate it with a larger extent size.
See AlsoThe following monitors in this chapter:
Extents — Background and Asynchronous, Extents byTablespace — Background and Asynchronous, Maximum Extents— Background and Asynchronous, Maximum Extents byTablespace — Background and Asynchronous, Maximum Extentsby User — Background and Asynchronous.
316 Version 2.0

Extents by User — Background
CLI SyntaxextentsbyuserBackground
–a <numberofextents>
–a <username>
The following briefly describes the arguments for this monitor.
<numberofextents>Specifies the threshold number of extents.
GUI Name: Extents Greater Than
<username>Specifies the Oracle user name.
GUI Name: User Name
CLI Examplewaddmon ’OracleManagerAsync’ ’extentsbyuserBackground’-a ’0’-a ’SYS’-t ’30 minutes’"ProfileName"
Suggested Monitoring ScheduleSite specific
GUI Data Entry FieldsThe following shows the GUI fields on the Add Monitor to TME10 Distributed Monitoring Profile dialog for the Extents by User— Background monitor; a description of each field follows.
Extents Greater ThanSpecifies the threshold number of extents.
317Tivoli Manager for Oracle** Reference Guide
4.A
sync
Mo
nito
rs

User NameSpecifies the Oracle user name.
OutputNone
318 Version 2.0

Extents by User — Asynchronous
CLI SyntaxextentsbyuserAsync
CLI Examplewaddmon ’OracleManagerAsync’ ’extentsbyuserAsync’-c ’critical’-c ’severe’-c ’warning’-c ’normal’-c ’always’"ProfileName"
Suggested Response LevelsThere are no default actions for this monitor.
Monitors that are defined with this monitoring source use operatorsto evaluate data. For information about these operators, seeAppendix C, “Operator Groups (Monitor Triggers)” .
GUI Data Entry FieldsNone
319Tivoli Manager for Oracle** Reference Guide
4.A
sync
Mo
nito
rs

OutputThe following shows an example output from this monitor.
This monitor returns, as its trigger value, the largest number ofextents for an object owned by a specified user. The object with themost extents is reported as TRIGGER_INFO. The monitor may alsoreturn additional objects in the userinfo lines. Information for allobjects is reported in descending order, based on the number ofextents, in the following format:
Number of Extents, Object Name, Tablespace Name
For a description of the monitor output, see “Understanding MonitorOutput” on page 6.
320 Version 2.0

Free Space Deficit — Background and Asynchronous
DescriptionChecks whether any segments are unable to allocate their next extentbecause of insufficient free space in the tablespace, and not becausethe segments reached MAXEXTENTS. The reported trigger valuerepresents the worst-case equity (available space less required space);a negative equity figure means that the next extent for that segmentwill fail. It does not check objects of segment_type CACHE. If theExclude Rollback Segments argument is set to Yes, the monitordoes not check the free space in any rollback segments.
Use the Free Space Deficit — Background monitor to setarguments. Use the Free Space Deficit — Asynchronous monitor toset the trigger and response criteria. You must use these twomonitors in conjunction for valid return values.
Authorization Roleoracle_user and user
Target EndpointOracleDatabaseManager
Views AccessedDBA_SEGMENTS
DBA_FREE_SPACE
Usage NotesA table is created with an initial extent of 1 MB, next extent 1 MB,and PCTINCREASE of 25%. If the table grows to six extents, theextent sizes are as follows:
Extent Number Extent Size (bytes)
1 1,024,000
2 1,024,000
3 1,280,000
4 1,600,000
321Tivoli Manager for Oracle** Reference Guide
4.A
sync
Mo
nito
rs

Extent Number Extent Size (bytes)
5 2,000,000
6 2,500,000
The size of the seventh extent is 3,125,000 bytes. If the free space inthe tablespace is 3 MB (3,072,000 bytes), the table cannot allocateits seventh extent. The equity is (3,072,000 - 3,125,000) = (-53,000bytes). This is the figure that is checked by the monitor.
If a segment is unable to allocate another extent, a number ofcorrective actions can be taken: add another file to the relevanttablespace, change the size of the next extent using ALTER TABLEALLOCATE EXTENT, or export the segment and recreate it withdifferent storage parameters. Tivoli recommends that all segments becreated with a PCTINCREASE of 0.
See AlsoThe following monitors in this chapter: Free Space Deficit byTablespace — Background and Asynchronous, Free Space Deficitby User — Background and Asynchronous.
The following monitors in the OracleDatabaseManager MonitoringCollection: Free Tablespace and Number of Datafiles.
322 Version 2.0

Free Space Deficit — Background
CLI SyntaxfreespacedefBackground
–a {Yes | No}
The following briefly describes the argument for this monitor.
{Yes | No}Yes ignores the rollback segments. No does not ignore therollback segments.
GUI Name: Exclude Rollback Segments
CLI Examplewaddmon ’OracleManagerAsync’ ’freespacedefBackground’-a ’No’-t ’30 minutes’"ProfileName"
Suggested Monitoring ScheduleEvery 30 minutes.
GUI Data Entry FieldsThe following shows the GUI fields on the Add Monitor to TME10 Distributed Monitoring Profile dialog for the Free spacedeficit— Background monitor; a description of each field follows.
Exclude Rollback SegmentYes ignores the rollback segments. No does not ignore therollback segments.
OutputNone
323Tivoli Manager for Oracle** Reference Guide
4.A
sync
Mo
nito
rs

Free Space Deficit — Asynchronous
CLI SyntaxfreespacedefAsync
CLI Examplewaddmon ’OracleManagerAsync’ ’freespacedefAsync’-c ’critical’ -R ’<’ ’0’ -n ’OracleManager Sentry’-c ’severe’-c ’warning’-c ’normal’-c ’always’"ProfileName"
Suggested Response LevelsThe following table shows suggested threshold values for severitylevels. See “Specifying Response Levels” in Chapter 6 of TivoliManager for Oracle User’s Guide.
Severity Trigger When Default Actions
Critical Less than 0 Send OracleManager Sentry notice
Severe N/A None
Warning N/A None
Normal N/A None
Always N/A None
Monitors that are defined with this monitoring source use operatorsto evaluate data. For information about these operators, seeAppendix C, “Operator Groups (Monitor Triggers)” .
GUI Data Entry FieldsNone
324 Version 2.0

OutputThe following shows an example output from this monitor.
The object with the worst-case equity is reported asTRIGGER_INFO. Additional information for all objects returnedappears as text in the userinfo lines in the following format:
Equity, Object Name, Tablespace Name, Object Owner
For a description of the monitor output, see “Understanding MonitorOutput” on page 6.
325Tivoli Manager for Oracle** Reference Guide
4.A
sync
Mo
nito
rs

Free Space Deficit by Tablespace — Background andAsynchronous
DescriptionChecks whether any segments, within specified tablespaces, areunable to allocate their next extent because of insufficient free spacein the tablespace, and not because the segments reachedMAXEXTENTS. The reported trigger value represents theworst-case equity (available space less required space); a negativeequity figure means that the next extent for that segment will fail.The monitor does not check objects of segment_type CACHE.
Use the Free Space Deficit by Tablespace — Background monitorto set arguments. Use the Free Space Deficit by Tablespace —Asynchronous monitor to set the trigger and response criteria. Youmust use these two monitors in conjunction for valid return values.
Authorization Roleoracle_user and user
Target EndpointOracleDatabaseManager
Views AccessedDBA_SEGMENTS
DBA_FREE_SPACE
Usage NotesA table is created with an initial extent of 1 MB, next extent 1 MB,and PCTINCREASE of 25%. If the table grows to six extents, theextent sizes are as follows:
Extent Number Extent Size (bytes)
1 1,024,000
2 1,024,000
3 1,280,000
4 1,600,000
326 Version 2.0

Extent Number Extent Size (bytes)
5 2,000,000
6 2,500,000
The size of the seventh extent is 3,125,000 bytes. If the free space inthe tablespace is 3 MB (3,072,000 bytes), the table will not be ableto allocate its seventh extent. The equity is (3,072,000 - 3,125,000) =-(53,000) bytes. This is the figure that is checked by the monitor.
If a segment is unable to allocate another extent, a number ofcorrective actions can be taken: add another file to the relevanttablespace, change the size of the next extent using ALTER TABLEALLOCATE EXTENT, or export the segment and recreate it withdifferent storage parameters. Tivoli recommends that all segments becreated with a PCTINCREASE of 0.
See AlsoThe following monitors in this chapter: Free Space Deficit —Background and Asynchronous, Free Space Deficit by User —Background and Asynchronous, Maximum Extents by Tablespace— Background and Asynchronous.
The following monitors in the OracleDatabaseManager MonitoringCollection: Free Tablespace and Number of Datafiles.
327Tivoli Manager for Oracle** Reference Guide
4.A
sync
Mo
nito
rs

Free Space Deficit by Tablespace — Background
CLI SyntaxfreespacedeftBackground
–a {in | not in}
–a <tablespaces>
The following briefly describes the arguments for this monitor.
{in | not in}Includes or excludes the contents of the tablespace namefield.
GUI Name: Include/Exclude
<tablespaces>Designates the tablespace names you want to include orexclude. Use spaces to separate names.
GUI Name: Tablespace Name
Note: Keywords have been defined for several classes ofPeopleSoft and SAP tables. When you enter one ofthe keywords as a tablespace, it calls all of the tablesassociated with the keyword. Using this approach mayslightly reduce system performance. Refer to theappendix titled “Best Practices Script” in the TivoliManager for Oracle User’s Guide.
CLI Examplewaddmon ’OracleManagerAsync’ ’freespacedeftBackground’-a ’in’-a ’users’-t ’30 minutes’"ProfileName"
Suggested Monitoring ScheduleEvery 30 minutes
328 Version 2.0

GUI Data Entry FieldsThe following shows the GUI fields on the Add Monitor to TME10 Distributed Monitoring Profile dialog for the Free space deficitby tablespace — Background monitor; a description of each fieldfollows.
Include/ExcludeIncludes or excludes the contents of the tablespace namefield.
Tablespace NameDesignates the tablespace names you want to include orexclude. Use spaces to separate names.
Note: Keywords have been defined for several classes ofPeopleSoft and SAP tables. When you enter one ofthe keywords as a tablespace, it calls all of the tablesassociated with the keyword. Using this approach mayslightly reduce system performance. Refer to theappendix titled “Best Practices Script” in the TivoliManager for Oracle User’s Guide.
OutputNone
329Tivoli Manager for Oracle** Reference Guide
4.A
sync
Mo
nito
rs
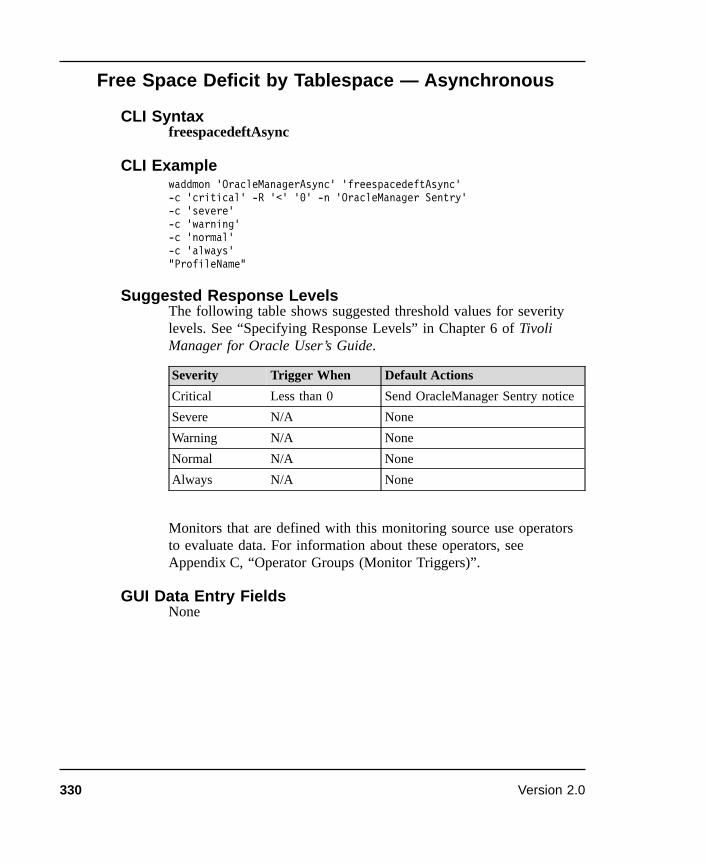
Free Space Deficit by Tablespace — Asynchronous
CLI SyntaxfreespacedeftAsync
CLI Examplewaddmon ’OracleManagerAsync’ ’freespacedeftAsync’-c ’critical’ -R ’<’ ’0’ -n ’OracleManager Sentry’-c ’severe’-c ’warning’-c ’normal’-c ’always’"ProfileName"
Suggested Response LevelsThe following table shows suggested threshold values for severitylevels. See “Specifying Response Levels” in Chapter 6 of TivoliManager for Oracle User’s Guide.
Severity Trigger When Default Actions
Critical Less than 0 Send OracleManager Sentry notice
Severe N/A None
Warning N/A None
Normal N/A None
Always N/A None
Monitors that are defined with this monitoring source use operatorsto evaluate data. For information about these operators, seeAppendix C, “Operator Groups (Monitor Triggers)” .
GUI Data Entry FieldsNone
330 Version 2.0

OutputThe following shows an example output from this monitor.
The object with the worst-case equity for the specified tablespaces isreported as TRIGGER_INFO. Additional information for all objectsreturned appears as text in the userinfo lines in the following format:
Equity, Object Name, Object Owner
For a description of the monitor output, see “Understanding MonitorOutput” on page 6.
331Tivoli Manager for Oracle** Reference Guide
4.A
sync
Mo
nito
rs

Free Space Deficit by User — Background andAsynchronous
DescriptionChecks whether any segments, for a specified user, are unable toallocate their next extent because of insufficient free space in thetablespace, and not because the segments reached MAXEXTENTS.The reported trigger value represents the worst-case equity (availablespace less required space); a negative equity figure means that thenext extent for that segment will fail. The monitor does not checkobjects of segment_type CACHE.
Use the Free Space Deficit by User — Background monitor to setarguments. Use the Free Space Deficit by User — Asynchronousmonitor to set the trigger and response criteria. You must use thesetwo monitors in conjunction for valid return values.
Authorization Roleoracle_user and user
Target EndpointOracleDatabaseManager
Views AccessedDBA_SEGMENTS
DBA_FREE_SPACE
Usage NotesA table is created with an initial extent of 1 MB, next extent 1 MB,and PCTINCREASE of 25%. If the table grows to six extents, theextent sizes are as follows:
Extent Number Extent Size (bytes)
1 1,024,000
2 1,024,000
3 1,280,000
4 1,600,000
332 Version 2.0
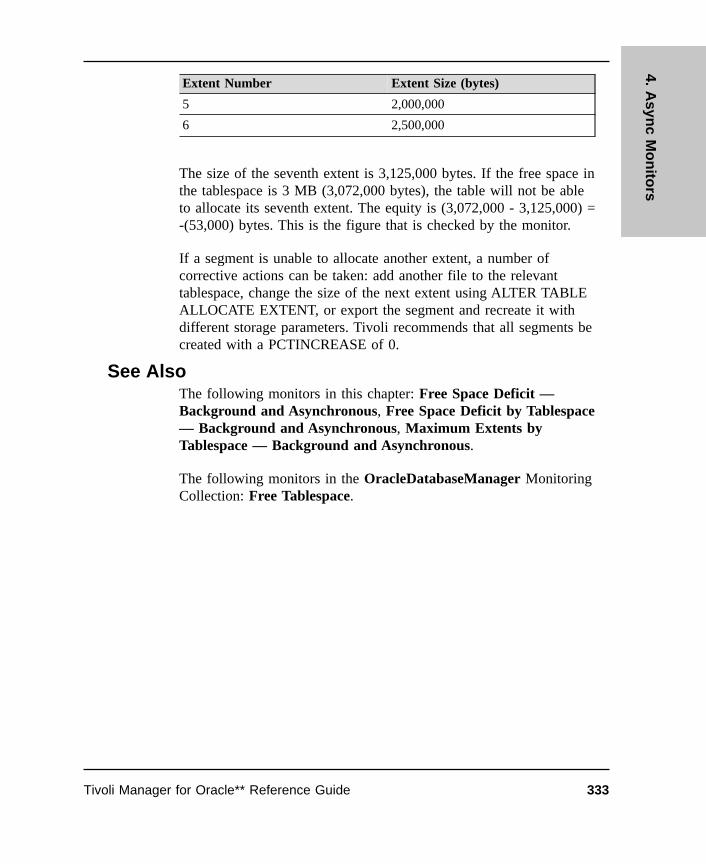
Extent Number Extent Size (bytes)
5 2,000,000
6 2,500,000
The size of the seventh extent is 3,125,000 bytes. If the free space inthe tablespace is 3 MB (3,072,000 bytes), the table will not be ableto allocate its seventh extent. The equity is (3,072,000 - 3,125,000) =-(53,000) bytes. This is the figure that is checked by the monitor.
If a segment is unable to allocate another extent, a number ofcorrective actions can be taken: add another file to the relevanttablespace, change the size of the next extent using ALTER TABLEALLOCATE EXTENT, or export the segment and recreate it withdifferent storage parameters. Tivoli recommends that all segments becreated with a PCTINCREASE of 0.
See AlsoThe following monitors in this chapter: Free Space Deficit —Background and Asynchronous, Free Space Deficit by Tablespace— Background and Asynchronous, Maximum Extents byTablespace — Background and Asynchronous.
The following monitors in the OracleDatabaseManager MonitoringCollection: Free Tablespace.
333Tivoli Manager for Oracle** Reference Guide
4.A
sync
Mo
nito
rs

Free Space Deficit by User — Background
CLI SyntaxfreespacedefuBackground
–a <username>
The following briefly describes the argument for this monitor.
<username>Specifies the Oracle user name.
GUI Name: User Name
CLI Examplewaddmon ’OracleManagerAsync’ ’freespacedefuBackground’-a ’scott’-t ’30 minutes’"ProfileName"
Suggested Monitoring ScheduleEvery 30 minutes.
GUI Data Entry FieldsThe following shows the GUI fields on the Add Monitor to TME10 Distributed Monitoring Profile dialog for the Free space deficitby user — Background monitor; a description of each field follows.
User NameSpecifies the Oracle user name.
OutputNone
334 Version 2.0

Free Space Deficit by User — Asynchronous
CLI SyntaxfreespacedefuAsync
CLI Examplewaddmon ’OracleManagerAsync’ ’freespacedefuAsync’-c ’critical’ -R ’<’ ’0’ -n ’OracleManager Sentry’-c ’severe’-c ’warning’-c ’normal’-c ’always’"ProfileName"
Suggested Response LevelsThe following table shows suggested threshold values for severitylevels. See “Specifying Response Levels” in Chapter 6 of TivoliManager for Oracle User’s Guide.
Severity Trigger When Default Actions
Critical Less than 0 Send OracleManager Sentry notice
Severe N/A None
Warning N/A None
Normal N/A None
Always N/A None
Monitors that are defined with this monitoring source use operatorsto evaluate data. For information about these operators, seeAppendix C, “Operator Groups (Monitor Triggers)” .
GUI Data Entry FieldsNone
335Tivoli Manager for Oracle** Reference Guide
4.A
sync
Mo
nito
rs

OutputThe following shows an example output from this monitor.
The object with the worst-case equity for the specified user isreported as TRIGGER_INFO. Additional information for all objectsreturned appears as text in the userinfo lines in the following format:
Equity, Object Name, Tablespace Name
For a description of the monitor output, see “Understanding MonitorOutput” on page 6.
336 Version 2.0
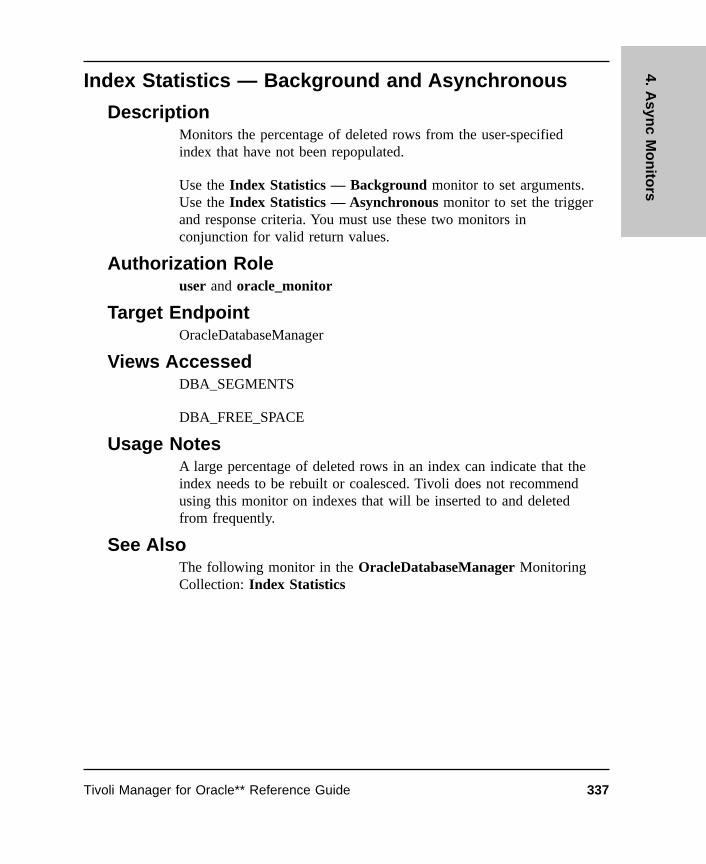
Index Statistics — Background and Asynchronous
DescriptionMonitors the percentage of deleted rows from the user-specifiedindex that have not been repopulated.
Use the Index Statistics — Background monitor to set arguments.Use the Index Statistics — Asynchronous monitor to set the triggerand response criteria. You must use these two monitors inconjunction for valid return values.
Authorization Roleuser and oracle_monitor
Target EndpointOracleDatabaseManager
Views AccessedDBA_SEGMENTS
DBA_FREE_SPACE
Usage NotesA large percentage of deleted rows in an index can indicate that theindex needs to be rebuilt or coalesced. Tivoli does not recommendusing this monitor on indexes that will be inserted to and deletedfrom frequently.
See AlsoThe following monitor in the OracleDatabaseManager MonitoringCollection: Index Statistics
337Tivoli Manager for Oracle** Reference Guide
4.A
sync
Mo
nito
rs
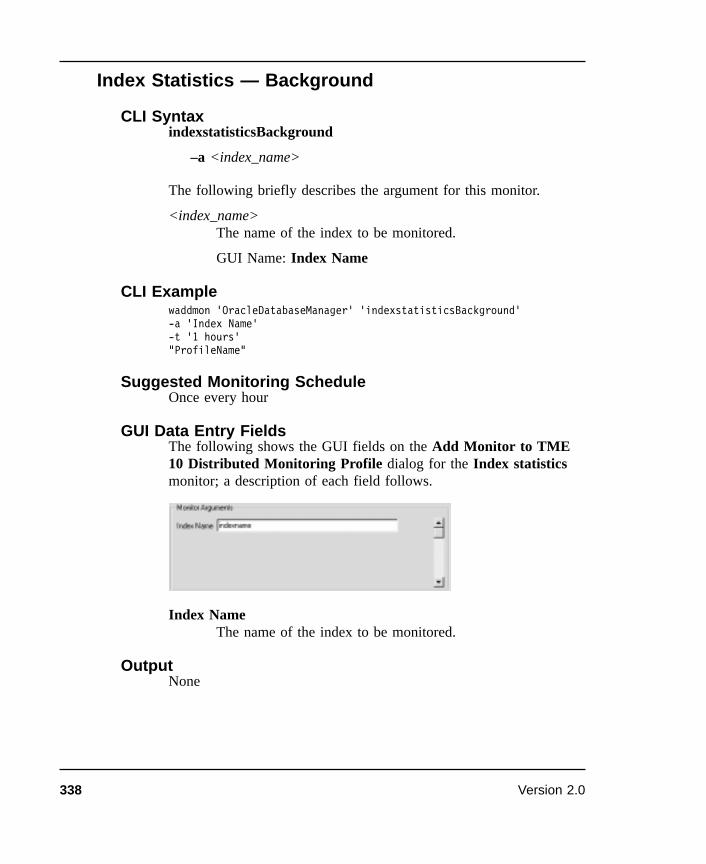
Index Statistics — Background
CLI SyntaxindexstatisticsBackground
–a <index_name>
The following briefly describes the argument for this monitor.
<index_name>The name of the index to be monitored.
GUI Name: Index Name
CLI Examplewaddmon ’OracleDatabaseManager’ ’indexstatisticsBackground’-a ’Index Name’-t ’1 hours’"ProfileName"
Suggested Monitoring ScheduleOnce every hour
GUI Data Entry FieldsThe following shows the GUI fields on the Add Monitor to TME10 Distributed Monitoring Profile dialog for the Index statisticsmonitor; a description of each field follows.
Index NameThe name of the index to be monitored.
OutputNone
338 Version 2.0

Index Statistics — Asynchronous
CLI SyntaxindexstatisticsAsync
CLI Examplewaddmon ’OracleDatabaseManager’ ’indexstatisticsAsync’"ProfileName"
Suggested Response LevelsThere are no default actions for this monitor.
Monitors that are defined with this monitoring source use operatorsto evaluate data. For information about these operators, seeAppendix C, “Operator Groups (Monitor Triggers)” .
GUI Data Entry FieldsNone
OutputThe following shows an example output from this monitor.
Index information is reported as text on the userinfo lines, in thefollowing format:
Index Name
339Tivoli Manager for Oracle** Reference Guide
4.A
sync
Mo
nito
rs

For a description of the monitor output, see “Understanding MonitorOutput” on page 6.
340 Version 2.0

Maximum Extents — Background and Asynchronous
DescriptionThis monitor returns the smallest number of free extents found for asegment. This monitor also checks how close each object is to thevalue of MAXEXTENTS and reports the number of extents that canstill be allocated. It does not check objects of segment_type CACHE.If the Exclude Rollback Segments argument is set to Yes, themonitor does not check the number of extents in any rollbacksegments.
Use the Maximum Extents — Background monitor to setarguments. Use the Maximum Extents — Asynchronous monitor toset the trigger and response criteria. You must use these twomonitors in conjunction for valid return values.
Authorization Roleoracle_user and user
Target EndpointOracleDatabaseManager
Views AccessedDBA_SEGMENTS
Usage NotesIf the number of extents for an object reaches the value of theMAXEXTENTS storage parameter and the object needs to allocatean additional extent, the operation will fail. If the value ofMAXEXTENTS is less than the maximum allowable (see thefollowing table), increase the value of MAXEXTENTS. Otherwise,export the object, drop and recreate the object with larger extentsizes, and import the data.
Block Size MAXEXTENTS
1 KB 57
2 KB 121
4 KB 249
341Tivoli Manager for Oracle** Reference Guide
4.A
sync
Mo
nito
rs

Block Size MAXEXTENTS
8 KB 505
See AlsoThe following monitors in this chapter: Maximum Extents byTablespace — Background and Asynchronous, Maximum Extentsby User — Background and Asynchronous.
The following monitors in the OracleDatabaseManager MonitoringCollection: Free Tablespace and Number of Datafiles
342 Version 2.0
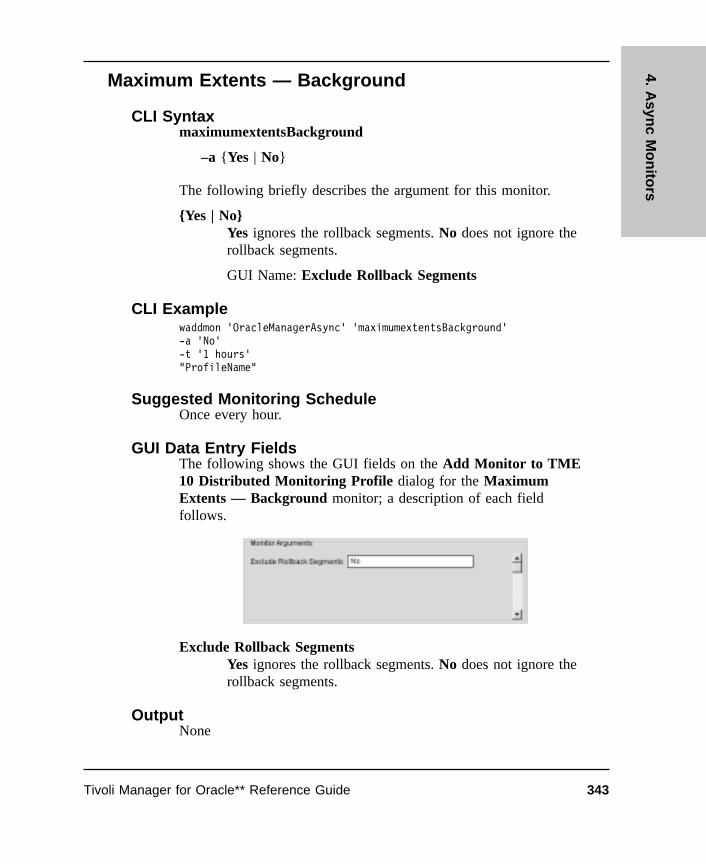
Maximum Extents — Background
CLI SyntaxmaximumextentsBackground
–a {Yes | No}
The following briefly describes the argument for this monitor.
{Yes | No}Yes ignores the rollback segments. No does not ignore therollback segments.
GUI Name: Exclude Rollback Segments
CLI Examplewaddmon ’OracleManagerAsync’ ’maximumextentsBackground’-a ’No’-t ’1 hours’"ProfileName"
Suggested Monitoring ScheduleOnce every hour.
GUI Data Entry FieldsThe following shows the GUI fields on the Add Monitor to TME10 Distributed Monitoring Profile dialog for the MaximumExtents — Background monitor; a description of each fieldfollows.
Exclude Rollback SegmentsYes ignores the rollback segments. No does not ignore therollback segments.
OutputNone
343Tivoli Manager for Oracle** Reference Guide
4.A
sync
Mo
nito
rs

Maximum Extents — Asynchronous
CLI SyntaxmaximumextentsAsync
CLI Examplewaddmon ’OracleManagerAsync’ ’maximumextentsAsync’-c ’critical’ -R ’<’ ’1’ -n ’OracleManager Sentry’-c ’severe’ -R ’<’ ’3’ -n ’OracleManager Sentry’-c ’warning’ -R ’<’ ’5’ -n ’OracleManager Sentry’-c ’normal’-c ’always’"ProfileName"
Suggested Response LevelsThe following table shows suggested threshold values for severitylevels. See “Specifying Response Levels” in Chapter 6 of TivoliManager for Oracle User’s Guide.
Severity Trigger When Default Actions
Critical Less than 1 Send OracleManager Sentry notice
Severe Less than 3 Send OracleManager Sentry notice
Warning Less than 5 Send OracleManager Sentry notice
Normal N/A None
Always N/A None
Monitors that are defined with this monitoring source use operatorsto evaluate data. For information about these operators, seeAppendix C, “Operator Groups (Monitor Triggers)” .
GUI Data Entry FieldsNone
344 Version 2.0

OutputThe following shows an example output from this monitor.
The segment with the least amount of free extents is reported asTRIGGER_INFO. The free extents for additional segments are listedin ascending order in the userinfo lines, in the following format:
Free Extents, Segment Name, Tablespace Name, Object Owner,Segment Type
For a description of the monitor output, see “Understanding MonitorOutput” on page 6.
345Tivoli Manager for Oracle** Reference Guide
4.A
sync
Mo
nito
rs

Maximum Extents by Tablespace — Background andAsynchronous
DescriptionThis monitor returns the smallest number of free extents found for asegment within the specified tablespaces. This monitor also checkshow close each object within the specified tablespaces is to the valueof MAXEXTENTS and reports the number of extents that can stillbe allocated. It does not check objects of segment_type CACHE.
Use the Maximum Extents by Tablespace — Background monitorto set arguments. Use the Maximum Extents by Tablespace—Asynchronous monitor to set the trigger and response criteria.You must use these two monitors in conjunction for valid returnvalues.
Authorization Roleoracle_user and user
Target EndpointOracleDatabaseManager
Views AccessedDBA_SEGMENTS
Usage NotesIf the number of extents for an object reaches the value of theMAXEXTENTS storage parameter, and the object needs to allocatean additional extent, the operation will fail. If the value ofMAXEXTENTS is less than the maximum allowable (see thefollowing table), increase the value of MAXEXTENTS. Otherwise,export the object, drop and recreate the object with larger extentsizes, and import the data.
Block Size MAXEXTENTS
1 KB 57
2 KB 121
4 KB 249
346 Version 2.0
Block Size MAXEXTENTS
8 KB 505
See AlsoThe following monitors in this chapter: Maximum Extents —Background and Asynchronous and Maximum Extents by User— Background and Asynchronous.
The following monitors in the OracleDatabaseManager MonitoringCollection: Free Tablespace by Tablespace and Number ofDatafiles.
347Tivoli Manager for Oracle** Reference Guide
4.A
sync
Mo
nito
rs

Maximum Extents by Tablespace — Background
CLI SyntaxmaximumextentstBackground
–a {in | not in}
–a <tablespaces>
The following briefly describes the arguments for this monitor.
{in | not in}Includes or excludes the contents of the tablespace namefield.
GUI Name: Include/Exclude
<tablespaces>Designates the tablespace names you want to include orexclude. Use spaces to separate names.
GUI Name: Tablespace Name
Note: Keywords have been defined for several classes ofPeopleSoft and SAP tables. When you enter one ofthe keywords as a tablespace, it calls all of the tablesassociated with the keyword. Using this approach mayslightly reduce system performance. Refer to theappendix titled “Best Practices Script” in the TivoliManager for Oracle User’s Guide.
CLI Examplewaddmon ’OracleManagerAsync’ ’maximumextentstBackground’-a ’not in’-a ’system’-t ’1 hour’"ProfileName"
Suggested Monitoring ScheduleOnce every hour.
348 Version 2.0

GUI Data Entry FieldsThe following shows the GUI fields on the Add Monitor to TME10 Distributed Monitoring Profile dialog for the Maximumextents by tablespace — Background monitor; a description ofeach field follows.
Include/ExcludeIncludes or excludes the contents of the tablespace namefield.
Tablespace NameDesignates the tablespace names you want to include orexclude. Use spaces to separate names.
Note: Keywords have been defined for several classes ofPeopleSoft and SAP tables. When you enter one ofthe keywords as a tablespace, it calls all of the tablesassociated with the keyword. Using this approach mayslightly reduce system performance. Refer to theappendix titled “Best Practices Script” in the TivoliManager for Oracle User’s Guide.
OutputNone
349Tivoli Manager for Oracle** Reference Guide
4.A
sync
Mo
nito
rs

Maximum Extents by Tablespace —Asynchronous
CLI SyntaxmaximumextentstAsync
CLI Examplewaddmon ’OracleManagerAsync’ ’maximumextentstAsync’-c ’critical’ -R ’<’ ’1’ -n ’OracleManager Sentry’-c ’severe’ -R ’<’ ’3’ -n ’OracleManager Sentry’-c ’warning’ -R ’<’ ’5’ -n ’OracleManager Sentry’-c ’normal’-c ’always’"ProfileName"
Suggested Response LevelsThe following table shows suggested threshold values for severitylevels. See “Specifying Response Levels” in Chapter 6 of TivoliManager for Oracle User’s Guide.
Severity Trigger When Default Actions
Critical Less than 1 Send OracleManager Sentry notice
Severe Less than 3 Send OracleManager Sentry notice
Warning Less than 5 Send OracleManager Sentry notice
Normal N/A None
Always N/A None
Monitors that are defined with this monitoring source use operatorsto evaluate data. For information about these operators, seeAppendix C, “Operator Groups (Monitor Triggers)” .
GUI Data Entry FieldsNone
350 Version 2.0

OutputThe following shows an example output from this monitor.
The segment with the least amount of free extents for the specifiedtablespaces is reported as TRIGGER_INFO. The free extents foradditional segments are listed in ascending order in the userinfolines, in the following format:
Free Extents, Segment Name, Object Owner, Segment Type
For a description of the monitor output, see “Understanding MonitorOutput” on page 6.
351Tivoli Manager for Oracle** Reference Guide
4.A
sync
Mo
nito
rs

Maximum Extents by User — Background andAsynchronous
DescriptionThis monitor returns the smallest number of free extents found for asegment of a specified user. This monitor checks how close eachobject for a specified user is to the value of MAXEXTENTS andreports the number of extents that can still be allocated. It does notcheck objects of segment_type CACHE.
Use the Maximum Extents by User — background monitor to setarguments. Use the Maximum Extents by User — Asynchronousmonitor to set the trigger and response criteria. You must use thesetwo monitors in conjunction for valid return values.
Authorization Roleoracle_user and user
Target EndpointOracleDatabaseManager
Views AccessedDBA_SEGMENTS
Usage NotesIf the number of extents for an object reaches the value of theMAXEXTENTS storage parameter, and the object needs to allocatean additional extent, the operation will fail. If the value ofMAXEXTENTS is less than the maximum allowable (see thefollowing table), increase the value of MAXEXTENTS. Otherwise,export the object, drop and recreate the object with larger extentsizes, and import the data.
Block Size MAXEXTENTS
1 KB 57
2 KB 121
4 KB 249
8 KB 505
352 Version 2.0

See AlsoThe following monitors in this chapter: Maximum Extents —Background and Asynchronous and Maximum Extents byTablespace — Background and Asynchronous.
The following monitors in the OracleDatabaseManager MonitoringCollection: Free Tablespace and Number of Datafiles.
353Tivoli Manager for Oracle** Reference Guide
4.A
sync
Mo
nito
rs

Maximum Extents by User — background
CLI SyntaxmaximumextentsuBackground
–a <username>
The following briefly describes the argument for this monitor.
<username>Specifies the Oracle user name.
GUI Name: User Name
CLI Examplewaddmon ’OracleManagerAsync’ ’maximumextentsuBackground’-a ’scott’-t ’1 hours’"ProfileName"
Suggested Monitoring ScheduleOnce every hour.
GUI Data Entry FieldsThe following shows the GUI fields on the Add Monitor to TME10 Distributed Monitoring Profile dialog for the Maximumextents by user — Background monitor; a description of each fieldfollows.
User NameSpecifies the Oracle user name.
OutputNone
354 Version 2.0

Maximum Extents by User — Asynchronous
CLI SyntaxmaximumextentsuAsync
CLI Examplewaddmon ’OracleManagerAsync’ ’maximumextentsuAsync’-c ’critical’ -R ’<’ ’1’ -n ’OracleManager Sentry’-c ’severe’ -R ’<’ ’3’ -n ’OracleManager Sentry’-c ’warning’ -R ’<’ ’5’ -n ’OracleManager Sentry’-c ’normal’-c ’always’"ProfileName"
Suggested Response LevelsThe following table shows suggested threshold values for severitylevels. See “Specifying Response Levels” in Chapter 6 of TivoliManager for Oracle User’s Guide.
Severity Trigger When Default Actions
Critical Less than 1 Send OracleManager Sentry notice
Severe Less than 3 Send OracleManager Sentry notice
Warning Less than 5 Send OracleManager Sentry notice
Normal N/A None
Always N/A None
Monitors that are defined with this monitoring source use operatorsto evaluate data. For information about these operators, seeAppendix C, “Operator Groups (Monitor Triggers)” .
GUI Data Entry FieldsNone
355Tivoli Manager for Oracle** Reference Guide
4.A
sync
Mo
nito
rs
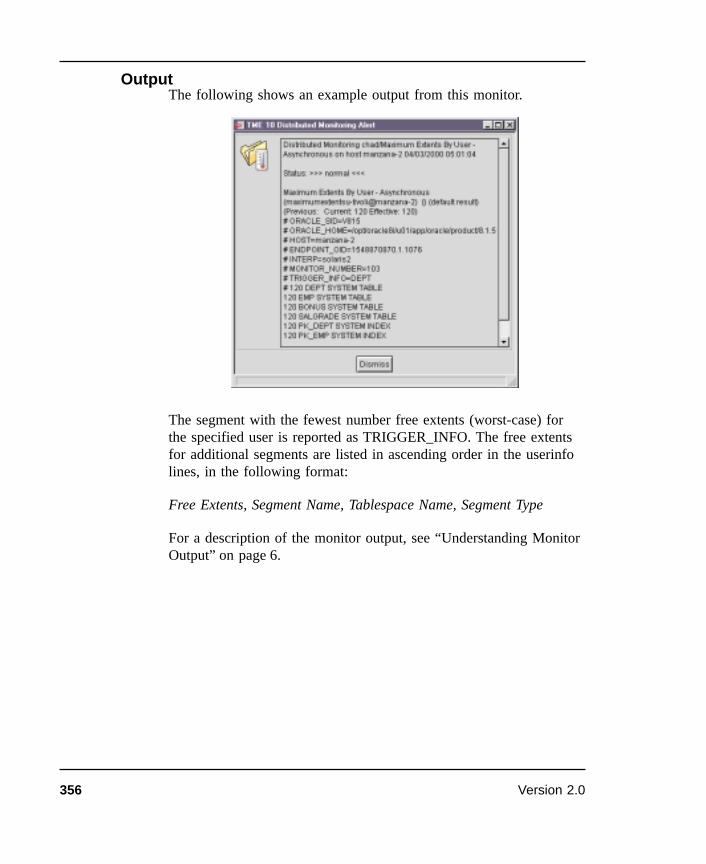
OutputThe following shows an example output from this monitor.
The segment with the fewest number free extents (worst-case) forthe specified user is reported as TRIGGER_INFO. The free extentsfor additional segments are listed in ascending order in the userinfolines, in the following format:
Free Extents, Segment Name, Tablespace Name, Segment Type
For a description of the monitor output, see “Understanding MonitorOutput” on page 6.
356 Version 2.0
SQL Number — Background and Asynchronous
DescriptionUsing SQL*Plus syntax, this monitor allows you to define a SQLselect statement as the basis of a monitor.
Use the SQL Number — Background monitor to set arguments.Use the SQL Number — Asynchronous monitor to set the triggerand response criteria. You must use these two monitors inconjunction for valid return values.
Authorization Roleoracle_user and user
Target EndpointOracleDatabaseManager
Views AccessedUser defined
Usage NotesDo not terminate the SQL statement with a semicolon (;), forwardslash (/), or backward slash (\). The select statement can returnmultiple columns and multiple rows. The trigger value (the valueagainst which the monitoring criteria is evaluated) must be one ofthe columns in the first row returned by the statement, and must be anumeric value.
The index parameter defines which column within the first rowcontains the trigger value (zero-based).
A SQL select statement might return no rows. By default, themonitor treats this as an error. You can override the default behaviorwith the –a value option, in which case the monitor returns the valuespecified by the argument value.
357Tivoli Manager for Oracle** Reference Guide
4.A
sync
Mo
nito
rs
The ability to define a freeform SQL select statement allows for theintegration of existing performance monitoring tools (particularlythose reporting monitored values to internal Oracle tables within thesubscribing database).
See AlsoThe following monitor in this chapter: SQL String — Backgroundand Asynchronous.
The following monitors in the OracleDatabaseManager MonitoringCollection: SQL String and SQL Number.
358 Version 2.0

SQL Number — Background
CLI SyntaxfreeformsqlnBackground
–a <monitor name>
–a <SQL statement>
–a <index>
–a <value>
The following briefly describes the arguments for this monitor.
<monitor name>Designates the name that you want to give to this monitor.
GUI Name: Monitor Label
<SQL statement>Specifies the selection and calculation criteria, in SQL*Plussyntax, of tables and columns for monitoring. Do notterminate the SQL statement with a semicolon (;), forwardslash (/), or backward slash (\).
GUI Name: SQL Statement
<index>Zero based; specifies the column number, within the firstrow returned, that is to contain the trigger value for themonitor.
GUI Name: Index
<value>Specifies the value to be returned if no rows are returnedfrom the SQL statement.
GUI Name: No Rows As
CLI Examplewaddmon ’OracleManagerAsync’ ’freeformsqlnBackground’-a ’number_of_sessions’-a ’select count(*) from V$session’
359Tivoli Manager for Oracle** Reference Guide
4.A
sync
Mo
nito
rs

-a ’0’-a ’0’-t ’2 hours’"ProfileName"
Suggested Monitoring ScheduleSite specific
GUI Data Entry FieldsThe following shows the GUI fields on the Add Monitor to TME10 Distributed Monitoring Profile dialog for the SQL number —Background monitor; a description of each field follows.
Monitor LabelDesignates the name that you want to give to this monitor.
SQL StatementSpecifies the selection and calculation criteria, in SQL*Plussyntax, of tables and columns for monitoring. Do notterminate the SQL statement with a semicolon (;), forwardslash (/), or backward slash (\).
Index Zero based; specifies the column number, within the firstrow returned, that is to contain the trigger value for themonitor.
No Rows AsSpecifies the value to be returned if no rows are returnedfrom SQL Statement.
OutputNone
360 Version 2.0

SQL Number — Asynchronous
CLI SyntaxfreeformsqlnAsync
CLI Examplewaddmon ’OracleManagerAsync’ ’freeformsqlnAsync’-c ’critical’ -R ’>’ ’24’-c ’severe’-c ’warning’-c ’normal’-c ’always’"ProfileName"
Suggested Response LevelsThere are no default actions for this monitor.
Monitors that are defined with this monitoring source use operatorsto evaluate data. For information about these operators, seeAppendix C, “Operator Groups (Monitor Triggers)” .
GUI Data Entry FieldsNone
OutputThe following shows an example output from this monitor.
361Tivoli Manager for Oracle** Reference Guide
4.A
sync
Mo
nito
rs

The user-specified arguments are reported as TRIGGER_INFO.Information in the userinfo lines appears in the following format:
Trigger Value
For a description of the monitor output, see “Understanding MonitorOutput” on page 6.
362 Version 2.0

SQL String — Background and Asynchronous
DescriptionUsing SQL*Plus syntax, this monitor enables you to define a SQLselect statement as the basis of a monitor.
Use the SQL String — Background monitor to set arguments. Usethe SQL String — Asynchronous monitor to set the trigger andresponse criteria. You must use these two monitors in conjunction forvalid return values.
Authorization Roleoracle_user and user
Target EndpointOracleDatabaseManager
Views AccessedUser defined
Usage NotesDo not terminate the SQL statement with a semicolon (;), forwardslash (/), or backward slash (\). The select statement can returnmultiple columns and multiple rows. The trigger value (the valueagainst which the monitoring criteria is evaluated) must be one ofthe columns in the first row returned by the statement, and must be astring value.
The index parameter defines which column within the first rowcontains the trigger value (zero-based).
A SQL select statement can return no rows. By default, the monitortreats this as an error. You can override the default behavior with the–a value option, in which case the monitor will return the valuespecified by the argument value.
363Tivoli Manager for Oracle** Reference Guide
4.A
sync
Mo
nito
rs

The ability to define a freeform SQL select statement allows for theintegration of existing performance monitoring tools (particularlythose reporting monitored values to internal Oracle tables within thesubscribing database).
See AlsoThe following monitors in this chapter: SQL Number —Background and Asynchronous.
The following monitor in the OracleDatabaseManager MonitoringCollection: SQL Number.
364 Version 2.0

SQL String — Background
CLI SyntaxfreeformsqlsBackground
–a <monitor name>
–a <SQL statement>
–a <index>
–a <return value>
The following briefly describes the arguments for this monitor.
<monitor name>Designates the name that you want to give to this monitor.
GUI Name: Monitor Label
<SQL statement>Specifies the selection and calculation criteria, in SQL*Plussyntax, of tables and columns for monitoring. Do notterminate the SQL statement with a semicolon (;), forwardslash (/), or backward slash (\).
GUI Name: SQL Statement
<index>Zero based; specifies the column number, within the firstrow returned, that is to contain the trigger value for themonitor.
GUI Name: Index
<return value>Specifies the value to be returned if no rows are returned<SQL statement>.
GUI Name: No Rows As
CLI Examplewaddmon ’OracleManagerAsync’ ’freeformsqlsBackground’-a ’SQL String Monitor’-a ’select one from dual’
365Tivoli Manager for Oracle** Reference Guide
4.A
sync
Mo
nito
rs

-a ’0’-a ’There were no rows returned!’-t ’1 hours’"ProfileName"
Suggested Monitoring ScheduleSite specific
GUI Data Entry FieldsThe following shows the GUI fields on the Add Monitor to TME10 Distributed Monitoring Profile dialog for the SQL String —Background monitor; a description of each field follows.
Monitor LabelDesignates the name that you want to give to this monitor.
SQL StatementSpecifies the selection and calculation criteria, in SQL*Plussyntax, of tables and columns for monitoring. Do notterminate the SQL statement with a semicolon (;), forwardslash (/), or backward slash (\).
Index Zero based; specifies the column number, within the firstrow returned, that is to contain the trigger value for themonitor.
No Rows AsSpecifies the value to be returned if no rows are returned<SQL statement>.
OutputNone
366 Version 2.0

SQL String — Asynchronous
CLI SyntaxfreeformsqlsAsync
CLI Examplewaddmon ’OracleManagerAsync’ ’freeformsqlsAsync’-c ’critical’-c ’severe’-c ’warning’-c ’normal’-c ’always’"ProfileName"
Suggested Response LevelsThere are no default actions for this monitor.
Monitors that are defined with this monitoring source use operatorsto evaluate data. For information about these operators, seeAppendix C, “Operator Groups (Monitor Triggers)” .
GUI Data Entry FieldsNone
OutputThe following shows an example output from this monitor.
367Tivoli Manager for Oracle** Reference Guide
4.A
sync
Mo
nito
rs

For a description of the monitor output, see “Understanding MonitorOutput” on page 6.
368 Version 2.0

Temporary Extents — Background andAsynchronous
DescriptionMonitors how close temporary segments are to their maximumextents limit (the ratio, as a percentage, of extents to the maximumextents limit).
A temporary segment is used whenever sorts are too large to beperformed in memory; that is, the amount of space required isgreater than the value of the init.ora parameter SORT_AREA_SIZE.Oracle creates a segment in the temporary tablespace of the userwho performs the sort operation.
Use the Temporary Extents — Background monitor to setarguments. Use the Temporary Extents — Asynchronous monitorto set the trigger and response criteria. You must use these twomonitors in conjunction for valid return values.
Authorization Roleoracle_user and user
Target EndpointOracleDatabaseManager
Views AccessedDBA_SEGMENTS
Usage NotesIf the number of extents for an object reaches the value of theMAXEXTENTS storage parameter, and the object needs to allocatean additional extent, the operation will fail. Check the storageparameters for the temporary tablespace, and ensure that they areappropriate for your applications.
Block Size MAXEXTENTS
1 KB 57
2 KB 121
369Tivoli Manager for Oracle** Reference Guide
4.A
sync
Mo
nito
rs

Block Size MAXEXTENTS
4 KB 249
8 KB 505
Over time, the temporary tablespace will become fragmented andshould be dropped and recreated periodically. You can reduce theamount of fragmentation by running the command:
alter tablespace [tablespacename] coalesce;
You can create a dedicated temporary tablespace, in which a singletemporary segment is created. This segment does not get droppedand avoids the costs associated with creating and dropping temporarysegments.
See AlsoThe following monitors in this chapter:Temporary Extents byTablespace — Background and Asynchronous and TemporaryExtents by User — Background and Asynchronous.
The following monitors in the OracleDatabaseManager MonitoringCollection: Free Tablespace by Tablespace
370 Version 2.0

Temporary Extents — Background
CLI SyntaxtemporaryextentsBackground
CLI Examplewaddmon ’OracleManagerAsync’ ’temporaryextentsBackground’-t ’10 minutes’"ProfileName"
Suggested Monitoring ScheduleEvery 10 minutes.
GUI Data Entry FieldsNone
OutputNone
371Tivoli Manager for Oracle** Reference Guide
4.A
sync
Mo
nito
rs

Temporary Extents — Asynchronous
CLI SyntaxtemporaryextentsAsync
CLI Examplewaddmon ’OracleManagerAsync’ ’temporaryextentsAsync’-c ’critical’ -R ’>’ ’95’ -n ’OracleManager Sentry’-c ’severe’ -R ’>’ ’85’ -n ’OracleManager Sentry’-c ’warning’ -R ’>’ ’75’ -n ’OracleManager Sentry’-c ’normal’-c ’always’"ProfileName"
Suggested Response LevelsThe following table shows suggested threshold values for severitylevels. See “Specifying Response Levels” in Chapter 6 of TivoliManager for Oracle User’s Guide.
Severity Trigger When Default Actions
Critical Greater than 95% used Send OracleManager Sentrynotice
Severe Greater than 85% used Send OracleManager Sentrynotice
Warning Greater than 75% used Send OracleManager Sentrynotice
Normal N/A None
Always N/A None
Monitors that are defined with this monitoring source use operatorsto evaluate data. For information about these operators, seeAppendix C, “Operator Groups (Monitor Triggers)” .
GUI Data Entry FieldsNone
372 Version 2.0

OutputThe following shows an example output from this monitor.
Segments are reported in descending order, based on the percentageof extents allocated, in the following format:
% Extents Allocated, Segment Name, Segment Owner, TablespaceName
For a description of the monitor output, see “Understanding MonitorOutput” on page 6.
373Tivoli Manager for Oracle** Reference Guide
4.A
sync
Mo
nito
rs

Temporary Extents by Tablespace — Backgroundand Asynchronous
DescriptionFor specified tablespaces, monitors how close temporary segmentsare to their maximum extents limit (the ratio, as a percentage, ofextents to the maximum extents limit).
A temporary segment is used whenever sorts are too large to beperformed in memory; that is, the amount of space required isgreater than the value of the init.ora parameter SORT_AREA_SIZE.Oracle creates a segment in the temporary tablespace of the userwho performs the sort operation.
Use the Temporary Extents by Tablespace — Backgroundmonitor to set arguments. Use the Temporary Extents byTablespace — Asynchronous monitor to set the trigger andresponse criteria. You must use these two monitors in conjunction forvalid return values.
Authorization Roleoracle_user and user
Target EndpointOracleDatabaseManager
Views AccessedDBA_SEGMENTS
Usage NotesIf the number of extents for an object reaches the value of theMAXEXTENTS storage parameter, and the object needs to allocatean additional extent, the operation will fail. Check the storageparameters for the temporary tablespace, and ensure that they areappropriate for your applications.
Block Size MAXEXTENTS
1 KB 57
374 Version 2.0

Block Size MAXEXTENTS
2 KB 121
4 KB 249
8 KB 505
Over time, the temporary tablespace will become fragmented andshould be dropped and recreated periodically. You can reduce theamount of fragmentation by running the command:
alter tablespace [tablespacename] coalesce;
You can create a dedicated temporary tablespace, in which a singletemporary segment is created. This segment does not get droppedand avoids the costs associated with creating and dropping temporarysegments.
See AlsoThe following monitors in this chapter: Temporary Extents —Background and Asynchronous and Temporary Extents by User— Background and Asynchronous.
The following monitor in the OracleDatabaseManager MonitoringCollection: Free Tablespace by Tablespace.
375Tivoli Manager for Oracle** Reference Guide
4.A
sync
Mo
nito
rs

Temporary Extents by Tablespace — Background
CLI SyntaxtemporaryextentstBackground
–a {in | not in}
–a <tablespaces>
The following briefly describes the arguments for this monitor.
{in | not in}Includes or excludes the contents of the tablespace namefield.
GUI Name: Include/Exclude
<tablespaces>Designates the tablespace names you want to include orexclude. Use space to separate names.
GUI Name: Tablespace Name
Note: Keywords have been defined for several classes ofPeopleSoft and SAP tables. When you enter one ofthe keywords as a tablespace, it calls all of the tablesassociated with the keyword. Using this approach mayslightly reduce system performance. Refer to theappendix titled “Best Practices Script” in the TivoliManager for Oracle User’s Guide.
CLI Examplewaddmon ’OracleManagerAsync’ ’temporaryextentstBackground’-a ’not in’-a ’users system’-t ’10 minutes’"ProfileName"
Suggested Monitoring ScheduleEvery 10 minutes
376 Version 2.0

GUI Data Entry FieldsThe following shows the GUI fields on the Add Monitor to TME10 Distributed Monitoring Profile dialog for the Temporaryextents by tablespace — Background monitor; a description ofeach field follows.
Include/ExcludeIncludes or excludes the contents of the tablespace namefield.
Tablespace NameDesignates the tablespace names you want to include orexclude. Use space to separate names.
Note: Keywords have been defined for several classes ofPeopleSoft and SAP tables. When you enter one ofthe keywords as a tablespace, it calls all of the tablesassociated with the keyword. Using this approach mayslightly reduce system performance. Refer to theappendix titled “Best Practices Script” in the TivoliManager for Oracle User’s Guide.
OutputNone
377Tivoli Manager for Oracle** Reference Guide
4.A
sync
Mo
nito
rs

Temporary Extents by Tablespace — Asynchronous
CLI SyntaxtemporaryextentstAsync
CLI Examplewaddmon ’OracleManagerAsync’ ’temporaryextentstAsync’-c ’critical’ -R ’>’ ’95’ -n ’OracleManager Sentry’-c ’severe’ -R ’>’ ’85’ -n ’OracleManager Sentry’-c ’warning’ -R ’>’ ’75’ -n ’OracleManager Sentry’-c ’normal’-c ’always’"ProfileName"
Suggested Response LevelsThe following table shows suggested threshold values for severitylevels. See “Specifying Response Levels” in Chapter 6 of TivoliManager for Oracle User’s Guide.
Severity Trigger When Default Actions
Critical Greater than 95% used Send OracleManager Sentrynotice
Severe Greater than 85% used Send OracleManager Sentrynotice
Warning Greater than 75% used Send OracleManager Sentrynotice
Normal N/A None
Always N/A None
Monitors that are defined with this monitoring source use operatorsto evaluate data. For information about these operators, seeAppendix C, “Operator Groups (Monitor Triggers)” .
GUI Data Entry FieldsNone
378 Version 2.0

OutputThe following shows an example output from this monitor.
The segment with the highest percentage of allocated extents, withinthe specified tablespaces, is reported as TRIGGER_INFO. Themonitor may also return additional temporary segments in theuserinfo lines. Segments are reported in descending order, based onthe percentage of extents allocated, in the following format:
% Extents Allocated, Segment Name, Segment Owner
For a description of the monitor output, see “Understanding MonitorOutput” on page 6.
379Tivoli Manager for Oracle** Reference Guide
4.A
sync
Mo
nito
rs
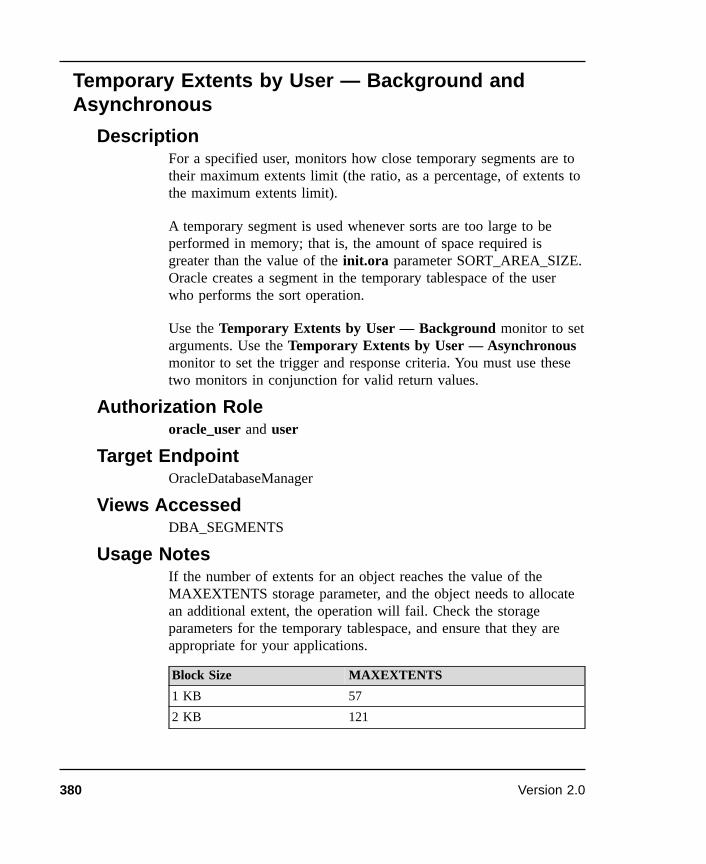
Temporary Extents by User — Background andAsynchronous
DescriptionFor a specified user, monitors how close temporary segments are totheir maximum extents limit (the ratio, as a percentage, of extents tothe maximum extents limit).
A temporary segment is used whenever sorts are too large to beperformed in memory; that is, the amount of space required isgreater than the value of the init.ora parameter SORT_AREA_SIZE.Oracle creates a segment in the temporary tablespace of the userwho performs the sort operation.
Use the Temporary Extents by User — Background monitor to setarguments. Use the Temporary Extents by User — Asynchronousmonitor to set the trigger and response criteria. You must use thesetwo monitors in conjunction for valid return values.
Authorization Roleoracle_user and user
Target EndpointOracleDatabaseManager
Views AccessedDBA_SEGMENTS
Usage NotesIf the number of extents for an object reaches the value of theMAXEXTENTS storage parameter, and the object needs to allocatean additional extent, the operation will fail. Check the storageparameters for the temporary tablespace, and ensure that they areappropriate for your applications.
Block Size MAXEXTENTS
1 KB 57
2 KB 121
380 Version 2.0

Block Size MAXEXTENTS
4 KB 249
8 KB 505
Over time, the temporary tablespace will become fragmented andshould be dropped and recreated periodically. You can reduce theamount of fragmentation by running the command:
alter tablespace [tablespacename] coalesce;
You can create a dedicated temporary tablespace, in which a singletemporary segment is created. This segment does not get droppedand avoids the costs associated with creating and dropping temporarysegments.
See AlsoThe following monitors in this chapter: Temporary Extents —Background and Asynchronous and Temporary Extents byTablespace — Background and Asynchronous.
The following monitor in the OracleDatabaseManager MonitoringCollection: Free Tablespace.
381Tivoli Manager for Oracle** Reference Guide
4.A
sync
Mo
nito
rs

Temporary Extents by User — Background
CLI SyntaxtemporaryextentsuBackground
–a <username>
The following briefly describes the argument for this monitor.
<username>Specifies the Oracle user name.
GUI Name: User Name
CLI Examplewaddmon ’OracleManagerAsync’ ’temporaryextentsuBackground’-a ’SYS’-t ’10 minutes’"ProfileName"
Suggested Monitoring ScheduleEvery 10 minutes
GUI Data Entry FieldsThe following shows the GUI fields on the Add Monitor to TME10 Distributed Monitoring Profile dialog for the Temporaryextents by user — Background monitor; a description of each fieldfollows.
User NameSpecifies the Oracle user name.
OutputNone
382 Version 2.0

Temporary Extents by User — Asynchronous
CLI SyntaxtemporaryextentsuAsync
CLI Examplewaddmon ’OracleManagerAsync’ ’temporaryextentsuAsync’-c ’critical’ -R ’>’ ’95’ -n ’OracleManager Sentry’-c ’severe’ -R ’>’ ’85’ -n ’OracleManager Sentry’-c ’warning’ -R ’>’ ’75’ -n ’OracleManager Sentry’-c ’normal’-c ’always’"ProfileName"
Suggested Response LevelsThe following table shows suggested threshold values for severitylevels. See “Specifying Response Levels” in Chapter 6 of TivoliManager for Oracle User’s Guide.
Severity Trigger When Default Actions
Critical Greater than 95% used Send OracleManager Sentrynotice
Severe Greater than 85% used Send OracleManager Sentrynotice
Warning Greater than 75% used Send OracleManager Sentrynotice
Normal N/A None
Always N/A None
Monitors that are defined with this monitoring source use operatorsto evaluate data. For information about these operators, seeAppendix C, “Operator Groups (Monitor Triggers)” .
GUI Data Entry FieldsNone
383Tivoli Manager for Oracle** Reference Guide
4.A
sync
Mo
nito
rs

OutputThe following shows an example output from this monitor.
The segment with the highest percentage of allocated extents for aspecified user is reported as TRIGGER_INFO. The monitor may alsoreturn additional temporary segments in the userinfo lines. Segmentsare reported in descending order, based on the percentage of extentsallocated, in the following format:
% Extents Allocated, Segment Name, Tablespace Name
For a description of the monitor output, see “Understanding MonitorOutput” on page 6.
384 Version 2.0

Unix SQL*Net V1 TCP/IP Listener — Background andAsynchronous
DescriptionThis monitor determines whether the UNIX SQL*Net Version 1TCP/IP listener process (orasrv) is running. If this process is notrunning, the machine cannot accept SQL*Net Version 1 TCP/IPconnections from any clients. This monitor returns one of thefollowing states: Is up/available, Is down/unavailable, Becomesavailable, and Becomes unavailable.
Note: For more information on the availability states for thismonitor, see Appendix C, “Operator Groups (MonitorTriggers)” .
Use the Unix SQL*Net V1 TCP/IP Listener — Backgroundmonitor to set arguments. Use the Unix SQL*Net V1 TCP/IPListener — Asynchronous monitor to set the trigger and responsecriteria. You must use these two monitors in conjunction for validreturn values.
Authorization Roleoracle_user and user
Target EndpointOracleDatabaseManager
Views AccessedNot applicable
Usage NotesThe trigger value can be set to Becomes unavailable, which willonly report an error when the listener goes down. This preventsmessages from appearing on an administrator’s desktop each timethe monitor is run and the listener is not running. The monitorchecks if the listener is running and whether it has hung by runningthe command tcpctl stat. You can restart the listener by logging inas the Oracle owner and typing tcpctl start. This monitor will onlywork if it is distributed to an endpoint that has the SQL*Net V1
385Tivoli Manager for Oracle** Reference Guide
4.A
sync
Mo
nito
rs

software installed, because it must be able to locate the$ORACLE_HOME/bin/tcpctl program. The monitor should only bedistributed once on each machine, regardless of the number of thedatabases on the machine.
Note: This monitor is only for UNIX systems. Do not run it onWindows NT.
See AlsoThe following monitors in this chapter: Unix SQL*Net V2 Listener— Background and Asynchronous.
The following monitor in the OracleDatabaseManager MonitoringCollection: NT Service Status.
386 Version 2.0

Unix SQL*Net V1 TCP/IP Listener — Background
CLI SyntaxnetonetcpipBackground
CLI Examplewaddmon ’OracleManagerAsync’ ’netonetcpipBackground’-t ’5 minutes’"ProfileName"
Suggested Monitoring ScheduleEvery 5 minutes
GUI Data Entry FieldsNone
OutputNone
387Tivoli Manager for Oracle** Reference Guide
4.A
sync
Mo
nito
rs

Unix SQL*Net V1 TCP/IP Listener — Asynchronous
CLI SyntaxnetonetcpipAsync
CLI Examplewaddmon ’OracleManagerAsync’ ’netonetcpipAsync’-c ’critical’ -R ’==’ ’down’ -n ’OracleManager Sentry’-c ’severe’-c ’warning’-c ’normal’-c ’always’"ProfileName"
Suggested Response LevelsThe following table shows suggested threshold values for severitylevels. See “Specifying Response Levels” in Chapter 6 of TivoliManager for Oracle User’s Guide.
Severity Trigger When Default Actions
Critical Is down/unavailable Send OracleManager Sentry notice
Severe N/A None
Warning N/A None
Normal N/A None
Always N/A None
Monitors that are defined with this monitoring source use operatorsto evaluate data. For information about these operators, seeAppendix C, “Operator Groups (Monitor Triggers)” .
GUI Data Entry FieldsNone
OutputNo output is available for this monitor.
Results for this monitor appear in the TRIGGER_INFO of the outputin the following format:
388 Version 2.0

Listener Name, TNS_Admin
For a description of the monitor output, see “Understanding MonitorOutput” on page 6.
389Tivoli Manager for Oracle** Reference Guide
4.A
sync
Mo
nito
rs

Unix SQL*Net V2 Listener — Background andAsynchronous
DescriptionThis monitor determines whether a UNIX SQL*Net Version 2listener process (tnslsnr) is running. If this process is not running,the machine cannot accept SQL*Net Version 2 connections from anyclients. This monitor returns one of the following states: Isup/available, Is down/unavailable, Becomes available, and Becomesunavailable.
Note: For more information on the availability states for thismonitor, see Appendix C, “Operator Groups (MonitorTriggers)” .
Use the Unix SQL *Net V2 Listener — Background monitor to setarguments. Use the Unix SQL *Net V2 Listener — Asynchronousmonitor to set the trigger and response criteria. You must use thesetwo monitors in conjunction for valid return values.
Authorization Roleoracle_user and user
Target EndpointOracleDatabaseManager
Views AccessedNot applicable
Usage NotesThe trigger value can be set to Becomes unavailable, which willonly report an error when the listener goes down. This preventsmessages from appearing on an administrator’s desktop each timethe monitor is run and the listener is not running. The monitorchecks if the listener is running, and whether it has hung, by runningthe command lsnrctl stat listener_name.
You can restart the listener by logging in as the Oracle owner andtyping lsnrctl start listener_name. If the TNS_ADMIN variable is
390 Version 2.0

set, the monitor will look in this location for the LISTENER.ORAfile. If this variable is not set, the LISTENER.ORA file should bein one of the standard locations; that is, /etc or /var/opt/oracle (thesame directory as the oratab file), or$ORACLE_HOME/network/admin. The monitor should only bedistributed once on each machine, regardless of the number ofdatabases on the machine.
If there are multiple listeners running, this monitor must beconfigured separately for each listener.
Note: For NT systems, use the NT service status monitor to checkwhether a SQL*Net listener is running.
See AlsoThe following monitors in this chapter: Unix SQL*Net V1 TCP/IPListener — Background and Asynchronous.
The following monitor in the OracleDatabaseManager MonitoringCollection: NT Service Status.
391Tivoli Manager for Oracle** Reference Guide
4.A
sync
Mo
nito
rs

Unix SQL *Net V2 Listener — Background
CLI SyntaxnettwolistenerBackground
–a <listener_name>
The following briefly describes the argument for this monitor.
<listener_name>Specifies the name of a SQL*Net listener. You can leave thisblank if only one listener is running.
GUI Name: Listener Name
CLI Examplewaddmon ’OracleManagerAsync’ ’nettwolistenerBackground’-a ’listener’-t ’5 minutes’"ProfileName"
Suggested Monitoring ScheduleEvery 5 minutes
GUI Data Entry Fields
Listener NameSpecifies the name of a SQL*Net listener. You can leave thisblank if only one listener is running.
OutputNone
392 Version 2.0

Unix SQL *Net V2 Listener — Asynchronous
CLI SyntaxnettwolistenerAsync
CLI Examplewaddmon ’OracleManagerAsync’ ’nettwolistenerAsync’-c ’critical’ -R ’==’ ’down’ -n ’OracleManager Sentry’-c ’severe’-c ’warning’-c ’normal’-c ’always’"ProfileName"
Suggested Response LevelsThe following table shows suggested threshold values for severitylevels. See “Specifying Response Levels” in Chapter 6 of TivoliManager for Oracle User’s Guide.
Severity Trigger When Default Actions
Critical Is down/unavailable Send OracleManager Sentry notice
Severe N/A None
Warning N/A None
Normal N/A None
Always N/A None
Because the listener has only two states (running or not running),only one response level is set. If the listener is not running, it isconsidered to be a serious problem, so you may want to choose thecritical response level. If the listener is not running, the followingevents will occur:
¶ A notice will be sent to the OracleManager Sentry noticegroup.
¶ An alert will be displayed on an administrator’s desktop.
¶ An e-mail message will be sent to an administrator.
¶ A program will be run to restart the listener.
393Tivoli Manager for Oracle** Reference Guide
4.A
sync
Mo
nito
rs

Monitors that are defined with this monitoring source use operatorsto evaluate data. For information about these operators, seeAppendix C, “Operator Groups (Monitor Triggers)” .
GUI Data Entry FieldsNone
OutputThe following shows an example output from this monitor.
Results for this monitor appear in the TRIGGER_INFO in thefollowing format:
Listener Name, TNS_Admin
For a description of the monitor output, see “Understanding MonitorOutput” on page 6.
394 Version 2.0

Tasks
The OracleManagerTasks task library contains a set of predefinedOracle tasks. A task is an operation or set of operations that isperformed routinely.
This chapter includes the following information:
¶ Tasks listed by GUI name and CLI name
¶ Task dialogs used by all tasks
¶ A description of each task in the task library
Refer to the Tivoli Manager for Oracle User’s Guide for informationon running and customizing tasks.
Refer to the Tivoli Management Framework Reference Manual forinformation on the wruntask command.
List of Tasks by GUI and CLI NamesThe following table lists the tasks by their GUI and CLI names.
GUI Name CLI Name
ConfigureTECOracle ConfigureTECOracle
CurrentRunningSQL CurrentRunningSQL
DisableMonitoring DisableMonitoring
EnableMonitoring EnableMonitoring
Listener Listener
5
395Tivoli Manager for Oracle** Reference Guide
5.Tasks

Common Task DialogsTwo dialogs are used by all tasks.
¶ When you press the Report to File button on a task argumentdialog, the system displays the Create a Report File dialog.
¶ When you press the Notify TEC button on a task argumentdialog, the system displays the TEC dialog.
Using the Create a Report File DialogUse the Create a Report File dialog to save the task outputinformation in a file. This option offers the following advantagesover the Save to File option:
¶ You can choose to send the task output to the monitored host, oryou can specify a host. (This is similar to the options offered byDistributed Monitoring.)
¶ You can display a drop-down list of available hosts.
¶ You can use a default path and file name from the GUI.
¶ You will always get output. The Save to File option may timeout before the task finishes, but Create a Report File does not.
To display the dialog, you click Report to File in a task’s taskarguments dialog.
396 Version 2.0

The following shows the Create a Report File dialog; a descriptionof each field follows.
Report to fileTells Tivoli Manager for Oracle to save the outputinformation for the task as a file when the box is checked.
Path and file nameDesignates the directory path to and the file name of theoutput file. The output file name is the name specified in thePath and file name field.
This field displays a list of variables as the default response.All variables, except WTEMP, are local to the endpointrunning the task. You can use some or all of the variables, oryou can enter your own specific information. The variablesinclude:
${DATE} is the current date in YYYYMMDD format.
${TIME} is the current time in HHMMSS format.
${NODE} is the name of the managed node (host) the taskwas run on. Although this information is also included in${ENDPOINT}, using a separate variable, such as ${NODE},makes it easier to sort.
${TASK} is the task CLI name, such as DisableMonitoring.
${ENDPOINT} is the name of the endpoint the task was runon.
397Tivoli Manager for Oracle** Reference Guide
5.Tasks

${WTEMP} is a temporary directory on the managed nodeon which to save the file. The task uses the wtempcommand to identify this directory.
On monitored hostCreates the output file on the monitored host the task wasrun against. (Mutually exclusive with On specified host.)
On specified hostCreates the output file on a specified host, which youdesignate in the Host name field; you cannot save outputfiles on multiple hosts. (Mutually exclusive with Onmonitored host.)
Host NameDisplays a list of host names so you can select the hostcomputer on which to save the output file. Use this fieldwith the On specified host field.
Using the TEC DialogThe TEC dialog sends the task success or failure status to the TivoliEnterprise Console event server. The following shows the TECdialog; a description of each field follows.
Send task success/failure status to TECSends a message to the TEC to report if the task succeededor failed when the box is checked.
Select TEC serverDisplays a list of available TEC servers. You can choose oneof these to send the message to.
398 Version 2.0

ConfigureTECOracle
DescriptionProvides Tivoli Enterprise Console (TEC) configuration options. Youcan configure TEC to receive events from the following:
¶ Distributed monitors (OracleDatabaseManager,OracleInstanceManager, and OracleManagerAsync monitors)
¶ Tasks (OracleManagerTasks tasks)
The task adds the class and rule set definitions of the selectedconfiguration option to a valid rule base, if the class and rule setdefinitions are not already defined in the specified rule base. Formore information, see the Tivoli Manager for Oracle User’s Guide.
Before you run this task, the following software must be installed:
¶ Tivoli Enterprise Console (TEC) Event Server
¶ Tivoli Manager for Oracle on the Tivoli Management Region(TMR) server of the TMR on which you want to run this task.
ConfigureTECOracle does the following, depending on the optionsyou choose:
¶ Creates a rule base in the directory where TEC is installed.
¶ Provides TEC configuration for the specified options. It addsclass and rule set definitions to a valid rule base for the options,if they are not already defined in the specified rule base.
¶ Copies a specified rule base into the newly created rule base.
¶ Creates event groups.
¶ Adds filters to an event group for the TEC configuration optionsspecified.
¶ Loads the rule base.
¶ Restarts the event server.
Authorization Rolesenior and oracle_dba (must have both roles)
399Tivoli Manager for Oracle** Reference Guide
5.Tasks

Target EndpointManaged node (where the event server is installed)
GUI Data Entry FieldsThe following shows the ConfigureTECOracle dialog; a descriptionof each field follows.
Rule Base NameName of the rule base to configure. This can be the newname for a rule base that you want to create or the name ofan existing rule base. If you specify an existing rule base,ConfigureTECOracle checks to make sure both its classand rule set files are defined correctly. Enter only the name;a full path is ignored. A rule base consists of a set ofexpressions (rule set files) used by the event server todetermine if an event meets the rule conditions. The rulesmay also define a set of actions that are taken when an eventmeets the specified rule conditions.
Copy Rule BaseUses an existing rule base as the basis for the rule base youare setting up for this configuration option.
400 Version 2.0

Rule Base to CopyName of the rule base to copy. If you leave this field blankafter selecting the Copy Rule Base check box, the task usesthe Default rule base. If you use a rule base other thanDefault, it must be a valid rule base.
The Default rule base contains correctly defined defaultclasses. Although Tivoli Manager for Oracle does not needthese classes, other applications (such as adapters) canrequire them.
Create Event GroupAn event group is a configured logical area of responsibility.An event group is used to notify users that an event thatmatches a specified set of criteria has occurred. Event groupsare configured on the event server to create a single alarmindicator that represents many different, but related, events.Each event group has its own icon on the event console.
Event Group NameName of the event group that you create. If you select theCreate Event Group check box and do not enter an eventgroup name, the task creates and configures an event groupcalled OracleEventBase. If you specify an existing eventgroup, the task configures the event group that you named.
Event Server option to configureTo set up an event group, you must define the selectioncriteria of the events you want to monitor. This dataconstitutes an event group filter. You can select from thefollowing two predefined filters to add to the Event GroupName specified elsewhere in this dialog (see Event GroupName).
¶ Configure Event Server for Distributed Monitoring— enables the event server to receive all events sentfrom the OracleDatabaseManager,OracleInstanceManager, and OracleManagerAsyncmonitors.
401Tivoli Manager for Oracle** Reference Guide
5.Tasks

¶ Configure Event Server for Tasks — enables the eventserver to receive all events sent fromOracleManagerTasks tasks.
Restart Event ServerLoads the rule base and starts the event server, if it is notalready running. When you create a new rule base or modifyan existing one, you must restart the event server for anyrule base configurations to take effect.
If the event server is not running, this task starts it. If theevent server is running, this task stops and restarts it. If youdo not use the task to restart the event server, you must loadthe rule base and restart the event server manually. (See theTivoli Enterprise Console User’s Guide for information onhow to do this.) For best results include the following:
Report to FileDisplays the Create a Report File dialog so that you cansave the output information for this task to a file.
Notify TECDisplays the TEC dialog so that you can forward the successor failure of the task to a TEC server.
CLI Syntax
ConfigureTECOracle–a RuleBaseName = <rulebasename>[–a CreateEventGroup = {Y | N}[–a EventGroupName = <eventgroupname>]][–a CopyBase = {Y | N}[–a CopyBaseName = <rulebasetocopy>]]{[–a ConfigureForDM = {Y | N}][–a ConfigureForTask = {Y | N}]}[–a RestartServer = {Y | N}][–a NotifyTEC = {Y | N}[–a TECServer = <servername>]][–a ReportToFile = {Y | N}[–a ReportFileName = <filename>]
402 Version 2.0

[–a SaveReportFileOn = {MonitoredHost | SpecifiedHost}[–a ReportHostName = <hostname>]]]
where:
RuleBaseName<rulebasename> is the name to give to the rule base.
GUI Name: Rule Base Name
CreateEventGroupY creates an event group and is the default. N does notcreate an event group.
GUI Name: Create Event Group
EventGroupName<eventgroupname> is the name to give to the event groupthat you are creating.
GUI Name: Event Group Name
CopyBaseY uses an existing rule base as the basis for the rule baseyou are setting up. N does not use the existing rule base.
GUI Name: Copy Rule Base
CopyBaseName<rulebasetocopy> is the name of the rule base to copy.
GUI Name: Rule Base to Copy
ConfigureForDMY enables the event server to receive all events sent from theOracleDatabaseManager, OracleInstanceManager, andOracleManagerAsync monitors. N does not set this option.
GUI Name: Configure Event Server for DistributedMonitoring
ConfigureForTaskY enables the event server to receive all events sent fromOracleManagerTasks tasks. N does not set this option.
GUI Name: Configure Event Server for Tasks
403Tivoli Manager for Oracle** Reference Guide
5.Tasks

RestartServerY restarts the server. N does not restart the server.
GUI Name: Restart Event Server
NotifyTECY sends the success or failure message to the TEC. N doesnot send the success or failure message to TEC. The defaultis N. If you specify Y, specify a valid TECServer argumentor no message is sent.
TECServer<servername> the name of the TEC server to send themessage to.
ReportToFileY saves the output of this task to a file. N does not save theoutput of this task to a file and is the default. If Y, specifythe file with ReportFileName and, optionally, the host withSaveReportFileOn.
ReportFileName<filename> is the path to and the name of the file to createas the task output.
SaveReportFileOnMonitoredHost puts the output file on the host the task wasrun against. SpecifiedHost puts the output file on a specifiedhost. Specify the host with ReportHostName.
ReportHostName<hostname> is the name of the host on which to save thefile created when you use the SpecifiedHost argument.
CLI Examplewruntask-t ConfigureTECOracle-l "OracleManagerTasks"-h @ManagedNode:nemuchay-a RuleBaseName=OracleBase1-a CopyBase=Y-a CopyBaseName=Default
404 Version 2.0

-a CreateEventGroup=Y-a EventGroupName=OracleEventBase1-a ConfigureForDM=Y-a ConfigureForTask=Y
OutputThe following displays the output for this task.
Usage NotesYou must restart the event server after defining new classes so thatTEC can recognize and display instances of classes. Because eachcommand defines new classes, you must stop and restart the eventserver for each instance of these defined classes.
405Tivoli Manager for Oracle** Reference Guide
5.Tasks

See AlsoThe following commands in the Tivoli Management FrameworkReference Manual: wruntask, wcrttask, wcrtjob and wgettask.
406 Version 2.0

CurrentRunningSQL
DescriptionShows current SQL statements for one or all users connected to anOracle database. This task provides a means of identifying problemSQL statements or SQL statements that need to be optimized inorder to improve overall database performance.
Authorization Roleoracle_dba, oracle_monitor, oracle_user and senior
Target EndpointTMA Endpoint
GUI Data Entry FieldsThe following shows the CurrentRunningSQL dialog box; adescription of each field follows.
Selection TypeAll shows the SQL for all connected users.
ByUser shows the SQL for one user, which you specify inthe User Name text box.
User NameSpecifies the user for whom you want to show the currentSQL statement.
407Tivoli Manager for Oracle** Reference Guide
5.Tasks

CLI Syntax
CurrentRunningSQL–a SelectionType = {All | ByUser}[–a UserName = <user_name>][–a NotifyTEC = {Y | N}[–a TECServer = <servername>]][–a ReportToFile = {Y | N}[–a ReportFileName = <filename>][–a SaveReportFileOn = {MonitoredHost | SpecifiedHost}[–a ReportHostName = <hostname>]]]
where:
SelectionTypeAll specifies that you want to display the current SQLstatements for all users.
ByUser specifies that you want to display the SQL statementfor a specific user account.
UserName<user_name> specifies the user for whom you want to showthe current SQL statement.
NotifyTECY sends the success or failure message to the TEC. N doesnot send the success or failure message to TEC. The defaultis N. If you specify Y, specify a valid TECServer argumentor no message is sent.
TECServer<servername> is the name of the TEC server to send themessage to.
ReportToFileY saves the output of this task to a file. N does not save theoutput of this task to a file and is the default. If Y, specifythe file with ReportFileName and, optionally, the host withSaveReportFileOn.
408 Version 2.0

ReportFileName<filename> is the path to and the name of the file to createas the task output.
SaveReportFileOnMonitoredHost puts the output file on the host the task wasrun against. SpecifiedHost puts the output file on a specifiedhost. Specify the host with ReportHostName.
ReportHostName<hostname> is the name of the host on which to save thefile created when you use the SpecifiedHost argument.
CLI ExampleThe following example shows the current running SQL for the userSYS.wruntask-t CurrentRunningSQL-l OracleManagerTasks-h @OracleDatabaseManager:v816@manzana-o 15-a SelectionType=All-a UserName="SYS"
409Tivoli Manager for Oracle** Reference Guide
5.Tasks

OutputThe following displays the output for this task.
Usage NotesMost system performance problems are caused by poorly writtenSQL and PL/SQL statements. This task enables the DBA to identifySQL statements that are most frequently executed during the courseof an applications execution. Analysis and optimization of the SQLstatement can improve application performance.
See AlsoThe following commands in the Tivoli Management FrameworkReference Manual: wruntask, wcrttask, wcrtjob and wgettask.
410 Version 2.0

DisableMonitoring
DescriptionDisables any monitors that are running on an Oracle database orinstance endpoint and optionally shuts down the database.
Authorization Roleoracle_dba and senior
Target EndpointTMA Endpoint
GUI Data Entry FieldsThe following shows the DisableMonitoring dialog; a description ofeach field follows.
Shutdown Displays a list of the shutdown options thatdetermine what happens to the database when themonitors are disabled.
¶ Abort — Specifies that the database will beaborted.
¶ Immediate — Specifies that the database willshut down immediately.
¶ NoShutdown — Specifies that the database willnot be shut down.
¶ Normal — Specifies that the database will shutdown normally.
411Tivoli Manager for Oracle** Reference Guide
5.Tasks

¶ Transactional — Allows active transactions tocomplete before shutting down the database.
CLI Syntax
DisableMonitoring–a ShutdownOption = {Abort | Immediate | NoShutdown |Normal | Transactional}[–a NotifyTEC = {Y | N}[–a TECServer = <servername>]][–a ReportToFile = {Y | N}[–a ReportFileName = <filename>][–a SaveReportFileOn = {MonitoredHost | SpecifiedHost}[–a ReportHostName = <hostname>]]]
where:
ShutdownOptionSpecifies what happens to the database when the monitorsare disabled. See the description in the GUI Data EntryFields section.
NotifyTECY sends the success or failure message to the TEC. N doesnot send the success or failure message to TEC. The defaultis N. If you specify Y, specify a valid TECServer argumentor no message is sent.
TECServer<servername> the name of the TEC server to send themessage to.
ReportToFileY saves the output of this task to a file. N does not save theoutput of this task to a file and is the default. If Y, specifythe file with ReportFileName and, optionally, the host withSaveReportFileOn.
ReportFileName<filename> is the path to and the name of the file to createas the task output.
412 Version 2.0

SaveReportFileOnMonitoredHost puts the output file on the host the task wasrun against. SpecifiedHost puts the output file on a specifiedhost. Specify the host with ReportHostName.
ReportHostName<hostname> is the name of the host on which to save thefile created when you use the SpecifiedHost argument.
CLI ExampleThe following example disables Oracle monitors running against thedatabase v816@manzana, but does not shut down the database.wruntask-t DisableMonitoring-l OracleManagerTasks-h @OracleDatabase:v816@manzana-o 15-a ShutdownOption=NoShutdown
413Tivoli Manager for Oracle** Reference Guide
5.Tasks

OutputThe following displays the output for this task.
Usage NotesThis task disables any monitors that are running on the Oracledatabase or instance endpoint and optionally shuts down thedatabase. This is useful if the database is taken down formaintenance purposes. If this task is not run, the user must manuallydisable all monitors to prevent spurious alerts from firing. In aspurious alert, monitors give errors because they are unable toconnect to the database endpoint. When this task is run, theDistributed Monitoring engine is updated to disable the monitors, butdistributed monitoring profiles are not updated and may still showthe monitors as enabled. To selectively disable monitors, edit anddistribute the relevant distributed monitoring profiles rather thanrunning this task.
414 Version 2.0

See AlsoThe following commands in the Tivoli Management FrameworkReference Manual: wruntask, wcrttask, wcrtjob, and wgettask.
415Tivoli Manager for Oracle** Reference Guide
5.Tasks

EnableMonitoring
DescriptionEnables previously disabled monitors by directly updating theDistributed Monitoring engine at the endpoint and, optionally,starting the database.
Authorization Roleoracle_dba and senior
Target EndpointTMA Endpoint
GUI Data Entry FieldsThe following shows the EnableMonitoring dialog; a description ofeach field follows.
StartupDisplays the startup options that determine what will happento the database when the monitors are enabled. If yourOracle server allows multiple instances to access a singledatabase concurrently, specify whether to start the instance inExclusive or Parallel mode. NoStartup does not start up thedatabase.
CLI Syntax
EnableMonitoring–a StartupOption = {Exclusive | Parallel | NoStartup}[–a NotifyTEC = {Y | N}
416 Version 2.0

[–a TECServer = <servername>]][–a ReportToFile = {Y | N}[–a ReportFileName = <filename>][–a SaveReportFileOn = {MonitoredHost | SpecifiedHost}[–a ReportHostName = <hostname>]]]
where:
StartupOptionIf your Oracle server allows multiple instances to access asingle database concurrently, specify whether to start theinstance in Exclusive or Parallel mode. NoStartup does notstart up the database.
NotifyTECY sends the success or failure message to the TEC. N doesnot send the success or failure message to TEC. The defaultis N. If you specify Y, specify a valid TECServer argumentor no message is sent.
TECServer<servername> is the name of the TEC server to send themessage to.
ReportToFileY saves the output of this task to a file. N does not save theoutput of this task to a file and is the default. If Y, specifythe file with ReportFileName and, optionally, the host withSaveReportFileOn.
ReportFileName<filename> is the path to and the name of the file to createas the task output.
SaveReportFileOnMonitoredHost puts the output file on the host the task wasrun against. SpecifiedHost puts the output file on a specifiedhost. Specify the host with ReportHostName.
ReportHostName<hostname> is the name of the host on which to save thefile created when you use the SpecifiedHost argument.
417Tivoli Manager for Oracle** Reference Guide
5.Tasks

CLI ExampleThe following example enables Oracle monitors that are runningagainst the database v816@manzana, but does not start thedatabase.wruntask-t EnableMonitoring-l OracleManagerTasks-h @OracleDatabase:v816@manzana-o 15-a StartupOption=NoStartup
OutputThe following displays the output for this task.
Usage NotesThis task enables previously disabled monitors by directly updatingthe Distributed Monitoring engine at the endpoint. It does not alterthe monitor state in distributed monitoring profiles. The task onlyenables monitors that were previously disabled by theDisableMonitoring task. The task also optionally starts up the OracleDatabase endpoint.
418 Version 2.0

See AlsoThe following commands in the Tivoli Management FrameworkReference Manual: wruntask, wcrttask, wcrtjob, and wgettask.
419Tivoli Manager for Oracle** Reference Guide
5.Tasks

Listener
DescriptionStarts or stops the Oracle Listener. The Oracle Listener is a processon the Oracle server that listens for connection requests from clients.
Authorization Roleoracle_dba and senior
Target EndpointTMA Endpoint
GUI Data Entry FieldsThe following shows the Listener dialog; a description of each fieldfollows.
Set listener stateStarts or stops the Oracle Listener.
Start listener specifies that the listener process will bestarted.
Stop listener specifies that the listener process will bestopped.
Name Specifies the name of the specific listener that will be started
420 Version 2.0

or stopped. The default listener name,listener, is displayedautomatically in the Name text box.
PasswordSpecifies the password required to stop a listener process asspecified in Oracle.
Note: The value entered in this field must match the valueassigned to the PASSWORDS_LISTENER parameterin the Administrator’s listener.ORA file. Thelistener.ORA file is located in the installed Oracledirectory.
CLI Syntax
Listener–a listener_mode = {Start Listener | Stop Listener}[–a listener_name = <listener_name>][–a listener_password = <listener_password>]
where:
listener_modeSpecifies whether to start or stop the listener function on theOracle Server.
listener_nameThe name of the Oracle Listener as defined by the OracleAdministrator. The default value for this parameter is“ listener.”
listener_passwordSpecifies the password required to stop a listener process asspecified in Oracle.
Note: The value entered in this field must match the valueassigned to the PASSWORDS_LISTENER parameterin the Administrator’s listener.ORA file. Thelistener.ORA file is located in the installed Oracledirectory.
421Tivoli Manager for Oracle** Reference Guide
5.Tasks

CLI Examplewruntask -t Listener-l OracleManagerTasks-h @OracleDatabase:v816@manzana-o 15-a listener_mode="Start Listener"-a listener_name="ohioServer"-a listener_password="swordfish"
OutputThe following displays example output for this task.
Usage NotesThe Listener utility in Oracle establishes listen endpoints on amachine. These listen endpoints are addresses that clients and serversuse to connect to a database. The Listener task is used to start andstop the Listener utility in Oracle. Tivoli uses Oracle’s “ lsnrctl”utility to start and stop the Listener.
422 Version 2.0

The Oracle Listener is capable of supporting multiple Oracleinstances or one instance per Listener depending on the Oracleconfiguration.
See AlsoThe following commands in the Tivoli Management FrameworkReference Manual: wruntask, wcrttask, wcrtjob, and wgettask.
423Tivoli Manager for Oracle** Reference Guide
5.Tasks

424 Version 2.0

Running Tivoli Commands
Most Tivoli commands are run within a shell on a managed node oron a Tivoli Management Region (TMR) server. A shell is acommand interpreter that enables the operating system to processcommands. You can run commands from a shell’s command line orinclude them in shell scripts, on either UNIX or Windows NToperating systems.
Before running Tivoli commands, you must set the Tivolienvironment variables for the shell. The managed node or TMRserver installation process supplies the scripts to set the Tivolienvironment variables. The procedures to run these scripts aredescribed in “Setting the Tivoli Environment on UNIX” on page 427and “Setting the Tivoli Environment on Windows NT” on page 428.
You must also have the appropriate Tivoli authorization role forrunning each command. The Tivoli authorization role required forrunning a command is specified in the reference information for thecommand.
Note: A few Tivoli commands can run on an endpoint. To set theTivoli environment variables on an endpoint, see“Establishing the Tivoli Environment on an Endpoint” onpage 428.
A
425Tivoli Manager for Oracle** Reference Guide
A.
Ru
nn
ing
Tivoli
Co
mm
and
s

Running Tivoli Commands on UNIXShells are provided with UNIX operating systems. Tivoli commandscan run in the Bourne, Korn, C, and bash shells. The Bourne shell isconsidered the standard UNIX shell and is included with everyUNIX system. The Korn shell supports the features of the Bourneshell plus it has extensions applicable only to the Korn shell. The Cshell is so named because of its closeness to C programminglanguage syntax. The bash shell supports many features of the UNIXshells and can be used on both UNIX and Windows NT systems.
Running Tivoli Commands on Windows NTWhen you install a Windows NT managed node or Windows NTTMR server, the installation process copies the bash shell executablefile to the machine. The bash shell supports many UNIX commandsand UNIX command syntax; for example, the forward slash (/) forthe directory separator. The bash shell supports the features of theBourne shell plus it has some extensions applicable only to the bashshell.
Note: You can use the Windows NT MS-DOS shell instead of thebash shell to run most Tivoli commands (after you set theTivoli environment variables with the%SystemRoot%\system32\drivers\etc\Tivoli\setup_envcommand). However, some commands and Tivoli tasks mayrequire a bash shell to run successfully. All examples ofTivoli commands in Tivoli publications are shown using bashshell syntax.
Where to Find Additional Information about ShellsThe following lists include resources where you can find additionalinformation about the various shells. These resources were availableat the time the lists were created. The lists do not show all of thematerial that is available, and Tivoli does not provide opinions orrecommendations about any of these resources.
UNIX shells:
426 Version 2.0

¶ UNIX in a Nutshell: A Desktop Quick Reference for System VRelease 4 and Solaris 7 (O’Reilly Nutshell handbook) by ArnoldRobbins. ISBN: 1-56592-427-4.
¶ Portable Shell Programming: An Extensive Collection of BourneShell Examples by Bruce Blinn. ISBN: 0-13-451494-7.
¶ Learning the Korn Shell (O’Reilly Nutshell handbook) by BillRosenblatt and Mike Loukides. ISBN: 1-56592-054-6.
¶ UNIX C Shell Desk Reference by Martin Arick. ISBN:0-47-155680-7.
Bash shell:
¶ Learning the bash Shell (O’Reilly Nutshell handbook) byCameron Newham and Bill Rosenblatt. ISBN: 1-56592-347-2.
¶ A Brief Introduction to the bash Shell by Jane Anna Langley.http://www.cs.ups.edu/acl/unix_talk/bash.html
¶ Bash FAQ (GNU documentation).http://www.delorie.com/gnu/docs/bash/FAQ
¶ Bash Reference Manual (GNU documentation).http://www.gnu.org/manual/bash/index.html
¶ bash command reference information (GNU documentation).http://www.delorie.com/gnu/docs/bash/bash.1.html
Establishing the Tivoli Environment within a ShellWhen you install a managed node or TMR server, the installationprocess supplies shell setup scripts. You use these scripts to set theenvironment variables needed for running Tivoli commands.
Setting the Tivoli Environment on UNIXThe following steps describe how to set the Tivoli environmentwithin a UNIX shell:
1. Log in to a UNIX managed node or TMR server.
2. Run the appropriate setup script for the shell.
For the Bourne, Korn, or bash shell, run the following command:
427Tivoli Manager for Oracle** Reference Guide
A.
Ru
nn
ing
Tivoli
Co
mm
and
s

. /etc/Tivoli/setup_env.sh
For the C shell, run the following command:source /etc/Tivoli/setup_env.csh
Setting the Tivoli Environment on Windows NTThe following steps describe how to set the Tivoli environment andstart a bash shell on Windows NT.
Note: The location of the setup scripts in the following steps assumethat the default port number of 94 was set for the objectdispatcher during the installation of a managed node or TMRserver. If a nondefault port number is used, the port number ispart of the Tivoli subdirectory name. For example, if port8613 is used, the setup_env.cmd command is located in the%SystemRoot%\system32\drivers\etc\Tivoli-8613 directory.
1. Log in to a Windows NT managed node or TMR server.
2. Open a command window.
3. Run the following command in the command window to setTivoli environment variables:%SystemRoot%\system32\drivers\etc\Tivoli\setup_env.cmd
4. Run either of the following commands in the command windowto start the bash shell:sh
—OR—bash
Establishing the Tivoli Environment on an EndpointWhen you install an endpoint, the installation process supplies setupscripts. You use these scripts to set the environment variables neededfor running Tivoli commands on an endpoint.
The following steps describe how to set the Tivoli environment onan endpoint:
1. Log in to an endpoint.
428 Version 2.0
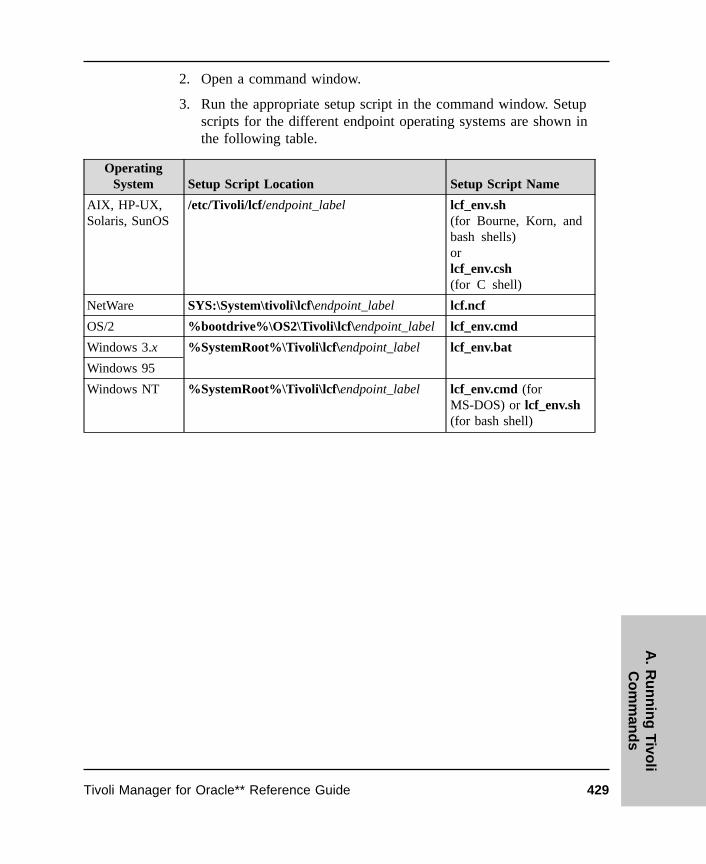
2. Open a command window.
3. Run the appropriate setup script in the command window. Setupscripts for the different endpoint operating systems are shown inthe following table.
OperatingSystem Setup Script Location Setup Script Name
AIX, HP-UX,Solaris, SunOS
/etc/Tivoli/lcf/endpoint_label lcf_env.sh(for Bourne, Korn, andbash shells)orlcf_env.csh(for C shell)
NetWare SYS:\System\tivoli\lcf\endpoint_label lcf.ncf
OS/2 %bootdrive%\OS2\Tivoli\lcf\endpoint_label lcf_env.cmd
Windows 3.x %SystemRoot%\Tivoli\lcf\endpoint_label lcf_env.bat
Windows 95
Windows NT %SystemRoot%\Tivoli\lcf\endpoint_label lcf_env.cmd (forMS-DOS) or lcf_env.sh(for bash shell)
429Tivoli Manager for Oracle** Reference Guide
A.
Ru
nn
ing
Tivoli
Co
mm
and
s

430 Version 2.0

Classes of Instance Monitors
The instance monitors can be divided into classes, depending on thetype of data collected and how the data relates to data collected atprevious times. Some monitors may be in more than one class. Theclasses are as follows:
Cache Provides information about cache performance. Do not use acache monitor until the instance has run long enough to havea representative workload. When an instance is started, theOracle caches are empty and the cache hit rate is low, sorunning the monitor at this time returns misleading results.
CumulativeProvides information about values for the lifetime of theinstance. All monitors not listed as Point in Time or Intervalmonitors are classed as Cumulative monitors. You can usethe cumulative monitors for capacity planning and trendanalysis.
IntervalProvides information about values for the current monitoringinterval.
Point in TimeTakes a snapshot of the instance at a point in time that youspecify.
Rate-basedCalculates the number of gets or calls for the currentmonitoring interval and divides this by the time in seconds.The rate cannot be calculated the first time the monitor is
B
431Tivoli Manager for Oracle** Reference Guide
B.
Classes
of
Instan
ceM
on
itors

run, because there are no values to compare against. In thiscase, the following text is output on the userinfo lines:!!RATE_BASED_MONITOR_STARTUP!!
Cache MonitorsThe following are cache monitors:
Monitor Name Collection
Buffer Cache Hit Ratio OracleInstanceManager
Buffer Cache Hit Ratio (Interval) OracleInstanceManager
Dictionary Cache Hit Ratio OracleInstanceManager
Dictionary Cache Hit Ratio (Interval) OracleInstanceManager
Library Cache Hit Ratio OracleInstanceManager
Library Cache Hit Ratio (Interval) OracleInstanceManager
Cumulative MonitorsAll monitors not listed as Point in Time or Interval are classed asCumulative monitors. The following example shows how the BufferCache Hit Ratio monitor is calculated.
Logical Reads Physical Reads Time
1000 100 10:00:00
2000 150 10:10:00
3000 300 10:20:00
¶ The monitoring interval is 10 minutes.
¶ The hit ratio is calculated at time T1 as: (Logical Reads -Physical Reads) / Logical Reads
¶ At 10:00:00 the hit ratio is calculated as:
(1000 - 100) / 1000 = 0.90
Note: This is the same as the interval ratio.
¶ At 10:10:00 the hit ratio is calculated as:
432 Version 2.0

(2000 - 150) / 2000 = 0.925
T1 = 10:10:00
¶ At 10:20:00 the hit ratio is calculated as:
(3000 - 300) / 3000 = 0.90
T1 = 10:20:00
Compare the Buffer Cache Hit Ratio values with the Buffer CacheHit Ratio (Interval) values shown in the Interval section.
You also can use monitors that return a single value (such asCompleted Background Checkpoints) rather than a ratio (RowSource Ratio) as Interval monitors by using the Increase oforsimilar numeric operators. See “Operator Groups (MonitorTriggers).″
Interval MonitorsThe following are interval monitors:
Monitor Name Collection
Buffer Cache Hit Ratio (Interval) OracleInstanceManager
Dictionary Cache Hit Ratio (Interval) OracleInstanceManager
Library Cache Hit Ratio (Interval) OracleInstanceManager
Long Table Full Table Scans (Interval) OracleInstanceManager
The following example shows how the Buffer Cache Hit Ratio(Interval) is calculated.
Logical Reads Physical Reads Time
1000 100 10:00:00
2000 150 10:10:00
3000 300 10:20:00
¶ The monitoring interval is 10 minutes.
433Tivoli Manager for Oracle** Reference Guide
B.
Classes
of
Instan
ceM
on
itors

¶ The hit ratio is calculated between time T1 and time T2 as:(Logical Reads - Physical Reads) / Logical Reads
¶ At 10:00:00 the hit ratio is calculated as:
(1000 - 100) / 1000 = 0.90
Note: This is the same as the cumulative ratio, as there are noprevious values to use.
¶ At 10:10:00 the hit ratio is calculated as:
((2000-1000) - (150-100)) / (2000-1000) = 0.95
T1 = 10:00:00 and T2 = 10:10:00
¶ At 10:20:00 the hit ratio is calculated as:
((3000-2000) - (300-150)) / (3000-2000) = 0.85
T1 = 10:10:00 and T2 = 10:20:00
Point-in-Time MonitorsThe following are point-in-time monitors:
Monitor Name Collection
Active Transactions OracleInstanceManager
Any v$lock OracleInstanceManager
Dispatcher Busy Rate OracleInstanceManager
Dispatcher Wait Times OracleInstanceManager
DML Locks Ratio OracleInstanceManager
Open Cursors OracleInstanceManager
PCM Conversion Waits OracleInstanceManager
PCM Lock Conversion Time OracleInstanceManager
Process Ratio OracleInstanceManager
Redo Allocation Latch Ratio OracleInstanceManager
Redo Copy Latch Ratio OracleInstanceManager
Redo Logs Not Archived OracleInstanceManager
Shared Server Process Ratio OracleInstanceManager
Shared Server Wait Time OracleInstanceManager
434 Version 2.0

Rate-based MonitorsThe following are rate-based monitors:
Monitor Name Collection
Block Get Rate OracleInstanceManager
Call Rate OracleInstanceManager
Recursive Call Rate OracleInstanceManager
The following example shows how the Recursive call rate iscalculated.
Recursive Calls Time
2000 10:00:00
4000 10:10:00
5000 10:20:00
The monitoring interval is 10 minutes (600 seconds).
¶ At 10:00:00, the call rate cannot be calculated.
¶ At 10:10:00 the call rate is calculated as: (4000 - 2000) / 600 =3.33
¶ At 10:20:00 the call rate is calculated as: (5000 - 4000) / 600 =1.67
435Tivoli Manager for Oracle** Reference Guide
B.
Classes
of
Instan
ceM
on
itors

436 Version 2.0

Operator Groups (MonitorTriggers)
The Edit Monitor dialog box contains a trigger when option menuthat allows you to define the conditions that must occur for amonitor to send an alert. The values displayed in this menu vary,depending on whether the monitor uses a numeric value, a stringvalue, or a status message. Each option of an operator group servesas a mathematical or logical evaluator.
Each operator description includes the value for the waddmon –Rargument. The quotation marks for each operator are required. If youwant to specify the (never) operator from the command line, omitthe –R argument.
Becomes availableChecks the status of system resources, such as daemons,host, and print queues. A response is triggered if the resourcewas not available in the previous sample but is available inthe current sample. This operator can be specified at thecommand line by entering "->" "up".
Becomes FailedChecks the status of system resources, such as daemons,host, and print queues. A response is triggered if the resourcedid not fail in the previous sample but did fail in the currentsample. This operator can be specified at the command lineby entering "->""failed".
C
437Tivoli Manager for Oracle** Reference Guide
C.
Op
erator
Gro
up
s(M
on
itor
Trigg
ers)

Becomes ShutdownChecks the status of system resources, such as daemons,host, and print queues. A response is triggered if the resourcewas not shutdown in the previous sample but is shutdown inthe current sample. This operator can be specified at thecommand line by entering "->""shutdown".
Becomes unavailableChecks the status of system resources, such as daemons,host, and print queues. A response is triggered if the resourcewas not unavailable in the previous sample but is unavailablein the current sample. This operator can be specified at thecommand line by entering "-<""up".
Becomes UpChecks the status of system resources, such as daemons,host, and print queues. A response is triggered if the resourcewas not up in the previous sample but is up in the currentsample. This operator can be specified at the command lineby entering "->""up".
Changes byMeasures an absolute difference between the previous andcurrent value. This operator can be specified at the commandline by entering "+>=".
Changes FromCompares the current value (returned by the query script andcompared to the threshold value provided for user-definedand asynchronous string monitors) against the previousvalue. A response is triggered if the current value does notmatch the value provided, but the previous value did. Thequery program is named in the Add Monitor to TivoliDistributed Monitoring Profile dialog. This operator can bespecified at the command line by entering "-<".
Changes ToCompares the current value (returned by the query script andcompared to the threshold value provided for user-definedand asynchronous string monitors) against the previousvalue. A response is triggered if the current value matches
438 Version 2.0

the value provided, but the previous value did not. The queryprogram is named in the Add Monitor to Tivoli DistributedMonitoring Profile dialog. This operator can be specified atthe command line by entering "->".
Decreases belowRecords the value of each sample and triggers if the previousresource value is larger than the specified threshold and thecurrent resource value is smaller than the specified threshold.This operator can be specified on the command line byentering "-<<".
Note: If the first scan of a monitor using the Decreasesbelow numeric operator returns a resource valuesmaller than the specified threshold, the monitor willtrigger, although there is no previous value tocompare with the current resource value.
Equal toRecords the value of each sample, compares it to thespecified value, and triggers a response if the current valueis equal to the specified value. Because it checks onlyagainst the current sample, this type of threshold can triggerafter any sample. This operator can be specified at thecommand line by entering "==".
Greater thanRecords the value of each sample, compares it to thespecified value, and triggers a response if the current valueis greater than the specified value. Because it checks onlyagainst the current sample, this type of threshold can triggerafter any sample. This operator can be specified at thecommand line by entering ">" .
Increase ofChecks the current value against the previous value andtriggers a response if the difference is greater than or equalto the threshold value. This operator can be specified at thecommand line by entering "->=".
439Tivoli Manager for Oracle** Reference Guide
C.
Op
erator
Gro
up
s(M
on
itor
Trigg
ers)

% increase ofChecks the current value as a percentage of the previousvalue and triggers a response if the current value is greaterthan or equal to the specified value. This operator can bespecified at the command line by entering "%>=".
Increases beyondRecords the value of each sample and triggers if the previousresource value is smaller than the specified threshold and thecurrent resource value is larger than the specified threshold.This operator can be specified on the command line byentering "->>".
Note: If the first scan of a monitor using the Increasesbeyond numeric operator returns a resource valuegreater than the specified threshold, the monitor willtrigger, although there is no previous value tocompare with the current resource value.
Is down/unavailableChecks the status of system resources, such as daemons,hosts, and print queues. A response is triggered if theresource is down or unavailable. This operator can bespecified at the command line by entering ″==″ ″down″.
Is FailedChecks the status of system resources, such as daemons,host, and print queues. A response is triggered if the resourceis failed. This operator can be specified at the command lineby entering "==""failed".
Is ShutdownChecks the status of system resources, such as daemons,host, and print queues. A response is triggered if the resourceis shutdown. This operator can be specified at the commandline by entering "==""shutdown".
Is UnavailableChecks the status of system resources, such as daemons,hosts, and print queues. A response is triggered if the
440 Version 2.0

resource is unavailable. This operator can be specified at thecommand line by entering "!=""up".
Is Up Checks the status of system resources, such as daemons,host, and print queues. A response is triggered if the resourceis up. This operator can be specified at the command line byentering "==""up".
Is up/availableChecks the status of system resources, such as daemons,hosts, and print queues. A response is triggered if theresource is up or available. This operator can be specified atthe command line by entering ″==″ ″up″.
Less thanRecords the value of each sample, compares it to thespecified value, and triggers a response if the current valueis less than the specified value. Because it checks onlyagainst the current sample, this type of threshold can triggerafter any sample. This operator can be specified at thecommand line by entering "<".
MatchesChecks the value returned by the query script against thethreshold value provided for user-defined and asynchronousstring monitors. A response is triggered if the monitor returnsa value that exactly matches the value you defined whenediting the monitor. The query program is named in the AddMonitor to Tivoli Distributed Monitoring Profile dialog.This operator can be specified at the command line byentering "=x".
MismatchesChecks the value returned by the query script against thethreshold value provided for the user-defined andasynchronous string monitors. A response is triggered if themonitor returns a value that does not match the value youdefined when editing the monitor. The query program isnamed in the Add Monitor to Tivoli DistributedMonitoring Profile dialog. This operator can be specified atthe command line by entering "!x".
441Tivoli Manager for Oracle** Reference Guide
C.
Op
erator
Gro
up
s(M
on
itor
Trigg
ers)

(never)Indicates the response level does not trigger a response. Thisvalue only affects the specific response level, not the entiremonitor.
Not equal toRecords the value of each sample, compares it to thespecified value, and triggers a response if the current valueis not equal to the specified value. Because it checks onlyagainst the current sample, this type of threshold can triggerafter any sample. This operator can be specified at thecommand line by entering "!=".
Outside rangeCompares each sample against the defined range limit andtriggers a response if the current value falls outside thespecified range. Because the range check is made against thecurrent sample, this monitor type can trigger after anysample. To define the acceptable range, enter a lower andupper limit separated by a dash in the argument field. Thisoperator can be specified at the command line by entering"<>".
442 Version 2.0

Index
AActive Transactions instance monitor 165Advanced Queue Propagation Status (8i)
database monitor 16alert log, list of errors 24Alerts database monitor 22Any v$lock instance monitor 168Any v$sysstat instance monitor 172AQ (Advanced Queue) Schedule Propagation
errors (8i) database monitor 19Archive Free Space database monitor 26Archive Percent Free Space database
monitor 29Archive Space (Number of Redo Logs) database
monitor 32Archive Used Space database monitor 35Average Message Propagation Rate (across
schedule) (8i) database monitor 37Average Redo Entry Size instance monitor 174Average waiting time of “READY” messages
(8i) database monitor 40
BBackground Dump Space database monitor 43Best Practices script 6Block Changes Per Transaction instance
monitor 176Block Get Rate instance monitor 178Blocked Transactions database monitor 46Buffer Cache Hit Ratio (Interval) instance
monitor 183Buffer Cache Hit Ratio instance monitor 180Buffer Waits Ratio instance monitor 186
Ccache instance monitors 431, 432Call Rate instance monitor 189Calls Per Transaction instance monitor 192chained rows
defined 203eliminating 56
Chained Rows (cluster) database monitor 49Chained Rows (table) database monitor 53Changed Block Ratio instance monitor 194CLI commands
using 3waddmon 5wcrtjob 5wlookup 10wrunjob 5wruntask 5wschedjob 5wtemp 398
CLI syntaxspecial characters 4
Cluster Key Ratio instance monitor 196command line interface -- See CLI 3commands
running on UNIX 426running on Windows NT 426running within shells 425
Completed Background Checkpoints instancemonitor 198
ConfigureTECOracle task 399Consistent Change Ratio instance monitor 201cumulative instance monitors 431, 432Currently running Heterogeneous Services (8i)
database monitor 58CurrentRunningSQL task 407
443Tivoli Manager for Oracle** Reference Guide
Ind
ex

Ddata blocks 180data definition language 272data manipulation language, measuring 176database
improving performance 102database, improving performance 208, 211database instance icon, changing 264database writer (DBWR) checkpoints
monitoring completions 198monitoring requests 206
datafiles, monitoring 120DBWR Checkpoints instance monitor 206Dictionary Cache Hit Ratio (Interval) instance
monitor 211Dictionary Cache Hit Ratio instance
monitor 208DisableMonitoring task 411disk sorts 300Dispatcher Busy Rate instance monitor 214Dispatcher Wait Times instance monitor 217distributed monitoring logging
configuring on the endpoint 10configuring on the TMR server 9OracleDatabaseManager monitors 13, 14, 15OracleInstanceManager 162, 163, 164OracleManagerAsync monitors 304, 305using 9viewing SQL statements 9
DML Locks Ratio instance monitor 220DUAL tables 124
EEnableMonitoring task 416ENDPOINT_OID in monitor output 8Enqueue Timeouts instance monitor 223events from tasks 398Extents
asynchronous monitor 306, 309background monitor 306, 308database monitor 61
Extents by Tablespaceasynchronous monitor 311, 314background monitor 311, 312database monitor 64
Extents by Userasynchronous monitor 316, 319background monitor 316, 317database monitor 68
Ffiles
specifying report file for tasks 397fragmentation, reducing from tablespace 135,
370Free Space Deficit
asynchronous monitor 321, 324background monitor 321, 323database monitor 71
Free Space Deficit by Tablespaceasynchronous monitor 326, 330background monitor 326, 328database monitor 75
Free Space Deficit by Userasynchronous monitor 332, 335background monitor 332, 334database monitor 80
Free Space Fragmentation by Tablespacedatabase monitor 87
Free Space Fragmentation database monitor 84free space fragmentation index (FSFI) 86, 90Free Tablespace by Tablespace database
monitor 95Free Tablespace database monitor 91Freelist Waits instance monitor 226
GGUI Data Entry Fields
See also CLI commands 3using 3
444 Version 2.0

HHOST in monitor output 8hosts,specifying for task output 398
Iidlcall OID InitializeEndpoint command 10Index Statistics
asynchronous monitor 337, 339background monitor 337, 338, 341database monitor 99
instance monitor classescache monitors 431, 432cumulative monitors 431, 432interval monitors 431, 433point-in-time monitors 431, 434rate-based monitors 431, 435
INTERP in monitor ouput 8interval instance monitors 431, 433
LLibrary Cache Hit Ratio (Interval) instance
monitor 232Library Cache Hit Ratio instance monitor 229listen endpoints 422listener process, monitoring 151, 385Lock Hit Ratio instance monitor 235Long Running Transactions database
monitor 102Long Table Full Table Scans (Interval) instance
monitor 237
MMaximum Extents
asynchronous monitor 341, 344background monitor 343database monitor 105
Maximum Extents by Tablespaceasynchronous monitor 346, 350background monitor 346, 348database monitor 109
Maximum Extents by Userasynchronous monitor 352, 355background monitor 352, 354database monitor 113
message states, monitoring 145monitor
definition 1organization 2
monitor number 10MONITOR_NUMBER in monitor output 8monitor numbers
OracleDatabaseManager 13, 14, 15OracleInstanceManager 162, 163, 164OracleManagerAsync 304, 305
monitor output 6date and time 7ENDPOINT_OID 8heading 6HOST 8INTERP 8MONITOR_NUMBER 8ORACLE_HOME 8ORACLE_SID 8status 7TRIGGER_INFO 8trigger values 7Userinfo 8
NNT Service Status database monitor 117Number of Datafiles database monitor 120Number of Deadlocks instance monitor 239
445Tivoli Manager for Oracle** Reference Guide
Ind
ex

OOpen Cursors instance monitor 242Oracle commands 11ORACLE_HOME in monitor output 8ORACLE_SID in monitor output 8OracleDatabaseManager
distributed monitoring logging 13, 14, 15monitor CLI names 13, 14, 15monitor GUI names 13, 14, 15monitor numbers 13, 14, 15
OracleInstanceManagerdistributed monitoring logging 162, 163, 164monitor CLI names 162, 163, 164monitor GUI names 162, 163, 164monitor numbers 162, 163, 164
OracleManagerAsyncdistributed monitoring logging 304, 305monitor CLI names 304, 305monitor GUI names 304, 305monitor numbers 304, 305
OracleManagerCollection.sh script 9, 11OracleManagerTasks
task CLI names 395task GUI names 395
outputhost for task output 398
Ppath names, specifying 3PCM Conversion Waits instance monitor 245PCM Lock Conversion Time instance
monitor 247Percentage of False Pings instance monitor 249Physical I/O Reads instance monitor 251Physical I/O Writes instance monitor 254Ping Rate instance monitor 257pins 231, 234point-in-time instance monitors 431, 434Process Ratio instance monitor 259program global area 244
Qqueues
monitoring propagation 16monitoring propagation errors 19
Rrate-based instance monitors 431, 435RDBMS State instance monitor 262Recursive Call Rate instance monitor 265recursive calls, causes 266, 269Recursive Calls instance monitor 268Recursive To User Calls Ratio instance
monitor 271Redo Allocation Latch Ratio instance
monitor 274Redo Copy Latch Ratio instance monitor 277Redo Log Space Waits instance monitor 279redo logs 174Redo Logs Not Archived instance monitor 282Redo Small Copy Ratio instance monitor 285report file, specifying for tasks 397Rollback Waits instance monitor 288Row Source Ratio instance monitor 290Rows in DUAL Table database monitor 123
Sscript, Best Practices 6Shared Server Process Ratio instance
monitor 293Shared Server Wait Time instance monitor 296shells
additional info 426on a managed node 425on the TMR server 425on UNIX 426on Windows NT 426
Sort Overflow Ratio instance monitor 298SQL Number
asynchronous monitor 357, 361
446 Version 2.0

SQL Number (continued)background monitor 357, 359database monitor 125
SQL select statementsdefining as a monitor 128, 131, 357, 363
SQL statements, viewing 9SQL String
asynchronous monitor 363, 367background monitor 363, 365database monitor 129
system global area 174
Ttablespace fragmentation, reducing 135, 370task
definition 1organization 2
TEC server, task events 398Temporary Extents
asynchronous monitor 369, 372background monitor 369, 371database monitor 133
Temporary Extents by Tablespaceasynchronous monitor 374, 378background monitor 374, 376database monitor 136
Temporary Extents by Userasynchronous monitor 380, 383background monitor 380, 382database monitor 141
Tivoli desktopusing 3
Tivoli desktop, using 3Tivoli environment
establishing on an endpoint 428scripts for operating systems 429setting a bash shell on Windows NT 428setting within a UNIX shell 427
Total waiting time of READY messages databasemonitor 145
TRIGGER_INFO in monitor output 8
UUnix Core Dump Space database monitor 148Unix SQL*Net V1 TCP/IP Listener
asynchronous monitor 385, 388background monitor 385, 387database monitor 151
Unix SQL*Net V2 Listenerasynchronous monitor 390, 393background monitor 390, 392database monitor 154
User Dump Space database monitor 158User Rollback Ratio instance monitor 301Userinfo in monitor output 8
Wwaddmon command 5wcrtjob command 5wlookup command 10wrunjob command 5wruntask command 5wschedjob command 5wtemp command 398
447Tivoli Manager for Oracle** Reference Guide
Ind
ex

448 Version 2.0


Printed in the United States of Americaon recycled paper containing 10%recovered post-consumer fiber.
GC32-0454-00