Embed Size (px)
Citation preview
Dissertation
Title PUBLIC PERCEPTION OF CURRENT AND FUTURE HOUSEHOLD WASTE RECYCLING METHODS: A CASE STUDY OF THE VILLAGE OF SAUGHALL, CHESTER.
Author Pope, Jamie Ben
URL http://clok.uclan.ac.uk/9017/
Date 2013
Citation Pope, Jamie Ben (2013) PUBLIC PERCEPTION OF CURRENT AND FUTURE HOUSEHOLD WASTE RECYCLING METHODS: A CASE STUDY OF THE VILLAGE OF SAUGHALL, CHESTER. [Dissertation]
This document is made available to authorised users, that is current staff and students of the University of Central Lancashire only, to support teaching and learning at that institution under a https://creativecommons.org/licenses/bync/3.0/ licence. It may be shared with other authorised users in electronically or printed out and shared in that format. This cover sheet must be included with the whole document or with any parts shared. This document should not be published or disseminated via the internet, or in an analogue format beyond the network or community of the University of Central Lancashire. So, you may post it on the intranet or on the Blackboard VLE, but not on the openly accessible web pages. You may print it, or parts of it, and you may hand it to a class or individual as long as they are staff or students of the University of Central Lancashire. This does not affect any use under the current Copyright Law and permission may be asked via [email protected] for uses otherwise prescribed.
PUBLIC PERCEPTION OF CURRENT AND FUTURE HOUSEHOLD WASTE RECYCLING METHODS: A CASE STUDY OF THE VILLAGE OF
SAUGHALL, CHESTER.
Jamie Pope Environmental Management BSc April 2013

Signed Declaration
‗I declare that the main body of this dissertation is all my own work‘
Signed:
Date:
Abstract
Household waste recycling methods differ between UK local authorities in several ways.
This includes; containers used for collection, frequency of collection, what materials are
collected and the processing of materials after collection, amongst other aspects. Increased
pressure is put upon local authorities to increase waste prevention and rates of reuse and
recycling in order to meet UK and EU legislation. Local authorities are meeting this through
several methods, including introduction of new items to the household waste service (for
example collection of food waste), or introduction of an entirely new system with different
containers and collection frequencies. This occurred during 2012 in Cheshire West and
Chester Council (CWCC).
Meeting legislation is a legal obligation, making it of high priority. However, whatever system
is in place, the local authority will rely on the household participation. Therefore the public
perception of household waste recycling methods is also of high priority.
Perception of a system may differ depending on the system in place. In addition to this,
perceptions may differ for several reasons including; the age of residents, number living
within an individual household and household type (for example terraced compared to
detached). With the system change being rolled out towards the end of 2012, this study
used 2 postal surveys in the village of Saughall, within CWCC.
These surveys assessed the perceptions of residents on the household waste method in
place before the new system was rolled out, and after. Analysis showed a major negative
perception towards the new system. It is taken into account whether CWCC accounted for
the perception of residents before a new system was decided upon.

Acknowledgements
I give thanks and appreciation to my supervisor Dr Chris Lowe for all of his support and
encouragement throughout this dissertation. I would also like to thank all of those who
responded to the surveys, making this dissertation possible.
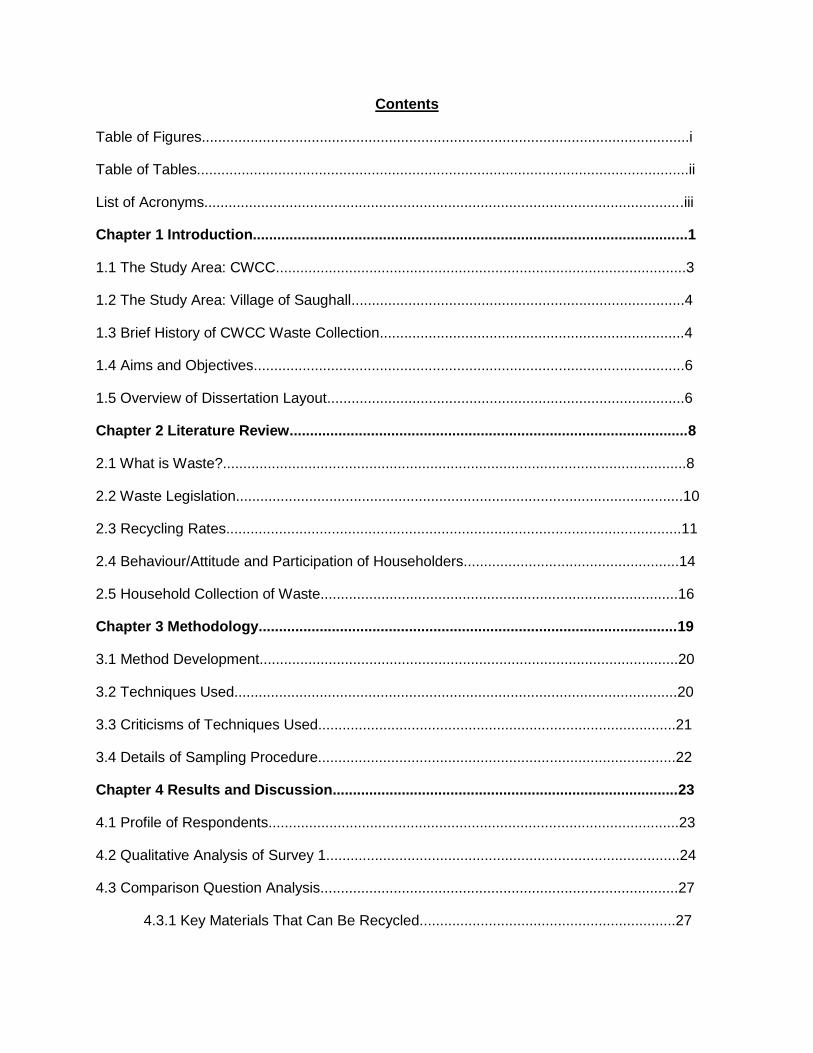
Contents
Table of Figures........................................................................................................................i
Table of Tables.........................................................................................................................ii
List of Acronyms......................................................................................................................iii
Chapter 1 Introduction...........................................................................................................1
1.1 The Study Area: CWCC.....................................................................................................3
1.2 The Study Area: Village of Saughall..................................................................................4
1.3 Brief History of CWCC Waste Collection...........................................................................4
1.4 Aims and Objectives..........................................................................................................6
1.5 Overview of Dissertation Layout........................................................................................6
Chapter 2 Literature Review..................................................................................................8
2.1 What is Waste?..................................................................................................................8
2.2 Waste Legislation..............................................................................................................10
2.3 Recycling Rates................................................................................................................11
2.4 Behaviour/Attitude and Participation of Householders.....................................................14
2.5 Household Collection of Waste........................................................................................16
Chapter 3 Methodology.......................................................................................................19
3.1 Method Development.......................................................................................................20
3.2 Techniques Used.............................................................................................................20
3.3 Criticisms of Techniques Used........................................................................................21
3.4 Details of Sampling Procedure........................................................................................22
Chapter 4 Results and Discussion.....................................................................................23
4.1 Profile of Respondents.....................................................................................................23
4.2 Qualitative Analysis of Survey 1.......................................................................................24
4.3 Comparison Question Analysis........................................................................................27
4.3.1 Key Materials That Can Be Recycled...............................................................27
4.3.2 Issues/Potential Issues.....................................................................................29
4.3.3 Methods of Kitchen Food Waste Disposal........................................................30
4.4 Qualitative Analysis of Survey 2......................................................................................32
4.5 Study Limitations.............................................................................................................35
4.6 Future Work.....................................................................................................................36
Chapter 5 Conclusion..........................................................................................................37
5.1 Conclusions......................................................................................................................37
Reference List
Appendices
i
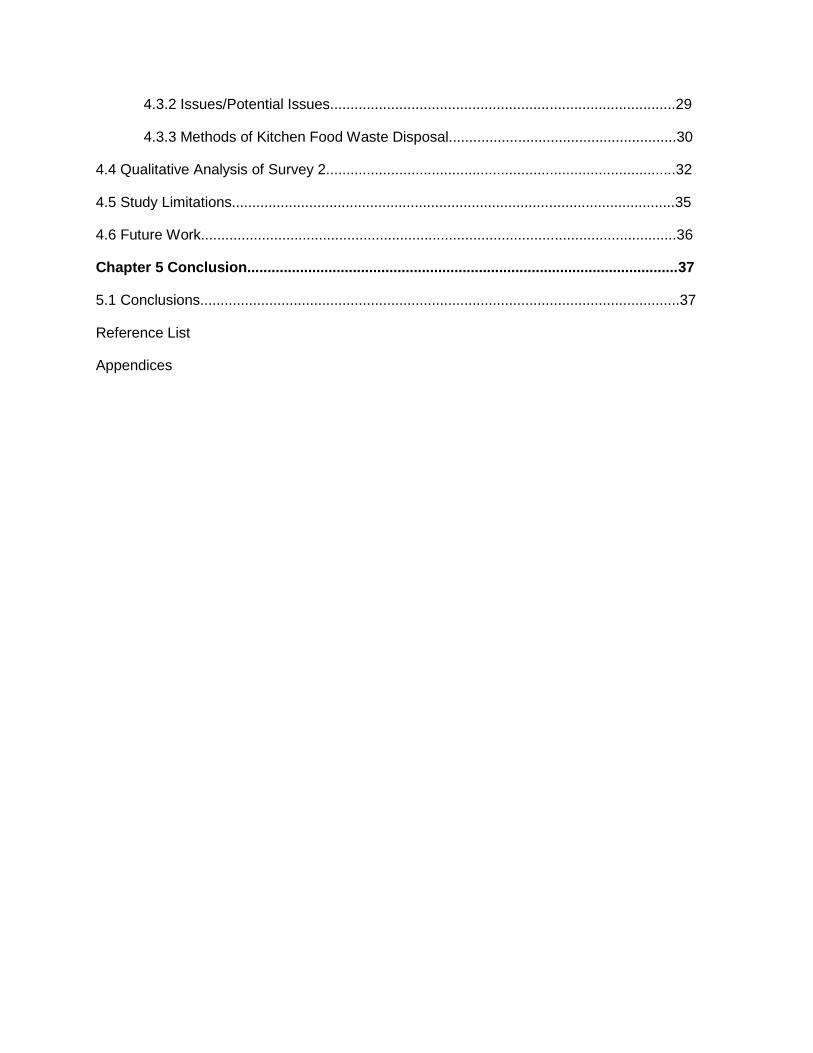
Table of Figures
Figure Figure Name Page
1 LA Collected Waste in England 2006 – 7 2
2 Area Controlled by CWCC 3
3 Local Areas Surrounding Chester City 4
4 CWCC Collection Service 5
5 Waste Hierarchy 8
6 Product Life Cycle Assessment 10
7 Municipal Waste Management in the EU 2010 13
8 Triad Model 15
9 Location of CWCC 2010 Survey Respondents 19
10 Street View of Saughall 22
11 Number of Survey 1 Respondents per Household Type 23
12 Number of Survey 2 Respondents per Household Type 24
13 Potential Issues Within the Recycling Service 25
14 Preference to Wheeled Bins or Boxes for Recycling Container 26
15 Methods of Kitchen Food Waste Disposal 31
16 How Survey 2 Respondents Dispose of Kitchen Food Waste 32
17 Statements Relating to the Small Caddy Liner 33
18 Pests Dealt With in the New System 34
ii
Table of Tables
Table Title Page
1 HWRCs in England, Scotland and Northern Ireland 1
2 List of Social Criteria 14
3 Survey 1 Negative Comments 26
4 Comparison of Material Recycling Frequency 27
5 Issues/Potential Issues Survey Comparison 29
6 Survey 2 Negative Comments 34
iii
List of Acronyms
CWCC – Cheshire West and Chester Council
DEFRA – Department of Environment, Food and Rural Affairs
DETR – Department of Environment, Transport and Regions
EC – European Commission
EfW – Energy from Waste
EU – European Union
FOE – Friends of the Earth
HWRC – Household Waste Recycling Centre
LA – Local Authority
LCA – Life Cycle Assessment
LCA-IWM – Life Cycle Assessment of Integrated Waste Management
MBT – Mechanical Biological Treatment
MRF – Materials Recovery Facility
MSWMS – Municipal Solid Waste Management System
REL – Rear End Loaders
ROHS – Restriction of Hazardous Substances
RORO – Roll-On-Roll-Off Bins
UK – United Kingdom
WEEE – Waste Electrical and Electronic Equipment
WRAP – Waste and Resources Action Programme
1
Chapter 1 – Introduction
Each Local Authority (LA) within the UK has its own household waste management system in
place. These can vary in terms of what items are collected, the frequency of collection, the
container used for disposal and methods of disposal after collections that are available.
Research shown in Chapter 2, revealed that a greater majority of UK LAs systems changed
from separate boxes to wheeled bins. DEFRA (2012) suggested that co-mingled collection has
become more widespread in recent years. Changes are needed within the UK and across all EU
member states in order to comply with EU waste framework directive (see 2.2). From this
directive, the UK is required to recycle compost or reuse 50% of household waste by 2020. The
study will focus on the public perception of household waste recycling methods, looking in
particular at the change that occurred within the study area of Saughall, in Chester. Cheshire
West and Chester Council (CWCC) changed the system from co-mingled (the collection of
recyclable materials within the same container.) wheeled bin collection, to boxes for material
separation before collection. Results will represent the change of perception (if any), how well
consulted the public were, the future of the new service, and whether it can help the UK reach
the 50% EU directive target by 2020.
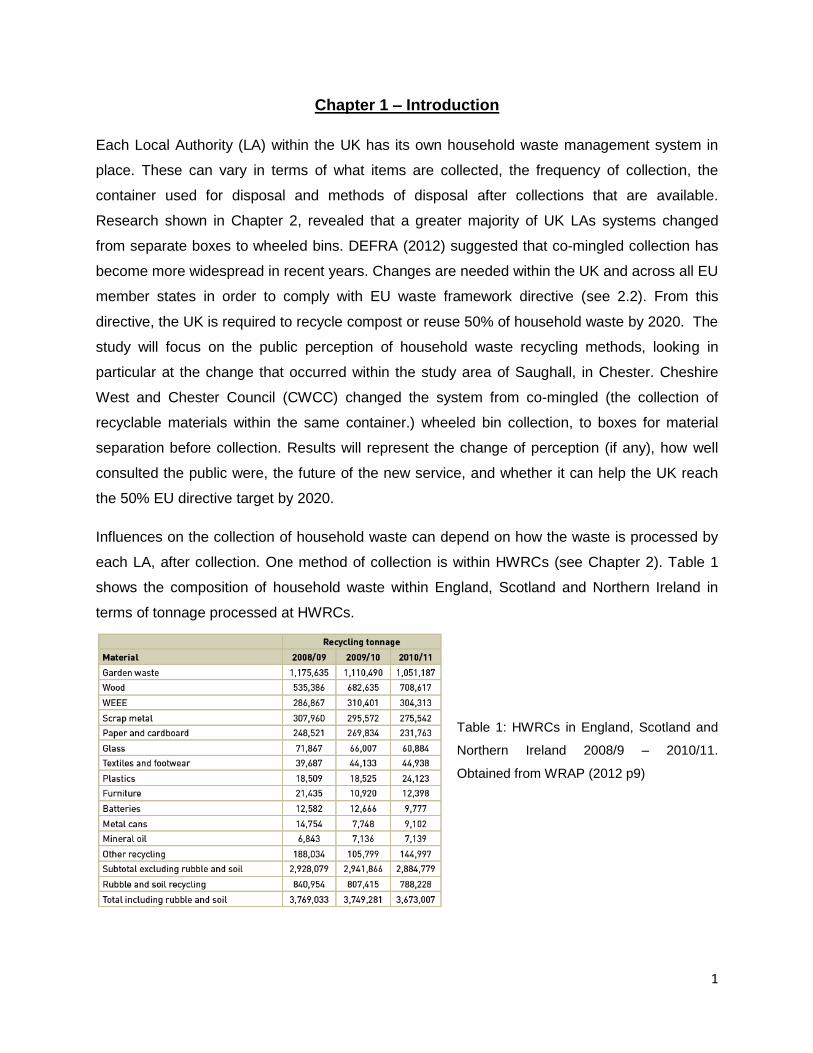
Influences on the collection of household waste can depend on how the waste is processed by
each LA, after collection. One method of collection is within HWRCs (see Chapter 2). Table 1
shows the composition of household waste within England, Scotland and Northern Ireland in
terms of tonnage processed at HWRCs.
Table 1: HWRCs in England, Scotland and
Northern Ireland 2008/9 – 2010/11.
Obtained from WRAP (2012 p9)
2
Looking at the totals, it can be seen that the tonnage of waste dealt with at HWRCs has
decreased. WRAP (2012) suggested three reasons for this decline:
1) The economic recession causing fewer home improvement projects to be carried out.
2) Diversion of some materials to new kerbside recycling services.
3) Improved control of commercial waste at HWRCs, with less being collected disguised as
household waste.
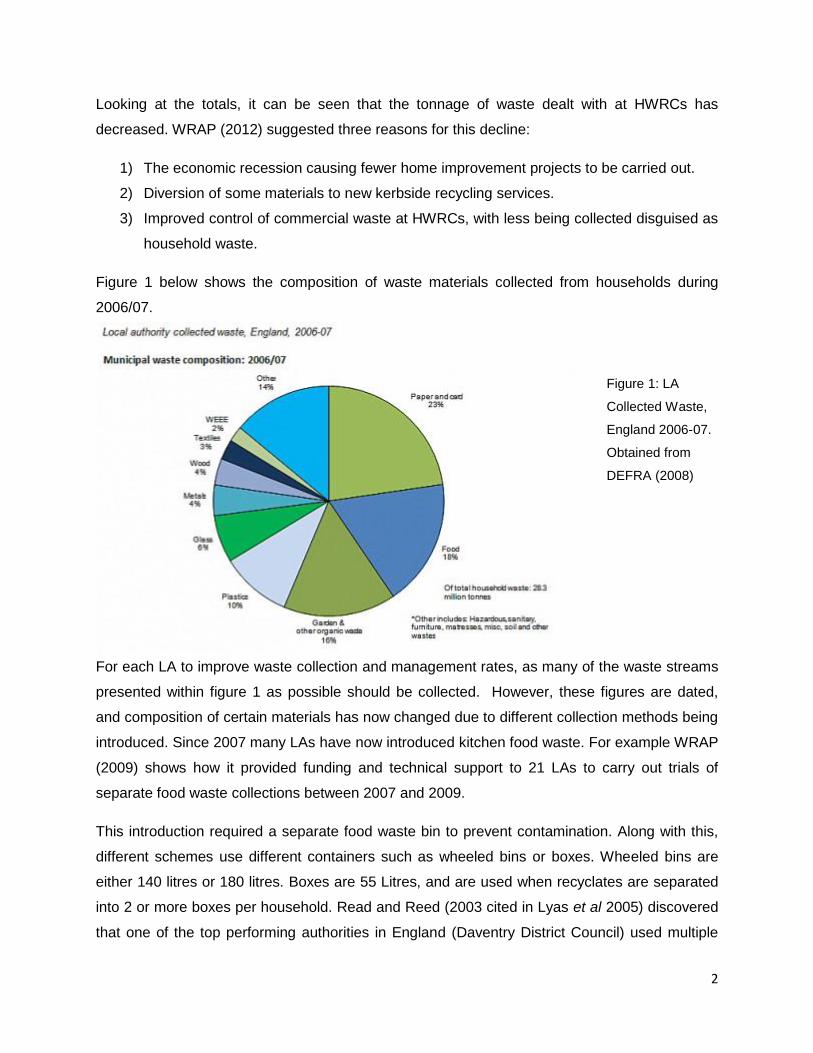
Figure 1 below shows the composition of waste materials collected from households during
2006/07.
Figure 1: LA
Collected Waste,
England 2006-07.
Obtained from
DEFRA (2008)
For each LA to improve waste collection and management rates, as many of the waste streams
presented within figure 1 as possible should be collected. However, these figures are dated,
and composition of certain materials has now changed due to different collection methods being
introduced. Since 2007 many LAs have now introduced kitchen food waste. For example WRAP
(2009) shows how it provided funding and technical support to 21 LAs to carry out trials of
separate food waste collections between 2007 and 2009.
This introduction required a separate food waste bin to prevent contamination. Along with this,
different schemes use different containers such as wheeled bins or boxes. Wheeled bins are
either 140 litres or 180 litres. Boxes are 55 Litres, and are used when recyclates are separated
into 2 or more boxes per household. Read and Reed (2003 cited in Lyas et al 2005) discovered
that one of the top performing authorities in England (Daventry District Council) used multiple
3
bins/boxes to collect organic material, dry recyclables and general waste. This helped the
council to achieve a recycling rate of 44.3% in 2002-2003. The use of different containers
represents a factor in the change of household waste composition. Different amounts of waste
may be collected with different systems and containers in place. Also different types of waste
may be collected or separated depending if authorities use the kerbside sorting scheme, sort at
a HWRC, or do not sort at all.
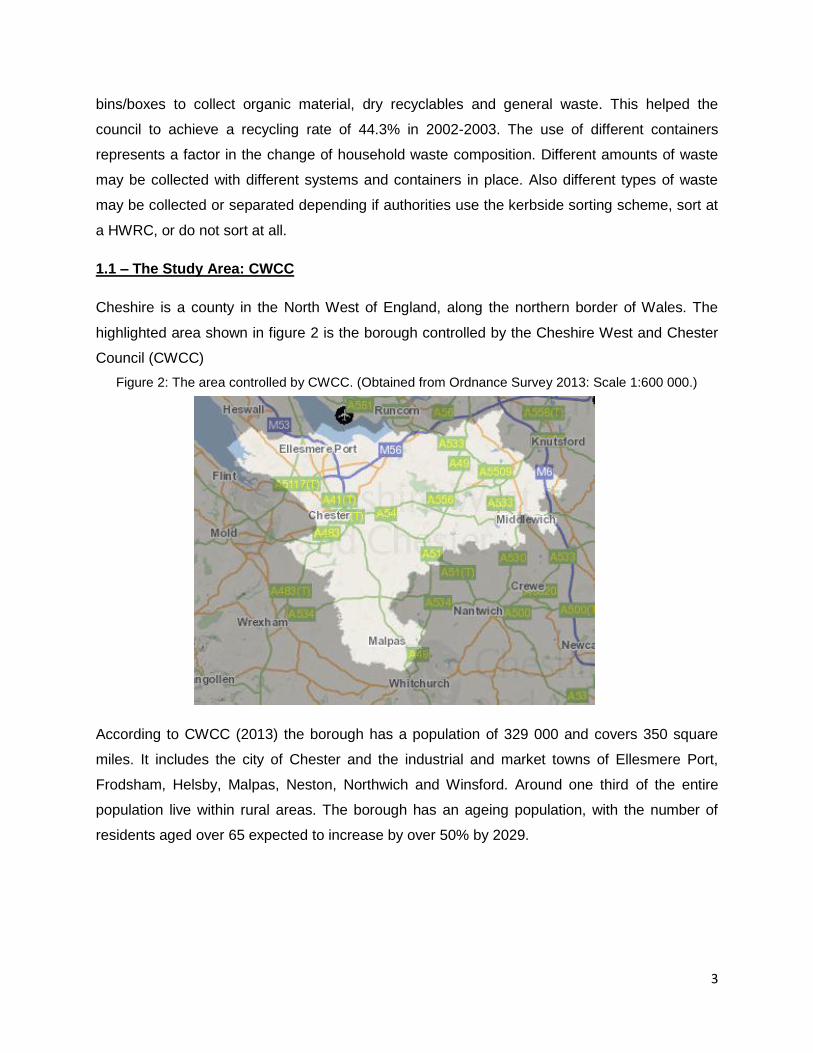
1.1 – The Study Area: CWCC
Cheshire is a county in the North West of England, along the northern border of Wales. The
highlighted area shown in figure 2 is the borough controlled by the Cheshire West and Chester
Council (CWCC)
Figure 2: The area controlled by CWCC. (Obtained from Ordnance Survey 2013: Scale 1:600 000.)
According to CWCC (2013) the borough has a population of 329 000 and covers 350 square
miles. It includes the city of Chester and the industrial and market towns of Ellesmere Port,
Frodsham, Helsby, Malpas, Neston, Northwich and Winsford. Around one third of the entire
population live within rural areas. The borough has an ageing population, with the number of
residents aged over 65 expected to increase by over 50% by 2029.
4
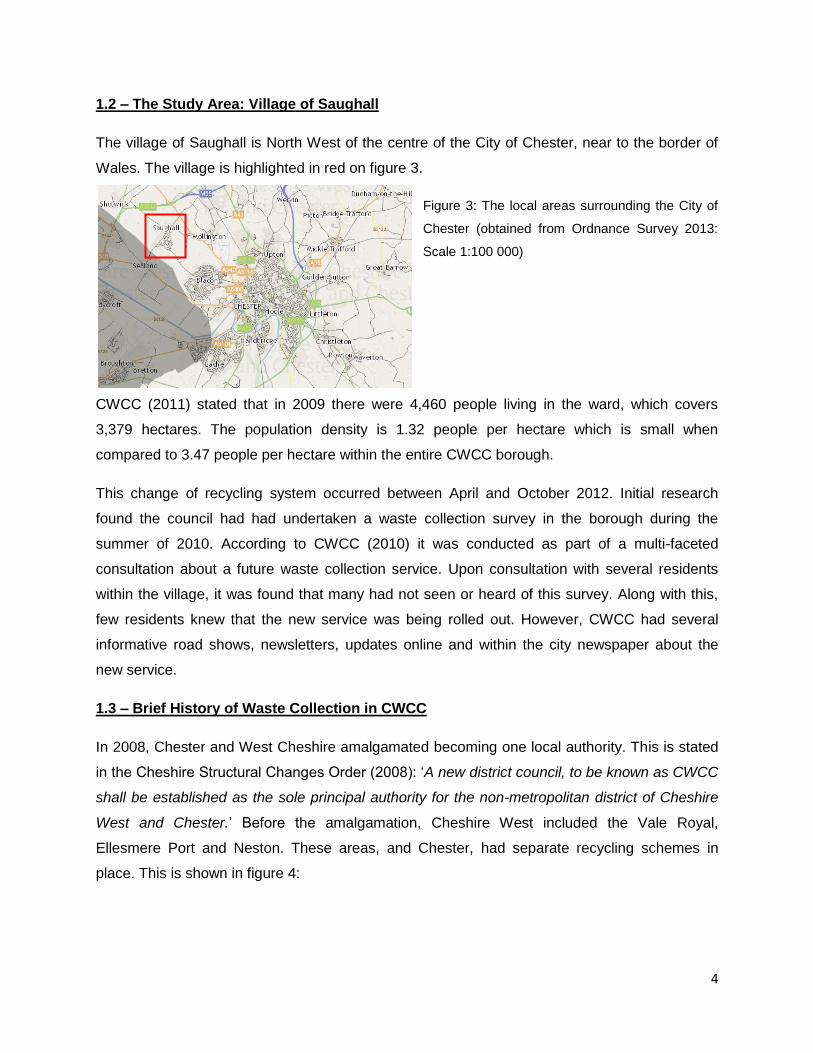
1.2 – The Study Area: Village of Saughall
The village of Saughall is North West of the centre of the City of Chester, near to the border of
Wales. The village is highlighted in red on figure 3.
Figure 3: The local areas surrounding the City of
Chester (obtained from Ordnance Survey 2013:
Scale 1:100 000)
CWCC (2011) stated that in 2009 there were 4,460 people living in the ward, which covers
3,379 hectares. The population density is 1.32 people per hectare which is small when
compared to 3.47 people per hectare within the entire CWCC borough.
This change of recycling system occurred between April and October 2012. Initial research
found the council had had undertaken a waste collection survey in the borough during the
summer of 2010. According to CWCC (2010) it was conducted as part of a multi-faceted
consultation about a future waste collection service. Upon consultation with several residents
within the village, it was found that many had not seen or heard of this survey. Along with this,
few residents knew that the new service was being rolled out. However, CWCC had several
informative road shows, newsletters, updates online and within the city newspaper about the
new service.
1.3 – Brief History of Waste Collection in CWCC
In 2008, Chester and West Cheshire amalgamated becoming one local authority. This is stated
in the Cheshire Structural Changes Order (2008): ‗A new district council, to be known as CWCC
shall be established as the sole principal authority for the non-metropolitan district of Cheshire
West and Chester.‘ Before the amalgamation, Cheshire West included the Vale Royal,
Ellesmere Port and Neston. These areas, and Chester, had separate recycling schemes in
place. This is shown in figure 4:
5
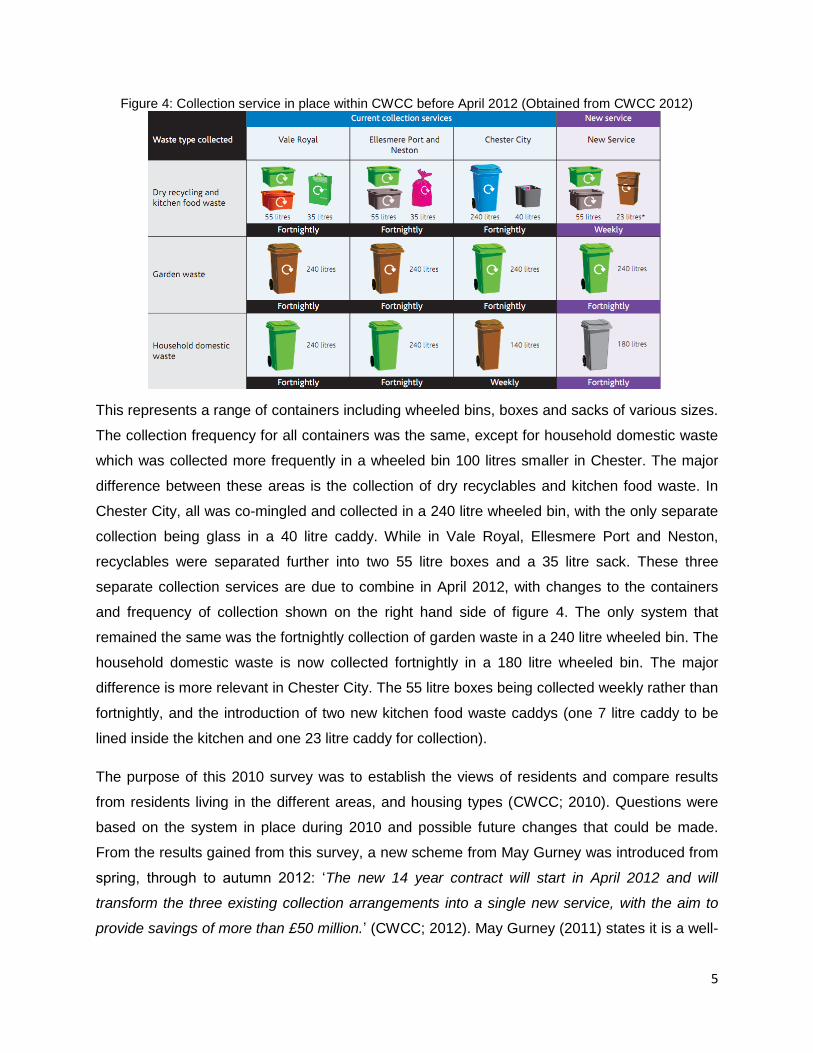
Figure 4: Collection service in place within CWCC before April 2012 (Obtained from CWCC 2012)
This represents a range of containers including wheeled bins, boxes and sacks of various sizes.
The collection frequency for all containers was the same, except for household domestic waste
which was collected more frequently in a wheeled bin 100 litres smaller in Chester. The major
difference between these areas is the collection of dry recyclables and kitchen food waste. In
Chester City, all was co-mingled and collected in a 240 litre wheeled bin, with the only separate
collection being glass in a 40 litre caddy. While in Vale Royal, Ellesmere Port and Neston,
recyclables were separated further into two 55 litre boxes and a 35 litre sack. These three
separate collection services are due to combine in April 2012, with changes to the containers
and frequency of collection shown on the right hand side of figure 4. The only system that
remained the same was the fortnightly collection of garden waste in a 240 litre wheeled bin. The
household domestic waste is now collected fortnightly in a 180 litre wheeled bin. The major
difference is more relevant in Chester City. The 55 litre boxes being collected weekly rather than
fortnightly, and the introduction of two new kitchen food waste caddys (one 7 litre caddy to be
lined inside the kitchen and one 23 litre caddy for collection).
The purpose of this 2010 survey was to establish the views of residents and compare results
from residents living in the different areas, and housing types (CWCC; 2010). Questions were
based on the system in place during 2010 and possible future changes that could be made.
From the results gained from this survey, a new scheme from May Gurney was introduced from
spring, through to autumn 2012: ‗The new 14 year contract will start in April 2012 and will
transform the three existing collection arrangements into a single new service, with the aim to
provide savings of more than £50 million.‘ (CWCC; 2012). May Gurney (2011) states it is a well-
6
established company with a great deal of experience of working with the public sector, holding
8% of the outsourced waste collection market in England and Wales. This provides reasoning
for CWCC selecting this company. Along with this, May Gurney (2011) claim the introduction of
the kitchen food waste caddy is to prevent more waste from going to landfill, as it makes up
approximately a third of the waste in general waste bins.
The company has shown success within other councils, such as Somerset Waste Partnership,
Bridgend County Borough Council and West Oxfordshire District Council (see 2.5). CWCC
(2010) suggests that changing from bins to boxes is advantageous due to sorting of recyclable
materials at kerbside being possible, allowing a wider range of materials to be recycled. Using
boxes, rather than wheeled bins, enables the collection crews to further sort the recyclable
materials into separate compartments on the purpose built recycling vehicles.
1.4 Aims and Objectives
Aims:
This study aims to assess public perception of the current household waste management
system (wheeled bins) and the future system (boxes) coming in to replace it within CWCC.
Objectives:
1. Develop and undertake a survey to assess the attitudes of the public in Saughall to the
current recycling system, and the future changes that are occurring. Saughall is on the
outskirts of Chester and is considered a microcosm of the wider study area.
2. Develop and undertake a second survey to assess the attitudes of the public in Saughall
to the new recycling system, after it has been put into effect, asking the same residents
asked in part 1.
3. Analyse the results from 1 and 2 and note the possible changes, if any, in the attitudes
to the newly introduced system.
1.5 – Overview of Dissertation Layout
The fundamentals for this research have been set, the forthcoming chapters will provide a
literature review on the subject of household waste management, looking in particular at
recycling; a description of the methodology of this study, a discussion and analysis of the results
gained from both surveys, noting comparisons between them, and finally a conclusion of the

7
results gained, with discussion of limitations to the study, and relevance to possible further
research.
8
Chapter 2 – Literature Review
This chapter will identify the background of what waste is, what policies and legislation relate to
the collection and sorting of household waste, and the different systems that are in place to deal
with household waste. In relation to the aims of this study, it will be discussed how these factors
can influence the public perception on what waste is, how policies and legislation affect
household waste management and how satisfied residents are with different recycling systems
that are in place. It will be noted how waste management differs on a national scale, between
EU member states, and on a local scale, between different LAs within the UK.
2.1 What is Waste?
The EU Waste Framework Directive (1975) describes waste as ―any substance or object in
which the holder intends to or is required to discard.‖ Coopland (2006) explains that once a final
recovery operation has been completed (for example being made into a new product) then
waste is no longer defined as waste. According to den Boer et al (2005) the definition of
household waste differs between countries.
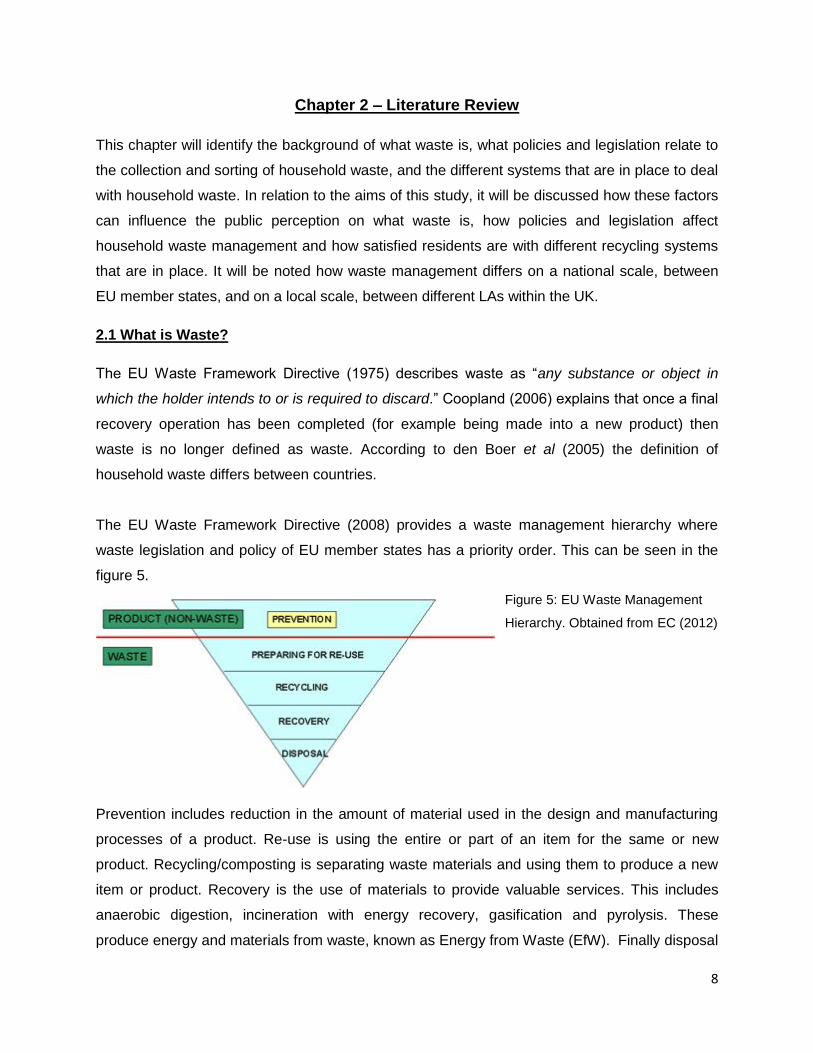
The EU Waste Framework Directive (2008) provides a waste management hierarchy where
waste legislation and policy of EU member states has a priority order. This can be seen in the
figure 5.
Figure 5: EU Waste Management
Hierarchy. Obtained from EC (2012)
Prevention includes reduction in the amount of material used in the design and manufacturing
processes of a product. Re-use is using the entire or part of an item for the same or new
product. Recycling/composting is separating waste materials and using them to produce a new
item or product. Recovery is the use of materials to provide valuable services. This includes
anaerobic digestion, incineration with energy recovery, gasification and pyrolysis. These
produce energy and materials from waste, known as Energy from Waste (EfW). Finally disposal
9
is the ‗throwing away‘ of waste typically via incineration without energy recovery and landfill. In
figure 5, these methods are put into an order of priority from top to bottom. According to DEFRA
(2012a) prevention offers the best outcome for the environment, making it the top priority. The
hierarchy then descends in order of environmental preference, with disposal being the least
preferred option.
Waste is seen as a beneficial resource through EfW. An example is incineration, as described
by Li (2011) ‗Incineration is a waste treatment process that involves the combustion of organic
substances contained in waste.‘ These bring resource benefits of producing electricity from the
heat, and the ash produced can be used to increase crop yields on agricultural land. Other
waste burning methods, such as gasification and pyrolysis, can also produce resources. FOE
(2009) describes pyrolysis and gasification as thermal processes using high temperatures to
break down waste, but unlike incineration, it is the burning of waste in a reduced oxygen
environment. FOE (2009) goes on to explain how the gases (syngas), oils and solid char (ash)
produced from these processes can be used as fuel resource, or as feedstock for petro-
chemicals when purified.
The importance of the waste hierarchy is highlighted throughout the EU Waste Framework
Directive (2008). According to the directive, all waste policy should aim to favour the practical
application of the hierarchy. The main aim is to reduce the impact managing waste has upon the
environment through promotion of reuse, recycling and reduction and moving away from landfill.
A particular example of this is the disposal of bio-waste, which includes biodegradable garden
and kitchen food waste. The 2008 directive states: it is important, in accordance with the waste
hierarchy, to facilitate the separate collection and proper treatment of bio-waste for the purpose
of reduction of greenhouse gases from landfill.
Waste is a mixture of different materials, some of which may have an increased value when
separated. McDougall et al (2008) states that separating the materials in waste will generally
increase their value if uses are available for recovered materials. All of the materials are
processed in different ways depending on different situations. This includes; where the waste is
produced and whether it is waste of a business or a household. Either way, regulations are in
place locally, nationally and globally for the regulation of waste.
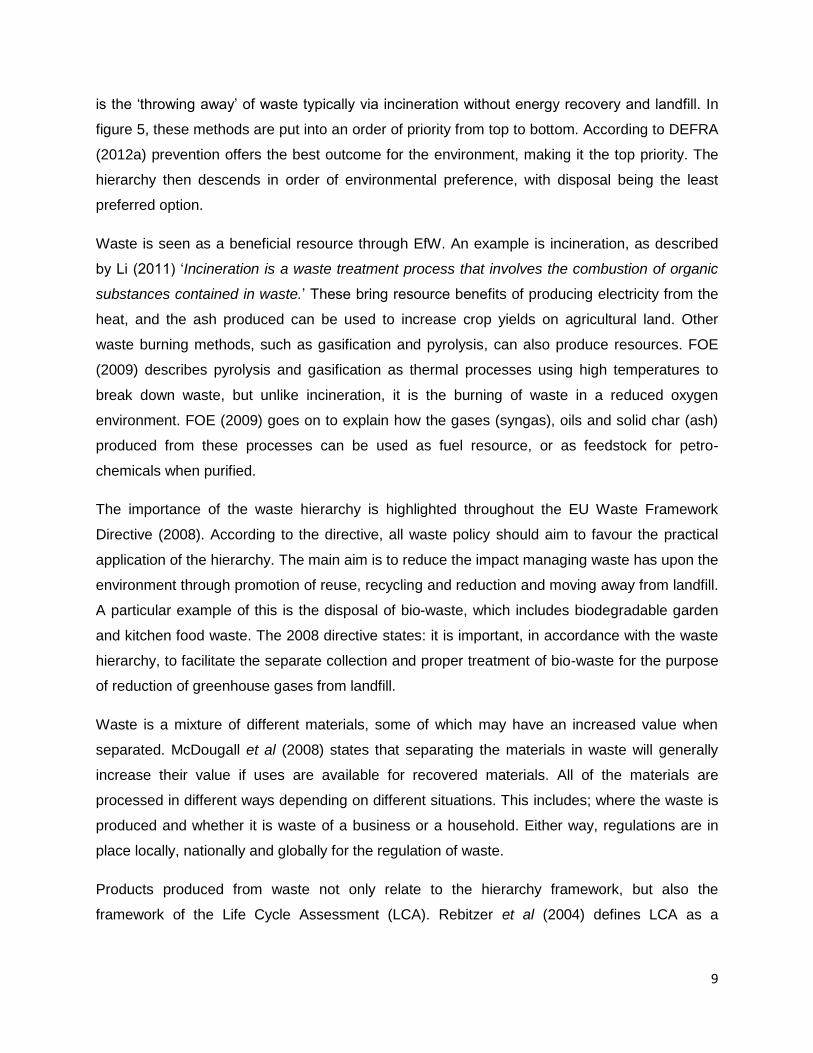
Products produced from waste not only relate to the hierarchy framework, but also the
framework of the Life Cycle Assessment (LCA). Rebitzer et al (2004) defines LCA as a
10
‗methodological framework for estimating and assessing the environmental impacts attributable
to the life cycle of a product.‘ Figure 6 represents the LCA.
Figure 6: Schematic representation of a generic life cycle of a product (the full arrows represent material
and energy flows, while the dashed arrows represent information flows). Obtained from Rebitzer et al
(2000 cited in Rebitzer et al 2004)
Focussing on household waste, den Boer et al (2005) discusses a project known as LCA-IWM.
This project ran from September 2002 to August 2005, with the financial support of the EC,
looking at the development of integrated waste management strategies for cities and regions
with rapidly growing economies at the time. The results of this project found faults within some
household waste management systems across Europe, and it provided suggestion for areas of
improvement, for example in recycling participation. Despite encouragement from the project
towards better household systems, in particular relation to this study, legislation has caused
further system changes.
2.2 Waste Legislation
The implementation of waste legislation and regulations is provided by the EU to all member
states. At EU Level, one of current legislations in place that best relates to this study is the EU
Waste Framework Directive. Particular targets within this directive for re-use and recycling are
stated by Europa (2009): ‗by 2020 preparing for re-use and recycling and other material
recovery shall be increased to a minimum of 70% by weight.‘ A larger amount of waste is sent
for reuse and recycling, adding to the current weight. This is a high expectation. A target is also
evident for household waste: ‗by 2020, preparing for re-use and recycling of solid municipal
waste materials from households shall be increased to a minimum of 50% by weight‘ (European
11
Commission; 2010). Stookes (2009) discussed that the most important aspects were to reduce
the negative impact of waste from production and disposal, through recycling. To ensure these
targets are met, new household waste management schemes have been initiated.
The UK is legally obliged to transfer EU directives into UK law. The UK government produced a
National Waste Strategy at the start of the new millennium from other EU Directives such as the
Landfill Directive of 1999. DETR (2000) worked with LAs within the UK to pilot schemes
encouraging householders to reduce waste and participate in recycling. This was over a decade
ago, and since then strategies have been amended with stricter targets being introduced.
DEFRA (2012) shows how targets have been revised since the 1975 EU Waste Framework
Directive. An additional target requires the member states to recycle, compost or reuse 50% of
household waste by 2020.
According to DEFRA (2012a) there are several waste regulations and policies in place in the
UK. These include waste electrical and electronic equipment (WEEE), restriction of hazardous
substances (ROHS) directives, packing and packaging regulations, and end of life vehicles
regulation. This represents how an individual member of the EU deals with its own waste,
introducing its own national regulations, in order to comply with EU regulations and law.
2.3 Recycling Rates
Increased pressure from the UK government is put on all LAs to increase recycling, composting
and re-use. Rogers (2011) stated that recycling is not the same rate around the country. The
current rates are used to compare each LA, giving a positive perception to those meeting the
targets, and a negative perception to those that don‘t. In turn, LAs may change the way the
systems operate, to try to gain a positive perception.
There are many factors influencing different recycling rates between LAs. A report from WRAP
(2010) implies that the factors fall into four main groups:
1) Socio-economic, lower rates in areas of high deprivation.
2) Range of materials collected, LAs that target a higher range of dry recycling materials
will achieve a higher rate.
3) Kerbside collection characteristics - with a less frequent fortnightly collection and a
container with a large capacity achieves higher yields.
4) Regional, some regional variations that cannot be explained using other factors.
12
Of these factors, the most influential during the report was found to be the deprivation, range of
materials collected and fortnightly collection. Another factor that varies within LAs is the different
types of households. Households across a LA can differ from high-rise buildings, to more
spacious, rural detached housing. With these variations, different collection methods within a
system must be considered. For example, Robinson and Read (2005) discuss how residents in
high-rise flats usually have communal waste systems where waste is disposed of in paladin bins
(extra large communal storage container) or similar. This can cause issues for the introduction
of new systems. This was highlighted by Mattsson et al (2003) in the new ‗4 bin‘ system
introduced into Daventry, England. It was suggested that the majority of rural housing had the
storage space required for 4 separate containers, while in urban areas, where terraced housing
is more common, 4 containers would cause a problem. This is due to the insufficient space for
storage, and few having a rear entrance in order to take containers to kerbside. With these
issues, then a different system for the collection of waste may be needed. Omran et al (2009)
used Malaysia as a case study, stating that kerbside collection is common in low-rise housing
areas, which include terraced, semi-detached and detached houses. While high-rise flats use
paladin bins, along with alternate systems such as roll-on-roll-off bins (RORO) or Rear End
Loaders (REL).
Before a new system is introduced, it may be beneficial to trial the system first. However, as
made evident by Williams and Cole (2013) the trials in Kings Bromley, Staffordshire, England
excluded high rise flats, older terraced properties with no front gardens and modern apartment
blocks with communal bins. Should trials not include all household types then it will not provide
an accurate representation of all potential issues within an area.
It can be argued that the introduction of schemes has had a positive effect by increasing UK
recycling rates, as made evident by DEFRA (2012b): ‗Around 40% of waste from households is
currently recycled, as of 2011, compared to 11% in 2000/01’ During November 2012, new
statistics were released by DEFRA (2012c) showing the recycling rate of UK households in
2011/12 being 43%. Although it is positive that the rate has increased by approximately 3%, the
increase is beginning to level off. In fact, 2011/12 is the lowest year on year increase for 10
years, which may be due to a greater difficulty and potential high costs.
In comparison to other member states, 43% is a small figure. For example, Flanders in Belgium
has a recycling and composting rate of over 70% (Laing; 2007). Hickman (2011) showed a
13
comparison between Germany and the UK. The town of Neustadt has the best recycling system
within Germany, 16% higher than the German target of 70%. Hickman (2011) stated the reason
for the success is provision of financial incentives and education. Germany have less that 300
landfills and according to Bersi (n.d), the country plans to increase the use of EfW, ceasing the
operation of all current landfills. This shows how small the figure of 43% is within the UK. It can
be argued that methods need to be more productive and efficient to match other member states
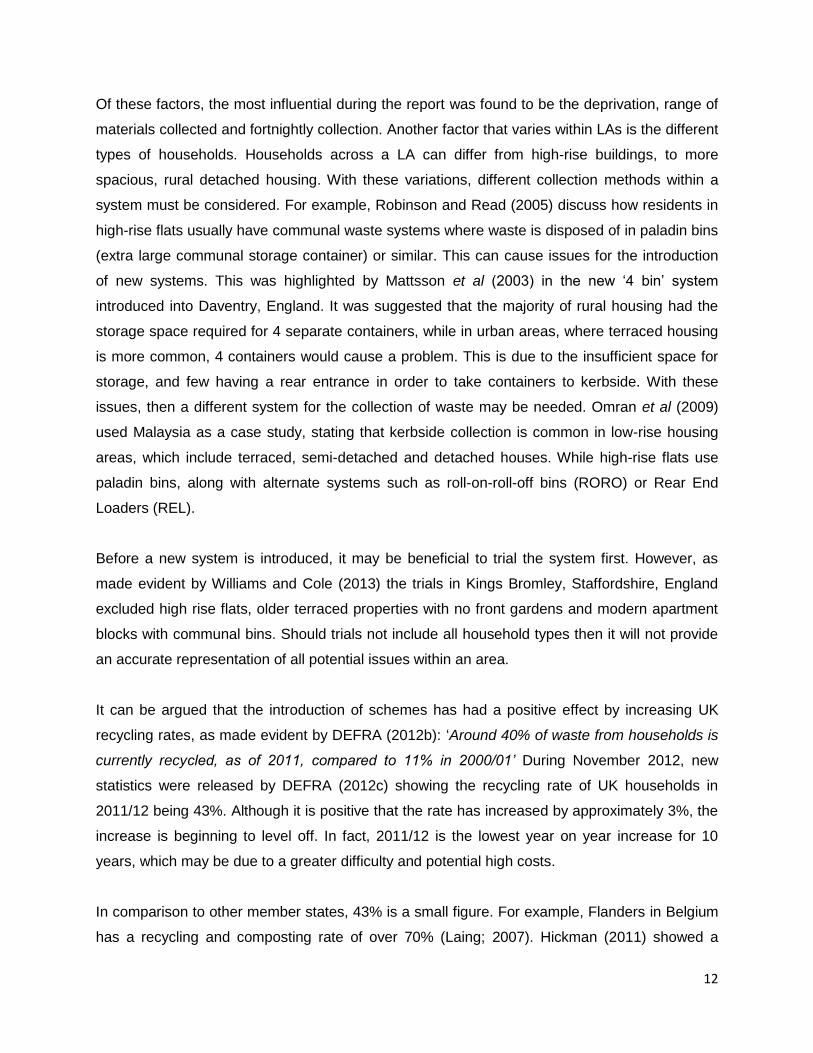
on recycling and composting efforts. However, the UK is ahead of many European countries
which figure 7 shows.
Figure 7: Municipal Waste
Management in the EU, 2010.
Obtained from DEFRA
(2011a)
The EU27 figures represent the European average. DEFRA (2011a) states that from these
2010 figures, the UK landfills around 12% more municipal waste than the EU27
average. However, many other member states are far from the average figures, which can
provide a negative perception e.g. should landfill rates be higher. It must be noted that these
figures represent broad comparisons due to differences in definitions of waste management.
Overall the UK needs to continue to decrease the use of landfill as it is seen to have a negative
effect on the environment. In comparison to a majority of EU countries, the UK currently
represents better methods of managing waste.
It can also be argued that the target of 50% for EU countries is not ambitious enough, with
some countries already surpassing the rate with ease, with time available before the target
needs to be reached. With aims to surpass current targets, UK LAs may need to change the
14
recyclable collection from households, frequency of recyclable collection, and the way in which
separation occurs at kerbside, or afterwards.
Furthermore, additional collection of recyclable materials such as food waste will help to
increase recycling rates and reduce the use of landfill. Changes have been, and are being made
across the UK. An example can be seen in Staining, in Lancashire. Winstanley (2011) studied
‗how efficiently householders engage with kerbside collections by measuring variations in
recycling rates following the introduction of a wheeled bin scheme.‘ The scheme changed from
2 collection boxes (size of 55 litres) to comingled wheeled bin collections (size of 240 litres) to
gain a higher volume of recyclable and compostable waste from collection. Winstanley (2011)
stated that the new scheme aimed to follow a large number of UK LAs which reported dramatic
increases in their recycling rates following the introduction of a comingled system.
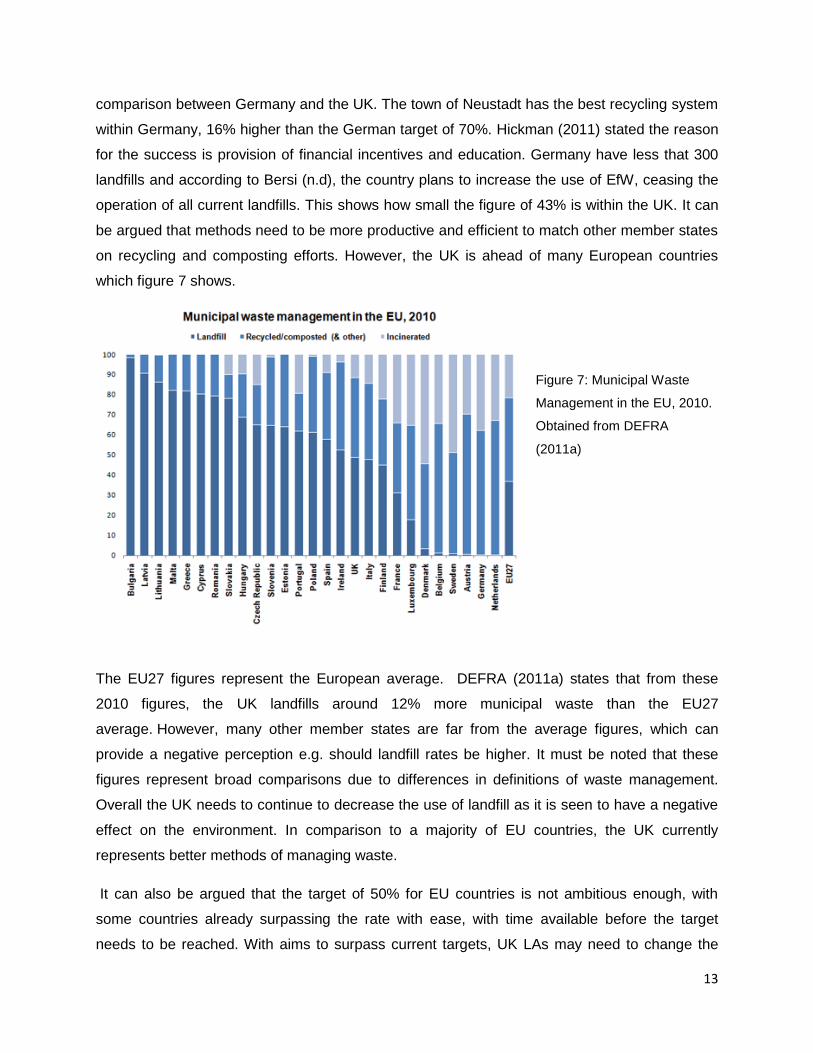
2.4 Behaviour/Attitude and Participation of Households
Table 2: List of the social
criteria and indicators obtained
from den Boer et al (2005 p 58)
All Waste Management systems should fulfil specific social obligations. Table 2 shows the
social criteria and indicators that should be taken into account to measure social sustainability of
the Municipal Solid Waste Management System (MSWMS).
The criteria represent negative social barriers that are present within waste collection and
treatment systems. Research from WRAP (2008) relating to influencing behaviour of
householders included the identification of barriers that prevent the task of recycling. These
include:
15
Situational barriers – not having adequate containers, lack of space, unreliable service,
physical problems.
Behavioural – being pre occupied, difficulties in sorting
Lack of knowledge – not knowing ‗what goes where‘
Attitudes and perceptions – being resistant to sorting, no motivation due to lack of
rewards.
These barriers can be overcome to increase participation. For example if containers cause
physical problems, add wheels, or provide an assisted service. If not knowing ‗what goes where‘
is a problem, then education via leaflets or online updates may be useful. According to Davis et
al (2006) high participation rates are an essential component of any effective kerbside collection
scheme.
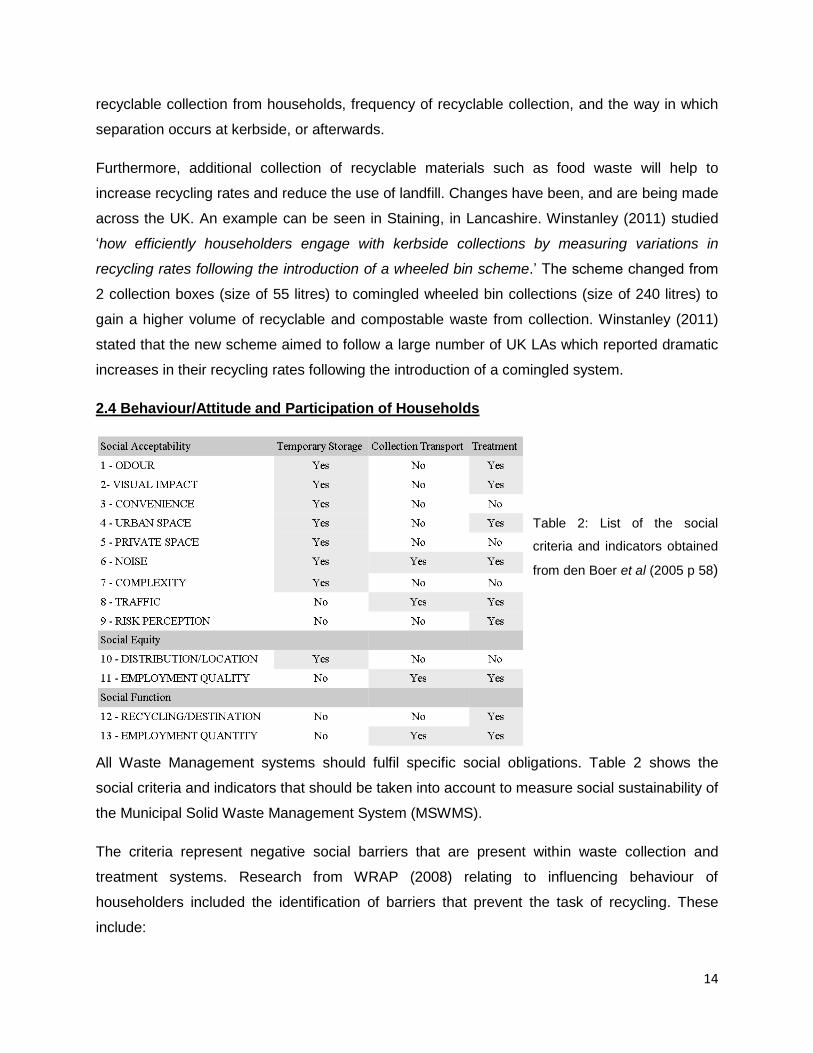
Figure 8 shows the Triad Model, which represents the base of resident behaviour management
towards waste separation in kerbside recycling schemes.
Figure 8: The Triad Model applied to waste
separation behaviour. Obtained from den
Boer et al (2005)
Poiesz (1999) state in the Triad model, resident behaviour is influenced by 3 factors:
1) Motivation – are citizens motivated to separate waste?
2) Capacity – are citizens physically and mentally capable to separate waste?
3) Opportunity – are opportunities provided to separate waste?
Different behavioural patterns will change levels of participation. Should households have
motivation, capacity and opportunity to participate, then participation rates will be high. Other
factors may affect participation rate, such as affluence within an area. Research by Wilson and
16
Williams (2007) in England showed differences between more and less affluent areas. In
general, residents from less affluent areas did not recycle as much as residents in more affluent
areas. The waste collection system that is in place needs to be convenient for as many
households within the LA as possible, to achieve the greatest participation rate. A study on
attitudes to recycling by Martin et al (2006) in Burnley, England showed that residents were
willing to participate, however it was agreed that local recycling services were too unreliable and
inconsistent to allow them to do so.
Woodard et al (2005) argued that public perception of household waste collection appears to
be: ‗a system dominated by collection of general household waste with an additional recycling
service included.‘ This perception needed changing, with recycling collection becoming the main
focus. This is being applied through the introduction of new kerbside separation collection
schemes across the UK. According to Let‘s Recycle (n.d), kerbside separation has been
introduced mainly due to the EU Waste Framework Directive having a requirement of separate
collection of at least paper, metal, plastic and glass by 2015.
2.5 Household Collection of Waste
The UK government is trying to encourage LAs to introduce new schemes that will increase
recycling rates. An example, stated by DEFRA (2012d), is the changes in penalties and
entitlement during 2012. This includes fixed penalties in place for putting the wrong bin out on
collection day, or not putting the bin out at all. An example can be seen in the London Borough
of Brent, as Brent Council (2011) have a fixed penalty of £100 should residents refuse to
recycle. These penalties can encourage residents to follow procedure.
The types of waste collection containers range from larger wheeled bins to sacks to boxes. This
shows variations between different schemes provided by LAs. With funding becoming available,
and with targets to meet, many authorities have altered their waste collection system. An
example can be seen in the Somerset Waste Partnership (2012), with additions to kerbside
recycling collections in 2011/12. During autumn 2011 plastic bottles and cardboard were added,
and in July 2012 aerosols, kitchen towel, and textiles were also added. Adding items will cause
costs to increase, but the increase in recycling rates depends upon participation.
An example within Wales, in Bridgend County Borough Council (2013) represents a new system
that was brought in during June 2010. Weekly collection for recycling and a fortnightly collection
for general waste were introduced. This helped the borough move from being the second worst
17
performing Welsh LA to the most improved. This represents how LAs are encouraged to
increase recycling rate through comparison to others. In West Oxfordshire during November
2010, a new service brought in collection of food and garden waste. The general waste service
was changed to fortnightly. According to May Gurney (2012) the new service aimed at saving
the council taxpayers more than £500, 000 a year in operational costs by increasing the amount
of waste that is recycled. It was also expected to save the more than £2 million in landfill costs
over the 7 year contract. This represents a positive perception to change in recycling service.
Sorting into separate boxes at kerbside may not be needed if a Materials Recovery Facility
(MRF) is available. An example is Farington Waste Recovery Park, Lancashire, which serves
South Ribble, Preston, Chorley, Ribble Valley and West Lancashire. Lancashire County Council
(2013) states that the park sorts recycling into separate waste streams after collection. It also
includes a Mechanical Biological Treatment (MBT) plant that recovers materials from the
general waste such as paper, plastic and metal. It also includes the aerobic and anaerobic
treatment of biodegradable waste. However, it was suggested in BBC News (2012) that using
kerbside sorting avoids the building of sorting site, which can have negative economic impacts.
WRAP (2009) presents 3 options that are currently available for LA household waste collection:
1) Kerbside sort – sorting materials on kerbside into different compartments of a specifically
designed vehicle
2) Single stream co-mingled – collection in a single compartment with sorting of materials
taking place at an MRF.
3) Two stream co-mingled – households are provided with 2 containers, with different
materials placed in each. Collection by one vehicle, with 2 separate compartments.
Importance is placed upon the quality of materials gained from collection. WRAP (2009)
highlights that kerbside separation prevents contamination, giving the most reliable stream of
quality materials. It is taken into account that there may be practical and operational barriers to
kerbside sorting. When left with a choice of single or two stream co-mingled; the latter has
advantages of higher material quality and value. However, BBC News (2012) states that a new
European Directive, which comes into force in January 2015, may leave authorities with little
option but to scrap the co-mingled approach. This could have a negative impact, for example,
councils in Wales currently using the co-mingled system have found that residents favour the
simplicity.
18
The collection of waste by the LA can differ in terms of; how frequent each container is
collected, and the range of materials that are collected (e.g. heavy bulky items, or small items
like household batteries). Woodard et al (2005) noted that the most common frequency for
collection of recyclable materials in England and Wales was fortnightly. According to Icaro
Consulting (2011) this still remains, with the most common collection combination being
fortnightly alternate collection for general household waste and recyclables, and new weekly
collection of kitchen food waste. Woodard et al (2005) explains 2 main reasons for authorities
not being able to collect everything more frequently, including; the higher cost of operating a
weekly service, and the yields of materials being too small to validate a weekly service.
Noehammer and Byer (1997 cited in Woodard et al 2005) suggested that LAs have 3 options
when providing waste collection containers; to provide them free of charge, at a cost or not to
provide them at all. All UK LAs provide containers free of charge, which will encourage
participation due to fewer costs to the householder. Woodard et al (2005) studied the kerbside
scheme in the area of Horsham, South East England. It was found the most popular container
was a plastic box with a lid. This is contrasted today as many authorities are changing from
boxes to wheeled bins, (see 2.3). Despite the box preference in Horsham, Woodard et al (2005)
noted the advantages of wheeled bins, which include; no required lifting and availability in a
variety of sizes. Therefore wheeled bins have fewer difficulties physically, and size can be
altered to accommodate different waste streams. Woodard et al (2005) also mentioned
disadvantages to wheeled bins which include a greater expense than boxes and the larger size
may cause an issue for storage, especially in areas with dense housing.
LAs also use large bags or sacks for disposal. Wilson and Williams (2007) found that fewer
people complained about the size of the sack in comparison to a box. More residents were
happy with the design of the wheeled bin for garden waste, rather than the design of a box. This
study also found that the LA and the public seem to use different indicators to establish the
success of a scheme. The public is more influenced by personal preferences and behaviours,
while LAs rely on specific performance indicators, such as the tonnage of waste collected, and
how legislation is met.
19
Chapter 3 – Methodology
Literature relating to this study has been reviewed in the previous chapter. To obtain data for
this study, it was decided to develop and carry out 2 surveys within the location (see appendix 1
and 2). The first survey was posted in May 2012 before the new recycling service was rolled out
in Saughall. The second survey was posted in November 2012, after the new service had been
rolled out.
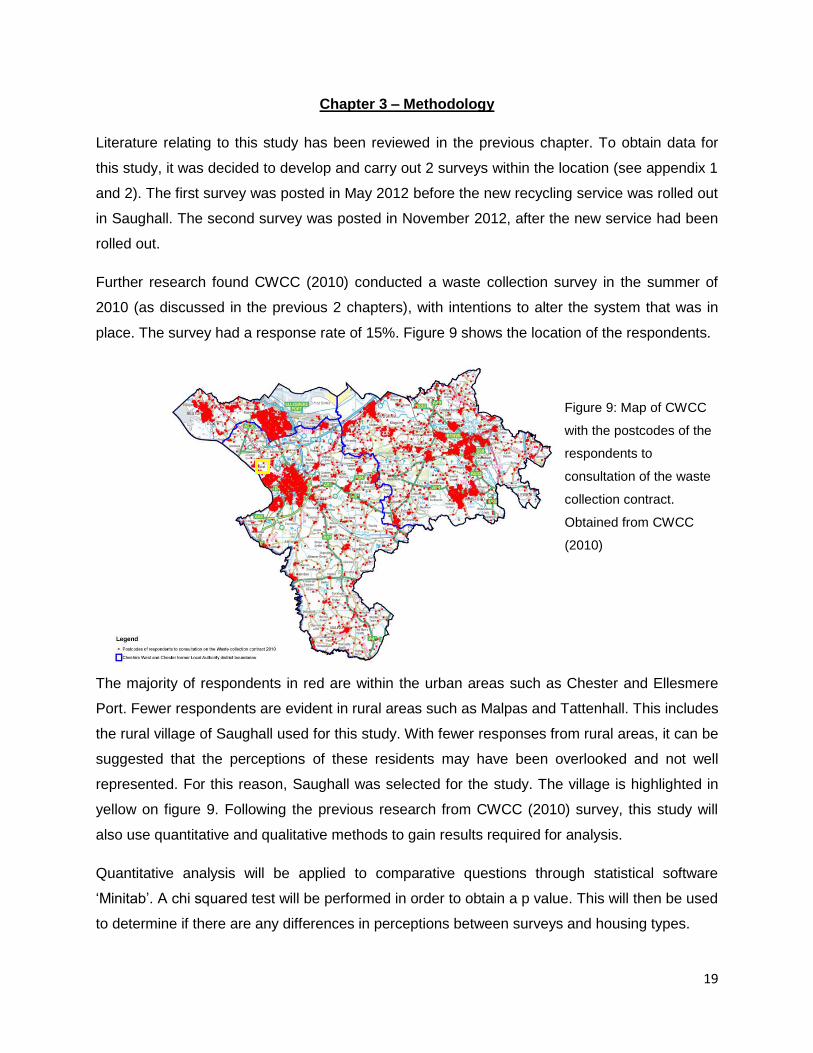
Further research found CWCC (2010) conducted a waste collection survey in the summer of
2010 (as discussed in the previous 2 chapters), with intentions to alter the system that was in
place. The survey had a response rate of 15%. Figure 9 shows the location of the respondents.
Figure 9: Map of CWCC
with the postcodes of the
respondents to
consultation of the waste
collection contract.
Obtained from CWCC
(2010)
The majority of respondents in red are within the urban areas such as Chester and Ellesmere
Port. Fewer respondents are evident in rural areas such as Malpas and Tattenhall. This includes
the rural village of Saughall used for this study. With fewer responses from rural areas, it can be
suggested that the perceptions of these residents may have been overlooked and not well
represented. For this reason, Saughall was selected for the study. The village is highlighted in
yellow on figure 9. Following the previous research from CWCC (2010) survey, this study will
also use quantitative and qualitative methods to gain results required for analysis.
Quantitative analysis will be applied to comparative questions through statistical software
‗Minitab‘. A chi squared test will be performed in order to obtain a p value. This will then be used
to determine if there are any differences in perceptions between surveys and housing types.
20
3.1 Method Development
Several different methods could have been chosen to obtain results for this study. Firstly, the
survey could have been online. Bethlehem (2009 p3) states that paper surveys are being
replaced by online surveys as they increase response speed and reduce costs. However, it
would have been difficult to target specific residents, and not all will have the internet available.
Door-to-door interviews could have been conducted. An issue here is the public are often
reluctant to answer, leading to a low response rate. A face-to-face questionnaire may have been
another option, however many do not have the time to stop and answer questions. Bethlehem
(2009 p3) suggested face-to-face interviews are time consuming and expensive. Also, choosing
the correct day and time to ask a variety of respondents would be difficult as residents each
have different routines.
Using postal surveys is beneficial as it will not have the same issues described above, although
Bethlehem (2009 p3) stated they lack the persuasive power of face-to-face interviews. The data
gathered from both surveys is primary data. Parsons and Knight (2005 p63) states an
advantage of obtaining primary data is that it is more specific to the problem. The surveys are
also a mix of qualitative and quantitative approaches. Roberts (2004 p113) discusses how
qualitative and quantitative approaches combined in a study complement each other by
providing results with greater breadth and depth.
3.2 Techniques Used
The purpose of using surveys is to gather accurate information required for analysis through the
use of quantitative and qualitative methods. To obtain perception of the change of system, 2
surveys will be conducted. The first being conducted in May 2012, before the change was in
place within Saughall. The second was conducted in November 2012 after the new service has
been rolled out. Attitudes towards each system will be analysed and compared. In turn, the
results from these 2 surveys will be compared with the 2010 CWCC survey. Each survey will be
separated into different sections for easier layout, and structure for respondents to follow.
A pilot survey was carried out to ensure the respondents could fully understand each question
and the language throughout. Several residents within Saughall were provided with the pilot
survey, and any suggestions or additional changes were applied.
21
Each finalised survey was delivered in a post-out and post-back format to residents, with a letter
providing a brief about the study, and how any contribution will help (see appendix 3). A pre-
paid addressed envelope was included, allowing residents to respond without cost.
A risk assessment of the research methodology was carried out before the surveys were posted
(see appendix 4). Possible risks included slips, trips and falls and the weather. There were also
the ethical issues of data protection and consent issues. These were all of low risk, and the
assessment was accepted, allowing the study to take place.
Survey 1 was posted in May 2012, before the new service was rolled out in Saughall during
October 2012. There were 100 surveys for each housing type. Every survey was coded
depending on household type it was posted to, with T for terraced, SD for semi-detached and D
for detached. Different housing types were included so different perceptions may be gained. For
example, a detached house may be more spacious, and have more room to store recycling
containers when compared to more compact terraced house. Certain questions within survey 1
are from secondary sources. Questions 6, 8, 15 and 17 were obtained from the original CWCC
2010 summer waste collection survey, allowing comparison. Questions 1, 24 and 25 were
obtained from a Manchester study by Cotterill et al (2008). Question 7 was obtained from a
similar survey by Eastleigh Borough Council (2010).
Survey 2 was posted in November 2012; one month after the new service was rolled out. There
were also 100 surveys for each housing type, with the same coding system as survey 1. Within
survey 2, questions 5, 10, and 20 to 25 are in the same format as survey 1. Questions 6 to 9,
11, 13 and 14 were based on comments from survey one about the new food waste caddy, the
potential high costs of the new service and the assisted service for elderly or disabled residents.
New questions were included due to the change of system, particularly the introduction of
kitchen food waste. Each survey also gave the respondent the option to leave a comment about
the recycling system in place within the study area.
3.3 Criticisms of Techniques Used
The disadvantages of using primary data, as suggested by Parsons and Knight (2005 p63) are:
it provides only a small data set, data collection can be tedious and it is time consuming. This
amount of surveys requires a vast amount of paper, producing a high cost. This format may also
restrict the amount of responses, as residents generally find it much quicker and easier to fill in
a survey online.
22
The household coding of the surveys may be useful, but the study area includes other housing
types such as bungalows, flats and a nursing home. All of which were left out of the study, not
gaining a full representation of the entire area. The flats and nursing home may also have a
different variation of the waste collection system in place, which may alter the perception.
3.4 Details of Sampling Procedure
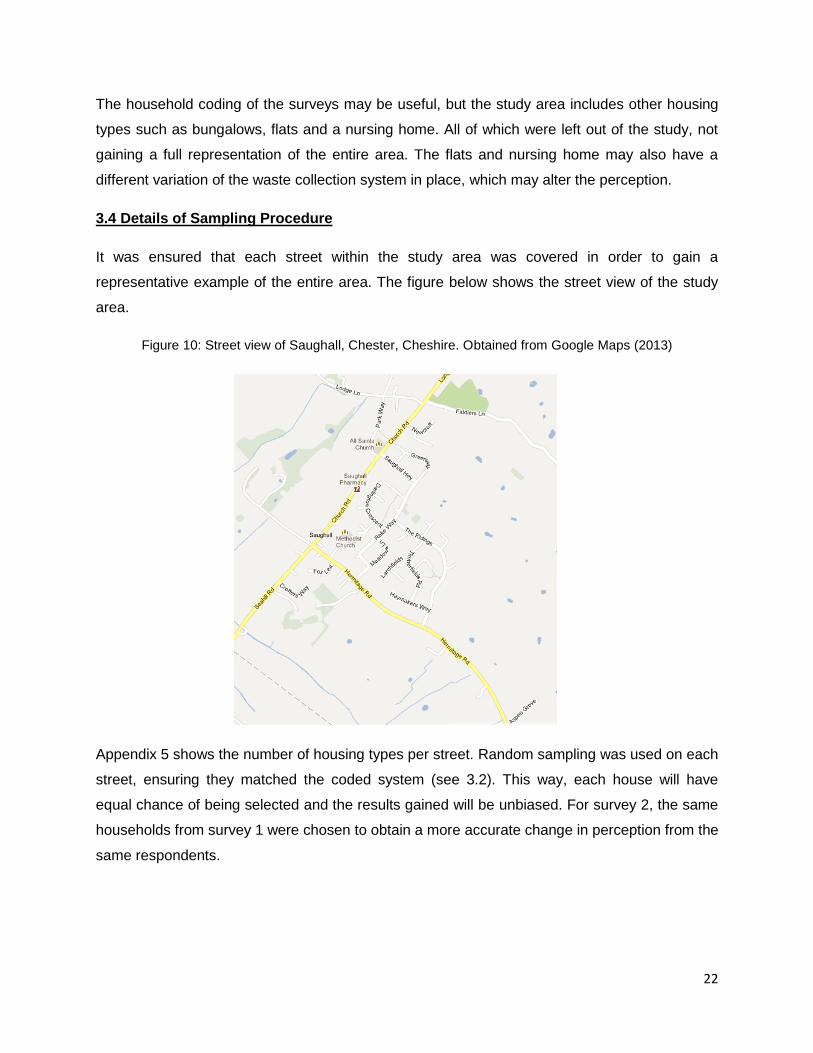
It was ensured that each street within the study area was covered in order to gain a
representative example of the entire area. The figure below shows the street view of the study
area.
Figure 10: Street view of Saughall, Chester, Cheshire. Obtained from Google Maps (2013)
Appendix 5 shows the number of housing types per street. Random sampling was used on each
street, ensuring they matched the coded system (see 3.2). This way, each house will have
equal chance of being selected and the results gained will be unbiased. For survey 2, the same
households from survey 1 were chosen to obtain a more accurate change in perception from the
same respondents.
23
29.37%
42.06%
28.57%
Number of Survey 1 Respondents per Household Type
SD
D
T
Chapter 4 – Results and Discussion
The previous chapter discussed the methods by which data was obtained for this study. Survey
one had a high response rate of 42%, while survey 2 had a lower response rate of 35%. These
are deemed as high rates, as stated by Saunders et al. (1997 cited in Lefever et al. 2007) rates
as low as 30% have been considered reasonable in posted surveys. Also Bethlehem (2009 pp,
3) specified rates tended to be lower in a postal survey. High rates may be due to the emotive
nature of the subject. All raw data can be seen in appendix 6 and 7. Firstly, a profile of the
respondents from both surveys is provided and then selected results from the first survey are
analysed before comparisons are made between both surveys and the CWCC 2010 summer
survey.
Following this, questions specific to survey 2 are discussed. Finally limitations of the study are
discussed, along with possible future work. Throughout this chapter, discussion focuses on
three key aspects: - 1) housing types, 2) perceptions on kitchen food waste and 3) issues
caused by the different collection systems.
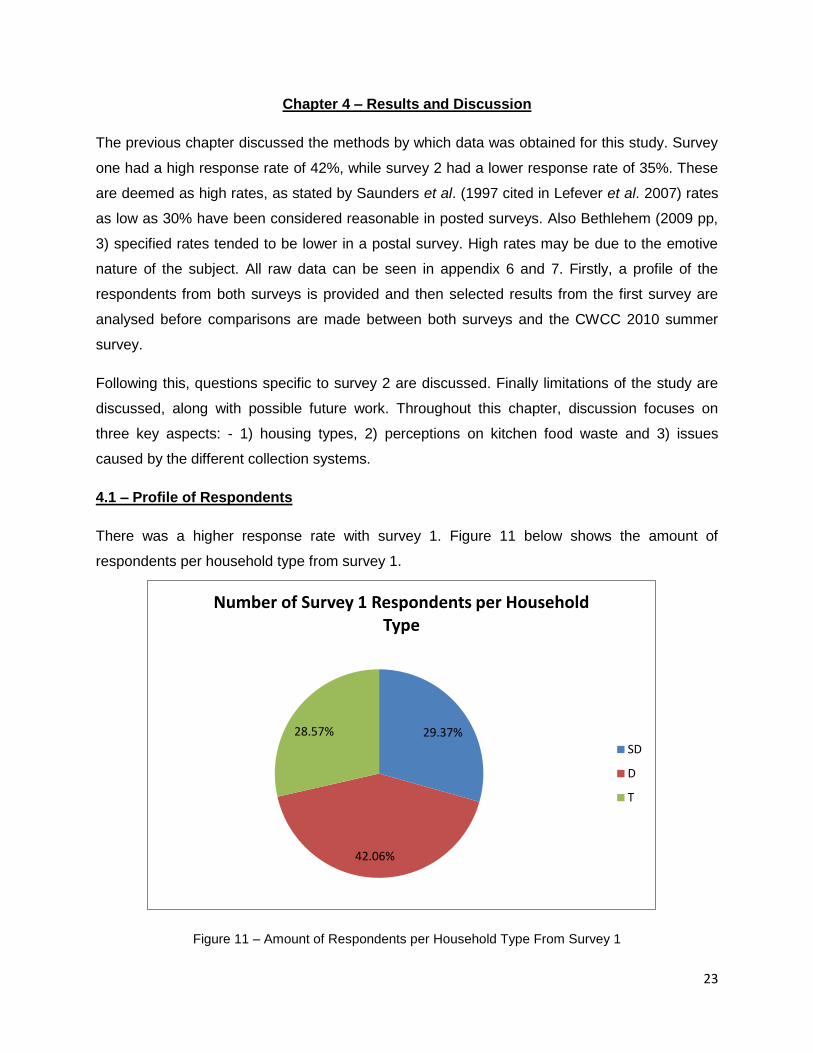
4.1 – Profile of Respondents
There was a higher response rate with survey 1. Figure 11 below shows the amount of
respondents per household type from survey 1.
Figure 11 – Amount of Respondents per Household Type From Survey 1
24
30.77%
40.38%
28.85%
Number of Survey 2 Respondents per Household Type
SD
D
T
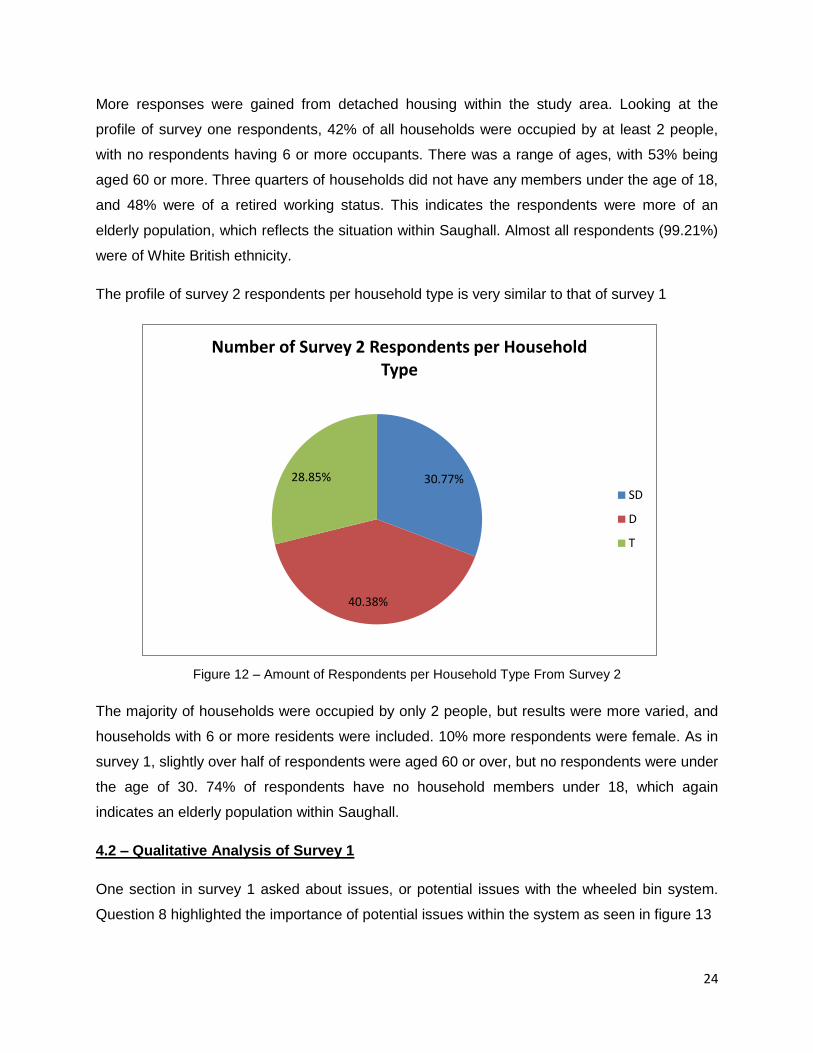
More responses were gained from detached housing within the study area. Looking at the
profile of survey one respondents, 42% of all households were occupied by at least 2 people,
with no respondents having 6 or more occupants. There was a range of ages, with 53% being
aged 60 or more. Three quarters of households did not have any members under the age of 18,
and 48% were of a retired working status. This indicates the respondents were more of an
elderly population, which reflects the situation within Saughall. Almost all respondents (99.21%)
were of White British ethnicity.
The profile of survey 2 respondents per household type is very similar to that of survey 1
Figure 12 – Amount of Respondents per Household Type From Survey 2
The majority of households were occupied by only 2 people, but results were more varied, and
households with 6 or more residents were included. 10% more respondents were female. As in
survey 1, slightly over half of respondents were aged 60 or over, but no respondents were under
the age of 30. 74% of respondents have no household members under 18, which again
indicates an elderly population within Saughall.
4.2 – Qualitative Analysis of Survey 1
One section in survey 1 asked about issues, or potential issues with the wheeled bin system.
Question 8 highlighted the importance of potential issues within the system as seen in figure 13
25
0.00%
10.00%
20.00%
30.00%
40.00%
50.00%
60.00%
70.00%
80.00%
90.00%
100.00%
Pe
rce
nta
ge (
%)
Potential Issues
Potential Issues Within The Recycling Service
Very Important
Fairly Important
Neither
Fairly Unimportant
Very Unimportant
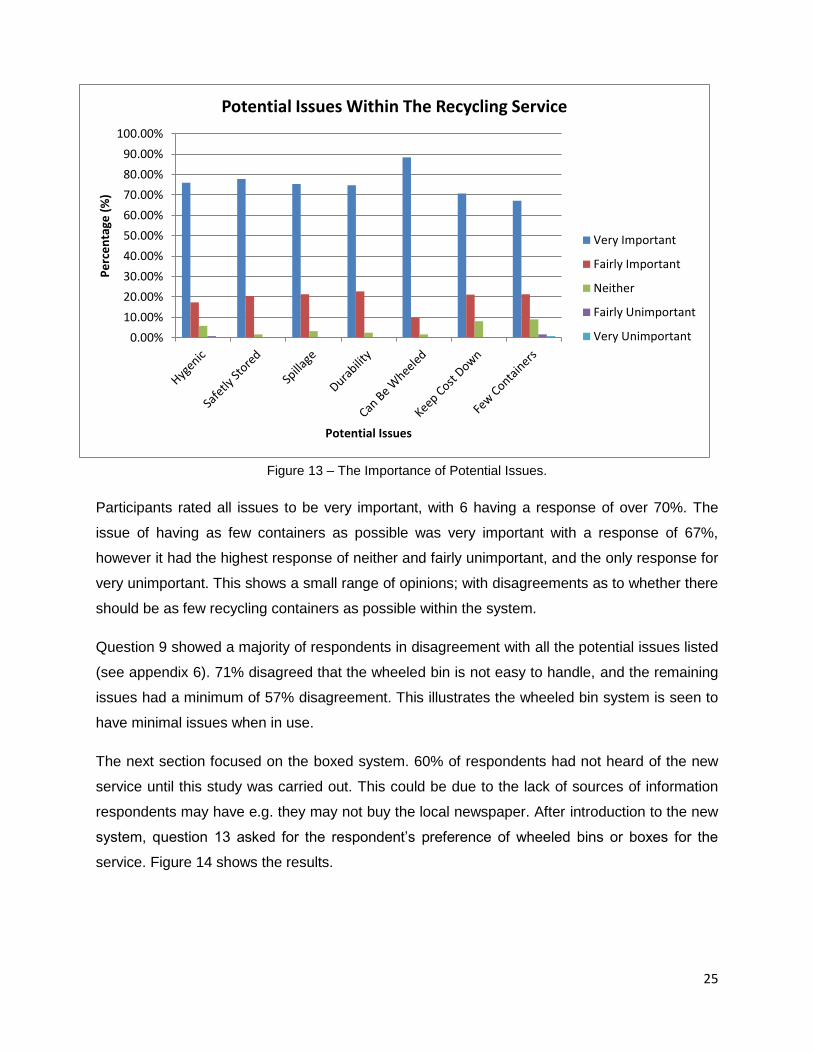
Figure 13 – The Importance of Potential Issues.
Participants rated all issues to be very important, with 6 having a response of over 70%. The
issue of having as few containers as possible was very important with a response of 67%,
however it had the highest response of neither and fairly unimportant, and the only response for
very unimportant. This shows a small range of opinions; with disagreements as to whether there
should be as few recycling containers as possible within the system.
Question 9 showed a majority of respondents in disagreement with all the potential issues listed
(see appendix 6). 71% disagreed that the wheeled bin is not easy to handle, and the remaining
issues had a minimum of 57% disagreement. This illustrates the wheeled bin system is seen to
have minimal issues when in use.
The next section focused on the boxed system. 60% of respondents had not heard of the new
service until this study was carried out. This could be due to the lack of sources of information
respondents may have e.g. they may not buy the local newspaper. After introduction to the new
system, question 13 asked for the respondent‘s preference of wheeled bins or boxes for the
service. Figure 14 shows the results.
26
85.83%
1.67% 12.50%
Preference of Wheeled Bin or Box Recycling Container
Wheeld Bin
Boxes
No Preference
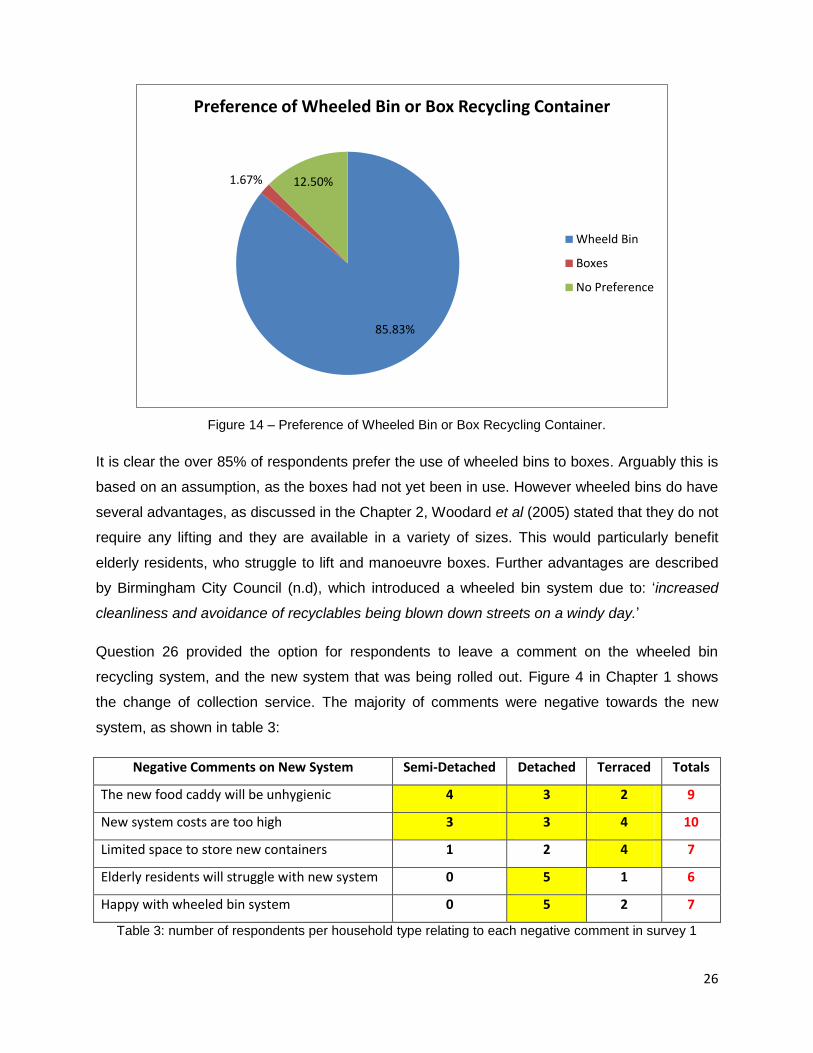
Figure 14 – Preference of Wheeled Bin or Box Recycling Container.
It is clear the over 85% of respondents prefer the use of wheeled bins to boxes. Arguably this is
based on an assumption, as the boxes had not yet been in use. However wheeled bins do have
several advantages, as discussed in the Chapter 2, Woodard et al (2005) stated that they do not
require any lifting and they are available in a variety of sizes. This would particularly benefit
elderly residents, who struggle to lift and manoeuvre boxes. Further advantages are described
by Birmingham City Council (n.d), which introduced a wheeled bin system due to: ‗increased
cleanliness and avoidance of recyclables being blown down streets on a windy day.‘
Question 26 provided the option for respondents to leave a comment on the wheeled bin
recycling system, and the new system that was being rolled out. Figure 4 in Chapter 1 shows
the change of collection service. The majority of comments were negative towards the new
system, as shown in table 3:
Negative Comments on New System Semi-Detached Detached Terraced Totals
The new food caddy will be unhygienic 4 3 2 9
New system costs are too high 3 3 4 10
Limited space to store new containers 1 2 4 7
Elderly residents will struggle with new system 0 5 1 6
Happy with wheeled bin system 0 5 2 7
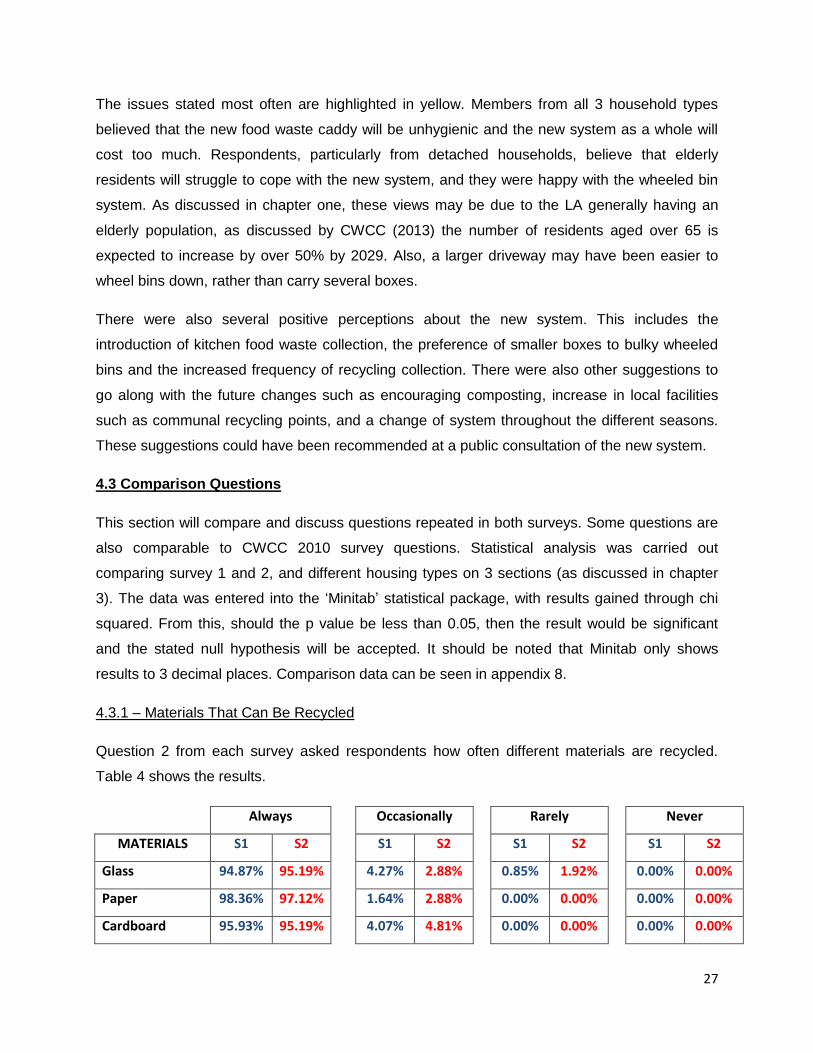
Table 3: number of respondents per household type relating to each negative comment in survey 1
27
The issues stated most often are highlighted in yellow. Members from all 3 household types
believed that the new food waste caddy will be unhygienic and the new system as a whole will
cost too much. Respondents, particularly from detached households, believe that elderly
residents will struggle to cope with the new system, and they were happy with the wheeled bin
system. As discussed in chapter one, these views may be due to the LA generally having an
elderly population, as discussed by CWCC (2013) the number of residents aged over 65 is
expected to increase by over 50% by 2029. Also, a larger driveway may have been easier to
wheel bins down, rather than carry several boxes.
There were also several positive perceptions about the new system. This includes the
introduction of kitchen food waste collection, the preference of smaller boxes to bulky wheeled
bins and the increased frequency of recycling collection. There were also other suggestions to
go along with the future changes such as encouraging composting, increase in local facilities
such as communal recycling points, and a change of system throughout the different seasons.
These suggestions could have been recommended at a public consultation of the new system.
4.3 Comparison Questions
This section will compare and discuss questions repeated in both surveys. Some questions are
also comparable to CWCC 2010 survey questions. Statistical analysis was carried out
comparing survey 1 and 2, and different housing types on 3 sections (as discussed in chapter
3). The data was entered into the ‗Minitab‘ statistical package, with results gained through chi
squared. From this, should the p value be less than 0.05, then the result would be significant
and the stated null hypothesis will be accepted. It should be noted that Minitab only shows
results to 3 decimal places. Comparison data can be seen in appendix 8.
4.3.1 – Materials That Can Be Recycled
Question 2 from each survey asked respondents how often different materials are recycled.
Table 4 shows the results.
Always Occasionally
Rarely
Never
MATERIALS S1 S2 S1 S2
S1 S2
S1 S2
Glass 94.87% 95.19%
4.27% 2.88%
0.85% 1.92%
0.00% 0.00%
Paper 98.36% 97.12%
1.64% 2.88%
0.00% 0.00%
0.00% 0.00%
Cardboard 95.93% 95.19%
4.07% 4.81%
0.00% 0.00%
0.00% 0.00%
28
Cans 94.31% 96.15%
4.07% 3.85%
1.63% 0.00%
0.00% 0.00%
Aluminium Foil 61.90% 67.65%
23.81% 25.49%
8.73% 3.92%
5.56% 2.94%
Household
Plastic 80.95% 85.00%
14.29% 11.00%
3.17% 2.00%
1.59% 2.00%
Garden Waste 91.80% 91.35%
1.64% 7.69%
2.46% 0.00%
4.10% 0.96%
Textiles 49.59% 56.57%
33.88% 26.26%
10.74% 14.14%
5.79% 3.03%
Kitchen Food
Waste 32.54% 75.25%
7.94% 11.88%
10.32% 5.94%
49.21% 6.93%
Used Cooking
Oil 6.35% 29.29%
5.56% 17.17%
17.46% 7.07%
70.63% 46.46%
Printer
Cartridges 26.40% 35.05%
12.00% 15.46%
9.60% 15.46%
52.00% 34.02%
Batteries 65.08% 64.00%
13.49% 20.00%
8.73% 11.00%
12.70% 5.00%
Spectacles 23.58% 19.59%
9.76% 14.43%
10.57% 14.43%
56.10% 51.55%
Shoes 37.30% 33.33%
19.84% 22.22%
12.70% 13.13%
30.16% 31.31%
Used Engine Oil 12.50% 24.74%
0.83% 7.22%
1.67% 4.12%
85.00% 63.92%
Electrical Items 28.23% 33.66%
21.77% 18.81%
14.52% 11.88%
35.48% 35.64%
Mobile Phones 20.97% 21.21%
10.48% 15.15%
21.77% 21.21%
46.77% 42.42%
Tetrapacks 47.58% 56.44%
17.74% 22.77%
9.68% 11.88%
25.00% 8.91%
Table 4: S1 represents survey 1 results and S2 represents survey 2 results
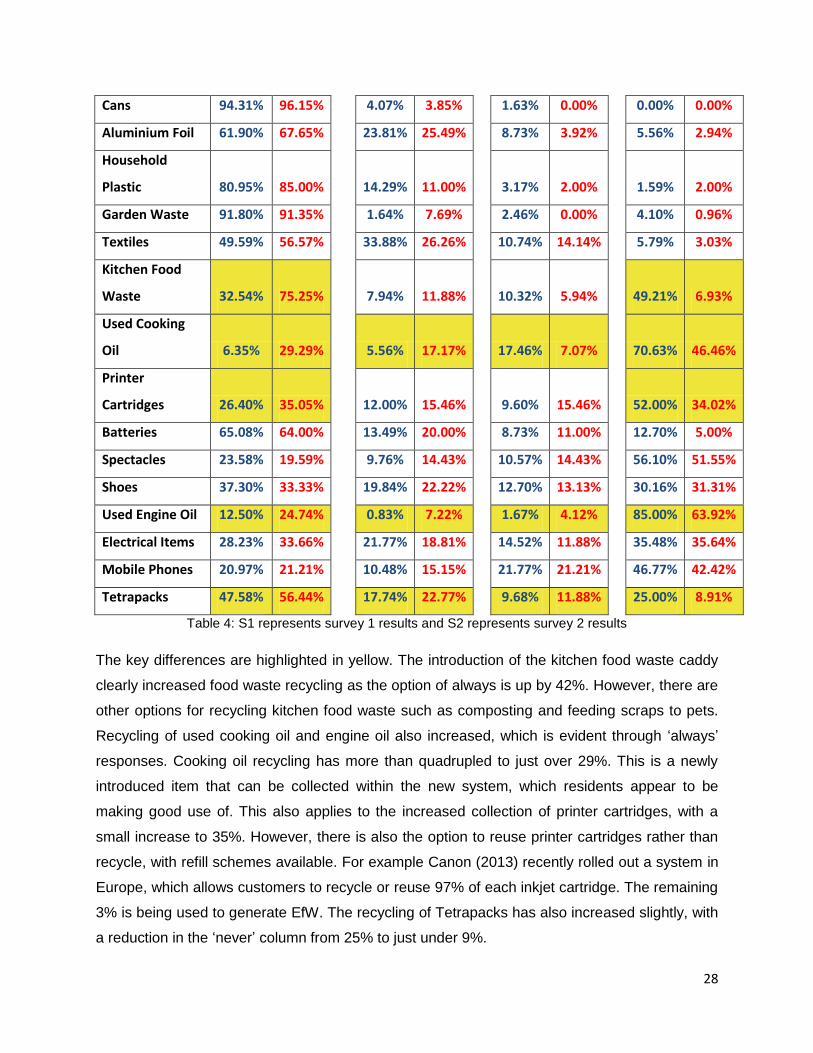
The key differences are highlighted in yellow. The introduction of the kitchen food waste caddy
clearly increased food waste recycling as the option of always is up by 42%. However, there are
other options for recycling kitchen food waste such as composting and feeding scraps to pets.
Recycling of used cooking oil and engine oil also increased, which is evident through ‗always‘
responses. Cooking oil recycling has more than quadrupled to just over 29%. This is a newly
introduced item that can be collected within the new system, which residents appear to be
making good use of. This also applies to the increased collection of printer cartridges, with a
small increase to 35%. However, there is also the option to reuse printer cartridges rather than
recycle, with refill schemes available. For example Canon (2013) recently rolled out a system in
Europe, which allows customers to recycle or reuse 97% of each inkjet cartridge. The remaining
3% is being used to generate EfW. The recycling of Tetrapacks has also increased slightly, with
a reduction in the ‗never‘ column from 25% to just under 9%.
29
Looking at the quantitative analysis, key materials were selected for comparison, including
glass, paper, cardboard, plastic, garden waste and kitchen food waste. The hypotheses are
stated below:
Null hypothesis: There is no influence of change in waste management collection scheme on
behaviour towards recycling these materials
Alternate hypothesis: There is an influence of change in waste management collection
scheme on behaviour towards recycling these materials
Glass, paper, cardboard and plastic obtained a p value of 0.685, 0.526, 0.786 and 0.820
respectively. All of these values are above the 0.05 level; therefore the null hypothesis is
accepted for these materials. This shows how these materials are still perceived as being key
materials to recycle, despite the system change.
Garden and kitchen food waste obtained a p value of 0.026 and 0.000 (keeping in mind Minitab
only shows the first 3 decimal places) respectively. Both of these values are below the 0.05
level; therefore the null hypothesis is rejected and the alternate hypothesis is accepted. It is
evident in table 4 that these materials have increased importance within the new system due to
fewer respondents claiming to never recycle, and an increase of respondents claiming to always
recycle both materials.
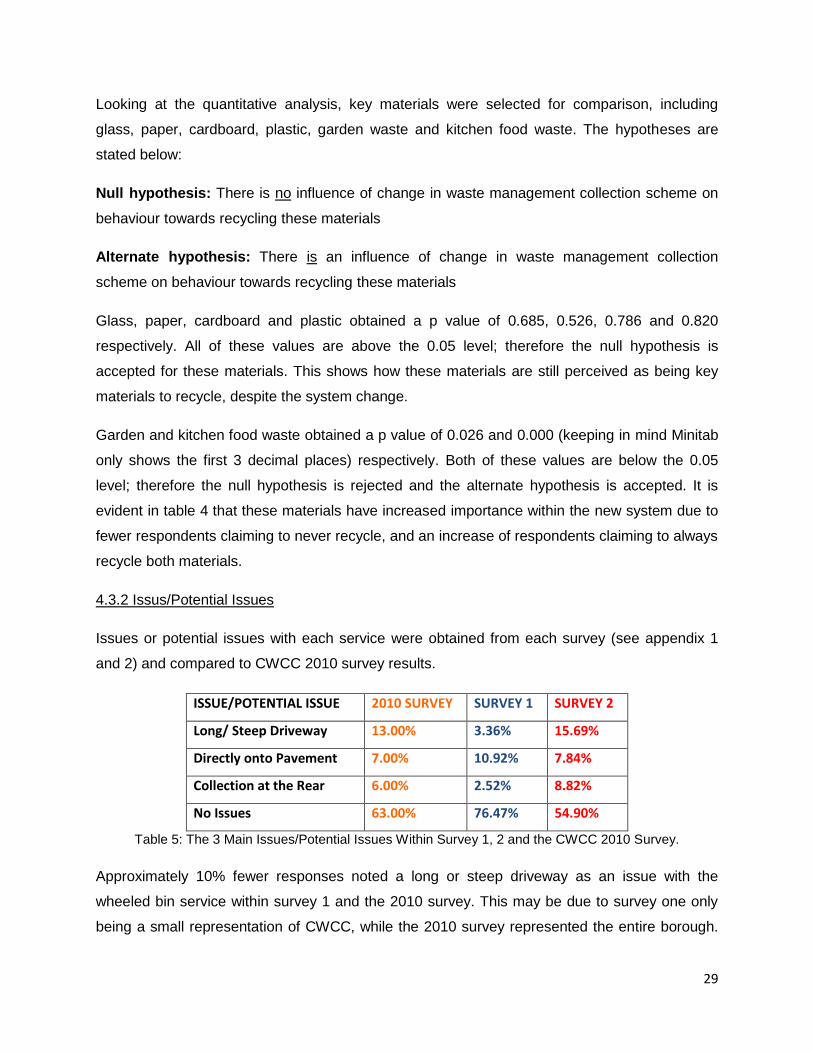
4.3.2 Issus/Potential Issues
Issues or potential issues with each service were obtained from each survey (see appendix 1
and 2) and compared to CWCC 2010 survey results.
ISSUE/POTENTIAL ISSUE 2010 SURVEY SURVEY 1 SURVEY 2
Long/ Steep Driveway 13.00% 3.36% 15.69%
Directly onto Pavement 7.00% 10.92% 7.84%
Collection at the Rear 6.00% 2.52% 8.82%
No Issues 63.00% 76.47% 54.90%
Table 5: The 3 Main Issues/Potential Issues Within Survey 1, 2 and the CWCC 2010 Survey.
Approximately 10% fewer responses noted a long or steep driveway as an issue with the
wheeled bin service within survey 1 and the 2010 survey. This may be due to survey one only
being a small representation of CWCC, while the 2010 survey represented the entire borough.
30
The survey 2 response is 2% higher, showing that respondents find it more of an issue with a
boxed system. Response to the issue of having a property that opens directly onto the
pavement is higher in survey 1. This suggests that respondents, without long or steep
driveways, find it easier to place boxes directly onto the pavement rather than wheeled bins,
however the response rate only 0.84% larger than the 2010 survey. Collection at the rear of the
property appears to be much more of an issue in survey 2, with the boxed service.
There is a clear difference between survey 1 and 2, with 76% of residents in survey one
claiming no issues with the wheeled bin system, while 54% of respondents in survey 2 claimed
no issues with the new boxed system. Therefore, respondents find more issues within the new
system. This could be because respondents are simply not used to the new system as of yet,
and a survey conducted at a later date may have shown fewer issues.
The quantitative analysis of issues/potential issues compared responses from different
household types within survey 1 and survey 2. The hypotheses are stated below:
Null hypothesis: There is no difference in issues/potential issues that may arise in waste
management collection schemes.
Alternate hypothesis: There is a difference in issues/potential issues that may arise in waste
management collection schemes.
Semi-detached housing and detached housing obtained a p value of 0.013 and 0.011
respectively. Both values are below the 0.05 level; therefore the null hypothesis is rejected and
the alternate hypothesis of is accepted. This is represented by the values (see appendix 9)
showing more issues were noted by respondents from semi-detached and detached
households, with the new system.
Terraced housing obtained a p value of 0.646. This is above the 0.05 level; therefore the null
hypothesis is accepted. The values (see appendix 9) show there is minimal difference in the
number of issues highlighted by respondents from terraced households
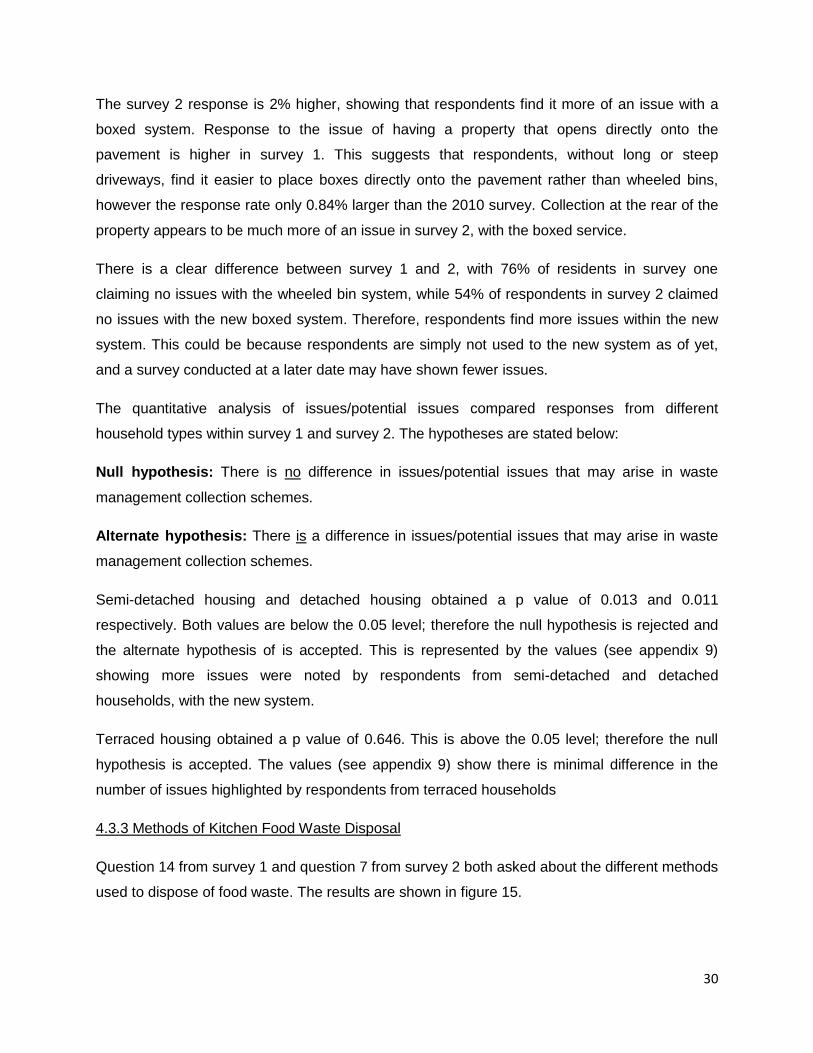
4.3.3 Methods of Kitchen Food Waste Disposal
Question 14 from survey 1 and question 7 from survey 2 both asked about the different methods
used to dispose of food waste. The results are shown in figure 15.
31
0.00%
10.00%
20.00%
30.00%
40.00%
50.00%
60.00%
70.00%
80.00%
Use General Use Compost Bin Other Kitchen FoodCaddy
Pe
rce
nta
ge (
%)
Methods of Disposal
Methods of Food Waste Disposal
Survey 1
Survey 2
Figure 15: Different methods that are used by respondents to dispose of kitchen food waste.
Before the new kitchen food waste caddy was introduced, 70% of residents used the general
household waste bin to dispose of their kitchen food waste. When the caddy was introduced,
approximately 60% of respondents use it, giving a large decrease of 50% using the general
household waste bin. Another option available is composting at home or in a shared facility.
This dropped slightly from 22% to 17%. WRAP (2008a) suggests that 88% of food waste is
collected by UK LAs, and not all of this is recycled, some will still be going to landfill. The
remaining 12% will is composted at home, fed to animals or disposed of down the sink.
Quantitative analysis was also obtained for methods of kitchen food waste disposal, with the
hypotheses stated below:
Null hypothesis: There is no influence of change in waste management collection scheme on
behaviour towards kitchen food waste disposal
Alternate hypothesis: There is influence of change in waste management scheme on
behaviour towards kitchen food waste disposal
The options of food waste disposal between both surveys obtained a p value of 0.000. As this is
below the 0.05 level, the null hypothesis is rejected. Therefore the alternate hypothesis is
accepted. This will be due to the introduction of the kitchen food waste caddys in the new
service.
32
19.72%
60.56%
13.38%
4.23% 2.11%
Disposal of Kitchen Food Waste
General Waste Black Bin
Kitchen Food Caddy
My Own Composting Bin
Contribute to OtherCompost Bin
Other
4.4 Qualitative Analysis of Survey 2 Questions
One section asked about the separation of waste. A majority at least 30% of respondents in
question 5 agreed with most of the statements. However 37% disagreed that there is not
enough room to store separate recycling boxes. There was a slight majority of 27% in strong
agreement that separating materials is too complicated. This may be due to lack of practice, and
should become less complicated in time. Research from WRAP (2008) suggested several
barriers preventing householders from recycling. These barriers represent struggles of
separating waste. A behavioural barrier is evident with householders being pre occupied, and
finding it difficult to store waste. Along with this, a barrier of not knowing which materials go
where will influence separation. However, the new system was provided with information leaflets
stating ‗what goes where‘ (see appendix 10).
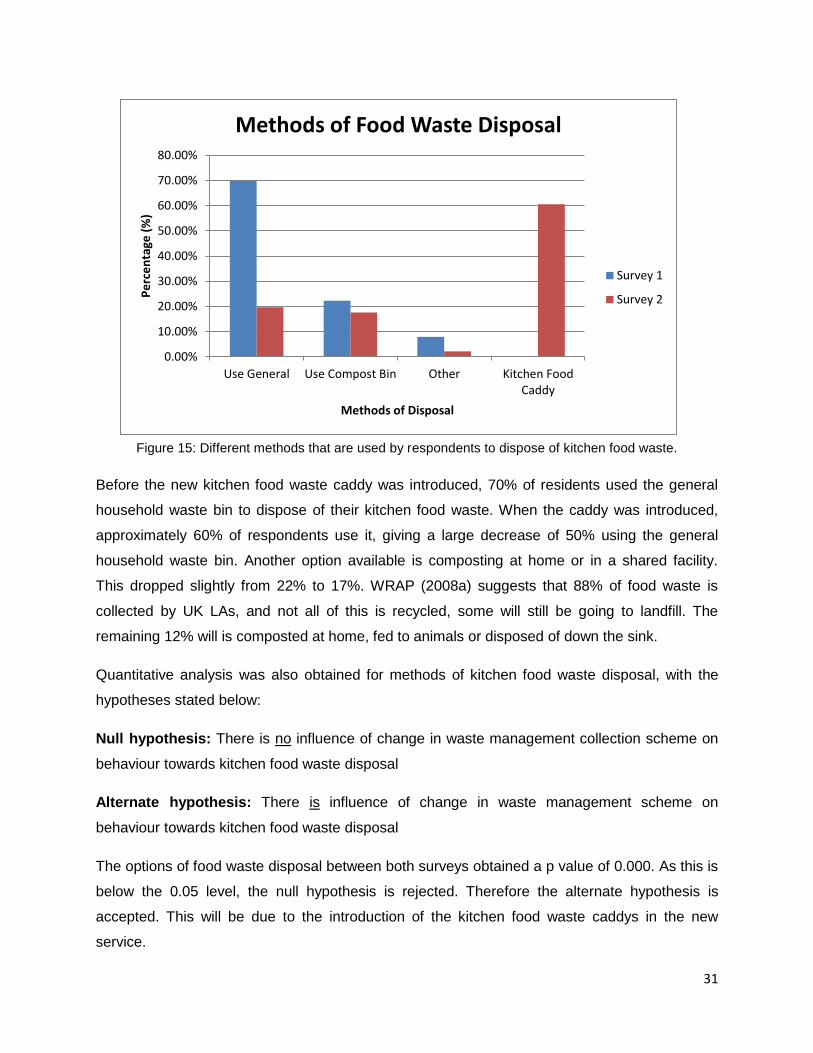
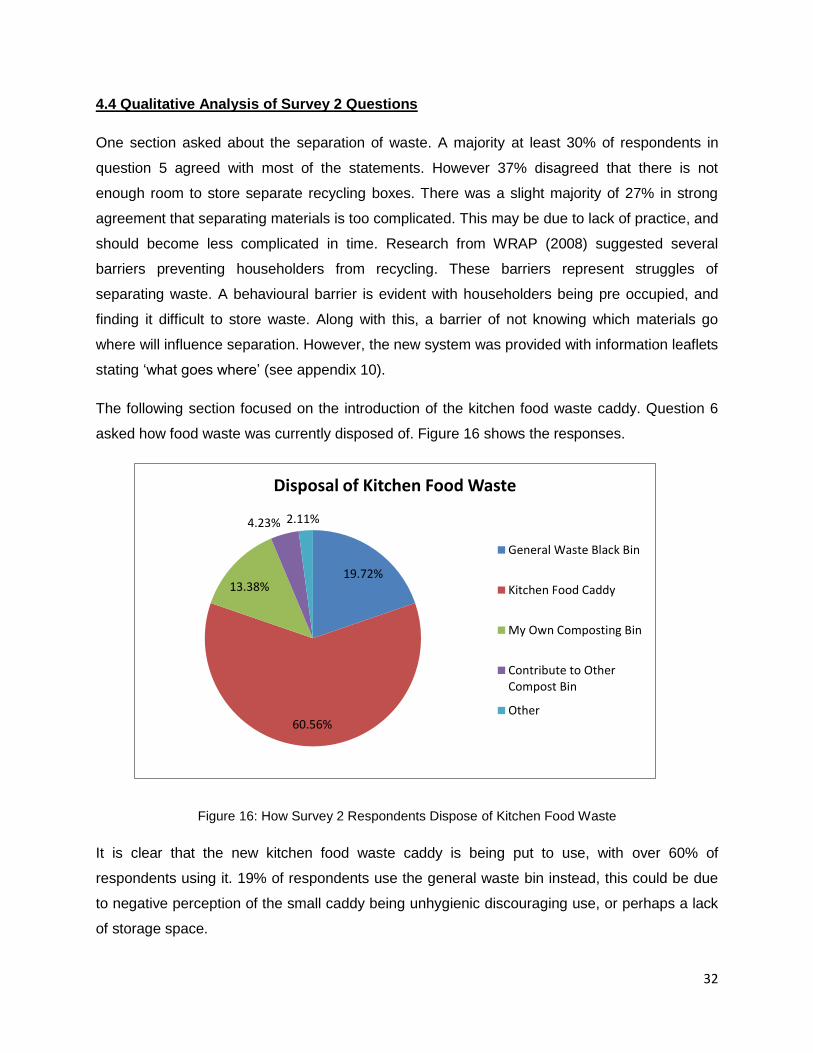
The following section focused on the introduction of the kitchen food waste caddy. Question 6
asked how food waste was currently disposed of. Figure 16 shows the responses.
Figure 16: How Survey 2 Respondents Dispose of Kitchen Food Waste
It is clear that the new kitchen food waste caddy is being put to use, with over 60% of
respondents using it. 19% of respondents use the general waste bin instead, this could be due
to negative perception of the small caddy being unhygienic discouraging use, or perhaps a lack
of storage space.
33
0.00%
5.00%
10.00%
15.00%
20.00%
25.00%
30.00%
35.00%
40.00%
45.00%
50.00%
Bags Are TooExpensive
Bags ShouldBe MoreReadily
Available
Newspaper isA Useful Liner
Bags EasilySplit
Bags Are TooSmall
Pe
rce
nta
ge (
%)
Statement
Statements Relating to the Small Caddy Liner
Strongly Agree
Agree
Neither
Disagree
Strongly Disagree
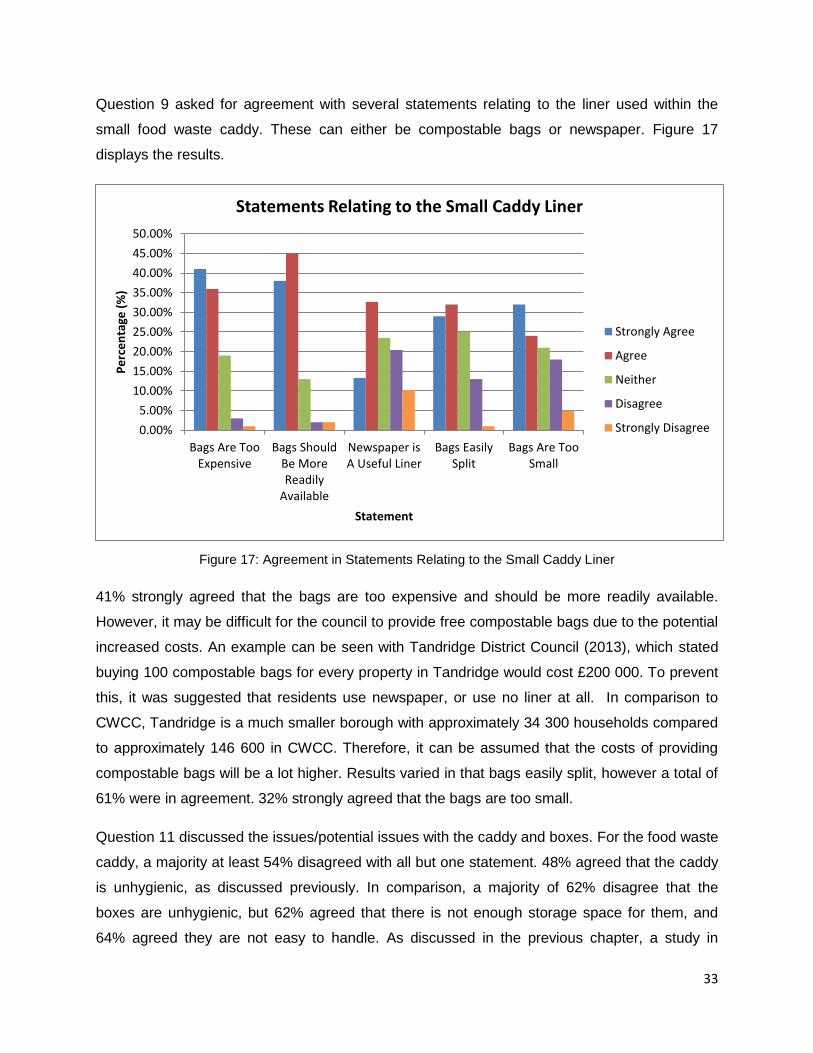
Question 9 asked for agreement with several statements relating to the liner used within the
small food waste caddy. These can either be compostable bags or newspaper. Figure 17
displays the results.
Figure 17: Agreement in Statements Relating to the Small Caddy Liner
41% strongly agreed that the bags are too expensive and should be more readily available.
However, it may be difficult for the council to provide free compostable bags due to the potential
increased costs. An example can be seen with Tandridge District Council (2013), which stated
buying 100 compostable bags for every property in Tandridge would cost £200 000. To prevent
this, it was suggested that residents use newspaper, or use no liner at all. In comparison to
CWCC, Tandridge is a much smaller borough with approximately 34 300 households compared
to approximately 146 600 in CWCC. Therefore, it can be assumed that the costs of providing
compostable bags will be a lot higher. Results varied in that bags easily split, however a total of
61% were in agreement. 32% strongly agreed that the bags are too small.
Question 11 discussed the issues/potential issues with the caddy and boxes. For the food waste
caddy, a majority at least 54% disagreed with all but one statement. 48% agreed that the caddy
is unhygienic, as discussed previously. In comparison, a majority of 62% disagree that the
boxes are unhygienic, but 62% agreed that there is not enough storage space for them, and
64% agreed they are not easy to handle. As discussed in the previous chapter, a study in
34
2.46% 6.56%
13.93%
4.10%
4.92%
4.10%
59.02%
4.92%
Pests Dealt With in The New Service
Rats
Mice
Flies
Maggots
Foxes
Birds
None
Other
Daventry by Mattsson et al. (2003) proposed 4 bins would cause a problem for terraced housing
due to insufficient storage space.
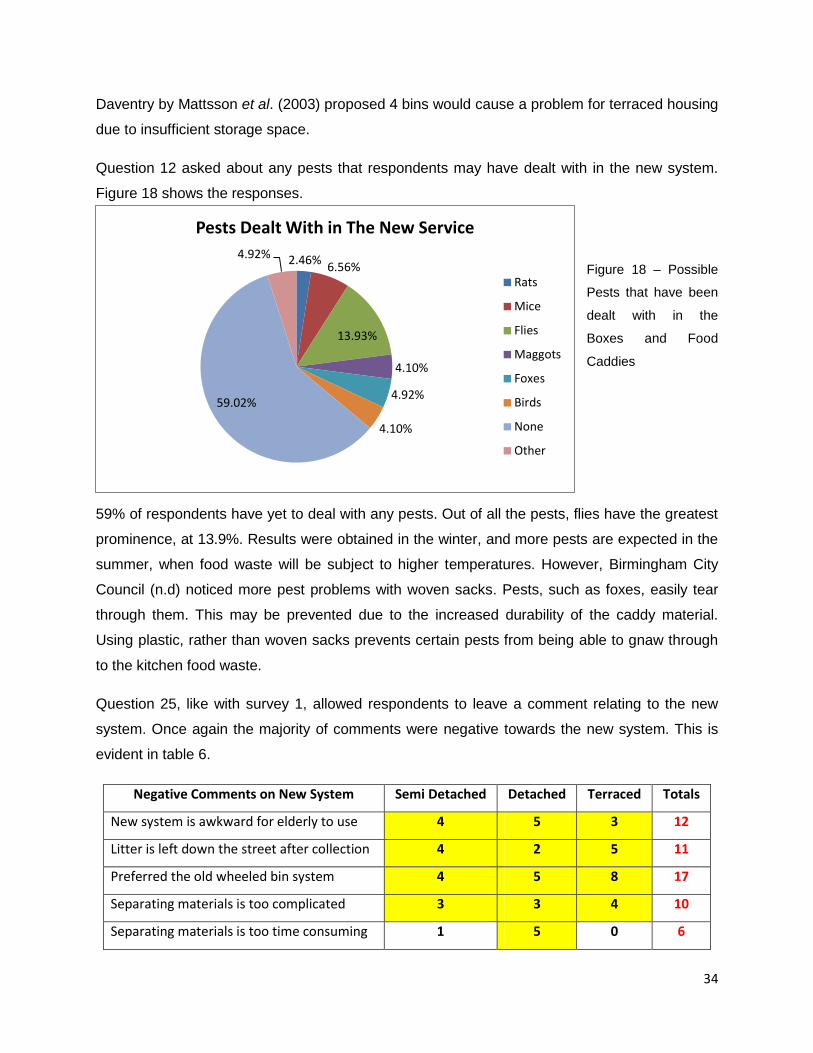
Question 12 asked about any pests that respondents may have dealt with in the new system.
Figure 18 shows the responses.
Figure 18 – Possible
Pests that have been
dealt with in the
Boxes and Food
Caddies
59% of respondents have yet to deal with any pests. Out of all the pests, flies have the greatest
prominence, at 13.9%. Results were obtained in the winter, and more pests are expected in the
summer, when food waste will be subject to higher temperatures. However, Birmingham City
Council (n.d) noticed more pest problems with woven sacks. Pests, such as foxes, easily tear
through them. This may be prevented due to the increased durability of the caddy material.
Using plastic, rather than woven sacks prevents certain pests from being able to gnaw through
to the kitchen food waste.
Question 25, like with survey 1, allowed respondents to leave a comment relating to the new
system. Once again the majority of comments were negative towards the new system. This is
evident in table 6.
Negative Comments on New System Semi Detached Detached Terraced Totals
New system is awkward for elderly to use 4 5 3 12
Litter is left down the street after collection 4 2 5 11
Preferred the old wheeled bin system 4 5 8 17
Separating materials is too complicated 3 3 4 10
Separating materials is too time consuming 1 5 0 6
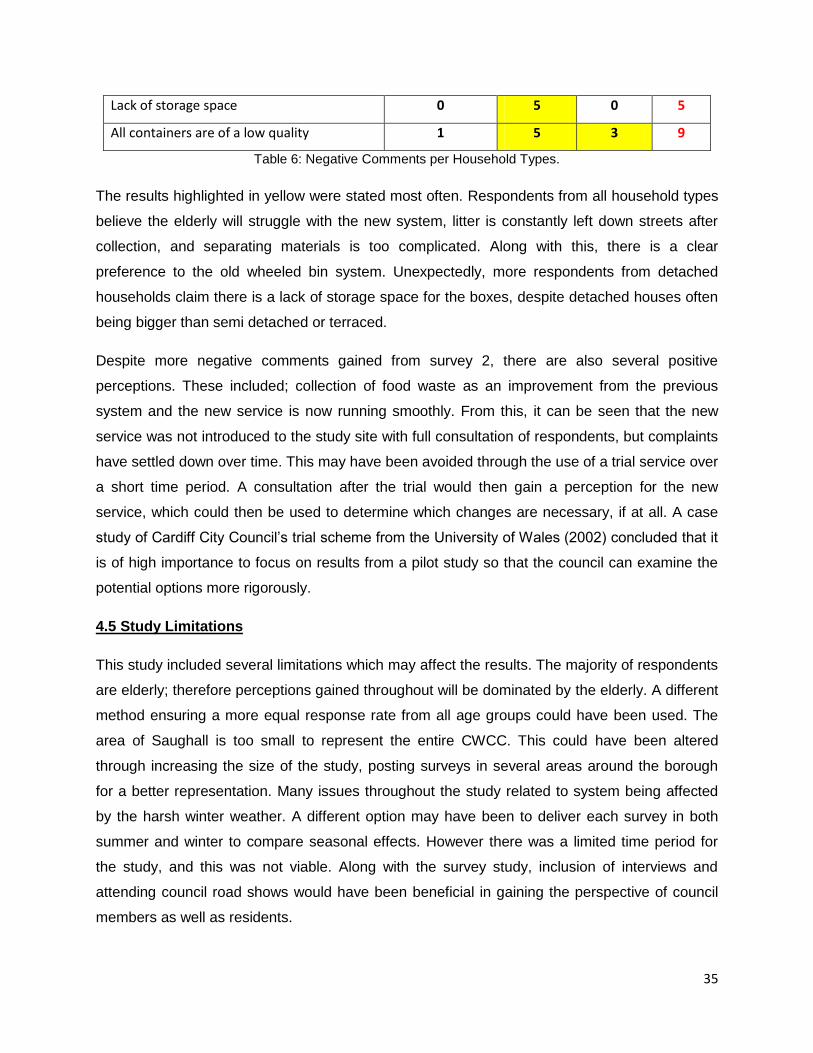
35
Lack of storage space 0 5 0 5
All containers are of a low quality 1 5 3 9
Table 6: Negative Comments per Household Types.
The results highlighted in yellow were stated most often. Respondents from all household types
believe the elderly will struggle with the new system, litter is constantly left down streets after
collection, and separating materials is too complicated. Along with this, there is a clear
preference to the old wheeled bin system. Unexpectedly, more respondents from detached
households claim there is a lack of storage space for the boxes, despite detached houses often
being bigger than semi detached or terraced.
Despite more negative comments gained from survey 2, there are also several positive
perceptions. These included; collection of food waste as an improvement from the previous
system and the new service is now running smoothly. From this, it can be seen that the new
service was not introduced to the study site with full consultation of respondents, but complaints
have settled down over time. This may have been avoided through the use of a trial service over
a short time period. A consultation after the trial would then gain a perception for the new
service, which could then be used to determine which changes are necessary, if at all. A case
study of Cardiff City Council‘s trial scheme from the University of Wales (2002) concluded that it
is of high importance to focus on results from a pilot study so that the council can examine the
potential options more rigorously.
4.5 Study Limitations
This study included several limitations which may affect the results. The majority of respondents
are elderly; therefore perceptions gained throughout will be dominated by the elderly. A different
method ensuring a more equal response rate from all age groups could have been used. The
area of Saughall is too small to represent the entire CWCC. This could have been altered
through increasing the size of the study, posting surveys in several areas around the borough
for a better representation. Many issues throughout the study related to system being affected
by the harsh winter weather. A different option may have been to deliver each survey in both
summer and winter to compare seasonal effects. However there was a limited time period for
the study, and this was not viable. Along with the survey study, inclusion of interviews and
attending council road shows would have been beneficial in gaining the perspective of council
members as well as residents.
36
4.6 Future Work
Should the study be developed further, it could include other housing types such as flats,
bungalows and nursing homes. These may have different recycling systems in place, which
would lead to different perceptions. For example, Wain Court is a nursing home within the study
area, where waste is comingled. Unlike the rest of Saughall, there are no separation containers
provided by the council to the nursing home, due to several obstacles preventing this.
Perceptions on the system in place at this nursing home may differ to other housing types.
37
Chapter 5 – Conclusion
This chapter brings the final conclusions from the results obtained from survey 1 and survey 2.
Each survey gained a high response rate of 42% and 35% respectively due to household waste
management being an emotive subject. Handling household waste is a part of resident‘s
everyday lives, and it is one of the top environmental priorities. Particular focus was put on
different housing types, kitchen food waste and issues/potential issues with the recycling
service. Results met the aims of the study through showing a difference in public perception on
the wheeled bin service and the new recycling boxes.
5.1 Conclusions
Results suggest that there is a positive perception towards the old wheeled bin system. Just
over 76% of respondents claimed no issues with the wheeled bin system compared to with the
new box system. The major positive feature of this system is the bins come with wheels, which
makes moving the bins from one place to another arguably easier. Another positive feature is
the capacity of the bins, particularly the 240 litre blue bin, which is larger than both boxes in the
new system.
There was a strong negative perception towards the new box system for many reasons. This
includes an increase of potential issues, with only 54% of respondents claiming to have no
issues in survey 2 (the boxes system). While in the first survey a greater number (76%) claimed
no issues with the wheeled system. One issue is the capacity of each box being 55 litres,
totalling 110 litres. Respondents see this as too small, despite the increased frequency of
collection. A strong negative perception of the new system was the introduction of the kitchen
food waste caddy. Generally, respondents see the caddy as unhygienic as it will cause bad
odours and look unsightly. Along with this, respondents commented that the caddy has the
potential to attract pests such as flies and foxes. Another issue is the difficulty the elderly and
disabled have lifting and moving the boxes regardless of the assisted service that is in place, as
seen in the negative comments given for each survey (see chapter 4). This is due to lack of
wheels on the boxes, and how low down the boxes are. Helper trolleys are a solution to this,
however they are not provided by the council.
Despite the negatives, there are also a number of positive perceptions with the new system. A
small number of respondents suggested the introductory period of the system caused the
highest negative perception, but now the system is in place, issues have reduced, and the
38
system is running more smoothly. It is suggested that a trial period of the new system and an
increased amount of public consultation was needed before the new system was introduced to
alleviate initial concerns. The CWCC 2010 survey managed a 15% response rate, from this it
would be assumed many residents would know about the new system. However, 60% of
respondents in survey 1 stated they had not heard of the new system. The new system is
remaining on a 14 year contract; therefore change will not occur again for a long period of time.
Residents within CWCC must now live with the new system, and hope for increased
consultation when, and if, future changes occur. Results have not yet been gained showing a
change in recycling rates within CWCC since the new service, in order to meet UK and EU
legislation. However, despite the negative perception, participation (particularly with kitchen food
waste) has increased and may continue to do so.
Reference List
BBC News (2012) ‘Sorting recycling’ EU rule concerns Welsh Councils. [online] Available
via: <http://www.bbc.co.uk/news/uk-wales-politics-19066123> [Accessed 21 January 2013]
Bersi, E. (n.d) Landfills a thing of the past in Germany where advanced waste management
rules. [pdf] Available via
<http://www.seas.columbia.edu/earth/wtert/sofos/Evridiki_Bersi_Kathimerini.pdf> [Accessed
10 January 2013]
Bethlehem, JG (2009). Applied Survey Methods: A Statistical Perspective New Jersey.
Wiley.
Birmingham City Council (n.d) Consultation with householders regarding new wheelie bin
services in Birmingham [online] Available via:
<https://www.ors.org.uk/online/index.php?sid=891449&lang=en> [Accessed 14 March 2013]
Brent Council (2011) Environment and Planning: Enforcement of compulsory recycling.
[online] Available via:
<http://www.brent.gov.uk/streetcare2.nsf/Recycling%20collections/LBB-176> [Accessed 18
February 2013]
Bridgend County Borough Council (2013) Environment and Planning [online] Available via:
<http://www.bridgend.gov.uk/web/groups/public/documents/services/071606.hcsp>
[Accessed 1 March 2013]
Canon (2013) Canon rolls out inkjet cartridge recycling scheme to 15 markets in Europe
[online] Available via: <http://www.canon-
europe.com/About_Us/Press_Centre/Press_Releases/Consumer_News/News/Canon_inkjet
_cartridge_recycling.aspx> [Accessed 22 March 2013]
Cheshire Structural Changes Order (2008) Single tier local government in West Cheshire
[pdf] Available via
<http://www.legislation.gov.uk/uksi/2008/634/pdfs/uksi_20080634_en.pdf> [Accessed 20
January 2013]
Coopland P (2006) Is it Waste? Understanding the Definition of Waste.[online] Available via:
<http://www.sepa.org.uk/waste/waste_regulation/is_it_waste.aspx> [Accessed 12 January
2013]
CWCC (2010) Waste Collection Survey Summer 2010 Report [pdf] [Accessed 17 February
2013]
CWCC (2011) Saughall and Mollington Ward Profile. [pdf] Available via:
<http://www.westcheshiretogether.org.uk/pdf/20110428-SaughallandMollingtonWardProfile-
v01.pdf> [Accessed 20 January 2013]
CWCC (2012) Waste and Recycling [online] Available via:
<http://www.cheshirewestandchester.gov.uk/residents/waste_and_recycling.aspx>
[Accessed 20 October 2012]
CWCC (2013) Key statistics and Data
<http://www.cheshirewestandchester.gov.uk/your_council/key_statistics_and_data.aspx>
[Accessed 19 January 2013]
Davis, G. Phillips, PS. Read, AD. Iida, Y. (2006) Demonstrating the need for the
development of internal research capacity: Understanding recycling participation using the
Theory of Planned Behaviour in West Oxfordshire, UK. Elsevier.
DEFRA (2008) Local Authorities Waste Collection, England. [online] Available via
<http://www.defra.gov.uk/statistics/environment/waste/wrfg18-compostion/> [Accessed 20
January 2013]
DEFRA (2011) Applying the Waste Hierarchy: evidence summary [pdf] Available via:
<http://www.defra.gov.uk/publications/files/pb13529-waste-hierarchy-summary.pdf>
[Accessed 17 December 2011]
DEFRA (2012) Household waste recycling, by material – England [online] Available via:
<http://www.defra.gov.uk/statistics/environment/waste/wrfg15-hhmaterial/> [Accessed 16
December 2011]
DEFRA (2012a) Waste Legislation [online] Available via:
<http://www.defra.gov.uk/environment/waste/legislation/> [Accessed 3 January 2012]
DEFRA (2012b) Waste and Recycling [online] Available via:
<http://www.defra.gov.uk/environment/waste/> [Accessed 20 January 2013]
DEFRA (2012c) Local Authority collected waste for England – quarterly statistics. [online]
Available via: <http://www.defra.gov.uk/statistics/environment/waste/wrfg22-wrmswqtr/>
[Accessed 22 January 2013]
DEFRA (2012d) Waste and Recycling: Local Authorities [online] Available via:
<http://www.defra.gov.uk/environment/waste/local-authorities/> [Accessed 22 January 2013]
den Boer, E. den Boer J and Jager, J. (2005) Waste Management planning and
optimisation. Stuttgart: ibidem.
DETR (2000) The Waste Strategy [online] Available via:
<http://www.publications.parliament.uk/pa/cm199900/cmselect/cmenvtra/903/903m12.htm>
[Accessed 16 December 2011]
Eastleigh Borough Council (2010) Waste & Recycling Services Viewpoint Survey 6 July
2010 [online] Available via:
<https://selfserve.eastleigh.gov.uk/AF3/an/default.aspx/RenderForm/?ID=sYmFXones1r&F.
Name=BzwyXUoVvU5&fs2s=Tp8NhsLmvCa&fs2c=reqxZCiwhUk&fs2svr=AFE#1>
[Accessed 16 December 2011]
EU Waste Framework (1975) Council Directive of 15 July 1975 on waste [pdf] Available via:
http://eur-lex.europa.eu/LexUriServ/LexUriServ.do?uri=OJ:L:1975:194:0039:0041:EN:PDF
[Accessed 3 January 2012]
EU Waste Framework Directive (2008) Directive 2008/98/EC of the European Parliament
and of the Council of 19 November 2008 on waste and repealing certain Directives [online]
Available via: <http://eur-
lex.europa.eu/LexUriServ/LexUriServ.do?uri=OJ:L:2008:312:0003:0030:en:PDF> [Accessed
3 January 2012]
Europa (2009) Summaries of EU Legislation – Environment – Waste Management. [online]
Available via:
<http://europa.eu/legislation_summaries/environment/waste_management/ev0010_en.htm>
[Accessed 16 March 2012]
European Commission (2010) Being Wise With Waste: The EU’s approach to Waste
Management [pdf] Luxemburg Publications Office of The European Union. [pdf] Available
via <http://ec.europa.eu/environment/waste/pdf/WASTE%20BROCHURE.pdf> [Accessed
17 December 2011]
European Commission (2012) Directive 2008/98/EC on waste (Waste Framework Directive)
[online] Available via: <http://ec.europa.eu/environment/waste/framework/index.htm >
[Accessed 3 January 2012]
FOE (2009) Briefing: Pyrolysis, Gasification and Plasma [pdf] Available via
<http://www.foe.co.uk/resource/briefings/gasification_pyrolysis.pdf> [Accessed 17 February
2013]
Google Maps (2013) Saughall, Cheshire West and Chester [online] Available via
<http://maps.google.co.uk/maps/place?q=Saughall&hl=en&ftid=0x487adc5e2bc4869d:0x96
1f69099b688b8d> [Accessed 23 March 2013]
Hickman L (2011) A small town in Germany where recycling pays. The Guardian [online] 18
March. Available via: <http://www.guardian.co.uk/environment/2011/mar/18/recycling-
waste> [Accessed 1 September 2012]
Icaro Consulting (2011) Attitudes to Waste and Recycling in Great Britain 2011 [pdf]
Available via: <http://icaro-consulting.co.uk/wp/wp-content/uploads/2011/11/Attitudes-to-
Waste-and-Recycling-in-Great-Britain-2011-Web.pdf> [Accessed 17 February 2013]
Laing F (2007) City’s Recycling targets are just not good enough.[online] Available via
<http://franceslaing.wordpress.com/about/columns/> [Accessed 22 February 2012]
Lancashire County Council (2013) Lancashire’s Waste Network: Farington Waste Recovery
Park [online] Available via:
<http://www.lancashire.gov.uk/corporate/web/?siteid=6043&pageid=34767> [Accessed 23
January2013]
Lefever, S. Dal, M and Matthíasdóttir, A (2007). Online data collection in academic research:
advantages and limitations. British Journal of Education Technology. 38 (4) pp 574 - 582
Li, W. Ju, M. Liu, L. Wang, Y and Li, T (2011) The Effects of Biomass Solid Waste
Resources Technology in Economic Development. Energy Procedia. (5) pp 2455 - 2460
Lyas, JK. Shaw, PJ. Vugt, MV (2005) Kerbside recycling in the London borough of Havering:
progress and priorities. Resources, Conservation and Recycling 45 (1) pp 1–17
Martin, M. Williams, ID and Clark, M. (2006) Social, cultural and structural influences on
household waste recycling: a case study. Resources Conservation and Recycling 48 (4) pp.
357 – 395.
Mattsson, CH. Berg, PEO. Clarkson, PA (2003) The development of systems for property
close collection of recyclables: experiences from Sweden and England. Resources,
Conservation and Recycling 38 (1) pp 39 – 57.
May Gurney (2011) Environmental Services Cheshire West & Chester [online] Available via:
<http://www.maygurney.co.uk/recycling/cheshire.php> [Accessed 25 January 2013]
May Gurney (2012) West Oxfordshire District Council [online] Available via:
<http://www.maygurney.co.uk/customers/47.html> [Accessed 25 January 2013]
McDougall, Forbes R. White, Peter R. Franke, Marina (2008) Integrated Solid Waste
Management: A Life Cycle Inventory. Chichester, England. Wiley.
Noehammer, HC and Byer PH (1997). Effect of design variables on participation in
residential curbside recycling programs. Waste Management and Research, 15 pp 407 –
427.
Omran, A. Mahmood, A. Abdul Aziz, H. Robinson, GM. (2009) Investigating Households
attitude toward recycling of solid waste in Malaysia: a case study. International Journal of
Environmental Research. 3 (2) pp 275 – 288.
Ordnance Survey (2013) Interactive Mapping Cheshire West and Chester [online] Available
via: <http://maps.cheshire.gov.uk/CWAC/interactivemapping/# > [Accessed 19 January
2013]
Parsons, T and Knight, PG (2005) How to do your dissertation in geography and related
disciplines. Second Edition. New York: Routledge.
Poiesz TBC (1999) Gedragsmanagement, waarom mensen zict (niet) gedragen, Imerc by
Wormer [pdf] available via: <http://triade-model.nl/Gedragsmanagement_het_boek.pdf>
[Accessed 20/01/2012]
Read, A and Reed, S. (2003) Daventry's high diversion recycling programme: how to
engage the public, recycle and compost domestic waste and meet government targets
ahead of schedule Proceedings of the 18th International Conference on Solid Waste
Technology and Management, Philadelphia, PA, USA, 23–26 March
Rebitzer G, Schiller U, Schmidt WP. (2000) Methode euroMat‘98—Grundprinzipien und
Gesamtmethode. In: Fleischer et al. (Eds.); 2000. pp. 4 – 22;
Rebitzer, G. Ekvall, T. Frischknecht, R. Hunkeler, D. Norris, G. Rydberg, T. Schmidt, WP.
Suh, S. Weidema, BP. Pennington, DW (2004). Life cycle assessment part 1: Framework,
goal and scope definition, inventory analysis and applications. Environmental International.
30 (5) pp. 701 – 720.
Roberts, CM (2004). The dissertation journey: a practical and comprehensive guide to
planning, writing and defending your dissertation. California: Corwin Press
Rogers S (2011) Recycling Rates in England: How Does Your Town Compare? The
Guardian [online] 4th November. Available via:
<http://www.guardian.co.uk/news/datablog/2011/nov/04/recycling-rates-england-data>
[Accessed 7 November 2011]
Saunders, M., Lewis, P. & Thornhill, A. (1997). Research methods for business students.
London: Pitman Publishing.
Somerset Waste Partnership (2012) Waste management strategy [online] Available via <
http://www.somersetwaste.gov.uk/about/strategy/ > [Accessed 10/ January 2013]
Stookes P (2009) A Practical Approach To Environmental Law. 2nd ed. Oxford. Oxford
University Press.
Tandridge District Council (2013) FAQs: Are compostable caddy liners being provided free
of charge by the council? [online] Available via:
<http://www.tandridge.gov.uk/faq/faq.htm?mode=20&pk_faq=689> [Accessed 14 March
2013]
University of Wales (2002) Cardiff City County Council Public Consultation Pilot Waste
Management Scheme – Report of Findings [pdf] Available via:
<http://www.cardiff.gov.uk/F&FResearchReports2002PilotWasteManagementScheme.pdf>
[Accessed 14 March 2013]
Williams, ID and Cole C (2013). The impact of alternate weekly collections on waste
arisings. Science of the Total Environment. 445 – 446 pp 29 – 40.
Wilson, CDH and Williams, ID (2007) Kerbside collection: a case study from the North West
of England. Resources, Conservation and Recycling 52 (2) pp. 381 – 394
Winstanley K (2011) An Investigation into the Introduction of Larger Recycling Containers in
The Village of Staining, Fylde – Is Bigger Really Better? MSC. University of Central
Lancashire.
Woodard, R. Bench, M. Harder, MK (2005) The development of a UK kerbside scheme
using known practice. Journal of Environmental Management 75 (2) pp. 115 – 127.
WRAP (2008) Barriers to recycling at home [pdf] Available via:
<http://www.wrap.org.uk/sites/files/wrap/Barriers_to_Recycling_Summary_Report.pdf>
[Accessed 23 January 2013]
WRAP (2008a) Food Waste Report – The food we waste [pdf] Available via
<http://wrap.s3.amazonaws.com/the-food-we-waste.pdf> [Accessed 14 March 2013]
WRAP (2009) Choosing the right recycling collection system [pdf] Available via:
<http://www.wrap.org.uk/sites/files/wrap/Choosing%20the%20right%20recycling%20collecti
on%20system.pdf> [Accessed 21 January 2013]
WRAP (2010) Analysis of kerbside dry recycling performance in the UK 2008/09 [pdf]
Available via: <http://www.wrap.org.uk/sites/files/wrap/EVA143-
000%20Kerbside%20Dry%20Benchmarking%20UK%2008-
09%20Report%20FINAL%20for%20publication%20V2%201.pdf> [Accessed 21 January
2013]

WRAP (2012) Household Waste Recycling Centre (HWRC) Guide [pdf] Available via:
<http://www.wrap.org.uk/sites/files/wrap/INH0449_HWRC_Guide_%20final.pdf> [Accessed
21 January 2013]

Appendix 1
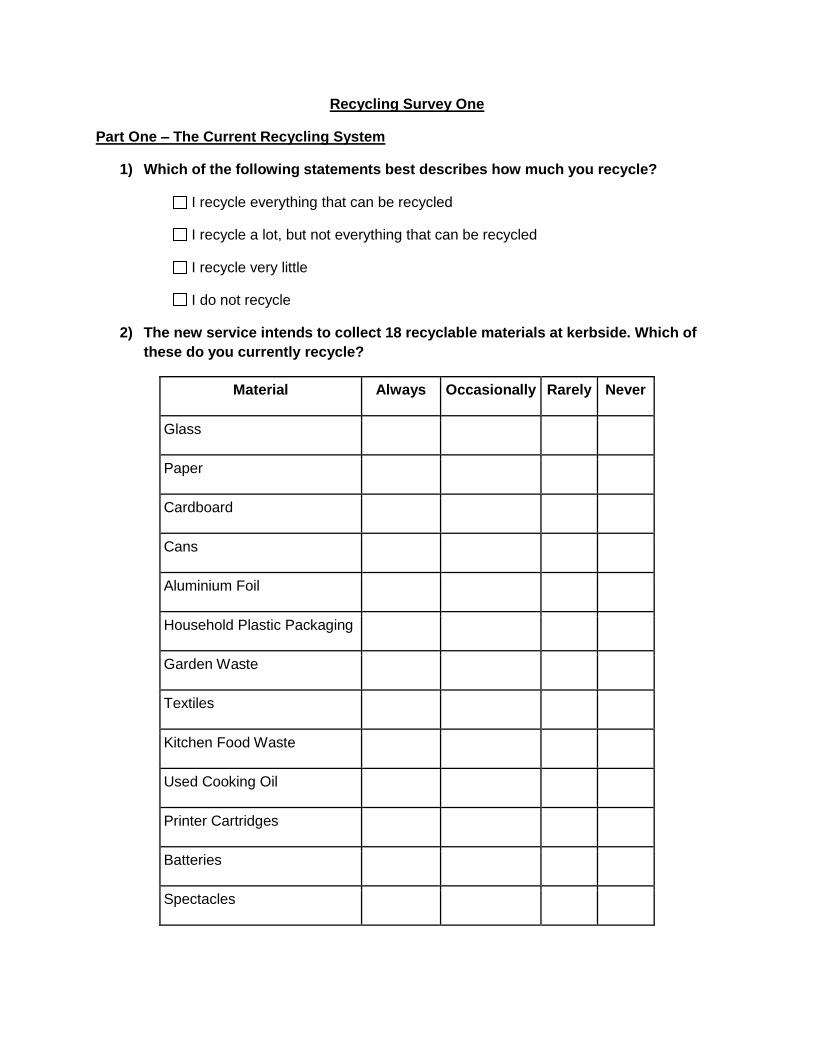
Recycling Survey One
Part One – The Current Recycling System
1) Which of the following statements best describes how much you recycle?
I recycle everything that can be recycled
I recycle a lot, but not everything that can be recycled
I recycle very little
I do not recycle
2) The new service intends to collect 18 recyclable materials at kerbside. Which of
these do you currently recycle?
Material Always Occasionally Rarely Never
Glass
Paper
Cardboard
Cans
Aluminium Foil
Household Plastic Packaging
Garden Waste
Textiles
Kitchen Food Waste
Used Cooking Oil
Printer Cartridges
Batteries
Spectacles
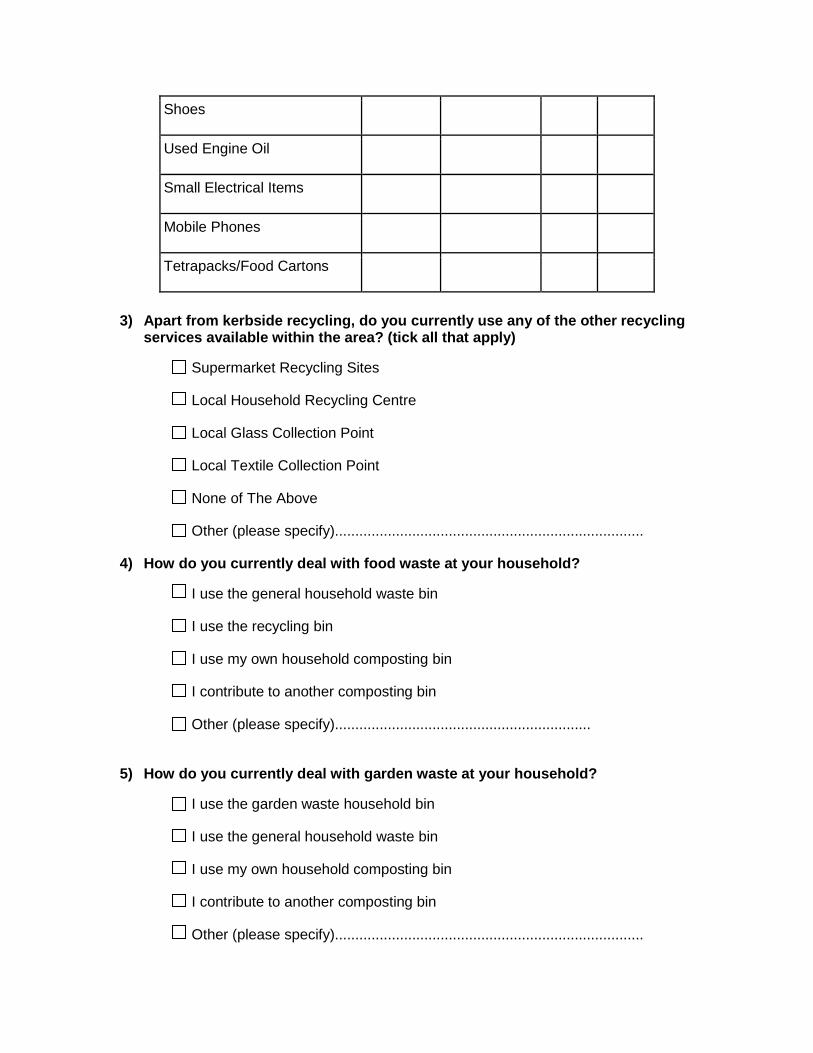
Shoes
Used Engine Oil
Small Electrical Items
Mobile Phones
Tetrapacks/Food Cartons
3) Apart from kerbside recycling, do you currently use any of the other recycling services available within the area? (tick all that apply)
Supermarket Recycling Sites
Local Household Recycling Centre
Local Glass Collection Point
Local Textile Collection Point
None of The Above
Other (please specify)............................................................................
4) How do you currently deal with food waste at your household?
I use the general household waste bin
I use the recycling bin
I use my own household composting bin
I contribute to another composting bin
Other (please specify)...............................................................
5) How do you currently deal with garden waste at your household?
I use the garden waste household bin
I use the general household waste bin
I use my own household composting bin
I contribute to another composting bin
Other (please specify)............................................................................
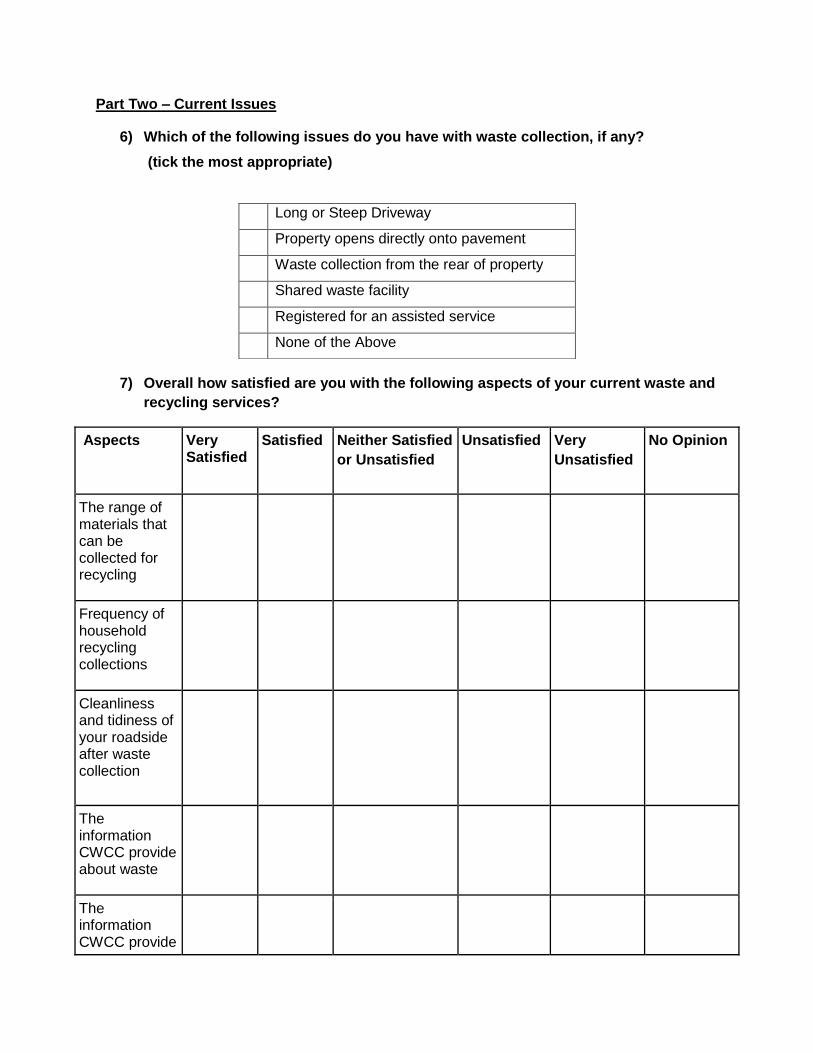
Part Two – Current Issues
6) Which of the following issues do you have with waste collection, if any?
(tick the most appropriate)
7) Overall how satisfied are you with the following aspects of your current waste and
recycling services?
Aspects Very Satisfied
Satisfied Neither Satisfied
or Unsatisfied
Unsatisfied Very
Unsatisfied
No Opinion
The range of materials that can be collected for recycling
Frequency of household recycling collections
Cleanliness and tidiness of your roadside after waste collection
The information CWCC provide about waste
The information CWCC provide
Long or Steep Driveway
Property opens directly onto pavement
Waste collection from the rear of property
Shared waste facility
Registered for an assisted service
None of the Above
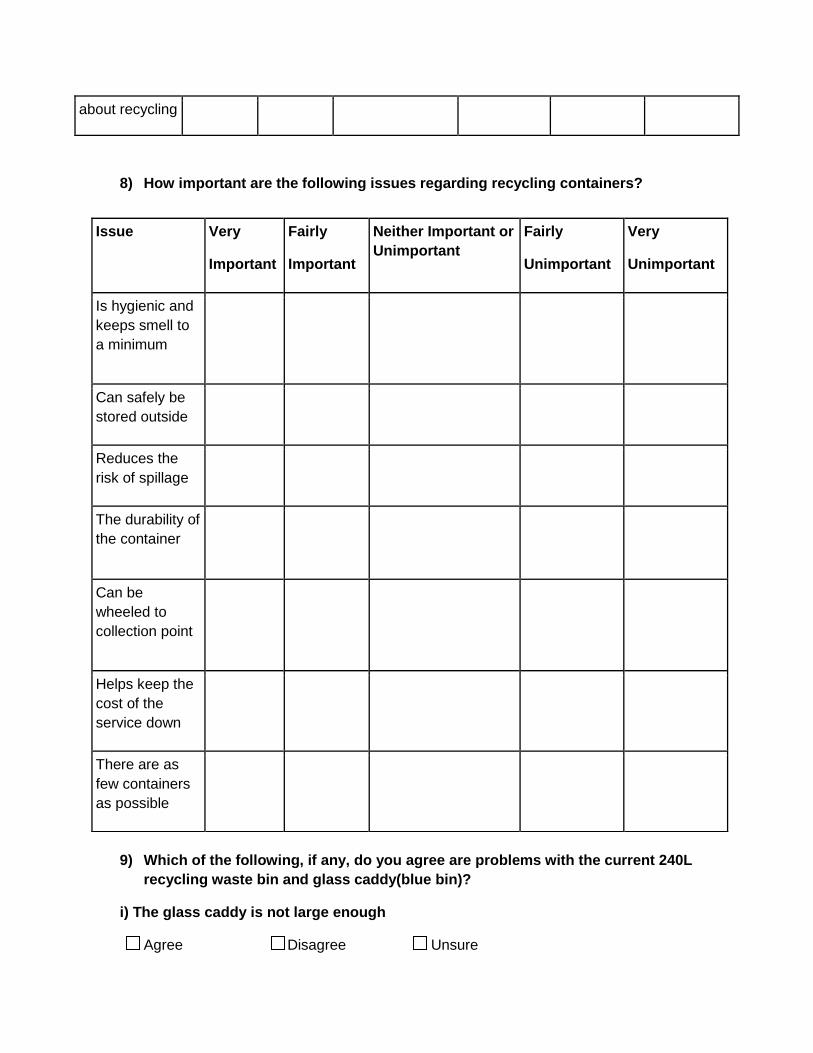
about recycling
8) How important are the following issues regarding recycling containers?
9) Which of the following, if any, do you agree are problems with the current 240L
recycling waste bin and glass caddy(blue bin)?
i) The glass caddy is not large enough
Agree Disagree Unsure
Issue Very
Important
Fairly
Important
Neither Important or
Unimportant
Fairly
Unimportant
Very
Unimportant
Is hygienic and
keeps smell to
a minimum
Can safely be
stored outside
Reduces the
risk of spillage
The durability of
the container
Can be
wheeled to
collection point
Helps keep the
cost of the
service down
There are as
few containers
as possible
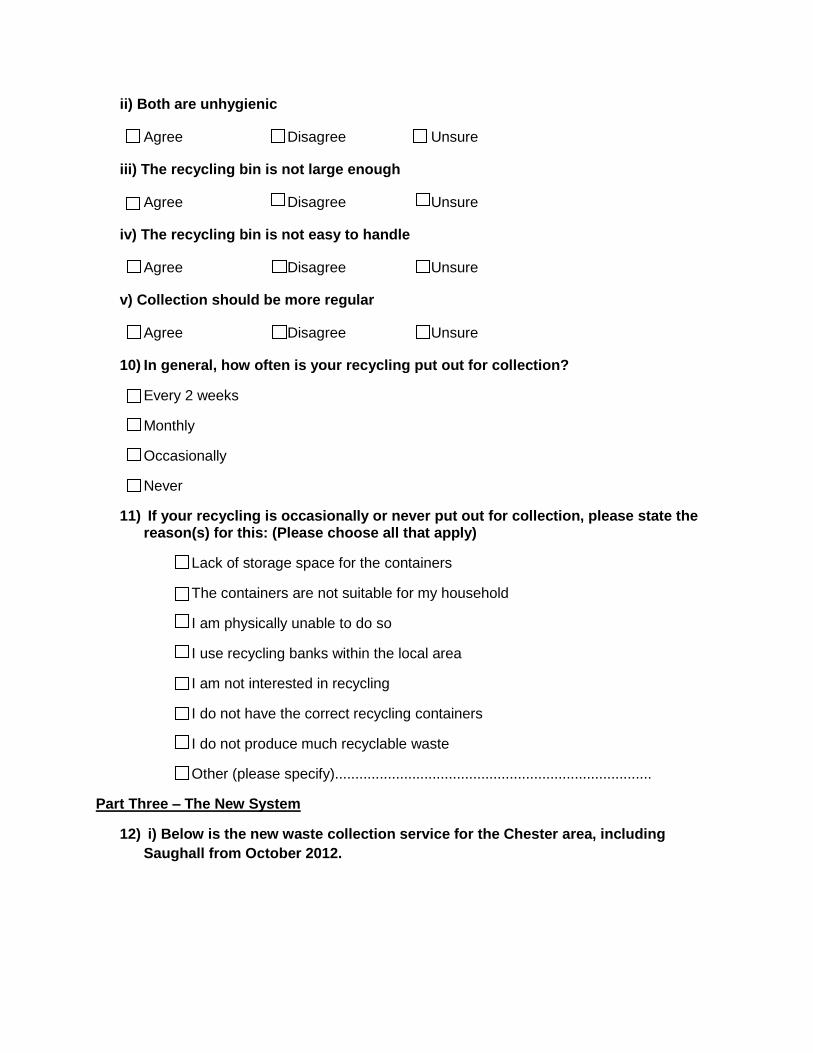
ii) Both are unhygienic
Agree Disagree Unsure
iii) The recycling bin is not large enough
Agree Disagree Unsure
iv) The recycling bin is not easy to handle
Agree Disagree Unsure
v) Collection should be more regular
Agree Disagree Unsure
10) In general, how often is your recycling put out for collection?
Every 2 weeks
Monthly
Occasionally
Never
11) If your recycling is occasionally or never put out for collection, please state the reason(s) for this: (Please choose all that apply)
Lack of storage space for the containers
The containers are not suitable for my household
I am physically unable to do so
I use recycling banks within the local area
I am not interested in recycling
I do not have the correct recycling containers
I do not produce much recyclable waste
Other (please specify)..............................................................................
Part Three – The New System
12) i) Below is the new waste collection service for the Chester area, including
Saughall from October 2012.
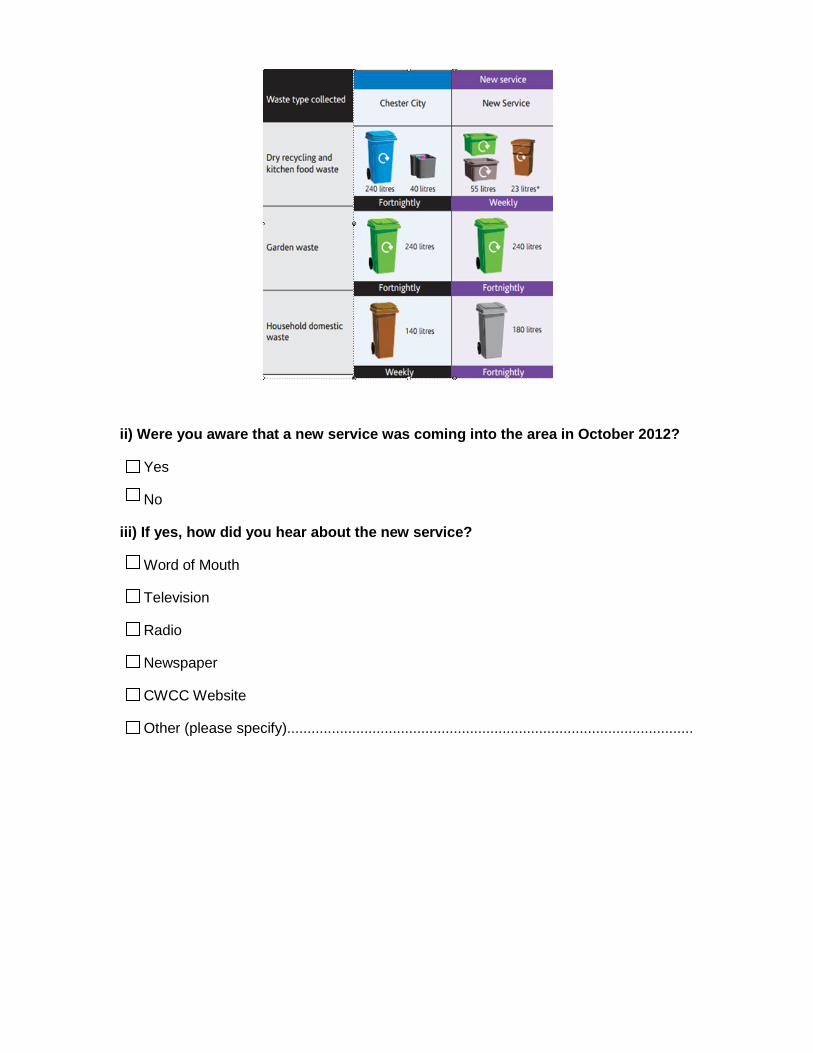
ii) Were you aware that a new service was coming into the area in October 2012?
Yes
No
iii) If yes, how did you hear about the new service?
Word of Mouth
Television
Radio
Newspaper
CWCC Website
Other (please specify)....................................................................................................
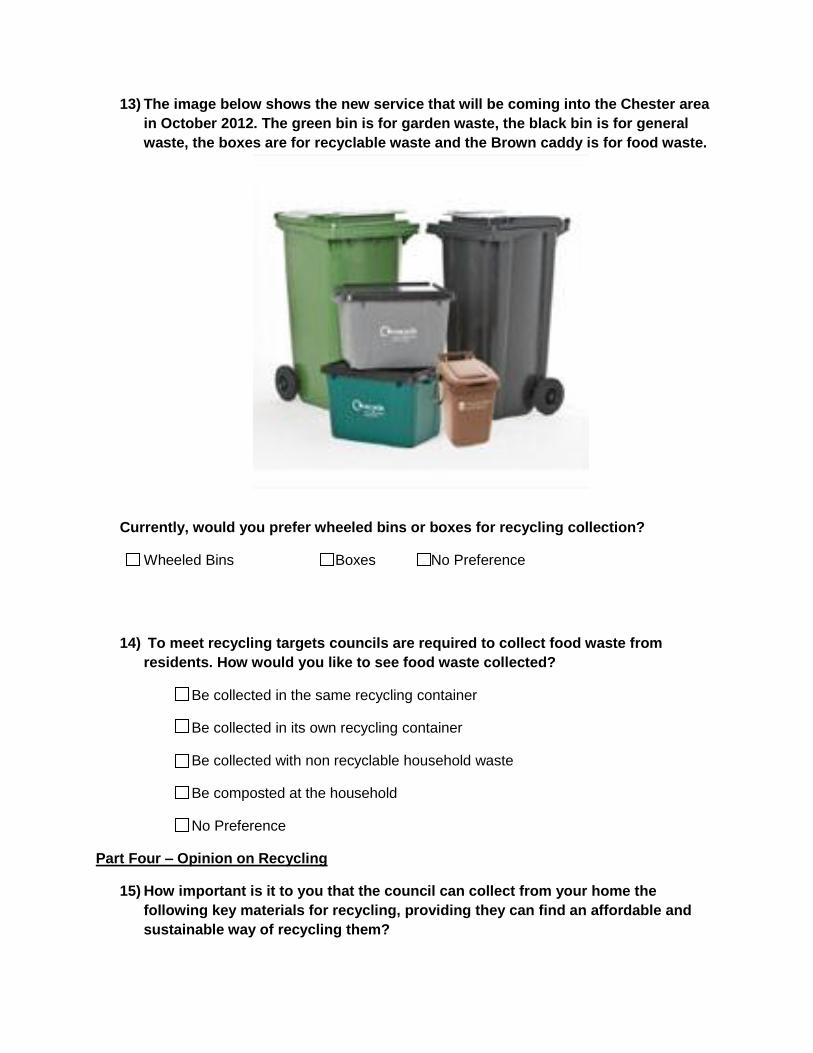
13) The image below shows the new service that will be coming into the Chester area
in October 2012. The green bin is for garden waste, the black bin is for general
waste, the boxes are for recyclable waste and the Brown caddy is for food waste.
Currently, would you prefer wheeled bins or boxes for recycling collection?
Wheeled Bins Boxes No Preference
14) To meet recycling targets councils are required to collect food waste from
residents. How would you like to see food waste collected?
Be collected in the same recycling container
Be collected in its own recycling container
Be collected with non recyclable household waste
Be composted at the household
No Preference
Part Four – Opinion on Recycling
15) How important is it to you that the council can collect from your home the
following key materials for recycling, providing they can find an affordable and
sustainable way of recycling them?
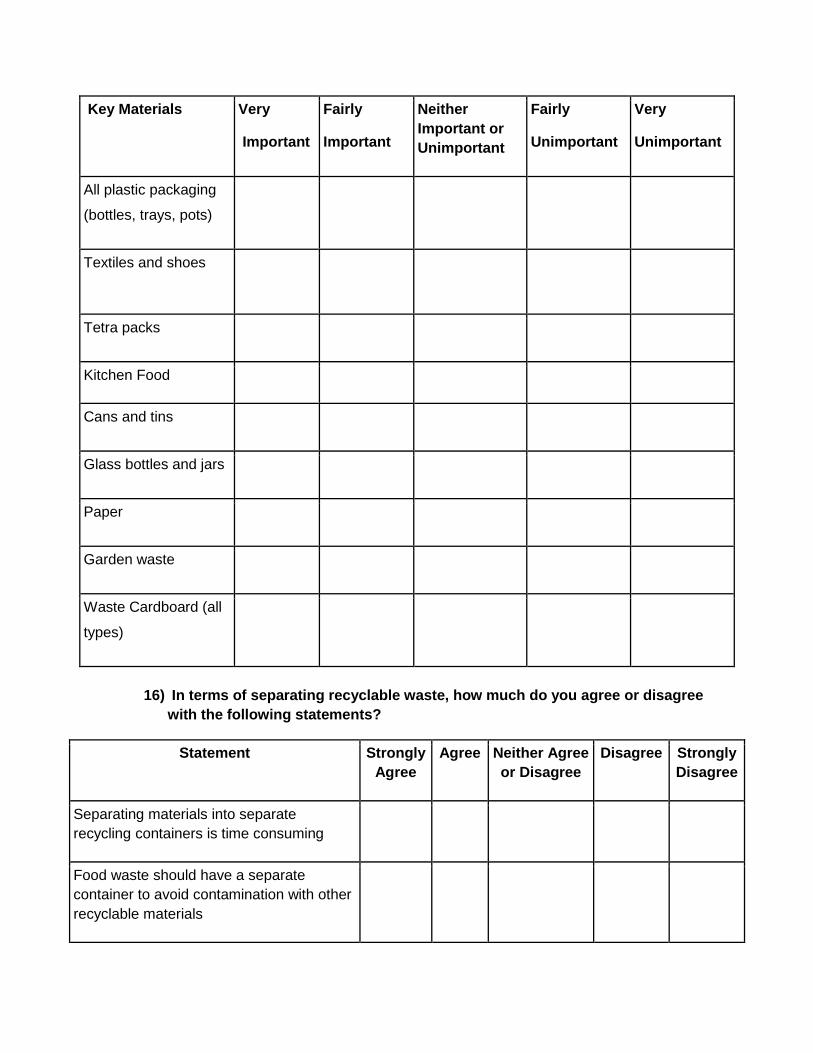
Key Materials Very
Important
Fairly
Important
Neither
Important or
Unimportant
Fairly
Unimportant
Very
Unimportant
All plastic packaging
(bottles, trays, pots)
Textiles and shoes
Tetra packs
Kitchen Food
Cans and tins
Glass bottles and jars
Paper
Garden waste
Waste Cardboard (all
types)
16) In terms of separating recyclable waste, how much do you agree or disagree
with the following statements?
Statement Strongly
Agree
Agree Neither Agree
or Disagree
Disagree Strongly
Disagree
Separating materials into separate
recycling containers is time consuming
Food waste should have a separate
container to avoid contamination with other
recyclable materials
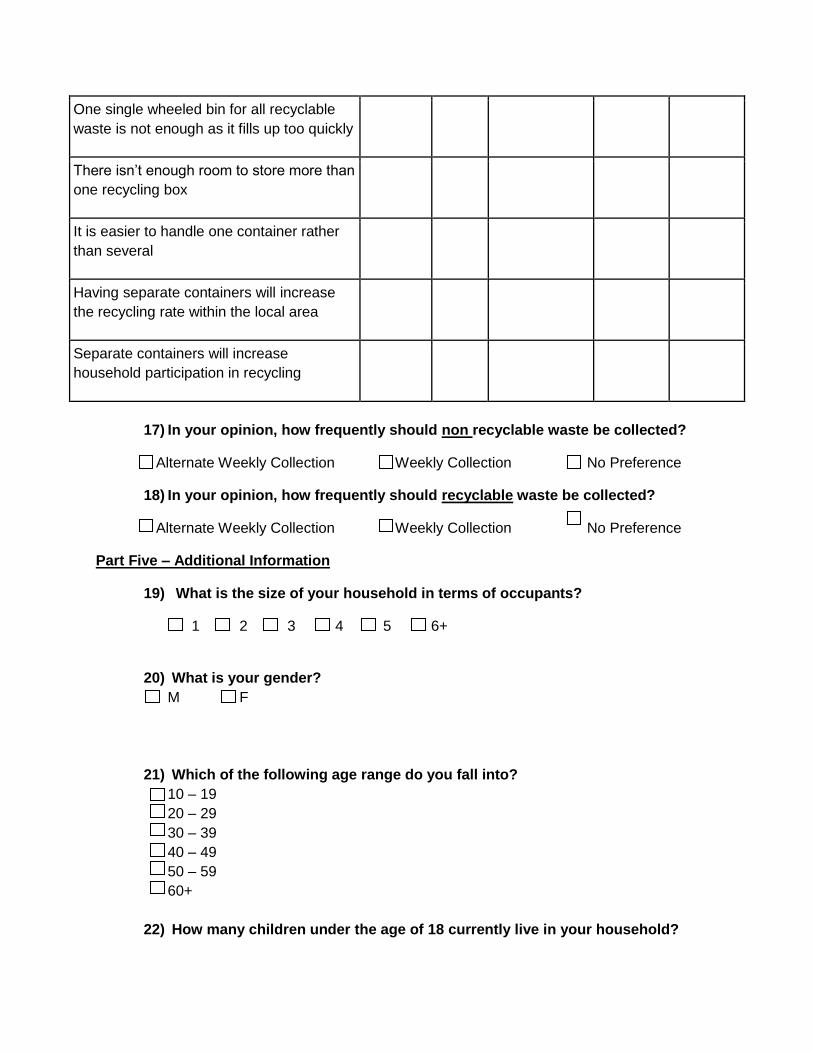
17) In your opinion, how frequently should non recyclable waste be collected?
Alternate Weekly Collection Weekly Collection No Preference
18) In your opinion, how frequently should recyclable waste be collected?
Alternate Weekly Collection Weekly Collection No Preference
Part Five – Additional Information
19) What is the size of your household in terms of occupants?
1 2 3 4 5 6+
20) What is your gender?
M F
21) Which of the following age range do you fall into?
10 – 19
20 – 29
30 – 39
40 – 49
50 – 59
60+
22) How many children under the age of 18 currently live in your household?
One single wheeled bin for all recyclable
waste is not enough as it fills up too quickly
There isn‘t enough room to store more than
one recycling box
It is easier to handle one container rather
than several
Having separate containers will increase
the recycling rate within the local area
Separate containers will increase
household participation in recycling
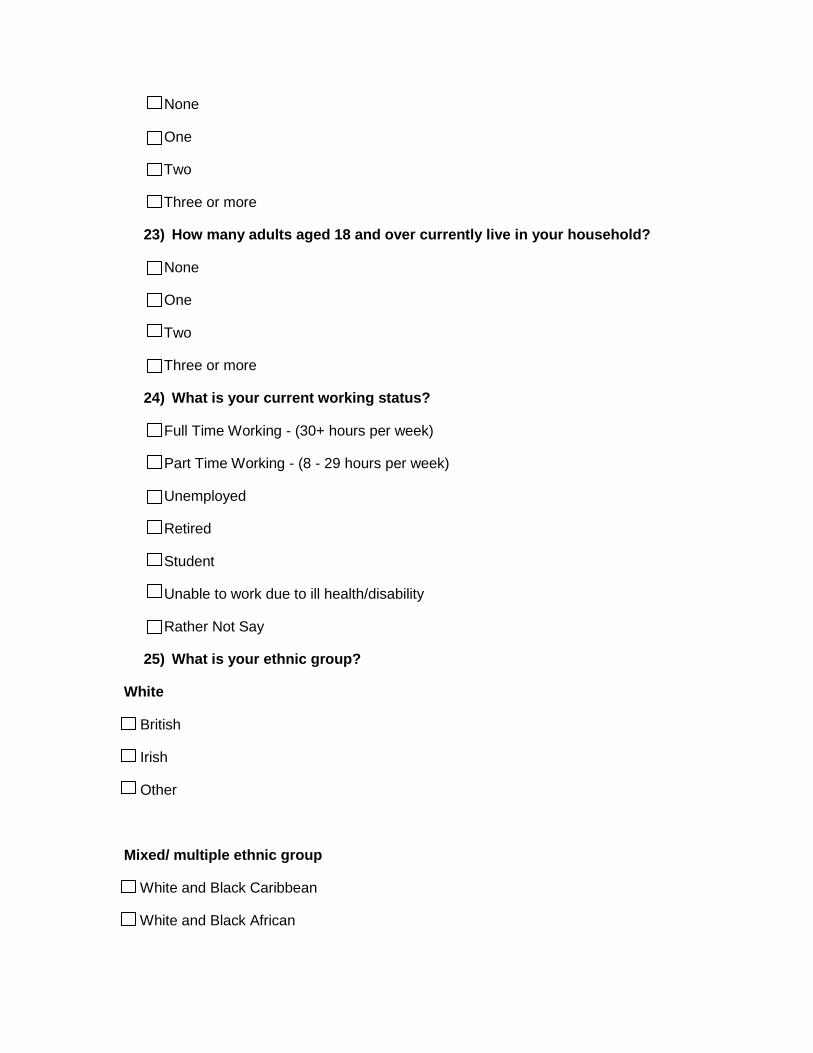
None
One
Two
Three or more
23) How many adults aged 18 and over currently live in your household?
None
One
Two
Three or more
24) What is your current working status?
Full Time Working - (30+ hours per week)
Part Time Working - (8 - 29 hours per week)
Unemployed
Retired
Student
Unable to work due to ill health/disability
Rather Not Say
25) What is your ethnic group?
White
British
Irish
Other
Mixed/ multiple ethnic group
White and Black Caribbean
White and Black African
White and Asian
Other
Asian/Asian British
Indian
Pakistani
Bangladeshi
Other
Black or Black British
African
Caribbean
Other
Other
Rather Not Say
26) Any other comments?
Thanks very much for your time
Please return the completed form in the pre paid envelope provided
Jamie Pope

Appendix 2
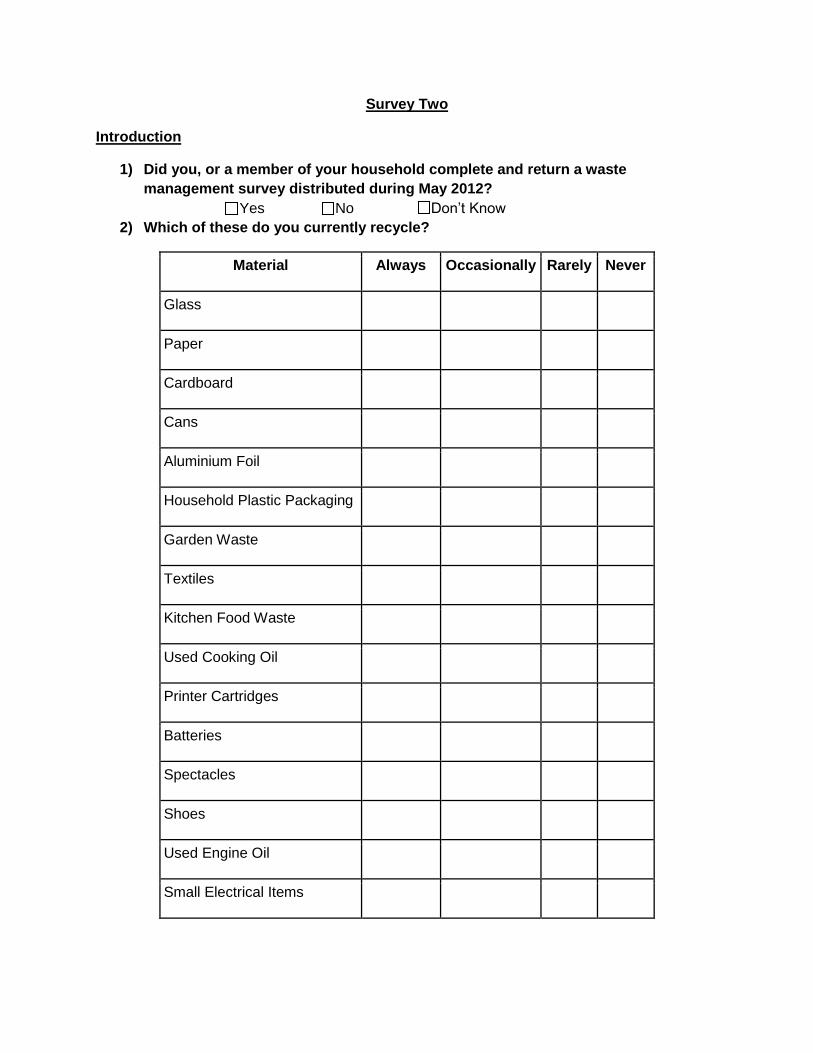
Survey Two
Introduction
1) Did you, or a member of your household complete and return a waste
management survey distributed during May 2012?
Yes No Don‘t Know
2) Which of these do you currently recycle?
Material Always Occasionally Rarely Never
Glass
Paper
Cardboard
Cans
Aluminium Foil
Household Plastic Packaging
Garden Waste
Textiles
Kitchen Food Waste
Used Cooking Oil
Printer Cartridges
Batteries
Spectacles
Shoes
Used Engine Oil
Small Electrical Items
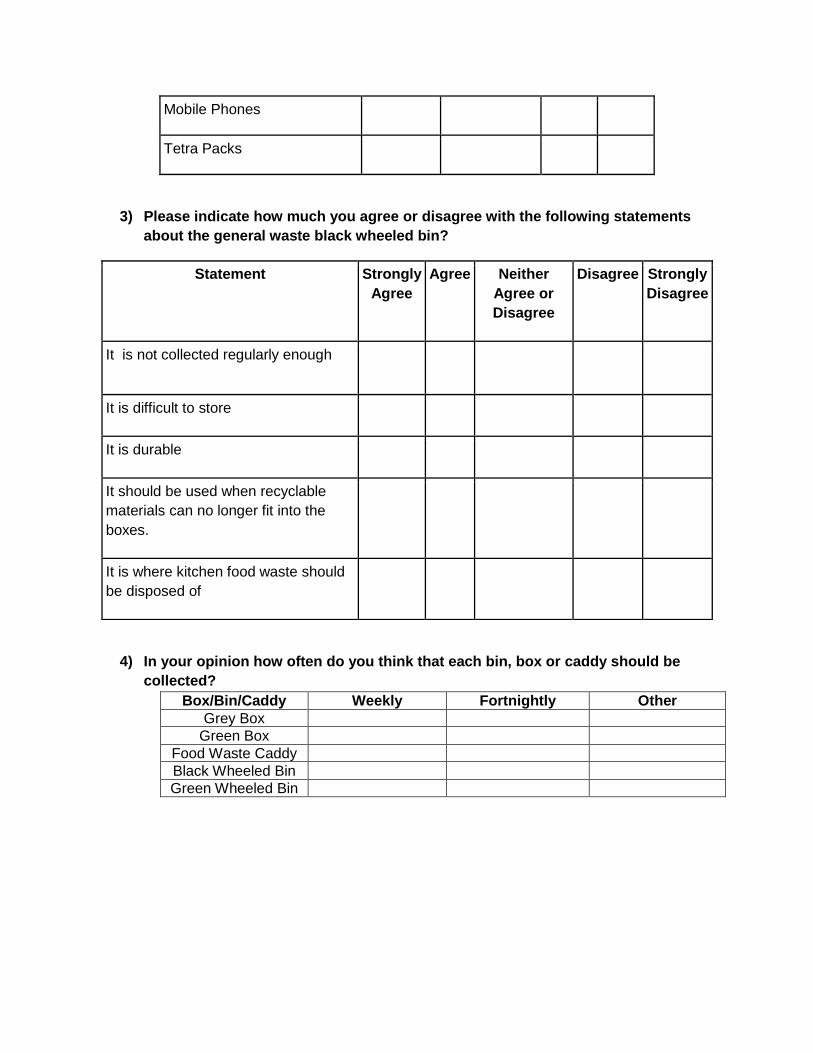
Mobile Phones
Tetra Packs
3) Please indicate how much you agree or disagree with the following statements
about the general waste black wheeled bin?
4) In your opinion how often do you think that each bin, box or caddy should be
collected?
Box/Bin/Caddy Weekly Fortnightly Other
Grey Box
Green Box
Food Waste Caddy
Black Wheeled Bin
Green Wheeled Bin
Statement Strongly
Agree
Agree Neither
Agree or
Disagree
Disagree Strongly
Disagree
It is not collected regularly enough
It is difficult to store
It is durable
It should be used when recyclable
materials can no longer fit into the
boxes.
It is where kitchen food waste should
be disposed of
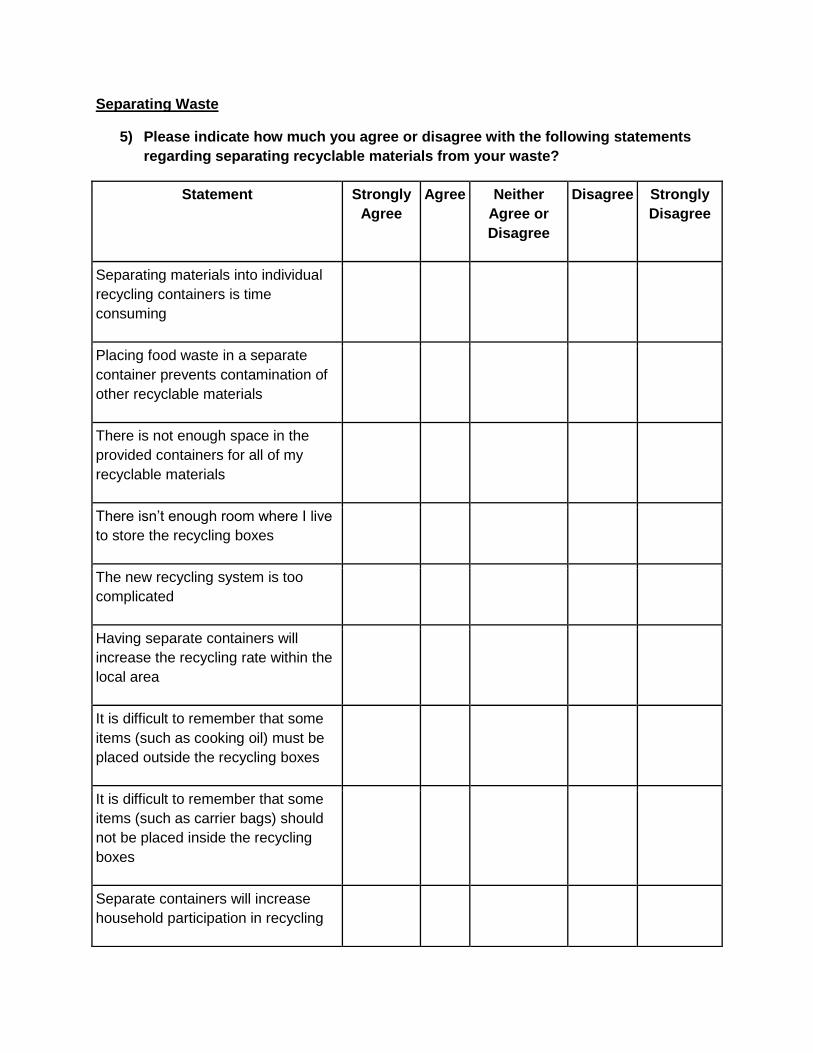
Separating Waste
5) Please indicate how much you agree or disagree with the following statements
regarding separating recyclable materials from your waste?
Statement Strongly
Agree
Agree Neither
Agree or
Disagree
Disagree Strongly
Disagree
Separating materials into individual
recycling containers is time
consuming
Placing food waste in a separate
container prevents contamination of
other recyclable materials
There is not enough space in the
provided containers for all of my
recyclable materials
There isn‘t enough room where I live
to store the recycling boxes
The new recycling system is too
complicated
Having separate containers will
increase the recycling rate within the
local area
It is difficult to remember that some
items (such as cooking oil) must be
placed outside the recycling boxes
It is difficult to remember that some
items (such as carrier bags) should
not be placed inside the recycling
boxes
Separate containers will increase
household participation in recycling
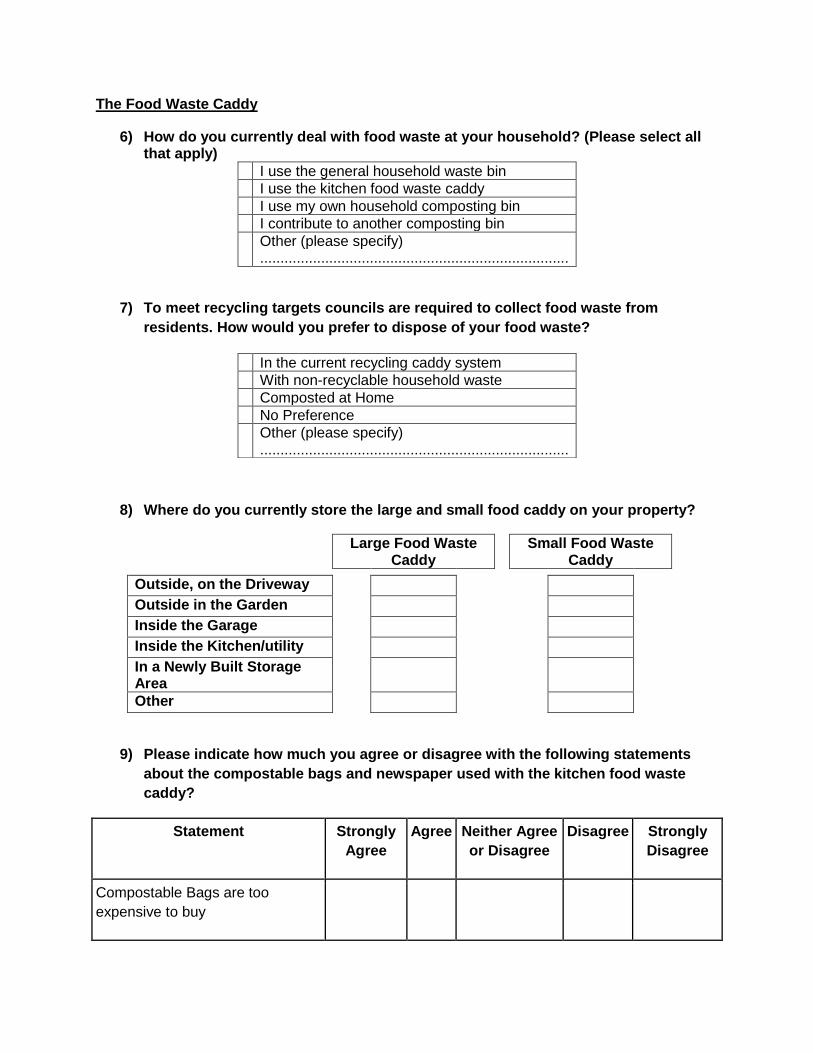
The Food Waste Caddy
6) How do you currently deal with food waste at your household? (Please select all that apply)
I use the general household waste bin
I use the kitchen food waste caddy
I use my own household composting bin
I contribute to another composting bin
Other (please specify) ............................................................................
7) To meet recycling targets councils are required to collect food waste from
residents. How would you prefer to dispose of your food waste?
8) Where do you currently store the large and small food caddy on your property?
Large Food Waste Caddy
Small Food Waste Caddy
Outside, on the Driveway
Outside in the Garden
Inside the Garage
Inside the Kitchen/utility
In a Newly Built Storage Area
Other
9) Please indicate how much you agree or disagree with the following statements
about the compostable bags and newspaper used with the kitchen food waste
caddy?
In the current recycling caddy system
With non-recyclable household waste
Composted at Home
No Preference
Other (please specify) ............................................................................
Statement Strongly
Agree
Agree Neither Agree
or Disagree
Disagree Strongly
Disagree
Compostable Bags are too
expensive to buy
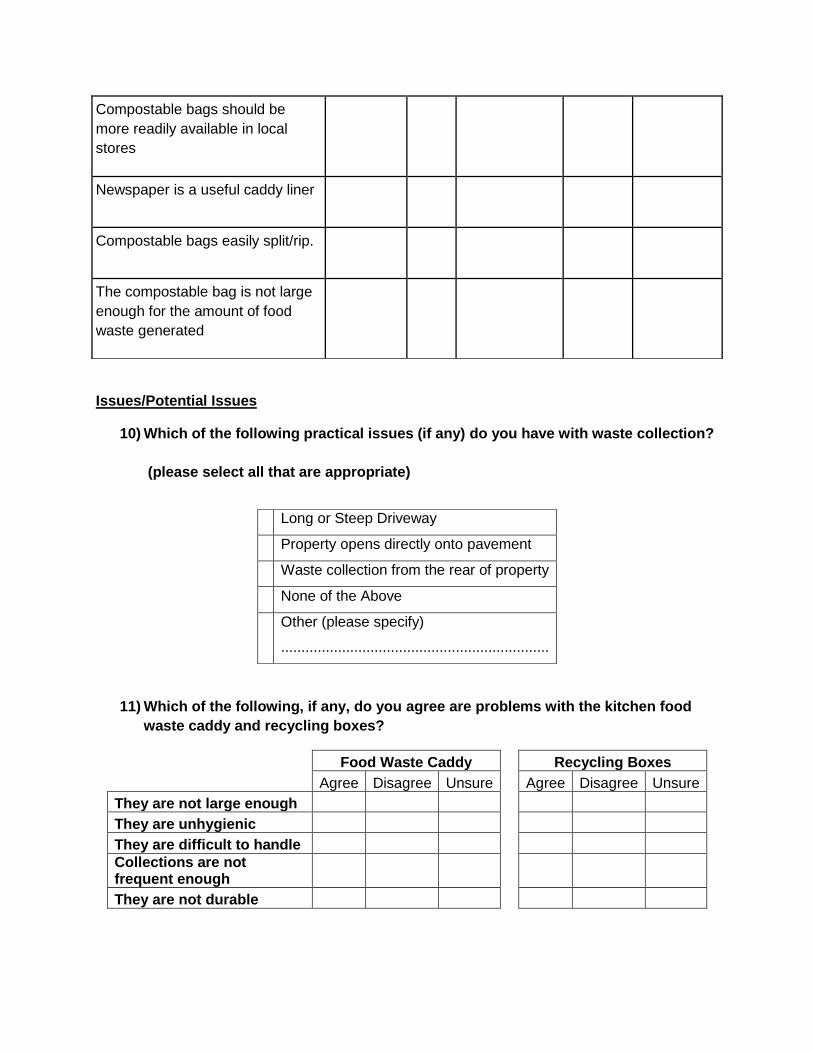
Issues/Potential Issues
10) Which of the following practical issues (if any) do you have with waste collection?
(please select all that are appropriate)
11) Which of the following, if any, do you agree are problems with the kitchen food
waste caddy and recycling boxes?
Food Waste Caddy
Recycling Boxes
Agree Disagree Unsure Agree Disagree Unsure
They are not large enough
They are unhygienic
They are difficult to handle
Collections are not frequent enough
They are not durable
Compostable bags should be
more readily available in local
stores
Newspaper is a useful caddy liner
Compostable bags easily split/rip.
The compostable bag is not large
enough for the amount of food
waste generated
Long or Steep Driveway
Property opens directly onto pavement
Waste collection from the rear of property
None of the Above
Other (please specify)
..................................................................
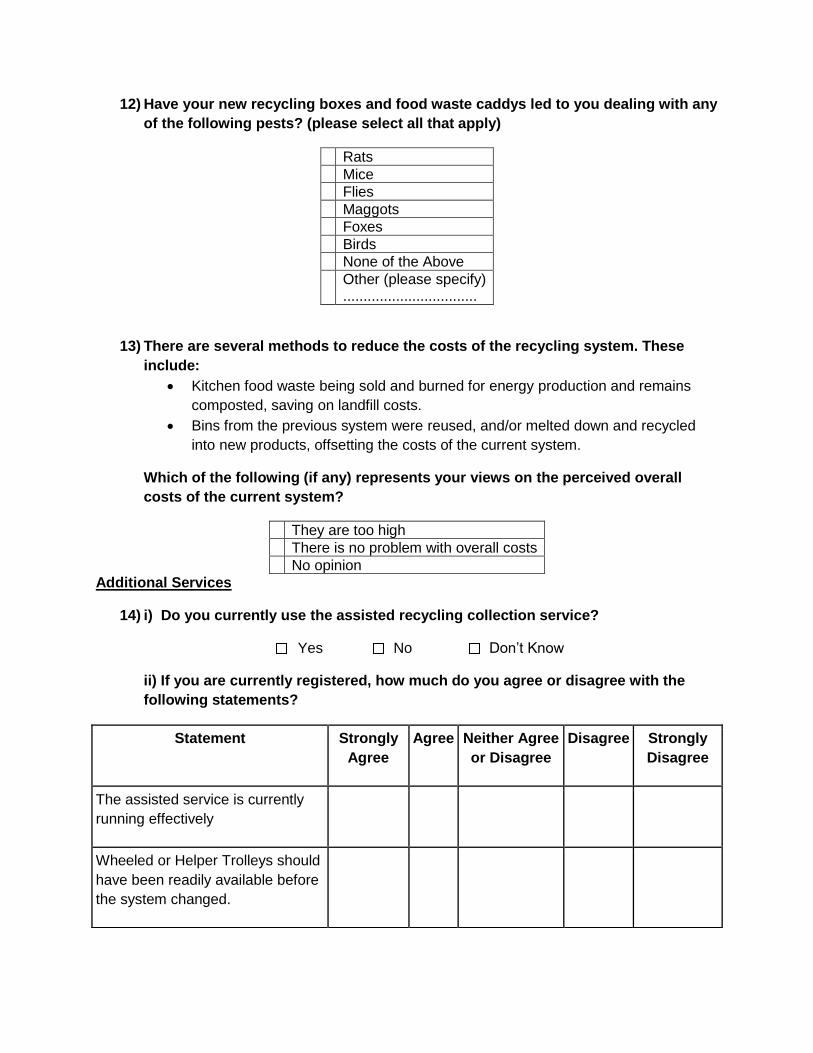
12) Have your new recycling boxes and food waste caddys led to you dealing with any
of the following pests? (please select all that apply)
Rats
Mice
Flies
Maggots
Foxes
Birds
None of the Above
Other (please specify) .................................
13) There are several methods to reduce the costs of the recycling system. These
include:
Kitchen food waste being sold and burned for energy production and remains
composted, saving on landfill costs.
Bins from the previous system were reused, and/or melted down and recycled
into new products, offsetting the costs of the current system.
Which of the following (if any) represents your views on the perceived overall
costs of the current system?
They are too high
There is no problem with overall costs
No opinion
Additional Services
14) i) Do you currently use the assisted recycling collection service?
Yes No Don‘t Know
ii) If you are currently registered, how much do you agree or disagree with the
following statements?
Statement Strongly
Agree
Agree Neither Agree
or Disagree
Disagree Strongly
Disagree
The assisted service is currently
running effectively
Wheeled or Helper Trolleys should
have been readily available before
the system changed.
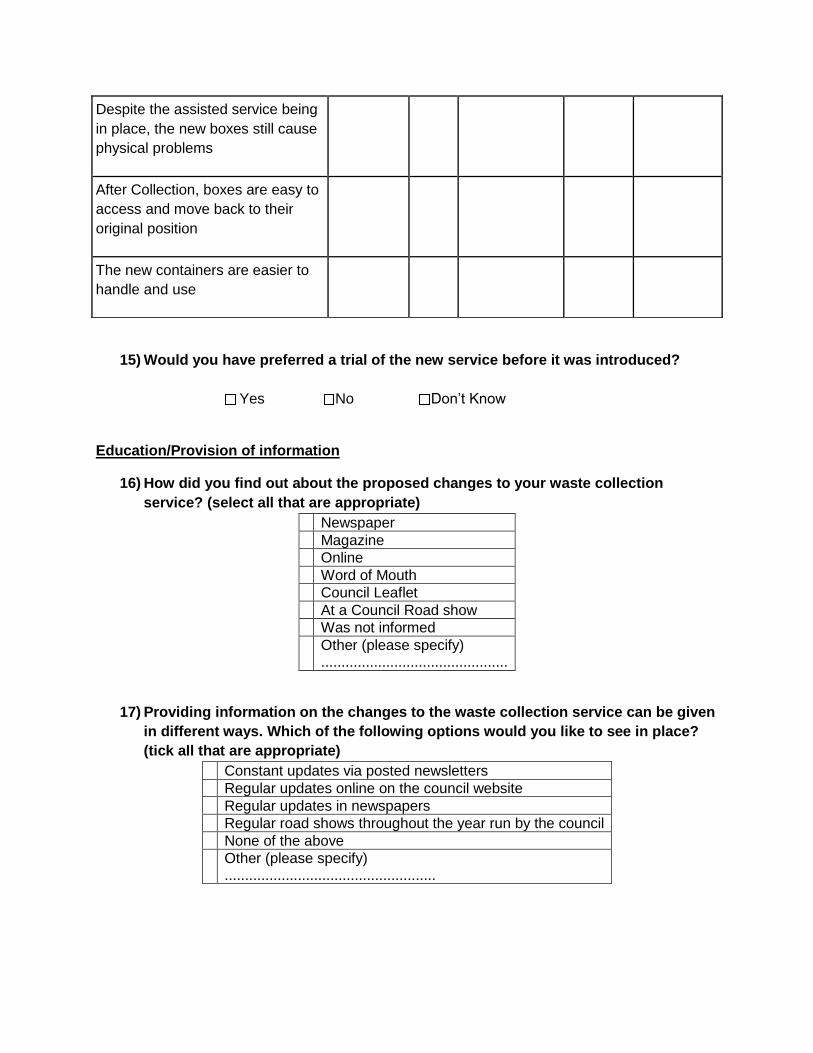
15) Would you have preferred a trial of the new service before it was introduced?
Yes No Don‘t Know
Education/Provision of information
16) How did you find out about the proposed changes to your waste collection
service? (select all that are appropriate)
Newspaper
Magazine
Online
Word of Mouth
Council Leaflet
At a Council Road show
Was not informed
Other (please specify) ..............................................
17) Providing information on the changes to the waste collection service can be given
in different ways. Which of the following options would you like to see in place?
(tick all that are appropriate)
Constant updates via posted newsletters
Regular updates online on the council website
Regular updates in newspapers
Regular road shows throughout the year run by the council
None of the above
Other (please specify) ....................................................
Despite the assisted service being
in place, the new boxes still cause
physical problems
After Collection, boxes are easy to
access and move back to their
original position
The new containers are easier to
handle and use
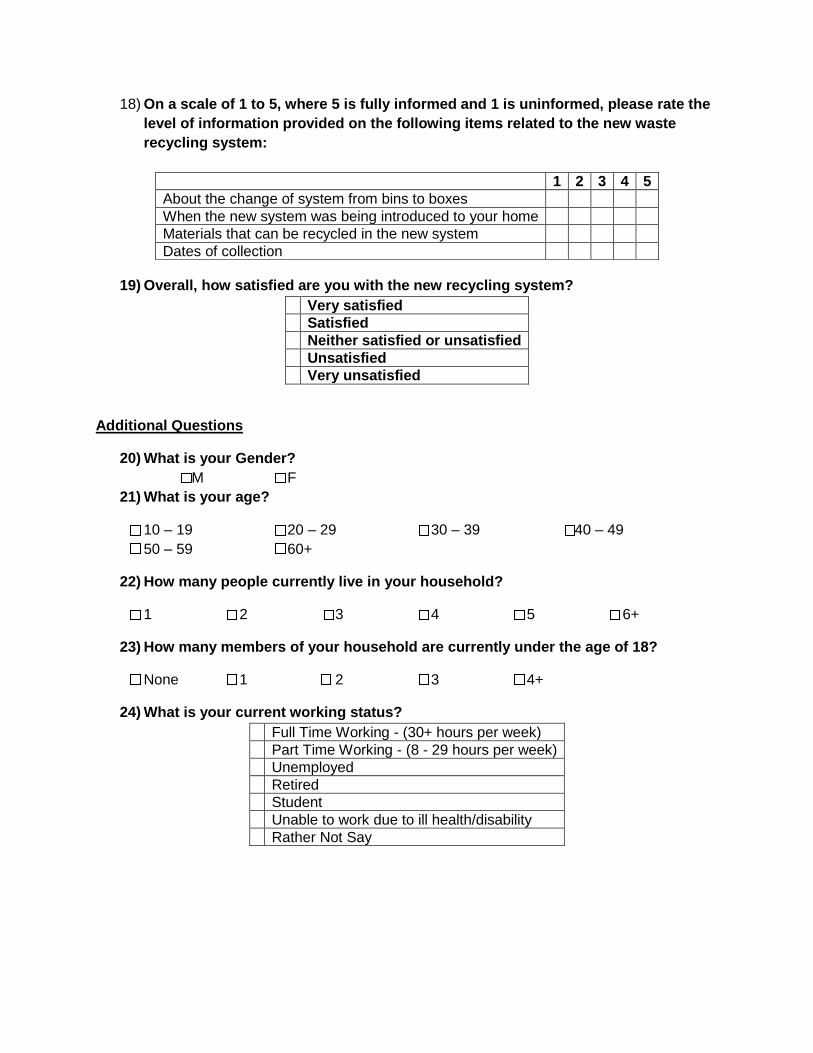
18) On a scale of 1 to 5, where 5 is fully informed and 1 is uninformed, please rate the
level of information provided on the following items related to the new waste
recycling system:
19) Overall, how satisfied are you with the new recycling system?
Very satisfied
Satisfied
Neither satisfied or unsatisfied
Unsatisfied
Very unsatisfied
Additional Questions
20) What is your Gender?
M F
21) What is your age?
10 – 19 20 – 29 30 – 39 40 – 49
50 – 59 60+
22) How many people currently live in your household?
1 2 3 4 5 6+
23) How many members of your household are currently under the age of 18?
None 1 2 3 4+
24) What is your current working status?
Full Time Working - (30+ hours per week)
Part Time Working - (8 - 29 hours per week)
Unemployed
Retired
Student
Unable to work due to ill health/disability
Rather Not Say
1 2 3 4 5
About the change of system from bins to boxes
When the new system was being introduced to your home
Materials that can be recycled in the new system
Dates of collection

25) Please use the space below to provide any further comments on your current
waste collection service?
Thanks for your time
Jamie Pope

Appendix 3
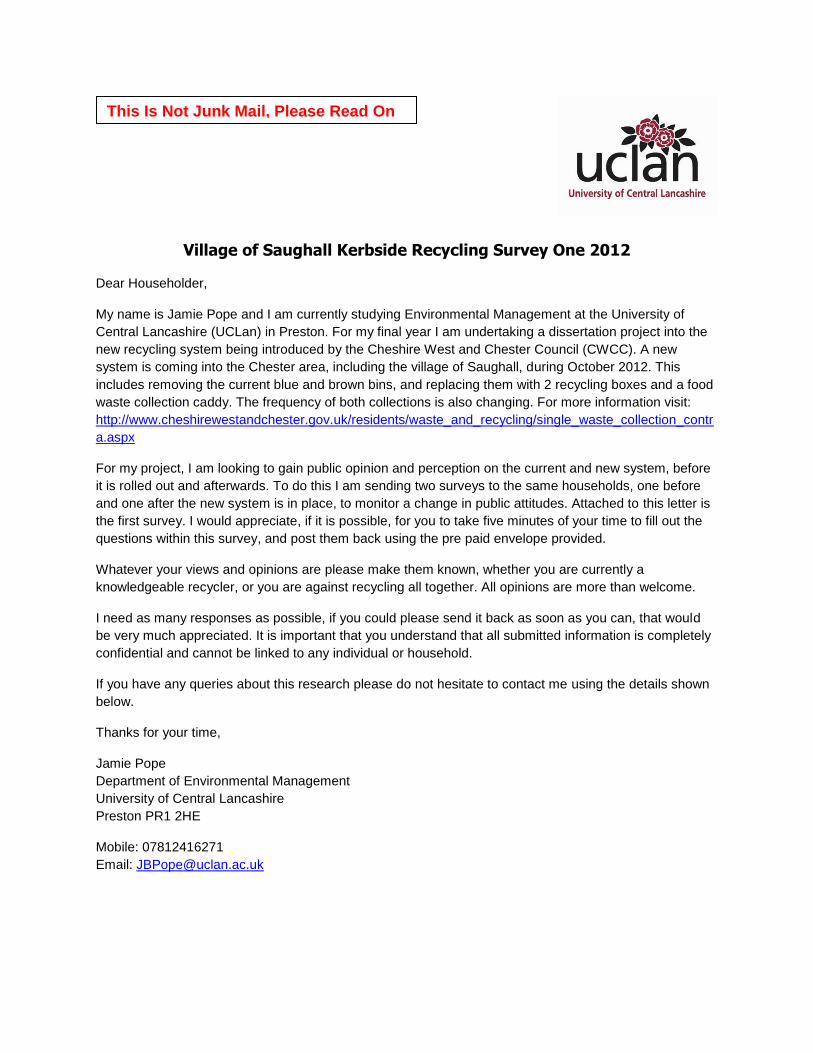
Village of Saughall Kerbside Recycling Survey One 2012
Dear Householder,
My name is Jamie Pope and I am currently studying Environmental Management at the University of
Central Lancashire (UCLan) in Preston. For my final year I am undertaking a dissertation project into the
new recycling system being introduced by the Cheshire West and Chester Council (CWCC). A new
system is coming into the Chester area, including the village of Saughall, during October 2012. This
includes removing the current blue and brown bins, and replacing them with 2 recycling boxes and a food
waste collection caddy. The frequency of both collections is also changing. For more information visit:
http://www.cheshirewestandchester.gov.uk/residents/waste_and_recycling/single_waste_collection_contr
a.aspx
For my project, I am looking to gain public opinion and perception on the current and new system, before
it is rolled out and afterwards. To do this I am sending two surveys to the same households, one before
and one after the new system is in place, to monitor a change in public attitudes. Attached to this letter is
the first survey. I would appreciate, if it is possible, for you to take five minutes of your time to fill out the
questions within this survey, and post them back using the pre paid envelope provided.
Whatever your views and opinions are please make them known, whether you are currently a
knowledgeable recycler, or you are against recycling all together. All opinions are more than welcome.
I need as many responses as possible, if you could please send it back as soon as you can, that would
be very much appreciated. It is important that you understand that all submitted information is completely
confidential and cannot be linked to any individual or household.
If you have any queries about this research please do not hesitate to contact me using the details shown
below.
Thanks for your time,
Jamie Pope
Department of Environmental Management
University of Central Lancashire
Preston PR1 2HE
Mobile: 07812416271
Email: [email protected]
This Is Not Junk Mail, Please Read On
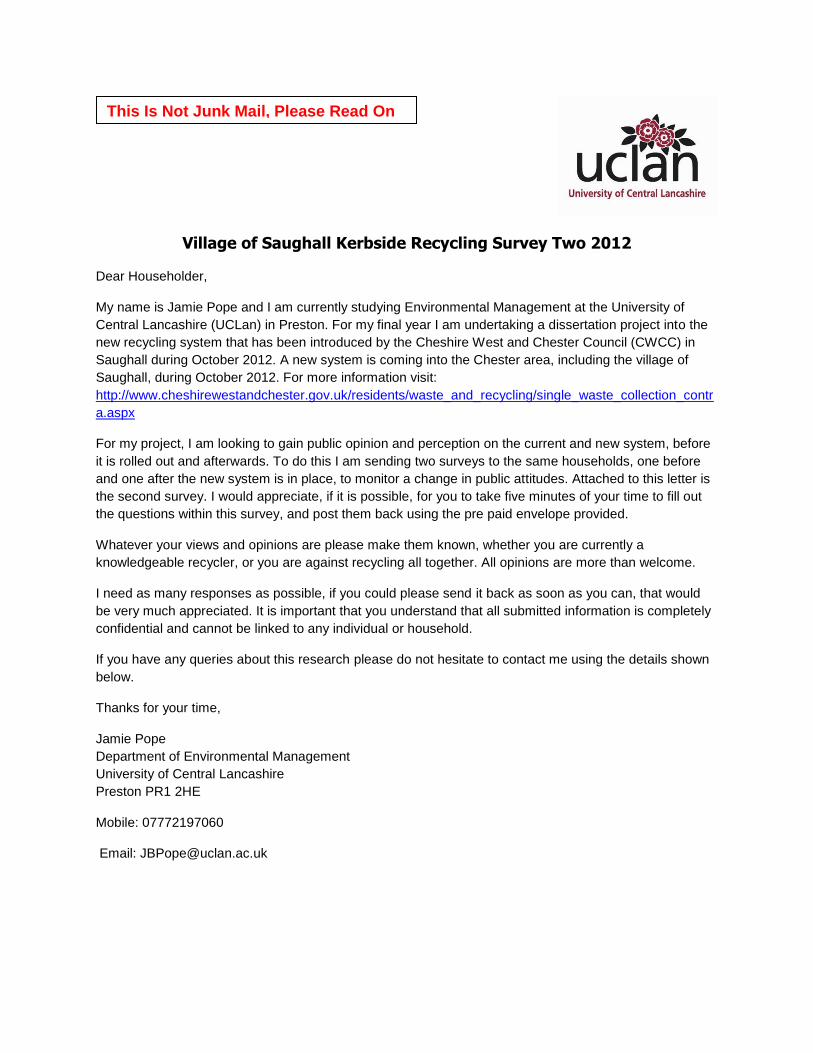
Village of Saughall Kerbside Recycling Survey Two 2012
Dear Householder,
My name is Jamie Pope and I am currently studying Environmental Management at the University of
Central Lancashire (UCLan) in Preston. For my final year I am undertaking a dissertation project into the
new recycling system that has been introduced by the Cheshire West and Chester Council (CWCC) in
Saughall during October 2012. A new system is coming into the Chester area, including the village of
Saughall, during October 2012. For more information visit:
http://www.cheshirewestandchester.gov.uk/residents/waste_and_recycling/single_waste_collection_contr
a.aspx
For my project, I am looking to gain public opinion and perception on the current and new system, before
it is rolled out and afterwards. To do this I am sending two surveys to the same households, one before
and one after the new system is in place, to monitor a change in public attitudes. Attached to this letter is
the second survey. I would appreciate, if it is possible, for you to take five minutes of your time to fill out
the questions within this survey, and post them back using the pre paid envelope provided.
Whatever your views and opinions are please make them known, whether you are currently a
knowledgeable recycler, or you are against recycling all together. All opinions are more than welcome.
I need as many responses as possible, if you could please send it back as soon as you can, that would
be very much appreciated. It is important that you understand that all submitted information is completely
confidential and cannot be linked to any individual or household.
If you have any queries about this research please do not hesitate to contact me using the details shown
below.
Thanks for your time,
Jamie Pope
Department of Environmental Management
University of Central Lancashire
Preston PR1 2HE
Mobile: 07772197060
Email: [email protected]
This Is Not Junk Mail, Please Read On

Appendix 4
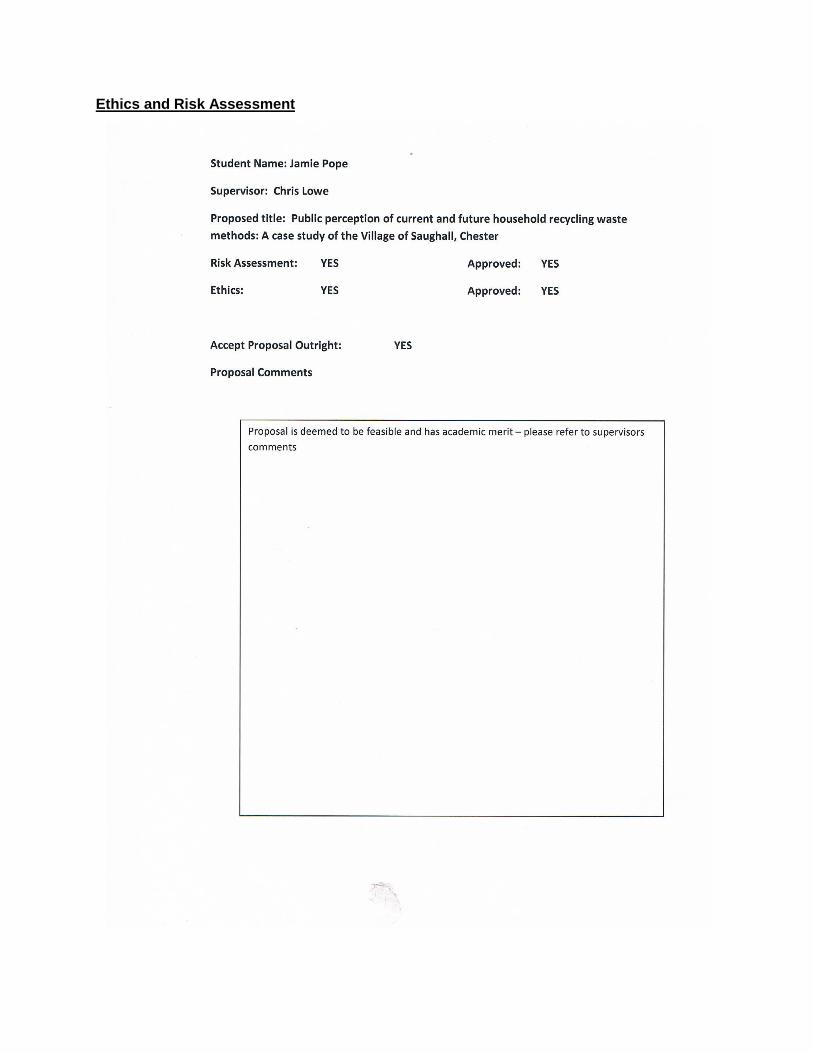
Ethics and Risk Assessment
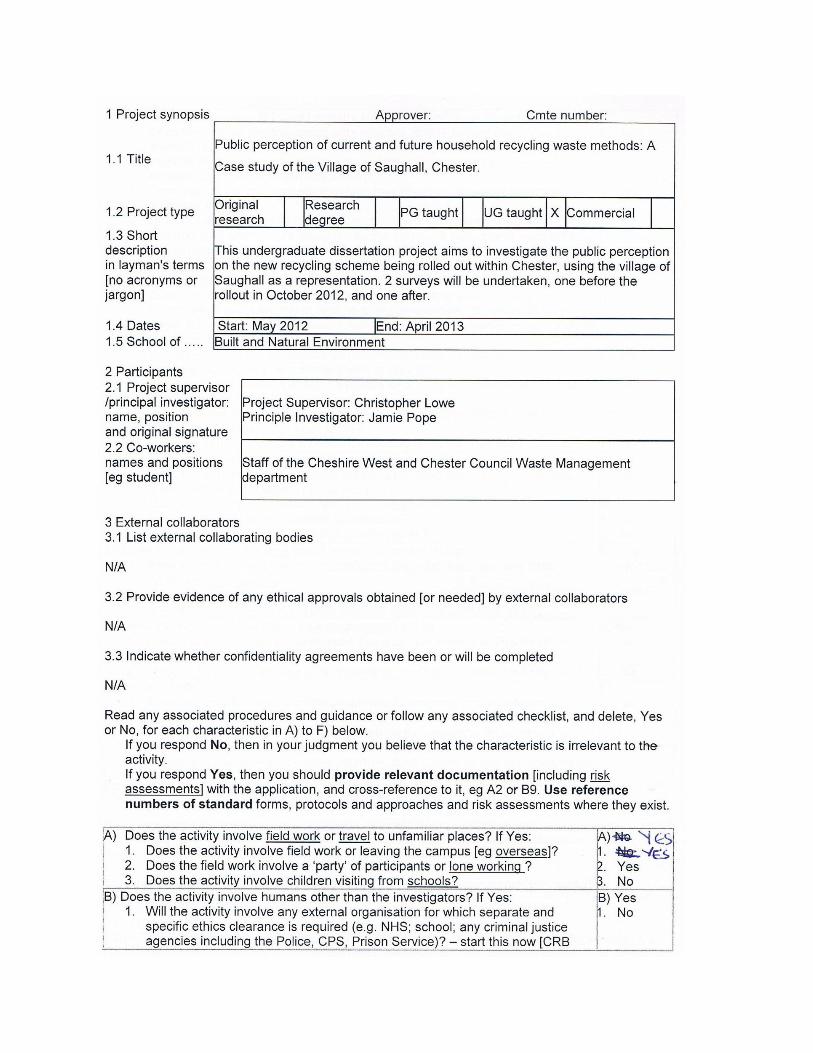
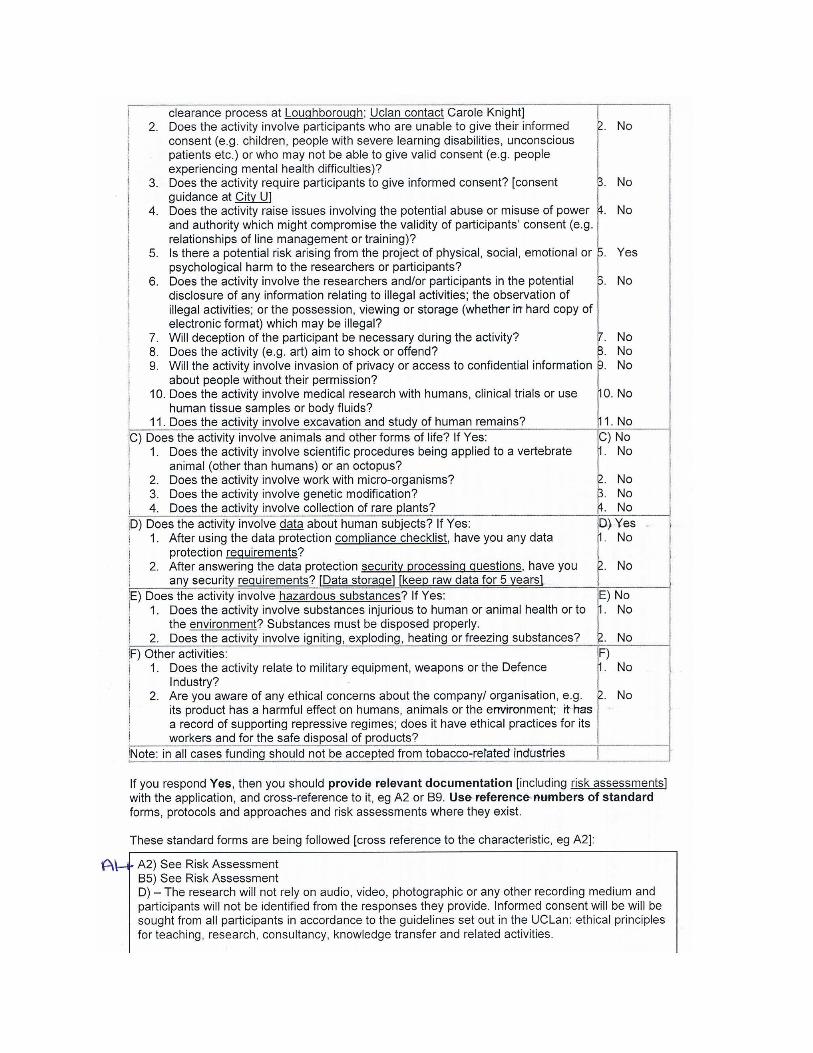
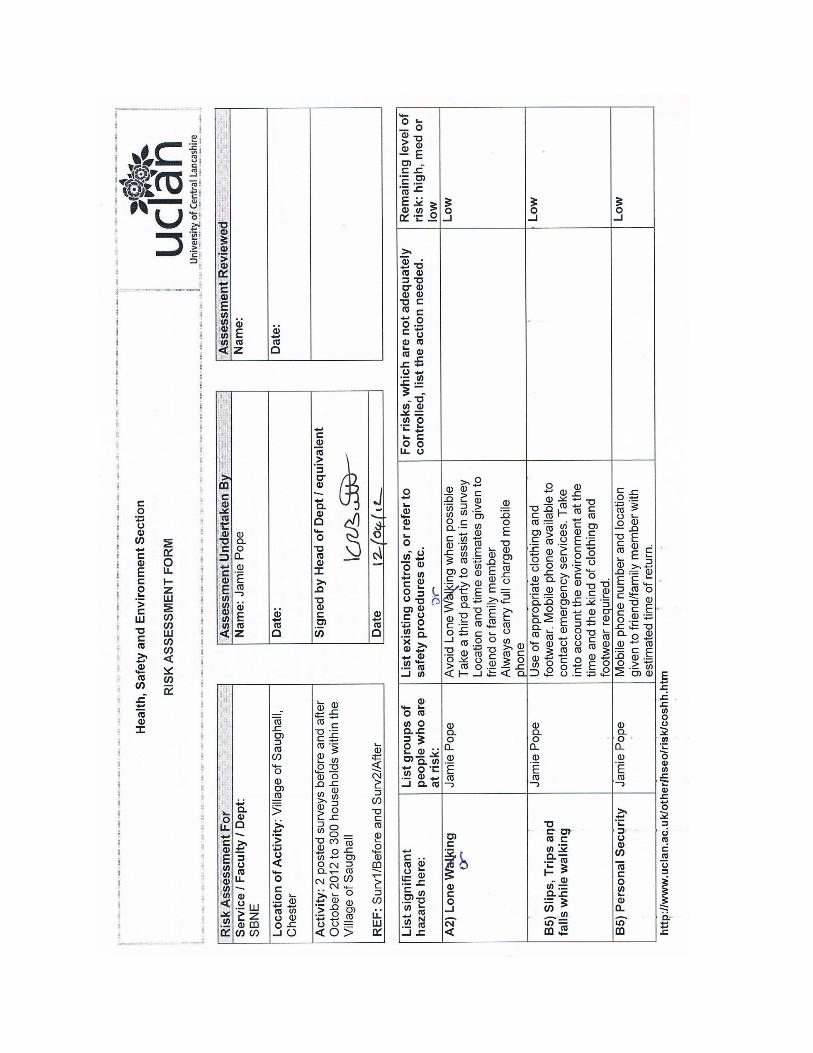
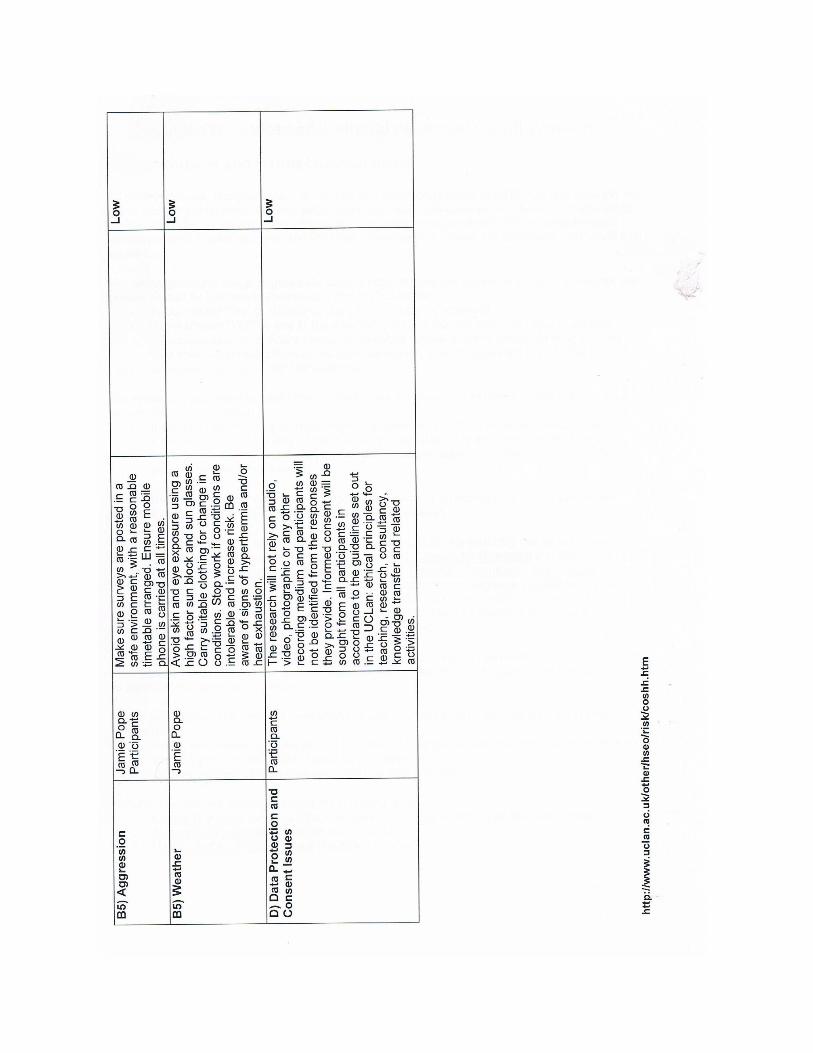

Appendix 5
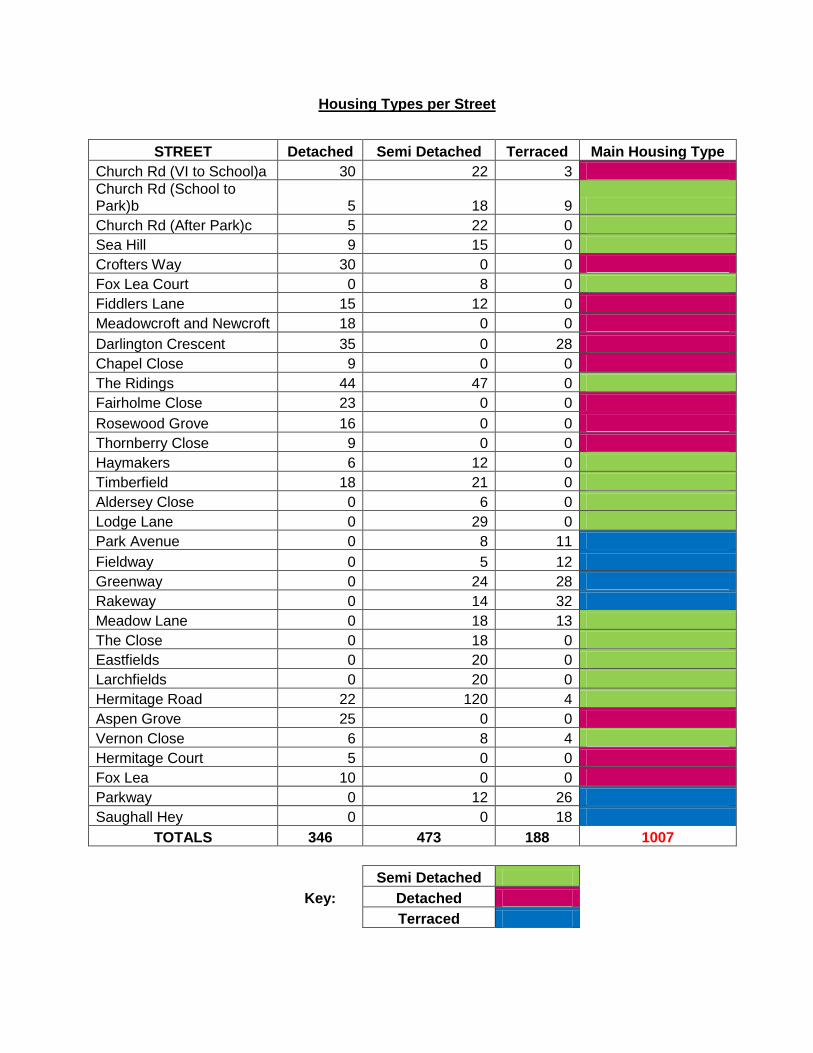
Housing Types per Street
STREET Detached Semi Detached Terraced Main Housing Type
Church Rd (VI to School)a 30 22 3
Church Rd (School to Park)b 5 18 9
Church Rd (After Park)c 5 22 0
Sea Hill 9 15 0
Crofters Way 30 0 0
Fox Lea Court 0 8 0
Fiddlers Lane 15 12 0
Meadowcroft and Newcroft 18 0 0
Darlington Crescent 35 0 28
Chapel Close 9 0 0
The Ridings 44 47 0
Fairholme Close 23 0 0
Rosewood Grove 16 0 0
Thornberry Close 9 0 0
Haymakers 6 12 0
Timberfield 18 21 0
Aldersey Close 0 6 0
Lodge Lane 0 29 0
Park Avenue 0 8 11
Fieldway 0 5 12
Greenway 0 24 28
Rakeway 0 14 32
Meadow Lane 0 18 13
The Close 0 18 0
Eastfields 0 20 0
Larchfields 0 20 0
Hermitage Road 22 120 4
Aspen Grove 25 0 0
Vernon Close 6 8 4
Hermitage Court 5 0 0
Fox Lea 10 0 0
Parkway 0 12 26
Saughall Hey 0 0 18
TOTALS 346 473 188 1007
Semi Detached
Key: Detached
Terraced

Appendix 6
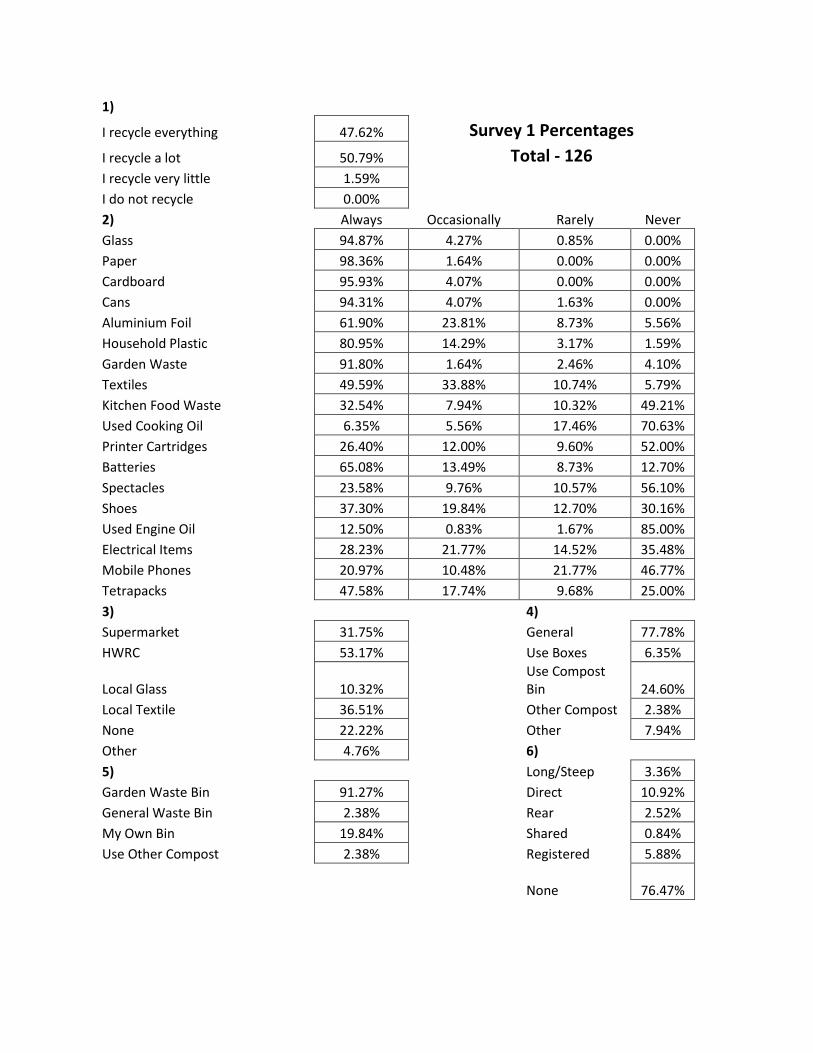
1)
I recycle everything 47.62% Survey 1 Percentages
I recycle a lot 50.79% Total - 126 I recycle very little 1.59%
I do not recycle 0.00% 2) Always Occasionally Rarely Never
Glass 94.87% 4.27% 0.85% 0.00%
Paper 98.36% 1.64% 0.00% 0.00%
Cardboard 95.93% 4.07% 0.00% 0.00%
Cans 94.31% 4.07% 1.63% 0.00%
Aluminium Foil 61.90% 23.81% 8.73% 5.56%
Household Plastic 80.95% 14.29% 3.17% 1.59%
Garden Waste 91.80% 1.64% 2.46% 4.10%
Textiles 49.59% 33.88% 10.74% 5.79%
Kitchen Food Waste 32.54% 7.94% 10.32% 49.21%
Used Cooking Oil 6.35% 5.56% 17.46% 70.63%
Printer Cartridges 26.40% 12.00% 9.60% 52.00%
Batteries 65.08% 13.49% 8.73% 12.70%
Spectacles 23.58% 9.76% 10.57% 56.10%
Shoes 37.30% 19.84% 12.70% 30.16%
Used Engine Oil 12.50% 0.83% 1.67% 85.00%
Electrical Items 28.23% 21.77% 14.52% 35.48%
Mobile Phones 20.97% 10.48% 21.77% 46.77%
Tetrapacks 47.58% 17.74% 9.68% 25.00%
3)
4) Supermarket 31.75%
General 77.78%
HWRC 53.17%
Use Boxes 6.35%
Local Glass 10.32%
Use Compost Bin 24.60%
Local Textile 36.51%
Other Compost 2.38%
None 22.22%
Other 7.94%
Other 4.76%
6) 5)
Long/Steep 3.36%
Garden Waste Bin 91.27%
Direct 10.92%
General Waste Bin 2.38%
Rear 2.52%
My Own Bin 19.84%
Shared 0.84%
Use Other Compost 2.38%
Registered 5.88%
None 76.47%
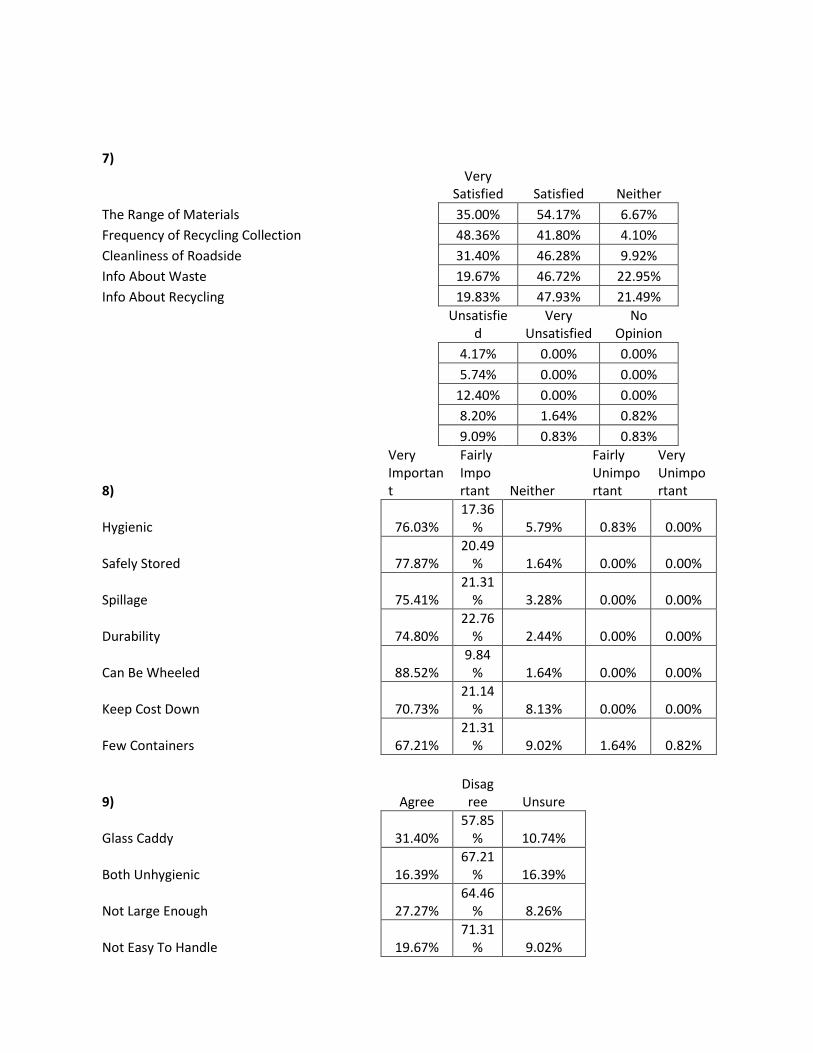
7)
Very
Satisfied
Satisfied
Neither
The Range of Materials 35.00% 54.17% 6.67% Frequency of Recycling Collection 48.36% 41.80% 4.10% Cleanliness of Roadside 31.40% 46.28% 9.92% Info About Waste 19.67% 46.72% 22.95% Info About Recycling 19.83% 47.93% 21.49%
Unsatisfied
Very Unsatisfied
No Opinion
4.17% 0.00% 0.00%
5.74% 0.00% 0.00%
12.40% 0.00% 0.00%
8.20% 1.64% 0.82%
9.09% 0.83% 0.83%
8)
Very Important
Fairly Important Neither
Fairly Unimportant
Very Unimportant
Hygienic 76.03% 17.36
% 5.79% 0.83% 0.00%
Safely Stored 77.87% 20.49
% 1.64% 0.00% 0.00%
Spillage 75.41% 21.31
% 3.28% 0.00% 0.00%
Durability 74.80% 22.76
% 2.44% 0.00% 0.00%
Can Be Wheeled 88.52% 9.84
% 1.64% 0.00% 0.00%
Keep Cost Down 70.73% 21.14
% 8.13% 0.00% 0.00%
Few Containers 67.21% 21.31
% 9.02% 1.64% 0.82%
9) Agree
Disagree Unsure
Glass Caddy 31.40% 57.85
% 10.74%
Both Unhygienic 16.39% 67.21
% 16.39%
Not Large Enough 27.27% 64.46
% 8.26%
Not Easy To Handle 19.67% 71.31
% 9.02%
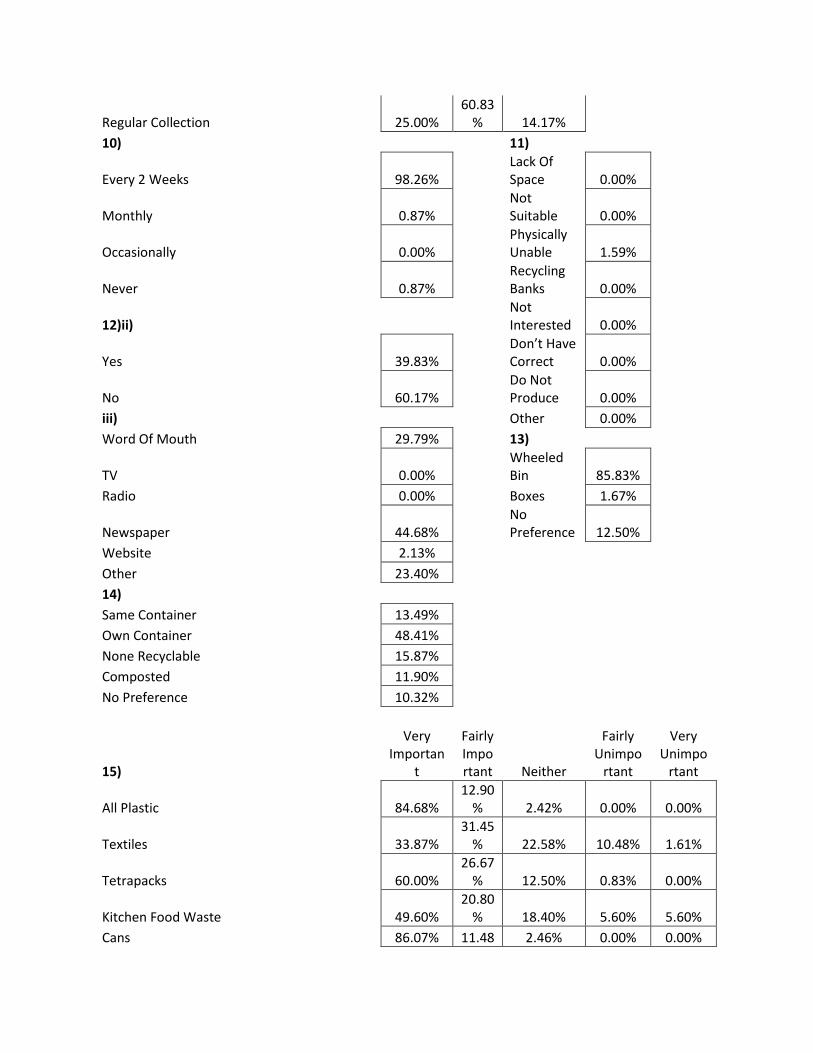
Regular Collection 25.00% 60.83
% 14.17% 10)
11)
Every 2 Weeks 98.26%
Lack Of Space 0.00%
Monthly 0.87%
Not Suitable 0.00%
Occasionally 0.00%
Physically Unable 1.59%
Never 0.87%
Recycling Banks 0.00%
12)ii)
Not Interested 0.00%
Yes 39.83%
Don’t Have Correct 0.00%
No 60.17%
Do Not Produce 0.00%
iii)
Other 0.00% Word Of Mouth 29.79%
13)
TV 0.00%
Wheeled Bin 85.83%
Radio 0.00%
Boxes 1.67%
Newspaper 44.68%
No Preference 12.50%
Website 2.13% Other 23.40% 14)
Same Container 13.49% Own Container 48.41% None Recyclable 15.87% Composted 11.90% No Preference 10.32%
15)
Very Importan
t
Fairly Important Neither
Fairly Unimpo
rtant
Very Unimpo
rtant
All Plastic 84.68% 12.90
% 2.42% 0.00% 0.00%
Textiles 33.87% 31.45
% 22.58% 10.48% 1.61%
Tetrapacks 60.00% 26.67
% 12.50% 0.83% 0.00%
Kitchen Food Waste 49.60% 20.80
% 18.40% 5.60% 5.60%
Cans 86.07% 11.48 2.46% 0.00% 0.00%
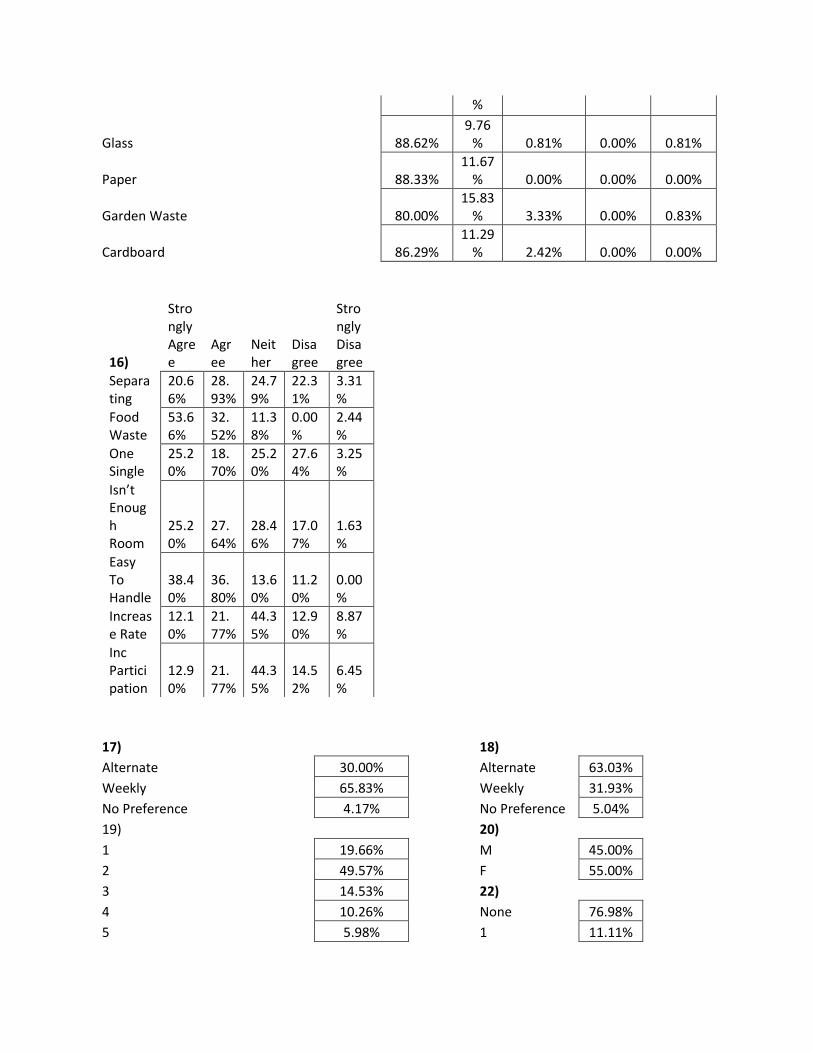
%
Glass 88.62% 9.76
% 0.81% 0.00% 0.81%
Paper 88.33% 11.67
% 0.00% 0.00% 0.00%
Garden Waste 80.00% 15.83
% 3.33% 0.00% 0.83%
Cardboard 86.29% 11.29
% 2.42% 0.00% 0.00%
16)
Strongly Agree
Agree
Neither
Disagree
Strongly Disagree
Separating
20.66%
28.93%
24.79%
22.31%
3.31%
Food Waste
53.66%
32.52%
11.38%
0.00%
2.44%
One Single
25.20%
18.70%
25.20%
27.64%
3.25%
Isn’t Enough Room
25.20%
27.64%
28.46%
17.07%
1.63%
Easy To Handle
38.40%
36.80%
13.60%
11.20%
0.00%
Increase Rate
12.10%
21.77%
44.35%
12.90%
8.87%
Inc Participation
12.90%
21.77%
44.35%
14.52%
6.45%
17)
18) Alternate 30.00%
Alternate 63.03%
Weekly 65.83%
Weekly 31.93%
No Preference 4.17%
No Preference 5.04%
19)
20) 1 19.66%
M 45.00%
2 49.57%
F 55.00%
3 14.53%
22) 4 10.26%
None 76.98%
5 5.98%
1 11.11%
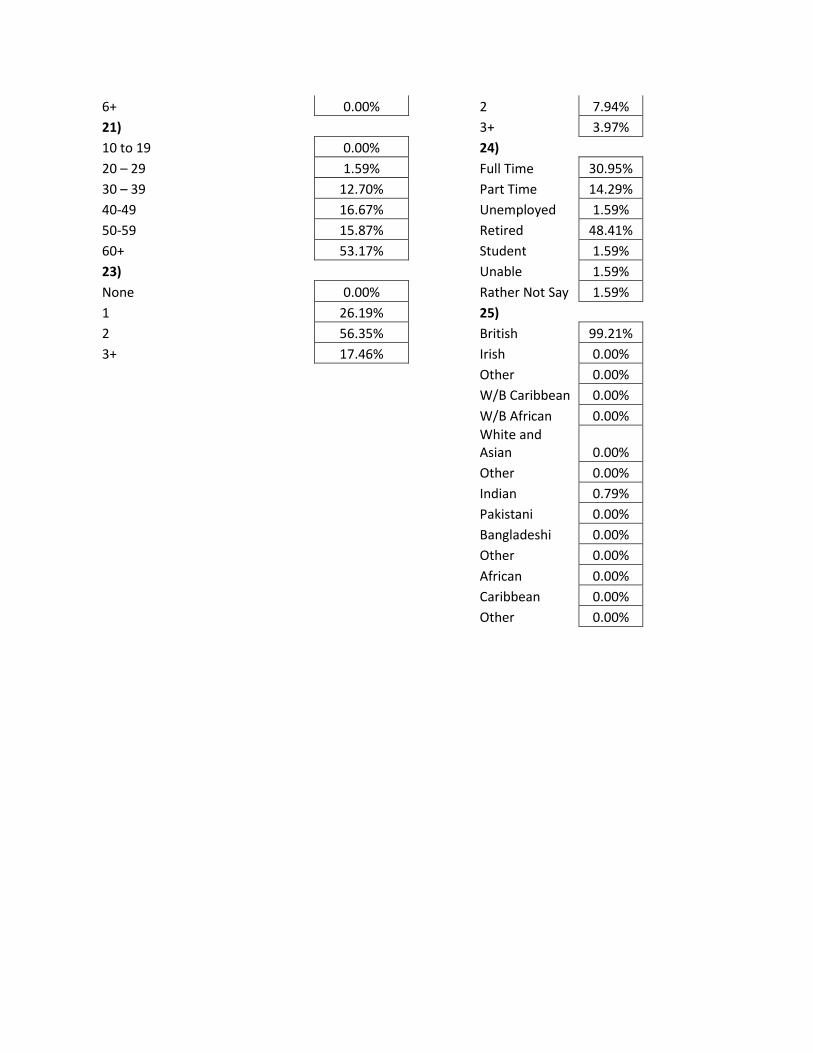
6+ 0.00%
2 7.94%
21)
3+ 3.97%
10 to 19 0.00%
24) 20 – 29 1.59%
Full Time 30.95%
30 – 39 12.70%
Part Time 14.29%
40-49 16.67%
Unemployed 1.59%
50-59 15.87%
Retired 48.41%
60+ 53.17%
Student 1.59%
23)
Unable 1.59%
None 0.00%
Rather Not Say 1.59%
1 26.19%
25) 2 56.35%
British 99.21%
3+ 17.46%
Irish 0.00%
Other 0.00%
W/B Caribbean 0.00%
W/B African 0.00%
White and Asian 0.00%
Other 0.00%
Indian 0.79%
Pakistani 0.00%
Bangladeshi 0.00%
Other 0.00%
African 0.00%
Caribbean 0.00%
Other 0.00%

Appendix 7
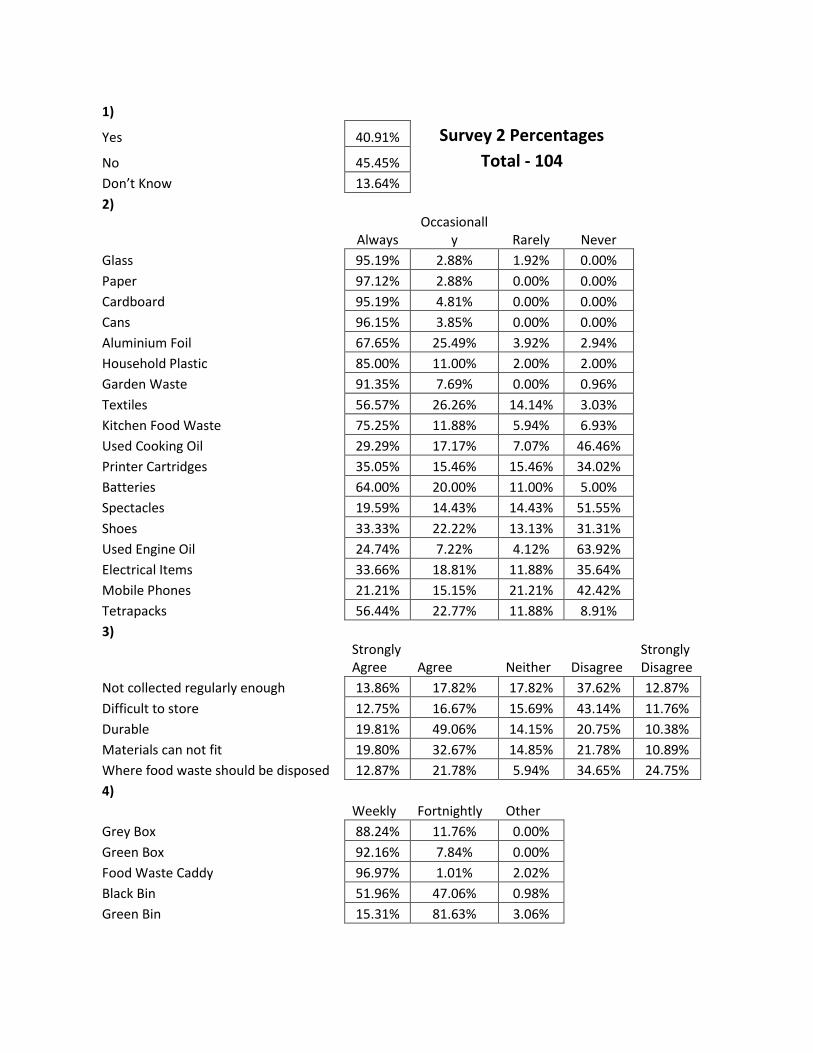
1)
Yes 40.91% Survey 2 Percentages
No 45.45% Total - 104 Don’t Know 13.64%
2)
Always
Occasionally Rarely Never
Glass 95.19% 2.88% 1.92% 0.00% Paper 97.12% 2.88% 0.00% 0.00% Cardboard 95.19% 4.81% 0.00% 0.00% Cans 96.15% 3.85% 0.00% 0.00% Aluminium Foil 67.65% 25.49% 3.92% 2.94% Household Plastic 85.00% 11.00% 2.00% 2.00% Garden Waste 91.35% 7.69% 0.00% 0.96% Textiles 56.57% 26.26% 14.14% 3.03% Kitchen Food Waste 75.25% 11.88% 5.94% 6.93% Used Cooking Oil 29.29% 17.17% 7.07% 46.46% Printer Cartridges 35.05% 15.46% 15.46% 34.02% Batteries 64.00% 20.00% 11.00% 5.00% Spectacles 19.59% 14.43% 14.43% 51.55% Shoes 33.33% 22.22% 13.13% 31.31% Used Engine Oil 24.74% 7.22% 4.12% 63.92% Electrical Items 33.66% 18.81% 11.88% 35.64% Mobile Phones 21.21% 15.15% 21.21% 42.42% Tetrapacks 56.44% 22.77% 11.88% 8.91% 3)
Strongly Agree Agree Neither Disagree
Strongly Disagree
Not collected regularly enough 13.86% 17.82% 17.82% 37.62% 12.87%
Difficult to store 12.75% 16.67% 15.69% 43.14% 11.76%
Durable 19.81% 49.06% 14.15% 20.75% 10.38%
Materials can not fit 19.80% 32.67% 14.85% 21.78% 10.89%
Where food waste should be disposed 12.87% 21.78% 5.94% 34.65% 24.75%
4)
Weekly Fortnightly Other
Grey Box 88.24% 11.76% 0.00% Green Box 92.16% 7.84% 0.00% Food Waste Caddy 96.97% 1.01% 2.02% Black Bin 51.96% 47.06% 0.98% Green Bin 15.31% 81.63% 3.06%
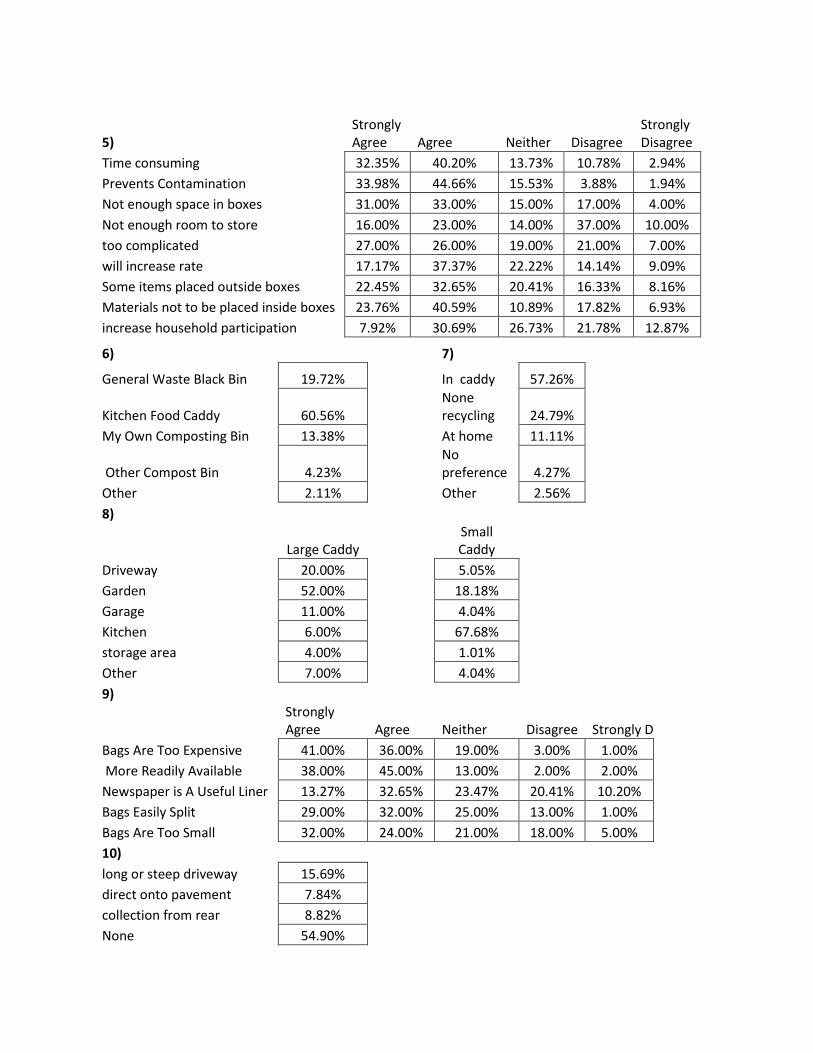
5) Strongly Agree Agree Neither Disagree
Strongly Disagree
Time consuming 32.35% 40.20% 13.73% 10.78% 2.94%
Prevents Contamination 33.98% 44.66% 15.53% 3.88% 1.94%
Not enough space in boxes 31.00% 33.00% 15.00% 17.00% 4.00%
Not enough room to store 16.00% 23.00% 14.00% 37.00% 10.00%
too complicated 27.00% 26.00% 19.00% 21.00% 7.00%
will increase rate 17.17% 37.37% 22.22% 14.14% 9.09%
Some items placed outside boxes 22.45% 32.65% 20.41% 16.33% 8.16%
Materials not to be placed inside boxes 23.76% 40.59% 10.89% 17.82% 6.93%
increase household participation 7.92% 30.69% 26.73% 21.78% 12.87%
6)
7)
General Waste Black Bin 19.72%
In caddy 57.26%
Kitchen Food Caddy 60.56%
None recycling 24.79%
My Own Composting Bin 13.38%
At home 11.11%
Other Compost Bin 4.23%
No preference 4.27%
Other 2.11%
Other 2.56% 8)
Large Caddy
Small Caddy
Driveway 20.00%
5.05% Garden 52.00%
18.18%
Garage 11.00%
4.04% Kitchen 6.00%
67.68%
storage area 4.00%
1.01% Other 7.00%
4.04%
9)
Strongly Agree Agree Neither Disagree Strongly D
Bags Are Too Expensive 41.00% 36.00% 19.00% 3.00% 1.00% More Readily Available 38.00% 45.00% 13.00% 2.00% 2.00% Newspaper is A Useful Liner 13.27% 32.65% 23.47% 20.41% 10.20% Bags Easily Split 29.00% 32.00% 25.00% 13.00% 1.00% Bags Are Too Small 32.00% 24.00% 21.00% 18.00% 5.00% 10)
long or steep driveway 15.69% direct onto pavement 7.84% collection from rear 8.82% None 54.90%
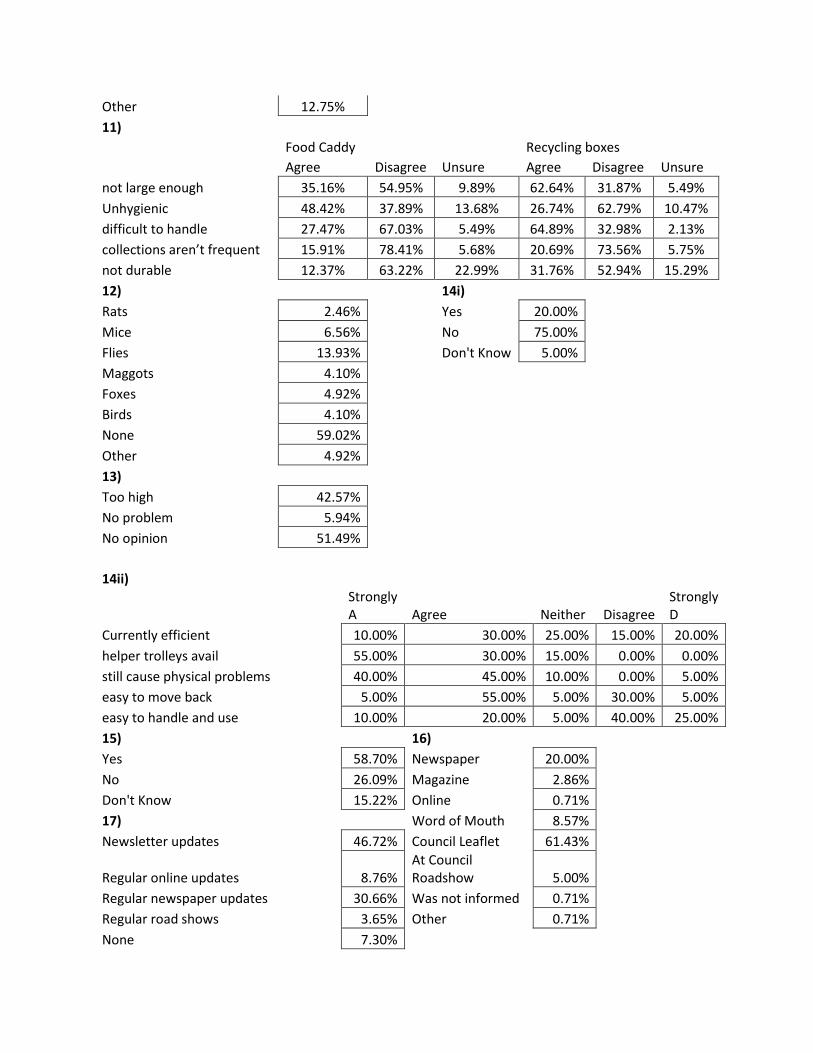
Other 12.75% 11)
Food Caddy
Recycling boxes
Agree Disagree Unsure Agree Disagree Unsure
not large enough 35.16% 54.95% 9.89% 62.64% 31.87% 5.49%
Unhygienic 48.42% 37.89% 13.68% 26.74% 62.79% 10.47%
difficult to handle 27.47% 67.03% 5.49% 64.89% 32.98% 2.13%
collections aren’t frequent 15.91% 78.41% 5.68% 20.69% 73.56% 5.75%
not durable 12.37% 63.22% 22.99% 31.76% 52.94% 15.29%
12)
14i) Rats 2.46%
Yes 20.00%
Mice 6.56%
No 75.00% Flies 13.93%
Don't Know 5.00%
Maggots 4.10% Foxes 4.92% Birds 4.10% None 59.02% Other 4.92% 13)
Too high 42.57% No problem 5.94% No opinion 51.49%
14ii)
Strongly A Agree Neither Disagree
Strongly D
Currently efficient 10.00% 30.00% 25.00% 15.00% 20.00%
helper trolleys avail 55.00% 30.00% 15.00% 0.00% 0.00%
still cause physical problems 40.00% 45.00% 10.00% 0.00% 5.00%
easy to move back 5.00% 55.00% 5.00% 30.00% 5.00%
easy to handle and use 10.00% 20.00% 5.00% 40.00% 25.00%
15)
16) Yes 58.70% Newspaper 20.00%
No 26.09% Magazine 2.86% Don't Know 15.22% Online 0.71% 17)
Word of Mouth 8.57%
Newsletter updates 46.72% Council Leaflet 61.43%
Regular online updates 8.76% At Council Roadshow 5.00%
Regular newspaper updates 30.66% Was not informed 0.71% Regular road shows 3.65% Other 0.71% None 7.30%
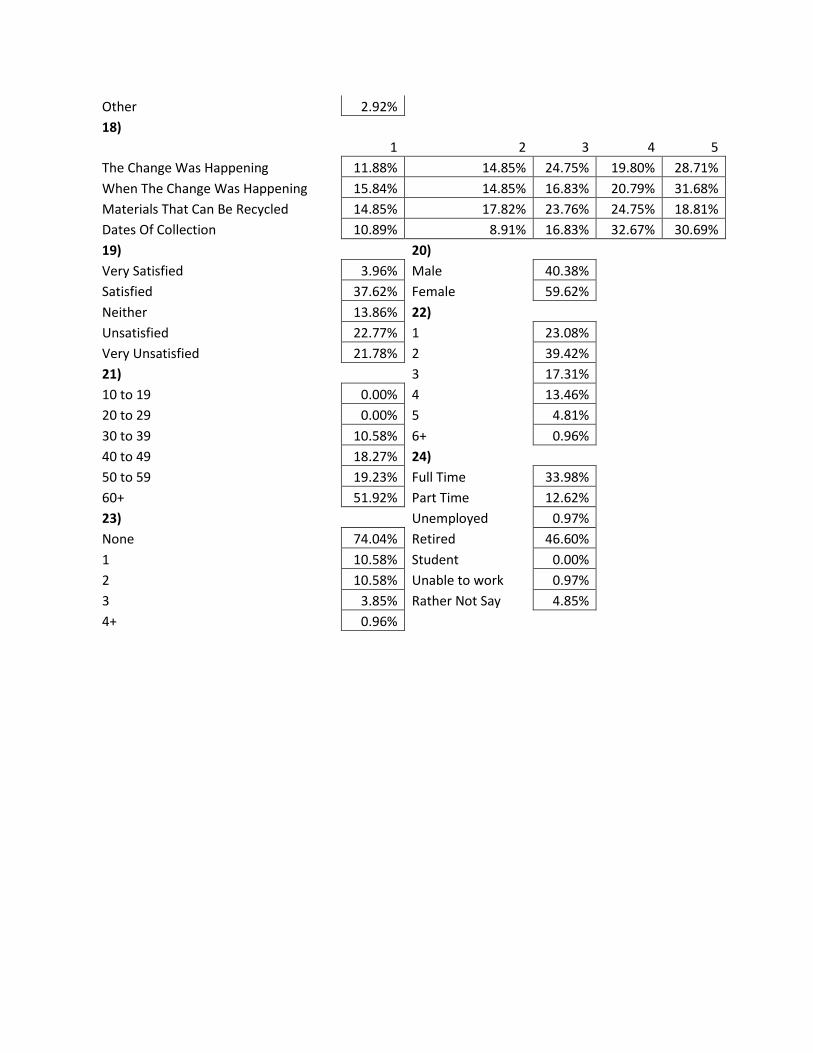
Other 2.92% 18)
1 2 3 4 5
The Change Was Happening 11.88% 14.85% 24.75% 19.80% 28.71%
When The Change Was Happening 15.84% 14.85% 16.83% 20.79% 31.68%
Materials That Can Be Recycled 14.85% 17.82% 23.76% 24.75% 18.81%
Dates Of Collection 10.89% 8.91% 16.83% 32.67% 30.69%
19)
20) Very Satisfied 3.96% Male 40.38%
Satisfied 37.62% Female 59.62% Neither 13.86% 22)
Unsatisfied 22.77% 1 23.08% Very Unsatisfied 21.78% 2 39.42% 21)
3 17.31%
10 to 19 0.00% 4 13.46% 20 to 29 0.00% 5 4.81% 30 to 39 10.58% 6+ 0.96% 40 to 49 18.27% 24)
50 to 59 19.23% Full Time 33.98% 60+ 51.92% Part Time 12.62% 23)
Unemployed 0.97%
None 74.04% Retired 46.60% 1 10.58% Student 0.00% 2 10.58% Unable to work 0.97% 3 3.85% Rather Not Say 4.85% 4+ 0.96%

Appendix 8
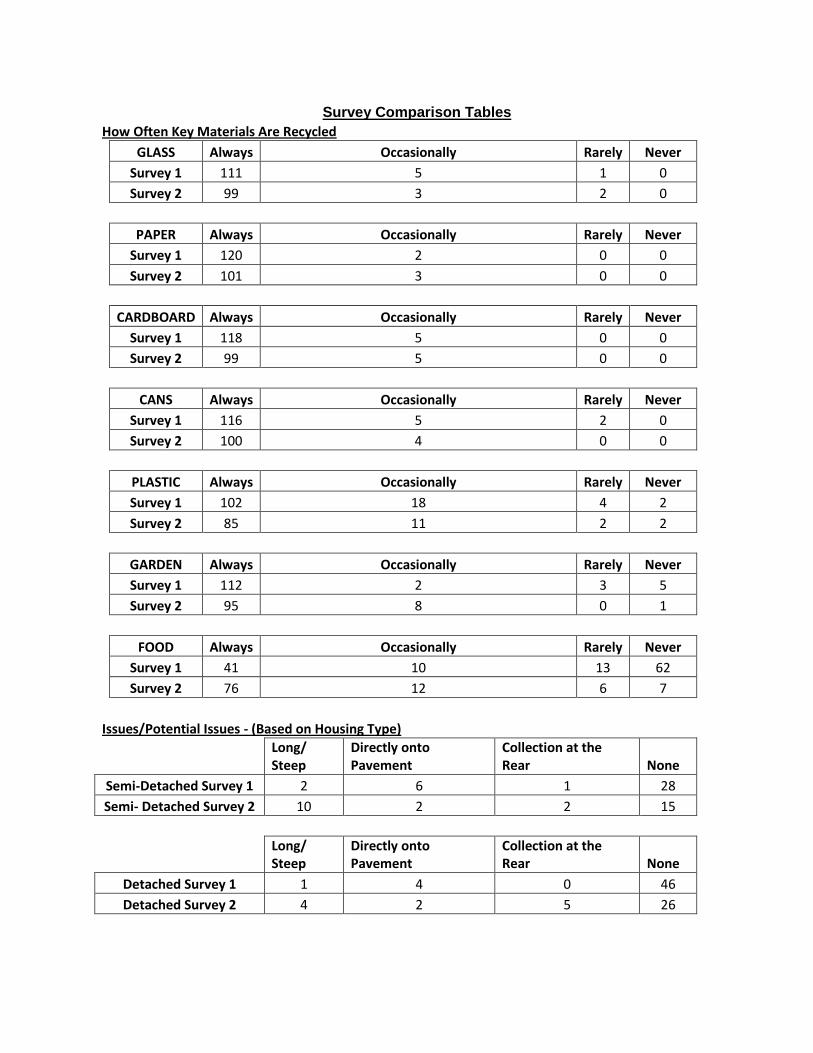
Survey Comparison Tables
How Often Key Materials Are Recycled
GLASS Always Occasionally Rarely Never
Survey 1 111 5 1 0
Survey 2 99 3 2 0
PAPER Always Occasionally Rarely Never
Survey 1 120 2 0 0
Survey 2 101 3 0 0
CARDBOARD Always Occasionally Rarely Never
Survey 1 118 5 0 0
Survey 2 99 5 0 0
CANS Always Occasionally Rarely Never
Survey 1 116 5 2 0
Survey 2 100 4 0 0
PLASTIC Always Occasionally Rarely Never
Survey 1 102 18 4 2
Survey 2 85 11 2 2
GARDEN Always Occasionally Rarely Never
Survey 1 112 2 3 5
Survey 2 95 8 0 1
FOOD Always Occasionally Rarely Never
Survey 1 41 10 13 62
Survey 2 76 12 6 7
Issues/Potential Issues - (Based on Housing Type)
Long/ Steep
Directly onto Pavement
Collection at the Rear None
Semi-Detached Survey 1 2 6 1 28
Semi- Detached Survey 2 10 2 2 15
Long/ Steep
Directly onto Pavement
Collection at the Rear None
Detached Survey 1 1 4 0 46
Detached Survey 2 4 2 5 26
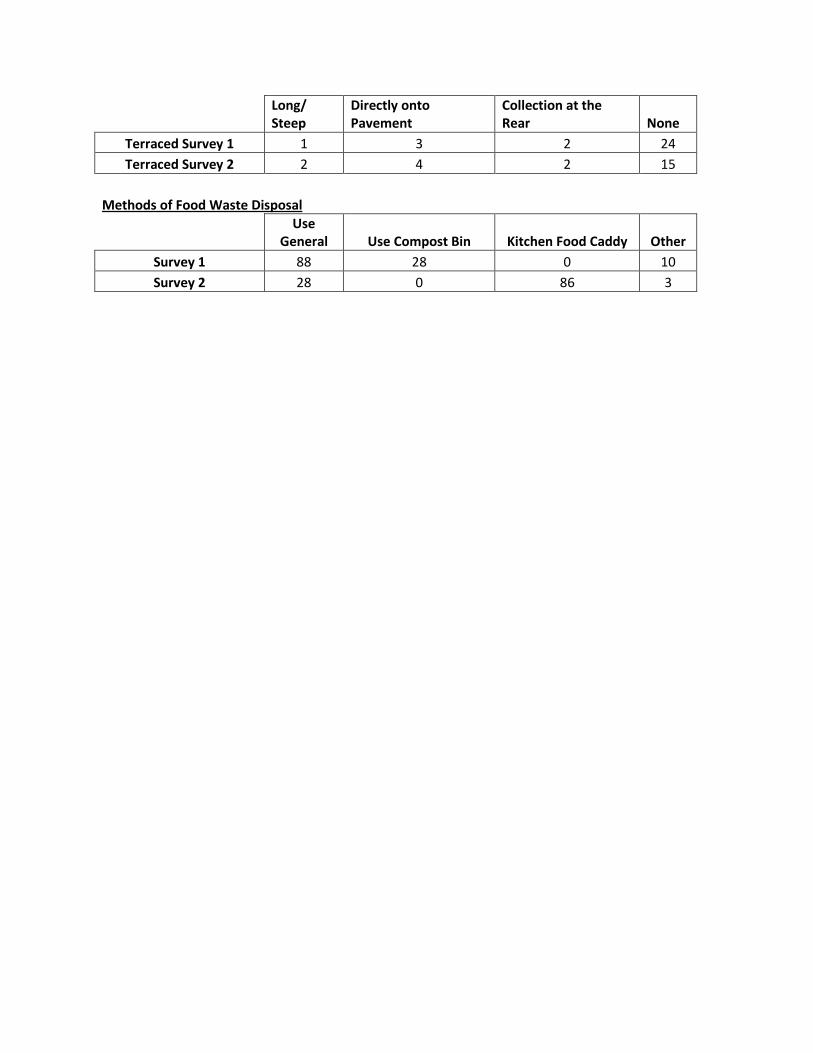
Long/ Steep
Directly onto Pavement
Collection at the Rear None
Terraced Survey 1 1 3 2 24
Terraced Survey 2 2 4 2 15
Methods of Food Waste Disposal
Use General Use Compost Bin Kitchen Food Caddy Other
Survey 1 88 28 0 10
Survey 2 28 0 86 3

Appendix 9
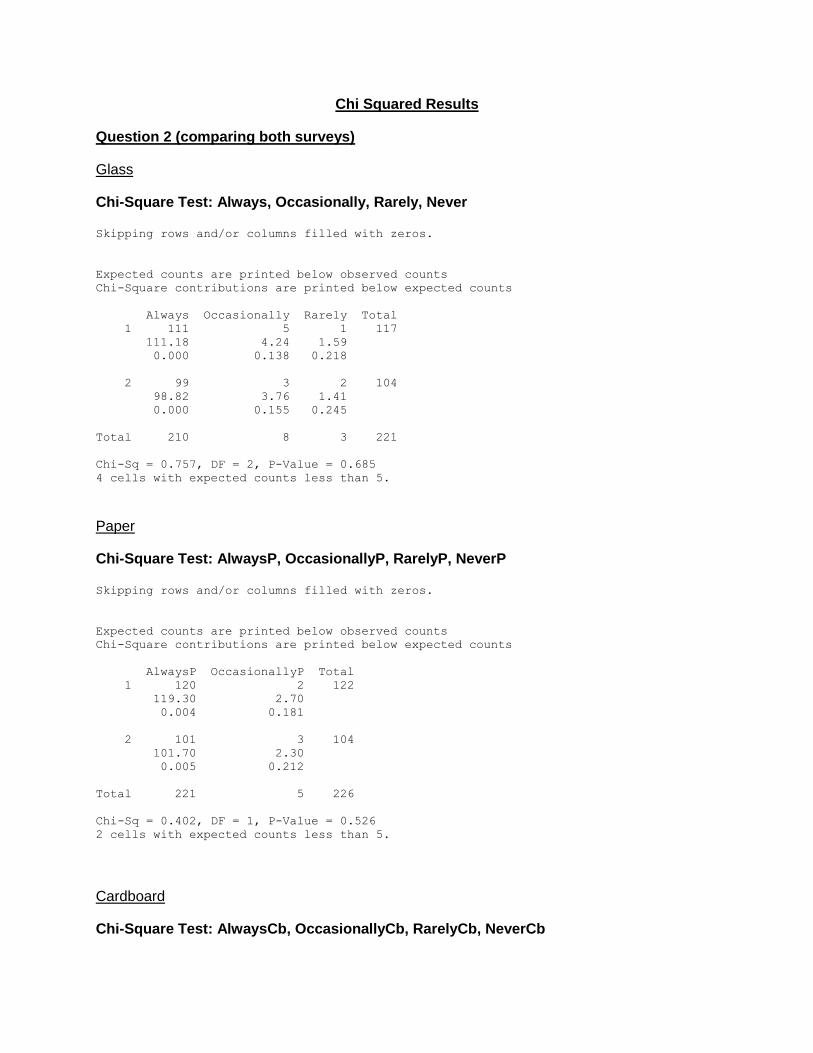
Chi Squared Results
Question 2 (comparing both surveys)
Glass
Chi-Square Test: Always, Occasionally, Rarely, Never Skipping rows and/or columns filled with zeros.
Expected counts are printed below observed counts
Chi-Square contributions are printed below expected counts
Always Occasionally Rarely Total
1 111 5 1 117
111.18 4.24 1.59
0.000 0.138 0.218
2 99 3 2 104
98.82 3.76 1.41
0.000 0.155 0.245
Total 210 8 3 221
Chi-Sq = 0.757, DF = 2, P-Value = 0.685
4 cells with expected counts less than 5.
Paper
Chi-Square Test: AlwaysP, OccasionallyP, RarelyP, NeverP Skipping rows and/or columns filled with zeros.
Expected counts are printed below observed counts
Chi-Square contributions are printed below expected counts
AlwaysP OccasionallyP Total
1 120 2 122
119.30 2.70
0.004 0.181
2 101 3 104
101.70 2.30
0.005 0.212
Total 221 5 226
Chi-Sq = 0.402, DF = 1, P-Value = 0.526
2 cells with expected counts less than 5.
Cardboard
Chi-Square Test: AlwaysCb, OccasionallyCb, RarelyCb, NeverCb
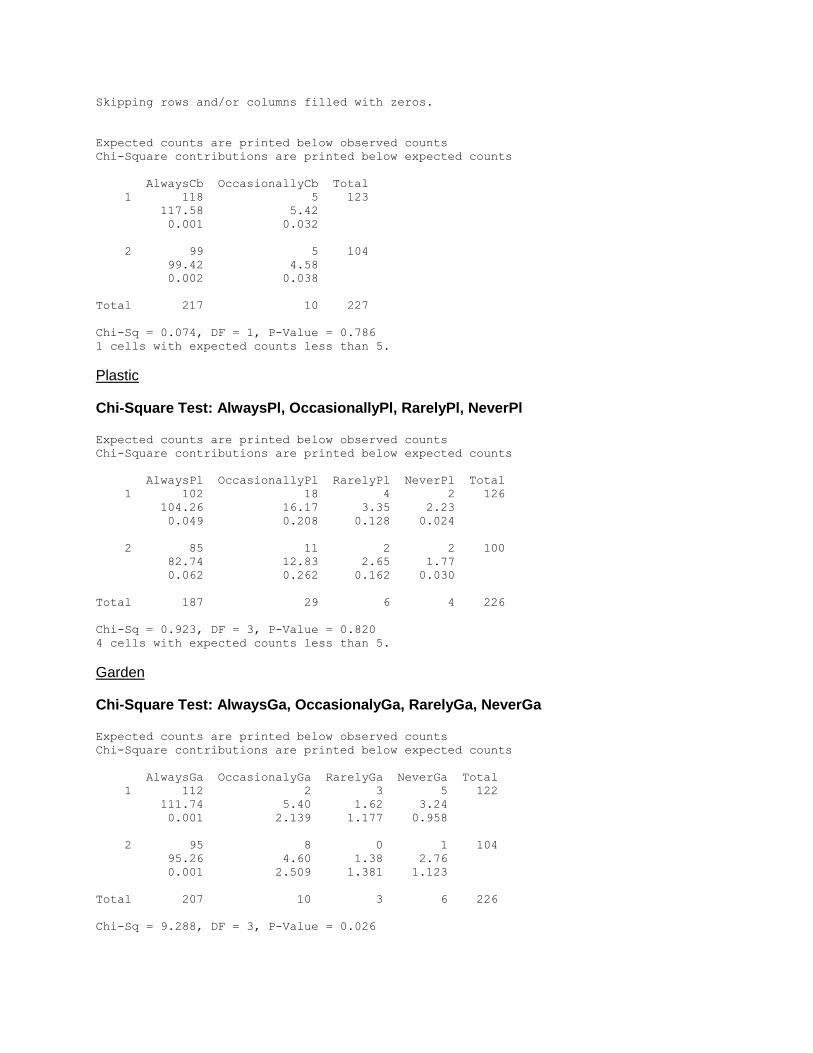
Skipping rows and/or columns filled with zeros.
Expected counts are printed below observed counts
Chi-Square contributions are printed below expected counts
AlwaysCb OccasionallyCb Total
1 118 5 123
117.58 5.42
0.001 0.032
2 99 5 104
99.42 4.58
0.002 0.038
Total 217 10 227
Chi-Sq = 0.074, DF = 1, P-Value = 0.786
1 cells with expected counts less than 5.
Plastic
Chi-Square Test: AlwaysPl, OccasionallyPl, RarelyPl, NeverPl Expected counts are printed below observed counts
Chi-Square contributions are printed below expected counts
AlwaysPl OccasionallyPl RarelyPl NeverPl Total
1 102 18 4 2 126
104.26 16.17 3.35 2.23
0.049 0.208 0.128 0.024
2 85 11 2 2 100
82.74 12.83 2.65 1.77
0.062 0.262 0.162 0.030
Total 187 29 6 4 226
Chi-Sq = 0.923, DF = 3, P-Value = 0.820
4 cells with expected counts less than 5.
Garden
Chi-Square Test: AlwaysGa, OccasionalyGa, RarelyGa, NeverGa Expected counts are printed below observed counts
Chi-Square contributions are printed below expected counts
AlwaysGa OccasionalyGa RarelyGa NeverGa Total
1 112 2 3 5 122
111.74 5.40 1.62 3.24
0.001 2.139 1.177 0.958
2 95 8 0 1 104
95.26 4.60 1.38 2.76
0.001 2.509 1.381 1.123
Total 207 10 3 6 226
Chi-Sq = 9.288, DF = 3, P-Value = 0.026
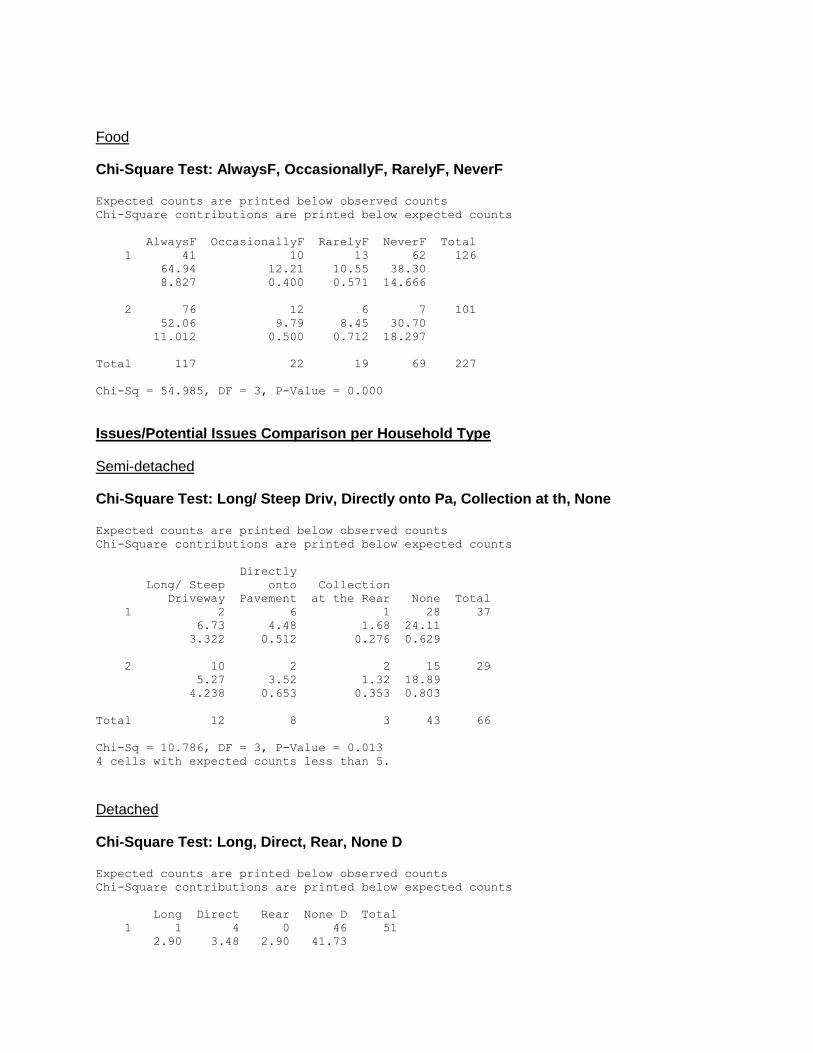
Food
Chi-Square Test: AlwaysF, OccasionallyF, RarelyF, NeverF Expected counts are printed below observed counts
Chi-Square contributions are printed below expected counts
AlwaysF OccasionallyF RarelyF NeverF Total
1 41 10 13 62 126
64.94 12.21 10.55 38.30
8.827 0.400 0.571 14.666
2 76 12 6 7 101
52.06 9.79 8.45 30.70
11.012 0.500 0.712 18.297
Total 117 22 19 69 227
Chi-Sq = 54.985, DF = 3, P-Value = 0.000
Issues/Potential Issues Comparison per Household Type
Semi-detached
Chi-Square Test: Long/ Steep Driv, Directly onto Pa, Collection at th, None Expected counts are printed below observed counts
Chi-Square contributions are printed below expected counts
Directly
Long/ Steep onto Collection
Driveway Pavement at the Rear None Total
1 2 6 1 28 37
6.73 4.48 1.68 24.11
3.322 0.512 0.276 0.629
2 10 2 2 15 29
5.27 3.52 1.32 18.89
4.238 0.653 0.353 0.803
Total 12 8 3 43 66
Chi-Sq = 10.786, DF = 3, P-Value = 0.013
4 cells with expected counts less than 5.
Detached
Chi-Square Test: Long, Direct, Rear, None D Expected counts are printed below observed counts
Chi-Square contributions are printed below expected counts
Long Direct Rear None D Total
1 1 4 0 46 51
2.90 3.48 2.90 41.73
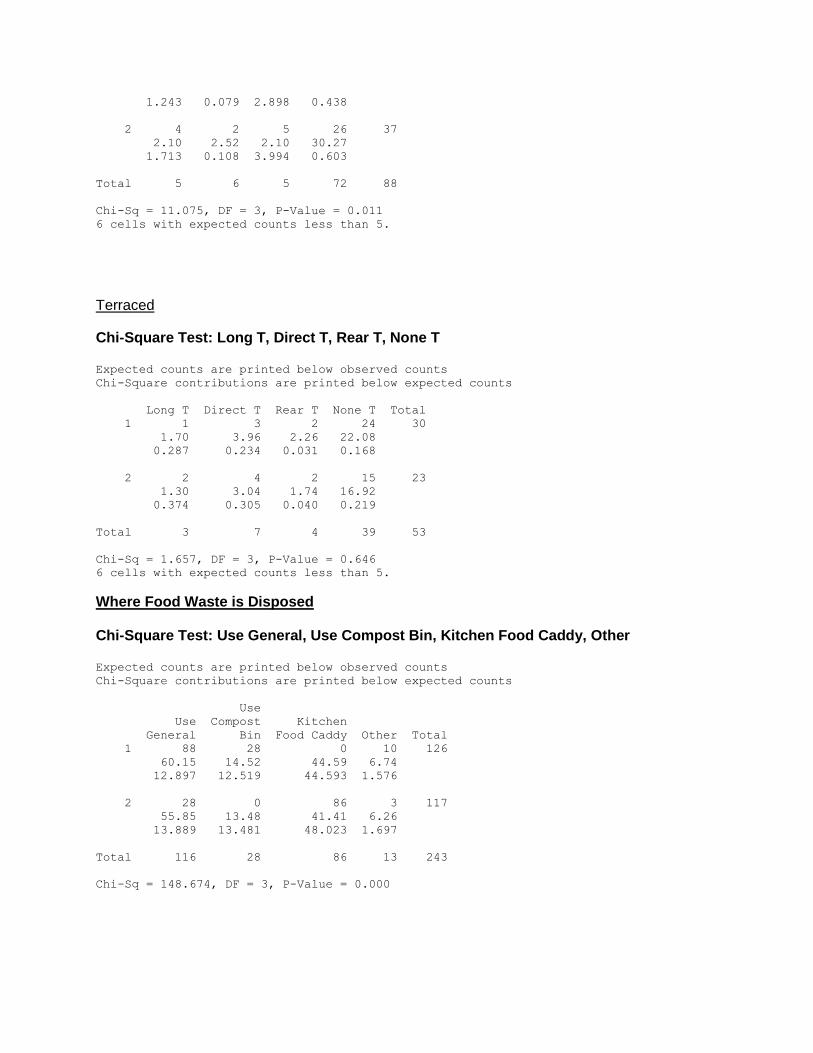
1.243 0.079 2.898 0.438
2 4 2 5 26 37
2.10 2.52 2.10 30.27
1.713 0.108 3.994 0.603
Total 5 6 5 72 88
Chi-Sq = 11.075, DF = 3, P-Value = 0.011
6 cells with expected counts less than 5.
Terraced
Chi-Square Test: Long T, Direct T, Rear T, None T Expected counts are printed below observed counts
Chi-Square contributions are printed below expected counts
Long T Direct T Rear T None T Total
1 1 3 2 24 30
1.70 3.96 2.26 22.08
0.287 0.234 0.031 0.168
2 2 4 2 15 23
1.30 3.04 1.74 16.92
0.374 0.305 0.040 0.219
Total 3 7 4 39 53
Chi-Sq = 1.657, DF = 3, P-Value = 0.646
6 cells with expected counts less than 5.
Where Food Waste is Disposed Chi-Square Test: Use General, Use Compost Bin, Kitchen Food Caddy, Other Expected counts are printed below observed counts
Chi-Square contributions are printed below expected counts
Use
Use Compost Kitchen
General Bin Food Caddy Other Total
1 88 28 0 10 126
60.15 14.52 44.59 6.74
12.897 12.519 44.593 1.576
2 28 0 86 3 117
55.85 13.48 41.41 6.26
13.889 13.481 48.023 1.697
Total 116 28 86 13 243
Chi-Sq = 148.674, DF = 3, P-Value = 0.000

Appendix 10
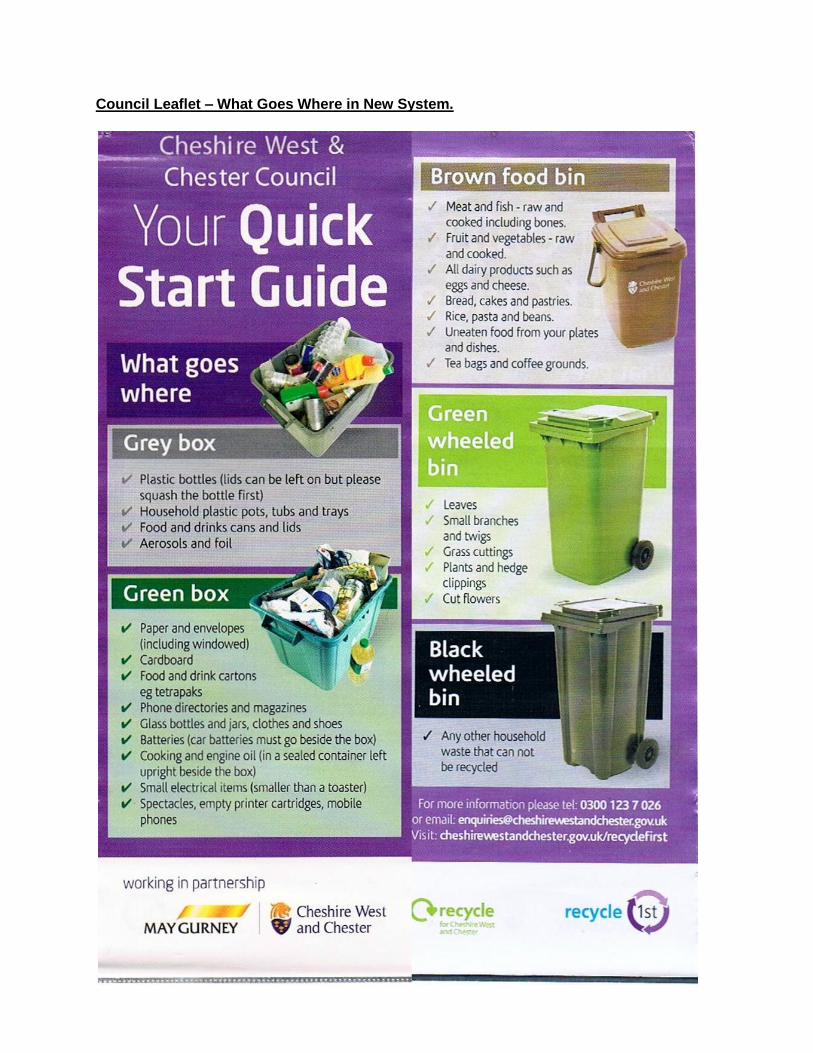
Council Leaflet – What Goes Where in New System.


![Zoonoses in Rural Cambodia - pub.epsilon.slu.se4.1.1 Zoonosis awareness and risk perception 52 4.2 Household practices associated with zoonosis exposure [Paper I] 53 4.3 Influenza](https://img.pdfslide.us/doc/110x75/5ed4acddd18c7b5d8f4ba6cb/zoonoses-in-rural-cambodia-pub-411-zoonosis-awareness-and-risk-perception-52.jpg)