Embed Size (px)
Citation preview
z
Medicaid Long-term Care Servicesfor the Elderly,
Adults with Physical Disabilities, and Adults with Developmental Disabilities:
A Study of the Determinants and Utilizationof Institutional and Home and
Community-Based Services
Submitted to the Division of Aging and Adults Services, Arkansas Department of Human Services
OnFebruary 28, 2005
Principal Report AuthorsM. Kate Stewart, MD, MPH, Holly Felix, MPA,
Nancy Dockter, Dana Perry, MA, and Jinger MorganCollege of Public Health
University of Arkansas for Medical Sciences

Medicaid Long-term Care Services for the Elderly, Adults with Physical Disabilities, and Adults with Developmental
Disabilities: A Study of the Determinants and Utilization of Institutional and Home and Community-Based Services
Submitted to the Division of Aging and Adults Services, Arkansas Department of Human Services
OnFebruary 28, 2005
Principal Report AuthorsM. Kate Stewart, MD, MPH, Holly Felix, MPA,
Nancy Dockter, Dana Perry, MA, and Jinger MorganCollege of Public Health
University of Arkansas for Medical Sciences4301 West Markham Street, Slot 820-1
Little Rock, Arkansas 72205
Suggested Citation:Stewart MK, Felix HC, Dockter NE, Perry DM, Morgan JR. Medicaid Long-term Care Services for the Elderly, Adults with Physical Disabilities and Adults with Developmental Disabilities: A Study of the Determinants and Utilization of Institutional and Home and Community-Based Services. Little Rock, AR: College of Public Health, UAMS. 2005.

Acknowledgments
This study would not have been possible without the generous participation of those who agreed to serve as respondents in our focus group discussions and key informant interviews. Their willingness to give their time and share their insights, their personal stories and other experiences was an invaluable contribution for which we are deeply grateful. We would also like to thank the many people who helped to identify, contact, and/or process informed consents and HIPAA forms for respondents: Judy Adams, Nancy Craft Alexander, Jim Bradley, Gerald Canada, Max Delee, Leann Edwards, Richard Fong, Charlie Green, Margo Green, Sherri Hardin, Tracey Harris, James Hayden, Jean Hecker, Shelley Lee, Lesa Lewallen, Sherri Proffer, Marthelle Qualls, Lisa Richerson, Forrest Steele, Trichita Steel, Deborah Tenner, Linda Vining, and Katie West. We would also like to express our appreciation to Joe Crum, Laurie Jackson, Teresa Hursey, and Lanny Nordin for their assistance in obtaining secondary Medicaid data.
The Advisory Working Group provided important guidance throughout the course of this study and we thank them for sharing their expertise, knowledge and insights with us and for the hours they spent helping to define the study questions in ways that would be relevant, identifying data sources and helping us to gain access to data, and helping us to interpret and reflect on the meaning of our findings. Their input in developing recommendations was essential to the production of this final report. The members1 of the AWG are:
*Sandra Barrett – retired, Division of Aging and Adult Services (DAAS)Elaine Eubank, CareLinkDawn Graziani, RN, Arkansas Department of Health#James C. “Charlie” Green, PhD, Division of Developmental Disabilities Services (DDS)James Hayden, Division of Developmental Disabilities Services (DDS)Randy Helms, Division of Medical ServicesScott Holladay, Division of Aging and Adult Services*Rich Huddleston, Arkansas Advocates for Children and Families (formerly DHS)*Shelley Lee, MPA, Division of Developmental Disabilities Services (DDS)Sherri Proffer, RN, Arkansas Department of Human Services (DHS)Carol Shockley, Office of Long Term CareHerb Sanderson, MPA, Division of Aging and Adult ServicesLinda White, United Cerebral Palsy of Arkansas
As the primary authors of this report, we would also like to acknowledge and thank the rest of the members of the research study team, who helped to carry out the work of this study through conducting literature reviews; obtaining, processing, and carrying out computer programming of the secondary data; giving their expert guidance on
1 Some members of the AWG did not have continuous involvement because of changes in their duties (*) or chose to designate a representative rather than to participate personally in AWG meetings (#).
i

substantive and research methodology issues; reviewing drafts of instruments, sample designs, and findings and recommendations; and participating in AWG and research study team meetings. These additional members of the research team are:
Dean Blevins, PhDMarisue Cody, PhDNancy KirschAl McCullough, MSDavid Rickard, MPA
Last but not least, we would like to express our thanks to the Blue and You Foundation of Arkansas for providing the grant that funded this study and to acknowledge the Centers for Medicare and Medicaid Services for matching this grant with federal funds.
ii

Table of Contents
Executive Summary Page iv
Chapter 1. Introduction Page 1
Chapter 2. Study Methodology Page 9
Chapter 3. Availability of Selected Medicaid Long-term Care Services in Arkansas
Page 27
Chapter 4. Selected Characteristics and Enrollment Patterns of Arkansas’ Medicaid Long-Term Care Beneficiaries
Page 34
Chapter 5. Description of the Study Sample, and Characteristics of Participants in Focus Group Discussions and Key Informant Interviews
Page 56
Chapter 6. Leveling the Playing Field for Home and Community and Institutional Services
Page 62
Chapter 7. Information Dissemination and Counseling Page 73
Chapter 8. Improving Services to Meet Unmet Need Page 86
Chapter 9. Conclusion Page 99
Appendices
References
iii
Executive Summary
This report describes findings and recommendations from a study initiated by the Arkansas Division of Aging and Adults Services and carried out by the UAMS College of Public Health with funding from the Blue and You Foundation and the Centers for Medicare and Medicaid Services. The purpose of the study was to inform policy for improving long-term care (LTC) services for Arkansans by gaining a better understanding of why people in Arkansas use the LTC services they do. A variety of sources of information were obtained and compiled to examine this question. Specifically, secondary data on consumers of Medicaid LTC were obtained and analyzed, and primary data were collected from providers, through focus group discussions, and from consumers and others through key informant interviews.
Key findings centered on three themes: leveling the playing field between institutional and home and community-based services (HCBS); information dissemination and counseling; and improving services to meet unmet need. While the work of the study was carried out by a research study team, extensive guidance and assistance was provided by an advisory working group comprised of state policymakers, program managers, advocates and service providers.
The key findings and recommendations of the study are as follows:
Disparities in utilization may exist between whites and African Americans. Across the three waiver programs and institutional care services, white Arkansans below the poverty level enrolled in services at a rate higher than that of African Americans below poverty level. While waivers serve individuals with incomes three times SSI, i.e., incomes greater than
the poverty level, further study is recommended to determine if there are racial disparities and to better understand the extent to which they reflect differences in access between whites and African Americans.
Gatekeeping and difficulties navigating the HCBS program system may restrict access to HCBS. Recommendations include standardized, one-stop application/approval process for all Medicaid LTC services; face-to-face assessments by independent entity prior to authorization; fast track and presumptive eligibility for HCBS for those in emergency situations; and Medicaid-reimbursable, temporary nursing home stays for those awaiting approval for HCBS.
Individuals in nursing homes may be remaining there beyond the time when they need that level of care. Recommended is a cost-benefit analysis by DHS of mandated annual reassessments of all long-term care service consumers.
Mechanisms for achieving income eligibility are available for consumers entering nursing homes that are not available for those seeking HCBS. Recommendations are development of a medically needy spend-down option for HCBS applicants and a provision for spousal impoverishment for Alternatives Waiver consumers.
Overcoming system barriers sometimes required the intervention of someone in an advocate role. Recommendations are greater involvement of HCBS consumers in LTC policy formation and system change and improving access to information about HCBS.
iv

Many respondents used multiple, informal sources of information about LTC services instead of going to one formal source to get answers about care options. Recommendations to improve consumer awareness about LTC options and information sources include outreach through existing agencies and multiple points of community contact, improvements to telephone directory listings, promotion of the DHA/DDS website, and use of lay workers to inform consumers and help them navigate the LTC system
Many respondents reported that formal sources were sometimes not helpful in providing the information they sought about HCBS. Recommendations to improve knowledge about the viability of HCBS options and waiver programs among DHS field office workers and other social service providers include promoting use of the DAAS/DDS website, toll-free phone line, and printed materials.
Physicians played an influential role in decision making about LTC, but not for accessing waiver services. Recommendations include multi-faceted promotions to physicians, nurses, and support staff about the full array of HCBS and sources of information about LTC services.
Among study participants, there was an unmet need for assisted living. Recommended is an expansion of the number of affordable assisted living beds to meet the needs of moderate and low-income individuals, including those eligible for the Medicaid Assisted Living Waiver.
HCBS use could be increased through selected expansion of services. Recommendations include more flexible nursing care plans; expansion of allowed hours and services for HCBS care; broadening the Nurse Practice Act to permit CNAs and personal care aides to dispense medications and perform non-invasive procedures under RN supervision;
increased hours of Medicaid-reimbursable HCBS respite services for ElderChoices and Developmentally Disabled Waiver consumers; and making respite care a standard, more “intentional” offering of nursing homes.
Some of the needs of non-elderly, institutionalized adults with physical disabilities are not being addressed. Recommended is provision of more alternatives to the nursing home for non-elderly adults with physical disabilities, specifically shared housing or assisted living.
A few HCBS consumers reported problems finding reliable, competent direct service workers. Recommendations include exploration of ways to improve wages and benefits for both institutional-based and HCBS direct service workers and development of policies to address issues of competency, trustworthiness and reliability of aides and private HCBS agencies, such as Medicaid-reimbursed training, credentialing, and background checks.
v

Chapter 1Introduction
Long-term care (LTC) represents the continuum of health and social services provided
for an extended period or on a permanent basis to persons who have limited functional
capacity and require assistance. In their glossary of health care terms, AcademyHealth
notes that LTC is often used to refer only to institutional care settings, however, their
definition of LTC includes a broader spectrum of services available both in an
institutional setting and at home: “Long-term care [is] a set of health care, personal
care, and social services required by persons who have lost, or never acquired, some
degree of functional capacity (e.g. the chronically ill, aged, disabled, or retarded) in an
institution or at home, on a long-term basis.”i
ProgramsOver the years, Arkansas has implemented a number of innovative programs offering
individuals a choice of how and where they receive such LTC. Today more than 6,000
elderly Arkansans receive home and community-based care (HCB) through
ElderChoices, a Medicaid waiver for individuals age 65+. More recently a second
nursing home diversion Medicaid waiver program, Alternatives, was initiated for adults
with physical disabilities who are from 21 to 64 years. Likewise, Arkansas has one of
the fastest growing Medicaid waivers for individuals with developmental disabilities. A
variety of other programs such as Medicaid personal care and home health care help
individuals remain in their own homes.
Nevertheless, a large number of Arkansas seniors and other adults with disabilities
choose institutionalization instead of HCBS. On any given day, there are approximately
12,700 Medicaid recipients in Arkansas nursing homes. This accounts for about 70% of
all nursing home residents. There are about 1,200 100 individuals with developmental
1

disabilities in Human Development Centers (HDCs). Arkansas has one of the highest
rates for developmentally disabled institutionalized populations in the US. ii
While aggregate data on utilization of services have been reported nationally, iii less is
known about racial and geographic differences in use within Arkansas. In addition, only
anecdotal data are available to explain why some individuals use HCBS, while others
use institutions to meet their LTC needs. A variety of possibilities have been suggested,
including: 1) waivers do not provide the same level of care as institutions, i.e., 24-hour
per day care; 2) consumers, physicians, hospital discharge planners and others are not
aware of alternatives to nursing home care; 3) consumers, physicians, hospital
discharge planners and others have a bias towards traditional institutions; 4) entry into
an institution is quicker and easier than receiving services under a waiver; 5) the
presence of or proximity of patients to a caregiver as a practical matter determines
choice of services; 6) preferences and attitudes about services differ by race and
ethnicity; and 7) individuals are initially served by HCBS but later turn to institutions as
their condition deteriorates.
Faculty in the College of Public Health, University of Arkansas for Medical Sciences and
leadership and staff with the Division of Aging and Adult Services, Arkansas
Department of Human Services, partnered in a research effort to provide greater
understanding of factors which affect decisions about the utilization of types of LTC
services available to Medicaid eligibles in Arkansas. Specifically, the study intended to
provide information to inform program and policy recommendations to improve the LTC
services available to the elderly and disabled of Arkansas. This collaborative research
effort was funded by the Blue and You Foundation of Arkansas and federal Medicaid
administrative match funds. This report presents the finding of this study.
2
Literature Review on Determinants
At the onset of the study the research team reviewed the academic literature to
understand what is known about factors affecting LTC service utilization. During the
study, the importance of service knowledge and awareness became clear and the
research team sought further for studies looking into the impact of these issues on
service utilization. The following sections highlight the outcomes of this review.
Predictors of Nursing Home Use. The results of a literature review of studies on
factors correlating with increased likelihood of entry of an elder into a nursing home are
summarized in a table in Appendix A. The effects of elder consumers’ demographic
and health characteristics, social support, and health service use on the likelihood of
nursing home utilization were examined.
Age. As would be expected, the loss of functionality associated with rising age
increases the likelihood of nursing home admission. Data from a national sample of
persons 65 years of age and older, collected in 1984, showed that persons over 80
were at greater risk of institutionalization than their younger counterparts, and females
over 80 were at significantly greater risk of nursing home placement than their male
peers.iv Two years after the initial sample was taken, follow-up sampling showed that 62
percent of those originally reporting no limitations with activities of daily living (ADLs)
now reported at least some loss of independent function, 1 percent had entered a
nursing home, and 7 percent had died. A study tracking a cohort of Massachusetts
residence age 65 years and older over a 10-year period beginning in 1974 found the
risk of diminished functioning and/or nursing home placement increased with age,
particularly for those who at baseline reported impairment of at least one ADL. By year
10, of the females 65-68 year old at baseline and without any ADL limitations, 61.8
percent were still independent, compared to 47.7 percent of their male counterparts.
Further, of the same baseline group. 29.6 percent of the females had died by year 10,
compared to 47.8 percent of the males. Of those surviving, however, females were
more likely than males to be residing in a nursing home.v Yet, after 10 years, more than
two-thirds of all survivors were without ADL limitations.
3

Race. Patterns of use of long-term care services vary with race.vi, vii, viii, ix Being white is a
strong predictor of nursing home admission.x (See also Appendix A.) Dwyer et al in an
analysis of a large national data set of persons age 65 and older found that racial
differences in institutionalization vary with area of residence. No significant difference in
utilization rates were found between urban whites and blacks, but whites in small towns
and rural areas were more likely to enter a nursing home than their black counterparts.xi
Demographic variables and health status modified risks of nursing home entry for
blacks and whites. For blacks, poverty, functional limitations, age, and being without the
help of relatives during a period of illness predicted nursing home entry.xii For whites,
age, being female, lower income, poorer self-reported health, functional limitations,
living alone, and lower levels of community activity predicted use of nursing home
services.xiii
Gender. Consumer demographic characteristics commonly found to increase the
likelihood of institutionalization by elders are increasing age, being white, and not
owning a home. Being male and single were positive, but less common, predictors of
nursing home entry. On the other hand, as noted above, a trend analysis data tracking
an elderly cohort over 10 years found that females were more likely to survive and be
institutionalized, while males in later years were more likely to die and less likely to
enter a nursing home.xiv
Health Status. Health characteristics among seniors predicting nursing home entry
were ADLxv, xvi,xvii,xviii,xix,xx,xxi,xxii,xxiii,xxiv,xxv,xxvi,xxvii,xxviii or IADL
limitationsxxix,xxx,xxxi,xxxii,xxxiii,xxxiv,xxxv,xxxvi,xxxvii,xxxviii or mobility problems.xxxix,xl Self-reported poorer
health,xli,xlii,xliii,xliv,xlv limited social interactionxlvi,xlvii and having dementia,xlviii,xlix,l,li,lii,liii,liv,lv,lvi,lvii,lviii or
other mental health problems,lix,lx,lxi positively correlated with nursing home service use.
The majority of studies examining the effect of depression on service utilization did not
find that condition highly correlated with nursing home entry. lxii,lxiii,lxiv Medical conditions
commonly preceding entry into a nursing home were arthritis or other musculoskeletal
4
disorderslxv, lxvi stroke or other neurological problemslxvii, lxviii and diseases of the circulatory
system.lxix,lxx One study of two that examined the effect of diabetes on service utilization
found the disease to be an antecedent of nursing home use. lxxi,lxxii
Health Service Use. Consumers’ health service use predicted nursing home service
by the elderly. As might be expected, prior nursing home stays lxxiii, lxxiv, lxxv, lxxvi and recent
hospitalizationlxxvii, lxxviii, lxxix, lxxx were common antecedents to nursing home entry. Mental
health visitslxxxi and use of unpaid supportive care in the homelxxxii, lxxxiii, lxxxiv, lxxxv, also
correlated with increased probability of institutional care.
Developmentally disabled persons who are placed in residential facilities by their
families are more impaired and have greater behavior problems than those who remain
at home. The families who made decisions to place a family member with a
developmental disability in a residential facility tended to be larger, were more likely to
be headed by a single person, and more likely to have experienced greater family
disruption.lxxxvi
The findings of a study conducted by Tausig corroborate the results of other studies that
severity of disability, behavioral problems, and stress impact decisions about LTC
placement. Tausig did determine that for older persons with developmental disabilities
(over 21), strains on family relations and perceived burden of care were important
factors in decision-making about residential placement. lxxxvii
Predictors of Home and Community-Based Care Services Use. HCBS care is
viewed by many consumers, their families and advocates as essential to maintaining
independence and social integration.lxxxviii, lxxxix HCBS care is considered to be cost-
effective,xc, xci does not replace sources of informal care,xcii enhances an individual’s
quality of life,xciii and helps individuals retain their autonomy longer, remain healthier,
and recover from illnesses more quickly than those who are institutionalized
prematurely.xciv
5

State Factors. Certain state characteristics are predictive of participation rates in home
and community-based Medicaid waiver programs for the elderly. Per capita income per
1,000 persons age 85 years and older, the number of residential beds, and the number
of Medicare home-health users in a state positively predict use of HCBS, while
increasing numbers of nursing home beds and fewer restrictions on residential beds
predict lower rates of utilization of HCBS.xcv
Race. Patterns of use of long-term HCBS vary with race.xcvi, xcvii, xcviii, xcix Houdec found that
being African-American reduced the likelihood of receiving formal in-home services. For
whites, ADL limitations were positively associated with use of home services, but not for
blacks. Independent activities of daily living (IADL) limitations and incidence of specific
diseases (e.g., diabetes, stroke, Alzheimer’s disease, and cancer) predicted use of
home services for black women, but not black men or whites.ci
Focus groups with black and white elder recipients of LTC services and family and
friends involved in their care yielded data about race-related differences in attitudes
about using services.cii Both blacks and whites expressed concern about being a burden
to a caregiver. However, blacks, but not whites, also talked about their sense of duty to
honor their aging parents’ wishes to not be institutionalized and care for them in return
for the care they received from them as children. Whites more commonly emphasized
the burden of caregiving and the importance of respite care.ciii Blacks were also more
likely to express distrust of direct service, in-home workers and doubt that they would
respect the requests and needs of care recipients. Blacks in contrast to whites were
more likely to voice privacy concerns that made them less likely to use home care
services.civ
Region of Residence. Research findings are mixed on the effect of geography on use
of HCBS. The general trend, however, is that residence in the South predicts lower
utilization rates than living in the Northeast or West,cv and that living in the Northeast or
North Central region increases the probability of use of formal in-home nursing care.cvi
6

Two studies that examined the effects of urban and rural residence on use of HCBS did
not find a significant correlation.cvii, cviii
Consumer and Caregiver Characteristics. An array of consumer and caregiver
characteristics predicts use of HCBS by the elderly, in contrast to using no LTC services
at all. Rising age, as would be expected, increases the use of HCBS,cix including formal
in-home nursing care and going to a senior center.cx Fewer behavior problems,cxi higher
educational attainment, increasing ADL and IADL limitations, large family size, and
being a Medicaid recipient increase the likelihood of participation in HCBS.cxii, cxiii
Caregivers who had depressive symptomscxiv or constrained social and personal
activities as a result of care giving responsibilities were more likely to seek formal
community-based services.cxv
Among elders with functional impairment, predictors of use of formal in-home services
(in contrast to no service use) include increasing age, the number of hours of care by
the primary caregiver, number of household members, being female or African-
American or living in elder housing.cxvi Caregivers who had mobility limitations or had to
rearrange their work schedule to provide care more commonly accessed formal home-
based services.cxvii Female caregivers who helped with bowel or bladder care were more
likely to use formal services than male caregivers.cxviii
Impact of Knowledge on Service Utilization. An early study on knowledge of long-
term care services among the Boston elderly found a lack of awareness of available
LTC services of a large segment of the population. Only 23 percent showed a high level
of knowledge about services.cxix Focus group data from black and white elders and their
friends and family members indicated gaps of knowledge in both racial groups about a
variety of issues related to LTC: service programs, eligibility, financing, and legal and
regulatory matters, such as licensing and monitoring.cxx
Degree of awareness about care options and sources of information about HCBS varied
with race and other socio-demographic characteristics. Chapleskicxxi found that
7

awareness of available services for the elderly was facilitated by being white,
economically advantaged, and educated; and having connections with service agencies
and community organizations, and having transportation and a family network of
moderate size. Being female, poor, black, under-educated, or having few or many family
ties inhibited awareness of services.cxxii,cxxiii Confidence about knowing where to seek
information about LTC services varied with race. While both blacks and whites
participating in focus groups about LTC decision making reported feeling uninformed
about services, only blacks said that they were not sure where to seek information
about LTC options.cxxiv
Silversteincxxv found that elders use a variety of information sources – formal, informal,
and the news media. Formal sources were the least used means of obtaining
information about services, but those who had made contact with service agencies and
other formal sources were the most likely to actually use services.cxxvi However,
individuals whose main source of information was the media had the best overall
knowledge of services.cxxvii Bradleycxxviii found that elders rely on many information
sources including health care providers, friends and relatives, social workers, clergy,
and lawyers.
8
Chapter 2Study Methodology
This chapter describes the methods used in this study to explore factors and issues
affecting decisions about long-term care (LTC) service utilization in Arkansas and to
arrive at policy and program recommendations. This entire study was guided by input
from an advisory working group and carried out by an interdisciplinary research study
team. The study primarily utilized qualitative research methods for reasons described
below. The qualitative data were collected through focus group discussions (FGDs)
with providers of LTC services and through key informant interviews (KIIs) with
consumers of LTC services and others knowledgeable and/or involved in the decision to
select LTC services. The qualitative data were augmented with secondary quantitative
data, in the form of Medicaid data. These data were used to provide a socio-
demographic profile of LTC recipients in Arkansas.
The study team complied with all appropriate standards regarding the use of human
subjects in research. Three separate research protocols covering the secondary data
analysis, the FGDs, and the KIIs were all submitted to and approved by the University of
Arkansas for Medical Sciences’ Institutional Review Board.
An advisory working group (AWG) was formed as the first step in implementing this
study. The members of this group included state policymakers, program managers,
advocates and service providers. A list of the AWG members is included in Appendix B.
The study team relied on the AWG to guide them in selecting the specific populations to
study, criteria for selecting the sample, key areas to include in developing the question
guides, and in interpretation of the findings. In addition, the AWG helped identify data
sources for key variables, facilitated access to secondary data, and assisted in
identifying providers to participate in FGDs. Selected members of the AWG participated
9
in analysis of FGD data and in developing policy recommendations based on findings
from the study.
Input from the AWG was supplemented with information obtained from reviewing the
literature. This review focused on identifying factors shown to be significant
determinants of institutionalization. This information was summarized by two members
of the study team and presented to the AWG to further inform the development of the
list of key variables sought in the secondary data as well as question guides for the
primary data collection and analysis. At the end of the study, both published and
unpublished literature was reviewed again to assist in interpreting findings and
developing recommendations.
Question guides, demographic survey data collection forms and materials, sample
letters and other research documents described in this section are available upon
request.
Conceptual Framework
A conceptual framework was developed by the research team to provide an organizing
illustration of key determinants of utilization documented through the literature review,
discussions with the AWG, and primary and secondary data analyzed in this study.
Factors identified early in the study included demographic characteristics (e.g., age,
gender, race and marital status), personal factors (availability of social support and
service awareness) and system level variables (e.g., scope of services available, the
assessment process, and biases and service awareness of health care providers).
These factors served as the basis for thinking about what influences decisions about
long-term service use of the elderly and adults with physical or developmental
disabilities in Arkansas.
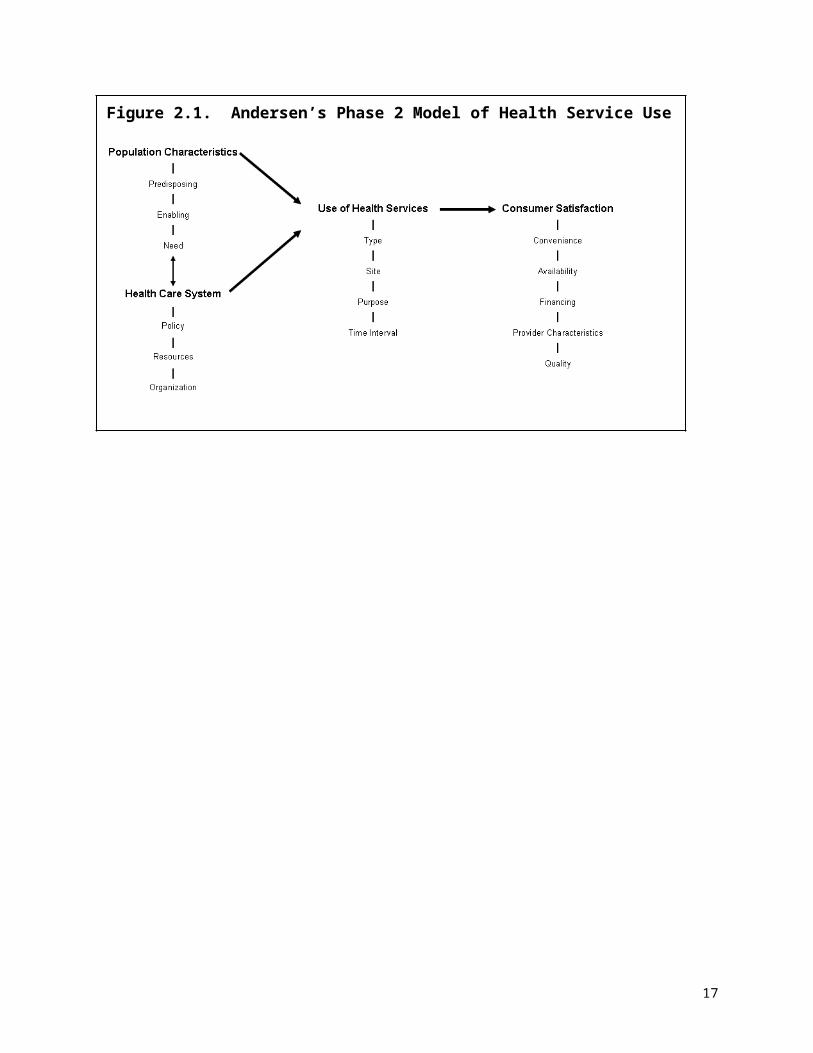
Andersen’s Phase 2 model of health service utilization was used as a starting point to
organize and understand the interactions of these different factors (See Figure 2.1).
This model suggests that a person’s use of health services is a function of factors which
10

can be grouped into three categories (predisposing characteristics, enabling resources,
and need) and their interaction with the health care system. Predisposing
characteristics include such things as demographic characteristics (e.g., gender and
age), social structure or factors that affect a person’s social status (e.g., education,
occupation, and ethnicity/race), and health beliefs and attitudes. Enabling resources
represent those factors which aid or impede a person’s ability to use health services,
either at the community level (e.g., number of health care providers or facilities in an
area) or the personal level (e.g., income, knowledge of services, and health insurance).
The final category is need (e.g., health status). Andersen depicted these three types of
factors as working in a linear fashion and interacting with the health care system to
predict the outcome, which is health services use. In this model, the level of consumer
satisfaction is an outcome of service use. This model built on Andersen’s previous
version by explicitly inserting the health care system, thereby acknowledging the
importance of policies, resources, and organization of the health care system on a
person’s health services utilization and consumer satisfaction.cxxix
Figure 2.1. Andersen’s Phase 2 Model of Health Service Use
The literature reviewed in Chapter 1 supports the use of the model, especially around
the inclusion of the predisposing, enabling and need components of the model. The
11

literature was clear that age, gender, and race (predisposing characteristics) are
explicitly linked to service use. Personal (e.g., caregiver burden) and community-level
resources (e.g., number of nursing home beds) impact decisions about long-term care
service use. Health status (need) is also strongly related to service use. Although the
model was fitting in these ways, the research team felt the need to adapt it to more
closely relate to the focus of the study and our understanding of factors influencing
decisions based on the literature and input from AWG members. See Figure 2.2.
First, even though aspects of consumer satisfaction were raised in the study and are
important, these were not the primary focus of this study and were outside its scope.
Therefore, this aspect of Andersen’s model is de-emphasized in the diagram in Figure
2.2. Rather, the research team was primarily interested in factors influencing what of
long-term care services, if available, were used, that is, institutional care or home- and
community-based services (HCBS). The research team modified the model by explicitly
marking the decision point separating institutional care and HCBS. Finally, the research
team recognized the unique importance of informal caregivers as enabling resources for
persons making decisions about LTC need and type of services to use.cxxx, cxxxi
A caregiver’s ability to be an enabling resource for the elderly or disabled person is
affected by his/her own predisposing characteristics, enabling resources, and need. The
12
Figure 2.2. Conceptual Framework, modified from Andersen’s Phase 2 Model of Health Service Use
role of the caregiver has, therefore, been added to the model to emphasize this
relationship.
Primary Qualitative Data
Populations: The populations focused on in primary data collection included three
groups eligible for specific Medicaid-funded LTC services in Arkansas: elderly (65
years and older), non-elderly adults with physical disabilities (21 to 64 years with a
physical disability), and adults with developmental disabilities (18 years and above).
These subpopulations were further differentiated to include within each group, those
residing in an institution (e.g., nursing home or human development center) and those
receiving HCBS through the ElderChoices (EC), Alternatives (ALT) or Developmentally
Disabled (DD) Waiver, respectively.
Why Qualitative Methods were Selected. The main questions of this study were to
learn why recipients of formal LTC use the services they do and to determine whether
interventions are needed to assist consumers and others involved in obtaining the
services they desire. In order to identify potential points of intervention, it is essential to
first understand the path followed to reach a decision. While previous studies provide
data on the major determinants of service use, information is lacking to help identify
where and what interventions in the decision-making path might be most effective. In
order to answer these questions, one needs to better understand who is involved in
making the decisions and how they are being made. Further, making a decision about
LTC is a complex process, often drawn out over time, and usually involving multiple
factors that have to be weighed in the context of varying circumstances and concerns.
Because of the lack of previous research on these specific aspects of the LTC decision-
making process and the complexity of issues involved, qualitative methods were chosen
as the most appropriate data collection method.
13

Focus Groups: Focus group discussions were chosen as a method for hearing the
perspectives of providers regarding the decision-making process of consumers, but also
to help inform us about what we might need to look for in the KIIs to follow. Open-
ended question guides were used in order to not bias or constrain providers’ accounts
of experiences, observations, beliefs and attitudes regarding consumer decision
making.
Four FGDs were held with professionals knowledgeable of the LTC decision-making
process. Since factors that affect decisions and/or the process of decision-making
regarding utilization of LTC services may differ by each of the three subpopulations, the
FGDs separately targeted professionals working with these three subpopulations.
Specifically, the research team held one FGD with professionals working with adults
with developmental disabilities, one with professionals working with adults with physical
disabilities, and two with professionals working with the elderly. Members of the
research team and the Advisory Working Group provided names of persons who would
be potential FGD participants. The research team contacted these individuals to invite
them to participate. Those willing to attend a focus group session were then mailed a
confirmation letter.
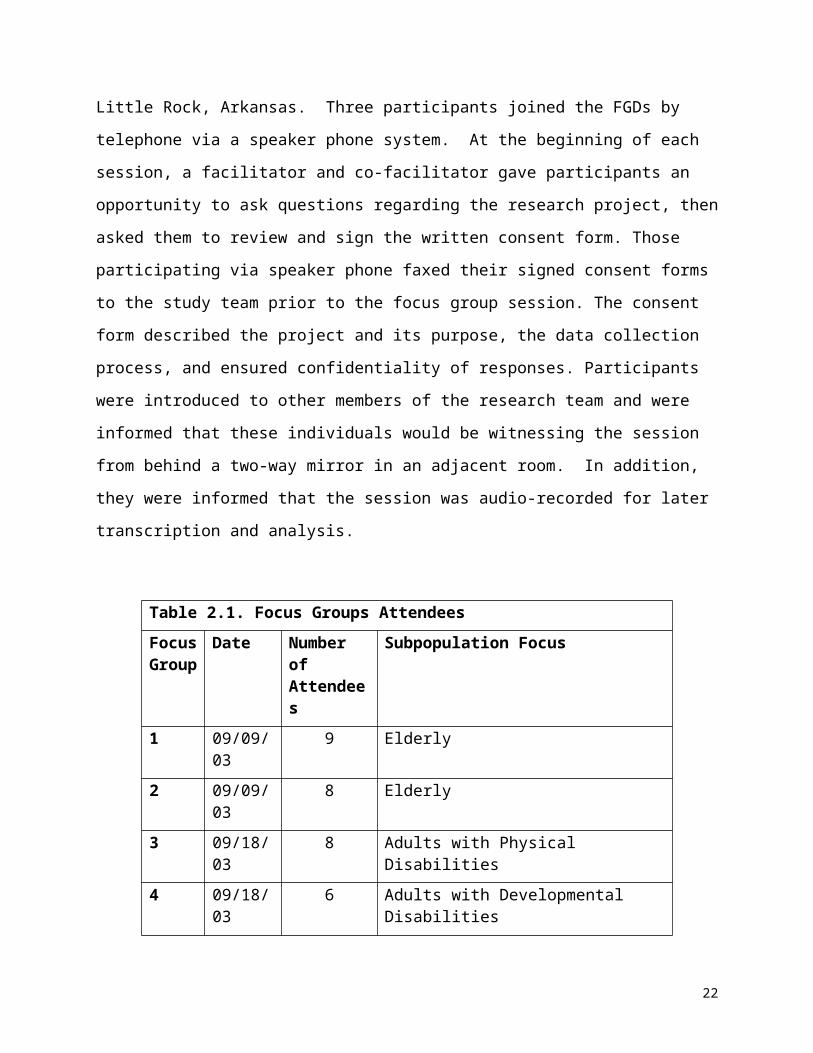
Table 2.1 lists the dates of the FGDs and the number of attendees. All FGDs were
conducted in a research facility in Little Rock, Arkansas. Three participants joined the
FGDs by telephone via a speaker phone system. At the beginning of each session, a
facilitator and co-facilitator gave participants an opportunity to ask questions regarding
the research project, then asked them to review and sign the written consent form.
Those participating via speaker phone faxed their signed consent forms to the study
team prior to the focus group session. The consent form described the project and its
purpose, the data collection process, and ensured confidentiality of responses.
Participants were introduced to other members of the research team and were informed
that these individuals would be witnessing the session from behind a two-way mirror in
14
an adjacent room. In addition, they were informed that the session was audio-recorded
for later transcription and analysis.
Table 2.1. Focus Groups Attendees Focus Group
Date Number of Attendees
Subpopulation Focus
1 09/09/03 9 Elderly
2 09/09/03 8 Elderly
3 09/18/03 8 Adults with Physical Disabilities
4 09/18/03 6 Adults with Developmental Disabilities
After introductory information was provided and signed consent forms were completed,
the facilitator and co-facilitator guided the group in a discussion using developed
research questions. The sessions lasted between 1.5 and 2 hours.
At the conclusion of each FGD, participants were asked to complete a 14-question
survey to collect participant profile information. Each was given $70 to compensate for
time and mileage.
Audiotapes of the FGDs were transcribed by a hired transcriptionist who provided the
research team with an MS Word file of each discussion. Data collected from the FGDs,
including signed consent forms, completed participant survey forms, audio recordings,
and transcripts were maintained in a secured location in the offices of the research
team. Only members of the research team (and the hired transcriptionist who agreed to
adhere to appropriate confidentiality standards) have had access to any of these data.
At a future time when the principal investigator of this study determines that these data
are of no further use, the data will be destroyed.
15
Facilitator Guide: The following main question and probing questions guided the
facilitator and co-facilitator in each of the provider FGDs:
Main Question: What determines whether a person utilizes a [insert appropriate institutional service – HDC or nursing home] or a [insert appropriate HCBS waiver option – ElderChoices, Alternatives, or the DD waiver]?
Probing Questions:1. What characteristics of a patient, caregiver, or the home setting influence
whether one enters into an institution or not?2. What characteristics of a service provider influence whether one enters into
an institution or not? 3. How often does provider availability become a factor in the services chosen
by patients and family caregivers? How and for what services?4. How much do patients and family caregivers know about the different
community services available to them? 5. How accurate is this knowledge? How did they learn it? Where do patients
and family get the information they use to decide between various care choices? What role do you play in the decision-making process?
Focus Group Data Analysis: The data collected from the participant survey forms
were tabulated for simple descriptive analysis of participant characteristics.
The analysis of the FGD transcripts initially was somewhat unstructured to maximize
discovery of interpretations that might otherwise be suppressed by using pre-defined
categories. The process was basically in three steps. In the first, an adaptation of the
editing style of analysis, as described by Miller and Crabtree,cxxxii was used to develop a
coding template.cxxxiii Three members of the research team reviewed the transcripts
making notes in the margins of the text, which were then used to develop a proposed
coding template. The coding template was then discussed with other members of the
research team and discussed and approved by the AWG. The template was organized
into the following five main categories, which correlated to frequency of comments
made in reference to each by FGD participants: individual, social support, provider,
system, and community. (See Appendix C for fuller description of the coding scheme.)
16
The second step of analysis involved attempting to code the transcripts using the
template. For each FGD, an AWG member with expertise relevant to a particular
subpopulation (i.e., elderly, non-elderly adults with physical disability, and non-elderly
adults with developmental disability) and four research team members independently
reviewed the transcripts using the template. The AWG members offered comments and
suggestions about the template’s suitability for a subpopulation, and both contributed
valuable contextual references to aid interpretation of comments made during the focus
groups. Through the coding process and related team discussions, a pattern emerged
consisting of the following four main domains which the team felt would serve as a more
useful framework for summarizing the data:
1. Timing, planning, players involved in the decision
2. Patient needs and characteristics (including social support systems needs
met or not met by existing services)
3. Past experiences and perceptions of services of patients and others
4. Access to information about past and current services
In the third step of the analysis, these four domains were used to code and summarize
the data. At this point, one member of the research team used this revised, simpler
template to systematically review the transcripts and code the text. This process then
allowed the team to identify key findings related to these four domains. For each
transcript, this researcher abstracted sections of text relevant to each of the domains
and organized them accordingly in a summary document for each population. These
four domains informed the design of the Key Informant Interview Question Guide and
influenced further analysis of the qualitative data.
Key Informant Interviews: Key informant interviews were used to obtain information
from consumers and others involved in the decision-making process. This mode was
chosen because we wanted to understand interactions between needs, beliefs, and
information in the decision-making process. Once again, these interviews were fairly
open-ended, beginning by encouraging story-tellingcxxxiv by the respondent with a grand
17
tour question: ”There are lots of reasons why someone selects a long-term care
service. I am interested in hearing, in your own words, about the most important factors
in the decision about your [or name of long-term care consumer] care, what happened
that led to the decision for you [or name of long-term care consumer], to go in/go on
[insert name of long-term care service or facility.] Can you tell me about that?”
However, in contrast to the FGDs, a more semi-structured question guidecxxxv was used
to ensure that the four domains identified in the FGD analysis were discussed during
the interview.
Key informant interviews were held with LTC consumers and others whom they
identified as being involved in the decisions about the LTC services they were using.
These individuals included relatives, spouses, friends, health care providers and social
service workers (e.g., case managers).
As noted above, there were three subpopulations of interest in this research project:
elderly (65 years and older), non-elderly adults with physical disabilities (21 to 64 years
with a physical disability), and adults with developmental disabilities (18 years and older
with a developmental disability). A sampling strategy was developed by the research
study team and the AWG to guide identification and selection of participants. For each
subpopulation, an index case (i.e., the consumer of the LTC service) and up to two
additional persons who were knowledgeable or involved in the decision to select the
LTC service were targeted for the KIIs. The research study team sought to conduct
interviews with a maximum of 12 consumers (index cases) for each of the three
subpopulations. Additionally, during the interview with the consumer (or the consumer’s
legal guardian), up to two additional respondents knowledgeable or involved in the
decision about LTC services were identified as possible key informants. No more than
30 interviews were to be conducted per subpopulation group. In addition, eligibility
criteria for the index cases of each subpopulation were developed, as described below.
18

Elderly. For these index cases, consumers had to be at least 65 years old, at a Level
III skill/disability level, (i.e., the highest level of functioning eligible for LTC services), and
be receiving Medicaid-supported LTC services. Additionally, when possible, the
researchers attempted to balance the key informant sample on demographic
characteristics such as marital status, gender, service type (institutional or HCBS), race
(African American or white), and region (urban or rural). Where possible, an even mix of
index cases receiving HCBS and institutional care was sought. [Note: The AWG
advised the researchers to target this disability level, as they represent a substantial
number of those institutionalized, and are the most likely to thrive in HCBS care
settings.]
Adults with Physical Disabilities. For these index cases, consumers had to be
between 21 and 64 years, be at a Level III skill/ disability level, (i.e., the highest level of
functioning eligible for LTC services), and be receiving Medicaid-supported LTC
services. Additionally, when possible, the researchers attempted to balance the key
informant sample on demographic characteristics such as marital status, gender,
service type (institutional or HCBS), race (African-American or white), and region (urban
or rural). Where possible, an even mix of index cases receiving HCBS and institutional
care was sought. [Note: The AWG advised the researchers to target this disability level
as they represent a substantial number of those institutionalized and are the most likely
to thrive in HCBS settings.]
Adults with Developmental Disabilities. For this subpopulation, the consumers had to
be 18 years or older, to have recently begun receiving the current designated service,
and to have a mild to moderate disability skill level, (i.e., the highest level of functioning
eligible for LTC services), and be receiving Medicaid-supported LTC services. The
distribution of race, marital status, and gender of consumers in this subpopulation was
determined based on the location of services around the state and the availability of
consumers that meet the other eligibility criteria. Where possible, an even mix of index
cases receiving HCBS and institutional care was sought.
19

Chart 2.1. Patient Identification, Consent & Interview Process
STEP 5. DHS Program Staff / DHS Provider Representative obtains written Authorization for UAMS interviewer to contact patient/ legal guardian. DHS Program staff sends signed Authorization forms to DHS Mgmt
STEP 2. DHS Mgmt conducts database search for study eligible patients & enters eligible patients names on top portion of Authorization to Release Health (Contact) Information Form
STEP 3. DHS Mgmt forwards Authorization to Release Health Information with identified patients to DHS Program Staff /DHS Provider Representative
STEP 4.DHS Program Staff assesses patient’s competency to provide informed consent in accordance with UAMS IRB Cognitive Impairment Determination Algorithm
STEP 6. DHS Mgmt forwards signed & completed Authorization forms to UAMS Research Team
STEP 7. UAMS interviewer contacts respondent via phone using information on authorization form to schedule interview
STEP 8. Interviewer obtains written consent do conduct interview
STEP 9. Interviewer obtains respondent’s signature on HIPAA Form
STEP 10. Interview is conducted
STEP 11. Interviewer obtains patient’s written Authorization to contact additional people for interview, and repeats STEPS 7 - 10
STEP 1. UAMS Research Team provides DHS Management with Study Eligibility Criteria and Authorization to Release Health (Contact) Information Form
Sample Selection and Process for Contacting Respondents
Because the respondent selection strategy was complex, the recruitment of participants
for key informant interviews was an involved process. The process for identifying
consumers, obtaining consent to contact them, obtaining informed interview consent
and HIPAA clearance, as well as the interview process, is described below and
illustrated by a flow chart (See Chart 2.1).
To identify study-eligible
respondents, required
characteristics of the sample
group were submitted to
Arkansas Department of
Human Services (DHS)
managers, identified by the
AWG, who are responsible
for overseeing eligibility for
LTC and disability services.
DHS management conducted
a search of eligibility records
(electronic databases and
paper files) to identify
individuals who matched
study criteria. Once cases
were identified, DHS
management contacted the
DHS program staff (for consumers who are receiving HCBS) or the DHS provider
representative (for those consumers who are institutionalized in a nursing home or
Human Development Center, HDC) to inform them of the study and provide them with
the list of potential respondents. For potential study participants who did not have a
20

legal guardian, the program staff or provider representative assessed cognitive level to
determine whether the potential respondent was able to participate in the interview. If a
person was deemed too cognitively impaired to participate, he/she was excluded from
the study. All others received information about the study and were asked to complete
an Authorization to Release Health Information Form. For potential study participants
who did have a legal guardian, the program staff or provider representative contacted
the guardian to describe the study, have the guardian determine the cognitive ability of
the potential study participant, and seek permission for the consumer to participate by
having the legal guardian sign an Authorization to Release Health Information Form. In
cases where the recipient of services was deemed too impaired to participate, his/her
legal guardian was allowed to participate on the consumer’s behalf. For individuals not
completing an Authorization to Release Health Information Form, their information was
not released to the study team, and they were excluded from the study.
When a signed Authorization to Release Health Information Form was received by the
study team, a researcher contacted the individual to describe the study and schedule
the in-person interview. Individuals who had changed their minds and were no longer
willing to be interviewed were excluded from the study.
Interviewers were trained and supervised throughout the data collection period by the
director of data collection. Interviewer training included general interviewing techniques,
qualitative data collection methods, question guide administration, and case assignment
and data processing procedures. In all cases, interviewers and respondents were
matched on race, i.e., all white respondents were interviewed by a white interviewer,
and all African-American respondents were interviewed by an African-American
interviewer.
During the in-person interview process, trained interviewers reviewed the study goals,
obtained respondent’s signature on the interview consent form and the HIPAA
authorization form, and addressed any questions or concerns mentioned. Guided by a
21
semi-structured questionnaire, the interviewer then led a discussion about factors
associated with the decision about LTC services. The questionnaire contained one
“grand tour” question and a series of probes that were used if the information pertaining
to all study domains did not come up naturally. The interviews concluded with several
standardized questions about demographics and the request to contact others who may
have been knowledgeable of or involved in decision making, about participation in the
study. If additional persons were identified, the respondent completed and signed an
Authorization to Contact Additional Persons Form. At the conclusion, respondents were
given $50 in cash as compensation for their time to participate. The interviews were
tape recorded and later transcribed verbatim for analysis purposes.
Key Informant Interview Data Analysis. Transcripts of the KIIs were initially reviewed
by one member of the research team, who developed a summary for each interview,
using the key questions and four main domains of inquiry (described above, in Focus
Group Data Analysis) as a framework. Each summary began with an overview of the
respondent’s story, supported by text abstracted from the transcript. For each domain,
the same process was followed. These summaries reduced and organized the
voluminous amount of transcript datacxxxvi into a format that allowed the research team
and AWG to identify themes and compare them with findings from the FGDs. This
review resulted in a listing of preliminary key findings as well as supporting quotes for
each.
Data from the summaries were then organized in a matrix.cxxxvii Data for every case,
relative to study domains and KII questions, were displayed. The matrix made it
possible to ascertain, to the extent that data were available, the number of interviews
that supported each of the preliminary key findings. Subsequently, other members of
the research team served as “secondary readers” to “audit” findings and determinations
made by the primary analyst.cxxxviii This was done by having them review a sample of the
transcripts and abstracts, against the findings matrix. If conflicting findings were noted
by reviewers differences were discussed and resolved. Finally, key members of the
22

research team reached consensus on key findings, over-arching themes, and identified
relevant quotes to highlight the key findings.
Reporting of Results. Results presented in this report focus on key findings that
emerged from both the FGDs and the KIIs. As described above, KII findings were
quantified to ascertain frequencies and patterns of response. However, inferences based
on percentages and other numeric values should be made with great caution in light of the
fact that the study sample is non-random and small; therefore the data are not appropriate
for statistical analysis. With that caveat, the key used to translate numbers into
descriptive, qualitative terms is presented in Table 2.2. These terms are used to describe
the key findings in Chapters 6, 7 and 8.
Table 2.2. Descriptive Terms and Percent with FindingsQualitative term: Percent meeting description:Almost all 75% or moreMost 50-74%Often, many 25-49%Some, a number of, sometimes 15-24%A few <15%
To protect the identity of study respondents, gender is concealed by random
assignment of gender-specific pronouns and pseudonyms in quotes and other text
describing cases.
Development of Recommendations. Recommendations were made to address
issues raised by key findings. These recommendations were developed by reviewing
published and unpublished literature (reports and other unpublished documents),
through personal communications with program managers, and with input from the
AWG.
Secondary Data Sources
The purpose of the secondary data analysis was to examine characteristics and enrollment
patterns of the Medicaid population receiving services to meet their LTC needs. Based on the
23

guidance from the AWG, the Medicaid populations for which data were analyzed included adult
residents of nursing homes or human development centers, and adults enrolled in any of these
waivers: ElderChoices, Alternatives, or Developmental Disabilities. Five years of data were
obtained covering state fiscal years 1998-2002. The following describes the process carried out
to identify and obtain appropriate data sources for the secondary analysis.
Table 2.3. Data Source Matrix
DHS Form 703*
Care plans
(AAS9503)DAAS
WaiversDHS 704
DHS MMIS ACES
Area Agency
on Aging**
ADH Home Health PC-6
Date of Birth YES YES YES YES YES YES YESRace NO NO NO YES YES YES YESGender YES NO NO YES YES YES YESHome County YES YES YES YES YES YES YESMarital Status YES NO NO NO NO YES YESMedicaid Number YES YES YES YES YES YES YESEligibility Category NO NO NO YES YES YES NOMedicare Number NO NO NO YES YES YES NODiagnosis YES YES NO YES NO YES YESDisability Level YES*** YES*** YES YES*** YES YES NOProvider Type NO YES NO YES NO NO NODate of Eligibility NO YES NO YES YES NO YESPrior LTC YES NO NO YES YES NO NOEducation NO NO NO NO NO YES NO
Notes: *DHS Form 703 used by nursing homes, Human Development Centers, and Intermediate Care Facilities/Mentally Retarded. **Included forms from Northwest Arkansas, Northeast Arkansas, Central Arkansas and White River Area Agencies on Aging. ***Only available Assisted Living Waiver.
The study team collectively and individually revisited the key questions that were to be
answered by the collecting, mining and reporting of secondary data. Various secondary
data client intake forms, in current use across multiple service providers, were reviewed.
The primary intent of this effort was to identify key information looking for best-fit
variables, common variables, and what and where data were stored. Where possible,
determination was made on whether these data were stored in electronic (database) or
non-electronic (paper) format. Due to time and resource constraints, the study team
determined that only relevant data available in electronic format would be used for this
analysis. This review resulted in the development of a data source matrix. See Table
2.3. This matrix shows which data elements of interest were available on each type of
application form or computerized database. The matrix indicated that most of the
24

desired data elements were available in electronic format from the Arkansas
Department of Human Services’ (DHS) Medicaid Management Information System
(MMIS) and the state Arkansas Client Eligibility System (ACES) databases. Even
though marital status, prior LTC service usage, and educational level were all variables
of interest, they were not available for all subpopulations and therefore were not
included in any of the analyses.
Other activities related to secondary data included client case closure reviews,
application for service denials, mapping of state and regional LTC services,
identification of services, and client use patterns. The team also reviewed previously
conducted and/or current LTC studies in Arkansas to determine if some of these data
could be used. This included reviewing efforts by the Arkansas Foundation for Medical
Care (AFMC) to collect, store and report secondary data, the federal Minimum Data Set
(MDS) Project, and the federal Programs for All-Inclusive Care for the Elderly (PACE).
Formal database extraction specifications were then developed, documented, approved
and issued for use with the State of Arkansas for applicable Medicaid program data.
Meetings were held with representatives of DHS, Division of Medical Services (DMS)
and Department of Aging and Adult Services (DAAS) to obtain approval for the data pull
and the timeline for completion.
Medicaid data were extracted from the Arkansas State MMIS and the ACES databases
for importing, cleaning, editing and reporting by the study team. Other data sources
used on an as-need basis to fully complement this data pull included Arkansas
Department of Human Services Annual Statistical Reports, the Olmstead Plan in
Arkansas Report, Arkansas Area on Aging (AAA) systems, National Institute of Health
(NIH) Databases, Arkansas Foundation for Medical Care (AFMC) data, U.S. Census
Bureau, and other related data sources.
25
Five years (SFY1998 – SFY2003) of Medicaid data were extracted. After extraction,
secondary data were evaluated first or concurrently where possible, to help set the
stage for determining primary data collection requirements. Efforts were made to
ensure that new secondary data reports were reconciled to the original proposal reports
and other published sources to ensure maximum accuracy and reliability. Standard
accuracy and data reasonableness checks were incorporated.
Data Analysis. The research team used several methods to analyze the secondary
data. For the assessment of the availability of LTC services across the state, simple
mapping techniques were used to look for geographic availability and clustering at the
county level. For the Medicaid new enrollment data, descriptive statistics (e.g., mean,
median, range, and standard deviation) were calculated to understand the central
tendencies of the data. Rates were calculated using U.S. Census Bureau data to
assess utilization patterns. For recipient data obtained from annual statistical reports,
descriptive statistics were also used to understand the central tendencies of the data.
Data were examined for seasonal patterns. New enrollment data were compared to
actual recipient data. Finally, Z-scores were used to determine significant geographical
differences in enrollment to the LTC services.
26
Chapter 3Availability of Selected Medicaid Long-term Care Services in
Arkansas
This chapter describes some of the long-term care services available through the
Medicaid program in Arkansas. Specifically, it describes the scope of services and
eligibility criteria for three home and community-based waiver services and describes
available institutional services. In addition, the chapter describes the geographic
distribution of the services about the state.
Arkansas offers a mix of institutional and LTC options for Medicaid beneficiaries. The
Department of Human Services (DHS) finances institutional care through the Medicaid
State Plan. A division of the DHS, the Division of Aging and Adult Services, operates a
number of waiver programs to offer home- and community-based services (HCBS) as
an alternative to institutional care. Of interest to this particular study were the
ElderChoices Waiver, the Alternatives Waiver, and the Developmental Disabilities
Waiver. The corresponding institutional care settings for these three waiver programs
are nursing homes and human development centers (HDCs). The following provides
eligibility criteria and services available through these LTC programs.
In 1991, the ElderChoices Waiver was approved by the Centers for Medicaid and
Medicaid Services (CMS) to serve persons aged 60 years and older who were
financially and functionally eligible for admission to a nursing home. Through this
program, consumers may receive homemaker, chore, home-delivered meals, personal
emergency response system, both social and therapeutic adult day care services, adult
foster care, and respite.cxxxix A registered nurse conducts a comprehensive assessment
and develops a care plan for each recipient to ensure that appropriate medical and

social services are provided to address the recipient’s individual needs.cxl Enrollment to
the waiver is limited to 9,000 persons.
The Arkansas Division of Aging and Adult Services was granted approval from the CMS
in 1997 to operate the Alternatives Waiver Program. This waiver program targets adults
(21-64 years) with physical disabilities who are eligible for admission to a nursing home
(meeting both the income and functional eligibility criteria). Services include
environmental modifications to a residence and attendant care to assist with activities of
daily living. The service needs are laid out in an individualized Plan of Care developed
by an assigned counselor. The counselor also assesses the consumer’s level of
satisfaction with the services received and assists in the annual re-assessment process.
Persons eligible to serve as an attendant must meet certain criteria and must be
enrolled as a Medicaid provider.cxli Through this program, up to 1,300 individuals can
be served.
The Developmental Disabilities (DD) Waiver was authorized by CMS to serve persons
with development disabilities who are eligible for institutional care. Services available
through the DD Waiver include crisis intervention and respite services, consultation and
case management, certain medical supplies, environmental modification, supportive
employment assistance, and integrated supports services.cxlii
Persons with developmental disabilities who are under the age of 65 years may receive
institutional care at one of six HDCs located around the state (Conway, Faulkner
County; Alexander, Saline County; Arkadelphia, Clarke County; Jonesboro, Craighead
County; Booneville, Logan County; and Warren, Bradley County). These facilities,
which can serve up to 1,313 persons, offer residential care, education and training,
socialization, recreation, and appropriate therapeutic and medical services.cxliii As of
January 2005, there were an estimated 180 persons on the waiting list for placement in
an HDC.

As of January 2005, there were 25,261 licensed nursing home beds in the state to
provide institutional LTC for eligible persons.cxliv Medicaid will cover nursing home care
for persons who meet functional and financial eligibility. To be financially eligible, a
person must have an income of $1,656 or less a month and have no more than $3,000
in assets (not counting a home, car or burial expenses). If a person is married when
applying for nursing home care, he or she is regarded as separated. Only the
applicant’s income is counted toward the income limit but the couple’s assets must be
divided based on prescribed rules.cxlv
Distribution of Medicaid Long-Term Care Services
The research team reviewed the availability of various Medicaid funded LTC services
across the state. The assessment was divided into two service types: institutional care
and HCBS.
Institutional Care Services. Institutional care was defined as nursing home facilities
and HDCs (or intermediate care facility services for the mentally retarded and
developmentally disabled [ICF-MR]). Since the 1960s, Arkansas has used permits of
approval (POAs) to manage the geographic distribution of health care services and
facilities, including nursing home and ICF-MR beds. The purpose of POAs around the
country and in Arkansas have been to ensure adequate geographic distribution of
services and facilities, to prevent potential investment in unnecessary (but expensive)
equipment and facilities, and to ensure quality.cxlvi Permits are issued, denied, or
withdrawn based on a determination of need using methodologies laid out in the POA
Rulebook.cxlvii
There are currently 1,313 beds in the six HDCs located around the state:cxlviii Conway,
Faulkner County (632 beds); Alexander, Saline County (145 beds); Arkadelphia, Clark
County (154 beds), Jonesboro, Craighead County (128 beds); Booneville, Logan
County (174 beds), and Warren, Bradley County (80 beds). DHS staff report a waiting

list for persons to enter an HDC. One list is maintained for all six HDCs. As of January
2005, there were 180 persons on the waiting list.cxlix
As of January 2005, there were 24,820 licensed nursing home beds in the state,cl down
just slightly (1.3%) from the number of licensed nursing home beds in November 2002.
In SFY 2001, the county average occupancy rate was 75%. Newton County had the
highest occupancy rate (98%) while Searcy County had the lowest (45%).cli
Using the number of licensed nursing home beds in SFY2001clii and 2000 US Census
population figures for persons 65 years and older by county in Arkansas, a county bed
rate (nursing home beds per 1,000 persons over 64 years) was calculated. The average
county bed rate was 76.1, with a minimum bed rate of 43 (Benton County) and a
maximum bed rate of 181.9 (Howard County).2
The rates were sorted into quartiles. See Map 3.1. Nearly two-thirds (63% or 47
2 The standard deviation of the bed rates was 24.56.
Map 3.1. County Nursing Home Bed Rate, SFY 2001
Data Sources: US Census Data and Arkansas Health Services Permit Agency
counties) of the counties had a bed rate in the lowest quartile, which ranged from 43 to
77 beds per 1,000 persons 65 years and older in the county. One third of the counties
(25) had a bed rate in the second lowest quartile, which ranged from 78 to 113. Only
one county, Nevada, had a bed rate in the third quartile, which ranged from 114-149.
Two counties, Dallas and Howard, had bed rates in the highest quartile, which ranged
from 150 to 185.
The state does not maintain a waiting list for nursing home beds. Based on the
occupancy rate analysis, there seem to be available beds in each of the 75 counties.
However, individual nursing home facilities may maintain a list for persons desiring to
enter their particular facility.
Home and Community-Based Services. For purposes of this study, HCBS were
defined as those that were provided under three waiver programs including:
ElderChoices, Alternatives, and the Developmental Disabilities (DD) Waiver. See
Chapter 1 for a list of services available under each of these programs. The
assessment of available HCBS was more difficult than the assessment of available
institutional care. The capacity of some services, such as adult day care and adult day
health care, could be determined. However, in most cases, lists of providers of services
were available but not an indication of their capacity or caseload limits. It was beyond
the scope of this study to contact all the HCBS providers to determine their capacity or
caseload limit. This analysis is therefore limited to available data.
All counties in Arkansas have at least one ElderChoices provider that offers most of the
covered ElderChoices services to county residents. The table below, Table 3.1,
provides the average number and range of providers by service type across all
counties. However, this table represents the number of providers and not their capacity
to serve. The most limited services are adult day care and adult day health care
services. Thirty counties do not have adult day care, and 57 counties do not have adult

day health care services, with twenty-six having neither.3 Chore services are not
available in five counties (Chicot, Lee, Newton, Phillips and Searcy).
Table 3.1. ElderChoices Service Providers By County, 2003PROVIDERS BY COUNTY
ADC ADHC Chore HDM Home-maker
PC PERS Respite TCM
Average1.2 .29 1.7 2.21 5.7 5.2 11.12 6.3 4.3
Minimum 0 0 0 1 2 2 7 3 2Maximum 18 4 6 8 32 18 24 38 14Notes: ADC= Adult Day Care, ADHC=Adult Day Health Care, HDM=home delivered meals, PC= personal care, PERS=personal emergency response services, TCM=targeted case management.Data Source: 2003 ElderChoices Provider List obtained from DAAS, DHS.
The Alternatives Waiver program provides counseling/case management, home
modification, and attendant services. To receive certification from the Division of Adult
and Aging Services (DAAS) to provide home modification services, organizations and/or
businesses must hold valid and appropriate businesses licenses, and be knowledgeable
of state and local contractor codes and the provisions of the Americans with Disabilities
Act Accessibility Guidelines. In addition to these services, Alternatives provides
attendant services. Since the Alternatives Waiver is a consumer-directed program,
adults with physical disabilities are able to hire their own attendants, who must meet
DAAS certification criteria and become a Medicaid provider. It was, therefore, not
possible to assess the distribution of attendants across the state.
The Developmental Disabilities (DD) Waiver provides a wide range of services to
enable persons with developmental disabilities to remain in the community. The
Medicaid provider manual lists 13 services provided through this waiver: case
management, respite care, supportive living, community experiences, consultation
services, waiver coordination, non-medical transportation, supportive employment
services, adaptive equipment, environmental modifications, supplement support
services, crisis intervention services, and crisis center. A DD waiver provider list
obtained from the Division of Developmental Disabilities indicated that all counties had
3 Counties without adult day care or adult day health care were Carroll, Chicot, Clay, Crawford, Franklin, Fulton, Garland, Hempstead, Howard, Izard, Jackson, Lafayette, Lincoln, Logan, Madison, Marion, Montgomery, Nevada, Newton, Pike, Polk, Randolph, Scott, Sevier, Sharp, and Stone.
services providers (based in the county or willing to serve the county but based
elsewhere) offering adaptive equipment, case management, consultation, crisis centers,
crisis intervention, integrated support, specialized medical supplies and vocational
maintenance. (Note: respite, supportive living, community experience, waiver
coordination, and transportation are included the services available through integrated
support.) Although the list indicates the existence of a service provider offering all the
waiver services, it does not allow for the analysis of the capacity of the provider to serve
the community (i.e., the number of persons they can actually serve). It was beyond the
scope of this study to conduct an assessment of this nature.

Chapter 4Selected Characteristics and Enrollment Patterns of Arkansas’
Medicaid Long-Term Care Beneficiaries
This chapter describes selected characteristics of Medicaid long-term care (LTC)
beneficiaries and patterns of enrollment according to the types of services received. The
findings reported are based on secondary data sources which are described in more
detail in Chapter 2 of this report.
Recipients of Long-Term Care Services
The research team reviewed existing data on recipients of LTC services received
through institutions (nursing homes and human development centers [HDCs]),
ElderChoices, Alternatives, and the Developmental Disabilities (DD) Waiver between
the years of SFY 1998 and SFY 2002.
Institutional Care. DHS data show that between 1998 and 2002 the number of
individuals in “private nursing homes” fell from 14,445 in SFY 1998 to 12,898 in
SFY2002.cliii Private nursing homes exclude the state operated AR Health Center,
HDCs, Pediatric Facilities and 10 Bed ICF-MRs. These figures represent the average
census at the end of each month, referred to as the midnight census.
Data from the DHS annual statistical reports from SFY1998 to SFY2002 show there
was a consistent proportion of males (31%) and females (69%). There was also a
consistent proportion of African-American (17%) and white (79%) nursing home
residents. cliv,clv,clvi,clvii,
ElderChoices. Between SFY1998 and 2002, an average of 8,228 persons per year
received home- and community-based services (HCBS) through the ElderChoices
34

Program. The annual number of recipients increased each year from SFY 1998 to SFY
2001. However, in SFY2002, the number of recipients had declined 6% from the
previous year to 8,102. See Chart 4.1. Between SFY1998 and SFY2002, the average
cost per recipient for the program has steadily increased. In SFY1998, the average cost
per recipient was $3,058. By SFY2002, the average cost per recipient was $4,075.clviii
Alternatives. Between SFY1998 and SFY2002, the number of persons receiving
services through the Alternatives Waiver program increased from 125 to 918, more than
a seven fold increase. See Chart 4.1. The average cost per recipient for the program
increased from $8,019 in SFY1998 to $12,350 in SFY 1999. From SFY1999 to
SFY2002, the average cost per recipient remained fairly stable.clix
DD Waiver. Between SFY1998 and SFY2002, there was a steady increase in the
number of persons receiving services through the DD Waiver. In SFY1998, just over
1,000 persons received services. By SFY2002, more than three times (3,423) that many
persons were receiving services. See Chart 4.1. During that same period, the average
cost per recipient remained fairly stable, with the per year average ranging between
$15,565 and $19,418.clx
35
Chart 4.1. Recipients of Home/Community-Based Long-Term Care, SFY 1998-2002
7804
8193 8439 8602
8102
125282
461 691 918
3423
29712443
1522
1006
0
1000
2000
3000
4000
5000
6000
7000
8000
9000
10000
1998 1999 2000 2001 2002
State Fiscal Years
Rec
ipie
nts
ElderChoices Alternatives DD Waiver

New Enrollees to Various Long-Term Care Services
This analysis examines enrollment patterns and characteristics of persons who were
newly enrolled for Medicaid-funded HCBS (ElderChoices, Alternatives and
Development Disabilities (DD) Waiver) and institutional (nursing home and HDC) LTC
services. Data by quarter for State Fiscal Years (SFY) 1998 through 2002 were
reviewed.
Table 4.1 shows the number of
persons who enrolled by quarter over
the five year period for the three waiver
programs and institutional services. It
is important to note that the totals
between programs may contain
duplicates although the totals for a
single program over the five years
reviewed do not. In other words, if a
person enrolled in ElderChoices in
Quarter 1 of 1998 and for institutional
care in the same quarter, he or she is
counted in both programs’ quarter
totals. Likewise, if a person enrolled
for ElderChoices in Quarter 1 of 1998
and then drops out of the program but
enrollees again in Quarter 1 of 2000,
he or she is only counted in the first
quarter he or she first enrollees.
The mean quarterly new enrollment for the ElderChoices Waiver was 530, the median
was 546, and the standard deviation was 80. The mean quarterly new enrollment for
Table 4.1. Number of New Enrollees by Program by Quarter, SFY 1998-2002SFY Quarter EC ALT DDW INST
1998
1.1 475 20 33 8311.2 424 64 21 8451.3 605 37 33 998
1.4 602 29 331 1130
1999
2.1 556 45 189 11842.2 464 31 71 11022.3 557 66 43 1250
2.4 686 35 57 1183
2000
3.1 556 67 84 12553.2 535 39 72 11183.3 593 57 104 1212
3.4 637 59 83 1212
2001
4.1 596 75 63 11774.2 443 74 30 10644.3 531 76 34 1335
4.4 559 107 47 1229
2002
5.1 483 97 59 12875.2 492 98 39 11405.3 388 91 48 1249
5.4 416 66 27 1244Source: Arkansas MMIS. Notes: Totals are not unduplicated between programs and quarters. EC= ElderChoices, ALT=Alternatives, DDW=Developmental Disabilities Waiver, and INST=Institutions.
36

the Alternatives Waiver was 62, the median was 65, and the standard deviation was 25.
The mean quarterly new enrollment for the DD Waiver was 88, the median was 58, and
the standard deviation was 91. The mean quarterly new enrollment for institutional care
services was 1152, the median was 1184, and the standard deviation was 133.
Chart 4.2. Patterns of New Enrollment to the ElderChoices Waiver By Quarter,1998-2002
0
100
200
300
400
500
600
700
800
Q11998
Q21998
Q31998
Q41998
Q11999
Q21999
Q31999
Q41999
Q12000
Q22000
Q32000
Q42000
Q12001
Q22001
Q32001
Q42001
Q12002
Q22002
Q32002
Q42002
3rd
4th
4th
1st
2nd
Chart 4.2 shows the enrollment trends for the ElderChoices Waiver with peak
enrollment for each quarter noted. Over the 20 quarter period, there was an overall
decreasing trend in the number of new enrollees in the program. The quarter of lowest
new enrollments (338) was the third quarter of 2002. The quarter of highest new
enrollment (686) was the 4th quarter of 1999. There do not appear to be any quarterly
patterns of new enrollment for the ElderChoices Waiver. New enrollment peaked in the
4th quarter in 1999 and again in 2000. However, new enrollment peaked in the 3 rd, 1st,
and 2nd quarters for years 1998, 2001, and 2002, respectively.
37

Chart 4.3 Patterns of Enrollment to the Alternatives Waiver by Quarter, SFY 1998-2002
0
20
40
60
80
100
120
Q11998
Q21998
Q31998
Q41998
Q11999
Q21999
Q31999
Q41999
Q12000
Q22000
Q32000
Q42000
Q12001
Q22001
Q32001
Q42001
Q12002
Q22002
Q32002
Q42002
2nd3rd 1st
4th
2nd
Chart 4.3 shows the enrollment trends for the Alternatives Waiver, with peak enrollment
for each quarter noted. Between quarter 1, 1998 and quarter 4, 2002, there was a
steady increase in the number of new enrollees. The quarter of lowest new enrollments
(20) was the first quarter of the reviewed time frame. The quarter of highest new
enrollment (107) was the 4th quarter of 2001. There do not appear to be any quarterly
patterns of new enrollment for the Alternatives Waiver. New enrollment peaked in the
2nd quarter in 1998 and again in 2002. However, new enrollment peaked in the 3rd, 1st
and 4th quarters, for years 1999, 2000, and 2001, respectively.
38

0
50
100
150
200
250
300
350
Q11998
Q21998
Q31998
Q41998
Q11999
Q21999
Q31999
Q41999
Q12000
Q22000
Q32000
Q42000
Q12001
Q22001
Q32001
Q42001
Q12002
Q22002
Q32002
Q42002
Chart 4.4. Patterns of New Enrollment to the DD Waiver By Quarter,SFY 1998-2002
Tie 3rd & 4th
1st
3rd
1st 1st
Chart 4.4 shows the enrollment trends for the Developmental Disabilities (DD) Waiver,
with peak enrollment for each quarter noted. Although there was a rapid increase in
enrollments during two quarters of 1998, there has been an overall decreasing trend in
the number of new enrollees to the DD Waiver between quarter 1, 1998 and quarter 4,
2002. This may be explained by the number of waiver slots available each year being
filled allowing only a few new enrollees to come on to the program each year. The
quarter of lowest new enrollments (21) was the second quarter of the first year in the
reviewed time frame. Two quarters tied for the highest new enrollment (331); they were
the third and fourth quarter of the first year reviewed (1998). For three of the five years
reviewed, the first quarters had the highest new enrollment of the other quarters in that
year. This may be explained by new funding becoming available at the beginning of
each program year enabling additional persons to be served under the program.
39

Chart 4.5. Patterns of New Enrollment for Institutional Care by Quarter, SFY 1998-2002
0
200
400
600
800
1000
1200
1400
1600
Q11998
Q21998
Q31998
Q41998
Q11999
Q21999
Q31999
Q41999
Q12000
Q22000
Q32000
Q42000
Q12001
Q22001
Q32001
Q42001
Q12002
Q22002
Q32002
Q42002
4th
3rd 1st3rd 1st
Chart 4.5 shows the enrollment trends for institutional care, with peak enrollment for
each quarter noted. From 1998 to 2002, there was a slight upward trend in new
enrollments by quarter. The first quarter of 1998 had the lowest new enrollments (831)
while the 3rd quarter of 2001 had the highest new enrollments (1335). The does not
appear to be any quarterly patterns of new enrollment for institutional care. New
enrollment peaked in the 3rd quarter of 1999 and 2001, and in the 1st quarter of 2000
and 2002. In 1998, new enrollment peaked in the 4th quarter.
There do not appear to be any similarities between the three waiver programs and
institutional care in terms of peak quarters of new enrollment.
New Enrollment Rates
Rates of new enrollment were calculated for each of the three waiver programs and for
institutional care using projected population totals for the years 1998 through 2002
available from the CDC Wonder Database using US Census Bureau data. These rates
do not control for poverty level or disability level, both factors considered when
40

determining eligibility for these programs. Unfortunately, population projection data for
persons with disabilities living at or below the poverty line were not available.
Table 4.2 shows the rates of new enrollments per year for the three waiver programs
and institutional care. There is an overall downward trend in the rate of new enrollments
for ElderChoices over the five-year period. For the Alternatives program, the rate of
new enrollments has steadily increased. The new enrollment rate trend for the DD
waiver has dramatically decreased. This decline may be a result of the number of
available slots being filled thereby reducing the number of persons who can enroll in the
program each year. The rate of new enrollments to institutions increased and then has
leveled off over the last several years reviewed.
Table 4.2. Rates per 100,000 of New Enrollment to Various LTC Programs by Year, 1998-2002
YearPopulation,
18-85 years
EC* Enrollees
EC* Rate
ALT* Enrollees
ALT* Rate
DDW* Enrollees
DDW* Rate
INST* Enrollees
INST* Rate
1998 1,880,573 2106 111.99 150 7.98 716 38.07 3804 202.281999 1,901,310 2263 119.02 177 9.31 360 18.93 4719 248.202000 1,920,632 2321 120.85 222 11.56 343 17.86 4797 249.762001 1,940,830 2129 109.70 332 17.11 174 8.97 4805 247.572002 1,960,618 1779 90.74 352 17.95 173 8.82 4920 250.94* EC = ElderChoices, ALT = Alternatives, DDW = Developmental Disabilities Waiver, and INST = Institutions.
Sources: MMIS Database, Census State Population Projections from CDC Wonder
41

Level of Care of New Enrollees
To be eligible for institutional care or
waiver services, a person must have a
functional disability. The level of care
codes used for nursing homes,
Alternatives and ElderChoices are
Intermediate 1-3, with level 1 requiring
the most care. The level of care codes
used for persons with developmental
disabilities enrolling in the DD Waiver
and HDCs are profound, severe,
moderate, and mild. However, the
MMIS does not utilize these codes and
instead uses one code:
Intermediate/Mentally Retarded (MR).
Table 4.3 shows the proportions of new
enrollees by the various levels of care
codes available through the MMIS and
ACES databases. For institutions,
approximately half of the new enrollees
over the five-year review period were
Level 3, the lowest level of care.
Although some data are missing for the
level of care codes for ElderChoices
and Alternatives new enrollees, it is not
too surprising that there was a higher
proportion (average of 40% over the five
years) of persons of higher care needs
(level 1 and 2) enrolling into nursing homes than for ElderChoices (24%) or Alternatives
(29%).
Table 4.3. Level of Care of New Enrollees to LTC Services, SFY 1998-2002.ElderChoices 1998 1999 2000 2001 2002Skilled Nursing 3% 2% 2% 1% 2%Intermediate 1 9% 8% 7% 8% 6%Intermediate 2 15% 18% 17% 21% 13%Intermediate 3 54% 51% 53% 48% 56%Intermediate / MR 0% 0% 0% 0% 0%Hospice 2% 1% 2% 2% 2%Missing 18% 19% 19% 20% 21%Total Percent 100% 100% 100% 100% 100%Total Persons 2106 2263 2321 2129 1779
Alternatives 1998 1999 2000 2001 2002Skilled Nursing 3% 1% 2% 1% 0%Intermediate 1 17% 11% 13% 7% 8%Intermediate 2 17% 22% 16% 17% 18%Intermediate 3 31% 27% 33% 29% 32%Intermediate / MR 3% 3% 3% 1% 1%Hospice 0% 1% 0% 0% 1%Missing 29% 36% 33% 46% 40%Total Percent 100% 100% 100% 100% 100%Total Persons 150 177 222 332 352 DD Waiver 1998 1999 2000 2001 2002Skilled Nursing 0% 0% 0% 0% 0%Intermediate 1 0% 0% 0% 0% 0%Intermediate 2 1% 1% 0% 0% 0%Intermediate 3 2% 1% 1% 1% 0%Intermediate / MR 83% 73% 76% 70% 64%Hospice 0% 0% 0% 0% 0%Missing 13% 26% 23% 30% 36%Total Percent 100% 100% 100% 100% 100%Total Persons 715 360 342 174 173
Institutions 1998 1999 2000 2001 2002Skilled Nursing 7% 7% 7% 5% 7%Intermediate 1 13% 14% 12% 12% 11%Intermediate 2 24% 30% 28% 27% 27%Intermediate 3 54% 48% 51% 52% 52%Intermediate / MR 1% 0% 1% 1% 0%Hospice 0% 1% 1% 2% 2%Total Percent 100% 100% 100% 100% 100%Total Persons 3804 4719 4797 4805 4920Source: Arkansas MMIS and ACES
42
Socio-Demographic Characteristics of New Enrollees
The research team reviewed the data on new enrollees to provide information on
gender, race, skill level and age by program for each of the five state fiscal years
reviewed.
AgeThe Alternatives Waiver Program is open to persons with physical disabilities who are
21-64 years of age. The ElderChoices Waiver is open to persons eligible for
institutional care who are 65 years of age or older. The Developmental Disabilities (DD)
Waiver is open to persons of any age with developmental disabilities as long as the
disability was determined prior to the person reaching age 22. Institutional care is open
to persons with certain physical limitations and functional assistance needs regardless
of age. For this analysis, persons under 18 years of age were excluded.
Data for the Alternatives Waiver indicated
all but three new enrolled persons were in
the 18-64 year age category. Since the
program’s eligibility criterion limits it to
persons with physical disabilities between
the ages of 21-64, it is assumed that data
entry error accounts for the three persons
older than 65 that were included as new
enrollees in the MMIS database. Table 4.4
shows the number of new enrollees by age
category by state fiscal year. As noted in
the section on patterns in new enrollment,
the number of new enrollments steadily
increased over the five-year review period.
Table 4.5 shows the number of new enrollees to the ElderChoices Waiver by four age
categories. For each of the five years reviewed, the age category with the highest
Table 4.4. New Enrollees to the Alternatives Waiver by Age Category, SFY 1998-2002Ages 1998 1999 2000 2001 2002
18-64 150 177 221 331 351
>65 0 0 1 1 1
Source: Arkansas MMIS Database
Table 4.5. New Enrollees to the ElderChoices Waiver by Age Category, SFY 1998-2002 Ages 1998 1999 2000 2001 200218-64 2 1 1 2 065-74 590 656 728 629 52875-84 876 921 938 885 743> 84 638 685 654 613 508Source: Arkansas MMIS Database
43

number of new enrollees was the 75-84 year age category. For 1998 and 1999, the age
category with the second highest number of new enrollees was the >84 years age
group followed by the 65-74 year age category. For the other three years reviewed
(2000-2002), the 65-74 year age category had the second highest number of new
enrollees, followed by the >84 year age category.
Table 4.6 shows the number of
enrollees to the DD waiver by various
age categories. Only a few persons
enrolling to this waiver were not
between the ages of 18 and 64 years of
age. This may be due to the limited life
expectancy of these persons and/or that older persons with developmental disabilities
utilize other waiver services (such as ElderChoices).
Because of variations in the distribution of age across the population, census data were
extracted to determine the rate by which persons of different age groups were using
various LTC services. New enrollment rates were calculated by age group regardless of
disability and poverty, and where possible, by age group of those with disabilities who
were non-institutionalized. Population data obtained from the US Census Bureau for
the 2000 US Census do not correspond to the age categories for the four LTC services
examined.
Table 4.7 indicates persons enrolled in the
ElderChoices Program at a higher rate as
they age. The enrollment rate doubles
from the 65-74 year old group to the 75-84
year old group, and then doubles again
from the 75-84 year old group to the >84
year old group. Since census data age
categories for non-institutionalized
disabled persons do not correspond to
Table 4.6. New Enrollees to the DD Waiver by Age Category, SFY 1998-2002 Ages 1998 1999 2000 2001 200218-64 707 357 339 174 17365-74 9 3 2 0 0>75-84 0 0 2 0 0
Source: Arkansas MMIS Database
Table 4.7. Rate per 100,000 persons of New Enrollees for the ElderChoices Waiver by Age Category, SFY 2000
2000 State Population
New Enrollees
Rate (per 100,000)
18-64 1,619,012 1 0.0665-74 198,334 728 367.0675-84 129,195 938 726.03
>84 46,492 654 1406.69
Sources: US Census Bureau. Arkansas MMIS
44

age categories used in this analysis, a rate was not calculated for new enrollment into
the ElderChoices program for non-institutionalized disabled persons by age category.
Table 4.8 provides a utilization rate in
2000 for the Alternatives Program.
This rate is very low for the number of
persons in the 18-64 year age category
in the general population. However,
when the level of disability is
considered, the rate increases. See
Table 4.9. Since Alternatives does not serve persons 65 years and older, no rates
were calculated for the persons the
MMIS database indicated were enrolled
in this program. Data entry error may
account for their existence in the
information database.
Table 4.10 indicates that the utilization
rates in 2000 for persons who newly
enrolled in the DD Waiver was 170.92 per
100,000 persons aged 18-64 years.
Table 4.11 shows the rate of new
enrollment to the DD Waiver for disabled
persons in the Community by age
category. Once disability is controlled for,
the rate increases to 339 per 100,000.
Table 4.8. Rate per 100,000 Persons of New Enrollees for Alternatives by Age Category, 2000
State Population
New Enrollees*
Rate (per 100,000)
18-64 1,619,012 221 13.65
65+ 374,021 1 NA*Enrollees are ages 21-64 years.Source: US Census and Arkansas MMIS
Table 4.9. Rate per 100,000 Persons of New Enrollees for Alternatives by Age Category, 2000
Persons Disabled in Community
New Enrollees*
Rate (per 100,000)
21-64 269,825 221 81.90
65+ 142,637 1 NASource: US Census and Arkansas MMIS
Table 4.10. Rate per 100,000 Persons of New Enrollees for the DD Waiver by Age Category, 2000
State Population
New Enrollees
Rate (per 100,000)
18-64 1,619,012 339 170.92
65-74 198,334 2 1.0075-84 129,195 2 1.55
>84 46,492 0 0.00Source: US Census and Arkansas MMIS
Table 4.12. New Enrollees for Institutional Care by Age Category, SFY 1998-2002 1998 1999 2000 2001 200218-64 487 559 667 572 66065-74 579 728 711 744 66475-84 1380 1712 1667 1714 1735>84 1358 1720 1752 1775 1861Source: Arkansas MMIS Database.
Table 4.11. Rate per 100,000 Persons of New Enrollees for the DD Waiver by Age Category, 2000
Persons Disabled in Community
New Enrollees*
Rate (per 100,000)
21-64 269,825 339 339.00
65+ 142,637 4 2.8*Includes new enrollees 18 - 64 years.Source: US Census and Arkansas MMIS
45

Table 4.12 provides data for the distribution of new enrollees for institutional care by
age category and state fiscal year. Both the 75-84 year and the >84 categories had 2.5
times more new enrollees for institutional care than the 18-64 year and the 65-74 year
age categories. In all but 1998, the age category with the highest number of new
enrollees was the >84 year age category. In 1998, the 75-84 year age category had the
highest number of new enrollees for institutional care.
Using the 2000 new enrollment figures for institutional care and 2000 Census age
distribution data for Arkansas, it was
found, as with the ElderChoices Waiver
program, that new enrollees in the >84
year age category are enrolling at a higher
rate (3,768.39) than persons in the other
three age categories (41.20, 358.49,
1,290.30,
respectively). See Table 4.13.
Table 4.14 shows the rate for institutional
care for non-institutionalized persons
with disabilities of two age categories.
Because the available census data do
Table 4.13. Rate per 100,000 Persons of New Enrollees for Institutional Care by Age Category, SFY 2000
2000 State Population
New Enrollees
Rate (per 100,000)
18-64 1,619,012 667 41.2065-74 198,334 711 358.4975-84 129,195 1667 1290.30
>84 46,492 1752 3768.39Source: US Census Bureau and Arkansas MMIS.
Table 4.14. Rate per 100,000 Persons of New Enrollees for Institutional Care by Age Category, 2000
Persons Disabled in Community
New Enrollees*
Rate (per 100,000)
21-64 269,825 667 247.20
65+ 142,637 4797 3363.08*Includes new enrollees 18 - 64 years.Source: US Census and Arkansas MMIS
46
not match the age categories of the data extracted from the MMIS, it is difficult to
compare the rates between Table 4.13 and Table 4.14.
47

RaceThe research team looked at the new enrollment to each of the waiver programs and to
institutional care by members of different racial groups. Data limitations do not allow
description of ethnicity so non-white and non-black enrollees are grouped as other or
unknown. The data did not
indicate much variability by racial
group among the new enrollees
of each of the four LTC programs
reviewed. See Table 4.15. The
average percentage of each of
the racial groups over the five-
year period for institutional care
was 80% white, 17% black, and
3% other/unknown. The average
percentage of each of the racial
groups over the five-year period
for the ElderChoices Waiver was
75% white, 21% black, and 4%
other/unknown. The average
percentage of each of the racial groups for the Alternatives Program was 77% white,
19% black, and 3% other/unknown. The average percentage of new enrollees to the
DD waiver was 79% white, 20% black, and 0% other/unknown. (Note: because of
rounding, average percentages may not equal 100%).
However, it does appear that blacks (as a proportion of new enrollees) are enrolling in
institutional care less than they are enrolling in HCBS (the three waiver programs).
Specifically, the average proportion of new enrollees to institutional care who were black
was 17%, compared to 20% for the average proportion of new enrollees to all three
waiver programs.
Table 4.15. Percentage of New Enrollees for LTC Services By Race, SFY 1998-2002ElderChoices 1998 1999 2000 2001 2002White 75% 75% 76% 73% 74%Black 21% 20% 20% 22% 23%Other/Unknown 4% 4% 4% 4% 4%
Alternatives 1998 1999 2000 2001 2002White 84% 83% 74% 77% 69%Black 14% 14% 23% 19% 26%Other/Unknown 2% 3% 3% 4% 4%
DD Waiver 1998 1999 2000 2001 2002White 83% 84% 75% 71% 84%Black 16% 16% 25% 28% 16%Other/Unknown 1% 0% 0% 1% 0%
Institutions 1998 1999 2000 2001 2002White 79% 80% 80% 81% 81%Black 17% 17% 16% 16% 16%Other/Unknown 4% 3% 3% 3% 3%Source: Arkansas MMIS
48

To consider more accurately the new enrollment patterns by members of different racial
groups to the various LTC services, the research team desired to calculate rates which
accounted for the disability level and the poverty status of persons of different racial
groups. However, census data are not available to allow for stratification across all three
variables (race, disability level and poverty status). The research team obtained from
US Census data, the number of non-institutionalized persons by racial group aged 18
years who were living at or below the poverty line, and the number of non-
institutionalized persons by racial group aged 21 years with a disability who were
unemployed (as a proxy for low income). Black Arkansans had disproportionately
higher percentages of unemployed disabled persons and persons living in poverty as
compared to white Arkansans (23% versus 18%, and 27% versus 11%, respectively).
Across the three waiver programs and
institutional care services, white
Arkansans below the poverty level
enrolled in these services at a rate
higher than that of African Americans
below poverty level (See Table 4.16).
For the ElderChoices program, the rate
of new enrollments for whites was 30%
higher than that of African Americans.
This represented the closest rate of new
enrollment between whites and blacks
among the four LTC services. Whites
enrolled in the Alternatives program at a
rate about 1.5 times higher than that of
African Americans. Whites enrolled in
the DD waiver at a rate that was 34%
higher than that of African Americans. The difference between the rate of enrollment of
whites and blacks for institutional care was larger than any rate differences for the three
Table 4.16. Rate per 100,00 Persons of New Enrollment to LTC Services by Race, 2000
ElderChoicesFPL or Below
*New Enrollees Rate
White, 65 yrs + 36,109 1768 4896.29
Black, 65 yrs + 12,136 456 3757.42
AlternativesFPL or Below
**New Enrollees Rate
White, 18-64 yrs 139,193 165 118.54
Black, 18-64 yrs 62,660 50 79.80
DD WaiverFPL or Below
New Enrollees Rate
White, 18-64 yrs 139,193 250 179.61
Black, 18-64 yrs 62,660 84 134.06
InstitutionsFPL or Below
New Enrollees Rate
White, 18 yrs + 175,302 3858 2200.77
Black, 18 yrs + 74,796 791 1057.54FPL=Federal Poverty Level. *Includes persons 60-65. ** Only includes persons 21-64. Source: US Census and AR MMIS.
49

waiver programs. For this program, whites enrolled at a rate more than twice that of
African Americans.
These differences, revealed after taking into account the higher rate of poverty in the
African-American population, indicate there may be disparities in utilization of formal
long-term care services in the African-American population.
However, more study is needed to confirm whether or not disparities exist, as the use of
poverty data to determine rates of participation is not a precise measure. In 2002 the
poverty level for an individual age 65 or older was $9,359. Income eligibility for
Medicaid institutional care and ElderChoices is not based on the poverty level. It is
based on the federal Supplemental Security Income (SSI) level ($545 per month or
$6,540 per year in 2002); the eligibility threshold is three times SSI. Therefore, in 2002,
individuals with incomes up to $19,620 were income eligible for Medicaid institutional
care or waiver care.
GenderThe research team looked at the
differences in new enrollments by
the gender of the enrollees across
the four LTC services. In general,
new enrollees to institutions and to
the ElderChoices program were
about 3 to 1 female. The average
enrollment for females to
institutional care across the five
years reviewed was 69%. For
ElderChoices, the five-year
average percentage of female new
enrollees was 74%. In contrast,
Table 4.17. Percentage of New Enrollees for LTC Services By Gender, SFY 1998-2002ElderChoices 1998 1999 2000 2001 2002Female 76% 74% 75% 75% 72%Male 24% 25% 25% 25% 28%
Alternatives 1998 1999 2000 2001 2002Female 40% 55% 48% 50% 50%Male 60% 45% 52% 50% 50%
DD Waiver 1998* 1999* 2000 2001 2002Female 47% 49% 47% 42% 47%Male 52% 50% 53% 58% 53%Institutions 1998 1999 2000 2001 2002Female 71% 69% 69% 69% 68%Male 29% 31% 31% 31% 32%Source: Arkansas MMIS. * Gender data was missing for several enrollees which made the percentage less than 100.
50

new enrollees to the Alternatives and DD Waiver programs were nearly evenly split
between males and females. The five-year average percentage of female new
enrollees to Alternatives was 49%, and to the DD Waiver was 47%. See Table 4.17.
Table 4.18 shows the rate of new enrollment to the four LTC services by gender in
2000. The table above showing the percentages of enrollment by gender suggests that
males and females are enrolling in the Alternatives and DD Waiver about evenly, and
that females are enrolling in
ElderChoices and
institutions about three
times more than males.
However, looking at the
rates of enrollment based
on the number of
impoverished males and
females by age group in the
population provides a
different picture. Male and
female enrollment rates to
ElderChoices are nearly the
same, with females
(4928.62) enrolling at just a
slightly higher rate than males (4212.72) In contrast, males enrolled in the Alternatives
Waiver and the DD Waiver (130.41, 204.61, respectively) about 1.5 times more often
than females (83.79, 127.26, respectively). For institutions, females (2039.92) enrolled
1.5 times more often than males (1444.36).
Table 4.18. Rate per 100,000 Persons of New Enrollment to LTC Services by Gender, 2000
ElderChoicesImpoverished
PersonsNew
Enrollees* RateFemales, 65 yrs + 35,162 1733 4928.62Males, 65 yrs + 13,934 587 4212.72
AlternativesImpoverished
PersonsNew
Enrollees** RateFemales, 18-64 yrs 126,511 106 83.79Males, 18-64 yrs 88,949 116 130.41
DD WaiverImpoverished
PersonsNew
Enrollees RateFemales, 18-64 yrs 126,511 161 127.26Males, 18-64 yrs 88,949 182 204.61
InstitutionsImpoverished
PersonsNew
Enrollees RateFemales, 18 yrs + 161,673 3298 2039.92Males, 18 yrs + 103,783 1499 1444.36*Includes persons 60-65. ** Only includes persons 21-64. Source: US Census and AR MMIS.
51

Geographic Distribution
To look at differences in enrollment patterns by different geographic regions, the
number of persons enrolling in institutional and HCBS (ElderChoices, Alternatives and
DD Waiver) was converted to a rate per persons 18 years older living at or below the
poverty line in the counties. That rate was then converted to a Z-Score (value – mean /
standard deviation). Z-Scores are used to standardize data and to compare a value (a
new enrollment rate, in this case) to the average for all values in the dataset (average
rate for all counties, in this case). After Z-Scores were calculated they were assessed
for significant differences. Counties that were significantly different were those which
had a Z-Score that was equal or greater than +1.96 (significantly higher) and those with
a Z-Score equal or less than -1.96 (significantly lower).
Table 4.19 lists the new
enrollment rate and Z-score for
HCBS in 2000 for each of the
75 counties in the state. Only
three counties had statistically
significantly higher rates as
compared to the average
county rate. They were Dallas,
Logan and St. Francis
Counties. See Map 4.1. No
counties had significantly lower
new enrollment rates for HCBS.
Table 4.20 lists the new
enrollment rates and Z-Scores
for institutional services. No
counties had statistically
significantly different rates as compared to the average county rate.
Map 4.1. Counties with Significantly Higher (Shaded) New Enrollments to Home and Community-Based LTC Services, SFY 2000.
52
Table 4.19. Rate per 100,000 Persons and Z-Score of Enrollment to Home and Community-Based Services by County, 2000
County
Enrollees to HCB,
2000Adults in
Poverty, 2000 RateZ-
Score County
Enrollees to HCB,
2000Adults in
Poverty, 2000 RateZ-
ScoreArkansas 43 2344 1834.47 0.41 Lee 46 1954 2354.15 0.93Ashley 57 2502 2278.18 0.85 Lincoln 16 1333 1200.30 -0.22Baxter 51 3111 1639.34 0.22 Little River 5 1420 352.11 -1.06Benton 87 9461 919.56 -0.50 Logan 80 2326 3439.38 2.00Boone 43 3373 1274.83 -0.14 Lonoke 47 3533 1330.31 -0.09Bradley 13 2230 582.96 -0.83 Madison 16 1675 955.22 -0.46Calhoun 21 645 3255.81 1.82 Marion 14 1590 880.50 -0.53Carroll 34 2624 1295.73 -0.12 Miller 28 4639 603.58 -0.81Chicot 52 2374 2190.40 0.77 Mississippi 38 6966 545.51 -0.87Clark 24 3002 799.47 -0.61 Monroe 19 1693 1122.27 -0.29Clay 34 2186 1555.35 0.14 Montgomery 8 1057 756.86 -0.66Cleburne 17 2187 777.32 -0.64 Nevada 10 1543 648.09 -0.76Cleveland 17 802 2119.70 0.70 Newton 15 1139 1316.94 -0.10Columbia 22 3293 668.08 -0.75 Ouachita 43 3628 1185.23 -0.23Conway 48 2070 2318.84 0.89 Perry 21 968 2169.42 0.74Craighead 77 8377 919.18 -0.50 Phillips 63 4698 1341.00 -0.08Crawford 53 4589 1154.94 -0.26 Pike 18 1277 1409.55 -0.01Crittenden 39 7172 543.78 -0.87 Poinsett 58 3453 1679.70 0.26Cross 33 2312 1427.34 0.01 Polk 15 2421 619.58 -0.79Dallas 80 1090 7339.45 5.87 Pope 82 5374 1525.87 0.11Desha 22 2642 832.70 -0.58 Prairie 16 975 1641.03 0.22Drew 20 2257 886.13 -0.53 Pulaski 165 28972 569.52 -0.84Faulkner 59 7481 788.66 -0.63 Randolph 33 1869 1765.65 0.34Franklin 23 1833 1254.77 -0.16 Saline 59 4029 1464.38 0.04Fulton 30 1339 2240.48 0.82 Scott 20 1333 1500.38 0.08Garland 30 8272 362.67 -1.05 Searcy 16 1368 1169.59 -0.25Grant 25 1101 2270.66 0.84 Sebastian 96 9753 984.31 -0.43Greene 30 3409 880.02 -0.53 Sevier 7 1783 392.60 -1.02Hempstead 15 2845 527.24 -0.88 Sharp 35 2116 1654.06 0.23Hot Spring 25 2743 911.41 -0.50 St. Francis 59 1476 3997.29 2.56Howard 13 1385 938.63 -0.48 Stone 29 4189 692.29 -0.72Independence 45 2939 1531.13 0.11 Union 67 5323 1258.69 -0.16Izard 18 1522 1182.65 -0.23 Van Buren 23 1681 1368.23 -0.05Jackson 30 1899 1579.78 0.16 Washington 82 15456 530.54 -0.88Jefferson 72 9721 740.66 -0.67 White 70 5894 1187.65 -0.23Johnson 41 2493 1644.60 0.22 Woodruff 49 1471 3331.07 1.90Lafayette 14 1287 1087.80 -0.33 Yell 34 2076 1637.76 0.22
Lawrence 27 2093 1290.01 -0.13
Source: Arkansas MMIS and US Census Bureau.
53

Table 4.20. Rates per 100,000 Persons and Z-Scores of Enrollment to Institutions Services by County, 2000
County
Institutional Enrollees,
2000
Adults in Poverty,
2000 RateZ-
Score County
Institutional Enrollees,
2000
Adults in Poverty,
2000 RateZ-
ScoreArkansas 60 2,344 40.95 -1.37 Lee 26 1,954 33.94 -1.37Ashley 48 2,502 43.79 -1.36 Lincoln 42 1,333 22.79 -1.39Baxter 99 3,111 54.72 -1.35 Little River 34 1,420 24.35 -1.38Benton 153 9,461 168.77 -1.24 Logan 55 2,326 40.63 -1.37Boone 60 3,373 59.43 -1.35 Lonoke 115 3,533 62.30 -1.35Bradley 40 2,230 38.90 -1.37 Madison 27 1,675 28.93 -1.38Calhoun 10 645 10.44 -1.40 Marion 22 1,590 27.41 -1.38Carroll 31 2,624 45.98 -1.36 Miller 82 4,639 82.17 -1.33Chicot 38 2,374 41.49 -1.37 Mississippi 106 6,966 123.96 -1.28Clark 71 3,002 52.77 -1.36 Monroe 17 1,693 29.26 -1.38Clay 35 2,186 38.11 -1.37 Montgomery 19 1,057 17.83 -1.39Cleburne 41 2,187 38.13 -1.37 Nevada 32 1,543 26.56 -1.38Cleveland 15 802 13.26 -1.39 Newton 18 1,139 19.31 -1.39Columbia 56 3,293 57.99 -1.35 Ouachita 59 3,628 64.01 -1.34Conway 37 2,070 36.03 -1.37 Perry 26 968 16.24 -1.39Craighead 159 8,377 149.30 -1.26 Phillips 64 4,698 83.23 -1.33Crawford 103 4,589 81.27 -1.33 Pike 30 1,277 21.79 -1.39Crittenden 83 7,172 127.66 -1.28 Poinsett 43 3,453 60.87 -1.35Cross 39 2,312 40.37 -1.37 Polk 36 2,421 42.33 -1.37Dallas 33 1,090 18.43 -1.39 Pope 89 5,374 95.37 -1.31Desha 42 2,642 46.30 -1.36 Prairie 35 975 16.36 -1.39Drew 32 2,257 39.39 -1.37 Pulaski 361 28,972 519.18 -0.89Faulkner 119 7,481 133.21 -1.28 Randolph 43 1,869 32.42 -1.38Franklin 65 1,833 31.77 -1.38 Saline 166 4,029 71.21 -1.34Fulton 35 1,339 22.90 -1.39 Scott 15 1,333 22.79 -1.39Garland 185 8,272 147.41 -1.26 Searcy 10 1,368 23.42 -1.38Grant 24 1,101 18.63 -1.39 Sebastian 178 9,753 174.01 -1.24Greene 73 3,409 60.08 -1.35 Sevier 38 1,783 30.87 -1.38Hempstead 43 2,845 49.95 -1.36 Sharp 52 2,116 36.85 -1.37Hot Spring 54 2,743 48.11 -1.36 St. Francis 43 1,476 25.36 -1.38Howard 47 1,385 23.73 -1.38 Stone 18 4,189 74.08 -1.33Independence 61 2,939 51.64 -1.36 Union 125 5,323 94.45 -1.31Izard 30 1,522 26.19 -1.38 Van Buren 46 1,681 29.04 -1.38Jackson 43 1,899 32.96 -1.38 Washington 171 15,456 276.44 -1.13Jefferson 140 9,721 173.44 -1.24 White 130 5,894 104.71 -1.30Johnson 30 2,493 43.63 -1.36 Woodruff 29 1,471 25.27 -1.38Lafayette 31 1,287 21.97 -1.39 Yell 54 2,076 36.14 -1.37
Lawrence 76 2,093 36.44 -1.37
Source: Arkansas MMIS and US Census Bureau.
54
Discussion
Limitations. Several limitations of the analysis presented in this chapter should be
noted. Specifically, the rates and percentages presented are for the most part
unstratified and do not control for factors that might vary across the variables being
examined. New enrollment data were based on eligibility start dates drawn from
eligibility files of beneficiaries and the accuracy of these data is uncertain. The data
examined here were administrative data collected for payment purposes rather than for
research. While early attempts were made to link eligibility files with claims data to
increase the accuracy of the enrollment picture, resolution of contradictions within these
data was outside of the scope of this study.
Recommendation: Better coordination of data. An important finding arising from
this study relates to the lack of common data elements across the various long term
care systems of care examined in this study. In Appendix A of this report, a matrix is
presented that was developed to identify data sources for this secondary data analysis.
Better coordination and standardization of the data elements collected and the manner
for processing and accessing these data would enhance studies of this kind and
facilitate efforts to examine the impact of programs and policies and related changes.
55
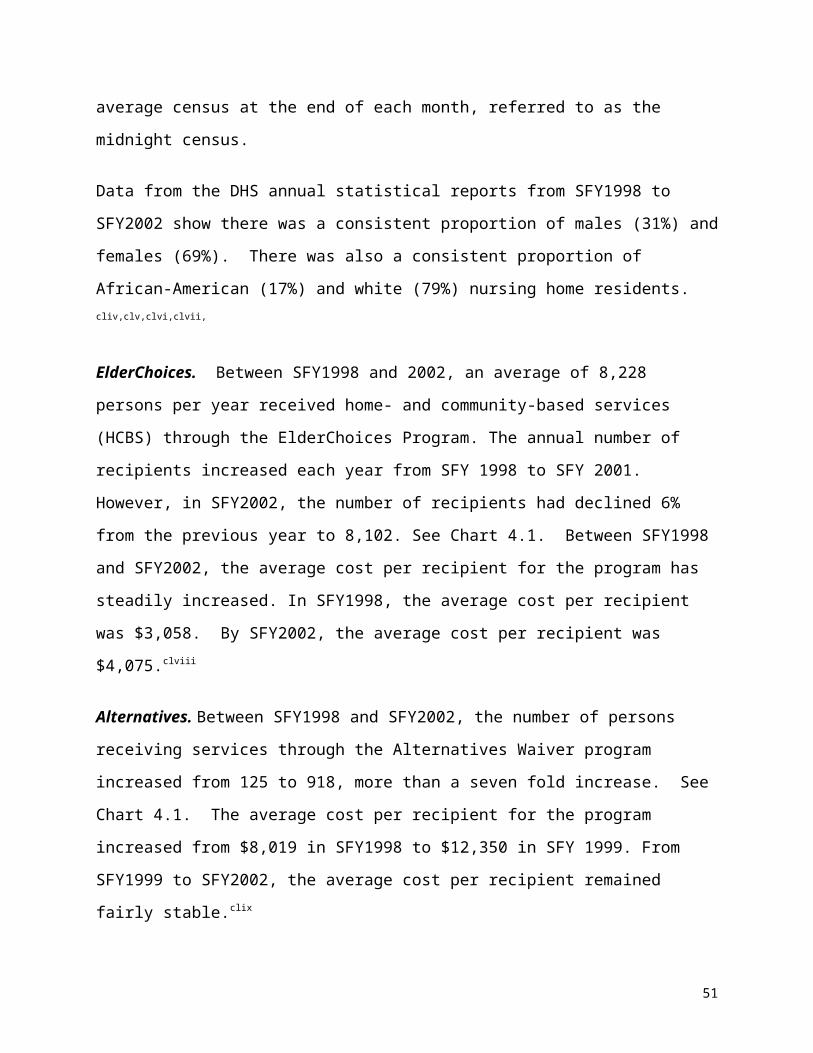
Chapter 5Description of the Study Sample, and Characteristics of Participants
in Focus Group Discussions and Key Informant Interviews
This section describes the actual sample drawn for this study and compares it with the
desired sample as described in Chapter 2. In addition, the demographic characteristics
of the respondents participating in Focus Group Discussions (FGD) and Key Informant
Interviews (KII) are described
Key findings from the FGDs and KIIs are presented in Chapters 6, 7, and 8.
Sample Description As noted in Chapter 2, the sample for the key informant interviews for long-term care
(LTC) consumers was up to 12 index cases for each of the three targeted
subpopulations of elderly, adults with physical disabilities and adults with developmental
disabilities. The research team attempted to balance the index cases in terms of
gender, race, marital status, and geographic location. Although some index case
consumers were not interviewed due to cognitive impairments, all the index case
consumers represented the actual sample.
The research team was able to recruit 39 index cases (14 elderly, 15 adults with
physical disabilities, and 10 adults with developmental disabilities) into the study.
Seven of these 39 index cases (four elderly, two adults with physical disabilities, and
one adult with developmental disabilities) were eventually excluded from the sample
because they did not meet the minimum sample eligibility criteria or were too cognitively
impaired to complete the interviews. The final sample contained a total of 32 index
cases, 10 elderly index cases, 13 adults with physical disabilities index cases, and nine
adults with developmental disabilities index cases. All these index cases met the
56
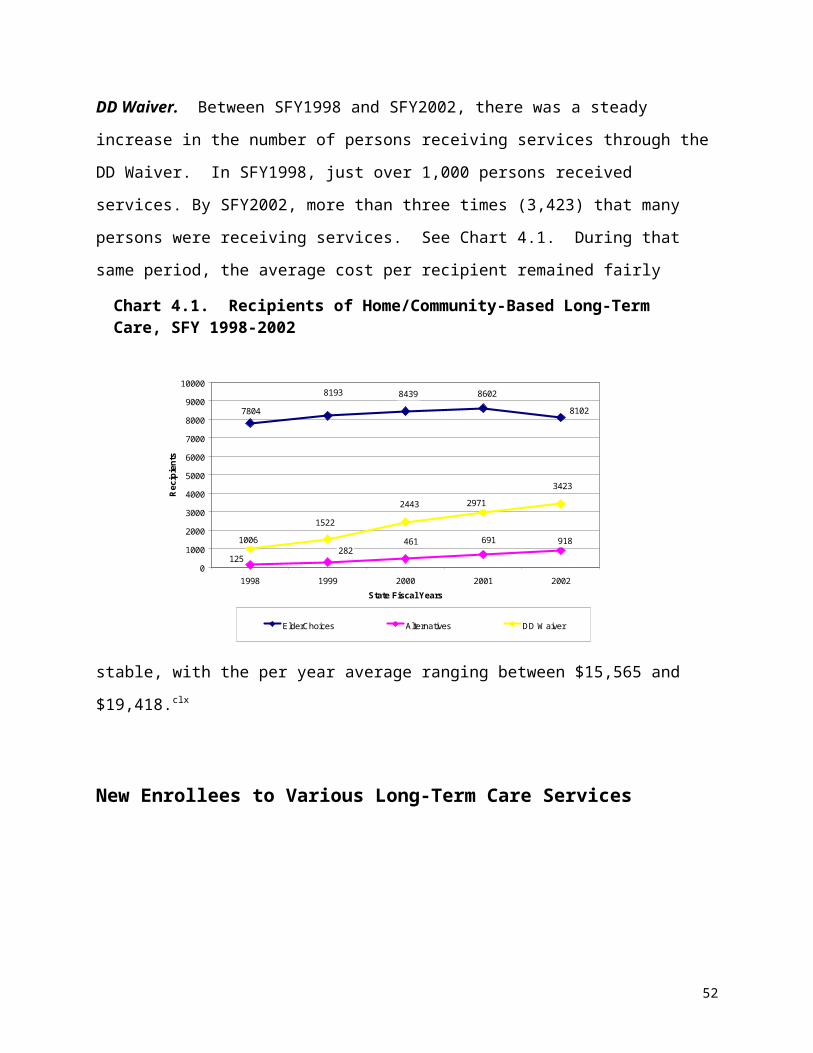
minimum sample eligibility criteria in terms of being eligible for Medicaid LTC services.
Table 5.1 provides other characteristics of the sample. In general, the research team
was able to recruit a sample that was fairly balanced in terms of demographic
characteristics. Due to the availability of index cases meeting the minimum sample
eligibility criteria, a balance was not achieved for gender among the index cases of the
adults with developmental disabilities (two females, seven males). In addition, all three
subpopulations had more index cases from rural areas of the state in comparison to
urban areas. Finally, there were more index cases using HCBS than institutional
services in the adults with developmental disabilities group. The average age of the
index cases were: 76 years for the elderly, 52 years for the adults with physical
disabilities, and 33 years for the adults with developmental disabilities.
Table 5.1. Characteristics of the Study SampleSample Subpopulation
Number of Index Cases
Service Type
HCBS/INST
Gendermale/female
Racewhite/black
Regionurban/rural
AverageAge
Elderly 10 6/4 6/4 5/5 3/7 76 years* Adults with Physical Disabilities
13 6/7 6/7 7/6 4/9 52 years**
Adults with Developmental Disabilities
9 6/3 2/7 6/3 3/6 33 years*
*Missing age data on 2 index cases. **Missing age data on 1 index case
Characteristics of Focus Group ParticipantsThe focus group sample consisted of 32 participants across the four focus group
discussions. In addition to the questions asked by the focus group moderators, the 32
focus group participants were asked to complete a short survey, to provide a
demographic and professional expertise profile of focus group respondents. Twenty-
nine of the 32 focus group participants completed the post-discussion survey.
Respondents were mostly white (23) and female (26). Nearly half (12) held a master’s
or doctorate degree, with another seven having completed bachelor’s degrees. The
focus of the degrees was mixed; however, seven reported having been educated in
57

nursing. On a scale from 1 to 7 (highest) of expertise in their current position and in
their field in general, most focus group participants considered themselves to be
experts. See Table 5.2 for selected characteristics.
Table 5.2. Selected Characteristics of Provider Focus Group ParticipantsGroup
1Group
2Group
3Group
4Summary
Elderly Elderly Adults with Physical Disabilities
Adults with DevelopmentalDisabilities
Number Attending 9 8 8 6 31Surveys Completed 9 6 8 6 29Males/Females 2/7 2/4 2/6 0/6 6/23Black/White/Other 0/9/0 0/6/0 2/4/2 2/4/0 4/23/2
Persons attending the focus group were given an opportunity to describe the patient
group(s) that comprised the majority of their caseload. As respondents could select
more than one patient group, the responses are greater than the total number of
attendees.
Of the six persons attending the group about adults with developmental disabilities, four
reported primarily working with these persons in HCBS settings. Two reported working
with adults with developmental disabilities in institutional settings. One of the persons
reported working with both adults with physical disabilities and adults with
developmental disabilities in institutional settings. One person reported working with a
population other than elderly, adults with physical disabilities, and adults with
developmental disabilities.
Of the eight persons attending the focus group about adults with physical disabilities,
five reported working with adults with physical disabilities in HCBS settings, three
reported working with adults in institutions, one reported working with adults with
developmental disabilities in an institutional setting, and one reported working with
adults with physical disabilities in an institutional setting.
58

Of the 17 people who attended the two focus groups about the elderly, five reported
working with elderly in HCBS settings and three reported working with elderly in
institutional settings. Three also reported working with adults with physical disabilities in
a HCBS setting and two reported working with adults with physical disabilities in an
institutional setting.
Characteristics of Key InformantsFor the study, a total of 59 key informants were interviewed. The average age was 55
years. Most of the informants were female (69%), were white (56%), were married
(41%), and had some college or a college degree (46%). Actual consumers of LTC
services represented nearly one-third (32%) of all informants, while 29% were legal
guardians of consumers, and 39% were associated with the consumers (either were family,
friends, or service providers).
Table 5.3. Characteristics of Key Informants
Service Type Total
Average Age* Gender Race
Marital Status
Education Level
Respondent Type
Male / Female / Unknown
White/ Black/ Other /
Unknown
Married / Widowed/
Single/ Divorced
/ Unknown
Less than High
School/ High
School/ Some
College or Degree / Unknown
Index Case (Consumer) /
Guardian / Other
AssociateKey Informants about Long-Term Care Services for Elderly
HCBS 11 66.78 3/8/0 6/4/0/1 3/3/3/0/2 5/0/4/2 5/0/6INST 7 56.85 2/5/0 4/3/0/0 3/1/0/3/0 0/4/3/0 2/2/3
Key Informants about Long-Term Care Services for Adults with Physical Disabilities
HCBS 12 50.36 4/7/1 4/6/0/2 4/2/2/3/1 3/3/4/2 5/7/0INST 14 47.36 3/11/0 8/6/0/1 6/1/3/4/0 3/4/7/0 6/1/7
Key Informants about Long-Term Care Services for Adults with Developmental DisabilitiesHCBS 11 56.09 4/7/0 9/2/0/0 6/1/2/2/0 2/2/7/0 1/4/6INST 4 61.75 1/3/0 3/1/0/0 2/1/0/1/0 1/1/2/0 0/3/1
Note: HCBS = Home and Community-Based Services, INST= Institutional Services*Missing Data on 2 of the Elderly HCBS respondents
59
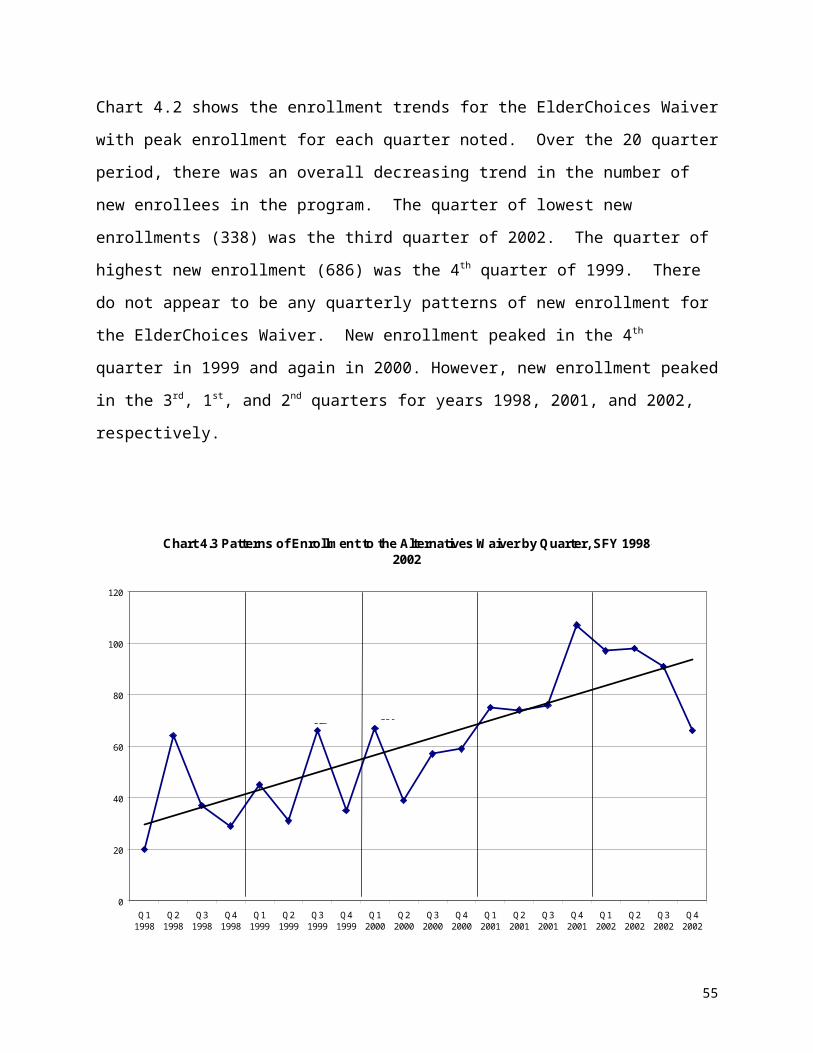
The 59 interviews represented the three target subpopulations: elderly, adults with
physical disabilities and adults with developmental disabilities. Table 5.3 provides
characteristics of the respondents by each of the three subpopulations and service type
(HCBS and institutions). A composite profile of the total participants by each of the
three subpopulations follows the table.
Elderly. Eighteen of the 59 persons interviewed represented the elderly subpopulation,
of which one-half (n=9, 50%) were associates of the elderly consumers and 39% (n=7)
were actual elderly consumers. Twelve of the interviews related to elderly persons
receiving HCBS while seven related to elderly persons receiving services in institutional
settings. Across the 18 persons interviewed, the average age was 62 years. Nearly
three-fourths (n=13, 72%) of the informants were female. Just over half (n=10, 56%) of
the informants were white, while 39% (n=7) of informants were African-American. Seven
of the 18 informants (39%) had some college or a college degree. Half of the
informants were associates of an elderly consumer, while just over one-third, (n=7,
39%) were actual elderly consumers.
Adults with Physical Disabilities. The study team was able to interview 26 persons
representing the adults with physical disabilities group. They were nearly evenly divided
between persons (or associates of these persons) who used HCBS (n=12) and persons
(or associates of these persons) who used institutional services. Nearly half (n=11,
42%) were adults with physical disabilities, while 8 (31%) were legal guardians, and
seven (27%) were other persons associated with the adults with physical disabilities.
The average age of all the persons interviewed was 49 years. Nearly two-thirds (n=18,
69%) of the informants were female. The informants were evenly mixed between
whites (n=12, 46%) and African Americans (n=12, 46%). Informants most often
reported being currently married (n=10, 38%).
Adults with Developmental Disabilities. A total of 15 persons representing the adults
with developmental disabilities population were interviewed. Most (n=11) represented
the persons who used HCBS. Only four represented persons using institutional
60
services. Only one of the informants was an actual consumer with developmental
disabilities. The other informants were evenly mixed between legal guardians (n=7,
41%) and other associates of adults with developmental disabilities (n=7, 41%). The
average age of all informants was 58 years. Nearly two thirds (n=10, 67%) of the
informants were female, and most (n=12, 73%) were white. More than half (n=8, 53%)
reported being married. Nearly two-thirds (n=9, 60%) had completed some college or
obtained a college degree.
61
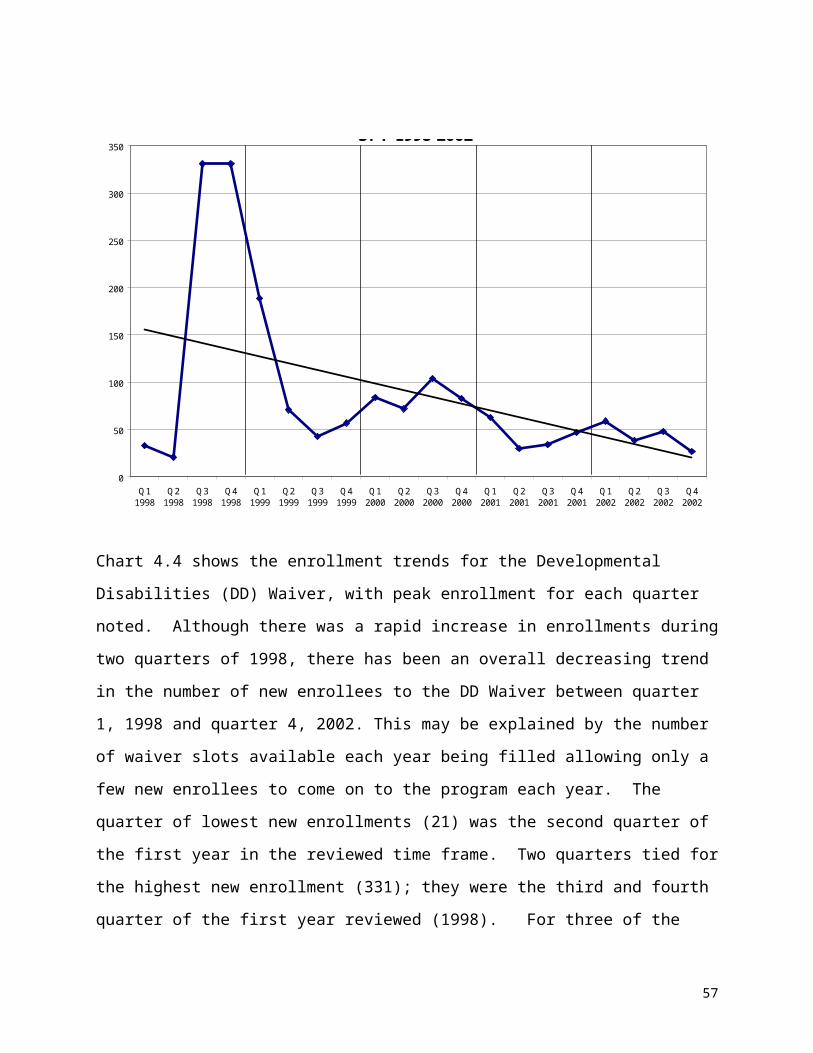
Chapter 6Leveling the Playing Field for Home and Community-based
and Institutional Services
A recurring theme that emerged over the course of the study from the Advisory Working
Group (AWG), the Focus Group Discussions (FGD), the Key Informant Interviews (KII),
and in reviewing policies was a sense that the playing field for home and community-
based services (HCBS) is not level with that for institutional services. This theme played
out in consumer and caregiver interviews as differences in access to, as well as scope, of
available services. For providers, policy and programmatic differences supporting this
theme were identified as well.
This section describes four key findings related to the theme of leveling the playing field.
The first three findings identify barriers that result in reduced access to HCBS when
compared to institutional services: gate-keeping and difficulties navigating the system,
requirements for re-assessment, and financial eligibility for services. The fourth finding
highlights the critical role of advocates in overcoming these system barriers.
Findings presented are those for which programmatic and policy changes are most
likely to have an impact. The quotes chosen for presentation are among the most
illustrative of the findings they support. (Please see Chapter 2 for a fuller description of
the data sources and analysis methods.) To protect the identity of study respondents,
gender is concealed by random assignment of gender-specific pronouns and
pseudonyms in quotes and other text describing cases.
Recommendations were developed in the context of these findings with input from the
AWG and through reviewing the published, as well as unpublished, literature for
recommended best practices. Recommendations are made for each key finding and
discussed at the end of this section.
62
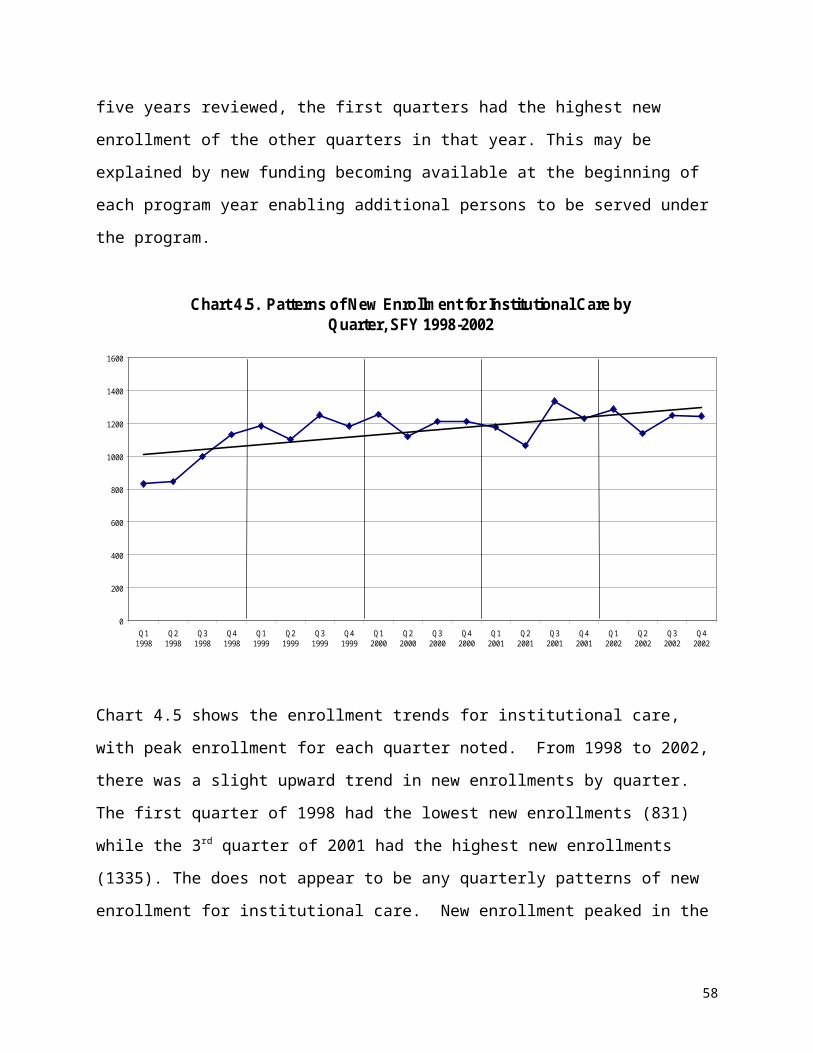
KEY FINDING 1: Gate-keeping and difficulties navigating the HCBS system may restrict access to HCBS.
Most of those using HCBS found the application and approval process confusing,
complicated and/or characterized by excessive gate-keeping, onerous paperwork and
long waiting periods, whereas few recipients of institutional care reported similar
experiences in applying for services.
Both providers and consumers reported instances of excessive gate-keeping. A few
recipients of HCBS mentioned having to apply multiple times in order to be finally
approved for services. A few mentioned not understanding the services for which they
were actually applying. For three of the five cases in which getting on HCBS was
relatively easy, participants reported that a friend intervened, steering them to the right
agency when health care or social service providers did not provide information and
guidance.
“They called over and said he didn’t qualify anymore because he is now standing by himself. Well, when he was in my office, it took us 20 minutes to get him on the scales. I don’t know what their definition of ‘stand by assist’ is, but it took every bit of 20 minutes to get him on and off the scales … [T]hat one gentleman did finally get on, after I reapplied and reapplied and reapplied and finally called the state and said, ‘Look somebody, please come look at this man.’” (FGD quote from a provider of services to the elderly)
“And even if they apply for that Alternative Waiver, which is ages 21 through 64, it takes at least 45 days, so what do you do from day 1 to day 45? Sometimes, it takes longer.” (FGD quote from a provider of services to adults with physical disabilities)
63
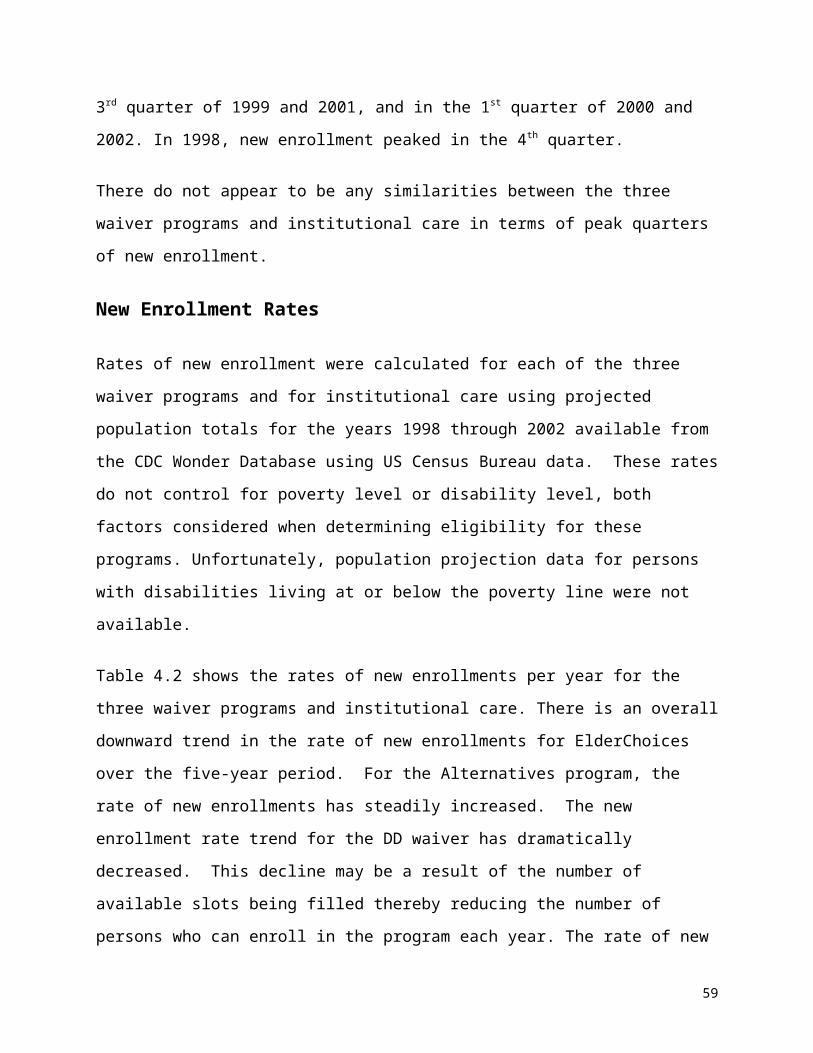
“[You can’t go down to DHS and say] … ‘I want to apply for this,’ without your case worker having to track down or figure out or find out or locate some hidden paperwork somewhere or a form that she didn’t know about, track down and get shipped in, or whatever …There’s not really forms to fill out for half the programs that exist … Yea, access to the forms to fill out for the program is a big issue they need to work on … and knowledge of ‘Hey, I don’t need form A, I need form B. I don’t need form 12, I need form 16.’” (Quote from a KII with an Alternatives Waiver consumer)
A number of respondents reported having to re-do applications more than once as a
result of lost paperwork.
“Round and round in a circle. Sending me papers back here that done been signed. … ‘Well, maybe we got hold of the wrong papers …’” (Quote from KII with an ElderChoices consumer)
In only one case of institutional care was gate-keeping mentioned as a problem. The
son of the recipient of services reported that prior to hospital discharge, the family had
repeatedly asked a hospital social worker for information about nursing home care, but
the social worker ignored their request, choosing instead to promote hospice care. The
family had to seek information about nursing home care and make arrangements for
services on their own.
Below is a passage from a KII with a provider who intervened and arranged for a
hearing with DHS to find out why a HCBS recipient who applied several times for
ElderChoices and was finally approved was then notified two weeks later that she was
denied. The provider contended that the medical criteria for ElderChoices were too
restrictive.
Respondent (R): “I think when they do the hearings, like they did with her, … they need to be more … specific, like I said, I never did, we never found out a reason why she was denied. … [I]t was me and Ms. Smith4 and I believe [someone from] from DHS [maybe] were there, in the home,
4 Not her real name.
64

and then we had two people on the phone that we were speaking to, I’m not sure, I can’t remember, I think it was.”
Interviewer (I): “Sure.”
R: “And one of them was the lady, the main person I guess, and one in the ElderChoices program. And we never did find out exactly why she was denied. They couldn’t ever tell me specifically why she was denied. We never got the answer that we were looking for, and were just told to reapply and they would check into it.”
R: “… [S]ome of the things, the way they approve people for this ElderChoices program doesn’t make a lot of sense to me. I mean … you have to be … incontinent and not be able to [clean] yourself up. Where to me, just because if you’re incontinent and you’re able to take your clothes off and put dry clothes on, it doesn’t mean you still don’t need help, you know what I mean? … I don’t understand exactly how they qualify different people for this program, because … there’s more extenuating circumstances than whether they can feed themselves, whether they’re incontinent, or whether they can walk by themselves. [T]hat’s the three, that’s what we have been told by DHS: That they have to be unable to feed themselves, that they have to be incontinent, and not able to clean themselves up… Well, Ms. Smith* at that time, when she first started applying, was able to do those things, but she was so short of breath, it might take her an hour and a half to take a bath, and it really wore her out to do that. So, I mean, I think we need to have a different set, like I said, on each individual basis instead of you know, just those three set things.” (Quote from a KII with a provider serving an ElderChoices consumer)
RECOMMENDATIONS:
Consolidate application for HCBS and institutional services into one process.
Conduct a cost-benefit analysis of standardizing the approval process for
Medicaid LTC, both institutional and HCBS, by requiring a face-to-face
assessment and counseling by an independent entity prior to authorization.
65
Expand efforts to have a fast track process to speed access to services for those
in emergency situations and those being discharged from hospitals.
Adopt presumptive eligibility for HCBS waiver programs, so services can start
immediately for those who appear to be eligible, pending final determination.
Explore options for making temporary nursing home care available for individuals
awaiting HCBS eligibility approval such as allowing Medicaid reimbursement for
nursing home stays of less than 30 days.
KEY FINDING 2: Individuals in nursing homes may be remaining there beyond the time when they need that level of care.
Annual assessments by an independent entity are required by policy for consumers of
waiver services, but not for nursing home residents. A few providers reported that
nursing home patients who may have been well enough to return home remained
institutionalized because they were not regularly reassessed. Consumers and others
involved in making the decision about services did not explicitly raise this as a problem.
However, data indicated this might have been true in a few cases involving elderly
individuals and individuals with physical disabilities. All of these persons had entered a
nursing home because they needed skilled care. The ramifications of a person
remaining in a nursing home past the point of need are far greater than for one who
uses HCBS who has improved but continues to receive unneeded services. The
expense to the state for unneeded services is much greater in the former than the latter.
Further, the consequence to the nursing home resident who remains in that setting may
be that returning home becomes an impossibility, as described in this quote below:
“[W]e have clients in nursing homes … say the person may have been in the nursing home for 10 years, and then they go to the hospital because they fell and fractured their arm. Then we look at the application and say, ‘Oh, this person is
66

up and walking? They are doing fine. They fractured their arm. We’ll give them 80 days convalescent care.’ At the end of the 80 days, that client is ready to go home. It could have been eight years earlier that they were ready to go home. Then all of a sudden we discharge them, and they can’t get paid anymore. Now, you know, they don’t have a home anymore, don’t have any assets whatsoever … [T]he nursing home is partly to blame. They knew that the client was no longer eligible, but since we don’t do any more reviews, those applications don’t come up anymore.” (FGD quote from a provider of services to adults with physical disabilities)
RECOMMENDATION:DHS should conduct a cost-benefit analysis of mandating annual reassessments of all
LTC service consumers.
KEY FINDING 3: Mechanisms for achieving income eligibility are available for consumers entering nursing homes that are not available for those seeking HCBC.
A few consumers reported having too much income to be eligible for HCBS, so they
ended up in a nursing home.
“No, we was gonna try to get somebody to come in the home and watch him … [S]he checked into a bunch of stuff, ‘cause she lives in Arkansas. … Anyway, he just made too much money … which is not enough … I don’t know how to put this, just because he worked hard all of his life and had a decent retirement, he’s penalized … [Y]ou gotta be dirt poor and on Medicaid in order to get anything nowadays.” (Quote from a KII with a relative of a nursing home resident)
RECOMMENDATIONS:
67
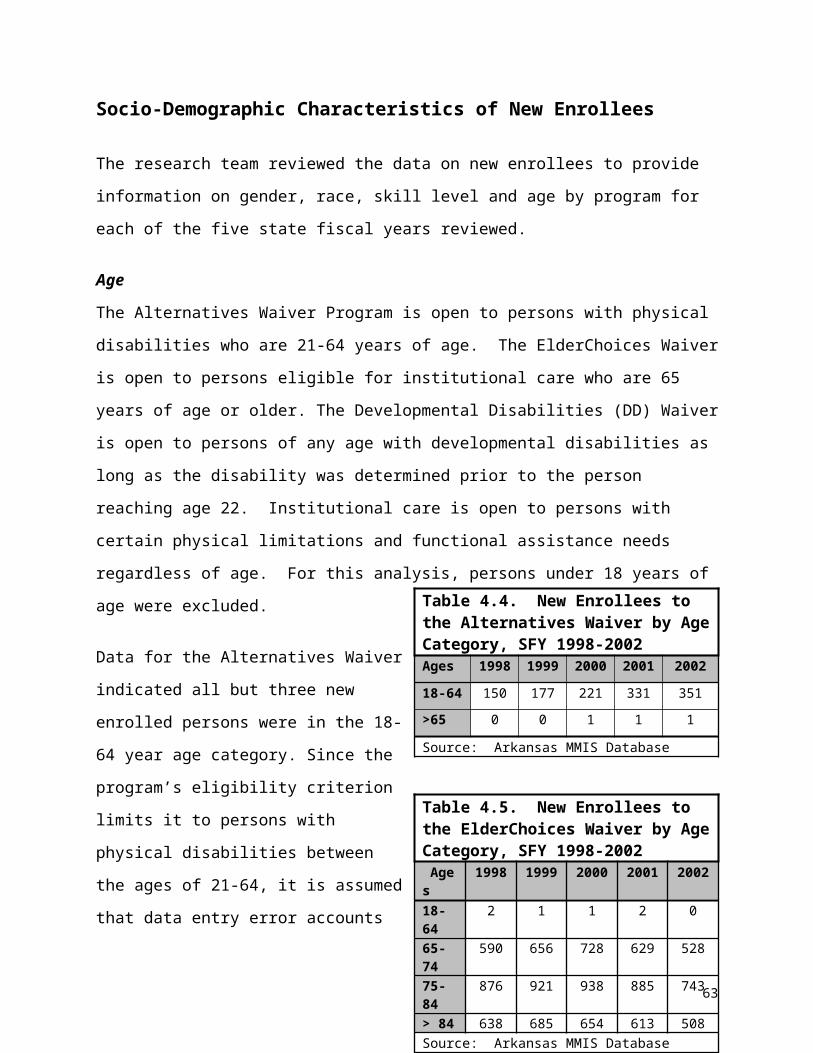
Develop medically needy spend-down option, such as a Miller Trust, for persons
applying for home and community-based waiver services, comparable to what is
available for those going into a nursing home.
Adopt policies to protect spouses of Alternatives Waiver consumers from
impoverishment to be comparable to that available now for nursing home residents,
ElderChoices Waiver and DD Waiver consumers.
KEY FINDING 4: Overcoming system barriers sometimes required the intervention of someone in an advocate role.
Those in health and social services or family members often played this role, making it
possible for consumers to get needed services.
“See, my mom went with me cause she’s on disability, so she knows she knows all that stuff, so I didn’t know anything. If it wasn’t for my mom being on it already and knowing some of the stuff, I’d be lost. I mean I don’t know how people do it. If I didn’t have her, I wouldn’t have known what to do. It probably would have took me a year or two, maybe two years,to get what I’m getting now.” (Quote from a KII with an Alternatives Waiver consumer)
“… [W]e like to see the paperwork go through the system [so] our social worker staff will make calls and make sure it goes from here to here to here, because we certainly don’t want it to get misplaced and us not know … [have it] sit on someone’s desk for months, [so] we try to follow it along.” (Quote from a KII with a provider of services to adults with developmentaldisabilities.)
“…[T]hey took me out of the hospital, they took me in the convalescent center…I didn’t figure I’d ever come home. And the therapist told me…, ‘Don’t give up ’cause we’re gonna get you out of here.’ I said, ‘You think I could go home?’ And they said, ‘Yes.’” (Quote from a KII with an ElderChoices consumer)
68
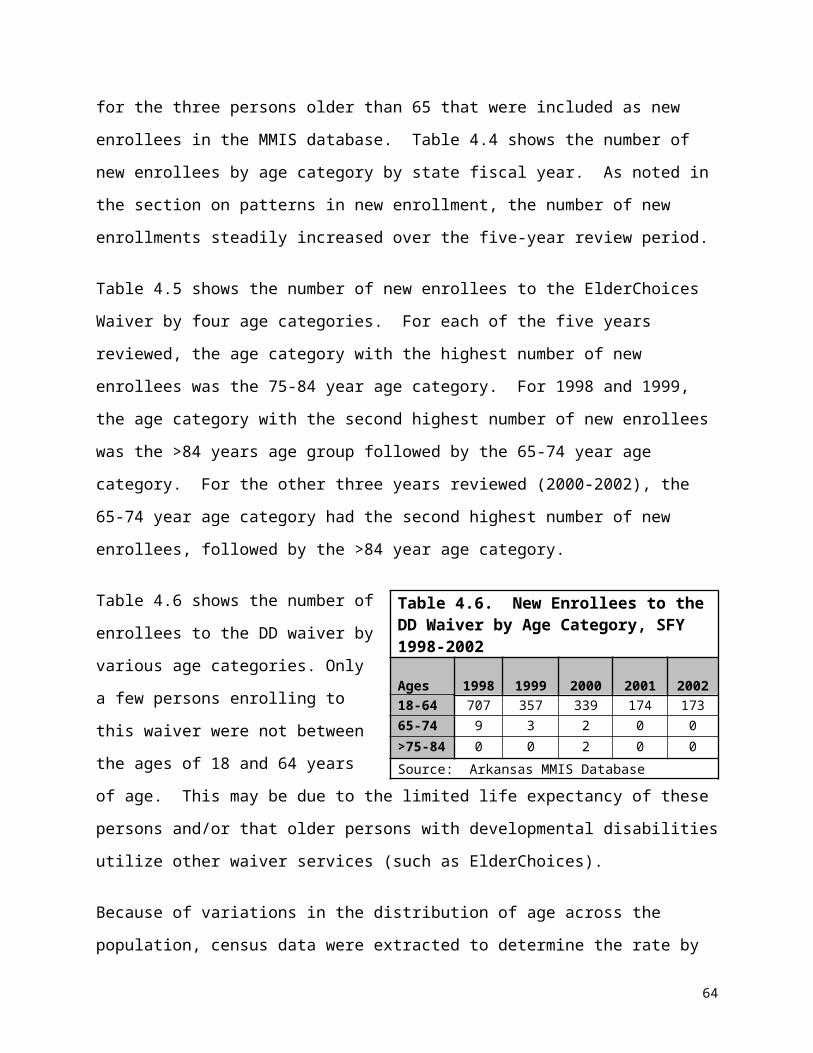
RECOMMENDATIONS Involve advocates and consumers in policy development aimed at system
change through forums and more balanced representation on decision-making
bodies that set LTC policy.
Improve consumers’ access to information about HCBS.
(We have devoted a separate chapter to this topic, because it comprises an important
area of our study findings and recommendations. See Chapter 7, Information
Dissemination and Counseling.)
Discussion of RecommendationsThe inequities between H/CB and institutional services and the impact on consumers,
as reported here, are not unique to Arkansas. Tonner and Harrington, in their study of
criteria used for determining need for LTC, note how differences in screening
procedures used for nursing homes and HCBS create bias and unequal access to
services.clxi Specifically, they state:
“The use of more stringent criteria, stringent methods of determining need, and longer forms for HCBS may make access to community care more restrictive than access to institutional care. Moreover, these HCBS procedures may require additional time, duplication of efforts, and be administratively cumbersome.”clxii
In another study documenting assessment methods used nationwide, Tonner and
Harrington found that only three states used a common application form for all LTC
services. This study concluded that most states used complicated and duplicative
screening and assessment procedures, which created a barrier to access for HCBS.
Addressing System Barriers. In Arkansas, efforts have been initiated to eliminate
system inequities that act as barriers to HCBS. These initiatives, as well as others on
69

the federal level, should be supported. For example, one of the top 10 priority
recommendations of the Governor’s Integrated Services Task Force (GIST) was to
reduce the response times for obtaining home and community-based waiver services.
Among their recommendations to accomplish this was the development of a fast track
pilot program for establishing eligibility for HCBS.clxiii In December 2004, the Division of
Aging and Adult Services launched a pilot program to test this concept in a Pulaski
County hospital and is exploring the possibility of expanding it to two other Pulaski
County hospitals as well as community service providers. Should this program prove
successful, it should be replicated in other hospitals throughout the state.
Presumptive Eligibility. President Bush’s Fiscal Year 2006 budget includes a
provision that would allow states to offer presumptive eligibility for home and
community-based waiver services as an option for institutionally qualified individuals
who are discharged from hospitals into the community. This proposal is aimed at
increasing the number of Medicaid beneficiaries who receive HCBS and is seen by the
administration as having no associated increased cost.clxiv The state should monitor this
item in the federal budget, and if approved as a state option, adopt it as a means for
increasing access and leveling the playing the field for HCBS.
Reassessment.
The DHS should continue to study the cost-effectiveness and consumer benefits of
face-to-face assessments and counseling by an independent entity prior to entry into an
institution. Similarly, equalizing the requirements for periodic reassessments of all LTC
recipients should be explored. Currently, there is no required period of re-evaluation of
nursing home residents, but rather the Office of Long-term Care determines each case’s
re-evaluation date, for which the provider must submit justification for continued
institutionalization. In contrast, annual reassessments are conducted annually by DHS
for all waiver service recipients. A policy change is currently being considered that
would relax the requirement for annual reassessments for some HCBS consumers with
chronic conditions.clxv Because these consumers’ need for services does not diminish
70
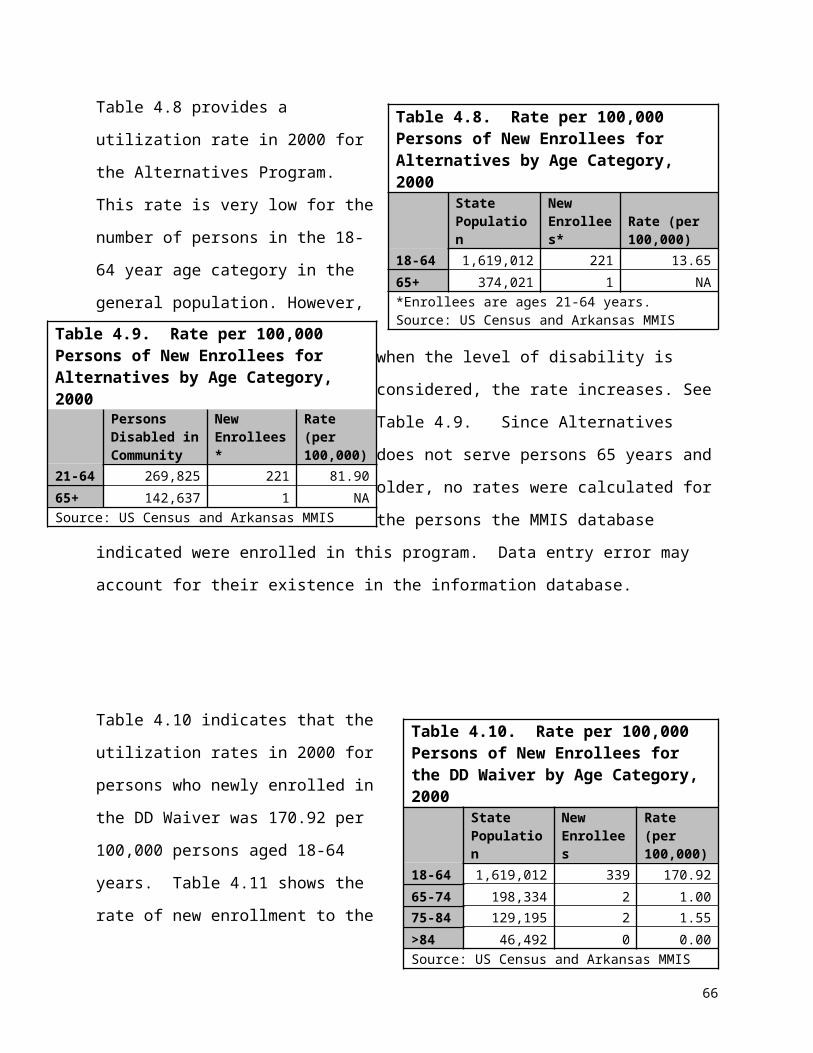
from one year to the next, conducting these reassessments on an annual basis may not
be the most efficient use of staff. Therefore, review of this policy is recommended.
Were DHS to explore more cost-effective ways to administer consumer reassessments,
one option would be to study using MDS data for nursing home consumer
reassessment.
Miller Trust Option. One policy change that can easily be implemented to improve
access to HCBS is to extend the Miller Trust option to those seeking HCBS. In some
states, if a person who needs nursing home care does not qualify because his or her
income exceeds the limit, he or she can establish a Miller Trust in order to qualify. The
trust, authorized by legislation passed by Congress, can be used to cover specific costs
such as support of a spouse still living in the community. The remainder of trust funds
must be used to pay Medicaid, either annually or at the death of the beneficiary. Some
states, including Texas, allow Miller Trusts for eligibility of HCBS. Arkansas allows this
option for those desiring nursing home care, but not for those interested in home- and
community-based waiver services.
Spousal Impoverishment. In Arkansas, inequities also exist regarding spousal
impoverishment, or “spend down,” provisions for the various LTC services. It is offered
to applicants to nursing homes as well as two waiver programs, ElderChoices and that
for adults with developmental disabilities. However, Alternative waiver consumers are
not entitled to the same.
Arkansas is not alone in having unequal access to this mechanism for increasing
financial eligibility for services. A study by the National Academy of State Health Policy
in 1996 revealed that only 15 states allowed individuals to “spend down” their incomes
to gain Medicaid eligibility for HCBS, while 29 states permitted such options only for
persons seeking nursing home eligibility.clxvi This study also reported that only 34 states
protected spouses of HCBS waiver recipients from impoverishment, whereas spouses
of nursing home residents are protected from impoverishment by law in all 50 states.
71

Efforts should be made to rectify this inequity among the waiver programs and to extend
the Miller Trust option and protection from spousal impoverishment to all HCBS
consumers.
72

Chapter 7Information Dissemination and Counseling
Perhaps the most consistent finding coming out of the primary data collected in this study
was the crying need of consumers and those providing informal support to have access to
information about the home and community-based services (HCBS) available and
counseling on how to access the services most appropriate for their needs. This theme
resonated with the theme of an unlevel playing field described in Chapter 6 in which
information about institutional care was clearly described as available and easy to obtain.
This was in contrast to the many difficulties respondents described in finding out about
HCBS options available to meet their needs.
This section describes three overarching key findings related to information and
counseling needs. Specifically, many respondents reported that information about
HCBS is difficult to obtain and traditional sources were sometimes unhelpful. In
addition, these data indicate that while physicians often played an influential role in
service decisions, their impact was decidedly weighted toward institutional care.
Findings presented are those for which programmatic and policy changes are most
likely to have an impact. The quotes chosen for presentation are among the most
illustrative of the findings they support. (Please see Chapter 2 for a fuller description of
the data sources and analysis methods.) To protect the identity of study respondents,
gender is concealed by random assignment of gender-specific pronouns and
pseudonyms in quotes and other text describing cases.
Recommendations were developed in the context of these findings with input from the
Advisory Working Group (AWG) and through reviewing the published, as well as
unpublished, literature for recommended best practices. Recommendations are made
for each key finding and discussed at the end of this chapter.
73

KEY FINDING 1: Many respondents used multiple, informal sources of information about long-term (LTC) services instead of going to one formal source to get answers about care options.
Many respondents seeking information about LTC options relied on multiple sources,
either because they did not know how to access the formal system, or the formal
system lacked information about the services they were seeking. Those information
sources included family and friends, co-workers, health care and social service
providers, as well as past experiences with LTC services. The Internet and news media
were mentioned by very few respondents as usual sources of information about LTC.
For nursing home care recipients, obtaining information and making arrangements for
services seemed to be a relatively straightforward process, whether family decision-
makers handled everything or had the help of a social worker or other provider. Finding
out about HCBS, however, was often described as a circuitous, haphazard, and difficult
process for study participants seeking such care. The difficulty respondents
encountered is apparent by the variety of information sources employed as they tried to
inform themselves about services: A total of 20 different sources were cited by those
who sought HCBS, compared to 10 total reported by users of nursing home care.
A lack of readily available information about the LTC system and how to access it was
reported by some respondents:
“I work in Head Start and I’m considered a social worker, so I have a little bit more resources that I can call. … You know, pick up a telephone book and try to find something in the telephone book, but you know …you don’t see nothing on TV, you don’t hear nothing on the radio about living arrangements for the elderly or nothing like that.” (Quote from a key informant interview [KII] with a relative of a nursing home resident)
Others reported frustration in trying to link up to the appropriate agency:
74
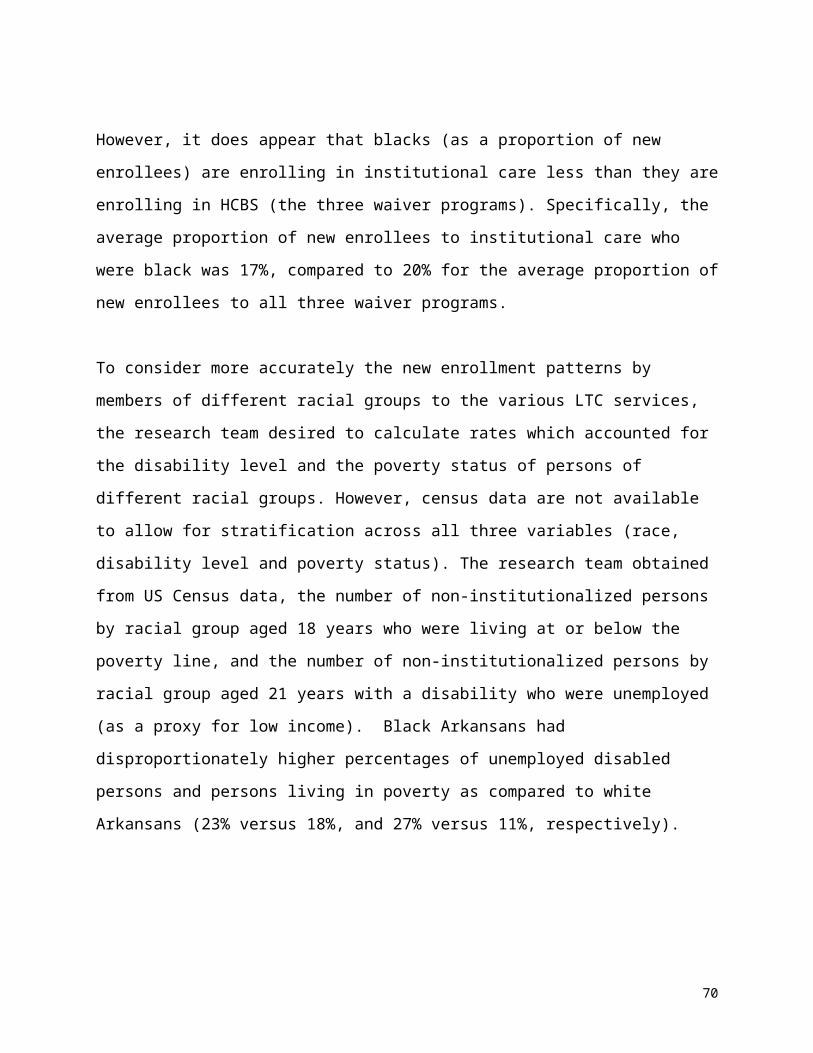
“… I was just needing some help with him and, and so I tried, and youknow, you just and seemed like a lot of the times I just chasing myself because some of them would even refer me back to where I had already been.” (Quote from a KII with a relative of a Developmentally Disabled
Waiver consumer)
This quote illustrates the approach used by some consumers to get information about
services:
Interviewer (I): “… [W]hat [is] the main way that you obtain information about services and look into programs?”
Respondent (R): “… [P]artly through the Internet, I have learned to utilize that. … I know advocacy organizations like … Pathfinders … [P]eople like that are a good source … to tap. If one doesn’t know, … I keep looking … [T]he best source is other parents, but again, for adults [with developmental disabilities] … When I was checking
about [her son’s] replacement wheelchair, the guy who was fitting his
wheelchair has a handicapped daughter and was telling me how they funded her van, so that you know, again, that’s where you get your real information.” (Quote from a KII with a relative of a Developmentally Disabled Waiver consumer)
RECOMMENDATIONS: Educate the public about HCBS options and related resources:
Use a multi-pronged approach aimed at many outreach channels and
points of access to reach the largest audience possible.
Use established networks, agencies and organizations where contact with
those in need of services is likely, such as government offices, senior
volunteer projects, religious centers, legal and other advocacy
organizations, and housing projects.
Advertise the DAAS/DDDS www.argetcare.org website and toll-free phone
line.
Display information about these resources in the Helpful Numbers blue
book pages phone directories statewide.
75
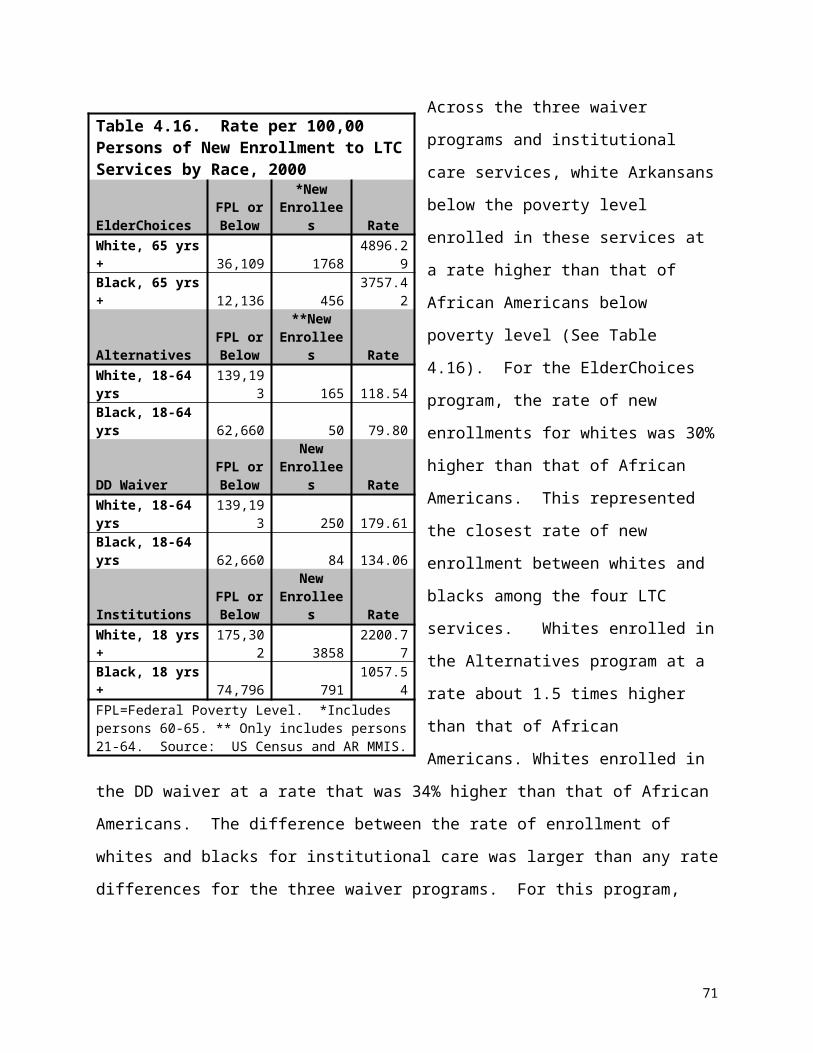
Consider revisions to the DHS/DAAS State Office listings to make it easier
for consumers to identify the appropriate agencies.
Explore community outreach services that use lay workers and counselors to
help consumers, especially those of underserved populations:
get information and access to LTC services, and
navigate the LTC service system.
KEY FINDING 2: Many respondents reported that formal sources were sometimes not helpful in providing the information they sought about HCBS.
Many consumers of HCBS reported that they had difficulty getting information about
HCBS or that they found the application process confusing, whereas few consumers of
institutional care reported this problem. The following is a quote from an interview with
a disabled individual. He reported that he was in contact with DHS for a year before his
caseworker told him about the Alternatives Waiver.
R: “I mean you know, nobody had ever mentioned that [and we] came in before for over a year … When we went to Ruth5 up there that day, I had an appointment up there that day. And [S]he just you know, she mentioned it, you know, while we was sitting in there … [S]he had some more papers for us, and [Mother] just casually kind of mentioned, ‘I’m tired you know, I’m having to go over there and help him you know. my son’s are going by, my daughter’s going by, their wives are going by and we just …’ [A]nd you know, it wasn’t really so much saying, ‘We need help,’ it’s just she mentioned … and finally [the caseworker] said, ‘We can get you help for where it won’t be so hard on you.’”
I: “Was that the first time anybody had ever…?”
5 Not real name.
76
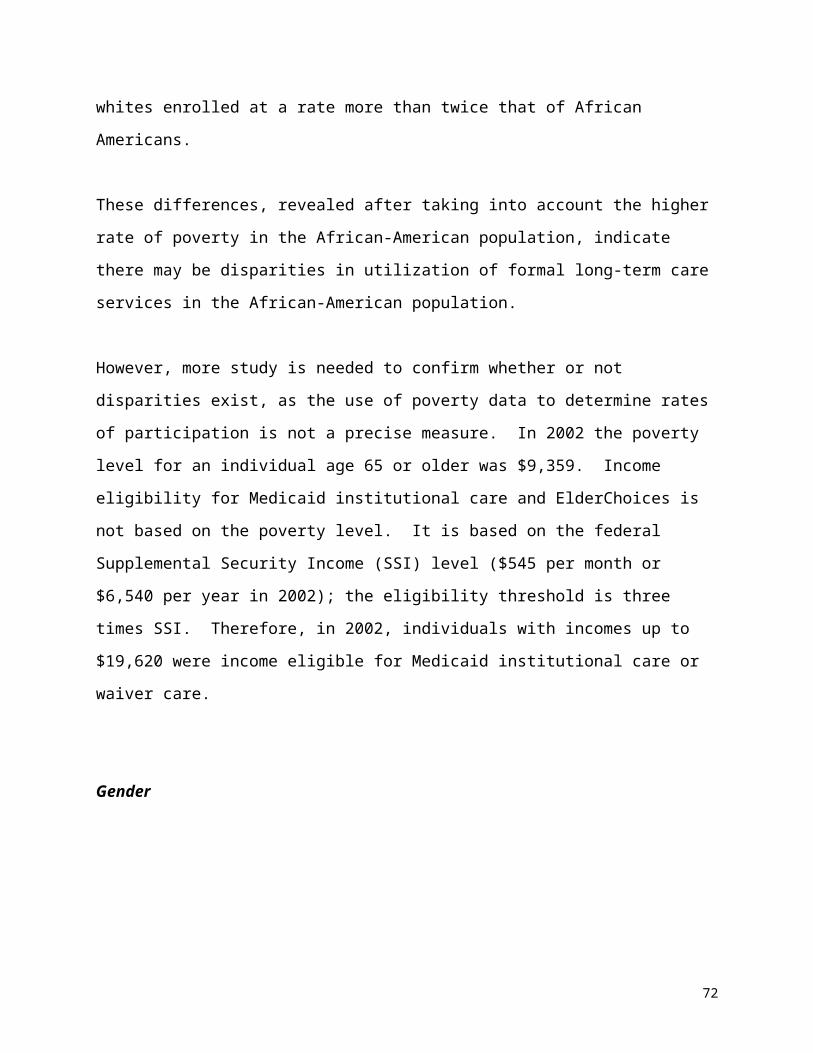
R: “That was the first time anybody [came] and was talking to me, it was a year ago, little over a year. She said, ‘They should have notified [you] February of last year … when you went in [to] help get your bills paid and all this and why they didn’t notify [you]? We could have been helping you the whole time.’ Nobody said a word. I mean not one word about ‘there’s a program we can get you on.’” (Quote from KII with an Alternatives Waiver consumer.)
Although a few recipients of HCBS commented on the helpfulness of Arkansas
Department of Human Services (DHS) field office workers, just as many said that DHS
workers were unaware of, or unable to explain, waiver program options to them. They
complained that they filled out forms, but they – and the DHS worker – did not
understand what they were applying for. In the KII interview excerpt below, a consumer
and a relative relate their conversation with a DHS worker about the Alternatives
Waiver.
Respondent (R) 1: “… [The DHS worker] said, ‘Well who is this, what is it?’ Well, I felt like she should know, because she’s the one [who] gave me the paperwork.“ R2: “They didn’t understand it either…”
Interviewer (I): “The Department of Human Services themselves did not know?”
R1: “No, they did not ... They didn’t know how to explain it or didn’t know what they had. That’s true.” (Quotes from KII with an Alternatives Waiver consumer and a relative)
The same participants made the point that other providers outside the formal social
services system lack the knowledge about waiver services and other issues related to
HCBS:
R: “The free clinic in Smithville6 – they’re great people, doctors and nurses and everybody giving their time and doing it
free. Well that’s great, but they, they need to understand there are other places these people can go that need some help, they may not know about. And this is one of things that I think they need to know.”
6 Not real name of place.
77
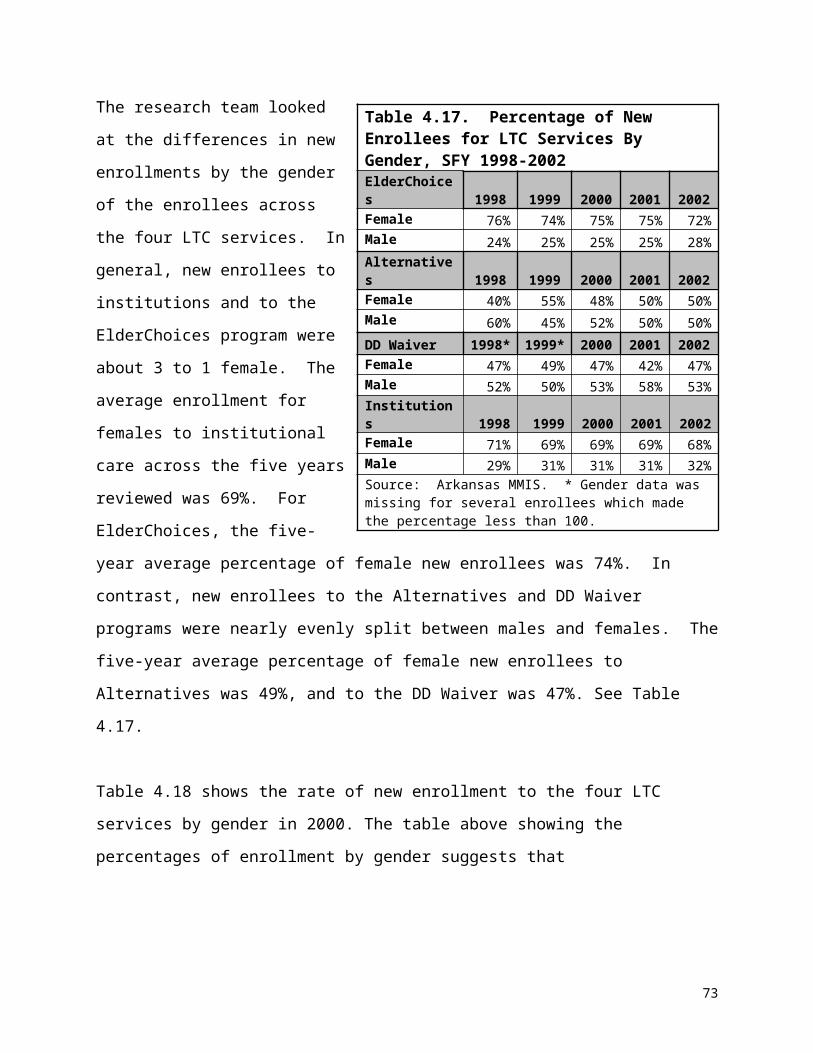
I: “About the Waiver services.”
R: Right. Because they didn’t understand it. Even my druggist didn’t understand it when I told him I could get six prescriptions with my Medicaid. He said no, only three, I said no, six. We had a little discussion about it, he didn’t think I knew what I was talking about, but I did. He’d never heard of it before …” (Quote from an Alternatives Waiver consumer)
Here is a quote from an individual with a physical disability, describing her frustration
with not being able to get, from a DHS office, a comprehensive understanding of all the
LTC options available to her – and her suggestion for improvement:
“ … [R]eally it’s lack of knowledge … me and my [relative], we didn’t know of any other programs to apply for. We went down to …the office down there and apply for the main, the basic Medicaid. So it’s not like you can go down there and choose different – they don’t have like a big information center that says, ‘We’ve got all these programs, which one fits you?’ They don’t have that. You go down there, and you file for basic Medicaid, then when you’re denied that,you’re asking your caseworker, ‘Hey, what can I do?’ If they, theyhad a big bulletin down there with 60 different things you could applyfor, based on say, say 10 items that fit your profile, you would knowwhat to apply for.” (Quote from an Alternatives Waiver consumer)
RECOMMENDATIONS:
Educate DHS field office workers about waiver programs. Promote their use of
the DAAS/DDDS www.argetcare.org website, toll-free phone line, and printed
materials that explain the waiver programs and other HCBS.
Educate social service providers (e.g., hospital social workers, discharge
planners, various agencies that serve the elderly and adults with disabilities)
about the viability of HCBS options, as well as related resources. Promote use of
the DAAS/DDDS www.argetcare.org website, toll-free phone line, and printed
materials on the waiver programs and other HCBS.
78
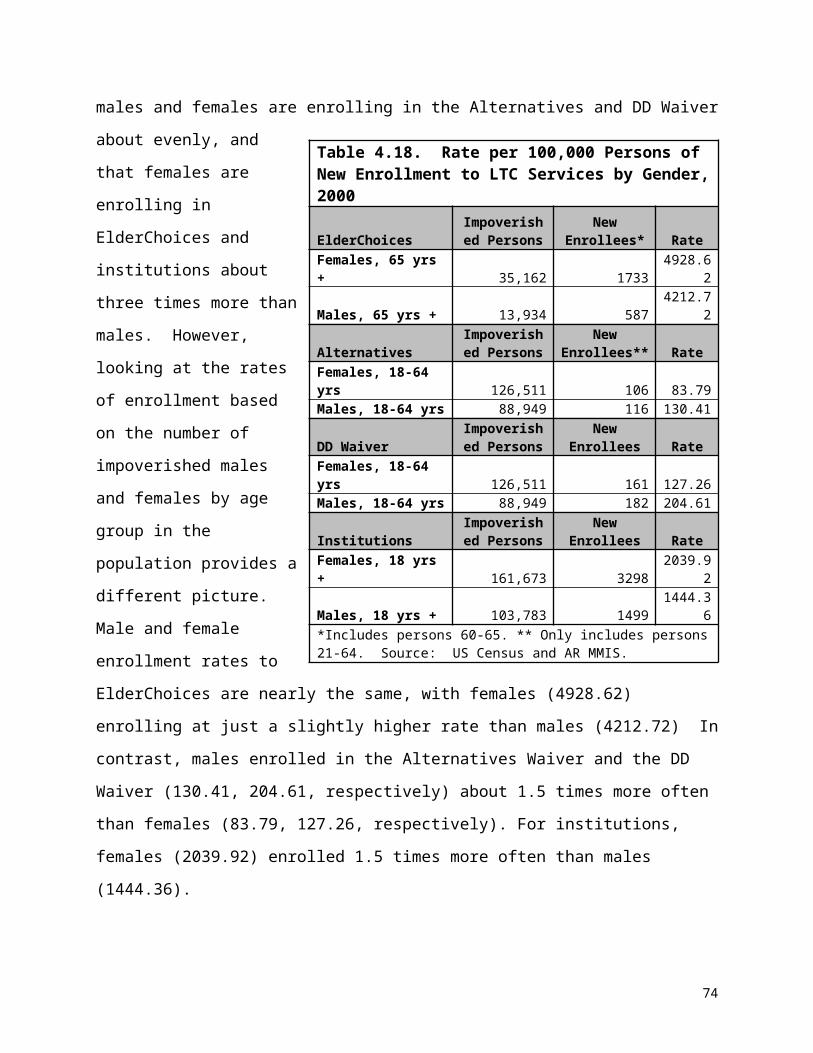
KEY FINDING 3: Physicians played an influential role in decision making about LTC, but not for accessing waiver services.
Physicians often played an influential role in consumers’ decisions about the LTC option
they chose. Most cases reported that their physician was in some way involved in the
decision about services. In a few cases, respondents named the physician as the most
important person in the decision, outside of the immediate family. However, the data
strongly suggest that physicians’ knowledge about HCBS was limited to Home Health
Care. In the vast majority of cases in which the physician did make a recommendation,
it was for nursing home care. No case reported that the physician was a source of
information about, or recommended, a waiver program.
“We don’t know about a lot of these services, and that’s nobody’s fault – well, maybe it’s our fault, but if we don’t know about them, we are going to be less apt to begin a service that we are not even familiar with. …I utilize our Area Agency on Aging. … If I had to do that on my own, if I didn’t have them to do that for me, there would be a lot of patients that wouldn’t get anything …” (FGD quote from a physician)
“… I think we have neglected to educate our physicians, our hospitals, even our social workers, our discharge planners, our community organizations. They know, ‘You go from the home to the nursing home.’ They don’t know in between … they have no clue what the resources are, how to get them, who to call, period.” (Quote from a Focus Group Discussion [FGD] with a provider of services to the elderly)
RECOMMENDATIONS: Implement multi-faceted promotions of sources of information, about LTC
services to physicians, nurses, and their support staff, including:
the DAAS/DDDS www.argetcare.org website
79

toll-free phone line
display of information about these resources in the Helpful Numbers blue
book pages phone directories statewide.
Educate physicians, nurses and their support staff about the full array of HCBS
through multiple approaches, such as:
presentations at state and regional meetings of the Arkansas Foundation
for Medical Care and the Arkansas Medical Society;
continuing medical education courses; and
academic detailing as is offered by pharmaceutical companies on the
options available.
DISCUSSION OF RECOMMENDATIONS
By virtue of the fact that nursing homes exist in many communities and are visible,
obtaining information about nursing homes is relatively easy. Local nursing homes can
easily serve as the first point of contact for information about services and the
application and eligibility process. With that initial nursing home contact, a consumer
can be directed to other resources or agencies that may be needed in making
arrangements for admission. In contrast, information sources for HCBS can be hard to
locate and arranging for services often is a fragmented process. This is true because, in
part, assembling the full of complement of services that an individual needs may require
accessing more than one program. However, the way for the consumer, and those in
the role of assisting them, could be smoothed by simplification of what it takes to get
information, augmented by outreach so that consumers – and providers – know where
to begin the process. One-stop and easy-to-access information sources for consumers
and providers; outreach, public promotions, and education of providers; and use of lay
workers to inform and counsel those seeking LTC services all have potential to improve
access to HCBS options.
80
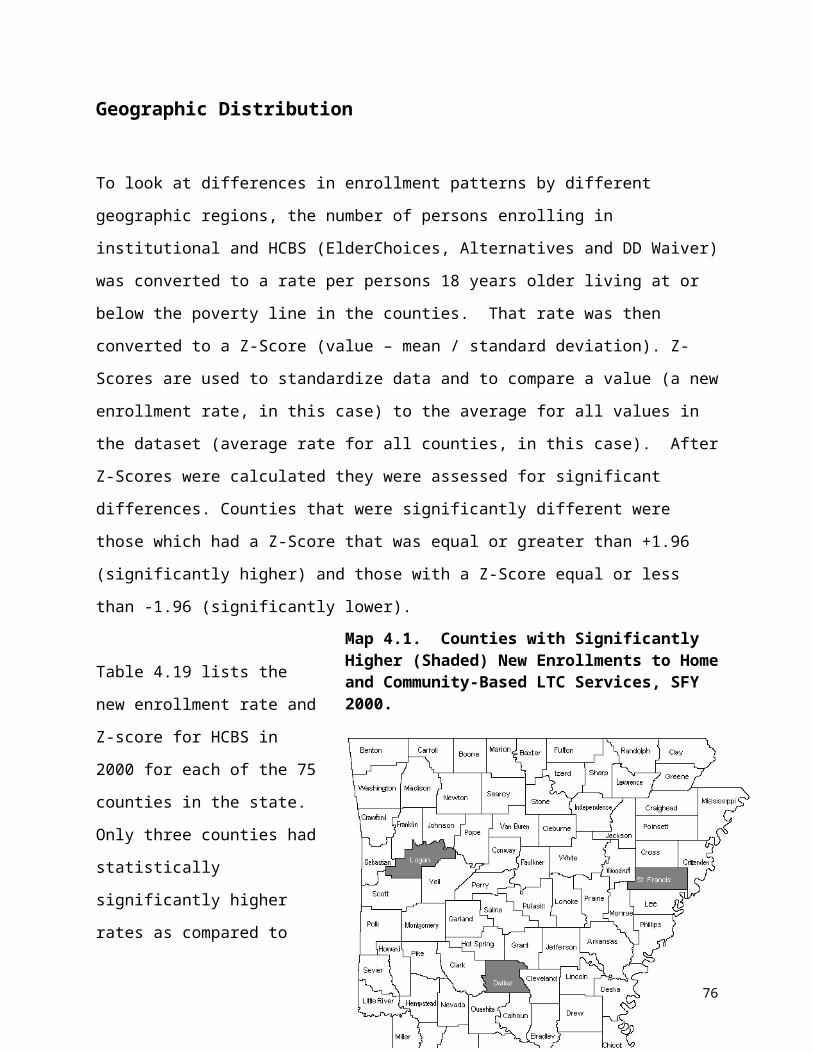
Using Information Technology. Even in this digital age, the telephone is often the
way people get information when they are seeking specifics about social services and
eligibility, and our data support that. Therefore, telephone directory listings – both the
Helpful Numbers/Blue Pages and the State Offices NEW listings – should be as user-
friendly as possible so that consumers can easily locate the agency that has the
services they need. Consumer input in designing and evaluating these services could
be of great value.
The DAAS/DHS www.argetcare.org website is a useful, but most likely underutilized
resource for information about HCBS available. Though it has been available for some
time, it has not yet been officially launched, much less evaluated.clxvii This resource
should be finalized, promoted to the public, and its impact assessed. The low number
of study participants who reported using the computer as a source of information about
LTC services may in part be a function of low public awareness that the website exists.
With sufficient promotion and advertising, the site may become a popular tool for
consumers with internet access. It offers a self-assessment tool that enables
consumers to be directed to the appropriate link, based on circumstances and need,
rather than having to randomly surf the site. Certainly the website should be vigorously
promoted to health care and social service providers as a one-stop resource and link to
related sites.
Direct Outreach. Many Arkansans who need to be connected to LTC services are
without a computer – or in some cases, even a telephone – or may lack the literacy
skills to independently gather information from social service agencies. Lay workers
can step in to fill the information gap for those who may otherwise have difficulty
accessing the LTC system and to reach underserved and minority individuals who may
have less trust in the traditional social services and health care system. Early findings
from a five-month lay worker pilot project in the Arkansas Delta shows promise as a
model to pursue. Lay outreach workers called Community Connectors linked people
with needed health and social services, especially long-term HCBS. Using only five
workers, this pilot was able to divert from, or transition out, 11 persons from nursing
81
homes.clxviii A Robert Wood Johnson Foundation funded three-year demonstration using
this model is scheduled to be implemented in May 2005. An evaluation of the cost-
effectiveness of this model demonstration will be conducted by the UAMS College of
Public Health. Data from this study should shed light on the impact of lay outreach
workers in linking persons to HCBS and reduce unnecessary institutionalization.
Several other states with CMS grants now employ lay workers, also known as “peer
counselors.” Wisconsin, in its 2001 Nursing Facility Transitions State grant, had a
provision for “increasing the availability of peer counseling for consumers, guardians,
and families to help them when making decisions regarding community placement and
adjustment.”clxix New Hampshire, in its 2001 Real Choice Systems Change Grant,
provided “education, peer counseling, and outreach [about consumer-directed services]
to persons with mental illnesses.”clxx And Maryland, in its 2001 Nursing Facility
Transitions Independent Living Center Grant, provided “face-to-face peer counseling
sessions with individuals interested in learning about community options” and
“developed a peer counseling relationship for those who wish to discuss concerns and
fears about transitioning.”clxxi
Lessons Learned from Survey of States’ Approaches. Traditional approaches to
public outreach can also be effective in raising consumer awareness about LTC options,
both institutional care and HCBS. A survey conducted in 1998 to explore methods used
by states to educate and enroll eligible Medicaid beneficiaries for dual Medicaid benefits
yielded some lessons that may also apply to outreach about long-term care services,
especially those for older persons: 1) The survey, to which 42 states responded,
showed that most states used a combination of materials and approaches to educate
consumers, and that most techniques (described below) proved to be moderately
successful; 2) the stigma commonly associated with programs for low-income persons
should be considered when designing outreach programs. States reported that
potential beneficiaries are reluctant to discuss program benefits and eligibility
requirements in front of peers; 3) partnerships with other service providers and
organizations, which may involve creation and well as distribution of materials, enhance
82

effectiveness of consumer outreach; and 4) many states reported making the
application process easier and more convenient by increasing the number of sites
where application could be made.clxxii
The outreach methods most commonly reported by states are highlighted below. The
average cost of all of these approaches was reported under $10,000 with the exception
of the toll-free line, for which the average cost was $25,000:
Eighty-two percent of states used brochures, information sheets and posters to
inform consumers. Brochures and posters disseminated at government offices,
presentations, and mailings were regarded as inexpensive but only moderately
effective. States reported that use of brochures and posters was only effective if
combined with other techniques. A small number of states that experimented with
inserting flyers into utility bills rated the method as highly effective.
Sixty-four percent of states reported using direct mail. Effectiveness scores for
direct mail methods varied widely across states – from extremely effective to not
at all effective. Despite the advantages of relative low cost and wide reach, most
states did not find that there was a significant increase in eligibles after a direct
mail campaign.
The 33 percent of the states that published notices in newspapers or other
publications rated the approach as relatively low-cost. The impact was not
always significant but moderately effective overall.
Periodic or one-time direct mailings to providers were employed by 27 percent of
the states. The method was rated as moderately effective and relatively low-
cost.
Presentations were used by 15 percent of states. States reported that the
positive effects of such an approach are not always immediately evident but
favored it as a way to have direct dialog with consumers.
A number of states reported having a toll-free line, but only two of the 42 states
participating in the survey reported using it for outreach, but rated it as highly
effective.
83
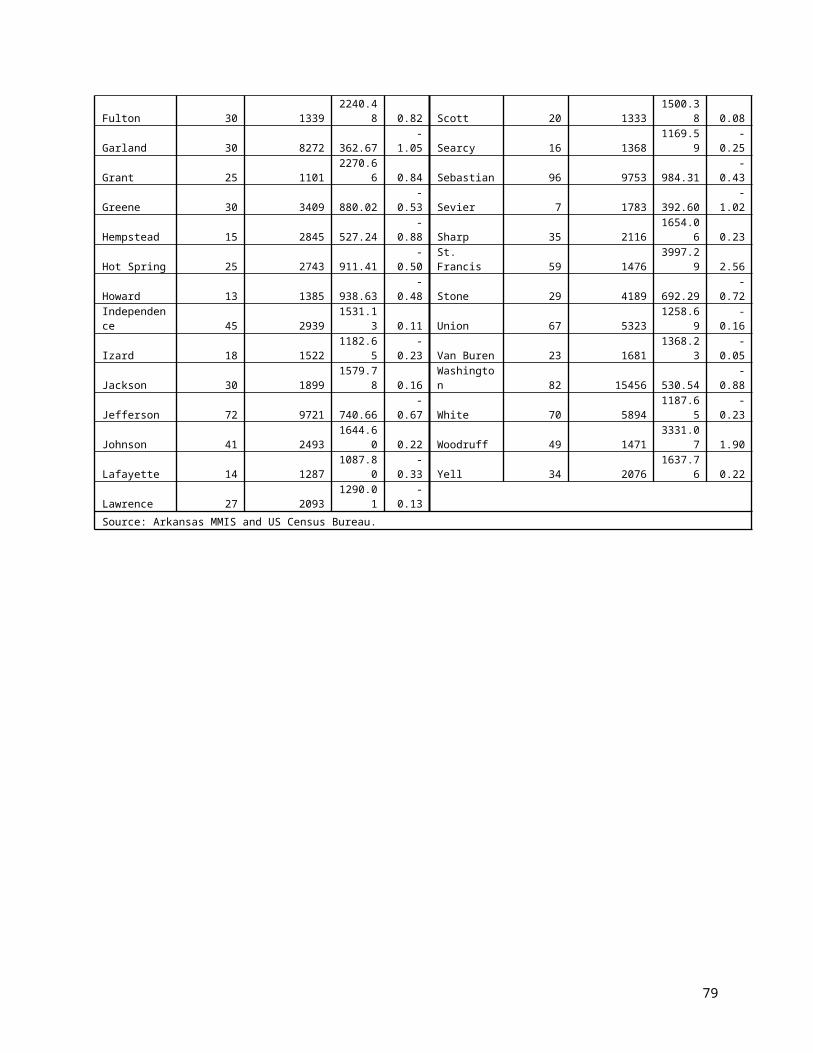
Other methods were tried by states to reach potential dual eligibles. A few states
conducted targeted mailings, with application forms enclosed, to participants in
other programs for older citizens and rated this method as highly effective. Some
states had information posted on web sites but felt that this was a poor way to
reach older people. Radio and television public service announcements were not
rated highly because there was no control over broadcast times, which tended to
be hours when audience levels were low.
Other recommendations from the state survey included:
Test market materials with focus groups matched on age and income of target
population.
Be concise and use fonts and colors that are easy to read and appealing to older
persons.
Design materials to target not only potential recipients but also family members.
Use a multi-pronged approach aimed at many outreach channels and points of
access to reach the largest audience possible.
Use established networks, agencies and organizations where contact with elders
is likely, such as government offices, senior volunteer projects, religious centers,
legal and other advocacy organizations, and housing projects.
An important key to better information dissemination about LTC options is continuing
education of those who serve the elderly and adults with disabilities. Groups that need
to be targeted include physicians, nurses, their support staff, pharmacists, DHS field
office workers and others employed by state agencies and private, non-profit social
service organizations, and hospital discharge planners and social workers. Public
schools that serve students with disabilities also need information about LTC services
and resources.
Making the public and providers aware of HCBS options is a challenge when so much is
competing for their attention. Keeping them apprised of policy and program changes is
a constant demand on limited state resources. But the investment can yield significant
84
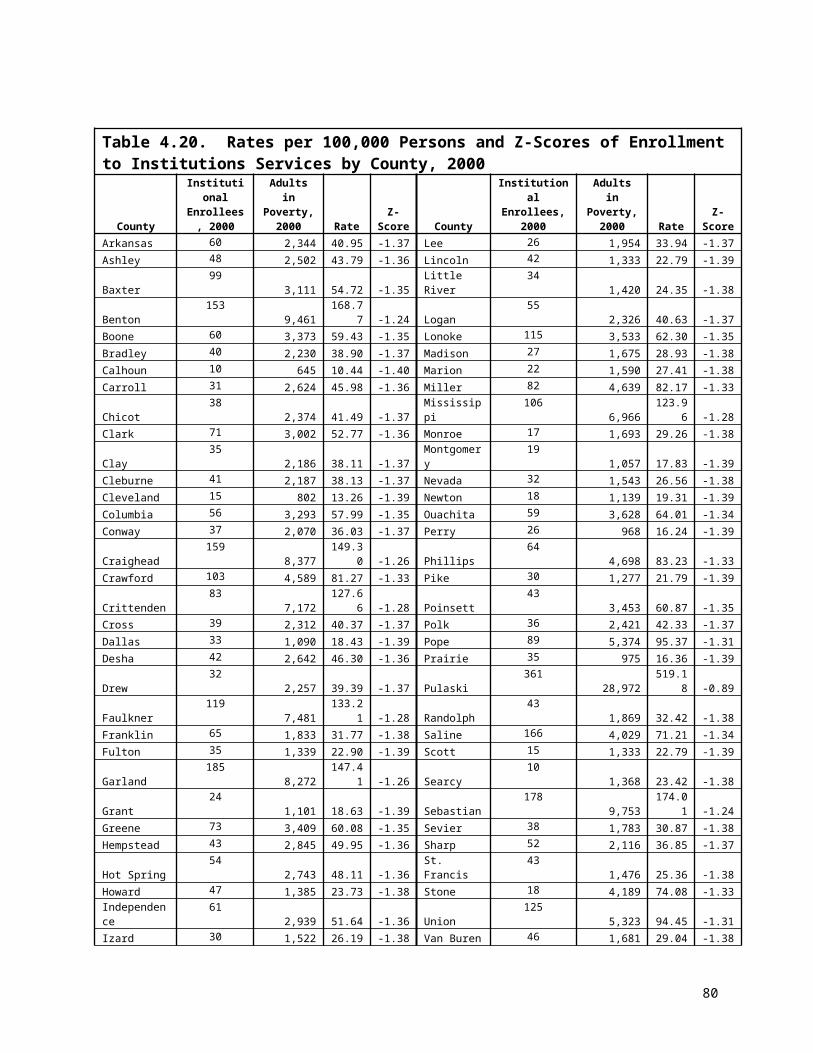
savings in the long term and improved services to Arkansas’ elderly and adults with
disabilities. “The price of a hasty or uninformed decision about long-term care
alternatives is often the independence, dignity and health of oneself or a loved one.”clxxiii
85

Chapter 8 Improving Services to Meet Unmet Need
The third theme threading its way through our respondents’ narratives was a call for
expansion of available home and community-based services (HCBS) and increased
flexibility of waiver services. The need to improve services is illustrated by stories of
individuals who, in order to remain at home, needed more intensive services, but required
less than the around-the-clock care of a nursing home. Others needed assistance with
administering medications or environmental enhancements beyond what the waiver would
cover. There were also a number of institutionalized individuals who might have managed
well in an assisted living setting.
This section presents five key findings related to the need to improve services by
expansion in three areas: assisted living, HCBS and services for non-elderly,
institutionalized adults with physical disabilities. Findings presented are those for which
programmatic and policy changes are most likely to have an impact. The quotes chosen
for presentation are those that were among the most illustrative of the findings they
support. (See Chapter 2 for a full description of the data sources and analysis methods.)
To protect the identity of study respondents, gender is concealed by random
assignment of gender-specific pronouns and pseudonyms in quotes and other text
describing cases.
Recommendations were developed in the context of these findings with input from the
Advisory Working Group and through reviewing the published, as well as unpublished,
literature for recommended best practices. Recommendations are made for each key
finding and discussed at the end of this section.
KEY FINDING 1: Among study participants, there was an unmet need for assisted living.
86

Many consumers said that they would likely use Medicaid-covered assisted living, if it
were available.
The following quotes are from a KII with a friend of an individual with a physical
disability who was in a nursing home. The friend is responding to being asked whether
she thought the individual would be a good candidate for assisted living.
“… [T]hat would be excellent, that would help out … like you wouldn’t believe … It is so limited, it’s terrible the way it’s limited these folks … I would love to see Chris7 in assisted living. [Chris] would do great, you know.” (Quote from KII with friend of an individual with a physical disability, residing in a nursing home.)
She goes on to express her views on the need for expansion of Medicaid-assisted living:
“…[Y]ou had a system set up where there was like assisted living places for individuals that did not meet nursing home criteria, … but were like on the verge of the money line or whatever the policy was, then they could pay on a sliding fee scale. But there’s not enough places for individuals like [that]. … [T]he people that seem to be disabled … just borderline competent, these are the people that I see suffer.”
RECOMMENDATIONS:Request the Health Services Permit agency to increase the bed need methodology to
allow greater access to assisted living.
Expand the number of affordable assisted living beds available to individuals with low
and moderate incomes, including those who are eligible for the Medicaid Assisted Living
Waiver.
7 Not real name.
87

KEY FINDING 2: HCBS use could be increased through selected expansion of services. The majority of consumers in institutions chose to go into a nursing home, even though
they wanted to stay at home, because they felt they needed 24-hour care. In particular,
respondents who were in a nursing home because of a physical disability (or others
involved in the decision about services) expressed interest in services that would enable
them to return home. Determination of respondents’ actual physical capability to live
more independently was outside the scope of this study. However, in a few cases, it did
seem that institutionalization was not appropriate, for which there are several possible
explanations. Either the crisis that had necessitated placement had passed, those who
made the decision about long-term care (LTC) were unaware of alternative services, or
certain services required to stay in the home were unavailable.
Many respondents, when asked, “What would/does it take for the client to be in a home
setting?” offered a laundry list of needs, some of which were not adequate in HCBS.
These include:
Medication reimbursement, management and administration
Dental care
Creating a disability-friendly environment.
Respite care
The need for medication administration, which largely by state law is allowed only by
RNs, can be the determining factor in whether a person is able to maintain
independence in the community or enters a nursing home.
“Actually so she was about to go back into the institution and literally what saved her is her mother … moved back to the town where she was, and Mom stepped in and Mom was going over to her house everyday and giving her shots. But if Mom had not been able to do that or wasn’t willing to do that, she would have been back in.” (Quote from a FGD with
88
providers of services to the adults with developmental disabilities)
The following is a quote from the foster parent of a former HDC resident describing the
arrangements that had to be made regarding the consumer’s dental care prior to the
transition.
“Danny8 has some ongoing dental issues that we were able to work with even through the pilot and the transition. …__ [T]hat’s one of the downfalls to our system, dental care. It’s very hard sometimes outside a place like this. …So we wanted to make sure that those things were taken care of before she left.” (Quote from a KII with the foster parent of a Developmentally Disabled Waiver consumer)
Getting assistance obtaining various kinds of equipment to make the home environment
handicap accessible was a problem raised by a few consumers or their family members.
“Because see if I can have somebody build me a ramp, then um, he can’t go down steps, like I say, I need two people to help him go down the steps, but if I had a ramp… [W]ell she did call me back about the ramp, and she said that it’s just so many people need them you know. … [S]he said …they said they’s getting around to it, but she said it’s just so many people that need them.” (Quote from a KII with a relative of an ElderChoices consumer)
Families who provide home care for individuals with developmental disabilities often
experience chronic stress and fatigue. The caregiver of an individual with disabilities,
made this suggestion:
“[To have] the option of both nursing facility or group home or just whatever level of care there is outside the home, and that maybe sometimes it’s appropriate for a client to move … away from the home setting and then to move back home, when the caregiver just needs a break for awhile. There needs to be some option – now that we don’t have extended
8 Not real name.
89
families within our community – we need something that meets that need. You know if it could be a facility where a client can check in for six months, or six weeks, or even a week … .” (Quote from KII with the caregiver of a Developmentally Disabled Waiver consumer)
RECOMMENDATIONS:
Give waiver nurses more flexibility to develop individualized care plans sufficient
to keep people in their homes or a community setting.
Train nurses in person-centered care.
Increase flexibility.
Encourage use of individualized care plans.
Adopt policies that afford more intensive HCBS (in hours and range of services)
for certain individuals. For example, ElderChoices nurses should be able to
authorize more than 64 hours of personal care per month without having to
request authorization for increased benefits.
Explore more flexible options to facilitate administration of medications in HCBS
settings:
Examine how the Nurse Practice Act could be broadened to allow personal
care aides and CNAs under RN supervision to dispense medications and
perform non-invasive procedures.
Broaden waivers to permit medication management for chronic conditions
and time extensions for Home Health services.
Make it easier for caregivers to receive increased hours of Medicaid-
reimbursable home and community-based respite services than are currently
available for ElderChoices and DD Waiver consumers.
90
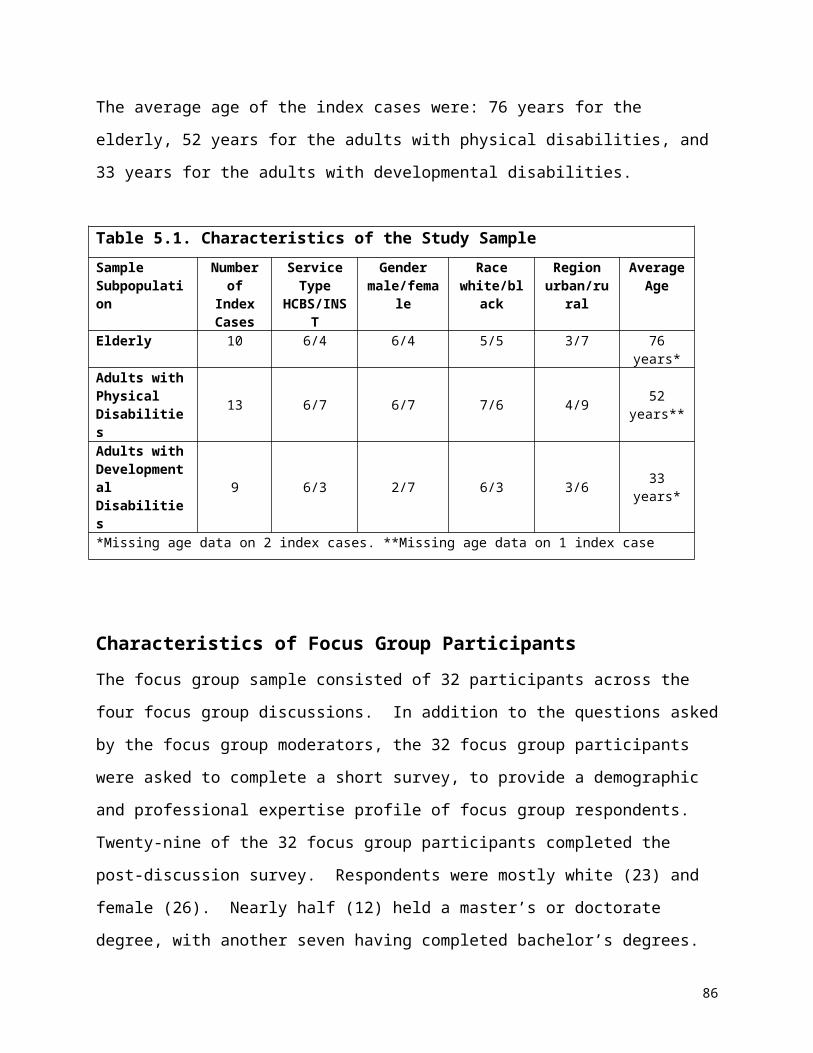
Adopt policies to make respite care a standard, more “intentional” offering of
nursing homes, emphasizing their role in short-term recuperation and respite.
For example, create special respite sections or wings of nursing home facilities
for temporary placement of consumers to reduce apprehension about nursing
home admissions.
KEY FINDING 3: Some of the needs of non-elderly, institutionalized adults with physical disabilities are not being addressed.
A few providers reported that young people with physical disabilities who reside in
nursing homes were not getting their social and cognitive needs met in that
environment.
A few providers also reported that young people with physical disabilities who reside in
nursing homes are often perceived as disruptive by the older residents and staff.
These findings were drawn from both the FGDs with LTC service providers and KIIs
with cases involving young persons with physical disabilities.
“It’s very difficult to meet the needs of some of those residents because you are not used it. You don’t have a lot of the training to deal with the psycho-social needs of the younger person. … Not too many of them want to play bingo and go to certain activities that are geared to the elderly population. … It is difficult for them to be happy in that surrounding, and then it opens up the geriatric population into a whole set of issues when you have younger people in that setting.” (FGD quote from a provider of services to adults with physical disabilities)
“ …Then a lot of family members don’t like to put their family members in those type facilities, but then we have nowhere else to put that population of people.” (FGD quote from a provider of services to adults with physical disabilities)
91

“There’s gotta be programs for people my age and even people 40 or 50. You know, how would I fit in there with a bunch of older folks is my issue? If they had one with younger people, that would be really good, ‘cause you could communicate on your level. …[Y]ou know, if there’s a 50-year gap between me and the other people around me is, it might create a problem. …I don’t want to go around offending anybody, and the same with them you know, they might look at me or the clothes I’m wearing or you know, what hair cut I got, and think, ‘This guy’s weird, he’s strange, he’s crazy, he might hurt us.’ I wouldn’t want nobody to think that about me.” (Quote from a KII with an Alternatives Waiver consumer)
RECOMMENDATIONS: Provide more alternatives to the nursing home for non-elderly adults with
physical disabilities that offer greater independence, nursing and personal care,
and opportunities for interaction with same-age peers, such as group homes and
assisted living.
KEY FINDING 4: A few HCBS consumers reported problems finding reliable, competent direct service workers.
The majority of respondents who used HCBS expressed that they were satisfied with
the care they received; however, a few were not, as illustrated by these quotes:
“And, they cleaned the house, help me take a bath…[T]hey did a good job until she started watching my soap operas and not doing her job. That’s when she got fired … I called the people and told them I need help … and they said they were all tied up, they didn’t have no vacancies … [I]f that lady could have done her job, I probably wouldn’t be here [in a nursing home] today.” (Quote from KII with a nursing home resident)
92
“Of course I’m one of the fortunate ones that I had good help. Not good help, but good helpers that have helped me be able to look to the future. But I’ve seen a lot of men and women that the helpers come in and they weren’t interested in trying to help them live for a future, all they was interested in doing is run in and run out and get their money.” (Quote from a KII with an ElderChoices consumer).
RECOMMENDATIONS:
Explore options for improving wages and benefits for both institution-based and
HCBS direct service workers.
Develop policies to address issues of competency, trustworthiness and reliability
of aides and private HCBS agencies:
Offer training and credentialing for HCBS care aides, reimbursed by
Medicaid.
Require HCBS providers to do background checks.
Discussion of Recommendations
Assisted Living. The Assisted Living Waiver has 395 slots available, 90 of which were
being used as of December 2004. Arkansas is one of only three states with a “high
privacy/high service” model of assisted living—although the service portion is voluntary
on the part of the facility. All new construction must offer private rooms, private baths,
and kitchenettes. Arkansas facilities are permitted to administer medications and
provide limited nursing care, though many other states prohibit this. While facilities are
not required to offer these services, if they accept a waiver client, they are required to
do so. Therefore, a high privacy/high service model does exist for Arkansas Medicaid
clients.
93
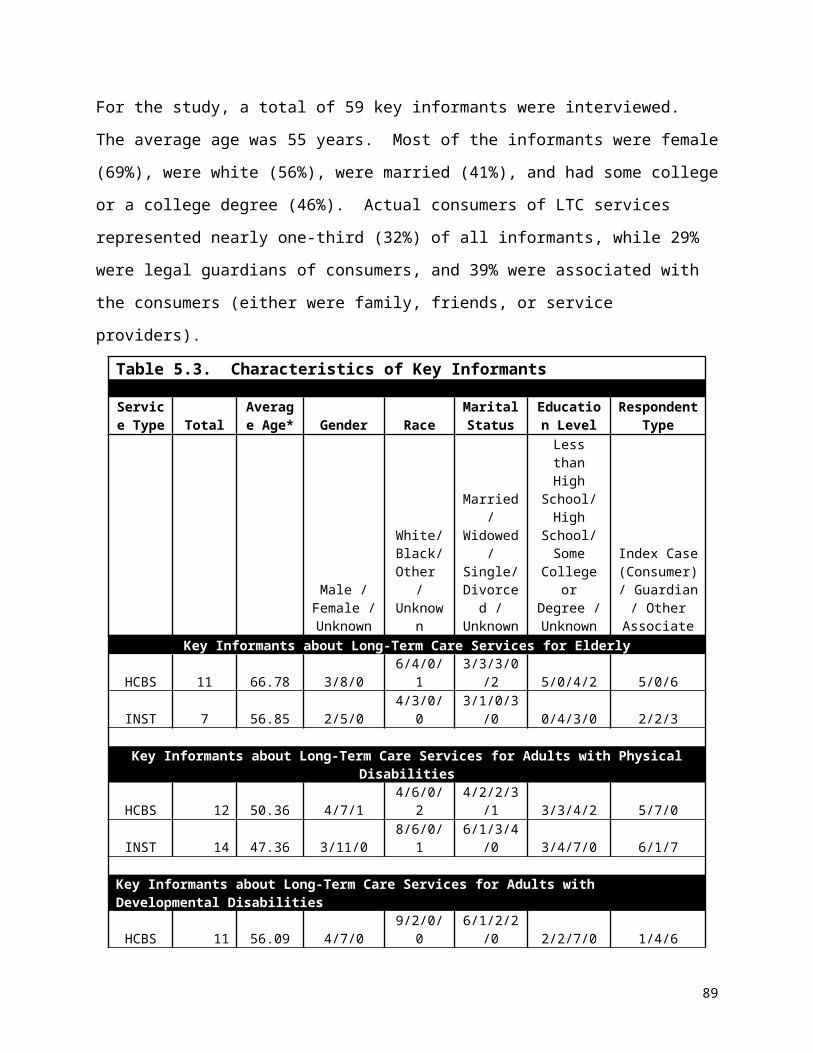
While most of the growth in assisted living has primarily been in the upper and upper-
middle priced market, creating affordable assisted living is much more challenging.
There are numerous barriers to creating affordable assisted living including: 1) limited
financing mechanisms; 2) conflicting state and federal regulations; 3) lack of “mission
driven” entities willing to take on affordable assisted living with its slim return on
investment; 4) lack of knowledge about tax credits; and 5) difficulty selling tax credits for
assisted living.
The need for affordable assisted living is high. An April 2004 review by Health Policy
Tracking Services found that estimates of the average cost of assisted living ranged
from approximately $2,100 to $2,900 a month.clxxiv Most residents are over the age of
75. Almost 62% of Arkansas householders above 75 years of age have incomes of less
than $25,000, making most assisted living facilities out of their reach financially.
The state Permit of Approval (POA) requirement is a potential barrier to achieving
sufficient numbers of beds for Medicaid clients because low service models can
potentially take up these beds without meeting the need for an alternative to nursing
home care. There are currently 1,700 approved beds in Arkansas. While the current
POA methodology is based on 15 beds per thousand, a recently completed study of
Arkansas demand for assisted living estimates the number of beds needed to be two to
three times this number.clxxv The methodology contained in this report shows a net need
between approximately 7,700 and 12,000 units based on population projections for
2004.
Expanding Services. Many consumers in institutions we spoke with in our study chose
institutional care in spite of their desire to stay at home, because they or their family felt
that they needed 24 hour care. It is likely, however, that some of these individuals could
have been served well in an HCBS setting if they had been provided with counseling
and services designed through a person-centered care approach and development of
an individualized plan of care.
94

Person-centered care has been described by Fabiano as a model of care that “focuses
on the value of each individual [and] involves respecting and honoring the uniqueness
of each person and allowing him/her to be involved in decisions that have an impact on
his/her life.”clxxvi Nissenboim describes eight components that are integral to person-
centered care:
“ 1. Upholding the value of the person regardless of the level of functioning.
2. Immersion of interactions in core psychological needs (love, comfort, attachment, inclusion, occupation and identity).
3. Promotion of positive health. 4. Reframing “problem” behaviors as a demonstration of a need being
communicated. 5. Reframing “problem” behaviors as an opportunity for communication
with caregivers. 6. Recognition that all action is meaningful. 7. Hiring of staff who demonstrate emotional availability to persons in
their care. 8. Integrate all elements of positive person work.” clxxvii
Training waiver DHS nurses in these approaches and giving them flexibility and
encouragement to work with consumers to meet the needs critical to their staying in the
community will help to meet a number of unmet needs.
Broadening responsibilities of Personal Care Aides and CNAs. Revising the Nurse
Practice Act was one of the ten priority recommendations of the 115 overall
recommendations made as a result of the Olmstead Decision by the Governor’s
Integrated Services Taskforce (GIST). Specifically, the GIST suggested following the
model established in Tennessee which extended training and licensing of CNAs to allow
them to perform certain tasks to relieve the workload of nurses and protect them from
liability.clxxviii
At the time of the writing of this report, the 2005 Arkansas General Assembly was
considering legislation that would broaden the Nurse Practice Act. Should that
legislation fail, efforts to address concerns and try again in the future should be
undertaken.
95

Direct Service Workers. While the issue of staffing for HCBS was not the focus of this
study, the issues of worker availability and quality of care were mentioned in a few
interviews and are clearly important factors in access and consumer satisfaction, both of
which can impact service use. The GIST Staffing Subcommittee studied this issue
extensively and made recommendations reported in the Arkansas Olmstead Plan.clxxix
They reviewed several initiatives and programs underway at the time of their report to
address recruitment, retention, education and training of direct service workers. The
Division of Developmental Disability Services had a grant with Partners for Inclusive
Communities (UAMS) to implement a recruitment campaign to change attitudes about
care-giving and to train direct support professionals working with persons with
developmental disabilities. The Department of Human Services has a new grant
underway which will continue to work on these issues.clxxx
While recommendations have been made to examine methods to enhance workers’
wage and benefit levels,clxxxi we are unaware of any current initiatives underway seeking
to address this issue.
96

Chapter 9Conclusion
This study was initiated to provide a better understanding of why people in Arkansas
use the long-term care (LTC) services they do. Unpaid, informal caregivers provide, by
far, the greatest amount of long-term support for elderly and non-elderly adults with
disabilities in need of such care.clxxxii,clxxxiii,clxxxiv Many of the findings of this study point to
ways the formal system can supplement the support of informal caregivers more
effectively for those consumers who are eligible for Medicaid reimbursed services.
These findings, and the recommendations to address issues they raise, are described in
detail in this report and summarized in the executive summary and will not be repeated
here. Rather, this chapter is intended to focus on the loose ends not fully dealt with, to
identify study limitations, and to point to further work that may need to be done to
support implementation of the recommendations made.
This study clearly identified physicians as very influential “key players” in decisions
made about long-term care. However, it was outside the scope of this study to explore
the literature concerning the physician’s role, knowledge, and attitudes in these
decisions. More work is needed to examine what intervention research may have been
conducted to determine best practices to improve physicians’ communication of LTC
options to consumers and families, and to broaden their patterns of referral to be more
inclusive of HCBS. Much research has been done to determine the most effective
methods of influencing physician practices related to counseling and referral for other
problems (e.g., depression in primary care). Perhaps findings from these other arenas
could be explored to determine their applicability to LTC.
Regarding improving services, there is clearly a need to expand the scope and flexibility
of services to overcome barriers to HCBS. Policy makers will need to balance the
97
increase in cost inherent in expanding HCBS with the subsequent decrease in long-term
institutional care that will provide resources to pay for improved HCBS. This report has
made several recommendations along these lines. Some actually require expanding
services, while others involve a change in the culture and attitudes of gatekeepers
regarding HCBS options. These latter changes will depend on the extent to which
social service workers are trained, encouraged, and enabled to do so by the system in
which they function.
i AcademyHealth. Glossary of Terms Commonly Used in Health Care. Washington, DC: Academy Health. 2004.ii Davis D, Fox-Grage W, Gehshan S. Deinstitutionalization of Persons with Developmental Disabilities: A Technical Assistance Report for Legislators. Washington, DC: National Conference for State Legislatures. No date. Accessed at http://www.ncsl.org/programs/health/Forum/pub6683.htm#execsum and verified on February 23, 2005.iii Harrington C, Carrillo H, Wellin V, Miller N, LeBlanc A. Predicting State Medicaid Home and Community Based Waiver Participants and Expenditures, 1992 – 1997. The Gerontologist. 2000; 40(6): 673-686.iv Miller B, Prohaska T, Mermelstein R, Van Nostrand JF. Changes in functional status and risk of institutionalization and death. Analytical and Epidemiological Studies. 1993;27:41-75.v Branch LG, Ku L. Transition probabilities to dependency, institutionalization, and death among the elderly over a decade. Journal of Aging and Health. 1989;1(3):370-408.vi Johnson RJ, Wolinsky FD. Use of community-based long-term care services by older adults. Journal of Aging and Health. 1996;8(4):512-537.vii Houde SC. Predictors of elders’ and family caregivers’ use of formal home services. Research in Nursing & Health. 1998;21:533-543.viii Kersting RC. Predictors of nursing home admission for older black Americans. Journal of Gerontological Social Work. 2001;35(3):33-51.ix Bradley EH, McGraw SA, Curry L. Expanding the Andersen model: the role of psychosocial factors in long-term care use. Health Services Research. 2002;37(5):1221-1242.x Kersting. 2001. See Reference 8. xi Dwyer JW, Barton AJ, Vogel WB. Area of residence and the risk of institutionalization. Journal of Gerontology. 1994;49(2):S75-S84.xii Kersting. 2001. See Reference 8. xiii Ibid. xiv Branch and Ku. 1989. See Reference 5.xv Dwyer, Barton, and Vogel. 1999. See Reference 11. xvi Rudberg MA, Sager MA, Zhang J. Risk factors for nursing home use after hospitalization for medical illness. Journal of Gerontology: Medical Sciences. 1996; 51A(5): M189-M194.xvii Black BS, Rabins PV, German PS. Predictors of nursing home placement among elderly public housing residents. The Gerontologist. 1999; 39(5): 559-568.xviii Pearlman DN, Crown WH. Alternative sources of social support and their impacts on institutional risk. The Gerontologist. 1992; 32(4): 527-535.
98
This report reinforces the need for other policy changes that have been on the table
again and again in the past such as the need to broaden the Nurse Practice Act, the
need to improve wages and benefits for direct service workers, and the need to improve
the competency and reliability of such workers. While not a formal recommendation of
this study, it is clear that as HCBS expand, regulatory oversight and quality
improvement activities will be needed to assure that consumer health and well-being
outcomes are positive.
xix Weissert WG, Cready CM. Toward a model for improved targeting of aged at risk of institutionalization. HSR: Health Services Research. 1989; 24(4): 485-510.xx Aykan H. Do state Medicaid policies affect the risk of nursing home entry among the elderly? Research on Aging. 2002;24(5):487-512.xxi Coughlin TA, McBride TD, Liu K. Determinants of transitory and permanent nursing home admissions. Medical Care. 1990; 28(7): 616-631.xxii Hays JC, Pieper CF, Purser JL. Competing risk of household expansion or institutionalization in late life. Journal of Gerontology: Social Sciences. 2003; 58B(1): S11-S20.xxiii Kersting. 2001. See Reference 8. xxiv Steinbach U. Social networks, institutionalization, and mortality among elderly people in the United States. Journal of Gerontology: Social Sciences. 1992; 47(4): S183-S190.xxv Mor V, Wilcox V, Rakowski W, Hiris J. Functional transitions among the elderly: patterns, predictors, and related hospital use. American Journal of Public Health. 1994;84(8):1274-1280.xxvi Freedman VA. Family structure and the risk of nursing home admission. Journal of Gerontology. 1996;51B(2):S61-S69.xxvii Miller, Prohaska, Mermelstein , and Van Nostrand . 1993. See Reference 4.xxviii Branch and Ku. 1989. See Reference 5.xxix Dwyer, Barton, and Vogel. 1999. See Reference 11.xxx Black, Rabins, and German. 1999. See Reference 17.xxxi Pearlman and Crown. 1992. See Reference 18.xxxii Weissert and Cready. 1989. See Reference 19.xxxiii Aykan. 2000. See Reference 20.xxxiv Greene VL. Ondrich JI. Risk factors for nursing home admission and exists: A discrete-time hazard function approach. Journal of Gerontology: Social Sciences. 1990; 45(6): S250-S258.xxxv Kersting. 2001. See Reference 8. xxxvi Steinbach. 1992. See Reference 24.xxxvii Mor, Wilcox, Rakowski, and Hiris. 1994. See Reference 25.xxxviii38 Miller, Prohaska, Mermelstein , and Van Nostrand . 1993. See Reference 4.xxxix Weissert and Cready. 1989. See Reference 19.xl Hays, Pieper, and Purser. 2003. See Reference 22. xli Black, Rabins, and German. 1999. See Reference 17.xlii Aykan. 2000. See Reference 20.xliii Kersting. 2001. See Reference 8. xliv Steinbach. 1992. See Reference 24.xlv Freedman . 1996. See Reference 26. xlvi Pearlman and Crown. 1992. See Reference 18.xlvii Freedman . 1996. See Reference 26.xlviii Dwyer, Barton, and Vogel. 1999. See Reference 11.
99

An important limitation of this study is its focus on those who are already receiving
Medicaid-covered services. All of the data analyzed and reported here were either from
Medicaid files (secondary data), providers of Medicaid services (focus group
discussions), or consumers and others involved in the decision about their care (key
informant interviews). This is an important limitation, particularly in light of the finding of
racial disparities in utilization of these services. There may be significant barriers to use
xlix Rudberg, Sager, and Zhang. 1996. See Reference 16.l Black, Rabins, and German. 1999. See Reference 17.li Bauer EJ. Transition from home to nursing home in a capitated long-term care program: The role of individual support systems. HSR: Health Services Research. 1996; 31(3): 309-326.lii Pearlman and Crown. 1992. See Reference 18.liii Weissert and Cready. 1989. See Reference 19.liv Aykan. 2000. See Reference 20.lv Ibid.lvi Coughlin, McBride, and Liu. 1990. See Reference 21.lvii Hays, Pieper, and Purser. 2003. See Reference 22.lviii Freedman . 1996. See Reference 26.lix Black, Rabins, and German. 1999. See Reference 17.lx Pearlman and Crown. 1992. See Reference 18.lxi Weissert and Cready. 1989. See Reference 19.lxii Black, Rabins, and German. 1999. See Reference 17.lxiii Bauer. 1096. See Reference 51. lxiv Hays, Pieper, and Purser. 2003. See Reference 22.lxv Bauer. 1096. See Reference 51. lxvi Coughlin, McBride, and Liu. 1990. See Reference 21.lxvii Weissert and Cready. 1989. See Reference 19.lxviii Brown RD, Ransom J, Hass S, et al. Use of nursing home after stroke and dependence on stroke severity: a population-based analysis. Stroke. 1999;30:924-929.lxix Weissert and Cready. 1989. See Reference 19.lxx Coughlin, McBride, and Liu. 1990. See Reference 21.lxxi Weissert and Cready. 1989. See Reference 19.lxxii Coughlin, McBride, and Liu. 1990. See Reference 21.lxxiii Dwyer, Barton, and Vogel. 1999. See Reference 11.lxxiv74 Pearlman and Crown. 1992. See Reference 18.lxxv Aykan. 2000. See Reference 20.lxxvi Coughlin, McBride, and Liu. 1990. See Reference 21.lxxvii Rudberg, Sager, and Zhang. 1996. See Reference 16.lxxviii Aykan. 2000. See Reference 20.lxxix Coughlin, McBride, and Liu. 1990. See Reference 21.lxxx Branch and Ku. 1989. See Reference 5.lxxxi Black, Rabins, and German. 1999. See Reference 17.lxxxii Dwyer, Barton, and Vogel. 1999. See Reference 11.
100
that we didn’t hear about, because they were so significant that they could not be
overcome. Anecdotal data from the Community Connector Program would indicate this
to be the case, as these lay workers have reported concerns about estate recovery,9
and shared the stories of the day-to-day survival challenges created by the deep
poverty of many in the communities they serve.
9 Estate recovery is the mechanism whereby states can seek reimbursement for the cost of certain long-term care services consumers have received through claims on their estate carried out upon their death.
lxxxiii Black, Rabins, and German. 1999. See Reference 17.lxxxiv Bauer. 1096. See Reference 51. lxxxv Hays, Pieper, and Purser. 2003. See Reference 22.lxxxvi Sherman BR. Predictors of the decision to place developmentally disabled family members in residential care. American Journal of Mental Retardation. 1988; 92(4): 344-51.lxxxvii Tausig M. Factors in family decision-making about placement for developmentally disabled individuals. American Journal of Mental Deficiency. 1985; 89(4): 352-61.lxxxviii Batavia AL, DeJong G, McKnew B. Toward a National Personal Assistance Program: The Independent Living Model of Long Term Care for Persons with Disabilities. Journal of Health Politics, Policy and Law. 1991;16(3): 523-52. In Miller NA, Goldstein E, Harrington, C. Use of Medicaid 1915 (c) Home and Community Care Waivers to Reconfigure State Long Term Care Systems. Medical Care Research and Review. 2001, March; 58(1): 100-119.lxxxix Kaye HS, Longmore PK. Disability Watch: The Status of People with Disability in the United States. San Francisco, CA: Disabilities Rights, Inc. 1998. In Miller NA, Goldstein E, Harrington, C. Use of Medicaid 1915 (c) Home and Community Care Waivers to Reconfigure State Long Term Care Systems. Medical Care Research and Review. 2001, March; 58(1): 100-119.xc Kemper P, Applebaum, R and Harrigan M. Community Care Demonstrations: What Have We Learned? Health Care Financing Review. 1987; 8(4): 87-100. In Krothe JS. Giving Voice to Elderly People: Community Based Long Term Care. Public Health Nursing. 1997, August; 14(4): 217-226.xci Miller NA, Goldstein E, Harrington, C. Use of Medicaid 1915 (c) Home and Community Care Waivers to Reconfigure State Long Term Care Systems. Medical Care Research and Review. 2001, March; 58(1): 100-119.xcii Pezzin PE, Kemper P, and Reschovsky JD. Does Publicly Provided Home Care Substitute for Family Care. Experimental Evidence with Endogenous Living Arrangements. The Journal of Human Resources. 1996; 31(3): 650-676. In Krothe JS. Giving Voice to Elderly People: Community Based Long Term Care. Public Health Nursing. 1997, August; 14(4): 217-226.xciii Kemper, Applebaum and Harrigan. 1987. See Reference 90. xciv American Nurses Association. Position Statement on Long Term Care. Washington DC: American Nurses Association. 1995. In Krothe JS. Giving Voice to Elderly People: Community Based Long Term Care. Public Health Nursing. 1997, August;14(4): 217-226.xcv Harrington, Carrillo, Wellin, Miller, and LeBlanc. 2000. See Reference 3. xcvi Johnson and Wolinsky. 1996. See Reference 6. xcvii Houde. 1998. See Reference 7.
101

It should also be noted that none of our primary data collection efforts included input
from direct service workers. Presenting the viewpoint of these workers was not a focus
of this study, or our review of the literature. However, further study along these lines
could provide helpful insight to efforts to address issues related to those providing front-
line care.
xcviii Kersting. 2001. See Reference 8. xcix Bradley, McGraw, and Curry. 2002. See Reference 9. c Houde. 1998. See Reference 7.ci Johnson and Wolinsky. 1996. See Reference 6.cii Bradley, McGraw, and Curry. 2002. See Reference 9. ciii Ibid. civ Ibid. cv Miller B, Campbell RT, Davis L. Minority use of community long-term care services: a comparative analysis. Journal of Gerontology. 1996;51B(2):S70-S81.cvi Rabiner D. Patterns and predictors of noninstitutional health care utilization by older adults in rural and urban America. The Journal of Rural Health. 1995;11(4):259-273.cvii Miller, Campbell, and Davis. 1996. See Reference 105.cviii Rabiner. 1995. See Reference 106.cix Miller, Campbell, and Davis. 1996. See Reference 105.cx Rabiner. 1995. See Reference 106.cxi Bookwala J, Zdaniuk B, Burton L, Lind B, Jackson S, Schulz R. Concurrent and long-term predictors of older adults’ use of community-based long-term care services. Journal of Aging and Health. 2004;16(1):88-115.cxii Miller, Campbell, and Davis. 1996. See Reference 105.cxiii Pan SM, Yang JT, Chen CC. The predictors of long-term care service utilization among older Americans. Kaohsiung Journal of Medical Sciences. 1998;14:226-233.cxiv Bookwala, Zdaniuk, Burton, Lind, Jackson, and Schulz. 2004. See Reference 111.cxv Ibid.cxvi Houde. 1998. See Reference 7.cxvii Ibid.cxviii Ibid.cxix Silverstein NM. Informing the elderly about public services: the relationship between sources of knowledge and service utilization. The Gerontologist. 1984;24(1):37-40.cxx Bradley, McGraw, and Curry. 2002. See Reference 9. cxxi Chapleski EE. Determinants of knowledge of services to the elderly: are strong ties enabling or inhibiting? The Gerontologist. 1989;29(4):539-545.cxxii Harel Z. Nutrition site service users: does racial background make a difference? The Gerontologist. 1985;25(3):286-291.cxxiii Chapleski. 1989. See Reference 121.cxxiv Bradley, McGraw, and Curry. 2002. See Reference 9. cxxv Silverstein. 1984. See Reference 119.cxxvi Ibid.
102
In this study, qualitative methods were deemed the most appropriate way to better
understand the decision-making process surrounding utilization of formal long-term care
services in Arkansas. Through the process of collecting and analyzing these data, we
have identified a number of issues that could be quantified through administration of a
closed-ended survey instrument implemented on a broader scale. Some of the areas of
inquiry we believe could be explored through a standardized tool include:
cxxvii Ibid.cxxviii Bradley, McGraw, and Curry. 2002. See Reference 9. cxxix Andersen RM. Revisiting the behavioral model and access to medical care: Does it matter? Journal of Health and Social Behavior. 1995; 36(1): 1-10. cxxxii Miller WL, Crabtree BF. Overview of qualitative research methods, Chapter 1. In Crabtree BF, Miller WL, eds. Doing Qualitative Research: Research Methods for Primary Care, Volume 3. Thousand Oaks, CA: Sage Publications, Inc. 1992: 3-30.cxxxiii Crabtree BF, Miller WL. Interpretation: Strategies of analysis, Chapter 5. In Crabtree BF, Miller WL, eds. Doing Qualitative Research: Research Methods for Primary Care, Volume 3. Thousand Oaks, CA: Sage Publications, Inc. 1992: 93-109.cxxxiv Gilchrist VJ. Key informant interviews, Chapter 4. In Crabtree BF, Miller WL, eds. Doing Qualitative Research: Research Methods for Primary Care, Volume 3. Thousand Oaks, CA: Sage Publications, Inc. 1992: pp 70-92.cxxxv Miller and Crabtree. 1992. See Reference 132.cxxxvi Huberman AM, Miles, M. Data management and analysis methods, Chapter 27. , In Denzin NK, Lincoln YS, eds. Handbook of Qualitative Research. Thousand Oaks, CA: Sage Publications. 1994: 428-444. p. 429.cxxxvii Ibid.cxxxviii Ibid, p. 439. . cxxxix AAANWA, Area Agency on Aging of Northwest Arkansas and DAAS, Division of Adult and Aging Services. (2003). Public Benefits for Arkansas Seniors, 2003. Little Rock, AR: Division of Adult and Aging Services. Accessed at http://www.state.ar.us/dhs/aging/pubbenarsr03.pdf and verified on February 17, 2004.cxl GIST, Governor’s Integrated Services Task Force and the Arkansas Department of Human Services. The Olmstead Plan in Arkansas: A Catalyst for Collaboration and Change. 2003. Accessed at http://www.state.ar.us/dhs/aging/olmarplan0303pro.doc and verified on 2/21/05.cxli Alternatives for Adults with Physical Disabilities Webpage accessed at http://www.state.ar.us/dhs/aging/alt.html and verified on February 17, 2005.cxlii GIST and ADHS. 2003. See Reference 140.cxliii Division of Developmental Disabilities Services Webpage accessed at http://www.state.ar.us/dhs/ddds/ddsinsti.html and verified on February 17, 2005.cxliv Nursing Home 2009 County Need from the Arkansas Health Services Permit Agency accessed at http://www.arhspa.org/bed_need/jan-05/NH-2009-County-Need-New.pdf and verified on February 17, 2005.
103

Whether information on HCBS was sought and if so, by whom, where, when, how and what was learned;
Difficulties experienced with knowing for what services individuals were eligible, finding information on how to apply, and filling out paperwork;
What assistance individuals received from traditional informational sources (and new sources being promoted such as the www.argetcare.org website), and how helpful they were; and
cxlv AAANWA, 2003. See Reference 139. cxlvi Harrington C, Swan JH, Nyman JA, and Carrillo H. The effect of the certificate of need and moratoria policy on change in nursing home beds in the United States. Medical Care. 1997; 35 (6): 574-588.cxlvii AHSPA, Arkansas Health Services Permit Agency. POA Rulebook. Little Rock, AR: Arkansas Health Services Permit Agency. 2004. Accessed at http://www.arhspa.org/rules_regs/poa_revised_rulebook_october_2004.pdf. cxlviii ADDDS, Arkansas Division of Developmental Services. General Information on Human Development Centers. No date. Webpage accessed at http://www.state.ar.us/dhs/ddds/ddsinsti.html#general. cxlix Personal Communications, DHS Staff.cl AHSPA, Arkansas Health Services Permit Agency. Nursing Home County Need FY 2005. 2005. Accessed at http://www.arhspa.org/bed_need/jan-05/NH-2009-County-Need-New.pdf. cli AHSPA, Arkansas Health Services Permit Agency. Nursing Home County Need FY 2002. 2002.clii Ibid. cliii Gist and ADHS, 2003. See Reference 140, page A-21.cliv ADHS, Arkansas Department of Human Services. Annual Statistical Report. Little Rock, AR: Arkansas Department of Human Services. 1998.clv ADHS, Arkansas Department of Human Services. Annual Statistical Report. Little Rock, AR: Arkansas Department of Human Services. 1999. Accessed at http://www.state.ar.us/dhs/dhs1999stats/stats_toc.htm. clvi ADHS, Arkansas Department of Human Services. Annual Statistical Report. Little Rock, AR: Arkansas Department of Human Services. 2000. Accessed at http://www.state.ar.us/dhs/dhs2000stats/stats_toc.htm.clvii ADHS, Arkansas Department of Human Services. Annual Statistical Report. Little Rock, AR: Arkansas Department of Human Services. 2001. Accessed at http://www.state.ar.us/dhs/AnnualStatRpts/dhs2002stats/DMS/DMSpg31.htm. clviii GIST and ADHS. 2003. See Reference 140.clix Ibid.clx Ibid.clxi Tonner MC, Harrington C. Nursing Facility and Home and Community-Based Service Need Criteria in the United States. Home Health Care Services Quarterly. 2003; 22(4):65-83. clxii Ibid, p. 79. clxiii Tonner and Harrington. 2003. p. 75. See Reference 161.clxiv Department of Health and Human Services (2005). Budget in Brief, Rich Text Format, Fiscal Year 2006 p. 82. Accessed on 2/16/05 at http://www.hhs.gov/budget/06budget/BIBRichTextVersion.rtf.
104

What other informational sources individuals used to access the system.
clxv Personal communication, DHS Staff.clxvi Kassner E. Medicaid Financial Eligibility for Older People: State Variations in Access to Home and Community-Based Waiver and Nursing Home Services. Washington, DC: AARP. 2000. Accessed on 2/16/05 at http://research.aarp.org/health/2000_06_medicaid.pdfclxvii Personal communication, DHS Staff.clxviii Stewart MK, Felix HC. Sustaining Community Health Workers Policy Intervention Project: Final Report to the Enterprise Corporation of the Delta. Little Rock, AR: College of Public Health, UAMS. 2004.clxix Wisconsin Real Choice Systems Grant Information accessed http://www.cms.hhs.gov/systemschange/winft.pdt and verified on August 5, 2004. clxx New Hampshire Real Choice Systems Change Grant Information accessed at http://www.cms.hhs.gov/systemschange/nhrc.pdf and verified on August 5, 2004.clxxi Maryland Real Choice System Grant Information accessed at For Maryland: http://www.cms.hhs.gov/systemschange/md.nft.pdf and verified on August 5, 2005.clxxii Shaner H. Dual eligible outreach and enrollment: a view from the states. Outreach Tools and Other Resources. Washington, DC: Centers for Medicare and Medicaid Research. Available at http:www.cms.hhs.gov/dualeligibles/outreach.asp. clxxiii Angel JI. Helping Families to Navigate the System of Long-Term Care Alternatives: The Role of Information Technology. Journal of Family and Consumer Sciences. 1999;91(3), p. 117. clxxiv Tanner, R. “Assisted Living”, Health Policy Tracking Services, April, 2004.clxxv Adams K, Novak R, Jenkins R, DeShane M, Brecht S. Arkansas Assisted Living Demand Analysis. (Prepared for Arkansas Department of Aging and Adult Services). February 2005.clxxvi Person-Centered Care. No date. Accessed on February 21, 2005 at http://www.bethanygrp.org/rosehaven/personcenteredcare.htm.clxxvii Nissenboim S. Professional Caregiving: ‘Person-Centered Care’ is In, One-Size-Fits-All is Out, July 14, 2004. Accessed at:http://www.caregivershome.com/professional/professional.cfm?UID=18, on 2/21/05.clxxviii GIST and ADHS. 2003. p. 14. See Reference 140. clxxix Ibid. p. 30-31. clxxx Personal communication, DHS Staff, 02/05.clxxxi ADHS, Arkansas Department of Human Services. Report of the Arkansas Olmstead Working Group for the Development of a Comprehensive, Effective Working Plan to Comply with the United States Supreme Court’s Holding on Olmstead v. LC. 2001. Accessed at www.accessarkansas.org/dhs/aging/OlmsteadReportVer6.doc and verified on February 22, 2005.clxxxii Arno PS, Levine C, Memmott MM. The economic value of informal caregiving. Health Affairs. 1999; 18(2): 182-188.
105
Another direction for research that builds upon this study could be analyses of Medicaid,
and perhaps Medicare, claims data to study patterns and paths for care that might
reveal strategic points for intervention. For example, several of the institutionalized
consumers we interviewed came into nursing homes directly from the hospital or from
the facility where they were receiving rehabilitation. However, our data were not
sufficient to determine whether this is a pattern more common among nursing home
residents than users of HCBS, though this appears to perhaps be the case.
Also worthy of further exploration are the findings suggestive of racial disparities
identified in our analysis of Medicaid eligibility files. More work is needed to determine if
racial disparities persist when the denominator for rates of use by race are more
accurately measured to represent the population of interest. Further analyses of the
key informant interviews are also needed to determine if racial differences in access
emerge.
Finally, we would like to note that although this report focuses on identifying ways to
improve long-term care services for the elderly and adults with physical and
developmental disabilities, many people who participated in our study expressed how
much they appreciated the services they were receiving. Along these lines we would
like to close with the following quotes from KII respondents.
“I am so thankful that somewhere along the line there was some program like this that came up that gives me the benefit to be able to stay in my house. Be on my own, my own independence. I really am thankful, and it hasn’t been around that long either so… And I’m thankful for every bit of it.” (Quote from a KII with an Alternatives Waiver consumer)
“… We went from no hope, lost hope to, you know, actually going, ‘Hey, we finally made it.’ It’s like being stranded at sea and finally seeing a rescue boat. So, that’s where I am today.” (Quote from a KII with an Alternatives Waiver consumer.)
clxxxiii Feder J, Komisar HL, Niefeld M. 2000. Long-Term Care In The United States: An Overview. Health Affairs. 19(30): 40-56.clxxxiv Kassner and Shirley. 2000. See Reference 167.
106

107

Appendix APredictors of Nursing Home Placement from a Review of the
Literature
a
b
VariablesRudberg
et al. SteinbachWeissert & Cready
X=variable in study. Bolded X=variable significant predictorSocio-demographic Characteristics Age x x xGender x xMarital Status xRace (black) x xEthnicity (Hispanic)EducationType of health insuranceIncome
Poverty status/Medicaid eligibility xRural/UrbanHome ownershipLength of residence/stabilityHealth Characteristics IADL status x x xADL status x x xMental status/dementia x xMobility xSelf -Reported health x# of Illnesses/Chronic conditions
Impaired social activity xFalls/Fractures xMental health/Not dementia xDepressionProblem behaviorCancer x xHeart/Circulatory problems x xStroke or neurological problems xArthritis/musculoskeletal xDiabetes xRespiratory problems x xHearing/vision problemsIncontinenceHealth Service Use Prior NH useRecent hospitalization xNH availability (# beds) xMental health visitsPaid help (home care/HCBS)Satisfaction with supportive careSocial Support Living arrangement x xNumber of childrenFamily network/social supportChild proximityCaregiver distress/illnessInformal support (unpaid helpers)
c

Full Citations for Literature Review Matrix
Aykan H. Do state Medicaid policies affect the risk of nursing home entry among the elderly? Evidence from the AHEAD Study. Research on Aging. 2000; 24(5): 487-512.
Bauer EJ. Transition from home to nursing home in a capitated long-term care program: The role of individual support systems. HSR: Health Services Research. 1996; 31(3): 309-326.
Black BS, Rabins PV, German PS. Predictors of nursing home placement among elderly public housing residents. The Gerontologist. 1999; 39(5): 559-568.
Coughlin TA, McBride TD, Liu K. Determinants of transitory and permanent nursing home admissions. Medical Care. 1990; 28(7): 616-631.
Dwyer JW, Barton AJ, Vogel WB. Area of residence and the risk of institutionalization. Journal of Gerontology: Social Sciences. 1994; 49(20): S75-S54.
Freeman VA, Berkman LF, Rapp SR, Ostfeld AM. Family networks: Predictors of nursing home entry. American Journal of Public Health. 1994; 84(5): 843-845.
Greene VL. Ondrich JI. Risk factors for nursing home admission and exists: A discrete-time hazard function approach. Journal of Gerontology: Social Sciences. 1990; 45(6): S250-S258.
Hays JC, Pieper CF, Purser JL. Competing risk of household expansion or institutionalization in late life. Journal of Gerontology: Social Sciences. 2003; 58B(1): S11-S20.
Kersting RC. Predictors of nursing home admission for older black Americans. Journal of Gerontological Social Work. 2001;35(3):33-51.
Pearlman DN, Crown WH. Alternative sources of social support and their impacts on institutional risk. The Gerontologist. 1992; 32(4): 527-535.
Rudberg MA.. Sager MA, Zhang J. Risk factors for nursing home use after hospitalization for medical illness. Journal of Gerontology: Medical Sciences. 1996; 51A(5): M189-M194.
Steinbach U. Social networks, institutionalization, and mortality among elderly people in the United States. Journal of Gerontology: Social Sciences. 1992; 47(4): S183-S190.
Weissert WG, Cready CM. Toward a model for improved targeting of aged at risk of institutionalization. HSR: Health Services Research. 1989; 24(4): 485-510.
d
Appendix BMembers of the Advisory Working Group
Sandra Barrett - retiredDivision of Aging and Adult ServicesArkansas Department of Human ServicesP. O. Box 1437, Slot S530Little Rock, AR 72203
Jennifer Dillaha, MDPublic Health PhysicianArkansas Department of Health 4815 West Markham, Slot 41Little Rock, AR 72205
Elaine EubankDirectorCareLinkP. O. Box 5988North Little Rock, AR 72219
Dawn Graziani, RNPersonal Care/Elder Choices/Community-BasedCase Management/Maternal and Infant ProgramArkansas Department of Health5800 West 10th Street, Suite 300Little Rock, AR 72204
James C. Green, PhDDirector, Developmental Disabilities Services (DDS)Arkansas Department of Human ServicesPO Box 1437, Slot N501Donaghey Plaza North, 5th FloorLittle Rock, AR 72203
James HaydenAssistant Director, Developmental Disabilities Services (DDS)Arkansas Department of Human ServicesPO Box 1437, Slot N501Donaghey Plaza North, 5th FloorLittle Rock, AR 72203
Randy HelmsDivision of Medical ServicesArkansas Department of Human ServicesP. O. Box 1437, Slot S416Little Rock, AR 72203
Scott HolladayNational Academy for State Health Policyc/o Arkansas Division of Aging and Adult ServicesP. O. Box 1437, Slot S-530Little Rock, AR 72203-1437
Rich HuddlestonResearch DirectorArkansas Advocates for Children and Families523 S. Louisiana, Suite 700Little Rock, AR 72201
Shelley Lee, MPADivision of Developmental Disabilities Services Arkansas Department of Human Services150 E. Seibenmorgen Dr.Conway, AR 72032
Donna MaddenDevelopmental Disabilities Services (DDS)Arkansas Department of Human ServicesPO Box 1437, Slot N501Donaghey Plaza North, 5th FloorLittle Rock, AR 72203
Sherri Proffer, RNArkansas Department of Human ServicesDonaghey Plaza South, Suite 1100Little Rock, AR 72203
Carol ShockleyDirector, Office of Long Term CareArkansas Department of Human ServicesP. O. Box 8059, Slot S409Little Rock, AR 72203
Herb Sanderson, MPADirector, Division of Aging and Adult ServicesArkansas Department of Human ServicesP. O. Box 1437-S530Little Rock, AR 72203-1437
Linda WhiteDirector, ACS Waiver Services United Cerebral Palsy of Arkansas9720 North Rodney Parham Rd.Little Rock, AR 72227
a

Appendix CFocus Group Discussions Coding Scheme
1. Social Support 1.1 Resources1.2 Demographics1.3 Health Status1.4 Knowledge1.5 Attitudes, experience, perceptions, emotion, etc.
2. Provider 2.1 Resources2.2 Policy2.3 Knowledge2.4 Attitude, experiences, preferences, emotions2.5 Practice2.5 Marketing2.6 Structured Environment
3. Community3.1 Infrastructure3.2 Community Climate
4. System4.1 Policy4.2 Quality4.3 Infrastructure4.4 Information4.5 Public Demand
5. Individual5.1 Social Support5.2 Resources5.3 Demographics5.4 Health Status5.5 Knowledge5.6 Attitudes, experience, perceptions, emotion, etc.
b

References
cxxx Pruchno RA, McMullen WF. Patterns of service utilization by adults with developmental disabilities: Types of Service Makes a Difference. American Journal of Mental Retardation. 2004; 109(5): 362-378.cxxxi Bradley, McGraw, and Curry. 2002. See Reference 9.