Embed Size (px)
Citation preview
INCIDENCE AND PREDICTORS OF RECOVERY FROM ANAEMIA AMONG PATIENTS ON ANTIRETROVIRAL THERAPY WITHIN THE THEMBA-LETHU
CLINICAL COHORT, FROM 2004-2010.
ZIBUSISO NDLOVU (600346)
Supervisors: Dr. Simba Takuva and Prof Tobias Chirwa
A research report submitted to the Faculty of Health Sciences, University of the Witwatersrand, Johannesburg, in partial fulfilment of the requirements
for the degree of Master of Science in Epidemiology (Epidemiology and Biostatistics).
August 2013.
i
DECLARATION
I, Zibusiso Ndlovu (student number 600346) am submitting my research report in partial
fulfilment of the requirements of the Master of Science in Epidemiology in the field of
Epidemiology and Biostatistics at the University of Witwatersrand, School of Public
Health. I declare that all material presented in this report is my own work and has not
been submitted before for any degree at any other university. Where I used
materials/thoughts from other sources, I have properly acknowledged through the
conventional referencing.
Signed:
................................................
Date: 21st August 2013

ii
DEDICATION
I dedicate this work to all people living with HIV/AIDS.
Zibusiso Ndlovu
August 2013
iii
ABSTRACT
Introduction
Anaemia is one of the most frequent haematological complications seen in people with
HIV/AIDS. Understanding factors associated with recovery from anaemia during Highly
Active Antiretroviral Therapy (HAART) is vital since anaemia is a strong predictor of
disease progression and mortality. However to our knowledge, predictors of recovery
from anaemia in HIV infected patients are not well documented.
Methods
The study was a retrospective analysis of data prospectively collected from Themba-
Lethu Clinic HIV cohort. A total of 12,441 adult patients initiating HAART between 1st April
2004 and 30th June 2010 were analyzed. A further 2,489 patients with anaemia at HAART
initiation were examined to determine incidence and predictors of recovery from
anaemia. Kaplan-Meier methods were used to estimate time to recovery from anaemia
and Cox proportional hazard models were fitted to investigate predictors of recovery
from anaemia.
Results
Among these 12,441 participants at HAART initiation, 7,645 (61.5%) were females and the
median age of the participants was 36.4 years (IQR: 31.3 - 42.9). The mean haemoglobin
level was 11.4 g/dl (SD: 2.23) and the overall prevalence of anaemia (Hb<10 g/dl) was
27%. The majority of patients had WHO HIV/AIDS clinical stage 1 (n=4,474; 36.0%), and
TB was present in 1,953 (15.7%) patients. Mean CD4 cell count was 101 cells/mm3
(SD=76.0) with 6,745 (54.2%) having CD4 cell count <100 cells/mm3. At the end of follow-
up, 48.1% of the cohort was still alive, while 37.6% were lost to follow up and 14.3% were
dead. Of the 2,489 anaemic patients at HAART initiation, 2,225 (89.4%) recovered from
anaemia.
The median time for anaemia recovery was 3.88 months [IQR: 3.22 - 6.20 months] and
incidence rate of recovery was 180 (95% CI: 172-187) per 100 person years. Sex, baseline
CD4 cell count, BMI, WHO HIV/AIDS clinical staging, employed, smoking, TB at initiation
of HAART, TB after initiation, still on first regimen and education category were significant
predictors of recovery from anaemia in the Cox univariate analysis. However, in the
adjusted analysis, predictors of recovery from anaemia which remained significant were:

iv
sex [HR: 1.44, (95% CI: 1.30-1.70) p<0.001], baseline CD4 cell count [HR: 0.99, (95% CI:
0.99-1.00) p=0.05], baseline WHO HIV/AIDS clinical staging [HR: 0.83, (95% CI: 0.65-0.97)
p=0.017] and HIV viral load [HR: 0.93, (95% CI: 0.79-1.09) p=0.359].
Conclusion
To our knowledge, this is the first study to look into predictors of recovery from anaemia
in sub-Saharan Africa. Anaemic individuals within HIV cohorts should be promptly
identified and predictors of recovery from anaemia must be used for intensive case
management and monitoring.

v
ACKNOWLEDGEMENTS
It gives me great pleasure in acknowledging the support and help of my supervisors Dr
Simbarashe Takuva and Prof Tobias Chirwa for their input and guidance in the
preparation of this report. My sincere gratitude is extended to all my lecturers from the
Witwatersrand University School of Public Health for their stimulating teaching and
encouragement.
I am indebted to my many colleagues for their unwavering emotional and moral support.
This thesis would not have been possible without the Themba-Lethu Clinic management
and Right to Care which supports the clinic and the participants enrolled at the clinic
whose data I used in my research. I cannot find words to express my gratitude to them.

vi
Table of contents DECLARATION ................................................................................................................................... i
DEDICATION ..................................................................................................................................... ii
ABSTRACT........................................................................................................................................ iii
Introduction ............................................................................................................................. iii
Methods ................................................................................................................................... iii
Results ...................................................................................................................................... iii
Conclusion ................................................................................................................................ iv
ACKNOWLEDGEMENTS .................................................................................................................... v
Table of contents............................................................................................................................. vi
List of figures ..................................................................................................................................viii
List of tables .................................................................................................................................... ix
Abbreviations ................................................................................................................................... x
1 CHAPTER 1: INTRODUCTION .................................................................................................... 1
1.1 Background .................................................................................................................... 1
1.2 Statement of the problem .............................................................................................. 3
1.3 Justification of the study ................................................................................................ 4
1.4 Literature review ............................................................................................................ 5
1.5 Study aims and objectives .............................................................................................. 7
2 CHAPTER 2: METHODS .............................................................................................................. 8
2.1 Introduction ................................................................................................................... 8
2.2 Study design ................................................................................................................... 8
2.3 Study setting and population ......................................................................................... 8
2.4 Sampling strategy: sample size calculation .................................................................... 9
2.5 Study cohort eligibility criteria ..................................................................................... 10
2.5.1 Inclusion criteria: .................................................................................................. 10
2.5.2 Exclusion criteria: ................................................................................................. 10
2.6 Definition of variables .................................................................................................. 10
2.6.1 Outcome variable ................................................................................................. 10
2.6.2 Study variables (possible explanatory variables) .................................................. 11
2.7 Data cleaning and quality checks ................................................................................. 12
2.8 Data analysis ................................................................................................................ 12
2.9 Ethical considerations .................................................................................................. 14
3 CHAPTER 3: RESULTS .............................................................................................................. 15

vii
3.1 Introduction ................................................................................................................. 15
3.2 Description of overall TLC cohort initiating HAART ...................................................... 15
3.3 Characteristics of anaemic cohort at baseline .............................................................. 20
3.4 Survival analysis results ............................................................................................... 24
3.5 Predictors of recovery from anaemia ........................................................................... 26
3.5.1 Recovery from anaemia by individual predictors ................................................. 26
3.6 Model building ............................................................................................................. 29
3.7 Multivariate analysis .................................................................................................... 31
3.8 Checking for possible interactions................................................................................ 32
3.9 Testing of assumptions ................................................................................................ 32
3.10 Evaluating goodness of fit of the final model ............................................................... 33
3.11 Evaluating survivor bias ............................................................................................... 34
3.12 Model interpretation ................................................................................................... 34
4 CHAPTER 4: DISCUSSION ........................................................................................................ 36
4.1 Introduction ................................................................................................................. 36
4.2 Baseline characteristics of TLC cohort .......................................................................... 36
4.3 Baseline characteristics of anaemic cohort .................................................................. 39
4.4 Incidence of recovery from anaemia in study cohort ................................................... 40
4.5 Predictors of recovery from anaemia ........................................................................... 40
4.6 Limitations ................................................................................................................... 43
5 CHAPTER 5: CONCLUSION AND RECOMMENDATIONS............................................................ 44
5.1 Introduction ................................................................................................................. 44
5.2 Conclusions .................................................................................................................. 44
5.3 Recommendations ....................................................................................................... 44
REFERENCES ................................................................................................................................... 46
APPENDICES ................................................................................................................................... 49
Appendix A: Assessing validity of proportionality hazards assumption. .................................. 49
Appendix B: Graphical assessment of proportionality assumption for each predictor ............ 50
Appendix C: Revised WHO clinical staging of HIV/AIDS for adults and adolescents (50) ........... 51
Appendix D: BMI categories (adapted from WHO) (39). ............................................................ 52
Appendix E: Evaluating survivor bias ....................................................................................... 52
Appendix F: Missing observations in variables ........................................................................ 53
Appendix G: Ethics approval letter .......................................................................................... 54

viii
List of figures
Figure Page
Figure 1: Proportion of subjects enrolled into TLC cohort by year of enrolment ........... 17
Figure 2: Anaemia status at baseline by baseline CD4 cell count category .................... 18
Figure 3: Final status of overall TLC cohort by close of data-set. .................................... 19
Figure 4: Anaemic cohort study profile flow chart ......................................................... 20
Figure 5: Prevalence of anaemia at enrolment by age group category .......................... 21
Figure 6: Recovery/non-recovery from anaemia by baseline CD4 cell count category .. 23
Figure 7: Anaemia recovery incidence rates (per person year) by gender ..................... 25
Figure 8: Kaplan-Meier survival estimates of recovery from anaemia ........................... 26
Figure 9: Kaplan-Meier estimates of anaemia recovery by sex ...................................... 27
Figure 10: Kaplan-Meier estimates of anaemia recovery by HIV viral load .................... 27
Figure 11: Kaplan-Meier estimates of anaemia recovery by WHO anaemia grade ........ 28
Figure 12: Kaplan-Meier estimates of anaemia recovery by CD4 cell counts ................. 29
Figure 13: Evaluation of final model fitness through Cox-Snell residuals ....................... 33

ix
List of tables
Table Page
Table 1: Overall TLC cohort characteristics at enrolment (n=12 441) ............................. 15
Table 2: Characteristics of the anaemic cohort at initiation and after follow up ........... 21
Table 3: Period incidence rates of recovery from anaemia. ........................................... 24
Table 4: Factors associated with recovery from anaemia .............................................. 30
Table 5: Multivariate Cox proportional hazards model for recovery from anaemia. ..... 34

x
Abbreviations
AIDS: Acquired Immuno-deficiency Syndrome
AZT: Zidovudine
BMI: Body Mass Index
CI: Confidence Intervals
CNS: Central Nervous System
d4T: Stavudine
EFV: Efavirenz
HAART: Highly Active Antiretroviral Therapy
Hb: Haemoglobin
HIV: Human Immunodeficiency Virus
HR: Hazard Ratio
IQR: Interquartile Range
LTFU: Loss to Follow-Up
NHLS: National Health Laboratory Services
NVP: Nevirapine
OI: Opportunistic Infection
PY: Person years
QOL: Quality Of Life
RSA: Republic of South Africa
SD: Standard Deviation
SSA: Sub-Saharan Africa
TB: Tuberculosis
TLC: Themba-Lethu Clinic
WHO: World Health Organisation
ZN: Ziehl Nelson stain
3TC: Lamivudine
<: Less than
>: More than
1
1 CHAPTER 1: INTRODUCTION
The chapter begins with a general background of the burden of anaemia and HIV in sub-
Saharan Africa and in South Africa. The causes of anaemia in HIV infection are explored
and statement of the problem follows thereafter. Justification of the study and critical
review of the little available published literature on anaemia recovery follows
subsequently and the chapter ends with a description of the aims and objectives of the
study.
1.1 Background
Anaemia is a common public health problem affecting both developing and developed
countries with major consequences for human health as well as social and economic
development (1). Anaemia is one of the most frequent haematological complications seen
in people with Human Immuno-deficiency Virus (HIV) and Acquired Immuno-deficiency
Syndrome (AIDS) (1, 2). The global prevalence of anaemia for the general population is
24.8% (2), but among HIV infected individuals, the prevalence of anaemia at initiation of
Highly Active Antiretro Viral Therapy (HAART) is reported to range from 20% to 90% in
different clinical settings (3, 4). Anaemia at initiation of HAART was found in 21% of
patients in Southern Africa (5). South Africa is estimated to have 5.7 million HIV-infected
individuals out of a total population of 48.6 million (6) and has more people living with
HIV/AIDS than any other country worldwide (6). In South Africa in 2008, the CAPRISA study
reported an anaemia prevalence of 52.6% in HIV infection (7).
In HIV/AIDS related mortality, anaemia has been reported to contribute between 11%
and 19% in different study settings (8).
Anaemia in HIV infected individuals has multi factorial aetiologies. It may be a result of
chronic disease (usually erythropoietin deficient anaemia), bone marrow infections
(Cytomegalo-virus, Cryptococcus neoformans, HIV, Parvo Virus B19, Mycobacterium
Avium), neoplasms (lymphomas), opportunistic infections, malnutrition and
malabsorption, myelosuppresive drugs, histiocytosis, myelofibrosis, and myelodysplasia
among other causes (2, 4, 9-13). Some of the complications of HIV, especially for the kidney
and bone disorders, induce or make anaemia worse because these organs are critical for

2
health and normal red blood cell production (14). These multi factorial aetiologies
complicate the differential diagnosis and adequate treatment of anaemia.
HIV infected patients with lower levels of haemoglobin, normally experience decreased
quality of life (QOL), fatigue, reduced energy and activity levels (9, 15). Mild anaemia is
associated with decreased productivity at work (16). Haemoglobin levels provide
prognostic information independent of that provided by the CD4 lymphocyte count and
HIV Viral load (17). As HIV/AIDS disease progresses, anaemia occurs with greater frequency
and its burden in Sub-Saharan Africa is further compounded by numerous co-morbid
conditions i.e. TB co-infection, malnutrition, and malaria in some instances (18). The
epidemiology of anaemia in HIV infection appears to have changed since the introduction
of HAART. Studies have shown that the usage of HAART, which is a combination of three
or more drugs, results in reversal of HIV-associated haematosuppression (15, 17), resulting
in a rise in haemoglobin levels. Anaemia has been shown to be independently associated
with mortality in HIV infected patients (13), and studies suggest that recovery from
anaemia may reduce the risk of disease progression to approximately the same level as in
patients who have never had anaemia (19). The prevalence of anaemia has been shown to
be significantly reduced after initiation of HAART compared to baseline measurements (2).
Many studies have shown that recovery from anaemia significantly improves survival of
HIV infected patients (17, 20, 21).
The multifactorial origin of anaemia complicates determining its original cause and its
proper treatment. Factors associated with recovery from anaemia when combination
HAART is started are of great importance to patients with infected with HIV and their
clinicians, and for planning of health-service provision and treatment guidelines.
Understanding the predictors of recovery from anaemia in African settings will aid in a
deeper understanding of the clinical course of patients living with HIV infection thereby
decreasing possible morbidity and mortality. However to our knowledge, predictors of
recovery from anaemia in HIV infected patients are not well documented in many
developing countries. Hence to address this gap, this study intends to determine the
incidence and predictors of recovery from anaemia.
3
1.2 Statement of the problem
HIV/AIDS has become a disease that people die with rather than a disease that people die
from, as more HIV/AIDS deaths become attributable to co-morbid conditions (22). With
effective HAART on the rise, patients with HIV/AIDS are now living longer, and there’s an
obligation to aggressively screen and manage co-morbid conditions. Many of these co-
morbid conditions result in hospitalization of patients, and extended use of health
services has serious implications for health care costs.
HIV associated anaemia (one of the co-morbid conditions) is usually not given the
maximum attention it deserves, yet knowledge of its impact is very essential for the
management and care of people living with HIV/AIDS. Though recovery from anaemia
among HIV infected patients is established to be associated with improved survival and
QOL (17, 20, 21), we still do not fully understand the factors contributing to anaemia
recovery. In resource limited settings, the proportion of anaemic patients who fail to
recover from anaemia has been high, particularly during the first 12 months after
initiating HAART (23), and factors contributing to this high failure are poorly understood.
The multi-factorial origin of anaemia complicates determining predictors to recovery
from anaemia and its proper treatment. Clinicians in resource limited settings need
reliable information on predictors of recovery from anaemia so as to help in the
monitoring and management of anaemia and achieving the best possible HAART
outcomes.
Since recovery from anaemia is shown to directly increase survival (17, 20, 21), screening for
anaemia should receive more attention. Better understanding of the factors associated
with recovery from anaemia would allow closer follow-up and more targeted
interventions in patients identified to be at higher risk of poor recovery, thus reducing
excess anaemia and mortality burden.
With the continued rapid scaling up of HAART services, and improvements in HAART
guidelines; there is a need to understand predictors of recovery from anaemia which will
4
help in the monitoring and management of anaemia in many patients so as to improve
the quality and length of lives of HIV/AIDS patients.
1.3 Justification of the study
In developing countries, the significance of anaemia in HIV infected patients cannot be
clearly appreciated because extensive focus is on treating HIV and its associated
opportunistic infections (OI). In the face of HIV being a chronic disease in those people
with access to HAART, resolution of anaemia can help offer HIV/AIDS patients a longer
life expectancy.
Many studies have shown that recovery from anaemia is linked with improved survival
outcomes (17, 20, 21). Although prevalence of anaemia in HIV infected patients has declined
since the introduction of HAART (4), anaemia continues to be problematic for many
patients (9). Recent studies suggest that mild to moderate anaemia, which can be
associated with impaired QOL, remains prevalent among HIV-positive patients treated
with HAART regimens, with approximately 18% – 46% of patients, anaemic one year after
initiating HAART (23). These findings underscore the importance of further studies to try
and determine the predictors of recovery from anaemia. To our knowledge there is
scanty literature, especially in resource limited settings, about factors which predict
recovery from anaemia.
Most literature has looked into factors associated with development of anaemia (24).
Understanding the prevalence and predictors of recovery from anaemia in patients on
HAART is crucial for the design of effective anaemia preventive strategies.
As effective HAART continues to greatly improve the prognosis of patients infected with
HIV, knowledge of treatment options and factors associated with anaemia recovery
should be an important aspect of the management of HIV patients. Hence, this study is an
attempt to understand predictors of recovery from anaemia in HIV infected patients.

5
1.4 Literature review
Mocroft et al. showed that haemoglobin levels provide prognostic information
independent of that provided by the CD4 lymphocyte count and HIV Viral load (17). Many
studies in different settings have shown that anaemia has a serious impact on the QOL of
HIV/AIDS patients (4, 10, 11, 20) and use of HAART has been associated with a significant
increase in haemoglobin concentrations and a decrease in the prevalence of anaemia (4, 9,
20, 25). A small but significant number of patients do not recover from anaemia despite use
of suppressive antiretroviral therapy (26), and these patients remain at a greater risk of
poor survival outcomes (17, 20). The aim of this study was to identify factors associated
with anaemia recovery following initiation of antiretroviral therapy.
Many different studies done in Africa in HIV cohorts, have reported varying prevalence of
anaemia at HAART initiation. Johannessen et.al (Tanzania 2011) reported a prevalence of
77.4% in an adult HIV cohort (27), and Mugisha et.al (Uganda 2008), reported 18.9%
prevalence of anaemia at enrolment (28). In a multi-centre study, Zhou et.al in 2012
reported anaemia prevalence of 45% in Western Africa, 29% in East Africa, 21% in
Southern Africa and 36% in Central Africa (5). All these studies only investigated the
predictors of anaemia; and predictors of recovery from anaemia are yet to be
understood.
Anaemia has been shown to be a statistically significant predictor of progression to AIDS,
and is independently associated with an increased risk of death (4, 9-11, 17, 23, 24). In a model
for predicting the proportion of patients infected with HIV who die of co-morbid
conditions, Brathwaitte et.al demonstrated 41% of deaths as not directly attributable to
HIV (22), and this shows that co-morbid conditions are becoming a determinant for survival
in HIV infected people. Previous studies suggest that recovery from anaemia is associated
with improved survival and QOL among persons with HIV infection (17, 20, 21). These novel
associations between recovery from anaemia, improved QOL and survival shown in many
studies are the reason this study seeks to explain predictors of recovery from anaemia,
especially with more patients expected to be initiated on HAART with the updated HAART
initiation guidelines (2010).

6
Sullivan P et al. found that recovery from anaemia was associated with decreased risk of
death and they found that the median survival for those who were not anaemic was
similar to median survival of those who became anaemic and later recovered (19). Moore
et al. also found that recovery from anaemia was associated with improved survival (21, 29).
Nonetheless, all these studies never explored predictors of recovery from anaemia.
In a recent study (2011) in Tanzania by Johannessen et.al, two thirds of patients who
were anaemic at time of initiation of HAART recovered from anaemia within the first 12
months of HAART (30). However, the study did not look at predictors of recovery from
anaemia. Russell et al. in 2010, in South Africa showed that there’s a significant early
mortality of patients on HAART mostly due to advanced disease and co-morbidities
(which include anaemia) which are common in poor resource settings (31). Sullivan et al
showed that HIV infected patients with anaemia are at a greater risk for mortality than
are patients without anaemia, even after controlling for various factors known to affect
survival, such as virus load or CD4 cell count (32). Thus there is a need to understand
predictors of recovery from anaemia as they might strengthen intensive case
management of those at high risk, thus reducing excess anaemia burden and possibly
subsequent excess mortality.
Many studies have explored predictors of persistent anaemia (27, 28, 33, 34) and reported
almost similar predictors which include; race, CD4 cell count less than 200 cells/mm3, HIV
viral load, MCV, sex, opportunistic infections, zidovudine use, and WHO clinical staging.
To our knowledge, however, no study has looked into predictors of recovery from
anaemia.
Knowledge of predictors of recovery from anaemia may serve as useful tools in the
monitoring and management of anaemic patients on HAART, especially as the ARV scale-
up continues. Recovery from anaemia in patients on HAART is very crucial; hence this
study aims to investigate factors associated with recovery from anaemia.

7
1.5 Study aims and objectives
The overall aim of the study is to determine the predictors of recovery from anaemia in
patients on HAART within the Themba-Lethu Clinical Cohort (TLC) in Johannesburg, South
Africa. The specific objectives are:
1. To describe the distribution of haemoglobin levels among this cohort of patients
initiating HAART at the TLC
2. To determine the incidence of recovery from anaemia among patients in this cohort
who have anaemia at initiation of HAART
3. To determine the predictors of recovery from anaemia among patients who have
anaemia at HAART initiation
8
2 CHAPTER 2: METHODS
2.1 Introduction
This chapter describes the study design, setting, population and data management.
Eligibility criteria are described in detail as well as the definitions of study variables used.
The TLC dataset used for analysis is also described here, and so are the measures taken to
ensure data quality. The chapter ends with a review of the data processing methods and
ethical considerations.
2.2 Study design
This study utilised secondary data prospectively collected from the TLC cohort.
2.3 Study setting and population
The TLC is a prospective clinical cohort of adults initiating antiretroviral therapy in
Johannesburg, South Africa. The program is funded by the South African National and
Gauteng Department of Health, with support from Right to Care funded by USAID and
PEPFAR. The Themba-Lethu Clinic at the regional Helen Joseph Hospital in urban
Johannesburg has over 24 000 patients in care and is currently the largest single clinic
providing antiretroviral therapy in South Africa, and one of the largest antiretroviral
therapy clinics worldwide; that is why it was chosen as the study site, and it is likely to be
representative of urban adult HIV care in the South African public sector.
Patients are referred to the clinic from voluntary counselling and testing clinics, hospitals,
prenatal care facilities, other ART clinics or by self-referral. HAART-eligible patients attend
educational and adherence sessions, and are assessed by a physician prior to initiating
treatment. These study patients are followed up as per normal routine care at the TLC.
The program started in 2004 and the details of this cohort can be found elsewhere (35).
According to 2004 South African HIV treatment guidelines in force during this study
period, patients are eligible for initiation of HAART at; CD4 cell count of less than 200
cell/mm3 or if they have TB co-infection and CD4 cell count of less than 350 cell/mm3 and
or if they have WHO stage IV and CD4 cell count of less than 350 cell/mm3 (36, 37). During
the period of this study, most patients were initiated on to efavirenz (EFV), lamivudine

9
(3TC) and stavudine (d4T) regimen. Only patients with contraindication to d4T at HAART
initiation were given zidovudine (AZT) in place of d4T. All clinical and laboratory
evaluations are done as per relevant clinical indication and specimens are analysed at the
National Health Laboratory Services (NHLS) which has a branch at Helen Joseph Hospital.
The TLC database integrates and downloads all laboratory results electronically from the
NHLS, ensuring high quality, complete data. The CD4 cell count is repeated every 6
months and HIV viral load is repeated annually. The laboratory result obtained closest to
the start of HAART was used as baseline, and this value had to be less than 3 months
prior to HAART initiation or 15 days after HAART initiation. Pre-antiretroviral therapy care
includes adherence counselling and is scheduled every 3 months, depending on the
patient’s CD4 cell count (35), hence baseline haemoglobin was chosen to be no more than
3 months. HIV infected, antiretroviral therapy naive patients were categorised according
to their baseline Hb level using the WHO toxicity grading systems for anaemia (38).
Patient records (visit scheduling, demographics, laboratory results and clinical
investigations) are stored electronically on a patient management and decision making
support system, Therapy-Edge-HIVTM (Associated Biological Systems-SA) database,
allowing for efficient secondary data analysis. Data is collected longitudinally at the TLC
as part of routine care. Clinical data is collected at all scheduled visits, and laboratory
tests are collected as TLC treatment protocols and whenever clinically indicated.
We extracted data from this electronic database for the current analysis.
2.4 Sampling strategy: sample size calculation
All patients initiating first line HAART between 1st April 2004 and 30th June 2010 and
fulfilling the inclusion criteria were included for analyses. Nearly 19 000 people have been
initiated on HAART since April 2004 to June 2010, and we expected about 11 000 patients
to fulfil the inclusion criteria of which about 25% (n=3 000 plus) will be anaemic (29). Using
the Log-rank test for sample size and power estimation, assuming an alpha of 5% and
assuming that more than 70% of the patients will recover from anaemia and an effect
10
size hazard ratio (HR) of 1.5, our estimated sample size of 3 000 will be highly powered
(>90%).
2.5 Study cohort eligibility criteria
The initial study sample consisted of 12,441 adults who initiated HAART at the TLC
between 1st April 2004 and 30th June 2010 and met the inclusion criteria described below.
2.5.1 Inclusion criteria:
Patients should be HIV infected and at least 18 years of age
Patients should be ART naive and initiating standard first line HAART
Patients should have baseline and at least two subsequent haemoglobin
measurements
2.5.2 Exclusion criteria:
Pregnant women and women in the post-partum period (within 6 weeks post-
delivery)
Patients on agents which enhance haematopoiesis (e.g. iron supplements,
transfusion etc., which might confound association between ARV and Hb levels).
2.6 Definition of variables
2.6.1 Outcome variable
Recovery from anaemia was defined as the first time point at which there was resolution
of a previous low baseline haemoglobin (<10 g/dl) to within normal levels (≥10 g/dl)
during the study follow up period.
Anaemia was defined according to the WHO toxicity grading systems for anaemia as Hb
less than 10 g/dl (38). In addition, Hb less than 10 g/dl was chosen so that our study is
comparable with most local studies (5).
Patients were followed for a maximum of 75 months (1st April 2004 to 30th June 2010),
and recovery from anaemia was the event/failure of interest.

11
2.6.2 Study variables (possible explanatory variables)
These were extracted from the Therapy-Edge database TM
Demographic characteristics
Sex; was defined as sex of adult participant (female or male)
Age; was defined as age of adult participant (in years) at HAART initiation time
and it was categorized as 18-21, 21-30, 30-40, 40-50 and more than 50 years.
Socio-economic characteristics
Employment status; was defined as whether the adult participant is employed or
not at HAART initiation.
Education status; was defined as the maximum level of education attained by the
participant at initiation of HAART. It was categorized into: none, primary,
secondary and tertiary.
Smoking status; was defined as whether or not the adult participant smoked at
initiation of HAART.
Alcohol use status; was defined as whether or not the adult participant was taking
alcohol at HAART initiation.
Clinical measurements
Body mass index (BMI); was defined as (weight)/(height)², in kg/m², at HAART
initiation. BMI was categorized as; underweight (BMI<20), normal (BMI 20-25),
overweight (BMI 25-30) and obese (BMI>30) (39).
WHO HIV/AIDS clinical staging; was defined as the clinical grade of the adult
participant at HAART initiation according to the WHO clinical staging guideline
(grade 1 to 4) (Appendix B).
Previous TB; was defined as whether or not the adult participant had TB during
HAART initiation. TB was diagnosed through ZN smear and chest X-rays
Previous milliary TB; was defined as whether or not the adult participant had
milliary TB during HAART initiation.
Plasma HIV viral load after HAART initiation; was defined as the first HIV load
(copies per millilitre) in an adult participant measured up to 7 months after
initiation. It was categorized into; undetectable (<400 copies/ml) and detectable
(>=400 copies/ml).

12
Baseline CD4 cell count was defined as the CD4 cell count (cells per cubic
millimetre) closest 6 months before or 7days post HAART initiation of an adult
participant. It was categorized as <50, 50-200 and >200 cells/mm3 as most
participants were severely immuno-suppressed.
2.7 Data cleaning and quality checks
All data analyses were conducted in STATA release 12 (Stata Corp., College Station, Texas,
US). Variables were tabulated and ‘codebook’ command was used to check for missing
data. Missing observations within variables were categorized and analyzed for their
influence on the outcome. Range checks for outliers were done by summarizing variables
in STATA and using histograms, box and whisker plots for continuous variables. Duplicates
were removed from the dataset. Inconsistencies in the data were checked e.g. checking
whether dates of HAART initiation preceded dates of censoring/close of data-set.
2.8 Data analysis
To achieve objective 1 of the study (description of the distribution of haemoglobin levels
among this cohort of patients initiating HAART at the TLC), a cross-sectional study of all
subjects in TLC cohort was used. Their demographic, socio-economic and clinical
characteristics at enrolment into study were stratified by Hb level (anaemic/not anaemic)
and summarized using proportions (for categorical variables like gender, ethnicity, WHO
clinical stage) and means/medians (for numerical variables like CD4 cell counts, Viral load,
age). Chi-squared tests were performed for all categorical variables to test for differences
or associations between anaemic and non-anaemic subjects at baseline and Student’s t-
test was used for continuous variables like haemoglobin, and CD4 cell count. Frequency
tables and charts (pie and bar) were used to display summary statistics. The cohort
variables were described and are presented in Table 1.
To achieve study objective 2, (to determine the incidence of recovery from anaemia
among patients in this cohort who have anaemia at initiation of HAART), a prospective
study for all those who were initially anaemic at baseline was conducted. Patients were
followed for a maximum of 75 months and those who recovered from anaemia during
13
the period were censored at the time of recovery. The total person time was time
contributions by each participant until; recovery from anaemia, LTFU, transfer out and
death. These were used to help calculate the incidence rates of recovery from anaemia.
Proportions and incidence rates of recovery from anaemia per 100 person-years were
computed.
To achieve study objective 3, (to determine the predictors of recovery from anaemia
among patients who have anaemia at HAART initiation), a prospective study of all those
who were initially anaemic at baseline was conducted. Association of categorical
explanatory variables with recovery from anaemia was investigated using the Chi-squared
test. Our sample size (of 2,489) was large enough to assume normality among the factors.
Time to event analysis was the main method of analysis used; where the event of interest
was recovery from anaemia. The exact date of baseline haemoglobin measurement was
not available in the data-set, so the day of HAART initiation was assumed to be the day of
baseline haemoglobin measurement. For all patients, person-time was accrued from date
of HAART initiation until the earliest of: 1) their last clinic visit date; 2) date of loss to
follow up to the clinic; 3) death or 4) close of the data set or 5) recovery from anaemia.
Patients who transferred out during follow-up were censored at their last clinic visit date.
Patients were periodically seen every 6 months at TLC and those patients lost to follow-
up were censored 3 months after their last clinic visit (mid-way to follow up). Mortality at
TLC is verified with the South African National Vital Registration system. Period incidence
rates and cumulative probabilities of recovery from anaemia at initiation were calculated.
Log-rank tests of equality across strata were done to compare Kaplan Meier curves; for all
possible categorical predictors. Kaplan-Meier estimates of recovery from anaemia at
initiation were determined. Cox proportional hazard models were fitted to investigate
associations between baseline characteristics with recovery from anaemia. Covariates
that influenced recovery from anaemia that had a p-value <0.25 in the univariate
analyses were included in the multivariable Cox models. The 0.25 level was used as a
selection criterion because all the predictors in the data set are variables that could be
relevant to the model and studies have shown that using a lower level (e.g. the traditional
0.05 level) often fails to identify variables that may be important. Variables will be
14
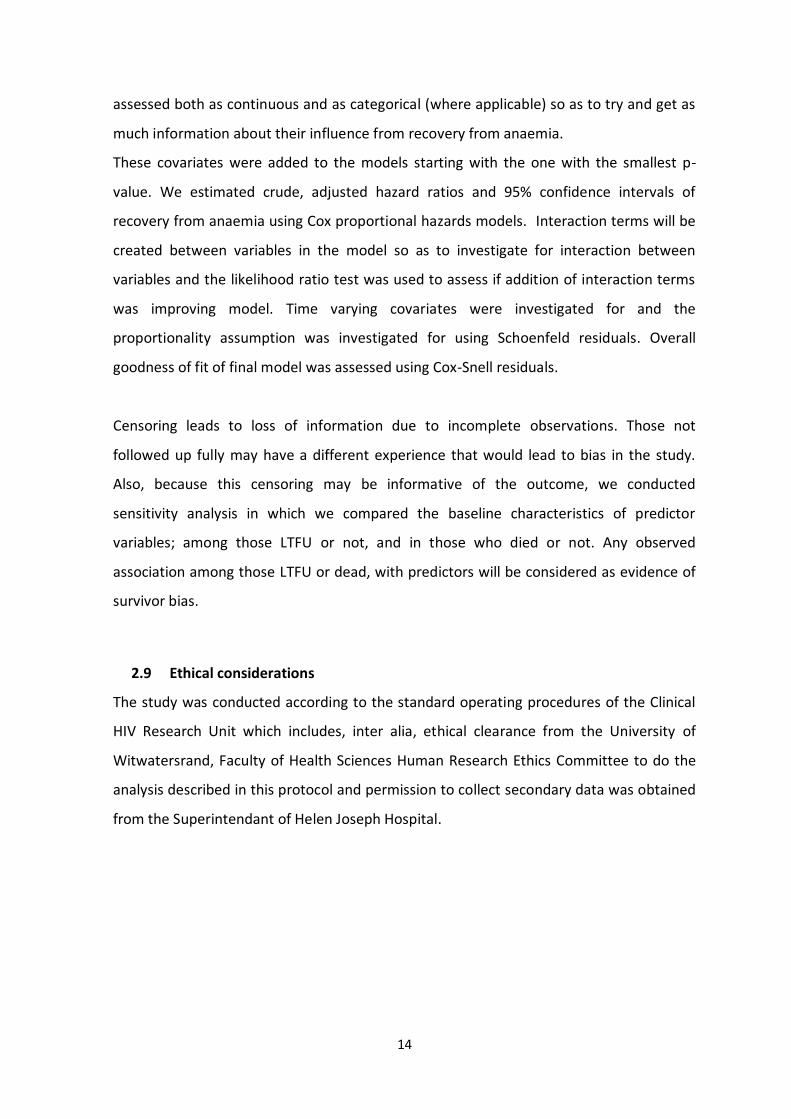
assessed both as continuous and as categorical (where applicable) so as to try and get as
much information about their influence from recovery from anaemia.
These covariates were added to the models starting with the one with the smallest p-
value. We estimated crude, adjusted hazard ratios and 95% confidence intervals of
recovery from anaemia using Cox proportional hazards models. Interaction terms will be
created between variables in the model so as to investigate for interaction between
variables and the likelihood ratio test was used to assess if addition of interaction terms
was improving model. Time varying covariates were investigated for and the
proportionality assumption was investigated for using Schoenfeld residuals. Overall
goodness of fit of final model was assessed using Cox-Snell residuals.
Censoring leads to loss of information due to incomplete observations. Those not
followed up fully may have a different experience that would lead to bias in the study.
Also, because this censoring may be informative of the outcome, we conducted
sensitivity analysis in which we compared the baseline characteristics of predictor
variables; among those LTFU or not, and in those who died or not. Any observed
association among those LTFU or dead, with predictors will be considered as evidence of
survivor bias.
2.9 Ethical considerations
The study was conducted according to the standard operating procedures of the Clinical
HIV Research Unit which includes, inter alia, ethical clearance from the University of
Witwatersrand, Faculty of Health Sciences Human Research Ethics Committee to do the
analysis described in this protocol and permission to collect secondary data was obtained
from the Superintendant of Helen Joseph Hospital.
15
3 CHAPTER 3: RESULTS
3.1 Introduction
This section provides results with the aim of providing answers to the objectives of the
study. The chapter begins by presenting overall TLC cohort characteristics and the
incidence of recovery from anaemia. It proceeds to describe the anaemic cohort and
associations between cohort characteristics and recovery from anaemia are explored and
predictors of recovery from anaemia are identified. The chapter ends with evaluation of
the fitness of the model with predictors of recovery from anaemia.
3.2 Description of overall TLC cohort initiating HAART
A total of 12,441 HIV positive patients were initiated into HAART between 1st April 2004
and 30th June 2010. Table 1 below shows baseline characteristics of patients in the TLC
cohort.
Table 1: Overall TLC cohort characteristics at enrolment (n=12 441)
Characteristics Total, n (%) Anaemic, n (%) Non anaemic, n (%) P-value ¶
Total 12 441 3 299 (26.5%) 9 142 (73.5%)
Gender Females Males
7 645 (61.5) 4 796 (38.5)
2 375 (31.1) 924 (19.3)
5 270 (68.9) 3 872 (80.7)
<0.001
Mean Hb, g/dl (SD) 11.4 (2.23) 8.7 (1.12) 12.4 (1.57)
First regimen § d4T/3TC/EFV d4T/3TC/NVP AZT/3TC/EFV AZT/3TC/NVP
10 989 (88.3) 988 (7.9) 416 (3.4) 48 (0.4)
3 034 (27.6) 201 (20.3) 60 (14.4) 4 (8.3)
7 955 (72.4) 787 (79.7) 356 (85.6) 44 (91.7)
<0.001
Age categories (years) <21 21-30 30-40 40-50 >50
132 (1.1) 2 314 (18.5) 5 699 (45.8) 3 118 (25.1) 1 178 (9.5)
46 (34.9) 683 (29.5) 1 536 (27.0) 770 (24.7) 264 (22.4)
86 (65.1) 1 631 (70.5) 4 163 (73.0) 2 348 (75.3) 914 (77.6)
<0.001
Median age (IQR) 36.4 (31.3- 42.9)
35.5 (30.7- 42) 36.7 (31.6- 43.1)
CD4 base line (cells/mm3)
<100 100-200 200-350 >350
6 745 (54.2) 4 355 (35.0) 1 341 (10.8) 0
2 237 (33.2) 867 (19.9) 195 (14.5) 0
4 508 (66.8) 3 488 (80.1) 1 146 (85.5) 0
<0.001
Mean CD4 base line 100.9 (76.0) 77.9 (68.0) 109.3 (77.0)

16
Characteristics Total, n (%) Anaemic, n (%) Non anaemic, n (%) P-value ¶
(cells/mm3) S.D
Education category None Primary Secondary Beyond Unknown
704 (4.0) 1 487 (9.0) 5 906 (47.0) 365 (2.0) 3 979 (38.0)
181 (25.7) 380 (25.5) 1 505 (25.5) 84 (23.0)
523 (74.3) 1 107 (74.5) 4 401 (74.5) 281 (77.0)
0.760
Employment status Employed Not employed
5 715 (45.9) 6 726 (54.1)
2 059 (30.6) 1 240 (21.7)
4 667 (69.4) 4 475 (78.3)
<0.001
Smoking status Yes No
1 235 (9.9) 11 206 (90.1)
216 (17.5) 3 083 (27.5)
1 019 (82.5) 8 123 (72.5)
<0.001
Alcohol use status Yes No
1 326 (10.7) 11 115 (89.3)
222 (16.7) 3 077 (27.7)
1 104 (83.3) 8 038 (72.3)
<0.001
WHO clinical staging †
1 2 3 4 Missing
4 474 (36.0) 1 901 (15.3) 3 760 (30.2) 1 270 (10.2) 1 036 (8.3)
830 (18.5) 418 (22.0) 1 271 (33.8) 534 (42.0)
3 644 (81.5) 1 483 (78.0) 2 489 (66.2) 736 (58.0)
<0.001
BMI category € Underweight Normal Overweight Obese Unknown
4 077 (32.8) 4 707 (37.8) 1 694 (13.6) 728 (5.9) 1 235 (9.9)
1 500 (36.8) 1 053 (22.4) 264 (15.6) 64 (8.8)
2 577 (63.2) 3 654 (77.6) 1 430 (84.4) 664 (91.2)
<0.001
TB prior HAART Yes No Unknown
1 953 (15.6) 10 481 (84.3) 7 (0.1)
816 (41.8) 2 478 (23.6)
1 137 (58.2) 8 003 (76.4)
<0.001
Last HIV Viral Load Undetectable Detectable
3 404 (27.4) 9 036 (72.6)
1 139 (33.5) 2 160 (23.9)
2 265 (66.5) 6 876 (76.1)
<0.001
Final status Alive Dead LFTU Trans. out
5 981 (48.09) 1 783 (14.3) 4 675 (37.59) 2 (0.02)
1 305 (21.8) 690 (38.7) 1 303 (27.9) 1 (50.0)
4 676 (78.2) 1 093 (61.3) 3 372 (72.1) 1 (50.0)
<0.001
¶ P value for chi squared test for categorical variables, Student’s t test for normally distributed continuous variables and Wilcoxon Rank-sum test for non-normal continuous variables § ART initiation combinations according to 2004 RSA D.o.H (36) † WHO clinical staging (see Appendix B for details) € BMI categorization (see Appendix C for details).
Of the 12,441 subjects enrolled, 7,645 (61.5%) were females and 4,796 (38.5%) were
males. Overall median age for cohort was 36.4 years (IQR: 31.3- 42.9). The mean

17
haemoglobin of cohort at enrolment was 11.4 g/dl (SD: 2.23); anaemic subjects had mean
haemoglobin of 8.7 g/dl (SD: 1.12) and non anaemic had 12.4 g/dl (SD: 1.57). At
enrolment, anaemic subjects were 3,299 (26.5%), while non anaemic individuals were
9,142 (73.5%). Prevalence of anaemia at enrolment within the overall TLC cohort was
27%.
The majority of subjects enrolling were of age group 30-40 years (45.8%), followed by 40-
50 years (25.1%), while 21-30, <21 and >50years categories had 18.6%, 1.1% and 9.5%
respectively. As seen from Table 1 above, there was a statistically significant association
between all variables and anaemia status (all p<0.05) with the exception of variable
education level.
The majority of those enrolled, 10,989 (88.3%), were initiated on
stavudine/lamivudine/efavirenz regimen while less than 4% were initiated on zidovudine
containing regimen.
The greatest amount of enrolment into HAART programme was in 2009 with 2 413
(19.4%) subjects, followed by 2006 with 2 328 (18.7%). Years 2010 and 2004 had the
lowest enrolment percentages (4.8% and 9.6% respectively), Figure 1 below.
Figure 1: Proportion of subjects enrolled into TLC cohort by year of enrolment
0
5
10
15
20
2004 2005 2006 2007 2008 2009 2010
Pro
po
rtio
n (%
)
Year of enrolment
Proportion enrolled into cohort by year (1st April -30th June 2010)
18
At enrolment, the majority of subjects had WHO HIV/AIDS clinical stage 1 (n=4 474;
36.0%), while WHO HIV/AIDS clinical stage 2, 3 and 4 had 1,901 (15.3%), 3,760 (30.2%)
and 1,270 (10.2%) respectively. 1,036 (8.3%) had missing data on WHO HIV/AIDS clinical
staging.
At initiation, TB was present in 1,953 (15.7%) subjects. The majority of the cohort
enrolees, were secondary school graduates (n=5,906 (47%),) while a smaller fraction had
more than secondary education (n=365 (2%)). About 3,979 (38%) had unknown education
status, while 704 (4%) had no education.
In the TLC cohort, 4,707 (37.8%) of the subjects had normal BMI, whilst 4,077 (32.8%)
were underweight. Overweight subjects were 1,694 (13.6%), whilst obese were 728
(5.9%) and 1,235 (9.9%) were of unknown BMI category.
The greater part of subjects at initiation (n=6,745 (54.2%)) were immuno-deficient
(CD4<100 cells/mm3) while 4,355 (35%) had CD4 cell count between 100-200 cells/mm3
at initiation. The overall mean CD4 cell count for TLC cohort was 101 cells/uL (SD=76.0).
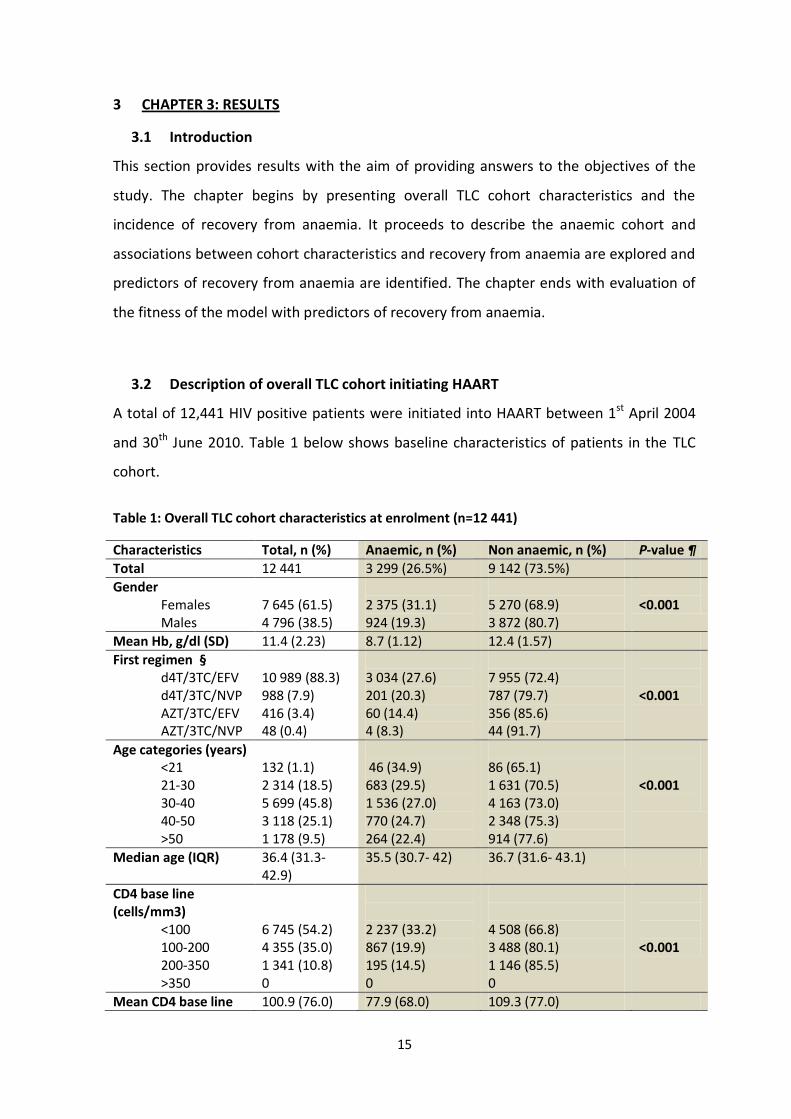
Males were more likely to be immuno-deficient at initiation compared to females. The
majority of anaemic subjects at enrolment had baseline CD4 cell count less than 100
cells/mm3, whilst most of the non-anaemic subjects had baseline CD4 cell count of more
than 200 cells/mm3 (Figure 2 below).
Figure 2: Anaemia status at baseline by baseline CD4 cell count category
0
20
40
60
80
100
<100 100-200 >200
Pro
po
rtio
n (%
)
CD4 cell count (cells/mm3)
Anaemia status at baseline by CD4 cell count category
Anaemic Non anaemic

19
As from 1st April 2004 to 30th June 2010, the mortality rate for the TLC cohort was 143 per
1000 people, and it was highest in age group category 30-40 years.
By the close of the data-set, on 30th June 2010, 48% of the cohort was still alive, while
37.6% were lost to follow up and 14.3% were dead (Figure 3 below).
Figure 3: Final status of overall TLC cohort by close of data-set.
Four thousand six hundred and seventy five (37.6%) participants left the TLC programme
during follow-up. However, these patients were similar to the alive by close of data-set in
terms of; sex, age, recovery from anaemia, CD4 cell count, among other variables.
However, the potential impact of LTFU should not be underestimated because among
these 37.6% participants, it is unknown how many might have died soon after leaving TLC
cohort - hence resulting in an under-estimate of the true cohort mortality. Studies in
similar HIV cohorts have shown that mortality is usually under-estimated when patients
are LTFU and not actively traced (40).
Alive48.09%
Dead14.30%
LTFU37.59%
Transf. Out0.02%
Final status of cohort at close of data-set, 30th June 2010
20
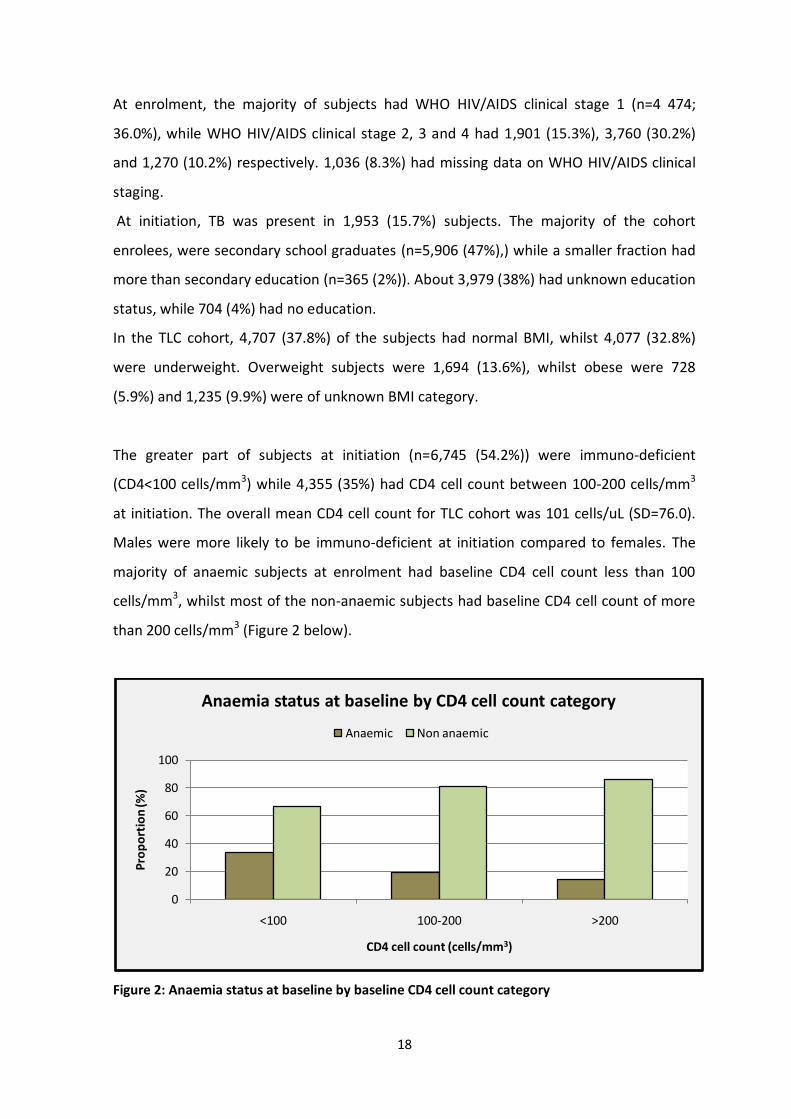
3.3 Characteristics of anaemic cohort at baseline
Within the 12,441 participants in the TLC cohort, 3,299 were anaemic, and among these
anaemic participants, only 2,489 met the eligibility criteria for further analysis.
The flow chart below summarises inclusion criteria for the anaemic study cohort.
Figure 4: Anaemic cohort study profile flow chart
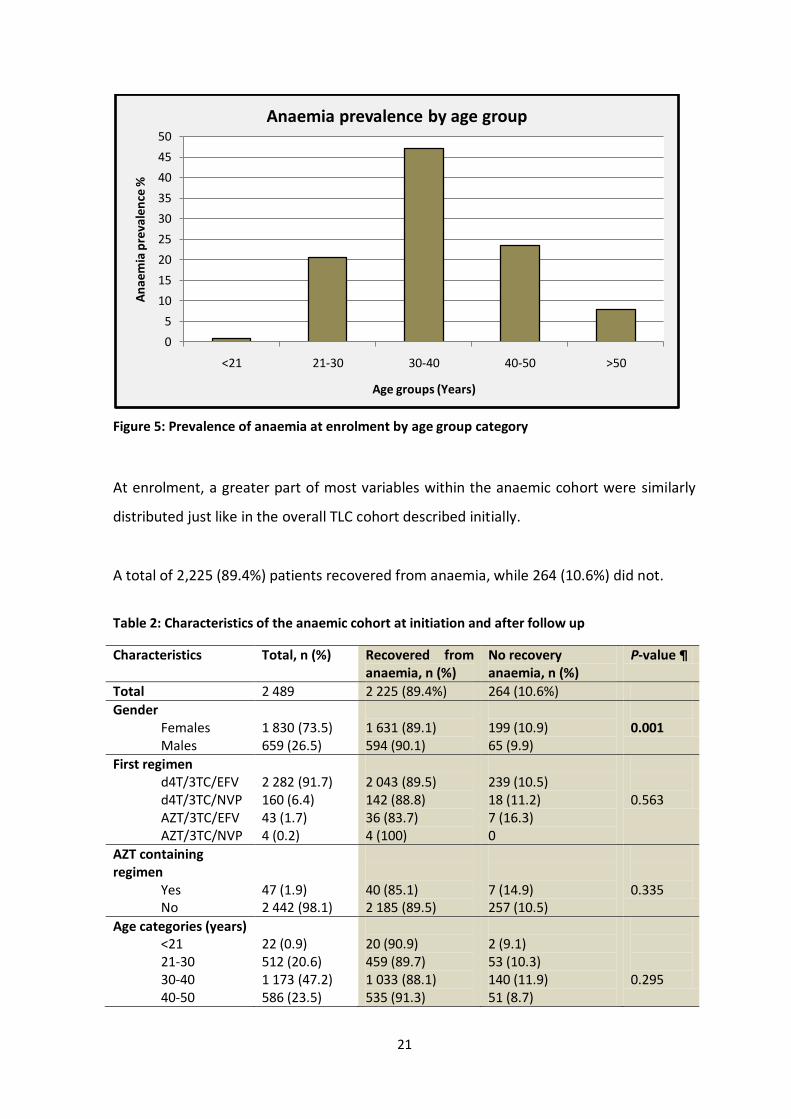
Among the anaemic subjects, the 30-40 years age group had the highest prevalence of
anaemia at enrolment as shown in figure 5 below.
45 Excluded: <18 years at initiation
3,254 HIV infected anaemic adult patients in cohort
12,441 HIV infected patients with Hb baseline values
3,299 HIV infected anaemic patients in cohort
9,142 Excluded: Non anaemic
765 Excluded: Missing follow up time and or follow up time >6.2years or <0
2,489 HIV infected anaemic adult patients in cohort
21
Figure 5: Prevalence of anaemia at enrolment by age group category
At enrolment, a greater part of most variables within the anaemic cohort were similarly
distributed just like in the overall TLC cohort described initially.
A total of 2,225 (89.4%) patients recovered from anaemia, while 264 (10.6%) did not.
Table 2: Characteristics of the anaemic cohort at initiation and after follow up
Characteristics Total, n (%) Recovered from anaemia, n (%)
No recovery anaemia, n (%)
P-value ¶
Total 2 489 2 225 (89.4%) 264 (10.6%)
Gender Females Males
1 830 (73.5) 659 (26.5)
1 631 (89.1) 594 (90.1)
199 (10.9) 65 (9.9)
0.001
First regimen d4T/3TC/EFV d4T/3TC/NVP AZT/3TC/EFV AZT/3TC/NVP
2 282 (91.7) 160 (6.4) 43 (1.7) 4 (0.2)
2 043 (89.5) 142 (88.8) 36 (83.7) 4 (100)
239 (10.5) 18 (11.2) 7 (16.3) 0
0.563
AZT containing regimen
Yes No
47 (1.9) 2 442 (98.1)
40 (85.1) 2 185 (89.5)
7 (14.9) 257 (10.5)
0.335
Age categories (years) <21 21-30 30-40 40-50
22 (0.9) 512 (20.6) 1 173 (47.2) 586 (23.5)
20 (90.9) 459 (89.7) 1 033 (88.1) 535 (91.3)
2 (9.1) 53 (10.3) 140 (11.9) 51 (8.7)
0.295
0
5
10
15
20
25
30
35
40
45
50
<21 21-30 30-40 40-50 >50
An
aem
ia p
reva
len
ce %
Age groups (Years)
Anaemia prevalence by age group

22
Characteristics Total, n (%) Recovered from anaemia, n (%)
No recovery anaemia, n (%)
P-value ¶
>50 196 (7.8) 178 (90.8) 18 (9.2)
Mean age (S.D) 36.7 (8.6) 36.8 (8.6) 36.1 (8.3)
CD4 base line (cells/mm3)
<50 50-200 >200
1 062 (42.7) 1 265 (50.8) 162 (6.5)
946 (89.1) 1 133 (89.6) 146 (90.1)
116 (10.9) 132 (10.4) 16 (9.9)
0.886
Mean CD4 base line (cells/mm3) S.D
82.45(69.2) 82.5 (69.5) 80.6 (66.8)
Education category None Primary Secondary Beyond Unknown
123 (4.9) 304 (12.3) 1 225 (49.2) 70 (2.8) 767 (30.8)
114 (92.7) 277 (91.1) 1 112 (90.8) 62 (88.6)
9 (7.3) 27 (8.9) 113 (9.2) 8 (11.4)
0.809
Employment status Employed Not employed
959 (38.5) 1 530 (61.5)
873 (91.0) 1 352 (88.4)
86 (9.0) 178 (11.6)
0.036
Smoking status Yes No
161 (6.5) 2 328 (93.5)
151 (93.8) 2 074 (89.1)
10 (6.2) 254 (10.9)
0.061
Alcohol use status Yes No
173 (7.0) 2 316(93.0)
159 (91.2) 2 066 (89.2)
14 (8.8) 250 (10.8)
0.266
WHO clinical staging 1 2 3 4 Missing
647 (26.0) 312 (12.5) 975 (39.2) 375 (15.1) 180 (7.2)
585 (90.4) 267 (85.6) 885 (90.8) 329 (87.7)
62 (9.6) 45 (14.2) 90 (9.2) 46 (12.3)
0.067
BMI category Underweight Normal Overweight Obese Unknown
1 105 (44.4) 851 (34.2) 219 (8.8) 55 (2.2) 259 (10.4)
985 (89.1) 782 (91.9) 196 (85.9) 47 (85.4)
120 (10.9) 69 (8.1) 23 (10.1) 8 (14.6)
0.131
TB prior HAART Yes No Unknown
646 (26) 1 838 (73.8) 5 (0.2)
598 (92.6) 1 623 (88.3)
48 (7.4) 215 (11.7)
0.008
HIV Viral Load Undetectable Detectable Missing
1 905 (76.5) 192 (7.7) 392 (15.8)
1 818 (95.4) 167 (87.0)
87 (4.6) 25 (13.0)
<0.001
Loss To Follow Up Yes No
866 (34.8) 1 623 (65.2)
732 (84.5) 1 493 (92.0)
134 (15.5) 130 (8.0)
<0.001
Dead Yes
337 (13.5)
217 (64.4)
120 (35.6)
<0.001
23
Characteristics Total, n (%) Recovered from anaemia, n (%)
No recovery anaemia, n (%)
P-value ¶
No 2 152 (86.5) 2 008 (93.3) 144 (6.7) ¶ P value for chi squared test for categorical variables, Student’s t test for normally distributed continuous variables and Wilcoxon Rank-sum test for non-normal continuous variables
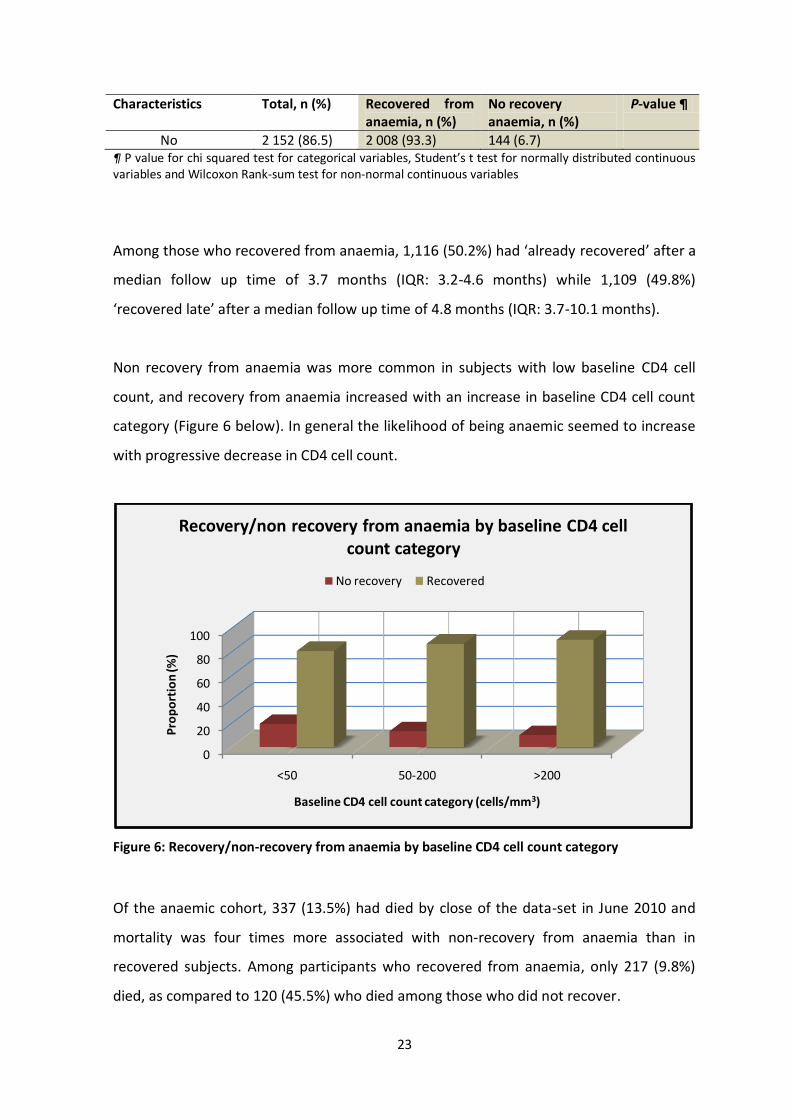
Among those who recovered from anaemia, 1,116 (50.2%) had ‘already recovered’ after a
median follow up time of 3.7 months (IQR: 3.2-4.6 months) while 1,109 (49.8%)
‘recovered late’ after a median follow up time of 4.8 months (IQR: 3.7-10.1 months).
Non recovery from anaemia was more common in subjects with low baseline CD4 cell
count, and recovery from anaemia increased with an increase in baseline CD4 cell count
category (Figure 6 below). In general the likelihood of being anaemic seemed to increase
with progressive decrease in CD4 cell count.
Figure 6: Recovery/non-recovery from anaemia by baseline CD4 cell count category
Of the anaemic cohort, 337 (13.5%) had died by close of the data-set in June 2010 and
mortality was four times more associated with non-recovery from anaemia than in
recovered subjects. Among participants who recovered from anaemia, only 217 (9.8%)
died, as compared to 120 (45.5%) who died among those who did not recover.
0
20
40
60
80
100
<50 50-200 >200
Pro
po
rtio
n (%
)
Baseline CD4 cell count category (cells/mm3)
Recovery/non recovery from anaemia by baseline CD4 cell count category
No recovery Recovered

24
3.4 Survival analysis results
During the study period, (1 April 2004 to 30 June 2010) a total of 2,225 (89.4%) patients
recovered from anaemia and of these, 1,631 (73.3%) were females and 594 (26.7%) were
males. Overall, they contributed 1 234.6 person years at risk and the incidence rate of
recovery from anaemia was 1.80 (180 events per 100 person years). The median time for
anaemia recovery was 3.87 months [Range: 3.2 - 6.2 months]. Table 4 below shows the
anaemia recovery incidence rates at given times of the cohort, and the period with the
highest recovery rate was 0 - 3 months from initiation (1.82) and the period with the least
recovery rate was > 6 months.
Table 3: Period incidence rates of recovery from anaemia.
Time (months) Person-time (years)
Anaemia recoveries
Anaemia recovery rate
95% Conf. Interval
0-3 1 213 2 205 1.818 1.74-1.90
3-6 21 19 0.888 0.57-1.39
>6 0.70 1 1.422 0.20-10.10
Total 24 208 2 225 1.802 1.73-1.88
Males had higher anaemia recovery incidence rates as compared to females (Figure 7
below). During the 0 - 3 months from HAART initiation, males had a recovery incidence
rate of 240 per 100 person years (py), and females had 170 per 100 py. During the 3-6
months follow-up time, males had recovery rates which were 2 times more than females
(males: 180/100 py, females: 80/100 py).

25
Figure 7: Anaemia recovery incidence rates (per person year) by gender
The overall study survival pattern (anaemia recovery pattern) is seen in the Kaplan-Meier
(K-M) survival plot below. The event/failure was ‘recovery from anaemia’ and Figure 8
below shows that as time progressed, patients recovered from anaemia and most of the
recoveries occurred within first 6 months. As time progressed, the probability of anaemia
decreased, as more patients recovered.
0
50
100
150
200
250
0-3months 3-6months >6months
An
aem
ia r
eco
very
inci
de
nce
rate
s(p
er
100p
y)
Time from HAART initiation (months)
Anaemia recovery incidence rates (per 100py) by gender
Males Females

26
Figure 8: Kaplan-Meier survival estimates of recovery from anaemia
3.5 Predictors of recovery from anaemia
3.5.1 Recovery from anaemia by individual predictors
The Kaplan-Meier curves were examined for all the categorical predictors. This gave
insight into the shape of the survival function for each group and gave an idea of whether
or not the groups are proportional (i.e. the survival functions are approximately parallel).
Tests of equality across strata to explore whether or not to include the predictor in
building a model were done, and variables that had a p< 0.25 on univariate analysis were
considered as potential candidates for the multivariable model. The non-parametric log-
rank test was used for all categorical variables (like sex and employment status) while Cox
proportional hazard regression (semi-parametric) was used for both categorical and
continuous variables (like CD4 cell count and HIV viral load).
0.0
00.2
50.5
00.7
51.0
0
2489 57 8 1 0 Number at risk
0 2 4 6 8Time from HAART initiation (Years)
TLC cohort 1 April 2004 to 30 June 2010
K-M survival estimate for anaemia recovery

27
Figure 9: Kaplan-Meier estimates of anaemia recovery by sex
Male participants had a better prognosis to recover from anaemia than females. The log-
rank test of equality across strata for the predictor ‘Sex’, was significant (p<0.001).
Figure 10: Kaplan-Meier estimates of anaemia recovery by HIV viral load
0.0
00.2
50.5
00.7
51.0
0
0 2 4 6 8Time from HAART initiation (Years)
Sex = Female Sex = Male
P<0.001
Sex0.0
00.2
50.5
00.7
51.0
0
0 2 4 6 8Time from HAART initiation (Years)
VL= Undetected VL= Detected
VL= Missing
P<0.001
HIV Viral Load

28
Participants with undetectable HIV viral load were more likely to recover from anaemia as
compared to patients with detectable HIV viral load. Those with missing HIV viral load
results were the least likely to recover.
Figure 11: Kaplan-Meier estimates of anaemia recovery by WHO anaemia grade
Participants with WHO anaemia grade 1 were more likely to recover from anaemia
compared to participants with WHO anaemia grade 2, 3 or 4. Participants with WHO
anaemia grade 4 were the least likely to recover from anaemia.
0.0
00.2
50.5
00.7
51.0
0
0 2 4 6 8Time from HAART initiation (Years)
Anaemia= WHO Grade 1 Anaemia=WHO grade 2Anaemia= WHO Grade 3 Anaemia=WHO Grade 4
P<0.001
WHO anaemia grade
29
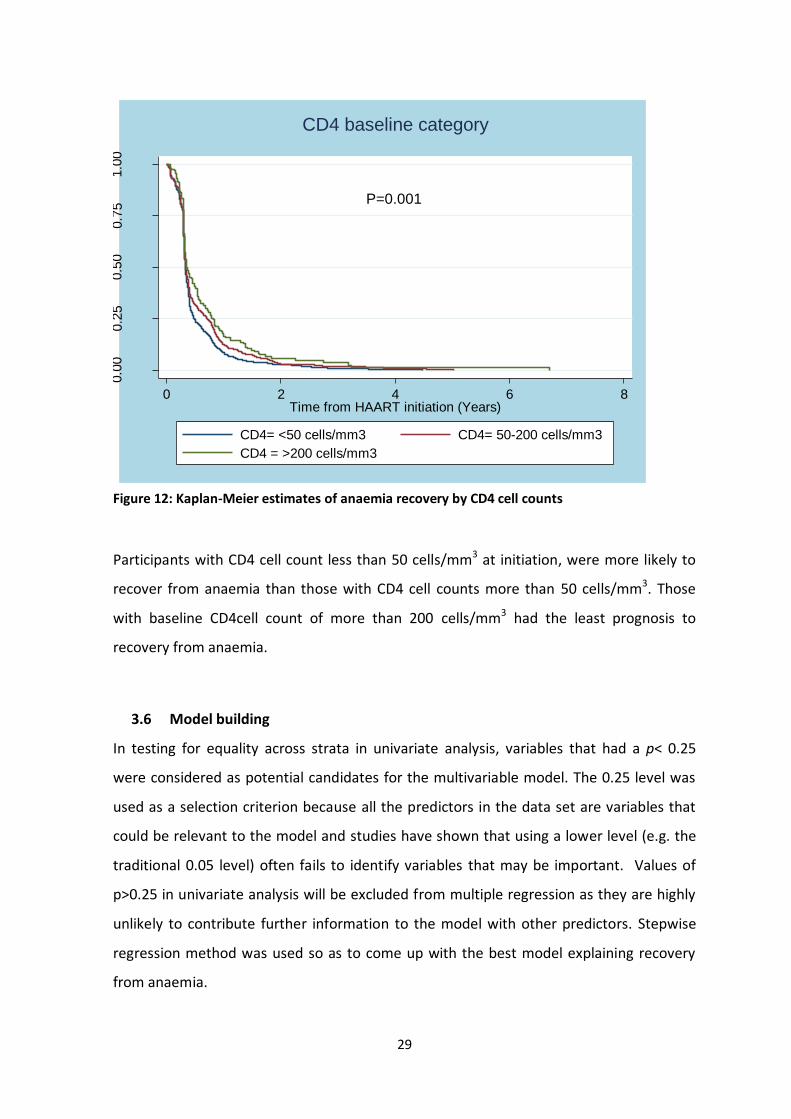
Figure 12: Kaplan-Meier estimates of anaemia recovery by CD4 cell counts
Participants with CD4 cell count less than 50 cells/mm3 at initiation, were more likely to
recover from anaemia than those with CD4 cell counts more than 50 cells/mm3. Those
with baseline CD4cell count of more than 200 cells/mm3 had the least prognosis to
recovery from anaemia.
3.6 Model building
In testing for equality across strata in univariate analysis, variables that had a p< 0.25
were considered as potential candidates for the multivariable model. The 0.25 level was
used as a selection criterion because all the predictors in the data set are variables that
could be relevant to the model and studies have shown that using a lower level (e.g. the
traditional 0.05 level) often fails to identify variables that may be important. Values of
p>0.25 in univariate analysis will be excluded from multiple regression as they are highly
unlikely to contribute further information to the model with other predictors. Stepwise
regression method was used so as to come up with the best model explaining recovery
from anaemia.
0.0
00.2
50.5
00.7
51.0
0
0 2 4 6 8Time from HAART initiation (Years)
CD4= <50 cells/mm3 CD4= 50-200 cells/mm3
CD4 = >200 cells/mm3
P=0.001
CD4 baseline category

30
Table 4: Factors associated with recovery from anaemia
Univariate analysis Multivariate analysis
Variable Crude HR 95% C.I P value Adjusted HR 95% C.I P value
Sex Females Males
1 1.45
1.38-1.60
<0.001
1 1.44
1.30-1.70
<0.001
First regimen d4T/3TC/EFV d4T/3TC/NVP AZT/3TC/EFV AZT/3TC/NVP
1 3.28 0.99 0.82
1.17-9.23 0.73-1.65 0.44-1.32
0.024 0.945 0.303
AZT containing regimen
No Yes
1 1.10
0.81-1.51
0.546
Age categories (years)
<21 21-30 30-40 40-50 >50
1 1.18 1.30 1.23 1.32
0.57-1.90 0.65-2.15 0.67-2.25 0.72-2.50
0.456 0.251 0.366 0.236
Age (Years) continuous
1.00
1.00-1.01
0.455
CD4 base line (cells/mm3)
<50 50-200 >200
1 0.86 0.72
0.77-0.94 0.62-0.87
0.001 <0.001
1 0.91 0.85
0.84-0.99 0.58-1.0
0.041 0.06
CD4 baseline (cells/mm3)
0.99
0.99-1.00
<0.001
0.99
0.99-1.00
0.05
Education category
None Unknown Primary Secondary Beyond
1 0.85 0.88 0.93 1.15
0.70-1.04 0.71-1.09 0.77-1.13 0.85-1.57
0.110 0.250 0.462 0.368
Employment status
Not employed Employed
1 1.12
1.04-1.32
0.011
1 1.08
0.99-1.18
0.077
Smoking status
No Yes
1 1.15
0.99-1.53
0.094
1 1.06
0.89-1.26
0.48

31
Variable Crude HR 95% C.I P value Adjusted HR 95% C.I P value
Alcohol use status
No Yes
1 1.04
0.83-1.30
0.642
WHO clinical staging
1 2 3 4 Missing
1 0.83 1.15 1.31 1.07
0.75-0.96 1.03-1.28 1.12-1.47 0.89-1.27
0.014 0.009 <0.001 0.479
1 0.83 1.06 1.16 1.01
0.65-0.97 0.90-1.25 1.00-1.43 0.71-1.31
0.017 0.395 0.142 0.912
BMI category Underweight Normal Overweight Obese Unknown
1 0.89 0.85 0.79 1.00
0.78-0.97 0.72-0.99 0.43-1.04 0.98-1.50
0.011 0.045 0.119 0.985
1 0.95 0.96 0.94 1.06
0.86-1.05 0.82-112 0.70-1.26 0.88-1.26
0.309 0.620 0.676 0.556
BMI 0.98 0.97-0.99 0.004 0.99 0.98-1.12 0.121
TB at HAART initiation
No Yes Unknown
1 1.24 0.97
1.05-1.37 0.34-2.51
0.001 0.943
1 1.09 0.95
1.40-1.53 0.35-2.60
0.345 0.989
HIV viral load Not detected Detected Missing
1 0.84 0.57
0.72-0.99 0.49-0.65
0.79 <0.001
1 0.91 0.89
0.78-1.08 0.73-1.08
0.288 0.245
Adjusted for other variables listed in final model OR: odds ratio, BMI: body mass index, TB: tuberculosis BMI= (Weight)/ (Height X Height), kg/m2
3.7 Multivariate analysis
As seen from above table; sex, CD4 cell count baseline category, BMI category, WHO
clinical stage category, employed, smoking, TB at initiation of ART, HIV viral load and first
ART regimen are significant in the univariate analysis. Using stepwise forward multi
regression, all the variables were individually added to the model and those not
improving the model (tested through likelihood ratio test) were dropped and later tested
for interaction. Some variables like; age at initiation, CD4 cell count and BMI were
analyzed both as categorical and as continuous so as to try and explore the effect they
may have on recovery from anaemia.
32
In multivariate Cox proportional hazards model, recovery from anaemia was strongly
predicted by Sex, CD4 cell count at baseline, HIV viral load and WHO clinical staging. BMI,
TB at initiation and type of HAART regimen did not significantly explain recovery from
anaemia.
3.8 Checking for possible interactions
Possible interactions could be from “education level and employment”, “sex and
smoking”, “age and BMI category”, “CD4 cell count and HIV viral load”, “sex and alcohol
use” and nothing was found significant. Certain expected interactions were not observed
and this might have been due to low number of subjects in some cells.
3.9 Testing of assumptions
One of the main assumptions of the Cox proportional hazard model is proportionality. If
the hazards experienced by different subgroups of the study population are not
proportional, then the proportional hazard model will not be appropriate for the data.
We checked proportionality assumption using Schoenfeld and Scan residuals and through
use of time varying covariates (tvc).
In testing for proportionality assumption, the global test was significant (p=0.028) and
this violated proportionality assumption. After removing the variable ‘WHO clinical
staging’ (because of its significant p-value; p=0.0036), the global test of proportional-
hazards assumption became in-significant (p value 0.317), showing that we did not
violate the proportionality assumption. Scaled Schoenfeld residuals plotted against time
showed no trend (no slope) for each predictor and this is further indication that there is
no violation of proportionality assumption (see Appendix A).
In addition, follow-up time was restricted to the first 12 months so as to further check for
non-proportional hazards and all variables met the proportional hazards assumption.
Due to the longitudinal feature of the data gathering process, some covariates could be
time-varying. We checked if there is different interaction of predictors with time (time

33
varying covariates) and all p-values were non-significant (p>0.05), showing lack of
violation of assumption for all predictors in the model. The ‘stvary’ command also
showed us that no variable varied with time. The conclusion is that all of the time-
dependent variables are not significant either collectively or individually thus supporting
the assumption of proportional hazards.
3.10 Evaluating goodness of fit of the final model
We evaluated the fit of the model using the Cox-Snell residuals, and the graph of the
residuals was well aligned to the graph of the Nelson-Aalen cumulative hazard, thereby
showing fit of the model.
Figure 13: Evaluation of final model fitness through Cox-Snell residuals
We see in the above graph that the hazard function follows the 45 degree line very
closely except for very large values of time. It is common for models with censored data
to have some wiggling at large values of time. Overall we conclude that the final model
fits the data very well.
01
23
45
67
8
0 1 2 3 4 5 6 7 8Cox-Snell residual
Nelson-Aalen cumulative hazard Cox-Snell residual
Goodness of fit of final model: Cox Snell residulas

34
3.11 Evaluating survivor bias
Sensitivity analysis was conducted, in which we compared the baseline characteristics of
those not followed up fully with those who were followed up fully. Those LTFU were 866
(34.8%) while those who died were 337 (13.5%). Chi-square test of association was done
between predictor variables; among those LTFU and not, and among those who died and
not. There was no association between all predictor variables and LTFU. However, some
predictor variables (CD4 cell counts and HIV viral load) were associated with outcome of
death with the exception of variable sex (Appendix F). This means that those who died
had different baseline characteristics from those who survived in terms of HIV viral load
and CD4 cell count.
3.12 Model interpretation
Table 5 below shows HRs of variables which were included in the final multivariate model
for recovery from anaemia in the TLC anaemic cohort. Sex, CD4 cell count at baseline, and
HIV viral load predicted recovery from anaemia among the anaemic TLC cohort.
Table 5: Multivariate Cox proportional hazards model for recovery from anaemia.
Multivariate Cox proportional analysis
Variable Adjusted HR 95% C.I P value
Sex Females Males
1 1.44
1.30-1.70
<0.001
CD4 baseline (cells/mm3)
0.99
0.99-1.00
0.050
HIV viral load (copies/ml) Not detected Detected Missing
1 0.93 0.89
0.79-1.09 0.74-1.08
0.359 0.253
WHO clinical staging 1 2 3 4 Missing
1 0.83 1.06 1.16 1.01
0.65-0.97 0.90-1.25 1.00-1.43 0.71-1.31
0.017 0.395 0.142 0.912

35
After adjusting for HIV viral load and baseline CD4 cell count; males were 1.44 times more
likely to recover from anaemia [HR: 1.44 (95% CI: 1.30-1.70)] compared to females.
Patients with detectable HIV viral load were 7.0% less likely to recovery from anaemia
[HR: 0.93, (95% CI: 0.79-1.09)] compared to patients with undetectable HIV viral load.
Those with missing HIV viral load results were 11% less likely to recover from anaemia
[HR: 0.89, (95% CI: 0.74-1.08)].
After adjusting for all other factors, participants who had baseline WHO clinical stage 2
were 17% less likely to recover from anaemia compared to participants who had baseline
WHO clinical stage 1 [HR: 0.83, (95% CI: 0.65-0.97) p=0.017]. However, results for
participants with baseline WHO clinical staging 3 and 4 were not significant.
An increase of baseline CD4 cell counts seemed protective against recovery from
anaemia. For every unit increase in baseline CD4 cell count, participants were less likely
to recover from anaemia after adjusting for WHO clinical staging, HIV viral load and sex,
[HR: 0.99, (95% CI: 0.99-1.00) p=0.050].

36
4 CHAPTER 4: DISCUSSION
4.1 Introduction
The study aimed to describe the distribution of haemoglobin levels among this cohort of
patients initiating HAART at the TLC and to determine the incidence of recovery from
anaemia among patients in this cohort who have anaemia at initiation of HAART. The
study also aimed to determine the predictors of recovery from anaemia among patients
who have anaemia at HAART initiation. The findings of the study are discussed below
with respect to each objective. To our knowledge, this is the first study to demonstrate
predictors of recovery from anaemia in a cohort of HIV positive subjects.
4.2 Baseline characteristics of TLC cohort
This TLC HIV cohort had 12,441 subjects initiated into HAART between 1st April 2004 and
30th June 2010, through the 2004 South African HIV National HIV treatment guidelines.
At enrolment, 7,645 (61.5%) of participants in the TLC cohort were females and this is in
line with findings from HIV cohorts in sub-Saharan Africa which have reported majority of
enrolees as females (27). Within this TLC cohort, 26.5% of the subjects were anaemic at
baseline HAART initiation. Of the anaemic subjects, 72% were women, thus reflecting the
overall higher prevalence of anaemia in women due to menstrual blood loss and multiple
deliveries. Our results showed that the overall prevalence of anaemia in this cohort at
HAART initiation was 27%, and this compares well with results from prior studies. In a
multi-centre study, Zhou et.al in 2010 reported anaemia prevalence of 29% in East Africa,
21% in Southern Africa, 36% in Central Africa and 45% in Western Africa (5). The
prevalence of anaemia was highest among subjects with CD4 cell count less than
100cells/mm3, which echoes the fact that the risk of anaemia is higher with advanced HIV
infection (28).
Many different studies done in Southern African HIV cohorts, have reported varying
prevalence of anaemia at HAART initiation. Present day HIV infected cohorts might be
having anaemia prevalence less than ours, since participants are initiated on HAART with
CD4cell count <350 cell/mm3, and as such, they are probably less immuno-compromised
than this cohort which initiated HAART with CD4 cell count <200 cells/mm3.

37
The majority of the anaemic subjects in the overall cohort (43.6%) had WHO grade 1
anaemia (mild) and only few (3.4%) had WHO grade 4. Such a finding is also consistent
with other previous findings from HIV cohorts which have reported between 40-60%
prevalence of WHO grade 1 anaemia (17, 32, 34) at baseline.
Most of the subjects enrolling into this HAART cohort were of age group 30 – 40 years
(n=5 699; 45.8%), while the least were the less than 21 years (n=132; 1.1%). This is
consistent with 2009 findings from National Antenatal Sentinel HIV & Syphilis Prevalence
Survey, National Department of Health (41), which reported that the greatest burden of
HIV/AIDS in South Africa to be between 30 – 34 years age group. Our data also showed
that subjects with advanced immuno-deficiency (WHO clinical stage 3) were more likely
to develop anaemia than HIV infected asymptomatic subjects and this observation is in
agreement with other studies (27).
Previous studies have shown that anaemia is associated with use of zidovudine (AZT) (33),
however, in this study, this did not reach statistical significance; probably because of the
introduction of HAART and decreased use of AZT mono-therapy, and that very few
subjects were on AZT containing regimens within this cohort (less than 2%), thereby
limiting statistical power in the analysis.
About half of the cohort had secondary education (n=5,906; 47.0%), whilst only 365
(2.0%) had tertiary education. These results show low education levels in this urban HIV
cohort. The cohort had 6,726 (54.1%) unemployed participants and this unemployment
figure is much higher than the Statistics South Africa figures for 2004 to 2010 which lay
between 25 and 33% (42). Baseline assessment of the TLC cohort showed that majority of
study participants who were alcohol drinkers, were non anaemic. These findings are in
agreement with results from the Third National Health and Nutrition Examination Survey
(Loannou et.al 2003) in which consumption of-up-to 2 alcoholic drinks/day seemed to be
associated with reduced risk of iron deficiency and iron deficiency anaemia (43). Baseline
assessment of the TLC cohort showed that majority of study participants who were
smokers, were non anaemic. These results seem to be in line with a review study (Leifert
et.al 2008) that showed an increase in the red blood cell production caused by chronic
exposure to carbon monoxide from cigarette smoke in smokers (44). We however

38
advocate for studies to look more closely into the impact of cigarette smoking on
anaemia.
There was a high TB burden within TLC cohort as 1,953 (15.7%) subjects had TB at HAART
initiation, and most likely, this represents ongoing transmission within this setting. There
is a need to urgently diagnose and treat TB so as to interrupt transmission and control
this ongoing health threat. During routine check-ups, there might be intense social
interaction and crowding among patients and TLC staff members; and patients with
unrecognized/not-yet diagnosed TB can spread the TB bacteria. As such, active case
finding; even non-facility based interventions will be required, with emphasis on
community-based case finding and contact tracing to decrease the infective TB pool. TLC
should be connected to the National TB registry, so that all these reported cases are
captured so as to improve TB surveillance.
Furthermore, we observed from our study that being underweight was associated with
anaemia, probably because of deficiencies/poor diet in underweight subjects as certain
micro-nutrients are essential for anaemia recovery (iron, folate, Vitamin A, B12 etc).
Several studies have shown that iron-deficiency anaemia accounts for approximately
more than half of anaemia among HIV positive subjects (24, 34), hence the need to evaluate
nutritional status of subjects within HIV cohorts.
Patient retention in care is a critical challenge for HAART lifelong programs because
retention is related to adherence, treatment and patient survival. By closure of the data-
set, the 75 months (6¼years) overall TLC cohort retention rate that we found, of 48%,
was much lower than the 74.4% retention rate reported by Sanne et al in 2009 within this
TLC cohort (45). The difference between the two retention rates for the TLC cohort might
be attributable to the fact that; our study had a much larger sample size (12,441)
compared to the Sanne et al (7,583) study and our study had a longer follow up time
(75months) compared to the Sanne et al study (48months). However, our findings are
almost comparable to findings by Rosen S et.al (2007), who reported an average 2year
retention rate of about 60% for sub Saharan HIV cohorts (46). Our 2year retention rate is

39
54%. However, better patient tracing procedures and better understanding of loss-to-
follow-up are needed if retention is to be improved.
The proportion of subjects who died within the TLC cohort by close of data set (1,783;
14.3%) is comparable to results from a South-African multi-centre cohort study of HIV
clinics which reported a proportion of deaths at 13.7% in 2010 (31).
4.3 Baseline characteristics of anaemic cohort
In this cohort, anaemia seems common among 30 – 40 year old adults, as majority of
anaemic participants (1,173; 47%) were in this age group, followed by 40-50 year old
adults (586; 24%). This finding is consistent with findings from previous studies that have
reported anaemia to be predicted by older age (47).
The anaemic cohort had very similar characteristics to the overall TLC cohort, as already
discussed above.
The majority of patients initiated HAART at advanced stages of the disease having WHO
clinical stage 3 and advanced or severe immune suppression (CD4<50 cells/mm3), just like
in other African urban HIV care programmes (31). Severity of immune suppression at time
of HAART initiation was associated with anaemia (Table 3). As immune suppression
increases, WHO anaemia grades increase from mild to severe (from grade 1 to 4). Such
results are in line with findings of other studies that reported an increase in anaemia
levels with decreases in CD4 cell counts (33). This study did not find any statistical
significance between being on AZT containing regimen and recovery/non recovery from
anaemia, probably because only 47 (1.9%) of the participants were on AZT containing
regimen. This demonstrates the decreased use of AZT containing regimen as many
studies have shown that it is associated with anaemia development (5, 48).
The overall mean CD4 cell count for the anaemic cohort at initiation was 82.5 cells/mm3
(S.D=69.30), and 7 months after ART initiation, the mean CD4 cell count was 210.4
cells/mm3 (S.D=126.75). This observation seems to be in agreement with results of
previous studies that have demonstrated the ultimate impact of HAART on improving
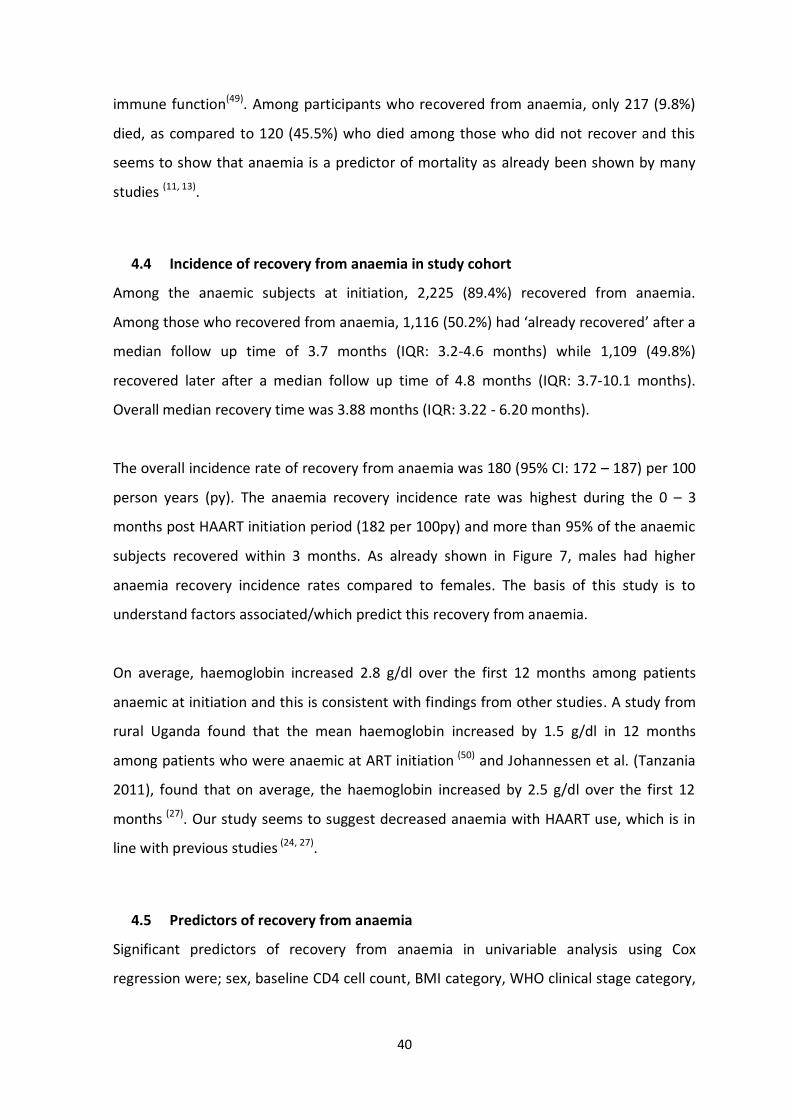
40
immune function(49). Among participants who recovered from anaemia, only 217 (9.8%)
died, as compared to 120 (45.5%) who died among those who did not recover and this
seems to show that anaemia is a predictor of mortality as already been shown by many
studies (11, 13).
4.4 Incidence of recovery from anaemia in study cohort
Among the anaemic subjects at initiation, 2,225 (89.4%) recovered from anaemia.
Among those who recovered from anaemia, 1,116 (50.2%) had ‘already recovered’ after a
median follow up time of 3.7 months (IQR: 3.2-4.6 months) while 1,109 (49.8%)
recovered later after a median follow up time of 4.8 months (IQR: 3.7-10.1 months).
Overall median recovery time was 3.88 months (IQR: 3.22 - 6.20 months).
The overall incidence rate of recovery from anaemia was 180 (95% CI: 172 – 187) per 100
person years (py). The anaemia recovery incidence rate was highest during the 0 – 3
months post HAART initiation period (182 per 100py) and more than 95% of the anaemic
subjects recovered within 3 months. As already shown in Figure 7, males had higher
anaemia recovery incidence rates compared to females. The basis of this study is to
understand factors associated/which predict this recovery from anaemia.
On average, haemoglobin increased 2.8 g/dl over the first 12 months among patients
anaemic at initiation and this is consistent with findings from other studies. A study from
rural Uganda found that the mean haemoglobin increased by 1.5 g/dl in 12 months
among patients who were anaemic at ART initiation (50) and Johannessen et al. (Tanzania
2011), found that on average, the haemoglobin increased by 2.5 g/dl over the first 12
months (27). Our study seems to suggest decreased anaemia with HAART use, which is in
line with previous studies (24, 27).
4.5 Predictors of recovery from anaemia
Significant predictors of recovery from anaemia in univariable analysis using Cox
regression were; sex, baseline CD4 cell count, BMI category, WHO clinical stage category,

41
TB at initiation of HAART, HIV viral load, still on first regimen, employment and LTFU
(Table 5 and Figure 2-12 for K-M plots for recovery by individual variable).
In multivariate analysis; sex, baseline CD4 cell count, WHO clinical staging and HIV viral
load predicted recovery from anaemia among the anaemic TLC cohort.
The finding that males were 1.44 times more likely to recover from anaemia than females
is in parallel with findings of previous studies that female sex is more likely to acquire
anaemia (5, 24) possibly because of blood loss due to menstruation and multiple deliveries,
hence males are more likely to recover from anaemia because they do not undergo these
blood losses as women do. The finding that patients with detectable HIV viral load were
7% less likely to recover from anaemia compared to patients with undetectable HIV viral
load is analogous to findings from studies that have shown that detectable HIV viral load
conversely predicts development of anaemia (28, 33, 34).
In addition, our study also showed that participants who had baseline WHO HIV/AIDS
clinical stage 2 were 17% less likely to recover from anaemia compared to participants
who had baseline WHO HIV/AIDS clinical stage 1, table 5. However, results for
participants with baseline WHO HIV/AIDS clinical staging 3 and 4 were not significant.
Nevertheless, findings from other studies have demonstrated that WHO HIV/AIDS clinical
staging is predictive of anaemia development (5, 28), and our study seems to inversely
show that WHO HIV/AIDS clinical staging predicts recovery from anaemia. In light of this
and of its biological significance WHO HIV/AIDS clinical staging was included in the final
model for predicting recovery from anaemia.
Intriguingly, participants with low baseline CD4 cell counts were found to be more likely
to recover from anaemia than those with higher baseline CD4 cell count. Results of our
study seem to suggest that anaemic patients with higher baseline CD4 cell count are less
likely to recover from anaemia compared to anaemic patients with lower baseline CD4
cell count. However, many studies (24, 51) have shown that low baseline CD4 cell counts is
a risk factor for anaemia development. We wonder if this finding could have been
different had we taken into account the longitudinal nature of CD4 cell count. This
atypical finding about baseline CD4 cell count warrants further studies to ascertain the
impact of baseline CD4 cell count on anaemia recovery.
42
Although a huge proportion of anaemic subjects were LTFU (37.6%), there was no
statistically significant association between LTFU and recovery from anaemia (p=0.102)
meaning that there was no survivor bias in LTFU. However, participants who died during
follow up (337; 13.5%), had baseline characteristics that were significantly different from
those who were alive; and this signified survivor bias among those who did not die.
Variables that had missing data within certain categories were re-tabulated into ‘missing’
and ‘non-missing’ so as to assess significance of missing data on anaemia recovery.
Missing data for certain variables (WHO HIV/AIDS clinical staging had 7.9% missing and
follow-up CD4 cell count had 14.1%) was seen to be significantly associated with
outcome, Appendix F. The final Cox proportional hazards regression model also shows
that patients with missing HIV viral load results were less likely to recover compared to
other groups where patients had non missing observations. Hence missing data should be
minimised at all costs.
Due to the longitudinal feature of the data gathering process, we assessed for time-
varying covariates and all of the time-dependent variables were not significant either
collectively or individually thus also supporting the assumption of proportional hazard.
We also evaluated the goodness of fit of the final model using the Cox-Snell residuals, and
the graph of the residuals showed a good fit to the model.
Anaemia is one of the most common haematological morbidities associated with HIV
infection, and the physical, medical, and economic consequences of anaemia may be high
(1). This study has helped shed light on predictors of recovery from anaemia and such
knowledge should be incorporated into interventions aimed at reducing the risk of
anaemia in HIV infected adults.

43
4.6 Limitations
Our study had much strength including use of a large sample size, the long follow-up
duration and the use of time to event analysis.
However, this was an observational retrospective study using secondary data from
routine TLC HAART cohort and as such, only pre-collected data was available for analysis.
Our inability to assess other important study variables (or possible confounders) which
are known to have an influence on anaemia (e.g. nutritional status, menstrual history,
iron supplements, MCV, MCH etc) was a major draw-back to this investigation. Although
our sample size was large enough, we advocate for further studies which will incorporate
all these aspects.
Due to time limitation and lack of funding, our study only looked at baseline variables so
as to ascertain predictors of recovery from anaemia. We advocate for future studies that
will take into account the longitudinal nature of some variables (like CD4 cell count, HIV
viral load, etc), so as to get as much information as possible from the influence of these
variables on anaemia recovery.
Only those participants who survived during the intended time of study were looked at
(survivor bias) and patients who died had different baseline characteristics to those who
survived, Appendix E. However, those LTFU had similar baseline characteristics to those
who survived, Appendix E. In addition, our results are susceptible to bias arising from
public-private bias; since the study was done on an urban public sector ART cohort, this is
most probably composed of people of low socioeconomic status.
TLC HIV cohort is one of the largest urban cohorts in South Africa and is highly likely to be
representative of the urban public HIV cohorts. However, it may not be generalizable to
rural HIV cohorts. We acknowledge that caution should be taken when generalizing these
results to rural cohorts.

44
5 CHAPTER 5: CONCLUSION AND RECOMMENDATIONS
5.1 Introduction
This chapter presents the conclusions of the study findings and recommendations that
we propose.
5.2 Conclusions
This analysis, based on TLC HIV cohort data, demonstrated a 27% prevalence of anaemia
among an urban public sector HIV clinic and it showed that more than 90% of subjects
recover from anaemia within 3 months into antiretroviral therapy enrolment. Predictors
of recovery from anaemia are; sex, baseline CD4 cell counts, HIV viral load and WHO
clinical staging. To our knowledge, this is the first study to look into predictors of recovery
from anaemia. Anaemic individuals within HIV cohorts should be promptly identified and
predictors of recovery from anaemia must be used for intensive case management and
monitoring.
5.3 Recommendations
Recovery from anaemia has been shown to directly increase survival (17, 20, 21) and as such,
anaemic individuals within HIV cohorts should be promptly identified and predictors of
recovery from anaemia must be used for intensive case management and monitoring.
Screening and treatment of anaemia among HIV cohorts should be intensified as the
public health importance of anaemia resolution has been emphasized.
HIV viral load should not only be interpreted as demonstrating the quantity of HIV in a
patient, but it should also be viewed as an opportunity to assess and identify individuals
who might be at risk of possible anaemia. In addition, WHO clinical staging and gender
are independent prognostic factors for recovery from anaemia and either can be used to
identify and monitor participants at risk of anaemia. Individuals who develop anaemia
during cohort follow-up should be targeted for intensified case management, including

45
investigation for parameters which have been shown by this study to predict recovery
from anaemia.
Individuals initiating ART with low haemoglobin in these settings are in particular need of
investigation, and if necessary, treatment for malnutrition (underweight). The majority of
enrolees in TLC cohort were underweight at initiation and TLC should enlist services of a
dietician to help counsel and advice enrolees about balanced diets.
Cohort retention is relatively low within TLC compared to other African HIV cohorts and it
is imperative that TLC should strive to maintain high patient retention rates. Contact
details for patients and their alternate contacts should be clearly documented. During
enrolment and follow up, there should be continuous intensive cohort adherence
counselling; and follow up of subjects LTFU with telephoning and even home visits.
Patients staying within same communities should be encouraged to form support groups
as these might aid in counselling and assisting each other. Innovative ways of reminding
subjects of clinic appointments should be explored, especially with communication
companies e.g. mobile message services sent to subjects before their clinic appointment.
Possibilities of decentralizing ART (TLC cohort forming sub units) and subsiding transport
costs for the non-working enrolees (since they are more than employed enrolees) should
be considered also.
Nurses/peer counsellors should thoroughly educate/counsel participants about the
benefits of treatment adherence.
Screening for TB during follow up should be aggressively done at scheduled times, those
found to be infected should be immediately quarantined and sent to infectious disease
treatment centres. TLC should be connected to the National TB registry, so that all
reported TB cases are captured so as to improve TB surveillance.
46
REFERENCES 1. Bruno De Benoist EM, Ines Egli, Mary Cogswell. World Wide Prevalence of Anaemia 1993-2005 Geneva, Switzerland2008. Available from: http://whqlibdoc.who.int/publications/2008/9789241596657_eng.pdf. 2. Adane A, Desta K, Bezabih A, Gashaye A, Kassa D. HIV-associated anaemia before and after initiation of antiretroviral therapy at Art Centre of Minilik II Hospital, Addis Ababa, Ethiopia. Ethiopian Medical Journal. 2012;50(1):13-21. 3. Doukas MA. Human-Immunodeficiency-Virus Associated Anaemia. Medical Clinics of North America. 1992;76(3):699-709. 4. Owiredu WKBA, Quaye L, Amidu N, Addai-Mensah O. Prevalence of anaemia and immunological markers among Ghanaian HAART-naive HIV-patients and those on HAART. African Health Sciences. 2011;11(1):2-15. 5. Jialun Zhou AJ, Emmanuel Bissagnene, Beverly Musick, Kara Wools-Kaloustian, Nicola Maxwell et.al. Short-term risk of anaemia following initiation of combination antiretroviral treatment in HIV-infected patients in countries in sub-Saharan Africa, Asia-Pacific and central and South America. Journal of International AIDS Society. 2012;15(5). 6. WHO/UNAIDS. Epidemiological Fact Sheet on HIV/AIDS South Africa 2008 WHO publishing (Switzerland) [Internet]. 2008 19 October 2012. Available from: http://apps.who.int/globalatlas/predefinedReports/EFS2008/full/EFS2008_ZA.pdf 7. Koleka Mlisana SCA, Anneke Grobler, Francois van Loggernberg, Carolyn Williamson, Itua Iriogbe. Anaemia in acute HIV-1 sub-type C infection. Plos medicine. 2008;3(2). 8. Gyuse A, Bassey I, Udonwa N, Okokon I, Philip-Ephraim E. HIV/AIDS related mortality among adult medical patients in a tertiary health institution in South–South, Nigeria. Asian Pacific Journal of Tropical Medicine. 2010;3(2):141-4. 9. Ferri RS, Adinolfi A, Orsi AJ, Sterken DJ, Keruly JC, Davis S, et al. Treatment of anemia in patients with HIV Infection--Part 2: guidelines for management of anemia. The Journal of the Association of Nurses in AIDS Care : JANAC. 2002;13(1):50-9. 10. Volberding P, Anemia HIVWG. Consensus statement: Anemia in HIV infection - Current trends, treatment options, and practice strategies. Clinical Therapeutics. 2000;22(9):1004-20. 11. Alemu AW, Sebastian MS. Determinants of survival in adult HIV patients on antiretroviral therapy in Oromiyaa, Ethiopia. Global Health Action. 2010;3. 12. Jam S, Ramezani A, Sabzvari D, Moradmand-Badie B, SeyedAlinaghi SA, Jabbari H, et al. A cross-sectional study of anemia in human immunodeficiency virus-infected patients in Iran. Arch Iranian Med. 2009;12(2):145-50. 13. Moyle G. Anaemia in persons with HIV infection: prognostic marker and contributor to morbidity. AIDS Rev. 2002;4(1):13-20. 14. Currier JS, Havlir DV. Complications of HIV disease and antiretroviral therapy. Topics in HIV Medicine. 2004;12(1):31-9. 15. Sarcletti M, Quirchmair G, Weiss G, Fuchs D, Zangerle R. Increase of haemoglobin levels by anti‐retroviral therapy is associated with a decrease in immune activation. European Journal of Haematology. 2003;70(1):17-25. 16. Scholz BD GR, Schultink W, Sastroamidjojo S. Anaemia is associated with reduced productivity of women workers even in less physically strenous tasks. British Journal of Nutrition. 1997(1):47-57. 17. Mocroft A, Kirk O, Barton SE, Dietrich M, Proenca R, Colebunders R, et al. Anaemia is an independent predictive marker for clinical prognosis in HIV-infected patients from across Europe. AIDS. 1999;13(8):943.

47
18. Braithwaite RS, Justice AC, Chang CCH, Fusco JS, Raffanti SR, Wong JB, et al. Estimating the proportion of patients infected with HIV who will die of comorbid diseases. The American Journal of Medicine. 2005;118(8):890-8. 19. Sullivan PS, Hanson DL, Chu SY, Jones JL, Ward JW, Adult Adolescent Spectrum Dis G. Epidemiology of anemia in human immunodeficiency virus (HIV)-infected persons: Results from the multistate adult and adolescent spectrum of HIV disease surveillance project. Blood. 1998;91(1):301-8. 20. Belperio PS, Rhew DC. Prevalence and outcomes of anemia in individuals with human immunodeficiency virus: A systematic review of the literature. American Journal of Medicine. 2004;116:27-43. 21. Moore RD. Human immunodeficiency virus infection, anemia, and survival. Clinical Infectious Diseases. 1999;29(1):44. 22. Braithwaite RS, Justice AC, Chang CC, Fusco JS, Raffanti SR, Wong JB, et al. Estimating the proportion of patients infected with HIV who will die of comorbid diseases. American Journal of Medicine. 2005;118(8):890-8. Epub 2005/08/09. 23. Mildvan D. Implications of anemia in human immunodeficiency virus, cancer, and hepatitis C virus. Clinical Infectious Diseases. 2003;37:S293-S6. 24. Masaisa F, Gahutu JB, Mukiibi J, Delanghe J, Philippe J. Anemia in Human Immunodeficiency Virus-Infected and Uninfected Women in Rwanda. American Journal of Tropical Medicine and Hygiene. 2011;84(3):456-60. 25. Sharma SK. Zidovudine-induced anaemia in HIV/AIDS. Indian Journal of Medical Research. 2010;132(4):359-61. 26. Moore RD FD. Anaemia in HIV-infected patients receiving highly active antiretroviral therapy. Acquired Immune Defficiency Syndromme. 2002;1(29):54-7. 27. Johannessen A, Naman E, Gundersen SG, Bruun JN. Antiretroviral treatment reverses HIV-associated anemia in rural Tanzania. BMC Infectious Diseases. 2011;11. 28. Mugisha JO, Shafer LA, Van der Paal L, Mayanja BN, Eotu H, Hughes P, et al. Anaemia in a rural Ugandan HIV cohort: prevalence at enrolment, incidence, diagnosis and associated factors. Tropical Medicine and International Health. 2008;13(6):788-94. Epub 2008/04/04. 29. Moore RD, Keruly JC, Chaisson RE. Anemia and Survival in HIV Infection. JAIDS Journal of Acquired Immune Deficiency Syndromes. 1998;19(1):29-33. 30. Asgeir Johannessen EN, Svein G Gundersen and Johan N Bruun. Antiretroviral treatment reverses HIV associated anaemia in rural Tanzania. BMC Infectious Diseases. 2011;11(190). 31. Russell EC, Charalambous S, Pemba L, Churchyard GJ, Grant AD, Fielding K. Low haemoglobin predicts early mortality among adults starting antiretroviral therapy in an HIV care programme in South Africa: a cohort study. BMC Public Health. 2010;10:433. Epub 2010/07/27. 32. Sullivan P. Associations of anemia, treatments for anemia, and survival in patients with human immunodeficiency virus infection. Journal of Infectious Diseases. 2002;185:S138-S42. 33. Alexandra M.Levine KB, Lena Masri-Lavine, Maria Lynn Sanchez, Mary Young, Michael Augenbraun et.al. Prevalence and correlates of anaemia in a large cohort of HIV infected women: women's interagency HIV study. Journal of AIDS. 2001;26. 34. Semba RD, Shah N, Klein RS, Mayer KH, Schuman P, Vlahov D, et al. Prevalence and cumulative incidence of and risk factors for anemia in a multicenter cohort study of human immunodeficiency virus-infected and -uninfected women. Clinical Infectious Diseases. 2001;34(2):260-6. 35. Fox MP, Maskew M, MacPhail AP, Long L, Brennan AT, Westreich D, et al. Cohort Profile: The Themba Lethu Clinical Cohort, Johannesburg, South Africa. International Journal of Epidemiology. 2012:1-10. 36. Department NH. Clinical guidelines for the management of HIV and AIDS in adults and adolescent, South Africa 2010.

48
http://wwwfidssacoza/Guidelines/2010_Adult_ART_Guidelinespdf.Pages: 9-12:[Accessed 28 October 2012] 37. Allen D CF, Coovadia A, Cotton M, Duma MW, Fomundam H,et.al. National Antiretroviral Guidelines, South Africa 2004. South Africa: Jacana; 2004. 38. Diseases NIoAaI. WHO: Monitoring and reporting adverse events2003 23 October 2012. Available from: http://www.icssc.org/Documents/Resources/AEManual2003AppendicesFebruary_06_2003%20final.pdf. 39. CDC. Body mass index calculator. http://wwwcdcgov/healthyweight/assessing/bmi. Geneva: CDC; 2011. 40. Yiannoutsos CT, An MW, Frangakis CE, Musick BS, Braitstein P, Wools-Kaloustian K, et al. Sampling-based approaches to improve estimation of mortality among patient dropouts: experience from a large PEPFAR-funded program in Western Kenya. PloS one. 2008;3(12):e3843. Epub 2008/12/03. 41. Epidemiology and Surveillance Unit Doh. National antenatal sentinel HIV and syphilis prevalence survey in South Africa, 2009. Department of Health. 2009. 42. Africa SS. StatsOnline2012; Accessed 12 November 2012. Available from: http://www.statssa.gov.za/census2011/documents/Working%20paper-ContentResearch-EmploymentStatus14Nov06.pdf 43. GEORGE N. IOANNOU JAD, NOEL S. WEISS, PATRICK J. HEAGERTY, and, KOWDLEY KV. The Effect of Alcohol Consumption on the Prevalence of Iron Overload, Iron Deficiency, and Iron Deficiency Anemia. Gastroentology. 2004;126:11. 44. LEIFERT JA. Anaemia and cigarette smoking. INTERNATIONAL JOURNAL OF LABORATORY HEMATOLOGY. 2008;130:7. 45. Ian M Sanne DW, Andrew P Macphail, Dennis Rubel, Pappie Majuba and Annelies Van Rie. Long term outcomes of antiretroviral therapy in a large HIV/AIDS care clinic in urban South Africa: a prospective cohort study. Journal of International AIDS Soceity. 2009;12(38). 46. Sydney Rosen MPF, Christopher J. Gill. Patient retention in Antiretro-viral therapy programs in sub-Saharan Africa: a systematic review. Plos medicine. 2007;4(10). 47. Wills T, Nadler J, Somboonwit C, Vincent A, Naik E, Powers S, et al. Anemia prevalence and associated risk factors in a single-center ambulatory HIV clinical cohort. AIDS READER-NEW YORK-. 2004;14:305-19. 48. SM Curkendall JR, MF Emons, AE Fisher and F Everhand. Incidence of anaemia among HIV-infected patients treated with highly active antiretroviral therapy. HIV Medicine. 2007;8:483-90. 49. Todd Hulgan BES, Stephen P. Raffanti, Jenifer S. Zfusco. Absolute count and percentage of CD4+ lymphocytes are independent predictors of disease progression in HIV infected persons initiating HAART. Journal of Infectious Diseases. 2007;195(425). 50. Forna F, Moore D, Mermin J, Brooks JT, Were W, Buchacz K, et al. Hematologic changes associated with Zidovudine following single-drug substitution from stavudine in a home-based AIDS care program in rural Uganda. Journal of the International Association of Physicians in AIDS Care (Chicago, Ill : 2002). 2009;8(2):128-38. 51. Richard D.Semba NS, Robert S. Klein, Kenneth H. Mayer, Paula Schuman and David Vlahov. Prevalence and cumulative incidence of and risk factors for anaemia in a multicenter cohort study of HIV infected and un-infected women. AIDS. 2002;34. 52. WHO. Interim WHO clinical staging of HIV/AIDS and HIV/AIDS case definitions for surveillance [Internet]. 2005 18 November 2012. Available from: www.who.int/hiv/pub/guidelines/clinicalstaging.pdf.

49
APPENDICES
Appendix A: Assessing validity of proportionality hazards assumption. Global tests for proportional hazards assumptions based on Schoenfeld residuals were done after fitting multivariate Cox models. Overall global test had a p>0.05 indicating that the proportional hazards assumption was not violated. WHO clinical stage category violated proportionality assumption because its p-value was significant (p=0.0036).
Variable P value
Sex 0.7013
CD4 cell count at baseline 0.2545
HIV viral load during follow up 0.1527
Global test 0.3177
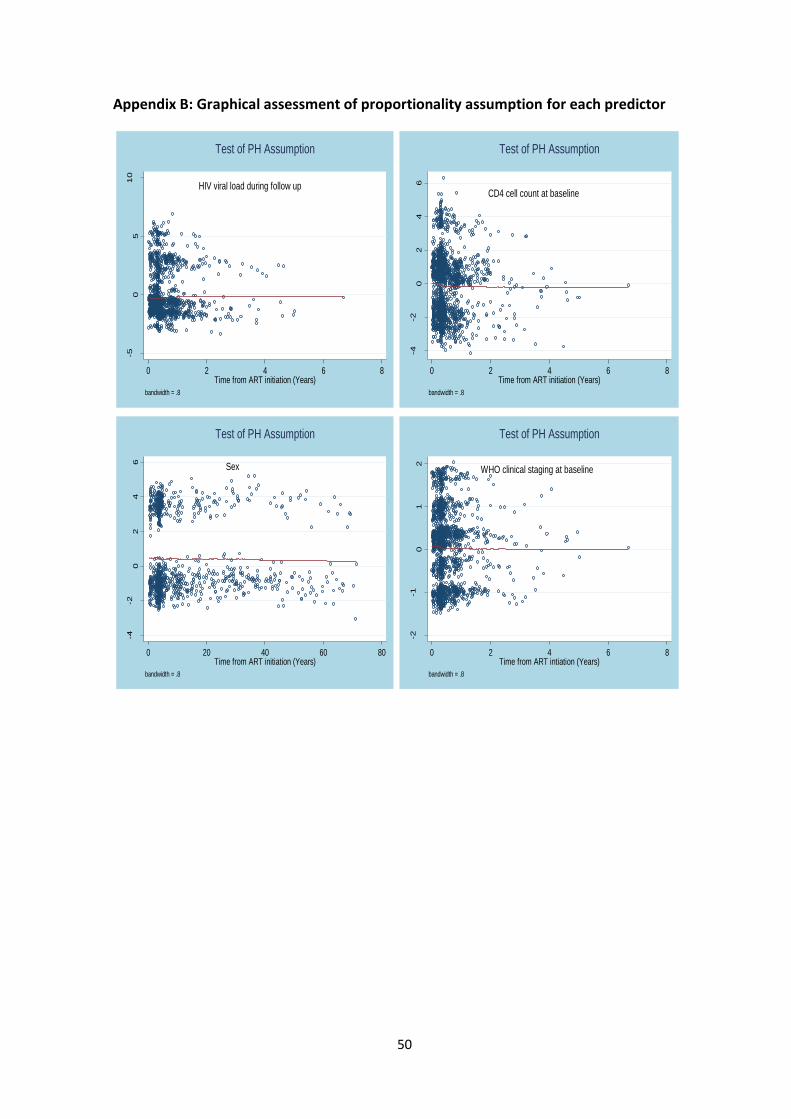
50
Appendix B: Graphical assessment of proportionality assumption for each predictor
-50
510
scale
d S
choenfe
ld -
HIV
viral lo
ad
0 2 4 6 8Time from ART initiation (Years)
bandwidth = .8
HIV viral load during follow up
Test of PH Assumption
-4-2
02
46
scale
d S
choenfe
ld -
cd4_base_cat
0 2 4 6 8Time from ART initiation (Years)
bandwidth = .8
CD4 cell count at baseline
Test of PH Assumption
-4-2
02
46
scale
d S
choenfe
ld -
Sex
0 20 40 60 80Time from ART initiation (Years)
bandwidth = .8
Sex
Test of PH Assumption
-2-1
01
2
scale
d S
choenfe
ld -
who_clinic
al sta
ge
0 2 4 6 8Time from ART intiation (Years)
bandwidth = .8
WHO clinical staging at baseline
Test of PH Assumption

51
Appendix C: Revised WHO clinical staging of HIV/AIDS for adults and adolescents (52)
Clinical stage 1 Asymptomatic, persistent generalized lymphadenopathy (PGL)
Clinical stage 2 Moderate unexplained weight loss (<10% of measured body weight) Recurrent respiratory tract infections (otitis media, bronchitis, etc) Herpes zoster, angular cheilitis, recurrent oral ulcerations, papullar pruritic eruptions, seborrhoeic dermatitis, fungal nail infections
Clinical stage 3 Conditions where a presumptive diagnosis can be made on the basis of clinical signs or simple investigations (severe weight loss, un-explained chronic diarrhoea, unexplained persistent fever, oral candidiasis, oral hairy leukoplakia, pulmonary TB, bacterial infections (pneumonia, meningitis, bactererimia) gingivitis etc) Conditions where confirmatory diagnostic testing is necessary (unexplained anaemia/neutropaenia/thrombocytopenia etc)
Clinical stage 4 Conditions where a presumptive diagnosis can be made on the basis of clinical signs or simple investigations (HIV wasting syndrome, pneumocystis pneumonia, Kaposi’s sarcoma, HIV encephalopathy, CNS toxoplasmosis, oesophageal candidiasis) Conditions where confirmatory diagnostic testing is necessary (cryptosporidiosis, lymphoma (cerebral/B-cell non-Hodgkin’s), recurrent non-typhoidal salmonella septicaemia, any disseminated mycosis (histoplasmosis, coccidiomycosis), Cytomegalovirus infection, PML)

52
Appendix D: BMI categories (adapted from WHO) (39).
BMI category BMI values (kg/m2)
Underweight <18
Normal 18-25
Over-weight 25-30
Obese >30
Appendix E: Evaluating survivor bias
LTFU Dead Variable Yes No P value Yes No P value
Sex Females Males
634 (34.6) 232 (35.2)
1 196(65.4) 427 (64.8)
0.796
223 (12.2) 114 (17.3)
1 607 (87.8) 545 (82.7)
0.058
CD4 base line (cells/mm3)
<50 50-200 >200
362 (34.1) 449 (35.5) 55 (34.0)
700 (65.9) 816 (64.5) 107 (66.0)
0.756
174 (16.4) 142 (11.2) 21 (13.0)
888 (83.6) 1 123 (88.8) 141 (87.0)
0.001
WHO clinical staging
1 2 3 4 Missing
246 (38.0) 97 (31.1) 348 (35.7) 121 (32.3) 54 (30.0)
401 (62.0) 215 (68.9) 627 (64.3) 254 (67.7) 126 (70.0)
0.089
77 (11.9) 38 (12.2) 134 (13.7) 63 (16.8) 25 (13.9)
570 (88.1) 274 (87.8) 841 (86.3) 312 (83.2) 155 (86.1)
0.245
HIV viral load Not detected Detected Missing
639 (33.5) 71 (37.0) 156 (39.8)
1 266 (66.5) 121 (63.0) 236 (60.2)
0.059
174 (9.1) 55 (28.7) 108 (27.6)
1 731 (90.9) 137 (71.4) 284 (72.5)
<0.001

53
Appendix F: Missing observations in variables
Missing observations in some variables were significantly associated with outcome, with
the exception of TB at baseline and of WHO clinical staging (Appendix E below). Hence
missing data should be minimised at all costs as we saw from the final Cox proportional
hazards regression model that patients with missing HIV viral load results were less likely
to recover compared to other groups where patients had observations.
Recovery from anaemia Variable Yes No P value
HIV viral load Non missing Missing
1 985 (94.7) 240 (61.2)
112 (5.3) 152 (38.8)
<0.001
TB prior HAART Non missing Missing
2 221 (89.4) 4 (80.0)
263 (10.6) 1 (20)
0.495
BMI category Non missing Missing
2 010 (90.1) 215 (83.0)
220 (9.9) 44 (17.0)
<0.001
WHO clinical stage Non missing Missing
2 066 (89.5) 159 (88.3)
243 (10.5) 21 (11.7)
0.632
Education Non missing Missing
1 565 (90.9) 660 (86.1)
157 (9.1) 107 (13.9)
<0.001
54
Appendix G: Ethics approval letter