Embed Size (px)
Citation preview
1
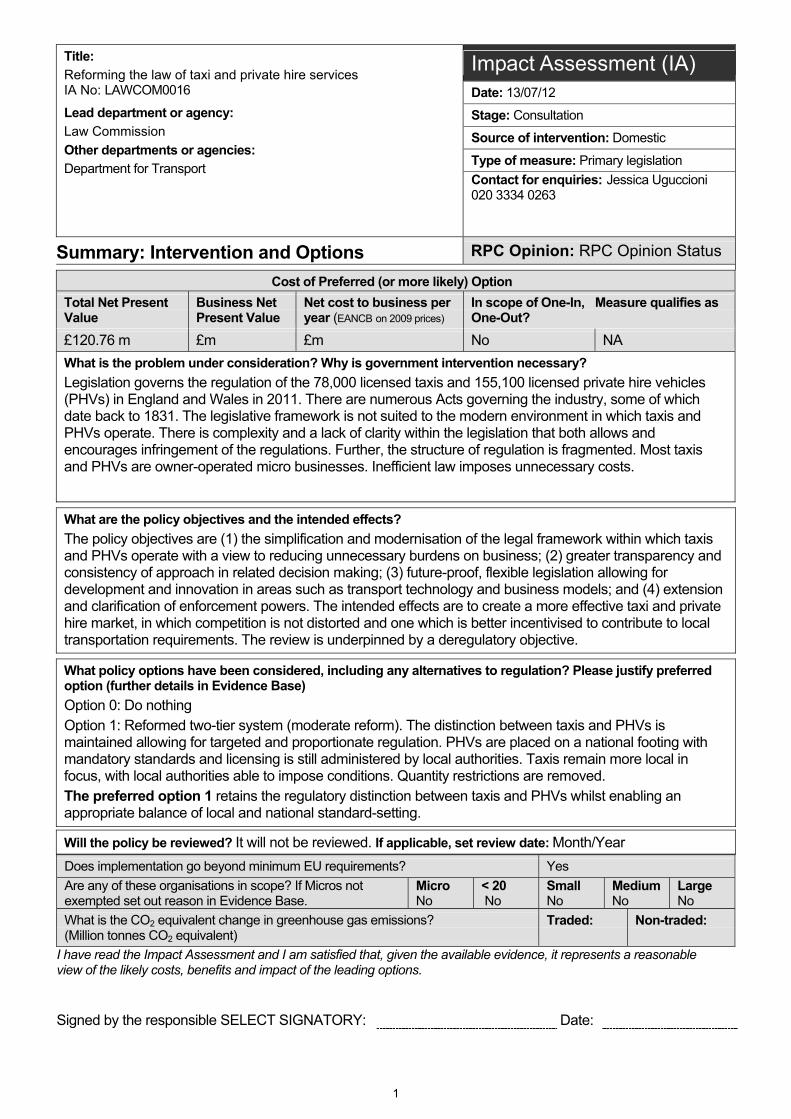
Title:
Reforming the law of taxi and private hire services IA No: LAWCOM0016 Lead department or agency:
Law Commission
Other departments or agencies: Department for Transport
Impact Assessment (IA) Date: 13/07/12
Stage: Consultation
Source of intervention: Domestic
Type of measure: Primary legislation
Contact for enquiries: Jessica Uguccioni 020 3334 0263
Summary: Intervention and Options RPC Opinion: RPC Opinion Status
Cost of Preferred (or more likely) Option
Total Net Present Value
Business Net Present Value
Net cost to business per year (EANCB on 2009 prices)
In scope of One-In, One-Out?
Measure qualifies as
£120.76 m £m £m No NA
What is the problem under consideration? Why is government intervention necessary?
Legislation governs the regulation of the 78,000 licensed taxis and 155,100 licensed private hire vehicles (PHVs) in England and Wales in 2011. There are numerous Acts governing the industry, some of which date back to 1831. The legislative framework is not suited to the modern environment in which taxis and PHVs operate. There is complexity and a lack of clarity within the legislation that both allows and encourages infringement of the regulations. Further, the structure of regulation is fragmented. Most taxis and PHVs are owner-operated micro businesses. Inefficient law imposes unnecessary costs.
What are the policy objectives and the intended effects?
The policy objectives are (1) the simplification and modernisation of the legal framework within which taxis and PHVs operate with a view to reducing unnecessary burdens on business; (2) greater transparency and consistency of approach in related decision making; (3) future-proof, flexible legislation allowing for development and innovation in areas such as transport technology and business models; and (4) extension and clarification of enforcement powers. The intended effects are to create a more effective taxi and private hire market, in which competition is not distorted and one which is better incentivised to contribute to local transportation requirements. The review is underpinned by a deregulatory objective.
What policy options have been considered, including any alternatives to regulation? Please justify preferred option (further details in Evidence Base)
Option 0: Do nothing Option 1: Reformed two-tier system (moderate reform). The distinction between taxis and PHVs is maintained allowing for targeted and proportionate regulation. PHVs are placed on a national footing with mandatory standards and licensing is still administered by local authorities. Taxis remain more local in focus, with local authorities able to impose conditions. Quantity restrictions are removed. The preferred option 1 retains the regulatory distinction between taxis and PHVs whilst enabling an appropriate balance of local and national standard-setting.
Will the policy be reviewed? It will not be reviewed. If applicable, set review date: Month/Year
Does implementation go beyond minimum EU requirements? Yes
Are any of these organisations in scope? If Micros not exempted set out reason in Evidence Base.
MicroNo
< 20 No
SmallNo
MediumNo
LargeNo
What is the CO2 equivalent change in greenhouse gas emissions? (Million tonnes CO2 equivalent)
Traded:
Non-traded:
I have read the Impact Assessment and I am satisfied that, given the available evidence, it represents a reasonable view of the likely costs, benefits and impact of the leading options.
Signed by the responsible SELECT SIGNATORY: Date:

2
Summary: Analysis & Evidence Policy Option 1 Description: Reformed two-tier system (moderate reform)
FULL ECONOMIC ASSESSMENT
Net Benefit (Present Value (PV)) (£m) Price Base Year 2011
PV Base Year 2011
Time Period Years 10 Low: £79.47 High: £378.10 Best Estimate: £120.76
COSTS (£m) Total Transition (Constant Price) Years
Average Annual (excl. Transition) (Constant Price)
Total Cost (Present Value)
Low £15.17 £1.12 £24.46
High £79.82. £4.78 £119.59
Best Estimate £69.79
1-5
£4.78 £109.50
Description and scale of key monetised costs by ‘main affected groups’
Transitional Costs: Taxi/PHV drivers (incumbent) – training - £69,650,000 (best estimate); training costs for licensing officers, £137,484 (best estimate); On-going costs –Training for Licensees - £4,776,000 (best estimate)
Other key non-monetised costs by ‘main affected groups’
Existing taxi drivers operating in areas with entry controls may experience some productive efficiency loss.
BENEFITS (£m) Total Transition (Constant Price) Years
Average Annual (excl. Transition) (Constant Price)
Total Benefit (Present Value)
Low £0 £12.50 £103.93
High £0 £59.84 £497.69
Best Estimate £0
0
£27.69 £230.26
Description and scale of key monetised benefits by ‘main affected groups’ On-going benefit: Taxi users - Reduced waiting time, £1,987,960 (best estimate) ;Taxi trade - Reduced regulatory burden, £25,000,000 per year (best estimate); Removal of unmet demand survey, £620,000 per year (best estimate); Reduced assaults on taxi drivers. Licensing bodies – Reduced enforcement expenditure and legal costs.
Other key non-monetised benefits by ‘main affected groups’
Taxi users – improved social inclusion; improved safety standards enabling increased user confidence; potential for reduced fares. Court system – improved understanding of licensing arrangements and reduced case load with reduced number of enforceable activities.
Key assumptions/sensitivities/risks Discount rate (%) 3.5
Assumptions: (1) Quantity controls are gradually removed with a managed approach. The premium value is reduced to zero over a 5 year period as entry controls are removed. (2) 20,450 taxi vehicles are estimated to operate in the 93 areas with entry controls. (3) 250,000 full-time equivalent taxi/PHV drivers. Sensitivities: (1) The estimated cost of an unmet demand survey is £15,000 (low), £20,000 (best) and £40,000 (high); (2) Taxi/PHV total Industry revenue ranges from £4.3 bn - £5.6 bn, £5.0 bn (best estimate) .Risk: Industry revenue value is over-estimated reducing the scope for savings.
BUSINESS ASSESSMENT (Option 1)
Direct impact on business (Equivalent Annual) £m: In scope of OIOO? Measure qualifies as
Costs: Benefits: Net: No NA

3
EVIDENCE BASE
INTRODUCTION
This review, suggested by the Department for Transport, undertakes a root and branch approach to reforming the regulatory framework governing taxis and private hire vehicles. The term taxi generally refers to the two main types of licensed vehicles – hackney carriages (the legal term for taxis), which undertake hail and rank work but can also do pre-booked work, and private hire vehicles, which can only undertake pre-booked work. Taxis and private hire vehicles are a staple aspect of the transport network in England and Wales, and indeed in most countries throughout the world. Such point to point services are essential for passengers with disabilities or who live in rural communities and play an important social role enhancing the provision of the public transportation system and facilitating social inclusion
Our terms of reference are to review the law relating to the regulation of taxis and private hire vehicles, with a view to its modernisation and simplification. We consider the potential advantages of de-regulation in reducing the burdens on business and improving the potential for competitive conditions which is of benefit to both the taxi trade and taxi users. We have taken a broad view of our remit, and have looked at the extent to which non-standard vehicles such as limousines, pedicabs and novelty vehicles fall within the licensing regime.
In 2010 an estimated £2.585 billion1 was spent by UK households on taxi journeys, of which approximately 80% relates to England and Wales.2 As this figure excludes business and tourist receipts it under-estimates the full value of the commensurate industry revenue, but nonetheless it is a useful indicator of the minimum revenue size. The Department for Transport’s latest statistics indicate there are nearly 300,000 licensed taxi and private hire vehicle drivers in England and Wales driving 78,000 taxi vehicles and 155,000 private hire vehicles.3 There is a clear geographical difference between the number of vehicles operating in London and numbers in all other regions outside of London. London, with an estimated 29 percent of taxis and 33 percent of all private hire vehicles, accounted for a disproportionately large share of industry activities in 2011.
Background to the problem The market is heavily regulated. Both taxis and private hire vehicles are required to adhere to standards imposed by local licensing authorities. This includes the safety and quality of vehicles and drivers, and such matters as the colour, appearance and signage on vehicles. In addition, taxis are subject to price regulation and, in some areas, to limits on numbers. The oldest taxi legislation that still applies dates from 1831 and the regime has been extended, amended and adapted ever since. Not only is the terminology often outdated, where statutes of the Victorian era and before envisage vehicles such as hackney carriages and charabancs, but the legislation is often out of touch with modern practice. This potentially imposes constraints on future developments where it is unable to adapt. Private hire vehicle legislation was not introduced until 1976 (1998 in London), in response to growth in the unlicensed trade, and many regard it as hastily constructed and ill thought out.
Licensing is undertaken by local authorities within a framework of almost exclusively national legislation. The legislation has developed in a piecemeal fashion and has frequently failed to take into account existing regulation, the regulation of other sectors or the possibility of future developments.
The confusing nature of the legislation may create a chilling effect on regulators’ actions. Where licensing authorities are unsure of their powers and duties they may unduly refuse to licence a vehicle, put in place a restrictive policy or fail to enforce against illegal vehicles and drivers. Where a driver or operator is unclear as to what they can or cannot do, they may unwittingly break the law or hesitate in expanding their business for fear of legal repercussions.
1 http://www.ons.gov.uk/ons/rel/consumer-trends/consumer-trends/q1-2011/index.html (last visited 18 May 2012). 2 http://www.ons.gov.uk/ons/rel/pop-estimate/population-estimates-for-uk--england-and-wales--scotland-and-northern-ireland/population-
estimates-timeseries-1971-to-current-year/index.html (last visited 17 April 2012) 3 DfT, Taxi and Private Hire Statistics 2011, at http://assets.dft.gov.uk/statistics/releases/taxi-private-hire-vehicle-statistics-2011/taxi-2011.pdf
(last visited 20 February 2012). The statistics apply as at 31 March 2011.

4
The uncertainty created by confusing legislation imposes costs on micro businesses. The vast majority of taxi services are owner-operated, the low barriers to entry making this an attractive option for self-employment. However, the regulatory burden imposed through unclear regulation significantly increases the average operating cost. For example, grey areas in private hire licensing may put off volunteers or child minders from providing valuable services to the community or unnecessarily adding costs; differing views about the appropriate scope of cross-border can result in licensing authorities requiring licensing in multiple districts or imposing additional burdens such as the establishment of a separate office within their licensing area. Earnings are also adversely affected by illegal operators – taxi touts and the like - who exploit the uncertainty created by complex rules.
The enforcement powers available to licensing officers are also limited. Sometimes this is as a result of the fragmented and local nature of the licensing system; for example, licensing officers cannot take action against the license of a non-compliant vehicle or driver from another area. Sometimes it is simply because officers’ powers are not sufficiently robust and available sanctions do not provide an appropriate deterrent.
Problem under consideration
Fragmentation and complexity of the legal framework
The body of law which applies to the licensing of taxis has evolved in a piecemeal fashion over more than a century and a half. There are over 250 different pieces of legislation governing taxis.4 The earliest law governing taxis which remains in force applies in London only and dates back to 1831.5 This legislation has continued to be extended and amended,6 and qualified by secondary legislation,7 since that time.
There are, broadly speaking, two licensing regimes. These apply differently across three separate geographical areas. Not only does this give rise to unmerited inconsistency, but in developing regulation little thought has been given to the overlap with existing and future regulation. Furthermore, the boundaries between different regulatory regimes are not always clear; for instance, that between private hire vehicles and public service vehicles.
Inconsistencies in the legal framework
Inconsistencies arise in two ways. First, due to the piecemeal and fragmented development of legislation in this area, and secondly, due to the broad variations in licensing practice which exist between licensing authorities. This has a chilling effect not only on licensing authorities and their activities, but also on those who wish to expand and develop their businesses.
Outdated and inflexible law
Although we recognise that the age of legislation does not necessarily render it useless, it can lead to the ossification of the law. Although it has allowed for a great deal of flexibility, the current definition of a taxi or “hackney carriage”, as it is known legally, bears little resemblance to modern vehicles. References to stage coaches and other old-fashioned vehicles within the definition have had, perhaps, an unnecessarily restrictive effect. It is not only the Victorian legislation which suffers; the far more modern private hire regime was designed on the basis of bookings made in person in a designated office, and has struggled to cope with developments such as the mobile telephone and the internet.
Costly and inefficient legal procedure
The problems engendered by the issues outlined above often result in unnecessary expenditure. This is particularly true for litigation, of which there has been a great deal. Were the definitions and powers of local authorities clearer, there would be far less need for cases to go to court. Local authority expenditure on court cases is very high, and this also incurs costs in the justice system. Those within the trade are often subject to considerable costs by virtue of policies and conditions put in place by licensing authorities.
Lack of clarity also imposes costs on Government. The Department for Transport has issued a number of guidance notes in recent years, as well as circulars and ad hoc advice to stakeholders. Many of these notes have been
4 Sources collated by NALEO, The Book, indicate that as of 10 February 2011, there are 261 pieces of legislation affecting taxis and private
hire vehicles. 5 London Hackney Carriage Act 1831.
6 The primary legislation includes the London Hackney Carriage Acts of 1831, 1833, 1843, 1850 and 1853, Metropolitan Public Carriage Act
1869, London Cab Acts of 1896 and 1968 and London Cab and Stage Carriage Act 1907. 7 See in particular London Cab Order 1934, as amended.

5
intended to encourage greater consistency between licensing authorities or to provide clarity on complex areas of the law. Our proposals would bring about greater consistency, both through the setting of national minimum safety standards, the removal of geographical variations for private hire vehicles and the issuance of binding statutory guidance. This should reduce the need for government intervention and advice.
Rationale for intervention
In both the private hire and taxi markets, the vast majority of drivers are self-employed, and most own their own vehicle. However, on the private hire side, both as a matter of practice and of law, the consumer deals with the operator, not individual drivers. In the pre-booked market, there is a very diverse range of market providers, from big regional operators like Addison Lee or Delta to small local operators and independent driver/operators. On the taxi side, radio networks take pre-bookings for taxis and independent taxi drivers may also take pre-booked work directly.
When pre-booking, consumers can shop around for the best deal in selecting their ride. The normal market mechanism of advertising operates, providing consumers with information on quality and price. Competition can be on the basis of offering a better price, or in respect of features which consumers would be willing to pay for if given a choice. A consumer who is a repeat player may try various providers, and make an informed decision based on factors important to him or her. A consumer can in future avoid an operator if he or she is unsatisfied with the quality of car or driver. This might include a cheaper price, better perceived safety features, or purely quality based considerations such as the comfort of the vehicle or its appearance, and customer service.
By contrast, in the taxi hailing and ranking markets, competitive market forces cannot work effectively. Since a consumer is unlikely to get in the same cab twice through either hailing or going to a rank, taxis have no incentive to raise standards (at least beyond a minimum mandated by regulation). Raising standards is a cost to each individual taxi yet they are not in a position to reap the benefits. This is because the next taxi may not adopt these higher standards and consumers have no obvious way of distinguishing between them. This means that innovation and improvement of standards in matters such as safety and quality, and cheaper prices, will not happen as a result of competition in the taxi market even if consumers have a demand for it.
In the on-street hail market, once a cab has been stopped the seller is in the position of a temporary monopolist. There is no real competitive pressure in relation to price – under monopoly conditions, prices will generally be higher than where competition prevails. If the customer refuses the offered fare he or she faces an uncertain waiting time before repeating the same negotiation with another cab.8
At ranks, it is a generally accepted social practice that customers will engage the first taxi in the rank, without negotiating on price, and without consideration of safety or quality. The result is that there is no place for competition between providers.9 In some cases, reformers have sought to change this social practice in order to encourage competition, but apparently without success.10 We take the view that we should take such practices as independently fixed in assessing the need for regulation, rather than relying on people changing their behaviour to suit economists’ prescriptions.
The importance of taxis and PHVs to the national transport network makes it essential that the regulatory system they operate within is appropriate. Passenger and driver safety is paramount, but it is also important to ensure fair and effective competition, and clear and transparent licensing and enforcement. The regulation of taxis and PHVs is currently opaque, cumbersome and often restrictive in its effect. Additionally, entry controls in the taxi market can distort the competitive process and provide the incentive for illegal activities such as taxi touts.
8 D Biggar, Why and how should we regulate taxis? (2011) p 5.
9 We have been told that on some occasions, in some places, the practice of customers not necessarily engaging the first taxi has
developed. Customers may either go to the first taxi from a preferred supplier, or go down the rank seeking to negotiate on price. We are not aware of any research on behaviour in ranks, but our impression is that this form of engagement is unusual, and confined to particular ranks in some areas. For present purposes, we discount it as having a significant effect on the behaviour of taxis in the general ranking market, but would be interested in any further information on the practice.
10 See the example of herring-bone patterned ranks in the Netherlands, where taxi drivers continued to direct passengers to the “first” taxi in
the line, even when to do so was unlawful: A Baanders and M Canoy Ten Years of Taxi Deregulation in the Netherlands – The Case for Re-Regulation and Decentralisation (2010), http://etcproceedings.org/paper/ten-years-of-taxi-deregulation-in-the-netherlands-the-case-for-re-regulation-a (last visited 23 April 2012).

6
The profile of taxi users raises particular concerns. Vulnerable groups such as those on low income and those with impaired mobility constitute a significant proportion of users. The absence of a viable service that meets the needs of taxi users within these groups would effectively restrict their opportunity for travel, be it for leisure or business. Societal-wide benefits flow from ensuring social inclusion and their value is often insufficiently captured within market evaluations.
This project aims to secure targeted, appropriate and transparent regulation. Given the deregulatory focus of the project, it is intended that regulation be as proportionate and light-touch as possible.
Policy objectives
Simplification and modernisation
A clearer, more consistent and cohesive statutory framework would give rise to better, more transparent decision-making, with fewer unnecessary geographical variations. It would enable the law to be more easily understood both by licensing officers and those within the industry. This would ensure that decisions were taken in a more appropriate fashion, and that those within the industry were able to plan their actions around a predictable body of law.
Consistency
We see little justification for the current degree of variation in licensing. This is particularly the case with geographical variation, but also some differences between taxi and private hire regulation. A core function of licensing is to promote safety, and we see no reason why basic safety standards should differ between taxis and private hire vehicles. As noted above, consistency in licensing decisions aids both licensing officers, who may be unclear as to the way in which they should approach their duties, and those within the industry.
Flexibility
Legislation in this area in is danger of causing the trades to ossify. Legislation which not only takes into account modern technological developments, but equally recognises the possibility of significant future developments, will lead to less uncertainty in the law and a greater ability for those within the industry to expand and develop.
More effective enforcement
Regardless of the strengths of the statutory framework, good licensing practice will only be undermined by poor enforcement. Although much of this is a question of resources, increasing and clarifying the powers of enforcement officers will help maintain confidence in regulation.
The efficient functioning of the markets
Although we recognise that scope for competition can be limited, particularly within the taxi market, removing some of the restraints on competition would lead to a more efficient market. This in itself would bring improvements such as greater compliance and the heightening of standards without the need for increased government intervention.
Cost efficiencies
Attainment of the above aims would, ultimately, lead to savings. Greater clarity in licensing decisions would minimise the number of applications which result in a court case, and improvements to enforcement powers could also reduce recourse to the courts. A regulatory system with fewer variations and which allowed market forces to operate more freely could also lead to fewer infractions.
OPTIONS FOR REFORM
We have considered three options:
(1) Option 0 - Do nothing.
(2) Option 1 – Reformed two-tier system (moderate reform).
(3) Option 2 – One-tier system (major reform).

7
Option 0: Do nothing
Under this option we would retain the current regulatory system. Some of the key features of the current law, linked to the problems identified earlier, are:
The legislation governing taxis and private hire vehicles is fragmented, complex and has been developed in a piecemeal fashion, with the result that it does not provide a holistic or comprehensive and consistent regulatory scheme. This has led to confusion whether and how non-standard vehicles should be licensed, which in turns can give rise to a chilling effect on licensing practice.
The current legislative framework contains a number of inconsistencies, whether on a geographical basis or as between taxi and private hire vehicles. Licensing authorities currently have a wide discretion in licensing matters, which allows them to effectively exclude vehicles from consideration and to impose sometimes burdensome and costly conditions.
The existing statutory framework can be inflexible and is often unable to deal with advances in technology. For example, private hire operators are limited in their ability to work across licensing districts as the relevant legislation was enacted prior to the invention of the mobile phone, and the definition of plying for hire, a central tenet of taxi legislation, is being undermined by the availability of immediate pre-booking via smartphone apps.
Current regulation fails to recognise those areas in which competition could work in a more efficient manner within the taxi and private hire markets. Competition can be a driver for higher standards and innovation, but the existing scope for this is limited.
The existing licensing system incurs a great deal of unnecessary cost. The most notable example of this is in court costs incurred where the decision of a licensing authority is challenged. Were the duties and powers of licensing authorities to be better defined, and exercised on a more uniform basis, the scope for this would be reduced.
Option 1: Reformed two-tier system
Our preferred option is to reform the regulatory framework for taxi services while retaining the regulatory distinction between taxis and PHVs to allow for an appropriate balance of local and national standard-setting.
In respect of safety our preferred option brings some common standards to both taxis and PHVs. Our starting point is that all vehicles and drivers carrying passengers for hire and reward should be safe. This suggests that the same safety requirements should apply to both taxis and PHVs. Such national standards would be set by the Secretary of State and the Welsh Ministers, in respect of drivers, vehicles and operators. We recommend that this be done following consultation.
These standards include, but would not be limited to:
1) for drivers: “fit and proper” person, medical, CRB checks, and disability awareness training;
2) for vehicles: roadworthiness standards and potentially accessibility for particular vehicles; and
3) for operators: “fit and proper” person.
In respect of PHVs which operate exclusively on a pre-booked basis, competitive forces work reasonably well, and the argument for intervention beyond safety is not strong. We therefore propose the national standards above would be mandatory so that local authorities could not impose more stringent conditions and fees for issuing PHV driver and vehicle licences would be set nationally. We would propose to maintain operator licensing as a useful layer of enforcement and information gathering in respect of licensing functions for local authorities.
By contrast the hail and rank markets do not allow competition to operate effectively. These forms of engagement by consumers in the market prevent competition on price and standards. The same is not true of the pre-booked market. By making these markets the exclusive remit of taxis it is possible to target regulation to address specific market failures more effectively and at a local level. On this model taxi regulation should continue to be a local matter subject to national minimum standards. Local authorities would be able to impose higher standards. It may be necessary to prescribe or proscribe particular conditions at national level.

8
Matters over which local authorities would retain standard-setting powers include:
1) maximum fares;
2) disabled access including 100% wheelchair accessibility;
3) additional driver requirements such as topographical knowledge; and
4) vehicle standards in respect of defined categories, including for example, livery, colours and age policies.
We believe that where national and local standards are set in an appropriate fashion, the licensing regime will be simpler, more consistent and more transparent. This will lead to fewer burdens being placed on those within the industry, by way of local variations and restrictions, as well as unforeseen costs. It will also give licensing officers greater clarity in performing their role.
The appropriate setting of these two sets of standards and of fees, with the taxi minimum at least as high as the national PHV mandatory standard, should remove any incentive for operators to register as taxis in one area in order to operate as PHVs in another, one of the most high profile problems with the current law.
We note in particular that a rural local authority without a significant hailing or rank market could choose to adopt the national mandatory PHV standards for their taxi fleet. This would achieve a similar result to opting into a one tier system of the local authority, bringing the benefits of Option 2 below, but without what we see as the disadvantages of applying this on a nationwide scale.
The issuing of licences and enforcement would remain a local authority function. Enforcement officers would be able to enforce against any vehicle, no matter where it was licensed. Given the nationalisation of PHV operation and merging of safety standards in respect of all vehicles this would, we hope, be easier to apply in practice and alleviate cross-border issues. The requirement that driver, vehicle and operator all be licensed in the same area would no-longer apply. The PHV industry, which in many ways already operates on a more national scale than the taxi trade, would no longer be restricted by what are often redundant borders.
We think London could be accommodated within the regulatory framework above as it would provide sufficient scope to set appropriate standards reflecting its unique governance arrangements in respect of transport; as well as its particularly vibrant rank and hailing markets.
We propose the abolition of quantity restrictions as we think that appropriate standard setting can provide a sufficient safeguard for standards; and that environmental and traffic regulations specifically targeted to the problems raised are more likely to achieve the desired results.
The scope of our preferred reform option covers all road transport services provided for hire with the services of a driver. We recognise that this covers a broad category of vehicles, many of which will not conform to the standard saloon car or taxi cab models. For this reason, we propose that the Secretary of State and Welsh Ministers would have the power to lay down different standards for different categories of vehicle, or indeed to exempt certain vehicles and services from the scope of regulation.
9
Option 2: One-tier (major reform)
One possible form of reform would be to move away from the current distinction between taxis and private hire vehicles to what is described as a “one tier” system.
This option would provide for a single category of licensed vehicle that would be able to take pre-bookings, to be hailed and to wait on ranks on the same basis as current taxis. There would be no free-standing category of PHV licence. Variants of this option would introduce some modifications to the basic model. An example might be to reserve certain positions in prime ranks for use only by wheelchair accessible vehicles.
The reason we have provisionally chosen not to pursue this route to reform is because we see the pre-booked market on the one hand, and hailing and ranking markets on the other, as having very different characteristics. These characteristics suggest the imposition of basic safety standards on private hire vehicles, but no more. By contrast, there is a need for much more thoroughgoing intervention into the taxi market, to regulate fares, quality, additional safety provision and what we have described as uniformity conditions.
It follows, in our view, that the economics of the market in which taxis and private hire vehicles operate, and the regulatory implications thereof, support a distinction between those vehicles and drivers who should be permitted to undertake only pre-booking, and those who should also be able to engage in the hailing and ranking markets.
If greater intervention is needed in one market and not the other, then a one tier approach necessarily implies that either one market will be over-regulated, or the other under-regulated. Either we accept unnecessary and anti-competitive restrictions on pre-booking, such as fare regulation and higher quality standards; or we fail to properly regulate fares and quality in the hailing and ranking markets. Either way, consumers lose. In the first situation, they are faced with inflated prices (and, possibly, less choice in respect of quality) in the pre-booked market. In the second situation, they face exploitative monopoly fares and poor quality provision in the hailing and ranking markets. Equally, it would be very difficult to ensure proper provision for disabled users in a one-tier system. The loss of the distinction between taxis and private hire vehicles would, as with fares, result in either over-regulation – in the form of a requirement that all vehicles be wheelchair accessible, or by only allowing WAVs to access ranks, for example – or under-regulation, for example simply allowing market forces to operate. As we have seen, market forces do not ensure sufficient provision in the hailing and rank markets.
For the above reasons, we do not pursue the one-tier system as a valid option. Our analysis below focuses on our preferred option, that of a reformed two-tier system.
Main Stakeholders
The main stakeholders are:
Taxi service providers: this includes drivers, vehicle owners and operators, and extends to limousine services and other non-standard services;
Licensing bodies, for example TfL and Councils outside of London;
Enforcement agencies, including the police;
The court system; and
Taxi users – the general public, and in particular those with mobility needs and those in areas which do not enjoy good public transport.
Scale and scope
The term taxi generally refers to the two main types of licensed vehicles – hackney carriages (the legal term for taxis), which undertake hail and rank work but can also do pre-booked work, and private hire vehicles, which can only undertake pre-booked work. Both provide a door-to-door service, but other similar arrangements also fall within

10
this functional description, for example limousines and novelty cars. See Table 1 below showing relative market size by taxi service category.
Table 1: Comparative taxi and private vehicle hire market size in England and Wales, 2011
Taxi service Number of vehicles
Hackney carriage 78,000
Private hire vehicles 155,100
Limousines* 6,000*
Source: DfT Taxi Survey, 2011; * Anecdotal evidence supplied through consultation
Number of drivers and vehicles
The Department for Transport taxi survey estimates that there are now 299,200 licensed taxi or PHV drivers in England and Wales.11 Of this number 287,300 (or 96 percent) drivers are based in England. It is clear that the number of licensed drivers exceeds the number of licensed vehicles by 66,100, or 28 percent. A much larger proportion of drivers are PHV licensed as against hackney carriage license holders, see chart 1 below.
Chart 1: Total licensed drivers in England
PHV-only54%
Taxi-only23%
Dual taxi-PHV23%
PHV-only
Taxi-only
Dual taxi-PHV
Source: DfT Taxi Survey, 2011.
Although there are approximately 300,000 licensed drivers, this includes both part time drivers and those who still have a licence but are inactive. Coming to a realistic figure for the total of full-time equivalent active drivers is not easy, and there is little data available. We accept that the concept of full-time equivalent active drivers is itself speculative given the wide variety of working patterns present within the trades. We suggest a range of active drivers between 200,000 and 300,000 with a best estimate of 250,000 full-time equivalent active drivers. We refer to this figure for the purposes of estimating the total revenue for the trades. However for the purposes of estimating training costs for example we have used a conservative figure including all licence holders.12
We estimate current industry full-time equivalent employment to be around 250,000. This would accord with estimates from industry sources. As we have endeavoured to make clear, this figure is not based on very robust data, and we particularly welcome views on whether it is a reasonable estimate or not.
There is a clear geographical difference between the number of vehicles operating in London and numbers in all other regions outside of London. In 2011 London, with an estimated 29 percent of taxis and 33 percent of all private
11
http://www.dft.gov.uk/statistics/releases/taxi-and-private-hire-vehicle-statistics-2011/. 12
The distinction between full time and part time working does not, however, impact training costs because all drivers would need to be qualified to the same relevant standard.

11
hire vehicles, accounted for a disproportionately large share of industry activities.13
Taxi and private hire services are particularly important to households without a car. Car availability is strongly correlated with income. In 2010 it was estimated that four times as many trips were made by households without cars in taxis (relative to five time times as many trips by bus).14 The Survey identified 49 percent of households in the lowest income quartile as being car-less as against 9 percent in the highest income quartile.
It is estimated that around one-fifth of the population in the UK is disabled – over 10 million people.15 Approximately 4.6 million of those with disabilities are over the state pension age and, with an ever-aging population.16 Disabled persons are reported to travel approximately a third less often than those who are not disabled, but disabled people use taxis and private hire vehicles approximately 67% more than people who are not disabled.17 The Disabled Persons Transport Advisory Committee report that
For a large and growing number of elderly and disabled people, they are quite literally a lifeline. Often taxis provide the only means of accessible local transport, or the only accessible link to long distance transport, for example, by rail or air. In fact, they are the most flexible form of public transport this is.18
Industry revenue
There is currently no robust estimate of industry revenue which we feel confident in using. We have therefore attempted to estimate total revenue by using four different methods, We put the resulting figures forward as a basis for consultation. The critique to which our earlier approach to industry revenue was subjected has been very helpful in developing our current approach, and we hope that consultation will result in improvements to the assumptions we make. Because of our uncertainty over this critical figure, we have accepted the need for a large range.
There is one strong empirical statistic. This comes from the ONS Household survey, which estimates UK household expenditure on taxi and PHV journeys as £2.645 billion (in 2011 prices). Adjusted on a simple population basis to reflect the population of England and Wales rather then the UK, this give a domestic household figure of £2.35 billion.19 However, this significantly underestimates total industry revenue because it excludes expenditure on taxi and private hire services by (a) businesses; (b) statutory services; and (c) foreign households – that is, primarily foreign tourists. We call this non-household expenditure below.
Case/Calculation one
The first calculation is based on adding a figure to the ONS household survey data to represent non-household expenditure.
The calculation depends on coming to an estimate for the percentage uplift to be applied to the ONS household survey figure to arrive at a figure for total revenue. It is therefore sensitive to the accuracy of our assumptions about uplift. This is an area where we hope feedback on consultation will assist us in improving the estimate.
We think it likely that the uplift required for London is higher than outside London. While expenditure by statutory services will probably be similar to that elsewhere in England and Wales, we think it likely that both private business and foreign tourist expenditure will be significantly higher. In London, we therefore propose an uplift of 75% to 125% for non-household expenditure. In reality, the real uplift figure for large towns and cities outside London will be
13
http://www.dft.gov.uk/statistics/releases/taxi-and-private-hire-vehicle-statistics-2011/. 14
See National Travel Survey 2010, Travel by car availability, income, ethnic group, household type and NS-SEC, page.2, published by the Department for Transport, 2011.
15 This statistic was taken from Department for Transport, Consultation on Improving Access to Taxis (February 2009) para 1.5, bullet 2. The
source is not attributed. 16 We note however that older people are likely to be under-represented by such figures as they do not include care home residents; and
further, the figures are based partly on self-declaration and most studies show that older people are either less likely to disclose a disability or identify as being disabled.
17 Disabled Persons Transport Advisory Committee, Attitudes of Disabled People to Public Transport – a research study conducted for the
Disabled Persons Transport Advisory Committee (November 2001). 18
Disabled Persons Transport Advisory Committee, Advice for taxi drivers – meeting the needs of disabled passengers, available at: http://dptac.independent.gov.uk/pubs/taxiadvice/index.htm (last visited 12 March 2012).
19 http://www.ons.gov.uk/ons/rel/pop-estimate/population-estimates-for-uk--england-and-wales--scotland-and-northern-ireland/mid-2010-
population-estimates/annual-mid-year-population-estimates--2010.pdf (last visited 7 June 2012).

12
different from that in smaller urban centres and rural areas. Accepting that, we nevertheless suggest a general uplift outside London of between 20% and 50%. The calculation also assumes that household expenditure in London and the rest of England and Wales is divided on the same ratio as taxi/PHV vehicular provision in each area, that is, 30% in London and 70% outside London. See table 2 below.
Table 2: Industry revenue estimate – ONS adjusted
Case/Calculation two
This calculation depends on multiplying the number of miles travelled by members of the public with a figure which represents the average fare.
The average mileage travelled per adult on taxi journeys in England and Wales is 54 miles per year.20 The adult (17+) population in 2010 was just over 44 million.
There is no reliable single figure for the average fare per mile. We explain the concept of the “running mile” below.21 This figure, which seems to us to be generally used in the trade, is directly derived from maximum fare levels set by local licensing authorities. Because of the complexities of tariff structures, it cannot represent a true average of taxi journeys actually undertaken, but it nevertheless seems to provide a reasonable approximation. The figure also seems to be used by many private hire operators as a means of setting fares for equivalent journeys by private hire vehicles. Again, this is imprecise. First, many private hire operators do not peg themselves to the running mile. Higher end operators will certainly charge more. Secondly, many private hire journeys are not comparable to metered taxi journeys. They include longer journeys, which for a taxi would be out-of-area; and contract work for statutory services (such as the NHS, social services and education authorities) may not rely on the running mile. In addition, the calculation missing altogether foreign tourists, a significant element of revenue in some areas.
With these caveats in mind, the national average of the running mile in tariff one is £1.78.22 This is a simple average of all local authority areas, not weighted by number of taxis in each area. This is likely to result in under-estimation, as it does not reflect the significance of London in the overall volume of trade (the running mile for London is £2.50).
Applying the national average to the average journey length gives a figure of about £4.3 billion per annum.
20
See Department for Transport, National Travel Survey 2010, Table NTS0305. 21
See the section ‘Fees and entry restrictions’ at p 15 below. 22
The National Private Hire Association has maintained a database of key statistics for over 10 years. The national average of the running mile was supplied from this source. We know that regulated fares apply only to hackney carriages but think this is a reasonable proxy which can also be used as an estimate of the likely per mile charge also faced by PHV drivers.
Low estimate Best estimate High estimate A. Household expenditure: England and Wales (£ bn)
2.35 2.35 2.35
B. Non-household expenditure: London % of A
75 100 125
C. Non-household expenditure: London (£ bn). (A x B)
1.76 2.35 2.94
D. Non-household expenditure: Out of London % of A
20 33 50
E. Non-household expenditure: Out of London (£ bn). (A x D)
0.47 0.78 1.18
F. Non-household expenditure (weighted): England and Wales (£ bn). (30% x C) + (70% x E)
0.86 1.26 1.71
G. Industry Revenue (£ bn). (A+F) 3.21 3.61 4.06

13
Case/Calculation three
This calculation seeks to establish an overall figure for revenue by estimating driver gross receipts. All of these calculations are subject to error, as we have explained. This calculation in particular is highly speculative.
In order to operate as a taxi/PHV driver there is a requisite minimum expenditure of about £250 to cover insurance, licensing, radio rental for PHVs and leasing/finance arrangements. We make the assumption that drivers will need to meet this cost initially and will subsequently aim to secure at least the equivalent of a minimum wage for a standard working week. We emphasise that we are not suggesting that drivers only work a standard week, and in that standard week earn the minimum hourly wage. Rather, we are suggesting that drivers will work such hours as are necessary to earn something similar to the minimum wage, at least. We have taken further account of fuel expenditure to identify gross earnings. See table 3 below
Table 3: Estimated industry revenue – earnings based
Low estimate Best estimate High estimate
A. Number of drivers 250,000 250,000 250,000
B. Minimum weekly earnings (£) 230 260 300
C. Expenditure on fuel/licensing/insurance (£) 250 275 300
D. Gross earnings
(B + C) (£)
480
535
600
E. Industry revenue
A x D x 50 (£ bn)
6.00
6.69
7.50
Assumptions:
Vehicles are operational over a 50 week period.
Taxi/PHV drivers earn at least the national minimum wage, which is £6.08 per hour and equivalent to gross earnings of about £230 per week (low estimate) – with an uplift ranging to £300;
Expenditure on licensing, insurance, leasing/vehicles financing costs and fuel, etc are approximately £250-£300
250,000 taxi/PHV drivers are actively engaged
Anecdotal evidence from the industry, across a diversity of regions, consistently identified an gross annual earnings of about £25,000 - £30,000. Assumed weekly earnings are consistent with this value.
Case/Calculation four
This calculation proceeds from an estimate of average driver mileage, to which an approximate average fare is applied.
Using the following assumptions:
Average taxi/PHV driver mileage ranges from 500-70023 miles per week;
Paid mileage is determined by accounting for just one half of the journey – which is appropriate for PHV drivers but
23
We recognise that this is an average value and carries with it the limitations associated with an average. Industry evidence indicates a wide range of values where small firms (and those located outside town centres) average about 500 miles, whereas larger town centre located firms can have much higher values – 700 miles per week.
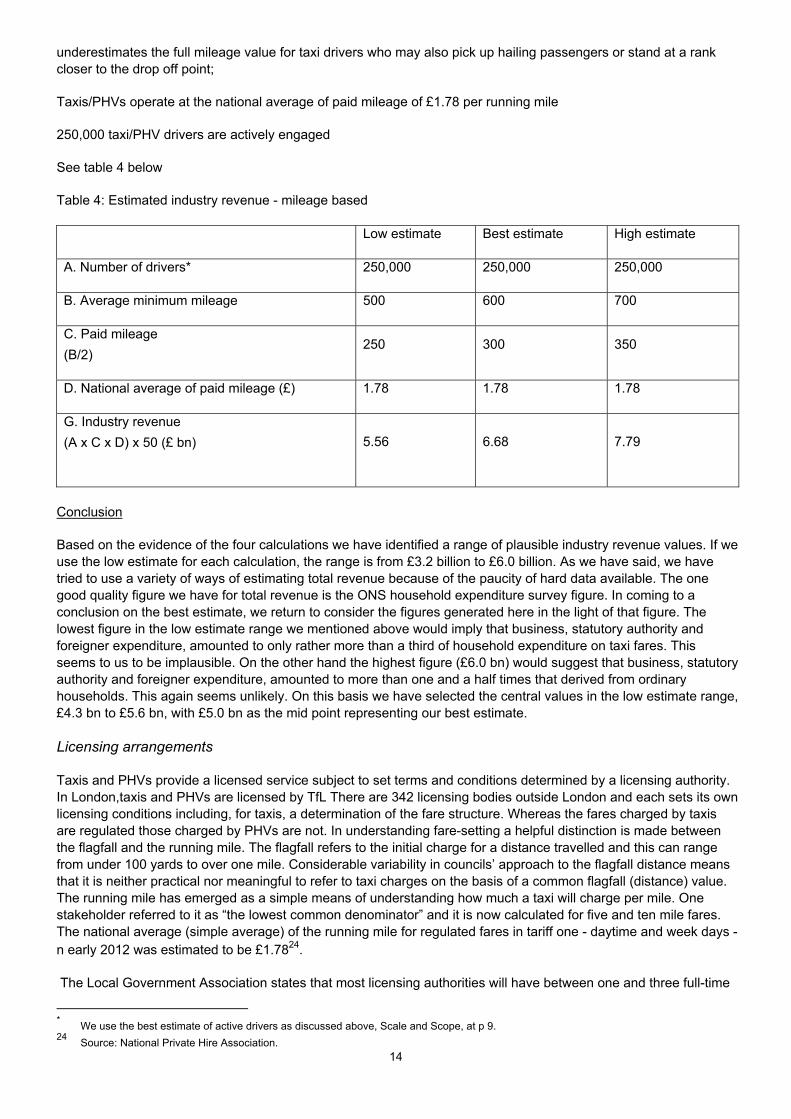
14
underestimates the full mileage value for taxi drivers who may also pick up hailing passengers or stand at a rank closer to the drop off point;
Taxis/PHVs operate at the national average of paid mileage of £1.78 per running mile
250,000 taxi/PHV drivers are actively engaged
See table 4 below
Table 4: Estimated industry revenue - mileage based
Low estimate Best estimate High estimate
A. Number of drivers* 250,000 250,000 250,000
B. Average minimum mileage 500 600 700
C. Paid mileage
(B/2) 250 300 350
D. National average of paid mileage (£) 1.78 1.78 1.78
G. Industry revenue
(A x C x D) x 50 (£ bn) 5.56 6.68 7.79
Conclusion
Based on the evidence of the four calculations we have identified a range of plausible industry revenue values. If we use the low estimate for each calculation, the range is from £3.2 billion to £6.0 billion. As we have said, we have tried to use a variety of ways of estimating total revenue because of the paucity of hard data available. The one good quality figure we have for total revenue is the ONS household expenditure survey figure. In coming to a conclusion on the best estimate, we return to consider the figures generated here in the light of that figure. The lowest figure in the low estimate range we mentioned above would imply that business, statutory authority and foreigner expenditure, amounted to only rather more than a third of household expenditure on taxi fares. This seems to us to be implausible. On the other hand the highest figure (£6.0 bn) would suggest that business, statutory authority and foreigner expenditure, amounted to more than one and a half times that derived from ordinary households. This again seems unlikely. On this basis we have selected the central values in the low estimate range, £4.3 bn to £5.6 bn, with £5.0 bn as the mid point representing our best estimate.
Licensing arrangements
Taxis and PHVs provide a licensed service subject to set terms and conditions determined by a licensing authority. In London,taxis and PHVs are licensed by TfL There are 342 licensing bodies outside London and each sets its own licensing conditions including, for taxis, a determination of the fare structure. Whereas the fares charged by taxis are regulated those charged by PHVs are not. In understanding fare-setting a helpful distinction is made between the flagfall and the running mile. The flagfall refers to the initial charge for a distance travelled and this can range from under 100 yards to over one mile. Considerable variability in councils’ approach to the flagfall distance means that it is neither practical nor meaningful to refer to taxi charges on the basis of a common flagfall (distance) value. The running mile has emerged as a simple means of understanding how much a taxi will charge per mile. One stakeholder referred to it as “the lowest common denominator” and it is now calculated for five and ten mile fares. The national average (simple average) of the running mile for regulated fares in tariff one - daytime and week days - n early 2012 was estimated to be £1.7824.
The Local Government Association states that most licensing authorities will have between one and three full-time
* We use the best estimate of active drivers as discussed above, Scale and Scope, at p 9.
24 Source: National Private Hire Association.
15
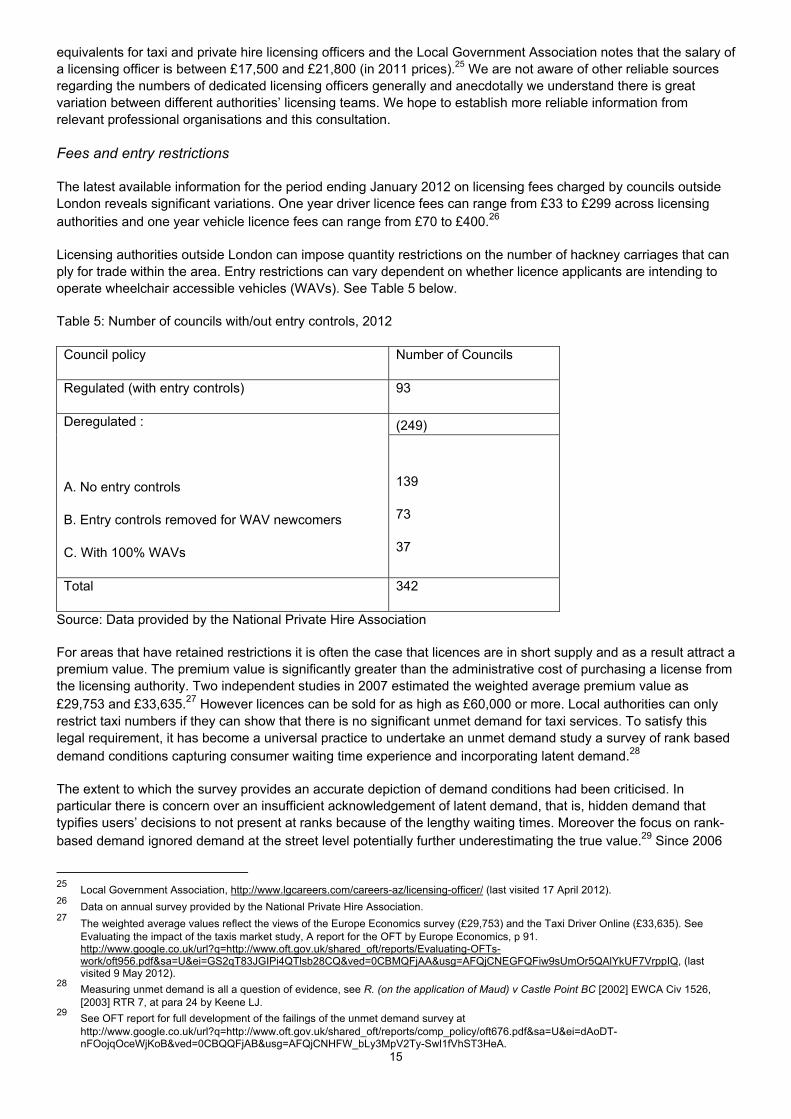
equivalents for taxi and private hire licensing officers and the Local Government Association notes that the salary of a licensing officer is between £17,500 and £21,800 (in 2011 prices).25 We are not aware of other reliable sources regarding the numbers of dedicated licensing officers generally and anecdotally we understand there is great variation between different authorities’ licensing teams. We hope to establish more reliable information from relevant professional organisations and this consultation.
Fees and entry restrictions
The latest available information for the period ending January 2012 on licensing fees charged by councils outside London reveals significant variations. One year driver licence fees can range from £33 to £299 across licensing authorities and one year vehicle licence fees can range from £70 to £400.26
Licensing authorities outside London can impose quantity restrictions on the number of hackney carriages that can ply for trade within the area. Entry restrictions can vary dependent on whether licence applicants are intending to operate wheelchair accessible vehicles (WAVs). See Table 5 below.
Table 5: Number of councils with/out entry controls, 2012
Council policy Number of Councils
Regulated (with entry controls) 93
(249) Deregulated :
A. No entry controls
B. Entry controls removed for WAV newcomers
C. With 100% WAVs
139
73
37
Total 342
Source: Data provided by the National Private Hire Association
For areas that have retained restrictions it is often the case that licences are in short supply and as a result attract a premium value. The premium value is significantly greater than the administrative cost of purchasing a license from the licensing authority. Two independent studies in 2007 estimated the weighted average premium value as £29,753 and £33,635.27 However licences can be sold for as high as £60,000 or more. Local authorities can only restrict taxi numbers if they can show that there is no significant unmet demand for taxi services. To satisfy this legal requirement, it has become a universal practice to undertake an unmet demand study a survey of rank based demand conditions capturing consumer waiting time experience and incorporating latent demand.28
The extent to which the survey provides an accurate depiction of demand conditions had been criticised. In particular there is concern over an insufficient acknowledgement of latent demand, that is, hidden demand that typifies users’ decisions to not present at ranks because of the lengthy waiting times. Moreover the focus on rank-based demand ignored demand at the street level potentially further underestimating the true value.29 Since 2006
25
Local Government Association, http://www.lgcareers.com/careers-az/licensing-officer/ (last visited 17 April 2012). 26
Data on annual survey provided by the National Private Hire Association. 27
The weighted average values reflect the views of the Europe Economics survey (£29,753) and the Taxi Driver Online (£33,635). See Evaluating the impact of the taxis market study, A report for the OFT by Europe Economics, p 91. http://www.google.co.uk/url?q=http://www.oft.gov.uk/shared_oft/reports/Evaluating-OFTs-work/oft956.pdf&sa=U&ei=GS2qT83JGIPi4QTlsb28CQ&ved=0CBMQFjAA&usg=AFQjCNEGFQFiw9sUmOr5QAlYkUF7VrppIQ, (last visited 9 May 2012).
28 Measuring unmet demand is all a question of evidence, see R. (on the application of Maud) v Castle Point BC [2002] EWCA Civ 1526,
[2003] RTR 7, at para 24 by Keene LJ. 29
See OFT report for full development of the failings of the unmet demand survey at http://www.google.co.uk/url?q=http://www.oft.gov.uk/shared_oft/reports/comp_policy/oft676.pdf&sa=U&ei=dAoDT-nFOojqOceWjKoB&ved=0CBQQFjAB&usg=AFQjCNHFW_bLy3MpV2Ty-Swl1fVhST3HeA.

16
unmet surveys, for example the recent Wirral taxi unmet demand survey,30 have attempted to capture latent demand within the index of significant unmet demand through the “latent demand factor”. This is derived from a public attitude survey of the proportion of the public who have given up trying to obtain a taxi. The survey involves consultation across a broad range of stakeholders and is a cost to the taxi trade of about £15,000 to £40,000 per survey.
Training
Most licensing authorities operate a system of on-going training for their licensing officers. Much of the training is currently undertaken in-house and through national organisations. Licensees also undertake training – some of which is mandatory within particular licensing authorities. There are three main nationally recognised qualifications for drivers:
Driving Standards Agency (DSA) driving assessment for taxis and private hire vehicles – a single test involving an eyesight test and a practical test including manoeuvres, “cabology” questions and passenger safety and comfort, The enhanced assessment also includes a wheelchair exercise.
Edexcel BTEC Level 2 Certificate in Introduction to the role of the professional taxi and private hire driver – 15 credit course covering 9 units including the regulatory framework, taxi and private hire services for passengers who require assistance and health and safety in the taxi and private hire environment;31
Edexcel level 2 NVQ Certificate in road passenger vehicle driving (Taxi and Private Hire) – 30 credit course covering 16 units including similar units to the certificate above plus optional units focussed on the management and administration of a small business and fare specific training.32
The DSA assessment is currently required by a number of local authorities. It costs approximately £93, depending on when it is taken, although candidates are advised to take professional lessons beforehand. Both Edexcel qualifications were developed following lengthy consultation with the trade and the first course delivery was in January 2011. Anecdotal evidence suggests that about 30 percent of existing drivers have the relevant training. The NVQ is fully funded33 at around £1200 and the introduction subsidised at £398. Programmes are available at colleges and private bodies at a cost that varies between £400 - £600 for the introduction.
We are also aware of at least one local authority (North West Leicestershire) which provides in-house disability awareness training for just £20.
Taxi offences and prosecution costs
The burden on the justice system created by licensing issues is great. The majority of cases are heard in the magistrates’ court, although some are appealed to the Crown Court or High Court.
When court costs are added to the cost of undertaking the initial investigation and enforcement work, the final cost is often significant. As these are criminal cases, the costs awarded where the defendant is found guilty rarely reflect the outlay incurred by the prosecuting authority.
The following information was supplied by Middlesbrough Council. It is based on a representative range of offences prosecuted between 2008 and 2011. This information can be built upon to give an impression of costs incurred by licensing authorities across England and Wales. The information below relates to criminal prosecutions. Unfortunately it has not been possible to obtain similar statistics for civil cases, such as where a licencee appeals against the imposition of a condition, the refusal of a licence or a decision to suspend or revoke a licence. See table 6 below.
30 http://www.national-taxi-association.co.uk/wp-content/uploads/2012/01/HALCROW-WIRRAL-SURVEY-2011.pdf (last visited 7 May 2012). 31
http://www.edexcel.com/quals/Specialist/taxi-ph-driver-lvl2/Pages/default.aspx (last visited 3 May 2012). 32
http://www.edexcel.com/quals/NVQ-competence-based-qcf/rpt/Pages/default.aspx (last visited 3 May 2012). 33
As at May 2012 funding is currently available for certain categories of the unemployed.

17
Table 6: Middlesbrough Council average prosecution costs 2008 - 2011
Category Cost Range Average investigation costs £132.22 £101.98 – £155.81 Average legal costs £510.93 £200 - £1537.50 Average total cost to council £615.03 £304.58 - £1693.31 Average costs awarded £148.86 Nil - £362 Average loss to council £466.17 N/A Average recovery rate 24.2% N/A
Taxi and private hire licensing is a self-funding function of licensing authorities. Thus where a local authority incurs, for example, annual expenditure of £10,000 on enforcement activities (including unrecovered legal costs), this may be passed on to the trade via increased licence fees.34 This leads to a great deal of resentment, as legitimate licensees are essentially penalised for the actions of rogue operators
A prosecution incurs the additional investigation costs inclusive of professional fees of expert witnesses and officers’ time. It is often the case that the true cost in bringing a case is not reflected in the costs sought from courts. This means that licensing authorities may face considerable losses through taking cases to court and may act as a disincentive.
Safety and assault evidence
Safety improvements are a significant objective of the proposed legislative reform. Safety improvements would stem from two sources: first, a reduction in journeys involving an unlicensed vehicle and/or driver, and secondly, improved and uniform vehicle safety standards.
Passenger safety
The most recent statistics on the number of accidents involving taxis is for the 2008-2010 period and it provides a mixed message.
Table 7: Accidents involving taxis and cars, 2008-2010
Vehicle type 2008 2009 2010 Total Taxis - Fatal 50 34 40 124 - Serious 641 613 556 1,810 - Slight 4,453 4,516 4,595 13,564 Cars - Fatal 2,661 2,292 1,882 6,835 - Serious 24,907 23,668 21,667 70,242 - Slight 203,284 195,324 183,194 581,802
Source: Department for Transport
With the exception of slight injury accidents, there is a declining trend with respect to fatal and serious accidents. Comparative figures on the total number of accidents per 1000 of licensed taxis as against licensed cars reveals a significant difference in performance. Taxi accidents accounted for 117.53, 118.04 and 118.49 with respect to 2008, 2009 and 2010. In the case of cars the comparative figures were 8.20, 7.83 and 7.28 for the same 2008-2010 period.
Transport for London reported 111 cab-related sexual offences in 2010 alone35 and Greater Manchester Police recorded 98 offences of rape or sexual assault linked to taxis and private hire vehicles in the same period.36 Whilst the latter figure may appear to be disproportionately high, the data was obtained through a Freedom of Information request. In its response, Greater Manchester Police noted that the information given was based on a search for offences where keywords such as "taxi", "cab" and "minicab". This means that offences which took place against a
34 Outside of London, only vehicle licence fees can fund enforcement whereas driver and operator licence revenue cannot be used for this
purpose, see See Local Government (Miscellaneous Provisions) Act 1976, s 53; and the Guildford Auditor case at www.guildford.gov.uk/cHttpHandler.ashx?id=6647&p=0 (last visited 23 April 2012).
35 See http://www.tfl.gov.uk/corporate/media/newscentre/archive/21165.aspx (last visited 10 April 2012).
36 Freedom of Information request submitted by Mr L Reid to Greater Manchester Police, 3 January 2011, reference 10/11.

18
taxi-related background, but were not perpetrated by the driver or passenger may have been included. A recent Freedom of Information request submitted to Merseyside Police revealed 22 sexual offences alleged to have been committed by taxi or private hire drivers against passengers.37
The Home Office 2003/04 study of the cost of crime38 estimated that the most costly crimes are those such as sexual offences and homicide which have a very high emotional and physical impact. The estimated total cost of £31,438 (in 2003 prices) attempts to capture the costs to the criminal justice system, lost productivity but even so it still considerably underestimates costs.
Driver safety
It is important to recognise that drivers too are at risk. In the past 20 years, 63 taxi or private hire drivers have been murdered.39 Whilst this figure does not distinguish between those who were killed whilst working and those whose deaths were not linked to the trade, it is nevertheless a substantial concern. Drivers are frequently victims of assaults and robberies. Our proposals would allow for driver safety measures to be provided for by regulation.
COST BENEFIT ANALYSIS
This impact assessment identifies both monetised and non-monetised impacts of intervention, with the aim of understanding the overall impact on society and the wider environment. The costs and benefits of each option are measured against the “do nothing” option. Impact assessments place a strong emphasis on valuing the costs and benefits in monetary terms (including estimating the value of goods and services that are not traded). However there are important aspects that cannot sensibly be monetised. These might include impacts on equity and fairness, either positive or negative, or enhanced (or diminished) public confidence.
The impact assessment process requires that we make an assessment of the quantifiable costs and benefits even when there is insufficient material on which to base those calculations. Where possible we have spoken to practitioners to inform our view of the likely aspects to be affected by the change in policy and have used this as the basis for our calculations. Where it has not been possible to obtain a rough indication of numbers in this way we have had to make a realistic estimate. In such cases we have taken a conservative approach and have tended to use figures that we considered likely to under-estimate benefits and over-estimate costs.
In the absence of sufficient data we have used a range of estimates in our calculations. Some of the assumptions apply in both the cost and benefit calculations. When calculating the net present value (NPV) for the impact assessment we have used a time frame of ten years, with the current year being year 0.40 We have assumed that the transitional costs and benefits occur in year 0, with any exceptions to this rule being clearly identified, and ongoing costs and benefits accrue in years 1 to 10. We have discounted the values accordingly using a discount rate of 3.5% in all cases in accordance with HM Treasury guidance. Unless stated, all figures are in 2010/11 prices, and have been uprated using the GDP deflator.
A summary analysis and evidence sheet is available for our preferred Option 1.
Option 0: Do nothing
Costs
Extreme variability in councils’ approach to licensing creates unpredictable, burdensome and at time arbitrary additional costs for those within the trade. For example, a licensing authority may decide to impose an age limit, requiring certain proprietors to acquire new vehicles, or a colour policy which will require vehicles to be resprayed. The time and resource put into determining matters such as this presumably gives rise to costs for the local authorities concerned as well, as these decisions involve elected members as well as officers, and sometimes involve consultation with the industries and members of public.
37
Freedom of Information request DM106/12. 38 R Duborg and J Hamed, The economic and social costs of crime against individuals and households 2003/04, June 2005. 39
Source: National Private Hire Association. 40
The net present value is the discounted stream of benefits less the discounted stream of costs. The present value of an annual cost is the discounted stream of that cost.

19
The inability of potential entrants to the taxi industry to operate in restricted areas effectively prohibits the opportunity to engage in productive activity and constrains the competitive process. The same applies with regards to private hire operators wishing to expand their business into other local authority areas. The requirement that driver, vehicle and operator be licensed by the same local authority, and the prohibition on sub-contracting out of area, significantly constrains the competitive process.
The variable and sometimes arbitrary nature of licensing decisions leads to a high volume of court cases. These are expensive both in terms of court time and costs, and the costs for local authorities and appellants. It is inefficient as licensing officers often lack sufficient powers to deal with offenders and are only able to tackle offenders who are a) licensed and b) licensed by the authority for which they work. Enforcement officers often require to be accompanied by police officers, who clearly have far greater powers, and indeed in some local authorities’ enforcement only takes place with police officers, as to do otherwise is seen to be wasteful.
Consumer welfare can be affected through longer waiting times than might otherwise be the case as a result of limited taxi availability. The availability of private hire vehicles can also be limited; for example, where an operator is unable to sub-contract a booking to an operator in another region, thus reducing supply, or where an operator is unable to use a vehicle and driver near to the passenger because they are not licensed by the same authority.
Benefits
The only benefit which accrues from the do nothing is the avoidance of costs associated with the implementation of the preferred option 1.
Option 1: Reformed two-tier system
Transitional Issues
Taxi drivers in areas with entry restrictions
Loss of the premium value attached to license plates
The removal of quantity restrictions on the number of hackney carriages over a phased period brings to an end the potential for a licence premium. This may be viewed as a transfer of value from the current incumbents to prospective taxi drivers prevented from entering the market and also to the benefit of taxi users through improved access.
As at the end of 2011 there was an estimated 93 licensing authorities operating entry controls. An estimated 20,450 vehicles are operational within these areas. Some drivers will have purchased a license directly from the licensing authorities, and therefore will not have paid the premium. For those that have purchased a license on the unofficial market - the licence value is estimated to range from a weighted average of about £32,800 to £37,100 (best estimate being the mid-point - £34,950).
The licence premium value provides an indication of potential future industry earnings. Such earnings are based on excess profits. One view that is that the higher earnings were made possible because of entry controls restricting the possibility of entrance. In any case the excess profits will be competed away with the arrival of new entrants. This will almost inevitably mean longer driver waiting times for existing drivers and also increased working hours if drivers seek to protect existing income streams. On this basis there is the potential for a loss in productive efficiency.
Based on the experience of other countries we assume a spike in market entrants in the short run given the removal of entry controls and the generally low barriers to entry which define the taxi industry. Incumbent taxi drivers lose not only the value of the licence, but often the cost of investing in a new vehicle, maintaining it and perhaps setting up as a sole trader. The controlled removal of entry restrictions seeks to limit wastage caused by a significant influx of market entrants, who leave shortly after entering the market. The addition of other quality enhancers, such as the requirement for licensee training, aims to reduce the risk of doubtful quality market entrants adversely affecting the industry reputation as this can have a long-lasting negative effect.
20
COSTS
Transitional costs
Local authorities
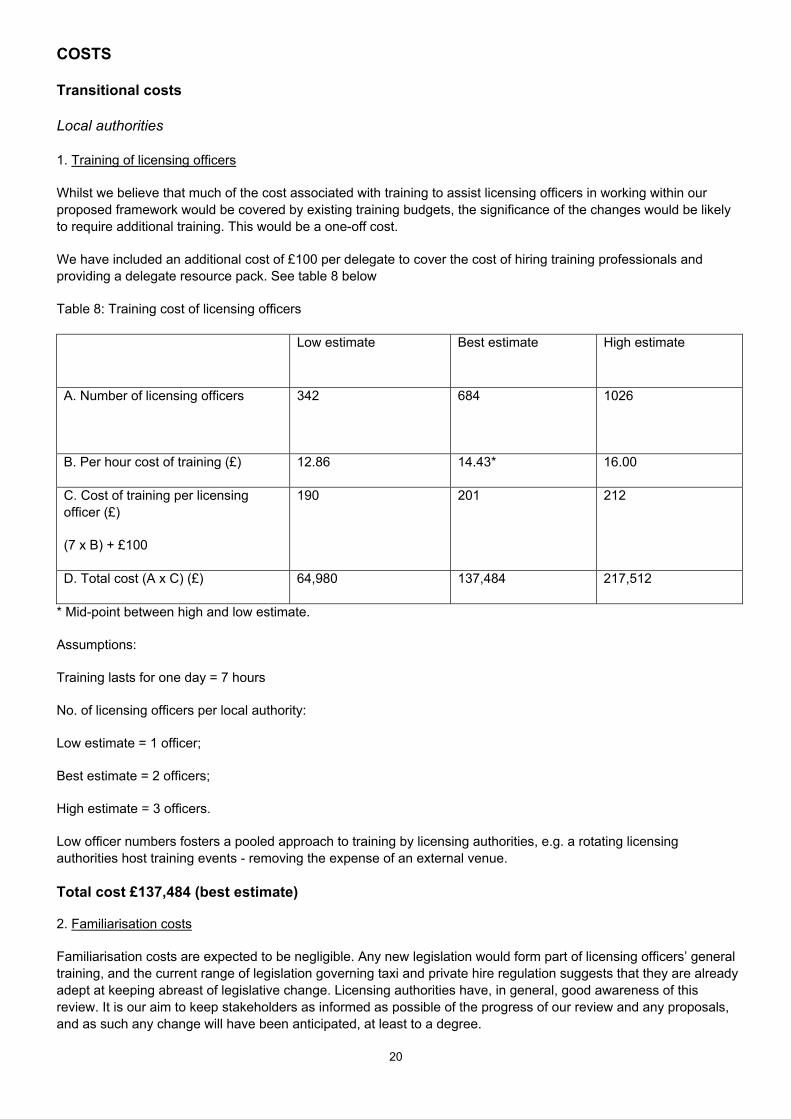
1. Training of licensing officers
Whilst we believe that much of the cost associated with training to assist licensing officers in working within our proposed framework would be covered by existing training budgets, the significance of the changes would be likely to require additional training. This would be a one-off cost.
We have included an additional cost of £100 per delegate to cover the cost of hiring training professionals and providing a delegate resource pack. See table 8 below
Table 8: Training cost of licensing officers
Low estimate Best estimate High estimate
A. Number of licensing officers
342 684 1026
B. Per hour cost of training (£) 12.86 14.43* 16.00
C. Cost of training per licensing officer (£)
(7 x B) + £100
190 201 212
D. Total cost (A x C) (£) 64,980 137,484 217,512
* Mid-point between high and low estimate.
Assumptions:
Training lasts for one day = 7 hours
No. of licensing officers per local authority:
Low estimate = 1 officer;
Best estimate = 2 officers;
High estimate = 3 officers.
Low officer numbers fosters a pooled approach to training by licensing authorities, e.g. a rotating licensing authorities host training events - removing the expense of an external venue.
Total cost £137,484 (best estimate)
2. Familiarisation costs
Familiarisation costs are expected to be negligible. Any new legislation would form part of licensing officers’ general training, and the current range of legislation governing taxi and private hire regulation suggests that they are already adept at keeping abreast of legislative change. Licensing authorities have, in general, good awareness of this review. It is our aim to keep stakeholders as informed as possible of the progress of our review and any proposals, and as such any change will have been anticipated, at least to a degree.

21
On-going Costs
Taxi and PHV trade/ local authorities/ central Government
3. Training of licensees
We have proposed a requirement that all taxi and private hire drivers undergo some form of training prior to receiving their license. This would include training on disability awareness and on giving assistance to passengers in need of it. We would not expect the appropriate training course to be stipulated in regulation; rather, this would be a matter for local authorities to decide. Currently a range of courses are available at varying costs. We envisage that the introduction of a national training requirement could lead to greater competition within the provision of these qualifications
Anticipated training costs apply to incumbents and also future industry entrants and is assumed to be one of the two most relevant qualifications - Driving Standards Agency test, generally paid for by the licensee, and the government subsidised Edexcel Level 2 introduction. See table 9 below
Table 9: Training of licensees - transitional and on-going costs
Low estimate Best estimate High estimate
A. Cost of training per licensee (£)* 93 398 398
B. No. of licensees 162,500 175,000 200,000
C. Transitional cost (£)
(A x B)
15,112,500 69,650,000 79,600,000
D Number of licensees 12,000 12,000 12,000
E. On-going cost (£)
(A x D)
1,116,000 4,776,000 4,776,000
* Rounded to the nearest pound.
Assumptions:
Current industry employment is estimated to be around 250,00041. A range of values for the number of incumbents requiring training is as follows:
65 percent of drivers have no formal qualifications – low estimate
70 percent of drivers have no formal qualifications – best estimate
80 percent of drivers have no formal qualifications – high estimate
The current pool of licensed taxi and private hire drivers is approximately 300,00042 we apply projected employment growth of 4.0%43 per annum to derive an annual increase of 12,000 drivers.
Transitional cost: £69,650,000 (best estimate); On-going cost: £4,776,000 (best estimate – on-going cost)
NPV over 10 years: £39,720,107 (best estimate)
41
Industry evidence suggests this to be a reasonable estimate of those actively engaged. We noted the difficulties with these figures at the outset of our discussion above, Scale and Scope, at p 9. 42
DfT, Taxi and Private Hire Statistics 2011, at http://assets.dft.gov.uk/statistics/releases/taxi-private- hire-vehicle-statistics-2011/taxi-2011.pdf (last visited 20 February 2012). The statistics apply as at 31 March, 2011. The higher estimate is used here to capture those drivers who are currently inactive but whom might resume operations in the future.
43 There was an estimated 18 percent growth in the number of taxi/phv drivers over the 2005-2011 period.
22
Local authorities
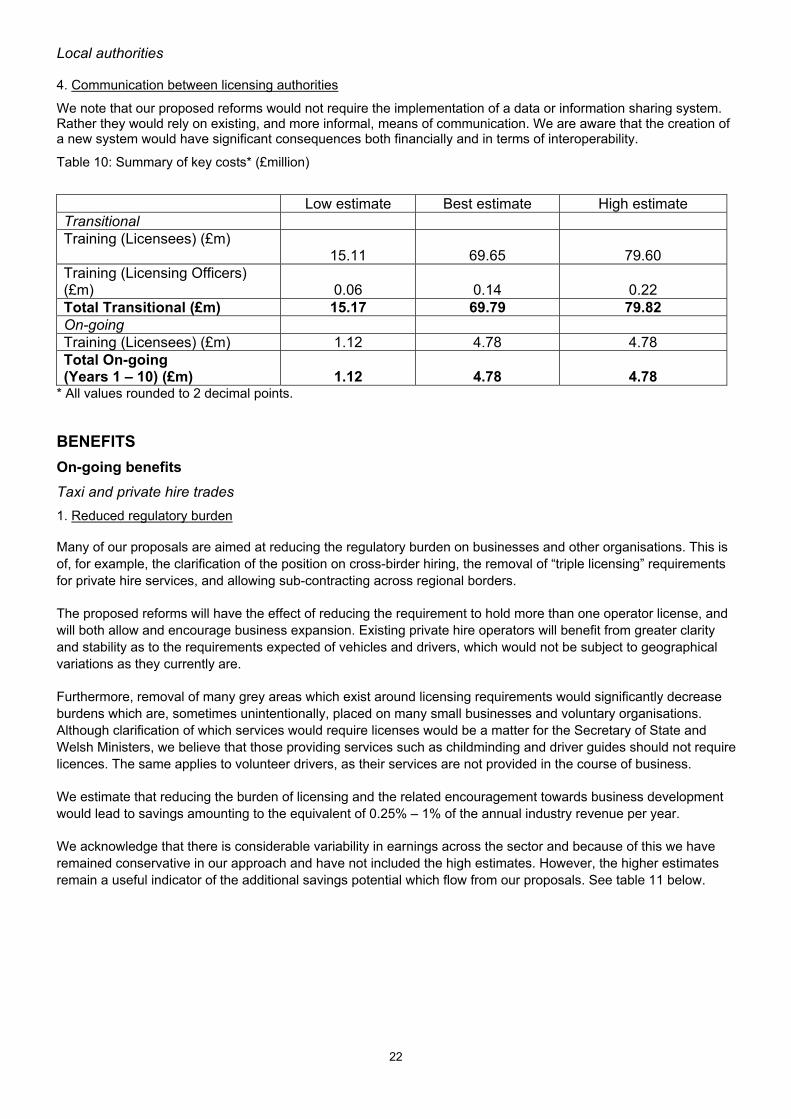
4. Communication between licensing authorities
We note that our proposed reforms would not require the implementation of a data or information sharing system. Rather they would rely on existing, and more informal, means of communication. We are aware that the creation of a new system would have significant consequences both financially and in terms of interoperability.
Table 10: Summary of key costs* (£million)
Low estimate Best estimate High estimate Transitional Training (Licensees) (£m)
15.11
69.65
79.60 Training (Licensing Officers) (£m)
0.06
0.14
0.22
Total Transitional (£m) 15.17 69.79 79.82 On-going Training (Licensees) (£m) 1.12 4.78 4.78 Total On-going (Years 1 – 10) (£m)
1.12
4.78
4.78
* All values rounded to 2 decimal points.
BENEFITS
On-going benefits
Taxi and private hire trades
1. Reduced regulatory burden
Many of our proposals are aimed at reducing the regulatory burden on businesses and other organisations. This is of, for example, the clarification of the position on cross-birder hiring, the removal of “triple licensing” requirements for private hire services, and allowing sub-contracting across regional borders.
The proposed reforms will have the effect of reducing the requirement to hold more than one operator license, and will both allow and encourage business expansion. Existing private hire operators will benefit from greater clarity and stability as to the requirements expected of vehicles and drivers, which would not be subject to geographical variations as they currently are.
Furthermore, removal of many grey areas which exist around licensing requirements would significantly decrease burdens which are, sometimes unintentionally, placed on many small businesses and voluntary organisations. Although clarification of which services would require licenses would be a matter for the Secretary of State and Welsh Ministers, we believe that those providing services such as childminding and driver guides should not require licences. The same applies to volunteer drivers, as their services are not provided in the course of business.
We estimate that reducing the burden of licensing and the related encouragement towards business development would lead to savings amounting to the equivalent of 0.25% – 1% of the annual industry revenue per year.
We acknowledge that there is considerable variability in earnings across the sector and because of this we have remained conservative in our approach and have not included the high estimates. However, the higher estimates remain a useful indicator of the additional savings potential which flow from our proposals. See table 11 below.

23
Table 11: Annual savings through reduced regulatory burden as a percentage of estimated industry revenue.
Low estimate Best estimate High estimate
A. Estimated industry revenue £4.30 billion £5.00 billion £5.60 billion
B. Percentage of industry turnover saved
0.25 0.5 1.0
C. Total savings
(A x B)
£10,750,000 £25,000,000 £56,000,000
Total Annual savings = £25,000,000 (best estimate)
NPV over 10 years = £207,915,133
Taxi and private hire trades
2. Reduction in number of taxi driver assaults
It is important to recognise that drivers too are at risk. In the past 20 years, 63 taxi or private hire drivers have been murdered. Whilst this figure does not distinguish between those who were killed whilst working and those whose deaths were not linked to the trade, it is nevertheless of great concern.
Drivers are frequently victims of assaults and robberies. If the Secretary of State and Welsh Ministers choose to introduce more stringent safety requirements our proposals could allow for increased driver safety measures. Furthermore, national training requirements should, we suggest, include disability training, and could also better equip drivers to deal with challenging environments and avoid conflict.
Taxi Users
3. Reduced waiting time
The number of taxis is expected to increase with the removal of entry controls. This has the favourable effect of reducing the waiting time for taxi users. The 2007 OFT44 report provides a monetised estimate of reduced consumer detriment. We draw on this analysis but also make a number of revisions as follows:
The average number of trips by taxi/phv is estimated at 11 per adult in 200945.
The adult population, those 17 and over, within the restricted areas46 has been calculated by applying the same ratio of adult/total population evident in the most recent population statistics for England and Wales – 2010.47 This is equivalent to 13,863,926 adults within the 93 areas which still have entry controls.
Total trips by taxi = adult population x 11 trips ie (13,863,926 x 11) = 152,503,18648
The 2007 study provides a breakdown for taxi users using hailing/ranks/telephone booking of the order 13.3%/31.3%/55.6%
44
Evaluating the impact of the Taxis market study, A report for the OFT, Europe Economics, 2007. 45
http://assets.dft.gov.uk/statistics/tables/nts0303.xls 46
Calculated by adding all the population figures within the restricted areas for 2010. 47
http://www.ons.gov.uk/ons/rel/pop-estimate/population-estimates-for-uk--england-and-wales--scotland-and-northern-ireland/population-estimates-timeseries-1971-to-current-year/index.html (last visited 17 April 2012).
48 We acknowledge that by restricting the analysis to just the resident population we are underestimating the number of trips since we are
excluding tourists.

24
Table 12: Estimated share and annual number of trips in restricted areas, 2012
Street hailing Rank hiring Telephone booking
% of total trips 13.2% 31.3% 55.6%
No. of total trips by purpose49 20,130,421 47,733,497 84,791,771
The monetary value of time50 has been derived using Department for Transport (DfT) guidance. The market value for taxi/PHV passengers in 2002 prices was £44.69,and the market value for commuting was £5.04 and £4.46 for leisure trips. The DfT recommends adjusting the market value by a factor of 2.5 to derive the value of non-working time spent waiting for public transport. The weighted average of £16.90 for 2011 for all three market values is derived using distributional information from DfT for the 2002-2005 period and has also been uprated using the average CPI index values.
The estimated monetary value for waiting times is based on the following formula:
Reduction in waiting time x total number of trips x monetary value per time unit51.
The reduction of time relies on the 2007 study using a conservative estimate of the lowest reduction in passenger waiting time of 0.13 minutes.52 Notwithstanding the conservative approach we have adjusted the values for the number of total trips projected to benefit from reduced waiting time as follows:
50 percent (of total trips) – low estimate
80 percent of total trips – best estimate
Full 100 percent (of total trips) – high estimate
Table 13: Annual Savings through reduced waiting time, 2012
% of total trips in restricted areas Street hailing Rank hiring Total
High estimate (£)
(100 percent)
737,109
1,747,842 2,484,950
Best estimate (£)
(80 percent)
589,687 1,398,273 1,987,960
Low estimate (£)
(50 percent)
368,554 873,921 1,242,475
Total Annual savings = £1,987,960 (best estimate)
NPV over 10 years = £16,533,078
49
Based on DFT proportions for the 2002-2005 period. 50
http://www.dft.gov.uk/webtag/documents/expert/unit3.5.6.php (last visited 17 April 2012) 51
Evaluating the impact of the Taxis market study, A report for the OFT, Europe Economics, 2007, p 107. 52
Evaluating the impact of the Taxis market study, A report for the OFT, Europe Economics, 2007, p 107.

25
Taxi users/ members of public
4. Improved safety standards
Safety is a key justification for the licensing system as a whole yet there are no national minimum standards in respect of issues such as driver and vehicle safety standards. Disability groups have highlighted significant problems in ensuring accessibility and the safety of disabled passengers. Disability groups have told us that most disabled persons have to travel without proper restraints on a daily basis. This is not only unsafe, but uncomfortable and at times undignified. These problems do not only affect wheelchair users: deaf passengers may have difficulty communicating with the driver where the vehicle is fitted with a partition, and blind passengers have concerns about being unable to read taximeters.
Furthermore, standardised vehicle safety requirements and a standard frequency of checks should give rise to a general improvement in consistent safety standards.
Currently, a hire vehicle which operates illegally (for example, a PHV which plies for hire) risks invalidating its insurance. The clearer definition of plying for hire we propose, along with greater clarity on which operations and services require licenses, could significantly reduce the incidence of passengers travelling in effectively uninsured vehicles. In these instances their only means of recourse is to the Motor Insurers Bureau, whose compensation is subject to limits.
Minimum national standards ensure the reputation of the taxi trade as all providing to at least a common standard. This ensures increased user confidence and provides the basis for increased user demand. The average value for the prevention of a road casualty in the case of car and taxi occupants has been estimated at £39,449, in 2011 prices.53 This means that if, as a consequence of the Secretary of State’s and Welsh Ministers’ national safety standards, one accident was avoided (a conservative estimate), there would be an annual saving of £39,449, two accidents = £78,900 (best estimate) and three accidents avoided per year would be £118,347 (high estimate).
Annual savings = £78,900 (best estimate)
NPV over 10 years = £656,180
5. Reduction in the number of assaults of taxi users
Our proposals should have the result of reducing the number of unlicensed vehicles and dirvers, as well as the number of touts. Better enforcement will act as a deterrent, encouraging providers to work within the regulated sector, and will allow greater targeting of rogue traders. Removing confusion around which vehicles should be licensed will also ensure more vehicles which ought to be licensed will be, for example limousines. Thus fewer passengers should be carried by wholly unlicensed drivers, who are likely to be much more dangerous to passengers than safety-checked licensed drivers. Although the move to allow enhanced CRB checks will have gone a significant way towards improving passenger safety where drivers are licensed, we believe that our proposals will continue this trend.
Offences against passengers most commonly include sexual offences, assault and theft. Taking sexual offences as an example, the estimated total cost of £38,359 (in 2011 prices) provides a measure of the economy-wide benefit of preventing sexual crimes. If 111 cases have been reported in London alone, which accounts for about 30 percent of all taxi services, nation-wide the figure must be closer to 400 reported cases.
6. Increased employment in areas that remove entry controls
The removal of entry controls has the further benefit of encouraging market growth as latent demand translates into industry activity as the number of taxi users increases in direct response to improved provision.
The increased supply of taxi services in areas that remove entry controls occurs as a result of increased vehicles being made available to ply for hire, pick-up at ranks or indeed be booked through various means. Increased industry employment occurs as those previously prevented from entering the market are now free to enter. The desire to enter is informed by the potential for work as signalled through the license premium which was previously secured in areas with entry restrictions. Increased taxi availability potentially triggers a customer response from
53
WebTag Unit 3.4.1. The Accidents sub objective, Department for Transport.

26
those who had previously suppressed demand and made use of less satisfactory forms of transportation. Taxi drivers potentially benefit from not only access to a previously restricted market and a share of the monopoly rent which accrued to a small group but also from the increase user demand as taxis become visibly more available and provide an obvious means of alternative transportation.
7. Improved social inclusion
The extent to which the removal of entry controls translates into wider benefits depends on councils’ approach. Increased numbers generally will improve access to people on low income – however the extent to which the benefit extends to those with particular needs, for example with limited mobility, depends on the type of increased supply that becomes available.
If, for example, zoned licensing were to be introduced, wheelchair accessible vehicles and vehicles restricted to working in particular areas would be made increasingly available. Furthermore, the opening up of the private hire market could encourage providers to diversify and expand. Placing the private hire industry on a national footing could promote access to people in more remote areas, as the most practicable way to meet their requirements may be through sub-contracting or using a driver and vehicle licensed in another area.
Court system
8. Improved understanding/certainty of licensing requirements
This review provides an opportunity to better address touting (where drivers or third parties may actively solicit customers) and to improve enforcement powers as a key aspect of better protecting the public. Our proposed scheme, which would limit the discretion of local authorities in standard setting, could greatly reduce this number. The courts would no longer see the systematic challenging on licensing decisions, conditions and policies by individuals, as many of the standards would be set at a national level and subject only to judicial review. We also suggest that disappointed applicants or licence holders should be able to request that the local authority reconsider its decision, which could reduce the number of issues which end up in court. We would also limit appeals from the magistrates’ court.
A clearer, modernised regulatory regime could lead to a significantly reduced number of cases going through the court system. This is particularly true for private hire vehicles, as local authorities would be restricted to applying standards set at a national level, and would not be able to add further requirements. Although licensing authorities would have the power to place additional conditions on taxis and their drivers, these would be more limited. In general, decision-making would be more consistent and give rise to fewer challenges. This would bring significant savings for the courts, licensing authorities and individual applicants.
Council/Enforcement Agencies
9. Savings from not having to do an unmet demand survey
The removal of entry controls means that there will be no need to do an unmet demand survey. This translates into savings for the taxi industry as surveys are generally paid for by the trade and are undertaken on a triennial basis. Surveys cost between £15,000 to £40,000.
We assumer 93 councils will complete a survey at some stage over a three year period – the end of quantity controls delivers an annual savings of between 31 x £15,000 (low estimate) to 31 X£40,000 (high estimate) with the best estimate being 31 x £20,000 – £620,000.
Total Annual savings = £620,000 (best estimate)
NPV over 10 years = £5,156,295
10. Reduced number of enforceable activities
A simpler, more coherent and modern legislative framework would make the role of the enforcement officer more straightforward, and perhaps less resource intensive. This ties in with the projected fall in the number of cases reaching court.

27
11. Reduction in demands on licensing officers’ time
Clearer legislation which is easier to apply will save time. Licensing officers will take decisions within a more transparent and simpler framework, assisted by statutory guidance. Furthermore, our proposed reforms will potentially remove some current license holders from the obligation to hold a license. Whilst it is for the Secretary of State and Welsh Ministers to decide what should or should not be included within the scope of licensing, it is our provisional view that services such as childminding and driver guides should not be licensable in this way. Not only will there be a consequent reduction in the number of licensees and applicants, but licensing officers will not be required to spend as much time considering such applications. Our proposals in relation to limousines and the boundaries between private hire and public service vehicle regulation will have a similar effect.
Our proposals aim to provide licensing and enforcement officers with a more effective, more suitable and more powerful suite of tools to employ against unlicensed providers, and against license holders in breach of regulations. We do not necessarily envisage a reduction in enforcement costs and it is of course for licensing authorities to decide how to allocate funds. However, more efficient working invites financial savings.
Where more effective enforcement allowed licensing officers to spend less time on taxi and private hire work and more time on other aspects of their role, the reduction in expenditure would be passed on to licensees by way of reduced license fees.
Table 14: Summary of annual key savings (benefits)* (£million)
Low estimate Best estimate High estimate On-going Reduced regulatory burden (£) 10.75 25.00 56.00 No unmet demand survey (£) 0.47 0.62 1.24 Reduced waiting time (£) 1.24 1.99 2.48 Improved safety (£) 0.04 0.08 0.12 Total On-going (Years 1 – 10) 12.50 27.69 59.84
* rounded to 2 decimal points.
RISKS, ASSUMPTIONS AND SENSITIVITIES
Assumptions: All the assumptions that underpin specific cost/benefit estimates are indicated alongside the relevant discussion. However there are broader assumptions that inform our approach to the impact assessment and these are as follows:
1. Latent demand responds to improved provision in taxi services and this facilitates the further increase in taxi demand;
2. The groups identified in the consultation paper as potentially excludable from the licensing regimes would all be excluded (eg driver guides, childminders, volunteer drivers);
3. Current arrangements regarding government funding for licensee training remain in place.
Risks: 1. Entry controls are not fully removed and the full benefits are not delivered particularly as it relates to
reduced consumer detriment through reduced waiting time – medium risk; 2. Councils do not pursue a managed approach to licensing. This carries the reputational risk to the taxi
industry if experienced drivers leave and less experienced drivers provide an inferior service – medium risk.
3. The Secretary of State and Welsh Ministers may choose to exclude fewer groups than indicated in assumption 2. This is a low risk.
4. There is a high risk that given the current economic climate funding of licensee training is no longer available – in which case licensee will be required to self-fund.
Sensitivities All cost/benefit estimates that rely on a range have been indicated throughout the impact assessment.

28
Questions
We are considering whether operator licensing should be extended to cover taxi radio circuits. What do you consider to be the benefits of this approach? For example, do you agree that this would allow for more efficient and targeted enforcement, thus both making savings in terms of enforcement resources and deterring unlawful behaviour? Do you think that the additional cost of licensing (approximately £500), which we do not envisage would be significant, will justify the benefits?
We have estimated the average annual increase in the number of taxi/PHV drivers as being 4.0 percent. Do you think that this figure is appropriate?
We have a value for the total household expenditure in England and Wales on taxi journeys (£2.35 billion). We think that business and tourist receipts are likely to add at least a further £2.0 billion so that the true industry revenue value probably lies around £5.0 billion for 2012. Do you agree?
To what extent do you think our proposals will impact on assaults on taxi users? For example, do you agree that a clearer regulatory framework and better enforcement will result in fewer unlicensed vehicles and drivers, as well as less touting?
To what extent do you think that our proposals will impact on assaults on taxi drivers? Do you agree that driver training will give drivers the tools to deal with situations of conflict? Can you identify any other ways in which our proposals will reduce the incidence of attacks on drivers?
Can licensing authorities identify common areas of legal disputes? And the time and resources taken to deal with them? We are interested in in-house costs and the cost of court attendance.

29
SPECIFIC IMPACT TESTS
Statutory equalities We do not think our proposals will have any adverse equality impact on any social group as defined by their race, religion or belief, sexual orientation, gender, age, or disability.
Please see attached equalities impact assessment.
Competition We anticipate that our proposals will enhance competition in the market.
We recognise that market forces already work well in the private hire sector. Consumers are able to exercise choice in relation to quality and price, and the market generally provides a positive level of choice and diversity. The healthy operation of the market is evidenced by the belief amongst groups representing disabled passengers that regulation is not needed to ensure accessibility in the private hire sector, as market forces provide an incentive for firms to make accessible vehicles available.
Our reforms will, however, further increase competition within the private hire industry. Our proposals will remove many of the burdens currently placed on those within the sector; for example, cross-border restrictions on operators would be removed and local authorities would no longer be able to place additional, unnecessary and at time arbitrary conditions on private hire licenses. The increased clarity, stability and flexibility of regulation would encourage innovation and expansion within the private hire market. This is particularly true with regards to the adoption of new technology: existing legislation has restricted the ability of those within the private hire sector to do this, and allowing the industry to embrace these developments would lead to greater expansion and competitiveness.
Competition does not operate as well in relation to the taxi market (rank and hail market, as opposed to pre-booked journeys). For the most part, this is as a result of the way in which the market operates: consumers do not exercise choice in selecting a vehicle or driver, and there is no incentive for taxis to behave in a competitive way. Fares must be regulated in order to protect consumers but there is rarely any incentive to charge anything other than the maximum fare set by the local authority. The elements recognised above are elements which it would be impossible to improve upon without removing consumer protection or altering the way in which the sector operates, both of which would have damaging consequences.
However, our proposal to abolish the power to impose restrictions on the number of taxi licences which may be granted would improve competition in those areas in which license numbers are currently restricted. In such areas, licences attract huge premium values due to their scarcity and those in possession of them have not only a good source of investment, but also a monopoly on the available fares. Deregulation of these areas could improve competition in these areas by giving rise to an increase in vehicles on the road, thus encouraging drivers to alter their fares.
Small firms We do not anticipate that there will be any particular negative effect on small firms beyond minimal familiarisation costs.
As noted above, we believe that our proposals in relation to private hire vehicles will significantly increase the opportunities for these businesses to expand. The majority of private hire operators are micro-businesses of ten or fewer employees, or small and medium enterprises.
Justice system The impact on the justice system would be twofold. On the one hand, we envisage far fewer appeals against licensing decisions (decisions to grant, refuse, suspend or revoke a licence and apply conditions to a licence). The regulatory framework will be far clearer as to what can and cannot be licensed, and what does and does not require a license. Fewer licenses will result in fewer appeals, as will licensing decisions being taken within a far clearer and simpler legal framework. Minimum safety conditions will be set by the Secretary of State or Welsh Ministers following detailed consultation. Furthermore, licensing authorities will no longer be able to impose additional licensing conditions on private hire vehicles.
On the other hand, we envisage our reforms leading to more and better enforcement. Licensing officers will spend less time tackling complex, outdated legislation, and thus could potentially have more time to spend carrying out

30
enforcement tasks. At the same time, we propose improving the powers of licensing officers. The combination of these two changes could be that more criminal cases will go to the magistrates’ court. However, we are consulting on whether fixed penalty notices might be appropriate for some offences, which would reduce any additional burden.
There is the further aspect of assaults and homicides against drivers and sexual offences against taxi users which also impacts on resource usage of the criminal justice system. The cost to the system from assaults and sexual offence crimes is £172,230 and £3,940 (in 2011 prices) respectively. Police activity accounted for about 10 percent of the amount in the case of homicides and prison service accounts for about 80 percent. The proportionate cost of these two aspects in the case of sexual offences was 50 percent and 20 percent respectively. To the extent that the proposed policy is effectively implemented direct savings to the criminal justice system can be claimed.
Other impacts Rural areas Our proposed reforms have a potential impact on rural areas. By emphasising and increasing the cross-border nature of private hire work, stakeholders have informed us that we are likely to increase the number of vehicles flooding city centres. We accept that this may be the case, and that at particular times outlying areas may suffer from a lack of available vehicles.
However, we believe that there will be no negative impact on rural areas. First, it is well recognised that the market functions well in the private hire industry. This would suggest that, where drivers and operators know that work is available in an outlying area, they will work there rather than attempt to get work in an already busy, potentially saturated, city centre. Secondly, we propose allowing licensing authorities to put in place licensing zones. Provision in rural areas could be encouraged through the use of cheaper licensing fees in areas which were susceptible to a lack of supply.
Environment
We recognise that encouraging a greater number of vehicles to take to the road, and perhaps to travel more widely, could have a negative impact on the environment.
Taxis and private hire vehicles account for a very small proportion of UK licensed vehicles. Of the 28.6 million cars registered in the UK in September 201154, only 233,100 of these were licensed taxis and private hire vehicles55. The past ten years or so has seen the small but consistent growth in the number of licensed taxi and private hire vehicles. See table 15 below.
54
See Vehicle Licensing Statistics Q3 2011,at http://www.dft.gov.uk/statistics/releases/vehicle-licensing-statistics-q3-2011. 55
See latest taxi survey at http://assets.dft.gov.uk/statistics/releases/taxi-private-hire-vehicle-statistics-2011/taxi-2011.pdf
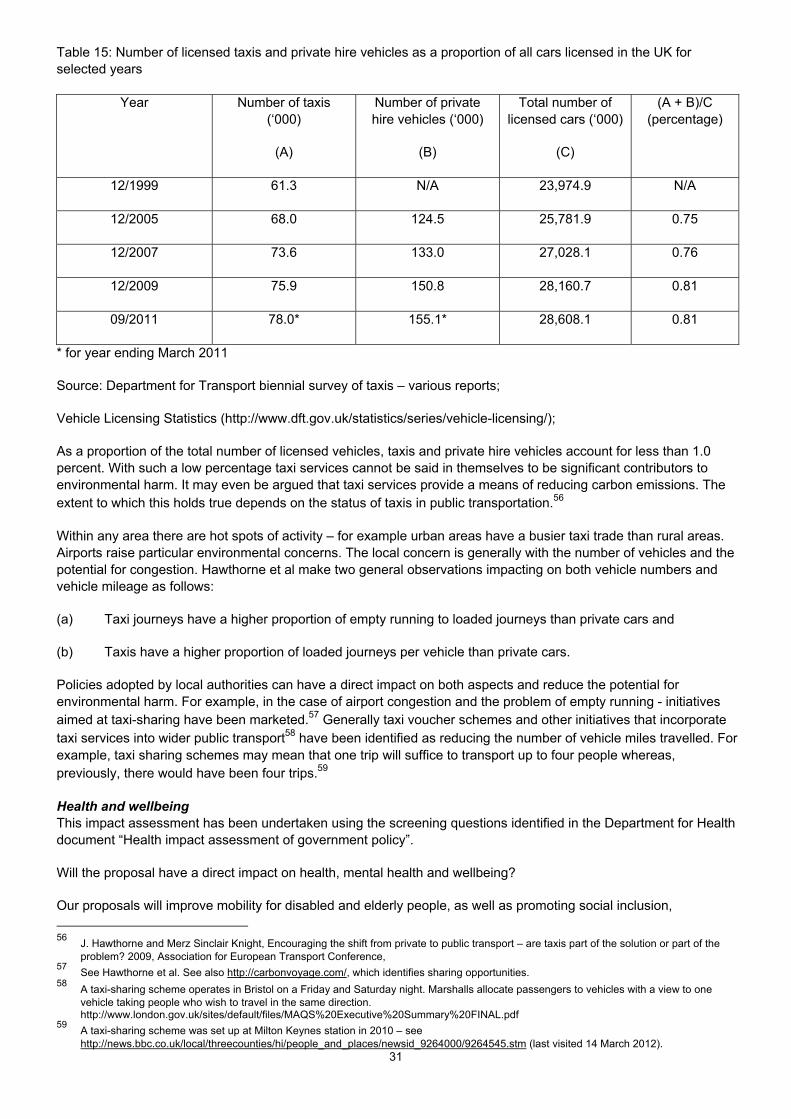
31
Table 15: Number of licensed taxis and private hire vehicles as a proportion of all cars licensed in the UK for selected years
Year Number of taxis (‘000)
(A)
Number of private hire vehicles (‘000)
(B)
Total number of licensed cars (‘000)
(C)
(A + B)/C (percentage)
12/1999 61.3 N/A 23,974.9 N/A
12/2005 68.0 124.5 25,781.9 0.75
12/2007 73.6 133.0 27,028.1 0.76
12/2009 75.9 150.8 28,160.7 0.81
09/2011 78.0* 155.1* 28,608.1 0.81
* for year ending March 2011
Source: Department for Transport biennial survey of taxis – various reports;
Vehicle Licensing Statistics (http://www.dft.gov.uk/statistics/series/vehicle-licensing/);
As a proportion of the total number of licensed vehicles, taxis and private hire vehicles account for less than 1.0 percent. With such a low percentage taxi services cannot be said in themselves to be significant contributors to environmental harm. It may even be argued that taxi services provide a means of reducing carbon emissions. The extent to which this holds true depends on the status of taxis in public transportation.56
Within any area there are hot spots of activity – for example urban areas have a busier taxi trade than rural areas. Airports raise particular environmental concerns. The local concern is generally with the number of vehicles and the potential for congestion. Hawthorne et al make two general observations impacting on both vehicle numbers and vehicle mileage as follows:
(a) Taxi journeys have a higher proportion of empty running to loaded journeys than private cars and
(b) Taxis have a higher proportion of loaded journeys per vehicle than private cars.
Policies adopted by local authorities can have a direct impact on both aspects and reduce the potential for environmental harm. For example, in the case of airport congestion and the problem of empty running - initiatives aimed at taxi-sharing have been marketed.57 Generally taxi voucher schemes and other initiatives that incorporate taxi services into wider public transport58 have been identified as reducing the number of vehicle miles travelled. For example, taxi sharing schemes may mean that one trip will suffice to transport up to four people whereas, previously, there would have been four trips.59
Health and wellbeing This impact assessment has been undertaken using the screening questions identified in the Department for Health document “Health impact assessment of government policy”.
Will the proposal have a direct impact on health, mental health and wellbeing?
Our proposals will improve mobility for disabled and elderly people, as well as promoting social inclusion,
56
J. Hawthorne and Merz Sinclair Knight, Encouraging the shift from private to public transport – are taxis part of the solution or part of the problem? 2009, Association for European Transport Conference,
57 See Hawthorne et al. See also http://carbonvoyage.com/, which identifies sharing opportunities.
58 A taxi-sharing scheme operates in Bristol on a Friday and Saturday night. Marshalls allocate passengers to vehicles with a view to one
vehicle taking people who wish to travel in the same direction. http://www.london.gov.uk/sites/default/files/MAQS%20Executive%20Summary%20FINAL.pdf
59 A taxi-sharing scheme was set up at Milton Keynes station in 2010 – see
http://news.bbc.co.uk/local/threecounties/hi/people_and_places/newsid_9264000/9264545.stm (last visited 14 March 2012).

32
independence and participation. We propose driver training which would specifically cover working with disabled people and persons with reduced mobility. Many disabled passengers complain of a significant degree of danger, discomfort and loss of dignity when travelling by taxi or private hire vehicle. Our proposals on driver training would increase awareness of how disabled passengers prefer to travel, the proper restraint of wheelchairs and how to use specialist equipment.
Standardised conditions of licencse for private hire drivers would lead to a consistent approach to medical requirements across England and Wales. These standards would be based on consultation not only with the industry but also with relevant specialists, ensuring an appropriate and proportionate response was taken to medical conditions, and potentially allowing a greater number of people will health problems to undertake this kind of work.
Will the policy have an impact on social, economic and environmental living conditions that would indirectly affect health?
Our proposals will improve employment prospects in those areas which currently restrict the number of taxi licences available. Whilst there is the possibility that they will increase emissions, it is hoped that market forces will limit the potential for expansion. In doing so it will limit wastage and people leaving the market and becoming unemployed.
Will the proposal affect an individual’s ability to improve their own health and wellbeing?
Our proposals will allow people, in particular disabled and elderly passengers, to travel more freely. This could allow them to improve their own health and wellbeing, for example by allowing them to shop in a wider range of locations or to access previously unreachable services.
Will there be any change in demand for or access to health and social care services?
The opening-up of the private hire market and removal of restrictions on taxi numbers in those areas which currently restrict taxi licences will promote greater access to health and social care services. There will be no direct change in demand for these services.
Will the proposal have an impact on global health?
No.


![Rapid impact assessment - Ministry of Civil Defence and ... · Rapid Impact Assessment i[IS 14/13] ... gives a broad overview of the concept of rapid impact assessment, ... and prioritise](https://img.pdfslide.us/doc/110x75/5b5b2f2a7f8b9a24038e1c9e/rapid-impact-assessment-ministry-of-civil-defence-and-rapid-impact-assessment.jpg)