Embed Size (px)
Citation preview

Insurance Awareness,
Customers’ Needs
and Satisfaction in
Kenya.
A report prepared by Kantar for
Association of Kenya Insurers
Contact:
Report Content
2
01.Background Individual
Segment
02.Institution Segment
03.Agents / Brokers
04.
• Context
• Research Objectives
• Sampling and
Methodology
• Awareness
• Usage
• Needs Understanding
• Satisfaction
• Awareness
• Usage
• Needs Understanding
• Satisfaction
• Awareness
• Usage
• Needs Understanding
• Satisfaction

Background1

Background
• Individuals are exposed to various risks daily. Life insurance and general insurance companies offer a variety of products covering different
types of risks. Not only is there a deficiency of knowledge about these but also most individuals are not aware of the value that insurance, as
an option, could add to their lives. While affordability and the place of insurance in the list of an individual’s priority in this context are important
questions, quite a few are uninsured purely due to lack of knowledge about insurance as a protection tool and details about the types of
insurances that are available.
• In 2016, AKI commissioned an insurance awareness study, and the level of insurance awareness was at 44%. Since then, AKI and other
stakeholders have continuously conducted awareness campaigns to raise insurance knowledge and awareness.
• According to research done in 2017 customer satisfaction index was 67%. The insurance industry has since then eased business processes
through technology adoption to improve customer experience, this has involved use of market insights to improve on business models,
customer engagement and claims settlement experience.
• All stakeholders have the responsibility of creating awareness. It is in this context that the Association of Kenya Insurers (AKI) engaged
Kantar East Africa Ltd. to carry out a survey about awareness levels about insurance both amongst individuals and Institutions.
• In this report, are findings from the survey conducted by Kantar that focused on four main areas: Insurance awareness, Usage, Needs
understanding and Customer satisfaction.
4

Methodology1. Coverage:
• The survey was conducted at both household level and institutions across 8 major towns, covering both rural, peri-urban and urban areas, in
Nairobi, Mombasa, Kisumu, Nakuru, Meru, Nyeri, Machakos and Eldoret.
• The sample was further split into both users [70%] and non – users[30%] for both household and institutions.
• Agents / brokers within the industry were also targeted through qualitative research given their direct contact with customers.
2. Sample design
▪ To generate a representative sample, probability proportion to size sampling (PPS) technique was adopted to select sampling points and
recruit respondents. Sampling points were randomly selected based on the 2019 population census – this method ensures the number of
interviews per sampling point is allocated based on the population size. Densely populated areas had more interviews than areas with
smaller population size.
▪ For each sampling point, households were randomly selected using the random walk method (left hand rule).
▪ At households' level, respondents' eligibility constituted any individual aged 18 years and above. Respondent selection was done using the
kish grid method.
▪ For the institutions, purposive sampling method was applied with target being main decision makers within the respective institutions.
5
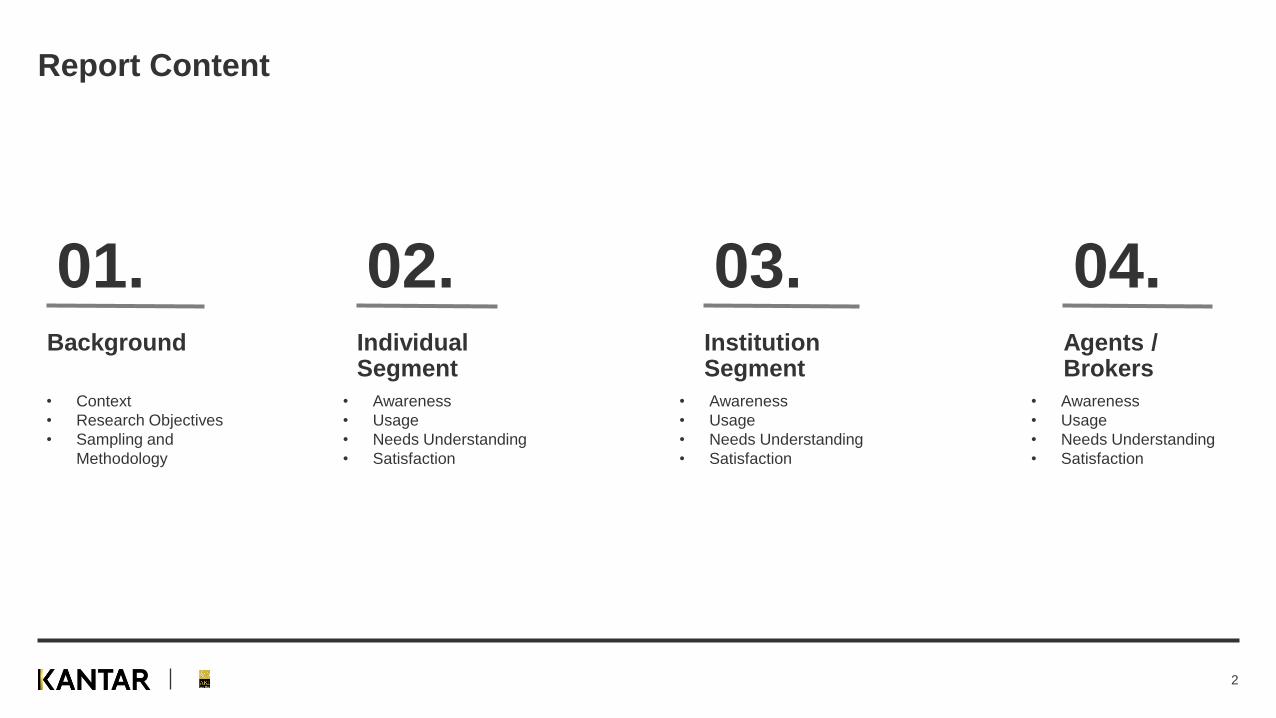
Sample and Methodology
Sample
criteria
Methodology
Sample Size /
Design
▪ Qualitative Phase
▪ Insurance Agents / Brokers
▪ Quantitative Phase
▪ Individual Segment: General population with individuals
aged 18 years and above
▪ Institutions: Key decision makers
▪ Face to face household interviews in urban, peri-urban and
rural areas
▪ Face to face interviews with selected key decision makers
in companies
▪ Total sample n=1200:
▪ Individual - 870
▪ Institution - 330
▪ Interviews conducted randomly in Nairobi, Mombasa,
Kisumu, Nakuru, Eldoret, Kisii, Machakos, Meru and Nyeri
▪ 20-minute questionnaire administered using tablets
6

Research Objectives
Key Research Objective: to track overall insurance awareness and customer satisfaction
levels while gaining into consumer interaction with the available insurance products and
companies Grouped the specific objectives into 4
main themes
Needs Understanding
For each of the different
customer segments• Need states that exist and
reasons for the same
• Do the different insurance
products meet the different
need states experienced by
customers
• The extent to which the
different insurance brands are
meeting the different needs
states experienced by
customers
Usage
For each of the different
customer segments• Trends in the insurance
industry and impact in choice
of products
• Category drivers of different
insurance products
• Category drivers of different
insurance brands for different
insurance products
• Which ones have a higher
uptake than others and
reasons for the same
• Attitudes towards different
• Drivers and Barriers of the
different insurance products
Awareness
For each of the different
customer segments• Level of awareness
• What do they know about
insurance and reasons for the
same
• Which products do they know
the most/which ones the least
and reasons for the same
• Sources of awareness
• Most effective/impactful
sources of awareness
• Drivers and Barriers of the
different sources of
awareness
• Improvement areas for the
different sources of
awareness and reasons for
the same
Customer Satisfaction
For each of the different
customer segments• Customer satisfaction levels for
insurance
• Extent to which digitization has
enhanced customer satisfaction
• Drivers and barriers of customer
satisfaction
• Improvement areas
7

Individual Segment2
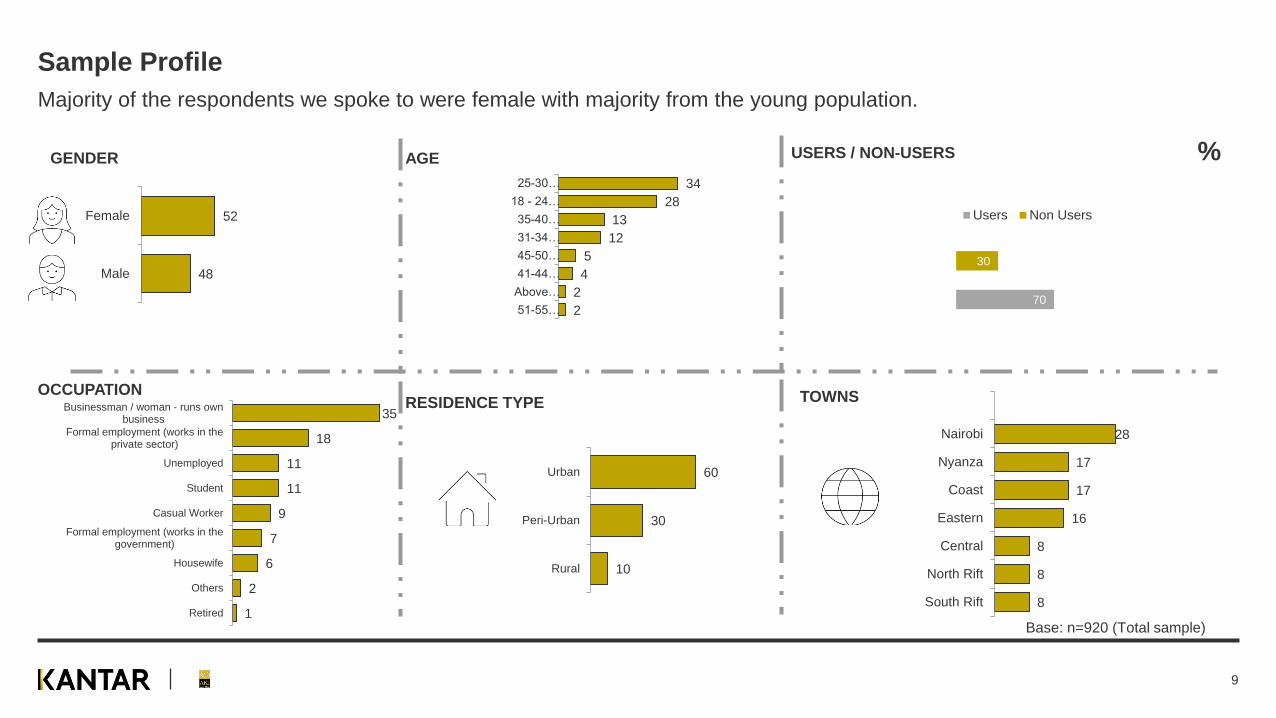
Sample Profile
Majority of the respondents we spoke to were female with majority from the young population.
48
52
Male
Female
70
30
Users Non Users
1
2
6
7
9
11
11
18
35
Retired
Others
Housewife
Formal employment (works in thegovernment)
Casual Worker
Student
Unemployed
Formal employment (works in theprivate sector)
Businessman / woman - runs ownbusiness
2
2
4
5
12
13
28
34
51-55…
Above…
41-44…
45-50…
31-34…
35-40…
18 - 24…
25-30…
GENDER AGE USERS / NON-USERS
OCCUPATION
Base: n=920 (Total sample)
%
10
30
60
Rural
Peri-Urban
Urban
RESIDENCE TYPE
8
8
8
16
17
17
28
South Rift
North Rift
Central
Eastern
Coast
Nyanza
Nairobi
TOWNS
9

Awareness

Insurance awareness
All households visited claimed to be aware of insurance; medical, motor vehicle and personal accident top the list on product
awareness. Word of mouth and TV advertisement cited as the main sources of awareness.
8
19
21
27
31
37
39
42
58
70
76
77
81
91
Golfers
Last Expense Cover
Marine
Domestic Package
Investment/Unit Linked Contracts
Travel
Agriculture (Crop, Livestock)
Loan protection
Pension
Education Policy
Life insurance
Personal accident
Motor (Private, Commercial)
Medical Health
Product awareness
2
3
5
9
10
14
28
29
Newspaper / Magazines
Internet - Online / Social Media
Others
School
Radio
Agent / broker
TV Advertisement
Word of mouth from a friend / familymember
Source of awareness
Qn. Are you aware of or ever heard of below insurance products? Qn. Where did you first know or hear about insurance?
Base: n=920 (Total sample) 11

Level of knowledge of insurance
…and only 7% of the consumers are sufficiently knowledgeable about insurance.
7
41
48
4
A lot of knowledge Moderateknowledge
Little knowledge No knowledge atall
Total
7
48
43
36
35
52
6
A lot of knowledge Moderateknowledge
Little knowledge No knowledge at all
Gender
Male Female
Base: n=920 (Total sample)
Qn. What is your level of insurance knowledge?
12

Level of knowledge by usage
Uninsured customers level of knowledge is lower compared to the insured.
9
52
37
25
28
60
7
A lot of knowledge Moderate knowledge Little knowledge No knowledge at all
Users Non-Users
Base: Users 644 | Non – Users 276 | 13

Level of knowledge of insurance by Age
Consumers in their mid-40s are the most knowledgeable about insurance. Little knowledge is predominant among the youth
and the older consumers above 50 years of age.
3
37
52
76
45 45
46
4447
3
24
47
29
0
11
39
48
2
16
21
58
56
39
56
0
A lot of knowledge Moderate knowledge Little knowledge No knowledge at all
Age
18 - 24 years 25-30 years 31-34 years 35-40 years 41-44 years 45-50 years 51-55 years Above 55 years
Base: n=920 (Total sample) 14

Sources of information
TV is the main source of information across the different demographics. Female seem to over index on the top sources of
information than their male counterparts.
2
4
7
7
11
13
14
16
18
21
29
36
48
74
Fliers / Brochures
Other specify
Colleagues / Peers
Billboards
Print media e.g. Newspapers, magazines
Family members
Friends
Youtube
Radio
TV
Total
2
5
6
6
11
13
14
16
21
22
27
35
47
72
2
4
9
7
15
16
8
20
11
20
30
36
49
76
Fliers / Brochures
Other specify
Colleagues / Peers
Billboards
Family members
Print media
Friends
Youtube
Radio
TV
Gender
Female
Male
Qn. Which are your main sources of news and information?
Base: n=920 (Total sample)15
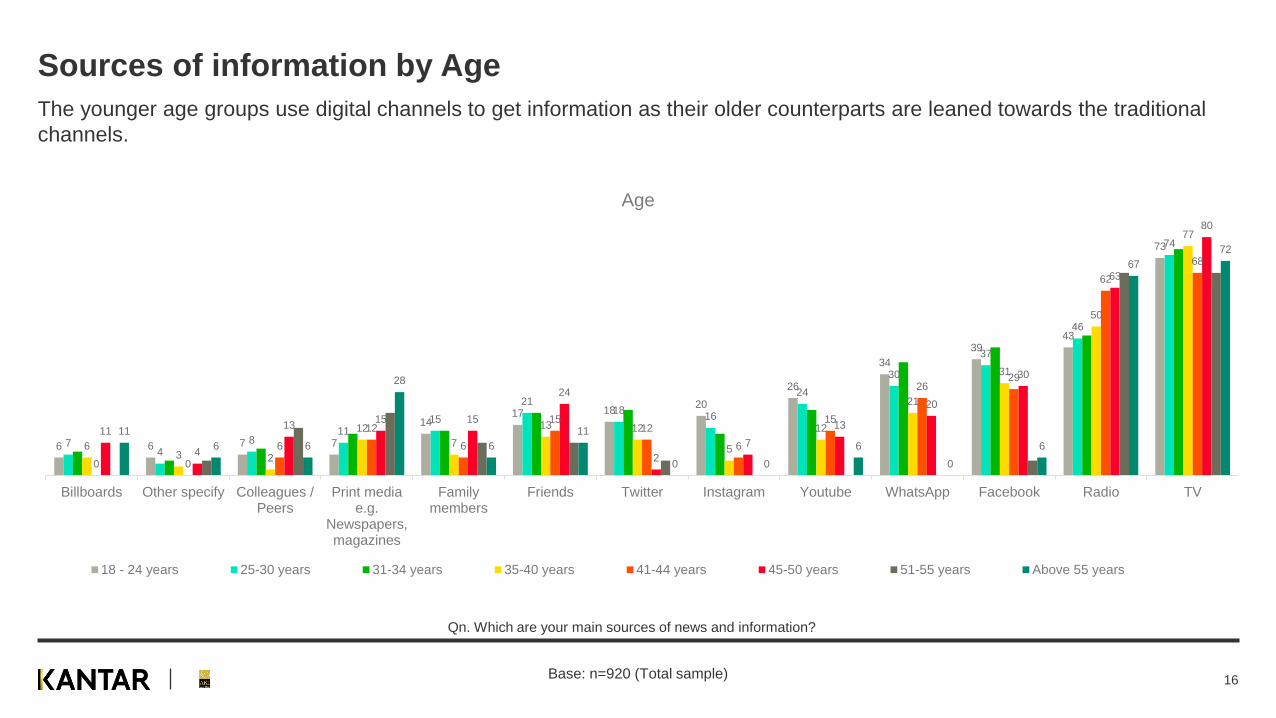
Sources of information by Age
The younger age groups use digital channels to get information as their older counterparts are leaned towards the traditional
channels.
6 6 7 7
1417 18
20
26
34
3943
73
74
811
15
2118
16
24
30
37
46
74
63 2
12
7
13 12
5
12
21
31
50
77
0 0
6
12
6
1512
6
15
2629
62
68
11
4
1315 15
24
2
7
13
20
30
63
80
11
6 6
28
6
11
0 0
6
0
6
67
72
Billboards Other specify Colleagues /Peers
Print mediae.g.
Newspapers,magazines
Familymembers
Friends Twitter Instagram Youtube WhatsApp Facebook Radio TV
Age
18 - 24 years 25-30 years 31-34 years 35-40 years 41-44 years 45-50 years 51-55 years Above 55 years
Qn. Which are your main sources of news and information?
Base: n=920 (Total sample) 16

Section Summary and Recommendations
• The Kenyan consumers claim to be aware of the concept
of insurance but has little knowledge about it.
• Only 7% of the sampled population claim to have
knowledge about insurance. Insurance knowledge is
highest among the 41–44-year-old population and lowest
among the younger [<24] and older[>50] individuals.
• On product awareness, medical, motor vehicle and
personal accident are top in level of awareness.
• Majority first heard or knew about insurance by word of
mouth from people who are close to them – family,
relatives and friends.
• TV, Radio and Facebook are the top main sources of
information. School also has played a key role in driving up
the awareness of insurance.
• Providers need to focus on educating the populace on
different aspects about insurance. Proper education will
increase knowledge on the different aspects of insurance
hence uptake.
• Medical, motor vehicle and personal accident insurance
presents ready opportunities to drive up insurance
knowledge. These are popular among consumers therefore
easier to push forth.
• TV and Radio are apt platforms to use in creating
awareness. Drive education themed programs for proper
understanding of the different insurance products and
services.
• Target majority of the young consumers on digital channels
especially social media.
Summary Recommendations
17

Usage
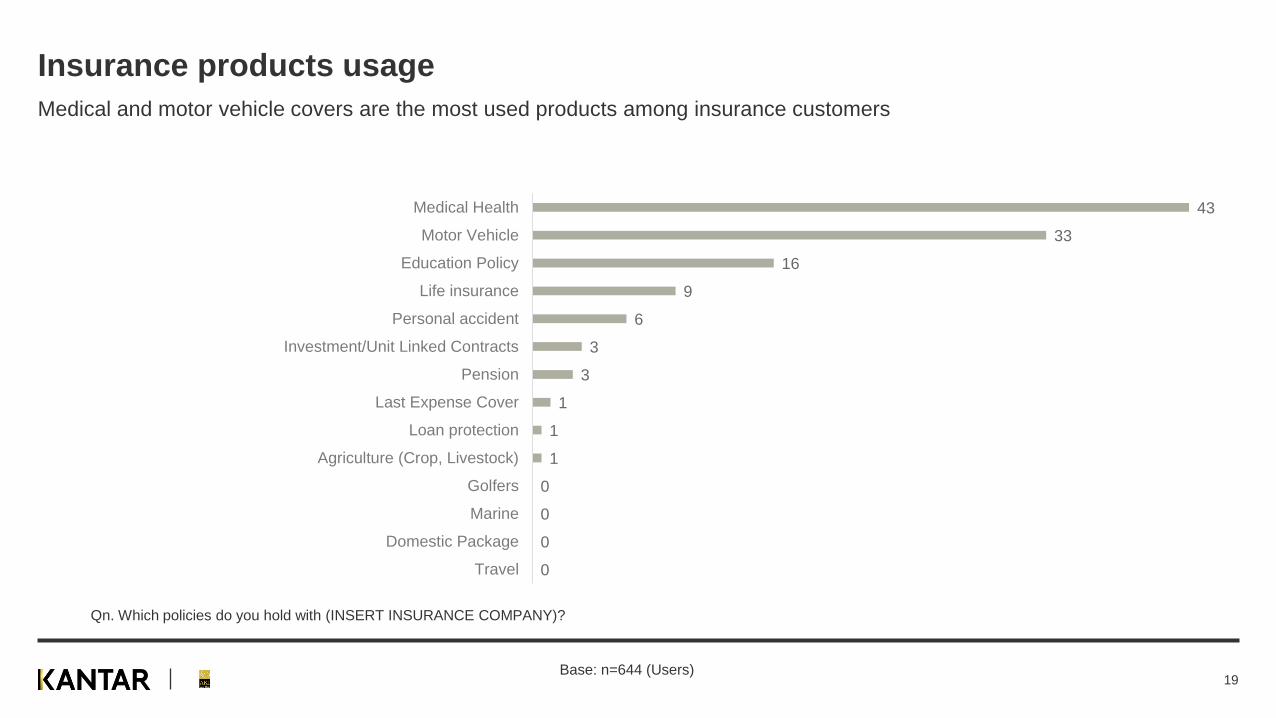
Insurance products usage
Medical and motor vehicle covers are the most used products among insurance customers
0
0
0
0
1
1
1
3
3
6
9
16
33
43
Travel
Domestic Package
Marine
Golfers
Agriculture (Crop, Livestock)
Loan protection
Last Expense Cover
Pension
Investment/Unit Linked Contracts
Personal accident
Life insurance
Education Policy
Motor Vehicle
Medical Health
Qn. Which policies do you hold with (INSERT INSURANCE COMPANY)?
Base: n=644 (Users)19

Non-users of insurance
Reason for Non-usage
2
3
4
4
6
6
7
16
25
35
Got a cover/employee cover
Still in school
Poor handling of claims
None
Not employed
Nothing to insure
Its expensive
Not interested/not useful
No/little knowledge
No funds/Financial constraints
Reason for Lapse
Financial constraints alongside lack of knowledge about insurance products are the biggest setback to insurance uptake.
2
2
3
4
4
5
6
7
9
23
Lack of company integrity
Challenges in compensation
Completed studies
Used another alternative
No longer traveling
Finished paying the loan
Stopped using the car/motor bike
No longer farming
No longer employed
Lack of funds
Qn. You have never taken up any insurance services. Would you please tell me why? Qn. Why did you stop using...?
Base: n=276 (Nonusers)20

Section Summary and Recommendations
• Users of insurance majorly take up medical, motor vehicle
and education policies.
• Households not using any insurance products cite financial
constraints as the biggest barrier followed by lack of
knowledge on insurance products.
• On the other hand, lapsed usage is mainly driven by lack of
finance. With the ever-changing economic situations,
consumers find it difficult to continue contributing towards
insurance.
• Providers should consider segmenting their customers and
present their products in a way that each segment will
realize value based on their financial abilities.
• Medical, Motor vehicle and education policies are the top
products that providers can give precedence as they attract
many users.
Summary Recommendations
21

Needs Understanding
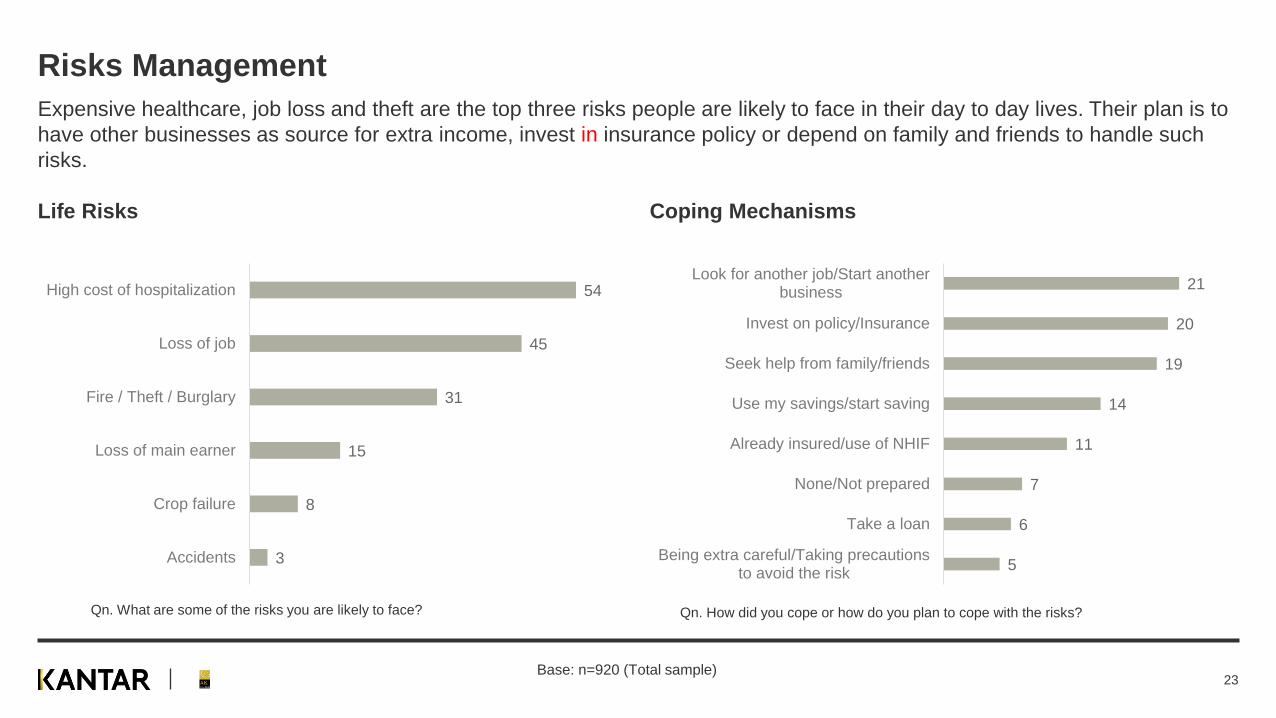
Risks Management
Life Risks
3
8
15
31
45
54
Accidents
Crop failure
Loss of main earner
Fire / Theft / Burglary
Loss of job
High cost of hospitalization
Coping Mechanisms
Expensive healthcare, job loss and theft are the top three risks people are likely to face in their day to day lives. Their plan is to
have other businesses as source for extra income, invest in insurance policy or depend on family and friends to handle such
risks.
5
6
7
11
14
19
20
21
Being extra careful/Taking precautionsto avoid the risk
Take a loan
None/Not prepared
Already insured/use of NHIF
Use my savings/start saving
Seek help from family/friends
Invest on policy/Insurance
Look for another job/Start anotherbusiness
Qn. What are some of the risks you are likely to face? Qn. How did you cope or how do you plan to cope with the risks?
Base: n=920 (Total sample)23

Insurance Relevance
8
9
15
17
18
20
23
24
24
24
28
57
58
Crop failure/Livestock death
Floods
Physical disability
Untimely death
Investment
Retirement
Natural calamity
Theft / Burglary
Economic burden of higher education
Fire
Job Loss
Accidents
Illness
Consumers rate insurance as being relevant because of the financial cover it provides during illnesses, accidents and job loss.
Qn. Why do you think insurance is relevant / not relevant?
Base: n=920 (Total sample)24

Decision Influencers
Decision on taking up insurance products is mainly influenced by people who are trusted like family and friends. In many cases,
male consumers make their own decisions compared to their female counterparts.
4
7
14
30
41
Mainstream media (TV, Radio,Newspapers)
My employer
Agents / Brokers
I made the decision on my own
Family, relatives, friends
Total
4
6
14
33
37
3
8
14
26
48
Mainstream media (TV, Radio,Newspapers)
My employer
Agents / Brokers
I made the decision on my own
Family, relatives, friends
Gender
Female Male
Qn. Who influenced your decision to take up insurance?
Base: n=644 (Users)25

Consideration
Households would consider taking up medical and life insurance policies in future. This is attributed to the reality of high cost of
health care and providing good quality of life for dependents.
8
13
13
14
16
18
23
24
30
35
44
63
Last Expense Cover
Domestic Package
Investment/Unit Linked Contracts
Travel
Agriculture (Crop, Livestock)
Loan protection
Motor (Private, Commercial)
Pension
Personal accident
Education Policy
Life insurance
Medical Health
Qn. Which of the following policies would you consider using in Future?
Base: n=920 (Total sample)26

Section Summary and Recommendations
• Consumers biggest fear are high costs that come with
hospitalization, job loss and loss of property through theft /
burglary.
• Leaning towards family and friends for support, taking up
insurance covers and starting afresh in case of a loss are
some of the coping mechanisms that consumers resort to.
• Insurance is relevant to consumers because it offers them
financial cover on illnesses, accidents and job losses.
• Users of insurance products is mostly influenced by close
family members and friends and sometimes make decisions
on their own.
• Medical, Life insurance and Education policies have the
highest level of consideration in future.
• The industry should consider taking an approach of
making consumers understand value of the insurance
concept, position insurance to appeal more emotionally
and not only as a functional need.
• Cut the different offerings by categories to cater for
everyone in the economic spectrum, so that low-income
earners do not see the burden of subscribing to services
which do not suit their financial muscle.
Summary Recommendations
27

Customer Satisfaction

With 88% of people prioritizing experiences over
possessions, how you make your customers feel
becomes crucial.
I’ve learned that people will forget
what you said, people will forget
what you did, but people will never forget how
you made them feel.
–Maya Angelou
29

When we come together, great things happen.
What is Net Promoter Score (NPS)?
▪ NPS is a measure of the likelihood of a customer to recommend (promote) the company’s services to friends, family or
colleagues.
▪ Measures the relationship between customers and a brand that is predictive of growth – if your customers are out
recommending you to people, you will grow.
▪ What is a good NPS score? – any score above 50 is considered excellent, above 80 is best in class. The goal is to
always have 0 detractors, therefore it is advisable to work on turning detractors into passives if not promoters.
EXTREMELY LIKELYEXTREMELY
UNLIKELY
Would you recommend (INSURANCE PROVIDER) to a friend, relative or colleague?
Detractors
Promoters - Detractors Net Promoter Score (NPS) =
5 4 3 2 16 0
Promoters
10 9
Passives
8 7
30

NPS and Reasons for NPS
8
8
8
8
8
8
8
8
8
8
15
15
31
31
Fair prices
Its the best
Good packages
Accessibility
Its reliable
Stable company
Fast services/Efficient
Friendly staff
Good communication
Meets all my needs
Wide coverage
Good customer care
Quality services/High standard
Good reputation
Average NPS rating on insurance for individual customers is at 29 with top reasons given for the ratings being ‘Quality
services’, Transparency', 'Coverage’ and ‘Good customer care.’
Promoters Passives Detractors
49 31 20
NPS 29 Qn. Based on your experience, how likely are you to recommend INSURANCE COMPANY to friends, family or colleague? Use a 10-point scale where 0= Definitely would not
recommend and 10=Definitely would recommend, remember you can use any number between 0-10
Base: n=644 (Users)31

Customer Satisfaction Index
Customer Satisfaction Index is at 81 . This is the average score from the 10-point satisfaction sale.
Qn. Overall, how satisfied are you with INSURANCE COMPANY as your insurance company? Please use a scale of 1-10 where 1= Not at all
satisfied and 10= Extremely satisfied. Remember you can use any number between 1-10
Base: n=644 (Users)
81
CSI1
1
1
1
7
8
13
16
23
35
1 = Not at all satisfied
2
3
4
5
6
7
9
8
10 = Extremely satisfied
Satisfaction
32

NPS Impact Analysis
NPS Impact Analysis identifies the gain and loss potential of performance changes on attributes
Gain potential in customer relationship
Improved performance would strengthen the relationship
Threat potential to customer relationship
Reduced performance would weaken the relationship
Th
reat
to r
ela
tio
nsh
ip
Gain in relationship
NPS impact analysis helps to deliver the optimal customer
experience based on the understanding that investment
decisions must take positive and negative implications into
account. Therefore it looks at the following two dimensions:
33

NPS Impact Analysis
These four areas help to prioritize actions and deliver excellence where it matters most.
Improvements in this area are
most critical for a company as
improved performance could
contribute strongly to improving
relationship strength – whereas
weaker performance would threaten
the relationship.
This area includes aspects
which have the potential to
increase relationship strength if
performance is improved – but
reduced performance is unlikely to
have a strong negative effect.
Attributes in the
consider area do not
have a strong impact on the
overall customer relationship.
Neither improving nor worsening
performance is likely to have
much impact on the TRI*M Index.
1
Th
reat
to r
ela
tio
nsh
ip
Gain in relationship
2
Reduced performance
could potentially have a
negative effect on relationship
strength. It is therefore vital that
the current performance level
should be maintained.
3
4
34

Impact Analysis
For improvement in relationship and NPS, providers need to focus on improving on timely and effective complain resolution as
well as providing adequate information on claim procedures.
Thre
at to
rela
tionship
Gain in relationship
Far below average Below average Average Above average Far above average
Friendliness, Politeness And Helpfulness Of StaffA01
A01
Staff’s Ability To Understand Your Needs And Offer Useful AdviceA02
A02
Timely And Effective Complaint ResolutionA03
A03
Accuracy And Completeness Of Information Provided On EnquiriesA04
A04
Ease Of Understanding The Information ProvidedA05A05
Notification Of UpdatesA06
A06
Adequate And Reliable Information On Various PoliciesA07
A07
Adequate Information On Claim ProceduresA08
A08
Technology / DigitizationA09
A09
Amount ContributedA10
A10
Mode Of PaymentA11
A11
Affordable ProductsA12
A12
Base: n=644 (Users)35

Product Satisfaction
High satisfaction levels on Pension followed by Education policy.
48
4340
60
51
71
35
Top 2 Box
Medical Health Motor (Private, Commercial...) Life Insurance Education Policy
Personal Accident Pension Investment/Unit Linked Contracts
Base: n=644 (Users)36

Digitization
1
3
17
48
31
Completelydisagree
Disgaree
Fairly agree
Agree
Completelyagree
1
0
1
0
7
8
9
17
25
32
Not all satisfied
2
3
4
5
6
7
8
9
Extremely satisfied
Digitization in the industry has made access to insurance services efficient and convenience and customers give good ratings
to their providers on satisfaction.
Qn. To what extent do you agree or disagree with the statement ' digitization has
improved efficiency and convenience in accessing insurance products and services'
Qn. How would you rate your satisfaction with (INSURANCE COMPANY) digitization of
their processes? Please use a scale of 1 - 10, where 1 is Not at all satisfied and 10 is
Extremely satisfied. You may give me any number between 1 and 10 .
Base: n=644 (Users)37
Section Summary and Recommendations
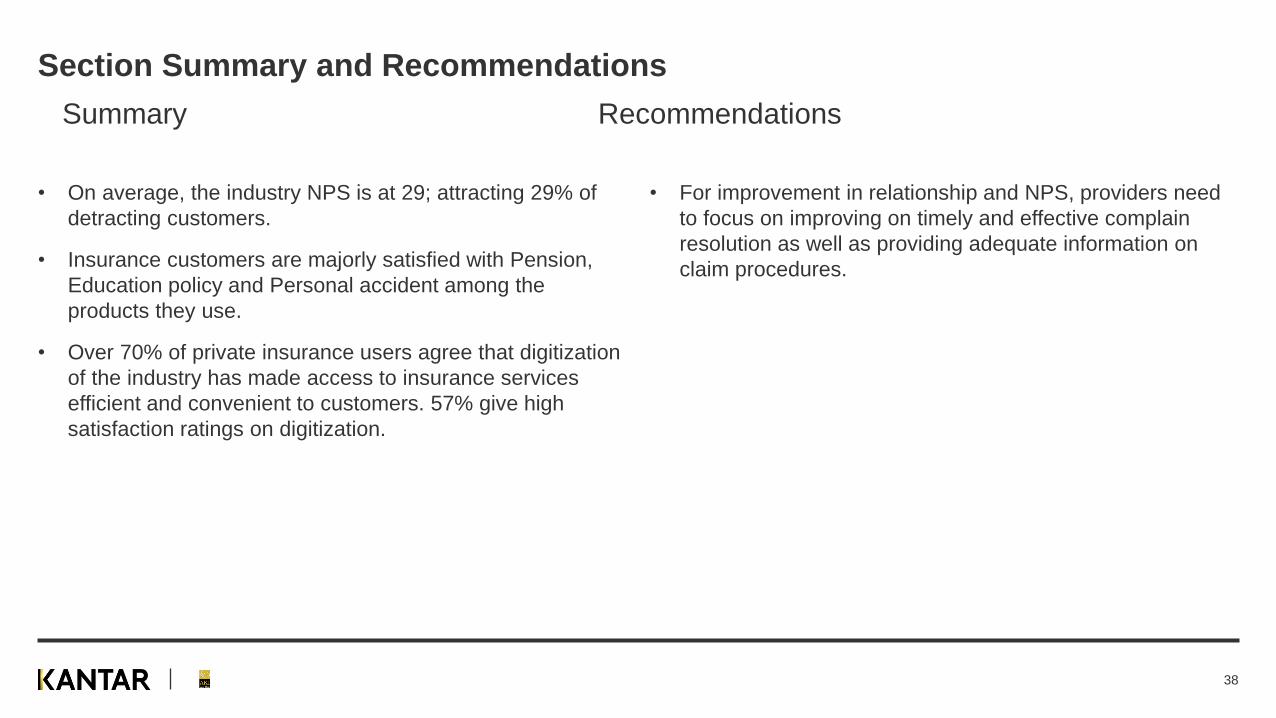
• On average, the industry NPS is at 29; attracting 29% of
detracting customers.
• Insurance customers are majorly satisfied with Pension,
Education policy and Personal accident among the
products they use.
• Over 70% of private insurance users agree that digitization
of the industry has made access to insurance services
efficient and convenient to customers. 57% give high
satisfaction ratings on digitization.
• For improvement in relationship and NPS, providers need
to focus on improving on timely and effective complain
resolution as well as providing adequate information on
claim procedures.
Summary Recommendations
38

Institutions Segment3

Who did we speak to?
70
30
Users Non Users
Users / No users
3
3
5
8
11
5
2
7
4
25
11
2
2
1
Agriculture
Manufacturing
Transport &…
Information &…
Education
Health Care
Real Estate
Construction
Financial Services
Retail & Trade
Hotels
Energy & Petroleum
Logistics
Media
Industry
44
28
19
10
MicroEnterprises
SmallEnterprises
MediumEnterprises
LargeEnterprises
Segment
40

Who did we speak to?
Region Sample
Nairobi 80
Kisumu 50
Nakuru 30
Mombasa 50
Eldoret 30
Machakos 30
Nyeri 30
Meru 30
TOTAL 330
Main decision makers
• Managing Directors
• Office Administrators
• Head of finance
• Human Resource Managers
Base: n=357 (Total sample)41

Awareness

Insurance products awareness
High awareness for Motor, Fire, Burglary and Theft and Medical cover whereas low awareness is seen on Group last expense,
Engineering and Marine.
67
79
4138
61
8983
34
83
48
3136
4350
6569
54
31
58
70
3732
51
8478
27
78
43
2632
36
46
5660
50
25
74
86
4447
66
9289
39
88
55
37 36
5357
7077
60
37
73
90
46
31
75
9388
37
88
49
34
43 45
54
7572
54
34
Total Micro Enterprises Small Enterprises Medium Enterprises Large Entreprises
Base: n=357 (Total sample)
Qn. Are you aware of or ever heard of the following insurance policies?
43

Sources of awareness
2
4
4
12
21
25
30
Newspaper / Magazines
Radio
Internet - Online / Social Media
Other
Agent / broker
Word of mouth from a friend / family member
TV Advertisement
TV advertisement, Word of mouth and agents are the main sources of awareness for insurance products.
Base: n=357 (Total sample)
Qn. Where did you first hear or know about insurance?
44

Usage

Product Usage
On product usage, institutions mostly use policies covering Motor, Fire and Burglary and theft.
1
2
3
3
5
7
9
14
18
20
23
23
Travel
Public/Product Liability
Fidelity guarantee
Loan protection
Group Life insurance
Money
Group personal accident
Workmen Injury Benefit Act (WIBA)/ Employer liability
Group Medical cover
Burglary & theft
Fire
Motor (Private, Commercial)
Base: n=250 (Users)46

Non-users of insurance
Reason for Non-usage
3
3
3
3
8
24
27
35
We've not got any that is favoring our kind of business
Don't foresee any risk
Fraud/don't pay the claims
Its a waste of money
Its expensive
The business is still new/small
Lack of knowledge
Due to financial difficulties
Financial constraints alongside lack of awareness contributing to institutions not taking up insurance services.
Qn. You have never taken up any insurance services. Would you please tell me why?
Base: n=107 (Nonusers)47

Section Summary and Recommendations
• Motor vehicle, Fire and Burglary and theft have the highest
usage levels among institutions as well as Group medical
cover which comes in 4th place.
• The drivers to non usage are mainly financial related –
either the business is small / new and not able to sustain
insurance or change in economic times that has affected
businesses financial reserves. This is also coupled with
lack of knowledge on the different insurance product offers.
• Packages tailored to different institutions depending on the
sizes would encourage insurance uptake. With affordability,
clients see value in what they are paying for.
Summary Recommendations
48

Needs Understanding

Risks and Coping Mechanisms
44
69
48
61
8
40
73
48
3 1
7
44
67
55
10
2
12
45
64
34
7
1
9
6265
53
6
Propertydamage
Theft /Burglary
Fire DataBreaches
Crop failure Other
Total Micro Enterprises Small Enterprises
Medium Enterprises Large Entreprises
Institutions are likely to be faced with property damage, Theft and Fire and have already taken up insurance covers or are
planning to for security.
2
2
4
4
6
7
7
9
10
10
24
28
Seek help from family/friends
Invest in technology
Borrow a loan
Proper planning/taking precaution
Use of savings
Installation CCTV cameras
Start over again
Bought fire extinguisher/call fire station
Report to the police
Provide security measures
Take an insurance cover
Already have an insurance cover
Base: n=357 (Total sample)
Qn. What are some of the risks your organization is likely to face / have faced? Qn. How did you cope or how do you plan to cope with these risks?
50

Future Consideration
Medical, Fire and Burglary make up the top policies that institutions would consider taking up in future..
15
29
13
4
18
3639
2
12
64
1
74
17
1215
5
12
26
15
3
15
39
44
1
11
4 4
0
5 5
13
8
16
2
17
32
14
5
19
36
41
1
16
11
52
12
4
19
15 14
7
18
36
74
24
3436
4
10
63
0
4 4
21
12 1310
Total Micro Enterprises Small Enterprises Medium Enterprises Large Entreprises
Base: n=357 (Total sample)
Qn. Which of the following insurance services does your organization consider using in future?
51

Section Summary and Recommendations
• Given the nature of this segment, they are likely to incur
loses through property damage, theft and Fire.
• Majority of them take insurance covers or plan to take
insurance covers to protect them against these risks. They
also resort to other measures like enhancing security.
• For future consideration, Group medical cover, Fire and
Burglary are the top three with biggest potential to be
considered in future.
• Institutions deem insurance to be relevant because of the
security it offers against occurrences like accidents,
burglary and fire.
• Potential insurance market exists for the small companies
as they have substantial requirements, and a proper
package would make insurance a viable option for them.
Summary Recommendations
52

Customer Satisfaction

Net Promoter Score
[NPS]
54

NPS and Reasons for NPS
Average NPS rating given for the providers used is at 33.
Promoters Passives Detractors
47 40 14
NPS 33
Base: n=250 (Users)
19
34
4340
Micro Enterprises Small Enterprises MediumEnterprises
Large Entreprises
NPS By segment
55

Customer Satisfaction Index
Customer Satisfaction Index for the institution segment was at 82. This is the average score from the 10-point satisfaction sale.
Qn. Overall, how satisfied are you with INSURANCE COMPANY as your insurance company? Please use a scale of 1-10 where 1= Not at all
satisfied and 10= Extremely satisfied. Remember you can use any number between 1-10
Base: n=250 (Users)
82
CSI23%
26%
26%
14%
7%
1%
1%
1%
1%
0%
Extremely satisfied
9
8
7
6
5
4
3
2
Not at all satisfied
56

Impact Analysis
To improve overall NPS, providers should focus providing timely and effective complain resolutions, adequate information on
claim procedures and consider revising the premiums charged.
Thre
at to
rela
tionship
Gain in relationship
Far below average Below average Average Above average Far above average
Friendliness, Politeness And Helpfulness Of StaffA01A01
Staff’s Ability To Understand Your Needs And Offer Useful AdviceA02
A02
Timely And Effective Complaint ResolutionA03A03
Accuracy And Completeness Of Information Provided On EnquiriesA04
A04Ease Of Understanding The Information ProvidedA05A05
Notification Of UpdatesA06
A06
Adequate And Reliable Information On Various PoliciesA07
A07
Adequate Information On Claim ProceduresA08
A08
Technology / DigitizationA09
A09
Amount ContributedA10
A10
Mode Of PaymentA11
A11
Affordable ProductsA12
A12
Base: n=250 (Users)57

Product Satisfaction
Money, Group personal accident and Motor policies top on satisfaction levels.
7369
6158
62
7780
61
Top 2 Box
Motor (Private, Commercial) Fire
Burglary & Theft Group Medical Cover
Workmen Injury Benefit Act (WIBA)/ Employer Liability Group Personal Accident
Money Group Life Insurance
Base: n=250 (Users)58

Improvement areas
Providers should improve on the time taken before compensation is given as well as prompt communication and updates
regarding any changes in services.
1111
222
33
44
555
677
111616
18
Downtime of systemsIncrease amount to cover
Annual discounts when risks don't occurOffer enough grace period
Customer care servicesAvailability
Competent staffAccessibility
Service deliveryClaims procedure
Discounts on premiumsEfficient services
Advertising themselves/creating awarenessTransparency
New products and servicesTechnology/digitalization's of services
Fast servicesReduce on payment
NothingNotification updates/communication
Compensation time
Base: n=250 (Users)59
Section Summary and Recommendations
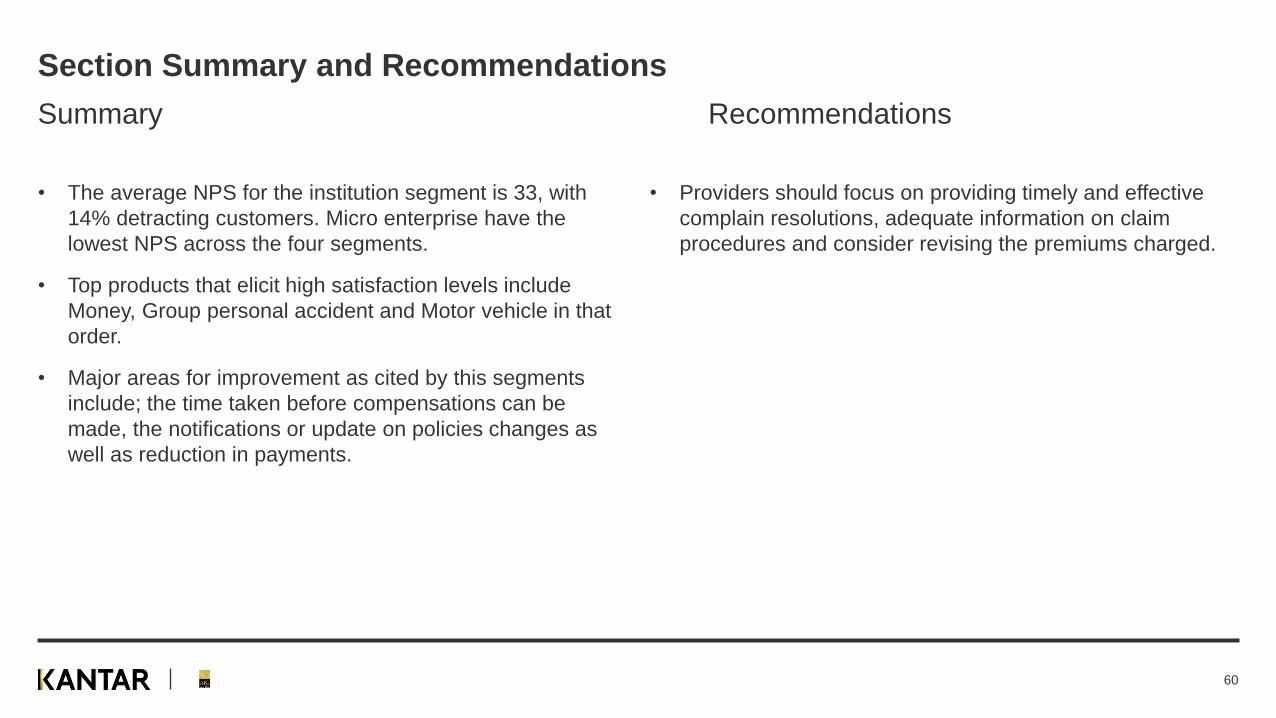
• The average NPS for the institution segment is 33, with
14% detracting customers. Micro enterprise have the
lowest NPS across the four segments.
• Top products that elicit high satisfaction levels include
Money, Group personal accident and Motor vehicle in that
order.
• Major areas for improvement as cited by this segments
include; the time taken before compensations can be
made, the notifications or update on policies changes as
well as reduction in payments.
• Providers should focus on providing timely and effective
complain resolutions, adequate information on claim
procedures and consider revising the premiums charged.
Summary Recommendations
60

Agents and Brokers
Segment
4

INSURANCE SEGMENT
X2General Insurance (Non-Life Insurance
Products)
BIG COMPANY
Our qualitative sample of 10 IDIs were carried out with Insurance Brokers /
Agents
MEDIUM
COMPANY
SMALL
COMPANY
X2 Life Insurance Products
X1General Insurance (Non-Life Insurance
Products)
X2 Life Insurance Products
X2General Insurance (Non-Life Insurance
Products)
X1 Life Insurance Products
62

Awareness

Defining Insurance Customers (1/2)
Individual Customers
• Referral is the largest source of
customers
• They have an insurance need -
first time car owners; Young
families with kids
• Stable income / Earnings that
can sustain a policy
• Identify potentials by reviewing
their company, titles, assets
owned etc.
Businesses
• Target businesses that are
involved in tender processes as
well as various sectors
• Well performing industries – like
pharma, retail / distribution /
logistics, Telco
• Process is relatively shorter,
taking up to 3 months for uptake
and involves less decision
makers
Corporates
• Target sectors with job security,
relatively stable / consistent –
civil servants, parastatals, large
NGOs
• Specifically target professional
practices and sectors where
insurance is mandatory
• i.e., WIBA, Professional
Indemnity etc.
• Process is longer, up to 6
months for uptake and
involves more stakeholders
Customers are broadly defined by individual, business and corporates with brokers and
agents targeting them largely through referrals and cold canvasing
64

Defining Insurance Customers (2/2)
The mass market customer is recognized to have potential; however, agents and brokers
feel it has low returns considering the investment required
Willingness for uptake of only a few products, i.e., personal accident, etc.
Uphill task to educate the customer and convince uptake
They deal in low premiums, low commission and require high effort
Insurance companies do not offer any added incentive for onboarding this customer segment
65
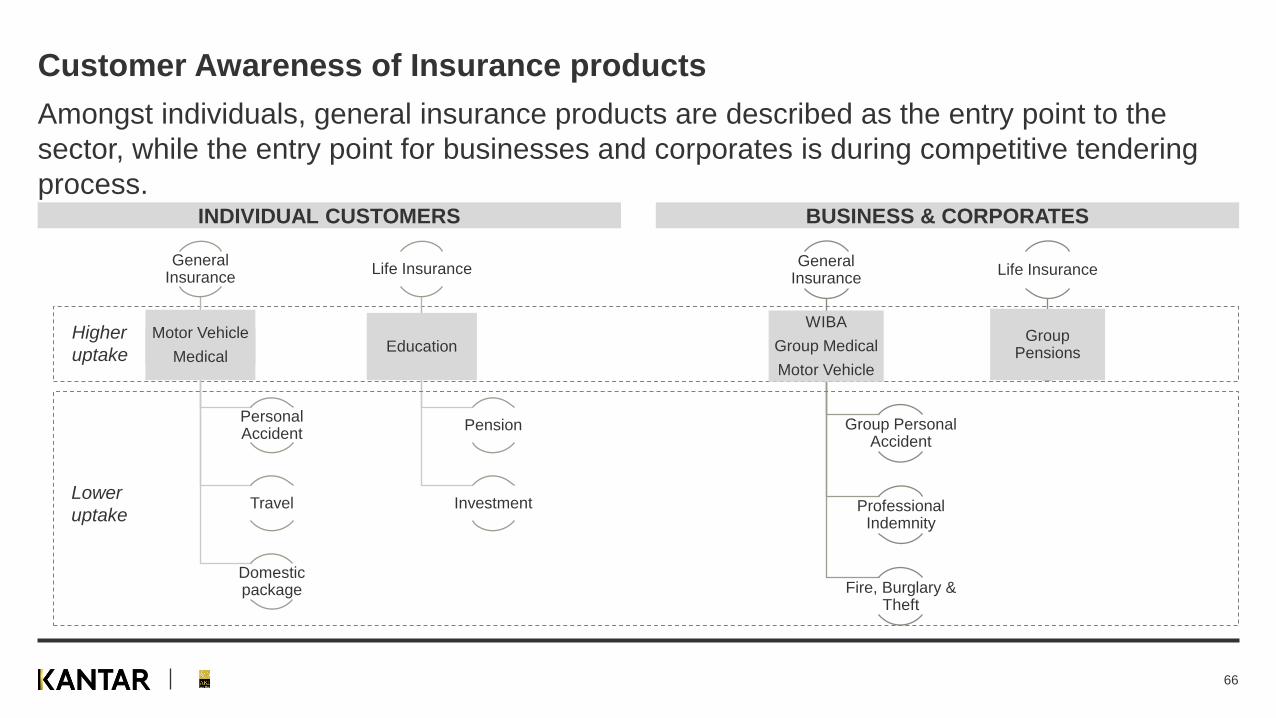
Customer Awareness of Insurance products
Amongst individuals, general insurance products are described as the entry point to the
sector, while the entry point for businesses and corporates is during competitive tendering
process.INDIVIDUAL CUSTOMERS BUSINESS & CORPORATES
General Insurance
WIBA
Group Medical
Motor Vehicle
Group Personal Accident
Professional Indemnity
Fire, Burglary & Theft
Life Insurance
Group Pensions
General Insurance
Motor Vehicle
Medical
Personal Accident
Travel
Domestic package
Life Insurance
Education
Pension
Investment
Higher
uptake
Lower
uptake
66
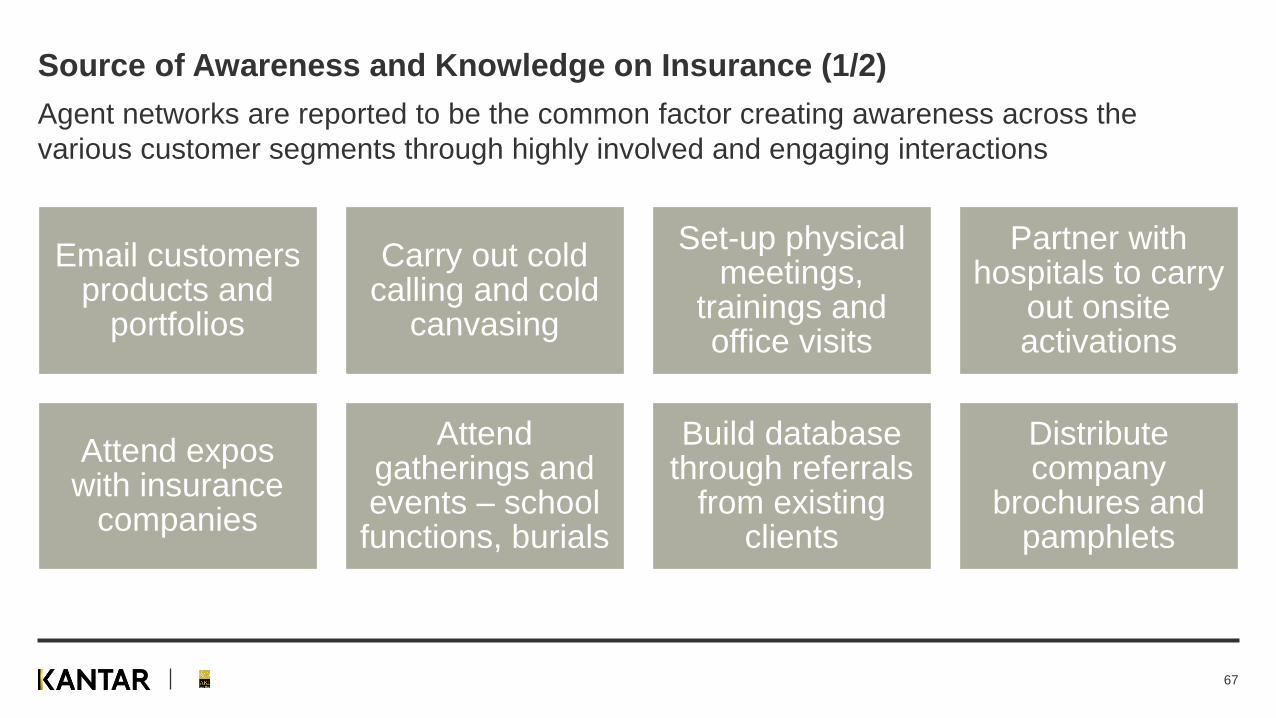
Source of Awareness and Knowledge on Insurance (1/2)
Agent networks are reported to be the common factor creating awareness across the
various customer segments through highly involved and engaging interactions
Email customers products and
portfolios
Carry out cold calling and cold
canvasing
Set-up physical meetings,
trainings and office visits
Partner with hospitals to carry
out onsite activations
Attend expos with insurance
companies
Attend gatherings and events – school
functions, burials
Build database through referrals
from existing clients
Distribute company
brochures and pamphlets
67

Source of Awareness and Knowledge on Insurance (2/2)
Notably, IRA is mentioned as a key driver of industry awareness
creating knowledge as well as accountability towards customers
Actively educate customers through advertisements
Organize both customer forums and workshops
They have an online portal for complaints
IRA has forced transparency, ensuring customers are taken through the entire product prior to purchase
68

Usage

Trends in insurance
The insurance sector is undergoing a series of changes with a push towards customer
centricity that will influence customization of products and processes
Covid-19 pandemic has shifted the demand for insurance products
• Increased uptake of individual medical covers
• Reduced spending from Business and Corporates who have downsized / closed shop
Increased competition and requirement for
transparency and accountability
• Flexible product offering – with reduced premiums and
partial payment options
Uptake of digital interventions within the uptake and
claims processes
• Lower employment rate in insurance companies and
less (human) customer support
Education sector has evolved including home-
schooling and cheaper online courses• Reduced demand for education policies
Mergers & acquisitions of insurance companies;
Selling of shares
• Continuity of brands, improved quality of service and
wider spread; Enhanced competition amongst players
70

Drivers and Barriers for Insurance products
General Insurance Products
✓ It has mandatory insurance products
✓ It is easy to grow / penetrate with more willing customer base
✓ One client gives access to others and expands their database
• 1 successful customer sale = 5 prospects / referrals
• 1 successful customer sale = 1 more uptake of another policy
✓ It is easier to profile customers, I.e., an individual customer can
be profiled by type of car, residence, work title
✓ Experience benefits of commission / payment immediately
× High churning of customers from one company to another
× Must be aggressive and timely in following up for renewals
× It has a lot of service requirements, i.e., running claims, dealing
with several stakeholders
• A Motor Vehicle Claim requires: Customer handling, liaising
with the garage & insurance company, following-up through
customer support
Life insurance products
✓ It has better commissions, paid out over a long period of time
✓ It is easier to manage and requires a lower level of engagement upon
uptake
✓There is less churning / movements amongst insurance companies
✓Claims process is seamless and timely; Has minimal requirements
× There is a lower awareness
× Long-term requirement is taxing for customers and offers low
motivation
× Strong perception that it is a scam, and they will not get paid
× Risk of lapsing and losing contributions – as caused by low job
security / job loss
× Other options / alternatives such as saccos and bank savings
Agents and brokers opt for their preferred product depending on the returns, short vs. long
term timelines and level of involvement required upon uptake
71

Drivers and Barriers for insurance companies
Their choice of insurance companies is driven by the company's reputation and the
competitiveness of their product portfolio
• Competitive premium rates
• Good reputation, esp. on claims payment
• Existing in the market
• Diverse portfolio offering
• Provide quotes in good time
• Poor customer support > unavailable / hard to reach
• Poor reputation on claims payment
• Rigid pricing / premiums – apply blanket fee
• Offers limited number of products
72

Perceptions of Insurance Companies
Pioneers and leaders in
insurance or a specific type
of insurance
Had mentors / support while
starting out in the industry
Offer competitive product
portfolio
Provides a conducive
working environment –
amenities,
Continuous trainings on
product offerings
Assigned to Account
Managers > responsive
Access to sales materials
and merchandize –
brochures, forms,
notebooks, pens etc.
Received awards
Pay claims on time
Well managed support
channels
Efficient and seamless
processes
Agents and brokers perceive favorably companies who launched their careers, continuously
engage them in trainings and perform well in customer service
Launch
& Build
Careers
Highly
Engaged
Customer
& Agent
Support
73

Needs Understanding

Need states for customer segments
Individual Customers
Offers security and a
safety net
Form of savings
Businesses
Requirement for their
operations
Those in tendering > it is
a pre-qualification to
winning bids
Corporates
Part of benefit package
for employees
Fulfilling mandatory
obligations
Securing them against
liabilities
Agents and brokers perceive insurance need states differently across customer segments
75

Satisfaction

Digitization in Insurance
Covid-19 pandemic has influenced uptake of digitization with the
onboarding and claims process being done seamlessly through
online channels
• Insurance providers are taking up technology
• Mtiba
• Use of USSD to access medical services
• Uptake and renewal is accessible on websites and phone apps
• Policy documents are sent in soft copy
• Preference for uptake on digital as it has a faster selling process
• Motor Vehicle certificates are sent digitally
• Online meetings with clients
• Easy and fast approvals on claims
77

Thank you
Vincent Otieno
254715 278 708
Rael Wangia
254723712263
78
Association of Kenya Insurers
254709640000