Embed Size (px)
Citation preview

Regional Development Plan
City Road City of London (excluding 33kV)
Regional Development Plan Template v1.1 Page 1 of 38
Title: City Road City of London (excluding 33kV)
LPN Regional Development Plan
Version: 2.2
Date: March 2014

Regional Development Plan
City Road City of London (excluding 33kV)
All of the cost numbers displayed in this document are before the application of on-going efficiencies and real price effects.
Regional Development Plan Page 2 of 38
Document History
Version Date Revision Class
Originator Section Update Details
1.0 21/06/2013 Barry Walker
First Submission
2.0 06/03/2014 Minor Panagiotis Xenos
Contents Updated table of contents
2.0 06/03/2014 Minor Panagiotis Xenos
1 Executive Summary
Revised and edited the text/content/wording
2.0 06/03/2014 Major Panagiotis Xenos
1 Executive Summary
Updated NAMP summary table
2.0 06/03/2014 Major Panagiotis Xenos
1 Executive Summary
Updated LI figure
2.0 06/03/2014 Major Panagiotis Xenos
1 Executive Summary
Added HI figures
2.0 06/03/2014 Minor Panagiotis Xenos
2 Network Configuration
Revised and edited the text/content/wording
2.0 06/03/2014 Major Panagiotis Xenos
2.2 Embedded Generation
Updated text and embedded generation table
2.0 06/03/2014 Major Panagiotis Xenos
2.3 Projects in Progress
Updated list and description of ongoing schemes and NAMP costs summary table
2.0 06/03/2014 Minor Panagiotis Xenos
3 Network Development Considerations
Revised and edited the text/content/wording
2.0 06/03/2014 Major Panagiotis Xenos
3.2 HI Profile – Without Intervention
Updated HI tables pre-intervention; added HI table for FFC’s and comments
2.0 06/03/2014 Major Panagiotis Xenos
3.3 Security of Supply Analysis
Updated P2/6 assessment and LI table pre-intervention
2.0 06/03/2014 Minor Panagiotis Xenos
4 Recommended Strategy
Revised and edited the text/content/wording
2.0 06/03/2014 Major Panagiotis Xenos
4.1 Asset Replacement
Updated list and description of proposed schemes
2.0 06/03/2014 Major Panagiotis Xenos
4.2 Reinforcement Updated list and description of proposed schemes
2.0 06/03/2014 Major Panagiotis Xenos
4.3 Costs and Phasing
Updated NAMP summary table
2.0 06/03/2014 Major Panagiotis Xenos
4.4 HI / LI Improvement
Updated HI / LI tables post-intervention; added HI table for FFC’s and comments
2.0 06/03/2014 Major Panagiotis Xenos
5 Rejected Strategies
Revised and edited the text/content/wording
2.0 06/03/2014 Minor Panagiotis Xenos
6 References Updated references table
2.0 06/03/2014 Minor Panagiotis Xenos
6.1 Appendices Updated appendices table
2.0 06/03/2014 Major Panagiotis Appendix A, B, C & Added appendices A, B, C & D

Regional Development Plan
City Road City of London (excluding 33kV)
All of the cost numbers displayed in this document are before the application of on-going efficiencies and real price effects.
Regional Development Plan Page 3 of 38
Version Date Revision Class
Originator Section Update Details
Xenos D
2.1 21/03/2014 Major Panagiotis Xenos
3.6 Pinch Points Removed section and transferred content in section 3.4
2.1 21/03/2014 Minor Panagiotis Xenos
Contents Updated table of contents
2.1 21/03/2014 Minor Panagiotis Xenos
1 Executive Summary
Revised and edited the text/content/wording
2.2 27/03/2014 Minor Regulation All Final publication
Regional Development Plan
City Road City of London (excluding 33kV)
All of the cost numbers displayed in this document are before the application of on-going efficiencies and real price effects.
Regional Development Plan Page 4 of 38
Contents
1 EXECUTIVE SUMMARY ................................................................................................................................. 6
2 NETWORK CONFIGURATION ....................................................................................................................... 9
2.1 EXISTING NETWORK .................................................................................................................................... 9
2.2 EMBEDDED GENERATION ............................................................................................................................. 9
2.3 PROJECTS IN PROGRESS ........................................................................................................................... 10
2.3.1 Limeburner Lane: Establish New 132/11kV Substation ................... Error! Bookmark not defined.
2.3.2 Plumtree Court – 11kV Switchboard Extension ............................................................................... 11
2.3.3 Calshot Street: Establish 2x66MVA 132/11kV Substation .............................................................. 12
2.3.4 Back Hill 11kV: South Group Transfer to Fisher Street ................................................................... 13
2.3.5 Permanent Transfer of Beech St B SE Group to Plumtree Court New Switchboard .................... 123
2.3.6 Finsbury Market: Deep Cable Tunnel Extension ............................................................................. 13
2.3.7 Cost Phasing for Projects in Progress ............................................................................................. 13
3 NETWORK DEVELOPMENT CONSIDERATIONS ....................................................................................... 14
3.1 DEVELOPMENT AREAS ............................................................................................................................... 14
3.2 HI PROFILE – WITHOUT INTERVENTION ....................................................................................................... 15
3.3 SECURITY OF SUPPLY ANALYSIS ................................................................................................................ 17
3.4 OPERATIONAL AND TECHNICAL CONSTRAINTS ............................................................................................. 19
3.5 NATIONAL GRID ......................................................................................................................................... 20
4 RECOMMENDED STRATEGY ...................................................................................................................... 21
4.1 ASSET REPLACEMENT ............................................................................................................................... 21
4.1.1 Finsbury Market B Install 33kV Auto Close Scheme ....................................................................... 21
4.1.2 Finsbury Market B 33kV - Replace Grid Transformers (GT1B, GT2B, GT3B) ................................ 21
4.1.3 City Road C 11kV - Replace Grid Transformer (GT3) ..................................................................... 21
4.1.4 Finsbury Market A 11kV - Replace Grid Transformer (GT2A) ........................................................ 21
4.1.5 Paternoster - Replace Primary Transformer (T4) ............................................................................ 21
4.1.6 Finsbury Market A 11kV - Refurbish Grid Transformers (GT1A, GT3A)Error! Bookmark not
defined.
4.1.7 City Road B 11kV - Refurbish Grid Transformers (GT1, GT2) ......... Error! Bookmark not defined.
4.2 REINFORCEMENT ....................................................................................................................................... 22
4.2.1 Ludgate Circus: Establish 11kV Site ................................................................................................ 22
4.2.2 11kV Load Transfers to Calshot Street MSS ................................................................................... 23
4.2.3 Paternoster 33/11kV - Reconfiguration to Finsbury Market B (33kV Circuits) ................................ 23
4.2.4 Finsbury Market B 33kV Feeder Reconfiguration ............................................................................ 23
4.3 COSTS AND PHASING ................................................................................................................................. 24

Regional Development Plan
City Road City of London (excluding 33kV)
All of the cost numbers displayed in this document are before the application of on-going efficiencies and real price effects.
Regional Development Plan Page 5 of 38
4.4 HI / LI IMPROVEMENT ................................................................................................................................. 24
5 REJECTED STRATEGIES ............................................................................................................................ 28
5.1 CALSHOT STREET: ESTABLISH 2X66MVA 132/11KV SUBSTATION ............................................................... 28
5.2 PLUMTREE COURT - 11KV SWITCHBOARD EXTENSION ................................................................................ 28
5.3 LUDGATE CIRCUS: ESTABLISH 11KV SITE ................................................................................................... 28
5.4 PATERNOSTER 33/11KV - RECONFIGURATION TO FINSBURY MARKET B (33KV CIRCUITS) ............................ 28
6 REFERENCES ............................................................................................................................................... 29
6.1 APPENDICES ............................................................................................................................................. 29
6.2 DOCUMENT HISTORY ................................................................................................................................. 29
7 DOCUMENT SIGN OFF ................................................................................................................................. 29
APPENDIX A: GEOGRAPHICAL LAYOUT ......................................................................................................... 30
APPENDIX B: SINGLE LINE DIAGRAMS – EXISTING NETWORK .................................................................. 31
APPENDIX C: SINGLE LINE DIAGRAMS – RECOMMENDED STRATEGY ..................................................... 33
APPENDIX D: SCHEMATIC DIAGRAM – EXISTING TUNNEL NETWORK ...................................................... 35

Regional Development Plan
City Road City of London (excluding 33kV)
All of the cost numbers displayed in this document are before the application of on-going efficiencies and real price effects.
Regional Development Plan Page 6 of 38
Cat. Description 2013/14 2014/15 2015/16 2016/17 2017/18 2018/19 2019/20 2020/21 2021/22 2022/23
A & H Total Asset Replacement 0 9,057 525,570 3,671,052 76,656 2,771,861 1,385,927 0 163,009 214,028
R Total Reinforcement 0 0 0 184,692 1,784,373 885,893 41,199 0 185,100 1,506,108
Grand Total 0 9,057 525,570 3,855,745 1,861,029 3,657,753 1,427,126 0 348,109 1,720,136
1 Executive Summary
This document reviews the LPN EHV network supplied from City Road 400/132kV Grid Supply Point (GSP)
which has an aggregated peak group demand of circa 799MVA (Winter) and 876MVA (Summer). It presents the
schemes which are currently under construction and impact the HV network and provides recommendations for
future interventions for the ED1 period.
The strategy for the development of the network during DPCR5 has included the introduction of a new 33kV
distribution network in the city to facilitate the connection of new large developments with a power demand
typically greater than 5MVA. The 33kV network development is now covered by a separate RDP.
The study area covers substations supplied by the City Road GSP National Grid exit point.
Proposed Interventions
The proposed interventions above £1M are as follows:
Finsbury Market B 33kV - Replace Grid Transformers (GT1B, GT2B, GT3B) £4.2M
City Road C 11kV - Replace Grid Transformer (GT3) £1.6M
Finsbury Market A 11kV - Replace Grid Transformer (GT2A) £1.6M
Ludgate Circus: Establish 11kV Site £1.8M (£1.7M in ED1)
11kV Load Transfers to Calshot St MSS £1.5M
Finsbury Market B 33kV Feeder Reconfiguration £1.1M
Costs profile
Table 1: NAMP Summary – 19th
February 2014
Output Measures – Load Index
The forecast load indices for 2015 and 2023, with and without intervention, are shown in the figure below:

Regional Development Plan
City Road City of London (excluding 33kV)
All of the cost numbers displayed in this document are before the application of on-going efficiencies and real price effects.
Regional Development Plan Page 7 of 38
Output Measures – Health Index
The forecast health indices for 2015 and 2023 for each plant category, with and without intervention, are
depicted in the figures below:

Regional Development Plan
City Road City of London (excluding 33kV)
All of the cost numbers displayed in this document are before the application of on-going efficiencies and real price effects.
Regional Development Plan Page 8 of 38
RDP Dependencies and Assumptions
This document assumes that all DPCR5 previously approved schemes will progress as currently programmed.
The proposal for the redevelopment of Shoreditch substation is dependent on the completion of the New Cross
– Finsbury Market tunnel and the installation of the associated 132kV circuits from New Cross.
Plumtree Court is dependent on the completion of Limeburner Lane substation.
The schemes covered in this RDP have been planned based on the planning load estimates dated 27/02/2013
taking into account the 2011/12 maximum demand figures. The load forecasts are based on the Element
Energy model. If the economic situation improves there is a risk that there will be shortfall of reinforcement
schemes in the plan.
The load forecasts also include an assumed level of embedded generation being connected to the network.
Should this generation not materialise, then a larger than forecast load growth could be realised.

Regional Development Plan
City Road City of London (excluding 33kV)
All of the cost numbers displayed in this document are before the application of on-going efficiencies and real price effects.
Regional Development Plan Page 9 of 38
GSP Main Substation Customer Name (MAVIS) SITE NAMEInstalled DG
(MVA)Mode of Operation
City Road 132kV Bankside C Total BRITISH TELECOMMUNICATIONS PLC COLUMBO HOUSE SOUTHBANK 5.112 Long Term Parallel
City Road 132kV Bankside C Total IBM UNITED KINGDOM LTD LLOYDS COMPUTER CENTRE 10.400 Long Term Parallel
City Road 132kV Beech Street A CITIGEN LONDON LTD 39.500 Long Term Parallel
City Road 132kV Devonshire Square UBS AG UBS 6.000 Standby
City Road 132kV Finsbury Market A THE TOWER MANAGEMENT SERVICE LTD TOWER COMPLEX 6.300 Short Term Parallel
City Road 132kV Beech Street B CHASE MANHATTAN BANK CHASE MANHATTAN BANK 6.800 Standby
City Road 132kV Devonshire Square LANDMARK PLC JOHNSON SMIRKE BUILDING 6.000 Long Term Parallel
City Road 132kV Finsbury Market A CITYPOINT (JERSEY) UNIT TRUST CITY POINT 5.200 Short Term Parallel
City Road 132kV Paternoster MERRILL LYNCH EUROPE PLC MERILL LYNCH FINANCIAL CENTRE 10.200 STANDBY
City Road 132kV Osborn Street INTERXION LIMITED BLOCK B 8.000 Standby
City Road 132kV Finsbury Market E SIR ROBERT MCALPINE 9.600 Standby
City Road 132kV Mansell Street 22kV LUL GREENWICH POWER STATION 29.500 Long Term Parallel
City Road 132kV Beech Street A MOOR HOUSE MANAGEMENT SERVICES LTD BNP PARIBAS, MOOREHOUSE 6.000 Standby
City Road 132kV Osborn Street QUEEN MARY UNIVERSITY OF LONDON LONDON HOSPITAL (CLINICAL BLOCK) 10.000 Standby
City Road 132kV Seacoal Lane LAND SECURITIES GROUP PLC 5.030 Short Term Parallel
City Road 132kV Bankside C Total NOMURA INTERNATIONAL PLC WATERMARK PROJECT PLACE 10.000 Standby
City Road 132kV City Road B LEVEL 3 COMMUNICATIONS LTD LEVEL 3 COMMUNICATIONS LTD 15.200 Standby
City Road 132kV City Road B LEVEL 3 COMMUNICATIONS LTD LEVEL 3 COMMUNICATIONS LTD 15.200 Standby
2 Network Configuration
2.1 Existing Network
The network is fed from City Road 400/132kV National Grid Exit Point, which currently experiences a summer
peak of 876MVA. Downstream, there is a 132kV cable network feeding predominantly 132/11kV substations
and a smaller number of 132/33kV substations. These 132/33kV substations in turn feed a number of 33/11kV
primary substations.
The number of UK Power Networks owned 33/11kV primary substations is expected to decrease over time as,
when dictated by load growth, these are replaced with larger 132/11kV substations housed within the existing
buildings (where possible) due to high land values in the area. In turn, the capacity freed up at the existing
132/33kV substations will be used to provide connections to large buildings in the city at 33kV (covered by the
33kV Distribution Network RDP). This strategy will ensure that both 11kV and 33kV load growth is catered for in
the most efficient manner by utilising existing assets where possible.
The network is predominantly located in the City of London to the north of the River Thames, with the exception
of Bankside Substation, which is located to the south of the Thames in Southwark and shares a building with the
Tate Modern. Bankside Substation is interconnected with the network north of the Thames by an extensive
tunnel network.
There is also an isolated 20kV network to the south of the Thames fed from Bankside D Substation. This
network is used for new customer connections however also supports a legacy 22kV system in the area which
is in the process of being phased out. There is a 22/11kV substation at Newington House (UK Power Networks
Head Office) which requires work to enable it to operate with a 20kV source; and a 22/6.6kV substation at
Charing Cross Railway Station, which is the only customer on this network that is located north of the Thames.
A Geographical Layout of the network can be found in Appendix A;
Single Line Diagrams of the existing network can be found in Appendix B;
A Schematic Diagram of the tunnel network in the area can be found in Appendix D.
2.2 Embedded Generation
Table 2: Embedded Generation (G59/2)
Note: CITIGEN generators are currently out of service and may be taken offline permanently.

Regional Development Plan
City Road City of London (excluding 33kV)
All of the cost numbers displayed in this document are before the application of on-going efficiencies and real price effects.
Regional Development Plan Page 10 of 38
The total installed capacity of G59/2 embedded generation under this RDP is 258MW. Table 3 above details all
the generating plants used in the analysis for the City Road Network with an installed capacity of over 5MVA
(totalling 204MVA).
2.3 Projects in Progress
2.3.1 Limeburner Lane: Establish New 132/11kV Substation
Seacoal Lane Substation is contained in the basement of Seacoal House, located within ¼ mile of Blackfriars
and the Old Bailey Law Courts in the City of London. The building was a disused ex-LEB, 7-storey office and
has recently been demolished to ground floor level and rebuilt to accommodate network reinforcement.
Due to a change in the road layout historically surrounding the substation, it is now situated on Limeburner
Lane. The substation is therefore being renamed as part of the redevelopment.
Seacoal Lane Substation currently consists of a 44-panel, double busbar, 11kV switchboard only. The
switchboard consists of three sections:
Section 1: Reyrolle C manufactured in 1954 9 x Feeders, 2 x Incomers, 1 x Bus Coupler, 1 x Bus Section
Section 2: Alstom WBD manufactured in 2006 10 x Feeders, 4 x Incomers, 4 x Off Load Disconnectors
Section 3: Reyrolle C manufactured in 1954 10 x Feeders, 1 x Incomer, 1 x Bus Coupler, 1 x Bus Section
It is supplied via 7x11kV, 630mm2, copper, XLPE circuits running through the City Road – Farringdon – Seacoal
Lane tunnel. These circuits have a firm rating of 65.2MVA and due to their length and heavy loading, are the
primary heat source and therefore use up the majority of the thermal capacity available within the tunnel.
Both City Road C and the circuits feeding Seacoal Lane are currently out of firm (LI4), with P2/6 compliance
maintained via the post-fault transfer of the Seacoal Lane SW Feeder Group (19MVA) to Paternoster
Substation. Paternoster’s switchboard has recently been partially transferred to Bankside C to maintain P2/6
compliance and to free up 33kV capacity at Finsbury Market C for new connections to the City of London 33kV
Distribution Network.
Limeburner Lane 3x66.6MVA, 132/11/11kV substation is currently under construction, with completion expected
in Q4 2015. The substation is to be supplied via a loop in/out arrangement from existing 132kV cables installed
in the City Road to Bankside deep cable tunnel.
The new substation will have a summer firm rating of 172MVA due to the transformers being specified as having
a 130% cyclic rating for a 12-hour period with an ambient air temperature of 300ºC.
The drivers for the project are as follows:
- Maintain P2/6 compliance at City Road C/Seacoal Lane
- Free up 11kV capacity near to the City Road Basin development and regeneration hub
- Free up space and thermal capacity in the Back Hill – Farringdon tunnel for circuits associated with the
City of London 33kV Distribution Network (see 33kV Distribution Network RDP)
- Provision for 11kV switch positions for surrounding connections activity
The scope of work is as follows:
- Cap the existing deep tunnel shaft and remove ventilation (forced exit)
- Demolish the existing 7-storey building to ground floor level
- Rebuild a fit for purpose structure and substation ventilation scheme

Regional Development Plan
City Road City of London (excluding 33kV)
All of the cost numbers displayed in this document are before the application of on-going efficiencies and real price effects.
Regional Development Plan Page 11 of 38
1 2 3 4 5 6 7 8 9 10 11 12 13 14 15 16 17 18 19 20 21 22 23 24 25 26 27 28
Reserve
Main
1 25 29 30 31
Lim
eb
urn
er
Inco
me
r 1
City R
oa
d
Inco
me
r 1
Lim
eb
urn
er
Inco
me
r 2
City R
oa
d
Inco
me
r 2
Lim
eb
urn
er
Inco
me
r 3
City R
oa
d
Inco
me
r 3
BEECH ST B
SE GROUP = 22MVA
Sp
are
NEW ST
SQUARE
4.3MVA
PLUMTREE
COURT = 10MVA
FLEET ST 120
7MVA
(intact)
CITY ROAD B
N GROUP = 8MVA
CAXTON HOUSE
= 8.8MVA
S S
S
S S
S
S SS
S
S
S
S
S MBS1
RBS1
- Reinstate the tunnel ventilation scheme
- Install 3x132kV GIS H-points with inline breakers
- Install 3x132/11kV, 66.6MVA transformers
- Install 6x132kV circuits from the existing 3xCity Road – Bankside 132kV Circuits to loop in/out of the
new GIS tee points via the Deep Tunnel and Limeburner Lane Shaft
- Install a new 41-panel 11kV switchboard in 2 sections and interconnect to the existing Alstom WBD
switchgear, which is to be retained
- Remove the existing 26 panels of Reyrolle C switchgear (HI4)
2.3.2 Plumtree Court - 11kV Switchboard Extension
Goldman Sachs have requested a 10MVA supply for a site known as Plumtree Court. During the negotiations
between UK Power Networks Connections and the customer it was agreed that the customer would provide
space for a larger switchboard than they required to be installed.
A 31-panel double busbar 11kV, 2500A, switchboard has been proposed (subject to customer acceptance) as
per the single line diagram shown in Figure 1 below:
Figure 1: Plumtree Court Single Line Diagram
The incoming feeders will be provided by cutting into the existing City Road C – Seacoal Lane 11kV circuits
running through the tunnel system, using two cables per phase in order to retain thermal capacity within the
tunnel. This project is therefore dependent on the completion of Limeburner Lane.
The drivers for the project are as follows:
- The Beech Street B South East Feeder Group is overloaded. There are no spare switches and no
space for expansion at the substation. In addition, the first legs of this group are approximately 1,700m
in length. The group is geographically located close to the Plumtree Court site and the project will
facilitate reinforcement of this feeder group.
- City Road B MSS is approaching firm capacity with a high number of connections referrals allocated.
The site is heavily reliant on emergency post-fault transfers to maintain compliance. This site is also
geographically close to the Plumtree Court site and the project will facilitate reinforcement of this feeder
group.
- New St Square, 1 – The customer requires a 4.3MVA Solkor connection from the 11kV network. If the
customer were connected to Limeburner Lane MSS, this would utilise two switches and be an inefficient
use of the capacity installed at Limeburner Lane.

Regional Development Plan
City Road City of London (excluding 33kV)
All of the cost numbers displayed in this document are before the application of on-going efficiencies and real price effects.
Regional Development Plan Page 12 of 38
- Caxton House – Due to the size of the load required (8.8MVA), if it were to be connected to Limeburner
Lane, it would require the addition of feeders into any existing group or dedicated switches. As the
location of Caxton House is better suited to a connection at Plumtree Court, it has been deemed a more
appropriate point of connection.
- Fleet St, 120 – This customer is to be supplied from Bankside, but have requested a backup “intact
only” supply from an alternative substation. Again, so as to not underutilise switches at Limeburner
Lane, the alternative supply has been assigned to Plumtree Court.
2.3.3 Calshot Street: Establish 2x66MVA 132/11kV Substation
Calshot Street is a UK Power Networks’ leasehold site strategically located 500m east of London Kings Cross
railway station. In 1978, London Borough of Islington granted London Electricity Board an 80-year lease of the
site. In 1999, Peabody Trust took over ownership of the site.
As the site has not been in continuous use for ‘operational purposes’, it is not possible to make use of permitted
development rights and a full planning application is required.
Two existing 132kV, 630mm2 Aluminium Conductored, XLPE insulated circuits, which feed Canal Street MSS,
pass within 100m of the Calshot Street site. Since Canal Street is contracted for a maximum demand of 45MVA,
there is capacity in the circuits to connect a 2x66MVA 132/11kV primary substation. The ‘N-1’ summer cyclic
rating of the circuits is 152MVA.
The establishment of Calshot Street Main Substation allows load to be transferred from Back Hill A 11kV and
City Road B 11kV (both LI4). The load on Back Hill A 11kV exceeds the firm capacity of the substation, with
Engineering Recommendation P2/6 compliance maintained via 11kV post-fault transfers. City Road B 11kV
currently has circa 17MVA of spare capacity available but also has 38MVA (diversified at 0.8) of connection
applications allocated to it.
As well as relieving loading issues in the surrounding network, this new Main Substation will provide spare 11kV
circuit breakers. These spare breakers give flexibility to the surrounding network and also allow timely
connection of new HV customers. There has been an informal expression of interest for an 8MVA supply to
Euston Station with N-3 security for the High Speed 2 rail project as well as an additional 7.5MVA traction
supply.
Figure 2: Calshot Street – Map of Associate Substations
Calshot Street 11kV
Back Hill 11kV
City Road B 11kV

Regional Development Plan
City Road City of London (excluding 33kV)
All of the cost numbers displayed in this document are before the application of on-going efficiencies and real price effects.
Regional Development Plan Page 13 of 38
Cat. Reference Description 2013/14 2014/15 2015/16 2016/17 2017/18
R 1.33.03.8471 Plumtree Court - 11kV Switchboard Extension 0 180,084 540,252 0 0
R 1.34.01.5743
Back Hill 11kV: South Group Transfer to Fisher
Street 402,183 861,823 517,095 0 0
R 1.34.02.5884
Permanent Transfer of Beech St B SE Group to
Plumtree Court New Switchboard 0 64,005 256,018 192,014 0
R 1.35.01.2632
Limeburner Lane: Establish new 132/11kV
Substation 8,965 713 42 0 0
R 1.35.07.5795
Calshot Street: Establish 2x66MVA 132/11kV
Substation 152,832 258,325 5,658,214 1,410,363 0
R 1.37.09.4379 Finsbury Market: Deep Cable Tunnel Extension 2,525,532 0 0 0 0
2.3.4 Back Hill 11kV: South Group Transfer to Fisher Street
It is proposed to transfer the South Group permanently from Back Hill 11kV to Fisher Street. This project will
allow Back Hill 11kV to remain P2/6 compliant and will be undertaken once Fisher Street substation is upgraded
to a 132/11kV site creating 36MVA of additional capacity. The South Group at Back Hill represents around
25MVA of capacity.
2.3.5 Permanent Transfer of Beech St B SE Group to Plumtree Court New Switchboard
The Beech Street South East Group is at firm capacity whilst the demand at Beech Street B main substation is
approaching the firm capacity limit. As there are no spare switches and no way out of the main substation for
additional circuits, it is proposed to reinforce and transfer the SE Group to Plumtree Court new switchboard.
This project is therefore dependent on timely completion of the switchboard extension at Plumtree Court.
2.3.6 Finsbury Market: Deep Cable Tunnel Extension
To enable development of the City of London intermediate voltage network, it is proposed to construct a short
extension (60m) to the new New Cross – Finsbury Market deep cable tunnel to establish viable routes for
distribution feeder groups connecting to the site. Open-cut route proving confirmed severe street service
congestion to the west of Finsbury Market substation hence this option was discarded.
2.3.7 Cost Phasing for Projects in Progress
Table 3: Ongoing Projects (NAMP 19
th February 2014)

Regional Development Plan
City Road City of London (excluding 33kV)
All of the cost numbers displayed in this document are before the application of on-going efficiencies and real price effects.
Regional Development Plan Page 14 of 38
3 Network Development Considerations
3.1 Development Areas
Elephant & Castle – Heygate Estate: Outline Planning Permission granted for 2,500 new homes (circa 5MVA of
load diversified at 2kVA per household).
Islington – City Road Basin urban development: Situated in one of London’s most fashionable and cosmopolitan
districts, the freehold of 8.5 acres of land surrounding the Islington Canal basin is to be transformed into a
waterside residential quarter with restaurants and shops and a new public civic space.
259 City Road: A planning consent was granted in April 2010 for the erection of a 29-storey tower
comprising 300 residential units and ground floor commercial floor space. Work has now started on site.
261 City Road: An application was approved in December 2006 for the erection of 36-storey building
(Islington’s tallest residential tower) and two 8-storey buildings to provide a total of 307 residential units.
The development will feature 785 square metres of mixed-use commercial floor space. Construction
launches in spring 2014.
Figure below depicts the proposed development at the City Road Basin with the construction of two residential
towers.
Figure 3: City Road Basin Proposed Development
Regional Development Plan
City Road City of London (excluding 33kV)
All of the cost numbers displayed in this document are before the application of on-going efficiencies and real price effects.
Regional Development Plan Page 15 of 38
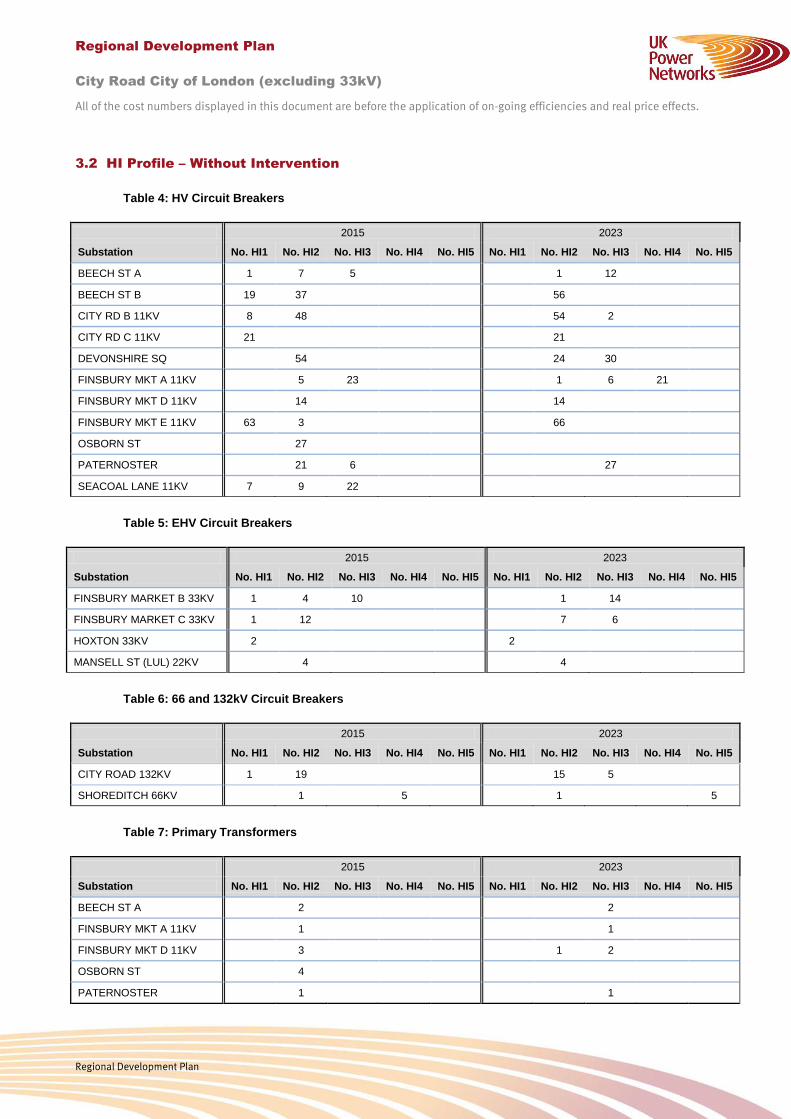
3.2 HI Profile – Without Intervention
Table 4: HV Circuit Breakers
2015 2023
Substation No. HI1 No. HI2 No. HI3 No. HI4 No. HI5 No. HI1 No. HI2 No. HI3 No. HI4 No. HI5
BEECH ST A 1 7 5 1 12
BEECH ST B 19 37 56
CITY RD B 11KV 8 48 54 2
CITY RD C 11KV 21 21
DEVONSHIRE SQ 54 24 30
FINSBURY MKT A 11KV 5 23 1 6 21
FINSBURY MKT D 11KV 14 14
FINSBURY MKT E 11KV 63 3 66
OSBORN ST 27
PATERNOSTER 21 6 27
SEACOAL LANE 11KV 7 9 22
Table 5: EHV Circuit Breakers
2015 2023
Substation No. HI1 No. HI2 No. HI3 No. HI4 No. HI5 No. HI1 No. HI2 No. HI3 No. HI4 No. HI5
FINSBURY MARKET B 33KV 1 4 10 1 14
FINSBURY MARKET C 33KV 1 12 7 6
HOXTON 33KV 2 2
MANSELL ST (LUL) 22KV 4 4
Table 6: 66 and 132kV Circuit Breakers
2015 2023
Substation No. HI1 No. HI2 No. HI3 No. HI4 No. HI5 No. HI1 No. HI2 No. HI3 No. HI4 No. HI5
CITY ROAD 132KV 1 19 15 5
SHOREDITCH 66KV 1 5 1 5
Table 7: Primary Transformers
2015 2023
Substation No. HI1 No. HI2 No. HI3 No. HI4 No. HI5 No. HI1 No. HI2 No. HI3 No. HI4 No. HI5
BEECH ST A 2 2
FINSBURY MKT A 11KV 1 1
FINSBURY MKT D 11KV 3 1 2
OSBORN ST 4
PATERNOSTER 1 1

Regional Development Plan
City Road City of London (excluding 33kV)
All of the cost numbers displayed in this document are before the application of on-going efficiencies and real price effects.
Regional Development Plan Page 16 of 38
Table 8: Grid Transformers
2015 2023
Substation No. HI1 No. HI2 No. HI3 No. HI4 No. HI5 No. HI1 No. HI2 No. HI3 No. HI4 No. HI5
BEECH STREET B 3 3
CANAL STREET 2 2
CITY ROAD B 11KV 1 1 2
CITY ROAD C 11KV 1 1 1 1
DEVONSHIRE SQ 3 1 2
FINSBURY MARKET B 33KV 1 1 1 1 1 1
FINSBURY MARKET C 33KV 1 2 1 2
FINSBURY MKT A 11KV 2 1 2 1
FINSBURY MKT E 11KV 1 2 3
HOXTON 33KV 1 1
MANSELL ST (LUL) 22KV 2 2
Table 9: Fluid Filled Cables
Cable Route Cable Section Voltage
kV 2015
HI 2023
HI
BEECH ST A-PATERNOSTER CABLE SECTION: 04070476-1-A 33 2 3
BEECH ST A-PATERNOSTER CABLE SECTION: 04070476-2-A 33 2 3
BEECH ST A-PATERNOSTER CABLE SECTION: 04070476-3-A 33 2 3
BEECH ST A-PATERNOSTER CABLE SECTION: 04070476-4-A 33 2 3
FINSBURY MARKET B 33KV-WHISTON RD CABLE SECTION: 34290495-1-A 33 3 3
FINSBURY MARKET B 33KV-WHISTON RD CABLE SECTION: 34290495-2-A 33 2 3
FINSBURY MARKET B 33KV-WHISTON RD CABLE SECTION: 34290495-3-A 33 2 2
FINSBURY MARKET B 33KV-WHISTON RD CABLE SECTION: 34290495-4-A 33 2 2
FINSBURY MARKET C 33KV-BEECH ST A CABLE SECTION: 34320407-1-A 33 2 3
FINSBURY MARKET C 33KV-BEECH ST A CABLE SECTION: 34320407-2-A 33 2 3
FINSBURY MARKET C 33KV-BEECH ST A CABLE SECTION: 34320407-3-A 33 2 3
FINSBURY MARKET C 33KV-BEECH ST A CABLE SECTION: 34320407-4-A 33 2 3
Notes: Osborn Street will be replanted at 132kV and fed from New Cross GSP. The new Limeburner Lane
substation will replace Seacoal Lane switching station.

Regional Development Plan
City Road City of London (excluding 33kV)
All of the cost numbers displayed in this document are before the application of on-going efficiencies and real price effects.
Regional Development Plan Page 17 of 38
Substation P2/6Type of
substation
Secondary
Voltage
Firm
Capacity
(MW)
Transfer
(MW)P. F.
Winter
13/14
Summer
2013
(MW)
Winter
14/15
Summer
2014
(MW)
Winter
15/16
Summer
2015
(MW)
Winter
16/17
Summer
2016
(MW)
Winter
17/18
Summer
2017
(MW)
Winter
18/19
Summer
2018
(MW)
Winter
19/20
Summer
2019
(MW)
Winter
20/21
Summer
2020
(MW)
Winter
21/22
Summer
2021
(MW)
Winter
22/23
Summer
2022
(MW)
Back Hill 33kV YES Grid 33kV 149.90 0.94 107.90 125.77 89.86 116.58 117.72 119.94 120.58 121.25 121.98 122.73
Back Hill 33kV YES Grid 33kV 116.10 21.38 0.86 109.56 127.45 90.91 118.39 119.52 121.73 122.36 123.01 123.72 124.45
Back Hill YES Grid 11kV 54.90 0.96 43.49 44.14 20.56 3.83 4.13 4.45 4.78 5.11 5.49 5.89
Back Hill NO Grid 11kV 42.75 1.26 0.95 44.64 45.27 20.46 3.72 4.01 4.31 4.62 4.93 5.30 5.67
Bankside C YES Grid 11kV 229.90 0.95 130.99 133.95 69.94 72.35 75.10 77.95 50.38 53.40 56.75 60.19
Bankside C YES Grid 11kV 222.60 0.92 125.71 128.45 66.96 69.20 71.74 74.38 39.25 42.04 45.14 48.33
Bankside C Total YES Grid 11kV 229.90 0.95 130.99 133.95 136.94 139.35 142.10 144.95 117.38 120.40 123.75 127.19
Bankside C Total YES Grid 11kV 222.60 0.92 125.71 128.45 131.21 133.45 135.99 138.63 103.50 106.29 109.39 112.58
Bankside D YES Grid 20kV 105.60 0.96 32.00 56.97 27.75 28.02 28.32 28.64 28.96 29.29 29.71 30.13
Bankside D YES Grid 20kV 101.20 0.92 35.96 57.74 27.57 27.84 28.15 28.46 28.79 29.12 29.53 29.96
Bankside D 20kV Group YES Group Load 20kV 117.00 0.96 29.35 29.35 -0.20 -0.20 -0.20 -0.20 -0.20 -0.20 -0.20 -0.20
Bankside D 20kV Group YES Group Load 20kV 117.00 0.96 33.68 33.68 3.18 3.18 3.18 3.18 3.18 3.18 3.18 3.18
Bankside F YES Grid 132kV 263.40 0.96 181.53 209.04 62.65 64.99 67.66 70.42 73.27 76.19 79.49 82.87
Bankside F YES Grid 132kV 263.40 0.96 227.11 252.06 77.29 80.13 83.38 86.73 90.18 93.73 97.72 101.82
Beech Street A YES Primary 11kV 18.72 0.96 8.87 9.06 9.26 0.00 0.00 0.00 0.00 0.00 0.00 0.00
Beech Street A YES Primary 11kV 14.10 0.94 9.61 9.81 10.01 0.00 0.00 0.00 0.00 0.00 0.00 0.00
Beech Street B YES Grid 11kV 154.17 0.98 78.43 79.62 80.82 81.78 82.89 84.03 85.22 86.43 87.78 89.16
Beech Street B YES Grid 11kV 127.68 0.95 94.18 95.54 96.91 98.01 99.27 100.58 101.93 103.32 104.85 106.43
Brick Lane NO Customer 33kV 0.00 0.96 20.00 20.00 20.00 20.00 20.00 20.00 20.00 20.00 20.00 20.00
Brick Lane NO Customer 33kV 0.00 0.96 20.00 20.00 20.00 20.00 20.00 20.00 20.00 20.00 20.00 20.00
Calshot Street YES Grid 11kV 82.40 0.96 0.00 0.00 0.00 47.10 47.10 47.10 47.10 47.10 47.10 47.10
Calshot Street YES Grid 11kV 63.40 0.96 0.00 0.00 0.00 45.40 45.40 45.40 45.40 45.40 45.40 45.40
Canal Street YES Grid 11kV 74.90 0.96 15.65 22.85 22.85 22.85 22.85 22.85 22.85 22.85 22.85 22.85
Canal Street YES Grid 11kV 55.20 0.92 14.56 21.24 21.24 21.24 21.24 21.24 21.24 21.24 21.24 21.24
Charing Cross 6.6kV. YES Primary 6.6kV 6.70 0.96 2.72 2.72 2.72 2.72 2.72 2.72 2.72 2.72 2.72 2.72
Charing Cross 6.6kV. YES Primary 6.6kV 5.50 0.92 2.30 2.30 2.30 2.30 2.30 2.30 2.30 2.30 2.30 2.30
Charterhouse Street Citigen YES Customer 11kV 40.00 0.96 12.40 12.40 12.40 0.00 0.00 0.00 0.00 0.00 0.00 0.00
Charterhouse Street Citigen YES Customer 11kV 40.00 0.92 12.41 12.41 12.41 0.00 0.00 0.00 0.00 0.00 0.00 0.00
City Rd Seacoal Bankside F Group YES Group Load 132kV 479.80 0.96 197.51 232.22 169.37 218.81 221.49 224.25 227.09 230.02 233.31 236.70
City Rd Seacoal Bankside F Group YES Group Load 132kV 459.80 0.92 241.67 273.29 200.04 248.28 251.53 254.88 258.33 261.88 265.87 269.97
City Road 132kV YES GSP 132kV 1244.16 0.96 821.29 861.79 688.55 713.96 705.49 713.57 721.85 729.36 737.84 746.53
City Road 132kV YES GSP 132kV 1099.00 0.96 901.77 939.56 740.60 757.93 754.18 763.01 772.07 780.37 789.70 799.27
City Road B YES Grid 11kV 149.45 0.95 115.28 116.83 118.42 93.51 94.98 96.51 98.08 99.69 101.60 103.54
City Road B YES Grid 11kV 123.65 0.92 105.53 106.88 108.27 83.20 84.48 85.81 87.18 88.59 90.25 91.95
City Road C YES Grid 11kV 75.50 0.96 53.05 53.05 0.00 0.00 0.00 0.00 0.00 0.00 0.00 0.00
City Road C YES Grid 11kV 63.25 2.40 0.92 63.67 63.67 0.00 0.00 0.00 0.00 0.00 0.00 0.00 0.00
City Road to Finsbury Circuits YES Circuits 132kV 296.30 0.96 216.58 217.83 180.04 178.68 162.51 162.67 162.83 162.99 163.17 163.36
City Road to Finsbury Circuits YES Circuits 132kV 260.80 0.92 234.06 235.38 193.96 185.60 173.44 173.60 173.77 173.95 174.14 174.34
Devonshire Square YES Grid 11kV 151.00 0.96 87.16 88.81 90.47 91.82 93.35 94.93 96.56 98.24 100.09 101.99
Devonshire Square YES Grid 11kV 126.34 0.94 93.02 94.70 96.38 97.75 99.30 100.91 102.56 104.26 106.14 108.07
Finsbury Market A YES Grid 11kV 55.40 0.96 35.26 35.27 35.29 35.30 35.31 35.32 35.34 35.35 35.37 35.38
Finsbury Market A YES Grid 11kV 42.30 6.27 0.94 40.06 40.07 40.09 40.10 40.11 40.13 40.14 40.16 40.18 40.20
Finsbury Market B 33kV YES Grid 33kV 108.81 0.93 75.32 75.94 41.06 41.24 41.44 51.50 91.60 92.46 93.42 94.41
Finsbury Market B 33kV NO Grid 33kV 80.10 15.08 0.89 75.00 75.55 37.02 37.13 37.26 48.32 97.06 97.83 98.69 99.57
Finsbury Market C 33kV YES Grid 33kV 111.15 0.95 36.73 37.01 37.29 37.52 37.78 28.21 19.44 19.44 19.44 19.44
Finsbury Market C 33kV YES Grid 33kV 81.00 0.90 35.28 35.56 35.83 36.05 36.31 25.66 15.50 15.50 15.50 15.50
Finsbury Market D YES Primary 11kV 37.44 0.96 17.33 17.34 17.34 17.35 17.35 17.36 17.36 17.37 17.38 17.38
Finsbury Market D YES Primary 11kV 27.60 0.92 19.87 19.88 19.88 19.89 19.89 19.90 19.91 19.91 19.92 19.93
Finsbury Market E YES Grid 11kV 167.86 0.97 81.35 81.50 81.64 81.76 81.90 82.03 82.18 82.32 82.48 82.65
Finsbury Market E YES Grid 11kV 138.97 0.94 91.67 91.82 91.98 92.11 92.25 92.40 92.56 92.71 92.89 93.07
Hoxton N/A Customer 33kV 86.40 0.96 0.00 0.00 0.00 0.00 0.00 0.00 0.00 0.00 0.00 0.00
Hoxton N/A Customer 33kV 57.60 0.96 0.00 0.00 0.00 0.00 0.00 0.00 0.00 0.00 0.00 0.00
Limeburner Lane YES Grid 11kV 166.23 0.96 0.00 0.00 83.55 83.55 83.55 83.55 83.55 83.55 83.55 83.55
Limeburner Lane YES Grid 11kV 159.30 0.92 0.00 0.00 101.51 101.51 101.51 101.51 101.51 101.51 101.51 101.51
Mansell Street 22kV LUL N/A Customer 22kV 82.45 0.97 38.38 38.38 38.38 38.38 39.38 40.38 41.38 41.38 41.38 41.38
Mansell Street 22kV LUL N/A Customer 22kV 78.20 0.92 37.70 37.70 37.70 37.70 38.70 39.70 40.70 40.70 40.70 40.70
New ington House. YES Primary 11kV 37.80 15.03 0.97 0.00 24.97 25.30 25.57 25.87 26.19 26.51 26.85 27.26 27.69
New ington House. YES Primary 11kV 27.90 0.93 0.00 21.78 22.12 22.38 22.69 23.01 23.33 23.66 24.08 24.51
Osborn Street YES Primary 11kV 55.58 0.95 37.92 38.33 0.00 0.00 0.00 0.00 0.00 0.00 0.00 0.00
Osborn Street YES Primary 11kV 41.40 8.81 0.92 41.50 41.92 0.00 0.00 0.00 0.00 0.00 0.00 0.00 0.00
Paternoster YES Primary 11kV 58.20 0.97 8.31 8.41 8.50 8.58 8.67 8.77 0.00 0.00 0.00 0.00
Paternoster YES Primary 11kV 57.60 0.96 9.64 9.75 9.86 9.95 10.05 10.16 0.00 0.00 0.00 0.00
Paternoster. YES Primary 11kV 56.70 0.97 0.00 0.00 0.00 0.00 0.00 0.00 39.70 40.14 40.63 41.13
Paternoster. NO Primary 11kV 43.20 0.96 0.00 0.00 0.00 0.00 0.00 0.00 48.43 48.87 49.36 49.86
Tooley St via Bankside YES Grid 11kV 37.40 0.96 22.24 22.24 0.00 0.00 0.00 0.00 0.00 0.00 0.00 0.00
Tooley St via Bankside YES Grid 11kV 28.80 0.96 25.94 25.94 0.00 0.00 0.00 0.00 0.00 0.00 0.00 0.00
Whiston Road T1 YES Primary 11kV 15.00 5.27 0.96 15.72 15.93 16.14 16.32 0.00 0.00 0.00 0.00 0.00 0.00
Whiston Road T1 YES Primary 11kV 14.00 0.94 11.90 12.05 12.20 12.33 0.00 0.00 0.00 0.00 0.00 0.00
3.3 Security of Supply Analysis
Table 10: P2/6 Assessment Table

Regional Development Plan
City Road City of London (excluding 33kV)
All of the cost numbers displayed in this document are before the application of on-going efficiencies and real price effects.
Regional Development Plan Page 18 of 38
Table 10 above is the P2/6 assessment table which shows the load growth predicted on the City Road network
(demand exceeding the substation firm capacity plus any available post-fault transfer capability is highlighted in
orange).
With the exception of Back Hill 11kV, all sites that face firm capacity issues due to projected load growth or
other local factors are currently/will remain P2/6 compliant within ED1 via the available 11kV post-fault transfers
or the proposed interventions covered in this RDP. Following the completion of the proposed reinforcement
schemes (see details below), additional load transfer capacity will be made available between Finsbury Market
B & C 33kV ensuring that Finsbury Market B will remain compliant with P2/6.
Paternoster substation was a 4x15MVA 33/11kV substation until 2012 when 3 of the transformers were
decommissioned and it is currently fed via 1x15MVA 33/11kV transformer (from Finsbury Market C 33kV) and
3x11kV circuits (from Bankside C; each rated at 20MVA). The firm capacity of the substation in the above table
is based on the minimum available capacity on those three interconnectors following the loss of the single
33/11kV transformer. After 2019 Paternoster will be reconfigured to its initial state and the 3x11kV circuits from
Bankside C will be partially utilised for other purposes; hence the firm capacity is then based on a 4x15MVA
transformer site (refer to 4.2.3 & 4.2.4). The site is expected to continue to comply with ER P2/6 until the end of
ED1 relying on the interconnection to Bankside C; the 11kV load transfer capacity post-intervention will be
established nearer the time.
Since there is insufficient post-fault transfer capability, the summer maximum demand at Back Hill 11kV
substation will be exceeding the site firm capacity until 2015, when Fisher Street will be replanted at 132kV
enabling Back Hill 11kV to be deloaded. It is recommended that an ‘At Risk’ study is carried out to determine the
summer cyclic capability of the Back Hill transformers and if necessary a derogation application submitted to
Ofgem on the grounds that any interim investment to deal with this issue would be an inefficient use of capital.
The 2015 and 2023 Load Index per substation, should no interventions be made, is shown below:
Table 11: Load Index per Substation (Without Intervention)
Substation Voltage
kV
Load Index
2015 2023
Beech Street A 33/11 1 2
Beech Street B 132/11 1 2
City Road B 132/11 2 3
City Road C 132/11 4 5
Devonshire Square 132/11 1 2
Finsbury Market A 132/11 2 3
Finsbury Market B 33kV 132/33 4 5
Finsbury Market C 33kV 132/33 1 1
Finsbury Market D 33/11 1 1
Finsbury Market E 132/11 1 1
Osborn Street 33/11 4 5
Paternoster 33/11 1 1
Tooley St via Bankside 132/11 2 2
Bankside C Total 132/11 1 2
Bankside D 132/20 1 1

Regional Development Plan
City Road City of London (excluding 33kV)
All of the cost numbers displayed in this document are before the application of on-going efficiencies and real price effects.
Regional Development Plan Page 19 of 38
R X Peak
Make
RMS
Break
Peak
Make
Break
kV kA kA kA kA
Finsbury Market B 33kV FINB31 33 1.66 10.59 41.43 14.69 32.8 13.1
Finsbury Market C 33kV FINC31 33 1.48 11.41 39.05 14.27 32.8 13.1
Fault Rating
% on 100 MVA
base
Substation Node Name
Voltage
Level
System
Impedance
Existing
System Fault
3.4 Operational and Technical Constraints
1) There will be 62MVA of spare capacity available at Limeburner Lane Substation upon completion;
however open-cut cable routes to the west of the substation are not feasible due to the barrier created
by the Thameslink Railway Line. The City Road – Bankside tunnel system is the only route out in this
direction via an intermediate shaft in Farringdon Road. Space and thermal constraints in the City Road
– Limeburner Lane tunnel need to be carefully managed at this network critical pinch point.
2) The Finsbury Market C – Beech Street A – Paternoster 33kV fluid filled cables have a historically high
leak rate, with the Beech Street A – Paternoster section being in the worst 8% in the LPN area,
averaging 4,945 litres leaked per annum over the last decade. Recent repair work and deloading due to
a temporary load transfer from Paternoster to Bankside has seen this figure drop to 425 litres in 2012.
The Finsbury Market C – Beech Street A section is less urgent, with an average leak rate of 421 litres
per annum over the past decade.
3) The following 11kV feeder groups are on the Distribution Planning Hotspots List and are considered in
this document to identify synergies with the substation reinforcement needs of the area:
Seacoal Lane NS Group – Load will exceed N-1 firm capacity once already connected load ramps
up to its notified maximum demand
Paternoster NE Group – Feeder NE1 overloaded during a recent hot spell. This Solkor group shares
load unequally and needs to be reinforced
City Road B NE Group – There are a large amount of connections referrals allocated to this feeder
group. This will see the group fully loaded if these proceed. Reinforcement options are to be
investigated
City Road B N Group – Cable sections overloaded for an outage on feeder N4
Beech Street B SE Group – Small section conductor sections on feeders SE1 and SE5 overloaded
4) The following transformer replacement works need to be considered in conjunction with the
reinforcement needs for the area:
One of the four Paternoster 33/11kV transformers will require replacement due to condition in ED1
Two of the City Road B 132/11kV transformers will require replacement due to condition in ED1
One of the City Road C 132/11kV transformers will require replacement due to condition in ED1
5) The following switchgear is overstressed:
Table 12: Overstressed Switchgear
Note: The Finsbury Market C Switchgear is currently being replaced under scheme 5550 (covered in the
33kV Distribution Network RDP) which will resolve the fault level issue shown in the table above. The
Finsbury Market B fault level issue will be addressed as part of project 6135 (see 4.1.1 below).
6) The City Road – Finsbury Market 132kV circuits are in violation of Engineering Recommendation P18 –
Complexity of 132kV Circuits. Restriction B states that “Not more than three transformers shall be
banked together on any one circuit at any one site”. However, Finsbury Market has four banked
transformers on site (Substations A, B, C & E). Furthermore, these circuits are then double banked with
Devonshire Square and Hoxton transformers back at City Road GSP.

Regional Development Plan
City Road City of London (excluding 33kV)
All of the cost numbers displayed in this document are before the application of on-going efficiencies and real price effects.
Regional Development Plan Page 20 of 38
7) A schematic diagram of the existing City Road – Bankside tunnel can be found in Appendix D. While the
construction of this tunnel has been necessary to provide a means of capacity injection into the City of
London, it has also created a critical network operational and technical constraint.
The worst conceivable event would be a fire near the Farringdon – Limeburner Lane spur tunnel
section. This would result in the loss of 251MW of load, of which only 52MW can be restored from
alternative sources:
Table 13: Load at Risk for Tunnel HILP Event
3.5 National Grid
An application is to be made for a 4
th SGT at New Cross 132kV GSP to maintain (N-2) P2/6 compliance. A UK
Power Networks funded extension to the switchhouse will be required to accommodate National Grid's 132kV
circuit breaker. This project is covered in detail in the New Cross RDP.
Substation Loading (MW) Transferable (MW) Load Lost (MW)
Limeburner Lane 102 0 102
Paternoster 11 0 11
Bankside C 36 0 36
CoL 33kV Network 45 45 0
Plumtree Court 57 7 50
Total 251 52 199

Regional Development Plan
City Road City of London (excluding 33kV)
All of the cost numbers displayed in this document are before the application of on-going efficiencies and real price effects.
Regional Development Plan Page 21 of 38
4 Recommended Strategy
4.1 Asset Replacement
4.1.1 Finsbury Market B Install 33kV Auto Close Scheme
Finsbury Market B comprises 3x45MVA 132/33kV transformers which exceed the fault rating of network
switchgear when operated in parallel. This switchgear is Reyrolle L42, which is known to have capabilities in
excess of its nameplate rating data. However, Network Operations have been informed of the issue and are
currently managing the safety risk by imposing an access restriction on the above switchrooms.
Should any personnel be required to enter these switchrooms, then the network is first remotely switched so
that only two of the three transformers are run in parallel, thereby reducing the fault level to within the
switchgear limitations.
To increase utilisation of the transformer capacity and remove operational constraints it is proposed to install a
33kV auto-close scheme. Normal operation would be to run 2 transformers in parallel with the 3rd
supplying a
separate section of busbar. For the loss of a transformer the section and coupler circuit breakers would close.
The recommendation is therefore to tolerate the situation and manage the risk via access restriction until the
above projects are completed.
4.1.2 Finsbury Market B 33kV - Replace Grid Transformers (GT1B, GT2B, GT3B)
The condition assessment of the 1955/56/62 Fuller Electric 45MVA Grid Transformers with Brush HD/HS tap
changers installed at Finsbury Market B 132/33kV Grid Substation has shown that the probability of failure due
to degradation will become unacceptable. It is not possible to keep these assets in use without compromising
operational requirements; therefore this project recommends their replacement. Completion of the project will
see 3 Grid Transformers replaced with 3 new 45MVA Grid Transformers.
4.1.3 City Road C 11kV - Replace Grid Transformer (GT3)
The condition assessment of the 1980 Ferranti 60MVA Grid Transformer with Ferranti FC6 tap changer installed
at City Road C 132/11kV Grid Substation has shown that the probability of failure due to degradation will
become unacceptable (HI5 at the end of ED1). It is not possible to keep this asset in use without compromising
operational requirements; therefore this project recommends its replacement. Completion of the project will see
1 Grid Transformer replaced with 1 new 60MVA Grid Transformer.
4.1.4 Finsbury Market A 11kV - Replace Grid Transformer (GT2A)
The condition assessment of the 1961 Ferranti 15MVA Grid Transformer with Ferranti FC4 tap changer installed
at Finsbury Market A 132/11kV Grid Substation has shown that the probability of failure due to degradation will
become unacceptable (HI5 at the end of ED1). It is not possible to keep this asset in use without compromising
operational requirements; therefore this project recommends its replacement. Completion of the project will see
1 Grid Transformer replaced with 1 new 15MVA Grid Transformer.
4.1.5 Paternoster - Replace Primary Transformer (T4)
The condition assessment of the 1966 Ferranti 15MVA Primary Transformer with Ferranti DC3 tap changer
installed at Paternoster 33/11kV Primary Substation has shown that the probability of failure due to degradation
will become unacceptable (HI5 at the end of ED1). It is not possible to keep this asset in use without

Regional Development Plan
City Road City of London (excluding 33kV)
All of the cost numbers displayed in this document are before the application of on-going efficiencies and real price effects.
Regional Development Plan Page 22 of 38
compromising operational requirements; therefore this project recommends its replacement. Completion of the
project will see 1 Primary Transformer replaced with 1 new 15MVA Primary Transformer.
4.1.6 Finsbury Market A 11kV - Refurbish Grid Transformers (GT1A, GT3A)
The condition assessment of the 1961/62 Ferranti Grid Transformers with Ferranti FC4 tap changers installed at
Finsbury Market A 132/11kV Grid Substation has shown that the probability of failure due to degradation will
become unacceptable (HI4 at the end of ED1). It is not possible to keep these assets in use without
compromising operational requirements; therefore this project recommends their refurbishment. Completion of
the project will see 2 Grid Transformers refurbished. As aforementioned, GT2A will be replaced due to asset
condition.
4.1.7 City Road B 11kV - Refurbish Grid Transformers (GT1, GT2)
The condition assessment of the 1979 Ferranti Grid Transformers with Ferranti FC6 tap changers installed at City Road B 132/11kV Grid Substation has shown that the probability of failure due to degradation will become unacceptable (HI4 at the end of ED1). It is not possible to keep these assets in use without compromising operational requirements; therefore this project recommends their
refurbishment. Completion of the project will see 2 Grid Transformers refurbished.4.2 Reinforcement
4.2.1 Ludgate Circus: Establish 11kV Site
Due to organic load growth and small connections activity in the Central London areas bordered by Bankside C,
South Bank, Seacoal Lane 11kV (Limeburner Lane), Paternoster and City Road substations; a significant
number of the 11kV feeder groups are approaching their capacity during periods of peak demand and hot spells
with some of them exceeding their firm capacity. The 11kV network in the area will need to be reinforced to
ensure continued security of supply whilst meeting customer power requirements within acceptable timescales.
11kV feeder panels to reinforce the interconnected feeder groups would have to be derived from the existing
substations but these sites are space constrained which restricts the ability to install additional panels to enable
the required reinforcement. The new Limeburner Lane 132/11kV Substation (a replacement for Seacoal Lane
11kV) will have 58MVA spare capacity available in summer on completion of the reinforcement project currently
underway (Project 2632); however open-cut cable routes to the west of the substation are unfeasible due to the
barrier created by the Thameslink Railway Line. The City Road-Bankside tunnel system is the only route out in
this direction via an intermediate shaft in Farringdon Road. Bankside C 132/11kV Substation has 100MVA spare
capacity available in summer. Space and thermal constraints in the City Road-Limeburner Lane tunnel need to
be carefully managed at this network critical pinch point and this requires limiting the number of 11kV circuits
installed in the tunnel.
This scheme allows for the civil modifications (required to avoid safety issues and further degradations of the
site resulting from trespassers or water ingress) of the Ludgate Circus toilet block in preparation of the proposed
establishment of a new 25-panel 11kV satellite switchboard fed from Limeburner Lane (via Seacoal-Farringdon
high level tunnel) and Bankside C (via Blackfriars Bridge). The close proximity of the intermediate shaft in
Farringdon Road and accessibility of Ludgate Circus via public roads significantly reduces the complexity and
risks of establishing new 11kV circuits to reinforce the existing network. Installation of this satellite switchboard
allows capacity from Limeburner Lane and Bankside C to be relocated to an area with limited capacity
headroom thereby facilitating the required network reinforcement. Installation of the 25-panel 11kV switchboard
will be under a different scheme in ED2 when the network needs to be reinforced.
Completion of this project will see a modified Ludgate Circus site ready to accept a new 25-panel, 2500A rated,
11kV single busbar switchboard in early ED2.
Regional Development Plan
City Road City of London (excluding 33kV)
All of the cost numbers displayed in this document are before the application of on-going efficiencies and real price effects.
Regional Development Plan Page 23 of 38
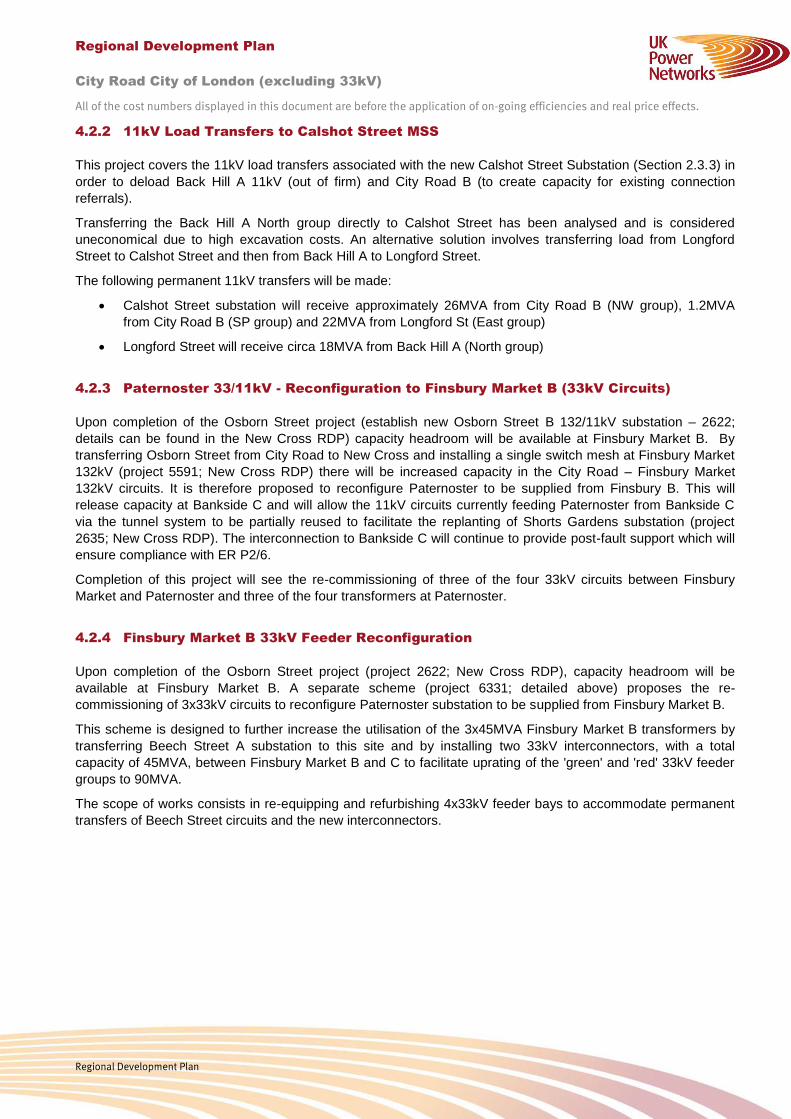
4.2.2 11kV Load Transfers to Calshot Street MSS
This project covers the 11kV load transfers associated with the new Calshot Street Substation (Section 2.3.3) in
order to deload Back Hill A 11kV (out of firm) and City Road B (to create capacity for existing connection
referrals).
Transferring the Back Hill A North group directly to Calshot Street has been analysed and is considered
uneconomical due to high excavation costs. An alternative solution involves transferring load from Longford
Street to Calshot Street and then from Back Hill A to Longford Street.
The following permanent 11kV transfers will be made:
Calshot Street substation will receive approximately 26MVA from City Road B (NW group), 1.2MVA
from City Road B (SP group) and 22MVA from Longford St (East group)
Longford Street will receive circa 18MVA from Back Hill A (North group)
4.2.3 Paternoster 33/11kV - Reconfiguration to Finsbury Market B (33kV Circuits)
Upon completion of the Osborn Street project (establish new Osborn Street B 132/11kV substation – 2622;
details can be found in the New Cross RDP) capacity headroom will be available at Finsbury Market B. By
transferring Osborn Street from City Road to New Cross and installing a single switch mesh at Finsbury Market
132kV (project 5591; New Cross RDP) there will be increased capacity in the City Road – Finsbury Market
132kV circuits. It is therefore proposed to reconfigure Paternoster to be supplied from Finsbury B. This will
release capacity at Bankside C and will allow the 11kV circuits currently feeding Paternoster from Bankside C
via the tunnel system to be partially reused to facilitate the replanting of Shorts Gardens substation (project
2635; New Cross RDP). The interconnection to Bankside C will continue to provide post-fault support which will
ensure compliance with ER P2/6.
Completion of this project will see the re-commissioning of three of the four 33kV circuits between Finsbury
Market and Paternoster and three of the four transformers at Paternoster.
4.2.4 Finsbury Market B 33kV Feeder Reconfiguration
Upon completion of the Osborn Street project (project 2622; New Cross RDP), capacity headroom will be
available at Finsbury Market B. A separate scheme (project 6331; detailed above) proposes the re-
commissioning of 3x33kV circuits to reconfigure Paternoster substation to be supplied from Finsbury Market B.
This scheme is designed to further increase the utilisation of the 3x45MVA Finsbury Market B transformers by
transferring Beech Street A substation to this site and by installing two 33kV interconnectors, with a total
capacity of 45MVA, between Finsbury Market B and C to facilitate uprating of the 'green' and 'red' 33kV feeder
groups to 90MVA.
The scope of works consists in re-equipping and refurbishing 4x33kV feeder bays to accommodate permanent
transfers of Beech Street circuits and the new interconnectors.
Regional Development Plan
City Road City of London (excluding 33kV)
All of the cost numbers displayed in this document are before the application of on-going efficiencies and real price effects.
Regional Development Plan Page 24 of 38
Cat. Reference Description 2013/14 2014/15 2015/16 2016/17 2017/18 2018/19 2019/20 2020/21 2021/22 2022/23
A 1.26.01.6135 Finsbury Market B Install 33kV Auto Close Scheme 0 9,057 122,265 3,474 0 0 0 0 0 0
A 1.51.01.7855
Finsbury Market B 33kV - Replace Grid Transformers
(GT1B, GT2B, GT3B) 0 0 0 0 76,656 2,771,861 1,385,927 0 0 0
A 1.51.01.7858 City Rd C 11kV - Replace Grid Transformer (GT3) 0 0 78,060 1,524,695 0 0 0 0 0 0
A 1.51.01.7860
Finsbury Market A 11kV - Replace Grid Transformer
(GT2A) 0 0 78,060 1,524,695 0 0 0 0 0 0
A 1.51.03.7870 Paternoster - Replace Primary Transformer (T4) 0 0 82,565 492,809 0 0 0 0 0 0
A 1.51.11.7852
Finsbury Market A 11kV - Refurbish Grid
Transformers (GT1A, GT3A) 0 0 164,621 125,379 0 0 0 0 0 0
A 1.51.11.7853
City Rd B 11kV - Refurbish Grid Transformers (GT1,
GT2) 0 0 0 0 0 0 0 0 163,009 214,028
R 1.33.03.6158 Ludgate Circus: Establish 11kV Site 0 0 0 0 0 0 0 0 185,100 1,506,108
R 1.34.02.8435 11kV Load Transfers to Calshot St MSS 0 0 0 0 962,951 577,770 0 0 0 0
R 1.35.02.6331
Paternoster 33/11kV - Reconfiguration to Finsbury
Market B (33kV circuits) 0 0 0 0 0 175,637 41,199 0 0 0
R 1.36.03.6156 Finsbury Market B 33kV Feeder Reconfiguration 0 0 0 184,692 821,422 132,485 0 0 0 0
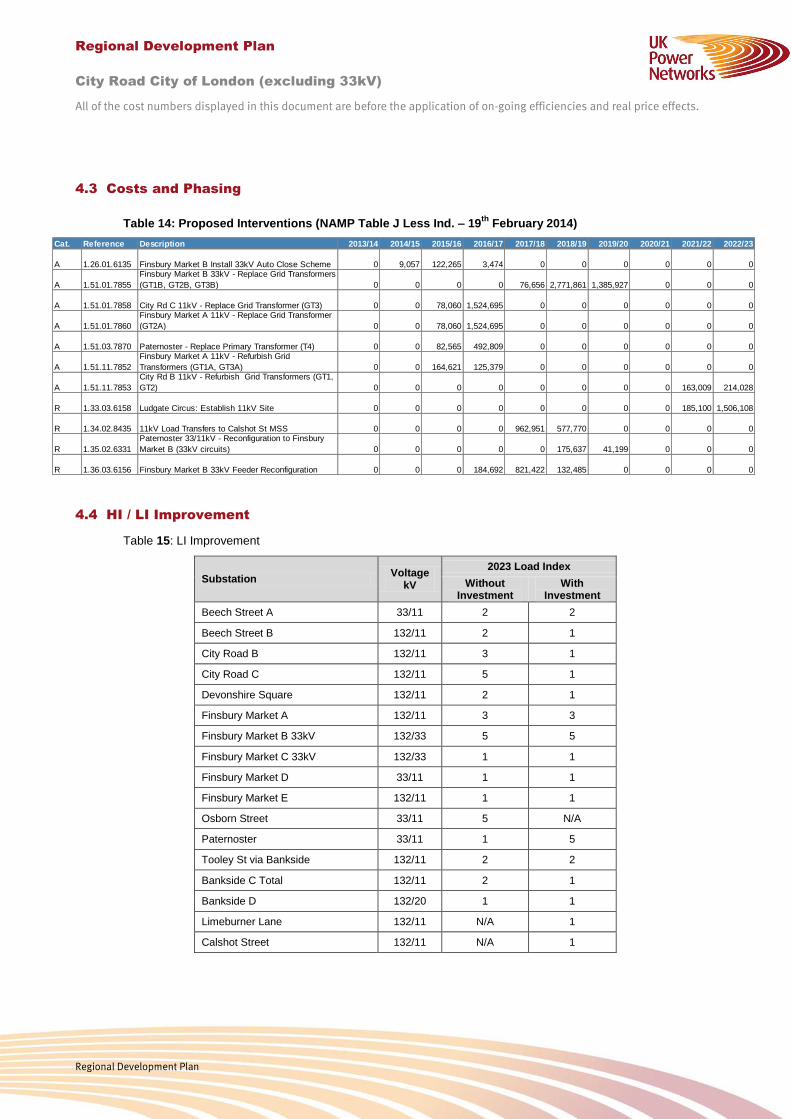
4.3 Costs and Phasing
Table 14: Proposed Interventions (NAMP Table J Less Ind. – 19th
February 2014)
4.4 HI / LI Improvement
Table 15: LI Improvement
Substation Voltage
kV
2023 Load Index
Without Investment
With Investment
Beech Street A 33/11 2 2
Beech Street B 132/11 2 1
City Road B 132/11 3 1
City Road C 132/11 5 1
Devonshire Square 132/11 2 1
Finsbury Market A 132/11 3 3
Finsbury Market B 33kV 132/33 5 5
Finsbury Market C 33kV 132/33 1 1
Finsbury Market D 33/11 1 1
Finsbury Market E 132/11 1 1
Osborn Street 33/11 5 N/A
Paternoster 33/11 1 5
Tooley St via Bankside 132/11 2 2
Bankside C Total 132/11 2 1
Bankside D 132/20 1 1
Limeburner Lane 132/11 N/A 1
Calshot Street 132/11 N/A 1

Regional Development Plan
City Road City of London (excluding 33kV)
All of the cost numbers displayed in this document are before the application of on-going efficiencies and real price effects.
Regional Development Plan Page 25 of 38
Health indices for all network equipment covered in this RDP with investments are listed in red font in Tables 16
to 21 below. The equipment groups covered include HV circuit breakers (6.6kV and 11kV), EHV circuit breakers
(33kV), 66kV&132kV circuit breakers, primary transformers (33/11/6.6kV), grid transformers (132/33/11kV) and
fluid filled cables (33kV).
Table 16: HV Circuit Breakers – HI Improvement with Intervention
2015 2023
Substation No. HI1 No. HI2 No. HI3 No. HI4 No. HI5 No. HI1 No. HI2 No. HI3 No. HI4 No. HI5
BEECH ST A 1 7 5 1 12
BEECH ST B 19 37 56
CITY RD B 11KV 8 48 54 2
CITY RD C 11KV 21 21
DEVONSHIRE SQ 54 24 30
FINSBURY MKT A 11KV 5 23 1 6 21
FINSBURY MKT D 11KV 14 14
FINSBURY MKT E 11KV 63 3 66
OSBORN ST 27
PATERNOSTER 21 6 27
SEACOAL LANE 11KV 7 9 22
PLUMTREE COURT 11kV 31
LIMEBURNER LANE 11KV 54 14
CALSHOT ST 11KV 30

Regional Development Plan
City Road City of London (excluding 33kV)
All of the cost numbers displayed in this document are before the application of on-going efficiencies and real price effects.
Regional Development Plan Page 26 of 38
Table 17: EHV Circuit Breakers - HI Improvement with Intervention
2015 2023
Substation No. HI1 No. HI2 No. HI3 No. HI4 No. HI5 No. HI1 No. HI2 No. HI3 No. HI4 No. HI5
FINSBURY MARKET B 33KV 1 4 10 5 14
FINSBURY MARKET C 33KV 1 12 7 6
HOXTON 33KV 2 2
MANSELL ST (LUL) 22KV 4 4
LIMEBURNER LANE 11KV 3
CALSHOT ST 11KV 2
Table 18: 66 and 132kV Circuit Breakers - HI Improvement with Intervention
2015 2023
Substation No. HI1 No. HI2 No. HI3 No. HI4 No. HI5 No. HI1 No. HI2 No. HI3 No. HI4 No. HI5
CITY ROAD 132KV 1 19 15 5
SHOREDITCH 66KV 1 5
Table 19: Primary Transformers - HI Improvement with Intervention
2015 2023
Substation No. HI1 No. HI2 No. HI3 No. HI4 No. HI5 No. HI1 No. HI2 No. HI3 No. HI4 No. HI5
BEECH ST A 2 2
FINSBURY MKT A 11KV 1 1
FINSBURY MKT D 11KV 3 1 2
OSBORN ST 4
PATERNOSTER 1 1 3
Table 20: Grid Transformers - HI Improvement with Intervention
2015 2023
Substation No. HI1 No. HI2 No. HI3 No. HI4 No. HI5 No. HI1 No. HI2 No. HI3 No. HI4 No. HI5
BEECH STREET B 3 3
CANAL STREET 2 2
CITY ROAD B 11KV 1 1 2
CITY ROAD C 11KV 1 1 1 1
DEVONSHIRE SQ 3 1 2
FINSBURY MARKET B 33KV 1 1 1 3
FINSBURY MARKET C 33KV 1 2 1 2
FINSBURY MKT A 11KV 2 1 1 2
FINSBURY MKT E 11KV 1 2 3
HOXTON 33KV 1 1
MANSELL ST (LUL) 22KV 2 2
LIMEBURNER LANE 11KV 3

Regional Development Plan
City Road City of London (excluding 33kV)
All of the cost numbers displayed in this document are before the application of on-going efficiencies and real price effects.
Regional Development Plan Page 27 of 38
CALSHOT ST 11KV 2
Table 21: Fluid Filled Cables - HI Improvement with Intervention
Section (Route) Cable Section Voltage
kV 2015
HI 2023
HI
BEECH ST A-PATERNOSTER CABLE SECTION: 04070476-1-A 33 2 3
BEECH ST A-PATERNOSTER CABLE SECTION: 04070476-2-A 33 2 3
BEECH ST A-PATERNOSTER CABLE SECTION: 04070476-3-A 33 2 3
BEECH ST A-PATERNOSTER CABLE SECTION: 04070476-4-A 33 2 3
FINSBURY MARKET B 33KV-WHISTON RD CABLE SECTION: 34290495-1-A 33 3 3
FINSBURY MARKET B 33KV-WHISTON RD CABLE SECTION: 34290495-2-A 33 2 3
FINSBURY MARKET B 33KV-WHISTON RD CABLE SECTION: 34290495-3-A 33 2 2
FINSBURY MARKET B 33KV-WHISTON RD CABLE SECTION: 34290495-4-A 33 2 2
FINSBURY MARKET C 33KV-BEECH ST A CABLE SECTION: 34320407-1-A 33 2 3
FINSBURY MARKET C 33KV-BEECH ST A CABLE SECTION: 34320407-2-A 33 2 3
FINSBURY MARKET C 33KV-BEECH ST A CABLE SECTION: 34320407-3-A 33 2 3
FINSBURY MARKET C 33KV-BEECH ST A CABLE SECTION: 34320407-4-A 33 2 3
Notes: 1) Limeburner Lane and Calshot Street substations as well as Plumtree Court switching station will be
commissioned within ED1; 2) Seacoal Lane will be replaced by Limeburner Lane and Osborn Street will be
replanted at 132kV and fed from New Cross GSP; 3) Shoreditch 66kV switching station will be decommissioned
within ED1 as part of the works to replant Hearn Street at 132kV (scheme 3657; details in New Cross RDP); 4)
Paternoster will return to its initial state by the end of ED1 (4x33/11kV transformers) and will pick up the demand
currently covered by 3x11kV circuits from Bankside C.

Regional Development Plan
City Road City of London (excluding 33kV)
All of the cost numbers displayed in this document are before the application of on-going efficiencies and real price effects.
Regional Development Plan Page 28 of 38
5 Rejected Strategies
The following options were considered for the aforementioned reinforcement schemes:
5.1 Calshot Street: Establish 2x66MVA 132/11kV Substation
Rejected Option 1: Build a new 132/11kV main substation (2x33MVA transformers).
This option is rejected as it does not solve the loading issues of the surrounding substations. The proposed
substation would only have a summer firm capacity of 42MVA and could only accept one 11kW group (Back Hill
11kW North Group). Space on site is very restricted, so there would be no opportunity to install a future third
transformer.
Rejected Option 2: Reinforce Back Hill A 11kV and City Road B 11kV.
Both sites have insufficient space to accommodate the necessary additional equipment. Furthermore, it has been identified that even if the transformer capacity is increased, there would still be problems accessing the new capacity (difficulty to get new cables out of the substations).
5.2 Plumtree Court - 11kV Switchboard Extension
Rejected Option: Extend customer switchboard by 21 additional panels.
This option includes extending the proposed customer switchboard by 21 panels, allowing for City Road North
group to also be transferred to the new switchboard. This option was rejected due to space constraints at the
customer site.
5.3 Ludgate Circus: Establish 11kV Site
Rejected Option: Install reinforcement 11kV cables in the City Road-Bankside/Limeburner Lane tunnel system.
This option involves installing additional 11kV cables in the City Road-Bankside/Limeburner Lane tunnel system
utilising the existing feeder panels for use in reinforcing interconnected feeder groups in the area around
Ludgate Circus. Installation of additional 11kV cables in the tunnel is not feasible due to thermal constraints. All
the cables in the tunnel will assume lower ratings due to overheating as they will operate in a higher ambient
temperature environment. This will result in no benefit being derived from installation of the additional 11kV
cables and it will create bottlenecks for the existing cables. Furthermore, due to a limited number of spare
feeder panels and space constraints to extend switchboards at Bankside C, South Bank, Seacoal Lane 11kV
(Limeburner Lane), Paternoster and City Road substations, 11kV feeders on their own will not provide adequate
capacity for the required reinforcement. This option has therefore been rejected on technical and feasibility
grounds.
5.4 Paternoster 33/11kV - Reconfiguration to Finsbury Market B (33kV Circuits)
Rejected Option: Create additional capacity for London by upgrading Paternoster to a 132/11kV, 3x33.3MVA
substation fed from Limeburner Lane.
This option is for the removal of the existing four 33/11kV transformers and the installation of 3x132/11kV
33.3MVA transformers. The transformers will be fed from Limeburner Lane by three new 132kV circuits run
through the tunnel connecting these sites. The length of the new circuits will be approximately 300m each. This
option is rejected on the basis of cost, complexity and technical grounds (height restriction within the
transformers chambers).
Regional Development Plan
City Road City of London (excluding 33kV)
All of the cost numbers displayed in this document are before the application of on-going efficiencies and real price effects.
Regional Development Plan Page 29 of 38
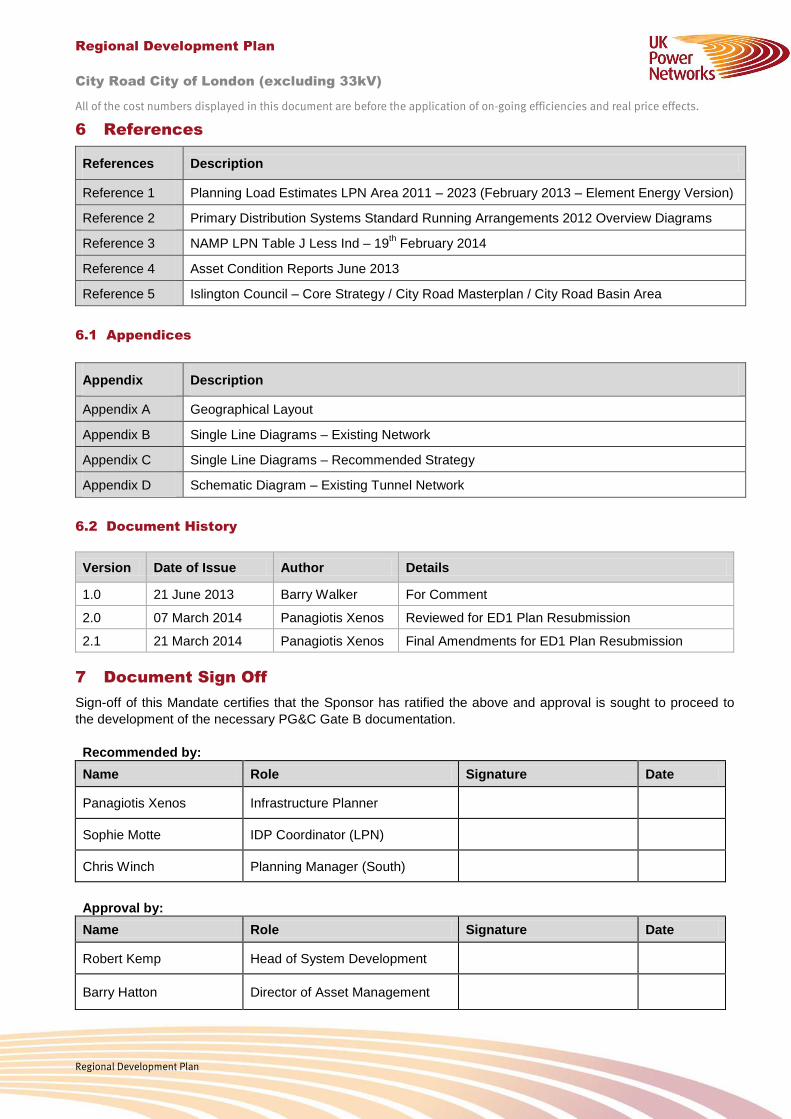
6 References
References Description
Reference 1 Planning Load Estimates LPN Area 2011 – 2023 (February 2013 – Element Energy Version)
Reference 2 Primary Distribution Systems Standard Running Arrangements 2012 Overview Diagrams
Reference 3 NAMP LPN Table J Less Ind – 19th February 2014
Reference 4 Asset Condition Reports June 2013
Reference 5 Islington Council – Core Strategy / City Road Masterplan / City Road Basin Area
6.1 Appendices
Appendix Description
Appendix A Geographical Layout
Appendix B Single Line Diagrams – Existing Network
Appendix C Single Line Diagrams – Recommended Strategy
Appendix D Schematic Diagram – Existing Tunnel Network
6.2 Document History
Version Date of Issue Author Details
1.0 21 June 2013 Barry Walker For Comment
2.0 07 March 2014 Panagiotis Xenos Reviewed for ED1 Plan Resubmission
2.1 21 March 2014 Panagiotis Xenos Final Amendments for ED1 Plan Resubmission
7 Document Sign Off
Sign-off of this Mandate certifies that the Sponsor has ratified the above and approval is sought to proceed to
the development of the necessary PG&C Gate B documentation.
Recommended by:
Name Role Signature Date
Panagiotis Xenos Infrastructure Planner
Sophie Motte IDP Coordinator (LPN)
Chris Winch Planning Manager (South)
Approval by:
Name Role Signature Date
Robert Kemp Head of System Development
Barry Hatton Director of Asset Management

Regional Development Plan
City Road City of London (excluding 33kV)
All of the cost numbers displayed in this document are before the application of on-going efficiencies and real price effects.
Regional Development Plan Page 30 of 38

Regional Development Plan
City Road City of London (excluding 33kV)
All of the cost numbers displayed in this document are before the application of on-going efficiencies and real price effects.
Regional Development Plan Page 31 of 38
Appendix A: Geographical Layout

Regional Development Plan
City Road City of London (excluding 33kV)
All of the cost numbers displayed in this document are before the application of on-going efficiencies and real price effects.
Regional Development Plan Page 32 of 38
Appendix B: Single Line Diagrams – Existing Network (continued overleaf)

Regional Development Plan
City Road City of London (excluding 33kV)
All of the cost numbers displayed in this document are before the application of on-going efficiencies and real price effects.
Regional Development Plan Page 33 of 38

Regional Development Plan
City Road City of London (excluding 33kV)
All of the cost numbers displayed in this document are before the application of on-going efficiencies and real price effects.
Regional Development Plan Page 34 of 38

Regional Development Plan
City Road City of London (excluding 33kV)
All of the cost numbers displayed in this document are before the application of on-going efficiencies and real price effects.
Regional Development Plan Page 35 of 38
Appendix C: Single Line Diagrams – Recommended Strategy (continued overleaf)

Regional Development Plan
City Road City of London (excluding 33kV)
All of the cost numbers displayed in this document are before the application of on-going efficiencies and real price effects.
Regional Development Plan Page 36 of 38

Regional Development Plan
City Road City of London (excluding 33kV)
All of the cost numbers displayed in this document are before the application of on-going efficiencies and real price effects.
Regional Development Plan Page 37 of 38
Note: The above diagrams illustrate the proposed network changes marked in red and blue depicting
reinforcement works and asset health driven works respectively. Detailed drawings can be found in the
individual reinforcement scheme papers.

Regional Development Plan
City Road City of London (excluding 33kV)
All of the cost numbers displayed in this document are before the application of on-going efficiencies and real price effects.
Regional Development Plan Page 38 of 38
Appendix D: Schematic Diagram – Existing Tunnel Network
Note: Limeburner Lane Substation (ex-Seacoal Lane) will be commissioned in 2015.
Paternoster
Limeburner Lane
Plumtree Court
Bankside
To Fisher Street
via Kingsw
ay and
Shorts G
ardens
To
City R
oa
d
& B
ack H
ill
33kV Network
Th
am
eslin
k B
ox
To Finsbury
Market C via
Beech St A