Embed Size (px)
Citation preview
Title Changes of vocal function in teachers during their career life
Author(s) Cheung, Man-lee, Milie; 張文莉
CitationCheung, M. M. [張文莉]. (2012). Changes of vocal function inteachers during their career life. (Thesis). University of HongKong, Pokfulam, Hong Kong SAR.
Issued Date 2012
URL http://hdl.handle.net/10722/237896
Rights
This work is licensed under a Creative Commons Attribution-NonCommercial-NoDerivatives 4.0 International License.; Theauthor retains all proprietary rights, (such as patent rights) andthe right to use in future works.
Changes of vocal function in teachers during their career life
Millie, Cheung Man Lee
A dissertation submitted in partial fulfillment of the requirements for the Bachelor of Science
(Speech and Hearing Sciences), The University of Hong Kong, June 30, 2012

Changes of vocal 2
Abstract
This project aimed 1) to investigate the change of vocal function in teachers over time with
voice intervention provided and 2) to compare the self-perceived quality of life (QoL)
between the practicing teachers and student teachers. The project consisted of two
prospective studies, in which practicing teachers (study 1) and student teachers (study 2) were
recruited as subjects respectively. In study 1, the subjects were randomly assigned to two
groups: voice training group and no-training group. In study 2, the subjects were randomly
assigned to three groups: vocal hygiene (VH) group, vocal hygiene and voicing technique
training (VHT) group, and no-training group. Participants in the intervention groups were
invited to attend the corresponding training workshops respectively. In both studies, results
demonstrated no significant positive change of vocal function in subjects after intervention
provided. Also, no significant difference was found between the practicing teachers and
student teachers on the self-perceived QoL. These findings did not support the hypotheses
that 1) interventions with vocal hygiene education would lead to significant positive change
in vocal function, and 2) the student teachers would have a better self-perceived QoL than the
practicing teachers.

Changes of vocal 3
Teachers are among one of the most vocally demanding occupational groups (Yiu &
Chan, 2005). They are at increased risk of having voice disorders and high prevalence of
voice disorders among teachers has been reported. Munier and Kinsella (2008) reported the
prevalence rate of voice problems among teachers was 80% in North County Dublin;
Angelillo, Di Maio, Costa, Angelillo and Barillari (2009) reported 60% of the teachers in
Italy had voice problems. In Hong Kong, voice disorders are also common among teachers:
An earlier local study revealed that about 18% of the patients with voice disorder who seek
the public speech therapy clinic in Hong Kong are teaching professionals (Yiu & Ho, 1991).
More recently, Lee, Lao and Yu (2010) reported the prevalence of voice disorders among
primary school teachers in Hong Kong to be 70%. Similarly, Chong and Chan (2010)
reported that around 74% of the primary and secondary school teachers in Hong Kong had
voice problems. Yiu and Chan (2005) estimated that around one-third of the local teachers
are having voice problems, with about 13% percent of them took at least one day off work
per year because of the voice problems. This represented at least a HK$6.7 million loss in
salary per annual (Yiu & Chan, 2005).
It has been suggested that teachers’ voice problems usually appear after several years of
work (Simberg, Laine, Sala & Ronnemaa, 2000). In Hong Kong, the percentage of
prospective teachers who have voice problems increased from 15.4% to 36.5% within a
three-year period of time starting from the first year of teaching (Yiu & Chan, 2005). This
means a more than double increase in the prevalence rate.
Voice problems in teachers during their career life
The high prevalence rate of voice disorders in teachers reflects the significant magnitude
of the problem in the overall teaching population. Yet, it did not reflect the population
distribution of the problem at different stage of their career life. Therefore, comparison of
voice between student teachers and practicing teachers would be useful to determine the most

Changes of vocal 4
affected group in the teaching population. This can also help reveal the development of voice
problems in the career life of teachers.
Intervention programs of voice
In Hong Kong, no compulsory course on voice protection is offered to teachers (Yiu &
Chan, 2005). To improve the situation of the high prevalence rate of voice problems in
teachers, it is important to develop the intervention programs for the local teachers.
Vocal education programs was found to be effective in preventing the emergence of the
vocal problems as it can increase the clients’ awareness of the voice problems so that they
can seek early intervention (Bovo, Galceram, Pertruccelli & Hatzopoulos, 2007). One
important element in the vocal education programs is the vocal hygiene education. Several
studies have been aimed to investigate the efficacy of the vocal hygiene programs: Chan
(1994) reported that kindergarten teachers who received the vocal hygiene education program
showed significant voice improvement afterwards. In this study, however, only female
subjects were included. Bovo et al. (2007) investigated the effectiveness of a preventive voice
program with vocal hygiene education in kindergarten and primary school teachers, and
positive effect was shown. Pasa, Oates and Dacakis (2007) also found that preventive voice
intervention with vocal hygiene training was likely to be effective for primary school teachers.
Yet, objective measurements of the vocal function (such as phonetogram) were limited in
these studies. Overall, vocal hygiene education was effective for the teaching population. Yet,
due to the limitation in subject selection and the choices of outcome measures, the findings
were difficult to be generalized to different situation (e.g., effect of the vocal hygiene
education program on the change of vocal function in primary and secondary teachers in
Hong Kong).
Changes of vocal 5
Voice and quality-of-life
Voice has been described as multidimensional in nature and voice disorders can lead to
physical and functional impairment, such as organic changes of the vocal folds, vocal fatigue
and throat discomfort. Voice problems also affect communication (daily and/or social),
reduce ones’ job performance, and may even lead to unemployment. All these can have
adverse psychological impacts on the person (Van Houtte, Claeys, Wuyts & Van Lierde,
2011).
Clinical evaluation of voice involves assessing the voice quality (using acoustic
measures and auditory-perceptual measures); the vocal function (using voice range profile,
videostroboscopy, and/or aerodynamic measures); and quality of life (QoL) measurements
(Chan, 2008). Among the measures, the voice quality and vocal function evaluations involve
the objective instrumental measurements and the professional judgment of the clinicians,
which have been frequently applied in the clinical practice. Yet, the self-evaluation of voice
using QoL protocols was also suggested to be a significant measure as its result can reflect
the clients’ own perception about the problem, which would be one of the major
considerations for choosing the intervention approaches (Ilomäki et al., 2009).
Attempts have been made to correlate the self-perceived voice-related QoL with the
voice quality and/or the vocal function measures (Bassi et al., 2011; Hummel, Scharf,
Schuetzenberger, Graessel & Rosanowski, 2010; Ilomäki et al., 2009; Wuyts et al., 2000).
Yet, foci were usually put on the voice quality measures, while studies related to the vocal
function measures, including objective measurements such as the voice range profile
measures, were limited. Moreover, some of these studies focused on only one objective
measure instrument (Hummel et al., 2010; Wuyts et al., 2000) and others adopted strict
inclusion criteria for sampling (e.g., female teachers only) (Bassi et al., 2011; Ilomäki et al.,

Changes of vocal 6
2009). These made it difficult to generalize the findings to different condition (e.g., the
situation in male teachers).
More importantly, the conclusion about the relationship between the self-perception
measures and the objective and/or subjective measures of voice remains controversial. Thus,
clients’ perception of voice problems could be unrelated from the commonly assessed voice
parameters (Bassi et al., 2011; Hummel et al., 2010; Ilomäki et al., 2009; Wuyts et al., 2000).
For this reason, obtaining information from all types of clinical evaluations of voice would be
important during the investigation of voice problems. Any similarities or discrepancies
between the clients’ perception of his/her voice problem and the objective measures of voice
impairment severity will provide a more client-centered perspective for the development of
an appropriate intervention program, which can therefore address the client’s concerns of
voice disorders more comprehensively. This may include intervention covering areas at the
activity and participation levels rather than just tackling the problem at the impairment level
(Ma & Yiu, 2001).
The primary objective of this study was to investigate the change of vocal function in
practicing teachers and student teachers over time with voice intervention provided. The
second objective was to compare between the practicing teachers and student teachers on the
self-perceived voice-related QoL measurements.
In measuring QoL, a number of outcome measures have been used.
QoL measures
Voice Handicap Index (VHI) is one of the most psychometrically robust and well
studied instruments (Franic, Bramlett & Bothe, 2005) for measuring how voice problem
affects ones’ in physical, emotional and functional domains. The Cantonese version of
VHI-30 showed high reliability and validity in the Cantonese population (Lam et al., 2006).
The VHI-30 is a 30-item questionnaire which can be divided into three parts. Each part of the

Changes of vocal 7
questionnaire made up of 10 questions. The three parts of questions help investigate the
effects of voice disorders on a person’s functional, physical and emotional aspects during
social and daily communication respectively. A five-point ordinal rating scale was used, with
the answer “Never” equals a score of 0 and “Always” equals a score of 4. In general, the
higher the VHI scores, the greater effects of voice disorders on a person (Lam et al., 2006).
Voice Activity and Participation Profile (VAPP) is a well validated measure (Ma & Yiu,
2001) to evaluate the self-perceived severity of the voice problem and their self-perceived
impact of voice disorders on several areas (e.g., job) (Yiu, Wei, van Hasselt & Wong, 2007).
VAPP assesses the impact of voice disorders on ones’ life at the activity and participation
levels, following the International Classification of Functioning (World Health Organization,
2001) literature. The VAPP comprised five sections with a total of 28 items. The subjects’
self-rated severity of the voice problems and their self-perception about the impact of voice
problems on four aspects, including job, daily communication, social communication and
emotion were evaluated in the five sections respectively. An equal-appearing interval (EAI)
rating scale with ten-point was used in the Cantonese version of VAPP (Ma & Yiu, 2001).
Risk assessment
Voice risk calculator (VRC) is an instrument that evaluates ones’ vocal status, amount
of vocal use and physiological condition for identifying any possible risk factors that are
associated with the development of voice problem (Ho, 2011). The VRC consisted of 40
questions and a section for obtaining the demographic information. The questions can be
divided into three parts: The first part consisted of questions which sought the subjects’
self-perceived vocal status. Any present of vocal symptoms were also identified in this part.
A five-point ordinal rating scale was used for judging the vocal condition, with the
description “very severe” given a score of 4 and “very good” given a score of 0. A total of
four questions made up this part. The second part is made up of twenty-six questions. In this

Changes of vocal 8
part, the subjects’ amount of voice use for occupational needs and daily usage was
investigated. The possible risks factors associate with voice problems were also identified.
Text responses and a five-point ordinal rating scale (point “0” = “never” and point “4” =
“always”) were used to evaluate the amount of voice use. The last part, which contained 10
items, required the respondents to report their general and voice-related physiological
condition in the past 6 months to 1 year. In general, the higher the VRC scores, the greater
risk of a person to have the voice disorders (Ho, 2011).
Survey for obtaining background information from teachers
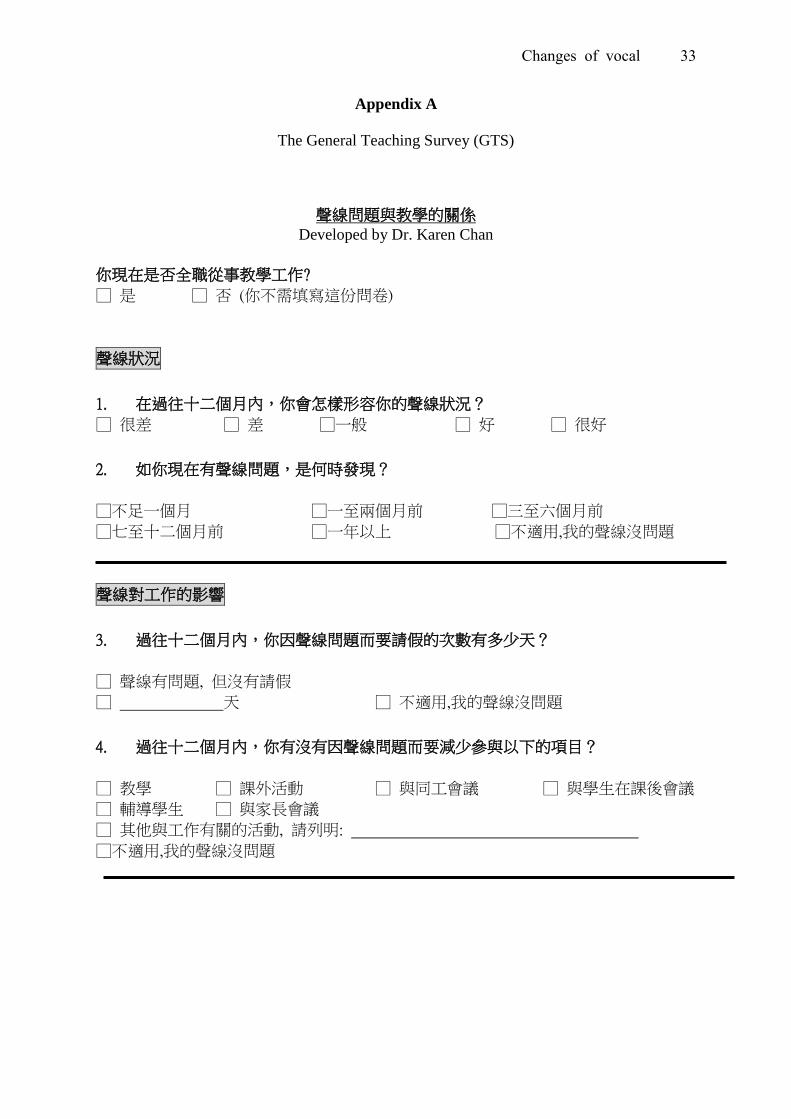
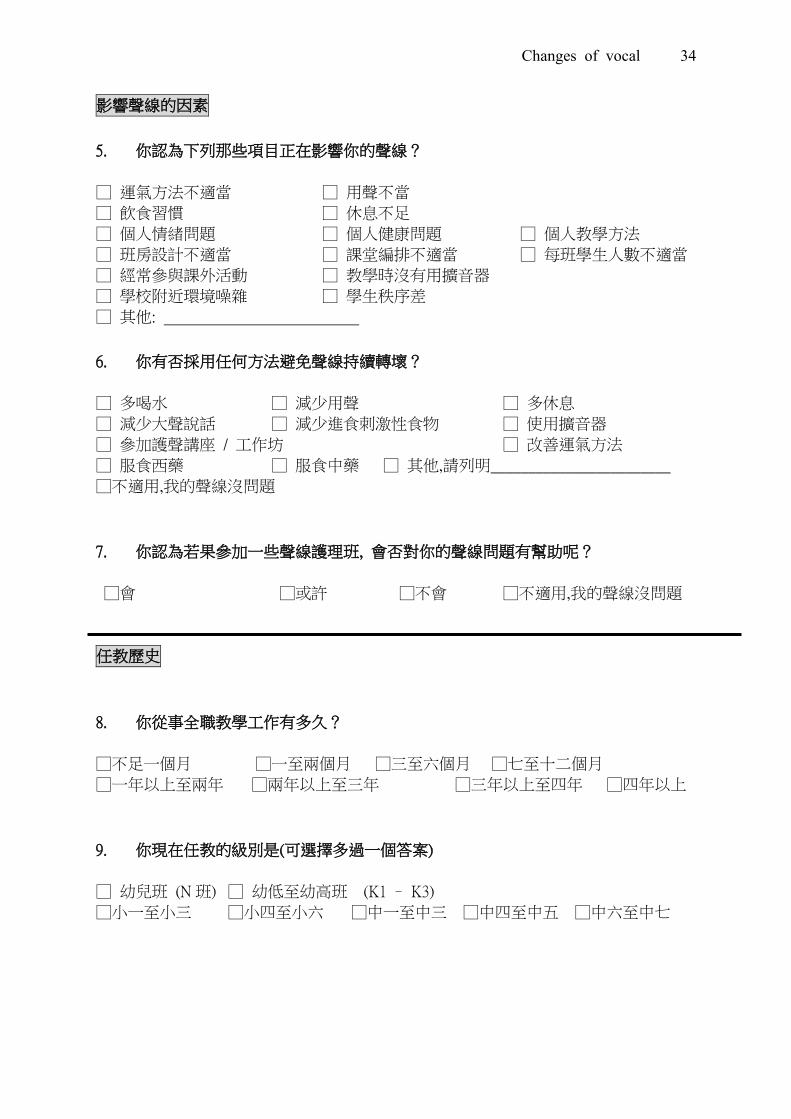
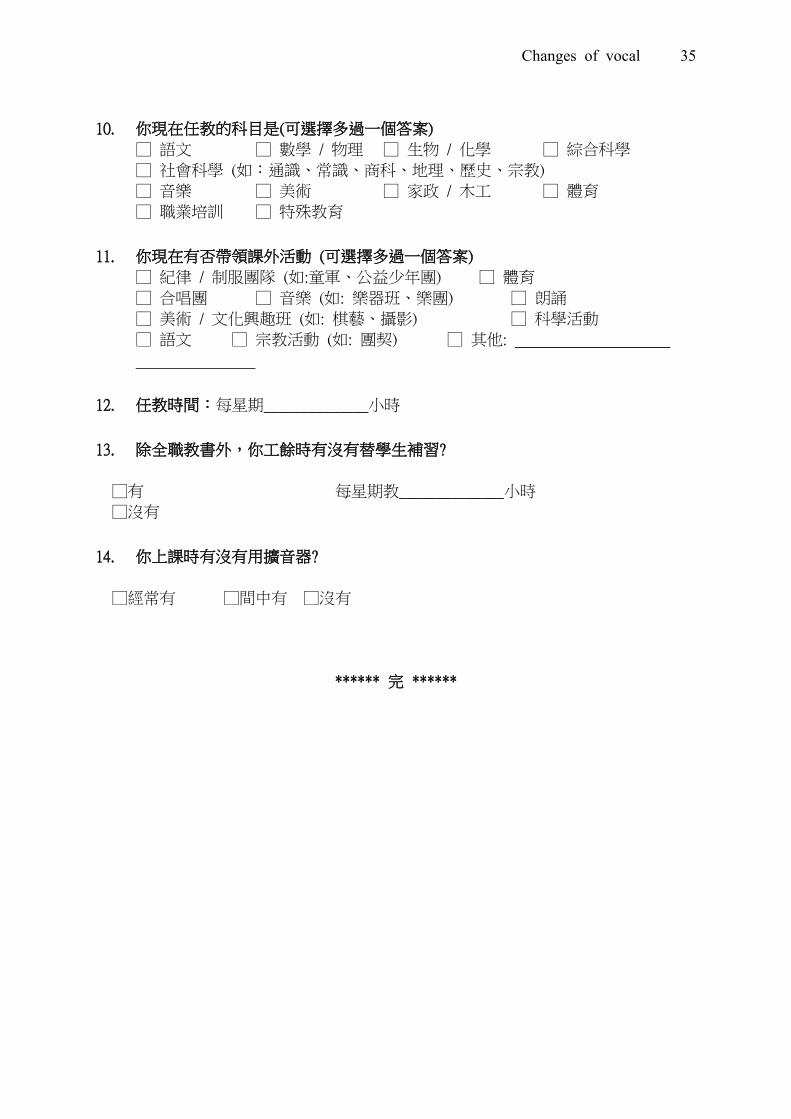
General Teaching Survey (GTS) is a newly developed instrument for teachers in this
project. It was designed to obtain their background information (mainly voice-related), which
can be used to evaluate the relationship between their work and the voice problems. The
questions were chosen to reflect the teaching duties and the teaching environment, which
have been reported in the literature that might affect the voice quality (Lindstrom, Waye,
Södersten, McAllister & Ternström, 2011).
The GTS is a 14-item questionnaire with four sections, which investigated information
about the recent voice condition, the effect of voice problems on work, factors that influence
the voice and the teaching history of the respondents respectively. No total GTS score was
supposed to be generated. However, nominal rating scales were applied in some items of the
survey. For example, for the description of the recent voice condition, five choices were
given, which are “very poor”, “poor”, “fair”, “good”, “very good”. (Appendix A)
In addition, a number of instrumental measurements were also used to measure the
outcome.
Vocal function measures
Voice range profile (VRP) has been found to be a useful tool to detect improvement of
vocal function due to the voice training (Speyer, Wieneke, van Wijck-Warnaar & Dejonckere,

Changes of vocal 9
2003). It provides quantitative evaluations of the voice training using several voice
measurements, which includes the maximum frequency, the minimum frequency, the
maximum intensity, the minimum intensity and the profile area. Among these parameters, it
has been suggested the maximum frequency and maximum intensity are two of the key
predictors of voice training (Siupsinskiene & Lycke, 2011).
Videostroboscopic images provide qualitative evaluation of vocal fold condition and
movement (Rosen, 2005). The vocal fold condition is a direct reflection of the health of
larynx.
Methods
To investigate the change of vocal function in the practicing teachers and student
teachers overtime (the primary objective) and to compare between the practicing teachers and
student teachers on the self-perceived voice-related QoL measurements (the second
objective), the project consisted of two prospective studies, in which practicing teachers and
student teachers were recruited as the subjects respectively. In both studies, interventions that
involved vocal hygiene education were adopted. Yet, the content of the intervention programs
varied among groups and different outcome measures were performed in the two studies. The
details are as follows:
Study 1 (change of voice condition in practicing teachers)
Participants
A total of 115 full-time practicing teachers were recruited from two kindergartens, one
primary school, two secondary schools and two special schools in Hong Kong. The subjects
were randomly assigned to two groups: 1) an experimental group, in which subjects were
provided with voice training (Group VT); and 2) a no-training group (Group NT).
Changes of vocal 10
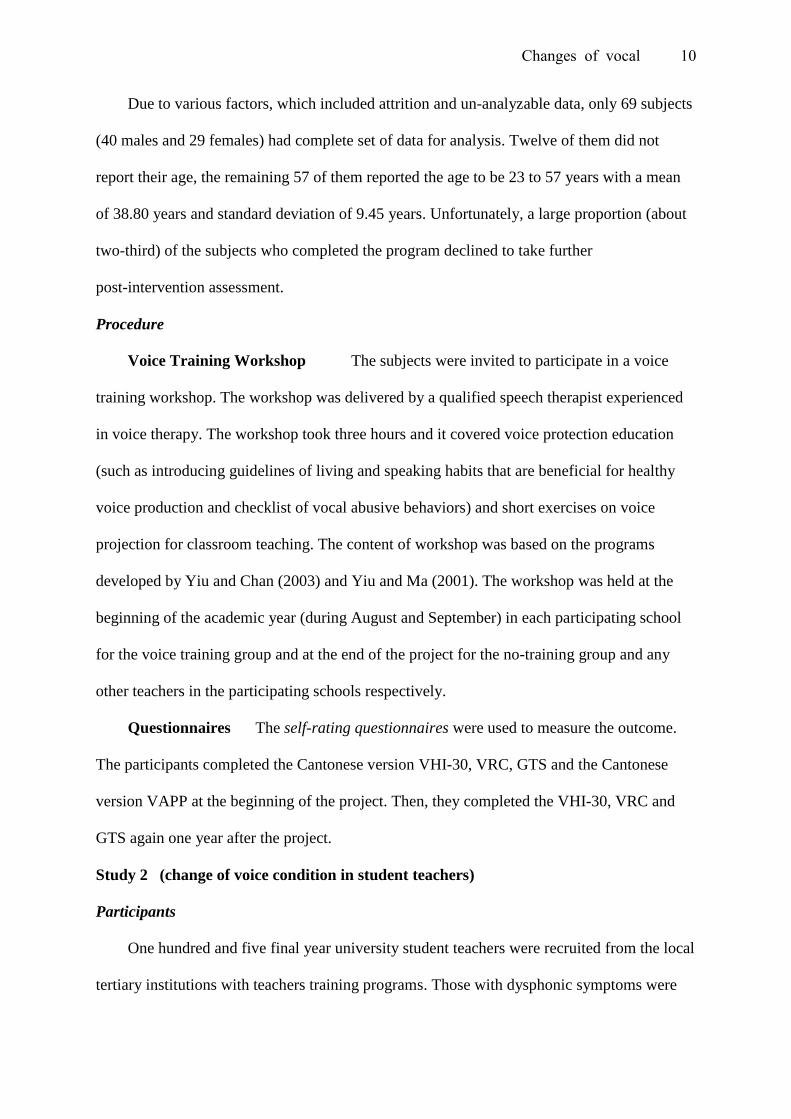
Due to various factors, which included attrition and un-analyzable data, only 69 subjects
(40 males and 29 females) had complete set of data for analysis. Twelve of them did not
report their age, the remaining 57 of them reported the age to be 23 to 57 years with a mean
of 38.80 years and standard deviation of 9.45 years. Unfortunately, a large proportion (about
two-third) of the subjects who completed the program declined to take further
post-intervention assessment.
Procedure
Voice Training Workshop The subjects were invited to participate in a voice
training workshop. The workshop was delivered by a qualified speech therapist experienced
in voice therapy. The workshop took three hours and it covered voice protection education
(such as introducing guidelines of living and speaking habits that are beneficial for healthy
voice production and checklist of vocal abusive behaviors) and short exercises on voice
projection for classroom teaching. The content of workshop was based on the programs
developed by Yiu and Chan (2003) and Yiu and Ma (2001). The workshop was held at the
beginning of the academic year (during August and September) in each participating school
for the voice training group and at the end of the project for the no-training group and any
other teachers in the participating schools respectively.
Questionnaires The self-rating questionnaires were used to measure the outcome.
The participants completed the Cantonese version VHI-30, VRC, GTS and the Cantonese
version VAPP at the beginning of the project. Then, they completed the VHI-30, VRC and
GTS again one year after the project.
Study 2 (change of voice condition in student teachers)
Participants
One hundred and five final year university student teachers were recruited from the local
tertiary institutions with teachers training programs. Those with dysphonic symptoms were
Changes of vocal 11
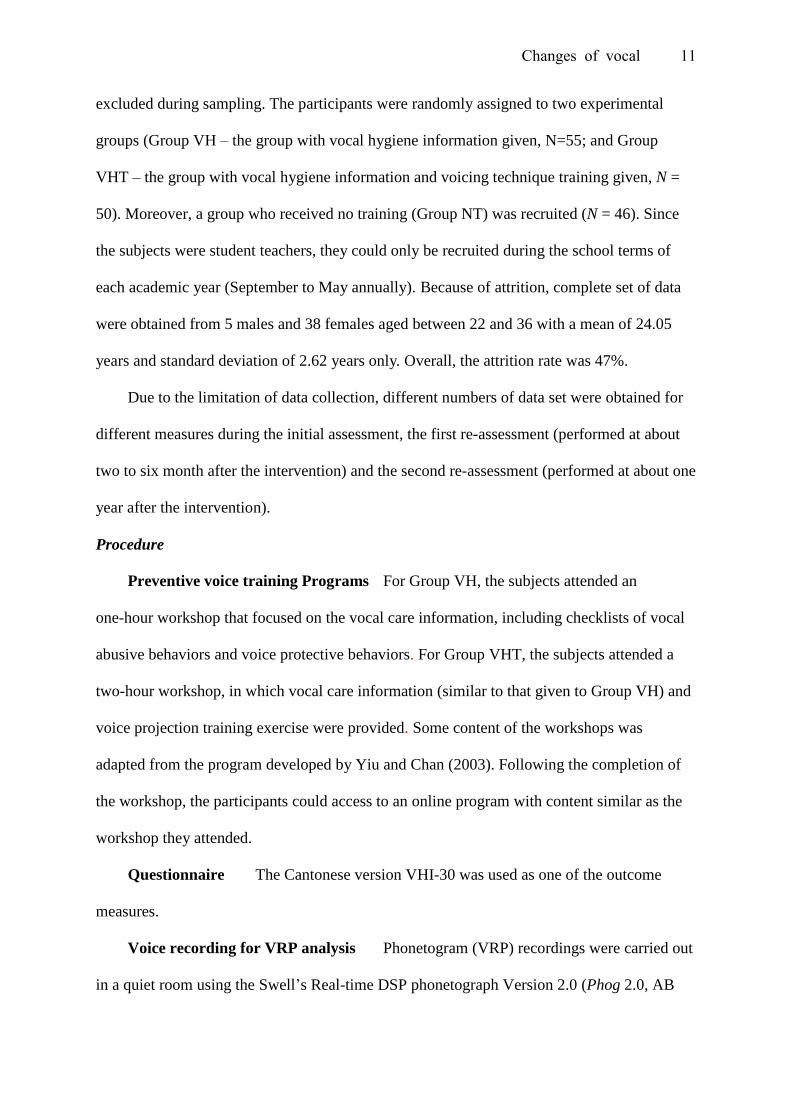
excluded during sampling. The participants were randomly assigned to two experimental
groups (Group VH – the group with vocal hygiene information given, N=55; and Group
VHT – the group with vocal hygiene information and voicing technique training given, N =
50). Moreover, a group who received no training (Group NT) was recruited (N = 46). Since
the subjects were student teachers, they could only be recruited during the school terms of
each academic year (September to May annually). Because of attrition, complete set of data
were obtained from 5 males and 38 females aged between 22 and 36 with a mean of 24.05
years and standard deviation of 2.62 years only. Overall, the attrition rate was 47%.
Due to the limitation of data collection, different numbers of data set were obtained for
different measures during the initial assessment, the first re-assessment (performed at about
two to six month after the intervention) and the second re-assessment (performed at about one
year after the intervention).
Procedure
Preventive voice training Programs For Group VH, the subjects attended an
one-hour workshop that focused on the vocal care information, including checklists of vocal
abusive behaviors and voice protective behaviors. For Group VHT, the subjects attended a
two-hour workshop, in which vocal care information (similar to that given to Group VH) and
voice projection training exercise were provided. Some content of the workshops was
adapted from the program developed by Yiu and Chan (2003). Following the completion of
the workshop, the participants could access to an online program with content similar as the
workshop they attended.
Questionnaire The Cantonese version VHI-30 was used as one of the outcome
measures.
Voice recording for VRP analysis Phonetogram (VRP) recordings were carried out
in a quiet room using the Swell’s Real-time DSP phonetograph Version 2.0 (Phog 2.0, AB

Changes of vocal 12
Nyvalla) with a Pentium III 500-MHz PC computer and a 17-inch monitor (Philip 170B4). A
head-mounted condenser microphone (AKG Acoustics, C420) was used to capture the voice
samples at a 5cm distance from the mouth. Calibration of loudness level of the Phog 2.0
system was carried out each time before recordings.
At the beginning of the examination, subjects were asked to sustain /a/ at a musical note
(for female: middle C; for male: G below middle C) at their comfortable loudness. Then, the
recordings were continued with the standard VRP procedure (Ma et al., 2007): Subjects were
required to gradually decrease/ increase the loudness with sustained phonation until it reaches
their lowest/ highest loudness level without whispering and vocal fry. This procedure was
repeated with different tones until the maximum and minimum frequencies produced by the
subject were obtained. In general, the VRP provided measurements of the maximum and
minimum fundamental frequency (Hz), the maximum and minimum intensity (dB), and the
total profile area (dB semitone).
Videostroboscopic image recording for perceptual evaluation The examination
of the larynx was conducted using Kay’s Rhino-Laryngeal Stroboscope (RLS Model 9100B).
During examination, the larynx was first visualized under continuous halogen illumination at
rest. Second, it was visualized under both halogen and stroboscopic illumination during
sustained /i/ at comfortable pitch and loudness. Some subjects, who demonstrated substantial
sensitive gag response, failed to complete the videostroboscopic examination.
Perceptual evaluation and reliability measures Perceptual rating measure was
performed on the videostroboscopic images. The videos were first screened in a selection
procedure of the rating of clarity. The clarity of videos was rated by an undergraduate year
four student studying Speech and Hearing Sciences in the University of Hong Kong. A
three-point scale was used for rating, with “clear” means the images can be certainly judged
with good lighting, good focus and the vocal folds can be completely seen; “semi-clear”

Changes of vocal 13
means the images can be partially judged with fair lighting, fair focus and/or partially seen
vocal folds; and “Unclear” means the images cannot be judged due to poor lighting, poor
focus and/or the vocal folds cannot be seen“. Only images rated as “clear” and “semi-clear”
were selected for the final rating process. Table 1 lists the number of videos that were rated as
“clear” and “semi-clear”. Three experienced judges participated in the rating process.
Table 1
The number of videos that were rated as “clear” and “semi-clear”
Clarity
Clear Semi-clear
Number of videos 21 26
The Stroboscopic Assessment Form (SAF), with parameters adapted from the
Stroboscopy Examination Rating Form (SERF) (Poburka, 1999), was used for the perceptual
evaluation in this study. The parameters included 1) mass and redness – with the area
represented by the number of boxes being the rating unit, which reflect the extent and size of
pathology, 2) amplitude – with an ordinal rating scale of five ranks, from 20 to 100 (20%,
40%, 60%, 80%, 100%) and the higher percentage represents the better vocal function, 3)
supraglottic activity – with an ordinal rating scale of six ranks, from 0 to 5 and the smaller
rating represents the better vocal condition, and 4) glottal closure – with seven descriptive
rating labels: complete, anterior gap, posterior gap, hourglass, spindle gap, irregular and
incomplete. (Appendix B).
Poburka (1999) suggested the SERF showed a better agreement and reliability of ratings
when compare to other rating forms. Moreover, it was reported that using the SERF allows
“faster rating times, less hesitation in making the ratings, and less confusion over left and
Changes of vocal 14
right orientations on the form” (Poburka, 1999, p. 412). Therefore, the SERF was taken as
reference.
Fifteen percent of the total samples were selected for the reliability measures. The
selected samples were repeated. Hence, these samples were rated by each rater for twice for
calculating the intra-rater agreement. Also, the ratings of the same stimuli by the three judges
were compared for calculating the inter-rater reliability. Due to the missing data, dummy
samples (about 40% of the total samples being rated) were added so that three video clips
were presented for each subject. Yet, the rating of the dummy samples was not included in
the final data analysis. Moreover, all samples to be rated were randomized between-subjects
and within-subjects before rating.
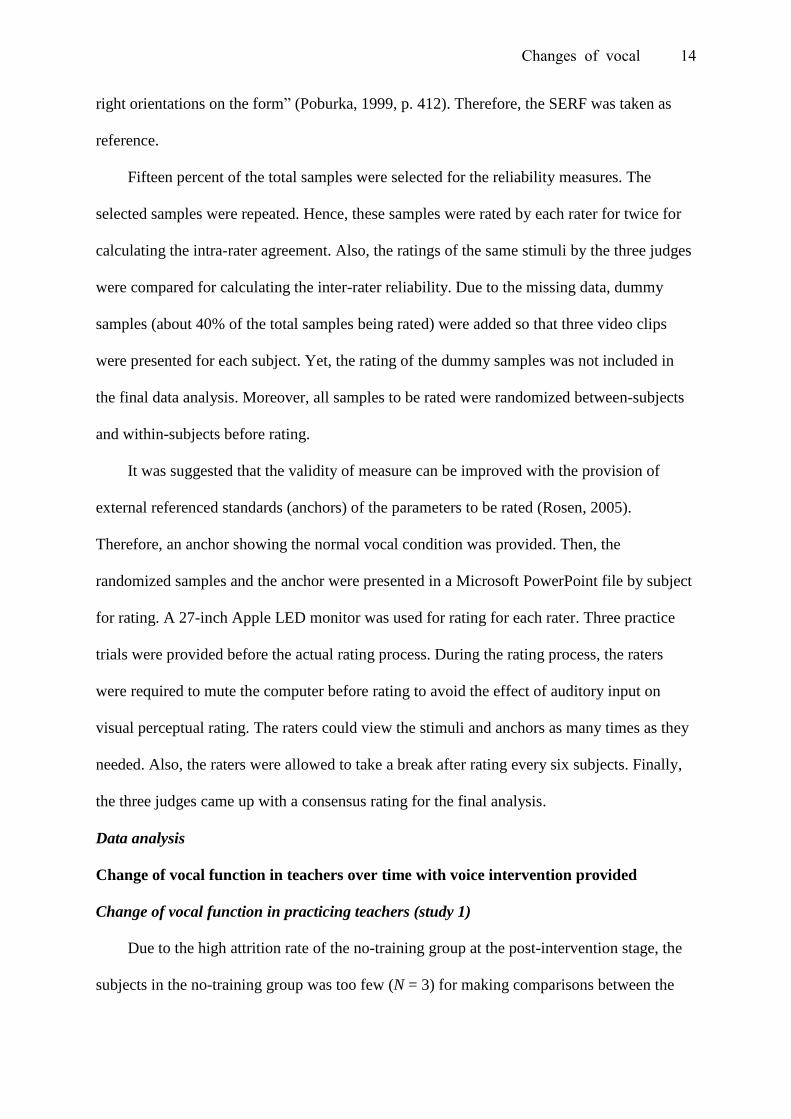
It was suggested that the validity of measure can be improved with the provision of
external referenced standards (anchors) of the parameters to be rated (Rosen, 2005).
Therefore, an anchor showing the normal vocal condition was provided. Then, the
randomized samples and the anchor were presented in a Microsoft PowerPoint file by subject
for rating. A 27-inch Apple LED monitor was used for rating for each rater. Three practice
trials were provided before the actual rating process. During the rating process, the raters
were required to mute the computer before rating to avoid the effect of auditory input on
visual perceptual rating. The raters could view the stimuli and anchors as many times as they
needed. Also, the raters were allowed to take a break after rating every six subjects. Finally,
the three judges came up with a consensus rating for the final analysis.
Data analysis
Change of vocal function in teachers over time with voice intervention provided
Change of vocal function in practicing teachers (study 1)
Due to the high attrition rate of the no-training group at the post-intervention stage, the
subjects in the no-training group was too few (N = 3) for making comparisons between the
Changes of vocal 15
intervention group and the no-training group. Therefore, analysis was only performed on the
intervention group (Group VT).
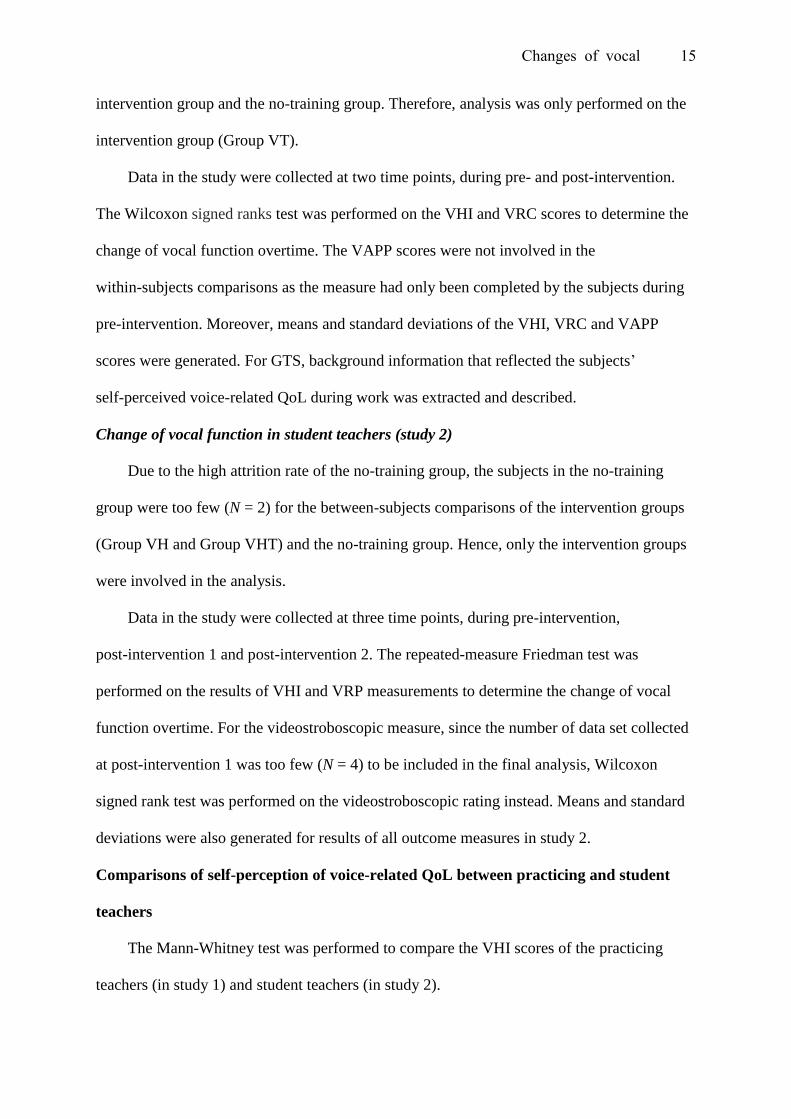
Data in the study were collected at two time points, during pre- and post-intervention.
The Wilcoxon signed ranks test was performed on the VHI and VRC scores to determine the
change of vocal function overtime. The VAPP scores were not involved in the
within-subjects comparisons as the measure had only been completed by the subjects during
pre-intervention. Moreover, means and standard deviations of the VHI, VRC and VAPP
scores were generated. For GTS, background information that reflected the subjects’
self-perceived voice-related QoL during work was extracted and described.
Change of vocal function in student teachers (study 2)
Due to the high attrition rate of the no-training group, the subjects in the no-training
group were too few (N = 2) for the between-subjects comparisons of the intervention groups
(Group VH and Group VHT) and the no-training group. Hence, only the intervention groups
were involved in the analysis.
Data in the study were collected at three time points, during pre-intervention,
post-intervention 1 and post-intervention 2. The repeated-measure Friedman test was
performed on the results of VHI and VRP measurements to determine the change of vocal
function overtime. For the videostroboscopic measure, since the number of data set collected
at post-intervention 1 was too few (N = 4) to be included in the final analysis, Wilcoxon
signed rank test was performed on the videostroboscopic rating instead. Means and standard
deviations were also generated for results of all outcome measures in study 2.
Comparisons of self-perception of voice-related QoL between practicing and student
teachers
The Mann-Whitney test was performed to compare the VHI scores of the practicing
teachers (in study 1) and student teachers (in study 2).
Changes of vocal 16
Result
Change of vocal function in teachers over time with voice intervention provided
Change of vocal function in practicing teachers (study 1)
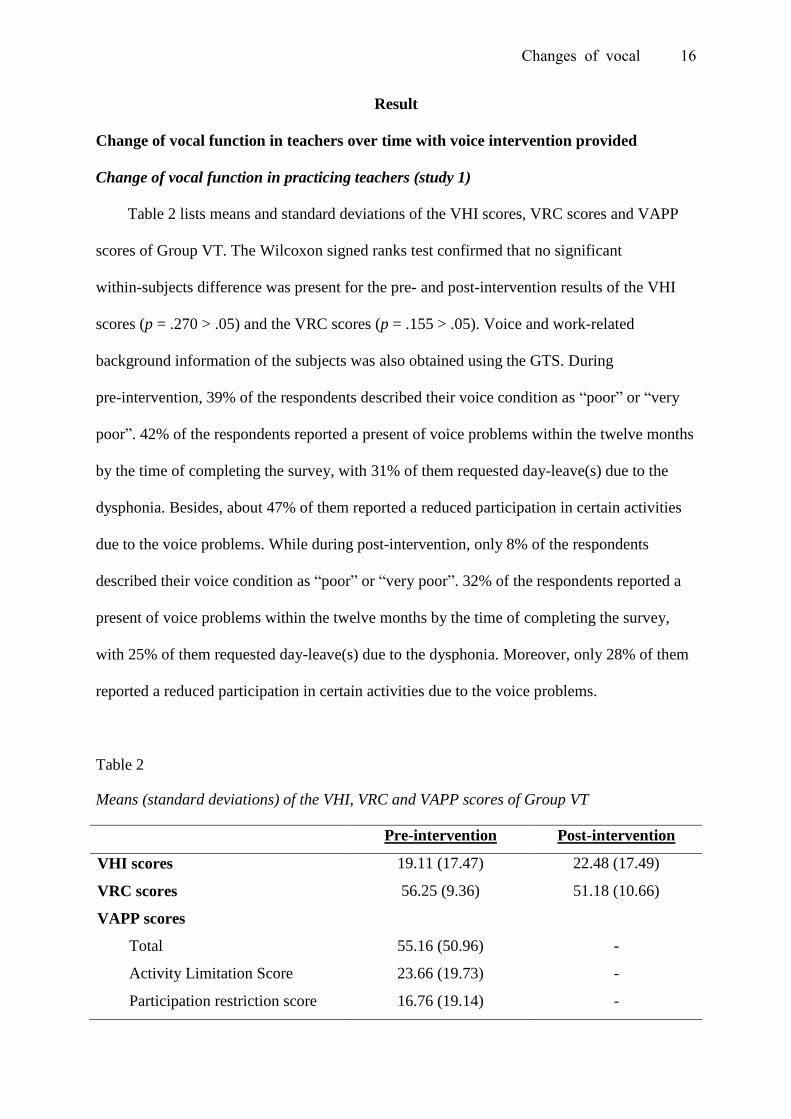
Table 2 lists means and standard deviations of the VHI scores, VRC scores and VAPP
scores of Group VT. The Wilcoxon signed ranks test confirmed that no significant
within-subjects difference was present for the pre- and post-intervention results of the VHI
scores (p = .270 > .05) and the VRC scores (p = .155 > .05). Voice and work-related
background information of the subjects was also obtained using the GTS. During
pre-intervention, 39% of the respondents described their voice condition as “poor” or “very
poor”. 42% of the respondents reported a present of voice problems within the twelve months
by the time of completing the survey, with 31% of them requested day-leave(s) due to the
dysphonia. Besides, about 47% of them reported a reduced participation in certain activities
due to the voice problems. While during post-intervention, only 8% of the respondents
described their voice condition as “poor” or “very poor”. 32% of the respondents reported a
present of voice problems within the twelve months by the time of completing the survey,
with 25% of them requested day-leave(s) due to the dysphonia. Moreover, only 28% of them
reported a reduced participation in certain activities due to the voice problems.
Table 2
Means (standard deviations) of the VHI, VRC and VAPP scores of Group VT
Pre-intervention Post-intervention
VHI scores 19.11 (17.47) 22.48 (17.49)
VRC scores 56.25 (9.36) 51.18 (10.66)
VAPP scores
Total 55.16 (50.96) -
Activity Limitation Score 23.66 (19.73) -
Participation restriction score 16.76 (19.14) -
Changes of vocal 17
Change of vocal function in student teachers (study 2)
Table 3 lists the results of the intra-rater and inter-rater agreements of the three raters in
the perceptual analysis of videostroboscopic images. Agreement within one unit for the
ratings of mass and redness, amplitude, and supraglottic activity; and the exact agreement for
the ratings of glottal closure patterns were set as the criterion level for the reliability analysis.
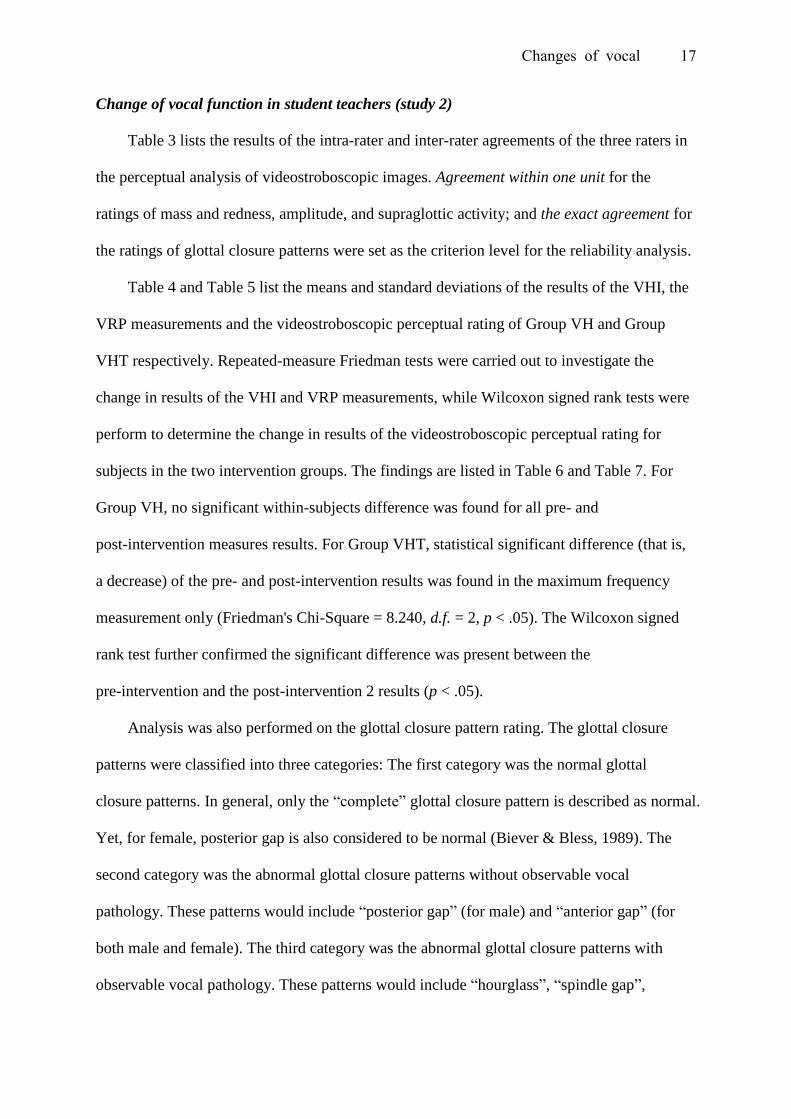
Table 4 and Table 5 list the means and standard deviations of the results of the VHI, the
VRP measurements and the videostroboscopic perceptual rating of Group VH and Group
VHT respectively. Repeated-measure Friedman tests were carried out to investigate the
change in results of the VHI and VRP measurements, while Wilcoxon signed rank tests were
perform to determine the change in results of the videostroboscopic perceptual rating for
subjects in the two intervention groups. The findings are listed in Table 6 and Table 7. For
Group VH, no significant within-subjects difference was found for all pre- and
post-intervention measures results. For Group VHT, statistical significant difference (that is,
a decrease) of the pre- and post-intervention results was found in the maximum frequency
measurement only (Friedman's Chi-Square = 8.240, d.f. = 2, p < .05). The Wilcoxon signed
rank test further confirmed the significant difference was present between the
pre-intervention and the post-intervention 2 results (p < .05).
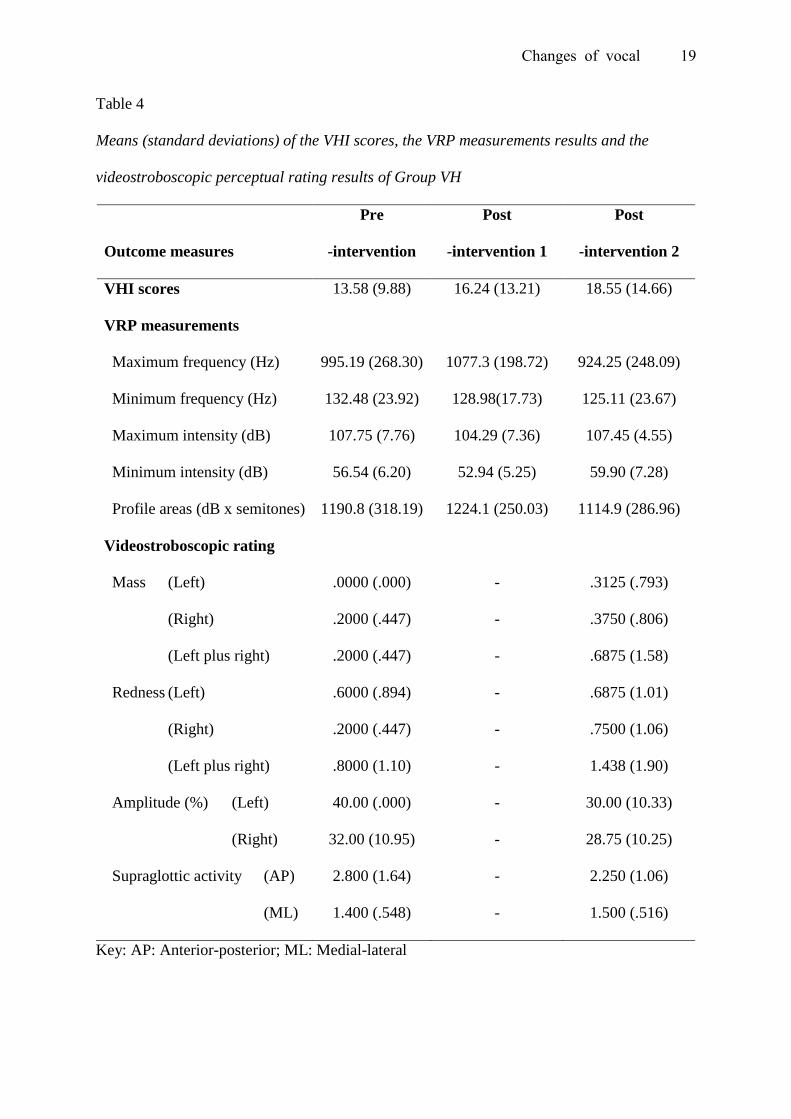
Analysis was also performed on the glottal closure pattern rating. The glottal closure
patterns were classified into three categories: The first category was the normal glottal
closure patterns. In general, only the “complete” glottal closure pattern is described as normal.
Yet, for female, posterior gap is also considered to be normal (Biever & Bless, 1989). The
second category was the abnormal glottal closure patterns without observable vocal
pathology. These patterns would include “posterior gap” (for male) and “anterior gap” (for
both male and female). The third category was the abnormal glottal closure patterns with
observable vocal pathology. These patterns would include “hourglass”, “spindle gap”,

Changes of vocal 18
“irregular” and “incomplete”. Table 8 lists the percentage of the corresponding glottal closure
patterns of the three categories in Group VH and Group VHT respectively.
Table 3
Intra-rater and inter-rater agreements in the perceptual analysis of videostroboscopic images
Parameters for perceptual rating
Intra-rater (%) Inter-rater (%)
Rater
1
Rater
2
Rater
3
Raters
1 and 2
Raters
2 and 3
Raters
1 and 3
Mass
Left Agreement within 1 unit 100 100 100 100 100 100
Right Agreement within 1 unit 100 100 100 100 100 100
Redness
Left Agreement within 1 unit 75 75 100 90.7 92.6 94.4
Right Agreement within 1 unit 75 75 100 92.6 90.7 92.6
Amplitude
Left Agreement within 1 unit 100 100 100 100 100 100
Right Agreement within 1 unit 100 100 100 100 100 100
Supraglottic activity
AP Agreement within 1 unit 100 100 100 94.4 94.4 88.9
ML Agreement within 1 unit 100 100 87.5 100 94.4 96.3
Glottal closure
Exact agreement 83.3 100 85.7 87.0 88.9 88.9
Key: AP: Anterior-posterior; ML: Medial-lateral
Changes of vocal 19
Table 4
Means (standard deviations) of the VHI scores, the VRP measurements results and the
videostroboscopic perceptual rating results of Group VH
Outcome measures
Pre
-intervention
Post
-intervention 1
Post
-intervention 2
VHI scores 13.58 (9.88) 16.24 (13.21) 18.55 (14.66)
VRP measurements
Maximum frequency (Hz) 995.19 (268.30) 1077.3 (198.72) 924.25 (248.09)
Minimum frequency (Hz) 132.48 (23.92) 128.98(17.73) 125.11 (23.67)
Maximum intensity (dB) 107.75 (7.76) 104.29 (7.36) 107.45 (4.55)
Minimum intensity (dB) 56.54 (6.20) 52.94 (5.25) 59.90 (7.28)
Profile areas (dB x semitones) 1190.8 (318.19) 1224.1 (250.03) 1114.9 (286.96)
Videostroboscopic rating
Mass (Left) .0000 (.000) - .3125 (.793)
(Right) .2000 (.447) - .3750 (.806)
(Left plus right) .2000 (.447) - .6875 (1.58)
Redness (Left) .6000 (.894) - .6875 (1.01)
(Right) .2000 (.447) - .7500 (1.06)
(Left plus right) .8000 (1.10) - 1.438 (1.90)
Amplitude (%) (Left) 40.00 (.000) - 30.00 (10.33)
(Right) 32.00 (10.95) - 28.75 (10.25)
Supraglottic activity (AP) 2.800 (1.64) - 2.250 (1.06)
(ML) 1.400 (.548) - 1.500 (.516)
Key: AP: Anterior-posterior; ML: Medial-lateral

Changes of vocal 20
Table 5
Means (standard deviations) of the VHI scores, the VRP measurements results and the
videostroboscopic perceptual rating results of Group VHT
Outcome measures
Pre
-intervention
Post
-intervention 1
Post
-intervention 2
VHI scores 13.27 (7.69) 22.36 (15.31) 23.00 (13.05)
VRP measurements
Maximum frequency (Hz) 1104.5 (194.54) 1065.0 (195.91) 1017.2 (126.34)
Minimum frequency (Hz) 138.35 (14.86) 137.75 (13.48) 138.21 (10.16)
Maximum intensity (dB) 107.12 (7.14) 106.54 (6.06) 111.00 (5.88)
Minimum intensity (dB) 56.88 (8.62) 55.36 (7.22) 58.09 (4.74)
Profile areas (dB x semitones) 1175.2 (307.63) 1094.1 (303.66) 1208.7 (281.80)
Videostroboscopic rating
Mass (Left) .5000 (.837) - .1667 (.408)
(Right) .5000 (.548) - .1667 (.408)
(Left plus right) 1.000 (1.26) - .3333 (.817)
Redness (Left) .6667 (1.63) - .3333 (.817)
(Right) .1000 (2.45) - .3333 (.817)
(Left plus right) 1.667 (4.08) - .6667 (1.63)
Amplitude (%) (Left) 33.33 (10.33) - 26.67 (10.33)
(Right) 26.67 (10.33) - 23.33 (8.16)
Supraglottic activity (AP) 1.500 (1.05) - 1.667 (.817)
(ML) 1.333 (.516) - 1.333 (.516)
Key: AP: Anterior-posterior; ML: Medial-lateral

Changes of vocal 21
Table 6
Within-subjects comparison of the VHI scores and the VRP measurements results of Group
VH and Group VHT
Outcome measures Friedman's
Chi-Square
d.f.
p
Group
VH
Group
VHT
Group
VH
Group
VHT
Group
VH
Group
VHT
VHI 0.353 1.000 2 2 .838 .607
VRP measurements
Maximum frequency (Hz) 2.596 8.240 2 2 .273 .016
Minimum frequency (Hz) 4.233 0.839 2 2 .120 .657
Maximum intensity (dB) 2.920 4.514 2 2 .232 .105
Minimum intensity (dB) 3.231 0.857 2 2 .199 .651
Profile areas (dB x semitones) 1.167 1.750 2 2 .558 .417
Statistically significant correlation, p < .05 (2-tailed)

Changes of vocal 22
Table 7
Within-subjects comparison of the videostroboscopic perceptual rating results of Group VH
and Group VHT
Videostroboscopic rating Z p
Group VH Group VHT Group VH Group VHT
Mass (Left) -1.000 -1.000 .317 .317
(Right) .000 .000 1.000 1.000
(Left plus right) -.447 -1.000 .655 .317
Redness (Left) -1.000 .000 .317 1.000
(Right) -.1.069 .000 .285 1.000
(Left plus right) -.1.069 .000 .285 1.000
Amplitude (%) (Left) -1.732 -1.000 .083 .317
(Right) -1.414 .000 .157 1.000
Supraglottic activity (AP) .000 -1.342 1.000 .180
(ML) -.577 -1.000 .564 .317
Statistically significant correlation, p < .05 (2-tailed)
Key: AP: Anterior-posterior; ML: Medial-lateral
Changes of vocal 23
Table 8
Percentage of the corresponding glottal closure patterns of the three categories in Group VH
and Group VHT respectively
Pre-intervention Post-intervention 1 Post-intervention 2
Glottal closure
patterns
Group
VH
Group
VHT
Group
VH
Group
VHT
Group
VH
Group
VHT
Category 1 60 83.3 - - 62.5 100
Category 2 40 0 - - 18.8 0
Category 3 0 16.7 - - 18.8 0
Comparisons of self-perception of voice-related QoL between practicing and student
teachers
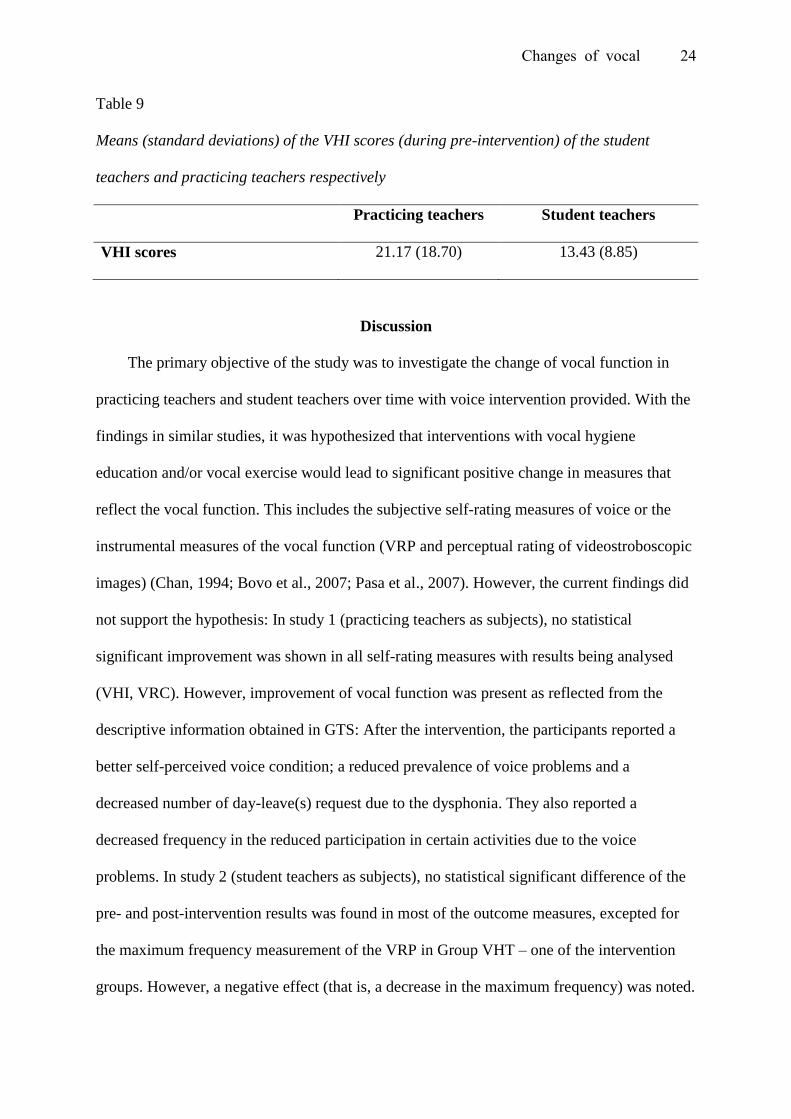
Table 9 lists the means and standard deviations of the VHI scores of the practicing
teachers and student teachers respectively at pre-intervention stage. Only pre-intervention
results were chosen for analysis to ensure a fair comparison between the two groups of
subjects without the effects of interventions. The results showed that the VHI scores of the
practicing teachers were higher than that of the student teachers. However, the
Mann-Whitney test confirmed the student teachers (subjects in Study 2) and the practicing
teachers (subjects in Study 1) were not significantly different in the mean VHI scores
(Mann-Whitney U = 1207.00, p = .141 > .05).
Changes of vocal 24
Table 9
Means (standard deviations) of the VHI scores (during pre-intervention) of the student
teachers and practicing teachers respectively
Practicing teachers Student teachers
VHI scores 21.17 (18.70) 13.43 (8.85)
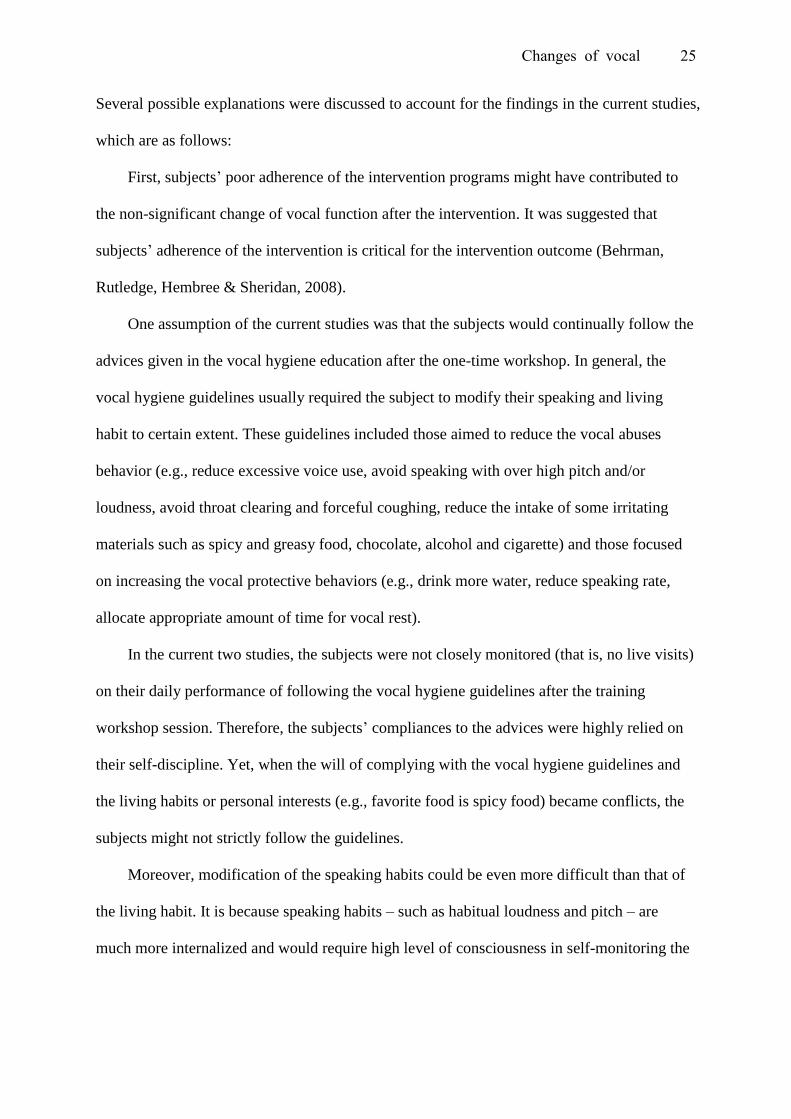
Discussion
The primary objective of the study was to investigate the change of vocal function in
practicing teachers and student teachers over time with voice intervention provided. With the
findings in similar studies, it was hypothesized that interventions with vocal hygiene
education and/or vocal exercise would lead to significant positive change in measures that
reflect the vocal function. This includes the subjective self-rating measures of voice or the
instrumental measures of the vocal function (VRP and perceptual rating of videostroboscopic
images) (Chan, 1994; Bovo et al., 2007; Pasa et al., 2007). However, the current findings did
not support the hypothesis: In study 1 (practicing teachers as subjects), no statistical
significant improvement was shown in all self-rating measures with results being analysed
(VHI, VRC). However, improvement of vocal function was present as reflected from the
descriptive information obtained in GTS: After the intervention, the participants reported a
better self-perceived voice condition; a reduced prevalence of voice problems and a
decreased number of day-leave(s) request due to the dysphonia. They also reported a
decreased frequency in the reduced participation in certain activities due to the voice
problems. In study 2 (student teachers as subjects), no statistical significant difference of the
pre- and post-intervention results was found in most of the outcome measures, excepted for
the maximum frequency measurement of the VRP in Group VHT – one of the intervention
groups. However, a negative effect (that is, a decrease in the maximum frequency) was noted.
Changes of vocal 25
Several possible explanations were discussed to account for the findings in the current studies,
which are as follows:
First, subjects’ poor adherence of the intervention programs might have contributed to
the non-significant change of vocal function after the intervention. It was suggested that
subjects’ adherence of the intervention is critical for the intervention outcome (Behrman,
Rutledge, Hembree & Sheridan, 2008).
One assumption of the current studies was that the subjects would continually follow the
advices given in the vocal hygiene education after the one-time workshop. In general, the
vocal hygiene guidelines usually required the subject to modify their speaking and living
habit to certain extent. These guidelines included those aimed to reduce the vocal abuses
behavior (e.g., reduce excessive voice use, avoid speaking with over high pitch and/or
loudness, avoid throat clearing and forceful coughing, reduce the intake of some irritating
materials such as spicy and greasy food, chocolate, alcohol and cigarette) and those focused
on increasing the vocal protective behaviors (e.g., drink more water, reduce speaking rate,
allocate appropriate amount of time for vocal rest).
In the current two studies, the subjects were not closely monitored (that is, no live visits)
on their daily performance of following the vocal hygiene guidelines after the training
workshop session. Therefore, the subjects’ compliances to the advices were highly relied on
their self-discipline. Yet, when the will of complying with the vocal hygiene guidelines and
the living habits or personal interests (e.g., favorite food is spicy food) became conflicts, the
subjects might not strictly follow the guidelines.
Moreover, modification of the speaking habits could be even more difficult than that of
the living habit. It is because speaking habits – such as habitual loudness and pitch – are
much more internalized and would require high level of consciousness in self-monitoring the

Changes of vocal 26
abusive behaviors. In other words, even the subjects had the desire to follow the vocal
hygiene advices; they might fail to do so due to the inadequate awareness to the problem.
Second, inaccurate implementation of the voicing techniques due to the inadequate
training might also be related to the lack of improvement after the intervention. In the current
project, apart from the vocal hygiene education, training of the voice projection techniques in
classroom teaching was also provided to the intervention group in study 1 and one of the
intervention groups in study 2 (Group VHT). In general, the voice projection exercise could
promote the appropriate and effective voice use. However, incorrect implementation of these
training could produce a reverse effect. In the current studies, only short exercises of the
voice projection were provided for the subjects, which might not be enough for all subjects to
master the techniques. Hence, inaccuracy could be resulted during the implementation of
voice projection in daily situation. This can be harmful to the subjects’ voice. For example, if
the subjects misunderstood increased loudness as better voice projection, the inappropriate
increase in loudness would cause stress on the vocal folds of the subjects. This might be one
of a possible reason in explaining the negative change of maximum frequency shown in
Group VHT, in which voice projection training was provided.
The second objective of the current project was to compare between the practicing
teachers and the student teachers on their self-perceived voice-related QoL measured by VHI.
The objective was set up on the hypothesis that the self-perceived QoL of the student teachers
would be significantly better than that of the practicing teachers. Concerning the current
findings, it was observed that although the student teachers showed a better self-perceived
voice-related QoL (that is, a lower VHI score) than the practicing teachers, the results of the
two groups were not significantly different. Thus, the present findings did not fully support
the hypothesis. The following are the possible explanations for the findings:

Changes of vocal 27
First, due to the high attrition rate in both studies, the number of subjects being included
in the final analysis was not balance between groups. Therefore, valid comparison between
the two groups could not be completely attained and the differences between groups might
not be fully demonstrated.
Second, it was expected that the different performance of the two groups might be
related to the following risk factors of voice problem. This included 1) vocal demand in a
week, 2) stress and anxiety, and 3) age (Thomas, Kooijman, Cremers & de Jong, 2006). In
the studies, the mean age of the student teachers was about 14 years younger than the
practicing teachers. Also, all the practicing teachers recruited were full-time teaching
professional in different education institution in Hong Kong. Hence, it was expected that the
practicing teachers would have higher vocal demand as well as more stress than the student
teachers due to the heavier teaching workloads. Yet, the above-mentioned risk factors could
be interfered with other factors such as the working environment and personality (World
Health Organization, 2001). Thus, concrete conclusion could not be drawn before the
information of other risk factors were taken into account and compared between the two
groups of participants.
Limitation of the present studies and future research directions
Sample size Due to the high attrition rate of subjects, a great number of the recruited
subjects did not participate in any of the outcome measures. This greatly reduced the number
of subjects included in the final analysis. Only 69 subjects and 43 subjects were included in
the final analysis of study 1 and study 2 respectively. Hence, the sample size might only be
large enough to give some preliminary rather than conclusive results.
The missing of no-training group subjects data A number of subjects who
participated in the studies did not completed all the outcome measures at different stages
(pre- or post- intervention), which led to the presence of missing data in outcome measures
Changes of vocal 28
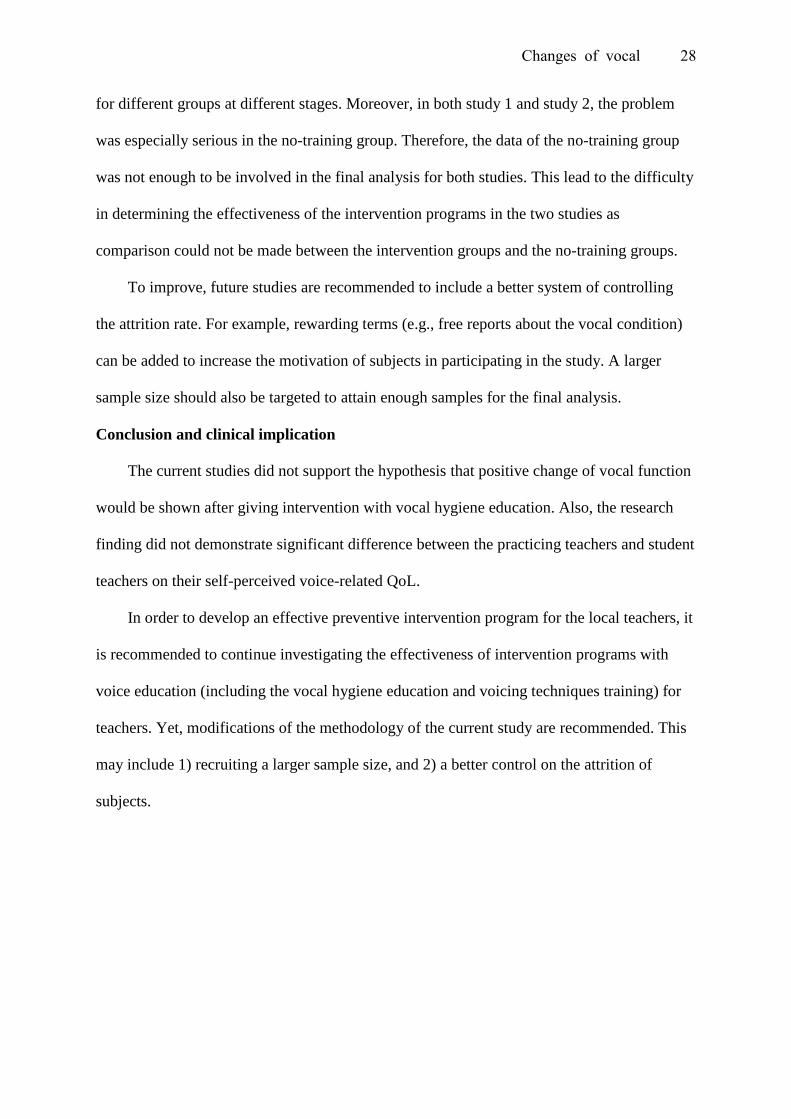
for different groups at different stages. Moreover, in both study 1 and study 2, the problem
was especially serious in the no-training group. Therefore, the data of the no-training group
was not enough to be involved in the final analysis for both studies. This lead to the difficulty
in determining the effectiveness of the intervention programs in the two studies as
comparison could not be made between the intervention groups and the no-training groups.
To improve, future studies are recommended to include a better system of controlling
the attrition rate. For example, rewarding terms (e.g., free reports about the vocal condition)
can be added to increase the motivation of subjects in participating in the study. A larger
sample size should also be targeted to attain enough samples for the final analysis.
Conclusion and clinical implication
The current studies did not support the hypothesis that positive change of vocal function
would be shown after giving intervention with vocal hygiene education. Also, the research
finding did not demonstrate significant difference between the practicing teachers and student
teachers on their self-perceived voice-related QoL.
In order to develop an effective preventive intervention program for the local teachers, it
is recommended to continue investigating the effectiveness of intervention programs with
voice education (including the vocal hygiene education and voicing techniques training) for
teachers. Yet, modifications of the methodology of the current study are recommended. This
may include 1) recruiting a larger sample size, and 2) a better control on the attrition of
subjects.
Changes of vocal 29
References
Angelillo, M., Di Maio, G., Costa, G., Angelillo, N., & Barillari, U. (2009). Prevalence of
occupational voice disorders in teachers. Journal of Preventive Medicine and
Hygiene,50(1), 26-32.
Bassi, I. B., Assunção, A. Á ., de Medeiros, A. M., de Menezes, L. N., Teixeira, L. C., &
Côrtes Gama, A.C. (2011). Quality of life, self-perceived dysphonia, and diagnosed
dysphonia through clinical tests in teachers. Journal of Voice, 25(2), 192-201.
Behrman, A., Rutledge, J., Hembree, A., & Sheridan, S. (2008). Vocal hygiene education,
voice production therapy, and the role of patient adherence: A treatment effectiveness
study in women with phonotrauma. Journal of Speech, Language, and Hearing Research,
51, 350-366.
Biever, D. M., & Bless, D. M. (1989). Vibratory characteristics of the vocal folds in young
adult and geriatric women. Journal of Voice, 3, 120-131.
Bovo, R., Galceram, M., Pertruccelli, J., & Hatzopoulos, S. (2007). Vocal problem among
teachers: Evaluation of a preventive voice program. Journal of Voice, 21(6), 705-722.
Chan, R. W. K. (1994). Does the voice improve with vocal hygiene education? A study of
some instrumental voice measures in a group of kindergarten teachers. Journal of Voice,
8(3), 279-291.
Chan, S.-K. M. (2008). Effectiveness of a multimedia-based voice therapy program for
teachers with voice disorders (Unpublished master degree dissertation). The University
of Hong Kong, Hong Kong.
Chong, E. Y., & Chan, A. H. (2010). Subjective health complaints of teachers from primary
and secondary schools in Hong Kong. International Journal of Occupational Safety and
Ergonomics, 16(1), 23-39.

Changes of vocal 30
Franic, D. M., Bramlett, R. E., & Bothe, A. C. (2005). Psychometric evaluation of disease
specific quality of life instruments in voice disorders. Journal of Voice, 19(2), 300-315.
Ho, E. M. (2011). The risk assessment framework for hyperfunctional voice disorders
(Unpublished doctoral dissertation). The University of Hong Kong, Hong Kong.
Hummel, C., Scharf, M., Schuetzenberger, A., Graessel, E., & Rosanowski, F. (2010).
Objective voice parameters and self-perceived handicap in dysphonia. Folia Phoniatrica
et Logopaedica, 62(6), 303-307.
Ilomäki, I., Leppänen, K., Kleemola, L., Tyrmi, J., Laukkanen, A.-M., & Vilkman, E. (2009).
Relationships between self-evaluations of voice and working conditions, background
factors, and phoniatric findings in female teachers. Logopedics Phoniatrics Vocology,
34(1), 20-31.
Lam, P. K., Chan, K. M., Ho, W. K., Kwong, E., Yiu, E. M., & Wei, W. I. (2006).
Cross-cultural adaptation and validation of the Chinese voice handicap index-10. The
Laryngoscope, 116(7), 1192-1198.
Lee, S. Y., Lao, X. Q., & Yu, I. T. (2010). A cross-sectional survey of voice disorders among
primary school teachers in Hong Kong. Journal of Occupational Health, 52(6), 344-352.
Lindstrom, F., Waye, K. P., Södersten, M., McAllister, A., & Ternström, S. (2011).
Observations of the relationship between noise exposure and preschool teacher voice
usage in day-care center environments. Journal of Voice, 25(2), 166-172.
Ma, E., Robertson, J., Radford, C., Vagne, S., El-fifi, R., & Yiu, E. (2007). Reliability of
speaking and maximum voice range measures in screening for dysphonia. Journal of
Voice, 21(4), 397-406.
Ma, E. P.-M., & Yiu, E. M.-L. (2001). Voice activities and participation profile: Assessing
the impact of voice disorders on daily activities. Journal of Speech, Language and
Hearing Research, 44(3), 511-524.

Changes of vocal 31
Munier, C., & Kinsella, R. (2008). The prevalence and impact of voice problems in primary
school teachers. Occupational Medicine, 58(1), 74-76.
Pasa, G., Oates, J., & Dacakis, G. (2007). The relative effectiveness of vocal hygiene training
and vocal function exercises in preventing voice disorders in primary school teachers.
Logopedics Phoniatrics Vocology, 32, 128-140.
Poburka, B. J. (1999). A new stroboscopy rating form. Journal of Voice, 13(3), 403-413.
Rosen, C. A. (2005). Stroboscopy as a research instrument: Development of a perceptual
evaluation tool. The Laryngoscope, 115(3), 423-428.
Simberg, S., Laine, A., Sala, E., & Ronnemaa, A. (2000). Prevalence of voice disorders
among future teachers. Journal of Voice, 14(2), 231-235.
Siupsinskiene, N., & Lycke, H. (2011). Effects of vocal training on singing and speaking
voice characteristics in vocally healthy adults and children based on choral and
nonchoral data. Journal of Voice, 25(4), e177-e189.
Speyer, R., Wieneke, G. H., van Wijck-Warnaar, I., & Dejonckere, P. H. (2003). Effects of
voice therapy on the voice range profiles of dysphonic patients. Journal of Voice, 17(4),
544-556.
Thomas, G., Kooijman, P. G., Cremers, C. W., & de Jong, F. I. (2006). A comparative study
of voice complaints and risk factors for voice complaints in female student teachers and
practicing teachers early in their career. European Archives of Oto-rhino-laryngology,
263, 370-380.
Van Houtte, E.,Claeys, S., Wuyts, F., & Van Lierde, K. (2011). The impact of voice disorders
among teachers: Vocal complaints, treatment-seeking behavior, knowledge of vocal care,
and voice related absenteeism. Journal of Voice, 25(5), 570-575.
World Health Organization (2001). International Classification of Functioning, Disability
and Health: ICF. Geneva: World Health Organization.
Changes of vocal 32
Wuyts, F. L., De Bodt, M. S., Molenberghs, G., Remacle, M., Heylen, L., Millet, B., . . . Van
de Heyning, P. H. (2000). The dysphonia severity index: An objective measure of vocal
quality based on a multiparameter approach. Journal of Speech, Language and Hearing
Research, 43(3), 796-809.
Yiu, E., & Chan, K. (2003). A simple guide to better voicing: For teachers and professional
voice users (2nd ed.). Hong Kong: INSTEP, The University of Hong Kong.
Yiu, E. M.-L., & Chan, K. M.-K. (2005). HKU's experts call for voice protection education
[electronic version]. HKU Press Release. Retrieved 30 March, 2012 from
http://www.hku.hk/press/news_detail_5246.html.
Yiu, E. M.-L., & Ho, P. S.-P. (1991). Voice problems in Hong Kong: A preliminary report.
Australian Journal of Human Communication Disorders, 19, 45-48.
Yiu, E., & Ma, E. (2001). Clinical voice assessment and therapy: A Hong Kong perspective.
Volume II: Voice therapy instructional manual. Hong Kong: Sik Sik Yuen Education
Research Fund, The University of Hong Kong.
Yiu, E. M.-L., Wei, W., Van Hasselt, A., & Wong, R. (2007). Predicting the outcome of
conservative (non-surgical) voice therapy for adults with laryngeal pathologies
associated with hyperfunctional voice use. Hong Kong Medical Journal, 13(Suppl 5),
S15-17.
Acknowledgement
I would like to thank my dissertation supervisors, Professor Edwin Yiu and Dr. Karen
Chan for their supervision and the inspiring suggestions and comments throughout the project.
Special thanks are given to Dr Estella Ma for her participation in the perceptual rating of the
videostroboscopic images. Last but not least, I wish to acknowledge all the subjects for their
kind participation in the project, as well as the support from my family and friends.
Changes of vocal 33
Appendix A
The General Teaching Survey (GTS)
聲線問題與教學的關係 Developed by Dr. Karen Chan
你現在是否全職從事教學工作?
□ 是 □ 否 (你不需填寫這份問卷)
聲線狀況
1. 在過往十二個月內,你會怎樣形容你的聲線狀況?
□ 很差 □ 差 □一般 □ 好 □ 很好
2. 如你現在有聲線問題,是何時發現?
□不足一個月 □一至兩個月前 □三至六個月前
□七至十二個月前 □一年以上 □不適用,我的聲線沒問題
聲線對工作的影響
3. 過往十二個月內,你因聲線問題而要請假的次數有多少天?
□ 聲線有問題, 但沒有請假
□ 天 □ 不適用,我的聲線沒問題
4. 過往十二個月內,你有沒有因聲線問題而要減少參與以下的項目?
□ 教學 □ 課外活動 □ 與同工會議 □ 與學生在課後會議
□ 輔導學生 □ 與家長會議
□ 其他與工作有關的活動, 請列明:
□不適用,我的聲線沒問題
Changes of vocal 34
影響聲線的因素
5. 你認為下列那些項目正在影響你的聲線?
□ 運氣方法不適當 □ 用聲不當
□ 飲食習慣 □ 休息不足
□ 個人情緒問題 □ 個人健康問題 □ 個人教學方法
□ 班房設計不適當 □ 課堂編排不適當 □ 每班學生人數不適當
□ 經常參與課外活動 □ 教學時沒有用擴音器
□ 學校附近環境噪雜 □ 學生秩序差
□ 其他:
6. 你有否採用任何方法避免聲線持續轉壞?
□ 多喝水 □ 減少用聲 □ 多休息
□ 減少大聲說話 □ 減少進食刺激性食物 □ 使用擴音器
□ 參加護聲講座 / 工作坊 □ 改善運氣方法
□ 服食西藥 □ 服食中藥 □ 其他,請列明________________________
□不適用,我的聲線沒問題
7. 你認為若果參加一些聲線護理班, 會否對你的聲線問題有幫助呢?
□會 □或許 □不會 □不適用,我的聲線沒問題
任教歷史
8. 你從事全職教學工作有多久?
□不足一個月 □一至兩個月 □三至六個月 □七至十二個月
□一年以上至兩年 □兩年以上至三年 □三年以上至四年 □四年以上
9. 你現在任教的級別是(可選擇多過一個答案)
□ 幼兒班 (N 班) □ 幼低至幼高班 (K1 – K3)
□小一至小三 □小四至小六 □中一至中三 □中四至中五 □中六至中七
Changes of vocal 35
10. 你現在任教的科目是(可選擇多過一個答案)
□ 語文 □ 數學 / 物理 □ 生物 / 化學 □ 綜合科學
□ 社會科學 (如:通識、常識、商科、地理、歷史、宗教)
□ 音樂 □ 美術 □ 家政 / 木工 □ 體育
□ 職業培訓 □ 特殊教育
11. 你現在有否帶領課外活動 (可選擇多過一個答案)
□ 紀律 / 制服團隊 (如:童軍、公益少年團) □ 體育
□ 合唱團 □ 音樂 (如: 樂器班、樂團) □ 朗誦
□ 美術 / 文化興趣班 (如: 棋藝、攝影) □ 科學活動
□ 語文 □ 宗教活動 (如: 團契) □ 其他:
12. 任教時間:每星期______________小時
13. 除全職教書外,你工餘時有沒有替學生補習?
□有 每星期教______________小時
□沒有
14. 你上課時有沒有用擴音器?
□經常有 □間中有 □沒有
****** 完 ******
Changes of vocal 36
Appendix B
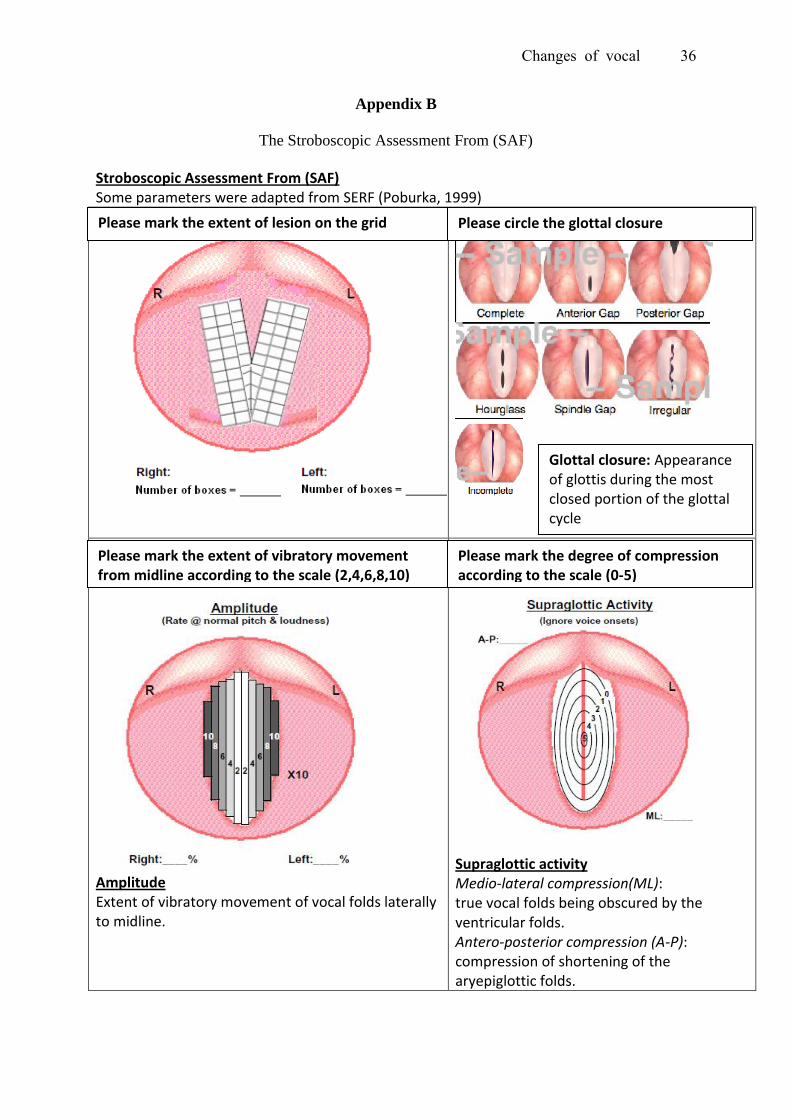
The Stroboscopic Assessment From (SAF)
Stroboscopic Assessment From (SAF) Some parameters were adapted from SERF (Poburka, 1999)
Amplitude Extent of vibratory movement of vocal folds laterally to midline.
Supraglottic activity Medio-lateral compression(ML): true vocal folds being obscured by the ventricular folds. Antero-posterior compression (A-P): compression of shortening of the aryepiglottic folds.
Please mark the extent of lesion on the grid
Please mark the extent of vibratory movement from midline according to the scale (2,4,6,8,10)
Please mark the degree of compression according to the scale (0-5)
Please circle the glottal closure
Glottal closure: Appearance of glottis during the most closed portion of the glottal cycle