Embed Size (px)
Citation preview
DOCUMENT RESUME
ED 313 426 TM 014 192
TITLE Census of Population and Housing, 1980. SchoolDistrict Equivalency Files: MARF 3 and MARF 4.
1NSTTTUTTnN NAtlnnal Confer fnr Vellini-Inn C4-m+-,c4-,nc (vn),
Washington, DC.PUB DATE 83
NOTE 74p.; For the corresponding data file, see TM 014193.
PUB TYPE Guides - Non-Classroom Use (055)
EDRS PRICE MF01/PC03 Plus Postage.DESCRIPTORS *Census Figures; Databases; *Demography; Elementary
Secondary Education; *Geographic Location; *Housing;Online Systems; *Population Distribution; PublicSchools; *School Districts; School District Size;Statistical Surveys
IDENTIFIERS *Census 1980; School District Equivalency Files
ABSTRACTThis document is the user's manual for utilizing the
data files containing the 1980 Census of Population and HousingSchool District Equivalency Files, Master Reference Files (MARF) 3and 4. These equivalency files were created by the Bureau of theCensus using school district boundary maps, and they pertain to allpersons and housing units in the United States. MARF 3 containsgeographic items from census Summary Tape Files (STF) lA and 3A aswell as total population and housing counts. MARF .' containsgeographic items from census STFs 1B and 3B and total population andhousing unit counts. These equivalency or geographic cross-referencefiles allow the user to prepare additional data summaries relevant toschool districts and to relate administrative record summaries withcensus geographic data. This user's manual contains an introductionto the data, a discussion of suppression of data, the data dictionaryand instructions concerning its use, an overview of the 1980 CensusSummary Tape Program, technical information, a glossary, and anaddendum on school districts split by Standard MetropolitanStatistical Areas. (SLD)
* * * * * * * * * * * * * * * * * * * * * * * * * * * * * A * * * * * * * * * * * * * * * * * * * * * * * * * * * * c * * * * * * * * * * *
* Reproductions supplied by EDRS are the best that can be made *
* from the original document. *
* * * * * * * * * * * * * * * * * * * * * * * * * * * * * * * * * * * * * * * * * * * * * * * * * * * * * * * * * * * * * * * * * * * * * * *
^ e4,
U S DEPARTMENT Of EDUCATIONOffice of Educvori Research nd improvement
EDUCATIONAL RESOURCES INFORMAT,ONCENTER IERIC/
ECriThis dOcurn(511 MOS been reproduced asreceived from the person or orparzat,onoriginaung it
P Minor changes have been made to Improvereproduction Ovallty
Pools Mute. or opinions sla,ument Ck, not necessarily represen! nItc,xOE RI position or poticy
Census ofPopulation and
Housing
SCHOOL DISTRICT EQUIVALENCYFILES
MARF 3 MARF 4
U1 Deportneni ef Ideseien1.11
Serwrow
Off. ef Eduartiewil Itomorth and 15.prwaoment
Deoeld J kneesAggrunt Seeremry
llotlemel Carnet ter [/oaten tootiociel
Mote D akin*"Aibtstmbinter
PUBLIC
ELEMENTARYAND
SECONDARYSCHOOLSYSTEMS
tic.). COPY AVAILABLE
...
f F.cloo Ogg rimer 3/5i
DATA BASE DOCUMENTATION(Authority. Public Law 93-502, Section 5521
(Reserve/
PART I - SURVEY SUMMARY
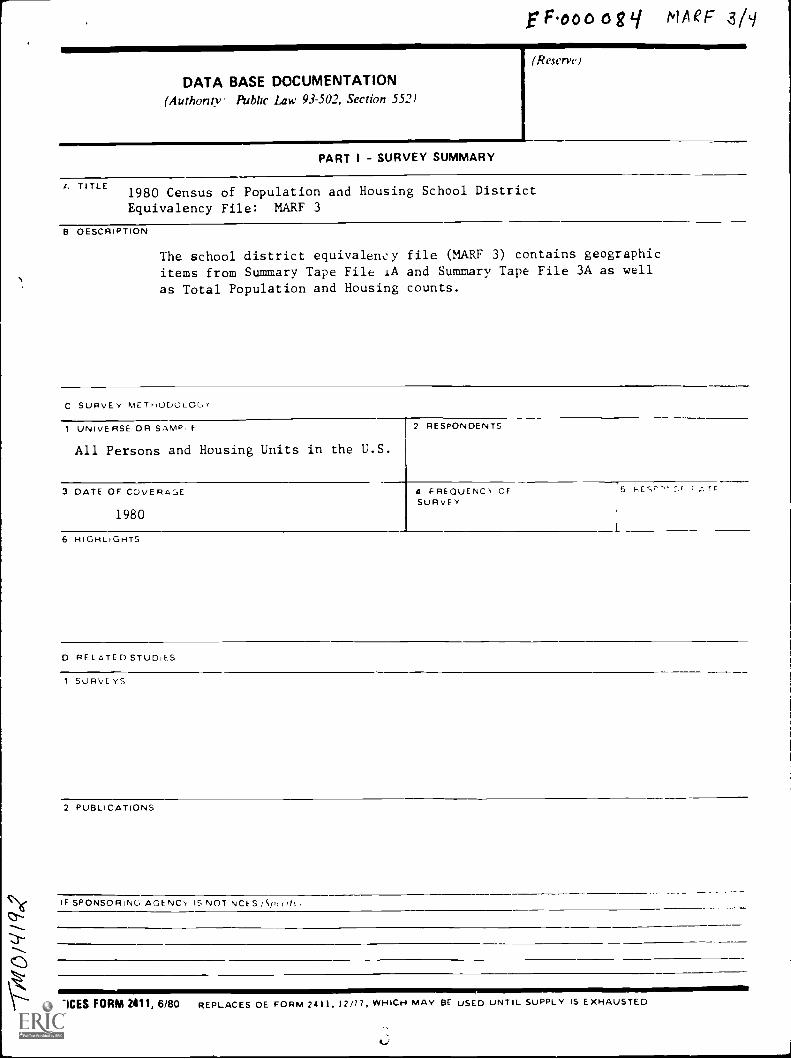
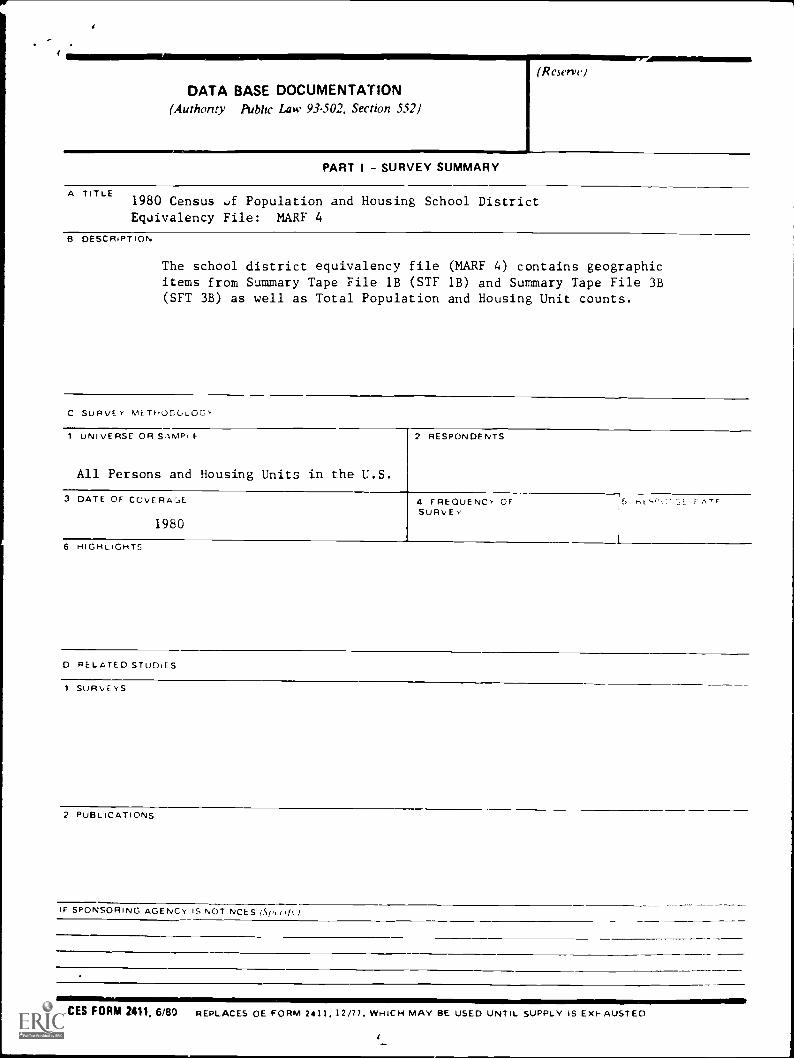
A TITLE1980 Census of Population and Housing School DistrictEquivalency File: MARF 3
S DESCRIPTION
The school district equivalency file (MARF 3) contains geographicitems from Summary Tape File IA and Summary Tape File 3A as well
as Total Population and Housing counts.
C SUPvE Y mETr,oGGLoc, y
1 UNIVERSE OR SAMF F
All Persons and Housing Units in the U.S.
2 RESPONDENTS
3 DATE OF COVERAGE
1980
4 F RE0uE NC OF '5 kES, '' :,, F ..-,PSURVEY
L6 HIGHLIGHTS
D RELATED STUDIES
1 SURVEYS
2 PUBLICATIONS
C.$)IF SPONSORING AGENCY IS NOT NCES Is (III 1
*--..._
.)
mimmommirr ,\..,._
NCES FORM 2411, 6/80 REPLACES OE FORM 2411, 12/77, WHICH MAY BE USED UNTIL SUPPLY IS EXHAUSTED
(Reserve)
DATA BASE DOCUMENTATION(Authority Public Law 93-502, Section 552)
PART I - SURVEY SUMMARY
A TITLE1980 Census ..df Population and Housing School District
Equivalency File: MARF 4
B DESCRIPTION
The school district equivalency file (MARF 4) contains geographicitems from Summary Tape File 1B (STF 1B) and Summary Tape File 3B(SFT 3B) as well as Total Population and Housing Unit counts.
C SURVEY METHODULOO'r
1 UNIVERSE OR SAMP, F
All Persons and Housing Units in the U.S.
2 RESPONDENTS
3 DATE OF COVERACA
1980
4 FREOUENC', OF si F ATESURVEY
6 HIGHLIGHTS
D RELATED STUDIES
1 SURVEYS
2 PUBLICATIONS
IF SPONSORING AGENCY IS NOT NCES (.50(//1 /
NCESFORMAM11,Amn REPLACES OE FORM 2411, 12/77, WHICH MAY BE USED UNTIL SUPPLY IS EXI-AUSTED
(R yen (,)
DATA BASE DOCUMENTATION
PART II FILE DESCRIPTION
A TITLE
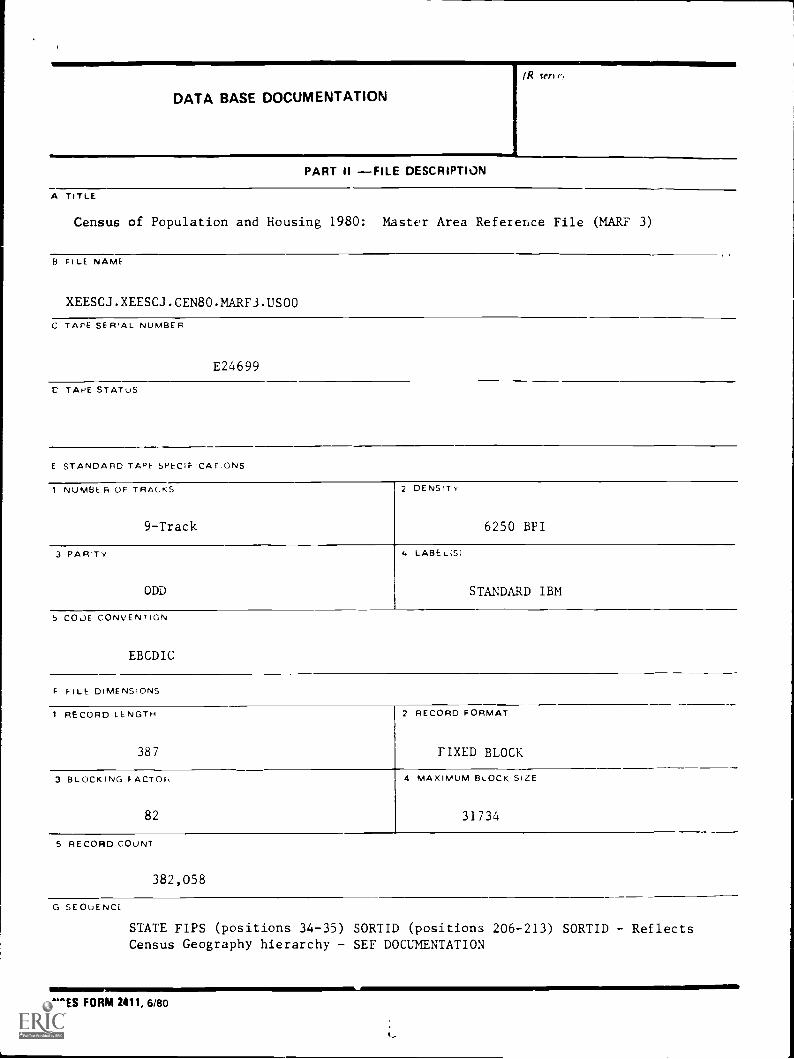
Census of Population and Housing 1980: Master Area Reference File (MARF 3)
B FILE NAME
XEESCJ.XEESCJ.CEN80.MARF3.US00
C TAPE SER'AL NUMBER
E24699
C TAPE STATUS
E STANDARD TARE SPECIFICATIONS
1 NUMBER OF TRACKS
9-Track
2 DENSITY
6250 BPI
3 PARTY
ODD
4 LABE LIS)
STANDARD IBM
5 COJE CONVEN/ LON
EBCDIC
F FILE DIMENSIONS
1 RECORD LENGTH
387
2 RECORD FORMAT
FIXED BLOCK
3 BLOCKING FACTOFA
82
4 MAXIMUM BLOCK SIZE
31734
5 RECORD COUNT
382,058
G SEOUENCL
STATE FIPS (positions 34-35) SORTID (positions 206-213) SORTID - ReflectsCensus Geography hierarchy SEF DOCUMENTATION
NCES FORM 2411, 6/80
L
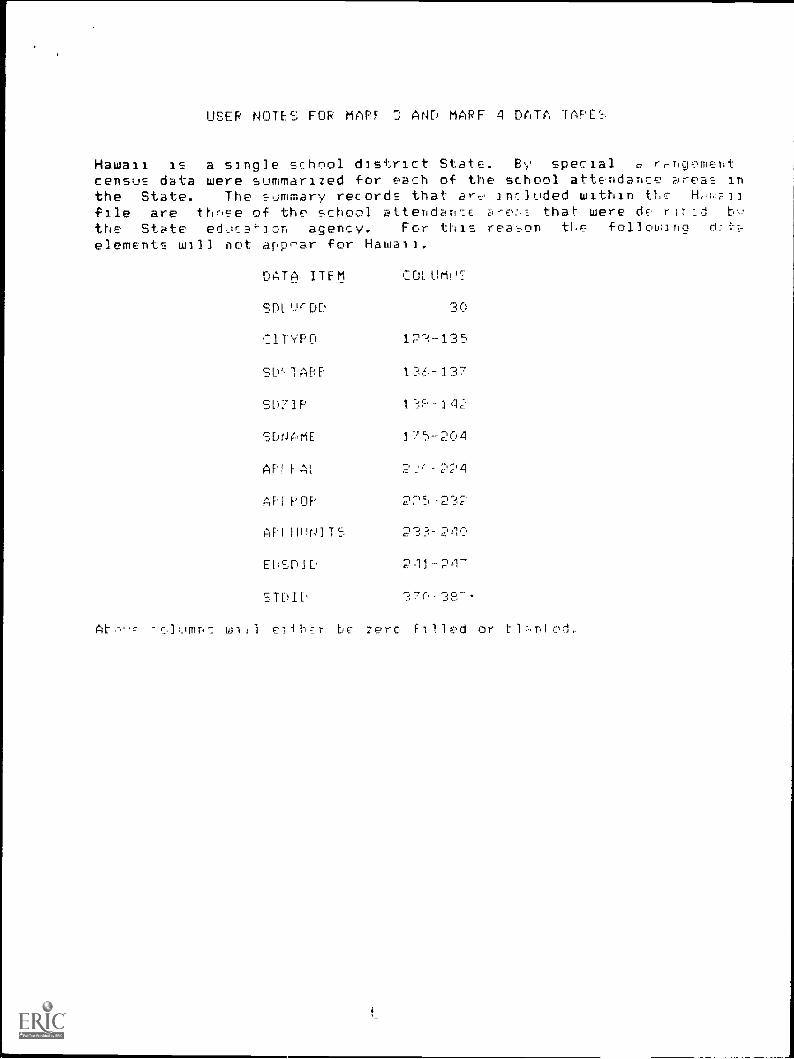
USER NOTES FOR MAPF AND MARF 4 DATA TAPE'7,
Hawaii is a single school district State. Bv special c rcnclomentcensus data were summarized for each of the school attendance areas inthe State. The summary records that t3r,,' inluded within thsfile are those of the school attendanr.c "c4rE';',E that were de rirldthe State educs4-ior. agency. For this rea'con the followinaelements will ;lot appc,ar for Hawaii.
DATA ITEM COL UMW-:-.
SD[ ')r 30
C1TYPO 1P'J.-135
SL)=IAPP
SO?1P 1 1-14C
SDNAME 175-204
APFA1
APFPOP
AM HHN1IS 2-:13-2=112.
EhSPIP 211-P1-
STDI()
-olumns will bc zero Filled or t1; -sled
(12( cell el
DATA BASE DOCUMENTATION
PART II FILE DESCRIPTION
A TITLE
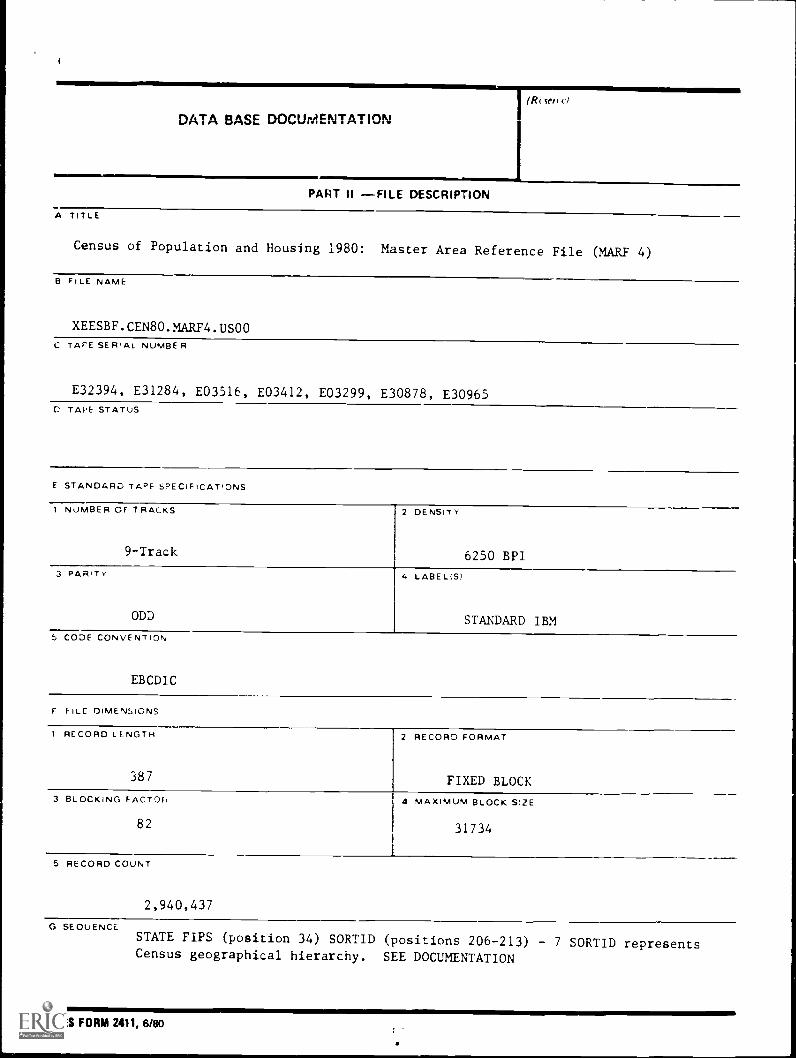
Census of Population and Housing 1980: Master Area Reference File (MARF 4)
8 FILE NAME
XEESBF.CEN80.MARF4.US00C TArE SERIAL NUMBER
E32394, E31284, E03516, E03412, E03299, E30878, E30965C TAPE STATUS
E STANDARD TAPE SPECIFICATIONS
1 NUMBER OF TRACKS
9-Track
2 DENSITY
6250 BPI3 PARITY
ODD
4 LABELS)
STANDARD IBM5 CODE CONVENTION
EBCDIC
F FILE OIMENSONS
1 RECORD LENGTH
387
2 RECORD FORMAT
FIXED BLOCK
3 BLOCKING FACTOR
82
4 MAXIMUM BLOCK S;ZE
31734
5 RECORD COUNT
2,940,437
G SEQUENCESTATE PIPS (position 34) SORTID (positions 206-213) - 7 SORTID representsCensus geographical hierarchy. SEE DOCUMENTATION
NCES FORM 2411.6/80
These equivalency files were created by the Bureau of the Census from school dis-
trict boundary maps furnished by the State Education Agencies in each state.
For additional information about these files or ordering information, contact:
William Freund Roy Nehrt
Data Systems Branch OR Elementary/Secondary Analysis Branch
(202) 254-5150 (202) 254-5690
National Center for Education StatisticsU.S. Department of EducationWashington, DC 20202
USER NOTE # 1September 15, 1983
Apportioned population and housing unit counts appearing in this file are carried
to two implied decimal places with an implied decimal point between the sixth and
seventh positions in each fleld. The fields affected are APPPOP beginning in pos-
ition 225 and APPHUNITS beginning in position 223 in each record.
USER NOTE # 2September 15, 1983
Disregard the section "File Structure and Geographic Coverage" on page 7.
This section should read:
MARF 3 and MARF 4 contain equivalency records for the lowest common geographic
areas presented on STF 1A, STF 1B, and STF 3A. The records appear in the same
sequence of geographic hiearchy as on STF 1A/STF 3A for MARF 3 and the STF 1B
sequence for MARF 4. The first 252 characters of each record on MARF 3 and MARF 4
contain the standard geographic identifiers contained in the 1980 summary tape
fil-s.
MARF 3 contains block group and enumeration district summary records. MARF 4 con-
tains block and enumeration district summary records.
In cases where a census geographic area is divided between two or more school dis-
tricts, the MARF record for this area will appear more than once with the respec-
tive school district identification numbers and apportionment factors.
Users wishing to identify the blocks, block groups, and enumeration districts that
lie within school district boundaries will need to sort the file to school district
identification number sequence. It is recommended that the "LDSDID" field begin-
ning in position 241 be used for this purpose.
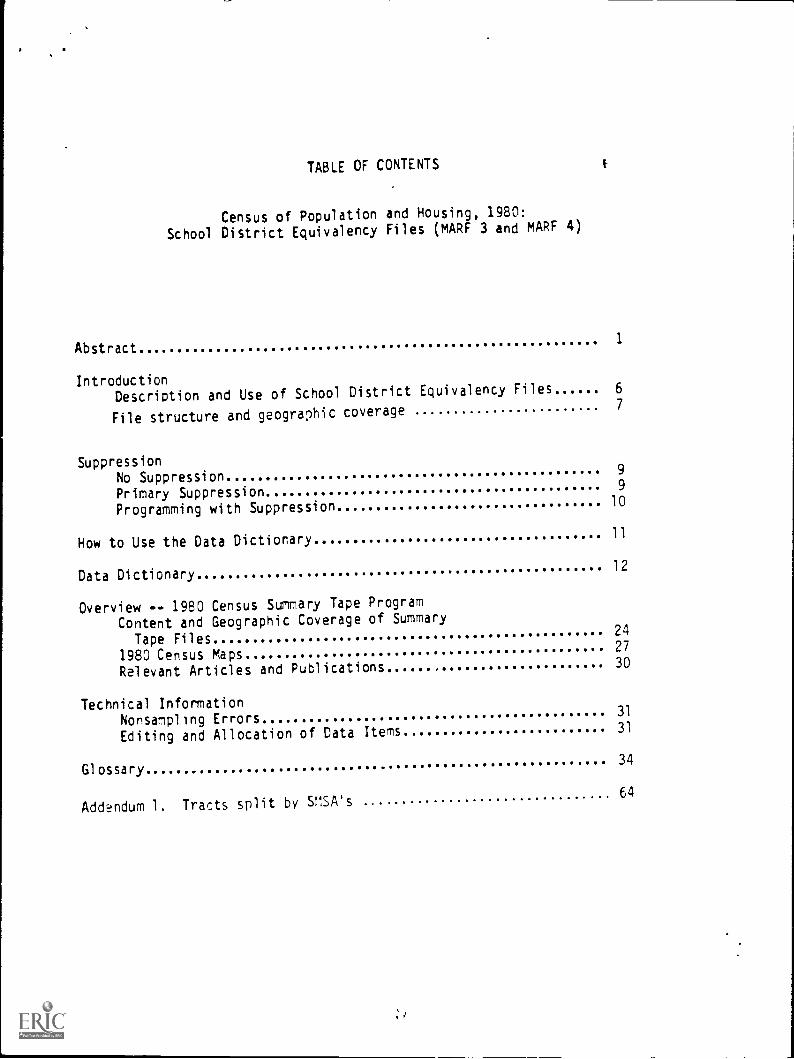
TABLE OF CONTENTS t
Census of Population and Housing, 1980:
School District Equivalency Files (MARF 3 and MARF 4)
Abstract1
IntroductionDescription and Use of School District Equivalency Files 6
File structure and geographic coverage7
SuppressionNo Suppression
9
Primary Suppression9
Programming with Suppression10
How to Use the Data Dictiorary11
Data Dictionary12
Overview -- 1980 Census Summary Tape Program
Content and Geographic Coverage of Summary
Tape Files24
1980 Census Maps27
Relevant Articles and Publications30
Technical InformationNonsampling Errors
31
Editing and Allocation of Data Items 31
Glossary34
Addendum 1. Tracts split by SMSA's ...64
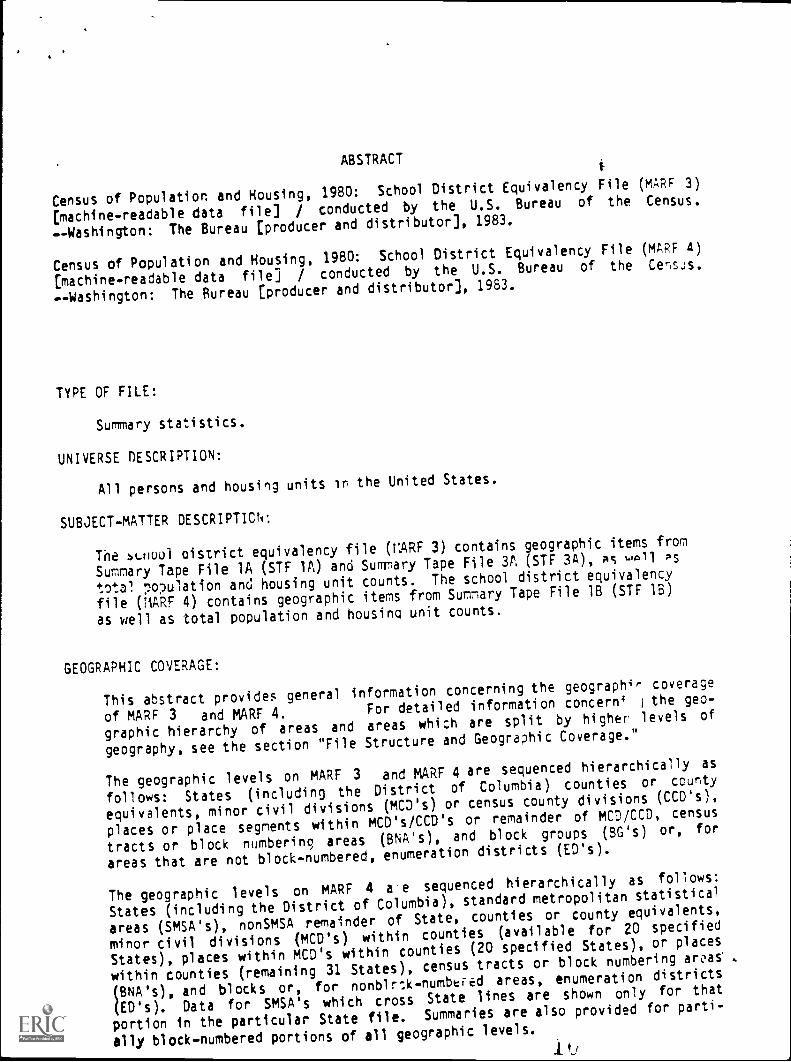
ABSTRACTi
Census of Population, and Housing, 1980: School District Equivalency File (MARF 3)
[machine-readable data file] / conducted by the U.S. Bureau of the Census.
--Washington: The Bureau [producer and distributor], 1983.
Census of Population and Housing, 1980: School District Equivalency File (MARF 4)
[machine-readable data file] / conducted by the U.S. Bureau of the Census.
--Washington: The Bureau [producer and distributor], 1983.
TYPE OF FILE:
Summary statistics.
UNIVERSE DESCRIPTION:
All persons and housing units in the United States.
SUBJECT-MATTER DESCRIPTICN:
The auluol oistrict equivalency file (KARF 3) contains geographic items from
Summary Tape File lA (STF 1A) and Summary Tape File 3A (STF 3A), As wail ps
total 7opulation and housing unit counts. The school district equivalency
file (11ARF 4) contains geographic items from Summary Tape File 1B (STF 1B)
as well as total population and housing unit counts.
GEOGRAPHIC COVERAGE:
This abstract provides general information concerning the geographer coverage
of MARF 3 and MARF 4.For detailed information concern' 1 the geo-
graphic hierarchy of areas and areas which are split by higher levels of
geography, see the section "File Structure and Geographic Coverage."
The geographic levels on MARF 3 and MARF 4 are sequenced hierarchically as
follows: States (including the District of Columbia) counties or county
equivalents, minor civil divisions ( MCD's) or census county divisions (CCD's),
places or place segments within MCD's/CCD's or remainder of MCD/CCD, census
tracts or block numbering areas (BNA's), and block groups (BG's) or, for
areas that are not block-numbered, enumeration districts (ED's).
The geographic levels on MARF 4 a e sequenced hierarchically as follows:
States (including the District of Columbia), standard metropolitan statistical
areas (SMSA's), nonSMSA remainder of State, counties or county equivalents,
minor civil divisions (MCD's) within counties (available for 20 specified
States), places within MCD's within counties (20 specified States), or places
within counties (remaining 31 States), census tracts or block numbering areas'
(BNA's), and blocks or, for nonblr-A-numbrued areas, enumeration districts
(ED's). Data for SMSA's which cross State lines are shown only for that
portion in the particular State file.Summaries are also provided for parti-
ally block-numbered portions of all geographic levels..tu
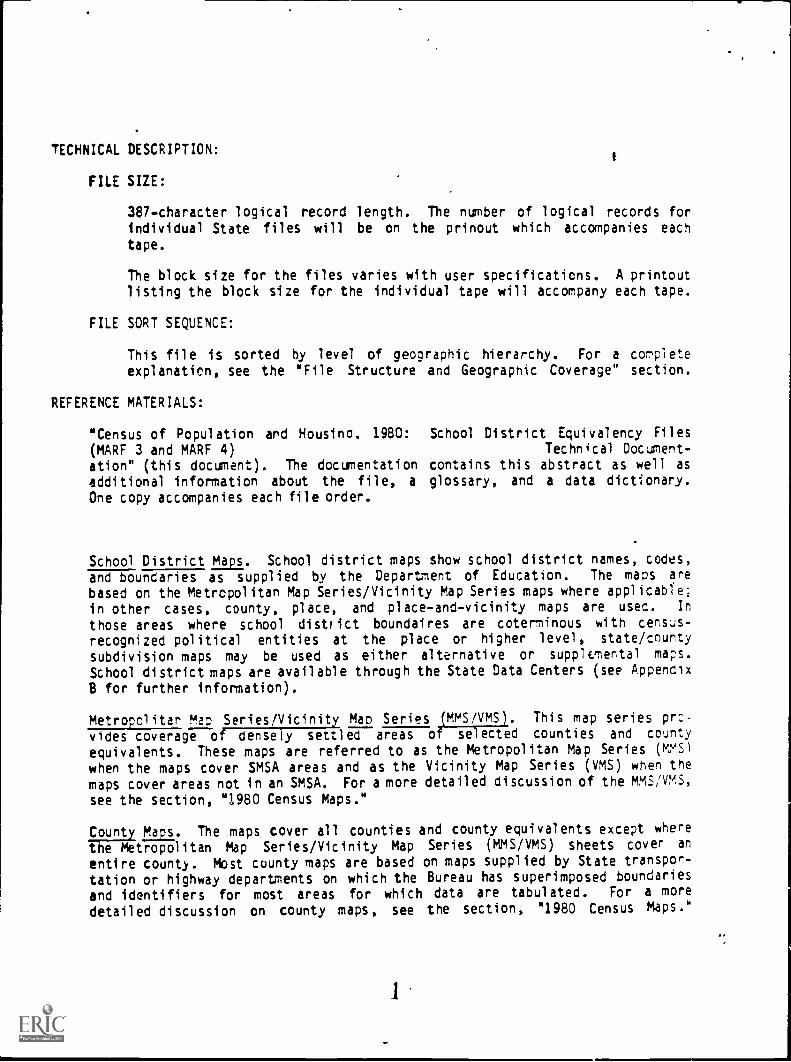
TECHNICAL DESCRIPTION:
FILE SIZE:
387-character logical record length. The number of logical records forindividual State files will be on the prinout which accompanies eachtape.
The block size for the files varies with user specifications. A printout
listing the block size for the individual tape will accompany each tape.
FILE SORT SEQUENCE:
This file is sorted by level of geographic hierarchy. For a complete
explanation, see the "File Structure and Geographic Coverage" section.
REFERENCE MATERIALS:
"Census of Population and Housino. 1980: School District Equivalency Files(MARF 3 and MARF 4) Technical Document-
ation" (this document). The documentation contains this abstract as well as
additional information about the file, a glossary, and a data dictionary.
One copy accompanies each file order.
School District Maps. School district maps show school district names, codes,
and boundaries as supplied by the Department of Education. The maps are
based on the Metropolitan Map Series/Vicinity Map Series maps where applicable;
in other cases, county, place, and place-and-vicinity maps are used. In
those areas where school district boundaires are coterminous with census-
recognized political entities at the place or higher level, state / county
subdivision maps may be used as either alternative or supplunental maps.
School district maps are available through the State Data Centers (see Appendix
B for further information).
Metropolitan Ml Series/Vicinity Mao Series (MMS/VMS). This map series prc
vides coverage of densely settled areas of selected counties and county
equivalents. These maps are referred to as the Metropolitan Map Series (YS)when the maps cover SMSA areas and as the Vicinity Map Series (VMS) when themaps cover areas not in an SMSA. For a more detailed discussion of the MMS/VMS,
see the section, "1980 Census Maps."
County Maps. The maps cover all counties and county equivalents except where
the Metropolitan Map Series/Vicinity Map Series (MMS/VMS) sheets cover an
entire count). Most county maps are based on maps supplied by State transpor-tation or highway departments on which the Bureau has superimposed boundaries
and identifiers for most areas for which data are tabulated. For a more
detailed discussion on county maps, see the section, "1980 Census Maps."
1
Census of Population and Housing, 1980: Summar Tape File 1B. STF 1B providesUiTTite-count population and houiTnidata. Data are summarized in hierarch-ical sequence for States, standard metropolitan statistical areas ( SMSA's),
nonSMSA remainder of State, counties, minor civil divisions (MCD's) withincounties (available for 20 specified States), places within MCD's withincounties (20 specified States) or places within counties (remaining 31 States),
census tracts or block numbering areas (BNA's), and blocks or, for nonblock-numbered areas, enumeration districts (ED's). Data for SMSA's which crossState lines are shown only for the portion in the particular State file.Summaries are also provided for partially block-numbered portions of allgeographic levels.
Census of Population and Housing, 1980: Summary Tape File IF, SchoolTriTtTicts. he School Districts file is a special tabulation that provioesSummary Tape File 1 population and housing data items, by State (includingthe District of Columbia), for school districts by county or county equivalent.
Census of Population and Housing, 1980: Summary Tape File 3A. STF 3A primarilycontains sample data inflated to represent the total population. The file alsocontains 100-percert counts and unweighted sample counts of persons and housingunits. Summaries are provided for the State or State equivalent, counties orcounty equivalents, minor civil divisions (MCD's) or census county divisions(CCD's), places or place segments within MCD's/CCD's and remainders of MCD's/CCD's, census tracts or block numbering areas (BNA's), and block groups (BG's)or, for areas that are not block-numbered, enumeration districts (ED's). Thesesummaries are provided in hierarchical sequence. Summaries are also presentedon File A for places and congressional districts. (1980 congressional districtdata presented in STF 3A are for districts delineated for the 96th Congress.)
Census of Population and Housing, 1980: Summary Tape File 3B. STF 3B
was originally part of the Census Bureau's 1980 program, but budget cutbacksforced cancellation of these plans. Since this cancellation, the Bureausigned a contract with National Ple,ning Data Corporation (NPDC) of Ithaca,New York to prepare STF 3B as a special tabulation. During the first18 months following the release of each State file (including the Districtof Columbia), users may purchase the file from NPDC. After eighteen months,the Bureau will sell the file as a standard public use computer tape.
STF 38 has records for each 5-digit ZIP code within a State in numeric orderfollowed by records for 5-digit ZIP codes within a State arranged in numericorder by SMSA or portion of SMSA, then county or county equivalent or portionof county or county equivalent.
Census of Population and Housing, 1980: Summary Tape File 3F, School Districts.The School DistrittsTile is a special tabulation that provfaiTTumnary TapeFile 3 data items, by State ( including the District of Columbia), for schooldistricts by county or county equivalent.
Summary files from the 1980 census will also be issued for all STF 1 throughST: 5 files. For more details on the 1980 census summary tape program, seethe overview section of the technical documentation.
Place Mips. Place maps are used for places not shown on MmS/VmS, and show
RTF-Teatures within the corporate limits of a m"nicipality or within bound-
aries established for a census designated place (CDP). If census boundaries
and identifier', for areas adjacent to a place are shown, the map ls referred to
as a place-and-vicinity map. For a more detailed discussion on place maps,
see the sortion, "1980 Census Maps."
For information about the availability of the above maps, write or call Data
User Services Division, Customer Services (Maps), Bureau of the Census,
Washington, D.C. 20233. Phone: (301) 763-4100.
Geographic Identification Code Scheme (GICS). The GICS is published in
the PHC80 -R:T series of reference reports. this series includes all named
geographic entities in the 1980 census, including regions, divisions, States,
counties, minor civil divisions ( MOD's) and census county divisions (COD's),
incorporated and census designated places, standard metropolitan statistical
areas (SMSA's), standard consolidated statistical areas (SCSA's), urbanized
areas (UA's), American Indian reservations, and Alaska Native villages. Toe
GICS also contains t'.11 5-digit Federal Information Processing Standards
(FIPS) codes. These reports will be available early in 1903 from the Govern-
ment Printing Office.
PHC80-R1. Users' Guide. This publication is a comprehensive guide to 1980
census data. It covers 1.98' census subject content, procedures, geography,
statistical products, limitations of the data, sources of user assistance,
notes on data use, d glossary of terms, and guides for locating data it reports
and tape files. The guide is issued In looseleaf form and sold in parts
(R1-A, -B, etc.) as they are prepared. Part A, Text is currently available
from the Superintendent of Documents, U.S. Government Printing Office, Washing-
ton, D.C. 20402. S/N 003- 024 - 03625 -8. Price is $5.50.
Month Product Announcement (MPA) New Census Bureau products released
each month are listed in the MPA. These product; include publications,
technical documentation, data files, published maps, and microfiche. To
be added to the mailing list, contact Data User Services Division, Customer
Services (Publications), Bureau of the Census, Washington, D.C. 20233.
RELATED MACHINE-READABLE FILES:
Listed below are some of the 1980 census data f,tes which have been or will
be released.
Census of Population and Housing, 1980: Summary Tape File 1A. STF 1A provides
7FirrTrete-count populiTion and hoJi775-data. Data are summarized for the State
or State equivalent, counties or county equivalents, minor civil divisions
( MCD's) or census county divisions (CCD's), places or place segments within
MCD/CCD's and remainders of MCD's/CCD's, census tracts or block numbering
areas (BNA's), and block groups (BG's) or, for areas that are not block-
numbered, enumeration district,. These summaries are provided in hierarchical
sequence. Summaries are also presented for places and congressional districts.
(1980 congressional distrir, data presented in STF 1 is for districts delin-
eated for the 96th Congress.)
INTRODUCTION I
Description and Use of School District Equivalency Files
A school district is a local government agency with the respohsibility forproviding educational services to the residents of a defined area. The areamay be coextensive with other geopolitical areas in a State or States (e.g.counties) or may be an entirely independent area. There are two school districtcensus geography equivalency files or "geographic cross-reference files." Onewas developed for usage with the standard 1980 census STF lA and STF 3A datafiles; the other was developed for usage with the STF 18 data files. Both areavailable on a State-by-State basis.
Each of these files associates the school district identification number(s)with the smallest level of census geography on the file--block or ED for theSTF 1B equivalency file and block group or ED for the STF 1A/3A equivalencyfile. The geographic levels on these files are in the same sequence as theSTF 1B or STF 1A/3A. Also included are population and housing unit counts for_.-
these levels and a flag to indicate those blocks, block groups, or ED's whichare split by school district boundaries. For these split blocks, block groups,and ED's, the percentage of tha population and housing unit counts assigned toeach school district is also shown.
These equivalency nr geographic cross-reference files have been created to allowthe user to prepare additional data summaries relevant to school districts. Forexample, by using the STF 18 (or STF 1A/3A) equivalency file in conjuncti-i withthe standard STF 1B (or STF 1A/3A) data files, one could identify the blocs, blockgroups, ED's, or parts of each that are components of each school district.
Additionally, by equating these school district components, one could furthersubdivide the school districts into subdistricts defined in terms of their owngeography or in terms of census geography without an equating process. Onecould manipulate the school district components to change boundaries for schooldistricts, i.e., create alternative school districts. Similarly, a user couldadd or delete the data summaries for specific blocks, ED's, or block groups in aschool district by using STF 1A, STF 1B, or STF 3A in conjunction with the STF IFand STF 3F school district summaries, thereby obtaining data summaries for alter-nate boundaries. This approach might be used to update the STF 1F and STF 3Ffiles for school district boundary changes over time.
One could also prepare more detailed data summaries for a school district bymanipulating the equivalency files to create new equivalency files similar tothe geography related to STF 2A or STF 4A. The STF 2A and STF 4A files are,however, restricted to tracted areas. Similarly, STF 28 or STF 4B could be usedwhen working with the MCC /CCD level as the lowest geographic area. Since theCensus Bureau developed the original STF 1F and STF 3F files using unsuppressedinternal summaries at a lower geographic level than available to those using thestandard STF 1A/3A or STF 18 files, any such manipulation mly not yield theexact same results.
Another use for the equivalency files is to provide the ability to equatedetail record files having school district codes with census geographic units.This capability could be used to relate administrative record summaries withcensus geographic data.
I6
Census of Population and Housing, 1980: Master Area Reference File (mlF).
An extract of STF 07-this file contains numeric codes and names (where
appropriate) of geographic areas plus selected complete count population
and housing data.
Census of Population and Housing, 1980: P.L. 94-171 Population Counts. This
file provides counts for the total population and provisional counts for five
racial categories and Spanish/Hispanic origin. The figures presented in P.L.
94-171 may differ from those shown in MARF. The changes reflect corrections
of errors found after P.L. 94-171 was prepared. Microfiche of the P.L. 94-171
Population Counts file is also available.
FILE AVAILABILITY:
The School District Equivalency Files (MARE 3 and MARF 4) are available on a
state-by-state basis from the state education agencies and state data centers.
A national file is available from the National Center for Education Statistics.
State files may be purchased from state educational agencies and state data
centers. The national file may be purchased by contacting:
Data Systems BranchNational Center for Education Statistics
U.S. Department of Education
Washington, DC 20202
5
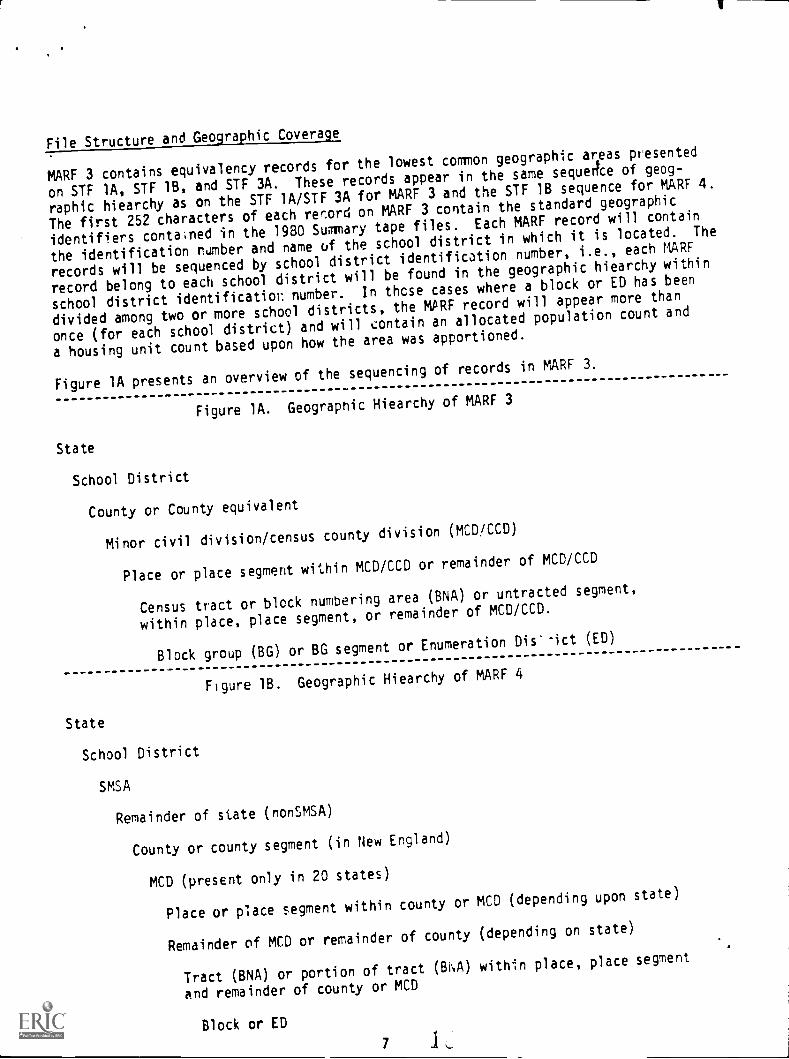
File Structure and Geographic Coverage
MARF 3 contains equivalency records for the lowest common geographic areas presented
on STF 1A, STF 1B, and STF 3A. These records appear in the same sequertce of geog-
raphic hiearchy as on the STF 1A/STF 3A for MARF 3 and the STF 1B sequence for MARE 4.
The first 252 characters of each record on MARF 3 contain the standard geographic
identifiers contained in the 1980 Summary tape files. Each MARF record will contain
the identificationnumber and name of the school district in which it is located. The
records will be sequenced by school district identificationnumber, i.e., each MARE
record belong to each school district will be found in the geographic hiearchy within
school district identification: number. In those cases where a block or ED has been
divided among two or more school districts, the MPRF record will appear more than
once (for each school district) and will contain an allocated population count and
a housing unit count based upon how the area was apportioned.
Figure lA presents an overview of the sequencing of records in MARF 3.
Figure 1A. Geographic Hiearchy of MARF 3
State
School District
County or County equivalent
Minor civil division/census county division (MCD/CCD)
Place or place segment within MCD/CCD or remainder of MCD/CCD
Census tract or block numbering area(BNA) or untracted segment,
within place, place segment, orremainder of MCD/CCD.
Block group (BG) or BG segment orEnumeration Dis' -ict (ED)
Figure 1B. Geographic Hiearchy of MARF 4
State
School District
SMSA
Remainder of state (nonSMSA)
County or county segment (in New England)
MCD (present only in 20 states)
Place or place segment within county or MCD (depending upon state)
Remainder of MCD or remainder of county (depending on state)
Tract (BNA) or portion of tract (BRA) within place, place segment
and remainder of county or MCD
Block or ED
7
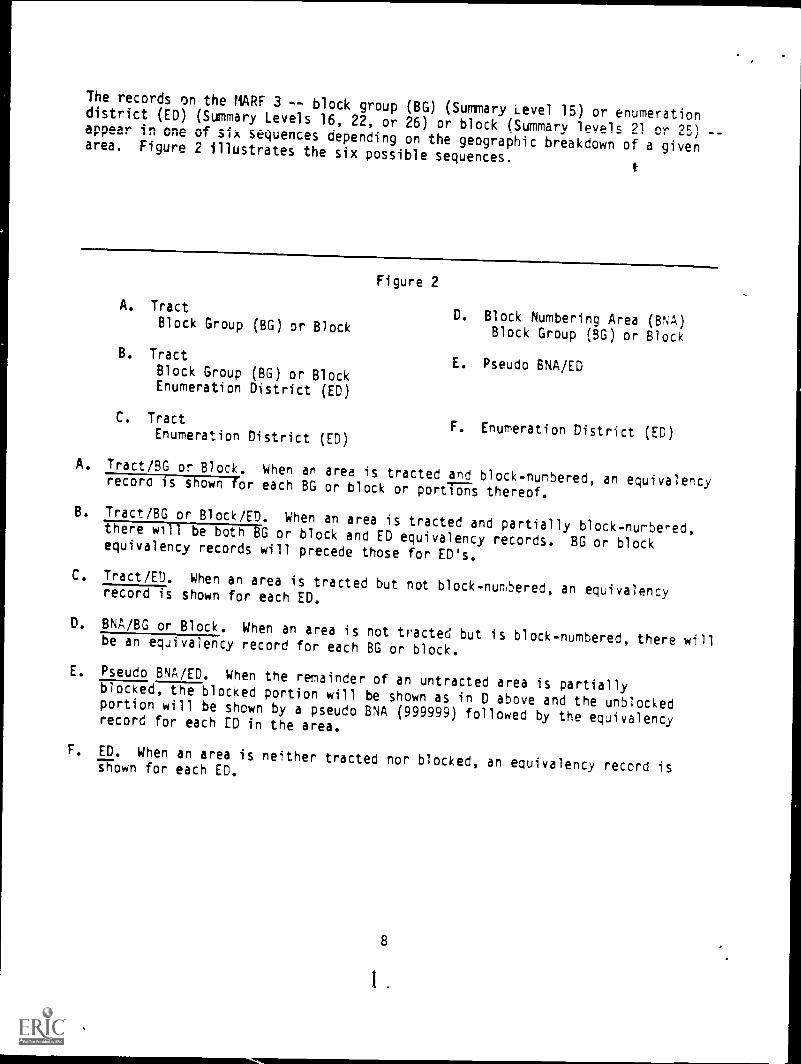
The records on the MARF 3 -- block group (BG) (Summary Level 15) or enumerationdistrict (ED) (Summary Levels 16, 22, or 26) or block (Summary levels 21 or 25) --appear in one of six sequences depending on the geographic breakdown of a givenarea. Figure 2 illustrates the six possible sequences.
Figure 2
A. TractD. Block Numbering Area (BNA)Block Group (BG) or Block
Block Group (BC) or Block
B. TractE. Pseudo BNA/ED
Block Group (BG) or BlockEnumeration District (ED)
C. TractF. Enumeration District (ED)Enumeration District (ED)
A. Tract/BG or Block. When an area is tracted and block-numbered, an equivalencyrecord is shown for each BG or block or portF-s thereof.
B. Tract/BG or Block/ED. When an area is tracted and partially block-numbered,there will be both BG or block and ED equivalency records. BG or blockequivalency records will precede those for ED's.
C. Tract/ED. When an area is tracted but not block-num5ered, an equivalencyrecord is shown for each ED.
D. BNA/BG or Block. When an area is not tracted but is block-numbered, there willbe an equivalency record for each BG or block.
E. Pseudo BNA/ED. When the remainder of an untracted area is partiallyblocked, the blocked portion will be shown as in D above and the unblockedportion will be shown by a pseudo BNA (999999) followed by the equivalencyrecord for each ED in the area.
F. ED. When an area is neither tracted nor blocked, an equivalency record isshown for each ED.
8
1
SUPPRESSION
In order to maintain the confidentiality promised respondents and
required by law, it is necessary for the Census Bureau to make sure
that its public data, in print or on tape, do not disclose
information about any individual. Therefore, the Bureau suppresses
tabulations of characteristics of very small groups of people or
housing units. On summary tapes, zeroes are entered in suppressed
cells and flag fields which indicate suppression are shown on each
record. However, a zero in a cell does not automatically mean
suppression. Only by checking the suppression flag can it be
determined if the zero for a specific item is suppressed data or an
actual count of zero.
This discussion outlines the rules for suppression of 100-percent
data as it applies to the variables on MARE. For a more extensive
discussion of suppression, see Census of Population and Housing,
1980: Summary Tape File 1 Technical Documentation.
No Suppression__-
Several basic counts are never suppressed, even if there is a count
of only one. They are as follows:
Total populationTotal housing unitsOccupied unitsCount of persons and households in
each race or Spanish origin group
Primary Sumnression
Suppression of Population Characteristics. Characteristics of
persons other than race or Spanish origin (e.g., age, relationship)
are shown only if there are 15 or more persons in the geographic
area. For example, on a record for an enumeration district with a
population of 1 to 14 persons, the number of persons in group
quarters is suppressed. Only counts for total population and the
number of persons within specific race or Spanish origin groups are
provided.
However, when the geographic area being summarized has 15 or more
persons, no suppression of population characteristics will occur- -
except possibly when tables are cross-classified by race or Spanish
origin- No data are cross-classified on the MARF file.
Suppression of Family, Household, or Occupied Housing
Characteristics. Characteristics of families, households, or
occupied housing units are shown if there are at least five occupied
housing units within the geographic area tabulated.
9
Suppression of Owner or Rental Characteristics.Distributions of
data for owners or renters are shown when the number of owners is at
least five and the number of renters is also at least five.
Programming with Suppression
Suppressed data cells contain zeroes. To distinguish between zeroes
as suppression and zeroes as valid data, occurrences of suppression
are .identified by a series of flag fields in the geographic
identification portion of each logical record. Programmers
developing software may wish to include procedures to check these
fields for the presence of suppression and if necessary, to flag the
output of any cumulation which includes one or more suppressed
fields.
In reviewing the data dictionary, the programmer can determine which
suppression flags indicate suppression for particular items by
checking either the item description or the flag description.
10
HOW TO USE THE DATA DICTIONARY
This computer-generated report documents the data contents and the
record layout of the file. Below, is a brief descrietion of the
information provided for each data item.
The first line of each data item description gives the name,
size/scale, begin position, and the variable label. Following those
items, on subsequent lines, are any applicable notes and value codes.
Each of these items is defined below.
1. Name. This is an arbitrarily assigned 8 character
identifier. It may be a mnemonic such as "STATE" or
"EDNUMBER", or sequential identifiers such as "SUPFLG1",
"SUPFLG2R, etc.
2. Size/Scale. The size of a data item is given in characters.
The scale of a data item is given in integer powers of 10.
Implied decimals or multipliers (in integer powers of ten
only) are indicated by a "-" or a "+" followed be a number.
For example, 123.45 would appear on the data tape as 12345,
and the size/scale value would be 5/-2. A number recorded
in thousands (12,345,000 for example) would appear on the
data tape as 12345 and the size/scale value would be 5/1.3.
Scale factors which are not an integer power of ten are
identified in the notes following the label, and in the
footnotes.
3. Begin. This is the location in the data record of the first
character of the data item.
4. Data Type. The data type indicates whether the data item is
alphanumeric (A) or numeric (N).
5. Description. Following the Data Type is a description of
the data item. This heading is not labeled on the data
dictionary. This section also provides any relevant notes
or footnote references. In addition, any value codes
necessary for the data item are listed and labeled here.
Note: Since the standard geographic identificationformat for 1980 census surviary
tapes is used on the MARF 3files, all geographic identifiers
are included in the Data Dictionary. However, the description indicates if the
identifier is not applicable to MARE files.
The MARE 3, MARE 4, and MARE 5 files all use the basic MARF records presented in
the Data Dictionary with the following modifications.
11
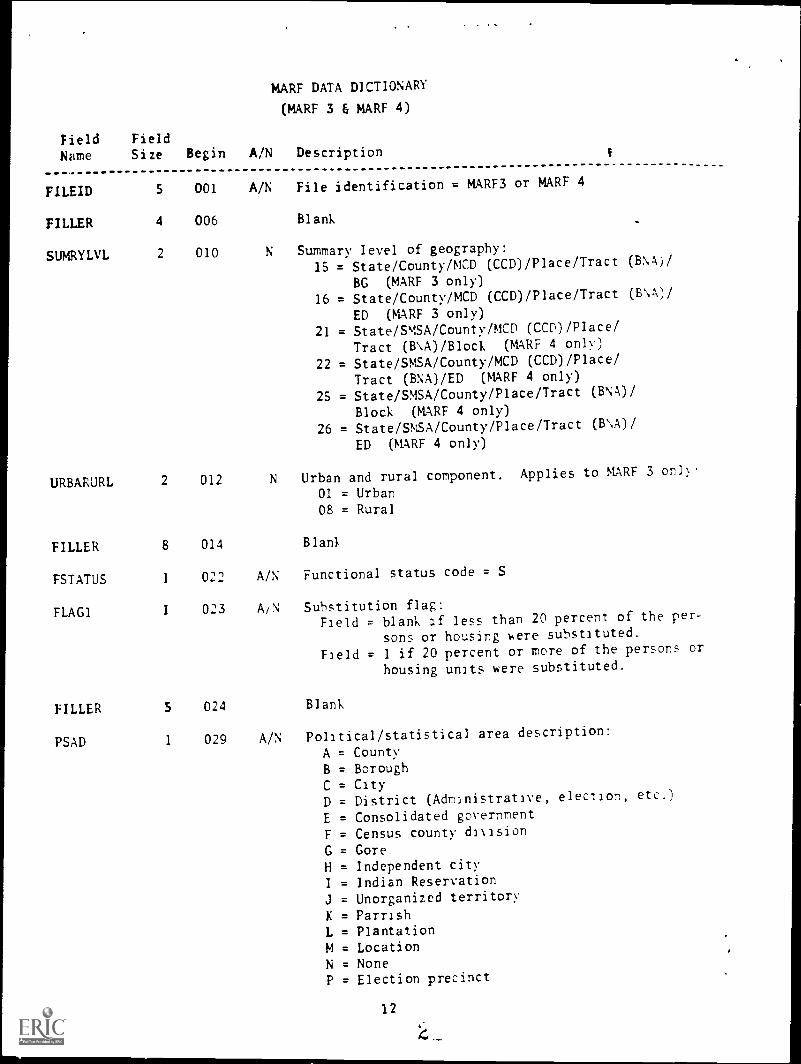
MARF DATA DICTIONARY
(MARF 3 & MARF 4)
Field Field
Name Size Begin A/N Description
FILEID 5 001 A/N File identification = MARF3 or MARF 4
FILLER 4 006 Blank
SUMRYLVL 2 010 N Summary level of geography:
15 = State/County/MCD (CCD)/Place/Tract (BNA)/
BG (MARF 3 only)
16 = State/County/MCD (CCD)/Place/Tract (B \A)/
ED (MARF 3 only)
21 = State/SMSA/County/MCD (CCD)/Place/
Tract (B \A) /Block (MARF 4 only)
22 = State/SMSA/County/MCD (CCD)/Place/
Tract (BNA)/ED (MARF 4 only)
25 = State/SMSA/County/Place/Tract (BNk)/
Block (MARF 4 only)
26 = State/SMSA/County/Place/Tract (BNA)/
ED (MARF 4 only)
URBARURL 2 012 N Urban and rural component. Applies to MARF 3 or])
01 = Urban08 = Rural
FILLER 8 014 Blank
FSTATUS 1 022 A/N Functional status code = S
FLAG] 1 023 A/N Substitution flag:Field . blank if less than 20 percent of the per-
sons or housing were substituted.
Field = 1 if 20 percent or more of the persons or
housing units were substituted.
FILLER 5 024 Blank
PSAD 1 029 A/N Political/statistical area description:
A = CountyB = BoroughC = CityD = District (Administrative, election, etc.)
E = Consolidated governmentF = Census county divisionG = GoreH = Independent cityI = Indian Reservation
J = Unorganized territoryK = ParrishL = PlantationM = LocationN = NoneP = Election precinct
12
MARE DATA DICTIONARY
Field Field
Name Size Begin A/N Description
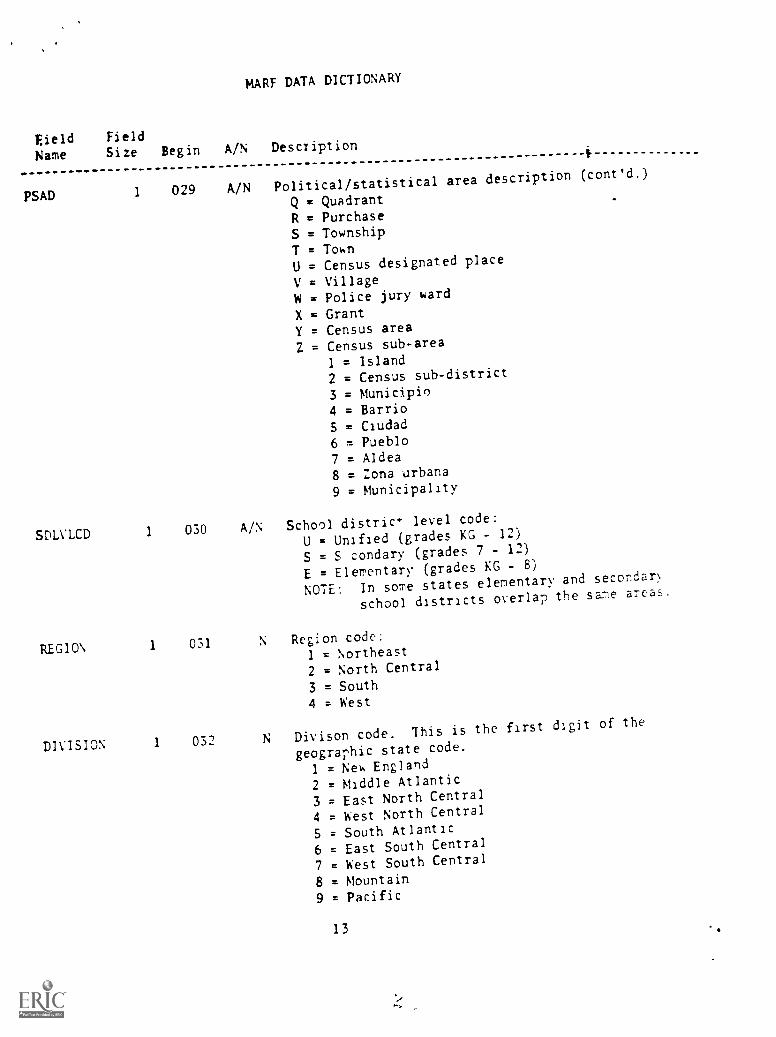
PSAD
E
1 029 A/N Political/statistical area description (cont'd.)
Q = QuadrantR = PurchaseS = TownshipT = TownU = Census designated place
V = VillageW = Police jury ward
X = GrantY = Census areaZ = Census sub-area
1 = Island2 = Census sub-district
3 = Municipio4 = Barrio5 = Ciudad6 = Pueblo7 = Aldea8 = Zona urbana9 = Municipality
SDLVLCD 1 030 A/N School district level code:
U = Unified (grades KG - 12)
S = S condary (grades 7 - 12)
E = Elementary(grades KG - 8)
NOTE: In some states elementary and secondar\
school districtsoverlap the same areas.
REGION 1 031 N Region code:1 = Northeast2 = North Central
3 = South4 = West
DIVISION 1 032 N Divison code. This is the first digit of the
geographic state code.
1 = Ner, England
2 = Middle Atlantic
3 = East North Central
4 = West North Central
5 = South Atlantic
6 = East South Central
7 = West South Central
8 = Mountain9 = Pacific
13
MARF DATA DICTIONARY
Field Field E
Name Size Begin A/N Description.. _
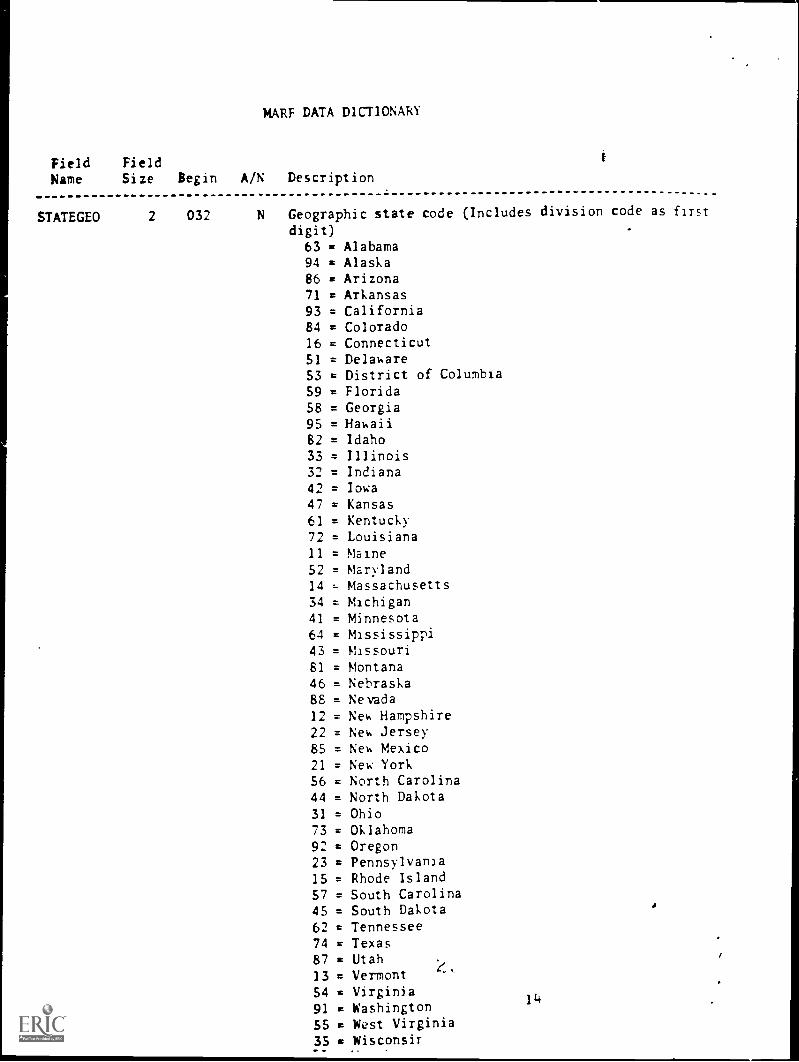
STATEGEO 2 032 N Geographic state code (Includes division code as first
digit)
63 = Alabama94 = Alaska86 = Arizona71 = Arkansas93 = California84 = Colorado16 = Connecticut51 = Delaware53 = District of Columbia59 = Florida58 = Georgia95 = Hawaii82 = Idaho33 = Illinois32 = Indiana42 = Iowa47 = Kansas61 = Kentucky72 = Louisiana11 = Maine52 = Maryland14 Massachusetts34 . Michigan41 = Minnesota64 = Mississippi43 = Missouri81 = Montana46 = Nebraska88 = Nevada12 = New Hampshire22 = New Jersey85 = New Mexico21 = New York56 = North Carolina44 = North Dakota31 = Ohio73 = Oklahoma92 = Oregon23 = Pennsylvania15 = Rhode Island57 = South Carolina45 = South Dakota62 = Tennessee74 = Texas87 = Utah13 = Vermont54 = Virginia91 = Washington
14
55 = West Virginia35 = Wisconsir
/
MARF DATA DICTIONARY
Field Field
Name Size Begin A/N Description
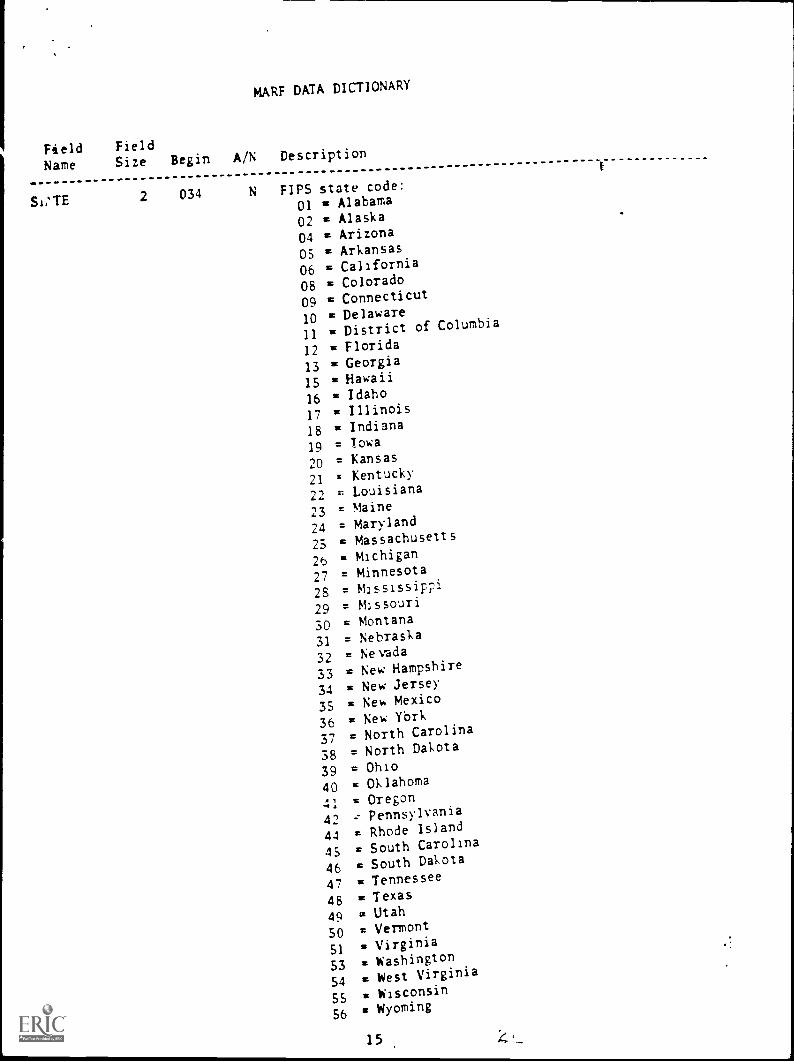
SI;TE 2 034 N FIPS state code:01 a Alabama
02 = Alaska
04 = Arizona
05 = Arkansas
06 = California
08 = Colorado
09 = Connecticut
10 = Delaware
11 = District of Columbia
12 = Florida
13 = Georgia15 = Hawaii
16 = Idaho
17 = Illinois
18 = Indiana
19 = Iowa
20 = Kansas
21 = Kentucky
22 = Louisiana
23 = Maine
24 = Maryland
25 = Massachusetts
26 = Michigan
27 = Minnesota
28 = Mississippi
29 = Missouri
30 = Montana
31 = Nebraska
32 = Nevada
33 = New Hampshire
34 = New Jersey
35 = New Mexico
36 = New YOrk
37 = North Carolina
38 = North Dakota
39 = Ohio
40 = Oklahoma
41 = Oregon
42 --- Pennsylvania
44 = Rhode Island
45 = South Carolina
46 = South Dakota
47 = Tennessee
48 = Texas
49 = Utah
50 = Vermont
51 = Virginia
53 = Washington
54 = West Virginia
55 it Wisconsin
56x Wyoming
15 4
Field Field
MARF DATA DICTIONARY
Name Size Begin A/N Description
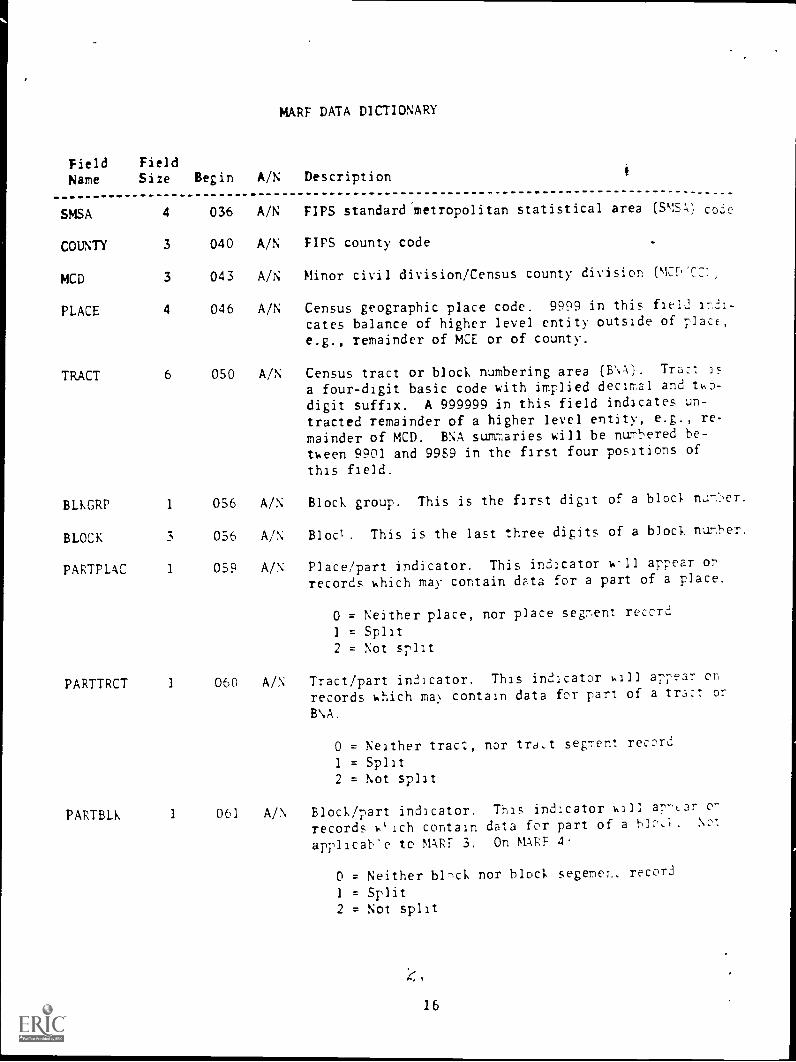
SMSA 4 036 A/N FIPS standard' metropolitan statistical area (SMS.) code
COUNTY 3 040 A/N FIPS county code -
MCD 3 043 A/N Minor civil division/Census county division rq,71-,'C::,
PLACE 4 046 A/N Census geographic place code. 9999 in this fief indi-
cates balance of higher level entity outside of placE,
e.g., remainder of MCE or of county.
TRACT 6 050 A/N Census tract or block numbering area (B \A). Tract 25
a four-digit basic code with implied decimal and tv,o-
digit suffix. A 999999 in this field indicates un-tracted remainder of a higher level entity, e.g., re-mainder of MCD. BNA summaries will be nurhered be-
teen 9901 and 9989 in the first four positions of
this field.
BLbGRP 1 056 A/N Block group. This is the first digit of a bloc), naml,er.
BLOCK 3 056 A/N Blocl. This is the last three digits of a block number.
PARTPLAC 1 059 A/N Place/part indicator. This indicator -11 appear or
records which may contain data for a part of a place.
0 = Neither place, nor place segment record
1 = Split2 = Not split
PARTTRCT 1 060 A/N Tract/part indicator. This indicator hill appear or
records which ma) contain data for part of a tract or
B \A.
0 = Neither tract, nor trdLt segment record
1 = Split
2 = Not split
PARTBLK 1 061 A/\ Block/part indicator. This indicator aT7car c^
records wish contain data for part of a blo,;. No
applicah'e tc MARI- 3. On MA1:F 4
0 = Neither block nor bloc). segemen, record
1 = Split2 = Not split
16
FieldName
FieldSize Begin A/N
MARF DATA DICTIONARY
Description
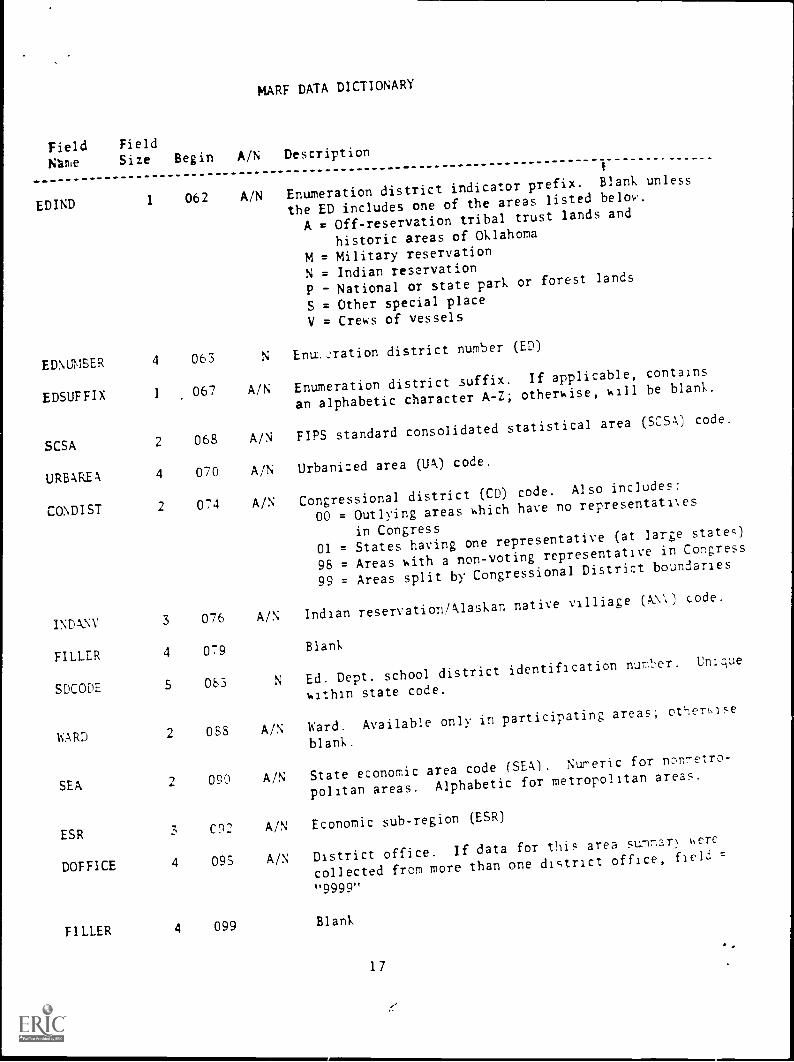
EDIND 1 062 A/N Enumeration district indicator prefix. Blank unless
the ED includes one of the areas listed below.
A = Off-reservation tribal trust lands and
historic areas of Oklahoma
M = Military reservation
N = Indian reservation
P - National or state park or forest lands
S = Other special place
V = Crews of vessels
EDNLNBER 4 063 N Enu..:1-ation district number (ED)
EDSUFFIX 1 067 A/N Enumeration district suffix. If applicable, contains
an alphabetic character A-Z;otherwise, will be blank.
SCSA 2 068 A/N FIPS standard consolidated statistical area (SCSA) code.
URBAREA 4 070 A/N Urbanized area (UA) code.
CONDIST 2 074 A/N Congressional district (CD) code. Also includes:
00 = Outlying areaskhich have no representatixes
in Congress
01 = States having one representative (at large states)
98 = Areas kith a non-voting representativein Congress
99 = Areas split by CongressionalDistrict boundaries
INDANV 3 076 A/N Indian reservation/Alaskannative villiage (XV,) code.
FILLER 4 079 Blank
SDCODE 5 063 N Ed. Dept. school district identification number. Uni.-iue
within state code.
WARD 2 088 A/N Ward. Available only in participating areas; otherwise
blank.
SEA 2 090 A/N State economic area code (SEA). Numeric for nnrsetro-
politan areas. Alphabetic for metropolitan areas.
ESR 3 C22 A/N Economic sub-region (ESR)
DOFFICE 4 095 A/N District office. If data for this area sum7ar %,ere
collected from more than one district office, field, .,--
"9999"
FILLER 4 099 Blank
17
MARF DATA DICTIONARY
Field Field
Name Size Begin A/N Description
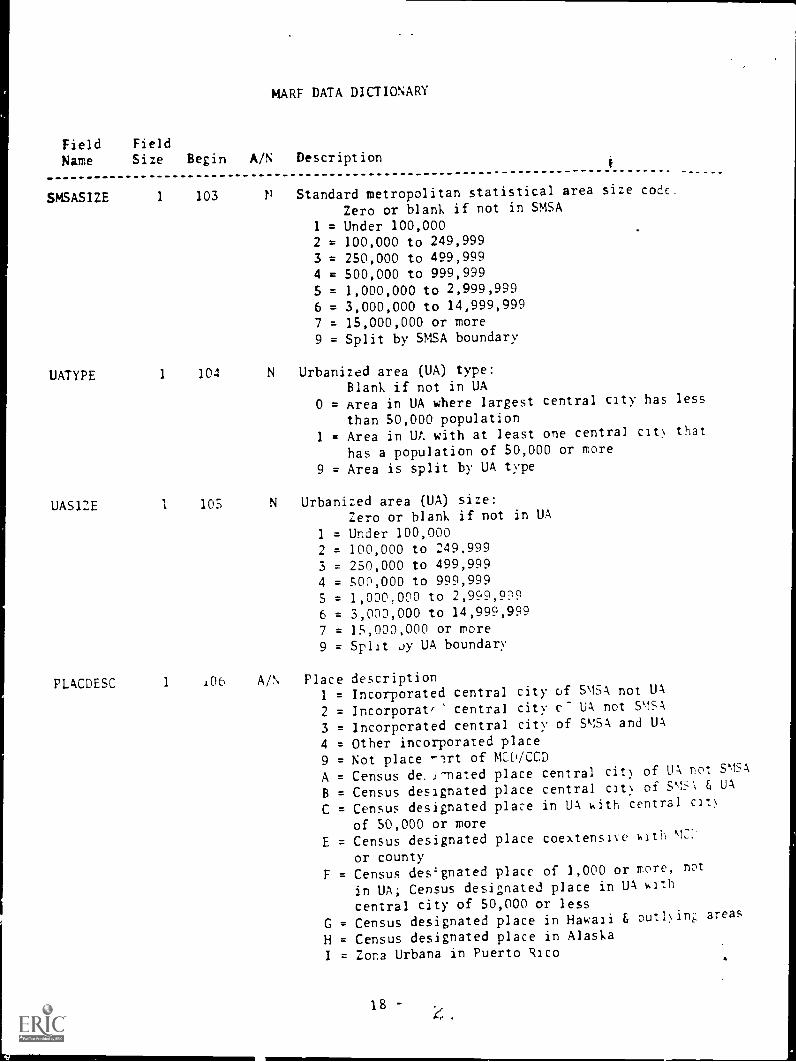
SMSASIZE 1 103 F Standard metropolitan statistical area size code.
Zero or blank if not in SMSA
1 = Under 100,0002 = 100,000 to 249,9993 = 250,000 to 499,9994 = 500,000 to 999,9995 = 1,000,000 to 2,999,9996 = 3,000,000 to 14,999,9997 = 15,000,000 or more9 = Split by SMSA boundary
UATYPE 1 104 N Urbanized area (UA) type:Blank if not in UA
0 = area in UA where largest central city has less
than 50,000 population1 = Area in UA with at least one central city that
has a population of 50,000 or more
9 = Area is split by UA type
UA512E 1 105 N Urbanized area (UA) size:Zero or blank if not in UA
1 = Under 100,0002 = 100,000 to 249,9993 = 250,000 to 499,9994 = S00,000 to 999,9995 = 1,000,000 to 2,999,9096 = 3,000,000 to 14,999,9997 = 15,000,000 or more9 = Split uy UA boundary
PLACDESC 1 106 A/N Place descriptionI = Incorporated central city of SMSA not UA
2 = Incorporat, central city c- UA not PISA
3 = Incorporated central city of 5k15 and UA
4 = Other incorporated place9 = Not place -1rt of MCD/CCD
A = Census de.1-nated place central cit) of UA not PISA
B = Census designated place central cat\ of 5',:S 6 UA
C = Census designated place in UA k.ith central cit)
of 50,000 or moreE = Census designated place coextensive uith '1:1'
or countyF = Census designated place of 1,000 or more, not
in UA; Census designated place in UA v.ith
central city of 50,000 or less
G = Census designated place in Hawaii & outlying. areas
H = Census designated place in Alaska
I = Zona Urbana in Puerto Rico ,
18
MARF DATA DICTIONARY
Field Field
Name Size Begin A/N Description
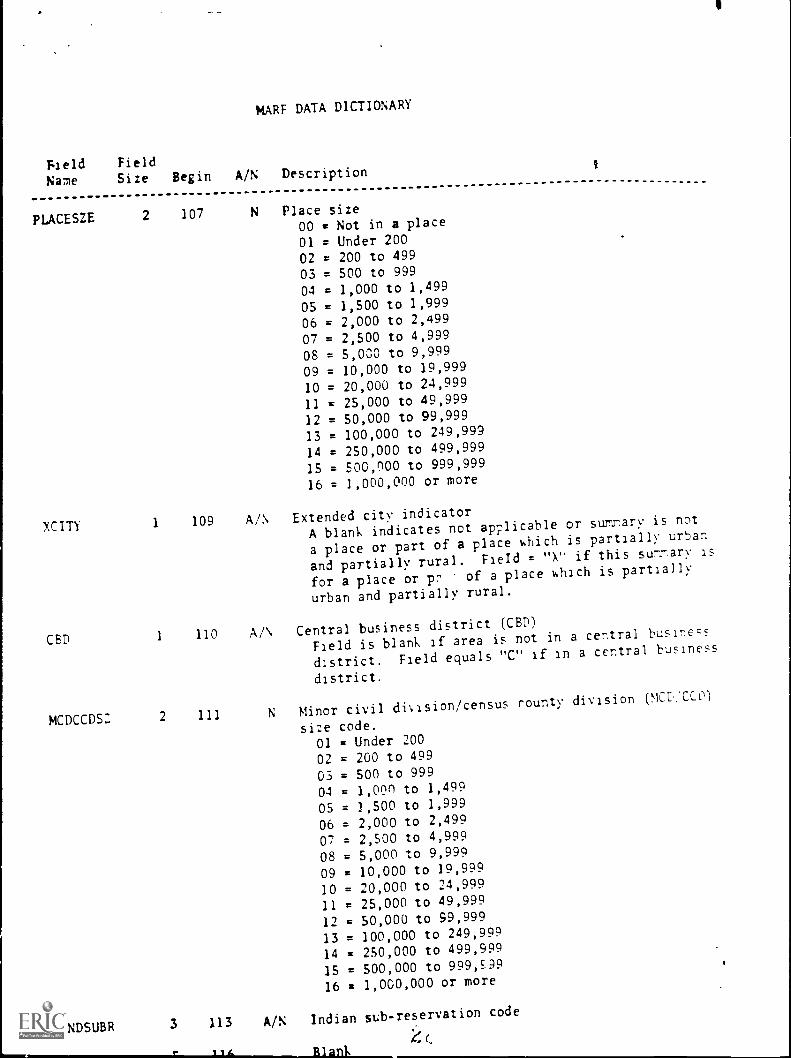
PLACESZE 2 107 N Place size00 = Not in a place
01 = Under 20002 = 200 to 49903 = 500 to 99904 = 1,000 to 1,499
05 = 1,500 to 1,999
06 = 2,000 to 2,499
07 = 2,500 to 4,999
08 = 5,000 to 9,999
09 = 10,000 to 19,999
10 = 20,000 to 24,999
11 = 25,000 to 49,999
12 = 50,000 to 99,999
13 = 100,000 to 249,999
14 = 250,000 to 499,999
15 = 500,000 to 999,999
16 = 1,000,000 or more
XCITY
CBD
1 109 A/N Extended city indicator
A blank indicates not applicable or sumrary is not
a place or part of a place which is partially urban
and partially rural. Field = "X" if this sum7ary is
for a place or p^ of a place which is partially
urban and partially rural.
1 110 A/\ Central business district (CBD)
Field is blank if area is not in a central busaners
district. Field equals "C" if in a central business
district.
MCDCCDS: 2 111 N Minor civil division /census county division (MCD:CCO)
size code.01 = Under 20002 = 200 to 49903 = 500 to 99904 = 1,00n to 1,499
OS = 1,500 to 1,999
06 = 2,000 to 2,499
07 = 2,500 to 4,999
08 = 5,000 to 9,999
09 = 10,000 to 19,999
10 = 20,000 to 24,999
11 = 25,000 to 49,999
12 = 50,000 to 99,999
13 = 100,000 to 249,999
14 = 250,000 to 499,999
15 = 500,000 to 999,C.'99
16 = 1,000,000 or more
INDSUBR 3 113 A/N Indian sub-reservation code
MARF DATA DICTIONARY
Field FieldName Size Begin A/N Description i
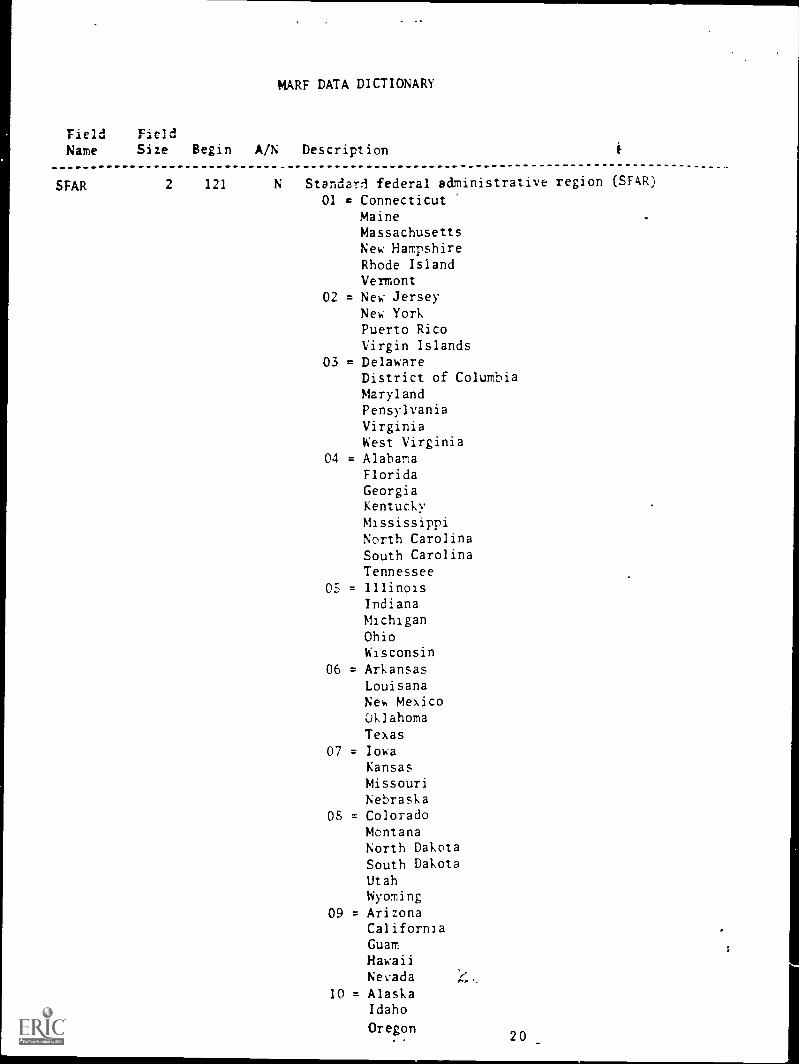
SFAR 2 121 N Standard federal administrative region (SFAR)
01 = ConnecticutMaineMassachusettsNew HampshireRhode IslandVermont
02 = New JerseyNew YorkPuerto RicoVirgin Islands
03 = DelawareDistrict of ColumbiaMarylandPensylvaniaVirginiaWest Virginia
04 = AlabamaFloridaGeorgiaKentuckyMississippiNorth CarolinaSouth CarolinaTennessee
OS = IllinoisIndiana
MichiganOhioWisconsin
06 = ArkansasLouisanaNel, Mexico
OklahomaTexas
07 = IowaKansas
MissouriNebraska
OS = ColoradoMontanaNorth DakotaSouth DakotaUtahWyoming
09 = ArizonaCaliforniaGuamHawaii
Nevada --10 = Alaska
Idaho
Oregon20
Field Field
MARF DATA DICTIONARY
Name Size Begin A/N Description
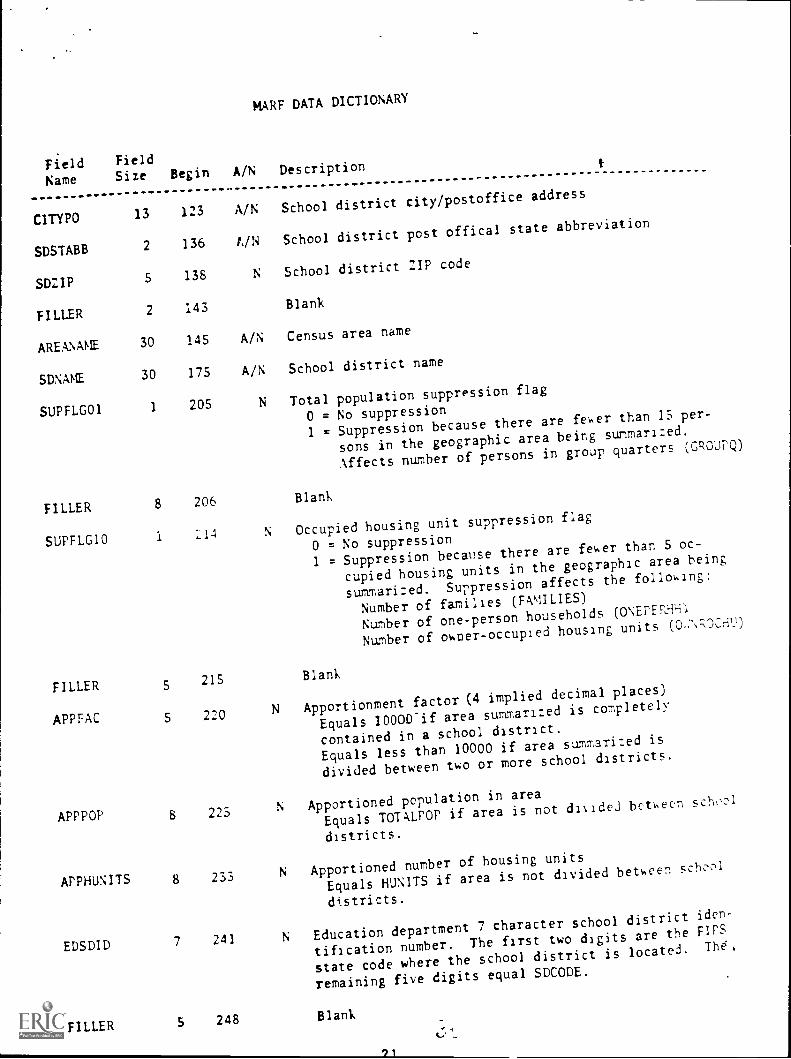
CITYPO 13 123 A/N School district city/postoffice address
SDSTABB2 136 1. /N School district post offical state abbreviation
SDZIP5 138 N School district ZIP code
FILLER 2 143 Blank
AREANANE 30 145 A/N Census area name
SDNA'E 30 175 A/N School district name
SUPFLGOI 1 205 N Total populationsuppression flag
0 = No suppression
1 = Suppressionbecause there are fever than 15 per-
sons in the geographic area being summarized.
Affects number of persons in group quarters (GROUPQ)
FILLER 8 206 Blank
SUPFLG10 1 214 N Occupied housing unit suppression flag
0 = No suppression
1 = Suppressionbecause there are
fewer than 5 oc-
cupied housing units in the geographic area being
summarized.Suppression affects the following:
Number of families (FPOI1LIES)
Number of one-person households (ONEPERH-P.,
Number of owner-occupiedhousing units (0.:\;DCriU)
FILLER 5215 Blank
APPFAC 5 220 N Apportionmentfactor (4 implied decimal places)
Equals 10000-if area summarized is completely
contained in a school district.
Equals less than 10000 if area summarized is
divided between two or more school districts.
APPPOP g 225N Apportioned
population in area
Equals TOTALPOPif area is not divided between cch,,01
districts.
APPHUNITS 8 233 N Apportioned number of housing units
Equals KNITS if area is not divided between school
districts.
EDSDID 7 241 N Education department7 character school district iden-
tification number.The first two digits are the Fir5
state code where the school district is located. The,
remaining five digits equal SDCODE.
FILLER 5 248 Blank
MARF DATA DICTIONARY
Field Field
Name Size Begin A/N DescriptionI
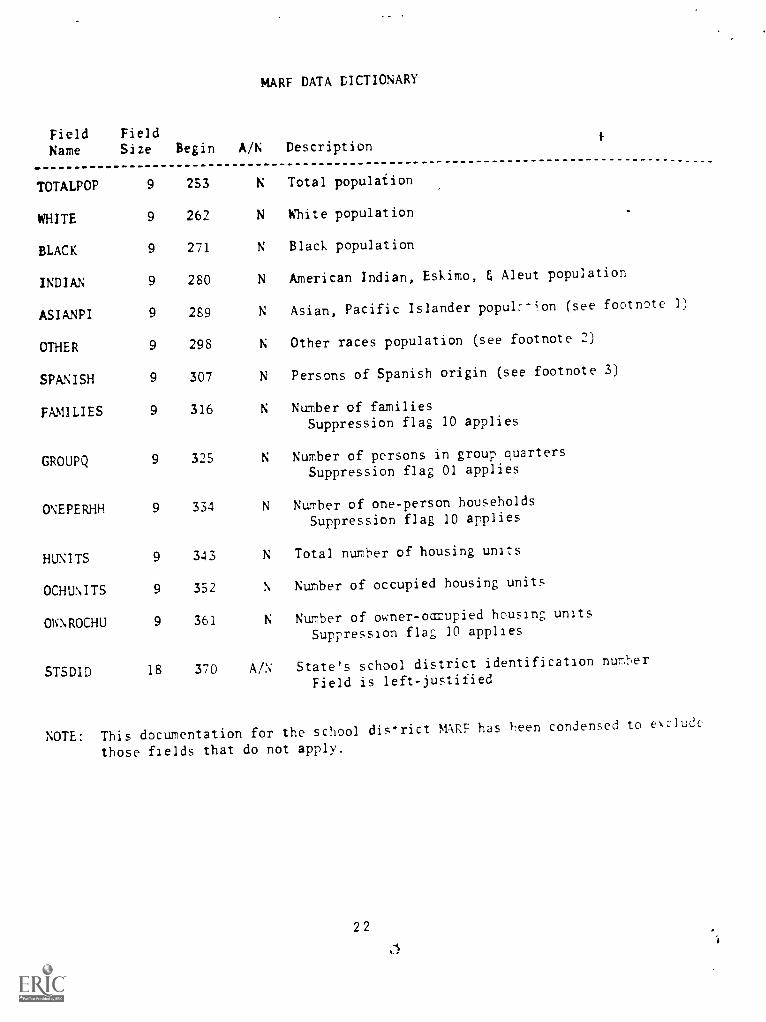
TOTALPOP 9 253 N Total population
WHITE 9 262 N White population
BLACK 9 271 N Black population
INDIAN 9 280 N American Indian, Eskimo, & Aleut population
ASIANPI 9 289 N Asian, Pacific Islander popul:-ion (see footnote 1)
OTHER 9 298 N Other races population (see footnote 2)
SPANISH 9 307 N Persons of Spanish origin (see footnote 3)
FAMILIES 9 316 N Number of familiesSuppression flag 10 applies
GROUPQ 9 325 N Number of persons in group quartersSuppression flag 01 applies
ONEPERHH 9 334 N Number of one-person householdsSuppression flag 10 applies
HUNITS 9 343 N Total number of housing units
OCHUNITS 9 352 N Number of occupied housing units
OWNROCHU 9 361 N Number of owner-oarupied housing units
Suppression flag 10 applies
STSDID 18 370 A/N State's school district identification numl,er
Field is left - justified
NOTE: This documentation for the school district MARF has been condensed to e\clude
those fields that do not apply.
22
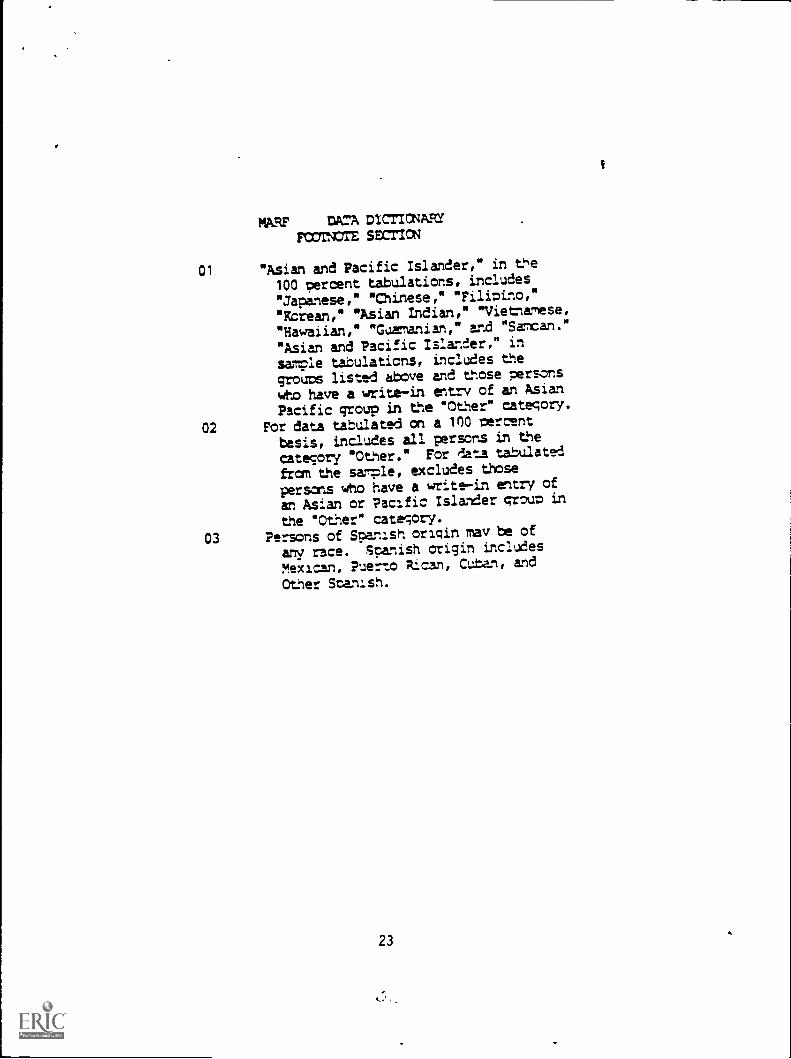
MARF DATA DICTICNARY=NOTE SECTION
01 "Asian and Pacific Islander," in the
100 percent tabulations, includes
"Japanese," "Chinese," "Filipino,"
"Korean," "Asian Indian," *Vietnamese,
"Hawaiian," "Guamanian," and "Samoan."
"Asian and Pacific Islander," in
sample tabulations, includes the
groups listed above and those persons
wtp have a write-in entry of an Asian
Pacific group in the "Other" category.
02 For data tabulated on a 100 percent
basis, includes all persons in the
category "Other." For data tabulated
from the sample, excludes those
persons who have a write-in entry of
an Asian or Pacific /slander groum in
the "Other" category.
03 Persons of Spanish origin may be of
any race. Spanish origin includes
Mexican, Puerto Rican, Cuban, and
Other Soahish.
23
OVERV IEW
1980 Census Summary Tape Program
Computer-readable data from the 1980 census include both summary data and microdata.Summary data include Summary Tape Files (STF's) 1 to 5, which are generallycomparable to the First Count through Sixth Count files from the 1970 census. Inaddition to the files in the STF series, other summary data released by the Bureauinclude the P.L. 94-171 Population Counts File for use in reapportionment/redistricting (released in February/March, 1981), various subject report files,and the Master Area Reference File which provides geographic items from STF 1and selected population and housing items. All of these files contain datasummarized to various levels of geography. Microdata files, on the other hang,contain disclouse-free household and person recnras from the census. These filesare similar to the 1970 Public Use Sample files and will be available some timeafter the release of STF 4,
In addition to the regular census products, special tabulations that hade beenprepared include the Summary Tape File 1F for school districts and the SummaryTape File 3F for school districts.
Content and Geographic Coverage of Summary Tape Files
Summary Tape Files vary by summary level of geography, detail ofinformation, and whether they include 100-percent or sample data.STF's 1 and 2 provide data based on the set of census questions askedof all persons and housing units. These data are 100-percent data.STF's 3, 4, and 5 are based on sample data. These data are estimatesbased on the responses of a sample of the population and housingunits and contain more extensive housing and population information.In 1980, the sampling rate was 1 in 2 in governmental units with lessthan 2,500 inhabitants and 1 in 6 elsewhere. Overall the samplingrate was approximately 1 in 5. The Bureau's 1977 populationestimates were used to determine the sampling rate for a given area.
The geographic detail of STF 1 is the maximum possible detailavailable from the census: data for individual blocks in block-numbered areas and for enumeration districts outside block-numberedareas. The lowest level of geography prcided by STF 2 is censustract, or minor civil division/census county division (MCD/CCD) andplaces of 1,000 or more inhabitants in nontracted areas. The lowest-level for STF 3 is the block group or enumeration district, while thesmallest geographic unit for STF 4 is census tract or MCD/CCD andplaces of 2,500 or more inhabitants in nontracted areas. STF 5'slowest geographic level is the standard metropolitan statistical area(SMSA), central city(ies), places of 50,000 or more inhabitants, andcounties of 50,000 or more inhabitants. Figure 3 on the followingpage details the geographic levels in each Summary Tape File.
For comparison purposes, STF 1 is similar in subject matter andgeographic detail to the First and Third Count files for 1970. STF's2 and 4 are roughly comparable to the 1970 Second and Fourth Counts, ;respectively. STF 3 is comparable to the 1970 Fifth Count, while STF5 corresponds to the 1970 Sixth Count. To summarize, STF 1 contains
246,
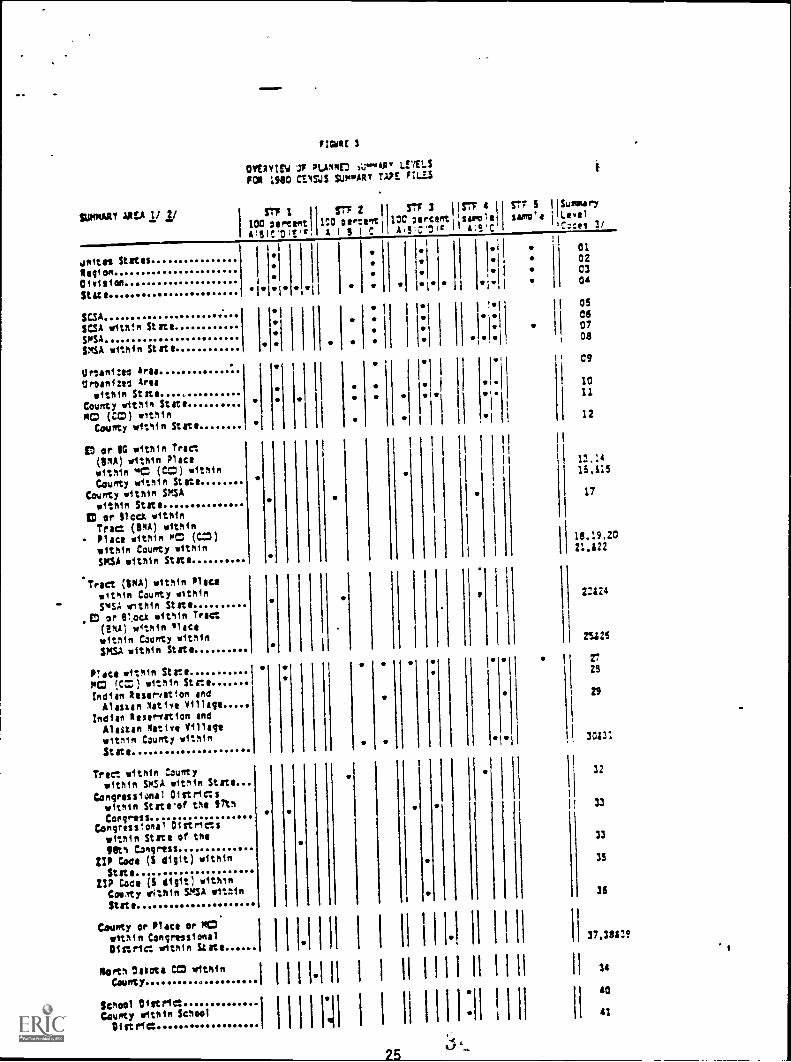
SUMMARY MU 1/ 2/
3
OVERYIEld ).,J.s,pv i.vaLsFOR 1980 CVISJS SUMMARY TAPE FILLS
fry 1 srF 2 S77 3 11517 4 577 113uswory
100 owneent 100 oertent 100 aereant; ;solo et sant* IllevelC'DIE't, AISIC 4.31211c A'S'C' FIC:tes 3/
,/nits'! StottsRegionDivisionState
SCSASCSA within StateSWSA
SW34 within State
tIrtani:es AreaUrbanized Area
within StateCounty within StateMC) (CCD) within
County within State
ID or 110 within Tract(9 M) within Placewithin h1C2 (CM) withinCounty within State
County within SMSAw ithin State
C or Ma. withinTrat (MO) withinPlace within PC (CZ)within County withinSMSA within State
Tract (8744) within Pleatwithin County withinSNISA within State
.2D or CAVE within Tract(1h4) within 'lacewithin County withinSMSA within State
Pace within StateWC) (CZ) within StateIndian Reservation and
Alaskan Native VillageIndian Reservation and
Alaskan Native Villagewithin County withinState.
Tract within Countywithin WA within State
Congressional DistrictsStatirof the 97th
CongressCongressional Districts
within State of the98th Congress
III Code (S digit) withinState.
21? Coca (S digit) withinCoemty within VISA wittinStine
I :1
County or Place or MCwithin Congressi onalOinric: within State
North Diana CC withinCounty
School DistrictCounty within Scheel
District 1:11
.1i 010203OA
elIIP f t
1
OS
ets07
Id 08
09
109( 11
12
12,1413,315
17
18,19,2021.522
22124
23425
2729
29
3053:
32
33
33
35
35
37,33/39
34
40
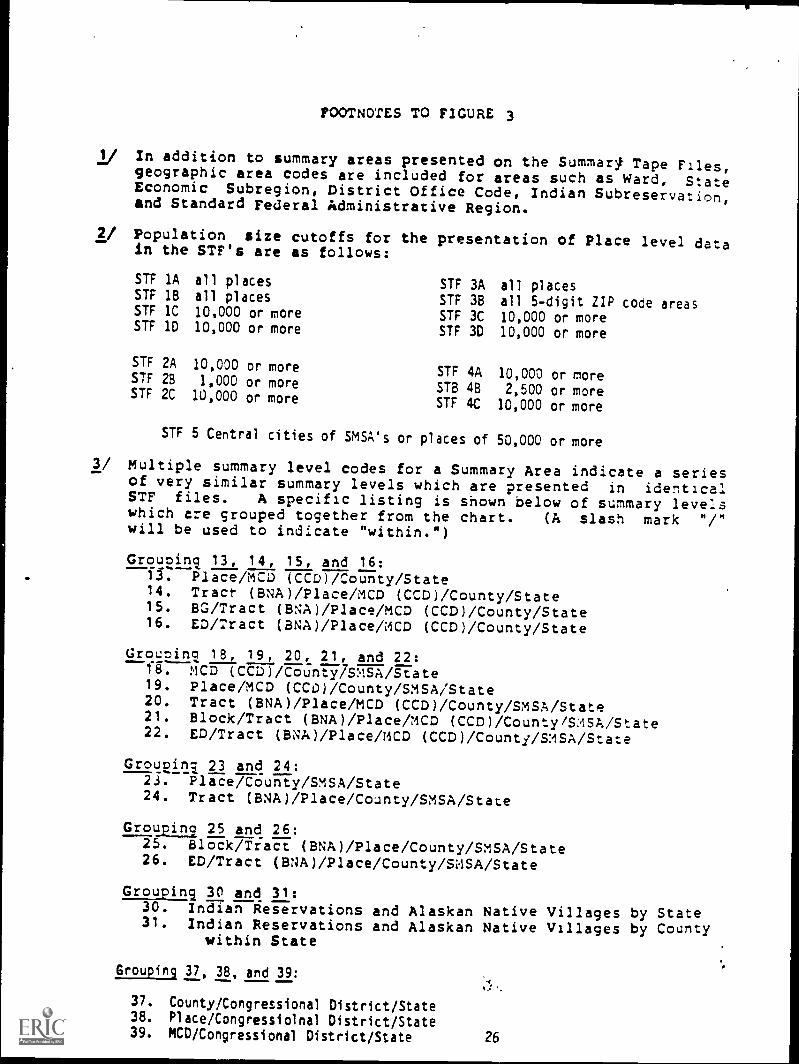
FOOTNOTES TO FIGURE 3
j/ In addition to summary areas presented on the SummarI Tape Files,geographic area codes are included for areas such as Ward, StateEconomic Subregion, District Office Code, Indian Subreservation,and Standard Federal Administrative Region.
2/ Population size cutoffs forin the STF's are as follows:
the presentation of Place level data
STF lA all places STF 3A all placesSTF 1B all places STF 3B all 5-digit ZIP code areasSTF 1C 10,000 or more STF 3C 10,000 or moreSTF 1D 10,000 or more STF 3D 10,000 or more
STF 2A 10,000 or more STF 4A 10,000 or moreSTF 2BSTF 2C
1,000 or more10,000 or more
STB 4BSTF 4C
2,500 or more10,000 or more
STF 5 Central cities of SMSA's or places of 50,000 or more
3/ Multiple summary level codes for a Summary Area indicate a seriesof very similar summary levels which are presented in identicalSTF files. A specific listing is shown below of summary levelswhich are grouped together from the chart. (A slash mark "/"will be used to indicate "within.")
Grouoini 13, 14, 15, and 16:13. Place/MCD (CCD)/County/State14. Tract (BNA)/Place/MCD (CCD)/County/State15. BG/Tract (BNA)/Place/MCD (CCD)/County/State16. ED/Tract (BNA)/Place/MCD (CCD)/County/State
Grouping 18, 19, 20, 21, and 22:18. MCD (CCD)/Cojnty7SMSA/State19. Place/MCD (CCO)/County/SMSA/State20. Tract (BNA)/Place/MCD (CCO)/County/SMSA/State21. Block/Tract (BNA)/Place/MCD (CCD)/County/SmSA/State22. ED/Tract (BNA)/Place/MCD (CCD)/County/SMSA/State
Grouping 23 and 24:23. Place/County/SMSA/State24. Tract (BNA)/Place/County/SMSA/State
Grouping 25 and 26:25. Block/Tract (BNA)/Place/County/SMSA/State26. ED/Tract (BNA)/Place/County/SMSA/State
Grouping 30 and 31:30. Indian Reservations and Alaskan Native Villages by State31. Indian Reservations and Alaskan Native Villages by County
within State
Grouping 37, 38, and 39:
37. County/Congressional District/State38. Place/Congressiolnal District/State39. MCD/Congressional District/State
-4,
26
more detailed geography but less subject matter detail than STF 2.
Similarly, STF 3 contains more detailed geography but less subject
matter detail than STF 4. STF's 1 and 2 contain complete count data,
while STF's 3 and 4 contain sample estimates. Finally, STF 5
contains sample estimates aggregated to a higher level of geocranhy
than the other files, but which are presented in the most subject
matter detail.
1980 Census Macs
Users may need certain types of maps for the geographic area(s) they
are extracting from the file(s). To determine which maps best lef:ne
the geographic area(s), compare the geographic coverage of the file
(see Appendix A) with the description of each type of 19;0 census mao
(see below).
The maps used in conjunction with summary tape files consist of four
basic types: county maps, Place maps, place-and-vicinity maps, and
Metropolitan Map Series (MMS) or Vicinity Map Series (VMS). Orlerina
information for these maps may be obtained from Data User Services
Division, Customer Services (Maps), Bureau of the Census, Washington,
D.C. 20233.
All four map types have severalcharacteristics in common:
--To improve legibility, most 1990 maps are at a larger scale
than were the comparable 1970 mays.
- -Symbols used for the various boundaries are consistent for all
four types of maps.
- -Names, identifying numbers, and boundaries are shown where
appropriate on all maps for counties, miner civil divisions
(MCD's) or census county divisions (CC1's), places, American
Indian reservations and Alaska Native villages, census
tracts or block numbering areas (3`A's) where nreFAnt,
enumeration districts(ED's) (in these areas which are not
block numbered), and blocks.
- -All maps show metric, feet, and mile scales.
- -All maps containir.q block-numbered areas will be available from
the U.S. Government Printing Office.
The following paragraphs present a brief description of each type of
map. The inclusion of the maps with various 1980 census Products
reflect the Bureau's plans as of September 1981.
County Maps. County maps are the backbone of the Bureau's man
coverage.Theoretically, with a complete set of these maps the
overall picture of the census geographic framework for the entire
United States and its possessions is shown. Most maps in the county
series are at a scale of 1 inch 1 mile. Most cc/Linty maps are created
27
by superimposing boundaries for most areas for which data aretabulated on base maps supplied by State transportation or hichwavdepartments. There are approximately 5,500 county map sheets for1980. The following geographic area boundaries are defined on countymaps where fippropriate: State, county, minor civil divisions (MCD's)or census county divisions (CCD's), places, American Indianreservations, census tracts or block numbering areas (RNA's), andenumeration districts (ED's) or numbered blocks. In addition, thelocation of Alaska Native villages are indicated. Counties which aretotally covered by MMS do not have county maps.
Place Maps. For places not covered on MMS or VMS sheets where mostof the development is contained within the corporate limits of amunicipality or within the boundaries established for a cens..:sdesignated place (CDP, the Bureau uses place !CADS. The scale of theplace maps varies from place to place. As with the county maps, mostare created by superimposing boundaries for most areas for which dataare tabulated on base maps supplied by local or State governments.On the county map, shading is added to indicate the area covered bythe place map; i.e., the place map is regarded as an inset to thecounty map. There are about 12,300 place map sheets for 1980. Thegeographic area boundaries defined on place maps are the same as forcounty maps.
Place- and - Vicinity Maps. For places not covered on MMS or VMS sheetswhich have areas of development outside the corporate limits of amunicipality or outside the boundaries established for a cnp, theBureau .uses place-and-vicinity maps. 'Also included in this categoryare maps of places which have parcels of land that are not Part ofthe city but are completely surrounded by the city and where two ormore places appear on the same map sheet. In all other respects,place-and-vicinity maps have the same characteristics as place mans.As with the place maps, all area covered by the Place-and-vicinitymap is shaded on the county map and the place-and-vicinity man isconsidered to be an inset to the county map. There are about 3,300place-and-vicinity map sheets for 1980. The geographic areaboundaries defined on place-and-vicinity maps are the same as thosespecified for county maps.
Metropolitan Man Series /Vicinity Mar) Series (MMS/VMS). For theNation's major built-up areas, the Bureau has developed its own mansto provide uniform coverage of the densely settled portions of theCounties involved. These maps are referred to AS the MetropolitanMap Series (MMS) when the maps cover SMSA counties an,J as theVicinity Map Series (VMS) when the maps cover areas which are not inan SMSA. (In a few instances, these map sheets entirely cover acounty, in which case no separate county map exists.) The predominantscale for the MMS and VMS is 1 inch = 1,600 feet. In selected areas with verydense development, some sheets !-e at 1 inch = 800 feet; conversely, some sparselysettled areas are mapped at 1 inch = 3,200 feet. The MMS and VMS are consideredto be insets to the county maps. The areas covered by MMS and VMS are shaved oncounty maps. There are about 10,400 MMS and VMS sheets for 1980. The geographicarea boundaries defined on the MMS are the same as those specified for countymaps, but also include urbanized areas.
28 :j
In addition to the four types of maps described above, there are a
number of "outline" maps (maps that do not show any data, only the
areas to which data can be related) that are prepared and published
as part of the various report series. As was the case with the mans
previously described, the maps included in the printed reports share
common characteristics. Both metric and mile scales are shown. Man
scale and content are similar to 1970 except where noted below;
however, presentation has been improved to make the maps more
readable and consistent from series to series.
The State SCSA/SMSA tap Series shows county names and boundaries,
names and locations of all places with a population of 25,000 or mere
or designated as the central city of an SMSA, and names and
boundaries of standard consolidated statistical areas (SCSA's) and
standard metropolitan statistical areas (SMSA's) in the State. ror
1980, the name of the capital of the State is underlined. These maps
appear in PC80-1-A, B, C, D; FIC80-1-A, P; and HC8u-2.
Map sets will be Printed for all block-numbered areas, grouped by
SMSA and the nonSMSA remainder of each State.
In addition to printed copies of the county, place, place-and-
vicinity, and Metropolitan Map Series/Vicinity Map Series (MMS/VMS)
sheets having block-numbered areas, there will be an index map
depicting the extent of the block-numbered area for the SMSA and
State. The SMSA Index to Block-Numbered Areas Mans will show the
extent of the SMSA; county., MCD/CCD, and place names and boundaries;
and the extent of block--umbered area within the SMSA shown by means
of shading. The State Index to Block-Numbered Preas Mans were
prepared by superimposing the exterTE6TWri or3ck-numhere.3iFeas in
the State over the county subdivision map. This index map will also
show the boundaries of the SMSA(s) in the State so that the reader
can determine whether the data for any block-numbered area in the
State are available with the SMSA tabulations or the remainder-of-
State tabulations
The County Subdivision Man Series consists of at least one man pale
for each Stat-ii7c7);71-4 the names and boundaries for the State, each
component county, the minor civil divisions (MCD's) or census county
divisions (CCD's), and all places, both incorporated and census
designated. For most States, the scale of the maps recuires that
they be presented in sections. These maps appear in PC80-1-A. ror
1980, the boundaries (not just the locations) of places with fewer
than 2,500 inhabitants are shown for the first time. In addition,
the name(s) of adjoining State(s) are shown along with a mark to
indicate where the State boundaries intersect. These maps are based
on the State base maps of the U.S. Geological Survey (USGS) National
Mapping Program. Single-sheet versions of the county subdivision man
series are published at the USGS scale of 1:500,000 (1 inch equals
about 8 miles) for all States except Alaska and the outivina areas,
and may be fitted together to form multi-State maps. F-. those
States in which American Indian reservations or Alaska Native
villages are located, a special version of the county subdivision map
showing these entities appears in PC80-1-3 and HCS0-1-A.
29 is
The Urbanized Area Outline Map. Series consists of one or more mapsheets-Tor eacn urtianized-irea (UA)-3-iiined on the basis of the 1900census results. The names and boundaries of all States, counties,MCD/CCD'o, and places on the map are shown, plus thy{ extent ofterritory defined as "urbanized." These maps appear in PC80-1-A. In1980, the report for each State containing part of a multi-State UAwill include the map for the entire UA.
The Census Tract Outline Map Series covers each of the areas forwhich tracts have been defined in 1980. These maps show theboundaries and code identification numbers for each tract; the na7esof streets or other features used as census tract boundaries; and tnenames and boundaries for counties, MCD/CCD's, and all places (notjust those over 25,000 as in 1970). Street detail within the tractsis not shown. Separate insets of larger scale than the base maps areincluded for densely developed areas; however, fewer insets are usedthan in 1970. Scale varies from map to map. For 19E0, tract cd,t1Inemaps will be prepared for tracted counties outside SMSA's.
School District Man. School district maps show school district names, codes, andFO:71FirlFT0i577-ied by the Department of Education. The maps are based onMMS/VMS maps where applicable; in other cases, county, place, and place-arc-vicinity maps are used. In those areas where school district boundaries arecoterminous with census recognized political entities at the place or higherlevel, state/county subdivision maps may be used as either alternative or supple-mental maps. School district maps are available through the State Data Centers(see Appendix B for further information).
Relevant Articles and Publications
The folloviing is a list of reference materials available presently orexpected to be available shortly which will provide additionalinformation concerning the 1980 census.
PNC8O-R1. Part A, Text. Users' Guide. This publication is a comprehensive guideIT1177census datat--Tt covers-1980 census subject content, procedures, geogrepry,statistical products, limitations of the data, sources of user assistance, ncta';
on data use, a glossary of terms, and guides for locating data in reports andfiles. The guide is issued in loose-leaf form and sold in parts (RI-A, -B, etc.!as they are prepared. Part A, Text is currently available from the Superintenden:of Documents, U.S. Government Printing Office, Washington, D.C. 20402.5/N 003-024-03625-8. Price is $5.50.
Data User News. This monthly newsletter provides continuous reporting on CensJ!,Bureau programs and products. A subscription is available from the GovernmePrinting Office for $20 a year.
Monthly Product Announcement. This free announcement lists new products releasaceach month from the Census Bureau. These products include publications, technicaldocumentation, data files, published maps, and microfiche. To be added to themailing list, contact Data User Services Division, Customer Services (Publications),Bureau of the Census, Washington, D.C. 20233.
4
30
TECHNICAL INFORMATION
Nonsampling Errors
Since 1980 population counts shown in this file were tabulated from
the entries for persons on all questionnaires, these courts are not
subject to sampling error. In any large-scale statistical ozeration
such as a decennial census, human and mechanical errors do occur.
These errors are commonly referred to as nonsampling errors. Such
errors include failure to include every household or person in the
frame, not obtaining all required information from resnondents,
obtaining incorrect or inconsistent information, and recording
information incorrectly. Errors can also occur during the field
review of the enumerators' work, the clerical handling of the census
questionnaires, or the electronic Processing of the questionnaires.
In an attempt to reduce various types of nonsampling errors in the
1980 census, a number of techniques wereintroduced on the basis of
experience in previous censuses and in tests conducted orior to the
census. These quality control and review measures were utilized
throughout the data collection and processing phases of the census to
minimize undercoverage of the population and housing units and to
keep the errors at a minimum. As was done after the 1950, 1940, and
1970 censuses, there were programs at the conclusion of the 1980
census to measure various aspects of the quality achieved in the
census. Reports on many aspects of the 1980 census evaluation
program will be Published as soon as the azorooriate data are
accumulated and analyzed.
A major comoonent of the evaluation work is to ascertain, insofar as
possible, the degree of completeness of the count of Persons and
housing units. The Census Bureau has estimates that the 1970 census
did not count 2.5 percent of the population. ror 1980, the Census
Bureau's extensive evaluation program will encompass a number of
different aporoaches to the task of est:,mating the coverage of the
census. Although these studies have not been comoleted at the time
of this file's release, preliminary estimates indicate that the rate
of undercoverage in the 1980 census was red..,ced from 1970 census
levels.
Editing and Allocation of Data Items
The objective of the processing oceration is to produce a set of
statistics that describes the population as accurately and clearly as
possible. To meet this objective, certain unacceptable entries and
blank items were edited.
Editing. In the field, questionnaires were reviewed for omissions
and certaininconsistencies by a census clerk or an enumerator and,
if necessary, a followup was made for missing information.In
addition, a similar review of questionnaires was done in the central
processing offices. As a rule, however, editing was Performed by
hand only when it could not be done effectively by machine.
1
As one of the first steps in computerized editing, the configuration
of marks on the questionnaire column was scanned electrbnicallv to
determine whether it contained information for a person or merely
spurious narks. If the column contained entries for at least two of
the basic characteristics (relationship, sex, race, age, marital
status, Spanish origin), the inference was made that the marks
represented a person. In cases in which two or more basiccharacteristics were available for only a Portion of the people in
the unit, other information on the questionnaire prcvided by anenumerator was used to determine the total number of persons. Names
were not used as a criterion of the presence of a person because theelectronic scanning was unable to distinguish an entry in the name
space.
Allocatio- 'Illt.cations, or 'Assignments of acceptable codes in place
of unacc .e entries, are needed most often when an entry for a
given it. is lacking or rinen the information reported for a Person
or housing unit on that item is inconsistent with other information
for the person or housing unit. The usefulness of the da:a isconsidered tr. be enhanced through the assignment of acceptable codes
in place of blanks or unace:otable entries.
For housing data., the assignment is based on related informationreported for the housing unit or on information reported for a
similar unit in the immediate neighborhood. For example, if tenurfor an occupied unit is omitted but a rental amount is reported for
that unit, the computer edits tenure to "rented for cash rent." On
the other hand, if the unit is reported as rented but the amount of
rent is missing, the computer assigns the rent from the Preceding
renter-occupied unit that had a rental amount reported.
The generel Procedure for changing unacceptable population entries is
to assign an entry for a person that is consistent with entries for
other persons with similar characteristics. Thus, a person who is
reported as a 20-year old son of the householder but for whom marital
status is not reported, is assigned the same marital status as that
of the last son processed in the same age group. The allocation
technique may be illustrated by the procedure used in the assignment
for unknown age. The process is carried out in the following steos:
1. The computer stores reported ages of persons by selected
characteristics, including sex, relationship, marital
status, and characteristics of other household members.
2. Each stored age is retained in the comouter only until a
person having the same set of char cteristics and with ace
reported is processed through the computer in the edit
operation. Then the age of this succeeding person is
substituted for the age previously stored.
3. When a person processed has no report of age, or the entry
is unacceptable, the age assigned to him or her is that
which was stored for the last person who otherwise has the
same set of characteristics.
32
Substitution. The editing process also includes another tvve of
correction, namely theassignment of a full set of characteristics
for a person or a housing unit. The assignment of theffull set of
housing characteristics occurs when there is no housing information
available. If the housing unit is determined to be occupied, the
housing characteristics are assigned from the previously processed
occupied units. If the housing unit is vacant, the housing
characteristics are assigned from the previously processed vacant
unit.
The assignment of a full set of characteristicsfor a Person in a
household containing no information for all or most of the People,
although persons were known to be present, is done in the following
manner. A previously processed household is selected as a substitute
and the full set of populationcharacteristcs for each substituted
person is duplicated. These duplications fall into two classes: (1)
"persons substituted due to noninterview," e.g., a housing unit
indicated as occupied but the occupants are rld-t listed en Lhe
questionnaire, and (2) "persons substituted due to mechanical
failure," e.g., where the questionnaire page on which Persons are
listed was not properly microfilmed.
The editing process ensures that the distribution of characteristics
for persons and housing units assigner: by the computer corresoonds
closely to the distribution of characteristics for persons and
housing units actually reported in the census. Before the advent of
the computer, this type of process was not feasible and the
distribution .ofcharacteristics to be used for assignment nurooses
was drawn from the preceding census or another source.
Specific tolerances are established for the number of comouter
allocations and substitutions that are oermitted. If the lumber of
corrections is beyond tolerance, the questionnaires i,. which the
errors occurred are clerically reviewed. If it is found that the
errors resulted from damaged questionnaires, from improper
microfilming, from faulty reading by FOSDIC 1/ of unriamaaed
questionnaires, or from other types of machine failure, the
questionnaires are reprocessed.
1/ Film Optical Sensing Device for Input to Comnuters.
33
GLOSSARY
Complete Count Concept Definitions
The following definitions were taken from the 1980 Census User'Guide. Since the items described here are only those which appear inMARF, there may be references to other terms which are not defined inthis glossary. A complete glossary will be available in the Users'Guide, scheduled to be published in late 1981.
ALASKA NATIVE VILLAGES. Alaska Native villages constitute tribes,bands, clans, groups, villages, communities, or associations inAlaska which were listed in sections 11 and 16 of the Alaska NativeClaims Settlement Act, Public Law 92-203, or which met therequirements of the Act and which the Secretary of Interiordetermined were, on the 1970 census enumeration date (April 1),composed of 25 or more Alaska Natives. This list was reviewed andupdated for the Census Bureau by the State of Alaska prior to the1980 census, to specifically identify only those entities that werelegally recognized as Alaska Native villages.
Data summaries for Alaska Native villages are included in STF's 28,2C, 48, and 4C, and reports PC80-1-8 and -C and HC80-1-A and -B.Population and housing counts for Alaska Native villages arescheduled to be included in a supplementary report (DC80-51 series).In addition, a population subject report (PCBs -2 series), featuringadditional data on Alaska Native villages is also Planned. rata foreach Alaska Native village can be derived from MARF, STF 1A, and STF3A by identifying the component ED(s), and summarizing the datashould multiple ED's be involved. (NOTE: Eklutna Native Village isin a blocked area; therefore, data can be derived from block group(BG) summaries for the village.) Each Alaska Native village has beenassigned a unique 3-digit code by the Bureau which appears in thereservation code field; the code appears in these files.
Alaska Native villages will be identified on the Alaska subdivisionmaps in the PC80-1-8 and HC80-1-A reports. Alaska Native villagesare also shown on Metropolitan Map Series, place, and county maps.It should be noted that Alaska Native villages do not have boundariesthat are defined by legal descriptions, and therefore the boundariesshown on the census maps are only indicative of the approximateextent of a villag.2: for those that correspond to a city or censusdesignated place, the limits of such places are construed to coincidewith the extent of the Alaska Native village.
Historical comparability: Data are not available from previouscensuses for Alaska Native villages. Some cities and "unincorporated,places" (referred to as "census designated places" in 1930) whichwere identified in the 1970 census may correspond to 1980 AlaskaNative villages.
34
ALEUT POPULATION. See RACE
AMERICAN INDIAN PUPOLATION. See RACEmia agrea 1 Ofil
AMERICAN INDIAN RESERVATIONS. American Indian reservations are areas
with boundaries established by treaty, statute, and/or executive or
court order. The reservations and their boundaries were identified
for tne 1980 census by the Bureau of Indian Affairs (HIA) and State
governments. Federal and State reservations are located in 33 States
and may :ross State, county, minor civil division/census county
division, and place boundaries. In tabulations for reservations,
trloal trust lands outside the boundaries of reservations (off-
reservation) are not included as part of the reservations (see
below).
Each American Indian reservation was assigned a unique 3-digit code
by the Bureau. Enumeration districts (ED's) and block groups (BG's)
and/or portions of SG's which are inside boundaries of reservations
are designated with an "N" in the ED prefix field in tape files.
Data summaries for American Indian reservations are included in STF's
23, 2C, 4B, and 4C, and reports PC80-1-8 and -C, and HC80-1-A and -B.
Summaries on tape and in PC80-1-3 and HC80-1-A show data not only for
the reservation totals, out also for parts of reservations that cross
State or county boundaries.Reservation data can also be derived
from MARF, STF 1A, and STF 3a by the addition of component ED or 3G
summaries. Maps outlining reservation boundaries will be included in
tne PC80-1-B and HC80-1-A reports. Reservation boundaries are also
shown on Metropolitan Map Series, place, and county maps.
Historical comparability: Data on 115 American Indian reservations
were puolished in the 1970 census subject report, ATerican Indians,
PC(2)-1F. However, 1980 data may not be comparable to 1970
information because of boundary changes, improvements in geographic
identification, new enumeration techniques, and other procedural
changes made for the 1980 census.
AMERICAN INDIAN SUBRESERVATION AREAS. Areas known as "districts,"
71-- sr "n et ."`"'"'agencies, segments, areas, or "communities" are associated with
some American Indian reservations and were identified for the 1980
census by tribal governments or the Bureau of Indian Affairs. In a
few cases, such subreservation areas extend beyond reservation
ooundaries or are located entirely outside tne reservation (off-
reservation). American Indian subreservationsrecognized for the
1980 census are identified by a unique 3-digit code.
Data for subreservations are not summarized in regular census
tabulations; however, subreservation data can be obtained from the
Census Bureau on a cost-reimbursablebasis from a special tabulation.
Historical coinparabili: American Indian subreservation areas were
not identified separately in previous censuses.
4,
35
AMERICAN INDIAN TRIBAL TRUST LANDS. Soren American IndianreiFilafions have tribaar trust the vicinity of tnereservation. These were identified for the 1980 census by the Bureauof Indian Affairs. Tribal trust lan6s are located outside thereservation boundary (off-reservation) and are associated with aspecific reservation.
Population and housing counts for tribal trust lands are scheduled tobe included ii. a supplementary report (PC80-S1 series). Additionalinformation for tnese areas may be included in special reports orunpublished tabulations. Also, such data can be obtained from tneCensus Bureau on a cost-reimbursable basis from a special tabulation.
Historical comparability) Tribal trust lands were not identified inprevious censuses.
ASIAN POPULATION. See RACE
BARRIO. See PUERTO RICO
BLACK POPULATION. See RACE
BLOCN. Normally a rectangular piece of land, bounded by fourstreets. However, a block may also be irregular in shape or boundedby railroad tracks, streams, or other features. Blocks do not crossthe boundaries of counties, census tracts, or block numbering areas(aNA's). They may cross place boundaries and the boundaries of minorcivil divisions (MCD's). When blocks cross place boundaries and, in20 States (see figure 4, column 3), when they cross MCD boundaries,separate statistical summaries are presented for each part of theblock.
Census blocks are normally compact units, but tnere are importantexceptions. For example, in some suburbs, houses cluster around cul-de-sacs. In these areas a census block may be fairly large sinceonly those features that serve as the perimeter of an enclosed areaare treated as block boundaries. Also, in those rural areas wnerethey are numbered, blocks may include many square miles, depending onthe frequency of intersections of roads, rivers, mountain ridges, orother physical features.
Census data are tabulated by block in all urbanized areas (UA's) andgenerally for some territory extending beyond the UA boundaries.Data will also be tabulated by block in incorporated places with10,000 or more inhabitants outside UA's, and in other areas whichcontracted with the Census Bureau for the collection of blockstatistics. Places outside of UitIri are included in the blockstatistics program if they met the 10,000 population criterion in the1970 census, in official Bureau estimates through 1976, or in aspecial census taken on or before December 31, 1977. Block coveragefor qualifying places is within boundaries as of January 1, 1980...Five States contracted for the preparation of block statistics forall of their territory, both urban and rural, not already in the
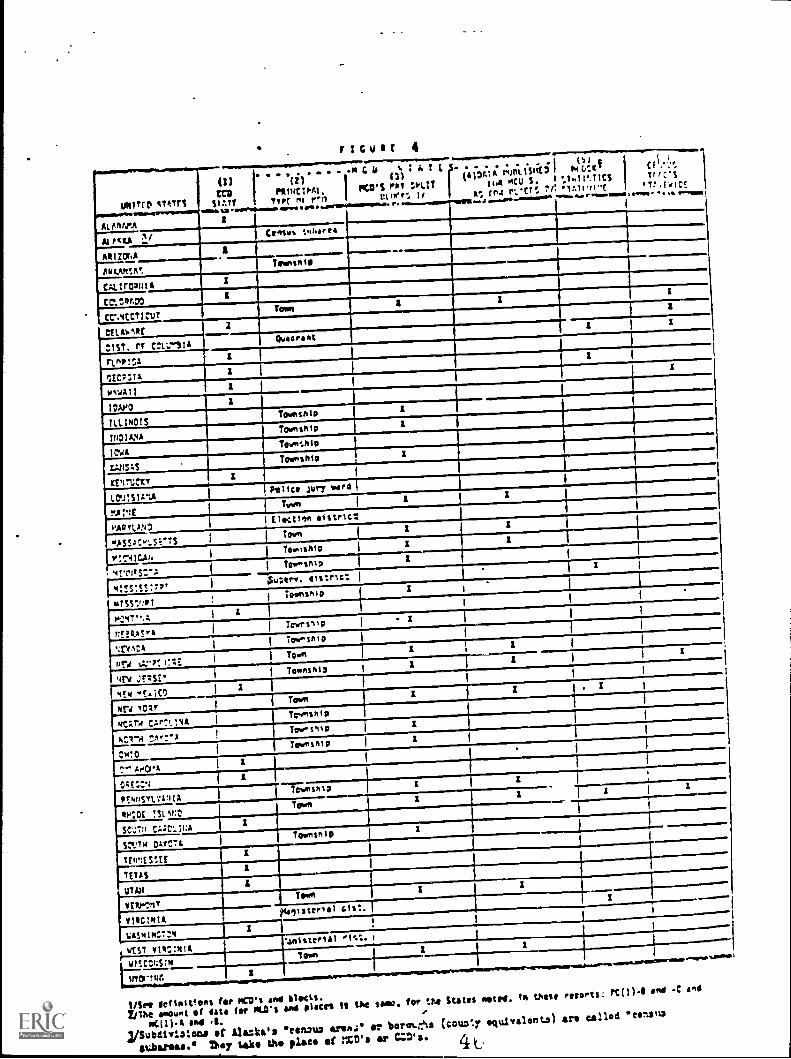
ricvat 4
ummp grmskel..........1...1...~
...........scu(13 (2)
CO PIIIIIICIPAI. ISt4tr ?W. mf r'n
INN. IA , A 0.4.1:AtE
0)sCO'S rot :otar
NW': 1/INrPri
'. . . . . - ... (S1 p
(410A1A 14011.1Slit2Oio:E.
ii,o MCU S. ".1.11'.11CS
AT, tr,4 I'VCTS 71 '1A1lqi"t11. l
...Mom o I MIMI
.....
Cf .''S
TI C'S
'7:.twICS.1 . a ,..
WM," a
4AI mu V
Cense% ..the. es
101120141
r
teckh!A!Towosnie
..
CAL1r03111A
CCLC0ADO
Cr.4CCTIngTotsn
It
1
cal.A0/1 .a
:1ST. rr C:11n1AQuatIrat
: 1
FIne1:1
:ECr:11I
ewall I
TWO111.1N01S
Townshit
PIDIANATownship
1CidA
Touredlie
1A/15,t$.
Townshie
EVIrti:XT
ted.P.S11-.A
Solite Bury word
.A:41Tam
Pity t .V1 DElectIln oistrittl
ASS;Cw-SiTTSTown
'7C-41CAN
ipishfp iI
4ricSr11 TomsOle .---1
I
4!SS!:7oAutarw. aistrict I
. 1
isTSSCI,o,1 7ownsh,0
I
w..":4",41 a i
.
nEn.A!'s,1 Tawrslie I
I
%rine1 70...ship
nrw i::. 121:10.n
1t
4ry JrtS:v-1
Towelsol,1 -----1
1
MN ,C.1C72
I
1
Nrd 11)2fTown
t I . I
et 7011 C;,r:tINA
Tronship
tt(}
kC1r4 !Ar,Tow-slip
.....--
:WOTerms/1112
I
r- Ara.*a
.
0;1=4I
T
PC4uS1171q1A1 1 Townsolp
11 I
.
-----,Teen t
1 I
OW:DE !Slwr.'
St:TH CI;C:1NA
S;+.14 OsrctTownsntp
IMISMIttas
1
UTAH
V1spVITTeem
II
0/91sterie1 Gist..----
efeC141A
WeSoINC724
I
1
(ST V11::NIA
*.shisterial oi::. ,
WItC:NSimTown
3
iffOrtha
f_______J
1
aa~ I
1/See Oefteitleedter OCO's and Stotts.
lithe mount or data See Mrs oos slam tt tag some. ter 'a.,States motet. le these retorts: rC(1)11 004 and
wc(()1 sof .1.2/SubdivIstoss of Alaska's etitt1U1 atom.: bertmess (courtr
ovavaletsta) are tallod census
Subareas. lltoy take the plat, ofgCD's sr C:3's.
E.block statistics program. These States are Georgia, Mississippi, NewYork, Rhode Island, and Virginia.
A block is identified by a 3-digit code which is unique within censustract or, where tracts do not exist, BNA. Since separate summariesare provided for the parts of a block split by a place boundary or,in 20 States, an MCD boundary, tape users often wil] need to specifythe place or MCD code, along with other codes, to retrieve data for ablock. Blocks are defined on detailed census maps: Metropolitan MapSeries (MMS), Vicinity Map Series (VMS), place maps, and county maps.The extent of block statistics coverage is reflected on maps by thepresence of the 3-digit block number and the absence of ED boundariesand numbers.
On census maps, when a block boundary ignores a minor physicalfeature, such as a railroad track, a "fishhook" across thefeature indicates that the block includes area on both sides of thefeature. Alternatively, the separate parts of such a block may haveidentical block numbers, each followed by an asterisk.
The maps used for enumeration activities were, of necessity, obtainedseveral years prior to the census and therefore do not reflectrecently constructed streets. Only those features shown on the mapscan serve as block boundaries.
Statistics were collected for approximately 2.6 million blocks in the1980 census. Block statistics are included in PHC80-1 BlocxStatistics microfiche series and in filt: B of Summary Tape File 1(ST/ la).
Historical comoarability: In 1970 block statistics were prepared forUH'S (and some territory beyond) located in SMSA's existing at thetime of the census, as well for contract areas. Unlike 1980, theywere not prepared for places of 10,000 population or more outsideUA's unless done under contract, nor for UA's in not-yet-definedSmSA's.
Some blocks defined for 1970 will have new boundaries in 1980,primarily those on the edges of UA's and other areas of newdevelopment where the street patterns have changed. To help tneuser notice a change wherever a block has been redefined by splittingor other adjustment, the 1970 block number will generally not bereused. In many areas, however, many block boundaries and numberswill be tne same in 1980 as in 1970, except for a few areas whereblocks were renumbered by local GBF/DIME-File coordinating agenciesin order to define more desirable block groups.
BLOCK GROUP (BG). A combination of numbered blocks that is asubdivision of a census tract or BNA and is defined in all areas forwhicn block statistics are prepared. (In areas where blocks are notnumbered, ED's are used instead of BG's.)
38
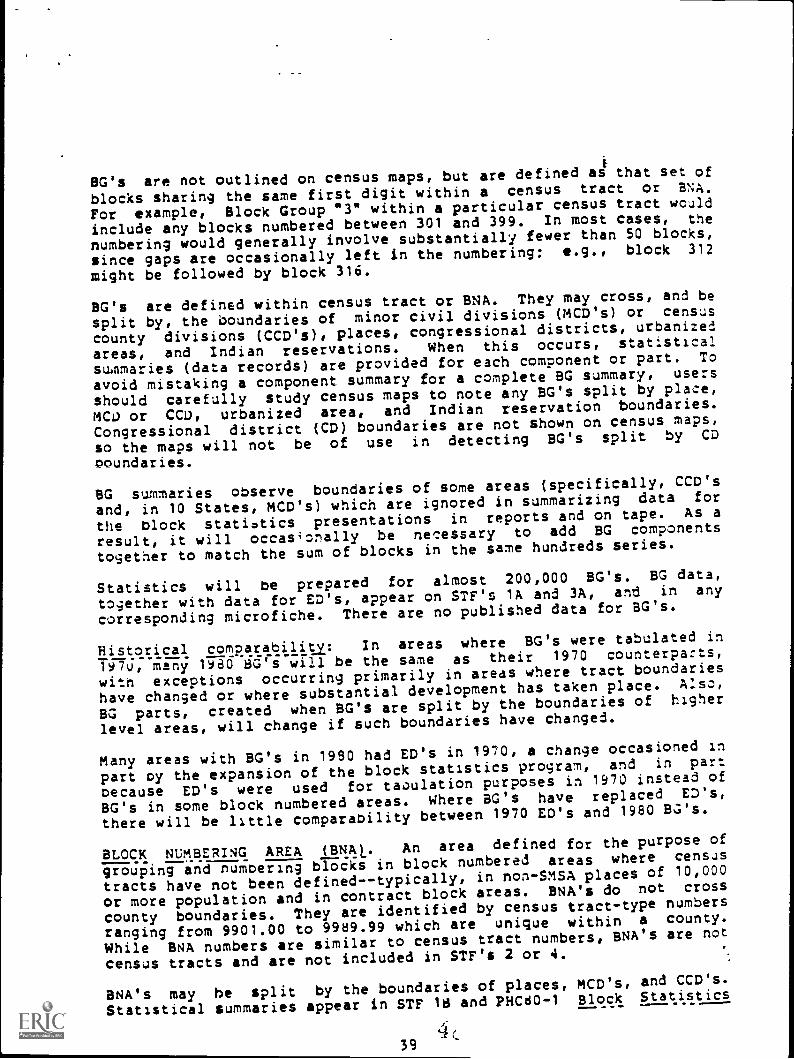
BG's are not outlined on census maps, but are defined as that set of
blocks sharing the same first digit within a census tract or BNA.
For example, Block Group "3" within a particular census tract would
include any blocks numbered between 301 and 399. In most cases, the
numbering would generally involve substantially fewer than 50 blocks,
since gaps are occasionally left in the numbering: e.g., block 312
might be followed by block 316.
BG's are defined within census tract or BNA. They may cross, and be
split by, the boundaries of minor civil divisions (MCD's) or census
county divisions (CCD's), places, congressional districts, urbanized
areas, and Indian reservations. When this occurs, statistical
summaries (data records) are provided for each component or part. To
avoid mistaking a component summary for a complete BG summary, users
should carefully study census maps to note any BG's split by place,
MCU or CCD, urbanized area, and Indian reservation boundaries.
Congressional district (CD) boundaries are not shown on census maps,
so the maps will not be of use in detecting BG's split by CD
poundaries.
BC summaries observe boundaries of some areas (specifically, CCD's
and, in 10 States, MCD's) which are ignored in summarizing data for
the block statistics presentations in reports and on tape. As a
result, it will occasionally be necessary to add BG components
together to match the sum of blocks in the same hundreds series.
Statistics will be prepared for almost 200,000 BG's. BG data,
together with data for ED's, appear on STF's 1A and 3A, and in any
corresponding microfiche. There are no published data for BG's.
Histrical comparaqility: In areas where BG's were tabulated in
197u, many 1980 BG's will be the same as their 1970 counterparts,
with exceptions occurring primarily in areas where tract boundaries
have changed or where substantial development has taken place. Also,
BG parts, created when BG's are split by the boundaries of higher
level areas, will change if such boundaries have changed.
Many areas with BG's in 1980 had ED's in 1970, a change occasioned in
part oy the expansion of the block statistics program, and in part
because ED's were used for tauulation purposes in 1970 instead of
BG's in some block numbered areas. Where BG's have replaced ED's,
there will be little comparability between 1970 ED's and 1980 BC's.
BLOCK NUMBERING AREA (BNA). An area defined for the purpose of
grouping and numbering blocks in block numbered areas where census
tracts have not beendefined--typically, in non-SMSA places of 10,000
or more population and in contract block areas. BNA's do not cross
county boundaries. They are identified by census tract-type numbers
ranging from 9901.00 to 9989.99 which are unique within a county.
While BNA numbers are similar to census tract numbers, BNA's are not
census tracts and are not included in STF's 2 or 4.
BNA's may he split by the boundaries of places, MCD's, and CCD's.
Statistical summaries appear in STF 18 and PHCd0-1 Block Statistics
394c
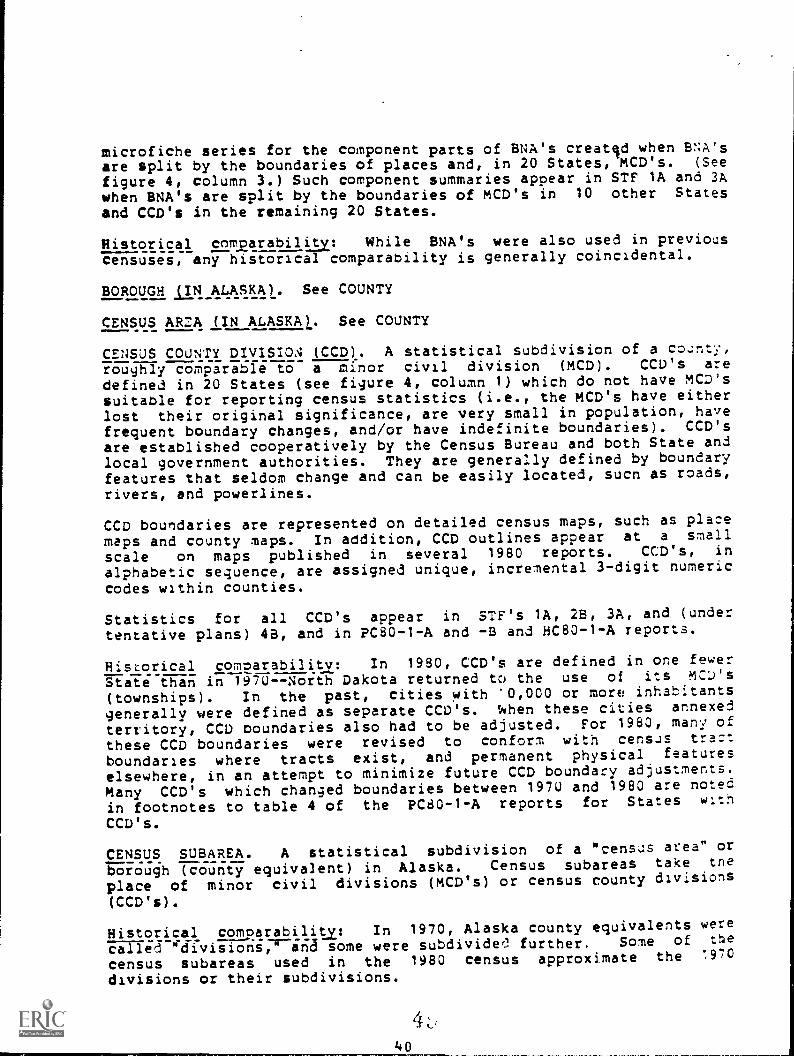
1
microfiche series for the component parts of BNA's created when BNA'sare split by the boundaries of places and, in 20 States, MCD's. (See
figure 4, column 3.) Such component summaries appear in STF 1A and 3Awhen BNA's are split by the boundaries of MCD's in 10 other States
and CCD's in the remaining 20 States.
Historical comparability: While BNA's were also used in previouscensuses, any historical comparability is generally coincidental.
BOROUGH EN ALASKA). See COUNTY---- .....
CENSUS ARZA (IN ALASKA). See COUNTY
CENSUS COUNTY DIVISIOA (CCD). A statistical subdivision of a county,roughly comparable to a minor civil division (MCD). CCD's are
defined in 20 States (see figure 4, column 1) which do not have MCD'ssuitable for reporting census statistics (i.e., the MCD's have either
lost their original significance, are very small in population, havefrequent boundary changes, and/or have indefinite boundaries). CCD's
are established cooperatively by the Census Bureau and both State andlocal government authorities. They are generally defined by boundaryfeatures that seldom change and can be easily located, sucn as roads,
rivers, and powerlines.
CCD boundaries are represented on detailed census maps, such as place
maps and county maps. In addition, CCD outlines appear at a small
scale on maps published in several 1980 reports. CCD's, in
alphabetic sequence, are assigned unique, incremental 3-digit numeric
codes within counties.
Statistics for all CCD's appear in STF's 1A, 2B, 3A, and (undertentative plans) 4B, and in PC80-1-A and -B and HC80-1-A reports.
Historical combarabilitv: In 1980, CCD's are defined in one fewerState than in 1970--North Dakota returned to the use of its MCJ's
(townships). In the past, cities with '0,000 or more inhabitantsgenerally were defined as separate CCD's. 'hen these cities annexed
territory, CCD boundaries also had to be adjusted. For 1980, many of
these CCD boundaries were revised to conform with census tract
boundaries where tracts exist, and permanent physical features
elsewhere, in an attempt to minimize future CCD boundary adjustments.
Many CCD's which changed boundaries between 1970 and 1980 are noted
in footnotes to table 4 of the PCd0-1-A reports for States with
CCD's.
CENSUS SUBAREA. A statistical subdivision of a "census area" or
borough (county equivalent) in Alaska. Census subareas take tne
place of minor civil divisions (MCD's) or census county divisions
(CCD's).
Historical comparability: In 1970, Alaska county equivalents were
called "divisions," and some were subdivide) further, Some of te
census subareas used in the 1980 census approximate the ',970
divisions or their subdivisions.
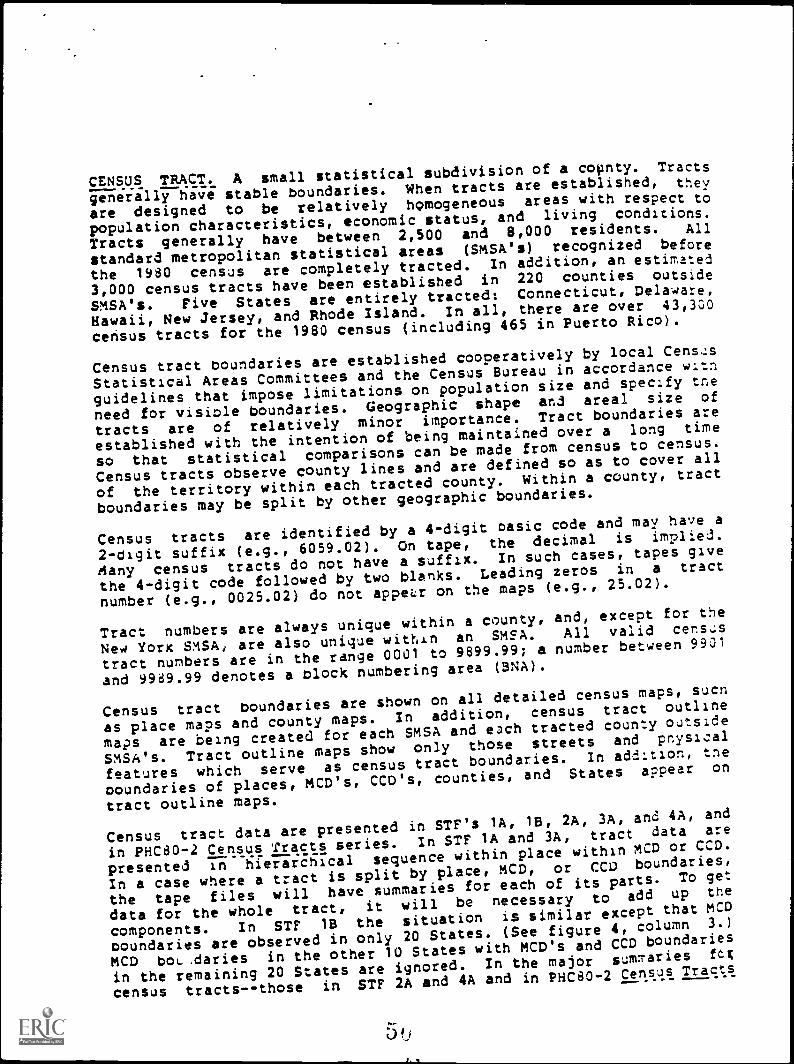
CENSUS TRACT. A small statisticalsubdivision of a county. Tracts
generally have stable boundaries. When tracts are established, they
are designed to be relatively homogeneous areas with respect to
population characteristics, economic status, and living conditions.
Tracts generally have between 2,500 and 8,000 residents. All
standard metropolitan statistical areas (SMSA's) recognized before
the 1980 census are completely tracted. In addition, an estimated
3,000 census tracts have been established in 220 counties outside
SMSA's. Five States are entirely tracted: Connecticut, Delaware,
Hawaii, New Jersey, and Rhode Island. In all, there are over 43,300
census tracts for the 1980 census (including 465 in Puerto Rico).
Census tract boundaries are established cooperatively by local Census
Statistical Areas Committees and the Census Bureau in accordance with
guidelines that impose limitations on population size and specify the
need for visible boundaries. Geographic shape and areal size of
tracts are of relatively minor importance. Tract boundaries are
established with the intention of being maintained over a long time
so that statistical comparisons can be made from census to census.
Census tracts observe county lines and are defined so as to cover all
of the territory within each tracted county. Within a county, tract
boundaries may be split by other geographic boundaries.
Census tracts are identified by a 4-digit basic code and may have a
2 -digit suffix (e.g., 6059.02). On tape, the decimal is implied.
Aany census tracts do not have a suffix. In such cases, tapes give
the 4-digit code followed by two blanks. Leading zeros in a tract
number (e.g., 0025.02) do not appear on the maps (e.g., 25.02).
Tract numbers are always unique within a county, and, except for the
New York SMSA, are also unique within an SMSA. All valid census
tract numbers are in the range 0001 to 9899.99; a number between 9931
and 9989.99 denotes a block numbering area (BNA).
Census tract boundaries are shown on all detailed census maps, such
as place maps and county maps. In addition, census tract outline
maps are being created for each SMSA and each tracted county outside
SMSA's. Tract outline maps show only those streets and physical
features which serve as census tract boundaries. In addition, the
boundaries of places, MCD's, CCD's, counties, and States appear on
tract outline maps.
Census tract data are presented in STF's 1A, 1B, 2A, 3A, and 4A, and
in PHC80-2 Census Tracts series. In STF 1A and 3A, tract data are
presented in hierarchical sequence within place within MCD or CCD.
In a case where a tract is split by place, MCD, or CCD boundaries,
the tape files will have summaries for each of its parts. To get
data for the whole tract, it will be necessary to add up the
components. In STF 1B the situation is similar except that MCD
boundaries are observed in only 20 States. (See figure 4, column 3.)
MCD boL.daries in the other 10 States with MCD's and CCD boundaries
in the remaining 20 States are ignored. In the major summaries ft;
census tracts--those in STF 2A and 4A and in PHC80-2 Census Tracts
Of'
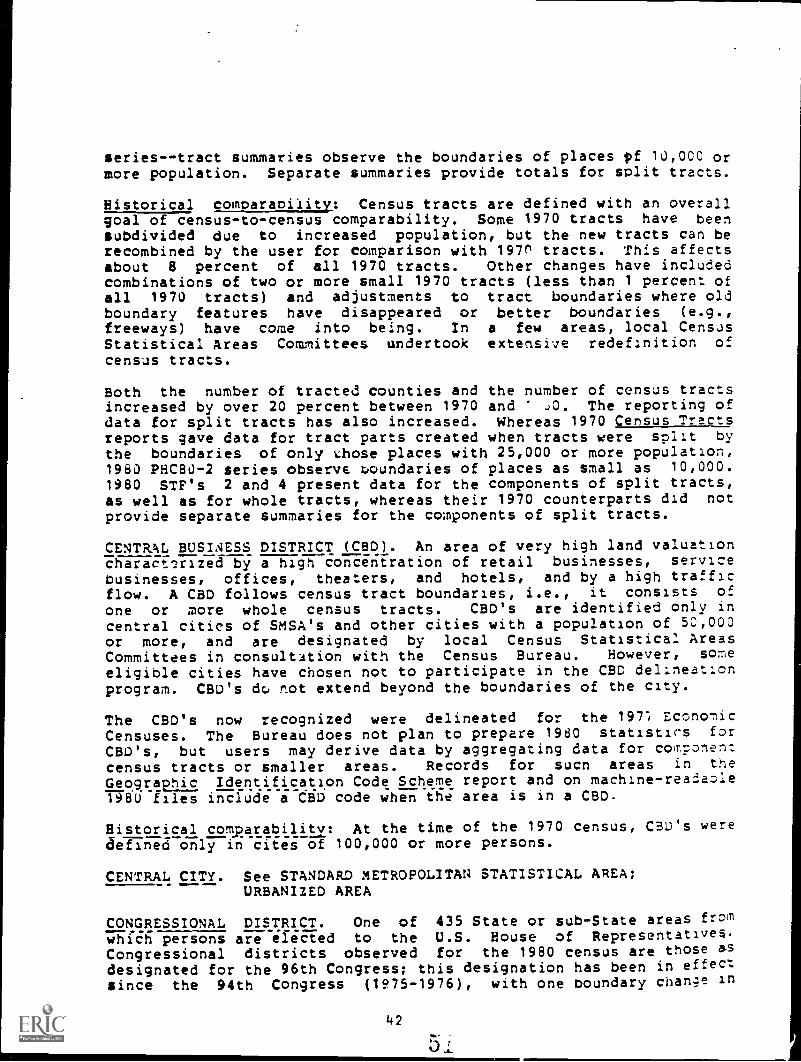
series--tract summaries observe the boundaries of places pf 10,000 ormore population. Separate summaries provide totals for split tracts.
Historical comparabilit: Census tracts are defined with an overallgoal of census-to-census comparability. Some 1970 tracts have beensubdivided due to increased population, but the new tracts can berecombined by the user for comparison with 197n tracts. This affectsabout 8 percent of all 1970 tracts. Other changes have includedcombinations of two or more small 1970 tracts (less than 1 percent ofall 1970 tracts) and adjustments to tract boundaries where oldboundary features have disappeared or better boundaries (e.g.,freeways) have come into being. In a few areas, local CensusStatistical Areas Committees undertook extensive redefinition of
census tracts.
Both the number of tracted counties and the number of census tractsincreased by over 20 percent between 1970 and The reporting ofdata for split tracts has also increased. Whereas 1970 Census Tractsreports gave data for tract parts created when tracts were split by
the boundaries of only those places with 25,000 or more population,1980 PHCBU -2 series observE rioundaries of places as small as 10,000.1980 STF's 2 and 4 present data for the components of split tracts,as well as for whole tracts, whereas their 1970 counterparts did notprovide separate summaries for the components of split tracts.
CENTRAL BUSINESS DISTRICT (CBD). An area of very high land valuationcharactrized by a high concentration of retail businesses, servicebusinesses, offices, theaters, and hotels, and by a high trafficflow. A CBD follows census tract boundaries, i.e., it consists of
one or more whole census tracts. CBD's are identified only incentral cities of SMSA's and other cities with a population of 50,000or more, and are designated by local Census Statistical AreasCommittees in consultation with the Census Bureau. However, someeligible cities have chosen not to participate in the CBD delineationprogram. CBD's dc, not extend beyond the boundaries of the city.
The CBD's now recognized were delineated for the 1971 Econollic
Censuses. The Bureau does not plan to prepare 1980 statisti's for
CBD's, but users may derive data by aggregating data for componentcensus tracts or smaller areas. Records for sucn areas in the
Geographic Identification Code Scheme report and on machine-readaole1980 files include a CBD code when the area is in a CBD.
Historical comparability: At the time of the 1970 census, CBD's weredefined only in cites of 100,000 or more persons.
CENTRAL CITY. See STANDARD METROPOLITAN STATISTICAL AREA;URBANIZED AREA
CONGRESSIONAL DISTRICT. One of 435 State or sub-State areas fromwhich persons are elected to the U.S. House of Representatives.Congressional districts observed for the 1980 census are those as
designated for the 96th Congress; this designation has been in effect
since the 94th Congress (1975-1976), with one boundary change in
42
Tennessee which took effect with the 95th Congress and reflects the 97th Curye,s
as well. Congress districts for the 98th Congress(1983-1984) were defined by
the States after the 1980 population counts became available. l98, census data
are available in STF 10 and STF 3D.
Small-scale maps of congressional districts appear in the
Congressional District Data Book and the Congressional District
Atlas. Congressional district boundaries are not shown on ii5
census map series.
Historical comosrability: 1970 census data are available for
congressional districts as defined for the 94th - 97th Congresses in
the Congressional District Data Book, except for the Tennessee change
noted above.
COUNTY. The primary political and administrativesubdivision of a
State. In Louisiana, such divisions are called parishes. In Alaska
13 boroughs and "census areas" are treated as county equivalents for
census purposes. Several cities (Baltimore, Maryland; St. Louis,
Missouri; Carson City, Nevada; and 41 Virginia cities) are
independent of any county organization, and thereby constitute
primary divisions of their States and are treated the same as
counties in census tabulations.
County boundaries are shown on most census maps. A 3-digit Federal
Information Processing Standards (FIPS) county code identifies each
county uniquely within State. Counties %re numbered in alphabetic
sequence, with independent cities numberedseparately at the end of
the list.
There are 3,137 counties and county equivalentsrecognized for the
1963 census. Tabulations for all counties appear in STF's 1 through
4, ano in PCd0-1-A, -B, and -C; HC80-1-A and -B; and PHCb0-3 reports.
Tabulations for large counties (population size cutoff to be
determined) appear in STF 5.
Historical comoaragilitv: A number of changes have occurred to
county boundaries since 1970. A new set of county equivalents
(boroughs and census areas) has been defined for Alaska, and in some
cases these county equivalents differ considerably from the census
divisions recognized for 1970. In addition, there are minor changes
in counties for South Dakota and Hawaii. In Virginia, county
boundaries have changed as a result of the creation of new
independent cities or annexations by independent cities. Most other
changes represent minor adjustments of the boundaries between
counties. Those counties which cnanged boundaries between 1970 and
1980 are noted in footnotes at the end of table 4 of the PC8U-1-A
report for each State.
COUNTY EQUIVALENT. See COUNTY
DIVISION (CENSUS GEOGRAPHIC). A census geographic division is one. of
the nine groups of States which are subdivisions of the four census
geographic regions of the United States. (See figure 5.) Census
geographic divisions areidentified by a 1-digit code which is also
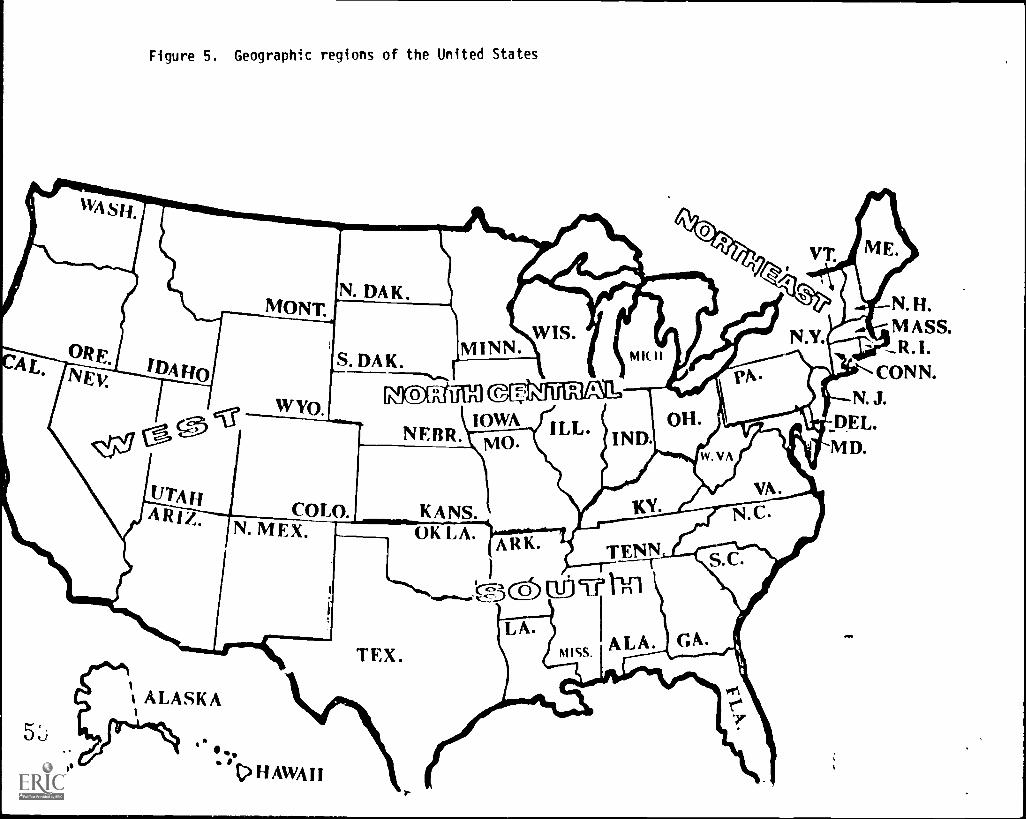
Figure 5. Geographic regions of the United States
N.H.MASS.R.I.
CONN.N. J.
DEL.MD.
T
the first digit of the 2-digit census geographiccode foj each State
in the division.
Historical comparability: Census divisions have remained unchanged
*ince the 1910 census, except for the expansion of the Pacific
Division to include Alaska and Hawaii.
ECONOMIC SUBREGION 1E111). A grouping of State Economic Areas (SEA's)
which brings together those SEA's which are most closely related in
terms of their economic and social characteristics. The areas were
first defined following the 1950 census and updated after the 190
census. In order to achieve such homogeneity, State boundaries are
frequently crossed. The 510 SEA's are grouped into 121 ESR's. A 3-
digit numeric code is assigaed to each ESR. No data summaries will
De prepared for ESR's, although the ESR code appears on the
geograr is records of th,: summary tape files.
Historical cormarability ESR boundaries have remained the same
since 1960.
ENUMERATION DISTRICT (LD). An area used in the 1980 .ensus for data
collection activities and as a tabulation area where blocks are not
presant. ED's do not cross the boundaries of legal or statistical
areas; for example, census tracts, MCD's/CCir's, places, counties,
congressional districts, and States. Because of tnese constraints,
they vary widely in population size, although they do not generally
exceed a population of 1,600 in areas where the census was taken by
mail, or a population of 1,000 in areas where the census was taken
conventional enumerator canvassing. The population limits are
designed so that an ED generally represents a reasonable workload for
one enumerator. About 1,000 3urisdictions in 47 States participated
in a program for local definition of ED's. In areas without blocks,
ED's are the smallest unit of census geography for which statistics
ar: prepared.
ED boundaries are shown on MMS/VmS, place, and county maps in areas
where there are no block numbers. ED's are identified by a 4-digit
number (except that leading zeros, when they occur in ED numbers, do
not appear on the maps). An FD number may be followed by a one-
letter alpnabetic suffix. The suffix is used to identify
subdivisions of ED's made during data collection and processing
activities where the original ED proved to be too populous for an
efficient work unit, or to accommodate a reAsion to a place or other
boundary made after January 1, 197d in mailout/mailback areas or
January 1 4979 in conventional census areas. An ED number may also
have a one-letter prefix indicating that the ED is of a special type
(e.g., an American Indian reservation), but the prefix is not
nece.;sary for onique identification of the ED. ED numbers do not
repeat within a county. Any ED may be uniquely identified by
accompanying its ED code with the 2-digit State code and 3-digit
county code.
Statistics will De prepared for about 100,000 ED's. ED data,
together with data for BC's, appear on STF's 1A and 3A and STF 1A
microfiche. In addition, ED data appear on STF 1B to complement thesummaries for blocks. There are no puolisned data for ED's.
Historical comparability: Many areas which were covered by ED's in1 V76 are summarized in terms of blocks and BG's for 1980. In somecases it may be possible to add up blocks to approximate the 1970ED's, based on detailed comparison of 1980 and 1970 maps.
In areas covered by ED's for 1980, enumeration considerationsdictated ED size and design, and historical comparability does notnormally enter into consideration.
ESAIMO POPULATION. See RACE
FAMILY. Two or more persons, including the householder, who arerelated by birth, marriage, or adoption and who live together as onehousehold; all such persons are considered as members of one family.(Persons not in families and not inmates of institutions areclassified as unrelated int_ividuals.) Families are defined usingresponses to the complete-count household relationship question.
If the son/daughter of the person or couple who maintains thenousehold and the son's or daughter's spouse and/or children aremembers of the nousehold, they are treated as part of tnehousenolder's family. A roomer /boarcer and his/her spouse who arenot related to the person or persons who maintain the household, or aresident employee and his/her spouse living in, are not counted as afamily, but as individuals unrelated to the nouseholder. Thus, amwsenold can contain only one family for purposes of censustabulations.
A person maintaining a household alone, or with unrelated personsonly, is regarded as a household out not as a family. Thus, somehousenolds do not contain a family.
(In certain Census Bureau surveys before 1980, families as definedhere are referred to as *primary families." The term "secondaryfamily" refers to a resident family unrelated to the householder,such as a roomer and nis/her spouc;e. Tabulations of families fromsuch surveyE include secondary families.)
Historical comparability: The 1970 definition for family wasto tnat used in 1980. In 196u, secondary families were separatelyidentifies.
GROUP QUARTERS, PERSONS :N. Persons in living arrangements, such asnursing homes or rooming houses, which are not households. Groupquarters status was determined on a complete-count basis.
Two general categories of persons in group quarters are recognized.
Innate of institution. A person under care or custody at the'ti me of enumeration. Inmates are persons in such facilities asnomes, schools, hospitals, or wards for the physically or
vas
I
mentally handicapped; persons in hospitals or wards for mental,tubercular, or chronic diseases; persons in homes for unmarriedmothers or in nursing (convalescent and rest) homes for the agedand dependent; persons in orphanages; and persons in correctionalinstitutions. These persons are enumer-ted as residents of aninstitution--regardless of tneir length of stay in the particularplace. Some tabulations include data by major types ofinstitutions (home for the aged, mental hospital, correctionalinstitution, and other institutions).
Other persons in group Quarters. A person living in
noninstitutional group quarters. Noninstitutional group quartershave nine or more persons unrelated to the person in column 1 ofthe questionnaire, or ten or more unrelated persons, and includesuch living quarters as rooming and boarding houses, communes,workers' dormitories, and convents or monasteries.
Persons residing in certain other types of living arrangementsare classified as living in noni-stitutional group quarters,regardless of tne number or relationship of people in the unit.These include persons residing in military barracks, on ships, incollege dormitories or in sorority and fraternity hcuses;patients in snort-term medical, maternity and surgical was of
hospitals who have no usual home elsewhere; live-in staff membersof institutions and other group quarters, provided that tneir
living arrangements do not meet the housing unit definition; andpersons staying in missions', flopnouses, Salvation Army snelters,railroad stations, etc.
Historical_ comparability: In 1970, the "other person in groupquarteriinwas defineS as a person in noninstitutional quarters with
five or more persons unrelated to tne head (rather than nine or moreunrelated to tne householder in 180) or six or more unrelatedpersons altogether (as compared to ten or mo'e in 198U).
See also: HOUSEHOLD, PERSONS IN
HISTORIC AREAS OF OKLAHOMA (EXCLUDING UR3ANIZED AREAS). The historicdm.
dm. . el aa WE..
areas of Oklahoma consist of tne former reservations which had
legally establisned boundaries during the period 19u0-1907. These
reservations were dissolved during the two- to three-year period
preceding the statehood of Oklahoma in 1907. The former reservationboundaries are used for planning purposes by tribes and the Federal
government. In the census, the entire area encompassing the former
reservations was identified (excluding parts in urbanized areas 1/);
individual former reservations were not identified separately.
_ parts inside urbanized areas were approximated in preparation
Tor tne 1980 census.
47-
IThe historic areas of Oklahoma (excluding urbanized areas) wereassigned a unique 3-digit code by the Bureau which appears in thereservation code field. Enumeration districts (ED's), block groups(BG's), and/or portions of BG's, which comprise the historic areas(excluding urbanized areas) are designated with an "A" in the EDprefix field in tape files. The boundaries for the "A" ED's weredrawn to follow visible features which approximate the Oklahomahistoric land boundaries.
Data summaries for the historic areas of Oklahoma (excludingurbanized areas) can be prepared by the addition of component EDand/or BG summaries from MARF, STF1A, or STF3A. Population andhousing counts for the historic areas (excluding urbanized areas) arescneduled to be included in a supplementary report (PCdO-S1 series).Also, a population subject report (PC80-2 series) featuringadditional data on the historic areas (excluding urbanized areas) isplanned.
Historical comparability: Historic areas of Oklahoma were notidentared in previous censuses.
HOUSEHOLD, PERSONS IN. The number of persons living in the housingunit. ,411 occupants are counted--not just those related to thehouseholder, but also any lodgers, roomers, boarders, partners,wards, foster cnildren, and resident employees who share the livingquarters.
Figures for "persons in households" match those for "persons inunits" in tabulations based on complete-count data. In sampletabulations, tney may differ because of the weighting process. Theprase "persons in housenold" is used for population tabulations,"persons in unit" for housing items. "One-person households" and"persons living alone" are synonymous.
See also: FAMILY
HOUSIAG UNIT. A house, apartment, mobile home or trailer, group ofrooms, or single room occupied or intended for occupancy as aseparate living quarters. Separate living quarters are those inwhich the occupants do not live and eat with any other person in thestructure and which have direct access from the outside of thebuilding or through a common hall.
The occupants of a housing unit may be a single family, one personliving alone, two or more families living together, or any othergroup of related or unrelated persons who share living arrangements(except as described in the definition for Persons In GroupQuarters). For vacant units, enumerators apply the criteria orseparateness and direct access wherever possible to the likely use byintended occupants, or otherwise to the use by previous occupants.;Both occupied and vacant housing units are included in the housinginventory, except that recreational vehicles, tents, caves, boats,railroad cars, and the like are included only if they are occupied.
Historical coinearabilit: The first Census of Housing in 1940
established the "dwelling unit" concept. Although tne term became
"housing unit" and the definition has been modified slightly in each
succeeding census, the 1930 definition is essentially comparable to
previous censuses. In 1970, the definition of a housing unit
stipulated that the occupants live and eat separately and have either
direct access or complete kitchen facilities. For 1980, direct
access is required; the alternative of complete kitchen facilities
has been dropped. Excluded in 1970, vacant mobile homes are included
in the 1980 housing inventory if intended for occupancy where tney
stand. Also in 1970, units with six or more unrelated persons living
together were classified as group quarters; for 1980 that requirement
was raised to ten or more unrelated persons.
See also: GROUP QUARTERS, PERSONS IN; OCCUPANCY STATUS; TENURE
CIVIL_ DIVISION (MCD). A primary political and administrative
suboivision ol"--a county. MCD's are most frequently known as
townships, but in some States they include towns, magisterial
districts, and similar areas. A few counties have some territory not
organized into MCD's; such "unorganized territory" is treated as one
or more MCD's for census purposes.
MCD's are used for census purposes in 29 States (see figure 4, column
2). In 20 of the remaining States, CCD's are used in lieu of MCD's,
and in Alaska, census subareas are used. In tne District of
Columbia, quandrants are used.
Tne Census Bureau has assigned each MCD, alphabetically sequenced
within county, an incremental, unique 3-digit numeric code. In
addition, MCD's in 11 States have a 4-digit "MCD sequence number"
whicn allows MCD's to be sorted into alphabetical sequence within a
State.
MCD boundaries are represented on all detailed census maps. In
addition, .MCD outlines appear on small-scale maps published in PCSO-
1-A, HC80-1-A, and PHC80-2 series. There are more than 26,000 MCD's
defined for the 1980 census.
Statistics for all MCD's appear in STF's 1A, 2B, 3A, and (under
tentative plans) 48, and in PC80-1-A and -B, and HC80-1-A reports.
In 20 States (specified in column 3 of figure 4), most MCD's serve as
functioning general-purpose governments, and these active MCD's are
included in PHC80 -3 Summary Statistics for Governmental Units. All
MCD's in block-numbered areas of theseStates are included in the
PBC80-1 Block Statistics microfiche series and STF 18. Finally, in
11 States (all 9 States in the Northeast region, plus Michigan and
Wisconsin), MCD data are published in a manner parallel to that of
places of the same population size in tables of PC80-1-8 and -C, and
HCd0-1-A and -8. (See figure 4, column 4.)
Historical sosearability: CCD's were used in North Dakota in '370,
out for 1980 that State returned to the use of its townships. A
number of MCD's in other States have changed boundaries. Changes
have resulted from municipal annexations, mergers or dissolutions of
4 i"".
MCD's, and other causes. There are seven Stages where rip boundarieshave changed substantially: Arkansas, Louisiana, Marylehd,Mississippi, Nebraska, Virginia, and West Virginia. MCD's which havechanged boundaries during 1970 to 1980 are noted in footnotes totable 4 of PC80-1-A reports for States with MCD's.
MUNICiPIO. See PUERTO RICO
OCCUPAN2Y STATUS. The classification of all housing units as either_ -_-a___
occupied or vacant.
Occupied. The classification of a housing unit with a person orpersons living in it as a usual residence when enumerated--oronly temporarily absent, for example, on vacation. A houser:oldconsists of all the persons who occupy a housing unit.Therefore, counts of households and occupied housing units shouldmatch--although complete counts may differ slightly from sampledata.
Vacant. The classification of a housing unit with no one livingin it at the time of enumeration, unless its occupants are onlytemporarily absent. If, at the time of enumeration, the unit istemporarily occupied entirely be persons who have a usualresidence elsewhere, it is also classif ed as vacant.
Historical comparability.: Similar data have been collected since1940.
OTHER RACES. See RACE
OWNER- OCCUPIED HOUSING UNITS. See TENURE
PACIFIC ISLANDER POPULATION. See RACE
PARISH (IN LOUISIANA). See COUNTY
PERSONS IN HOUSEHOLD. See HOUSEHOLD, PERSONS IN
PLACE. A concentration of population which may or may not havelegally prescribed limits, powers, or functions. Most of the placesidentified in the 1980 census are incorporated as cities, towns,villages, or boroughs. In addition, census designated places (called"unincorporated places" in earlier censuses) are delineated for 1980census tabulations. There are about 23,000 places recorded in tne1980 census. Places do not cross State boundaries.
Incorporated place. A political unit incorporated as a city,borough (excludi7tg Alaska and New York), village, or town(excluding the New England States, New York, and Wisconsin). Inmost States, incorporated places are subdivisions of the MCD orCCD in which they are located; for example, a village locatedwithin and legally part of a township. In some States,,incorporated places are independent of surrounding townships ortowns and therefore are also treated as MCD's. In a few States,
b t;
P n
the pattern is mixed. Almost 4,000 incorporated places cross
MCD/CCD and/or county boundaries.
There are about 19,000 incorporated places recognized in the 1980 census.
Census designated place (CDP). A densely settledpopulation center without
legally c orporate limits or corporate powers or functions. Each
CDP has a definite residential nucleus with a dense, city-type street
pattern, and ideally should have an overall population density of at least
1,000 persons per square mile. In addition, a CDP is a community that
can be identified locally by place name. Boundaries of CDP's are drawn
by the Census_locally
in cooperation with State and local
agencies, to include, insofar as possible, all the closely
settled area. In the 1980 census, statistics are tabulated for
each CDP with 5,000 inhabitants or more if located in an
urbanized area (UA) with a central city of 50,000 or more and for
each CDP of 1,000 inhabitants or more if in a UA with no central
city of 50,000 or more. Some CDP's--notably in the Northeast- -
coincide with MCD's. On STF's these are treated as both places
and MCD's, but in printed reports they are shown only in MCD
tables to avoid duplication.Outside of UA's, statistics are
tabulated in 48 States for CDP's of 1,000 or more, in Hawaii for
CDP's of 300 or more, and in Alaska for CDP's of 25 or more.
There are almost 4,000 CDP's recognized in the 1980 census.
Incorporated place and CDP ooundaries are shown on all detailed
census maps. For tracted areas,boundaries of all places are shown
on census tract outline maps. County subdivision maps, at still
smaller scale, also show boundaries for places.
A 4-digit numeric code is assigned by the Census Bureau to each place
in alpnabetic sequence within State. "Place description" codes will
also generally accompany place records. These codes indicate whether
or not a place is incorporated, as well as represent certain other
information about the place.
Data are summarized for all places in STF's lA and 3A and PCo0-1-A
reports. For places with 1,000 or more inhabitants, data are
summarized in STF 2d, and FC80-1-8 and HC80-1-8 reports. For places
with 2,500 or more, data are summarized in STF 48, PC8J -1 -C, and
HC80-1-8 reports. In PHC80-3 reports, the only data given for places
are summaries for incorporated places. In the PHC80-2 Census Tracts
series and STF's 2A and 4A, summaries are presented only fo places
with 1:,000 or more inhabitants located in tracted areas. Very
detailed data are presented for all places which are central cities
of SMSA's in PC80-1-D reports, and places with 50,000 or more
inhabitants in HC80-2 reports. STF 5 also provides detailed data for
places of 50,000 or more.
The files and reports which sequence geographic units inthierarchlcalfashion must account for the fact that places may cross theboundaries of counties, MCD's, and CCD's. Such reports and tapes,therefore, provide summaries for the various parts of places createdwhen places are split by the boundaries of higher-level areasrecognized in the hierarchy. Specifically, place parts within countyand MCD or CCD are presented in STF 1A and 3A, and PC80-1-A. Placeparts within county and MCD are presented for 20 specified States inSTF 18 and PHC80-1 Block Statistics microfiche series, although tr.ePHC80-1 reports include only places which have data collected forblocks. In the remaining 30 States, STF 18 and PHC80-1 reportssubdivide places when split by county boundaries, but do not observeMCD or CCD boundaries.
Historical comparability,: Sixty-eight percent of all incorporatedplaces of 2,500 or more made changes in their boundaries between 1970and January 1, 1980, which is the reference date for boundaries inthe 1980 census. In the 1970 census, ED boundaries were drawn so as
to allow a user to aggregate 1970 data for each city of 2,000 or moreinhabitants according to 1960 boundaries. There will not be a
corresponding capability in the 1980 census, because many of themunicipalities are now subdivided into block groups and, whereenumeration districts are still used, the boundaries were oftenredrawn in response to local recommendations.
In the 1970 and earlier censuses, CDP's were referred to as
"unincorporated places." The name was changed to make it more
explicit that such places are defined for census purposes, and toavoid co.,fusion in States where many "unincorporated places" are
parts of incorporated towns or townships. Many CDP's nave beenredefined since 1970. Incorporated places which were newly
incorporated or which changed boundaries between 1970 and 19a0 arelisted in footnotes to taole 4 of PC80-1-A.
PUERTO RICO AND OUTLYING AREAS. In addition to the United States,tne decennial census covers the Commonwealth of Puerto Rico and the
outlying areas, including American Samoa, Guam, the Trust Territoryof the Pacific Islands (including the Northern. Mariana Islands wnicn
were legally part of the Trust Territory in 1980), the VlrginIslands, and certain other small islands over which the United Statesexercises sovereignty or jurisdiction. Questionnaire design and tnequestions asked were developed for Puerto Rico and each specified
area to accommodate local conditions. In the case of the smallislands, enumerations were not conducted; only population counts
obtained from U.S. Government records are published.
The geographic subareas for which statistics are reported vary. Sone
of those noted below are defined in this glossary; others will be
defined in 1980 census reports for the areas.
American Samoa: villages, district subdivisions, districts, and
islands.
Guam: census designated places and election districts.
Puerto Rico: blocks; EO's and BG's; census tracts and block
- numbering areas; zones urbanas and aldeas; suobarrios; barrios,
cuidades, and pueblos; municipios; and SMSA's and SCSA's.
Trust Territory of the Pacific Islands (including the Northern
Mariana Islands); census designated places, municipal districts,
municipalities and islands, and administrative districts.
_Virgin Islands: places, census subdistricts, and islands.
Other islands: no subdivisions.
Data for Puerto Rico and its subdivisons will appear in reports and
tapes in generally the same pattern as for States and tneir
subdivisons. Data for outlying areas will appear in 1930 Census of
Population, Volume 1, and Census of Housing, Volume 1, reports. Data
will be availa'ole on computer tape only by special arrangement.
Historical comparability.: The Canal Zone was not included in the
1930 census because it was no longer under U.S. jurisdiction.
RACE. All persons were asked to identify themselves according to the
'Following race categories on the 1980 questionnaire: White, Black or
Negro, American Indian, Eskimo, Aleut, Japanese, Cninese, Filipino,
Korean, Asian Indian, Vietnamese, Hawaiian, Guamanian, Samoan, and
"other." Tne "other" category includes Malayan, Polynesian, Thai,
and other groups not included in tne specific categories listed on
tne questionnaire. This item was asked on a complete-count basis.
Counts of the population by race in complete-count tabulations are
provisional. Final counts for race will be determined after the
sample data have seen processed. The sample counts will first appear
on tape in STF 3 ano in print in Characteristics of the Population,
General Social and Economic Characteristics,PC8.0-1-C reports.
The concept of race as used by the Census Bureau reflects self-
identification by respondents; it does not denote any clear-cut
scientific definition of biological stock. Since the 1980 census
obtained information on race througn self-enumeration, the data
represent self-classification by people according to the race with
which they identify themselves. For persons with parents of
different races who could not provide a single response to the race
question, the race of the person's mother was used; however, if a
single response could not be provided for the person's mother, the
first race reported by the person was used.
During clerical operat'ons on all questionnaires,write-in responses
were reviewed in an attempt to classify entries to existing
categories. For instance, if the "other" circle was marked and
accompanied by a write-in entry of "Caucasian," the "other" circle
was erased and the circle for "White" was filled, (additional'
examples are noted below.) Howeve:, Hispanic write-in categories such
as "Mexican" or "Puerto Rican" were not recoded during complete-count
63
processing, nor were Asian/Pacific Islander entrie4 such 'as"Cambodian," "Indo-Chinese," or "Polynesian." During the subse?Jentprocessing of sample questionnaires,
werepersons in the "other"
category with write-in entries were assigned codes which wererecorded on the basic records.
After sample coding, categories such as "Cambodian," "Indo-Chinese,"or "Polynesian" are collectively tabulated as "Other Asian andPacific Islander" in sample tabulations with detailed race categoriesand added into the broader "Asian and Pacific Islander" category inother sample tabulations by race. This shifts a significant part ofthose cases tabulated as "other races" in complete-count data to"Asian and Pacific Islander" in sample data and affects tnecomparability between complete-count and sample data for these broad9.-roups.
White. Persons who indicated their race as White, as well asrersons who did not classify themselves in one of the specificace categories listed on the questionnaire but entered a
response suggesting European origin such as German, Italian, orPolish. (Persons who did not classify themselves in one of thespecified race categories but wrote in entri- such as Cuban,Puerto Rican, Mexican, or Dominican were included in the "other"race category; in the 1970 census most of these persons wereincluded in the "White" category.)
Black. Persons who indicated their race as Black or Negro, aswell as persons who did not classify themselves in one of thespecific race categories, but reported entries such as African,Black Puerto Rican, Creole, Jamaican, Nigerian, Trinidadian, orWest Indian.
American'
Eskimo and Aleut:......_____ _...... ...., - ........= .... . .m.-.. . .......
American Indian. Persons who indicated their race as1-171Fliiri(AFJiican)" or who did not indicate a specific racecategory but reported the name of an Indian tribe.
Eskimo. Persons who indicated their race as "EskiAlc."
Aleut. Persons who indicated their race as "Aleut."
Asian and Pacific Islander. In complete-count tabulations,includes all of the groups listed below except "Other Asian andPacific Islander." In sample tabulations, it includes all of thegroups listed below.
Japanese. Persons who indicated their race as Japanese, aswell as persons who did not classify themselves in one of
the specific race categories, but entered a response such asNipponese or Japanese American.
.
Chinese. Persons who indicated their race as Chinese, aswerr-ii persons who did not classify themselves in one of
6,.
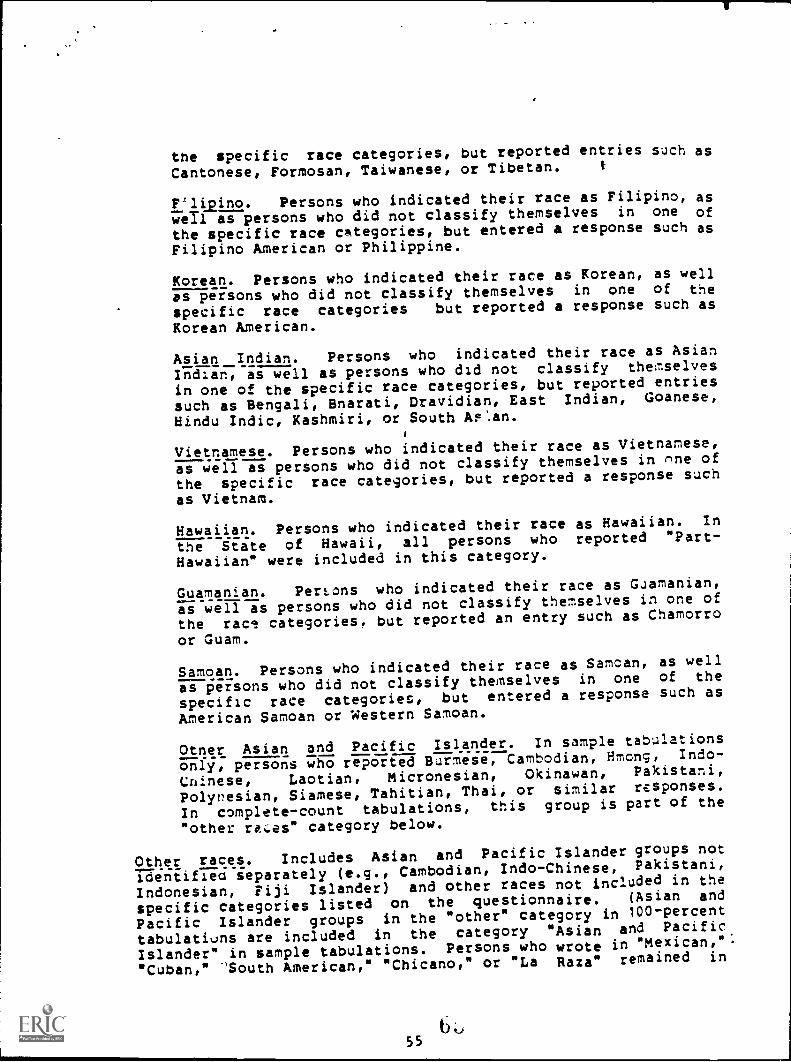
the specific race categories, but reported entries such as
Cantonese, Formosan, Taiwanese, or Tibetan.
Filipino. Persons who indicated their race as Filipino, as
well as persons who did not classify themselves in one of
the specific race categories, but entered a response such as
Filipino American or Philippine.
Korean. Persons who indicated their race as Korean, as well
as persons who did not classify themselves in one of the
specific race categories but reported a response such as
Korean American.
Asian Indian. Persons who indicated their race as Asian
Indian, as well as persons who did not classify themselves
in one of the specific race categories, but reported entries
such as Bengali, Bnarati, Dravidian, East Indian, Goanese,
Hindu Indic, Kashmiri, or South A5..an.
Vietnamese. Persons who indicated their race as Vietnamese,
as well as persons who did not classify themselves in nne of
the specific race categories, but reported a response such
as Vietnam.
Hawaiian. Persons who indicated their race as Hawaiian. In
the State of Hawaii, all persons who reported "Part-
Hawaiian" were included in this category.
Guamanian. Persons who indicated their race as Guamanian,
as well as persons who did not classify themselves in one of
the race categories, but reported an entry such as Chamorro
or Guam.
Samoan. Persons who indicated their race as Samoan, as well
as persons who did not classify themselves in one of the
specific race categories, but entered a response such as
American Samoan or Western Samoan.
Otner Asian and Pacific Islander. In sample tabulations
only, persons who reported Burmese, Cambodian, Hmong, Indo-
Cninese, Laotian, Micronesian, Okinawan, Pakistani,
Polynesian, Siamese, Tahitian, Thai, or similar responses.
In complete-count tabulations, this group is part of the
"other races" category below.
Other races. Includes Asian and Pacific Islander groups not
identified separately (e.g., Cambodian, Indo-Chinese, Pakistani,
Indonesian, Fiji Islander) and other races not included in the
specific categories listed on the questionnaire. (Asian and
Pacific Islander groups in the "other" category in 100-percent
tabulations are included in the category "Asian and Pacific.
Islander" in sample tabulations. Persons who wrote in "Mexican,".
"Cuban," "South American," "Chicano," or "La Rata" remained in
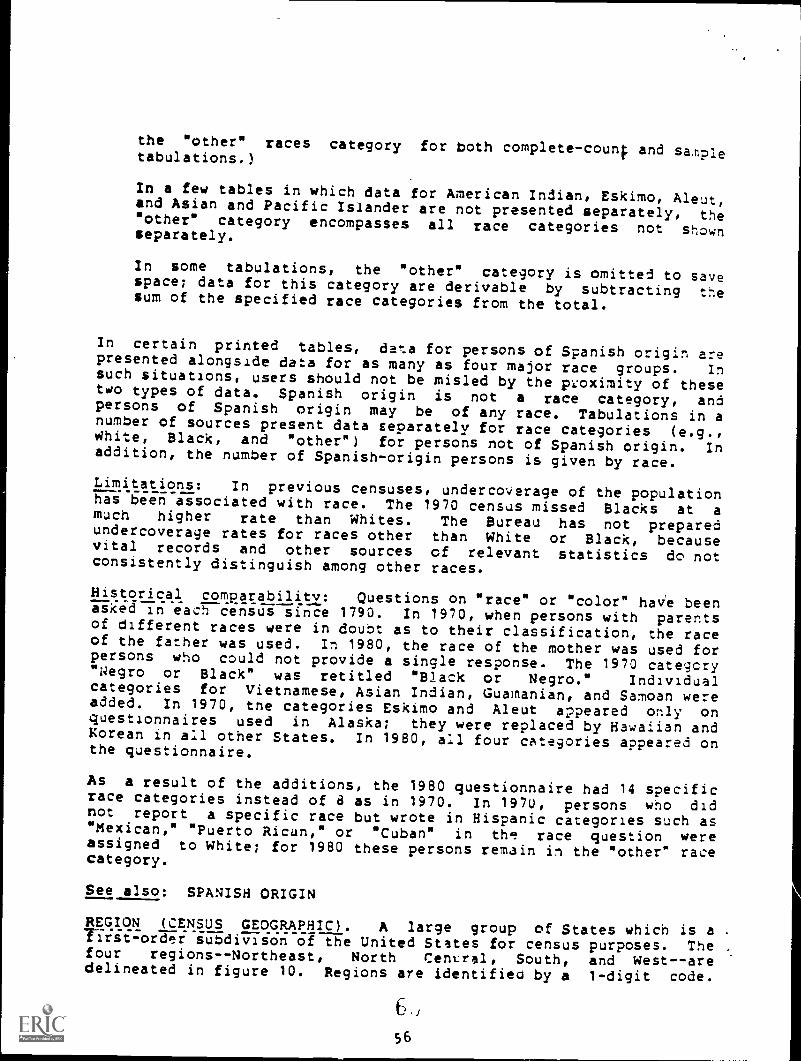
the "other" races category for both complete -count and sa.npietabulations.)
In a few tables in which data for American Indian, Eskimo, Aleut,and Asian and Pacific Islander are not presented separately, the"other" category encompasses all race categories not shownseparately.
In some tabulations, the "other" category is omitted to savespace; data for this category are derivable by subtracting thesum of the specified race categories from the total.
In certain printed tables, data for persons of Spanish origin arepresented alongside data for as many as four major race groups. Insuch situations, users should not be misled by the proximity of thesetwo types of data. Spanish origin is not a race category, andpersons of Spanish origin may be of any race. Tabulations in anumber of sources present data separately for race categories (e.g.,White, Black, and "other") for persons not of Spanish origin. Inaddition, the number of Spanish-origin persons is given by race.
Limitations: In previous censuses, undercoverage of the populationhai been associated with race. The 1970 census missed Blacks at amuch higher rate than Whites. The Bureau has not preparedundercoverage rates for races other than White or Black, becausevital records and other sources of relevant statistics dc notconsistently distinguish among other races.
Historical comparability: Questions on "race" or 'color" haVe beenasked in each census since 1790. In 1970, when persons with parentsof different races were in doubt as to their classification, the raceof the father was used. In 1980, the race of the mother was used forpersons who could not provide a single response. The 1970 categcry"Negro or Black" was retitled "Black or Negro." Individualcategories for Vietnamese, Asian Indian, Guamanian, and Samoan wereadded. In 1970, tne categories Eskimo and Aleut appeared only onquestionnaires used in Alaska; they were replaced by Hawaiian andKorean in all other States. In 1980, all four categories appeared onthe questionnaire.
As a result of the additions, the 1980 questionnaire had 14 specificrace categories instead of 8 as in 1970. In 1970, persons who didnot report a specific race but wrote in Hispanic categories such as"Mexican," "Puerto Rican," or "Cuban" in the race question wereassigned to White; for 1980 these persons remain in the "other" racecategory.
See also: SPANISH ORIGIN
REGION (CENSUS GEOGRAPHIC). A large group of States which is a .
Tirst-order subdivison of the United States for census purposes. Thefour regions--Northeast, North Central, South, and West--aredelineated in figure 10. Regions are identified by a 1-digit code.
656
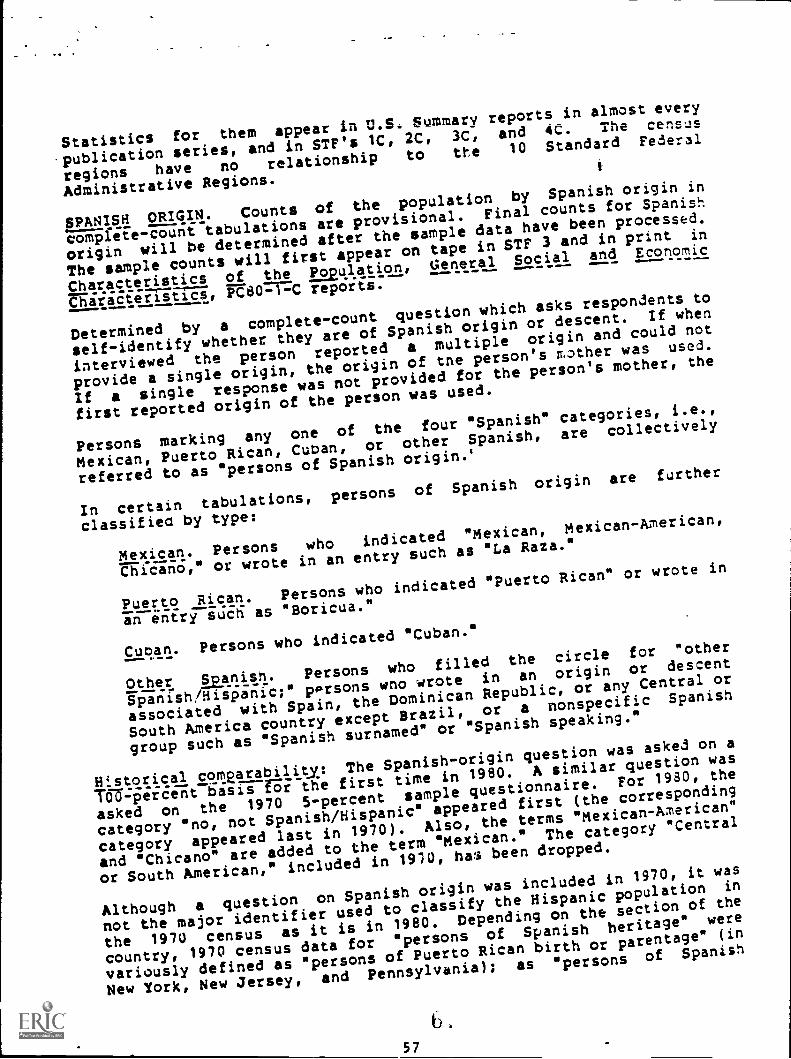
Statistics for them appear in U.S. Summary reports in almost every
publicationseries, and in STF's 1C, 2C, 3C, and 4C. The census
regions have no relationshipto the 10 Standard Federal
AdministrativeRegions.
t
SPANISH ORIGIN_.Counts of the population by Spanish origin in
complete-counttabulations are provisional.
Final counts for Spanish
origin will be determined after the sample data have been processed.
The sample counts will first appear on tape in STF 3 and in print in
Characteristicsof the population, General Social and Economic
rgaracteristics,PC80-1-C reports.
Determined by a complete-countquestion which asks respondents to
self-identifywhether they are of Spanish origin or descent. If when
interviewed the person reported a multiple origin and could not
provide a single origin, the origin of the person's mther was used.
If a single response was not provided for the person's mother, the
first reported origin of the person was used.
Persons marking any one of the four "Spanish" categories, i.e.,
Mexican, Puerto Rican, Cuban, or other Spanish, are collectively
referred to as "persons of Spanish origin.'
In certain tabulations, persons of Spanish origin are further
classified by type:
Mexican. Persons who indicated "Mexican, Mexican-American,
Chicano," or wrote in an entry such as "La Raze."
Puerto Rican. Persons who indicated "Puerto Rican" or wrote in
an entry such as "Boricua."
Cuban. Persons who indicated "Cuban."
Other §:mist. Persons who filled the circle for "other
Spanish/Hispanic;"parsons wno wrote in an origin or descent
associated with Spain, the DominicanRepublic, or any Central or
South America country except Brazil, or a nonspecific Spanish
group such as 'Spanishsurnamed" or 'Spanish speaking."
Historical comEarability.:The Spanish-origin
question wasasked on a
TO-percent basis ar the first time in 1980. A similar question was
asked on the 1970 5-percent sample questionnaire.For 1930, the
category "no, not Spanish/Hispanic"appeared first (the corresponding
category appeared last in 1970).Also, the terms "Mexican-American"
and 'Chicano" are added to the term "Mexican."The category "Central
or South American,"included in 1910, has been dropped.
Although a question on Spanish origin was included in1970, it was
not the major identifier used to classify the Hispanic populationin
the 1970 census as it is in 1980. Depending on the section of the
country, 1970 census data for "persons of Spanish heritage"were
variously defined as "persons of PuertoRican birth or parentage"
(in
New York, New Jersey, and Pennsylvania);as "persons of Spanish
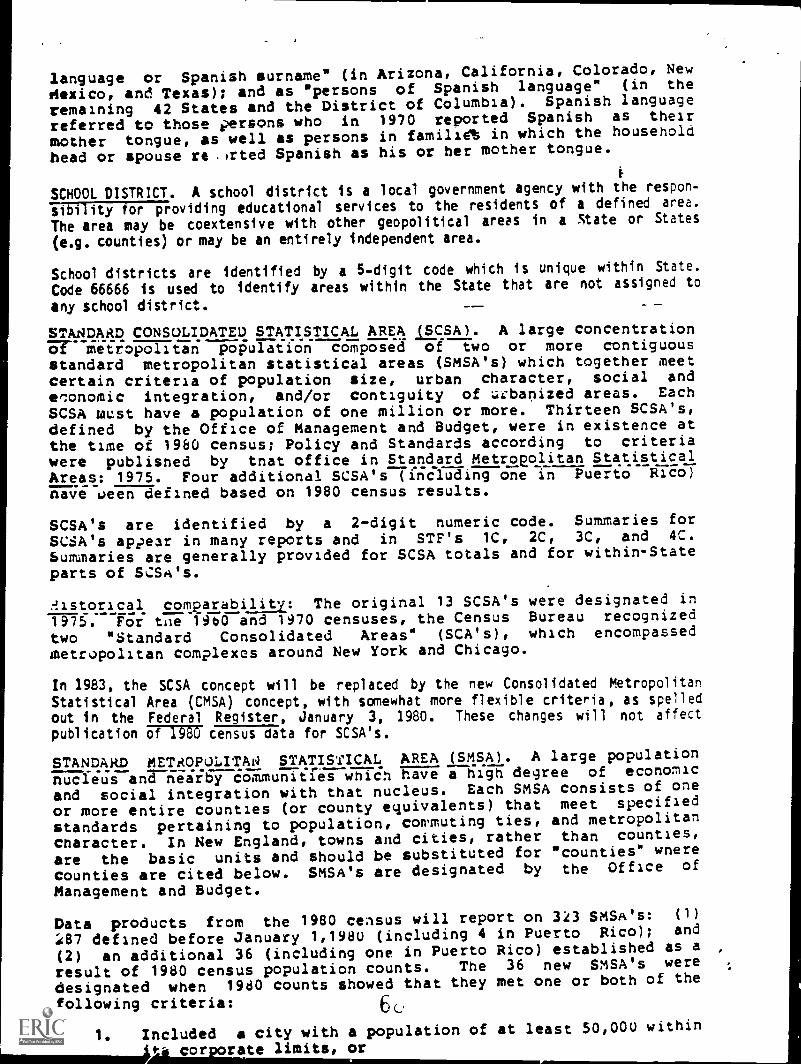
language or Spanish surname" (in Arizona, California, Colorado, New
Mexico, and Texas); and as 'persons of Spanish language" (in the
remaining 42 States and the District of Columbia). Spanish language
referred to those persons who in 1970 reported Spanish as their
mother tongue, as well as persons in familidt in which the household
head or spouse ra )rted Spanish as his or her mother tongue.
SCHOOL DISTRICT. A school district is a local government agency with the respon-
sibility for providing educational services to the residents of a defined area.
The area may be coextensive with other geopolitical areas in a State or States
(e.g. counties) or may be an entirely independent area.
School districts are identified by a 5-digit code which is unique within State.
Code 66666 is used to identify areas within the State that are not assigned to
any school district.
snlipm "ESA).CONSOLIDATED STATISTICAL AREA "SA). A large concentrationEar metropolitan population composed of two or more contiguous
standard metropolitan statistical areas (SMSA's) which together meetcertain criteria of population size, urban character, social and
economic integration, and/or contiguity of Liebanized areas. Each
SCSA must have a population of one million or more. Thirteen SCSA's,
defined by the Office of Management and Budget, were in existence atthe time of 1960 census; Policy and Standards according to criteria
were published by tnat office in Stand Metroeolitan Statistical(iAreas: 1975. Four additional SCSA's ncluding one in Puerto Rico)
nave oeen defined based on 1980 census results.
SCSA's are identified by a 2-digit numeric code. Summaries for
SCSA's appear in many reports and in STF's 1C, 2C, 3C, and 4C.
Summaries are generally provided for SCSA totals and for within-State
parts of SCSA's.
:!istorical comparability: The original 13 SCSA's were designated in
ile1975. For t 19b0 and 1970 censuses, the Census Bureau recognized
two "Standard Consolidated Areas" (SCA's), which encompassedmetropolitan complexes around New York and Chicago.
In 1983, the SCSA concept will be replaced by the new Consolidated Metropolitan
Statistical Area (CMSA) concept, with somewhat more flexible criteria, as spelledout in the Federal Register, January 3, 1980. These changes will not affect
publication of 1980 census data for SCSA's.
STANDARD METROPOLITAN STATISTICAL AREA (SMSA). A large population
nucleus annTearby communities which have a high degree of economic
and social integration with that nucleus. Each SMSA consists of one
or more entire counties (or county equivalents) that meet specified
standards pertaining to population, commuting ties, and metropolitan
cnaracter. In New England, towns and cities, rather than counties,
are the basic units and should be substituted for "counties" wnere
counties are cited below. SMSA's are designated by the Office of
Management and Budget.
Data products from the 1980 census will report on 323 SMSA's; (1)
i87 defined before January 1,198U (including 4 in Puerto Rico); and
(2) an additional 36 (including one in Puerto Rico) established as a
result of 1980 census population counts. The 36 new SMSA's were
designated when 19d0 counts showed that they met one or both of the
following criteria:
1. Included city with a population of at least 50,000 within
t- cor -rate limits, or
2. Included a Census Bureau-defined urbanized area (whicn must
.have a population of at least 50,000) and a total 8mSft
population of at least 100,000 (or, in New England, 75,000).
An SMSA includes a city and, generally, its entire UA and the
remainder of the county or counties in which the UA is located. An
SMSA also includes such additional outlying counties which meet
specified criteria relating to metropolitan character and level of
commuting of workers into the central city or counties. Specific
criteria governing the definition of SMSA's recognized before 1980
are published in Standard Metropolitan Statistical Areas: 1975
issued by the Office of Management ana Budget.
With two exceptions, eacd SMSA has one or more central cities, up to
a maximum of thr4-e, and the names of these cities comprise the title
of the SMSA. The Nassau-Suffolk, NY SMSA has no central city; the
title of the Northeast Pennsylvania SMSA does not contain the names
of its three central cities: Scranton, Wilkes-Barre, and Hazleton.
SMSA's are identified by a FIPS 4-digit numeric code, which follows
the alphabetic sJquence of SMSA names. SMSA's are outlined on small-
scale maps in several 1980 report series. SMSA data appear in most
1980 census publications and summary tape files. Many SMSA's cross
State oounaaries, and reports in se'Yeral series provide summaries for
tne State parts of multi-State SMSA's, as well as SMSA totals.
Suwary tape files present data only for State parts of SMSA's,
except for the "nationa:w files: STF's 1C, 2C, 3C, and 4C.
diatorical comparability.: A comparison of 1970 and 1980 census
products reveals twotypes of changes in metropolitan territory.
First, 69 ne4 SMSA's were created from previously nonmetropolitan
territory: 36 were defined in 1981 based on 1980 population c 'nts
and 43 were defined between 1973 and 1979 based on current pcpt-1._ ion
estimates. (An additional SMSA--Rapid City, SO--waz provisionally
recognized based on population estimates, but it lid not qualify
according to 1930 census data.)
Tne second component of change to metropolitan -erritory between 1970
and 1980 was the redefinition of many of the SMSA's which were
recognized in 1970 census tabulations. Of tne 247 197C SMSA's, 101
were redefined in 1973 based on 1970 census commuting data, most by
tne addition of 1 or more counties (or towns and cities in New
England). In addition, one SMSA was redefined by tne addition of one
area nd tne deletion of another (Wicnita Falls, Texas), one 4as
subdivided (.Jassau-Suffolk SMSA was created from a part of tne New
York SMSA), four pairs of SMSA's were c'nbined into single SMSA's
(for example, Dallas-Fort Worth, Texas), and four SMSA's lost area
that was added to other SMSA's. In addition, the names of several
SMSA's were changed in 1973, one in such a way that the SMSA code
also changed (San Bernardino-Riverside-Ontario to Riverside-San.
Bernardino - Ontario, California).
Since SMSA's are always defined in terms of whole counties (towns orcities in New England) for which -extensive data are avalle)le. Jserscan usually compile figures for comparisons over time.
In 1933, SMSA boundaries will be re-evaluated using 1980 census data on conl7Jtin,,labor force, population density, type of residence, and population growth, accoroingto new criteria spelled out in the Federal Reaister, January 3, 1980 (vol. 45, no. 2,
pt. VI). At that time, new outlying counties may be added or existing ones deleted,some area titles will be changed, some new central cities will be designated, sore
areas may be consolidated, and a few new SMSA's may be created. Further, the term
"standard metropolitan statistical area" will be shortened to "metropolitan statis-
tical area" (MSA). These changes will not affect publication of 19En census ca:afor SMSA's.
STATE. A major political unit of the United States. The District ofColumbia is treated as a State-equivalent in all 1980 census dataseries; Puerto Rico, Virgin Islands, American Samoa, Guam, NortnernMariana Islands, and the remainder of the Trust Territory of thePacific Islands are also, except that they do not appear in the P.L.94-171 Population Counts file.
States are identified by a 2-digit FIPS code wnich follows thealphabetic sequence of State names (including the District of
Columbia), and by a 2-digit CLnsus Geographic State code, the firstdigit of whicn identifies the census division of which the State is apart. Pue:to Rico and the outlying areas have FIPS codes nL;merallyfollowing tne State codes.
Historical comparability: There have been no significant changes toState boundaries since 1970.
See also: PUERTO RICO AND OUTLYING AREAS
STATE ECONOMIC AREA (SEA). A single county or group of cou,Itieswithin a State, whicn is relatively homogeneous with respect to
economi: and social cnaracteristics. The grouping of the 3,103counti.l!s or county equivalents in 1950 into f'EA's was the product of
a special Idy prepared by the Bureau of the Census in cooperationwith the Bur, _ of Agricultural Economics and several State and
private agencies. Boundaries were drawn in such a manner that eacheconomic area had certain significant characteristics whicn
distinguisned it from adjoining areas. There are 510 SEA'S.
SEk's are identified in census tabulations on computer tape by a 2-
digit numeric code or a 1-digit alphabetic code, assigned
Seyuentially within the State; however, no 1980 data are tabulatedfor SEA's.
Historical comparahilia: SEA boundaries have remained largely
unchanged since they were defined in 1950. In 1950, 501 areas were
defined; in 1v6U, 509; and in 1970, 510.
See also: ECONOMIC SUBREGION I
TENURE. The classification of all occupied units as either owner-
occupied or renter-occupied. This item was asked cn a complete-count
basis.
Owner- occuied. All housing units where the owner or co-own,r
"ryes in the unit, even if mortgaged or not fully paid for.
Renter-occupied. All occupied housing units which are not owner-
occupied, regardless of whether or not cash rent is paid by a
member of the household. ("No cash rent" units, included here,
are separately identified in rent tabulations.)
Historical comparability: Tenure has been collected since 1980. In
T7u, the question on tenure also included a category for condominium
and cooperative ownership. In 1980, condominiums are identified in a
separate question.
TOWN/TOWN.i1HIP. See MINOR CIVIL DIVI ION
TRACT. See CENSUS TRACT
UNITED STATES. Tnis designation includes the 50 States and the
District of Columbia. 1980 STF's and most report series (usually in
a separate U.S. Summary report) provide data summarized for the
United States.
URBAN AND RU:2,111,. (POPULATION). Urban and rural are type-of-area
concepts ratner than speirric areas outlined on maps. As defined by
the Census Bureau, tne urban population comprises all persons living
in uruanizeo areas (UA's) and in places of 2,500 or more inhabitants
outside UA's.
The rural population consists of everyone else. Therefore a rural
classification need not imply farm residence or a sparsely settled
area, since a small city or town is rural as long as it is outs de a
UA and has fewer than 2,500 inhabitants.
The terms urban and rural are independent of metropolitan and
nonmetropolitan designations; both urban and rural areas occur inside
and outside SASAss.
Historical comparability.: Except for the minor relaxation of UA
criteria discussed below, urban and rural def:nitions have been
consistent since 1950. Within small counties, mdisurements of urban
and rural populations over time may be significantly affected by the
increase or decrease of a place's population across the 2,500
population threshold, e.g., the increase of 1 person to a place of
2,499 results in a- increase of 2,500 to the county's urban
population.
URBAN FRINGE. See URBANIZED AREA
URBANIZED AREA itilat. A population concentration of atileast 50,000inhabitants, generally consisting of a central city and thesurrounding, closely settled, contiguous territory (suburbs).
The UA criteria define a boundary based primarily on a populationdensity of at least 1,000 persons per square mile, but also include
Some less densely settled areas within corporate limits, and suchareas as industrial parks and railroad yards, if they are withinareas of dense urban development. The density level of 1,000 personsper square mile corresponds approximately to the continuously built-
up area around a city. The 'urban fringe" is that part of the UAoutside of a central city.
Typically, an entire UA is included within an SMSA. SMSA is
usually much larger in terms of territory covered and includes
territory where the population density is less than 1,000.Occasionally, more than one VA is located within an SMSA.' In some
cases a small part of a UA may extend beyond an SMSA boundary andpossibly into an adjacent SMSA. A few 1980 DA's will be defined in
areas which do not meet the 100,000 total population criterion forSMSA designation. DA's may cross State boundaries. In a few cases aUA does not include all of an "extended" city, that is, a city whichis determined to have a significant amount of rural territory.
CIA's are identified by 4-digit codes, which follow the alphabeticsequence of all UA names. When a UA has the same name as an SMSA,
the UA code is the same as the SMSA code. UA boundaries are shown onfinal MMS/VMS maps, and at much smaller scale on UA outline maps in
PC80-1-A and HC80-1-A reports.
Historical comparabiliy: Because DA's are defined on the basis ofpopulation distribution at the time of a decennial census, their
boundaries tend to change following each census to include expanding
uroan development.
The criteria have been fairly constant since 1950, although in eacn
decade some new refinements have been added. For the 1970 census, inwhich 252 DA's were recognized, it was necessary for the central city
to have a population of 50,000 or more, or for there to te "twin
cities" with a combined population of 50,000 and with the smallercity having at least 15,000. In 1974 the criteria were liberalized
to allow UA recognition to certain cities between 25,000 and 50,000,
and this resulted in 27 new urbanized areas. For 1980, no minimum
population size is required for a central city.
WARD. Political subdivision of a city used for voting and
representation purposes. For 1980, approximately 900 places of
10,000 inhabitants or more and approximately 200 nonblock-numberedplaces ward boundaries were observed in the definition of enumerationdistricts (ED's). For these areas, users may prepare ward data by
summarizing ED data. In areas with block statistics, users may
prepare ward data by summarizing block data.
62
Historical co-Iparability:Population counts for wards in places with
a idiJfiiron of 10,000 or more appeared in SupplementaryReports, p0-
S1, in 1960 and 1970.
WHITE POPALATION. See RACE
ZIP CODE. A 5-digit geographic code that identifies areas within the
lrates and its territories for distribution of mail by the U.S. Postal Service.
ADDENDUM 1
Tracts Split by Standard Metropolitan Statistical Areas (SMSA's)Census of Population and Housing, 1980:
Master Area Reference Files 3, 4, and 5 (MARE 3, 4, and 5)
There are currently two instances in New England in which a tract is splicby an SMSA because some of its minor civil divisions (MCD's) are inside anSMSA and some are not. This occurs because it was not known at tie timethe tracts were established which MCD's would be included within newSMSA's. The tal instances are listed below.
Maine Tract 0090 in Penobscot County (019) has two MCD's whichare in the Bangor SMSA and one which is outside the SMSA.
Vermont Tract 0035 in Chittenden County (007) has three MCD's wnichare in the Burlington SMSA and two which are outside theSMSA.


![Census of Population, 1980 [United States]: Equal ... Inter-university Consortium for Political and Social Research Census of Population, 1980 [United States]: Equal Employment Opportunity](https://img.pdfslide.us/doc/110x75/5b0037c27f8b9a256b8fafd0/census-of-population-1980-united-states-equal-inter-university-consortium.jpg)