Embed Size (px)
Citation preview
1
Title
AN ANALYTICAL STUDY OF RETESTING OF RETAINED SAMPLE RESULTS
Author:Dr.Shyamali Pal
Consultant Biochemist & Quality Manager
JMD Diagnostics Pvt Ltd
P-336,C I T Road Scheme VI M
Kolkata-700054
M- 9874415344
2
AN ANALYTICAL STUDY OF RETESTING OF RETAINED SAMPLE RESULTS
Abstract
Aims
The sample retention policy for Clinical Chemistry analytes in accredited medical laboratories as per ISO
15189:2012 is 24 hrs. Serum/ plasma to be separated in aliquot within 20 minutes of collection unless the
primary container is gel vacutainers. Rigorous maintenance of such procedure is difficult and as a result
the possibility of deviation from such schedule may not be very uncommon. The Turn Around Time(TAT)
analysis of 1 year of the laboratory is a good guide to find out time lag from sample collection to sample
processing&average working hour of the laboratory personnel. The laboratory retested 22 common
analytes on the basis of such time lag and evaluated the deviation from 1st
observation. The accumulated
data has helped to evaluate and implement sample retention policy.
Study design
The average time lag from collection to completion of test performance of a batch is 4hrs±30 minutes.
The analytes retested in the time lag. After accumulation of sufficient data the time lag increased to 6hours
±30 minutes which is the average lag from sample collection end of day duty personnel. In the 3rd
phase
total retention timeie ,24 hrs has been considered as time interval of retained sample retesting. But
the samples remained at room temperature for (6±30) hours then preserved at 2°c-8°c . The samples
always retested from primary container.
Place and duration of study
The study took place in JMD Diagnostics Private Limited, Kolkata, India. The duration of study is 2 yrs.
Methodology
The analytes tested in Cobas Integra 400plus.The tests have been performed as routine tests and
considered as 1st
observation. 2nd
observation value obtained after the specified time lag. The results
obtained were compared using statistical software. Comparison of 1st
and 2nd
results and bias of all
analytes were studied. Electrolytes have been eliminated from the study as the test is preferred to
be retested from freshly collected sample. Labile parameters like L-Lactate ,ammonia,bicarbonate
were also not considered for the same reason.
Comment [D1]: Should be “for”
Comment [D2]: Shouldbe plural
Comment [D3]: Should singular
Comment [D4]: ????
Comment [D5]: Should be capital
3
Conclusion
Only 4 analytes , total protein, albumin, total calcium and inorganic phosphorus cannot be preserved in
primary containers. The analytes also need not to be separated within 20 minutes of collection. Upto
4hrs±30 minutes all the parameters have shown excellent correlation coefficient. Hence, the laboratory
earns a time lag between collection to preservation of samples for these analytes. For other 18 analytes
sample may be kept in primary container.
Key words based on MESH system:
1.Retesting
2.Additional test
3. Clinical biochemistry
4. Regression co-efficient(r)
Abbreviations
1. TAT
2. CLSI
3. NABL
Introduction
The guideline of Indian Laboratory Accreditation Body, NABL 112(1) and CLSI(2) have certain instructions
for the maintenance of quality of testing and procedures for accredited laboratories. The retention period
of a sample after collectionis 24 hrs(1,2). The retained sample is preserved for additional/ repeat test on
request. Preservation criteriais at 2°c-8°c for 24 hrs (from the time of collection). It has been observed
thatthere is a time lag fromsample collection to receiving time of the laboratory. From receipt of the
laboratory till processing a time lapse also has been noted. The total time interval is not less than 4
hrs(4hrs±30minutes).The data obtained from Turn Around Time(TAT) analysis of 2 years from the authors
laboratory. Therefore, to maintainquality of test performance the tests needs to be repeated after the lag
to check the deviation from 1st
result.
The optimum storage time of clinical biochemistry analytes were standardized by Marjini et al(3)
Ali L et al[4] and proved the stability of some of the analytesupto9 days. The storage temperature
was 2°c-8°c. The serum samples were separated by centrifugation in aliquot within 20 minutes of collection.
But in a busyroutine clinical biochemistry laboratory with approximate sample load 100/day preservation of
Comment [D6]: Should be written more
precisely
Comment [D7]: The long names should be given
with the abbreviations
4
samples in aliquot within 20 minutesof collection is difficult, rather impossible. The average time of separating
serum /plasma in aliquotis 6-7hours,obtained from TAT(generally before charge handover of laboratory
personnel). So, anaccredited laboratory should accept the practical situation and thedeviation from 1st result after
such lag should be checked.
Though after 6hrs the aliquots are being preserved, the author felt a 3rd phase observation may help the laboratory
personnel.If the samples are kept in primary container instead preserving in aliquot and the deviation is within
acceptable limit then the laboratory validated their preservation policy. The validation of policy saves time of
pouring samples in aliquot , saves the laboratory from the personal error during the process and unnecessary
procurement of microcentrifuge tubes needed to preserve the serum/plasma in aliquot. As total retention time
is 24 hours so for the 3rd phase study of deviation the time lag should be 6hrs±minutes at room temperature
and at 2°c-8°c for 17 hours . Hence, the study of deviation is actually a study of deviation when samples are
stored in primary container only.
The author decided to select 5 analytes for retesting in every month so that each parameter is being retested
at least 6 times in a month giving the option of statistical calculation of deviation. Minimum deviation
reflectsambience of room temperature, efficiency of the instrument and reagents and quality of the
evacuated primary container. Stress has been given to tight capping of the primary container immediately
after performance to prevent deviation due to evaporation of serum sample.
Such study is not essential for laboratories using gel vacutainers as gel effectively separates cells from serum. But
gelvacutainers are expensive and hence only in use when requested by patients. Moreover, if less expensive
primary container can satisfy the criteria of deviation of the retention time , it should be accepted by the laboratory.
Materials and methods
Study materials
Patient samples were selected at random . The retesting of retained sample analysis is one of the
quality assurance criteria for the tests under the scope of Indian Accreditation body . So, for the study
of analysis of test results patient consent is not needed. Result analysis neither discloses patient
identity. So, integrity and confidentiality of patient information is protected. Samples are collected
in evacuated containers with additive/no additive. Gel vacutainers are not in use.
Comment [D8]: This sentence should be written
in the manner of the Introduction.
Comment [D9]: These sentences should be
written in the Discussion Section.
5
Method
The analytes tested are plasma glucose, serum urea, creatinine, uric acid, Total Protein, Albumin, Total
Cholesterol, HDLC, LDLC, TG,AST,ALT,ALP, Amylase ,Lipase, Total Calcium, Inorganic Phosphorus, CPK,LDH,
GGT,Total Bilirubin and Direct Bilirubin. The tests were performed in Cobas Integra 400 Plus automated system.
The objective of retained sample testing is to check repeatability performanceof the laboratory . The criteria is,
a single test to be repeated in the same method and system by two different laboratory personnel to eliminate
personal bias. The laboratory selected 5 parameters on every month based on method mode(end point, kinetic etc).
As a result for each parameterthe laboratory is getting at least 5x2=10 observations per month per analyte. Hence
after 2 years the evaluation of deviations of 22 analytes have been done . Time lag between two observations in the
1st phase was 4hrs±30minutes which is the lag between collection to completion of processing of samples. In the 2nd
phase 6hrs±30minutes , the lag of collection to the end of day duty ie, before handover of the charges . In the 3rd
phase total 24hrs±60minutes(at 23°c-25.8°c for 6hrs±30minutes then 17hrs ±60 minutes at at 2°c-8°c , the total
retention time. After 24 hrs the samples are disposed as per National regulation of Waste Disposal. The lag periods
obtained from TAT analysis data of the laboratory.
Statistical Calculations
The samples have been randomly chosen. The mean of 1st and 2nd observation of every analyte in everyphase is
calculated. Difference from first observations and bias evaluated. Mean of the deviationfor every analyte in each
phase, Mean X(mean of 1st observations) ,Mean y(mean of 2nd observations) have been calculated. CV% evaluated
as follows:
CV% = Mean of deviationx100/Mean of 1st observation (all results).
Regression coefficient has also been calculated from Winks SDA – online statistical data analysis calculator. The
parameterswith regression coefficient 0.95-1.02 havebeen chosen as validated parameter for preservation in
primary container.
6
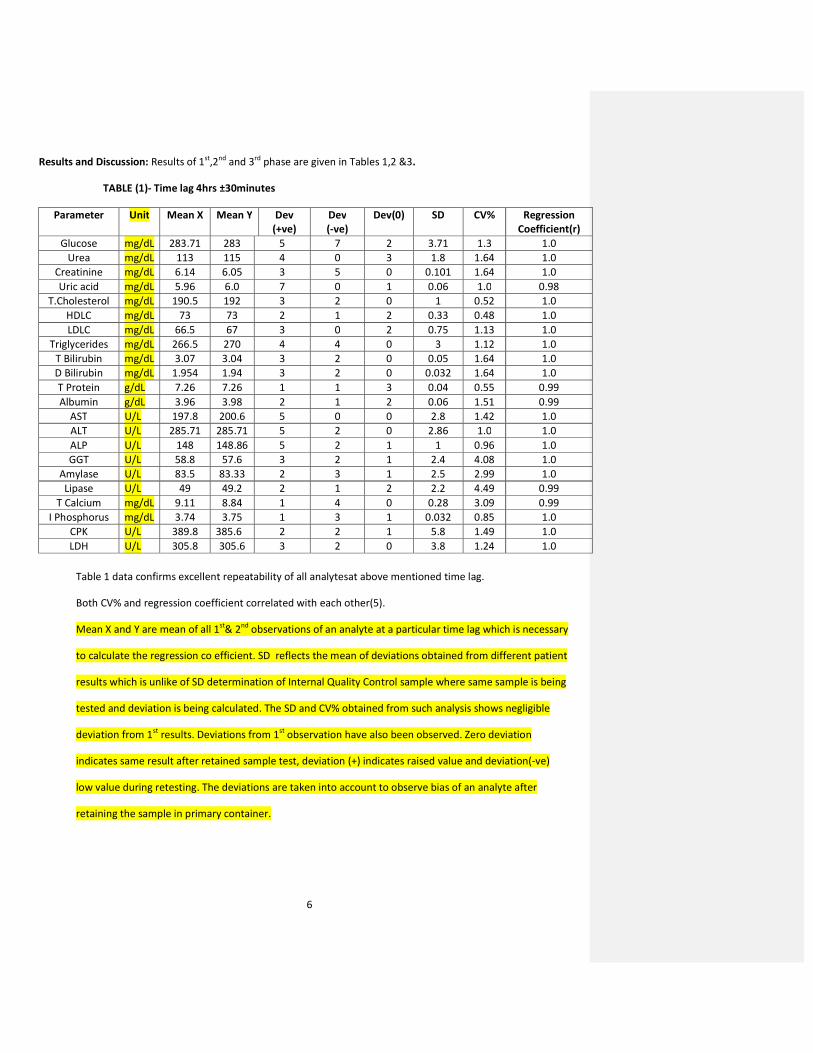
Results and Discussion: Results of 1st,2nd and 3rd phase are given in Tables 1,2 &3.
TABLE (1)- Time lag 4hrs ±30minutes
Table 1 data confirms excellent repeatability of all analytesat above mentioned time lag.
Both CV% and regression coefficient correlated with each other(5).
Mean X and Y are mean of all 1st& 2
nd observations of an analyte at a particular time lag which is necessary
to calculate the regression co efficient. SD reflects the mean of deviations obtained from different patient
results which is unlike of SD determination of Internal Quality Control sample where same sample is being
tested and deviation is being calculated. The SD and CV% obtained from such analysis shows negligible
deviation from 1st
results. Deviations from 1st
observation have also been observed. Zero deviation
indicates same result after retained sample test, deviation (+) indicates raised value and deviation(-ve)
low value during retesting. The deviations are taken into account to observe bias of an analyte after
retaining the sample in primary container.
Parameter Unit Mean X Mean Y Dev
(+ve)
Dev
(-ve)
Dev(0) SD CV% Regression
Coefficient(r)
Glucose mg/dL 283.71 283 5 7 2 3.71 1.3 1.0
Urea mg/dL 113 115 4 0 3 1.8 1.64 1.0
Creatinine mg/dL 6.14 6.05 3 5 0 0.101 1.64 1.0
Uric acid mg/dL 5.96 6.0 7 0 1 0.06 1.0 0.98
T.Cholesterol mg/dL 190.5 192 3 2 0 1 0.52 1.0
HDLC mg/dL 73 73 2 1 2 0.33 0.48 1.0
LDLC mg/dL 66.5 67 3 0 2 0.75 1.13 1.0
Triglycerides mg/dL 266.5 270 4 4 0 3 1.12 1.0
T Bilirubin mg/dL 3.07 3.04 3 2 0 0.05 1.64 1.0
D Bilirubin mg/dL 1.954 1.94 3 2 0 0.032 1.64 1.0
T Protein g/dL 7.26 7.26 1 1 3 0.04 0.55 0.99
Albumin g/dL 3.96 3.98 2 1 2 0.06 1.51 0.99
AST U/L 197.8 200.6 5 0 0 2.8 1.42 1.0
ALT U/L 285.71 285.71 5 2 0 2.86 1.0 1.0
ALP U/L 148 148.86 5 2 1 1 0.96 1.0
GGT U/L 58.8 57.6 3 2 1 2.4 4.08 1.0
Amylase U/L 83.5 83.33 2 3 1 2.5 2.99 1.0
Lipase U/L 49 49.2 2 1 2 2.2 4.49 0.99
T Calcium mg/dL 9.11 8.84 1 4 0 0.28 3.09 0.99
I Phosphorus mg/dL 3.74 3.75 1 3 1 0.032 0.85 1.0
CPK U/L 389.8 385.6 2 2 1 5.8 1.49 1.0
LDH U/L 305.8 305.6 3 2 0 3.8 1.24 1.0
7
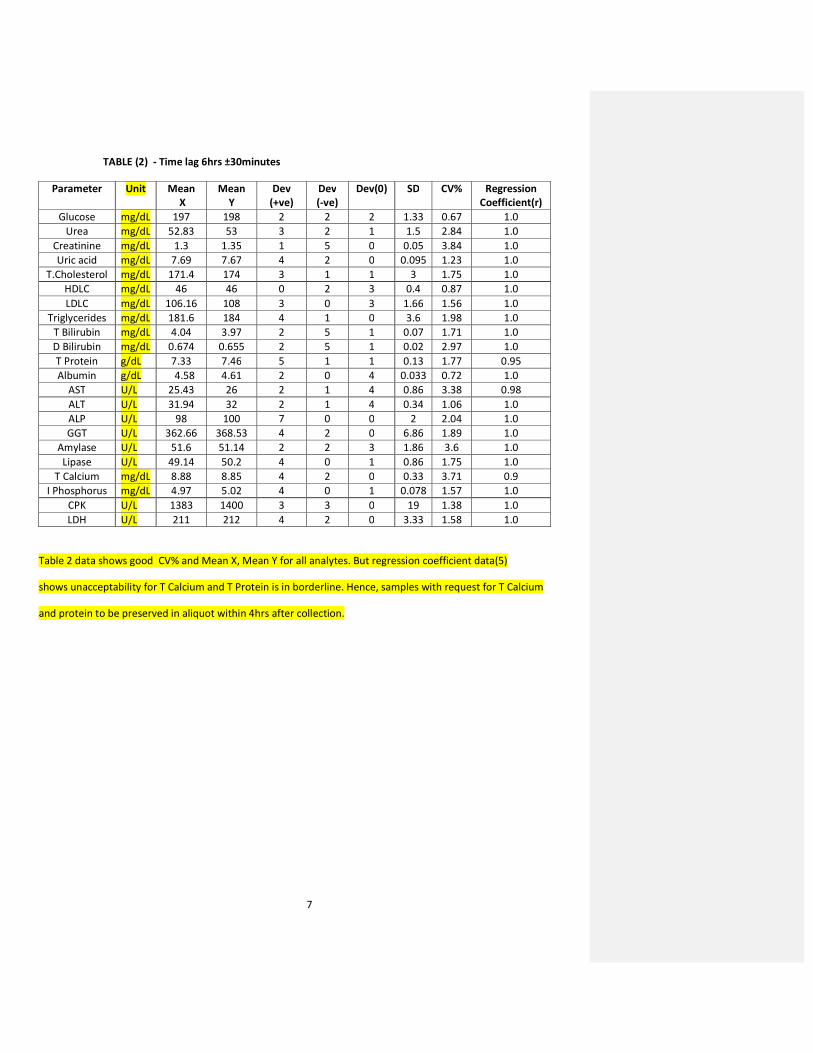
TABLE (2) - Time lag 6hrs ±30minutes
Parameter Unit Mean
X
Mean
Y
Dev
(+ve)
Dev
(-ve)
Dev(0) SD CV% Regression
Coefficient(r)
Glucose mg/dL 197 198 2 2 2 1.33 0.67 1.0
Urea mg/dL 52.83 53 3 2 1 1.5 2.84 1.0
Creatinine mg/dL 1.3 1.35 1 5 0 0.05 3.84 1.0
Uric acid mg/dL 7.69 7.67 4 2 0 0.095 1.23 1.0
T.Cholesterol mg/dL 171.4 174 3 1 1 3 1.75 1.0
HDLC mg/dL 46 46 0 2 3 0.4 0.87 1.0
LDLC mg/dL 106.16 108 3 0 3 1.66 1.56 1.0
Triglycerides mg/dL 181.6 184 4 1 0 3.6 1.98 1.0
T Bilirubin mg/dL 4.04 3.97 2 5 1 0.07 1.71 1.0
D Bilirubin mg/dL 0.674 0.655 2 5 1 0.02 2.97 1.0
T Protein g/dL 7.33 7.46 5 1 1 0.13 1.77 0.95
Albumin g/dL 4.58 4.61 2 0 4 0.033 0.72 1.0
AST U/L 25.43 26 2 1 4 0.86 3.38 0.98
ALT U/L 31.94 32 2 1 4 0.34 1.06 1.0
ALP U/L 98 100 7 0 0 2 2.04 1.0
GGT U/L 362.66 368.53 4 2 0 6.86 1.89 1.0
Amylase U/L 51.6 51.14 2 2 3 1.86 3.6 1.0
Lipase U/L 49.14 50.2 4 0 1 0.86 1.75 1.0
T Calcium mg/dL 8.88 8.85 4 2 0 0.33 3.71 0.9
I Phosphorus mg/dL 4.97 5.02 4 0 1 0.078 1.57 1.0
CPK U/L 1383 1400 3 3 0 19 1.38 1.0
LDH U/L 211 212 4 2 0 3.33 1.58 1.0
Table 2 data shows good CV% and Mean X, Mean Y for all analytes. But regression coefficient data(5)
shows unacceptability for T Calcium and T Protein is in borderline. Hence, samples with request for T Calcium
and protein to be preserved in aliquot within 4hrs after collection.
8
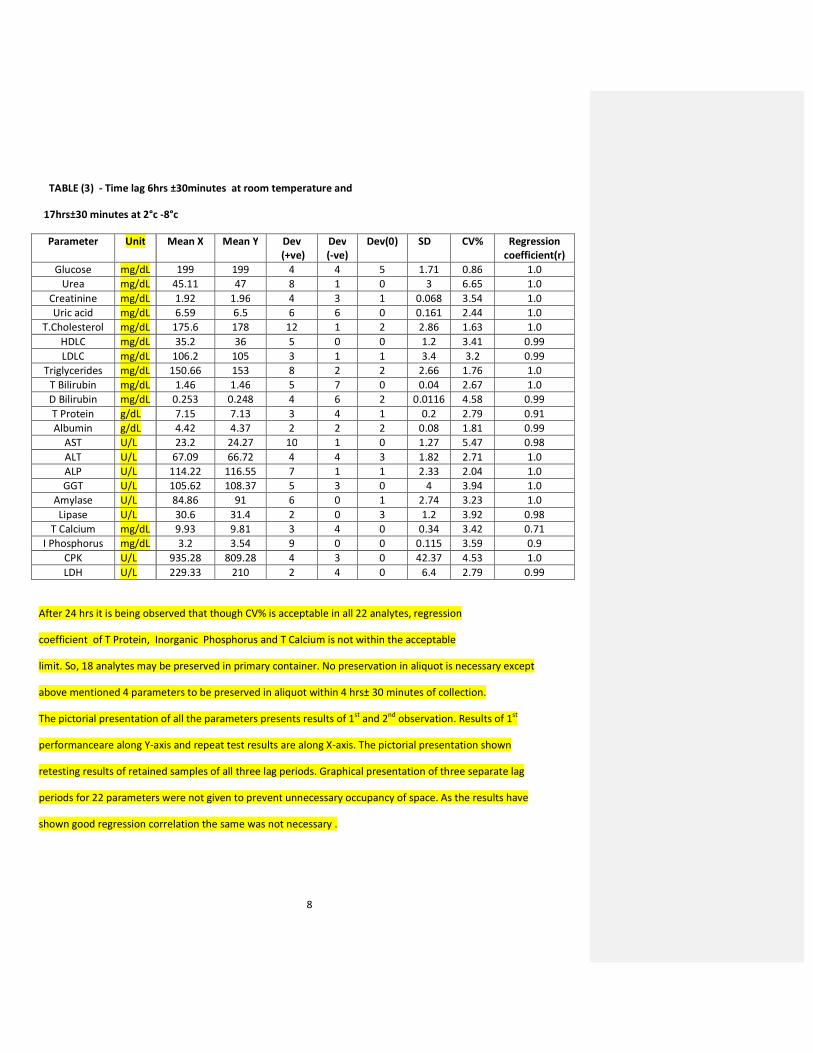
TABLE (3) - Time lag 6hrs ±30minutes at room temperature and
17hrs±30 minutes at 2°c -8°c
Parameter Unit Mean X Mean Y Dev
(+ve)
Dev
(-ve)
Dev(0) SD CV% Regression
coefficient(r)
Glucose mg/dL 199 199 4 4 5 1.71 0.86 1.0
Urea mg/dL 45.11 47 8 1 0 3 6.65 1.0
Creatinine mg/dL 1.92 1.96 4 3 1 0.068 3.54 1.0
Uric acid mg/dL 6.59 6.5 6 6 0 0.161 2.44 1.0
T.Cholesterol mg/dL 175.6 178 12 1 2 2.86 1.63 1.0
HDLC mg/dL 35.2 36 5 0 0 1.2 3.41 0.99
LDLC mg/dL 106.2 105 3 1 1 3.4 3.2 0.99
Triglycerides mg/dL 150.66 153 8 2 2 2.66 1.76 1.0
T Bilirubin mg/dL 1.46 1.46 5 7 0 0.04 2.67 1.0
D Bilirubin mg/dL 0.253 0.248 4 6 2 0.0116 4.58 0.99
T Protein g/dL 7.15 7.13 3 4 1 0.2 2.79 0.91
Albumin g/dL 4.42 4.37 2 2 2 0.08 1.81 0.99
AST U/L 23.2 24.27 10 1 0 1.27 5.47 0.98
ALT U/L 67.09 66.72 4 4 3 1.82 2.71 1.0
ALP U/L 114.22 116.55 7 1 1 2.33 2.04 1.0
GGT U/L 105.62 108.37 5 3 0 4 3.94 1.0
Amylase U/L 84.86 91 6 0 1 2.74 3.23 1.0
Lipase U/L 30.6 31.4 2 0 3 1.2 3.92 0.98
T Calcium mg/dL 9.93 9.81 3 4 0 0.34 3.42 0.71
I Phosphorus mg/dL 3.2 3.54 9 0 0 0.115 3.59 0.9
CPK U/L 935.28 809.28 4 3 0 42.37 4.53 1.0
LDH U/L 229.33 210 2 4 0 6.4 2.79 0.99
After 24 hrs it is being observed that though CV% is acceptable in all 22 analytes, regression
coefficient of T Protein, Inorganic Phosphorus and T Calcium is not within the acceptable
limit. So, 18 analytes may be preserved in primary container. No preservation in aliquot is necessary except
above mentioned 4 parameters to be preserved in aliquot within 4 hrs± 30 minutes of collection.
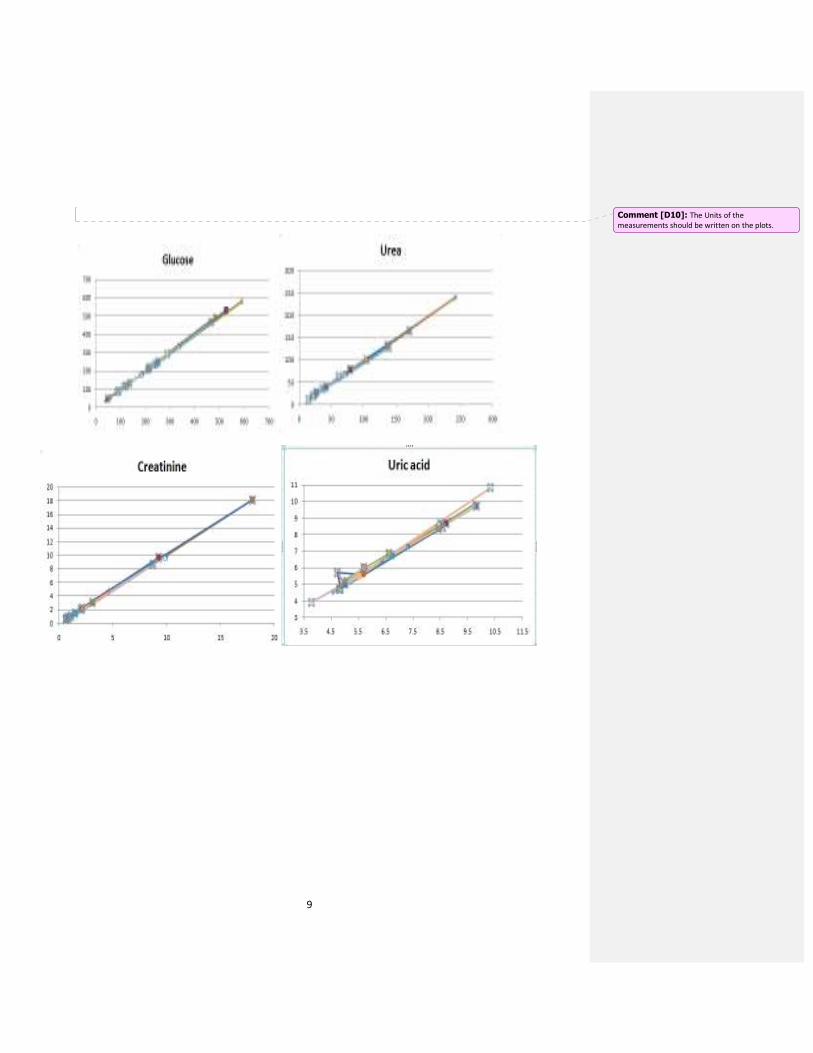
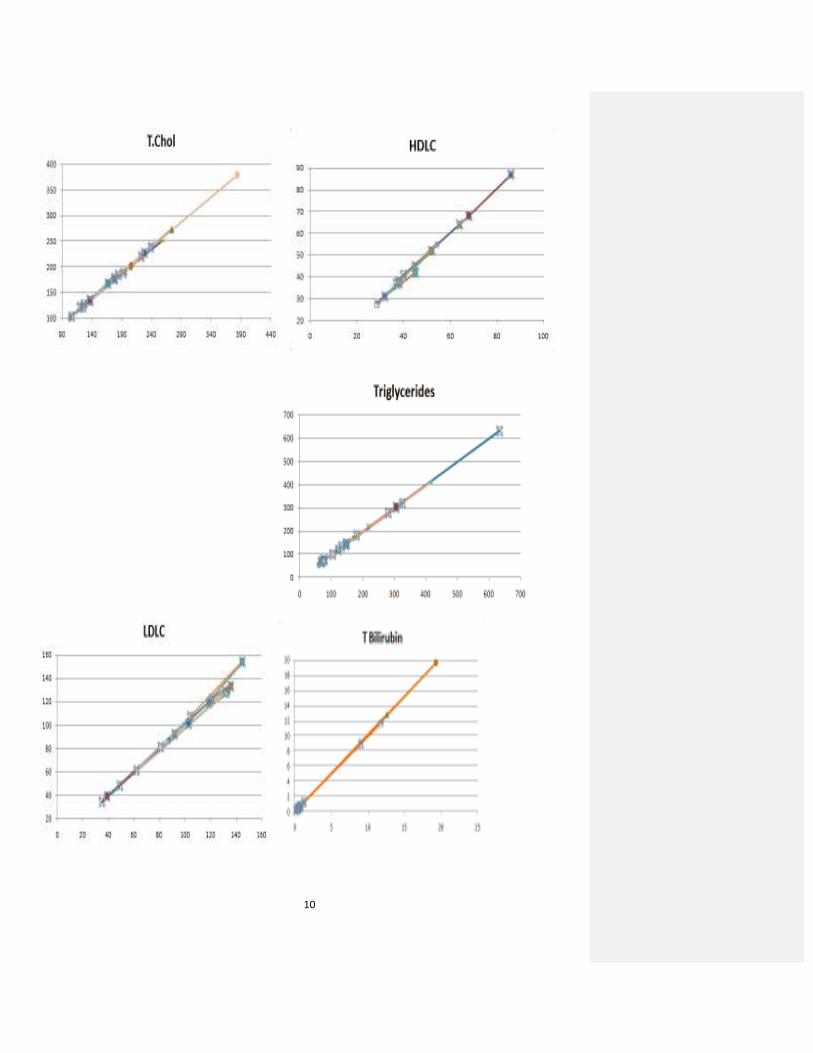
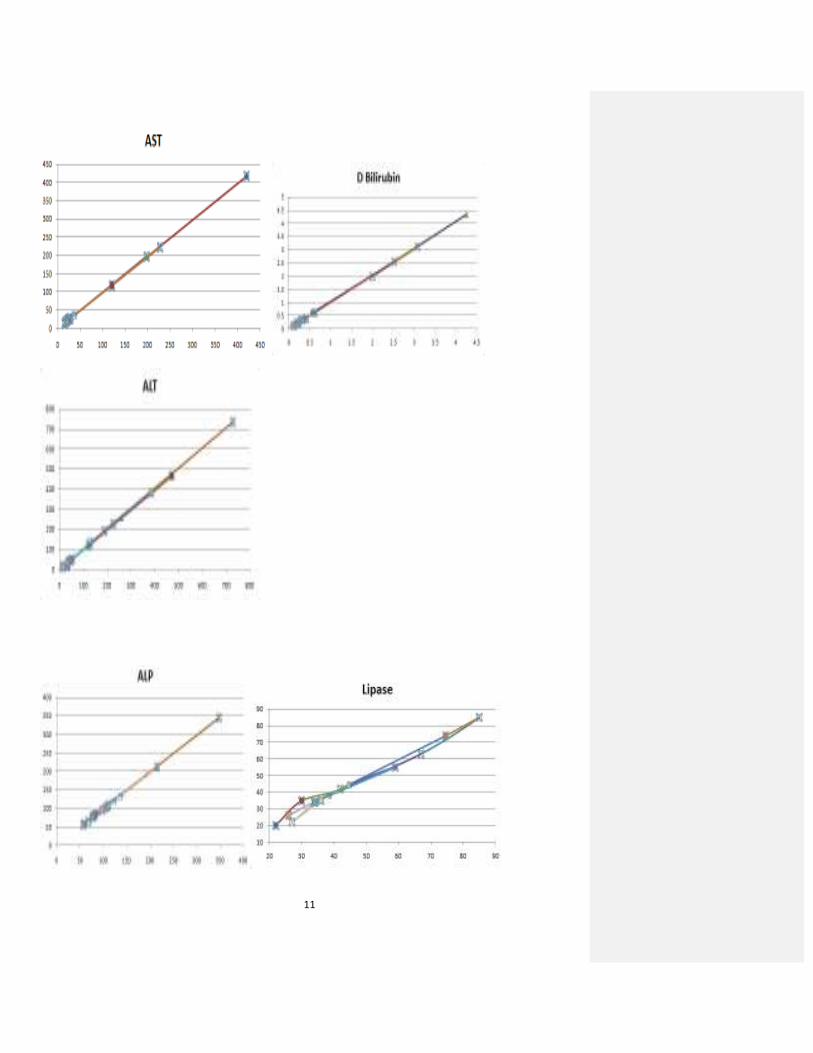
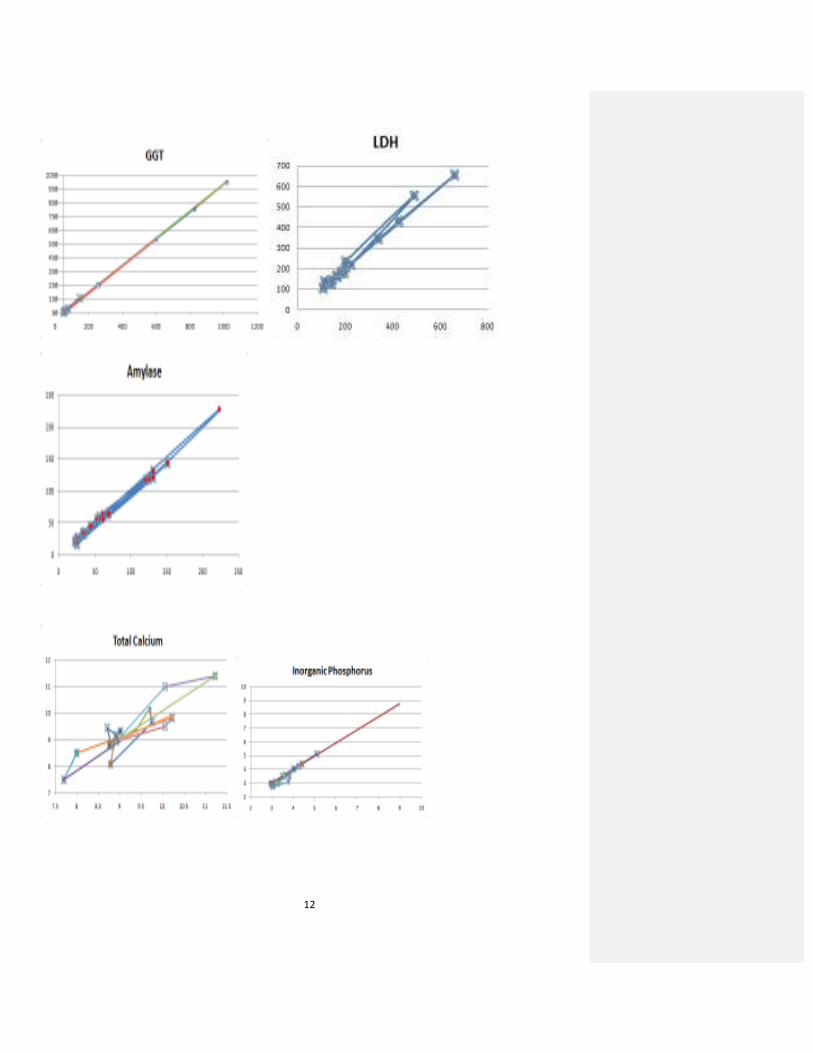
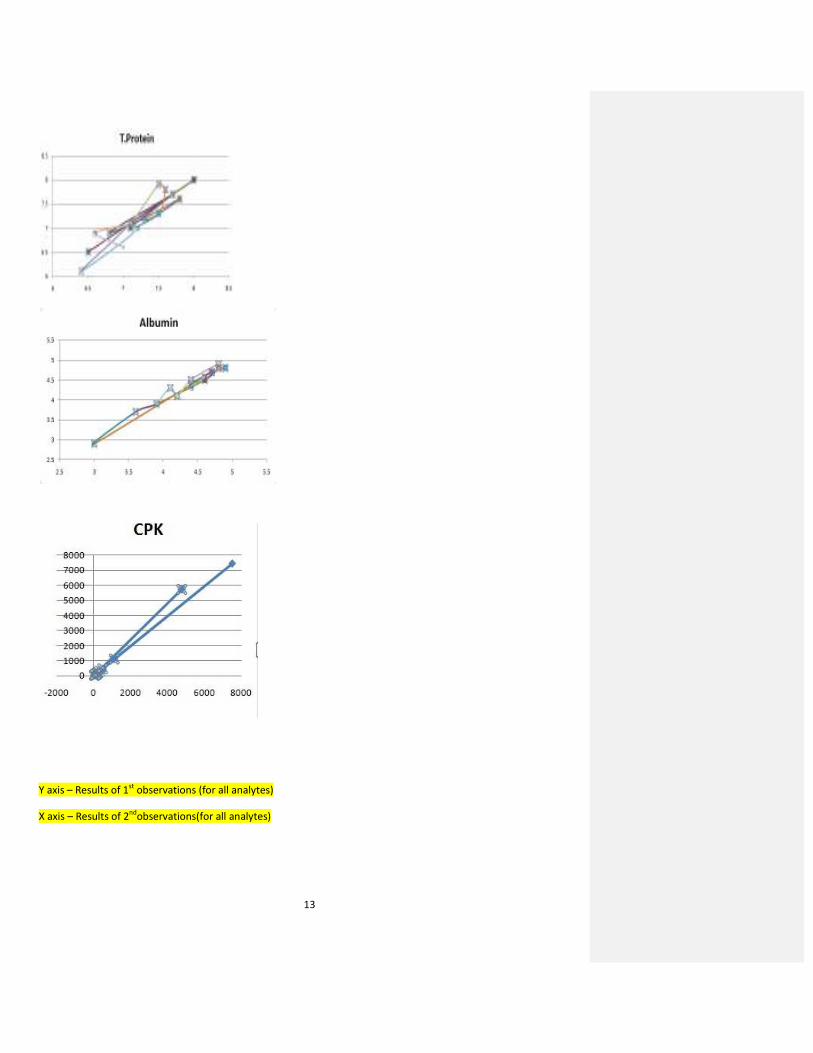
The pictorial presentation of all the parameters presents results of 1st
and 2nd
observation. Results of 1st
performanceare along Y-axis and repeat test results are along X-axis. The pictorial presentation shown
retesting results of retained samples of all three lag periods. Graphical presentation of three separate lag
periods for 22 parameters were not given to prevent unnecessary occupancy of space. As the results have
shown good regression correlation the same was not necessary .
9
Comment [D10]: The Units of the
measurements should be written on the plots.
10
11
12
13
Y axis – Results of 1st
observations (for all analytes)
X axis – Results of 2nd
observations(for all analytes)
14
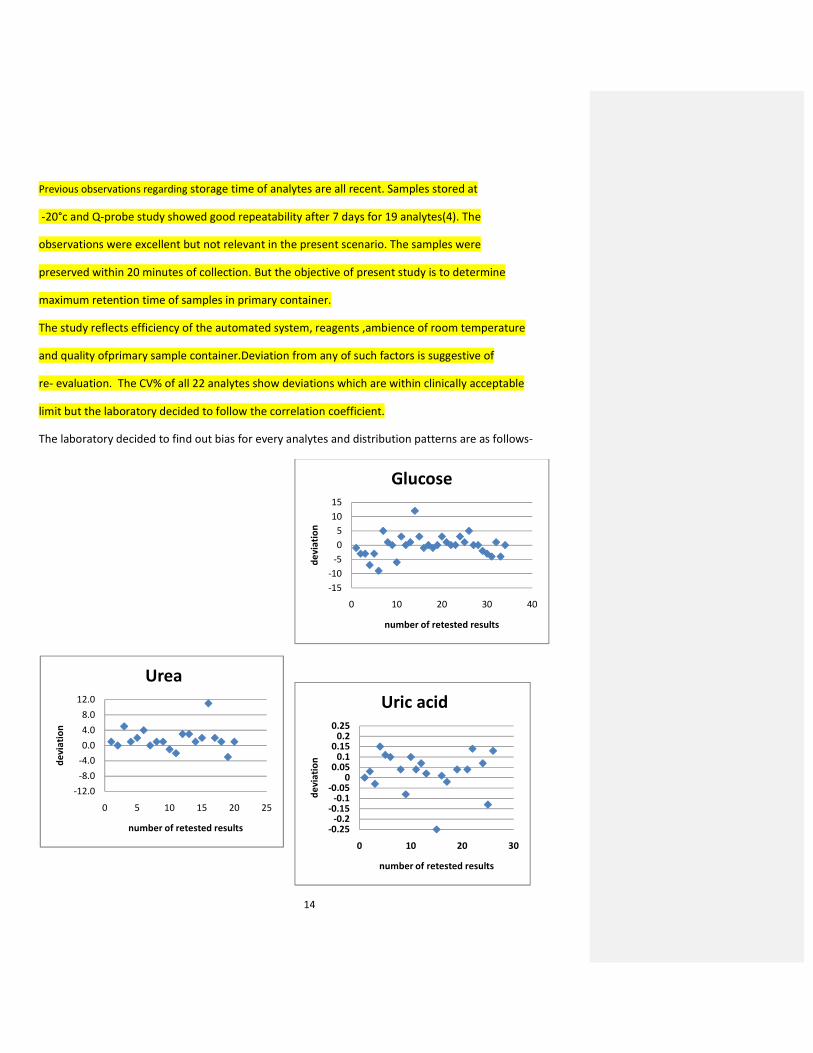
Previous observations regarding storage time of analytes are all recent. Samples stored at
-20°c and Q-probe study showed good repeatability after 7 days for 19 analytes(4). The
observations were excellent but not relevant in the present scenario. The samples were
preserved within 20 minutes of collection. But the objective of present study is to determine
maximum retention time of samples in primary container.
The study reflects efficiency of the automated system, reagents ,ambience of room temperature
and quality ofprimary sample container.Deviation from any of such factors is suggestive of
re- evaluation. The CV% of all 22 analytes show deviations which are within clinically acceptable
limit but the laboratory decided to follow the correlation coefficient.
The laboratory decided to find out bias for every analytes and distribution patterns are as follows-
-15
-10
-5
0
5
10
15
0 10 20 30 40
de
via
tio
n
number of retested results
Glucose
-0.25-0.2
-0.15-0.1
-0.050
0.050.1
0.150.2
0.25
0 10 20 30
de
via
tio
n
number of retested results
Uric acid
-12.0
-8.0
-4.0
0.0
4.0
8.0
12.0
0 5 10 15 20 25
de
via
tio
n
number of retested results
Urea
15
-0.40-0.35-0.30-0.25-0.20-0.15-0.10-0.050.000.050.100.150.200.250.300.350.40
0 10 20 30
de
via
tio
n
number of retested results
Creatinine
-8
-6
-4
-2
0
2
4
6
8
0 10 20 30
de
via
tio
n
number of retested results
T Cholesterol
-10
-5
0
5
10
0 5 10 15 20 25
de
via
tio
n
number of retested results
Triglycerides
-3
-2
-1
0
1
2
3
0 5 10 15
de
via
tio
n
number of retested results
HDLC
16
-9
-6
-3
0
3
6
9
0 5 10 15 20
de
via
tio
n
number of retested results
LDLC
-0.35-0.30-0.25-0.20-0.15-0.10-0.050.000.050.100.150.200.250.300.35
0 5 10 15 20 25
de
via
tio
n
number of retested results
T Bilirubin
-6
-4
-2
0
2
4
6
0 10 20 30
de
via
tio
n
number of retested results
ALT
-0.04
-0.02
0.00
0.02
0.04
0 5 10 15 20
de
via
tio
n
number of retested results
D Bilirubin
-4
-3
-2
-1
0
1
2
3
4
0 10 20 30
de
via
tio
n
number of retested results
ALP
17
-6
-4
-2
0
2
4
6
0 5 10 15 20 25
de
via
tio
n
number of retested results
AST
-1.00
-0.50
0.00
0.50
1.00
0 5 10 15 20
de
via
tio
n
number of retested results
T.Calcium
-20
-10
0
10
20
0 5 10 15 20
de
via
tio
n
number of retested results
GGT
-7
-2
3
0 5 10 15 20 25
de
via
tio
n
number of retested results
Amylase
-0.70-0.60-0.50-0.40-0.30-0.20-0.100.000.100.200.300.400.500.600.70
0 5 10 15 20
de
via
tio
n
number of retested results
I.Phosphorus
18
-6
-4
-2
0
2
4
6
0 5 10 15 20
de
via
tio
n
number of retested results
Lipase
-1000
-500
0
500
1000
0 5 10 15 20
de
via
tio
n
number of retested results
CPK
-0.25-0.2
-0.15-0.1
-0.050
0.050.1
0.150.2
0.25
0 5 10 15 20
de
via
tio
n
number of retested results
Albumin
19
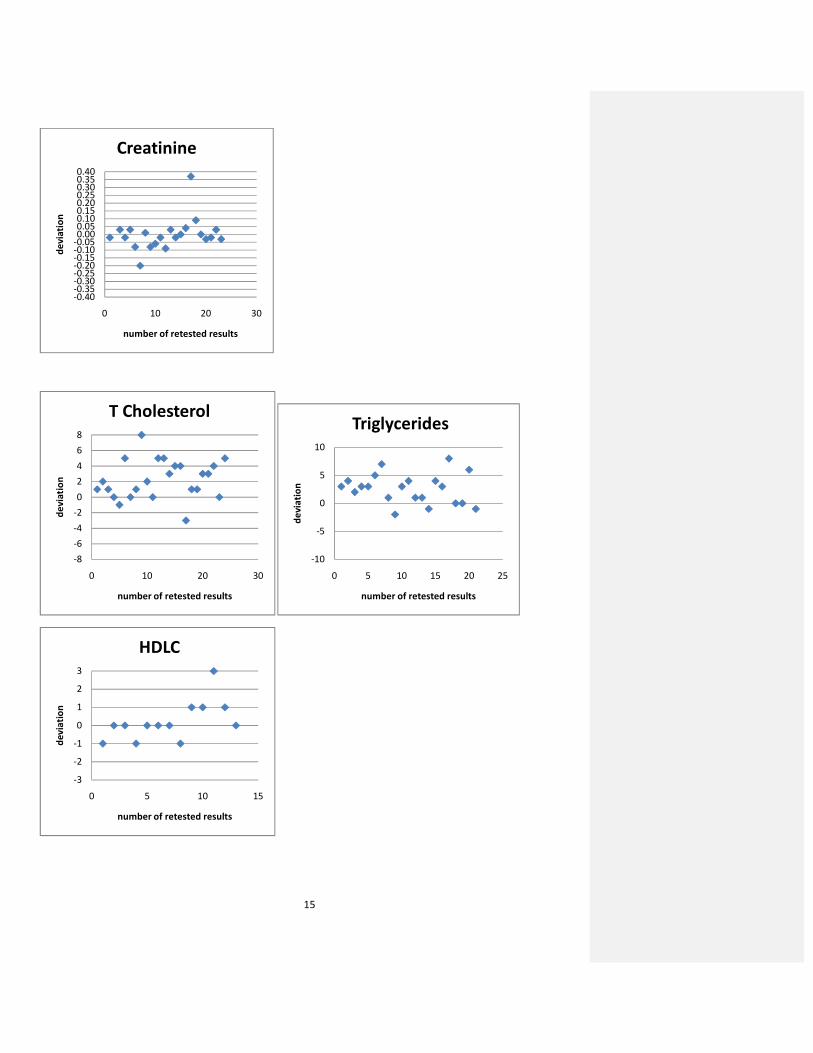
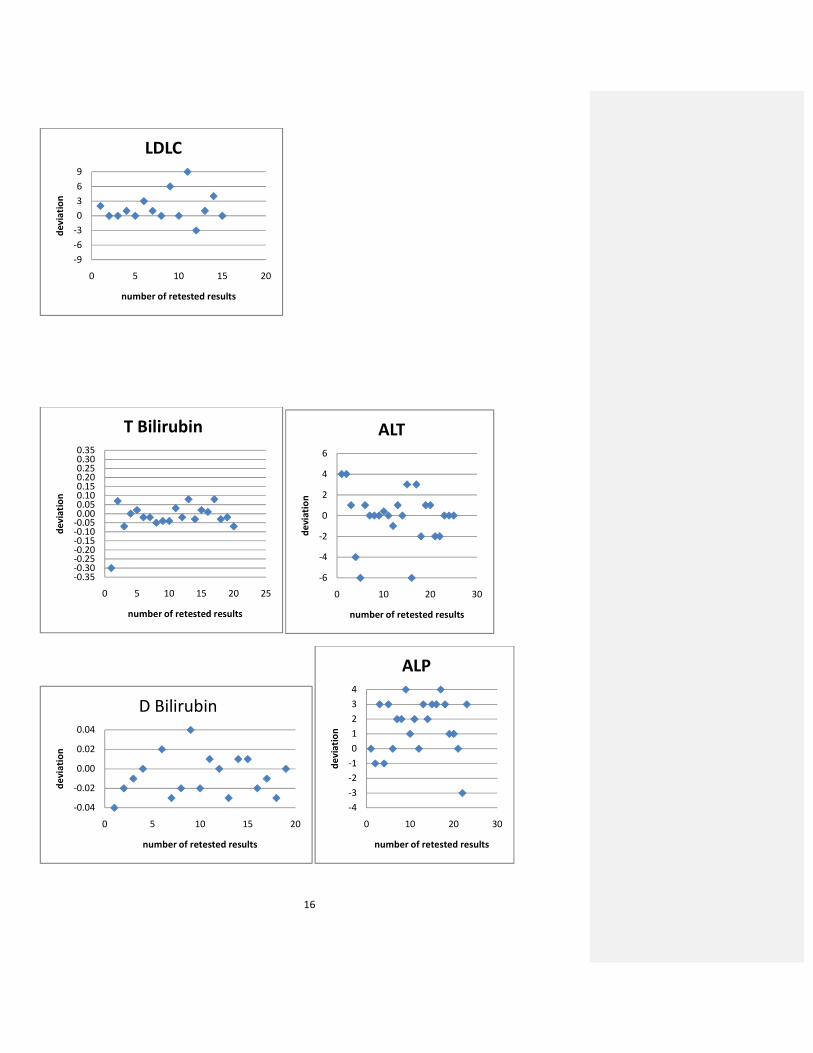
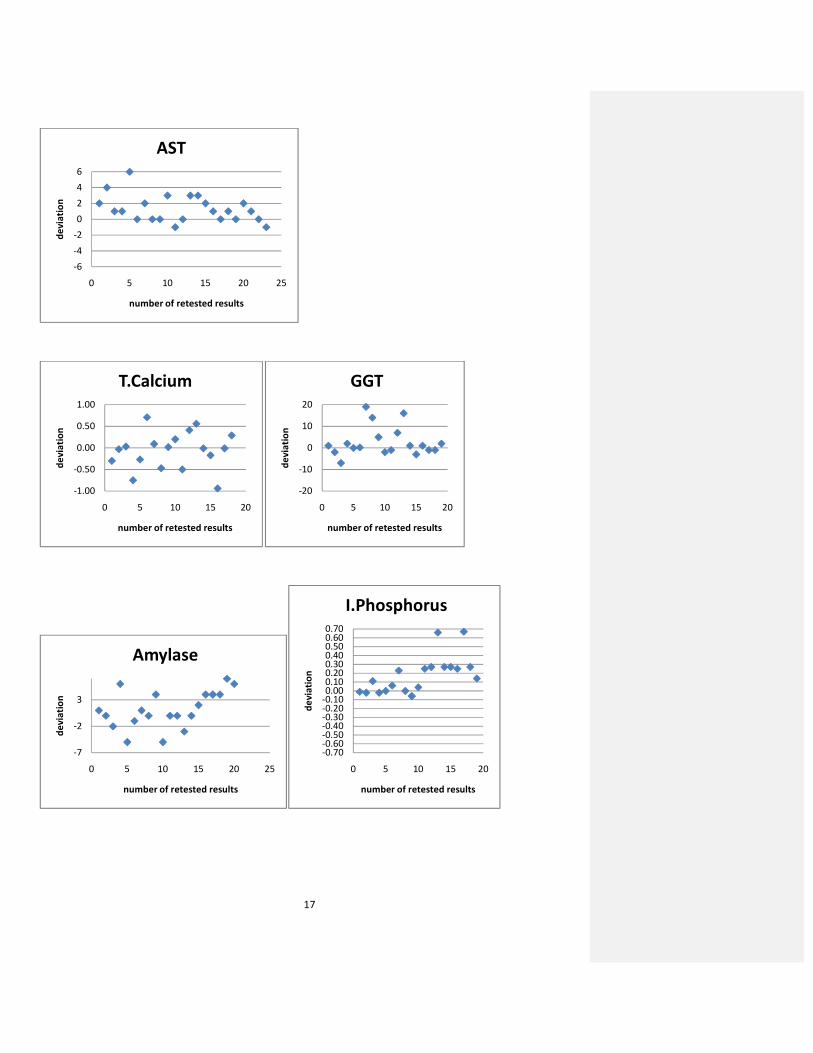
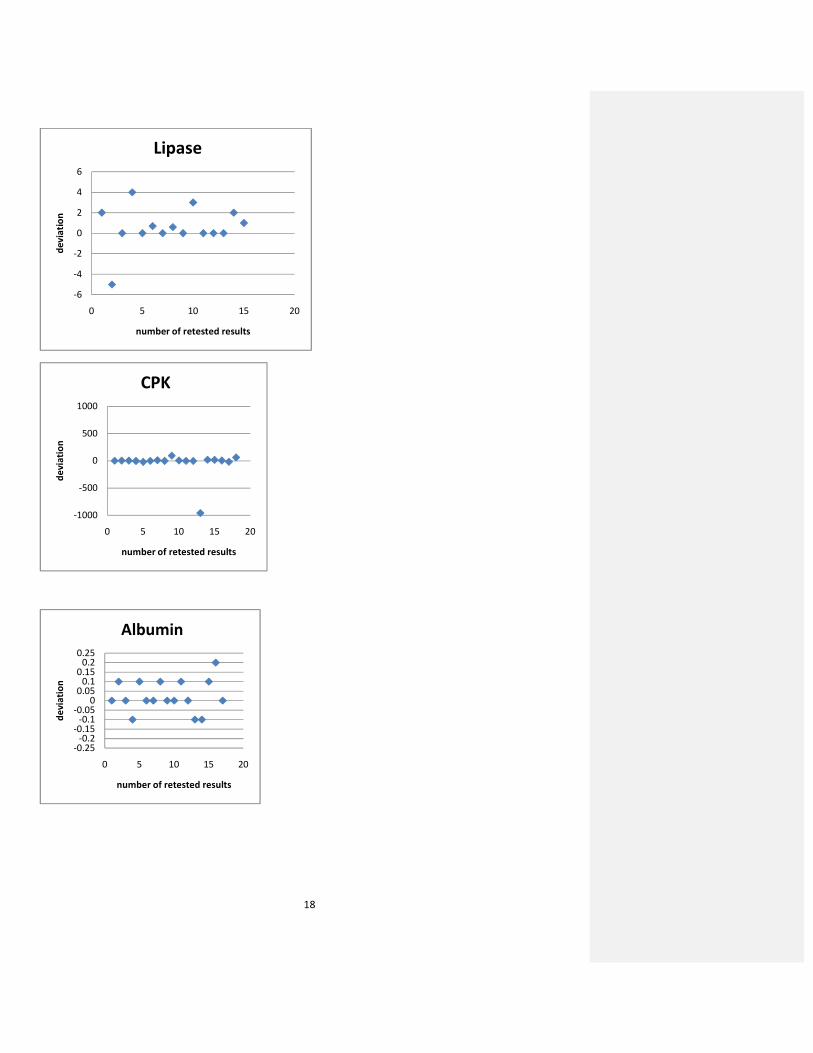
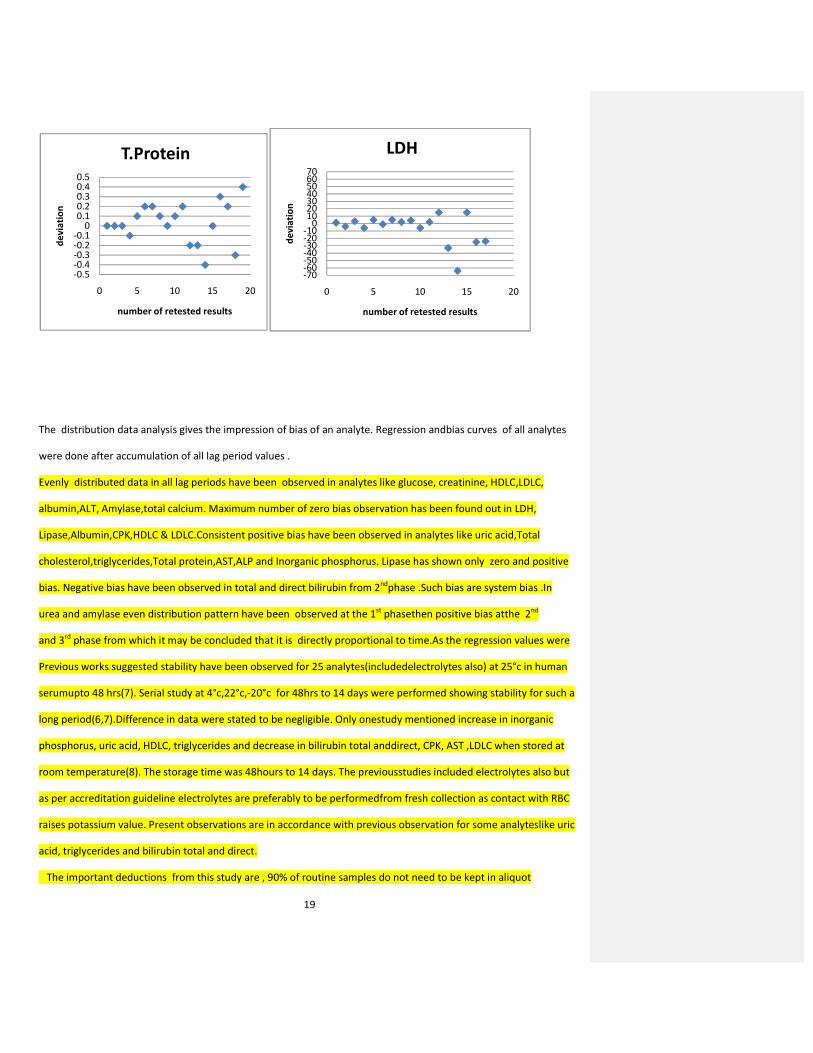
The distribution data analysis gives the impression of bias of an analyte. Regression andbias curves of all analytes
were done after accumulation of all lag period values .
Evenly distributed data in all lag periods have been observed in analytes like glucose, creatinine, HDLC,LDLC,
albumin,ALT, Amylase,total calcium. Maximum number of zero bias observation has been found out in LDH,
Lipase,Albumin,CPK,HDLC & LDLC.Consistent positive bias have been observed in analytes like uric acid,Total
cholesterol,triglycerides,Total protein,AST,ALP and Inorganic phosphorus. Lipase has shown only zero and positive
bias. Negative bias have been observed in total and direct bilirubin from 2ndphase .Such bias are system bias .In
urea and amylase even distribution pattern have been observed at the 1st phasethen positive bias atthe 2nd
and 3rd phase from which it may be concluded that it is directly proportional to time.As the regression values were
Previous works suggested stability have been observed for 25 analytes(includedelectrolytes also) at 25°c in human
serumupto 48 hrs(7). Serial study at 4°c,22°c,-20°c for 48hrs to 14 days were performed showing stability for such a
long period(6,7).Difference in data were stated to be negligible. Only onestudy mentioned increase in inorganic
phosphorus, uric acid, HDLC, triglycerides and decrease in bilirubin total anddirect, CPK, AST ,LDLC when stored at
room temperature(8). The storage time was 48hours to 14 days. The previousstudies included electrolytes also but
as per accreditation guideline electrolytes are preferably to be performedfrom fresh collection as contact with RBC
raises potassium value. Present observations are in accordance with previous observation for some analyteslike uric
acid, triglycerides and bilirubin total and direct.
The important deductions from this study are , 90% of routine samples do not need to be kept in aliquot
-0.5-0.4-0.3-0.2-0.1
00.10.20.30.40.5
0 5 10 15 20
de
via
tio
n
number of retested results
T.Protein
-70-60-50-40-30-20-10
010203040506070
0 5 10 15 20d
ev
iati
on
number of retested results
LDH
20
If the retention time is 24 hours which is important from both Human resources and financial point of views.
Total protein and albumin results get affected because they are base of sample matrix. Hence , slightest
change in sample volume affects the correlation coefficient. Total calcium and phosphorus method of
estimation is very sensitive and failure to satisfy the criteria of correlation coefficient may be attributed to that.
Secondly , the CV% of all analytes are satisfactory but correlation coefficient criteria made four parameters
unacceptable for such preservation. So, for similar study , correlation coefficient to be considered as the
determinant instead CV%.The study is specifically useful for paediatric samples as collection &preservation
ofpaediatric samples is difficult.
CONCLUSION
The validation study may be used as a guideline for sample preservation. But the validity is dependant on
certain factors like laboratory environment, time lag between collection and receipt by the laboratory,
instrument, reagents, competence of laboratory personnel and quality of primary container. Any deviation
from such factor/factors needs re evaluation. The presenting authors laboratory has decided to continue
this study as part of quality control procedure so that any deviation may be noted and corrective and preventive
action may be implemented.
Acknowledgement
1. The Director - JMD Diagnostics Private Limited .
2. The laboratory personnel -JMD Diagnostics Private Limited .
21
References
(1) Specific criteria for accreditation of medical laboratories –National Accreditation Board of Testing and
Calibration Laboratories. Document NABL 112;p. 21:2007(Guidebook of Indian Accreditation Body).
(2)Wayne P A.CLSI procedures for the handling and processing of blood specimens for common laboratory tests:
Clinical and Laboratory Standards Institute.4th Ed.2010.
(3)Marjani A. Effect of storage time and temperature on serum analytes. American Journal of Applied Sciences.
Vol.5. p.1047-51: 2008.
(4)L Ali , Siddiqui I. Q probes study of replicate specimen at the clinical laboratory . Journal of Pakistan Medical
Association. Vol.54,No.2; p.1-5:2004.
(5)Passing H, Bablok W. A general regression procedure for method transformation.JClinChemClinBiochem.
Vol.26;p.783-90:1988
(6)Heins M, Heil W, Withhold W. Storage of serum or whole blood samples? Effects of time and temperature
on 22 serum analytes. Eur J ClinChemClinBiochem. Vol.33; p.231-8:1995.
(7)Donnelly J G, Soldin S J, Nealon D A, Hicks J M. Stability of twenty five analytesin human serum at 22°c, 4°c
and -20°c. Paeditr.Pathol Lab Med. Vol.15(6);869-74:1995.
(8)Ono T, Kitaguchi K, Takehara M, Shiiba M, Hayami K. Serum constituent analysis: effect of duration and
Temperature of storage of clotted blood.Clin Chem. .Vol 27(1); 35-6:1981.