Embed Size (px)
Citation preview

Approved forpublic release;distribution is unlimited.
Title:
Author(s):
Submitted to:
A PEGASUS DYNAMIC LINER FRICTION EXPERIMENT
J. E. Hammerberg, XNHG. A. Kyrala, P-24D. M. Ore, P-22R. D. Fulton, P-22W. E. Anderson, MST-7A. W. Obst, P-23H. Oona, P-23.1.Stokes. P-22
APS Conference on Shock Compression of Condensed Matter
IFNECXW”EDs~p1)71999
cm-n
Los AlamosNATIONAL LABORATORY
Los Alamos National Laboratory, an affirmative acfiotiequal opportunity employer, is operated by the University of California for the U.S.Department of Energy under contract W-7405-ENG-36. By acceptance of this article, the pubfisher recognizes that the U.S. Governmentretains a nonexclusive, royalty-free ficense to pubfish or reproduce the pubfished form of this contribution, or to allow others to do so, for U.S.Government purposes. Los Alamos National f-aborato~ requests that the publisher identify this article as work performed under theauspices of the U.S. Department of Energy. Los Afamos National Laboratory strongly supports academic freedom and a researcher% right topublish; as an institution, however, the Laboratory does not endorse the viewpoint of a publication or guarantee its technical correctness.
Form 836 (10/96)
-., ..=,- . ->,-.,-.7/, -7 - .-7,-7T, -T----??,. >.=. ...3.. . . .. . . . . . ... -.— Tm?’-r’? Tr-*-- .T?17r,.,.- - . -77------ -
DISCLAIMER
This repofi was prepared as an account of work sponsoredby an agency of the United States Government. Neitherthe United States Government nor any agency th”ereof, norany of their employees, make any warranty, express orimplied, or assumes any legal liability or responsibility forthe accuracy, completeness, or usefulness of anyinformation, apparatus, product, or process disclosed, orrepresents that its use would not infringe privately ownedrights. Reference herein to any specific commercialproduct, process, or service by trade name, trademark,manufacturer, or otherwise does not necessarily constituteor imply its endorsement, recommendation, or favoring bythe United States Government or any agency thereof. Theviews and opinions of authors expressed herein do notnecessarily state or reflect those of the United StatesGovernment or any agency thereof.
DISCLAIMER
Portions of this document may be illegiblein electronic image products. Images areproduced from the best available originaldocument.
-. ----
,
APEGASUSDYNAMICLINERFRICTIONExperimentJ.E.Hammerberg, G.A.Kyralz D.M.Ore, RD.Fulton, W&Anderson, A.W.Obs&
H.Oon~ J.Stokes, and M.D.WiIke
Los AlamosNationul b.borato~, Los Alamos,NM 87545
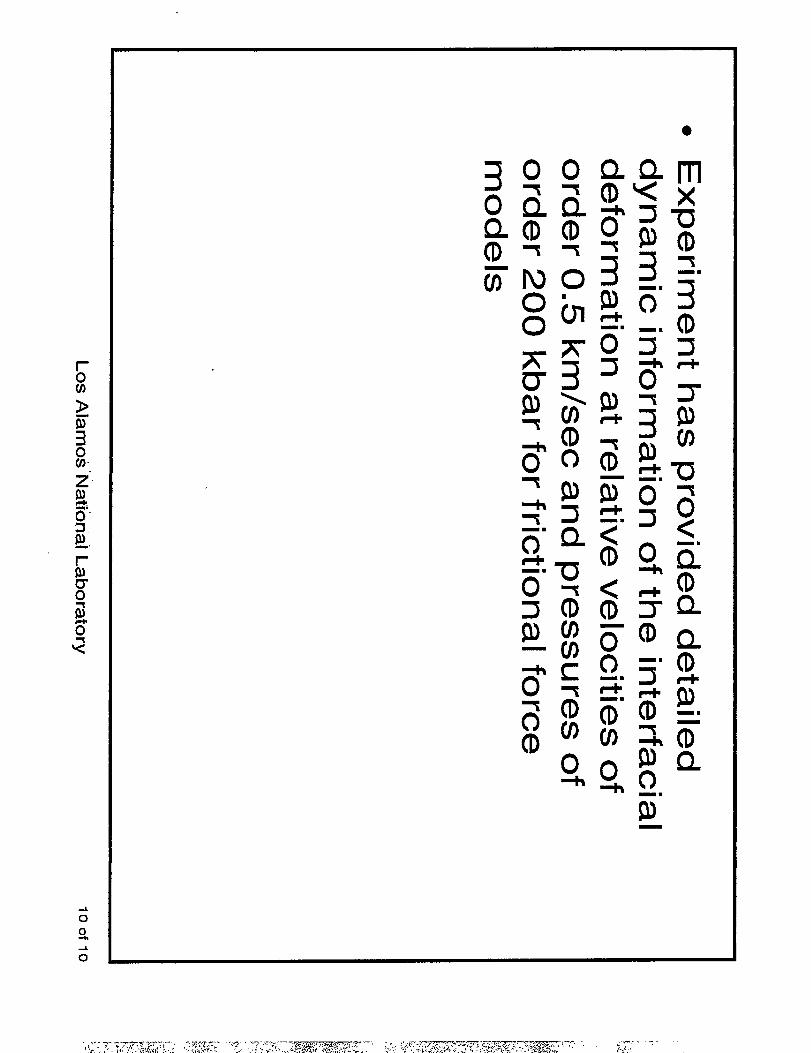
Abstract. We report on a pulsed power experiment performed at the Los Alamos National LaboratoryPegasus facility which was designed to measure material flow at metal interfaces driven to high relativevelocities. Material motion at and near four flat Ta/Al(6061) interfaces was measured using flash radio-graphic techniques. A series of tine Pb wires (407 micron diameter) was implanted in the Al normal tothe interfaces. The motion of these markers under shock loading provided a picture of material motionin the Al interracial region. The surface roughness of the interfaces was varied between 32and 125micro-inches. We discuss the implications of these measurements for constitutive models of high speedfriction and interracial morphological change.
INTRODUCTION
Material motion at a shock loaded metal-metalinterface is extremely difficult to observe in a quan-titative fashion. The theory of the tangential forcelaw appropriate to hydrodynamic computer codes isvery approximate for material slip velocitiesapproaching significant fractions of the soundspeeds of the interracial materials and for the largepressures achieved in shock loading. There is evi-dence from atornistic simulations (1) that for relativevelocities greater than 0.1 times the sound speed, the
coefficient of friction scales as (vRl / @a with a of
order 0.7 where ~ is the transverse sound speed.
However, the experimented data is meager at best forsuch high speeds and at very large compressions(pressures of order lOOkbar and above) is non-exis-tent. The present experiment is an attempt to rectifythis situation by interrogating a shock loaded ductilemetal - ductile metal interface. The technique is toradiograph thin .(407 pm diameter) lead wires placedperpendicular to a Ta/Al interface. The wave speedsin these two materials are such that high relative
velocities are achieved in tangential shock loading.This method allows us to map Lagrangian meshmotion at and near the interface. The following sec-tions discuss the Pegasus friction experiment target,diagnostics, results, and a preliminary analysis ofthe data.
THE PEGASUS FRICTION TARGET
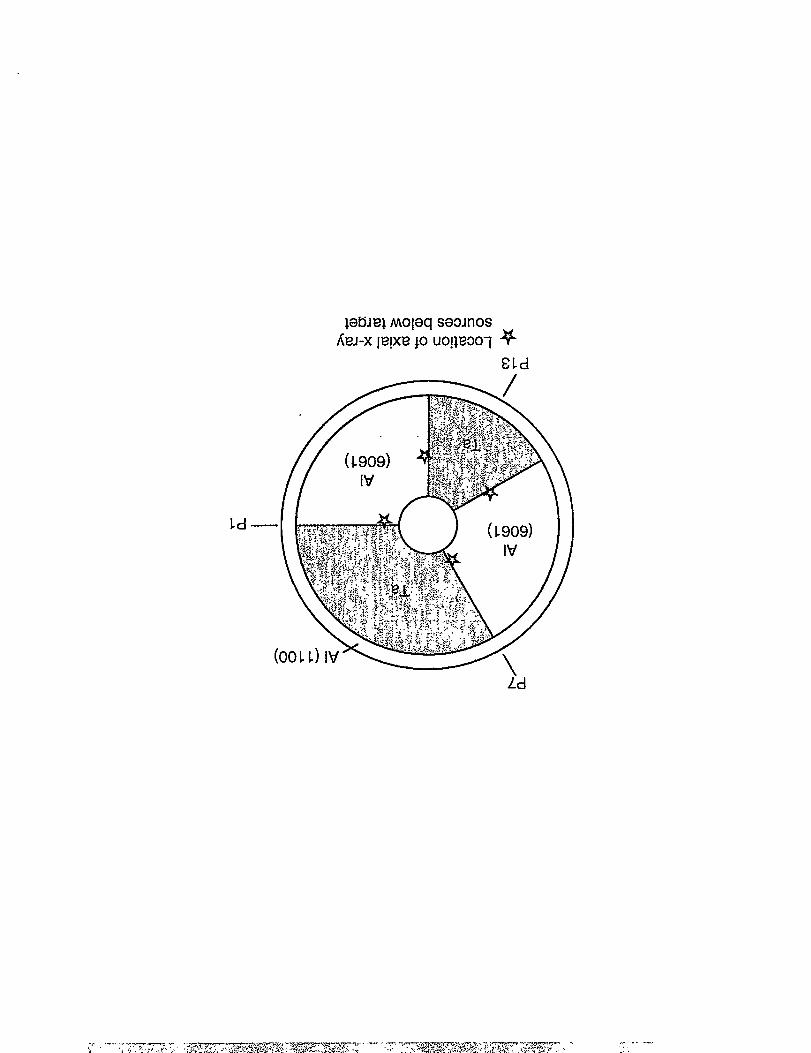
The Pegasus pulsed power facilhy is designedto accelerate a cylindrical liner (usually an Al(l 100)“Moy) onto a target object which is typically cylin-drical in shape. The drive is provided by j x B forcesgenerated by the discharge of a high energy capaci-tor bank (2). In the present experimen~ we havetaken advantage of this geometry to drive a set ofcylindrical shock waves along a set of interfaces.The target geometry is shown in fig.1. It consists ofan Al(l 100) outer cylinder of thickness 2mm andouter diameter 30mrn. This cylinder consists of fourwedges two AI(6061) pieces and two Ta pieces. TheTa wedges have opening angles of 60° and 120°.The interfaces between the Ta and Al weremachined to different surface roughnesses. Along
-?s’-”- - ‘,- “-”’‘—,..-L..

.the 120° Ta piece, the roughness was 32 Pinchesrms. ‘l%esurface roughnesses for the 60° Ta wedgefaces were 63 and 125 pinches. The inner cylindri-cal hole (diameter 6mrn) was filled with Xe gas at 2atmospheres pressure. The target was closed at thetop and bottom with a lexan endcap.
P?’
Pi3
* LLLlcl:cl+y
PIGURE 1. Top view of target geametry. Stms indicate axialsources. Radial source directions era indicated by PI, P7, andP13.
The cylindrically symmetric liner impact drivesshock waves inwmd into the two materials. Sincethe shock wave speeds in Al are greater by roughly afactor of 1.6 than the shock speeds in the T& the Ta/Al interface experiences differential slip. Theamount of slip depends on the tangential force at theinterface, i.e. on the interracial fictional force. Itwas the purpose of the present experiment toattempt to measure, radiographically, the true extentof deformation in the aluminum near the inter-face.under loading conditions such that the radialvelocity of the liner at impact with the target was 1.2km/see. The method we used to do this was toimplant a series of thin wires into the aluminum nor-mal to the interface. These wires are representationsof Lagrangian mesh lines and the object of thisexperiment was to measure the deformation of thewires and hence the deformation of the mesh nearthe interface as a function of time. In order for thewires to truly represent the mesh, they must be fineenough to present a minor perturbation. to the mate-rial flow in the alumir!um. They muse however, bethick enough to give sufficient radiographic contrastrelative to the Al background in which they areembedded. We have found that Pb and Sb have
shock impedances sufficiently near Al and highenough atomic number to give good hydrodynamicmatching and x-ray contrast. They also have rela-tively high melting temperatures (’I’m(Al)=9340&
Tm(Pb)=6010~ and Tm(Sb)=9040K). The Pb wires
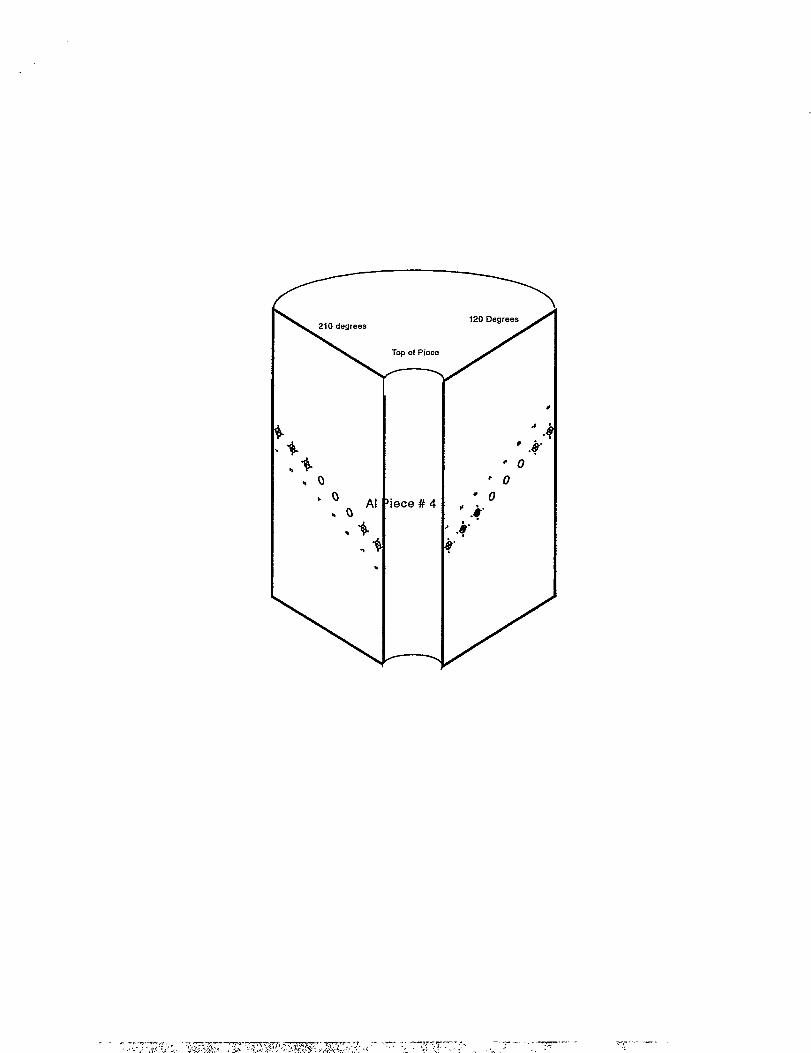
were radiographer in a static sample and wires of407 pm were deefied to give sufficient contrast.These wires were placed in the aluminum about themidplane of the A1/Ta interfaces. They were placedin a skewed arrangement rather than along the mid-line so as to avoid possible wala? effects horn the
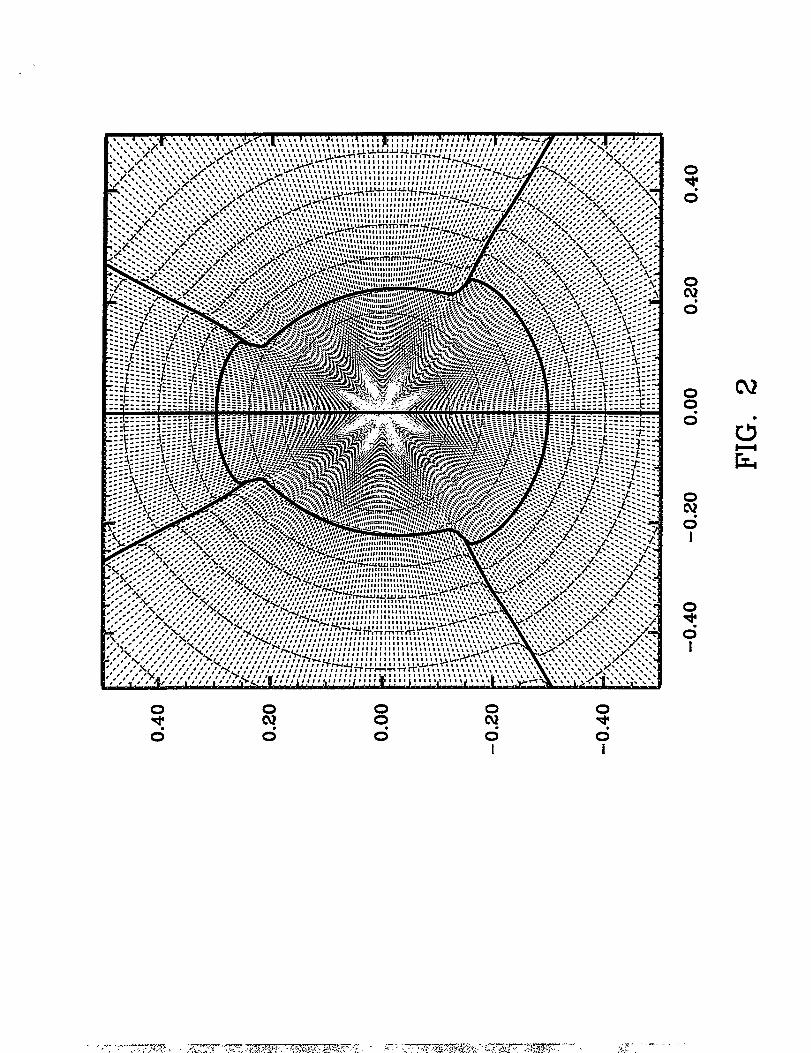
other wires in the presence of the radially converg-ing shock. The wires were typically 3mm in lengthalthough some were shorter. Two wires of diameter370 and 308 pm were placed along one of the 120°faces near the central void so that we could comparetheir images with the symmetrically placed 407 pmwires on the otkr 120° face. The arrangement of thewires $, shown in fiz 2 in a top view.
*’za- ..
*-**F.sl
$2 ---
270 nssm=,s 9--
FIGURE 2. Top view of target showing Pb wire cotiguration
The diagnostics included four axial x-ray sources,three radial sources, and an axial thrning camera toview the progression of the Xe gas shock. Thesediagnostics are described in the next section.
DIAGNOSTICS
FIash radiography was the primary diagnosticfor the experiment. Four radiographs were takenwith a line-of-sight along the target axis (axialradiographs), and three radiographs were taken withlines-of-sight aIong target radii (radial radiographs).The pwpose of the axial radiographs was to view
the motion and distortion of the lead markers as theexperiment progressed.
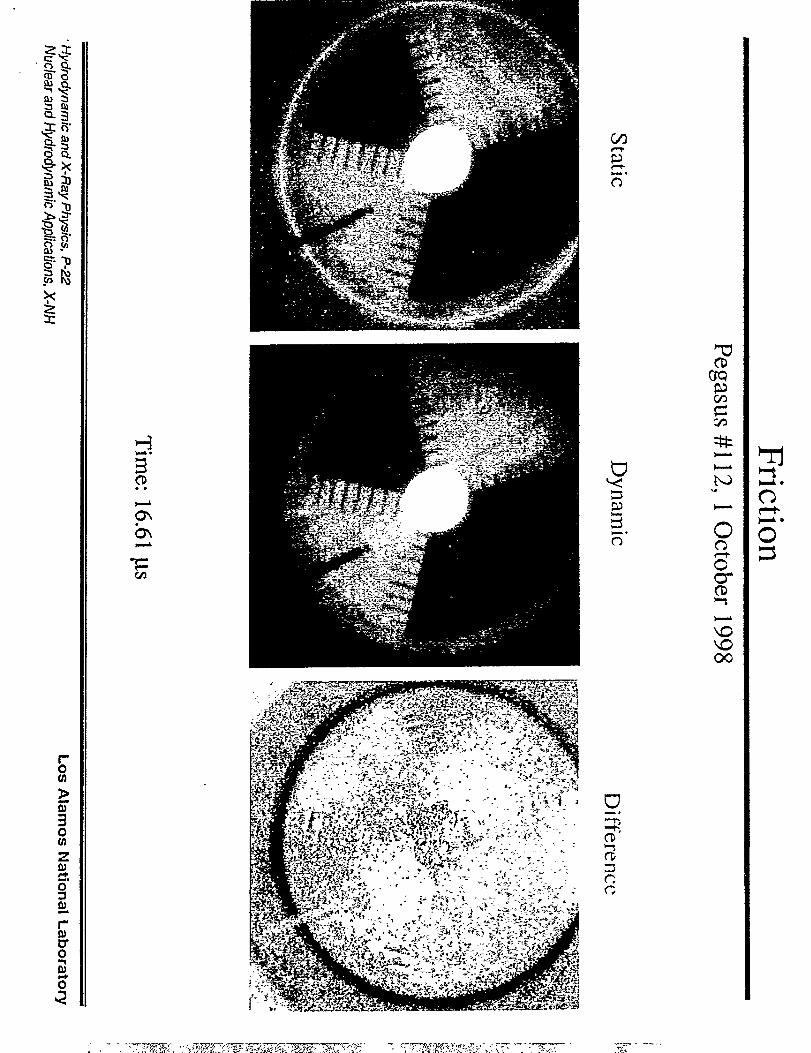
The purpose of the radial radiographs was two-fold One radial radiograph was used to view theliner prior to impact with the target the other tworadial radiographs were used to view gross distor-tions of the target during the experiment. The x-raysources are marx driven diodes tiat employ atapered tungsten rod, 1.5 mm in diameter, as the x-ray emitter. The duration of the x-ray pulses is 20 nsFWHM. The axial radiographs are imaged with asodium iodide fluor that is viewed by four gatedCCD cameras. This configuration permits capturingfour images separated in time along the same line-of-sight. For this experimen~ axial radiographs wereimaged using a film-screen combination. Eachradial radiograph has separate line-of -sight andeach is rotated by 120 degrees from the other. Theradial radiographs were taken at 13.69, 15.87, and17.37 l.i.secafter current start.
In addition to viewing the target with x-rays, thecenirrd cavity of the target was also viewed axiallywith two framing cameras. The purpose of the cam-eras was to sequentially image the luminous shockffont in the xenon filled cavity that was expectedwhen the shock exited the aluminum and tantalumpieces. Also employed during this experiment werea number of current diagnostics used to measure thecurrent through the liner and the symmetry of thecurrent drive.
EXPERIMENTAL RESULTS
The timings for the axial and radial sources andthe thming camera were chosen based upon a cal-culation of liner impact which used a model shownto be valid for precision liner experiments. This cal-culation gave liner impact at 14.12 psec after currentonset. For adequate image separation it is necessaryto separate the axial images by 0.75 paw. The axialtimings were taken to be 15.12, 15,87, 16.62, and17.37 wee so that the first image would occur whenthe Al shock had traversed roughly 1/3 the distanceto the inner surface, the second image when the Alshock has”almost reached the inner surface, the thirdimage close to maximum compression and the lastimage occurring during disassembly. The 16 visibleframing images were spaced 0.10 jwc apart and
timed to be able to see shock breakout. The firstradial image at 13.69 p.sec was calculated to showthe state of the liner 0.42. psec before target impactand the remaining two images at 15.87 and 17.37psec were timed to see subtIe features in the Tadeformation.
All of the sources and cameras performed nom-inally. However, the framing camera images were alldarQ i.e. prior to 17.12 psec, the last framing image,no shock had entered the Xe gas region. Also, theradial image at 13.69 wee showed the liner to beata distance of 1.9 mm from the target surface. Theradial image at 15.87 J.ISeCis consistent with contactand we estimate that actual impact occurred proba-bly close to 15.3 psec. Assuming that this number iscorrec4 the last image at 17.37 p.sec corresponds tothe AI(6061) shock beiig at the inner surface. Thisis consistent with the fact that there is no evidencefor Al extrosion into the central region at this time.There is, however, significant observable motion ofthe Pb marker wires at this time.
The present experiment used a thicker thanusual liner. An unanticipated consequence of thisfact was that the sample was recovered quasi intact.The Al liner flowed plastically about the target andengulfed the Ta pieces and part of the Al wedges.Other parts of the Al wedges separated from the tar-get. The final state of the recovered target is shownin fig. 3.
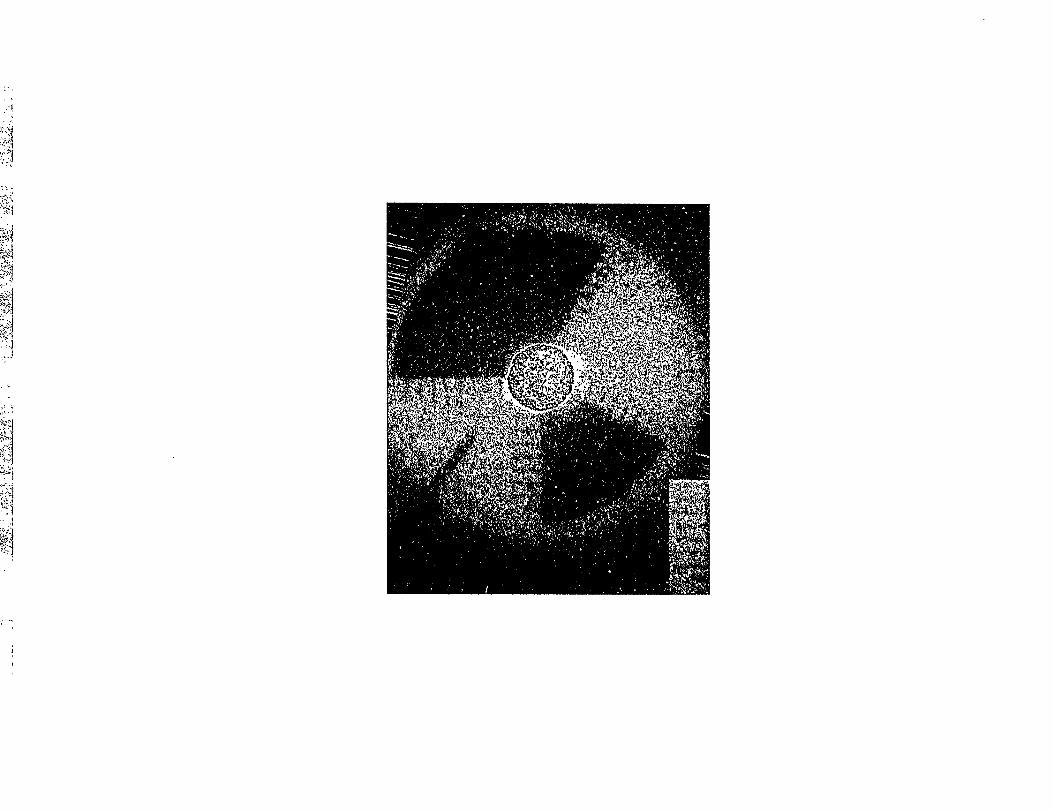
BiiBfkJ.ak2--!FIGURE 3. Reccweredtarget. dark wedges are Ta pieca.
DISCUSSION
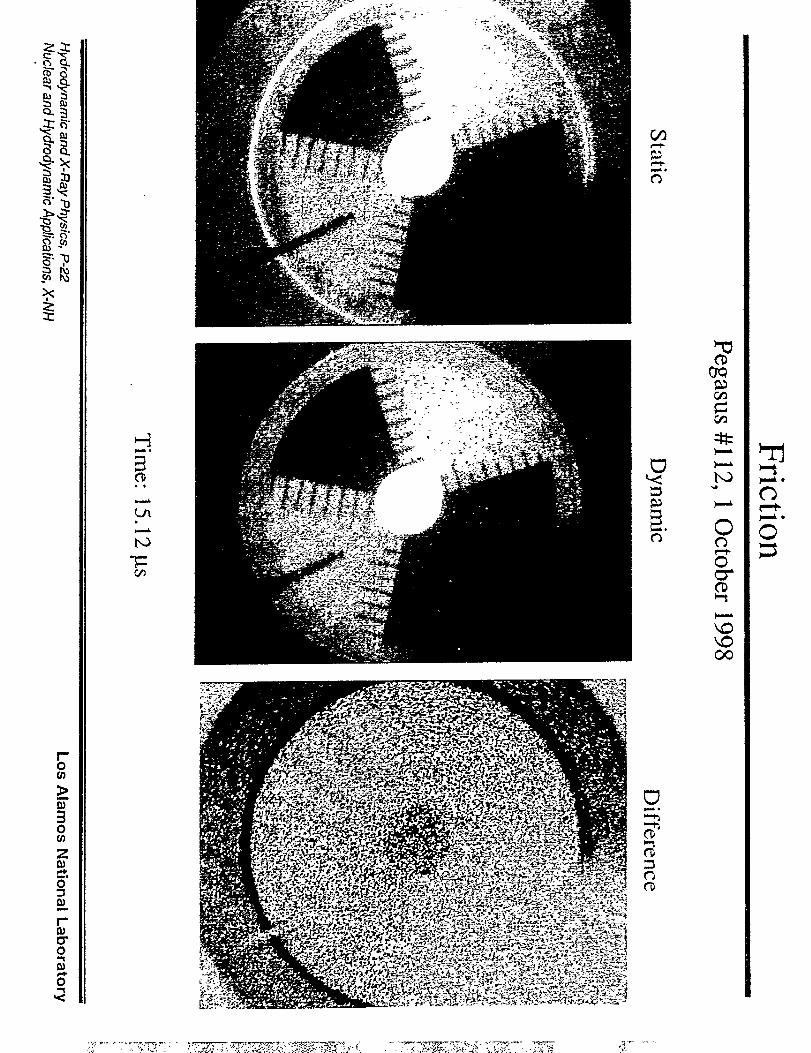
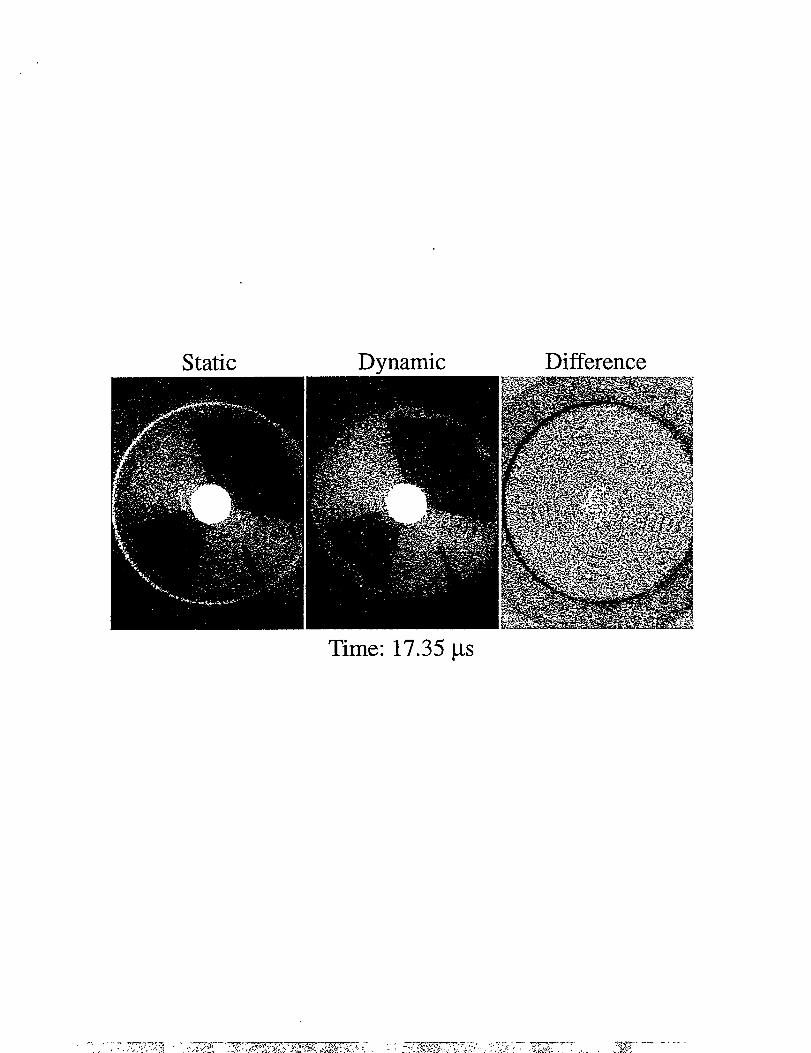
Figure 4 shows a comparison of the lastdynamic axial (17.37 psec) image with the staticimage. ‘I%estatic dynamic, and subtracted images

Static Dynamic Difference
FIGURE 4 Comparison of deformation of tsrget at 17.37 !-WCwith initial SWO.Leli image statiq; middle image: dynamic; right inmg~ dif-ference.
areshown. There has been significant motion alongthe interface of order 0.5 mm. This motion is consis-tent with the order of magnitude of motion indicatedin twodimensional Lagrangian materials dynamicscomputer code simulations of this impact using rate-dependent models of material flow for Al and Ta.‘Ihere is significant motion for the first five wires.The last three wires, nearest the center, have not yethad time to move appreciably.
“~
.,~=
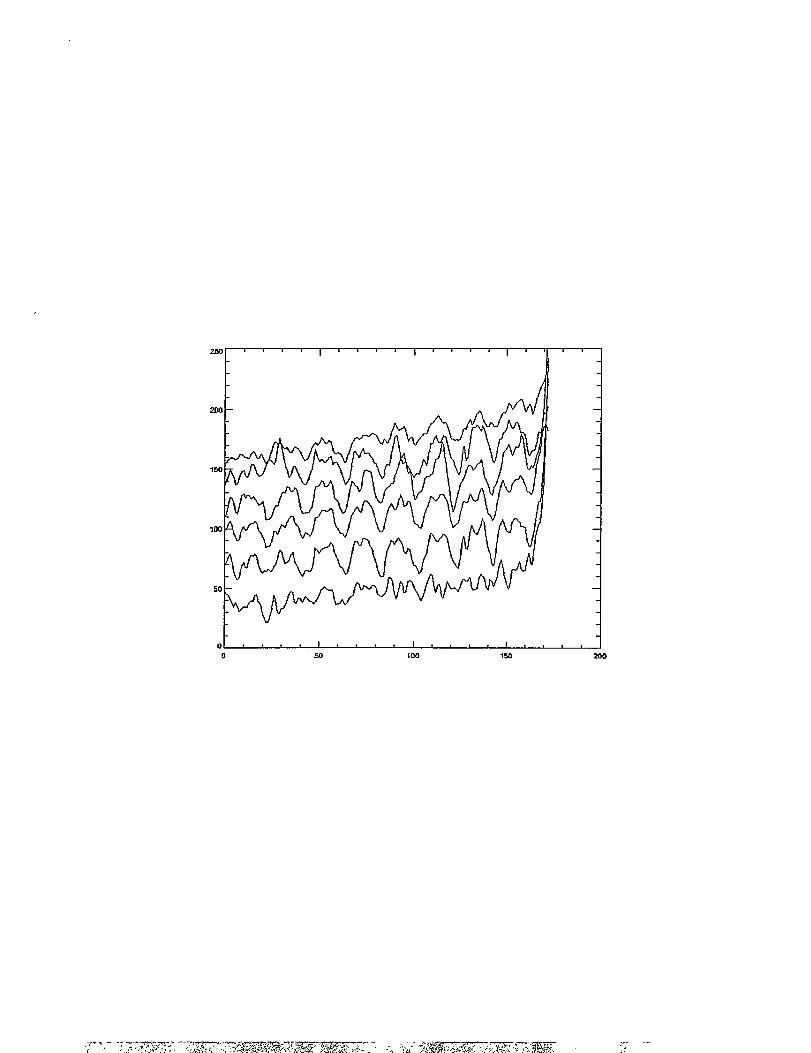
FIGURE 5. Line traces parallel to the 63 pin interfaer.. Minimamrrespond to wire positions. Y axis in arbhry units. X axis is inpixeIunits. Lower ewe in Ta, upper curves in At. t = 17.37 psec.
Figure 5 shows a preliminary analysis of thewire distortions for the interface having 63 pinchroughness. A rectangular section of the total image,containing this interface, was analyzed using a sin-gular value decomposition of the bit mapped imageusing 5 eigenvectors (see (3) for a description of this
method). A series of line traces leading away fromthe interface is shown in fig.5 with the initial (lowercurve) trace located just within the Ta. The innersurface is at the right of the figure. The minimalocate the wire positions. The wire shape is clearlydiscernible.
These prelimirmy analyses of the experimentaldata indicate that we are able to map the Lagrangianflow near the interface at the O.lrnrn level. The radi-ography in this first Pegasus friction measurementperformed very well and has allowed us to resolveinterracial flow under dynamic conditions. Thisinformation will allow us to assess the validity ofmodels for interracial frictional forces and computercode representations’ of interracial hydrodynamics.We are presentIy completing a detailed analysis ofall four interfaces and metallographic examinationof the recovered object. Of particular interest to us isthe change itI surface and subsurface morphology.
REFEIUZNCES
1. Hammerberg,J.E. et aL,Phy,rica D123, 330-340(1998).
2. Bowers,RL. et al., J.Appl.Phys.,83(8), 41464159(1998).
3. Keinigs,R. and Hammerberg,J.E., “Radiographicanalysis using principle component analysis”,LANL Rept. LA-UR-98-4080 (1998).
t Work performed under auspices of U.S. DOE atLANL under contract W-7405-Eng-36
>-- ---

ozm
H
HH
zm-t
●
Q u)u (0D(1)o
u(D(DQ
(1)c)
-- a
3D3-8c)
-m
sc)
-m
-9
—
-m
c) Qo 0
0<(1)
(1)<a)
u)o 0-x
3-m
3-8
c3-m
cD(Q~“ ‘$-1
<
(1)c)o0-m
u0su) s
m
c) -m
sQ
-m
0-m
Qc0
c)-Y
0s -m
i?
a)s0
c)-m
-n
(1)(J)
0 A=
0 (D
5(i)
-m
-m
c) t)(D(n
-m
0
3-m
(/3(D -m
s
y,- ,--

● ●
alc)
(1)x i
r(D
ic)o
-m
3(D (Q-u
a)7-m
3(D
3Q-m
-m
o
3(0n
o-T
D uc
7
u
o <
(D -m
(0s(1)
o
0c) <
a)o(0(1)
o
5(1)
Tm0>(/)ccl)
-s
-m
(D0
0u)
-m
-m
s-m
s0c
sQ(1) h
-n
o
s(1)(0(1) o
c

● ● ●
g-,0
gf-
as
OQ
@
o4
o0 (D (Q
3-30u’)u)
G)IQ
w
s(DQ
o0
3uo
(/)(1)Qo
H
o
ld

North
P-7
120 Degrees ..
Im
,.210 Degrees
63 p“ rms
270 Degrees
125 p“ rms
TopView Layout:8 Holes, each hole size is the same and is .425 diamCenters Seperated vertically by 0.450 mm 17.72 roils
I 1Centem Seperated radially by 1.2857 mm 50.62 roilsFill each hole b a 407 micron-diameter Lead Wire [16.5 roils}
i’ExceM for 2 ho es at 120 dewees.
O Deg!
32
,ees P-1
Eae4p’ rms
r
\
210 degrees
●oAl.0
.%.4●
\
120 Degrees
Top of Piece
J
● @
“o‘o
iece # 4“o
‘.8‘.*
c)a)
*l-l
0II
o
0
0qo
00o“

N000
0000
CQo0
I
U3o0
I
o
0I
of+d
oQo
c)a)w3
Ln●
II1+
R
Inq
o
In
o
(J=U’Y) d
o
0U2o0
0o*o
0cqd
oqo
0a*o
0yo
c)a)m3Lf3
●
w-l
IIB
● ● ●
3(DDu)c
-T
(Q(1) (D-i
D(1)Q
—-m
s0
I
oyh
(/)-m
(Qr
Q -m
30 u-a
(/)o a
-m
u)o
1
0h
2=-m
0
N0
2-m
0
su) z
0x-.D
3-m
3D(Q(i)co
(0. -m 0<(D
<-m
(Q(1)u)
3(Ds (D 03(Q
--f
0(i)(/l u

● ●
Dx-m
D
● ●
om o
u‘D-J)(■ -m(1)
c)-%
Qa)(Dc)ozu)oQ-m
c
3-m
o
Q-m
Q
—
T(t)
-m
3-m
3a)o (Q03
C(Qu)am
m
(nIvu
(J■
0)cou
ss-m
sa
s(JlAm
(nu)-s
x
0(Ds
d.
n
a)Ivu
DsQ0
c)
r?:-----,-,,..
● ● ● ●
D os >
c)F
Qzso(D
-B(1)(1)
o 3D
0
Du’) (n
-m
3u
(/)(1)(r)so
c)oc
m-s
sm
=P co-m
3D(Q(D
T(n (1) r
i-m
s mz
0c) 0
comi
>
(D-s
o7
3-1 c) r
(i)Q-r
(t)(1)c)
3

s(1)
(D
--- ..:.
u-l●

)--
y
)--
)--
tJk!
m.
c1
#
Static Dynamic Difference
Time: 17.35 ps

● ● ●
-m
s(1)
u(D-m
3(Q
-Y
(Q(1)
s(Q(1)(J)
7
(Dc)o<(1)
30m-m
s
o
33
Ogu
0(D*(1) -m
0
<s0a+0
3
x0
00
(n
33
●
30Q(1)
o 0 Q00 s
(1)(l)-T
No0
0I
(0D-m
c)0-m
so
0s
DE30u)’
-’T
(DoD o -’%
o<sQ
s-m
<
(1)o-m
o -m
Q(DQQ(D
uos
-<
O(D(/)D o
c)(nc
-m
sa)
o -m
D-m
-m
50
0(0 (D
Qo 0-m
A
o0-L
o
.!
,...$
Z?Q
Zoa
Im
100
50
00 so Im 150 200