Embed Size (px)
Citation preview
MASTERARBEIT
Titel der Masterarbeit
Determination and Correlation of Lipophilicity Parameters of Platinum(IV) Compounds
Analyzed by HPLC and ICP-MS
verfasst von
Matthias Klose, BSc
angestrebter akademischer Grad
Master of Science (MSc)
Wien, 2014
Studienkennzahl lt. Studienblatt: A 066 862
Studienrichtung lt. Studienblatt: Masterstudium Chemie
Betreut von: O. Univ.-Prof. Dr. Dr. Bernhard K. Keppler

- III -
Acknowledgments
First of all, I would like to thank O. Univ.-Prof. Dr. Dr. Bernhard K. Keppler for giving me the
opportunity to do my master thesis in his group on such an interesting topic, since it combines
HPLC and ICP-MS with anticancer research.
Furthermore I would like to thank the whole inorganic chemistry group for the great atmosphere
and delicious cakes, especially Marlene, Doris, Carmen, Stefanie, Sonja, Masha and Claudia.
Especially, I want to thank Sarah, my practical supervisor, for all the discussions, lunches and
questions we have had. It was really a great time and I hope you enjoyed it as much as I did .
Big thanks also to the whole Lab 2 team: Sam, who always had an open ear (and the solutions)
for my unresolved problems; Karla, who always kept an eye on our balanced diet by putting
Satsumas in our chocolate drawer (instead of chocolate); Christian, for going to lunch with me
when no other could keep up with my fast steps; and finally Lindi, for the best ‘Rumkugerl’ in the
world. Thanks guys!
Moreover, I am deeply grateful to Doris Höfer, Verena Pichler and Hristo Varbanov for
synthesizing all the platinum compounds. Without you, this master thesis could not have been
done!
In addition, I would like to thank Ricarda Bugl and Filip Groznica, our trainees for their practical
relief.
Elfriede Limberger, Mihai Odoleanu, Norbert Kandler and Harald Fuchs for their help in
administrative and technical issues.
Beyond that I would like to thank all my friends who keep contacting me even at the hardest lab
times, when it seemed that I vanished in some other scientific galaxy. Thank you for bringing me
back to normal social life!
However, above that, I would like to thank my family, especially my mum for her endless
support during my whole life. Love you all!

- IV -
"Ich bin eine Mischung, die ist ziemlich lecker,
Aus Albert Einstein und Arnold Schwarzenegger.
Soweit so gut, doch das dumme ist nur,
Ich hab Schwarzeneggers Hirn und von Einstein die Figur."
EAV – An Der Copacabana
- V -
Abstract
Platinum(IV) complexes are among the most promising metal-based cytostatics and are based on
their respective platinum(II) precursors. They are supposed to be as active against tumor cells as
their platinum(II) analogs, but are claimed to exhibit less side effects and offer the possibility of
oral administration. The axial ligands are the main modification sites for tuning their
pharmacological properties, i.e. by the addition of relatively long alkyl chains, in order to
increase the lipophilicity and enable passive transport of the drug into the tumor cell.
The classical parameter for the estimation of the lipophilicity of a molecule is the value. In
the shake flask method, a sample is shaken mechanically in a bi-phasic mixture of water and 1-
octanol for a defined time interval. However, there are some drawbacks to this method such as
the time consuming sample preparation and the low sample-throughput. An alternative
lipophilicity parameter is the value, which can be determined by liquid chromatography.
The advantage of this method is a very short sample preparation as well as a fully automatic
measurement. The third parameter is derived from the value.
The aim of this master thesis was to develop and evaluate suitable analytical methods for the
determination of the lipophilicity of platinum(IV) anticancer drugs using reversed phase-high
performance liquid chromatography (RP-HPLC) and inductively coupled plasma-mass
spectrometry (ICP-MS). Two dead time markers, uracil and potassium iodide (KI), were evaluated
and discussed. The classical shake flask method was used to determine the values by
chromatographic and mass spectrometric methods. Moreover, and were derived from
RP-HPLC measurements only and were correlated with the obtained values. For this
purpose, 79 platinum(IV) complexes were investigated in terms of their lipophilicity.
Both dead time markers performed well, however, KI is suitable for more hydrophilic
compounds compared to uracil and therefore covers a broader range of organic modifier.
Furthermore, if the value of a given platinum(IV) complex is within = –1.5 to 1.3 both
detection techniques (UV/Vis and MS) can be used. Beyond that range only HPLC shows
reasonable results from = –2.0 up to 2.4. Results for lay within the range of roughly
0.70 up to 4.0. Whereas for , the results cover the range of about 20 to 70.
In general the lipophilicity parameter might be the most suitable one, since it requires a short
sample preparation time and the measurement can be carried out automatically without any
further steps.
- VI -
Zusammenfassung
Platin(IV) Komplexe zählen zu den vielversprechendsten Zytostatika, die strukturell auf Platin(II)
Komplexen aufbauen. Platin(IV) Komplexe sollen nach Möglichkeit die gleiche Aktivität gegen
Tumorzellen wie ihre Platin(II) Analoga aufweisen, jedoch mit geringeren Nebenwirkungen,
besserer Verträglichkeit, sowie einer leichteren Handhabung, da im Gegensatz zu Platin(II)
Komplexen, Platin(IV) Verbindungen oral verabreicht werden können. Möglich machen dies die
beiden zusätzlichen axialen Positionen, mit denen man gezielt versuchen kann die
pharmakologischen Eigenschaften von Platin(IV) Komplexen zu steuern. Stattet man die axialen
Positionen mit relativ lipophilen Resten, wie z.B. Alkylketten aus, so erhöht dies den passiven
Transport in die Tumorzelle.
Ein klassischer Parameter zur Abschätzung der Lipophilie ist der sogenannte – Wert.
Hierbei wird eine Substanz in ein Gemisch aus Wasser und 1-Oktanol eingebracht und
ausreichend geschüttelt (Shake Flask Methode), sodass sich die Probe in beiden Phasen verteilen
kann. Danach wird die Konzentration der Substanz in den beiden Phasen bestimmt und daraus
der – Wert berechnet. Diese Methode hat jedoch Nachteile, wie z.B. der hohe Zeitaufwand
der Probenvorbereitung und der daraus resultierende limitierte Probendurchsatz. Ein Messwert
zur Abschätzung der Lipophilie ist der – Wert, der mit RP-HPLC bestimmt werden kann.
Zusätzlich kann aus dieser Größe der sogenannte – Wert abgeleitet werden. Die Bestimmung
dieser Parameter zeichnen sich durch eine sehr einfache und kurze Probenvorbereitung aus.
Das Ziel dieser Masterarbeit ist es anhand von Platin(IV) Komplexen eine geeignete analytische
Methode mit RP-HPLC und ICP-MS zur Bestimmung der Lipophilie von metallhältigen
Krebstherapeutika zu entwickeln und zu evaluieren. Hierfür werden zwei Totzeitmarker, Uracil
und Kaliumiodid (KI), untersucht. Im Zuge dessen wird die klassische Shake Flask - Methode zur
Bestimmung von verwendet und die Detektion mit UV/Vis (HPLC) und ICP-MS verglichen.
Des Weiteren werden und – Werte mittels RP-HPLC bestimmt und mit korreliert.
Hierzu werden insgesamt 79 verschiedenartige Platin(IV)-Komplexe bezüglich ihrer Lipophilie
untersucht und charakterisiert.
Es konnte aufgezeigt werden, dass die beiden Totzeitmarker, Uracil und KI, sehr gut korrelieren.
Jedoch sollte KI gegenüber Uracil bevorzugt werden, da es auch für sehr hydrophile Substanzen
geeignet ist. Zusätzlich konnte gezeigt werden, dass die beiden unterschiedlichen
Detektionstechniken (UV/Vis und MS) korreliert sind, sofern die Proben sich innerhalb des
Bereiches von = –1.5 bis 1.3 bewegen. Darüber hinaus liefert die HPLC Methode gute
- VII -
Ergebnisse in einem Bereich von etwa = –2.0 bis 2.4. Die Ergebnisse von sind in
einem Bereich von ca. 0.7 bis 4.0, die von bei ungefähr 20 bis 70. Als geeigneter Lipophilie-
Parameter zeichnet sich der – Wert aus. Dieser verspricht eine sehr kurze
Probenvorbereitungszeit sowie eine anschließende automatische Probenmessung ohne
Zwischenschritte.
- VIII -
Content
1. Introduction ............................................................................................................................. 1
1.1. General Overview ............................................................................................................. 1
1.2. Cell cycle and carcinogenesis ........................................................................................... 4
1.3. Chemotherapy – the discovery of cisplatin ...................................................................... 5
1.3.1. Carboplatin and oxaliplatin ...................................................................................... 8
1.3.2. Platinum(II) drugs with regional approval ............................................................... 8
1.4. Platinum(IV) drugs .......................................................................................................... 10
1.5. Non-platinum metal-based drugs .................................................................................. 13
1.6. Pharmacokinetic properties ........................................................................................... 14
1.7. High Performance Liquid Chromatography – HPLC ........................................................ 15
1.8. Inductively Coupled Plasma-Mass Spectrometry – ICP-MS ........................................... 18
1.9. Determination of Chromatographic Lipophilic Parameters ........................................... 22
1.10. Determination of the Partition Coefficient .................................................................... 24
1.11. Timeline of log P measurements .................................................................................... 25
2. Experimental Part .................................................................................................................. 26
2.1. Chemicals and Reagents ................................................................................................. 26
2.2. Log k – sample preparation ............................................................................................ 26
2.3. Log P – Sample preparation ............................................................................................ 27
2.4. Log P – Buffer experiments ............................................................................................ 29
3. Results and Discussion ........................................................................................................... 30
3.1. Determination and correlation of log kw and ϕ0 ............................................................ 30
3.1.1. Comparison of uracil and KI as dead time markers ............................................... 30
3.1.2. Calculation of log kw and ϕ0 ................................................................................... 31
3.1.3. Comparison of log kw and ϕ0 determined with uracil and KI ................................. 33
3.1.4. Comparison of log kw vs. ϕ0 ................................................................................... 34
3.2. Determination of log P ................................................................................................... 35
3.2.1. Evaluation of the shaking time .............................................................................. 36
3.2.2. Log P correlation HPLC vs. ICP-MS ......................................................................... 38
3.2.3. Determination of log D at different pH values – buffer experiments .................... 42
3.3. Evaluation of log kw, ϕ0 and log P with regard to their applicability to characterize the
lipophilicity of platinum(IV) anticancer agents .............................................................. 45
3.3.1. Log P – correlation with log kw and ϕ0 – complete list .......................................... 54
3.3.2. Log P – correlation with log kw and ϕ0 – adjusted list ............................................ 56
4. Conclusion and Outlook ......................................................................................................... 60
5. Appendix ................................................................................................................................ 62
5.1. Retention times of uracil and KI ..................................................................................... 62
5.2. Complete Data List ......................................................................................................... 63
6. References ............................................................................................................................. 88
7. List of Tables .......................................................................................................................... 92
8. List of Figures ......................................................................................................................... 92
9. Curriculum vitae ..................................................................................................................... 94
- IX -
Abbreviations:
ACN Acetonitrile
ADME Absorption, Distribution, Metabolism and Excretion
AES Atomic emission spectroscopy
CBDCA 1,1’-cyclobutandicarboxylic acid
CE Capillary electrophoresis
cha Cyclohexylamine
DACH 1,2-diaminocyclohexane
DCA Dichloroacetate
DNA Deoxyribonucleic acid
en Ethylenediamine
FAAS Flame atomic absorption spectroscopy
FDA U.S. Food and Drug Administration
GST Glutathione S-transferase
HCC Hepatocellular carcinoma
(U)HPLC (Ultra) High Performance Liquid Chromatography
HSAB Hard and soft acids and bases
i.v. Intravenous
ICP-MS Inductively Coupled Plasma - Mass Spectrometry
LC Liquid Chromatography
M Mol / L
m/z Mass to charge (ratio)
MEEKC Microemulsion electrokinetic chromatography
MeOH Methanol
MS Mass spectrometry
NSCLC Non-small cell lung cancer
SCLC Small cell lung cancer
TFA Trifluoroacetic acid
UV/Vis Ultraviolet / visible spectroscopy
WHO World Health Organization

- 1 -
1. Introduction
1.1. General Overview
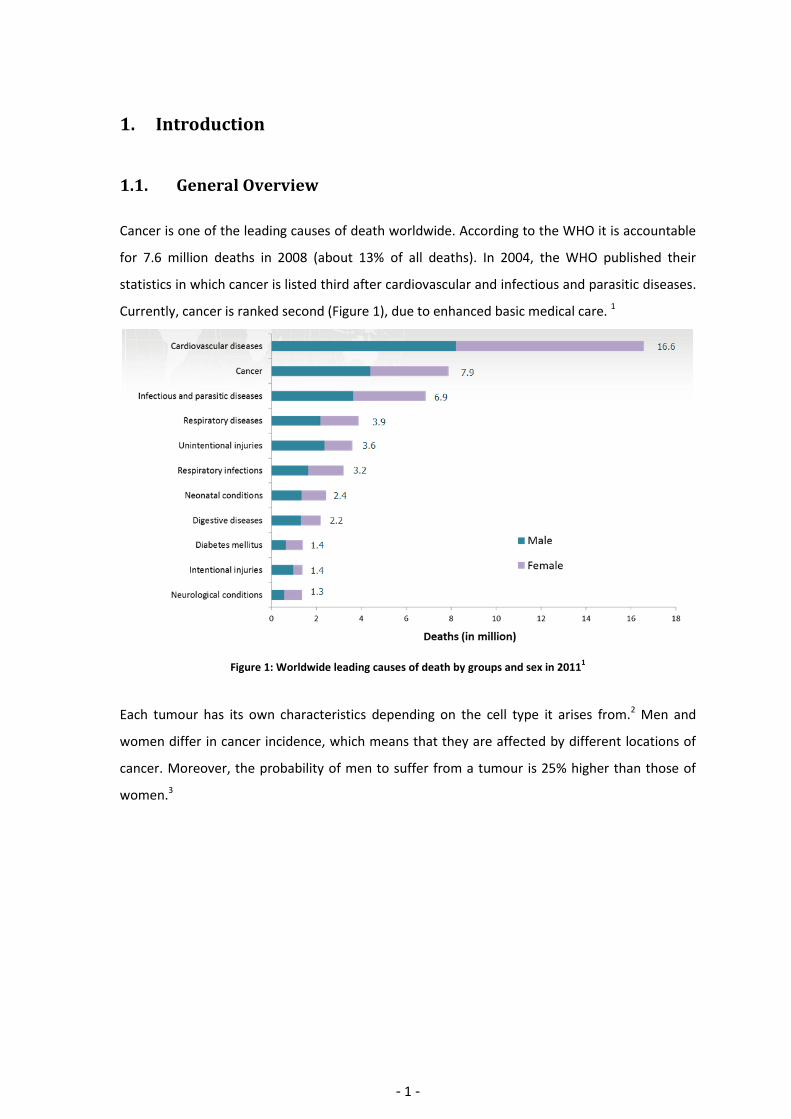
Cancer is one of the leading causes of death worldwide. According to the WHO it is accountable
for 7.6 million deaths in 2008 (about 13% of all deaths). In 2004, the WHO published their
statistics in which cancer is listed third after cardiovascular and infectious and parasitic diseases.
Currently, cancer is ranked second (Figure 1), due to enhanced basic medical care. 1
Figure 1: Worldwide leading causes of death by groups and sex in 20111
Each tumour has its own characteristics depending on the cell type it arises from.2 Men and
women differ in cancer incidence, which means that they are affected by different locations of
cancer. Moreover, the probability of men to suffer from a tumour is 25% higher than those of
women.3
- 2 -
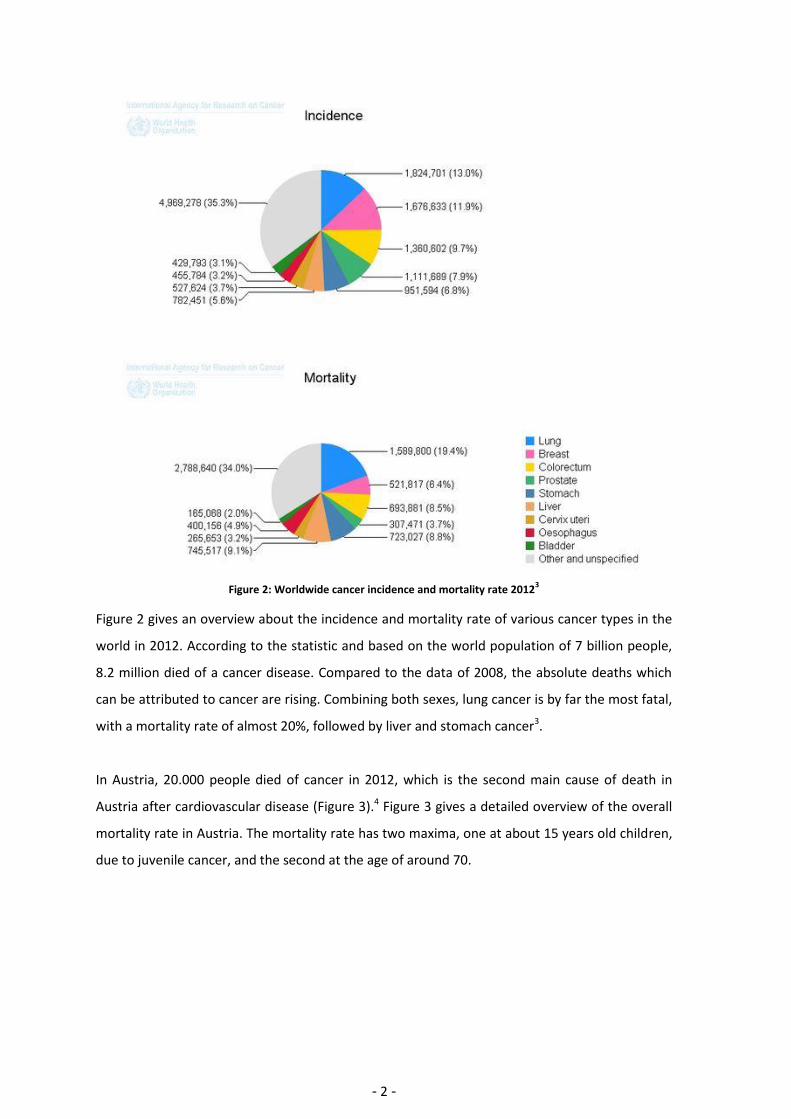
Figure 2: Worldwide cancer incidence and mortality rate 20123
Figure 2 gives an overview about the incidence and mortality rate of various cancer types in the
world in 2012. According to the statistic and based on the world population of 7 billion people,
8.2 million died of a cancer disease. Compared to the data of 2008, the absolute deaths which
can be attributed to cancer are rising. Combining both sexes, lung cancer is by far the most fatal,
with a mortality rate of almost 20%, followed by liver and stomach cancer3.
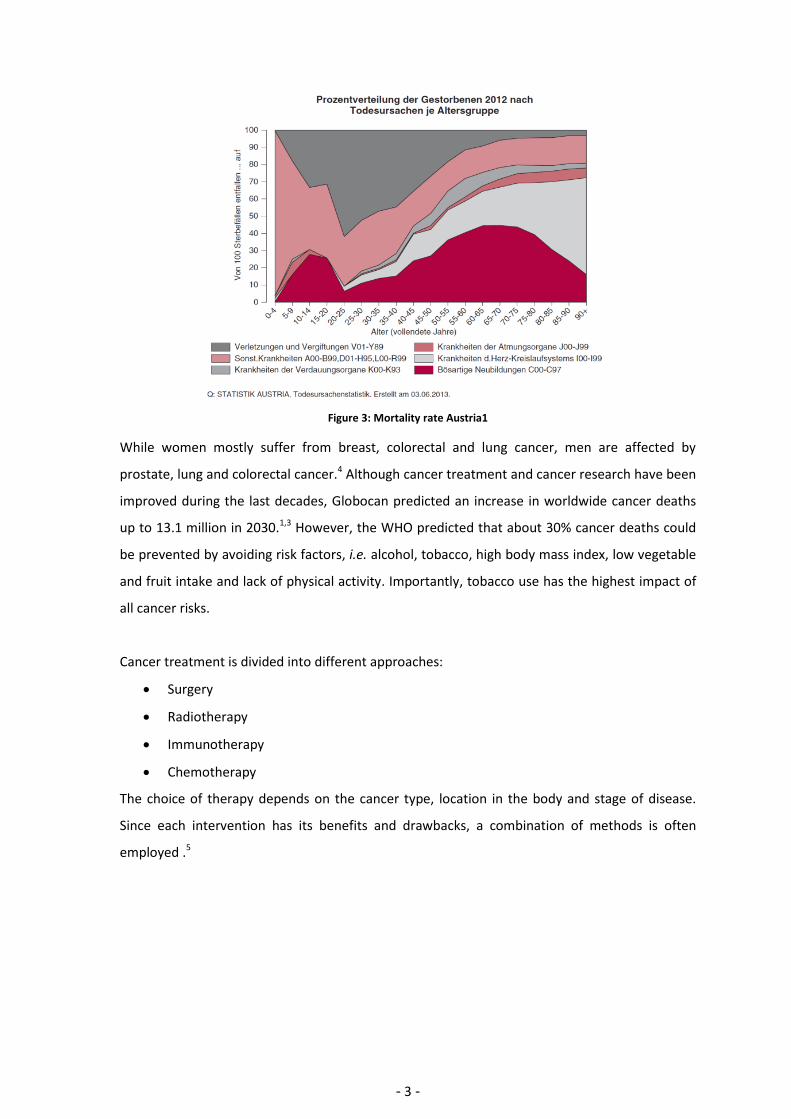
In Austria, 20.000 people died of cancer in 2012, which is the second main cause of death in
Austria after cardiovascular disease (Figure 3).4 Figure 3 gives a detailed overview of the overall
mortality rate in Austria. The mortality rate has two maxima, one at about 15 years old children,
due to juvenile cancer, and the second at the age of around 70.
- 3 -
Figure 3: Mortality rate Austria1
While women mostly suffer from breast, colorectal and lung cancer, men are affected by
prostate, lung and colorectal cancer.4 Although cancer treatment and cancer research have been
improved during the last decades, Globocan predicted an increase in worldwide cancer deaths
up to 13.1 million in 2030.1,3 However, the WHO predicted that about 30% cancer deaths could
be prevented by avoiding risk factors, i.e. alcohol, tobacco, high body mass index, low vegetable
and fruit intake and lack of physical activity. Importantly, tobacco use has the highest impact of
all cancer risks.
Cancer treatment is divided into different approaches:
Surgery
Radiotherapy
Immunotherapy
Chemotherapy
The choice of therapy depends on the cancer type, location in the body and stage of disease.
Since each intervention has its benefits and drawbacks, a combination of methods is often
employed .5
- 4 -
1.2. Cell cycle and carcinogenesis
Knowledge about the development of cancer is one of the key in order to find appropriate ways
to treat cancer. The human body consists of approximately 1014 cells, each of them with a
specific task.5 The only way to build up a new cell is via duplication of an already existing one. A
cell itself does not duplicate constantly, normally it remains in the G0 phase (G for ‘gap’) until it is
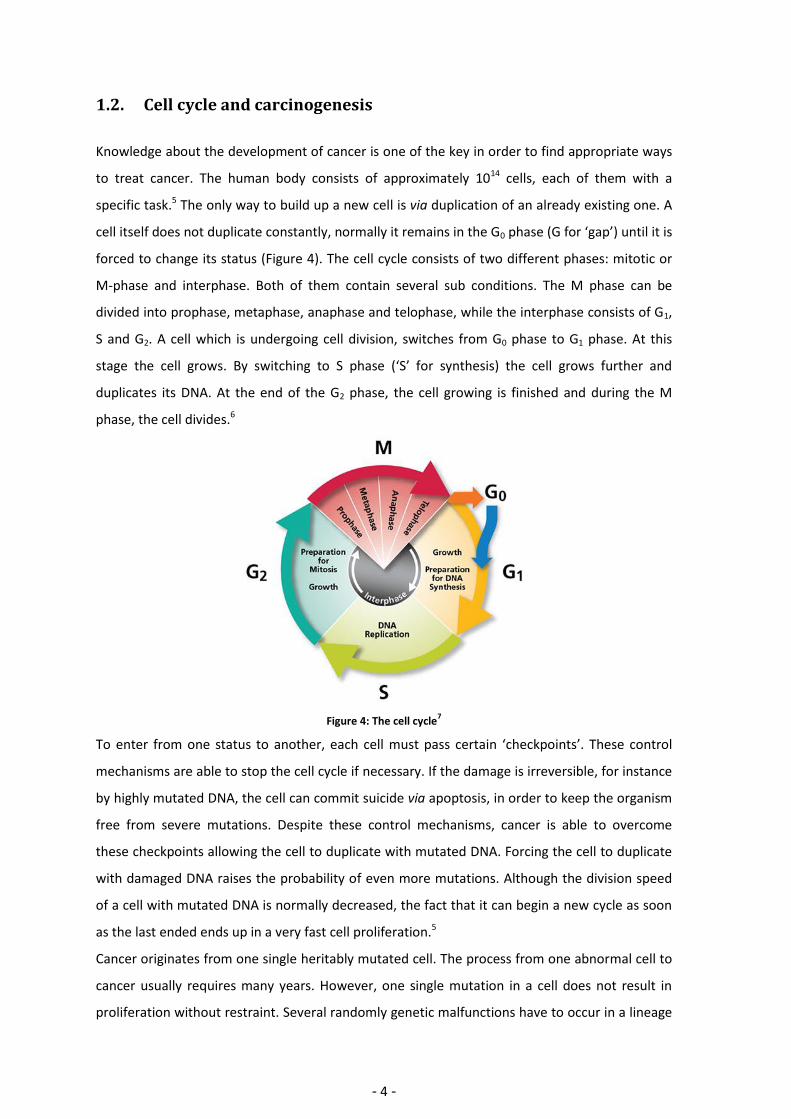
forced to change its status (Figure 4). The cell cycle consists of two different phases: mitotic or
M-phase and interphase. Both of them contain several sub conditions. The M phase can be
divided into prophase, metaphase, anaphase and telophase, while the interphase consists of G1,
S and G2. A cell which is undergoing cell division, switches from G0 phase to G1 phase. At this
stage the cell grows. By switching to S phase (‘S’ for synthesis) the cell grows further and
duplicates its DNA. At the end of the G2 phase, the cell growing is finished and during the M
phase, the cell divides.6
Figure 4: The cell cycle7
To enter from one status to another, each cell must pass certain ‘checkpoints’. These control
mechanisms are able to stop the cell cycle if necessary. If the damage is irreversible, for instance
by highly mutated DNA, the cell can commit suicide via apoptosis, in order to keep the organism
free from severe mutations. Despite these control mechanisms, cancer is able to overcome
these checkpoints allowing the cell to duplicate with mutated DNA. Forcing the cell to duplicate
with damaged DNA raises the probability of even more mutations. Although the division speed
of a cell with mutated DNA is normally decreased, the fact that it can begin a new cycle as soon
as the last ended ends up in a very fast cell proliferation.5
Cancer originates from one single heritably mutated cell. The process from one abnormal cell to
cancer usually requires many years. However, one single mutation in a cell does not result in
proliferation without restraint. Several randomly genetic malfunctions have to occur in a lineage
- 5 -
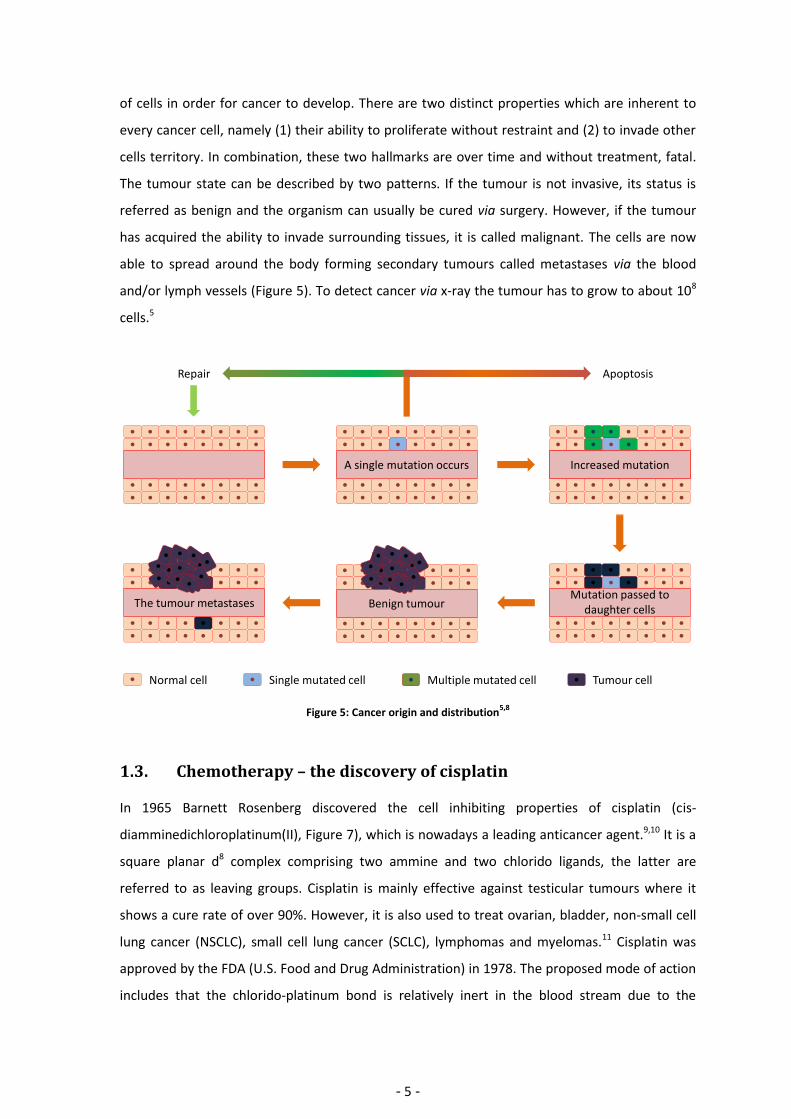
of cells in order for cancer to develop. There are two distinct properties which are inherent to
every cancer cell, namely (1) their ability to proliferate without restraint and (2) to invade other
cells territory. In combination, these two hallmarks are over time and without treatment, fatal.
The tumour state can be described by two patterns. If the tumour is not invasive, its status is
referred as benign and the organism can usually be cured via surgery. However, if the tumour
has acquired the ability to invade surrounding tissues, it is called malignant. The cells are now
able to spread around the body forming secondary tumours called metastases via the blood
and/or lymph vessels (Figure 5). To detect cancer via x-ray the tumour has to grow to about 108
cells.5
Figure 5: Cancer origin and distribution5,8
1.3. Chemotherapy – the discovery of cisplatin In 1965 Barnett Rosenberg discovered the cell inhibiting properties of cisplatin (cis-
diamminedichloroplatinum(II), Figure 7), which is nowadays a leading anticancer agent.9,10 It is a
square planar d8 complex comprising two ammine and two chlorido ligands, the latter are
referred to as leaving groups. Cisplatin is mainly effective against testicular tumours where it
shows a cure rate of over 90%. However, it is also used to treat ovarian, bladder, non-small cell
lung cancer (NSCLC), small cell lung cancer (SCLC), lymphomas and myelomas.11 Cisplatin was
approved by the FDA (U.S. Food and Drug Administration) in 1978. The proposed mode of action
includes that the chlorido-platinum bond is relatively inert in the blood stream due to the
Repair Apoptosis
Normal cell Single mutated cell Multiple mutated cell Tumour cell
A single mutation occurs Increased mutation
Mutation passed to daughter cells
The tumour metastases Benign tumour
- 6 -
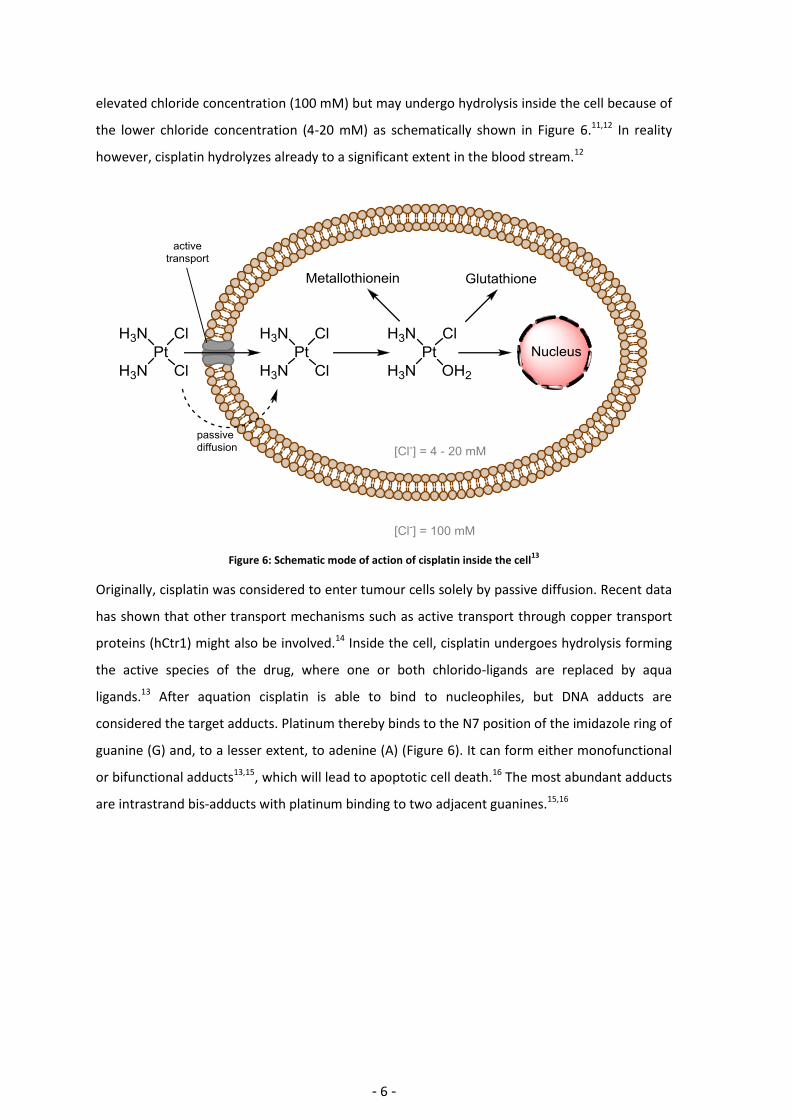
elevated chloride concentration (100 mM) but may undergo hydrolysis inside the cell because of
the lower chloride concentration (4-20 mM) as schematically shown in Figure 6.11,12 In reality
however, cisplatin hydrolyzes already to a significant extent in the blood stream.12
Figure 6: Schematic mode of action of cisplatin inside the cell13
Originally, cisplatin was considered to enter tumour cells solely by passive diffusion. Recent data
has shown that other transport mechanisms such as active transport through copper transport
proteins (hCtr1) might also be involved.14 Inside the cell, cisplatin undergoes hydrolysis forming
the active species of the drug, where one or both chlorido-ligands are replaced by aqua
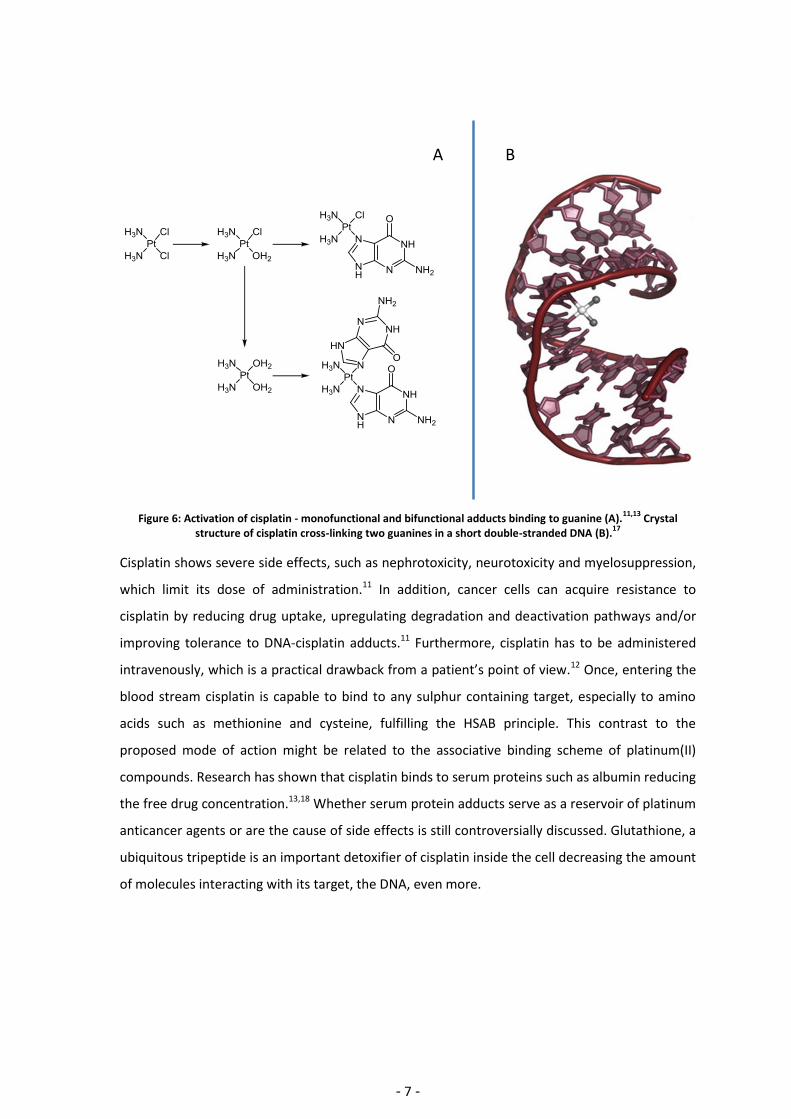
ligands.13 After aquation cisplatin is able to bind to nucleophiles, but DNA adducts are
considered the target adducts. Platinum thereby binds to the N7 position of the imidazole ring of
guanine (G) and, to a lesser extent, to adenine (A) (Figure 6). It can form either monofunctional
or bifunctional adducts13,15, which will lead to apoptotic cell death.16 The most abundant adducts
are intrastrand bis-adducts with platinum binding to two adjacent guanines.15,16
- 7 -
Figure 6: Activation of cisplatin - monofunctional and bifunctional adducts binding to guanine (A).11,13
Crystal structure of cisplatin cross-linking two guanines in a short double-stranded DNA (B).
17
Cisplatin shows severe side effects, such as nephrotoxicity, neurotoxicity and myelosuppression,
which limit its dose of administration.11 In addition, cancer cells can acquire resistance to
cisplatin by reducing drug uptake, upregulating degradation and deactivation pathways and/or
improving tolerance to DNA-cisplatin adducts.11 Furthermore, cisplatin has to be administered
intravenously, which is a practical drawback from a patient’s point of view.12 Once, entering the
blood stream cisplatin is capable to bind to any sulphur containing target, especially to amino
acids such as methionine and cysteine, fulfilling the HSAB principle. This contrast to the
proposed mode of action might be related to the associative binding scheme of platinum(II)
compounds. Research has shown that cisplatin binds to serum proteins such as albumin reducing
the free drug concentration.13,18 Whether serum protein adducts serve as a reservoir of platinum
anticancer agents or are the cause of side effects is still controversially discussed. Glutathione, a
ubiquitous tripeptide is an important detoxifier of cisplatin inside the cell decreasing the amount
of molecules interacting with its target, the DNA, even more.
A B
- 8 -
1.3.1. Carboplatin and oxaliplatin
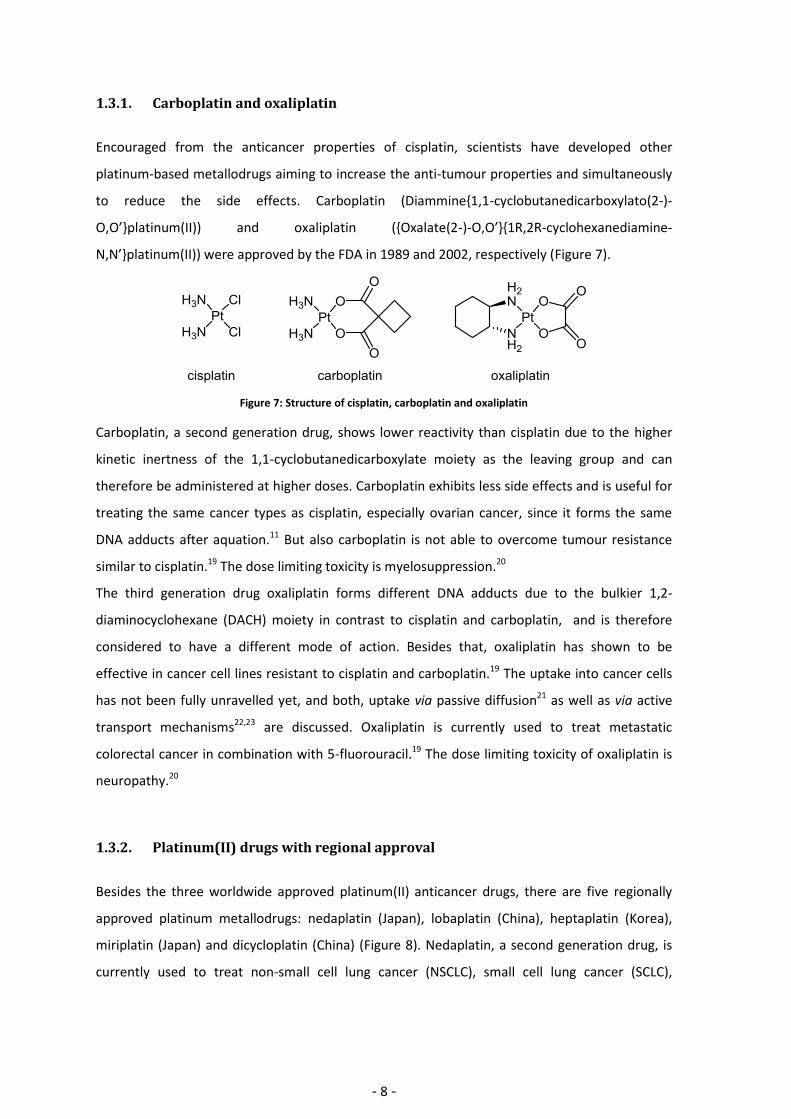
Encouraged from the anticancer properties of cisplatin, scientists have developed other
platinum-based metallodrugs aiming to increase the anti-tumour properties and simultaneously
to reduce the side effects. Carboplatin (Diammine{1,1-cyclobutanedicarboxylato(2-)-
O,O’}platinum(II)) and oxaliplatin ({Oxalate(2-)-O,O’}{1R,2R-cyclohexanediamine-
N,N’}platinum(II)) were approved by the FDA in 1989 and 2002, respectively (Figure 7).
Figure 7: Structure of cisplatin, carboplatin and oxaliplatin
Carboplatin, a second generation drug, shows lower reactivity than cisplatin due to the higher
kinetic inertness of the 1,1-cyclobutanedicarboxylate moiety as the leaving group and can
therefore be administered at higher doses. Carboplatin exhibits less side effects and is useful for
treating the same cancer types as cisplatin, especially ovarian cancer, since it forms the same
DNA adducts after aquation.11 But also carboplatin is not able to overcome tumour resistance
similar to cisplatin.19 The dose limiting toxicity is myelosuppression.20
The third generation drug oxaliplatin forms different DNA adducts due to the bulkier 1,2-
diaminocyclohexane (DACH) moiety in contrast to cisplatin and carboplatin, and is therefore
considered to have a different mode of action. Besides that, oxaliplatin has shown to be
effective in cancer cell lines resistant to cisplatin and carboplatin.19 The uptake into cancer cells
has not been fully unravelled yet, and both, uptake via passive diffusion21 as well as via active
transport mechanisms22,23 are discussed. Oxaliplatin is currently used to treat metastatic
colorectal cancer in combination with 5-fluorouracil.19 The dose limiting toxicity of oxaliplatin is
neuropathy.20
1.3.2. Platinum(II) drugs with regional approval
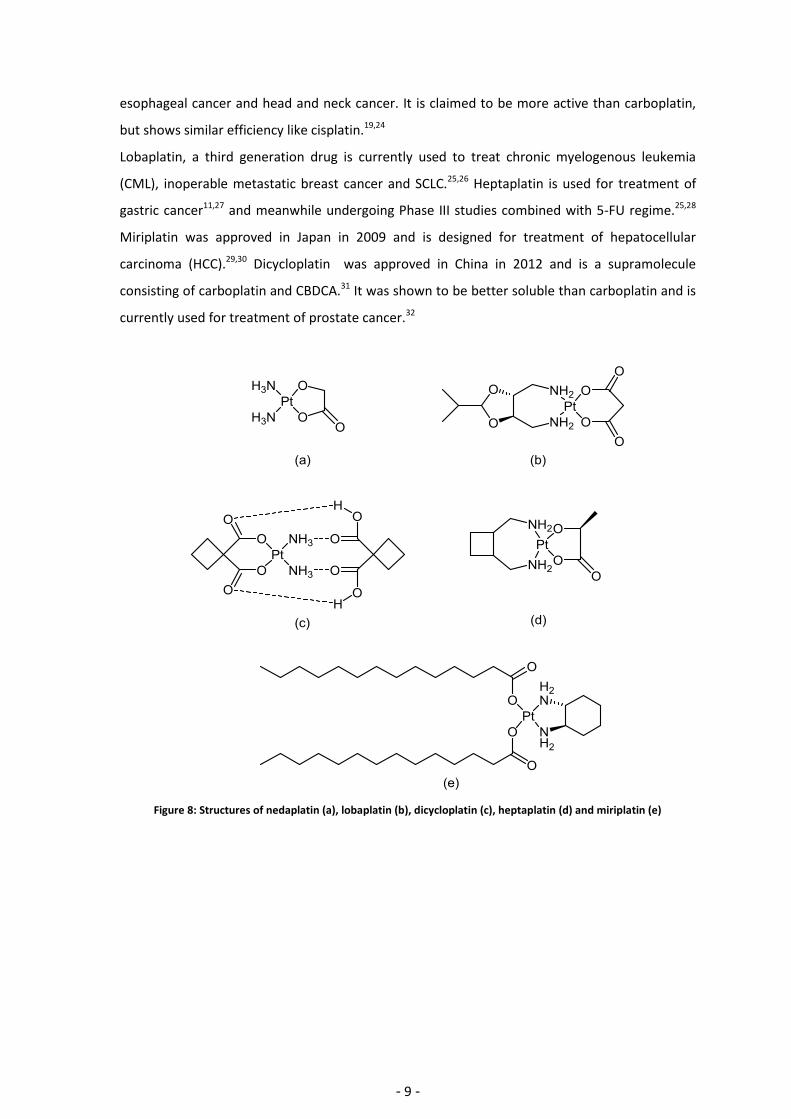
Besides the three worldwide approved platinum(II) anticancer drugs, there are five regionally
approved platinum metallodrugs: nedaplatin (Japan), lobaplatin (China), heptaplatin (Korea),
miriplatin (Japan) and dicycloplatin (China) (Figure 8). Nedaplatin, a second generation drug, is
currently used to treat non-small cell lung cancer (NSCLC), small cell lung cancer (SCLC),
- 9 -
esophageal cancer and head and neck cancer. It is claimed to be more active than carboplatin,
but shows similar efficiency like cisplatin.19,24
Lobaplatin, a third generation drug is currently used to treat chronic myelogenous leukemia
(CML), inoperable metastatic breast cancer and SCLC.25,26 Heptaplatin is used for treatment of
gastric cancer11,27 and meanwhile undergoing Phase III studies combined with 5-FU regime.25,28
Miriplatin was approved in Japan in 2009 and is designed for treatment of hepatocellular
carcinoma (HCC).29,30 Dicycloplatin was approved in China in 2012 and is a supramolecule
consisting of carboplatin and CBDCA.31 It was shown to be better soluble than carboplatin and is
currently used for treatment of prostate cancer.32
Figure 8: Structures of nedaplatin (a), lobaplatin (b), dicycloplatin (c), heptaplatin (d) and miriplatin (e)
- 10 -
1.4. Platinum(IV) drugs
Although the synthesis of platinum(IV) compounds has already been carried out by Rosenberg in
his seminal reports in the 1960s,9,10 research has mostly been focusing on the development of
Platinum(II) drugs until the 1990s. From then on, and probably due to an increased knowledge
on platinum chemistry, platinum(IV) complexes were reconsidered to be suitable for
metallodrug development.
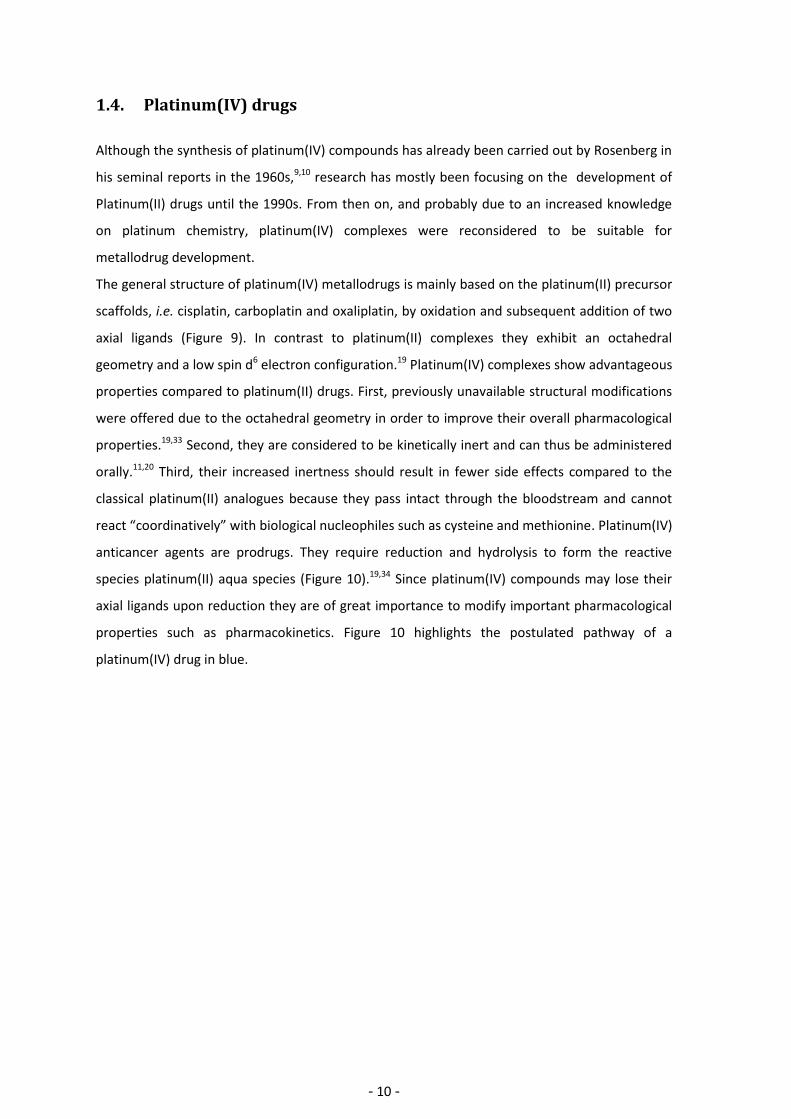
The general structure of platinum(IV) metallodrugs is mainly based on the platinum(II) precursor
scaffolds, i.e. cisplatin, carboplatin and oxaliplatin, by oxidation and subsequent addition of two
axial ligands (Figure 9). In contrast to platinum(II) complexes they exhibit an octahedral
geometry and a low spin d6 electron configuration.19 Platinum(IV) complexes show advantageous
properties compared to platinum(II) drugs. First, previously unavailable structural modifications
were offered due to the octahedral geometry in order to improve their overall pharmacological
properties.19,33 Second, they are considered to be kinetically inert and can thus be administered
orally.11,20 Third, their increased inertness should result in fewer side effects compared to the
classical platinum(II) analogues because they pass intact through the bloodstream and cannot
react “coordinatively” with biological nucleophiles such as cysteine and methionine. Platinum(IV)
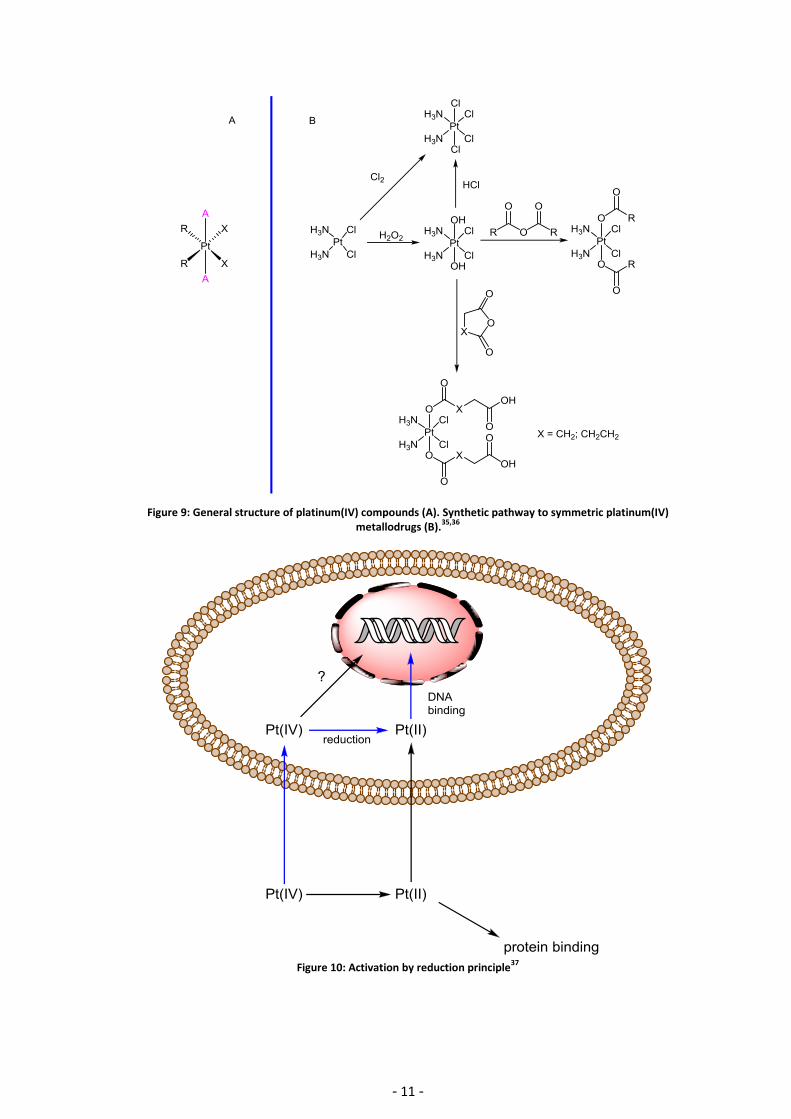
anticancer agents are prodrugs. They require reduction and hydrolysis to form the reactive
species platinum(II) aqua species (Figure 10).19,34 Since platinum(IV) compounds may lose their
axial ligands upon reduction they are of great importance to modify important pharmacological
properties such as pharmacokinetics. Figure 10 highlights the postulated pathway of a
platinum(IV) drug in blue.
- 11 -
Figure 9: General structure of platinum(IV) compounds (A). Synthetic pathway to symmetric platinum(IV) metallodrugs (B).
35,36
Figure 10: Activation by reduction principle
37
- 12 -
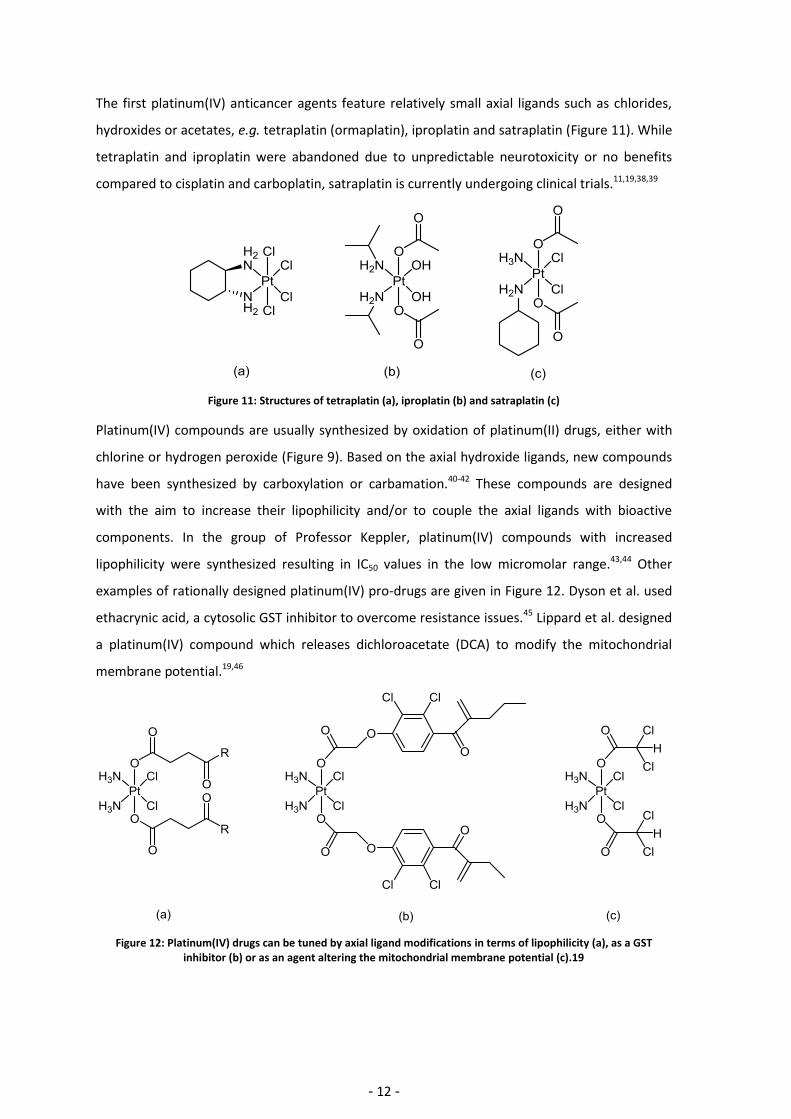
The first platinum(IV) anticancer agents feature relatively small axial ligands such as chlorides,
hydroxides or acetates, e.g. tetraplatin (ormaplatin), iproplatin and satraplatin (Figure 11). While
tetraplatin and iproplatin were abandoned due to unpredictable neurotoxicity or no benefits
compared to cisplatin and carboplatin, satraplatin is currently undergoing clinical trials.11,19,38,39
Figure 11: Structures of tetraplatin (a), iproplatin (b) and satraplatin (c)
Platinum(IV) compounds are usually synthesized by oxidation of platinum(II) drugs, either with
chlorine or hydrogen peroxide (Figure 9). Based on the axial hydroxide ligands, new compounds
have been synthesized by carboxylation or carbamation.40-42 These compounds are designed
with the aim to increase their lipophilicity and/or to couple the axial ligands with bioactive
components. In the group of Professor Keppler, platinum(IV) compounds with increased
lipophilicity were synthesized resulting in IC50 values in the low micromolar range.43,44 Other
examples of rationally designed platinum(IV) pro-drugs are given in Figure 12. Dyson et al. used
ethacrynic acid, a cytosolic GST inhibitor to overcome resistance issues.45 Lippard et al. designed
a platinum(IV) compound which releases dichloroacetate (DCA) to modify the mitochondrial
membrane potential.19,46
Figure 12: Platinum(IV) drugs can be tuned by axial ligand modifications in terms of lipophilicity (a), as a GST inhibitor (b) or as an agent altering the mitochondrial membrane potential (c).19
- 13 -
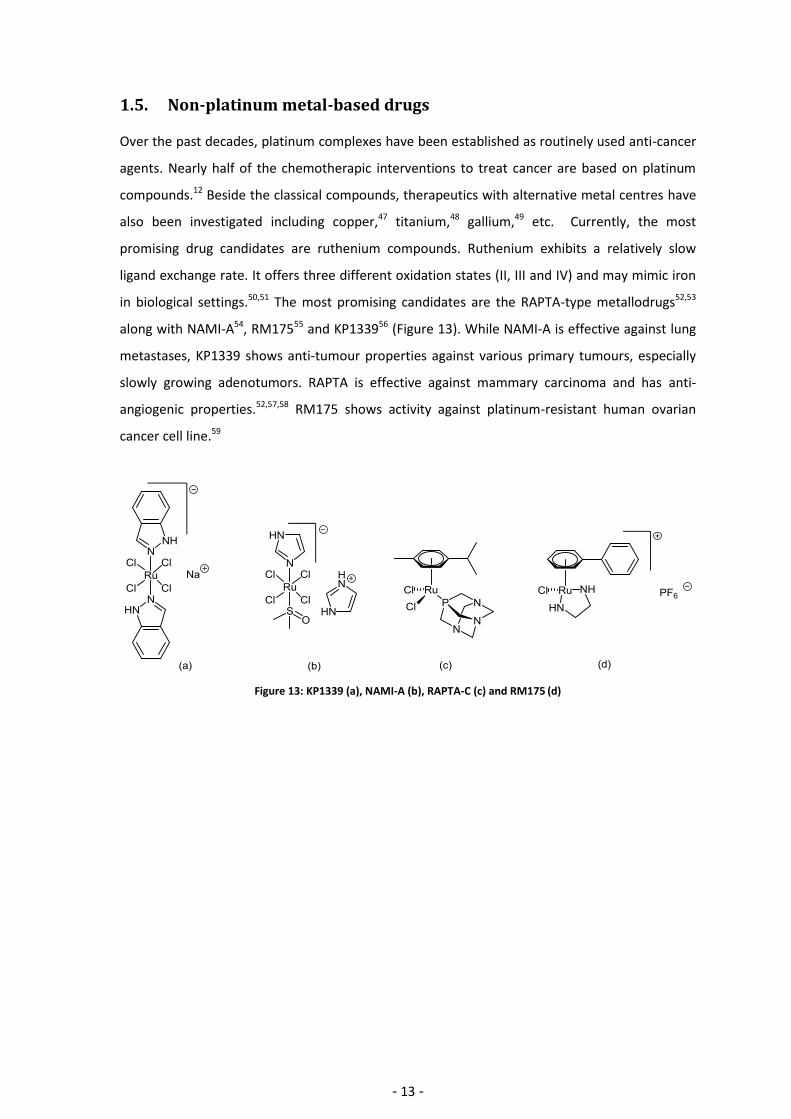
1.5. Non-platinum metal-based drugs Over the past decades, platinum complexes have been established as routinely used anti-cancer
agents. Nearly half of the chemotherapic interventions to treat cancer are based on platinum
compounds.12 Beside the classical compounds, therapeutics with alternative metal centres have
also been investigated including copper,47 titanium,48 gallium,49 etc. Currently, the most
promising drug candidates are ruthenium compounds. Ruthenium exhibits a relatively slow
ligand exchange rate. It offers three different oxidation states (II, III and IV) and may mimic iron
in biological settings.50,51 The most promising candidates are the RAPTA-type metallodrugs52,53
along with NAMI-A54, RM17555 and KP133956 (Figure 13). While NAMI-A is effective against lung
metastases, KP1339 shows anti-tumour properties against various primary tumours, especially
slowly growing adenotumors. RAPTA is effective against mammary carcinoma and has anti-
angiogenic properties.52,57,58 RM175 shows activity against platinum-resistant human ovarian
cancer cell line.59
Figure 13: KP1339 (a), NAMI-A (b), RAPTA-C (c) and RM175 (d)
- 14 -
1.6. Pharmacokinetic properties
Solubility and lipophilicity are important parameters in drug design, since they influence
pharmacokinetic (ADME) processes. ADME stands for absorption, distribution, metabolism and
elimination.60
Absorption is defined as “the passage of the drug from its site of administration into the general
circulatory system after enteral administration”.61 If a drug is administered intravenously it will
directly enter the systemic circulation. All other administration methods (oral, parenteral,
buccal, rectal, sublingual etc.) are called extravascular routes. The most convenient way for
patients is oral administration. After oral administration the drug has to cross several cell
membranes and the gut wall and has to enter the tumour tissue in the case of anticancer
drugs.60 After oral administration, the drug encounters drastic pH shifts from the stomach to the
intestine, inside a cell and into the blood stream, which may influence the drugs permeability
across cell membranes.61
The distribution process is referred to as the reversible transfer of a drug from one location to
another within the body. Once a drug enters the blood stream it can spread throughout the
body. The distribution will be most likely non-uniform in tissues.60
Metabolism is divided into phase I and phase II. In general, both stages are used to render
xenobiotics more hydrophilic in order to enhance their elimination. The typical reactions in
phase I are hydroxylation, reduction and epoxidation. In phase II the compound is conjugated
with polar biomolecules such as amino acids or functional groups.60 Before entering the
circulatory system, orally administered drugs may be metabolized in the liver already. Therefore,
the amount of the drug binding to its target is reduced. This is commonly referred as the first
pass effect.61
In most cases the elimination of drugs is carried out by micturition and, to a much lesser extent,
via faeces.60
On the one hand, a drug with high solubility may be well suited for i.v. administration, but for
oral administration it will not pass the cell membranes and would require an active transport. On
the other hand, a highly lipophilic substance would be able to enter cells via passive diffusion,
but may be excreted in the first place since it will dissolve in fat globules.36 Therefore, a reliable
estimation of the lipophilic character of a drug is of high importance and three different
lipophilicity parameters are assayed and discussed with respect to their suitability for
characterizing the lipophilicity of platinum(IV) anticancer agents.
- 15 -
1.7. High Performance Liquid Chromatography – HPLC HPLC is a chromatographic technique based on the development of column chromatography by
Michail Tsvet in 1906. Tsvet was able to separate chlorophyll and xanthophylls, which resulted in
different coloured zones on his column inspiring him for the name chromatography.62 It is
currently one of the most popular analytical method.
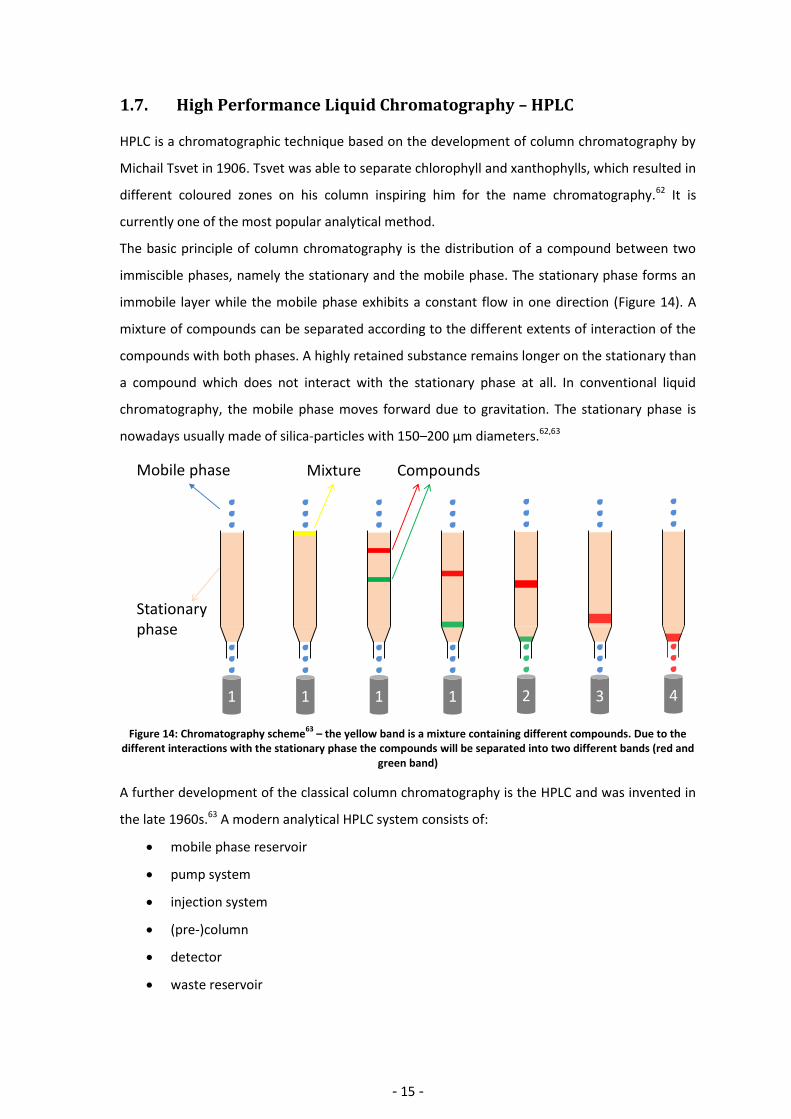
The basic principle of column chromatography is the distribution of a compound between two
immiscible phases, namely the stationary and the mobile phase. The stationary phase forms an
immobile layer while the mobile phase exhibits a constant flow in one direction (Figure 14). A
mixture of compounds can be separated according to the different extents of interaction of the
compounds with both phases. A highly retained substance remains longer on the stationary than
a compound which does not interact with the stationary phase at all. In conventional liquid
chromatography, the mobile phase moves forward due to gravitation. The stationary phase is
nowadays usually made of silica-particles with 150–200 µm diameters.62,63
Figure 14: Chromatography scheme63
– the yellow band is a mixture containing different compounds. Due to the different interactions with the stationary phase the compounds will be separated into two different bands (red and
green band)
A further development of the classical column chromatography is the HPLC and was invented in
the late 1960s.63 A modern analytical HPLC system consists of:
mobile phase reservoir
pump system
injection system
(pre-)column
detector
waste reservoir
1 1 1 1
Mobile phase
Stationaryphase
Mixture
2 3 4
Compounds
- 16 -
A mobile phase reservoir is necessary for storage of the solvents. It is usually made of glass or,
less commonly, steel and normally comprises 250 to 1000 mL. The most frequently used solvents
are water, MeOH and ACN, however, the choice of solvent depends on the column type. To
pump the mobile phase (eluent) through the system, further purifications steps are necessary in
order not to harm the column, the detector or to ensure a good resolution. One of them is the
so called degasser, a small item which prevents bubbles to reach the detector in order to
maintain good resolution. The degasser can be combined with a filter unit to remove small
particles from the eluent. An HPLC system is capable of mixing solvents from different mobile
phase reservoirs. This allows various compositions of mobile phases between and even during
HPLC runs. If the eluent composition is kept constant during the run, it is referred as an isocratic
elution mode, as accordingly a gradient elution mode if the compositions are varied. While
isocratic elution is not prone to baseline drifts, a gradient elution typically exhibits a drifting
baseline over time. On the other hand, a gradient elution can offer shorter analysis time and
sharper peaks.63
The pump system has to generate pressure up to 400 bars (1200 bars in an UHPLC system). It
should be chemically inert and should maintain continuous flow rates from 0.1 mL/min up to
10 mL/min for classical analytical pumps.63
The injection system should support a broad volumina range from 1 to 100 µL depending on the
size of the sample loop. However, this is not an easy task since the pressure within the system
should not be influenced by the injection itself. Therefore, a so called sample injection 6-port
valve was invented which can bypass the eluent flow from the pump directly on the column. In
this position, the sample can be injected into the sample loop. Upon switching the valve into
main pass, the sample is flushed on the column. Although every HPLC system has a manual
injection system, an autosampler used for routinely analysis is more common.63
The column is one of the most critical issues of an HPLC system, since its stationary phase is
responsible for a chromatographic separation. There are basically two different kinds of
columns: ‘normal phase’ and ‘reversed phase’. A normal phase exhibits a polar stationary phase
while a reversed phase uses a non-polar column, e.g. alkyl-chains. Obviously, the type of column
selected depends on the sample properties. However, a reversed phase column is used in most
cases, since the compounds which are separately mostly nowadays such as amino acids,
antibiotics or (metallo-) drugs can be separated very well.63 Commercial columns are available in
- 17 -
various lengths, diameters and particle sizes. The most frequently used columns are 5-25 cm in
length, have an inner diameter of 1.8-10 mm and consist of spherical particles of 2 to 10 µm.
There is a specific column for almost every application on the market.63
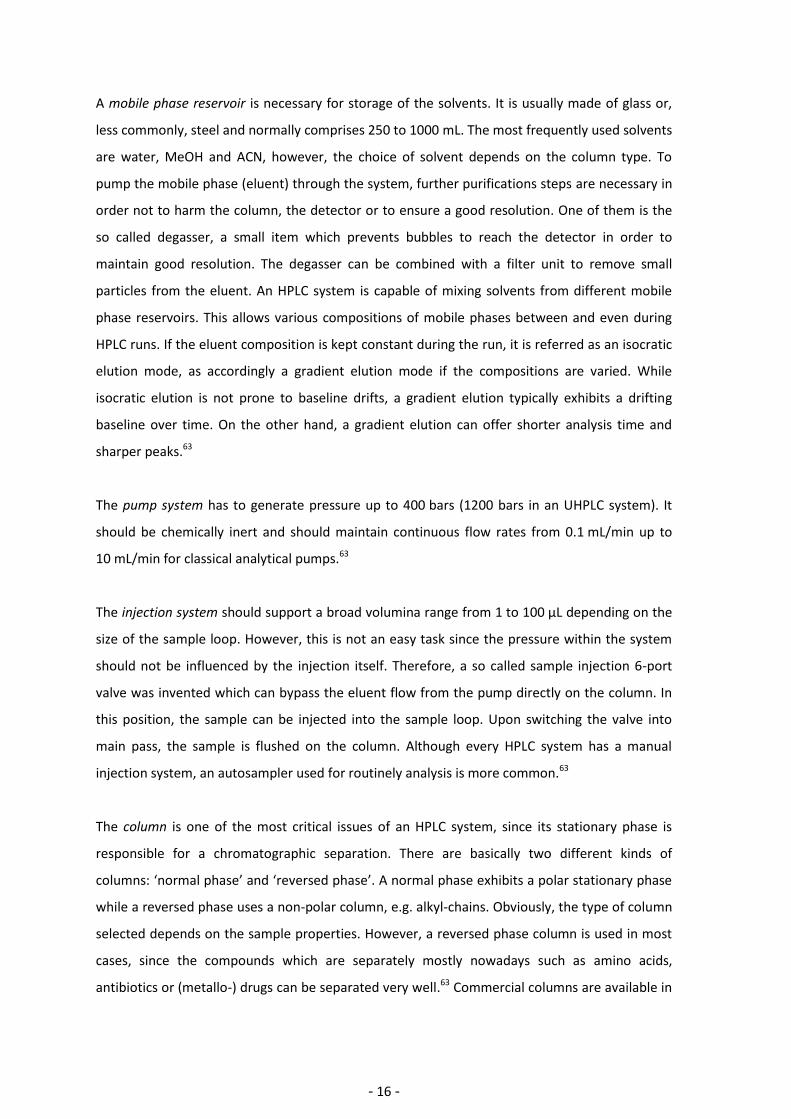
Basically, there are two different types of detectors. It can either measure an intrinsic physically
characteristic of the mobile phase such as refractive index or conductivity, or properties of the
analytes, such as UV/Vis or fluorescence. The UV/Vis detector is used the most frequently used
detector with an estimated usage of 70%.62 Since UV detectors are based on absorption, it is also
susceptible to interferences. Therefore, a small cell in ‘z’-shape is used, which should use as little
volume as possible and is normally ranging from 1 to 11 µL at 2 to 10 mm length (Figure 15).63
Figure 15: UV detection cell63
However, there are some disadvantages/limitations of an HPLC system. For example, the
detection limits for UV/Vis, which depend on the molar extinction coefficient, are quite high and
are usually in the nanogram range. Peaks can also overlap, which may lead to masking effects.
Although HPLC is a ‘stand-alone’ technique, it can be combined with other analytical instruments
such as MS for an enhanced sensitivity and the possibility of gaining additional information
based on the m/z ratios of the analytes. In the last years chiral columns have been introduced to
facilitate chiral separations on HPLC systems even on semi-preparative scale. Furthermore,
UHPLC systems (Ultra High Performance Liquid Chromatography) have been developed. These
systems are characterized by small column particles (<2 µm) which enable relatively fast
separations, but at the price of higher back pressure compared to conventional HPLC
systems.64,65
UV lamp Detector
Eluent
Waste
Quartz windows
- 18 -
1.8. Inductively Coupled Plasma-Mass Spectrometry – ICP-MS Inductively coupled plasma - mass spectrometry (ICP-MS) is a powerful technique which was
designed in the early 1970s to combine the rapid multi-element capabilities of inductively
coupled plasma - optical emission spectrometry (ICP-OES) with the detection limits (ng/g scale)
of graphite furnace atomic absorption (GFAA).66 The benefits are its multi-element analysis
capabilities, a very high sensitivity to sub 1 ppb range and on-line sample introduction.67 ICP-MS
has been established as a routine technique for a common field in inorganic chemistry known as
metallomics, which can be described as the analysis of metal-containing biomolecules (structure,
function etc.) within a tissue or cell type.67 This can be derived from the fact that an ICP-MS does
not detect the analyte structure due to the atomization process and therefore, metabolites can
be determined by elements of interest e.g. platinum, ruthenium or any other metal. Although
ICP-MS is a superb stand-alone technique, it can be coupled with analytical separation methods
such as LC or capillary electrophoresis (CE), to gain additional information. Especially HPLC
systems can be easily hyphenated to ICP-MS, due to the similar flow rate. Furthermore, ICP-MS
is able to handle solid samples as well, such as soil- and rock samples via a laser ablation (LA)
unit hyphenated to ICP-MS (LA-ICP-MS).
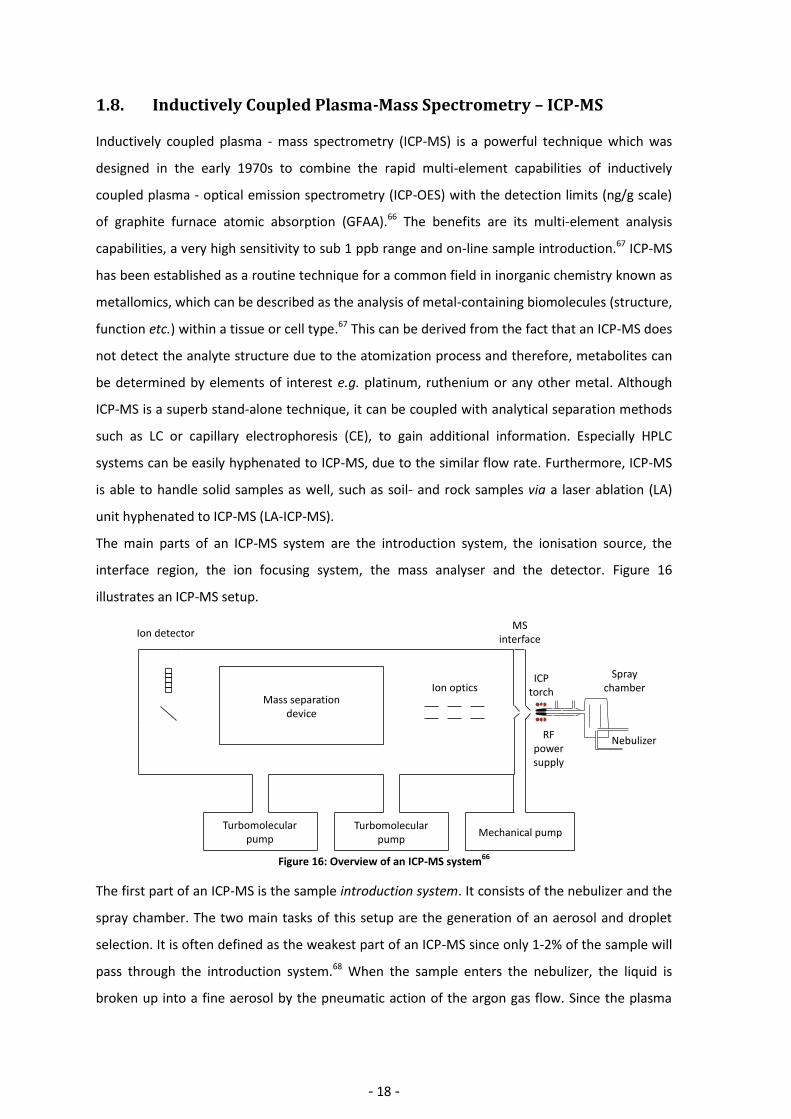
The main parts of an ICP-MS system are the introduction system, the ionisation source, the
interface region, the ion focusing system, the mass analyser and the detector. Figure 16
illustrates an ICP-MS setup.
Figure 16: Overview of an ICP-MS system
66
The first part of an ICP-MS is the sample introduction system. It consists of the nebulizer and the
spray chamber. The two main tasks of this setup are the generation of an aerosol and droplet
selection. It is often defined as the weakest part of an ICP-MS since only 1-2% of the sample will
pass through the introduction system.68 When the sample enters the nebulizer, the liquid is
broken up into a fine aerosol by the pneumatic action of the argon gas flow. Since the plasma
MS interface
Mass separationdevice
Turbomolecularpump
Turbomolecularpump
Mechanical pump
Ion opticsICP
torch
RF power supply
Spray chamber
Nebulizer
Ion detector
- 19 -
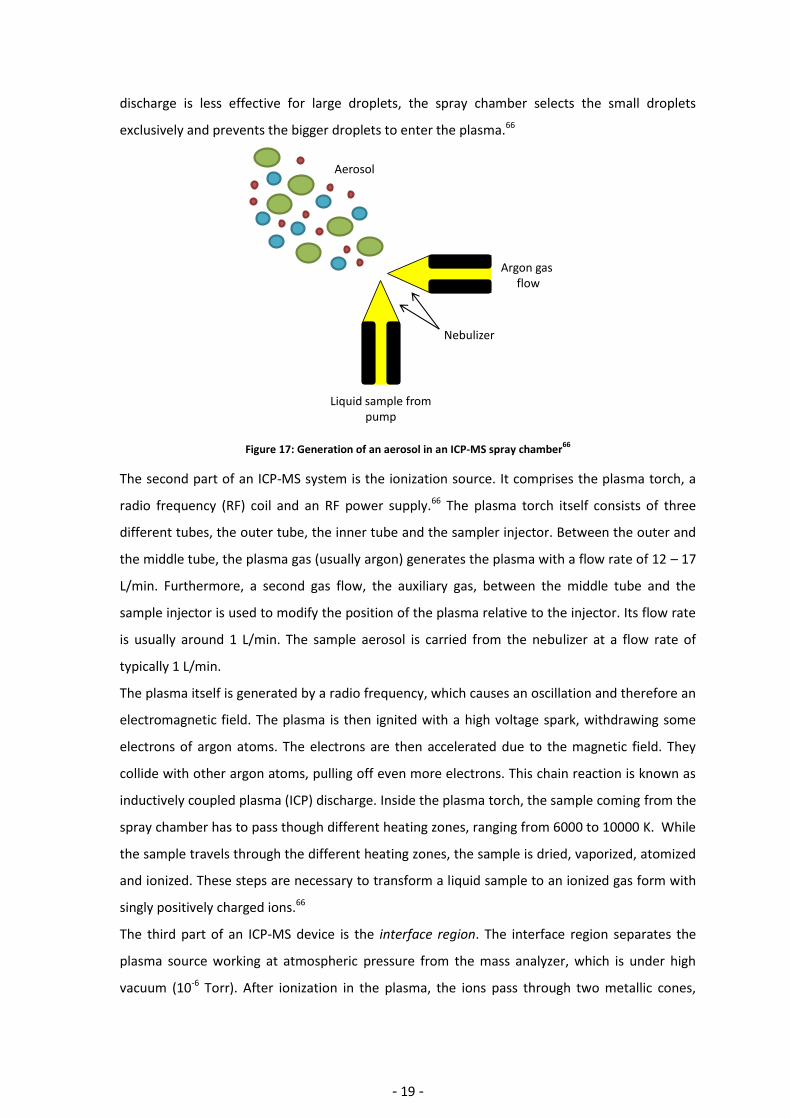
discharge is less effective for large droplets, the spray chamber selects the small droplets
exclusively and prevents the bigger droplets to enter the plasma.66
Figure 17: Generation of an aerosol in an ICP-MS spray chamber66
The second part of an ICP-MS system is the ionization source. It comprises the plasma torch, a
radio frequency (RF) coil and an RF power supply.66 The plasma torch itself consists of three
different tubes, the outer tube, the inner tube and the sampler injector. Between the outer and
the middle tube, the plasma gas (usually argon) generates the plasma with a flow rate of 12 – 17
L/min. Furthermore, a second gas flow, the auxiliary gas, between the middle tube and the
sample injector is used to modify the position of the plasma relative to the injector. Its flow rate
is usually around 1 L/min. The sample aerosol is carried from the nebulizer at a flow rate of
typically 1 L/min.
The plasma itself is generated by a radio frequency, which causes an oscillation and therefore an
electromagnetic field. The plasma is then ignited with a high voltage spark, withdrawing some
electrons of argon atoms. The electrons are then accelerated due to the magnetic field. They
collide with other argon atoms, pulling off even more electrons. This chain reaction is known as
inductively coupled plasma (ICP) discharge. Inside the plasma torch, the sample coming from the
spray chamber has to pass though different heating zones, ranging from 6000 to 10000 K. While
the sample travels through the different heating zones, the sample is dried, vaporized, atomized
and ionized. These steps are necessary to transform a liquid sample to an ionized gas form with
singly positively charged ions.66
The third part of an ICP-MS device is the interface region. The interface region separates the
plasma source working at atmospheric pressure from the mass analyzer, which is under high
vacuum (10-6 Torr). After ionization in the plasma, the ions pass through two metallic cones,
Nebulizer
Aerosol
Liquid sample from pump
Argon gas flow
- 20 -
namely the sample and skimmer cone. The sample cone has an orifice diameter of 0.8-1.2 mm,
while the skimmer cone has an orifice diameter of 0.4-0.8 mm. The main function of these cones
is to align the ions and they are usually made of nickel or platinum. The interface region consists
of a mechanical pump, keeping the pressure at 3-4 Torr.
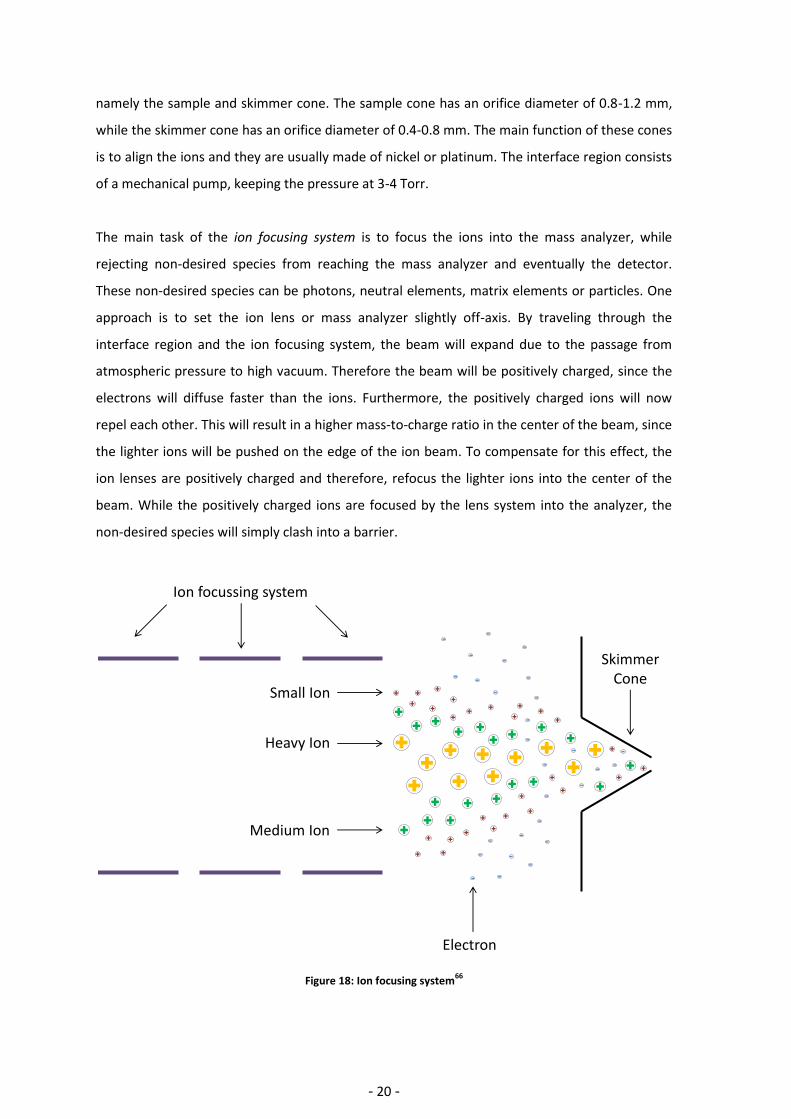
The main task of the ion focusing system is to focus the ions into the mass analyzer, while
rejecting non-desired species from reaching the mass analyzer and eventually the detector.
These non-desired species can be photons, neutral elements, matrix elements or particles. One
approach is to set the ion lens or mass analyzer slightly off-axis. By traveling through the
interface region and the ion focusing system, the beam will expand due to the passage from
atmospheric pressure to high vacuum. Therefore the beam will be positively charged, since the
electrons will diffuse faster than the ions. Furthermore, the positively charged ions will now
repel each other. This will result in a higher mass-to-charge ratio in the center of the beam, since
the lighter ions will be pushed on the edge of the ion beam. To compensate for this effect, the
ion lenses are positively charged and therefore, refocus the lighter ions into the center of the
beam. While the positively charged ions are focused by the lens system into the analyzer, the
non-desired species will simply clash into a barrier.
Figure 18: Ion focusing system66
SkimmerCone
Ion focussing system
Electron
Heavy Ion
Medium Ion
Small Ion
- 21 -
Followed by the ion focusing system and before the detector, a mass analyzer selects the ions
according to their mass-to-charge ratio. Three different mass analyzers can be employed in an
ICP-MS device, such as quadrupole, double-focusing magnetic-sector field and time of flight
(TOF). According to the literature, about 90% ICP-MS systems use a quadrupole as a mass
analyzer. The quadrupole and the double-focusing magnetic-sector screen within a defined m/z
ratio and select the desired ions. Double-focusing magnetic-sector mass analyzers offer high
resolution, but are more expensive than quadrupole- based ICP-MS. TOFs are designed to detect
more than one element simultaneously, which offers a full mass spectrum in short time. Finally,
the detector is usually a channel electron multiplier.66
The occurrence of mass interferences is one of the challenges of ICP-MS. Depending on the
sample and its matrix, there can be interferences caused by atomic or polyatomic species having
the same mass to charge ratio as the analyte. These interferences appear mostly on low mass
metal ions, due to the formation of oxide, nitrogen, sulfur, phosphor and/or argon species. To
overcome this problem either a sector-field high resolution ICP-MS can be used or a reaction
and/or collision cell can be placed after the focusing system and before the mass analyzer.
- 22 -
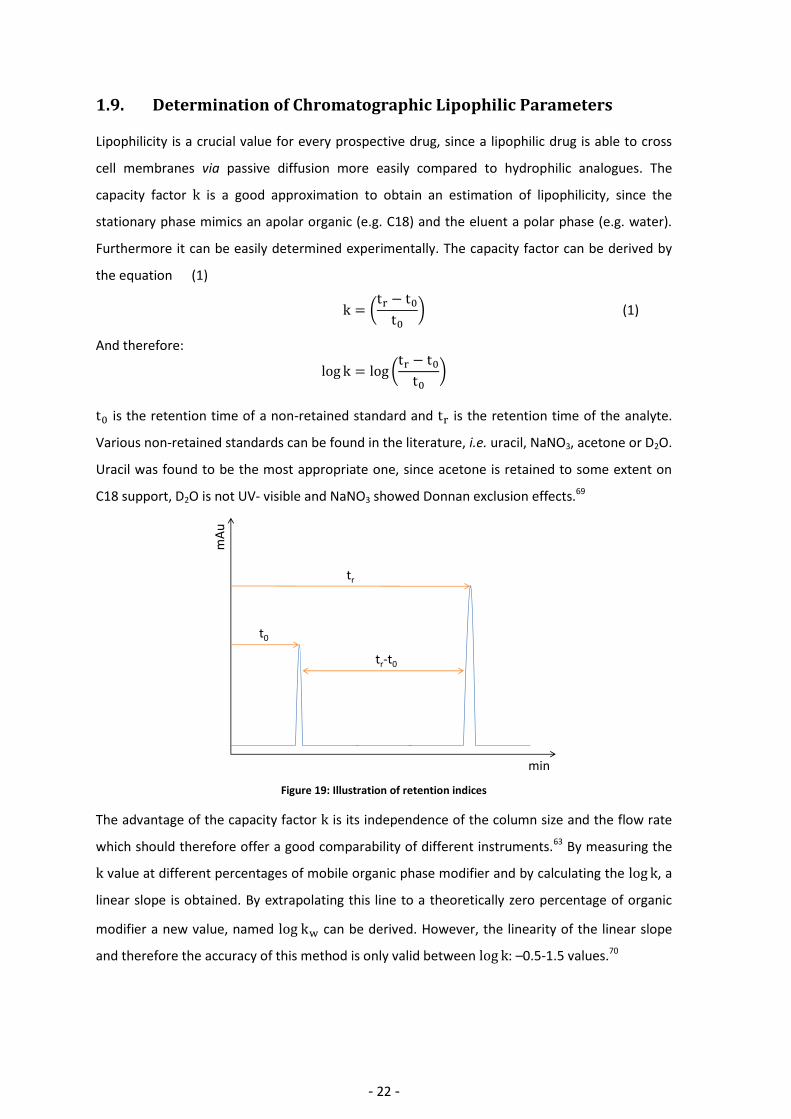
1.9. Determination of Chromatographic Lipophilic Parameters Lipophilicity is a crucial value for every prospective drug, since a lipophilic drug is able to cross
cell membranes via passive diffusion more easily compared to hydrophilic analogues. The
capacity factor is a good approximation to obtain an estimation of lipophilicity, since the
stationary phase mimics an apolar organic (e.g. C18) and the eluent a polar phase (e.g. water).
Furthermore it can be easily determined experimentally. The capacity factor can be derived by
the equation (1)
(
) (1)
And therefore:
(
)
is the retention time of a non-retained standard and is the retention time of the analyte.
Various non-retained standards can be found in the literature, i.e. uracil, NaNO3, acetone or D2O.
Uracil was found to be the most appropriate one, since acetone is retained to some extent on
C18 support, D2O is not UV- visible and NaNO3 showed Donnan exclusion effects.69
Figure 19: Illustration of retention indices
The advantage of the capacity factor is its independence of the column size and the flow rate
which should therefore offer a good comparability of different instruments.63 By measuring the
value at different percentages of mobile organic phase modifier and by calculating the , a
linear slope is obtained. By extrapolating this line to a theoretically zero percentage of organic
modifier a new value, named can be derived. However, the linearity of the linear slope
and therefore the accuracy of this method is only valid between : –0.5-1.5 values.70
min
mA
u
tr
t0
tr-t0
- 23 -
In the early 1990’s papers have introduced a new value in order to achieve better correlation of
various compounds sets.71 The chromatographic lipophilicity index 0 is calculated from the
value by the equation
(3)
where ‘ ’ is the slope obtained by plotting values as a function of the percentage of the
organic modifier.34,35 The value is defined as the percentage of organic modifier in the mobile
phase, where the value is zero for a given compound, or in other words, where the
distribution of a compound is equal in the stationary and the mobile phase.72 The retention time
at is therefore exactly twice the column dead time. The value has been introduced in
1993 to overcome correlation problems of with occurring by the usage of
structurally different types of compounds.71,72
- 24 -
1.10. Determination of the Partition Coefficient
The classical value to describe the lipophilicity of compounds is the so called (sometimes
referred as or ) value. The parameter is constituted as the distribution of a
neutral compound between 1-octanol and water phases in contact (equation (4).
A positive value means that the 1-octanol phase contains the majority of the compound,
which itself is lipophilic. If the value is zero, there is an equal distribution of the substance in
both phases. A good log P value for a prospective drug is between = 0.5 to 3.5.36 There are
several ways for the determination of the value.69,73-75 The classical method is the shake
flask method followed by UV/Vis detection. This technique exhibits six orders of magnitude
ranging from to , although a slightly different range from to was also reported.69,73
In this case, the concentration of the analyte is measured in both the aqueous and the 1-octanol
phase. Beside UV/Vis several alternative detection methods have been proposed, such as ICP-
MS, ICP-AES and FAAS.76 In such cases, the value can be indirectly derived by measuring
the concentration of the analyte in the aqueous stock solution and in the water phase after
shaking by the equation 5:
(5)
If a compound’s lipophilicity is depending on the pH of the aqueous solution, the value is
replaced by the value. The correct notation is:
Determining the value by the shake flask method shows several drawbacks. First of all, it is
a very time consuming method, since after bringing the compound into the system it has to be
ensured that the system will be measured at equilibrium. Another point is the obtrusive smell of
1-octanol. Furthermore, the 1-octanol/water layer may not always be well-defined.
- 25 -
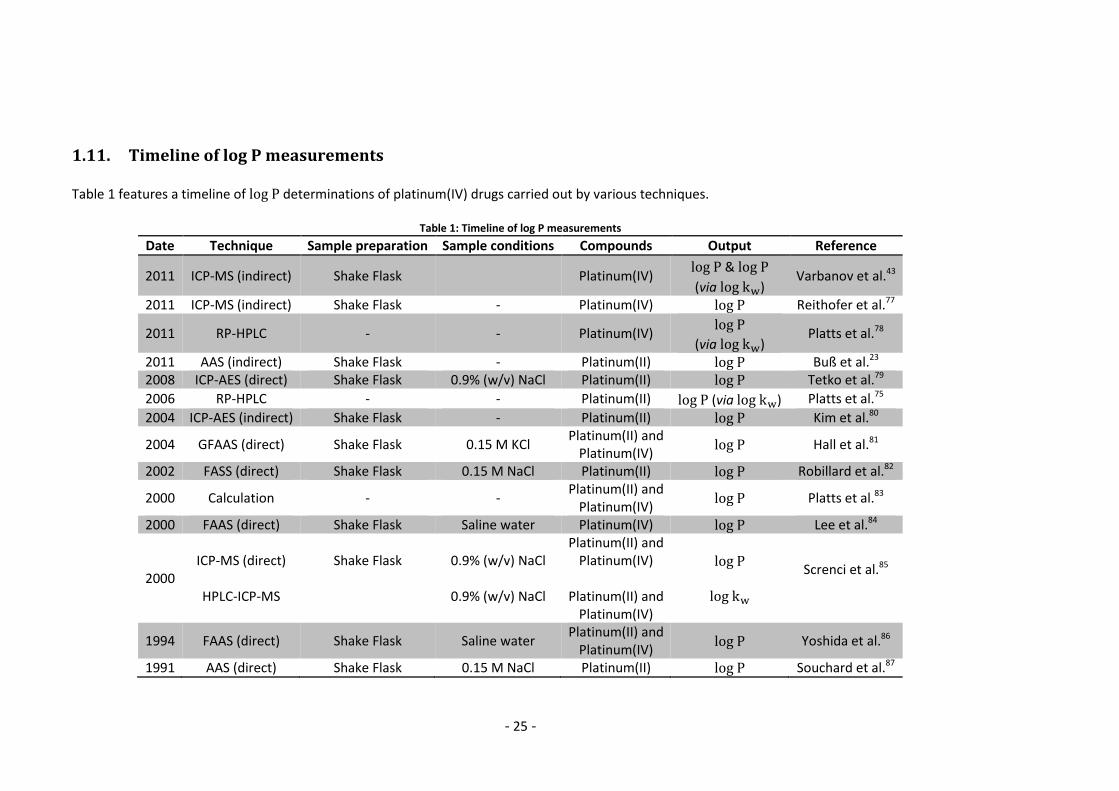
1.11. Timeline of log P measurements
Table 1 features a timeline of determinations of platinum(IV) drugs carried out by various techniques.
Table 1: Timeline of log P measurements
Date Technique Sample preparation Sample conditions Compounds Output Reference
2011 ICP-MS (indirect) Shake Flask Platinum(IV) &
(via ) Varbanov et al.43
2011 ICP-MS (indirect) Shake Flask - Platinum(IV) Reithofer et al.77
2011 RP-HPLC - - Platinum(IV)
(via ) Platts et al.78
2011 AAS (indirect) Shake Flask - Platinum(II) Buß et al.23 2008 ICP-AES (direct) Shake Flask 0.9% (w/v) NaCl Platinum(II) Tetko et al.79
2006 RP-HPLC - - Platinum(II) (via ) Platts et al.75
2004 ICP-AES (indirect) Shake Flask - Platinum(II) Kim et al.80
2004 GFAAS (direct) Shake Flask 0.15 M KCl Platinum(II) and
Platinum(IV) Hall et al.81
2002 FASS (direct) Shake Flask 0.15 M NaCl Platinum(II) Robillard et al.82
2000 Calculation - - Platinum(II) and
Platinum(IV) Platts et al.83
2000 FAAS (direct) Shake Flask Saline water Platinum(IV) Lee et al.84
2000 ICP-MS (direct)
HPLC-ICP-MS
Shake Flask
0.9% (w/v) NaCl
0.9% (w/v) NaCl
Platinum(II) and Platinum(IV)
Platinum(II) and
Platinum(IV)
Screnci et al.85
1994 FAAS (direct) Shake Flask Saline water Platinum(II) and
Platinum(IV) Yoshida et al.86
1991 AAS (direct) Shake Flask 0.15 M NaCl Platinum(II) Souchard et al.87
- 26 -
2. Experimental Part
2.1. Chemicals and Reagents
Milli-Q water (18.2 MΩ cm, Milli-Q Advantage A10, Darmstadt, Germany) was used for all
dilutions. Nitric acid (65% p.a.) was purchased from Fluka (Buchs, Switzerland) and further
purified before usage in a quartz sub-boiling point distillation unit (Milestone-MLS GmbH,
Leutkirch, Germany). Platinum, indium and rhenium standards were obtained from CPI
International (Amsterdam, The Netherlands). Uracil (99%) and potassium iodide were bought
from Fluka and Sigma-Aldrich, respectively. 1-Octanol (HPLC grade) was purchased from Fluka.
Triflouroacetic acid (peptide grade) was obtained from Iris Biotech.
2.2. Log k – sample preparation The compounds were dissolved in 1 mL methanol : water (1 : 1) yielding a final concentration of
0.5 mmol/L. The samples were vortexed and sonicated for 15 min. Afterwards, the samples were
filtered through a 0.45 µm filter (Minisart RC 25, Sartorius AG, Göttingen, Germany) into a
1.5 mL HPLC vial (Schnappringflasche, Markus Bruckner Analysentechnik, Linz, Austria). Uracil
and potassium iodide were used in order to evaluate the column dead time. The samples were
spiked with 200 µL of a filtered aqueous uracil solution (c = 1 µmol/L). Potassium iodide was
used as an additional standard via an extra run. The capacity factors ( ) were determined
using an UHPLC instrument (UltiMate3000 RS, Dionex, Bremen, Germany) and a Poroshell SB-
120 column (150 x 2.1 mm, 2.7 µm particle diameter). The values were derived by the
equation 2: For each compound, isocratic methods were used with at
least three different mobile phase compositions and each method was run in duplicate, except
for reference platinum(II) compounds. Furthermore, values were obtained by
extrapolating the to 100% aqueous mobile phase. The value can be derived from the
by equation 3. A minimum of R2 = 0.98 was obtained in all determinations. The
chromatographic and instrumental parameters are listed in Table 2.
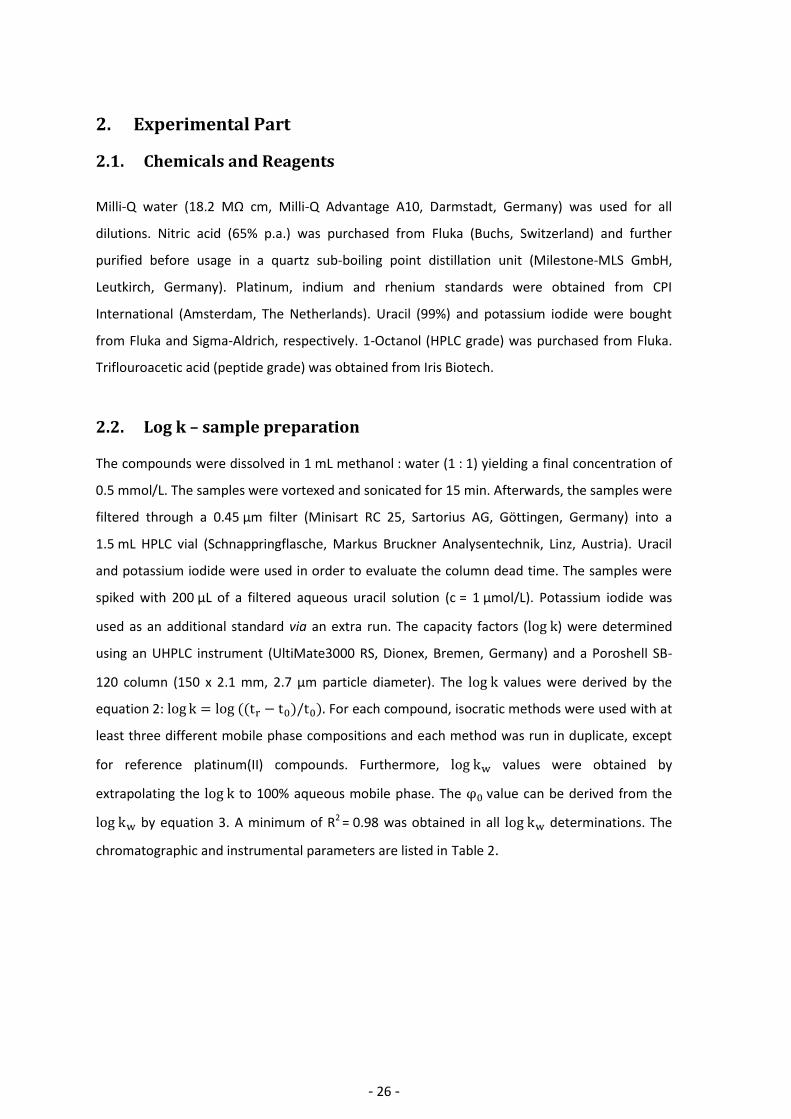
- 27 -
Table 2: HPLC – parameters for log k determination
System Manufacturer Dionex
Model UltiMate 3000 RS
Column Manufacturer Agilent
Column Name Poroshell 120 SB-C18 (2.1 x 150 mm; 2.7
Micron)
Column Type Reversed Phase
Mobile Phase MeOH/Water (0.1% TFA)
Mobile Phase Composition Range 5-95% MeOH
Elution Mode Isocratic
Flow Rate 0.20 [mL/min]
Detector Wavelength 210 [nm]
Auto Sampler Temperature 23 [°C]
Column Temperature 23 [°C]
Collecting Data Rate 5 [Hz]
2.3. Log P – Sample preparation
Solutions of 1-octanol saturated with water and water saturated with 1-octanol were prepared
by stirring for one week prior to use. Samples were dissolved in 1.5 mL water saturated with 1-
octanol at a final concentration of approx. 0.5 mmol/L and the initial and output weights were
recorded. The samples were vortexed and subsequently sonicated for 15 min. Afterwards the
stock solutions were filtered through a 0.45 µm filter. The filtered stock solution was divided into
three parts. One part was used for HPLC measurements, while the second was diluted
gravimetrically with 1% HNO3 for ICP-MS measurements yielding Pt concentrations lower than
20 µg/L. Equal amounts of the third part of the stock solution and 1-octanol (700 µL each) were
pipetted into a vial (TwistTop Vials, Sorensen BioSciene Inc., Salt Lake City, USA) and shaken
mechanically for 1 h at 60 rpm at RT. Afterwards the vials were centrifuged at 10000 rpm for
10 min. 500 µL of the 1-octanol phase were directly pipetted into an HPLC vial. The 1-octanol
phase was carefully removed from the water phase. The water phase was split into two parts.
The first was used for HPLC measurements, while the second was again diluted with 1% HNO3
for Pt determination with ICP-MS in the same manner as described before. A platinum standard
stock solution was used to prepare eight calibration standards ranging from 0.05 µg/L to
20 µg/L. Since it is not possible to measure the concentration in the 1-octanol phase with ICP-MS
directly, it has to be calculated via the stock solution and the water phase by the equation:
. Therefore, the value is calculated by equation 5:
.
- 28 -
For HPLC measurements of the stock-solution, the 1-octanol and the water-phase were injected
onto the column separately. Although the measurement of the 1-octanol and the water-phase
would be sufficient for the calculation, the measurement of the stock solution gives
additional certainty, since the summation of the area values of the 1-octanol and the water-
phase should result in the area value of the stock solution. When this was not the case the result
was rejected. This direct method allows the calculation by the common equation:
. For the aqueous solutions an isocratic mode was applied, whereas
for the 1-octanol phase a multigradient method was developed to remove all the 1-octanol from
the column. The multigradient method starts with an isocratic elution, based on the -value of
a given compound. After the isocratic elution of the compound in the 1-octanol phase the
organic modifier was increased to 95% and held for at least 20 min. Finally, the column was
flushed for 12 min with the initial MeOH/water ratio to equilibrate the column. All
measurements were repeated at least twice. The HPLC parameters were the same as in Table 2,
only the collecting rate was increased to 100 Hz in order to increase accurateness of the peak
shape.
ICP-MS measurements were carried out using an ICP-MS Agilent 7500ce (Agilent Technologies,
Waldbronn, Germany) equipped with a CETAC ASX-520 autosampler (Nebraska, USA) and a
MicroMist nebulizer at a sample uptake rate of about 0.25 mL/min. Rhenium served as internal
standard for platinum. The Agilent MassHunter software (Workstation Software, Version
B.01.01, 2012) was used for data processing. The instrumental ICP-MS parameters are
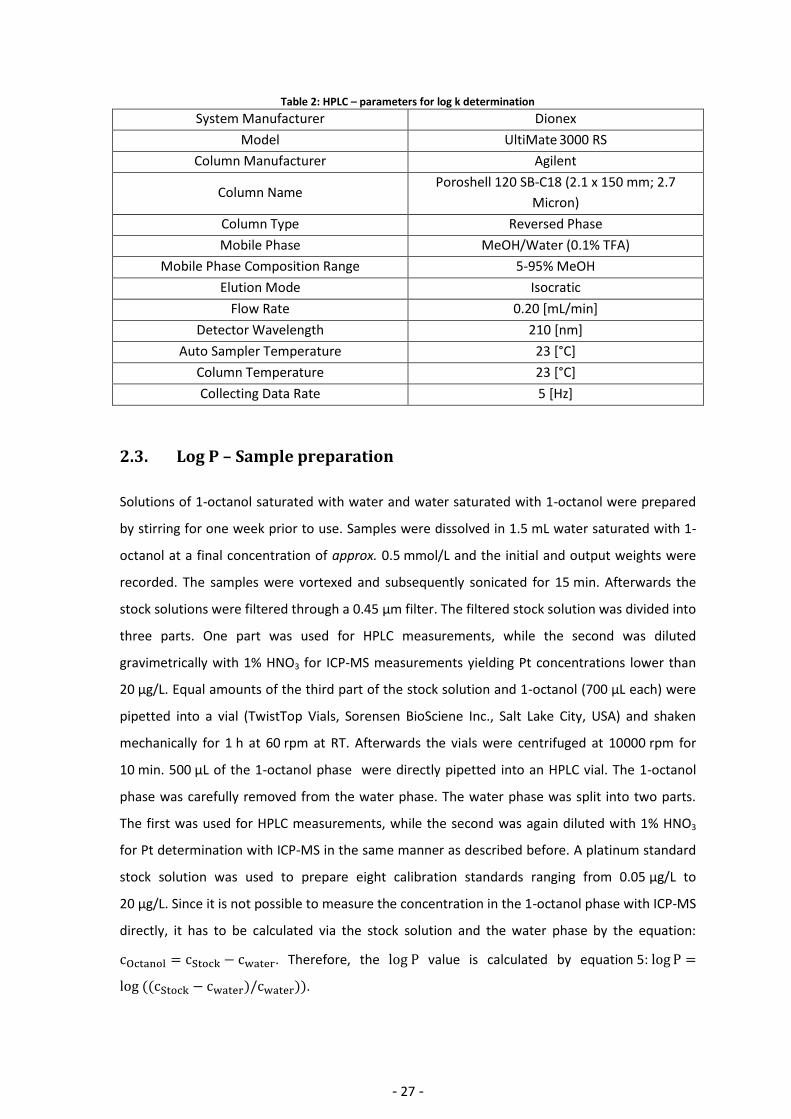
summarized in Table 3. Figure 20 gives an illustration of the sample preparation scheme.
Figure 20: Scheme of Log P sample preparation and determination
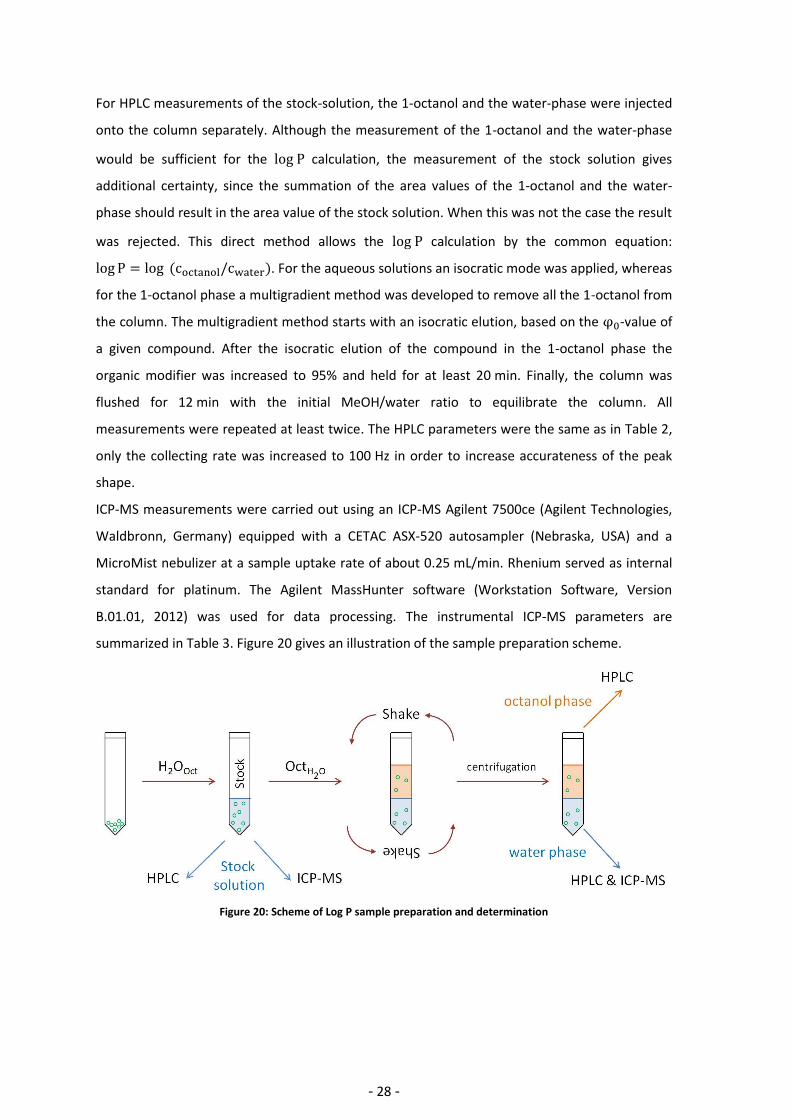
- 29 -
Table 3: ICP-MS – parameters for log P determination
RF-Power 1500 [W]
Cone Material Nickel
Carrier Gas 0.96 (Argon) [L/min]
Make up Gas 0.16 (Argon) [L/min]
Plasma Gas 15 (Argon) [L/min]
Recorded isotopes 185Re, 194Pt, 195Pt
Dwell time 0.1 [s]
2.4. Log P – Buffer experiments Five compounds containing an acidic moiety were evaluated in dependence of buffer conditions.
The buffers were prepared with either phosphate or acetic acid buffer at a final concentration of
10 mmol/L using MQ water. Phosphate buffers were used for pH = 7.4, 6.2, 2.5 and 1.7, while
acetic acid buffers were used for pH = 5.6, 4.7, 4.2 and 3.7. All experiments were carried out
using HPLC and are therefore directly measured log D values. The sample preparation was
identical to chapter 2.3.
- 30 -
3. Results and Discussion Lipophilicity is a crucial value for every prospective drug, since a lipophilic drug is able to cross
cell membranes via passive diffusion more easily compared to hydrophilic analogues. The log P
value of a prospective metallodrug should be within = 0.5-3.5.36
In a first step two dead time markers, uracil and KI, are evaluated and discussed. Then, the
lipophilicity parameters , and are discussed. Furthermore five compounds with
an acidic moiety were investigated in buffer experiments ( values).
In total, the of 79 platinum compounds was determined, including 6 platinum(II) and 73
platinum(IV) compounds were analyzed. Furthermore, the of a subseries of 28 compounds
was determined. The entire lists of results are shown in Appendix 5.2.
3.1. Determination and correlation of log kw and φ0
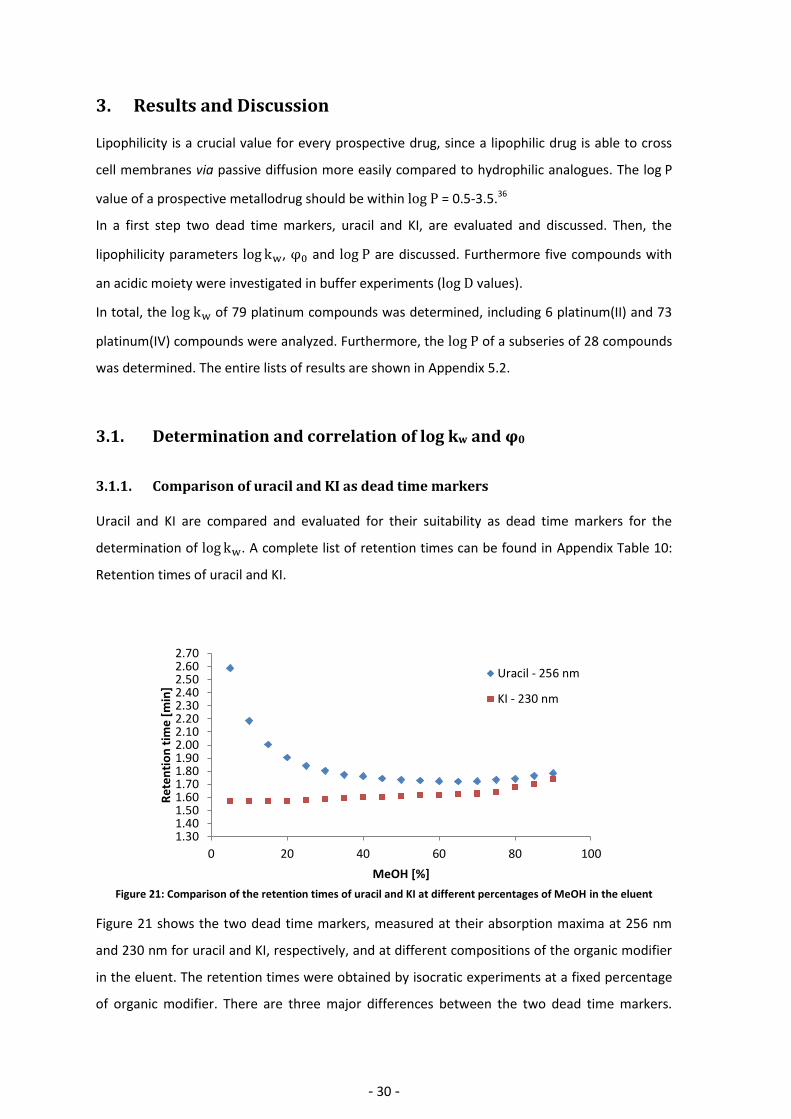
3.1.1. Comparison of uracil and KI as dead time markers Uracil and KI are compared and evaluated for their suitability as dead time markers for the
determination of . A complete list of retention times can be found in Appendix Table 10:
Retention times of uracil and KI.
Figure 21: Comparison of the retention times of uracil and KI at different percentages of MeOH in the eluent
Figure 21 shows the two dead time markers, measured at their absorption maxima at 256 nm
and 230 nm for uracil and KI, respectively, and at different compositions of the organic modifier
in the eluent. The retention times were obtained by isocratic experiments at a fixed percentage
of organic modifier. There are three major differences between the two dead time markers.
1.301.401.501.601.701.801.902.002.102.202.302.402.502.602.70
0 20 40 60 80 100
Re
ten
tio
n t
ime
[m
in]
MeOH [%]
Uracil - 256 nm
KI - 230 nm
- 31 -
First, KI displays relatively constant retention times in a broad range of mobile phase
compositions. Second, KI elutes generally faster than uracil independent on the methanol
concentration. Third, the retention time of uracil increases drastically at lower methanol
concentrations by approximately 60 s. KI shows ionic character and will not interact with the
highly non-polar C18-column at all. Furthermore, KI is better soluble in water than MeOH and
therefore the retention time increases slightly by using more organic modifier in the mobile
phase. On the other hand the retention time of uracil increases significantly below 25% organic
modifier. This suggests that the distribution equilibrium between the mobile and the stationary
phase is shifted in favour of the stationary phase. Overall, the retention time increases slightly
above 80% MeOH.
Consequently, KI seems to be the more suitable dead time marker because of its lower retention
time compared to uracil. This allows the determination of more hydrophilic compounds.
Therefore, while the experimentally determined value using uracil may not be within the
linear range of –0.5 to 1.570, the calculated value using KI may be. Therefore, KI is expected
to display a larger linear spectrum, however, it can potentially coordinate to aquated Pt-
complexes, which must be kept in mind during the chromatographic runs. The retention time of
KI was measured externally in this study.
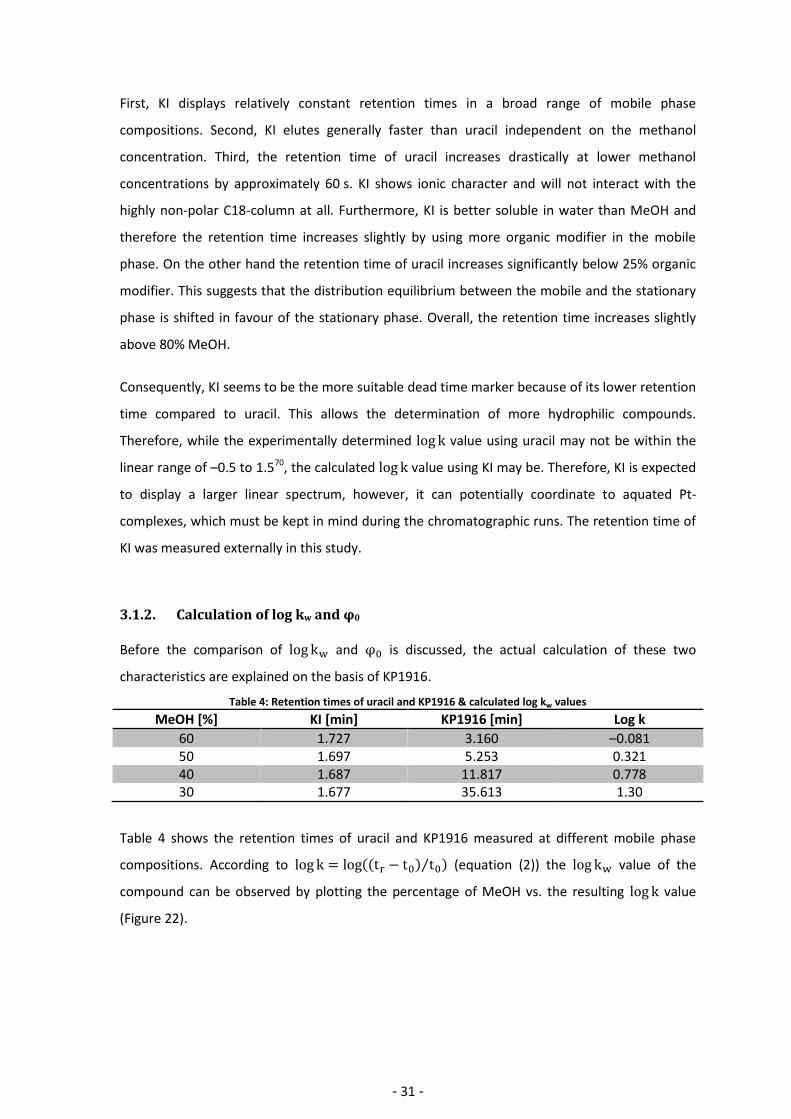
3.1.2. Calculation of log kw and φ0 Before the comparison of and is discussed, the actual calculation of these two
characteristics are explained on the basis of KP1916.
Table 4: Retention times of uracil and KP1916 & calculated log kw values
MeOH [%] KI [min] KP1916 [min] Log k
60 1.727 3.160 –0.081 50 1.697 5.253 0.321 40 1.687 11.817 0.778 30 1.677 35.613 1.30
Table 4 shows the retention times of uracil and KP1916 measured at different mobile phase
compositions. According to ⁄ (equation (2)) the value of the
compound can be observed by plotting the percentage of MeOH vs. the resulting value
(Figure 22).
- 32 -
Figure 22: Plot of log k vs. % of MeOH
The resulting value is just the intercept of the line with the y-axis in Figure 22, therefore
. It can be easily seen that this value is obtained by extrapolation. The calculation
of the value is according to equation (3) ⁄ , with and
. The resulting value is the intercept of the line with the x-axis, . It
can be seen that the value lies within the plotted line. This is the major difference between
the extrapolated value and the value.
y = -0.0462x + 2.6596 R² = 0.9963
-0.2
0.0
0.2
0.4
0.6
0.8
1.0
1.2
1.4
0 10 20 30 40 50 60 70
Log
k
MeOH [%]
- 33 -
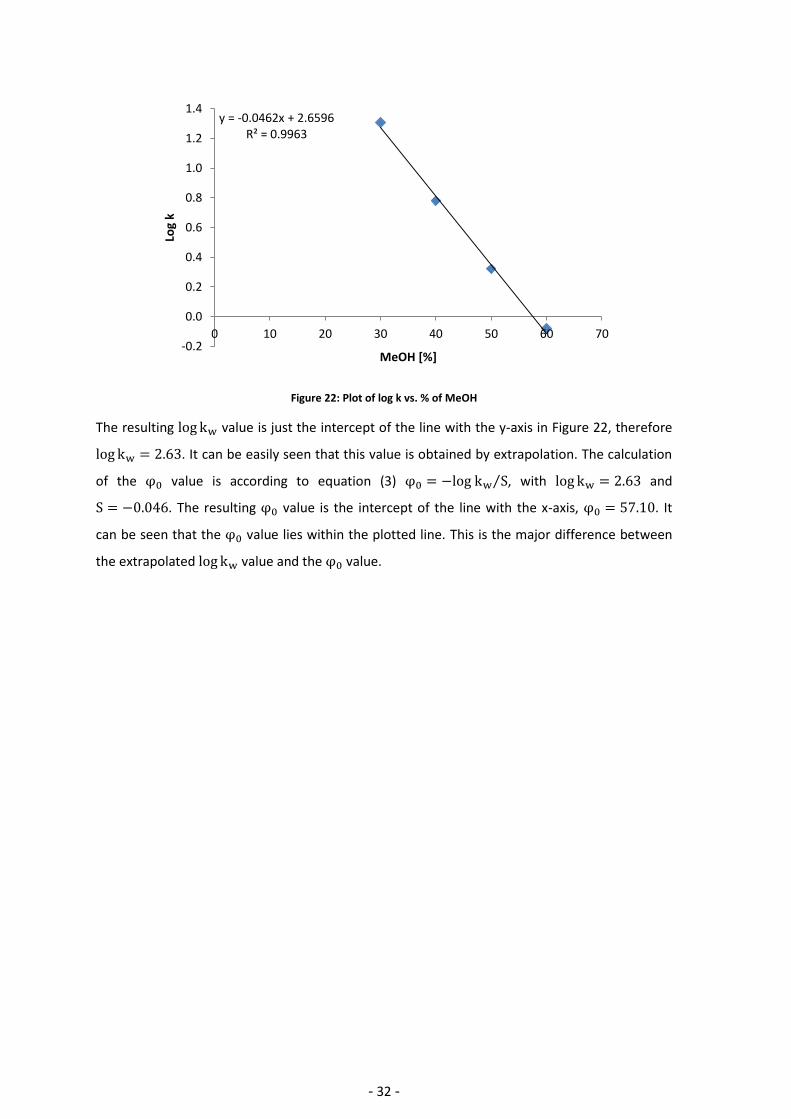
3.1.3. Comparison of log kw and φ0 determined with uracil and KI This chapter features the correlation of and in respective of their different calculation by using uracil or KI as dead time markers.
Figure 23: Correlation of log kw and ϕ0 with uracil and KI of 67 platinum(IV) complexes
Figure 24 shows the correlation of values (left) as well as values (right) calculated with uracil and KI as dead time marker for 67 platinum(IV)
compounds at 210 nm. The values were calculated with uracil and KI, which were derived by equation (3): . Platinum(II)
compounds and substances with an acid moiety are not included into the correlation. The correlation is linear with an R² of 0.9962 for and
R² = 0.9981 for . A small bend for low values, and less distinctive for values, can be observed. This can be explained by the previously
mentioned tendency of uracil to display increased retention times at low methanol concentration. However, the log-scale has a smoothing effect and
therefore, the difference in values might not be as pronounced as expected from Figure 21. The regression of the values increases slightly,
compared to the values, to R² = 0.9981. The two curves show a slight offset, since they should run through the origin. However, this can as well
y = 0,9321x + 0,2207R² = 0,9962
0,0
0,5
1,0
1,5
2,0
2,5
3,0
3,5
4,0
4,5
0,0 0,5 1,0 1,5 2,0 2,5 3,0 3,5 4,0 4,5
log
k w(K
I)
log kw (uracil)
y = 0,9333x + 4,5628R² = 0,9981
0
10
20
30
40
50
60
70
80
90
0 10 20 30 40 50 60 70 80 90
ϕ0
(KI)
ϕ0 (uracil)
- 34 -
be explained by the consideration with uracil above. In practical terms: as long as a value (and therefore a value) is derivable in its range
from –0.5 to 1.5, both dead time markers can be used. However, for more hydrophilic components uracil may be problematic. Therefore, KI is
recommended for measurements of and as the dead time marker.
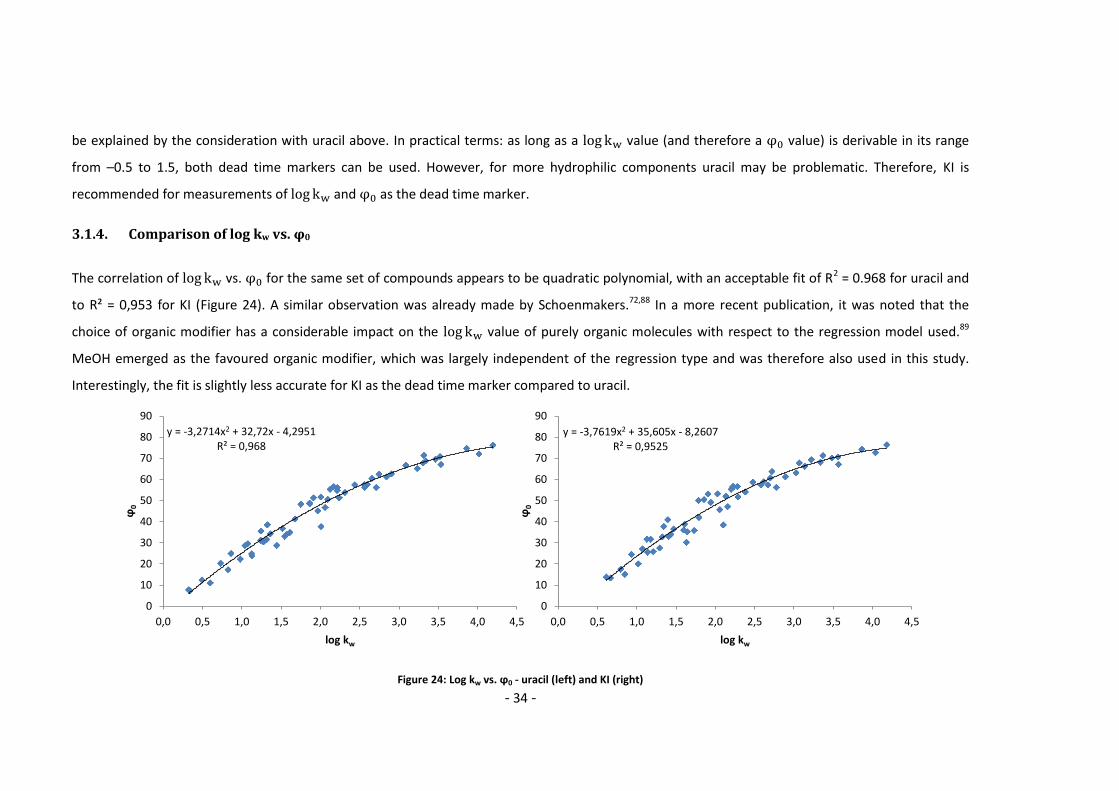
3.1.4. Comparison of log kw vs. φ0
The correlation of vs. for the same set of compounds appears to be quadratic polynomial, with an acceptable fit of R2 = 0.968 for uracil and
to R² = 0,953 for KI (Figure 24). A similar observation was already made by Schoenmakers.72,88 In a more recent publication, it was noted that the
choice of organic modifier has a considerable impact on the value of purely organic molecules with respect to the regression model used.89
MeOH emerged as the favoured organic modifier, which was largely independent of the regression type and was therefore also used in this study.
Interestingly, the fit is slightly less accurate for KI as the dead time marker compared to uracil.
Figure 24: Log kw vs. ϕ0 - uracil (left) and KI (right)
y = -3,2714x2 + 32,72x - 4,2951R² = 0,968
0
10
20
30
40
50
60
70
80
90
0,0 0,5 1,0 1,5 2,0 2,5 3,0 3,5 4,0 4,5
ϕ0
log kw
y = -3,7619x2 + 35,605x - 8,2607R² = 0,9525
0
10
20
30
40
50
60
70
80
90
0,0 0,5 1,0 1,5 2,0 2,5 3,0 3,5 4,0 4,5
ϕ0
log kw
- 35 -
3.2. Determination of log P
The experiments were carried out using the classical shake flask method. Components were
dissolved in water which was presaturated with 1-octanol. This stock solution was then
measured with HPLC (via absorbance area ) and ICP-MS (via intensity of the platinum mass
signal). Equal amounts of the stock solution and 1-octanol were then shaken mechanically for
1 h. After centrifugation, the phases were split into a 1-octanol and a water phase. While the
water phase was measured with both techniques the organic phase could only be measured
with HPLC. Therefore, the calculation of was performed either directly for HPLC
( ⁄ ) or indirectly for ICP-MS ( ⁄ ;
chapter 1.10). Furthermore, data were also calculated indirectly for HPLC as well. This
approach allows validation of (1) the two different detections techniques (UV/Vis and MS) and
(2) the two different calculation methods of (direct and indirect).
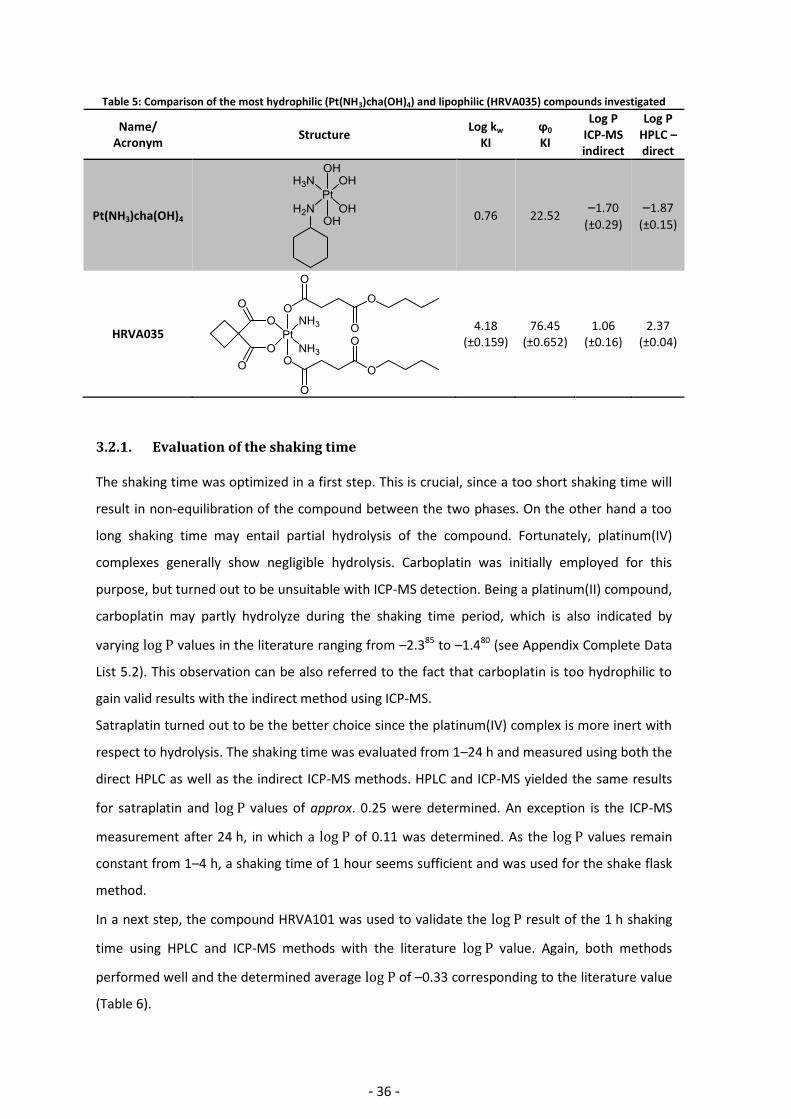
The value was determined for 19 platinum(IV) anticancer drugs, and additionally for four
platinum(II) complexes and five platinum(IV) compounds featuring carboxylic groups. The
compounds were chosen according to their values, covering the entire lipophilicity range
from the most hydrophilic (Pt(NH3)cha(OH)4) to the most lipophilic (HRVA035) compound (see
Table 5). The results are given in Table 8. Furthermore, three reference compounds (carboplatin,
satraplatin and HRVA101) with known value were chosen, in order to validate the shaking
time of the classical shake flask method. These experiments were run in duplicate.
- 36 -
Table 5: Comparison of the most hydrophilic (Pt(NH3)cha(OH)4) and lipophilic (HRVA035) compounds investigated
Name/ Acronym
Structure Log kw
KI ϕ0
KI
Log P ICP-MS indirect
Log P HPLC – direct
Pt(NH3)cha(OH)4
0.76 22.52 –1.70
(±0.29)
–1.87
(±0.15)
HRVA035
4.18
(±0.159)
76.45 (±0.652)
1.06 (±0.16)
2.37 (±0.04)
3.2.1. Evaluation of the shaking time The shaking time was optimized in a first step. This is crucial, since a too short shaking time will
result in non-equilibration of the compound between the two phases. On the other hand a too
long shaking time may entail partial hydrolysis of the compound. Fortunately, platinum(IV)
complexes generally show negligible hydrolysis. Carboplatin was initially employed for this
purpose, but turned out to be unsuitable with ICP-MS detection. Being a platinum(II) compound,
carboplatin may partly hydrolyze during the shaking time period, which is also indicated by
varying values in the literature ranging from –2.385 to –1.480 (see Appendix Complete Data
List 5.2). This observation can be also referred to the fact that carboplatin is too hydrophilic to
gain valid results with the indirect method using ICP-MS.
Satraplatin turned out to be the better choice since the platinum(IV) complex is more inert with
respect to hydrolysis. The shaking time was evaluated from 1–24 h and measured using both the
direct HPLC as well as the indirect ICP-MS methods. HPLC and ICP-MS yielded the same results
for satraplatin and values of approx. 0.25 were determined. An exception is the ICP-MS
measurement after 24 h, in which a of 0.11 was determined. As the values remain
constant from 1–4 h, a shaking time of 1 hour seems sufficient and was used for the shake flask
method.
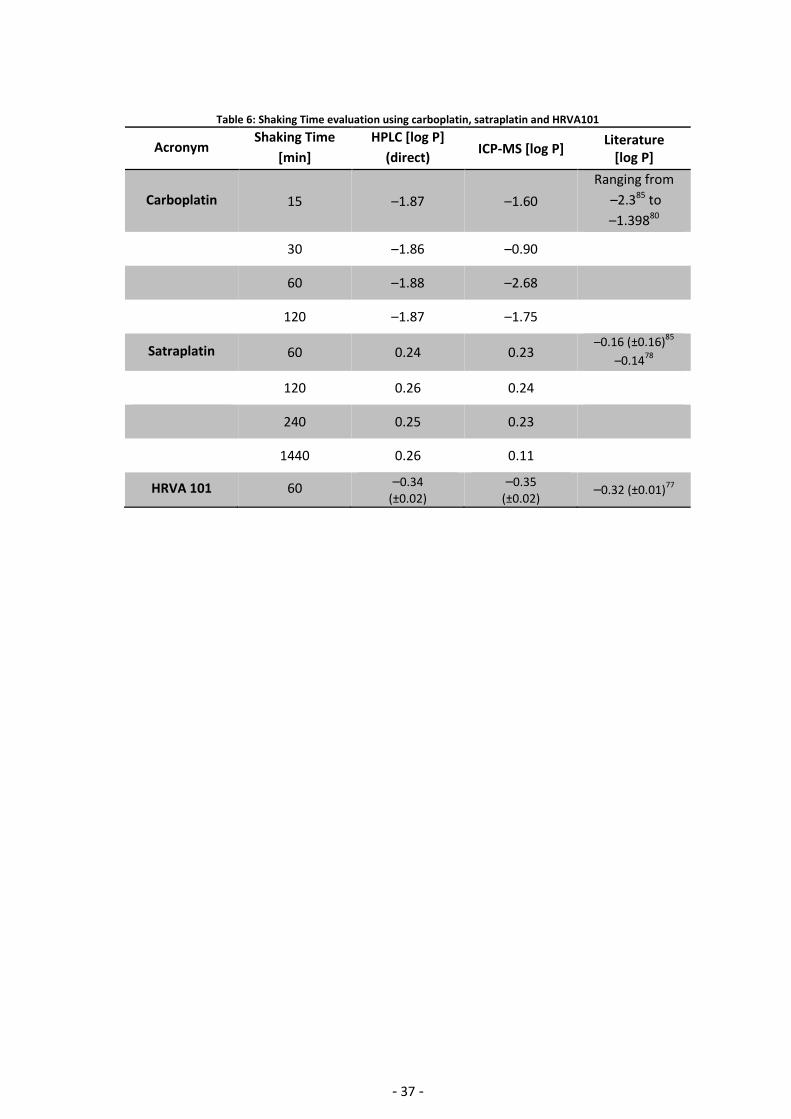
In a next step, the compound HRVA101 was used to validate the result of the 1 h shaking
time using HPLC and ICP-MS methods with the literature value. Again, both methods
performed well and the determined average of –0.33 corresponding to the literature value
(Table 6).
- 37 -
Table 6: Shaking Time evaluation using carboplatin, satraplatin and HRVA101
Acronym Shaking Time
[min]
HPLC [log P]
(direct) ICP-MS [log P]
Literature [log P]
Carboplatin 15 –1.87 –1.60
Ranging from
–2.385 to
–1.39880
30 –1.86 –0.90
60 –1.88 –2.68
120 –1.87 –1.75
Satraplatin 60 0.24 0.23 –0.16 (±0.16)
85
–0.1478
120 0.26 0.24
240 0.25 0.23
1440 0.26 0.11
HRVA 101 60 –0.34
(±0.02)
–0.35
(±0.02) –0.32 (±0.01)
77
- 38 -
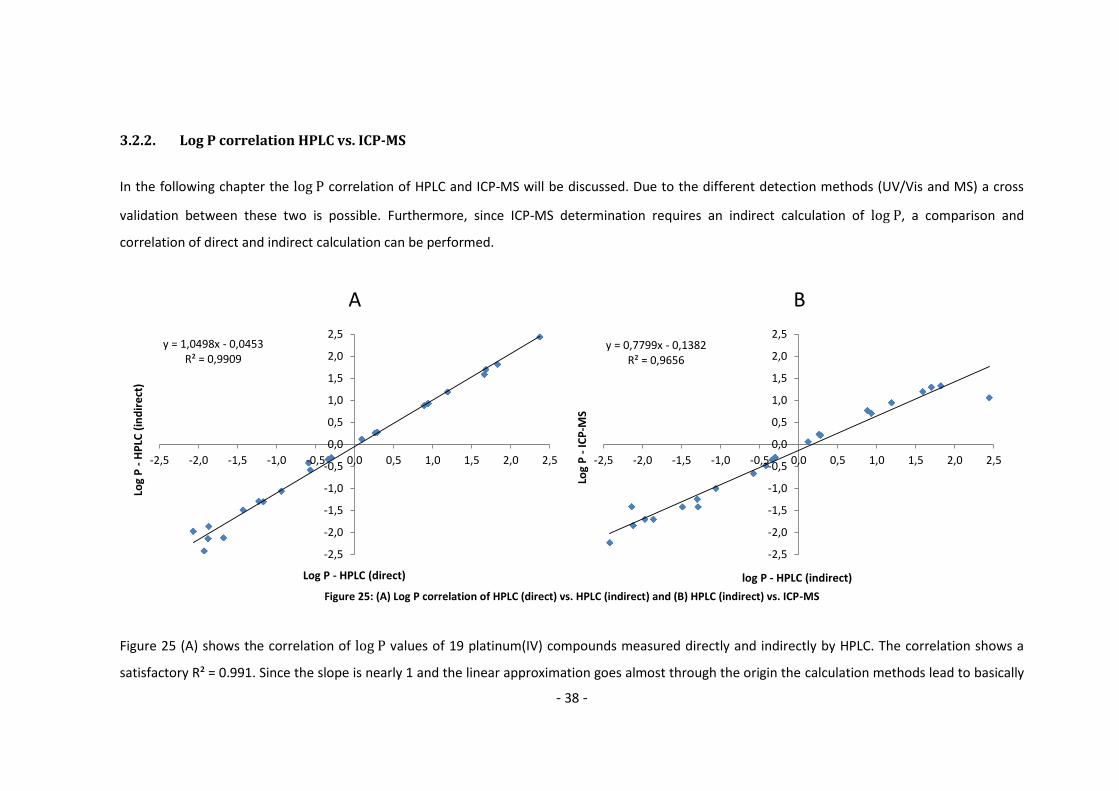
3.2.2. Log P correlation HPLC vs. ICP-MS
In the following chapter the correlation of HPLC and ICP-MS will be discussed. Due to the different detection methods (UV/Vis and MS) a cross
validation between these two is possible. Furthermore, since ICP-MS determination requires an indirect calculation of , a comparison and
correlation of direct and indirect calculation can be performed.
Figure 25: (A) Log P correlation of HPLC (direct) vs. HPLC (indirect) and (B) HPLC (indirect) vs. ICP-MS
Figure 25 (A) shows the correlation of values of 19 platinum(IV) compounds measured directly and indirectly by HPLC. The correlation shows a
satisfactory R² = 0.991. Since the slope is nearly 1 and the linear approximation goes almost through the origin the calculation methods lead to basically
A B
y = 1,0498x - 0,0453R² = 0,9909
-2,5
-2,0
-1,5
-1,0
-0,5
0,0
0,5
1,0
1,5
2,0
2,5
-2,5 -2,0 -1,5 -1,0 -0,5 0,0 0,5 1,0 1,5 2,0 2,5
Log
P -
HP
LC (
ind
ire
ct)
Log P - HPLC (direct)
y = 0,7799x - 0,1382R² = 0,9656
-2,5
-2,0
-1,5
-1,0
-0,5
0,0
0,5
1,0
1,5
2,0
2,5
-2,5 -2,0 -1,5 -1,0 -0,5 0,0 0,5 1,0 1,5 2,0 2,5
Log
P -
ICP
-MS
log P - HPLC (indirect)
- 39 -
the same results. The greatest variances are found for hydrophilic compounds. It seems that the indirect measurement fails to yield accurate results in
particular for hydrophilic substances where the cstock and cwater approach the same value. For lipophilic substances, however, the chromatographic
method remains linear to the most lipophilic substance tested.
Figure 25 (B) shows the correlation of the same compounds for the indirect HPLC and ICP-MS methods. It can be seen that although the correlation is
quite high with R² = 0.966 the results differ from each other quite drastically. A hypothetical of 1.00 for HPLC (indirect) would lead to 0.64 at the
ICP-MS. Again, the indirect method is problematic to a certain extent for hydrophilic compounds. In contrast to the comparison between the direct and
indirect HPLC methods, which were linear for lipophilic compounds, the ICP-MS method seems to level off.
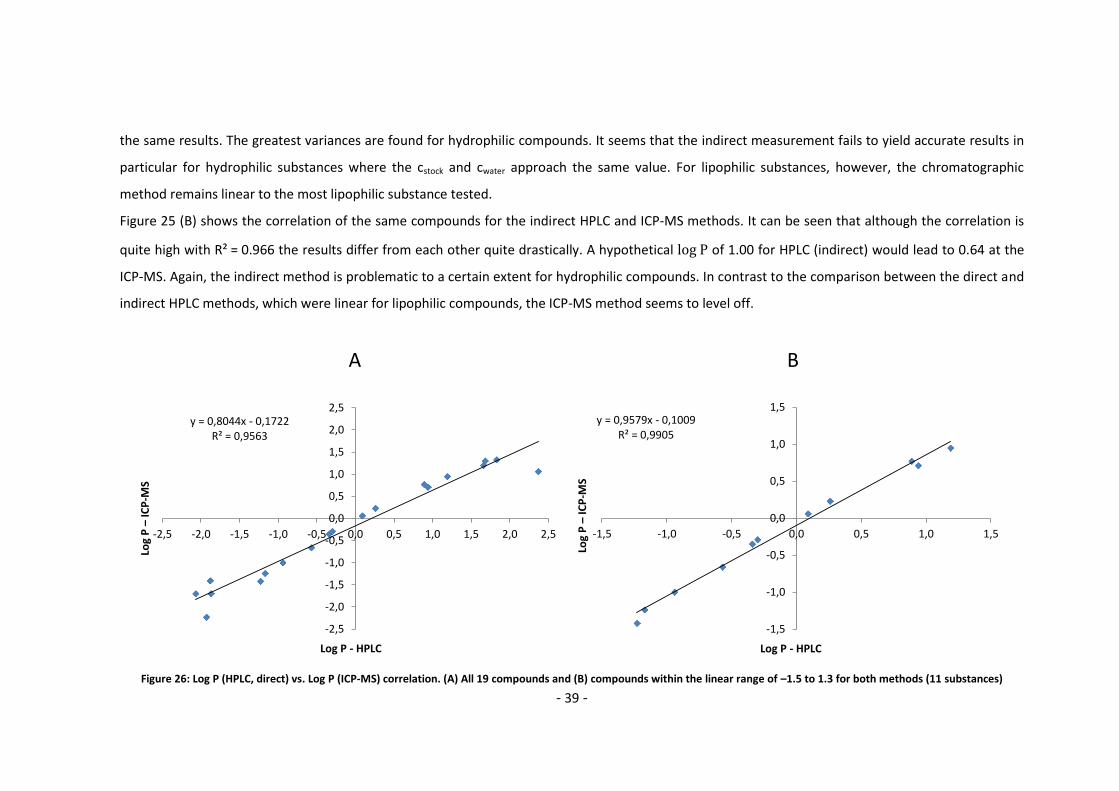
Figure 26: Log P (HPLC, direct) vs. Log P (ICP-MS) correlation. (A) All 19 compounds and (B) compounds within the linear range of –1.5 to 1.3 for both methods (11 substances)
y = 0,8044x - 0,1722R² = 0,9563
-2,5
-2,0
-1,5
-1,0
-0,5
0,0
0,5
1,0
1,5
2,0
2,5
-2,5 -2,0 -1,5 -1,0 -0,5 0,0 0,5 1,0 1,5 2,0 2,5
Log
P –
ICP
-MS
Log P - HPLC
y = 0,9579x - 0,1009R² = 0,9905
-1,5
-1,0
-0,5
0,0
0,5
1,0
1,5
-1,5 -1,0 -0,5 0,0 0,5 1,0 1,5
Log
P –
ICP
-MS
Log P - HPLC
A B
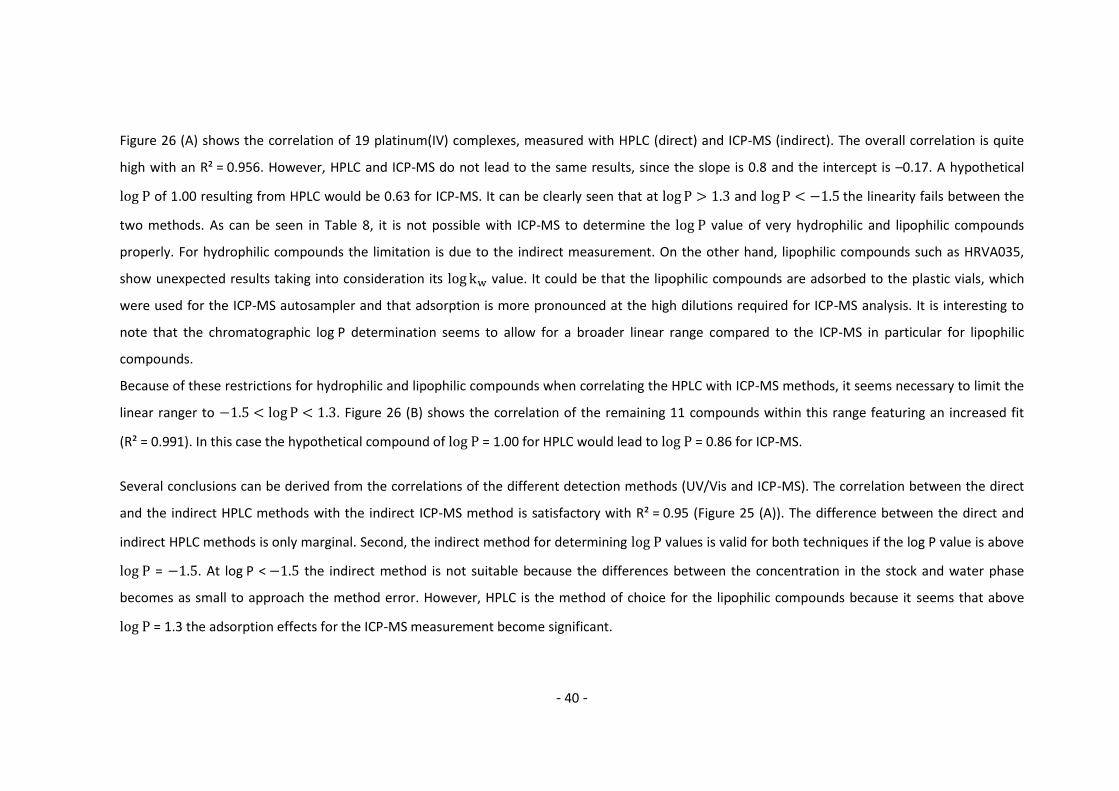
- 40 -
Figure 26 (A) shows the correlation of 19 platinum(IV) complexes, measured with HPLC (direct) and ICP-MS (indirect). The overall correlation is quite
high with an R² = 0.956. However, HPLC and ICP-MS do not lead to the same results, since the slope is 0.8 and the intercept is –0.17. A hypothetical
of 1.00 resulting from HPLC would be 0.63 for ICP-MS. It can be clearly seen that at and the linearity fails between the
two methods. As can be seen in Table 8, it is not possible with ICP-MS to determine the value of very hydrophilic and lipophilic compounds
properly. For hydrophilic compounds the limitation is due to the indirect measurement. On the other hand, lipophilic compounds such as HRVA035,
show unexpected results taking into consideration its value. It could be that the lipophilic compounds are adsorbed to the plastic vials, which
were used for the ICP-MS autosampler and that adsorption is more pronounced at the high dilutions required for ICP-MS analysis. It is interesting to
note that the chromatographic log P determination seems to allow for a broader linear range compared to the ICP-MS in particular for lipophilic
compounds.
Because of these restrictions for hydrophilic and lipophilic compounds when correlating the HPLC with ICP-MS methods, it seems necessary to limit the
linear ranger to . Figure 26 (B) shows the correlation of the remaining 11 compounds within this range featuring an increased fit
(R² = 0.991). In this case the hypothetical compound of = 1.00 for HPLC would lead to = 0.86 for ICP-MS.
Several conclusions can be derived from the correlations of the different detection methods (UV/Vis and ICP-MS). The correlation between the direct
and the indirect HPLC methods with the indirect ICP-MS method is satisfactory with R² = 0.95 (Figure 25 (A)). The difference between the direct and
indirect HPLC methods is only marginal. Second, the indirect method for determining values is valid for both techniques if the log P value is above
= . At log P < the indirect method is not suitable because the differences between the concentration in the stock and water phase
becomes as small to approach the method error. However, HPLC is the method of choice for the lipophilic compounds because it seems that above
= 1.3 the adsorption effects for the ICP-MS measurement become significant.
- 41 -
In practical terms the correlation of both techniques is valid within = –1.5 and 1.3. Within this range, the log P of the indirect ICP-MS method can
be calculated from the direct HPLC method via to following equation:
,
Below values of = –1.5, it is not possible to derive values with ICP-MS and at log P < –2.0 both techniques cannot be recommended. For
values higher than = 1.3, the values determined with ICP-MS seem to reach a plateau, probably due to the fact that lipophilic compounds are
adsorbed on the vials. For HPLC even higher values of = 2.4 can be determined, which corresponds to the most lipophilic substance tested.
In summary, ICP-MS offers a magnitude of roughly 3 units (from –1.5 to 1.3), while HPLC offers a better range of at least 4 magnitudes (from –2.0 to at
least +2.4).
- 42 -
3.2.3. Determination of log D at different pH values – buffer experiments This subchapter investigates five acid complexes at different pH of the water phase commonly referred as buffer experiments. If a compound’s
lipophilicity is depending on the pH of the aqueous solution e.g. due to the existence of an acidic moiety, the value is replaced by the value.
The correct notation is: . Table 7 shows the complete list of the buffers experiments. All buffers were prepared at a final concentration of 10
mmol/L using either phosphate buffer (pH = 7.4, 6.2, 2.5 and 1.7) or acetic acid buffer (pH = 5.6, 4.7, 4.2 and 3.7). The unbuffered water exhibits a pH of
around pH = 6.0, and by dissolving e.g. the component HRVA045B to a final concentration of 0.5 mmol/L the solution has an effective pH of 3.8.
Consequently all the results should be approximately at the same level as the measurement, which is true for all measured complexes,
with slightly deviance for HRVA034 and HRVA026. All experiments were carried out using RP-HPLC and are therefore values measured by the
direct method. In comparison, the unbuffered values are given as well and are marked as , since the exact pH remains unknown but should
be around 3.8.
The compound Lust004 was barely detectable without buffer, since it is very hydrophilic with a of –1.87. However, in our buffer experiments it
was not detectable at all. As reference substance KP2016, which has no acidic group, was used. It resulted throughout the whole measurement at a
constant level between a value of –0.30 and –0.25. The measurements were only performed once.
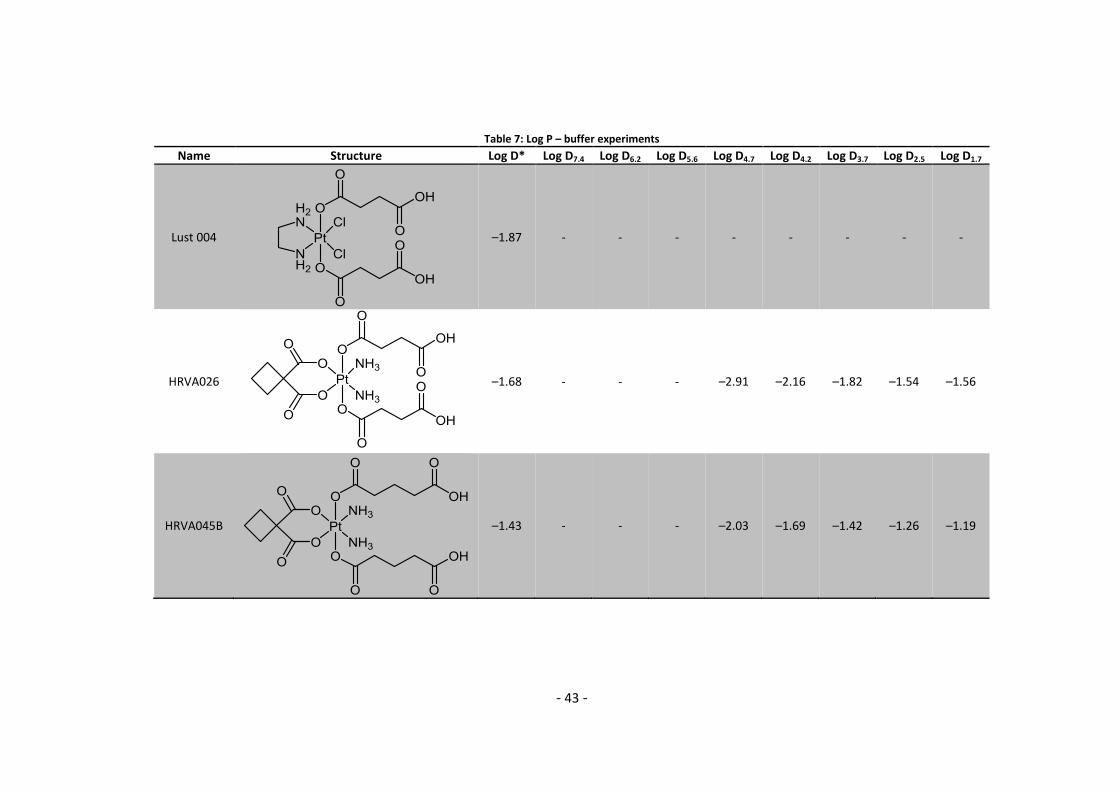
- 43 -
Table 7: Log P – buffer experiments
Name Structure Log D* Log D7.4 Log D6.2 Log D5.6 Log D4.7 Log D4.2 Log D3.7 Log D2.5 Log D1.7
Lust 004
–1.87 - - - - - - - -
HRVA026
–1.68 - - - –2.91 –2.16 –1.82 –1.54 –1.56
HRVA045B
–1.43 - - - –2.03 –1.69 –1.42 –1.26 –1.19
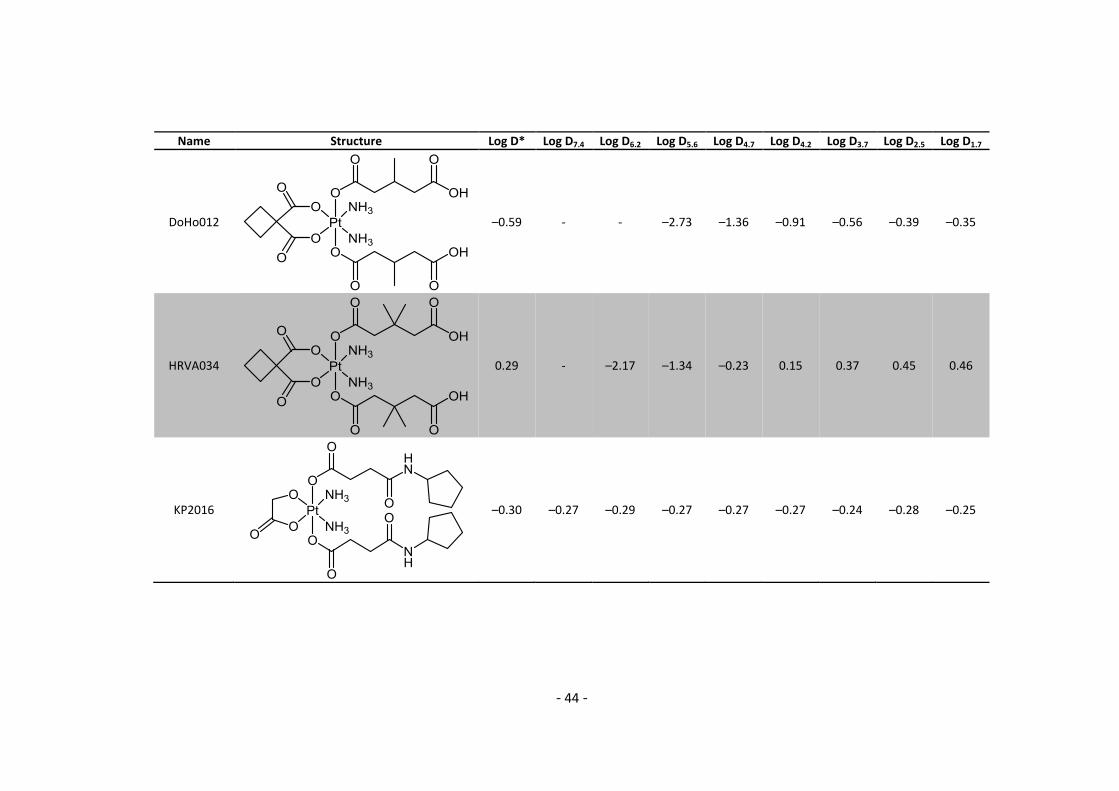
- 44 -
Name Structure Log D* Log D7.4 Log D6.2 Log D5.6 Log D4.7 Log D4.2 Log D3.7 Log D2.5 Log D1.7
DoHo012
–0.59 - - –2.73 –1.36 –0.91 –0.56 –0.39 –0.35
HRVA034
0.29 - –2.17 –1.34 –0.23 0.15 0.37 0.45 0.46
KP2016
–0.30 –0.27 –0.29 –0.27 –0.27 –0.27 –0.24 –0.28 –0.25
- 45 -
3.3. Evaluation of log kw, φ0 and log P with regard to their applicability to characterize the lipophilicity of platinum(IV) anticancer agents
Table 8 features the chromatographic and values, which are calculated with uracil (U) or KI as dead time markers. Moreover, three different
values are shown. The first was determined by ICP-MS using the indirect method. The second and the third was determined by RP-HPLC
using the direct and indirect method, respectively. The values of several platinum(II) complexes were determined, i.e. cisplatin, carboplatin,
oxaliplatin and Pt(NH3)2chaCl2. The investigated platinum(II) compounds show a very hydrophilic character and accurate values were only
obtained for Pt(NH3)2chaCl2. The retention times of these compounds were in general very close to the dead time markers. Carboplatin, oxaliplatin and
Pt(NH3)2chaCl2 showed values in the range of roughly –2.0 to 0 analyzed by HPLC and ICP-MS, while the of cisplatin could not be obtained. It
was not possible to determine values below –1.5 by ICP-MS. The only platinum(II) compound which could be measured properly with ICP-MS was
Pt(NH3)2chaCl2. This may be due to the limitation of the indirect calculation method, which fails to calculate a value if the stock solution is
approximately of the same concentration as the water phase. For instance, carboplatin has a very high standard deviation of ±0.65. It is most likely that
these compounds lay on the edge or even beyond the method range for both values – via HPLC and via ICP-MS. In general, HPLC shows
lower standard deviation of the values compared with ICP-MS. This can be an effect of the indirect method.
One crucial point for metal based complexes is hydrolysis. Platinum(IV) complexes are claimed to be stable, whereas platinum(II) complexes can
undergo rapid loss of their leaving groups followed by formation of the respective aqua complexes. These are usually charged and therefore, more
hydrophilic, which results in an enrichment in the water phase and lead to incorrect results. Hence, the measurement will result in a mean value
of all generated species. Therefore the values measured for platinum(II) complexes using ICP-MS have to be treated with caution. An indication for this
phenomenon is that literature values differ significantly for identical compounds. For example carboplatin shows values from –2.385 to –1.39880.
More literature results are given in Appendix 5.2 Complete Data List.
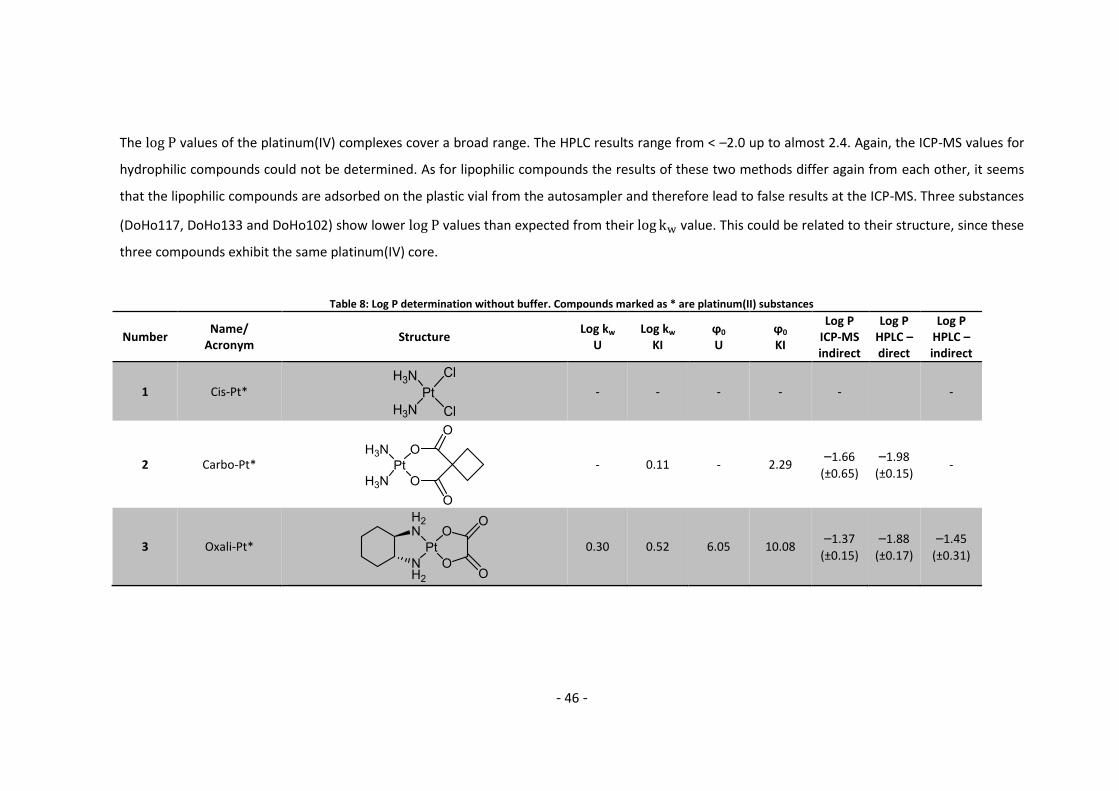
- 46 -
The values of the platinum(IV) complexes cover a broad range. The HPLC results range from < –2.0 up to almost 2.4. Again, the ICP-MS values for
hydrophilic compounds could not be determined. As for lipophilic compounds the results of these two methods differ again from each other, it seems
that the lipophilic compounds are adsorbed on the plastic vial from the autosampler and therefore lead to false results at the ICP-MS. Three substances
(DoHo117, DoHo133 and DoHo102) show lower values than expected from their value. This could be related to their structure, since these
three compounds exhibit the same platinum(IV) core.
Table 8: Log P determination without buffer. Compounds marked as * are platinum(II) substances
Number Name/
Acronym Structure
Log kw
U Log kw
KI ϕ0
U ϕ0
KI
Log P ICP-MS indirect
Log P HPLC – direct
Log P HPLC – indirect
1 Cis-Pt*
- - - - - -
2 Carbo-Pt*
- 0.11 - 2.29 –1.66
(±0.65)
–1.98
(±0.15) -
3 Oxali-Pt*
0.30 0.52 6.05 10.08 –1.37
(±0.15)
–1.88
(±0.17)
–1.45
(±0.31)
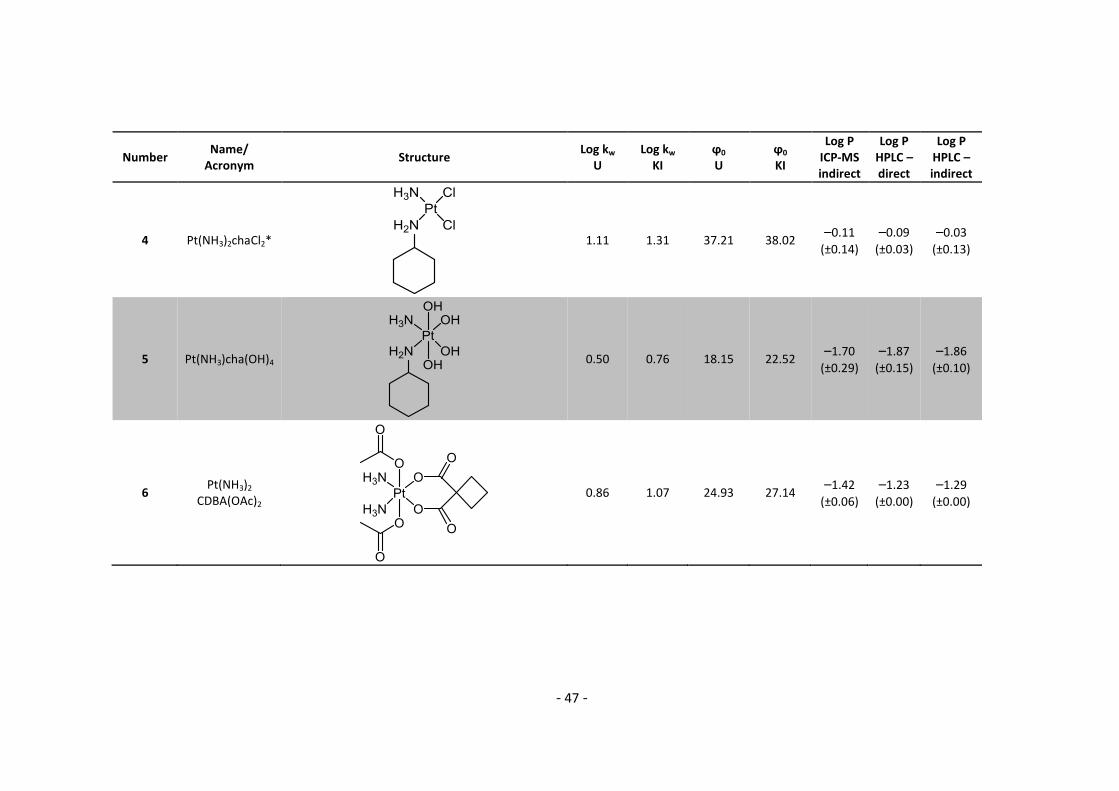
- 47 -
Number Name/
Acronym Structure
Log kw
U Log kw
KI ϕ0
U ϕ0
KI
Log P ICP-MS indirect
Log P HPLC – direct
Log P HPLC – indirect
4 Pt(NH3)2chaCl2*
1.11 1.31 37.21 38.02 –0.11
(±0.14)
–0.09
(±0.03)
–0.03
(±0.13)
5 Pt(NH3)cha(OH)4
0.50 0.76 18.15 22.52 –1.70
(±0.29)
–1.87
(±0.15)
–1.86
(±0.10)
6 Pt(NH3)2
CDBA(OAc)2
0.86 1.07 24.93 27.14 –1.42
(±0.06)
–1.23
(±0.00)
–1.29
(±0.00)
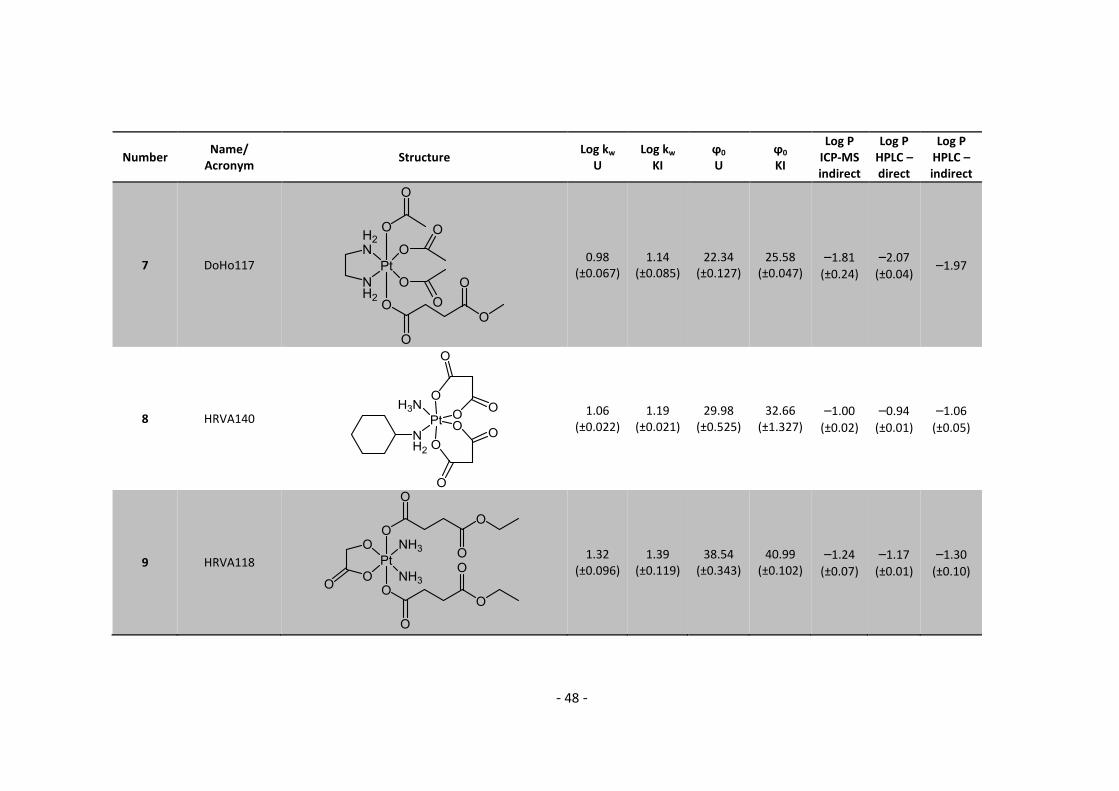
- 48 -
Number Name/
Acronym Structure
Log kw
U Log kw
KI ϕ0
U ϕ0
KI
Log P ICP-MS indirect
Log P HPLC – direct
Log P HPLC – indirect
7 DoHo117
0.98 (±0.067)
1.14
(±0.085)
22.34 (±0.127)
25.58 (±0.047)
–1.81
(±0.24)
–2.07
(±0.04) –1.97
8 HRVA140
1.06
(±0.022)
1.19 (±0.021)
29.98 (±0.525)
32.66 (±1.327)
–1.00
(±0.02)
–0.94
(±0.01)
–1.06
(±0.05)
9 HRVA118
1.32
(±0.096)
1.39
(±0.119)
38.54 (±0.343)
40.99 (±0.102)
–1.24
(±0.07)
–1.17
(±0.01)
–1.30
(±0.10)
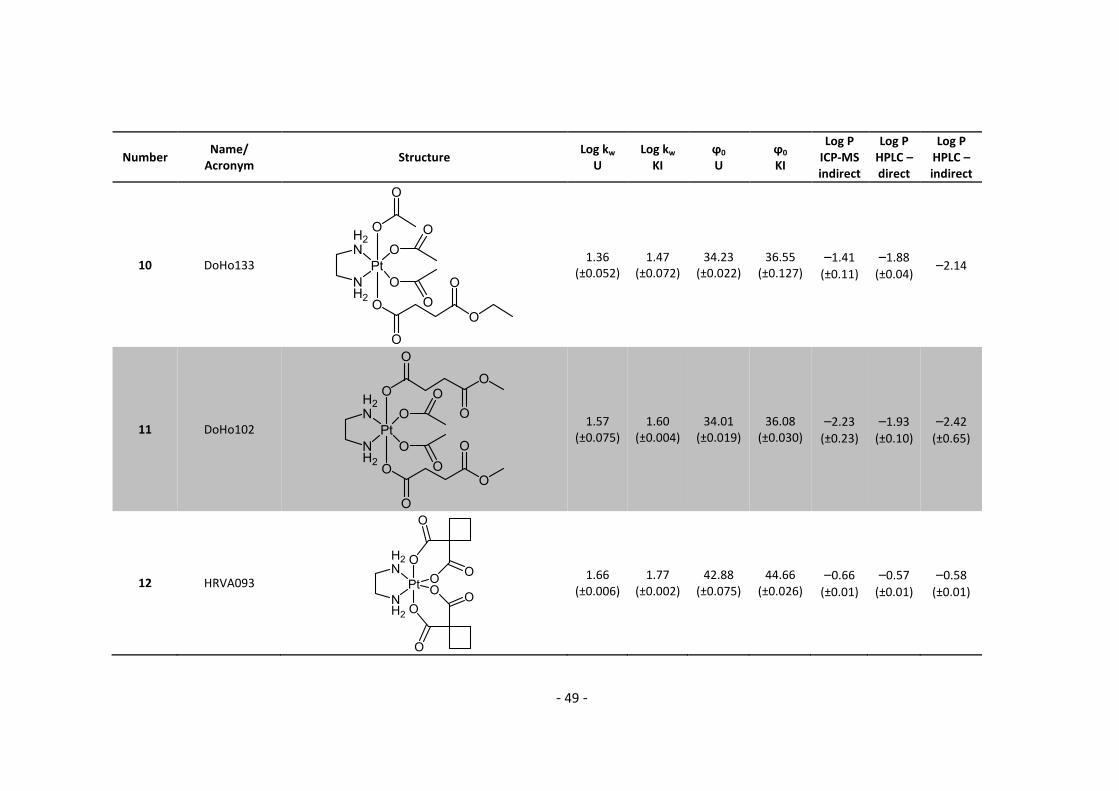
- 49 -
Number Name/
Acronym Structure
Log kw
U Log kw
KI ϕ0
U ϕ0
KI
Log P ICP-MS indirect
Log P HPLC – direct
Log P HPLC – indirect
10 DoHo133
1.36
(±0.052)
1.47
(±0.072)
34.23 (±0.022)
36.55 (±0.127)
–1.41
(±0.11)
–1.88
(±0.04) –2.14
11 DoHo102
1.57
(±0.075)
1.60
(±0.004)
34.01 (±0.019)
36.08 (±0.030)
–2.23
(±0.23)
–1.93
(±0.10)
–2.42
(±0.65)
12 HRVA093
1.66 (±0.006)
1.77 (±0.002)
42.88 (±0.075)
44.66 (±0.026)
–0.66
(±0.01)
–0.57
(±0.01)
–0.58
(±0.01)
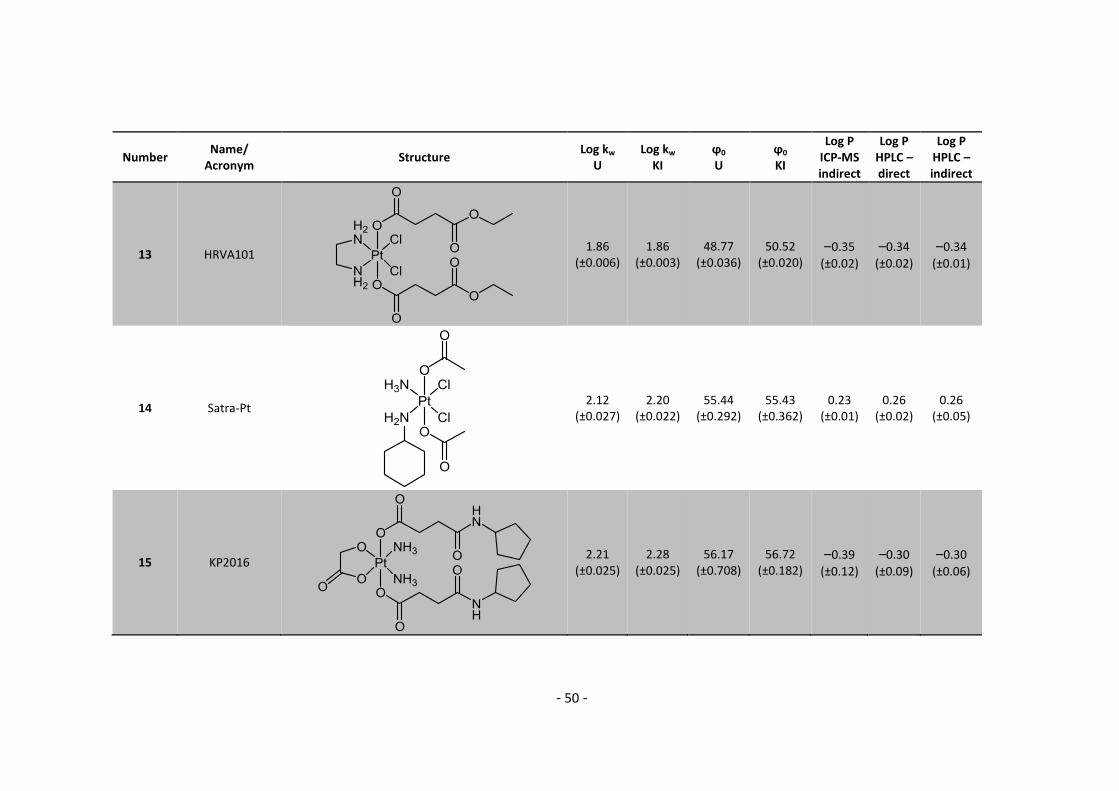
- 50 -
Number Name/
Acronym Structure
Log kw
U Log kw
KI ϕ0
U ϕ0
KI
Log P ICP-MS indirect
Log P HPLC – direct
Log P HPLC – indirect
13 HRVA101
1.86
(±0.006)
1.86
(±0.003)
48.77 (±0.036)
50.52 (±0.020)
–0.35
(±0.02)
–0.34
(±0.02)
–0.34
(±0.01)
14 Satra-Pt
2.12
(±0.027)
2.20 (±0.022)
55.44 (±0.292)
55.43 (±0.362)
0.23 (±0.01)
0.26 (±0.02)
0.26 (±0.05)
15 KP2016
2.21 (±0.025)
2.28 (±0.025)
56.17 (±0.708)
56.72 (±0.182)
–0.39
(±0.12)
–0.30
(±0.09)
–0.30
(±0.06)
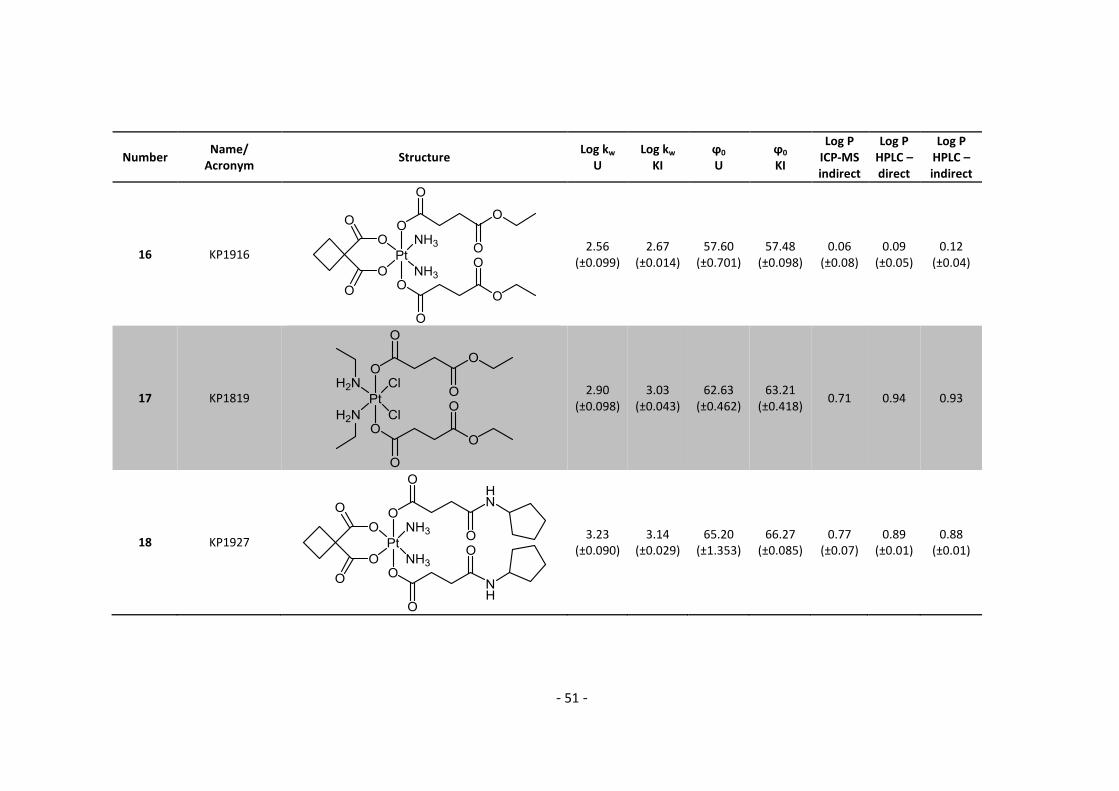
- 51 -
Number Name/
Acronym Structure
Log kw
U Log kw
KI ϕ0
U ϕ0
KI
Log P ICP-MS indirect
Log P HPLC – direct
Log P HPLC – indirect
16 KP1916
2.56
(±0.099)
2.67
(±0.014)
57.60 (±0.701)
57.48 (±0.098)
0.06 (±0.08)
0.09 (±0.05)
0.12 (±0.04)
17 KP1819
2.90 (±0.098)
3.03 (±0.043)
62.63 (±0.462)
63.21 (±0.418)
0.71 0.94 0.93
18 KP1927
3.23
(±0.090)
3.14 (±0.029)
65.20 (±1.353)
66.27 (±0.085)
0.77 (±0.07)
0.89 (±0.01)
0.88 (±0.01)
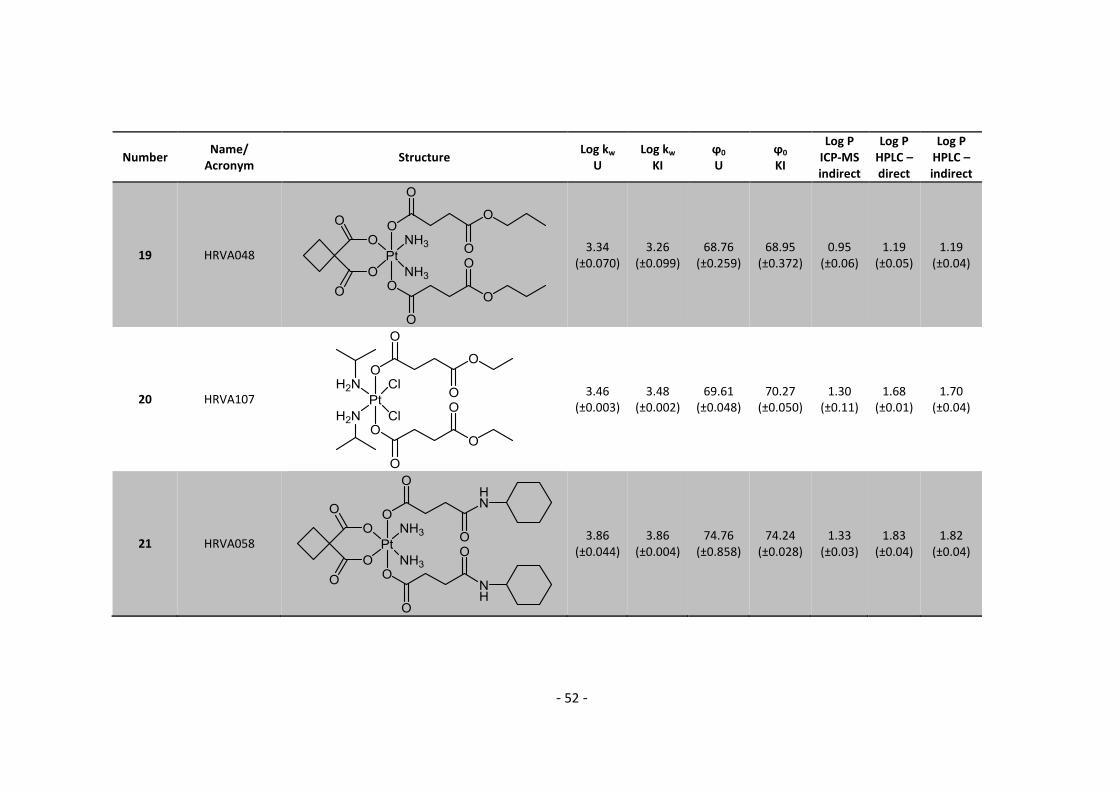
- 52 -
Number Name/
Acronym Structure
Log kw
U Log kw
KI ϕ0
U ϕ0
KI
Log P ICP-MS indirect
Log P HPLC – direct
Log P HPLC – indirect
19 HRVA048
3.34 (±0.070)
3.26
(±0.099)
68.76 (±0.259)
68.95 (±0.372)
0.95 (±0.06)
1.19 (±0.05)
1.19 (±0.04)
20 HRVA107
3.46
(±0.003)
3.48 (±0.002)
69.61 (±0.048)
70.27 (±0.050)
1.30 (±0.11)
1.68 (±0.01)
1.70 (±0.04)
21 HRVA058
3.86
(±0.044)
3.86
(±0.004)
74.76 (±0.858)
74.24 (±0.028)
1.33 (±0.03)
1.83 (±0.04)
1.82 (±0.04)
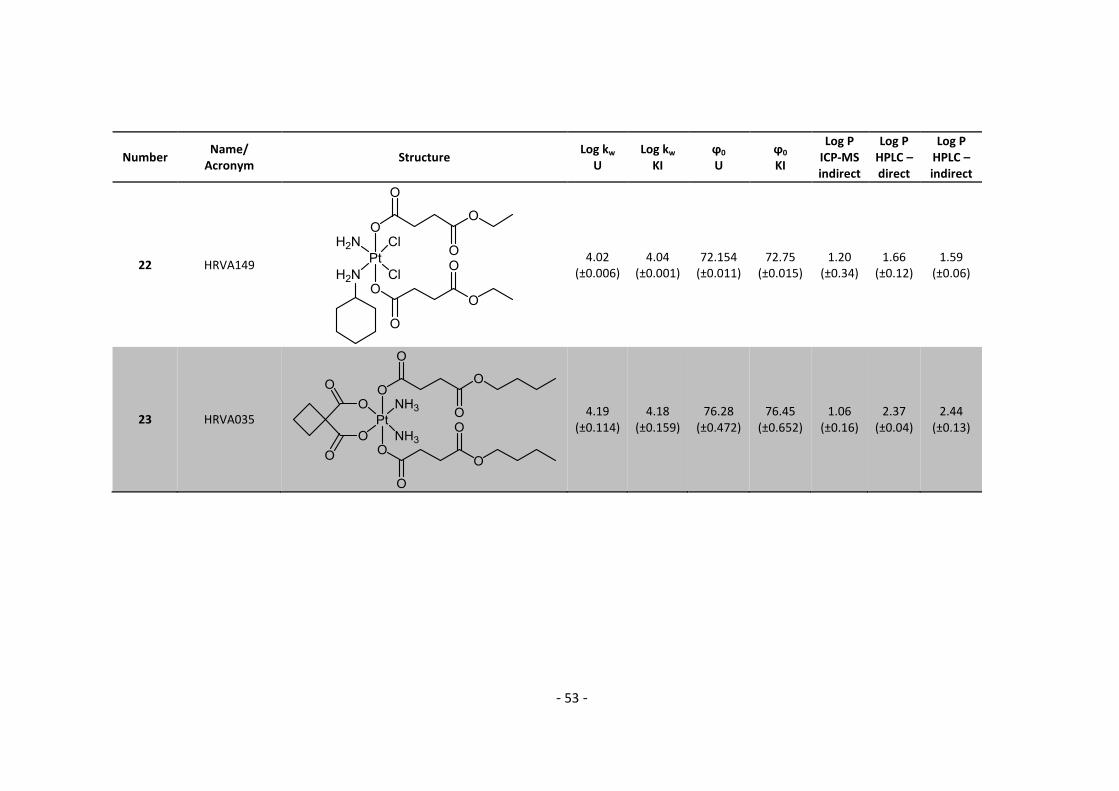
- 53 -
Number Name/
Acronym Structure
Log kw
U Log kw
KI ϕ0
U ϕ0
KI
Log P ICP-MS indirect
Log P HPLC – direct
Log P HPLC – indirect
22 HRVA149
4.02
(±0.006)
4.04
(±0.001)
72.154 (±0.011)
72.75 (±0.015)
1.20 (±0.34)
1.66 (±0.12)
1.59 (±0.06)
23 HRVA035
4.19
(±0.114)
4.18
(±0.159)
76.28 (±0.472)
76.45 (±0.652)
1.06 (±0.16)
2.37 (±0.04)
2.44 (±0.13)
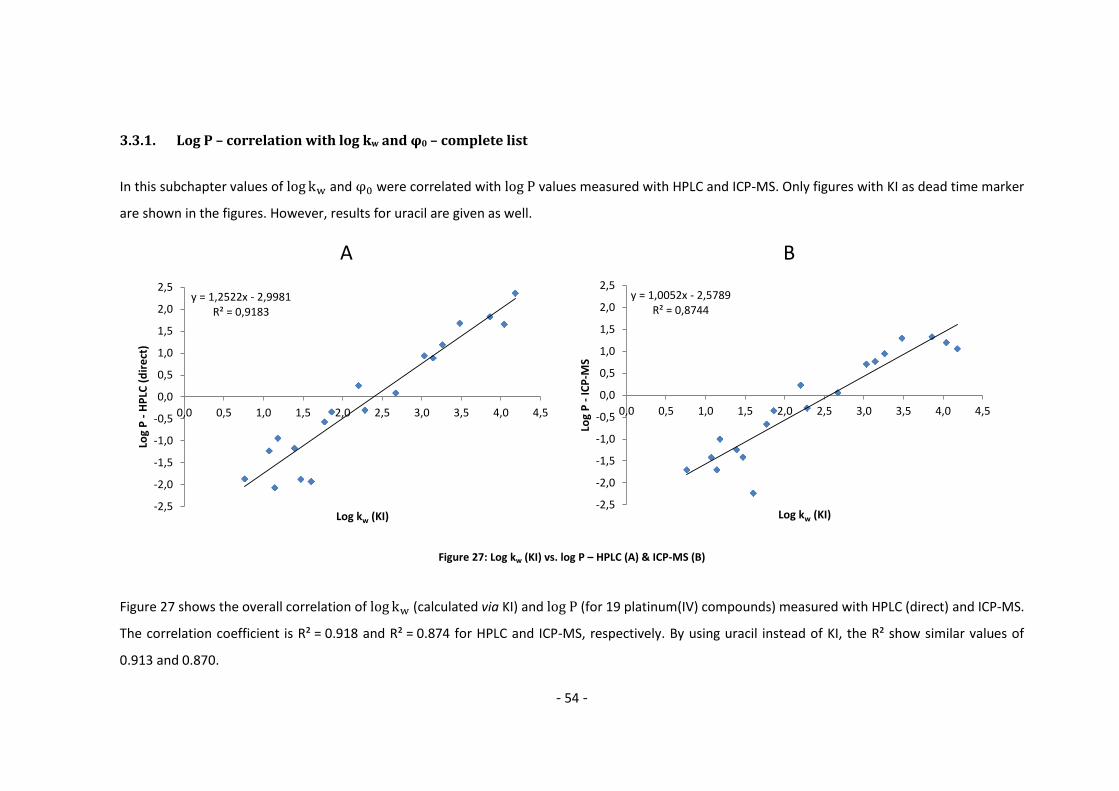
- 54 -
3.3.1. Log P – correlation with log kw and φ0 – complete list
In this subchapter values of and were correlated with values measured with HPLC and ICP-MS. Only figures with KI as dead time marker
are shown in the figures. However, results for uracil are given as well.
Figure 27: Log kw (KI) vs. log P – HPLC (A) & ICP-MS (B)
Figure 27 shows the overall correlation of (calculated via KI) and (for 19 platinum(IV) compounds) measured with HPLC (direct) and ICP-MS.
The correlation coefficient is R² = 0.918 and R² = 0.874 for HPLC and ICP-MS, respectively. By using uracil instead of KI, the R² show similar values of
0.913 and 0.870.
A B
y = 1,2522x - 2,9981R² = 0,9183
-2,5
-2,0
-1,5
-1,0
-0,5
0,0
0,5
1,0
1,5
2,0
2,5
0,0 0,5 1,0 1,5 2,0 2,5 3,0 3,5 4,0 4,5
Log
P -
HP
LC (
dir
ect
)
Log kw (KI)
y = 1,0052x - 2,5789R² = 0,8744
-2,5
-2,0
-1,5
-1,0
-0,5
0,0
0,5
1,0
1,5
2,0
2,5
0,0 0,5 1,0 1,5 2,0 2,5 3,0 3,5 4,0 4,5
Log
P -
ICP
-MS
Log kw (KI)
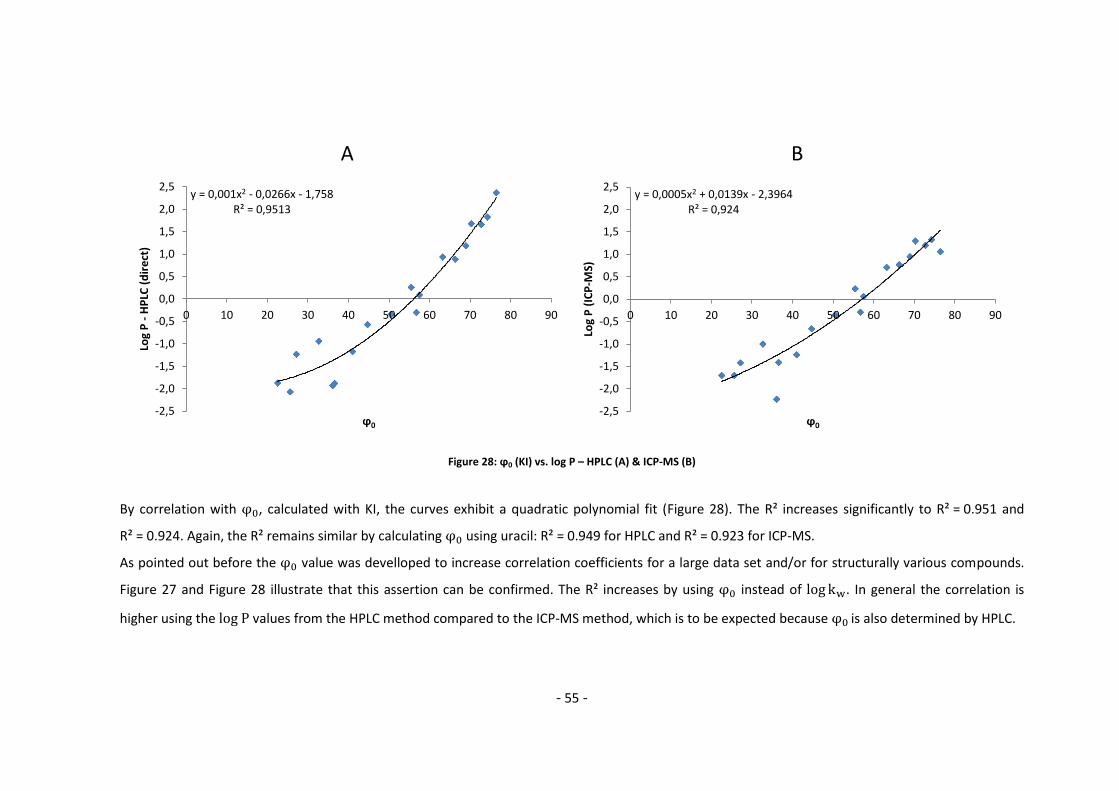
- 55 -
Figure 28: ϕ0 (KI) vs. log P – HPLC (A) & ICP-MS (B)
By correlation with , calculated with KI, the curves exhibit a quadratic polynomial fit (Figure 28). The R² increases significantly to R² = 0.951 and
R² = 0.924. Again, the R² remains similar by calculating using uracil: R² = 0.949 for HPLC and R² = 0.923 for ICP-MS.
As pointed out before the value was develloped to increase correlation coefficients for a large data set and/or for structurally various compounds.
Figure 27 and Figure 28 illustrate that this assertion can be confirmed. The R² increases by using instead of . In general the correlation is
higher using the values from the HPLC method compared to the ICP-MS method, which is to be expected because is also determined by HPLC.
A B
y = 0,001x2 - 0,0266x - 1,758R² = 0,9513
-2,5
-2,0
-1,5
-1,0
-0,5
0,0
0,5
1,0
1,5
2,0
2,5
0 10 20 30 40 50 60 70 80 90
Log
P -
HP
LC (
dir
ect
)
ϕ0
y = 0,0005x2 + 0,0139x - 2,3964R² = 0,924
-2,5
-2,0
-1,5
-1,0
-0,5
0,0
0,5
1,0
1,5
2,0
2,5
0 10 20 30 40 50 60 70 80 90
Log
P (
ICP
-MS)
ϕ0

- 56 -
3.3.2. Log P – correlation with log kw and φ0 – adjusted list
Since the values of the three most lipophilic compounds seem to reach a plateau with ICP-MS they were excluded from the correlation with
measured with ICP-MS. Also, the indirect method has difficulties with hydrophilic compounds as pointed out above and consequently, the three most
hydrophilic compounds (DoHo102, 117, 133) were excluded for both the HPLC and ICP-MS methods. Therefore, 16 compounds for HPLC and 13
compounds for ICP-MS were correlated. The exclusion of these borderline compounds leads to a significant improvement of the R2-factor in particular
for the ICP-MS method and underlines that the correlation is linear between and . By using uracil as a dead time marker instead of KI the
correlation improves further to R² = 0.969 and R² = 0.963 for the HPLC and the ICP-MS methods, respectively.
Figure 29: Log kw (KI) vs. log P – HPLC (A) & ICP-MS (B) – adjusted list
A B
y = 1,1281x - 2,5515R² = 0,9672
-2,5
-2,0
-1,5
-1,0
-0,5
0,0
0,5
1,0
1,5
2,0
2,5
0,0 0,5 1,0 1,5 2,0 2,5 3,0 3,5 4,0 4,5
Log
P –
HP
LC (
dir
ect
)
Log kw
y = 1,0481x - 2,4679R² = 0,9618
-2,5
-2,0
-1,5
-1,0
-0,5
0,0
0,5
1,0
1,5
2,0
2,5
0,0 0,5 1,0 1,5 2,0 2,5 3,0 3,5 4,0 4,5
Log
P –
ICP
-MS
Log kw
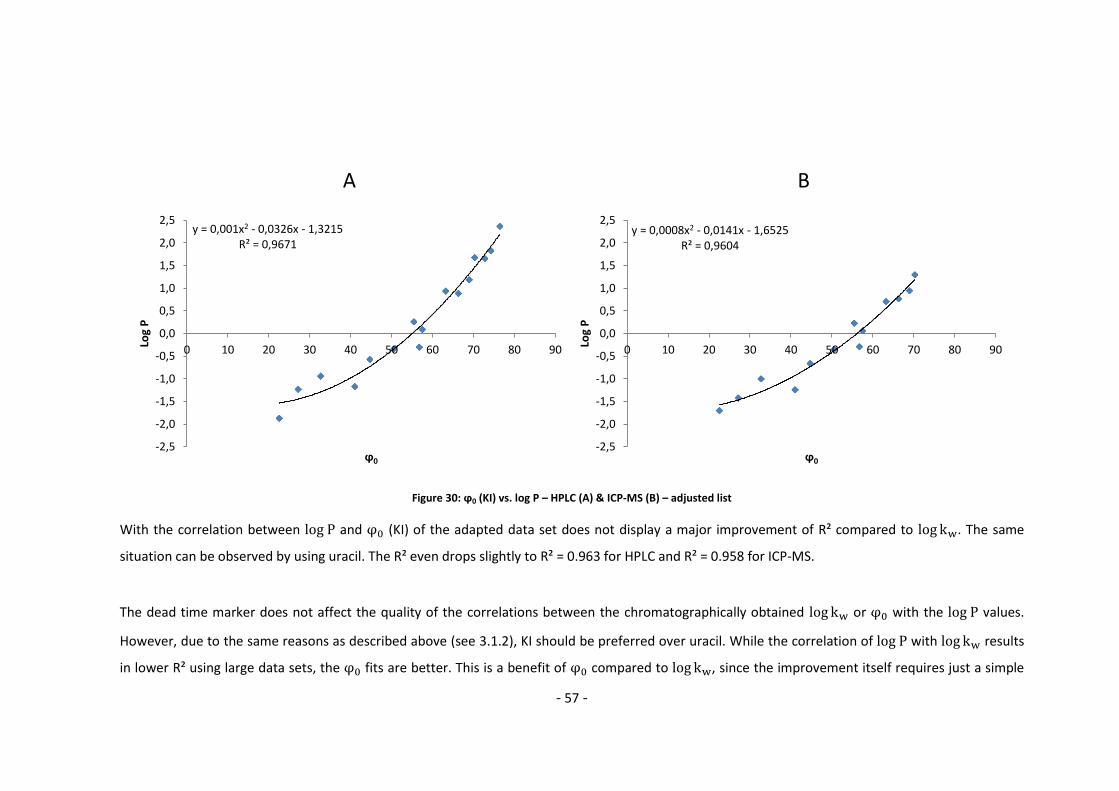
- 57 -
Figure 30: ϕ0 (KI) vs. log P – HPLC (A) & ICP-MS (B) – adjusted list
With the correlation between and (KI) of the adapted data set does not display a major improvement of R² compared to . The same
situation can be observed by using uracil. The R² even drops slightly to R² = 0.963 for HPLC and R² = 0.958 for ICP-MS.
The dead time marker does not affect the quality of the correlations between the chromatographically obtained or with the values.
However, due to the same reasons as described above (see 3.1.2), KI should be preferred over uracil. While the correlation of with results
in lower R² using large data sets, the fits are better. This is a benefit of compared to , since the improvement itself requires just a simple
A B
y = 0,001x2 - 0,0326x - 1,3215R² = 0,9671
-2,5
-2,0
-1,5
-1,0
-0,5
0,0
0,5
1,0
1,5
2,0
2,5
0 10 20 30 40 50 60 70 80 90Log
P
ϕ0
y = 0,0008x2 - 0,0141x - 1,6525R² = 0,9604
-2,5
-2,0
-1,5
-1,0
-0,5
0,0
0,5
1,0
1,5
2,0
2,5
0 10 20 30 40 50 60 70 80 90Log
P
ϕ0
- 58 -
calculation. Nevertheless the advantage of being capable to correlate larger data sets diminishes by using fewer samples or structurally related
compounds. The three DoHo (except DoHo102) substances exhibit a complete different core structures compared to all the other compounds. While
most compounds feature a carbo-, ipro-, or satraplatin core, the DoHo substances exhibit an ethylenediamine (en) core structure with aceto groups.
Summarized, the “classical” shake flask method exhibits a magnitude of around 6 orders, ranging from –2 up to at least 4, according to the OECD
guidelines.73 However, there are several drawbacks to this method with regard to metal-based anticancer agents. Hydrolysis of the metallodrugs may
be the most crucial point to mention because the method requires a shaking time of 1 h. Partial hydrolysis during this time period would amount to an
increased concentration in the water phase and therefore a false result. Moreover, the shake-flask method itself is susceptible to impurities of the
samples.
In this work the HPLC (UV/Vis) and ICP-MS detection techniques were investigated to determine of 19 platinum(IV) anticancer agents (Table 9).
The HPLC method comprises a high dynamic range of from –2.0 up to at least 2.4. It is less prone to impurities, since the calculation is based on
the area values of eluting peaks and is therefore recommended. However, since 1-octanol has a higher back pressure and interacts more strongly with
the C18 surface a gradient method is required to wash off all 1-octanol remaining in the column after the injection, which is time consuming.
ICP-MS offers a limited dynamic range of from–1.5 up to 1.3. The lower limit is due to the indirect calculation method, and the upper limit is
probably caused by adsorption of the lipophilic compounds to the plastic tube during the dilution process. Furthermore, the sample preparation takes
more time compared to HPLC, since the dilution was done gravimetrically. On the other hand, once prepared, the ICP-MS measurement requires only 5
min for stock and water solution of one compound.
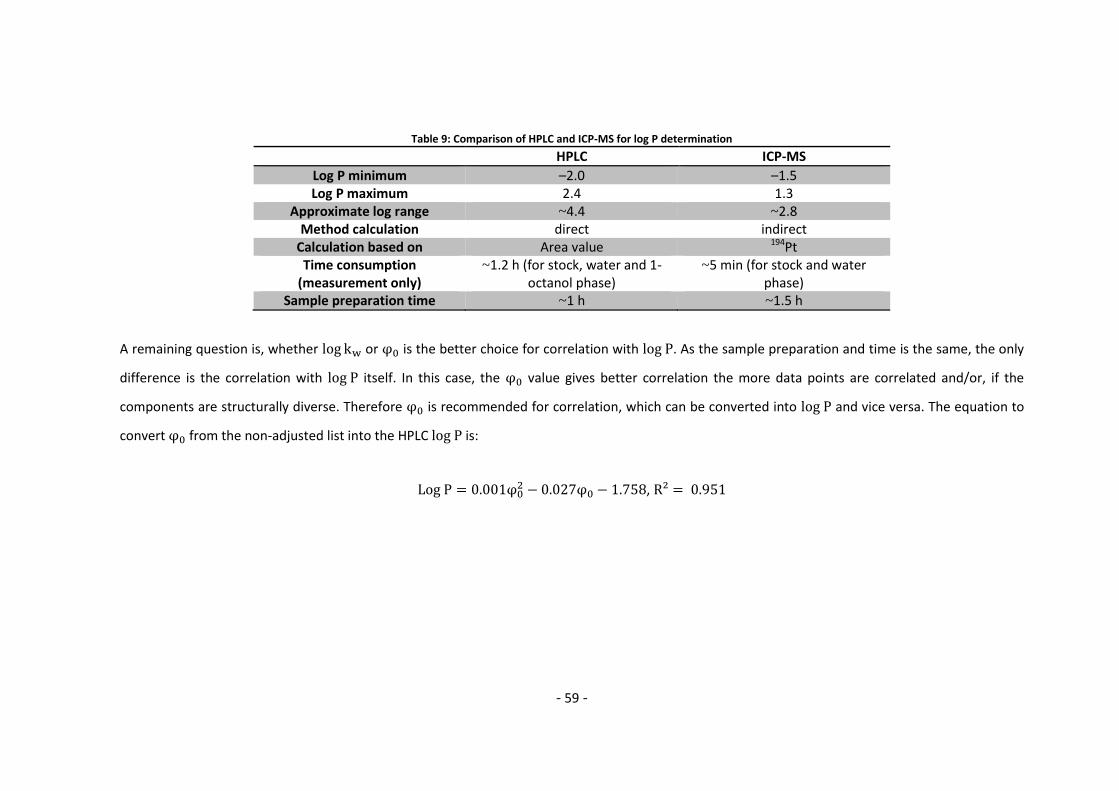
- 59 -
Table 9: Comparison of HPLC and ICP-MS for log P determination
HPLC ICP-MS
Log P minimum –2.0 –1.5 Log P maximum 2.4 1.3
Approximate log range ~4.4 ~2.8 Method calculation direct indirect
Calculation based on Area value 194Pt Time consumption
(measurement only) ~1.2 h (for stock, water and 1-
octanol phase) ~5 min (for stock and water
phase) Sample preparation time ~1 h ~1.5 h
A remaining question is, whether or is the better choice for correlation with . As the sample preparation and time is the same, the only
difference is the correlation with itself. In this case, the value gives better correlation the more data points are correlated and/or, if the
components are structurally diverse. Therefore is recommended for correlation, which can be converted into and vice versa. The equation to
convert from the non-adjusted list into the HPLC is:
,
- 60 -
4. Conclusion and Outlook
The aim of this master thesis was the evaluation of analytical methods using RP-HPLC and ICP-
MS to determine the lipophilicity of platinum(IV) anticancer drugs. In contrast to platinum(II)
cytostatics, platinum(IV) complexes may be administered orally due to their higher inertness of
ligand exchange reactions. Oral administration requires the crossing of cell membranes or tight
junctions of the drug in order to reach the blood stream. Therefore, the lipophilicity is a crucial
property of every platinum(IV) compound and has a direct impact on the pharmacokinetics. The
classical way to measure the lipophilicity of compounds is by the ‘shake flask’ method. This
method features a bilayer of 1-octanol and water phases, where the concentration of a
substance is measured after reaching an equilibrium distribution. This distribution is reported as
the value. However, this method has several drawbacks, for instance the long sample
preparation, low sample throughput and most importantly possible hydrolysis of analytes during
the shaking time, which alters the lipophilicity of the compounds. In order to avoid these
drawbacks two chromatographic parameters to measure the lipophilicity, namely and
, have been evaluated as well. Although the measurements are equally time
consuming compared to experiments, there is no further sample preparation needed and
the measurement may run completely automatized.
Log P values derived from HPLC and ICP-MS, show high correlation within a range of
to . Within this range, it does not matter if the is calculated via the direct
( ⁄ ) or indirect ( ⁄ HPLC method.
Below values of it is not possible to measure log P values with ICP-MS, whereas
with HPLC values can be measured down to . This is mainly due to the indirect
method, which becomes problematic as the concentrations in the stock solution and in water
approaches each other. For values higher than , ICP-MS seems to reach a plateau
due to adsorption effects. HPLC, however, exhibits linearity at least up to .
Two substances (uracil and KI) were investigated as dead time markers for the determination of
and . Two major differences could be observed. First, KI features an almost constant
retention time at different percentages of the organic modifier, while uracil does not. Second,
the retention time of KI is shorter at all mobile phase compositions compared to uracil.
Therefore, KI allows the determination of more hydrophilic compounds compared to uracil and
KI is generally recommended for future measurements.
- 61 -
- and values were derived by RP-HPLC using KI and uracil as dead time marker. The
values display a better correlation than . Since values ranging from 14 to 76
could be easily derived, the values cover a broad lipophilicity range equal to about 4
orders. Additionally, does not feature any disadvantages from indirect measurements or
adsorption effects compared to determination using ICP-MS.
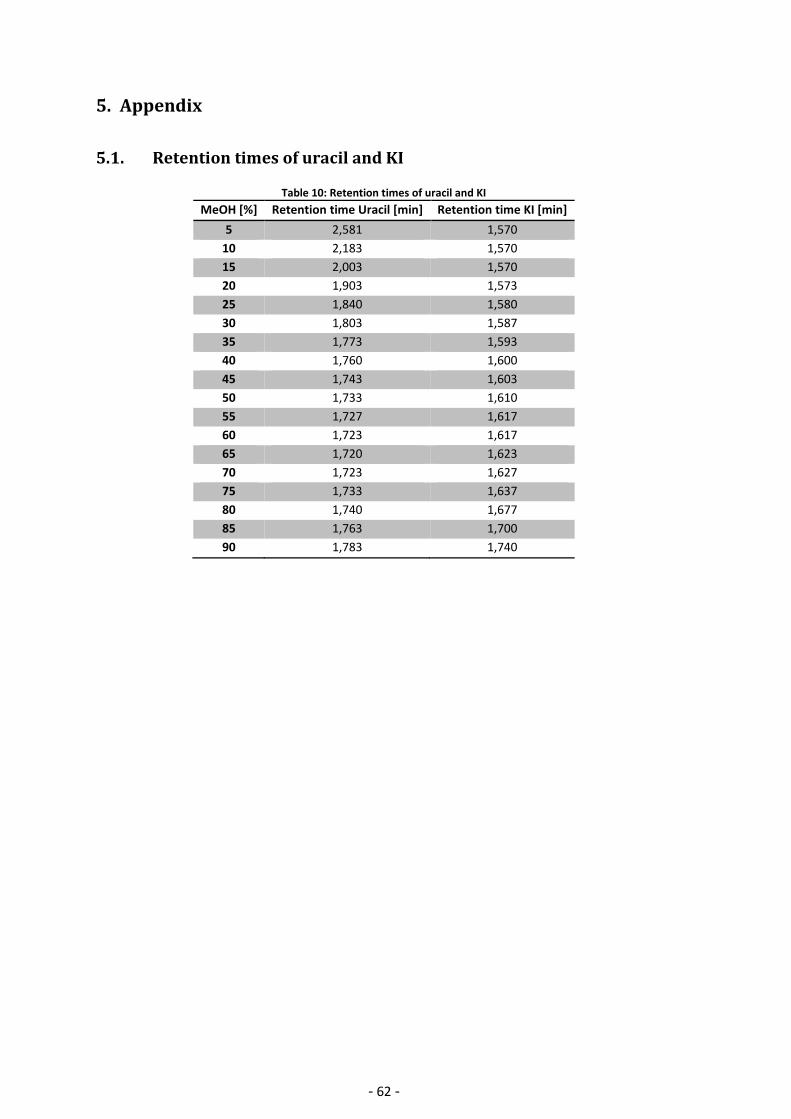
- 62 -
5. Appendix
5.1. Retention times of uracil and KI
Table 10: Retention times of uracil and KI
MeOH [%] Retention time Uracil [min] Retention time KI [min]
5 2,581 1,570
10 2,183 1,570
15 2,003 1,570
20 1,903 1,573
25 1,840 1,580
30 1,803 1,587
35 1,773 1,593
40 1,760 1,600
45 1,743 1,603
50 1,733 1,610
55 1,727 1,617
60 1,723 1,617
65 1,720 1,623
70 1,723 1,627
75 1,733 1,637
80 1,740 1,677
85 1,763 1,700
90 1,783 1,740
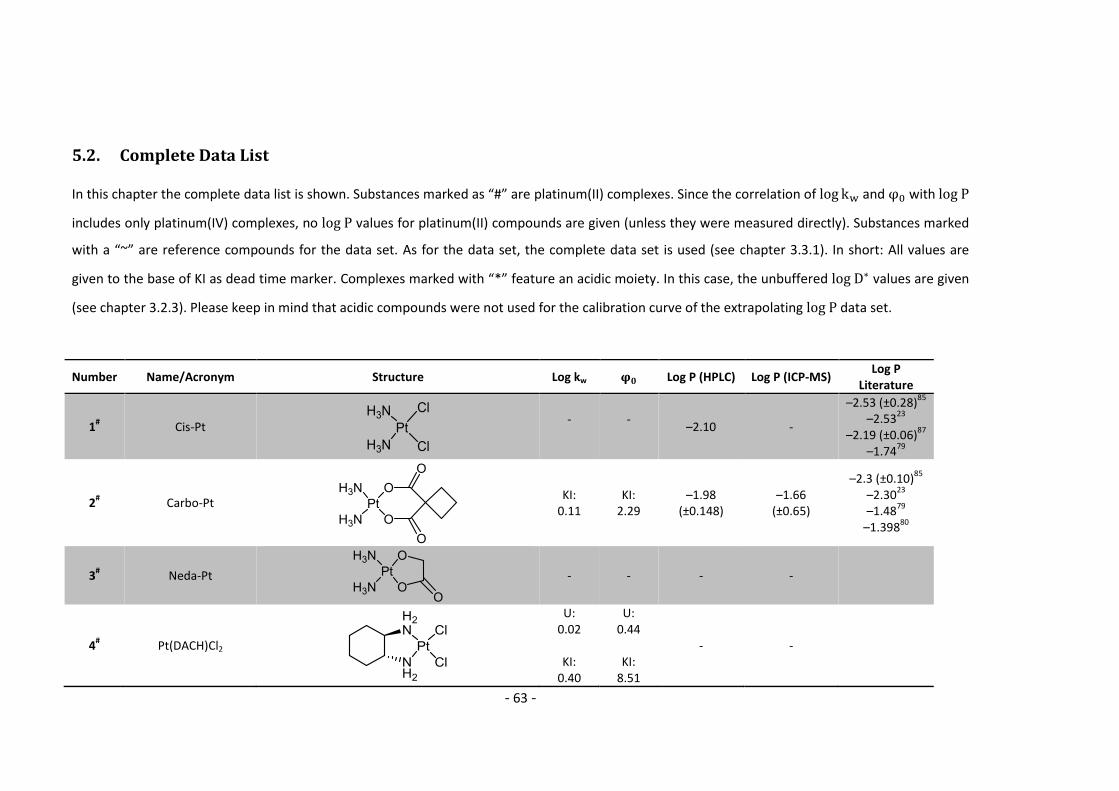
- 63 -
5.2. Complete Data List
In this chapter the complete data list is shown. Substances marked as “#” are platinum(II) complexes. Since the correlation of and with
includes only platinum(IV) complexes, no values for platinum(II) compounds are given (unless they were measured directly). Substances marked
with a “~” are reference compounds for the data set. As for the data set, the complete data set is used (see chapter 3.3.1). In short: All values are
given to the base of KI as dead time marker. Complexes marked with “*” feature an acidic moiety. In this case, the unbuffered values are given
(see chapter 3.2.3). Please keep in mind that acidic compounds were not used for the calibration curve of the extrapolating data set.
Number Name/Acronym Structure Log kw Log P (HPLC) Log P (ICP-MS) Log P
Literature
1# Cis-Pt
- - –2.10 -
–2.53 (±0.28)85
–2.53
23
–2.19 (±0.06)87
–1.74
79
2# Carbo-Pt
KI: 0.11
KI: 2.29
–1.98 (±0.148)
–1.66 (±0.65)
–2.3 (±0.10)85
–2.30
23
–1.4879
–1.398
80
3# Neda-Pt
- - - -
4# Pt(DACH)Cl2
U: 0.02
KI:
0.40
U: 0.44
KI:
8.51
- -
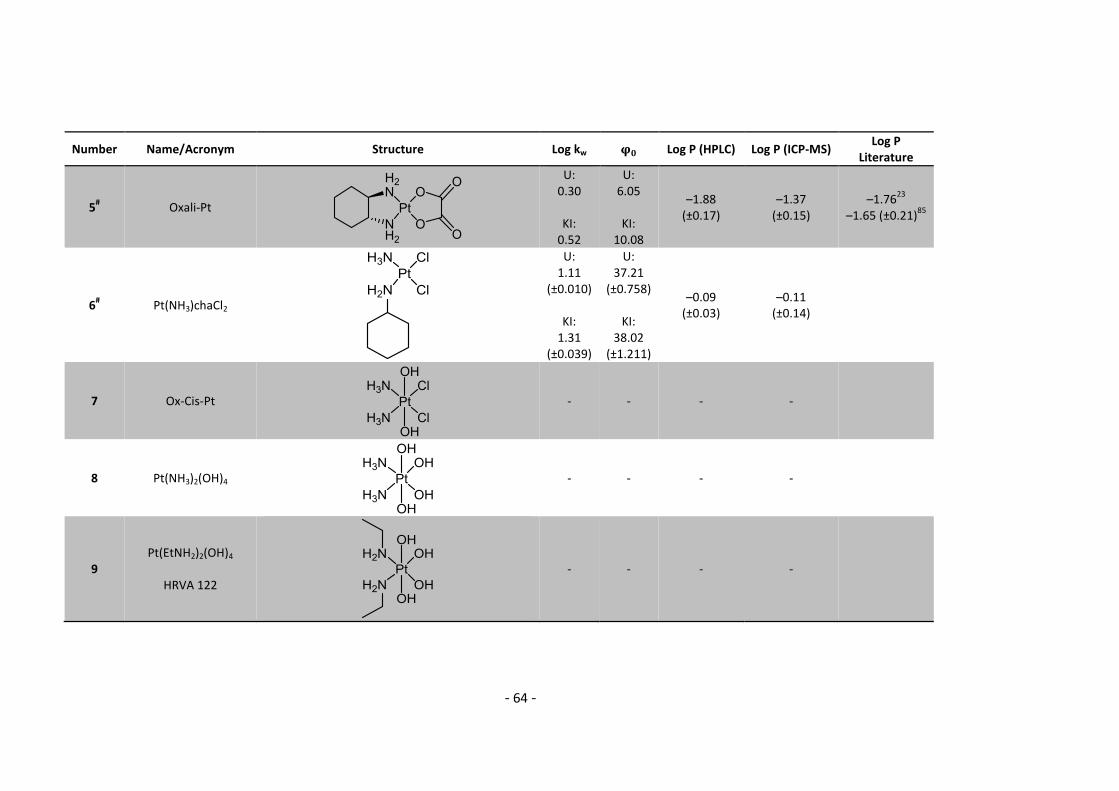
- 64 -
Number Name/Acronym Structure Log kw Log P (HPLC) Log P (ICP-MS) Log P
Literature
5# Oxali-Pt
U: 0.30
KI:
0.52
U: 6.05
KI:
10.08
–1.88 (±0.17)
–1.37 (±0.15)
–1.7623
–1.65 (±0.21)
85
6# Pt(NH3)chaCl2
U: 1.11
(±0.010)
KI: 1.31
(±0.039)
U: 37.21
(±0.758)
KI: 38.02
(±1.211)
–0.09 (±0.03)
–0.11 (±0.14)
7 Ox-Cis-Pt
- - - -
8 Pt(NH3)2(OH)4
- - - -
9 Pt(EtNH2)2(OH)4
HRVA 122
- - - -
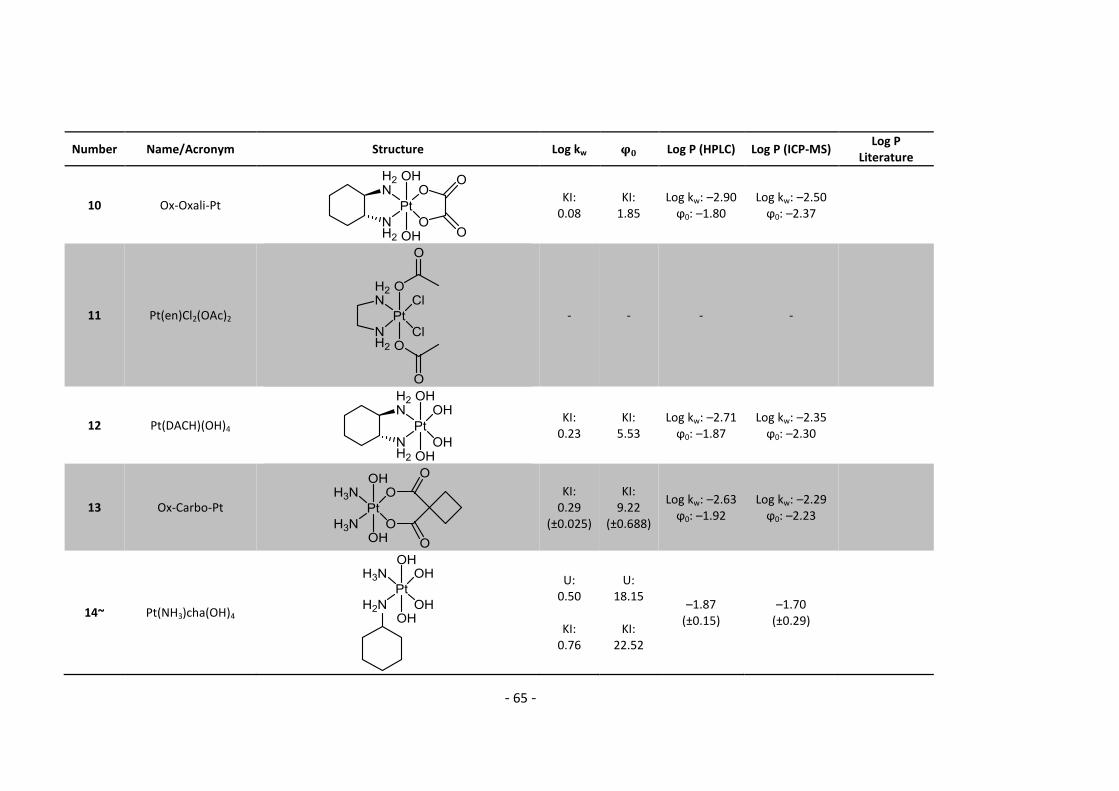
- 65 -
Number Name/Acronym Structure Log kw Log P (HPLC) Log P (ICP-MS) Log P
Literature
10 Ox-Oxali-Pt
KI: 0.08
KI: 1.85
Log kw: –2.90 ϕ0: –1.80
Log kw: –2.50 ϕ0: –2.37
11 Pt(en)Cl2(OAc)2
- - - -
12 Pt(DACH)(OH)4
KI: 0.23
KI: 5.53
Log kw: –2.71 ϕ0: –1.87
Log kw: –2.35 ϕ0: –2.30
13 Ox-Carbo-Pt
KI: 0.29
(±0.025)
KI: 9.22
(±0.688)
Log kw: –2.63 ϕ0: –1.92
Log kw: –2.29 ϕ0: –2.23
14~ Pt(NH3)cha(OH)4
U: 0.50
KI:
0.76
U: 18.15
KI:
22.52
–1.87 (±0.15)
–1.70 (±0.29)
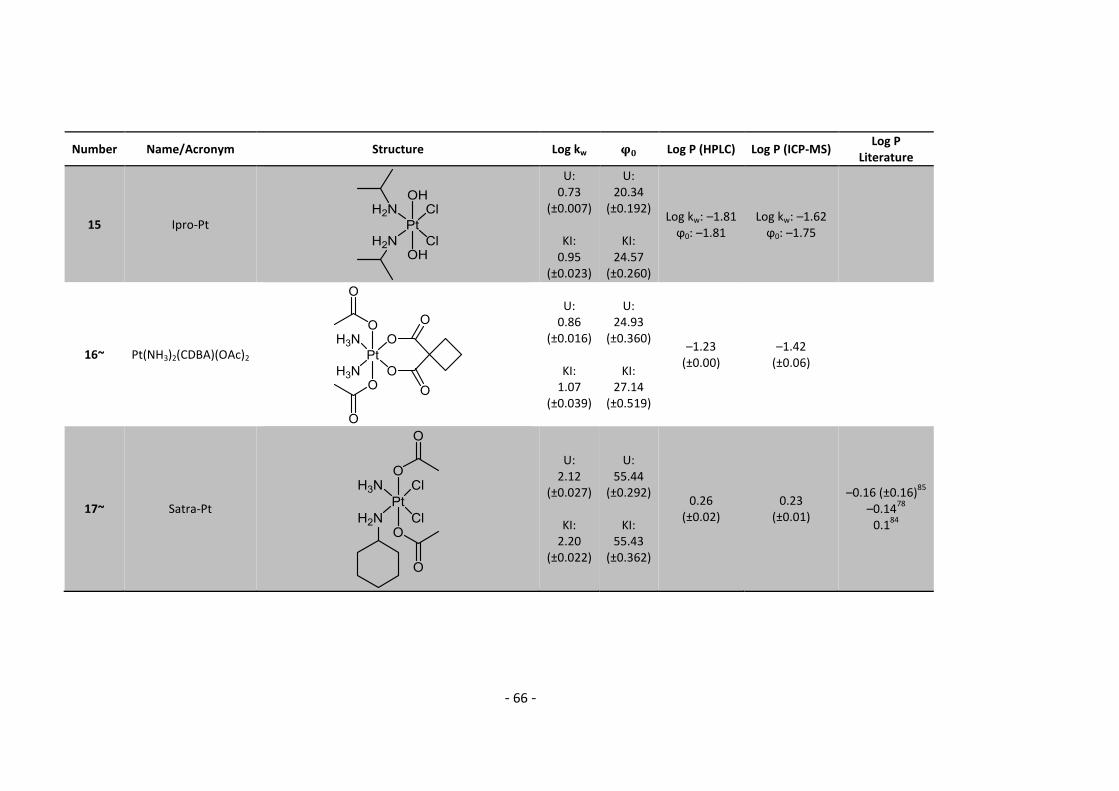
- 66 -
Number Name/Acronym Structure Log kw Log P (HPLC) Log P (ICP-MS) Log P
Literature
15 Ipro-Pt
U: 0.73
(±0.007)
KI: 0.95
(±0.023)
U: 20.34
(±0.192)
KI: 24.57
(±0.260)
Log kw: –1.81 ϕ0: –1.81
Log kw: –1.62 ϕ0: –1.75
16~ Pt(NH3)2(CDBA)(OAc)2
U: 0.86
(±0.016)
KI: 1.07
(±0.039)
U: 24.93
(±0.360)
KI: 27.14
(±0.519)
–1.23 (±0.00)
–1.42 (±0.06)
17~ Satra-Pt
U: 2.12
(±0.027)
KI: 2.20
(±0.022)
U: 55.44
(±0.292)
KI: 55.43
(±0.362)
0.26 (±0.02)
0.23 (±0.01)
–0.16 (±0.16)85
–0.14
78
0.184
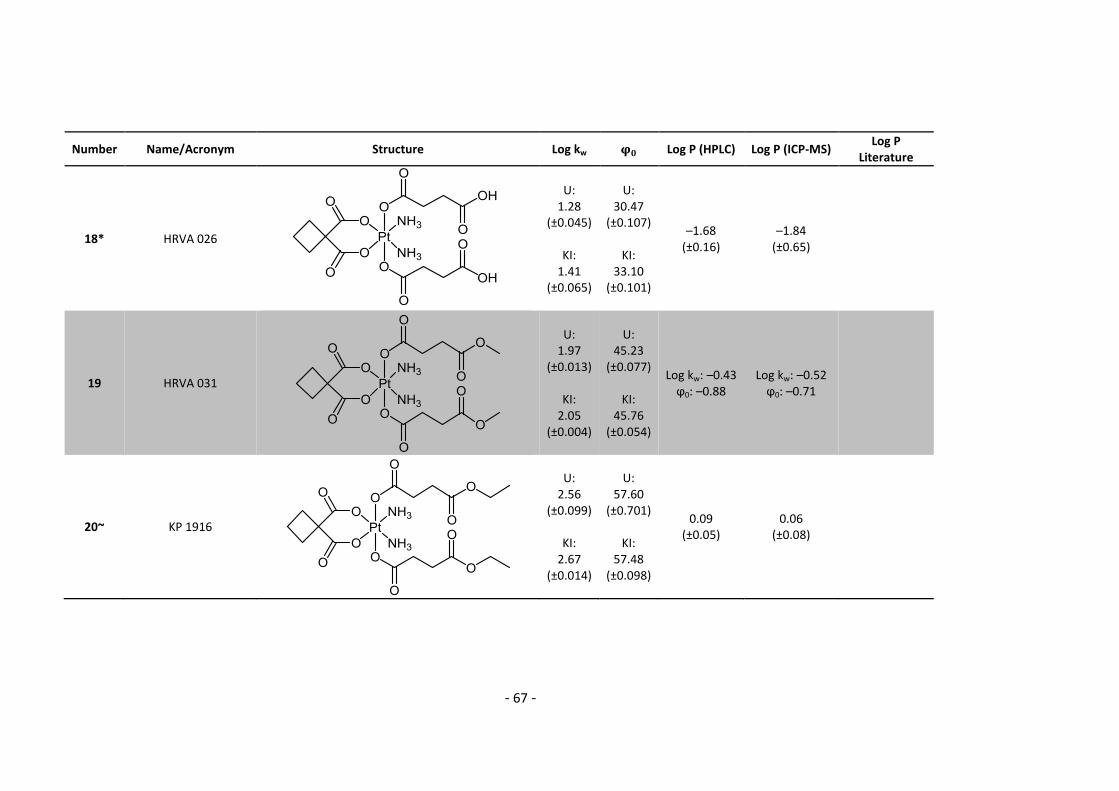
- 67 -
Number Name/Acronym Structure Log kw Log P (HPLC) Log P (ICP-MS) Log P
Literature
18* HRVA 026
U: 1.28
(±0.045)
KI: 1.41
(±0.065)
U: 30.47
(±0.107)
KI: 33.10
(±0.101)
–1.68 (±0.16)
–1.84 (±0.65)
19 HRVA 031
U: 1.97
(±0.013)
KI: 2.05
(±0.004)
U: 45.23
(±0.077)
KI: 45.76
(±0.054)
Log kw: –0.43 ϕ0: –0.88
Log kw: –0.52 ϕ0: –0.71
20~ KP 1916
U: 2.56
(±0.099)
KI: 2.67
(±0.014)
U: 57.60
(±0.701)
KI: 57.48
(±0.098)
0.09 (±0.05)
0.06 (±0.08)
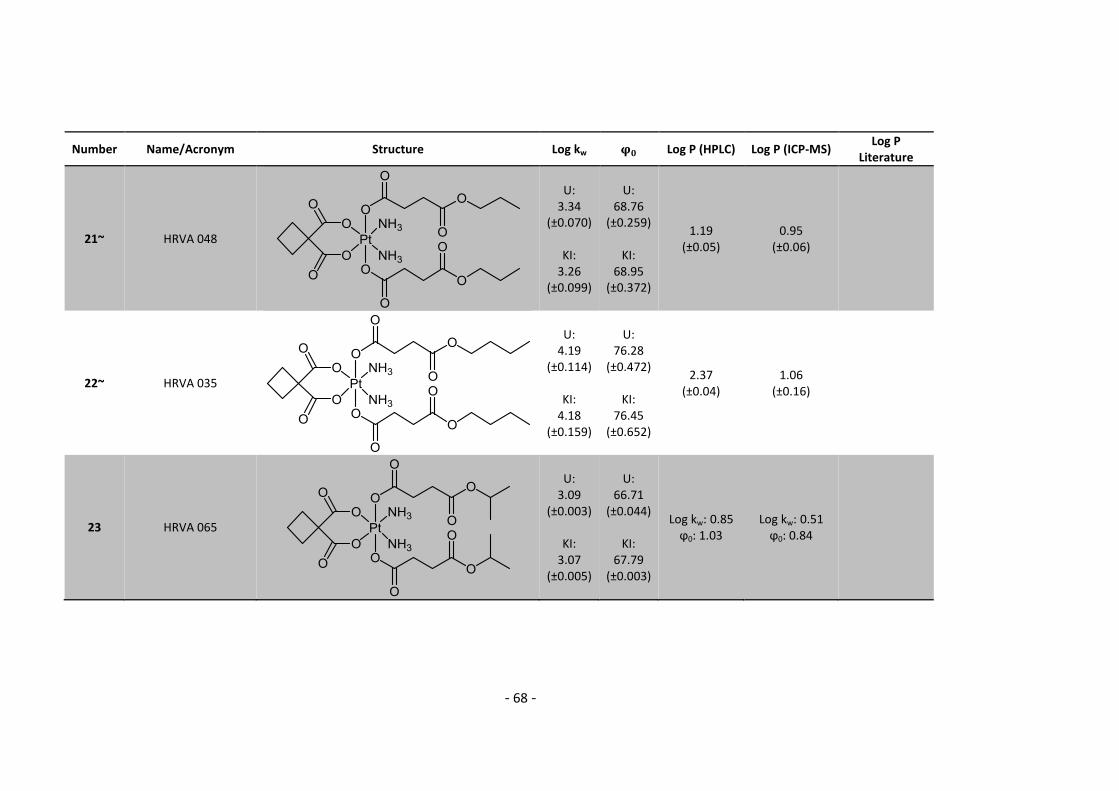
- 68 -
Number Name/Acronym Structure Log kw Log P (HPLC) Log P (ICP-MS) Log P
Literature
21~ HRVA 048
U: 3.34
(±0.070)
KI: 3.26
(±0.099)
U: 68.76
(±0.259)
KI: 68.95
(±0.372)
1.19 (±0.05)
0.95 (±0.06)
22~ HRVA 035
U: 4.19
(±0.114)
KI: 4.18
(±0.159)
U: 76.28
(±0.472)
KI: 76.45
(±0.652)
2.37 (±0.04)
1.06 (±0.16)
23 HRVA 065
U: 3.09
(±0.003)
KI: 3.07
(±0.005)
U: 66.71
(±0.044)
KI: 67.79
(±0.003)
Log kw: 0.85 ϕ0: 1.03
Log kw: 0.51 ϕ0: 0.84
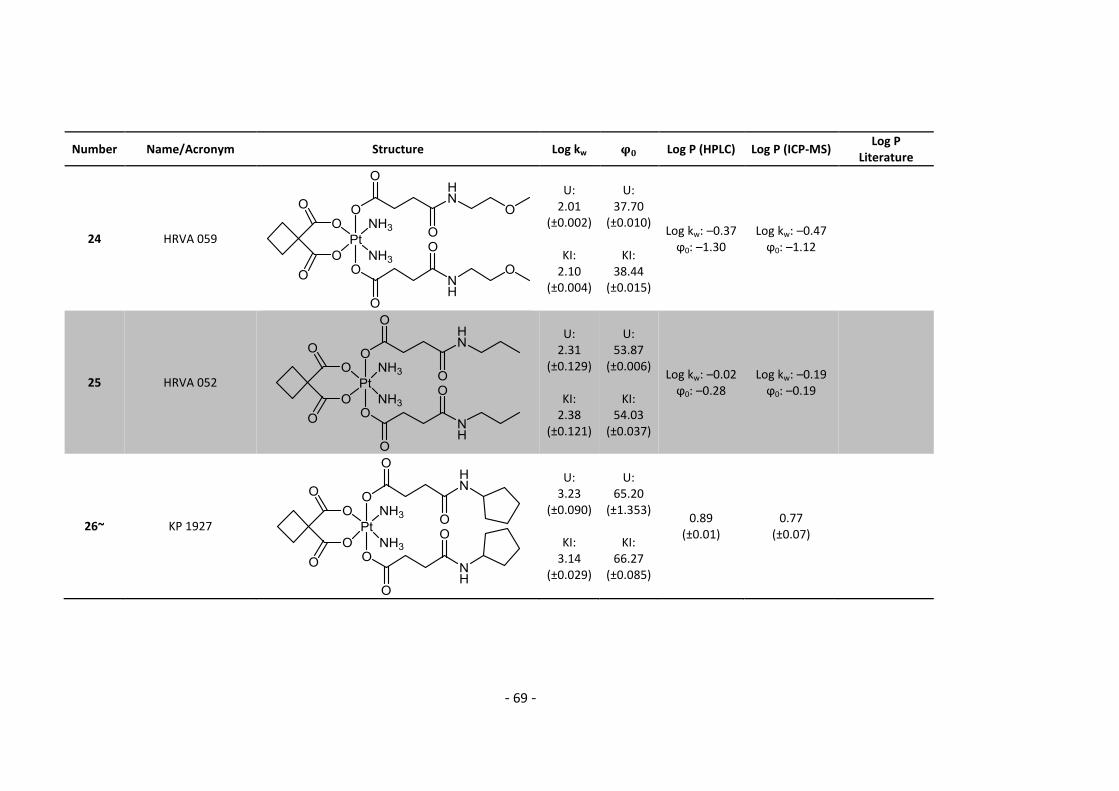
- 69 -
Number Name/Acronym Structure Log kw Log P (HPLC) Log P (ICP-MS) Log P
Literature
24 HRVA 059
U: 2.01
(±0.002)
KI: 2.10
(±0.004)
U: 37.70
(±0.010)
KI: 38.44
(±0.015)
Log kw: –0.37 ϕ0: –1.30
Log kw: –0.47 ϕ0: –1.12
25 HRVA 052
U: 2.31
(±0.129)
KI: 2.38
(±0.121)
U: 53.87
(±0.006)
KI: 54.03
(±0.037)
Log kw: –0.02 ϕ0: –0.28
Log kw: –0.19 ϕ0: –0.19
26~ KP 1927
U: 3.23
(±0.090)
KI: 3.14
(±0.029)
U: 65.20
(±1.353)
KI: 66.27
(±0.085)
0.89 (±0.01)
0.77 (±0.07)
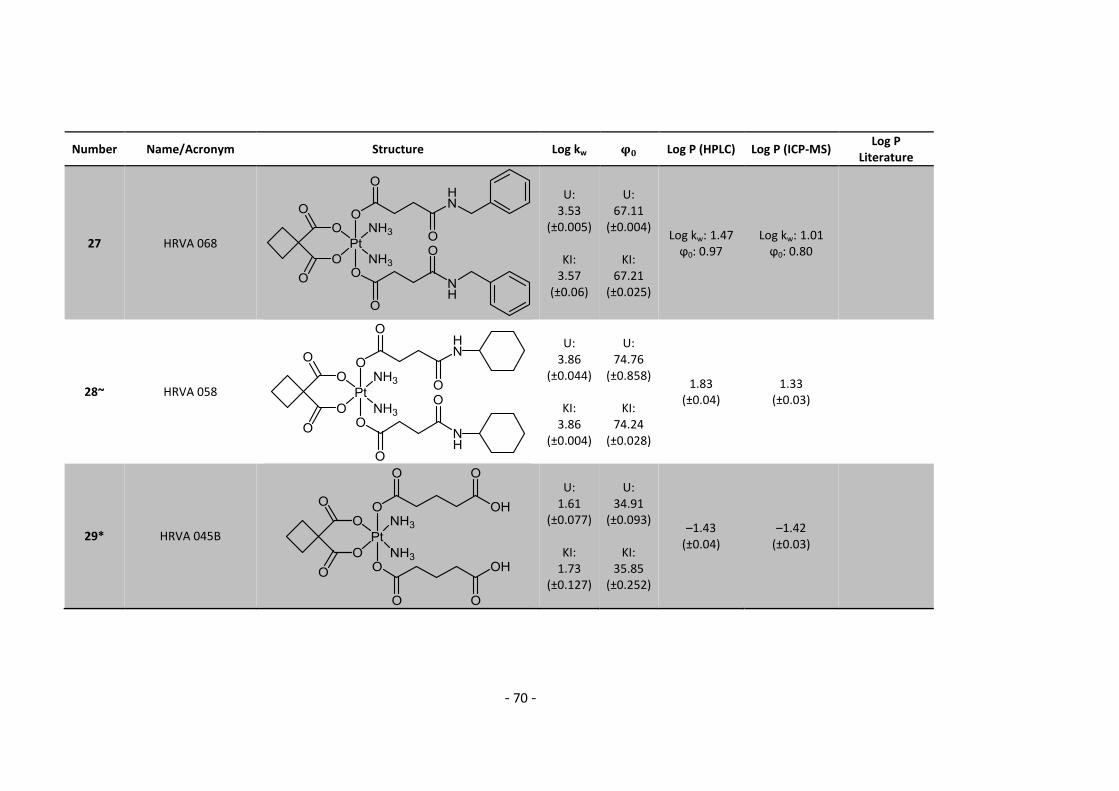
- 70 -
Number Name/Acronym Structure Log kw Log P (HPLC) Log P (ICP-MS) Log P
Literature
27 HRVA 068
U: 3.53
(±0.005)
KI: 3.57
(±0.06)
U: 67.11
(±0.004)
KI: 67.21
(±0.025)
Log kw: 1.47 ϕ0: 0.97
Log kw: 1.01 ϕ0: 0.80
28~ HRVA 058
U: 3.86
(±0.044)
KI: 3.86
(±0.004)
U: 74.76
(±0.858)
KI: 74.24
(±0.028)
1.83 (±0.04)
1.33 (±0.03)
29* HRVA 045B
U: 1.61
(±0.077)
KI: 1.73
(±0.127)
U: 34.91
(±0.093)
KI: 35.85
(±0.252)
–1.43 (±0.04)
–1.42 (±0.03)
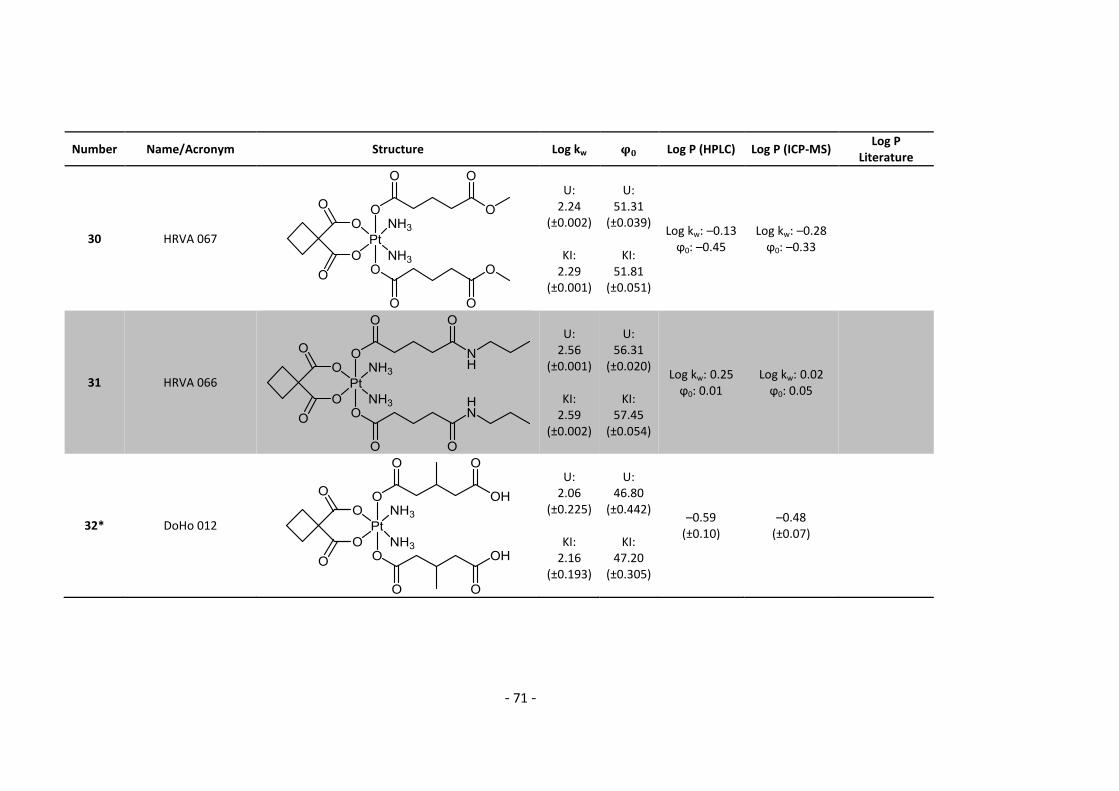
- 71 -
Number Name/Acronym Structure Log kw Log P (HPLC) Log P (ICP-MS) Log P
Literature
30 HRVA 067
U: 2.24
(±0.002)
KI: 2.29
(±0.001)
U: 51.31
(±0.039)
KI: 51.81
(±0.051)
Log kw: –0.13 ϕ0: –0.45
Log kw: –0.28 ϕ0: –0.33
31 HRVA 066
U: 2.56
(±0.001)
KI: 2.59
(±0.002)
U: 56.31
(±0.020)
KI: 57.45
(±0.054)
Log kw: 0.25 ϕ0: 0.01
Log kw: 0.02 ϕ0: 0.05
32* DoHo 012
U: 2.06
(±0.225)
KI: 2.16
(±0.193)
U: 46.80
(±0.442)
KI: 47.20
(±0.305)
–0.59 (±0.10)
–0.48 (±0.07)
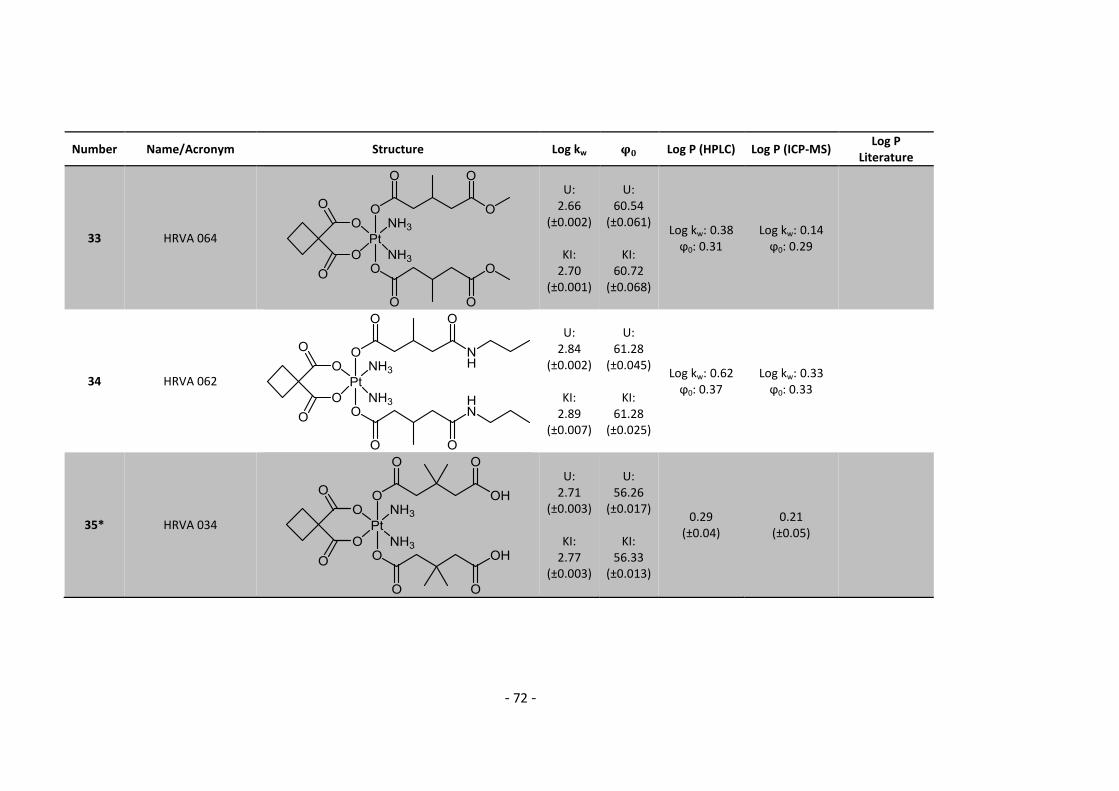
- 72 -
Number Name/Acronym Structure Log kw Log P (HPLC) Log P (ICP-MS) Log P
Literature
33 HRVA 064
U: 2.66
(±0.002)
KI: 2.70
(±0.001)
U: 60.54
(±0.061)
KI: 60.72
(±0.068)
Log kw: 0.38 ϕ0: 0.31
Log kw: 0.14 ϕ0: 0.29
34 HRVA 062
U: 2.84
(±0.002)
KI: 2.89
(±0.007)
U: 61.28
(±0.045)
KI: 61.28
(±0.025)
Log kw: 0.62 ϕ0: 0.37
Log kw: 0.33 ϕ0: 0.33
35* HRVA 034
U: 2.71
(±0.003)
KI: 2.77
(±0.003)
U: 56.26
(±0.017)
KI: 56.33
(±0.013)
0.29 (±0.04)
0.21 (±0.05)
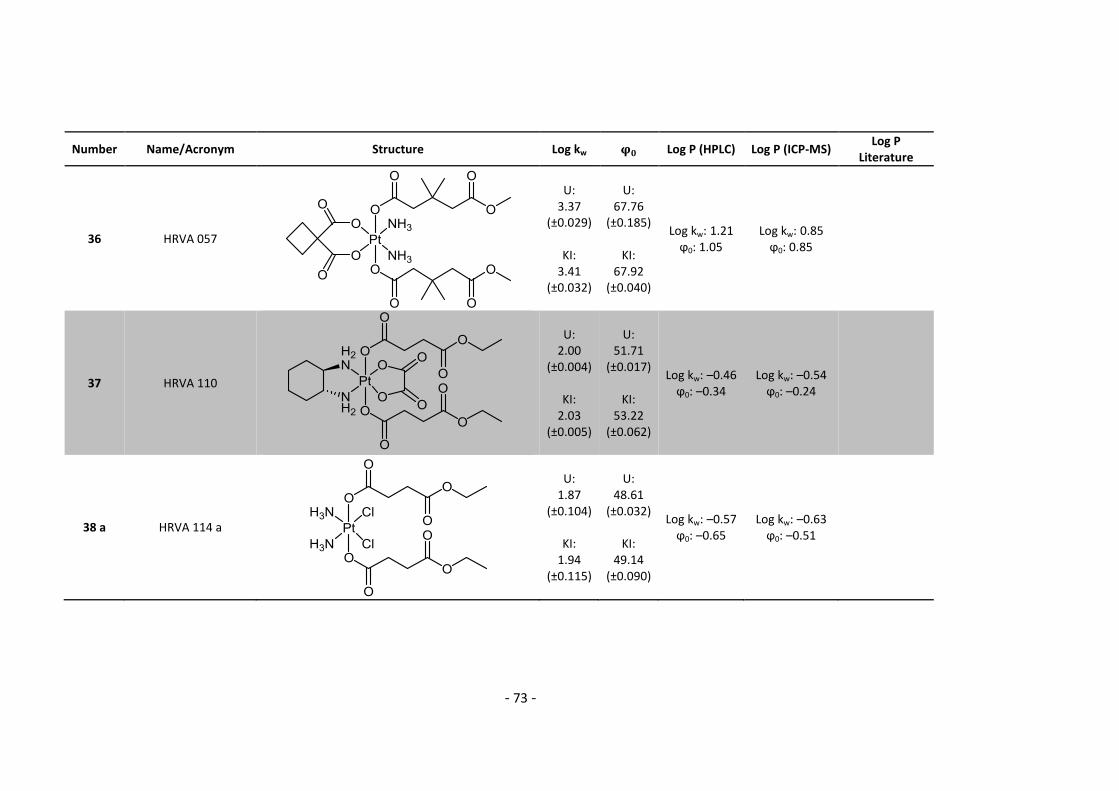
- 73 -
Number Name/Acronym Structure Log kw Log P (HPLC) Log P (ICP-MS) Log P
Literature
36 HRVA 057
U: 3.37
(±0.029)
KI: 3.41
(±0.032)
U: 67.76
(±0.185)
KI: 67.92
(±0.040)
Log kw: 1.21 ϕ0: 1.05
Log kw: 0.85 ϕ0: 0.85
37 HRVA 110
U: 2.00
(±0.004)
KI: 2.03
(±0.005)
U: 51.71
(±0.017)
KI: 53.22
(±0.062)
Log kw: –0.46 ϕ0: –0.34
Log kw: –0.54 ϕ0: –0.24
38 a HRVA 114 a
U: 1.87
(±0.104)
KI: 1.94
(±0.115)
U: 48.61
(±0.032)
KI: 49.14
(±0.090)
Log kw: –0.57 ϕ0: –0.65
Log kw: –0.63 ϕ0: –0.51
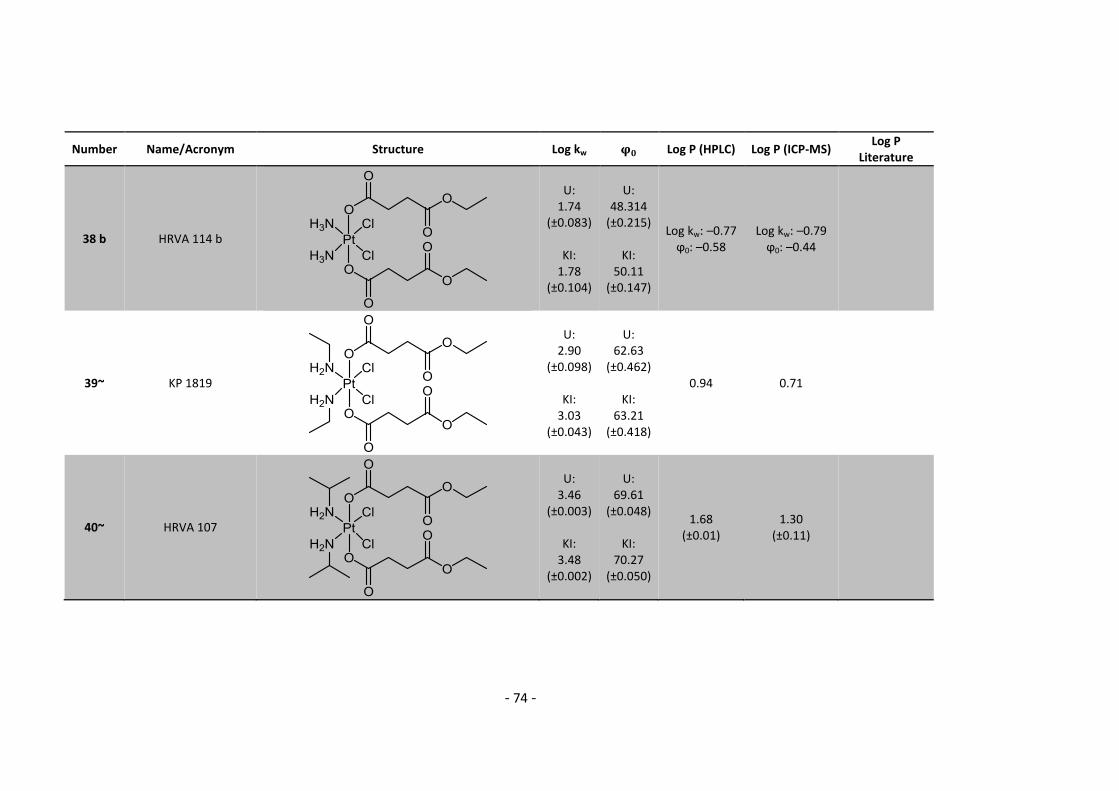
- 74 -
Number Name/Acronym Structure Log kw Log P (HPLC) Log P (ICP-MS) Log P
Literature
38 b HRVA 114 b
U: 1.74
(±0.083)
KI: 1.78
(±0.104)
U: 48.314
(±0.215)
KI: 50.11
(±0.147)
Log kw: –0.77 ϕ0: –0.58
Log kw: –0.79 ϕ0: –0.44
39~ KP 1819
U: 2.90
(±0.098)
KI: 3.03
(±0.043)
U: 62.63
(±0.462)
KI: 63.21
(±0.418)
0.94 0.71
40~ HRVA 107
U: 3.46
(±0.003)
KI: 3.48
(±0.002)
U: 69.61
(±0.048)
KI: 70.27
(±0.050)
1.68 (±0.01)
1.30 (±0.11)
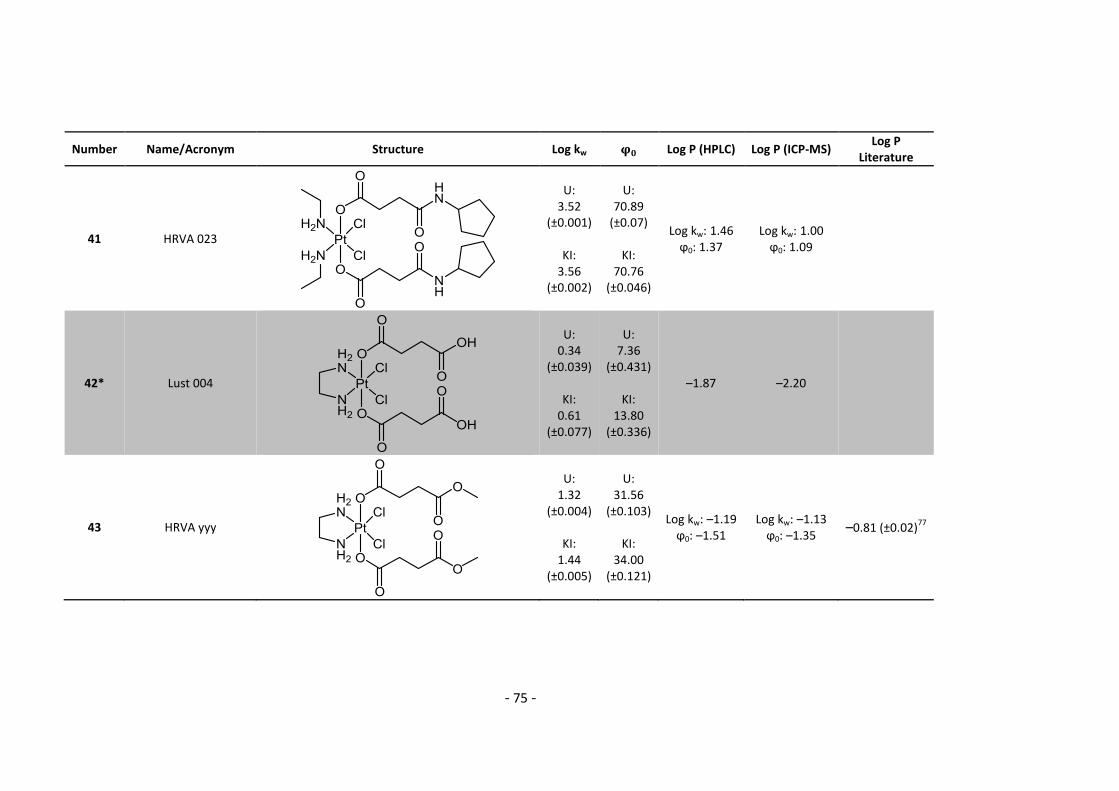
- 75 -
Number Name/Acronym Structure Log kw Log P (HPLC) Log P (ICP-MS) Log P
Literature
41 HRVA 023
U: 3.52
(±0.001)
KI: 3.56
(±0.002)
U: 70.89
(±0.07)
KI: 70.76
(±0.046)
Log kw: 1.46 ϕ0: 1.37
Log kw: 1.00 ϕ0: 1.09
42* Lust 004
U: 0.34
(±0.039)
KI: 0.61
(±0.077)
U: 7.36
(±0.431)
KI: 13.80
(±0.336)
–1.87 –2.20
43 HRVA yyy
U: 1.32
(±0.004)
KI: 1.44
(±0.005)
U: 31.56
(±0.103)
KI: 34.00
(±0.121)
Log kw: –1.19 ϕ0: –1.51
Log kw: –1.13 ϕ0: –1.35
–0.81 (±0.02)77
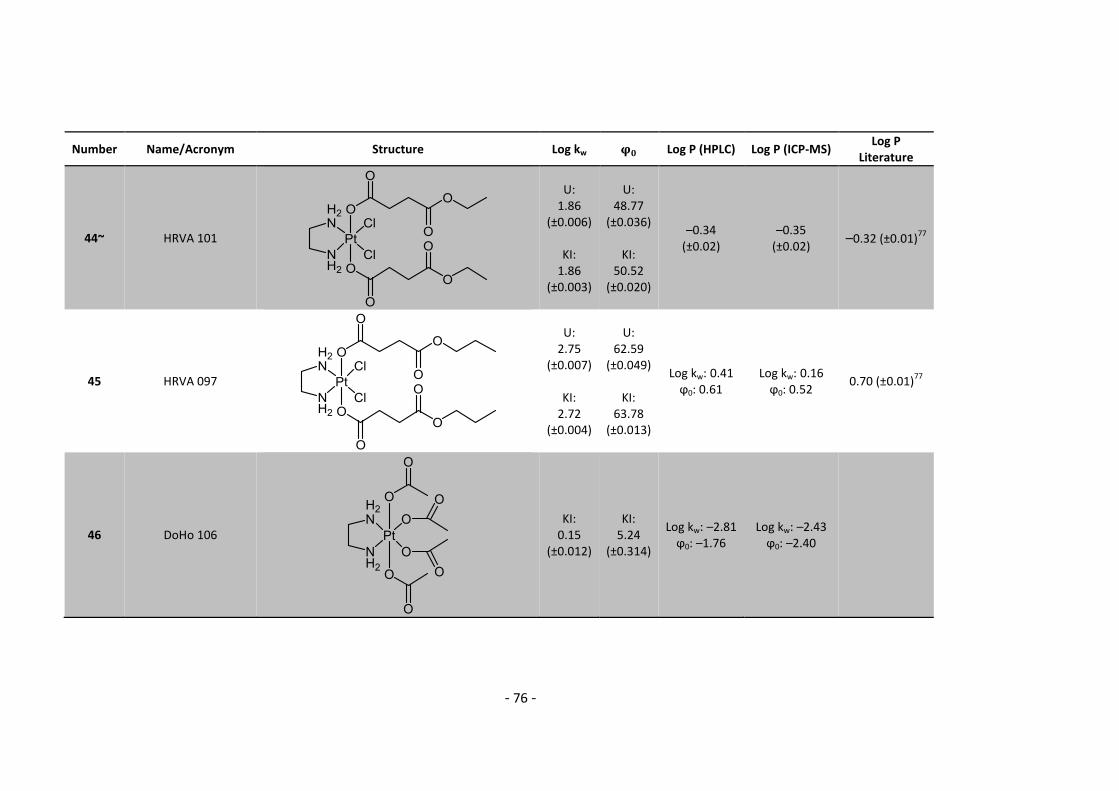
- 76 -
Number Name/Acronym Structure Log kw Log P (HPLC) Log P (ICP-MS) Log P
Literature
44~ HRVA 101
U: 1.86
(±0.006)
KI: 1.86
(±0.003)
U: 48.77
(±0.036)
KI: 50.52
(±0.020)
–0.34 (±0.02)
–0.35 (±0.02)
–0.32 (±0.01)77
45 HRVA 097
U: 2.75
(±0.007)
KI: 2.72
(±0.004)
U: 62.59
(±0.049)
KI: 63.78
(±0.013)
Log kw: 0.41 ϕ0: 0.61
Log kw: 0.16 ϕ0: 0.52
0.70 (±0.01)77
46 DoHo 106
KI: 0.15
(±0.012)
KI: 5.24
(±0.314)
Log kw: –2.81 ϕ0: –1.76
Log kw: –2.43 ϕ0: –2.40
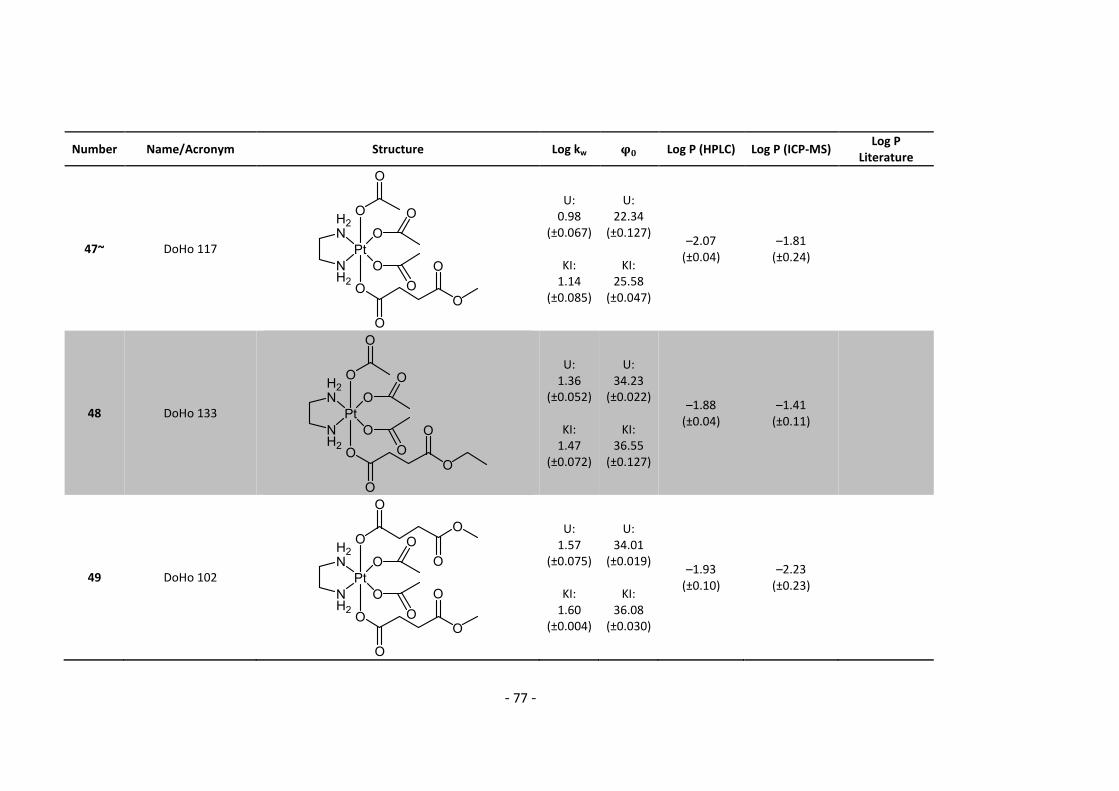
- 77 -
Number Name/Acronym Structure Log kw Log P (HPLC) Log P (ICP-MS) Log P
Literature
47~ DoHo 117
U: 0.98
(±0.067)
KI: 1.14
(±0.085)
U: 22.34
(±0.127)
KI: 25.58
(±0.047)
–2.07 (±0.04)
–1.81 (±0.24)
48 DoHo 133
U: 1.36
(±0.052)
KI: 1.47
(±0.072)
U: 34.23
(±0.022)
KI: 36.55
(±0.127)
–1.88 (±0.04)
–1.41 (±0.11)
49 DoHo 102
U: 1.57
(±0.075)
KI: 1.60
(±0.004)
U: 34.01
(±0.019)
KI: 36.08
(±0.030)
–1.93 (±0.10)
–2.23 (±0.23)
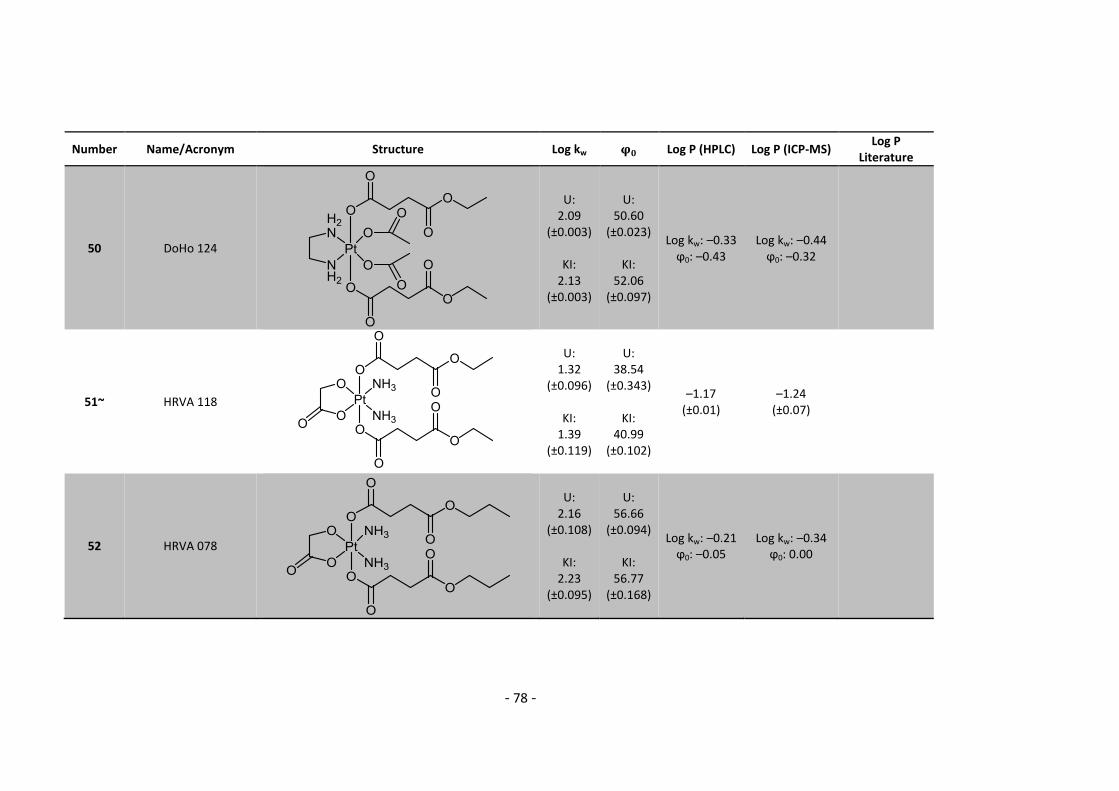
- 78 -
Number Name/Acronym Structure Log kw Log P (HPLC) Log P (ICP-MS) Log P
Literature
50 DoHo 124
U: 2.09
(±0.003)
KI: 2.13
(±0.003)
U: 50.60
(±0.023)
KI: 52.06
(±0.097)
Log kw: –0.33 ϕ0: –0.43
Log kw: –0.44 ϕ0: –0.32
51~ HRVA 118
U: 1.32
(±0.096)
KI: 1.39
(±0.119)
U: 38.54
(±0.343)
KI: 40.99
(±0.102)
–1.17 (±0.01)
–1.24 (±0.07)
52 HRVA 078
U: 2.16
(±0.108)
KI: 2.23
(±0.095)
U: 56.66
(±0.094)
KI: 56.77
(±0.168)
Log kw: –0.21 ϕ0: –0.05
Log kw: –0.34 ϕ0: 0.00
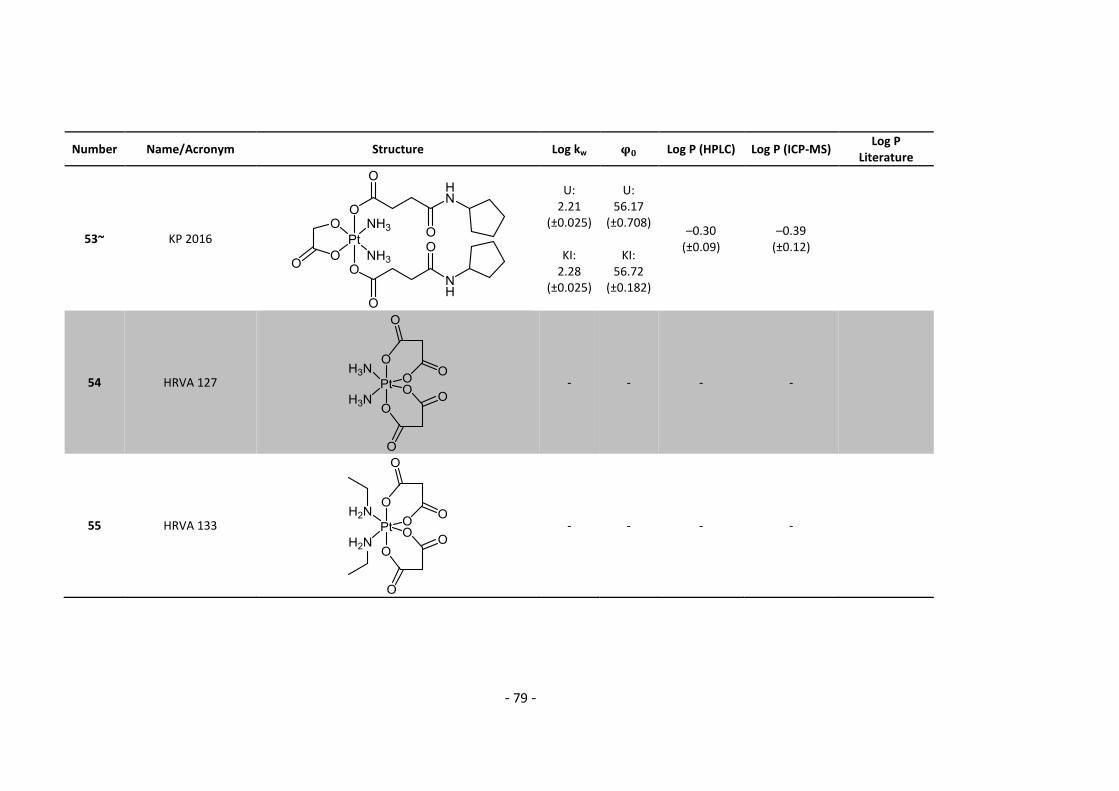
- 79 -
Number Name/Acronym Structure Log kw Log P (HPLC) Log P (ICP-MS) Log P
Literature
53~ KP 2016
U: 2.21
(±0.025)
KI: 2.28
(±0.025)
U: 56.17
(±0.708)
KI: 56.72
(±0.182)
–0.30 (±0.09)
–0.39 (±0.12)
54 HRVA 127
- - - -
55 HRVA 133
- - - -
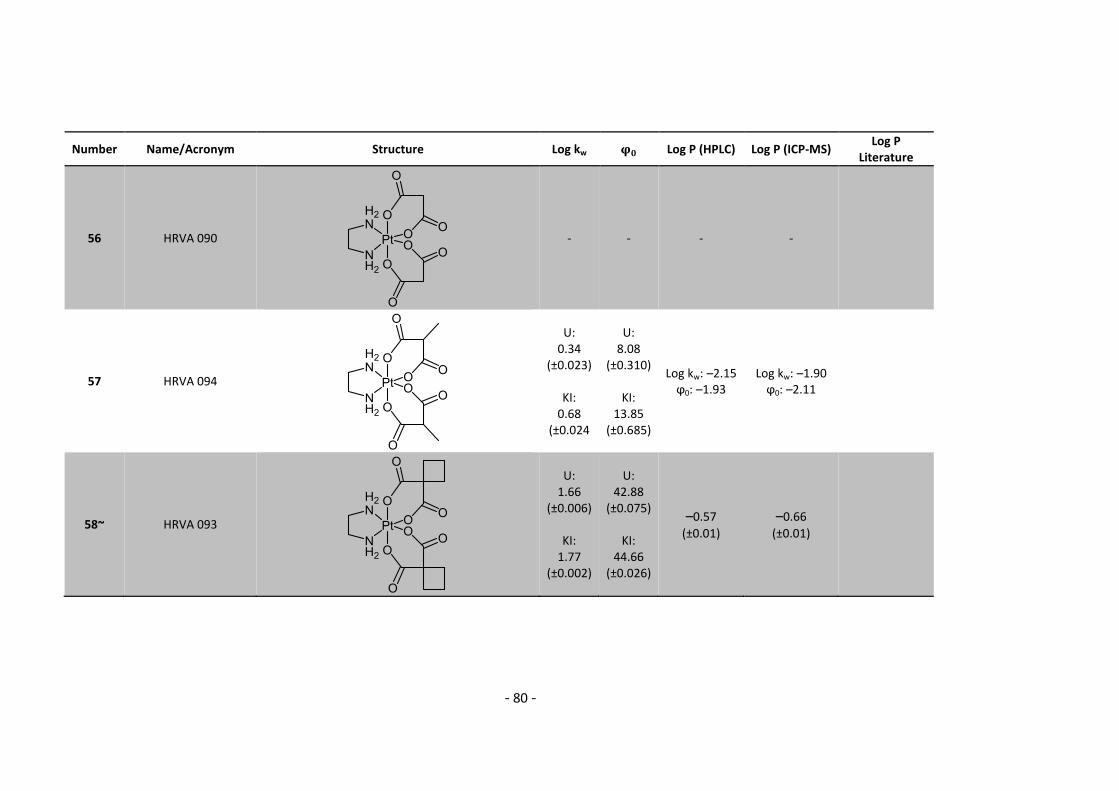
- 80 -
Number Name/Acronym Structure Log kw Log P (HPLC) Log P (ICP-MS) Log P
Literature
56 HRVA 090
- - - -
57 HRVA 094
U: 0.34
(±0.023)
KI: 0.68
(±0.024
U: 8.08
(±0.310)
KI: 13.85
(±0.685)
Log kw: –2.15 ϕ0: –1.93
Log kw: –1.90 ϕ0: –2.11
58~ HRVA 093
U: 1.66
(±0.006)
KI: 1.77
(±0.002)
U: 42.88
(±0.075)
KI: 44.66
(±0.026)
–0.57
(±0.01)
–0.66
(±0.01)
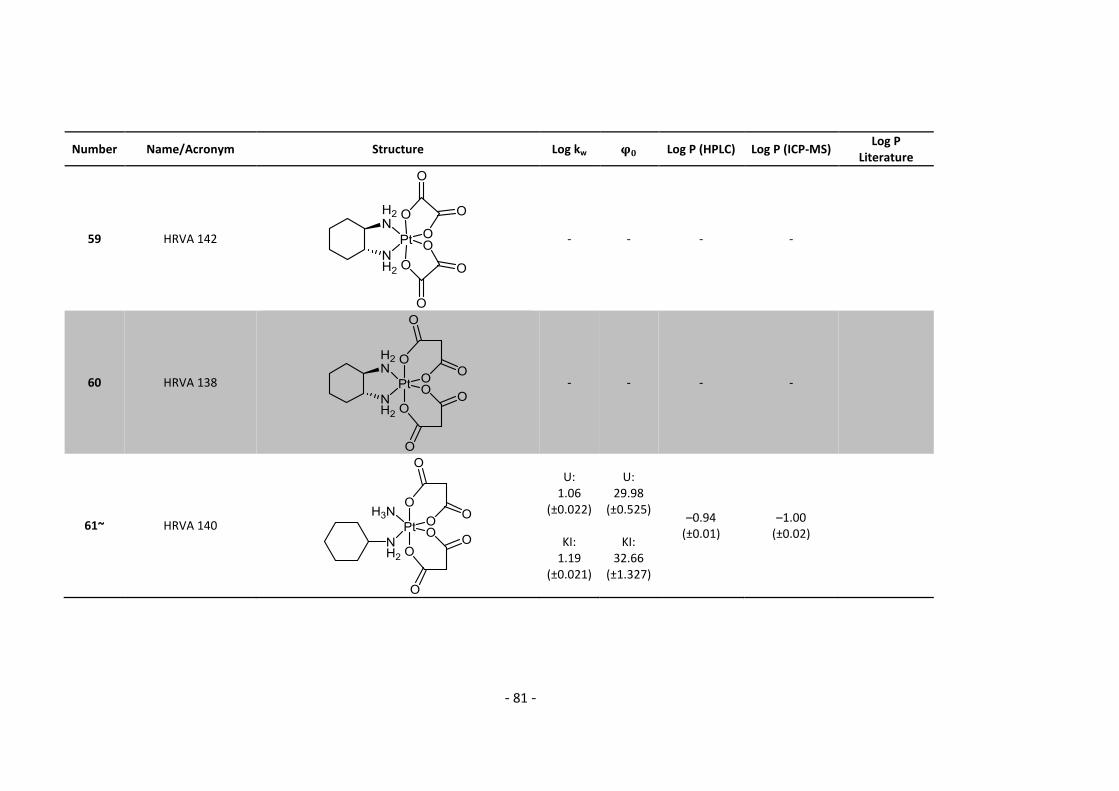
- 81 -
Number Name/Acronym Structure Log kw Log P (HPLC) Log P (ICP-MS) Log P
Literature
59 HRVA 142
- - - -
60 HRVA 138
- - - -
61~ HRVA 140
U: 1.06
(±0.022)
KI: 1.19
(±0.021)
U: 29.98
(±0.525)
KI: 32.66
(±1.327)
–0.94 (±0.01)
–1.00 (±0.02)
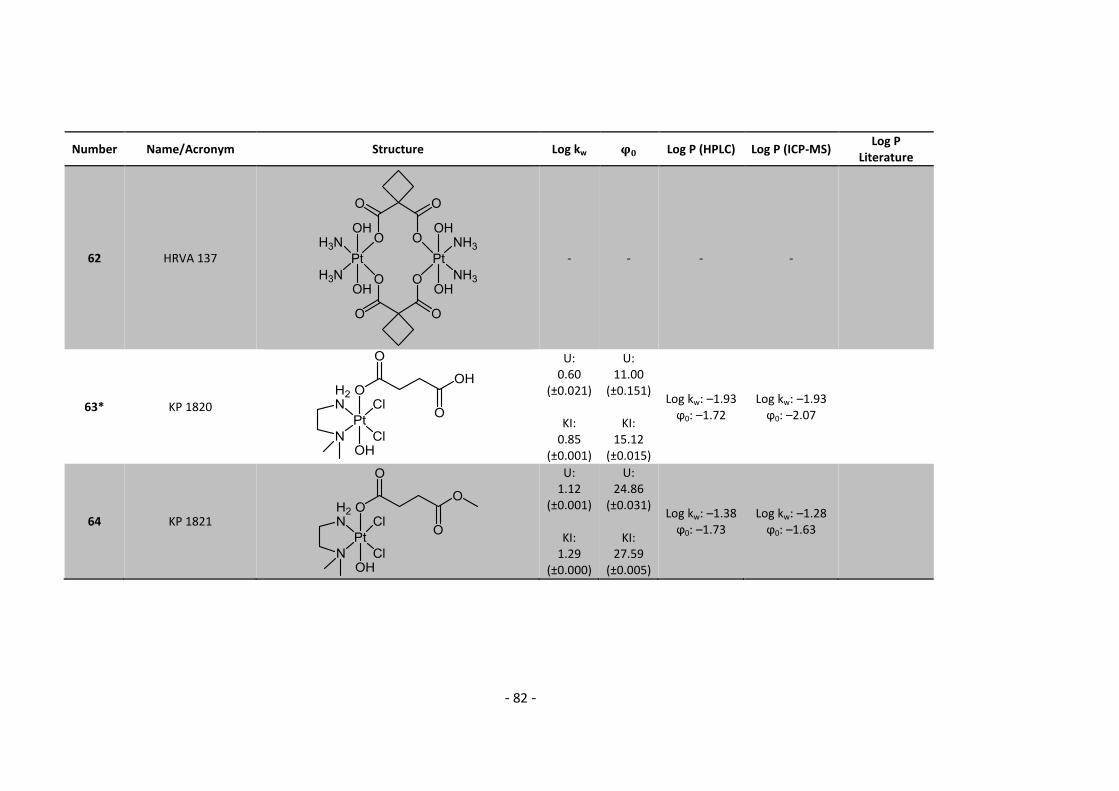
- 82 -
Number Name/Acronym Structure Log kw Log P (HPLC) Log P (ICP-MS) Log P
Literature
62 HRVA 137
- - - -
63* KP 1820
U: 0.60
(±0.021)
KI: 0.85
(±0.001)
U: 11.00
(±0.151)
KI: 15.12
(±0.015)
Log kw: –1.93 ϕ0: –1.72
Log kw: –1.93 ϕ0: –2.07
64 KP 1821
U: 1.12
(±0.001)
KI: 1.29
(±0.000)
U: 24.86
(±0.031)
KI: 27.59
(±0.005)
Log kw: –1.38 ϕ0: –1.73
Log kw: –1.28 ϕ0: –1.63
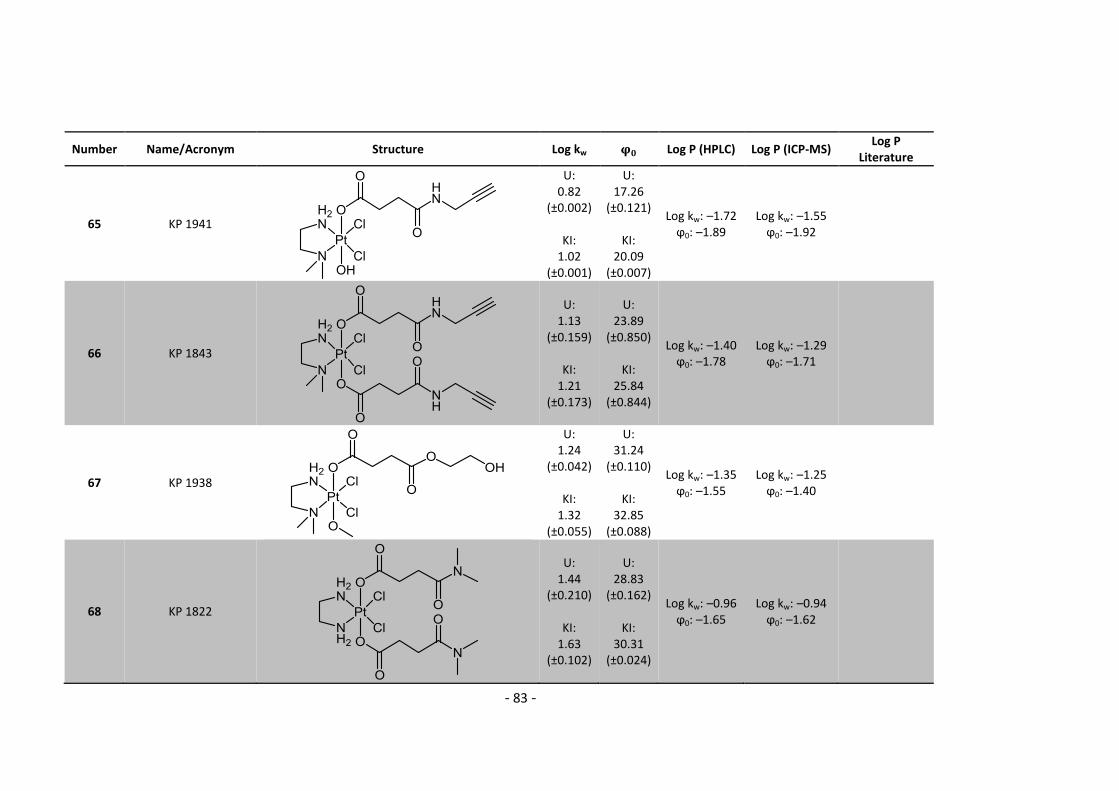
- 83 -
Number Name/Acronym Structure Log kw Log P (HPLC) Log P (ICP-MS) Log P
Literature
65 KP 1941
U: 0.82
(±0.002)
KI: 1.02
(±0.001)
U: 17.26
(±0.121)
KI: 20.09
(±0.007)
Log kw: –1.72 ϕ0: –1.89
Log kw: –1.55 ϕ0: –1.92
66 KP 1843
U: 1.13
(±0.159)
KI: 1.21
(±0.173)
U: 23.89
(±0.850)
KI: 25.84
(±0.844)
Log kw: –1.40 ϕ0: –1.78
Log kw: –1.29 ϕ0: –1.71
67 KP 1938
U: 1.24
(±0.042)
KI: 1.32
(±0.055)
U: 31.24
(±0.110)
KI: 32.85
(±0.088)
Log kw: –1.35 ϕ0: –1.55
Log kw: –1.25 ϕ0: –1.40
68 KP 1822
U: 1.44
(±0.210)
KI: 1.63
(±0.102)
U: 28.83
(±0.162)
KI: 30.31
(±0.024)
Log kw: –0.96 ϕ0: –1.65
Log kw: –0.94 ϕ0: –1.62
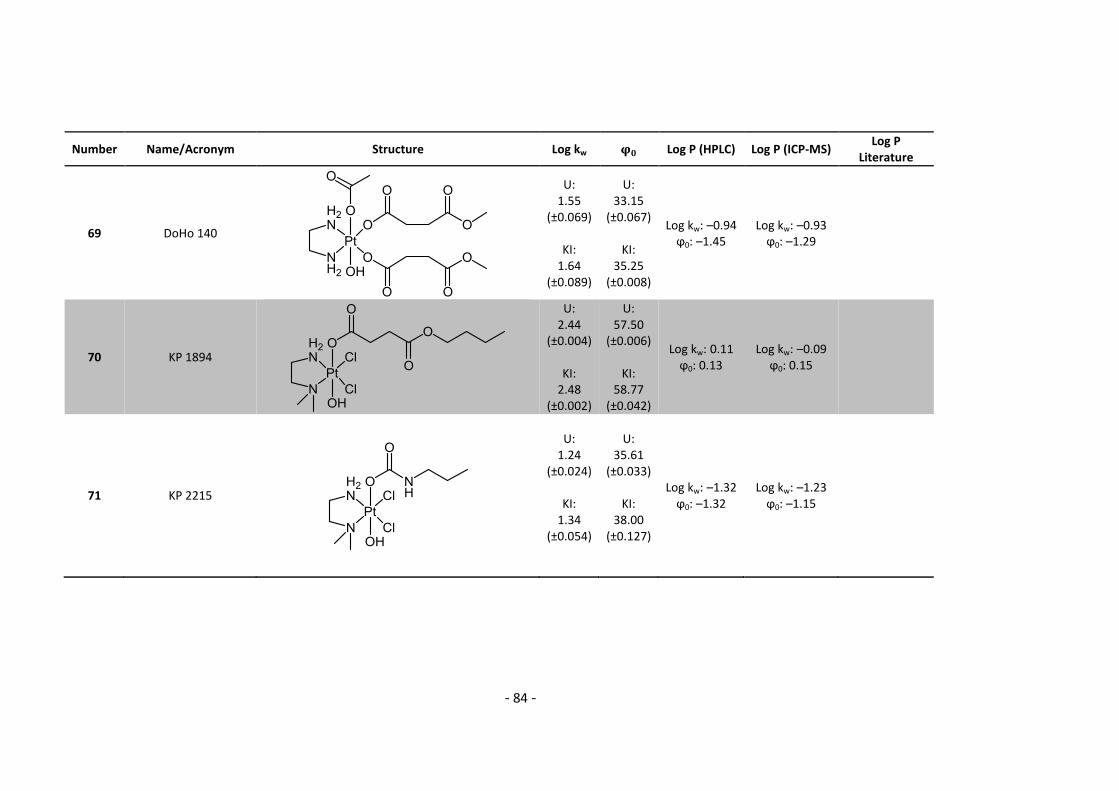
- 84 -
Number Name/Acronym Structure Log kw Log P (HPLC) Log P (ICP-MS) Log P
Literature
69 DoHo 140
U: 1.55
(±0.069)
KI: 1.64
(±0.089)
U: 33.15
(±0.067)
KI: 35.25
(±0.008)
Log kw: –0.94 ϕ0: –1.45
Log kw: –0.93 ϕ0: –1.29
70 KP 1894
U: 2.44
(±0.004)
KI: 2.48
(±0.002)
U: 57.50
(±0.006)
KI: 58.77
(±0.042)
Log kw: 0.11 ϕ0: 0.13
Log kw: –0.09 ϕ0: 0.15
71 KP 2215
U:
1.24 (±0.024)
KI:
1.34 (±0.054)
U:
35.61 (±0.033)
KI:
38.00 (±0.127)
Log kw: –1.32 ϕ0: –1.32
Log kw: –1.23 ϕ0: –1.15
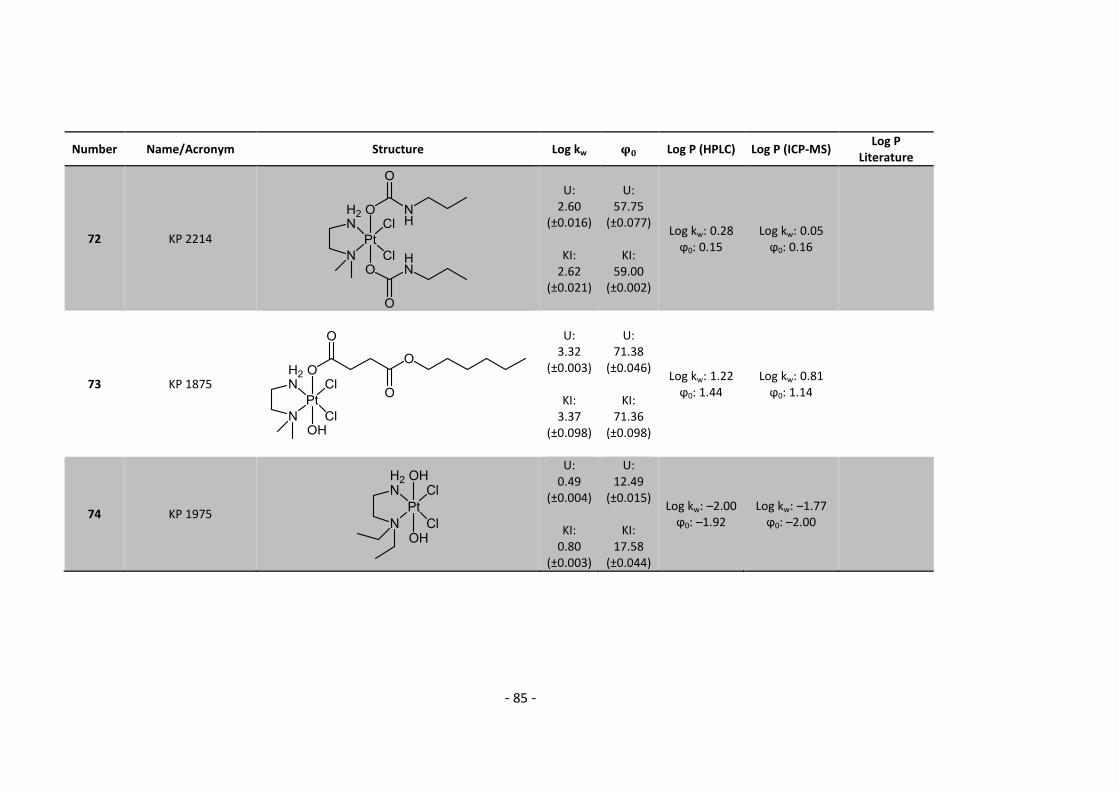
- 85 -
Number Name/Acronym Structure Log kw Log P (HPLC) Log P (ICP-MS) Log P
Literature
72 KP 2214
U: 2.60
(±0.016)
KI: 2.62
(±0.021)
U: 57.75
(±0.077)
KI: 59.00
(±0.002)
Log kw: 0.28 ϕ0: 0.15
Log kw: 0.05 ϕ0: 0.16
73 KP 1875
U:
3.32 (±0.003)
KI:
3.37 (±0.098)
U: 71.38
(±0.046)
KI: 71.36
(±0.098)
Log kw: 1.22 ϕ0: 1.44
Log kw: 0.81 ϕ0: 1.14
74 KP 1975
U: 0.49
(±0.004)
KI: 0.80
(±0.003)
U: 12.49
(±0.015)
KI: 17.58
(±0.044)
Log kw: –2.00 ϕ0: –1.92
Log kw: –1.77 ϕ0: –2.00

- 86 -
Number Name/Acronym Structure Log kw Log P (HPLC) Log P (ICP-MS) Log P
Literature
75 KP 2212
U: 1.04
(±0.027)
KI: 1.13
(±0.060)
U: 28.76
(±0.022)
KI: 31.79
(±0.051)
Log kw: –1.58 ϕ0: –1.59
Log kw: –1.44 ϕ0: –1.45
76 KP 2054
U: 1.52
(±0.029)
KI: 1.61
(±0.059)
U: 36.82
(±0.116)
KI: 38.78
(±0.170)
Log kw: –0.98 ϕ0: –1.29
Log kw: –0.96 ϕ0: –1.11
77 KP 2216
U: 1.91
(±0.004)
KI: 1.91
(±0.016)
U: 51.37
(±0.120)
KI: 53.16
(±0.084)
Log kw: –0.61 ϕ0: –0.35
Log kw: –0.66 ϕ0: –0.24
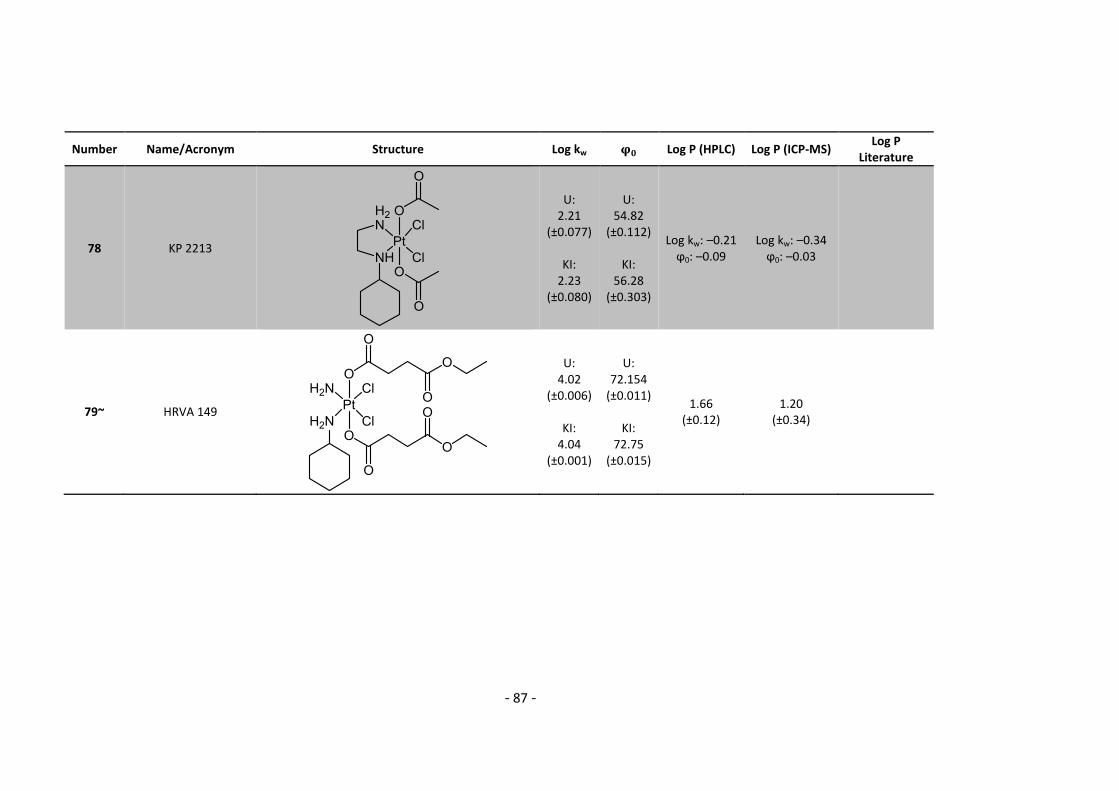
- 87 -
Number Name/Acronym Structure Log kw Log P (HPLC) Log P (ICP-MS) Log P
Literature
78 KP 2213
U: 2.21
(±0.077)
KI: 2.23
(±0.080)
U: 54.82
(±0.112)
KI: 56.28
(±0.303)
Log kw: –0.21 ϕ0: –0.09
Log kw: –0.34 ϕ0: –0.03
79~ HRVA 149
U: 4.02
(±0.006)
KI: 4.04
(±0.001)
U: 72.154
(±0.011)
KI: 72.75
(±0.015)
1.66 (±0.12)
1.20 (±0.34)
- 88 -
6. References
1. WHO www.who.int.en (04.09.2013), 2. Löffler, G. P., P. E.; Heinrich, P. C., Biochemie und Pathobiochemie. Springer: 2006. 3. Globocan http://globocan.iarc.fr/ (21.01.2014), 4. Statistik-Austria http://www.statistik.at/ (29.07.2013), 5. Alberts, B. J., A.; Lewis, J.; Raff, M.; Roberts, K.; Walter, P., Molecular Biology of the Cell. 5th ed.; Garland Science: 2012. 6. Campbell, N. A. R., J.B. , Biologie. Pearson: 2006; Vol. 6. 7. Biosciences, B. The Cell Cycle. http://www.bdbiosciences.com/research/apoptosis/analysis/index.jsp (21.01.2014), 8. Primik, M. F. Effects of Metal Coordination and Peptide Conjugation on the Antiproliferative Activity of Indolo[3,2-d]benzazepines and Indolo[3,2-c]quinolines. University of Vienna, Vienna, 2013. 9. Rosenberg, B.; Van Camp, L.; Krigas, T., Nature 1965, 205, 698-699. 10. Rosenberg, B.; Vancamp, L.; Trosko, J. E.; Mansour, V. H., Nature 1969, 222, 385-386. 11. Wheate, N. J.; Walker, S.; Craig, G. E.; Oun, R., Dalton Transactions 2010, 39, 8113-8127. 12. Wexselblatt, E.; Yavin, E.; Gibson, D., Inorganica Chimica Acta 2012, 393, 75-83. 13. Kelland, L., Nature Reviews Cancer 2007, 7, 573-584. 14. Puckett, C. A.; Ernst, R. J.; Barton, J. K., Dalton Transactions 2010, 39, 1159-1170. 15. Fichtinger-Schepman, A. M. J.; Van der Veer, J. L.; Den Hartog, J. H. J.; Lohman, P. H. M.; Reedijk, J., Biochemistry 1985, 24, 707-713. 16. Eastman, A., Cancer cells (Cold Spring Harbor, N.Y. : 1989) 1990, 2, 275-280. 17. Todd, R. C.; Lippard, S. J., Journal of Inorganic Biochemistry 2010, 104, 902-908. 18. Perera, A.; Jackson, H.; Sharma, H. L.; McAuliffe, C. A.; Fox, B. W., Chemico-Biological Interactions 1992, 85, 199-213. 19. Wexselblatt, E.; Gibson, D., Journal of Inorganic Biochemistry 2012, 117, 220-229. 20. Lippert, B., Cisplatin - Chemistry and Biochemistry of a Leading Anticancer Drug. Wiley-VCH: 1999. 21. Luo, F. R.; Wyrick, S. D.; Chaney, S. G., Journal of Biochemical and Molecular Toxicology 1999, 13, 159-169. 22. Burger, H.; Zoumaro-Djayoon, A.; Boersma, A. W. M.; Helleman, J.; Berns, E.; Mathijssen, R. H. J.; Loos, W. J.; Wiemer, E. A. C., British Journal of Pharmacology 2010, 159, 898-908. 23. Buß, I.; Garmann, D.; Galanski, M.; Weber, G.; Kalayda, G. V.; Keppler, B. K.; Jaehde, U., Journal of Inorganic Biochemistry 2011, 105, 709-717. 24. Mabuchi, S.; Kimura, T., Chemotherapy Research and Practice 2011, 2011. 25. Lee, K. H.; Hyun, M. S.; Kim, H.-K.; Jin, H. M.; Yang, J.; Song, H. S.; Do, Y. R.; Ryoo, H. M.; Chung, J. S.; Zang, D. Y.; Lim, H.-Y.; Jin, J. Y.; Yim, C. Y.; Park, H. S.; Kim, J. S.; Sohn, C. H.; Lee, S. N., Cancer Research and Treatment 2009, 41, 12-18. 26. McKeage, M. J., Expert Opinion on Investigational Drugs 2001, 10, 119-128. 27. Kim, N. K.; Kim, T.-Y.; Shin, S.-G.; Park, Y. I.; Lee, J. A.; Cho, Y.-B.; Kim, K. H.; Kim, D.-K.; Heo, D. S.; Bang, Y.-J., Cancer 2001, 91, 1549-1556. 28. Lee, J.-W.; Park, J.-K.; Lee, S.-H.; Kim, S.-Y.; Cho, Y.-B.; Kuh, H.-J., Anti-Cancer Drugs 2006, 17, 377-384 10.1097/01.cad.0000205033.08838.c7. 29. Iwazawa, J.; Hashimoto, N.; Ohue, S.; Mitani, T., Anticancer Research 2012, 32, 5039-5044. 30. Okusaka, T.; Kasugai, H.; Ishii, H.; Kudo, M.; Sata, M.; Tanaka, K.; Shioyama, Y.; Chayama, K.; Kumada, H.; Yoshikawa, M.; Seki, T.; Saito, H.; Hayashi, N.; Shiratori, K.; Okita, K.; Sakaida, I.;
- 89 -
Honda, M.; Kusumoto, Y.; Tsutsumi, T.; Sakata, K., Investigational New Drugs 2012, 30, 2015-2025. 31. Yang, X.; Jin, X.; Song, Q.; Tang, K.; Yang, Z.; Zhang, X.; Tang, Y., Science China Chemistry 2010, 53, 1346-1351. 32. Li, G.-q.; Chen, X.-g.; Wu, X.-p.; Xie, J.-d.; Liang, Y.-j.; Zhao, X.-q.; Chen, W.-q.; Fu, L.-w., PLoS ONE 2012, 7, e48994. 33. Shi, Y.; Liu, S.-A.; Kerwood, D. J.; Goodisman, J.; Dabrowiak, J. C., Journal of Inorganic Biochemistry 2012, 107, 6-14. 34. Hall, M. D.; Hambley, T. W., Coordination Chemistry Reviews 2002, 232, 49-67. 35. Pichler, V. Synthesis and Characterisation of Novel Antitumour Active Platinum(IV) Compounds. Univeristy of Vienna, Vienna, 2009. 36. Varbanov, H. Novel antineoplastic platinum(IV) complexes: synthesis, characterization, biological investigations and structure-activity relashionships. University of Vienna, Vienna, 2013. 37. Galanski, M.; Jakupec, M. A.; Keppler, B. K., Current medicinal chemistry 2005, 12, 2075-2094. 38. Anderson, H.; Wagstaff, J.; Crowther, D.; Swindell, R.; Lind, M. J.; McGregor, J.; Timms, M. S.; Brown, D.; Palmer, P., European Journal of Cancer and Clinical Oncology 1988, 24, 1471-1479. 39. O'Rourke, T. J.; Weiss, G. R.; New, P.; Burris, H. A. I.; Rodriguez, G.; Eckhardt, J.; Hardy, J.; Kuhn, J. G.; Fields, S.; Clark, G. M.; Von Hoff, D. D., Anti-Cancer Drugs 1994, 5, 520-526. 40. Galanski, M.; Keppler, B. K., Inorganic Chemistry 1996, 35, 1709-1711. 41. Reithofer, M.; Galanski, M.; Roller, A.; Keppler, B. K., European Journal of Inorganic Chemistry 2006, 2006, 2612-2617. 42. Varbanov, H. P.; Valiahdi, S. M.; Kowol, C. R.; Jakupec, M. A.; Galanski, M.; Keppler, B. K., Dalton Transactions 2012, 41, 14404-14415. 43. Varbanov, H.; Valiahdi, S. M.; Legin, A. A.; Jakupec, M. A.; Roller, A.; Galanski, M.; Keppler, B. K., European Journal of Medicinal Chemistry 2011, 46, 5456-5464. 44. Pichler, V.; Göschl, S.; Meier, S. M.; Roller, A.; Jakupec, M. A.; Galanski, M.; Keppler, B. K., Inorganic Chemistry 2013, 52, 8151-8162. 45. Ang, W. H.; Khalaila, I.; Allardyce, C. S.; Juillerat-Jeanneret, L.; Dyson, P. J., Journal of the American Chemical Society 2005, 127, 1382-1383. 46. Dhar, S.; Lippard, S. J., Proceedings of the National Academy of Sciences 2009, 106, 22199-22204. 47. Primik, M. F.; G schl, S.; akupec, M. A.; Roller, A.; eppler, B. .; Arion, . B., Inorganic Chemistry 2010, 49, 11084-11095. 48. Tinoco, A. D.; Thomas, H. R.; Incarvito, C. D.; Saghatelian, A.; Valentine, A. M., Proceedings of the National Academy of Sciences of the United States of America 2012, 109, 5016-5021. 49. Enyedy, É. A.; Dömötör, O.; Varga, E.; Kiss, T.; Trondl, R.; Hartinger, C. G.; Keppler, B. K., Journal of Inorganic Biochemistry 2012, 117, 189-197. 50. Antonarakis, E.; Emadi, A., Cancer Chemotherapy and Pharmacology 2010, 66, 1-9. 51. Clarke, M. J.; Zhu, F.; Frasca, D. R., Chemical Reviews 1999, 99, 2511-2534. 52. Scolaro, C.; Bergamo, A.; Brescacin, L.; Delfino, R.; Cocchietto, M.; Laurenczy, G.; Geldbach, T. J.; Sava, G.; Dyson, P. J., Journal of Medicinal Chemistry 2005, 48, 4161-4171. 53. Chatterjee, S.; Kundu, S.; Bhattacharyya, A.; Hartinger, C.; Dyson, P., Journal of Biological Inorganic Chemistry 2008, 13, 1149-1155. 54. Sava, G.; Zorzet, S.; Turrin, C.; Vita, F.; Soranzo, M.; Zabucchi, G.; Cocchietto, M.; Bergamo, A.; DiGiovine, S.; Pezzoni, G.; Sartor, L.; Garbisa, S., Clinical Cancer Research 2003, 9, 1898-1905.
- 90 -
55. Aird, R. E.; Cummings, J.; Ritchie, A. A.; Muir, M.; Morris, R. E.; Chen, H.; Sadler, P. J.; Jodrell, D. I., British Journal Cancer 2002, 86, 1652-1657. 56. Heffeter, P.; Atil, B.; Kryeziu, K.; Groza, D.; Koellensperger, G.; Körner, W.; Jungwirth, U.; Mohr, T.; Keppler, B. K.; Berger, W., European Journal of Cancer. 57. Bergamo, A.; Masi, A.; Dyson, P. J.; Sava, G., International Journal of Oncology 2008, 33, 1281-9. 58. Nowak-Sliwinska, P.; van Beijnum, J. R.; Casini, A.; Nazarov, A. A.; agni res, G.; van den Bergh, H.; Dyson, P. J.; Griffioen, A. W., Journal of Medicinal Chemistry 2011, 54, 3895-3902. 59. Morris, R. E.; Aird, R. E.; del Socorro Murdoch, P.; Chen, H.; Cummings, J.; Hughes, N. D.; Parsons, S.; Parkin, A.; Boyd, G.; Jodrell, D. I.; Sadler, P. J., Journal of Medicinal Chemistry 2001, 44, 3616-3621. 60. Bohnert, T. P., Ch., ADME Profiling in Drug Discovery and Development: An Overview. In Encyclopedia of Drug Metabolism and Interactions, 6-Volume Set, Lyubimov, A. V., Ed. John Wiley & Sons, Inc.: 2012; Vol. 1. 61. Gareth, T., Medical Chemistry - An Introduction. 2nd ed.; John Wiley & Sons: 2007. 62. Otto, M., Analytische Chemie. 3 ed. 63. Skoog, D. A.; Leary, J. J., Instrumentelle Analytik. Springer: 1996. 64. Maureen, J. Rapid Resolution High Definition Columns and More http://www.chem.agilent.com/Library/slidepresentation/Public/Rapid%20Resolution%20High%20Definition%20Columns%20and%20More%20UHPLC%20Columns.pdf (18.02.2014), 65. Fountain, K. UPLC versus UHPLC: Comparison of Loading and Peak Capacity for Small Molecule Drugs. http://www.waters.com/webassets/cms/library/docs/720003869en.pdf (18.02.2014), 66. Thomas, R. A Beginner’s Guide to ICP-MS. www.spectroscopyonline.com 67. Gammelgaard, E. S., S.; Moller, Ch., Inductively Coupled Plasma Mass Spectrometry for Analysis of Metal-Containing Pharmaceuticals. In Encyclopedia of Drug Metabolism and Interactions, Lyubimov, A. V., Ed. John Wiley & Sons, Inc.: 2012. 68. Browner, R. F.; Boorn, A. W., Analytical Chemistry 1984, 56, 786A-798A. 69. Henchoz, Y.; Guillarme, D.; Martel, S.; Rudaz, S.; Veuthey, J.-L.; Carrupt, P.-A., Analytical and Bioanalytical Chemistry 2009, 394, 1919-1930. 70. Valkó, K., Journal of Chromatography A 2004, 1037, 299-310. 71. Valkó, K.; Slégel, P., Journal of Chromatography A 1993, 631, 49-61. 72. Nasal, A.; Siluk, D.; Kaliszan, R., Current medicinal chemistry 2003, 10, 381-426. 73. OECD, Test No. 107: Partition Coefficient (n-octanol/water): Shake Flask Method. OECD Publishing. 74. OECD, Test No. 117: Partition Coefficient (n-octanol/water), HPLC Method. OECD Publishing. 75. Platts, J. A.; Oldfield, S. P.; Reif, M. M.; Palmucci, A.; Gabano, E.; Osella, D., Journal of Inorganic Biochemistry 2006, 100, 1199-1207. 76. Tetko, I. V.; Jaroszewicz, I.; Platts, J. A.; Kuduk-Jaworska, J., Journal of Inorganic Biochemistry 2008, 102, 1424-1437. 77. Reithofer, M. R.; Bytzek, A. K.; Valiahdi, S. M.; Kowol, C. R.; Groessl, M.; Hartinger, C. G.; Jakupec, M. A.; Galanski, M.; Keppler, B. K., Journal of Inorganic Biochemistry 2011, 105, 46-51. 78. Platts, J.; Ermondi, G.; Caron, G.; Ravera, M.; Gabano, E.; Gaviglio, L.; Pelosi, G.; Osella, D., Journal of Biological Inorganic Chemistry 2011, 16, 361-372. 79. Tetko, I.; Jaroszewicz, I.; Platts, J.; Kuduk-Jaworska, J., Chemistry Central Journal 2008, 2, 1-1. 80. Kim, Y.-S.; Song, R.; Chung, H. C.; Jun, M. J.; Sohn, Y. S., Journal of Inorganic Biochemistry 2004, 98, 98-104. 81. Hall, M. D.; Amjadi, S.; Zhang, M.; Beale, P. J.; Hambley, T. W., Journal of Inorganic Biochemistry 2004, 98, 1614-1624.
- 91 -
82. Robillard, M. S.; Galanski, M.; Zimmermann, W.; Keppler, B. K.; Reedijk, J., Journal of Inorganic Biochemistry 2002, 88, 254-259. 83. Platts, J. A.; Hibbs, D. E.; Hambley, T. W.; Hall, M. D., Journal of Medicinal Chemistry 2000, 44, 472-474. 84. Lee, Y.-A.; Lee, S. S.; Kim, K. M.; Lee, C. O.; Sohn, Y. S., Journal of Medicinal Chemistry 2000, 43, 1409-1412. 85. Screnci, D.; McKeage, M. J.; Galettis, P.; Hambley, T. W.; Palmer, B. D.; Baguley, B. C., British Journal Cancer 2000, 82, 966-972. 86. Yoshida, M.; Khokhar, A. R.; Siddik, Z. H., Cancer Research 1994, 54, 3468-3473. 87. Souchard, J. P.; Ha, T. T.; Cros, S.; Johnson, N. P., Journal of Medicinal Chemistry 1991, 34, 863-864. 88. Schoenmakers, P. J.; Billiet, H. A. H.; Tussen, R.; De Galan, L., Journal of Chromatography A 1978, 149, 519-537. 89. Ba¸czek, T.; Markuszewski, M.; Kaliszan, R.; van Straten, M. A.; Claessens, H. A., Journal of High Resolution Chromatography 2000, 23, 667-676.
- 92 -
7. List of Tables Table 1: Timeline of log P measurements ...................................................................................... 25 Table 2: HPLC – parameters for log k determination .................................................................... 27 Table 3: ICP-MS – parameters for log P determination ................................................................. 29 Table 4: Retention times of uracil and KP1916 & calculated log kw values ................................... 31 Table 5: Comparison of the most hydrophilic (Pt(NH3)cha(OH)4) and lipophilic (HRVA035)
compounds investigated ..................................................................................................... 36 Table 6: Shaking Time evaluation using carboplatin, satraplatin and HRVA101 ........................... 37 Table 7: Log P – buffer experiments .............................................................................................. 43 Table 8: Log P determination without buffer. Compounds marked as * are platinum(II)
substances ........................................................................................................................... 46 Table 9: Comparison of HPLC and ICP-MS for log P determination ............................................... 59 Table 10: Retention times of uracil and KI ..................................................................................... 62
8. List of Figures Figure 1: Worldwide leading causes of death by groups and sex in 20111 ..................................... 1 Figure 2: Worldwide cancer incidence and mortality rate 20123 .................................................... 2 Figure 3: Mortality rate Austria1 ..................................................................................................... 3 Figure 4: The cell cycle7 .................................................................................................................... 4 Figure 5: Cancer origin and distribution5,8 ....................................................................................... 5 Figure 6: Activation of cisplatin - monofunctional and bifunctional adducts binding to guanine
(A).11,13 Crystal structure of cisplatin cross-linking two guanines in a short double-stranded DNA (B).17 ............................................................................................................................... 7
Figure 7: Structure of cisplatin, carboplatin and oxaliplatin ............................................................ 8 Figure 8: Structures of nedaplatin (a), lobaplatin (b), dicycloplatin (c), heptaplatin (d) and
miriplatin (e) .......................................................................................................................... 9 Figure 9: General structure of platinum(IV) compounds (A). Synthetic pathway to symmetric
platinum(IV) metallodrugs (B).35,36 ...................................................................................... 11 Figure 10: Activation by reduction principle37 ............................................................................... 11 Figure 11: Structures of tetraplatin (a), iproplatin (b) and satraplatin (c) ..................................... 12 Figure 12: Platinum(IV) drugs can be tuned by axial ligand modifications in terms of lipophilicity
(a), as a GST inhibitor (b) or as an agent altering the mitochondrial membrane potential (c).19 .................................................................................................................................... 12
Figure 13: KP1339 (a), NAMI-A (b), RAPTA-C (c) and RM175 (d) ................................................... 13 Figure 14: Chromatography scheme63 – the yellow band is a mixture containing different
compounds. Due to the different interactions with the stationary phase the compounds will be separated into two different bands (red and green band) ...................................... 15
Figure 15: UV detection cell63 ........................................................................................................ 17 Figure 16: Overview of an ICP-MS system66................................................................................... 18 Figure 17: Generation of an aerosol in an ICP-MS spray chamber66 ............................................. 19 Figure 18: Ion focusing system66 .................................................................................................... 20 Figure 19: Illustration of retention indices .................................................................................... 22 Figure 20: Scheme of Log P sample preparation and determination ............................................ 28 Figure 21: Comparison of the retention times of uracil and KI at different percentages of MeOH
in the eluent ......................................................................................................................... 30 Figure 22: Plot of log k vs. % of MeOH ........................................................................................... 32 Figure 23: Correlation of log kw and ϕ0 with uracil and KI of 67 platinum(IV) complexes............. 33
- 93 -
Figure 24: Log kw vs. ϕ0 - uracil (left) and KI (right) ........................................................................ 34 Figure 25: (A) Log P correlation of HPLC (direct) vs. HPLC (indirect) and (B) HPLC (indirect) vs. ICP-
MS ........................................................................................................................................ 38 Figure 26: Log P (HPLC, direct) vs. Log P (ICP-MS) correlation. (A) All 19 compounds and (B)
compounds within the linear range of –1.5 to 1.3 for both methods (11 substances) ....... 39 Figure 27: Log kw (KI) vs. log P – HPLC (A) & ICP-MS (B) ................................................................. 54 Figure 28: ϕ0 (KI) vs. log P – HPLC (A) & ICP-MS (B) ....................................................................... 55 Figure 29: Log kw (KI) vs. log P – HPLC (A) & ICP-MS (B) – adjusted list ......................................... 56 Figure 30: ϕ0 (KI) vs. log P – HPLC (A) & ICP-MS (B) – adjusted list ................................................ 57
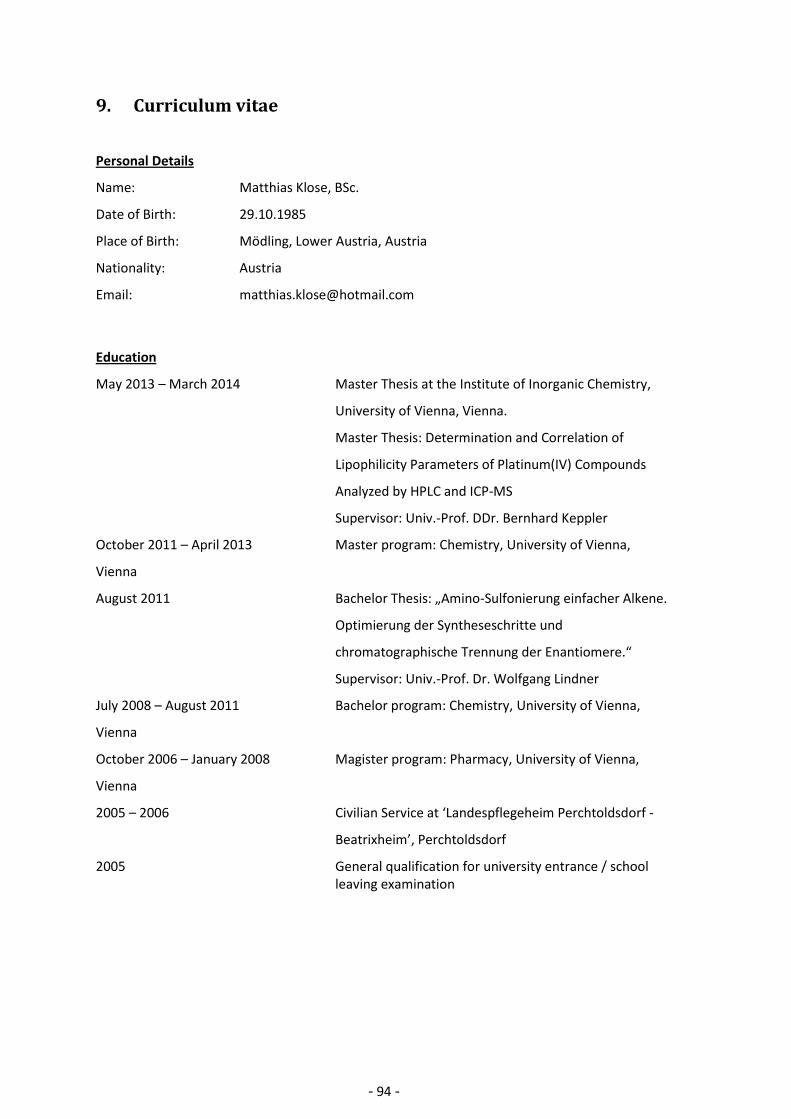
- 94 -
9. Curriculum vitae Personal Details
Name: Matthias Klose, BSc.
Date of Birth: 29.10.1985
Place of Birth: Mödling, Lower Austria, Austria
Nationality: Austria
Email: [email protected]
Education
May 2013 – March 2014 Master Thesis at the Institute of Inorganic Chemistry,
University of Vienna, Vienna.
Master Thesis: Determination and Correlation of
Lipophilicity Parameters of Platinum(IV) Compounds
Analyzed by HPLC and ICP-MS
Supervisor: Univ.-Prof. DDr. Bernhard Keppler
October 2011 – April 2013 Master program: Chemistry, University of Vienna,
Vienna
August 2011 Bachelor Thesis: „Amino-Sulfonierung einfacher Alkene.
Optimierung der Syntheseschritte und
chromatographische Trennung der Enantiomere.“
Supervisor: Univ.-Prof. Dr. Wolfgang Lindner
July 2008 – August 2011 Bachelor program: Chemistry, University of Vienna,
Vienna
October 2006 – January 2008 Magister program: Pharmacy, University of Vienna,
Vienna
2005 – 2006 Civilian Service at ‘Landespflegeheim Perchtoldsdorf -
Beatrixheim’, Perchtoldsdorf
2005 General qualification for university entrance / school leaving examination
- 95 -
Research Interests
Analytical chemistry: drug development and characteristics; metallomics Method Skills
HPLC, ICP-MS Personal Skills Mother tongue: German Languages: German, English Computer skills: Word Excel LaTeX „Ich habe mich bemüht, sämtliche Inhaber der Bildrechte ausfindig zu machen. Sollte dennoch
eine Urheberrechtsverletzung bekannt werden, ersuche ich um Meldung bei mir.“ – M.H.M. Klose