Embed Size (px)
Citation preview

.
3* buR- 94-1813
Tit/e:
Author(s):
Submitted to:
FREE-FIELD GR03ND MOTIONS FOR THE NONPROLIFERATIOEXPERIMENTS PRELIMINARY COMPARISONS WITH NEARBYNUCLEAR EVENTS
Anthony L. Peratt, P-15
Kenneth H. Olsen, P-15
DOE Symposium on the NonproliferationExperiment Result and Implication for TestBan Treaties
Los Alamos National Laboratory. an affirmative action/equal opportunity empdyer IS operated by the University ot California for the U.S. Department of EhecgYunder contract W.7405SNG-36. By acceptance ot this article, the publisher recognizes that the U.S. Government retains a nonexclusive. royalty-tree licenee topublish or reproduce the published form o! this contribution, or to allow others to do eo, tar U.S. Govemment purposes. The Los Alamos National Laboratoryrequests that the publisher identity this article a9 work performed under the eusplces ot the U.S. Department of Energy.
,&2- Fla a38 R5

FREE-FIELD GROUND MOTIONS FOR THE NONPROLIFERATIONEXPERIMENT: PRELIMINARY COMPARISONS WITH NEARBY
NUCLEAR EVENTS
KENNETH H. OLSEN and ANTHONY L. PERATT
Explosion Effects Physics Project, Group P-15, Lus Alamos National Laboratory, LosAlamos, NM 87545, [email protected]; [email protected].
Revised Abstract
Since 1987, in an effort to provide more extensive close-in (40 km) data sets for modem regionaland teleseismic source function studies, we have installed fixed arrays of t&axial accelerometers inthe free-field near the shot horizons for low-yield (< 20 kt) nuclear events in the N-tunnel complexbeneath Rainier Mesa. For the Nonproliferation Experiment (NPE) we augmented the array toachieve 23 free-field stations. Our accelerometer arrays span distance intervals between the non-linear material failure region-where peak stresses are the same order as rock strengths (~200 bars
and ranges typically -5&150 m)-and distances (-1 km) where linear-elastic response isexpected (stress <50 bars; accelerations cl g). Goals are: (a) to examine robustness and stability of
various free-field source function estimate&+-e.g., reduced displacement potentials (RDP) andspectr’a; (b) to compare close-in with regional estimates to test whether detailed close-in free-fieldand/or surface ground motion data can improve predictability of regional-teleseismic sourcefunctions; (c) to provide experimental data for checking two-dimensional numerical simulations.
We report preliminary comparisons between experimental free-field data for NPE (1993) andthree nearby nuclear events (MISTY ECHO, 1988; MINERAL QUARRY, 1990; HUNTERS
TROPHY, 1992). All four working points ate within 1 km of each other in the same wet tuff bed,
thus reducing concerns about possible large differences in material properties between widely
separated shots. Initial comparison of acceleration and velocity seismograms for the four events
reveals: (1) There is a large departure from the spherical symmetry commonly assumed in analytic
treatments of source theory; both vertical and tangential components are surprisingly large. (2) Allshots show similar first-peak particle-velocity amplitude decay rates -R-l.8 suggesting significant
attenuation even in the supposedly purely elastic region. (3) Sharp (>20 Hz) arrivals are rwtobserved at tunnel level from near-surface pP reflections or spall-closunz sources---but broadenedpeaks are seen that suggest yore diffuse reflected energy from the surface and from the Paleozoiclimestone basement below tunnel level.

t
Introduction
Close-in free-field measurements of stress wave propagation in geologic media with well-documented material properties can play a unique role in establishing a fundamental physical basisfor predicting equivalent elastic seismic source functions for most types of undergroundexplosions in arbitrary geological environments. Since 1987, as part of a coordinated experimentalprogram to study the basic physics of the evolution of explosion waves from the hydrodynamicand highly non-linear material response regions very close to the source out to purely elasticmotions at distances c 10 km, we installed fixed arrays of t&axial accelerometers in the free-fieldat the shot horizons for low-yield (I 20 kt) nuclear events in N-tunnel complex beneath Rainier
Mesa at NTS. We supplemented the arrays for additional free-field observations of the Non-Proliferation Experiment (NPE). Our main purpose has been to help bridge the “knowledge gap”between numerous essentially high-pressure equation of state (EOS) and shock physics studiesvery close to the explosion and the also numerous surface seismic measurements made atdistances beyond a few km. Our measurements focus principally on the “nonlinear-to-lineartransition zone” at distances between about 50 m and 1000 m, which should include the indistinctregion loosely known as the “elastic radius.*’ Goals are both (a) to provide experimental “ground-truth” data for detailed compariscn with state-of-the-art two-dimensional numerical models, and(b) to provide detailed free-field data in the vicinity of the “elastic radius” against which seismicinversion and equivalent source function scaling techniques can be critically tested.
Table 1 is a summary of locations and seismic parameters for the four underground explosions at
N-tunnel for which we have made free-field observations. In a previous paper (Olsen and Peratt,1993), we made selected comparisons offirst peak (only) trunsienf v&es of acceleration, particlevelocity, and displacement for the three nearby nuclear events (MISTY ECHO, 1988; MINERAL
QUARRY, 1990; HUNTERS TROPHY, 1992) preceding the NPE. In this short contribution, weshow preliminary free-field results from our NPE observations together with selected data from
the MISTY ECHO nuclear event, but we will present waveform data in preference to only transient
first-peak values. However, because the yields of the nuclear shots have not yet been declassified,
we axe unable at this time to present a satisfactory detailed quantitative comparison between thenuclear and “chemical” sources. Instead, we will stress general features of the waveform data forall four explosions that pertain chiefly to the basic physical processes occurring in the free-field,nonlinear-to-linear transition zone. More extensive analyses using spectral and teduceddisplacement (RDP) techniques are underway but will not be reported here.

.
Free-field waveform data
Figure 1 is a schematic cross section showing general features of underground free-fieldaccelerometer array installation for our Rainier Mesa seismic source physics experiments. Figute 2displays a plan view of part of the N-tunnel complex and shows the final 23-station configurationof the accelerometer array that was in place for the NPE. As discussed in the caption, the N-tunnelaccelerometer array grew piecemeal with time as successive shots were planned and executed overthe years in the N-tunnel complex; only seven stations were installed for the initial 1988 MISTYECHO shot, for instance. In designing the underground arrays, we always tried to achieve asbroad range-interval and azimuthal distributions with respect to each new source as was possiblewithin the tunnel-access constraints of the time. Because most of our instrument packages operatedby design in the distal portions of the crush and shear region where peak accelerations and stresses
seldom exceeded -500 g and -1 kilobars respectively, most of these grouted, sealed instrumentpackages with associated cabling usually survived and could be reactivated for ,ucc-&ng shots.However, this often meant that individual instrument sensitivities (i.e., Volts/g) and gauge linearitylimits (both unchangeable after initial grouting-in) could not be optimized for followingexperiments. In practice, as the number of stations in the array grew, most new added instrumentswere high-g-limit units installed close to the newest working point in order to acquire as much newdata in the nonlinear material (rock) response regime as possible.
For several reasons, the 7-station MISTY ECHO (ME) array achieved the highest performance ofall of the 4 experiments in terms of gage sensitivity, fully optimized digital dynamic recording
ranges, and lowest electrical and data processing noise levels. The MISTY ECHO data set thususually displays the clearest examples of many of the general free-field waveform characteristics
that we wish to point out in this contribution. We will first overview the NPE data and then display
selected waveform plots from the ME data set in order to better understand the more important
general characteristics of the free-field data sets from all our N-tunnel experiments.
(A word of caution in viewing the plots is in order: We display here mainly velociry anddisplucemenr waveforms which are derived by integration of the primary acceleration data. After
integration, one normally makes corrections (1) for long-term trends aue to any electronic noise
introduced by the data processing/recording system hardware and also (2) to remove ‘ramps,’ and
trends resulting from the integration process. For example, integrated velocity values should tctumto the zero baseline at very long times (> 20 s in our case). However, our initial attempts to apply
very simple filtering and correction processes to achieve this often severely modified‘intermediate’ frequency (-1-2 Hz) signals that were obviously geophysical in origin. For thisinitial overview, we have elected not to apply any long-term corrections. Thus, values for some

insqped parameters, such as “permanent” particle displacements, steady-state values of the RDP,and “‘DC-levels” for spectra should be recognized as possibly somewhat uncertain and inaccurateat this time.)
Slant-range and gauge perfo~~~~ance data for the NPE free-field array is summarized in Table 2.
Unfortunately, due to a faulty grout mixture during installation of the four new high-g units (TM31-34) closest to the NPE charge about 10 months prior to the shot, these gauges failed at verylow stress levels and gave invalid acceleration readings shortly after initial shock arrival. Thus,much of the higher-stress-EOS portion of our experiment was lost, but most of the more distantexisting stations yielded good data that extended well into the elastic zone.
Figms 3a, 3b, and 3c display the first two seconds of the NPE purricle velocity records for theRadial, Tangential, and Vertical (Z) components respectively. A priori, one would expect to
observe that the higher Frequency energy is attenuated more rapidly with distance due especially tononlinear crush and shear processes close-in. Indeed, this initial pulse broadening and selectiveattenuation of higher frequencies in the coda during about the first second of record can be seen-particularly on the radial and vertical components. (This effect is displayed even more clearly onthe ME records of Fig. da and Fig. 6b).
While one can readily trace the evolution with distance of several high-frequency waveformfeatures and phases on both the radial- and vertical-component stacks, transverse-components
(Fig. 3b) appear to show very little coherence in this Respect between successive seismograms inthe stack. Indeed, there appears to be poor consistency even in the polarities of the initial pulses.
We interpret this to mean that transverse energy arises here mainly from scattering and multi-pathing due to small, random inhomogeneities throughout the bedded tuffs of Rainier Mesa. We
intend to evaluate such effects more thoroughly by future detailed studies of both acceleration andvelocity spectra.
The NPE vertical component velocity waveform stack (Fig. 3c) displays many of the same high-frequency (-50 Hzj features and phases shown on the corresponding radial seismograms (Fig.
3a). There is a high coherence between the radial and vertical seismograms (high R-Z coherence
also is seen on the primary accelerograms). The good coherence between radial and vertical
components for N-tunnel free-field data is principally due to the fact that there is a particularbedded tuff layer immediately below tunnel level in this part of Rainier Mesa which has a strong
positive velocity gradient (velocity increases downward). Thus, much initially down-going energyis refracted back upward by this strong positive gradient; significant vertically-traveling energy isevident on all our seismograms-even at the closest ranges -50 m. Also of great interest are the

.
“long-period” (- 2 Hz) oscillations that are particularly evident on all the vertical velocity-seismograms. These oscillations can also be seen, but less obviously, on the radial componentwaveforms, but appear only intermittently and less clearly on transverse comyonents. Similar longperiod oscillations-chiefly on the vertical components-appear on free-field seismograms for allfour N-tunnel shots, both for the NPE ANFO charge and for all three nuclear sources. These long-period oscillations are most clearly seen on the MISTY ECHO vertical velocity records (Fig. 6b).We will comment more extensively on these oscillations when we discuss details of the MErecords below.
Figure 4 displays Radial, Transverse and vertical component velocity waveforms for a singleuiaxial NPE station (TM- lo), all plotted at the same amplitude and time scales. One isimmediately struck with how large axe the m-is-amplitudes (particularly for frequencies >lO Hz) ofthe vertical and transverse components as compared with corresponding radial componentamplitudes. We clearly observe this near-equality of rms component-amplitudes on almost every
station for all four shots (e.g., see also the ME station discussed in Fig. 7 below). Thu_, thereobviously is a very large departure from the spherical symmetry that commonly is assumed inanalytic treatments of source theory. This suggests that one should carefully re-evaluate the practiceof comparing only radial-component, close-in, free-field data with spherically-symmetricequivalent seismic source functions &rived from inversion of distant seismic observations. Wenoted above that the relatively large amplitudes of vertical components has at least a partialexplanation because of strong upward refraction from thi; strong velocity gradient just beneathtunnel level, but this cannot satisfactorily account for ail the effect in the surprisingly large
transverse components. In discussing transverse waveforms in Figure 3b, we suggested that much
of the non-radial, higher-frequency energy arises from scattering and multi-path propagation due toroughly meter-size inhomogeneities of the surrounding geological medium. Strong scattering and
multi-pathing would lead to an effective equipartitioning of rms energy over propagation distances
of a few tens- to hundreds-of-meters. In all our tunnel experiments, we do indeed observe (&tailsnot shown here) such an increase in equipartitioning versus propagation distance both with respectto rms amplitudes and for fust-peak transient acceleration, velocity, and displacement pulses. In
previous surface-array mund motion measurements on shots in the alluvium of Yucca Flats(Stump, et al., 1994), we have also seen strong evidence in displacement spectra for long-duration,complex wave trains -nd equipartitioning between components. In the Yucca Flats alluvium
experiments, however, the distance-scale over which the equipartition process takes place appearsto be about ten-times greater than that for tunnel tuffs (i.e., for alluvium, waveforms/spectra are
‘simple’ at ranges -500 m but complex/‘equipartitioned’ at -5 km, whereas for N-tunnel tuffs the
corresponding distances are more like 50 m and 500 m, respectively.

The other noteworthy feature seen in Figure 4 (and wy pointed out in comments on Fig. 3cabove) is the “~-HZ long-period” oscillation which is particularly well developed on the verticalcomponent at times after 0.5 s. In Figure 4, we observe that this “~-HZ’* oscillation also is seenquite well on the radial component and is effectively in phase with the vertical oscillation.However, the case for a corresponding long-period oscillation on the transverse component isunconvincing. Again, we defer discussion of rhe long period oscillation until we examine someMISTY ECHO records below.
We now tum to an examination of selected MISTY ECHO waveforms. As noted above, thereason for discussing ME records here is that most general characteristics of all our the free-fielddata sets are particularly well displayed due the more optimal recording conditions for the MEshot. Figure 5 shows the evolution with distance of the radial component displacement (doublyintegrated acceleration) waveforms for ME. These nicely illustrate “overshoot*’ and “rebound” oftransient free-field displacemp.nts and the eventual decay to a “permanent” displacement value. Forinstance, at the closest ME station (TM-2 at 341-m-range) the displacement of the tuff mediumfirst expands to about 25 cm (overshoot), then rebounds back to 7 cm and then expands again toreach an apparent steady- state value of about 12 cm after 2 seconds. These motions mirror similar
but larger motions of the explosion cavity wall. Although not shown here, vertical and transversecomponents of displacement show similar waveform characteristics, but agam, these amplitudes
are surprisingly large. (Comfortingly, “permanent” displacement values for both T- and Z-components in these uncorrected ME records return to within a few millimeters of zero.) We notethat the full sequence of overshoot-rebound-steady-state takes place in a time scale of about 2seconds. This implies that good free-field records of at feusr two-seconds-duration are required inorder to derive reliable estimates for long-period RDP parameters for NTS tunnel shots. (Wemaintain that good records of at least 10-s duration are necessary to &rive meaningful estimates of
long-Fried spectral levels [for moment estimation].)
We return to examining velocity waveforms in the remaining figures. Figures 6a and 6b display
the evolution with distance of MISTY ECHO velocity waveforms for radial and verticalcomponents, respectively. Due to the much lower long-term drifts in the ME data as compared toNPE, it is possible to display 5-second-duration records in Figures 6a and 6b rather than only 2seconds as for NPE (Figs. 3a, 3b, and 3~). Comparing radial components for the two events (Fig.6a and Fig. 3a), we again note the broadening of the initial pulse and the selective decay of higher
(>20 Hz) muencies in the pulse coda, probably mainly due to strong, close-in attenuation
processes-including non-linear crush and shear particularly at ranges 400 m. Although we areunable to quantitatively demonstrate them here because of classification constraints, comparison of

irtitialpeuk values of acceleration (directly related to peak forces on buried structures), velocity, anddisplacements for the three nuclear sources versus those from the NPE ANFO charge suggests thelower-energydensity NPE event is about rW2.c ar eflective as tamped nuclear sources as inproducing mechanical effects, such as peak shock forces on buried structures, etc. Such anapproximately double equivalency factor for completely buried High-Explosive charges (“TNT”)over tamped nuclear sources has been well known for a number of years among nuclear effectsmodeling and explosion crat&ng specialists within the U.S. defense research community (e.g.,Killian, et al. 1987). Although the approximate HE/nuclear equivalency factor quoted here refers
strictly to the smger high-frequency signals near the beginning of the free-field waveforms, ourpnliminary evidence suggests that a nearly equal factor also pertains to the lower-frequency energycharacterizing radiated seismic energy from the two source types.
Figure 6b displays vertical velocity waveforms for ME which show even more clearly severalfeatures already noted for NPE (Fig. 3~). In addition, we call particular attention to the large,“longperiod” (- 1 Hz) oscillations, in-phase on all components, which dominate the vertcal wave
trains at times >l S-2 seconds. We observe such 1 -Hz vertical oscillations at later times on all fourN-tunnel shots (NPE and 3 nuclear) for which we have made free-field measurements (the 2-secondduration NPR records of Fig. 3c arc not quite long enough to display these clearly). Thisuniversality leads us to tentatively conclude that these l-Hz vertical oscillations are more indicativeof larger features of Rainier Mesa geological structure than they are of wave propagation effectsclose to the individual shot points. Consideration of an additional separate line of evidence leads usto suggest an explanation for several features of the vertical free-field seismograms. One cannot
readily discern on vertical seismograms any sharp pulse returning after near-total reflections (a pPreflection) from the Mesa-top free-surface. Actually, there should be rwo reflection pulses: one due
to pP from the surface and another from the large velocity contrast between the mesa tuffs and thePaleozoic limestone basement about 200-400 m below the tunnel-level gauges (the reflection
coefficient here should be fairly large because the P-velocity contrast probably exceeds I km/s).
Examination of Figure 6b suggests the presence of two, broadened upward peaks at about 250 ms
and 4CO-500 ms after the initial sharp, “shock” pulse on all seismograms. Pending detailed
forward Inodeling, we suggest these are the diffused reflections from the free-surface above @P),and from the Paleozoic limestone basement below. Thus, considerable mainly vertically-traveling,
seismic energy is reflected back and forth between these two strong largely-horizontal reflectorsleading to “trapping” of energy and rather coherent, mostly vex-&l oscillations which probably
cause Rainier Mesa to vibrate vertically essentially as a unit. This preliminary explanation needs tobe tested by more detailed data analysis and by numerical modeling.

Finally, shown in Figure 7 are radial, transverse and verticalcomponent velocity waveforms for asingle biaxial MISTY ECHO station (TM-3), all plotted at the same amplitude and time scales(compare with NPE in Fig. 4). In contrast to NPE signals of Figure 4, this ME station is located ata somewhat larger peak stress level (probably still within the nonlinear crush and shear failurezone) so the radial component dominates and “equipartitioning” between components has notprocc&d as far. Nevertheless, there already is significant higher frequency enn gy (> 20 Hz) inboth the vertical and transverse components.
Concluding remarks
T’hc main important points from this initial overview of the NPE free-field experiments am:
l Both nuclear & NPE shots show an approximately bi-modal energy distribution withmuency :
1. High Frequencies (> 10-20 Hz) arise! from the expanding/attenuating shock front.
2. Low frequency (-1-2 Hz) of lower amplitudes at later times in seismogram (Significant as alarge portion of total energy radiated as seismic waves to regional and teleseismic distances).
l Conversion to low frequencies appears very efficient on vertical component seismograms (largesurface [pP] and basement reflections)
l For high-frequency, first-peak smng-motion accelerations & velocities, NPE is more! efficient
(roughly x 2) than tamped nuclear sources.
In surveying free-field ground motions from all four N-tunnel shots, we continue to be impressed
by the large amount of close-in seismic energy residing in the vertical and transverse componentsand at the “non-spherical” complexity of close-in free-field ground motions even at the relatively
close ranges explored by our N-tunnel experiments. This complexity suggests that considerablecare needs to be observed in comparing and understanding the basic physics of seismic source
function estimates as derived by close-in and uy distant seismic techniques.
References
Killian, B. G., J. R. Rocco, and E. J. Rinehart, Comparisons of Nuclear-TNT Equivalencies ad
Effects Environments in Different Geological Media, Defense! Nuclear Agency, Washington,DC, DNA-TR-87-152, 1987.
Olsen, K. H., and A. I,. Peratt, Free-field ground motion measurements in the nonlinear-to-elastictransition region, in S. R. Taylor and J. R. Kamm (eds.), Proceedings of the Numerical

Modeling for Underground Nuclear Test Monitoring Symposium, Los Alamos report LA-UR-
93-3839, pp. 397#4,1993.
Stump, B. W., R. E. Reinke, K. H. Olsen, and L. R. Johnson, Isotropic and deviatoriccharacterization of the Coalosa nuclear explosion in Yucca Flats, Geophys. J. fnt. 2 16,538-
552, 1994.
TABLES
Table 1 Seismic Parameters of Four Underground Explosions in N-Tunnel, Rainier Mesa,Nevada Test Site
Table 2 Slant-ranges and gauge performance for NPE free-field array

Seismic Parameters of Four Underground Explosionsin WTunnel, Rainier Mesa, Nevada Test Site
Event
Event Name,
HoleID
Location Origin Time Magnitudes
N Latitude W Longitude Surface DOE Date Time, UT mb mb mbm f mM,g * ML
Elevation @OE) (NEtc) (ISC) (BRK)m m
MISTY 37” 11’ 56.54” 116” 12’ 34.00” 2259ECHO
U12N.23
MINERAL 37’ 12’ 24.73” 116’ 12’ 51.33” 2243QUARRYUI2N.22
HUNTERS 37” 12’ 24.1t3” 116” 12’ 35.94” 2239TROPHY
U12N.24
NPEPEE;,, 3?” 12’ 06.95” 116’ 12’ 35.50” 2243
EXPERIMEm)U12N.25b.k.L.'CHEMICAL
400 10 Dec. 1988 203OXIO.055 5.0 5.0 4.81 5.16 5.0
400 25 July 1990 1500:00.057 4.7 4.8 4.53 4.94
385 18 Sept. 1992 1700:00.008 4.4 4.18+ 4.57*
390 22 Sept. 1993 0701:00.080 4.1 4.16 4.59
For definition and discussion of the LLNL 4-broadband-station regional magnitude,mbgn , see: Denny, M. D., S. R. Taylor, and E. S. Vergino, Investigation of mb andMS formulas for the Western United States and their impact on the MS/mbdiscriminant, BSSA 77,987-995,1987.For definition and discussion of the LLNL 4-broadband-station regional magnitude,rnbt_g , see: Patton, I-L J., Application of Nuttli’s method to estimate yield of NevadaTest Site explosions recorrkd on Lawrence Livermore National Laboratory’s digitalseismic system, BSSA 78, 1759- 1772, 1988.These am 3-station values rather than 4-station averages.

Table-2 NPE ranges&comment
TABLE 2 J IFREE-FIELD RANGES FOR NPE
IIU12N.25Sh ID Slant range (clr) Comments
TM 31 (Ll) 54.206
TM 32 (L2) 84.629
TM 6 93.987
TM 33 (L3) 98.326
TM 2 100.321
TM 34 (L4) 114.226
TM 7 228.435
384.151
Shorted @ D-2 (Grout failw)Grout failurc(>50g)-shock rise only (t&O ms)
Exceeded gauge linearity (>Zg)Grout failure(>50e)-shock rise onlv (td0 ms)
Exceeded gauge linearity (>25g)Grout failure(>50g)-shock rise only (tc50 ms)
Early data only-some axes failed t -1 s
Inoperative after previous shot
Page 1

Figure Captions
Fig. 1. Cartoon cross-section of Rainier Mesa, NT’S, illustrating the general layout of biaxial free-field accelerometer units in relation to the close-in, high-stmss gauges and the mesa-top surfacemeasurements fielded by other experimenters. Oriented triatial free-field accelerometer packages
are typically grouted into boreholes at depths at least 2-hlnneldiameters (6 m) blow the tunnelfloor in or&r to eliminate small effects of tunnel-wall motions on the desired free-field
8CCClcrogramS.
Fig. 2. Map of part of the N-tunnel complex (approximately 400 m beneath the mesa surface)showing locations for the 23-station free-field accelerometer array activated for the Non-proliferation experiment (NPE). Also shown are the working points (* ) for three previous nearbynuclear events (MISTY ECHO [ME]; MINERAL QUARRY, [MQ]; and HUNTERS TROPHYIHTJ) which were recorded by fewer-station predecessors of our free-field accelerometer netwark.IThe first event, ME, had only a seven stations (Ws: 2, a pair near 4,6,7,8, and 12). Station:, 1,3,
5,9,10,14, and 15 were added for MQ; stations 21-26 were added for HT, and stations 3 l-34were added for NPE.] Depending somewhat on source yield, stations generally closer than about100-200 m from the WP undergo non-linear material failure (crush and shear), whereas beyond
200-300 m, rock responses are nearly elastic.
Fig. 3a. Stack of trace-normalized particle-velocity seismograms from the NPE arranged in or&rof distance (see Table 2) from the NPE working point. (a) Radial components. (b) Tangentialcomponents. (c) Vertical components. Only the first 2 seconds of the seismograms arc shown.
Note how the first transient pulse broadens and the dominant frequencies of the first 1 second of
high-frequency (-50 Hz) coda decrease with range. Also, observe the approximately ~-HZ low-
frequency, in-phase energy appearing mainly on vertical components (Fig. 3~). No corrections
have been made for any offsets or long-period drifts arising from either the recording system orfrom integration of primary acceleration data.
Fig. 3b. Tangential components. (See caption for Figure 3a)
Fig. 3c. Vertical components. (See caption for Figure 3a)
Fig. 4 Comparison of Radial (R), Transverse (T), and Vertical (2) component velocity
waveforms from free-field station TM-10 for the NPE. Station is at a range of 676 m from the
charge center, well outside the “transition zone” in a region where the tuff response should beelastic. All components are plotted at the same amplitude scale. Note that for frequencies greater
there is an approximate ‘equipartitioning’ of energy among all components. “Long-period” (-2Hz) energy is &arty seen on both Z and R components. (All uncorrected for offsets or long-period drifts.)
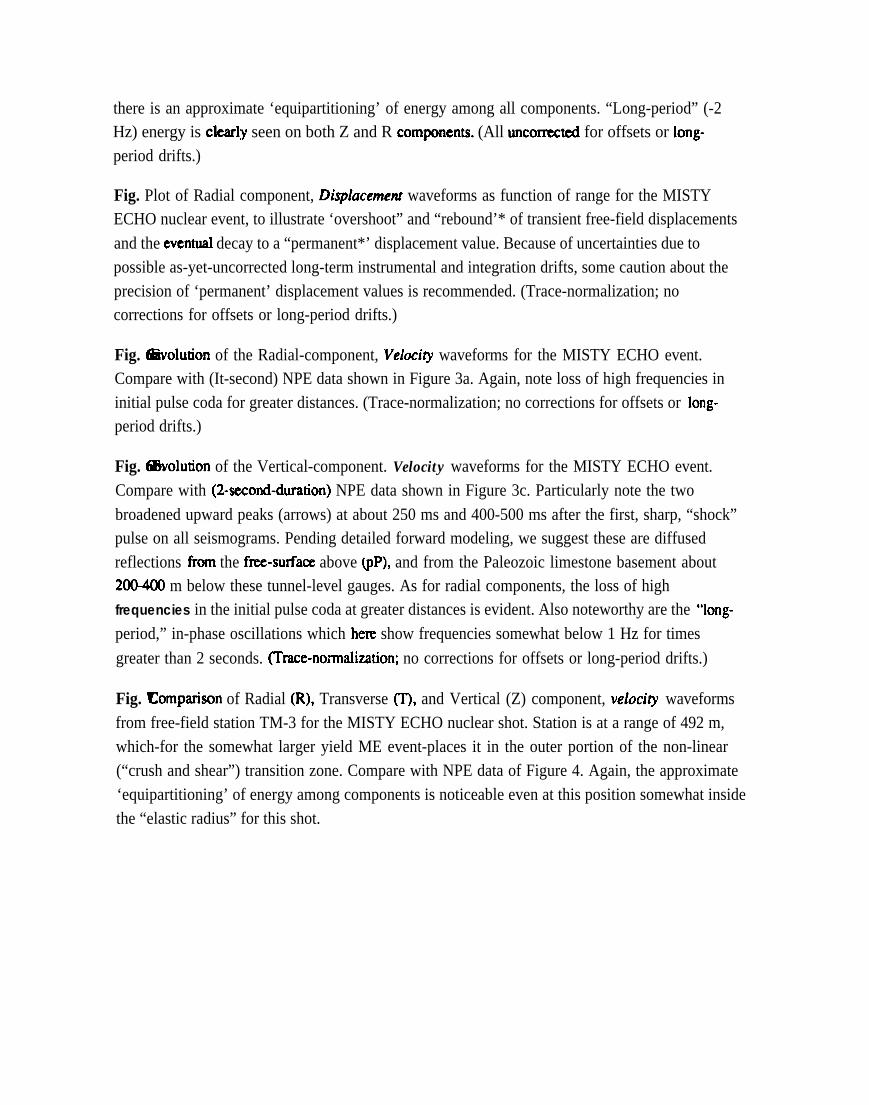
Fig. Plot of Radial component, DispZucemenr waveforms as function of range for the MISTYECHO nuclear event, to illustrate ‘overshoot” and “rebound’* of transient free-field displacements
and the eventuaI decay to a “permanent*’ displacement value. Because of uncertainties due topossible as-yet-uncorrected long-term instrumental and integration drifts, some caution about theprecision of ‘permanent’ displacement values is recommended. (Trace-normalization; nocorrections for offsets or long-period drifts.)
Fig. Solution of the Radial-component, Velocizy waveforms for the MISTY ECHO event.Compare with (It-second) NPE data shown in Figure 3a. Again, note loss of high frequencies ininitial pulse coda for greater distances. (Trace-normalization; no corrections for offsets or long-period drifts.)
Fig. Solution of the Vertical-component. Velocity waveforms for the MISTY ECHO event.Compare with (Zsecond-duration) NPE data shown in Figure 3c. Particularly note the two
broadened upward peaks (arrows) at about 250 ms and 400-500 ms after the first, sharp, “shock”pulse on all seismograms. Pending detailed forward modeling, we suggest these are diffusedreflections from the ftee-surface above (PP), and from the Paleozoic limestone basement about20@400 m below these tunnel-level gauges. As for radial components, the loss of highfrequencies in the initial pulse coda at greater distances is evident. Also noteworthy are the “long-
period,” in-phase oscillations which here show frequencies somewhat below 1 Hz for times
greater than 2 seconds. (Trace-no&rrnalization; no corrections for offsets or long-period drifts.)
Fig. comparison of Radial (R), Transverse (T), and Vertical (Z) component, velociry waveformsfrom free-field station TM-3 for the MISTY ECHO nuclear shot. Station is at a range of 492 m,which-for the somewhat larger yield ME event-places it in the outer portion of the non-linear(“crush and shear”) transition zone. Compare with NPE data of Figure 4. Again, the approximate‘equipartitioning’ of energy among components is noticeable even at this position somewhat insidethe “elastic radius” for this shot.

J

“N” TUNNEL COMPLEXNTS
N 3OOm
4 0 1OOOtt1 I
SCALE
MINERAL OUARRY 0 NEW SITES FOR NPE 31_ 34
8 PRE-EXISTING SITES 1_ 26
Free-field accelerometer array for the Non-Proliferation Experiment
d_ n

NPE Velocities - Radial
Time (set) [with individual delays]

NPE Velocities - Transverse
-k/f---.-- -’tmlayv
tmlOoyv"~-_i4
-’ ”I I I 1 7 ,v0.0 02 C.4 0.6 0.5 lo 1.2 1.4 1.6 18 2.0
tml7nw
Time (set) [with individual delays]

NPE Velocities - Vertical (Z)
Time (set) [with kdivldual delays]
.‘, _ ’

NPE - Station TM-10 (676 m)
Away
-02 tml0uzvUP
Time (set) [with illdivldual delays]

.
Ml§TY ECHO Displacements - Radial
- -O.OSL.E-
I --8:$-
r
V 341 m
almxd
Time (set) [with individual delays]

MISTY ECHO - Radial Velocity waveforms
----___------_-_,__~-~----r ,
620 m -1r-f 51
I--i--_.--_._--__r~---- -C-C--.-__ 1---__c-

MISTY ECHO - Vertical (2) Velocity waveforms

.
.
MISTY ECHO Velocities - Stat ion TM-3 (492 m)
$ t-_I-L
1 t
1
tm3arv
h‘b-J-l -A0 L
Y - -
.
-I
UPA
- -
t I
l ime (set) [with indiwdual d e l a y s ]