Embed Size (px)
Citation preview

U.S. International Trade CommissionPublication 4736 October 2017
Washington, DC 20436
Titanium Sponge from Japan and Kazakhstan
Investigation Nos. 701-TA-587 and 731-TA-1385-1386 (Preliminary)
U.S. International Trade Commission
COMMISSIONERS
Rhonda K. Schmidtlein, Chairman David S. Johanson, Vice Chairman
Irving A. Williamson Meredith M. Broadbent
Catherine DeFilippo
Staff assigned
Address all communications to Secretary to the Commission
United States International Trade Commission Washington, DC 20436
Director of Operations
Jordan Harriman, Investigator Ayanna Butler, Investigator
Daniel Matthews, Industry Analyst Emily Burke, Economist
Fernando Gracia, Economist Joanna Lo, Accountant
Cindy Payne, Statistician Darlene Smith, Statistical Assistant
John Henderson, Attorney Elizabeth Haines, Supervisory Investigator

U.S. International Trade CommissionWashington, DC 20436
www.usitc.gov
Publication 4736 October 2017
Titanium Sponge from Japan and Kazakhstan
Investigation Nos. 701-TA-587 and 731-TA-1385-1386 (Preliminary)


CONTENTS Page
i
Determinations ............................................................................................................................... 1 Views of the Commission ............................................................................................................... 3 Part I: Introduction ................................................................................................................ I‐1 Background ................................................................................................................................ I‐1 Statutory criteria and organization of the report ..................................................................... I‐2 Statutory criteria ................................................................................................................... I‐2 Organization of report ........................................................................................................... I‐3
Market summary ....................................................................................................................... I‐3 Summary data and data sources ............................................................................................... I‐4 Previous and related investigations .......................................................................................... I‐4 Nature and extent of alleged subsidies and sales at LTFV ........................................................ I‐5 Alleged subsidies ................................................................................................................... I‐5 Alleged sales at LTFV ............................................................................................................. I‐5
The subject merchandise .......................................................................................................... I‐6 Commerce’s scope ................................................................................................................ I‐6 Tariff treatment ..................................................................................................................... I‐7
The product ............................................................................................................................... I‐7 Description and applications ................................................................................................. I‐7 Manufacturing processes .................................................................................................... I‐10
Domestic like product issues ................................................................................................... I‐12 Part II: Conditions of competition in the U.S. market ............................................................ II‐1 U.S. market characteristics ....................................................................................................... II‐1 Channels of distribution ........................................................................................................... II‐2 Geographic distribution ........................................................................................................... II‐2 Supply and demand considerations ......................................................................................... II‐3 U.S. supply ............................................................................................................................ II‐3 U.S. demand ......................................................................................................................... II‐6
Substitutability issues ............................................................................................................... II‐9 Lead times ............................................................................................................................ II‐9 Factors affecting purchasing decisions............................................................................... II‐10 Comparison of U.S.‐produced and imported titanium sponge .......................................... II‐10
Part III: U.S. producers’ production, shipments, and employment ....................................... III‐1 U.S. producers ......................................................................................................................... III‐1 U.S. production, capacity, and capacity utilization ................................................................. III‐2 Alternative products ............................................................................................................ III‐3
U.S. producers’ U.S. shipments and exports ........................................................................... III‐3 U.S. shipments by grade ...................................................................................................... III‐4
U.S. producers’ inventories ..................................................................................................... III‐4 U.S. producers’ imports and purchases .................................................................................. III‐5 U.S. employment, wages, and productivity ............................................................................ III‐5

CONTENTS Page
ii
Part IV: U.S. imports, apparent U.S. consumption, and market shares ................................ IV‐1 U.S. importers.......................................................................................................................... IV‐1 U.S. imports ............................................................................................................................. IV‐1 U.S. importers’ subject U.S. shipments and exports ............................................................... IV‐3 Negligibility .............................................................................................................................. IV‐4 Cumulation considerations ..................................................................................................... IV‐4 Fungibility ............................................................................................................................ IV‐4 Presence in the market ....................................................................................................... IV‐5 Geographical markets ......................................................................................................... IV‐8
Apparent U.S. consumption .................................................................................................... IV‐9 U.S. market shares .................................................................................................................. IV‐9
Part V: Pricing data ............................................................................................................... V‐1 Factors affecting prices ............................................................................................................ V‐1 Raw material costs ............................................................................................................... V‐1 U.S. inland transportation costs ........................................................................................... V‐1
Pricing practices ....................................................................................................................... V‐1 Pricing methods .................................................................................................................... V‐1 Sales terms and discounts .................................................................................................... V‐2
Price data .................................................................................................................................. V‐2 Price trends ........................................................................................................................... V‐5 Price comparisons ................................................................................................................ V‐5
Lost sales and lost revenue ...................................................................................................... V‐5 Part VI: Financial experience of U.S. producers .................................................................... VI‐1 Background .............................................................................................................................. VI‐1 Operations on titanium sponge .............................................................................................. VI‐2 Capital expenditures and research and development expenses ............................................ VI‐6 Assets and return on assets .................................................................................................... VI‐6 Capital and investment ........................................................................................................... VI‐6
Part VII: Threat considerations and information on nonsubject countries .......................... VII‐1 The industry in Japan ............................................................................................................. VII‐3 Changes in operations ........................................................................................................ VII‐4 Operations on titanium sponge.......................................................................................... VII‐4 Exports ................................................................................................................................ VII‐5
The industry in Kazakhstan .................................................................................................... VII‐8 Changes in operations ........................................................................................................ VII‐9 Operations on titanium sponge.......................................................................................... VII‐9 Exports ................................................................................................................................ VII‐9
U.S. inventories of imported merchandise .......................................................................... VII‐12 U.S. importers’ outstanding orders ...................................................................................... VII‐12 Antidumping or countervailing duty orders in third‐country markets ................................ VII‐12 Information on nonsubject countries .................................................................................. VII‐13

CONTENTS Page
iii
Global exports .................................................................................................................. VII‐13 The Industry in China ........................................................................................................ VII‐16 The Industry in Russia ....................................................................................................... VII‐20 The Industry in Ukraine .................................................................................................... VII‐23 Global production capacity .............................................................................................. VII‐26 Global production ............................................................................................................. VII‐27
Appendixes
A. Federal Register notices ................................................................................................. A‐1
B. Calendar of the public staff conference ......................................................................... B‐1
C. Summary data ................................................................................................................ C‐1 Note.—Information that would reveal confidential operations of individual concerns may not be published and therefore has been deleted. Such deletions are indicated by asterisks.


1
UNITED STATES INTERNATIONAL TRADE COMMISSION
Investigation Nos. 701‐TA‐587 and 731‐TA‐1385‐1386 (Preliminary)
Titanium Sponge from Japan and Kazakhstan
DETERMINATIONS
On the basis of the record1 developed in the subject investigations, the United States International Trade Commission (“Commission”) determines, pursuant to the Tariff Act of 1930 (“the Act”), that there is no reasonable indication that an industry in the United States is materially injured or threatened with material injury, or that the establishment of an industry in the United States is materially retarded, by reason of imports of titanium sponge from Japan and Kazakhstan, provided for in subheading 8108.20.00 of the Harmonized Tariff Schedule of the United States, that are alleged to be sold in the United States at less than fair value (“LTFV”) and to be subsidized by the government of Kazakhstan.
BACKGROUND
On August 24, 2017, Titanium Metals Corporation, Exton, PA, filed a petition with the Commission and the U.S. Department of Commerce, alleging that an industry in the United States is materially injured and threatened with material injury by reason of LTFV imports of titanium sponge from Japan and Kazakhstan and subsidized imports of titanium sponge from Kazakhstan. Accordingly, effective August 24, 2017, the Commission, pursuant to sections 703(a) and 733(a) of the Act (19 U.S.C. 1671b(a) and 1673b(a)), instituted countervailing duty investigation No. 701‐TA‐587 and antidumping duty investigation Nos. 731‐TA‐1385‐1386 (Preliminary).
Notice of the institution of the Commission’s investigations and of a public conference to be held in connection therewith was given by posting copies of the notice in the Office of the Secretary, U.S. International Trade Commission, Washington, DC, and by publishing the notice in the Federal Register of September 1, 2017 (82 FR 41656). The conference was held in Washington, DC, on September 14, 2017, and all persons who requested the opportunity were permitted to appear in person or by counsel.
1 The record is defined in sec. 207.2(f) of the Commission’s Rules of Practice and Procedure (19 CFR 207.2(f)).


Bthere is nthreatenKazakhstsubject mKazakhst
TI.
Trequires preliminamateriallmateriallstandardrecord asthreat ofinvestiga
BII.
PproducerTIMET ap
SeIncorporathe perioexporter exporter JSC (“UKTPerrymanCompanyan impor
1 T
generally Pub. 3119materially
2 994, 1001
3 AF.3d 1535
ased on theno reasonabed with mattan that are merchandisetan.1
The Legal S
he legal stanthe Commisary determinly injured orly retarded, d, the Comms a whole cof such injury;ation.”3
Background
arties to ther of titaniumppeared at teveral respoated (“ATI”)od of investigof subject mof subject mTMP”), a pron Company y Inc. (“RMI”rter of subje
The U.S. induTitanium Spo9 (Aug. 1998)y retarded by19 U.S.C. §§ 11‐04 (Fed. Cir.American Lam5, 1543 (Fed. C
record in thle indicationterial injury ballegedly soe from Kazak
Standard fo
ndard for pression to detenations, whethreatenedby reason oission weighontains clear ; and (2) no
d
e Investigatim sponge, filehe staff confondent entit, an importegation; OSAKmerchandisemerchandiseoducer and e(“Perryman””), a subsidiact merchand
ustry producinonge from Jap. Whether th reason of su1671b(a), 167. 1986); Aristemb Co., 785 FCir. 1994).
Views of t
he preliminan that an indby reason ofld in the Unikhstan that a
or Prelimin
eliminary anermine, baseether there i with materf the allegedhs the evidenand convinclikelihood ex
ion. Titaniumed the petitiference andies participaer of subjectKA Titaniume from Japane from Japanexporter of s”), an importary of Arcondise. ATI, OT
ng titanium sppan, Kazakhsthere is a reasobject imports73b(a) (2000)ech Chem. CoF.2d at 1001; s
3
the Comm
ry phase of tdustry in the f imports of ited States aare allegedly
nary Deter
ntidumping aed upon the is a reasonabial injury, ordly unfairly tnce before itcing evidencxists that co
m Metals Coons in these submitted aated in thesemerchandis Technologien; Toho Titann; Ust‐Kamensubject mercter of subjecic Titanium aTC, UKTMP,
ponge has betan, Russia, aonable indicats is not an issu; see also Amorp. v. United see also Texa
mission
these investUnited Stattitanium spoat less than fy subsidized
rminations
and counterinformationble indicatior that the esttraded impot and determce that thereontrary evide
orporation (“e investigatioa postconfere investigatiose as well ases Co., Ltd. (nium Co., Ltdnogorsk Titachandise froct merchandand EngineePerryman, a
een establisheand Ukraine, Ition that the ue in these in
merican Lamb States, 20 CIT
as Crushed Sto
tigations, wetes is materiaonge from Jfair value anby the Gove
s
vailing duty n available aon that a domtablishmentrts.2 In applmines whethe is no mateence will aris
“TIMET”), a ons on Augurence brief. ons: Alleghes a domestic (“OTC”), a pd. (“Toho”), anium and Mom Kazakhstdise; and RMering Producand RMI all a
ed for many yInv. Nos. 751‐establishmennvestigations.Co. v. UnitedT 353, 354‐55one Co. v. Un
e determineally injured oapan and d imports ofernment of
determinatt the time omestic indust of an industlying this her “(1) the rial injury orse in a final
domestic ust 24, 2017. eny Technoloproducer duroducer anda producer a
Magnesium Pan; The
MI Titanium cts (“Arconicappeared at
years. See ‐TA‐17‐20, USnt of an indus. d States, 785 F5 (1996). ited States, 3
that or
f the
ions f the stry is try is
r
ogies uring d and Plant
c”), the
SITC stry is
F.2d
35

conferensubmitte
Dproducerbased onsubject imquestionin Japan,one prodmerchan
DIII.
InStates is subject m“industrythe relevthose proproportio“domestcharacte
Tfactual d“most simdispositiv
4 5 6 7 8 9 10
11
DepartmeStates, 191990), affparticularnumber o(3) channmanufactprice. See1996).
nce and submed a postconData Coveragrs, accountinn the questiomports fromnaires from accounting ducer/exportdise from Ka
Domestic L
n determininmaterially inmerchandisey.”8 Section vant domestoducers whoon of the totic like produristics and uhe decision eterminatiomilar in charve, and the C
Perryman anConfidential CR at I‐5; PR CR at VII‐3, V19 U.S.C. § 1619 U.S.C. § 160 19 U.S.C. § 11 See, e.g., Cleent of Comme9 CIT 450, 455f’d, 938 F.2d 1r record at issof factors incluels of distribuuring facilitiee Nippon, 19 C
mitted postcference briege. U.S. indung for all U.Sonnaire respm Japan and three foreigfor virtuallyter in Kazakhazakhstan in
ike Produc
ng whether tnjured or thre, the Comm771(4)(A) ofic industry aose collectivtal domesticuct” as “a proses with, theregarding thn, and the Cracteristics aCommission
d Arconic (coReport (“CR”at I‐4. VII‐10; PR at V677(4)(A). 677(4)(A). 1677(10). eo Inc. v. Uniterce, 36 F. Sup5 (1995); Torr1278 (Fed. Cirue’ and the ‘uuding the follution; (4) custes, productionCIT at 455 n.4
conference bef. ustry data arS. productionponses from Kazakhstan gn producersy all productihstan, accoun 2016.7
ct
there is a reareatened wiission first df the Tariff Aas the “produe output of c productionoduct whiche article subhe appropriaCommission and uses” on may consid
llectively “U.S”) at I‐5; Publi
VII‐3, VII‐8.
ted States, 50pp. 2d 380, 3rington Co. v. r. 1991) (“eveunique facts oowing: (1) phtomer and prn processes, a4; Timken Co.
4
briefs.4 Toho
re based on n of titaniumeight U.S. imin 2016.6 Ths of subject ion of subjecunting for all
asonable indth material idefines the “Act of 1930, ucers as a wa domestic l of the prodh is like, or inbject to an inate domestichas applied n a case‐by‐cer other fac
S. Importers”ic Report (“PR
1 F.3d 1291, 83 (Ct. Int’l TUnited Statesery like produof each case’”hysical characoducer perceand productio v. United Sta
o did not app
the questiom sponge in 2mporters thahe Commissmerchandisct merchandl or virtually
dication thatinjury by rea“domestic likas amended
whole of a dolike productduct.”9 In turn the absencnvestigation.c like producthe statutorcase basis.11
ctors it deem
”) submitted aR”) at I‐4.
1299 (Fed. Cirade 1998); Ns, 747 F. Suppuct determina”). The Commcteristics andeptions of theon employeesates, 913 F. Su
pear at the c
nnaire respo2016.5 U.S. at accountedion receivede: two proddise from Japall producti
t an industryason of impoke product” d (“the Tariffomestic like p constitutesrn, the Tariffce of like, mo.”10 ct(s) in an invry standard No single fa
ms relevant b
a postconfere
ir. 2007); NECNippon Steel Cp. 744, 749 nation ‘must bemission gened uses; (2) intee products; (5s; and, whereupp. 580, 584
conference,
onses of twoimport datad for virtualld responses ducers/expopan in 2016;on of subjec
y in the Unitorts of the and the f Act”), definproduct, or a major f Act definesost similar in
vestigation iof “like” or actor is based on the
ence brief join
C Corp. v. Corp. v. Unite.3 (Ct. Int’l Tre made on thrally considererchangeabili5) common e appropriate4 (Ct. Int’l Tra
but
o a are y all to its rters ; and ct
ed
nes
s n
is a
e
ntly.
ed rade he rs a ity;
, (6) ade

5
facts of a particular investigation.12 The Commission looks for clear dividing lines among possible like products and disregards minor variations.13 Although the Commission must accept the determination of the Department of Commerce (“Commerce”) as to the scope of the imported merchandise that is subsidized and/or sold at less than fair value,14 the Commission determines what domestic product is like the imported articles Commerce has identified.15
In its notices of initiation, Commerce defined the imported merchandise within the scope of these investigations as follows:
The product covered by these investigations is all forms and grades of titanium sponge, except as specified below. Titanium sponge is unwrought titanium metal that has not been melted. Expressly excluded from the scope of this investigation are:
(1) Loose particles of unwrought titanium metal having a particle size of
less than 20 mesh (0.84 mm); (2) alloyed or unalloyed briquettes of unwrought titanium metal that
contain more than 0.2% oxygen on a dry weight basis; and (3) ultra‐high purity titanium sponge. In ultra‐high purity titanium sponge,
metallic impurities do not exceed any of these amounts: WT % Aluminum 0.0005 Chromium 0.0001 Cobalt 0.0001 Copper 0.0002 Iron 0.0300 Manganese 0.0010 Nickel 0.0002
12 See, e.g., S. Rep. No. 96‐249 at 90‐91 (1979). 13 See, e.g., Nippon, 19 CIT at 455; Torrington, 747 F. Supp. at 748‐49; see also S. Rep. No. 96‐249
at 90‐91 (Congress has indicated that the like product standard should not be interpreted in “such a narrow fashion as to permit minor differences in physical characteristics or uses to lead to the conclusion that the product and article are not ‘like’ each other, nor should the definition of ‘like product’ be interpreted in such a fashion as to prevent consideration of an industry adversely affected by the imports under consideration.”).
14 See, e.g., USEC, Inc. v. United States, 34 Fed. App’x 725, 730 (Fed. Cir. 2002) (“The ITC may not modify the class or kind of imported merchandise examined by Commerce.”); Algoma Steel Corp. v. United States, 688 F. Supp. 639, 644 (Ct. Int’l Trade 1988), aff’d, 865 F.3d 240 (Fed. Cir.), cert. denied, 492 U.S. 919 (1989).
15 Hosiden Corp. v. Advanced Display Mfrs., 85 F.3d 1561, 1568 (Fed. Cir. 1996) (the Commission may find a single like product corresponding to several different classes or kinds defined by Commerce); Cleo, 501 F.3d at 1298 n.1 (“Commerce’s {scope} finding does not control the Commission’s {like product} determination.”); Torrington, 747 F. Supp. at 748‐52 (affirming the Commission’s determination defining six like products in investigations where Commerce found five classes or kinds).

6
Vanadium 0.0002 Zirconium 0.0005 Carbon 0.0150 Hydrogen 0.0100 Nitrogen 0.0020 Oxygen 0.1000
Titanium sponge is currently classified under subheading 8108.20.0010 of the Harmonized Tariff Schedule of the United States (HTSUS). The HTSUS subheading is provided for convenience and customs purposes; the written description of the scope of this investigation is dispositive.16
Titanium sponge is a porous, brittle, unwrought form of titanium, a metal that is highly
valued for its physical characteristics, including a high strength‐to weight ratio (the highest of any metallic element), resistance to corrosion, and the ability to bond with high‐strength polymers. These physical properties make titanium ideal for certain aerospace, military, and industrial applications. Typically, titanium sponge (sometimes mixed with scrap titanium metal) is melted down to make titanium ingots, before being further processed through various manufacturing processes, depending on the intended end use of the final product.17
The two major grades of titanium sponge within the scope definition are premium‐quality and standard‐quality sponge. Premium quality, which is commonly referred to as “rotor grade,” is used in rotating engine parts for the aerospace industry. Standard grade can be used in airframes and non‐rotating parts of aircraft engines, and in non‐aerospace industrial applications such as equipment for desalination, nuclear power plants, chemical processing equipment, medical implants, and other products.18
A. Arguments of the Parties
Petitioner’s Argument. Petitioner argues that the Commission should define a single domestic like product that is coextensive with the scope consisting of titanium sponge. TIMET asserts that ultra‐high purity titanium sponge, which is excluded from scope, is distinct from in‐scope titanium sponge and should not be included within the domestic like product. TIMET also argues that both premium and standard grades of titanium sponge should be included in the domestic like product.19
16 Titanium Sponge From Japan and Kazakhstan: Initiation of Less‐Than‐Fair Value
Investigations, 82 Fed. Reg. 43939, 43944 (Sept. 20, 2017); Titanium Sponge From Kazakhstan: Initiation of Countervailing Duty Investigation, 82 Fed. Reg. 43936, 43939 (Sept. 20, 2017).
17 CR at I‐8; PR at I‐7. 18 CR at I‐9 to I‐10; II‐1; PR at I‐7 to I‐8; II‐1. 19 Petition at 18‐23; TIMET’s Postconference Brief at 5‐6; Transcript of Conference (“Conference
Tr.”) at 47‐48 (Horgan).

7
Respondents’ Argument. Respondents do not contest petitioner’s view that the Commission should define a single domestic like product that is coextensive with the scope.20
B. Analysis
Based on the record, we define a single domestic like product consisting of titanium sponge that is coextensive with the scope.
Physical Characteristics and Uses. All grades of titanium sponge consist of unwrought titanium metal that has not been melted or forged. Titanium sponge generally has a titanium metal content in excess of 99.2 percent, with the balance of the sponge made of small amounts of impurities whose maximum contents are specified for each grade. The required chemistries for each grade vary in only limited respects. Titanium sponge (sometimes mixed with scrap titanium metal) is melted down to make titanium ingots, before being further processed into downstream mill products. As previously discussed, the end uses for standard grade titanium sponge include airframes and non‐rotating parts of aircraft engines, and non‐aerospace industrial applications, while the end uses for premium grade include rotating engine parts for the aerospace industry.21
By contrast, ultra‐high purity titanium sponge, which is excluded from the scope, has a different chemical composition, is dedicated for use in the semiconductor business, and is not used in producing titanium mill products.22
Manufacturing Facilities, Production Processes and Employees. Both U.S. producers of in‐scope titanium sponge during the period of investigation (as well as most global producers of titanium sponge) have used the Kroll process to produce titanium sponge.23 The Kroll process results in a single mass of titanium sponge that will yield multiple grades of titanium sponge. Each producer has used similar raw materials and the same manufacturing process, and common facilities, equipment, and workers to produce all grades of titanium sponge.24 By contrast, ultra‐high purity titanium sponge in the United States produced by Honeywell Electronics Materials (“Honeywell”) uses a different production process involving sodium reduction.25 U.S. producers of in‐scope titanium sponge (i.e., TIMET and ATI) have not produced ultra‐high purity titanium sponge, and the leading U.S. producer of ultra‐high purity titanium sponge (i.e., Honeywell) does not produce in‐scope titanium sponge.26
Channels of Distribution. During the period of investigation, domestic producers TIMET and ATI produced titanium sponge and captively consumed it to produce downstream titanium
20 Conference Tr. at 163‐64 (Cannon, Okun, Ellis, Thomas, Schaefer); U.S. Importers’
Postconference Brief at 5; UKTMP’s Postconference Brief at 3 n.8. 21 CR at I‐9 to I‐11, II‐1; PR at I‐7 to I‐9, II‐1; Conference Tr. at 38‐39 (Seiner); Petition at 20. 22 Petition at 19‐20; CR at I‐9 n.19; PR at I‐7 n.19. 23 CR at I‐13 to I‐14; PR at I‐10 to I‐11 (describing Kroll process); Petition at 20; Conference Tr. at
157 (Thomas, Sando), 159 (Forsythe); Petition at Exh. GEN‐20, Declaration of Henry Seiner, at Paragraphs 4, 8.
24 Petition at 19 and Exh. GEN‐20, Declaration of Henry Seiner, at Paragraph 3. 25 Petition at 6, 19, and Exh. GEN‐20, Declaration of Henry Seiner, at Paragraph 5. 26 Petition at 19‐20.

8
melted and/or mill products.27 TIMET asserts that ultra‐high purity titanium sponge goes through different channels of distribution involving different customers.28
Interchangeability. According to TIMET, in‐scope titanium sponge is completely interchangeable within the same grade. In addition, different grades of titanium sponge are frequently interchangeable, in that premium grades can readily be substituted for standard grades. While standard grade cannot be used as a substitute for premium grade, standard grades frequently meet the chemical requirements for premium grades.29 Domestically produced out‐of‐scope ultra‐high purity titanium sponge is not economically suitable for use in producing titanium mill products, and thus is not interchangeable with in‐scope titanium sponge.30
Producer and Customer Perceptions. According to TIMET, customers perceive that various grades of titanium sponge are frequently interchangeable, and that premium grade can be readily substituted for standard grade.31
Price. According to TIMET, the cost of producing titanium sponge does not vary significantly from grade to grade, but premium grade sponge has a higher price due to the additional testing and certifications associated with guaranteeing the quality of the titanium sponge. TIMET states that there are additional costs associated with producing out‐of‐scope ultra‐high purity titanium sponge that make it economically unsuitable for use in production of downstream titanium mill products.32
Conclusion. We define a single domestic like product that is coextensive with the scope consisting of titanium sponge of all grades. While there may be some differences in the specific end uses and prices for standard grade and premium grade titanium sponge, and limits on their interchangeability, the record indicates that all grades have the same general physical characteristics, manufacturing processes, and channels of distribution, have some degree of interchangeability, and are generally perceived by producers and customers to be different grades of the same product. By contrast, the limited record indicates that out‐of‐scope ultra‐high purity titanium sponge has different physical characteristics and end uses from in‐scope titanium sponge and a different manufacturing process, is generally not interchangeable with in‐scope titanium sponge, and is perceived to be a different product by customers and producers. We consequently do not include out‐of‐scope ultra‐high purity titanium sponge within the definition of the domestic like product. Accordingly, we define a single domestic like product encompassing the types of titanium sponge described in the scope definition.
27 Petition at 21. 28 Conference Tr. at 47 (Horgan). 29 Petition at 20‐21 and Exh. GEN‐20, Declaration of Henry Seiner, at Paragraph 2; TIMET’s
Postconference Brief at 5. 30 Petition at 19‐20. 31 Petition at 22‐23. 32 Petition at 19‐20 and Exh. GEN‐20, Declaration of Henry Seiner, at Paragraph 5. Although
there are minimal pricing data in the record given the very limited quantities of commercial sales of domestically produced titanium sponge, the data available suggest that domestically produced premium grade is priced higher than standard grade. See CR/PR at Tables V‐3 to V‐4.

DIV.
Tlike proda major pindustry,domesticthe dome
Wexcludedprovisiondomesticor which discretio
Tinvestigaparty unddomesticthe POI, domesticdefinitiondomesticexist to e
33
34
without o(Ct. Int’l TSupp. 134
35
circumsta(1(2
(whether enable it t
(3industry;
(4(5
importati2015); see
36
37
38
Domestic In
he domesticuct, or thoseproportion o the Commic productionestic merchaWe must deted from the don allows the c industry prare themsen based upoIMET and ATation (“POI”)der 19 U.S.Cc industry tonamely TIMc industry asn of the domc industry asexclude eithe
3 19 U.S.C. § 14 See Torringtopinion, 991 FTrade 1989), a48, 1352 (Ct. I5 The primaryances exist to 1) the percent2) the reason the firm bento continue p3) whether in
4) the ratio of5) whether thon. Changzhe also Torring6 CR at III‐1; P7 TIMET’s Post8 Conference
ndustry
c industry is e producers of the total dssion’s genen of the like pant market. ermine wheomestic induCommissionroducers thalves importeon the facts pTI each direc of January 2C. § 1677(4)(o include all UET and ATI, s a related pamestic industs a related paer producer
1677(4)(A). ton Co. v. Unit.2d 809 (Fed.aff’d mem., 9Int’l Trade 19 factors the Cexclude a reltage of domethe U.S. prodefits from theproduction anclusion or exc
f import shipmhe primary intou Trina Solagton Co. v. UnR at III‐1; CR/tconference BTr. at 164‐65
defined as twhose colle
domestic proeral practice product, wh ther any proustry pursuan, if approprat are relateders.34 Excluspresented inctly imported2014 througB)(i). TIMETU.S. produceand that neiarty.37 No retry or arguedarty.38 We dfrom the do
ted States, 79. Cir. 1993); S04 F.2d 46 (F87). Commission hlated party inestic productiducer has dece LTFV sales ond compete inclusion of the
ments to U.S.terest of the iar Energy Co. nited States, 7/PR at Table IBrief at 4‐5; P(Cannon, Ok
9
he domesticective outpuoduction of thas been toether toll‐pr
oducer of thant to Sectioiate circumsd to an exposion of such n each investd subject megh June 2017T argues thaters that prodither it nor Aespondent pd that any pdiscuss belowomestic indu
90 F. Supp. 11Sandvik AB v. ed. Cir. 1990)
has examinedclude the folon attributabcided to impoor subsidies on the U.S. mae related part
production fmporting prov. USITC, 100790 F. Supp. aII‐9. Petition at 23‐un); U.S. Imp
c “producersut of a domethe product.o include in troduced, cap
e domestic lon 771(4)(B) stances existorter or impoa producer tigation.35 erchandise d7.36 Accordint the Commduced the doATI should bparty has conroducer show whether austry.
161, 1168 (CtUnited States); Empire Plow
in deciding wlowing: ble to the import the producor whether thrket); ty will skew th
for the imporoducer lies in 0 F. Supp.3d 1at 1168.
‐24. porters’ Postc
s as a wholestic like prod.”33 In definthe industry ptively cons
like productof the Tarifft, to excludeorter of subjis within the
during the pngly, each fiission shouldomestic likee excluded fntested TIMould be excluappropriate
. Int’l Trade 1s, 721 F. Suppw Co. v. Unite
whether appr
porting product subject to e firm must i
he data for th
rted product; domestic pro
1314, 1326‐31
conference Br
of a domesduct constituing the domproducers oumed, or so
should be f Act. This e from the ject merchane Commissio
eriod of rm is a relatd define the product dufrom the ET’s proposuded from thcircumstanc
1992), aff’d p. 1322, 1331ed States, 675
ropriate
ucer; investigation mport in orde
he rest of the
and oduction or 1 (Ct. Int’l. Tra
rief at 5 and n
tic utes
mestic of all ld in
ndise on’s
ted e ring
ed he ces
1‐32 5 F.
er to
ade
n.20.

10
ATI. ATI was the *** U.S. producer of titanium sponge in 2016, accounting for *** percent of domestic production, but it ceased production in December 2016 after its Rowley, Utah plant was idled; this idling process began in August 2016. ATI opposes the petitions.39 ATI imported *** metric tons of subject merchandise in 2014, *** metric tons in 2015, and *** metric tons in 2016; it imported *** metric tons in January‐June (“interim”) 2016, and *** metric tons in interim 2017.40 ATI produced *** metric tons of titanium sponge in 2014, *** metric tons in 2015, and *** metric tons in 2016; it produced *** metric tons in interim 2016 and *** metric tons in interim 2017.41 The ratio of ATI’s imports of subject merchandise to its U.S. production was *** percent in 2014, *** percent in 2015, and *** percent in 2016; it was *** percent in interim 2016.42 ATI explained its reason for importing: ***.43 44
We find that appropriate circumstances do not exist to exclude ATI from the domestic industry. ATI ceased domestic production in December 2016 in favor of importation of subject merchandise, and its ratio of imports of subject merchandise to domestic production was high throughout the POI. However, there is no question that ATI was a bona fide domestic producer of titanium sponge before its decision to cease domestic production in 2016, and no party has argued that it should be excluded from the domestic industry. Under the circumstances we find that appropriate circumstances do not exist to exclude ATI from the domestic industry as a related party.
TIMET. TIMET was the *** U.S. producer of titanium sponge in 2016, accounting for *** percent of domestic production. TIMET is the petitioner and supports the petition.45 TIMET imported *** metric tons of subject merchandise in 2014, *** metric tons in 2015, and *** metric tons in 2016. It imported *** metric tons of subject merchandise in interim 2016 and *** metric tons in interim 2017.46 TIMET produced *** metric tons of titanium sponge in 2014, *** metric tons in 2015, and *** metric tons in 2016; it produced *** metric tons in interim 2016 and *** metric tons in interim 2017.47 The ratio of TIMET’s imports of subject merchandise to its U.S. production was *** in 2014, *** percent in 2015, and *** percent in
39 CR/PR at Tables III‐1, III‐3. 40 CR/PR at Table III‐9. ATI imported *** metric tons of titanium sponge from Japan in 2014, ***
metric tons in 2015, and *** metric tons in 2016; it imported *** metric tons from Japan in interim 2016, and *** metric tons in interim 2017. ATI imported *** metric tons of titanium sponge from Kazakhstan in 2014, *** metric tons in 2015, and *** metric tons in 2016; it imported *** metric tons in interim 2017. Id.
41 CR/PR at Table III‐9. 42 CR/PR at Table III‐9. 43 CR at III‐9 n.5; PR at III‐5 n.5. 44 ATI’s operating margin was *** percent in 2014, *** percent in 2015, and *** percent in
2016; it was *** percent in interim 2016 and *** percent in interim 2017. Its operating margin was *** the industry average in 2014, 2016, interim 2016, and interim 2017, but *** the industry average in 2015. CR/PR at Table VI‐3.
45 CR/PR at Table III‐1 46 CR/PR at Table III‐9. In 2015, TIMET imported *** metric tons from Japan and *** metric tons
from Kazakhstan. TIMET’s import of subject merchandise in 2016 were ***. 47 CR/PR at Table III‐9.

2016; it wfor impo
Wdomesticratio of impercent iand not icurrent pskew the
Wdomestic
NV.
Pmerchanall such mwhich danegligible
Dthe petittitanium total U.Scountry wimports f
CVI.
Foindicatiorequires were filecompete
48
49
50
2016; it wwas *** taverage in
51
See 19 U.S52
was *** percrting: ***.49
We find that c industry. Itmports of suin 2015, indimportation producer ande data. We accordingc producers
Negligible I
ursuant to Sdise correspmerchandiseata are availae.51 During the peion, subject sponge by q. imports of were well abfrom Japan a
Cumulation
or purposes n of materiathe Commisd and/or inve with each o
8 CR/PR at Tab9 CR at III‐10 n0 TIMET’s opewas *** percehe industry an 2015. CR/P1 19 U.S.C. §§ S.C. §§ 1677(2 CR/PR at Tab
cent in inter9 50 appropriatets importatioubject merchcating that iof subject md the *** do
gly define thof the dome
Imports
Section 771(2ponding to ae imported inable precedi
eriod Augustimports fromquantity andtitanium spobove the perand Kazakhs
n
of evaluatinal injury by rssion to cumvestigations other and wi
ble III‐9. n.6; PR at III‐5erating marginent in interim average in 201PR at Table VI‐1671b(a), 1624)(A)(i), 167ble IV‐4.
rim 2016 and
e circumstanon of subjechandise to dits interest dmerchandiseomestic prod
e domestic estic like pro
24) of the Ta domestic linto the Unitng the filing
t 2016 ‐ July m Japan accd subject imponge by quartinent statustan are not
ng the volumeason of sub
mulate subjecself‐initiatedith the dome
5 n.6. n was *** per2016 and **14, 2016, and‐3. 673b(a). Ther77(24)(B).
11
d *** in inte
ces do not ect merchandomestic produring the POe. Moreoverducer during
industry to ioduct during
ariff Act, impke product tted States dug of the petit
2017, the 1counted for *ports from Kantity.52 Becutory negligibnegligible.
me and effecbject importct imports frd by Commeestic like pro
rcent in 2014* percent in id interim peri
re are excepti
erim 2017.48
exist to excluise was sporoduction at itOI was clearr, given TIMEg the POI, ex
include TIME the POI.
ports from athat accounturing the motion shall gen
2‐month pe*** percent Kazakhstan acause subjecbility thresh
cts for a detets, section 77rom all counerce on the soduct in the
4, *** percentinterim 2017.ods 2016 and
ions to this ge
TIMET expl
ude TIMET frradic during ts highest rerly in domestET’s status axclusion of T
ET and ATI, t
a subject cout for less thaost recent 12nerally be de
riod preced of total U.Saccounted foct imports froolds, we find
ermination o71(7)(G)(i) ontries as to wsame day, if U.S. market
t in 2015, and. TIMET’s oped 2017, but *
eneral rule no
lained its rea
rom the the POI, andeached only tic productios the sole IMET would
the two
untry of an 3 percent2 months foeemed
ing the filing. imports of or *** perceom each subd that subje
of reasonablof the Tariff Awhich petitiosuch importt. In assessin
d *** percenterating margi** the indust
ot pertinent h
ason
d its *** on
of r
g of
ent of bject ct
e Act ons ts ng
t in in try
here.

12
whether subject imports compete with each other and with the domestic like product, the Commission generally has considered four factors:
(1) the degree of fungibility between subject imports from different
countries and between subject imports and the domestic like product, including consideration of specific customer requirements and other quality related questions;
(2) the presence of sales or offers to sell in the same geographic markets of subject imports from different countries and the domestic like product;
(3) the existence of common or similar channels of distribution for subject imports from different countries and the domestic like product; and
(4) whether the subject imports are simultaneously present in the market.53
While no single factor is necessarily determinative, and the list of factors is not exclusive, these factors are intended to provide the Commission with a framework for determining whether the subject imports compete with each other and with the domestic like product.54 Only a “reasonable overlap” of competition is required.55
We do not consider subject imports from Japan and Kazakhstan on a cumulated basis because we find that the statutory criteria for cumulation are not satisfied, because there is not a reasonable overlap of competition between subject imports from either Japan or Kazakhstan and the domestic like product. The threshold requirement is met because petitioner filed the antidumping and countervailing duty petitions with respect to both countries on the same day, August 24, 2017.56
A. Arguments of the Parties
TIMET argues that the Commission should cumulate subject imports from Japan and Kazakhstan. It asserts that subject imports from Japan and Kazakhstan and the domestic like product are fungible, because titanium sponge from domestic and subject sources is
53 See Certain Cast‐Iron Pipe Fittings from Brazil, the Republic of Korea, and Taiwan, Inv. Nos.
731‐TA‐278‐80 (Final), USITC Pub. 1845 (May 1986), aff’d, Fundicao Tupy, S.A. v. United States, 678 F. Supp. 898 (Ct. Int’l Trade), aff’d, 859 F.2d 915 (Fed. Cir. 1988).
54 See, e.g., Wieland Werke, AG v. United States, 718 F. Supp. 50 (Ct. Int’l Trade 1989). 55 The Statement of Administrative Action (SAA) to the Uruguay Round Agreements Act (URAA),
expressly states that “the new section will not affect current Commission practice under which the statutory requirement is satisfied if there is a reasonable overlap of competition.” H.R. Rep. No. 103‐316, vol. I at 848 (1994) (citing Fundicao Tupy, 678 F. Supp. at 902); see Goss Graphic Sys., Inc. v. United States, 33 F. Supp. 2d 1082, 1087 (Ct. Int’l Trade 1998) (“cumulation does not require two products to be highly fungible”); Wieland Werke, AG, 718 F. Supp. at 52 (“Completely overlapping markets are not required.”).
56 None of the statutory exceptions to cumulation applies.

13
interchangeable within the same grade.57 TIMET states that subject imports from Japan and Kazakhstan were present in the United States throughout the POI,58 and that there is geographic overlap between the domestic like product and subject imports from both sources.59
TIMET argues that the domestic like product and subject imports from both sources share common channels of distribution. It states that the two U.S. producers internally consumed all titanium sponge, while the importers of subject merchandise were melters that internally consumed imported titanium sponge. It argues that the difference between the two as to channels of distribution is not significant, since both domestic producers and importers internally consume titanium sponge in the production of downstream merchandise, and Japanese and Kazakh producers compete based on price against titanium sponge that is produced in the United States.60
UKTMP, supported by other respondents, argues that the Commission should not cumulate subject imports from Japan with subject imports from Kazakhstan.61 UKTMP asserts that the statute does not envision cumulation in the circumstances here where domestic producers do not compete against subject imports in the open market in the United States. UKTMP argues that there were no sales or offers to sell the domestic like product and the subject imports in the same geographic markets, given the absence of any commercially significant sales or offers of the domestic like product in any U.S. market.62 It further asserts that internal consumption of the domestic like product is arguably a different channel of distribution from open market sales.63 UKTMP also argues that subject imports from Kazakhstan and subject imports from Japan are not broadly fungible, asserting that subject imports from Japan were *** premium grade titanium sponge, but no subject imports from Kazakhstan during the POI were premium grade.64
B. Analysis
Fungibility. U.S. producers and U.S. importers were generally *** between those reporting that the domestic like product and subject imports from both subject countries are “always” interchangeable, and those reporting that they are only “sometimes”
57 TIMET’s Postconference Brief at 7; Petition at 26; Conference Tr. at 49‐50 (Horgan), 50‐51
(Seiner). 58 TIMET’s Postconference Brief at 9; Petition at 27. 59 TIMET’s Postconference Brief at 7‐8. 60 TIMET’s Postconference Brief at 8; Petition at 26‐28. 61 Conference Tr. at 139‐42 (Thomas), 165 (Cannon; Ellis); UKTMP’s Postconference Brief at 5‐9;
U.S. Importers’ Postconference Brief at 6; OTC’s Postconference Brief at 6; ATI’s Postconference Brief at 22 n.13.
62 UKTMP’s Postconference Brief at 5‐7; Conference Tr. at 140‐41 (Thomas). 63 UKTMP’s Postconference Brief at 7 n.13; Conference Tr. at 141 (Thomas). 64 UKTMP’s Postconference Brief at 7‐8 and n.13; Conference Tr. at 141 (Thomas).

14
interchangeable.65 In the comparison of subject imports from Japan and subject imports from Kazakhstan, U.S. producers and U.S. importers were *** between those reporting that imports from both sources are “always” interchangeable with each other and those reporting that they are only “sometimes” interchangeable.66
Subject imports from Kazakhstan during the POI were *** standard grade titanium sponge.67 By contrast, *** subject imports from Japan during the POI were of premium grade, although a *** and increasing percentage of shipments of subject imports from Japan over the POI was of standard grade.68 While *** domestically produced titanium sponge during the POI was premium grade, at least *** percent of domestic production was standard grade during each year and interim period of the POI.69 Thus, both the domestic like product and U.S. shipments of subject imports from Japan and Kazakhstan included substantial quantities of standard grade titanium sponge.
While the record indicates some divisions among responding market participants as to the degree of interchangeability between and among subject imports and the domestic like product, and there appear to be some differences between the grades of titanium sponge imported from Kazakhstan and those imported from Japan, the record generally indicates sufficient fungibility to satisfy the reasonable overlap of competition standard.
Channels of Distribution. The reported sales of U.S. producers and importers of subject merchandise went exclusively to end users, with no reported sales to distributors.70 However, there were almost no reported sales by U.S. producers. In 2016, most U.S. producers’ U.S. shipments (*** percent by quantity) were internally consumed, with a smaller percentage (*** percent by quantity) going to transfers to related firms, and less than *** percent by quantity of U.S. producers’ U.S. shipments were commercial shipments.71 TIMET had a very small volume of commercial sales (e.g., one or two metric tons a year), which occurred when non‐commercial end users contacted TIMET to supply “niche” needs for small amounts of titanium
65 CR/PR at Table II‐4. U.S. importers were split with respect to the comparison of the domestic
like product and subject imports from Japan, as *** importers reported that they were “always” interchangeable, *** reported that they were “frequently” interchangeable, and *** reported that they were “sometimes” interchangeable. Id.
66 CR/PR at Table II‐4. While the *** responding U.S. producers were *** on this point, *** U.S. importers reported that they were “always” interchangeable, while *** reported that they were “sometimes” interchangeable. Id.
67 CR/PR at Table IV‐5. 68 The percentage of shipments of subject imports from Japan by quantity that were of premium
grade was *** percent in 2014, *** percent in 2015, and *** percent in 2016; it was *** percent in interim 2016 and *** percent in interim 2017. The percentage of shipments of subject imports from Japan by quantity that were of standard grade was *** percent in 2014, *** percent in 2015, and *** percent in 2016; it was *** percent in interim 2016 and *** percent in interim 2017. CR/PR at Table IV‐5.
69 CR/PR at Table III‐7. 70 CR/PR at Table II‐1. 71 CR at III‐6; PR at III‐3. ATI reported no commercial sales between 2014 and 2016. CR at II‐1,
III‐6 n.4; PR at III‐3 n.4.

15
sponge.72 By TIMET’s own account, these infrequent commercial spot sales by TIMET did not compete with subject imports.73
The largest importers of subject merchandise in 2016 were ***.74 ATI, Arconic, Perryman, and TIMET consume the titanium sponge they import to produce downstream titanium mill products.75 Importers reported that in 2016, *** percent of subject imports from Japan and *** percent of subject imports from Kazakhstan were internally consumed.76 Given the absence of commercial sales by the domestic industry (apart from the small “niche” spot sales by TIMET), there were no commercial sales during the POI by domestic producers TIMET and ATI to any of the other large U.S. firms that consume titanium sponge.
TIMET asserts that it contacted representatives of ATI, Perryman, and Arconic during the POI, and inquired whether these companies would be interested in purchasing titanium sponge from TIMET, but states that none of them expressed any interest, leading TIMET to assert that it has been effectively “locked out”’ of the commercial market for titanium sponge in the United States by subject imports.77 Respondents dispute TIMET’s characterization of these contacts, arguing that TIMET’s inquiries were not bona fide offers to sell, particularly given the prevalence in the market of long‐term supply contracts negotiated over a substantial period of time, and doubts about whether TIMET had available titanium sponge to supply.78 In any event, TIMET states that these contacts did not involve offers to sell titanium sponge at a specific price under specific terms, but rather were general inquiries to determine whether these other firms might be interested in discussing purchasing titanium sponge from TIMET.79 Thus, although the record may be in dispute as to some aspects of these contacts, it is undisputed that these contacts do not constitute commercial sales or offers to sell titanium sponge by TIMET.
Accordingly, the record indicates that during the POI no domestic producer made any meaningful commercial sales of or offers to sell the domestic like product. Instead, virtually all domestically produced titanium sponge was internally consumed in the production of downstream products or transferred to related firms. By contrast, subject imports from Japan and Kazakhstan were purchased, typically pursuant to contract, by unrelated entities that also internally consumed the titanium sponge in the production of downstream products.80
72 See Conference Tr. at 60, 85‐86 (Seiner); CR/PR at Table V‐2. TIMET described its commercial
sales as de minimis. (“It was one or two tons a year for a plant that’s making more than 10,000 {tons}, de minimis. … One ton out of more than 10,000 is essentially no sale.”). Conference Tr. at 60 (Seiner).
73 See Conference Tr. at 85‐86 (Seiner) (TIMET frequently sold these products at premium prices); TIMET’s Postconference Brief at 25.
74 CR/PR at Table IV‐1. 75 Petition at 21 and Exh. GEN‐20, Declaration of Henry Seiner, at Paragraph 6; see Conference
Tr. at 108‐11 (Sims), 113, 117 (Halford), 119 (Perryman) 76 CR at V‐10; PR at V‐4. 77 Petition at 38‐39; TIMET’s Postconference Brief at 38; Conference Tr. at 22‐23 (Seiner). 78 ATI’s Postconference Brief at 19‐20, U.S. Importers’ Postconference Brief at 10; OTC’s
Postconference Brief at 9; Conference Tr. at 109‐10 (Sims), 114‐16 (Halford), 121‐22 (Perryman). 79 Conference Tr. at 51, 61 (Seiner). 80 CR at V‐2 to V‐3; PR at V‐1 to V‐2.

16
Geographic Overlap. The record indicates that *** reported its very small volume of commercial sales in the Midwest, Central Southwest, and Pacific Coast regions. Two importers of subject merchandise from Japan reported sales in the Northeast and Midwest regions. No importer of subject merchandise from Kazakhstan provided data on this issue.81 As previously discussed, the record indicates that both TIMET and ATI imported subject merchandise that they used in conjunction with their domestically produced titanium sponge in their downstream production operations, which are located in the *** regions.82
Simultaneous Presence in Market. Subject imports from Japan were present in the U.S. market in all 42 months of the POI. Subject imports from Kazakhstan were present in the U.S. market for *** of 42 months during the POI: *** months in 2014, *** months in 2015; *** in 2016, and *** months in interim 2017.83 The domestic like product was present in the U.S. market throughout the POI.84
Conclusion. We find that two of the four criteria that the Commission examines in determining whether there is a reasonable overlap of competition – fungibility and simultaneous presence in the market – are satisfied. In addition, the geographic overlap criterion appears to be satisfied by domestic producers’ use of both domestically produced titanium sponge and subject imports from Japan and Kazakhstan in their downstream production operations. However, we find that the criterion concerning channels of distribution is not satisfied because during the POI the subject imports were sold to unrelated entities while the domestic like product was not, to any meaningful extent, notwithstanding that both the subject imports and the domestic like product were used in production of downstream titanium mill products. The sales of subject imports to unrelated producers of downstream titanium products and internal transfers of the domestic like product by producers of downstream titanium products do not indicate the presence of common channels of distribution and do not indicate that any actual competition, much less price competition, existed between the domestic producers and subject imports from Japan or Kazakhstan for commercial sales. In other words, because the record indicates the absence of meaningful commercial sales or offers to sell of the domestic like product in the U.S. market, we find that there is a lack of head‐to‐head competition between subject imports and the domestic like product.
TIMET argues that even if the channels of distribution are not exactly the same, the availability of subject imports in the market may affect a domestic producer’s decision whether to make titanium sponge at its U.S. plant or buy it from subject imports, which in its view indicates that there is some degree of competition between subject imports and internally consumed domestic production.85 While this may be pertinent to the question of fungibility, it does not indicate an overlap in channels of distribution between the domestic like product and subject imports.
81 CR/PR at Table II‐2. 82 See CR at III‐6 n.4; PR at III‐3 n.4. 83 CR/PR at Table IV‐6. 84 CR/PR at Table III‐4. 85 TIMET’s Postconference Brief at 8; Petition at 26‐28.

Wwhether but also wthese invdomesticto‐head ccommercbetweensubject imsubject imimports fof mater
NVII.b
A
InCommissStates is investigasubject imdomesticoperatioimmaterdomesticeconomiis disposiand cond
86
87
88
amendedindicationrespects.
89
relevant tto the det
90
91
92
We note thatsubject impwhether subvestigations c like produccompetitioncial sales. W and amongmports frommports. In lfrom Japan aial injury.87
No Reasonaby Reason o
A. Legal
n the prelimision determimaterially ination.88 In mmports, theic producers ns.89 The staial, or unimpc industry is c factors thaitive, and allditions of co
6 19 U.S.C. § 17 19 U.S.C. § 18 19 U.S.C. §§ the provision
n of material i We have app9 19 U.S.C. § 1to the determtermination.”0 19 U.S.C. § 11 19 U.S.C. § 12 19 U.S.C. § 1
t the statutoports from dibject importindicates a lct and impor of imports f
We consequeg subject impm Japan and ight of our fand Kazakhs
able Indicaof Subject
Standard
inary phase ines whethenjured or thrmaking this deir effect on pof the domeatute defineportant.”90 Imaterially inat bear on th relevant facmpetition th
1677(7)(G)(i). 1677(7)(H). 1671b(a), 16ns of the Tarifinjury and thrplied these am1677(7)(B). Tmination” but ” 19 U.S.C. § 1677(7)(A). 1677(7)(C)(iii)1677(7)(C)(iii)
ory standard ifferent sours compete wack of overlrts from eithfrom either ently find thaports and theKazakhstan inding of a lastan are also
ation of M Imports
of antidumper there is a rreatened wieterminatioprices for theestic like proes “material In assessing njured by rehe state of thctors are conhat are distin
673b(a). The Tff Act pertainreat of matermendments hhe Commissioshall “identif1677(7)(B).
.
.
17
for cumulatrces competwith the domap of channher subject csubject sourat there is noe domestic lfor our analack of reasoo ineligible fo
Material Inj
ping and coureasonable ith material in, the Comme domestic loduct, but oninjury” as “hwhether theason of subjhe industry insidered “wnctive to the
Trade Preferening to Commrial injury by rhere. on “may consfy each {such}
tion directs ute with each mestic like prels of distribcountry that rce and the o reasonablelike product,ysis of mateonable overlaor cumulatio
ury or Thr
untervailing indication thinjury by reamission mustike product,nly in the coharm which ere is a reasject importsin the Uniteithin the cone affected in
ences Extensimission determreason of sub
sider such oth} factor ... {a}
us to examin other in theroduct.86 Thbution betweindicates thdomestic like overlap of , and we do erial injury byap of compeon for our an
reat of Mat
duty investihat an industason of the it consider th, and their imntext of U.Sis not incononable indic, we consided States.91 Nntext of the dustry.”92
ion Act of 201minations of rbject imports
her economicnd explain in
ne not only e U.S. markehe record in een the he lack of heake product fof competitionnot cumulay reason of etition, subjenalysis of thr
terial Injur
gations, thetry in the Unmports undhe volume ompact on . productionsequential, cation that ter all relevanNo single facbusiness cyc
15, Pub. L. 11reasonable in certain
c factors as arfull its releva
et,
ad‐or n te
ect reat
ry
nited er of
n
he nt ctor cle
14‐27,
re ance

18
Although the statute requires the Commission to determine whether there is a reasonable indication that the domestic industry is “materially injured by reason of” unfairly traded imports,93 it does not define the phrase “by reason of,” indicating that this aspect of the injury analysis is left to the Commission’s reasonable exercise of its discretion.94 In identifying a causal link, if any, between subject imports and material injury to the domestic industry, the Commission examines the facts of record that relate to the significance of the volume and price effects of the subject imports and any impact of those imports on the condition of the domestic industry. This evaluation under the “by reason of” standard must ensure that subject imports are more than a minimal or tangential cause of injury and that there is a sufficient causal, not merely a temporal, nexus between subject imports and material injury.95
In many investigations, there are other economic factors at work, some or all of which may also be having adverse effects on the domestic industry. Such economic factors might include nonsubject imports; changes in technology, demand, or consumer tastes; competition among domestic producers; or management decisions by domestic producers. The legislative history explains that the Commission must examine factors other than subject imports to ensure that it is not attributing injury from other factors to the subject imports, thereby inflating an otherwise tangential cause of injury into one that satisfies the statutory material injury threshold.96 In performing its examination, however, the Commission need not isolate
93 19 U.S.C. §§ 1671b(a), 1673b(a). 94 Angus Chemical Co. v. United States, 140 F.3d 1478, 1484‐85 (Fed. Cir. 1998) (“{T}he statute
does not ‘compel the commissioners’ to employ {a particular methodology}.”), aff’g 944 F. Supp. 943, 951 (Ct. Int’l Trade 1996).
95 The Federal Circuit, in addressing the causation standard of the statute, has observed that “{a}s long as its effects are not merely incidental, tangential, or trivial, the foreign product sold at less than fair value meets the causation requirement.” Nippon Steel Corp. v. USITC, 345 F.3d 1379, 1384 (Fed. Cir. 2003). This was re‐affirmed in Mittal Steel Point Lisas Ltd. v. United States, 542 F.3d 867, 873 (Fed. Cir. 2008), in which the Federal Circuit, quoting Gerald Metals, Inc. v. United States, 132 F.3d 716, 722 (Fed. Cir. 1997), stated that “this court requires evidence in the record ‘to show that the harm occurred “by reason of” the LTFV imports, not by reason of a minimal or tangential contribution to material harm caused by LTFV goods.’” See also Nippon Steel Corp. v. United States, 458 F.3d 1345, 1357 (Fed. Cir. 2006); Taiwan Semiconductor Industry Ass’n v. USITC, 266 F.3d 1339, 1345 (Fed. Cir. 2001).
96 SAA, H.R. Rep. 103‐316, vol. I at 851‐52 (1994) (“{T}he Commission must examine other factors to ensure that it is not attributing injury from other sources to the subject imports.”); S. Rep. 96‐249 at 75 (1979) (the Commission “will consider information which indicates that harm is caused by factors other than less‐than‐fair‐value imports.”); H.R. Rep. 96‐317 at 47 (1979) (“in examining the overall injury being experienced by a domestic industry, the ITC will take into account evidence presented to it which demonstrates that the harm attributed by the petitioner to the subsidized or dumped imports is attributable to such other factors;” those factors include “the volume and prices of nonsubsidized imports or imports sold at fair value, contraction in demand or changes in patterns of consumption, trade restrictive practices of and competition between the foreign and domestic producers, developments in technology and the export performance and productivity of the domestic industry”); accord Mittal Steel, 542 F.3d at 877.

19
the injury caused by other factors from injury caused by unfairly traded imports.97 Nor does the “by reason of” standard require that unfairly traded imports be the “principal” cause of injury or contemplate that injury from unfairly traded imports be weighed against other factors, such as nonsubject imports, which may be contributing to overall injury to an industry.98 It is clear that the existence of injury caused by other factors does not compel a negative determination.99
Assessment of whether material injury to the domestic industry is “by reason of” subject imports “does not require the Commission to address the causation issue in any particular way” as long as “the injury to the domestic industry can reasonably be attributed to the subject imports” and the Commission “ensure{s} that it is not attributing injury from other sources to the subject imports.”100 Indeed, the Federal Circuit has examined and affirmed various Commission methodologies and has disavowed “rigid adherence to a specific formula.”101
The Federal Circuit’s decisions in Gerald Metals, Bratsk, and Mittal Steel all involved cases in which the relevant “other factor” was the presence in the market of significant volumes of price‐competitive nonsubject imports. The Commission interpreted the Federal
97 SAA at 851‐52 (“{T}he Commission need not isolate the injury caused by other factors from
injury caused by unfair imports.”); Taiwan Semiconductor Industry Ass’n, 266 F.3d at 1345. (“{T}he Commission need not isolate the injury caused by other factors from injury caused by unfair imports ... . Rather, the Commission must examine other factors to ensure that it is not attributing injury from other sources to the subject imports.” (emphasis in original)); Asociacion de Productores de Salmon y Trucha de Chile AG v. United States, 180 F. Supp. 2d 1360, 1375 (Ct. Int’l Trade 2002) (“{t}he Commission is not required to isolate the effects of subject imports from other factors contributing to injury” or make “bright‐line distinctions” between the effects of subject imports and other causes.); see also Softwood Lumber from Canada, Inv. Nos. 701‐TA‐414 and 731‐TA‐928 (Remand), USITC Pub. 3658 at 100‐01 (Dec. 2003) (Commission recognized that “{i}f an alleged other factor is found not to have or threaten to have injurious effects to the domestic industry, i.e., it is not an ‘other causal factor,’ then there is nothing to further examine regarding attribution to injury”), citing Gerald Metals, 132 F.3d at 722 (the statute “does not suggest that an importer of LTFV goods can escape countervailing duties by finding some tangential or minor cause unrelated to the LTFV goods that contributed to the harmful effects on domestic market prices.”).
98 S. Rep. 96‐249 at 74‐75; H.R. Rep. 96‐317 at 47. 99 See Nippon, 345 F.3d at 1381 (“an affirmative material‐injury determination under the statute
requires no more than a substantial‐factor showing. That is, the ‘dumping’ need not be the sole or principal cause of injury.”).
100 Mittal Steel, 542 F.3d at 877‐78; see also id. at 873 (“While the Commission may not enter an affirmative determination unless it finds that a domestic industry is materially injured ‘by reason of’ subject imports, the Commission is not required to follow a single methodology for making that determination ... {and has} broad discretion with respect to its choice of methodology.”) citing United States Steel Group v. United States, 96 F.3d 1352, 1362 (Fed. Cir. 1996) and S. Rep. 96‐249 at 75. In its decision in Swiff‐Train v. United States, 793 F.3d 1355 (Fed. Cir. 2015), the Federal Circuit affirmed the Commission’s causation analysis as comporting with the Court’s guidance in Mittal.
101 Nucor Corp. v. United States, 414 F.3d 1331, 1336, 1341 (Fed. Cir. 2005); see also Mittal Steel, 542 F.3d at 879 (“Bratsk did not read into the antidumping statute a Procrustean formula for determining whether a domestic injury was ‘by reason’ of subject imports.”).
20
Circuit’s guidance in Bratsk as requiring it to apply a particular additional methodology following its finding of material injury in cases involving commodity products and a significant market presence of price‐competitive nonsubject imports.102 The additional “replacement/benefit” test looked at whether nonsubject imports might have replaced subject imports without any benefit to the U.S. industry. The Commission applied that specific additional test in subsequent cases, including the Carbon and Certain Alloy Steel Wire Rod from Trinidad and Tobago determination that underlies the Mittal Steel litigation.
Mittal Steel clarifies that the Commission’s interpretation of Bratsk was too rigid and makes clear that the Federal Circuit does not require the Commission to apply an additional test nor any one specific methodology; instead, the court requires the Commission to have “evidence in the record ‘to show that the harm occurred ‘by reason of’ the LTFV imports,’” and requires that the Commission not attribute injury from nonsubject imports or other factors to subject imports.103 Accordingly, we do not consider ourselves required to apply the replacement/benefit test that was included in Commission opinions subsequent to Bratsk.
The progression of Gerald Metals, Bratsk, and Mittal Steel clarifies that, in cases involving commodity products where price‐competitive nonsubject imports are a significant factor in the U.S. market, the Court will require the Commission to give full consideration, with adequate explanation, to non‐attribution issues when it performs its causation analysis.104
The question of whether the material injury threshold for subject imports is satisfied notwithstanding any injury from other factors is factual, subject to review under the substantial evidence standard.105 Congress has delegated this factual finding to the Commission because of the agency’s institutional expertise in resolving injury issues.106
102 Mittal Steel, 542 F.3d at 875‐79. 103 Mittal Steel, 542 F.3d at 873 (quoting from Gerald Metals, 132 F.3d at 722), 875‐79 & n.2
(recognizing the Commission’s alternative interpretation of Bratsk as a reminder to conduct a non‐attribution analysis).
104 To that end, after the Federal Circuit issued its decision in Bratsk, the Commission began to present published information or send out information requests in the final phase of investigations to producers in nonsubject countries that accounted for substantial shares of U.S. imports of subject merchandise (if, in fact, there were large nonsubject import suppliers). In order to provide a more complete record for the Commission’s causation analysis, these requests typically seek information on capacity, production, and shipments of the product under investigation in the major source countries that export to the United States. The Commission plans to continue utilizing published or requested information in the final phase of investigations in which there are substantial levels of nonsubject imports.
105 We provide in our respective discussions of volume, price effects, and impact a full analysis of other factors alleged to have caused any material injury experienced by the domestic industry.
106 Mittal Steel, 542 F.3d at 873; Nippon Steel Corp., 458 F.3d at 1350, citing U.S. Steel Group, 96 F.3d at 1357; S. Rep. 96‐249 at 75 (“The determination of the ITC with respect to causation is ... complex and difficult, and is a matter for the judgment of the ITC.”).
21
Section 771(7)(C)(i) of the Tariff Act provides that the “Commission shall consider whether the volume of imports of the merchandise, or any increase in that volume, either in absolute terms or relative to production or consumption in the United States, is significant.”107
Section 771(7)(C)(ii) of the Tariff Act provides that, in evaluating the price effects of subject imports, the Commission shall consider whether –
(I) there has been significant price underselling by the imported merchandise as compared with the price of domestic like products of the United States, and
(II) the effect of imports of such merchandise otherwise depresses prices to a significant degree or prevents price increases, which otherwise would have occurred, to a significant degree.108
Section 771(7)(C)(iii) of the Tariff Act provides that the Commission, in examining the impact of the subject imports on the domestic industry, “shall evaluate all relevant economic factors which have a bearing on the state of the industry.” These factors include output, sales, inventories, capacity utilization, market share, employment, wages, productivity, gross profits, net profits, operating profits, cash flow, return on investment, return on capital, ability to raise capital, ability to service debt, research and development, and factors affecting domestic prices. No single factor is dispositive and all relevant factors are considered “within the context of the business cycle and conditions of competition that are distinctive to the affected industry.”109
Section 771(7)(F) of the Tariff Act directs the Commission to determine whether the U.S. industry is threatened with material injury by reason of the subject imports by analyzing whether “further dumped or subsidized imports are imminent and whether material injury by reason of imports would occur unless an order is issued or a suspension agreement is accepted.”110 The Commission may not make such a determination “on the basis of mere conjecture or supposition,” and considers the threat factors “as a whole” in making its determination whether dumped or subsidized imports are imminent and whether material injury by reason of subject imports would occur unless an order is issued.111 In making our determination, we consider all statutory threat factors that are relevant to these investigations.112
107 19 U.S.C. § 1677(7)(C)(i). 108 19 U.S.C. § 1677(7)(C)(ii).r 109 19 U.S.C. § 1677(7)(C)(iii). This provision was amended by the Trade Preferences Extension
Act of 2015, Pub. L. 114‐27. 110 19 U.S.C. § 1677(7)(F)(ii). 111 19 U.S.C. § 1677(7)(F)(ii). 112 These factors are as follows: (I) if a countervailable subsidy is involved, such information as may be presented to it by the
administering authority as to the nature of the subsidy (particularly as to whether the countervailable subsidy is a subsidy described in Article 3 or 6.1 of the Subsidies Agreement) and whether imports of the subject merchandise are likely to increase, (Continued…)

22
B. Conditions of Competition and the Business Cycle
The following conditions of competition inform our analysis of whether there is a reasonable indication of material injury by reason of subject imports.113
1. Demand Conditions
U.S. demand for titanium sponge depends on the demand for U.S.‐produced downstream products in the form of ingots, billet, slabs, and titanium mill products. These
(…Continued)
(II) any existing unused production capacity or imminent, substantial increase in production capacity in the exporting country indicating the likelihood of substantially increased imports of the subject merchandise into the United States, taking into account the availability of other export markets to absorb any additional exports,
(III) a significant rate of increase of the volume or market penetration of imports of the subject merchandise indicating the likelihood of substantially increased imports,
(IV) whether imports of the subject merchandise are entering at prices that are likely to have a significant depressing or suppressing effect on domestic prices and are likely to increase demand for further imports,
(V) inventories of the subject merchandise, (VI) the potential for product‐shifting if production facilities in the foreign country, which can be
used to produce the subject merchandise, are currently being used to produce other products, … (VIII) the actual and potential negative effects on the existing development and production
efforts of the domestic industry, including efforts to develop a derivative or more advanced version of the domestic like product, and
(IX) any other demonstrable adverse trends that indicate the probability that there is likely to be material injury by reason of imports (or sale for importation) of the subject merchandise (whether or not it is actually being imported at the time).
19 U.S.C. § 1677(7)(F)(i). To organize our analysis, we discuss the applicable statutory threat factors using the same volume/price/impact framework that applies to our material injury analysis. Statutory threat factors (I), (II), (III), (V), and (VI) are discussed in the analysis of subject import volume. Statutory threat factor (I) is applicable only in the investigation of titanium sponge from Kazakhstan. Statutory threat factor (IV) is discussed in the analysis of subject import price effects. Statutory factors (VIII) and (IX) are discussed in the analysis of impact. Statutory factor (VII) concerning agricultural products is inapplicable to these investigations.
113 The captive production provision does not apply in these investigations because the threshold condition is not satisfied. 19 U.S.C. § 1677(7)(C)(iv). While domestic producers “internally transfer significant production of the domestic like product for the production of a downstream article,” they do not “sell significant production of the domestic like product in the merchant market.” In 2016, most U.S. producers’ U.S. shipments (*** percent by quantity) were internally consumed, with a smaller percentage (*** percent by quantity) going to transfers to related firms, but less than *** percent by quantity of U.S. producers’ U.S. shipments were commercial shipments to the merchant market. CR at III‐6; PR at III‐3.
23
downstream products are used for applications such as electrodes, aerospace engines, airframes, and medical devices.114
Responding U.S. producers and importers reported that U.S. demand for titanium sponge either increased or was unchanged since January 1, 2014.115 However, apparent U.S. consumption declined by *** percent between 2014 and 2016, increasing from *** metric tons in 2014 to *** metric tons in 2015, and then declining to *** metric tons in 2016. It was *** metric tons in interim 2016 and *** metric tons in interim 2017.116
U.S. consumption of titanium sponge is relatively concentrated, with three purchasers and two domestic producers accounting for more than *** percent of total U.S. consumption in 2016. The vast majority of U.S. purchases and production of titanium sponge were for internal consumption to produce downstream products, with very little titanium sponge offered for resale.117
2. Supply Conditions
There were two U.S. producers during the POI, TIMET and ATI. ATI idled its plant in Rowley, Utah in December 2016 and ceased domestic production of titanium sponge.118 TIMET is an integrated producer that has the ability to produce its own magnesium and titanium tetrachloride (TiCl4) necessary for the production of titanium sponge. By contrast, ATI had to purchase the necessary magnesium and TiCl4, because it did not have internal sources of these raw materials.119 The capacity of the domestic industry was below apparent U.S. consumption throughout the POI.120 Both TIMET and ATI supplemented their domestic production with imports of titanium sponge during the POI.121 TIMET reported minimal commercial sales during the POI, while ATI reported no commercial sales.122
114 CR at II‐10; PR at II‐7. 115 CR at II‐11; PR at II‐7; CR/PR at Table II‐3; see Conference Tr. at 69 (Seiner). 116 CR/PR at Tables IV‐8, C‐1. 117 CR at II‐2; PR at II‐1. Less than *** percent of U.S. production of titanium sponge and less
than two *** of U.S. imports of titanium sponge are resold. CR at II‐3; PR at II‐2. 118 CR at III‐1 n.1; PR at III‐1 n.1. 119 CR at VI‐7; PR at VI‐4; Conference Tr. at 78‐79 (Seiner), 107 (Sims). 120 In 2016, the domestic industry’s capacity was *** metric tons, while apparent U.S.
consumption was *** metric tons. In interim 2017, after ATI ceased domestic production, the domestic industry’s capacity was *** metric tons, while apparent U.S. consumption was *** metric tons. CR/PR at Table C‐1.
121 CR at III‐9 to III‐10; PR at III‐5; CR/PR at Table III‐9; Petition at 32‐33; Conference Tr. at 66‐67 (Seiner), 110‐11 (Sims).
122 CR at II‐1 to II‐2, III‐6 and n.4; PR at II‐1, III‐3 and n.4; Conference Tr. at 60, 85‐86 (Seiner). The domestic industry reported commercial sales of *** in 2016, while reporting that *** metric tons were internally consumed, and *** metric tons were shipped to related firms. CR/PR at Table VI‐1.

24
The domestic industry’s share of apparent U.S. consumption increased from *** percent in 2014 to *** percent in 2015, and then declined to *** percent in 2016. It was *** percent in interim 2016 and *** percent in interim 2017.123
The market share of subject imports from Japan was *** percent in 2014, *** percent in 2015, and *** percent in 2016; it was *** percent in interim 2016 and *** percent in interim 2017.124 The market share of subject imports from Kazakhstan was *** percent in 2014, *** percent in 2015, and *** percent in 2016; it was *** percent in interim 2016 and *** percent in interim 2017.125 126
The market share of nonsubject imports was below that of the domestic industry or subject imports from Japan, but above that of subject imports from Kazakhstan. *** percent in 2014, *** percent in 2015, and *** percent in 2016; it was *** percent in interim 2016 and *** percent in interim 2017.127 The largest sources of nonsubject imports during the 2014 to 2016 period were Russia, Ukraine, and China.128
3. Substitutability and Other Conditions
The record indicates that the domestic like product and subject imports from both Japan and Kazakhstan are moderately to highly substitutable.129 Purchasers responding to the Commission’s lost sales/lost revenues survey identified several factors as important to their purchasing decision for titanium sponge, with availability, quality, and terms of supply being the most frequently listed factors, and did not list price as a main purchasing factor. Responding purchasers emphasized the importance of a reliable, diversified, and stable supply of titanium sponge.130 U.S. importers reported that a majority of their sales were under annual or long‐term contracts, sometimes with fixed prices and quantities, with some long‐term contracts having a duration of five or ten years.131
Titanium sponge is produced in standard and premium grades. The end uses for standard grade titanium sponge include airframes and non‐rotating parts of aircraft engines, and non‐aerospace industrial applications, while the end uses for premium grade include rotating engine parts for the aerospace industry.132 Some end users require a lengthy certification process for producers of premium grade titanium sponge to ensure that their
123 CR/PR at Table IV‐9. 124 CR/PR at Table IV‐9. 125 CR/PR at Table IV‐9. 126 The 2017 general U.S. rate of duty for imports of titanium sponge, which is applicable to
imports from both Japan and Kazakhstan, is 15 percent ad valorem. CR at I‐8 and n.15; PR at I‐7 and n.15.
127 CR/PR at Table IV‐9. 128 CR at II‐9; PR at II‐6. 129 CR at II‐13 to II‐14; PR at II‐9. 130 CR at II‐14; PR at II‐10. 131 CR at V‐3; PR at V‐2; CR/PR at Table V‐2; Conference Tr. at 61‐62 (Seiner), 108 (Sims), 169‐70
(Halford), 170‐71 (Forsythe), 171 (Perryman). 132 CR at I‐9 to I‐10, II‐1; PR at I‐7 to I‐8, II‐1.
25
product is suitable for particular end uses (e.g., rotating engine parts).133 Premium grade titanium sponge can be and is used in standard grade applications, but standard grade titanium sponge cannot be used in premium grade applications.134 For some applications, titanium scrap can be substituted to some degree for titanium sponge.135
C. No Reasonable Indication of Material Injury by Reason of Subject Imports from
Japan
1. Volume of Subject Imports
The volume of subject imports from Japan increased during the period of investigation. The quantity of subject imports from Japan rose from *** metric tons in 2014 to *** metric tons in 2015 and *** metric tons in 2016; it was *** metric tons in interim 2016 and higher, at *** metric tons, in interim 2017.136 The market share of subject imports from Japan was *** percent in 2014, *** percent in 2015, and *** percent in 2016; it was *** percent in interim 2016 and *** percent in interim 2017.137 Viewed in isolation, the volume and market share and increases in volume and market share of subject imports from Japan could be considered significant. However, we do not perceive that market share shifts in this industry, such as the increase in market penetration of subject market imports from Japan in interim 2017, are indicative of a competitive advantage for the imported product. This is because the domestic like product is not sold commercially; given the lack of head‐to‐head competition between subject imports and the domestic like product, sales gained by subject imports are not necessarily “lost” by the domestic industry. By the same token, we do not view the percentage of imports in relation to domestic production, which was used virtually exclusively for internal transfers, as a particularly instructive metric. Moreover, as explained below, these volumes of subject imports of Japan did not have significant price effects or impact in light of the conditions of competition. For these reasons, we find that the volume of subject imports from Japan and any increase in that volume, both in absolute terms and relative to domestic consumption and production, are not significant.
2. Price Effects of the Subject Imports
The Commission collected data in these investigations concerning pricing of two titanium sponge products shipped to unrelated customers, as well as import purchase cost data.138 These data do not provide a basis for making a finding of significant price underselling
133 CR at I‐9; PR at I‐7 to I‐8; Conference Tr. at 89‐90, 96‐98 (Seiner). 134 CR at I‐10; II‐1; PR at I‐8, II‐1. 135 CR at I‐10 to I‐11; II‐13; PR at I‐8 to I‐9; II‐9; Conference Tr. at 63‐64 (Seiner). 136 CR/PR at Table IV‐2. The quantity of U.S. shipments of subject imports from Japan declined
from *** metric tons in 2014 to *** metric tons in 2015, and then increased to *** metric tons in 2016. It was *** metric tons in interim 2016 and *** metric tons in interim 2017. CR/PR at Table IV‐8.
137 CR/PR at Table IV‐9. 138 CR at V‐4, V‐10; PR at V‐2 to V‐3, V‐4.

26
by subject imports from Japan, given the absence of meaningful commercial sales of the domestic like product.139 TIMET concedes that, because of the nature of the domestic industry’s operations, the Commission cannot make meaningful pricing comparisons between subject imports and the domestic like product for purposes of an underselling analysis.140 Additionally, no purchasers responding to the Commission’s lost sales/lost revenues survey confirmed that the domestic industry lost any sales or revenues as a result of low‐priced subject imports from Japan.141
In examining whether subject imports from Japan significantly depressed or suppressed the prices of the domestic like product, we have used the facts available in the record. In light of the lack of meaningful commercial sales by the domestic industry, the data available are the industry’s reported average unit net sales values (“AUVs”).142 These AUVs primarily reflect internal consumption by domestic producers, but also reflect some transfers to related parties as well as a very small volume of commercial sales.143 The domestic industry’s net sales AUV declined somewhat between 2014 and 2016, and was *** lower in interim 2017 than in interim 2016.144 The domestic industry’s ratio of cost of goods sold (“COGS”) to net sales increased
139 Commercial sales of the domestic like product to unrelated parties represented less than ***
percent of U.S. production in 2016, and *** percent of total subject imports in 2016. CR at V‐5 n.6; PR at V‐3 n.6.
140 TIMET’s Postconference Brief at 24, 26; Conference Tr. at 99‐100 (Horgan). TIMET acknowledges that the prices of its few commercial sales do not provide a meaningful basis for making pricing comparisons, stating that it sometimes charged premium prices in light of the administrative costs of processing sales of small volumes of titanium sponge. TIMET’s Postconference Brief at 25; Conference Tr. at 60, 85‐86 (Seiner); CR at VI‐3 n.10; PR at VI‐2 n.10.
141 CR at V‐16 to V‐20; PR at V‐5 to V‐6; CR/PR at Tables V‐8 through V‐10. 142 There are available, albeit limited, pricing data for subject imports from Japan, for which
commercial sales constituted only a very small proportion of subject import shipments. CR at V‐5 n.6, V‐10; PR at V‐3 n.6, V‐4. Reported prices for subject imports of product 1 (premium quality titanium sponge) from Japan declined by *** percent from the first quarter of 2014 through the second quarter of 2017, while reported prices for subject imports of product 2 (standard quality premium sponge) declined by *** percent during this period. CR/PR at Table V‐7. The direct import purchase data, which cover a much greater quantity of shipments, see CR/PR at Tables V‐5 to V‐6, indicate that during this period, direct import purchase costs for product 1 from Japan fell by *** percent and those for product 2 fell by *** percent. CR/PR at Table V‐7.
143 By value, *** percent of U.S. producers’ net sales in 2016 were internal consumption, *** percent were transfers to related firms, and less than *** percent were commercial sales. CR/PR at Table VI‐1.
144 The domestic industry’s net sales AUV fell by *** percent between 2014 and 2016, declining from $*** per metric ton in 2014 to $*** per metric ton in 2015, and $*** per metric ton in 2016. It was $*** per metric ton in interim 2016 and $*** per metric ton in interim 2017. CR/PR at Tables VI‐1, C‐1. The domestic industry’s AUV for internal consumption declined between 2014 and 2016, and was *** lower in interim 2017 than in interim 2016, while its AUV for transfers to related firms declined between 2014 and 2016, but was *** higher in interim 2017 than interim 2016. CR/PR at Table VI‐1. The domestic industry’s AUV for its small volume of commercial sales increased *** between 2014 and 2016, and was *** higher in interim 2017 than in interim 2016. Id.
27
irregularly between 2014 and 2016 and was *** higher in interim 2017 than in interim 2016.145 While we have examined the data reported for the domestic industry as a whole, we observe that TIMET experienced adverse developments in its net sales AUVs and its ratio of COGS to net sales between interim 2016 and interim 2017, just as the domestic industry as a whole did, while ATI experienced positive developments in in its net sales AUVs and its ratio of COGS to net sales between these two interim periods.146 147
Because they largely reflect values derived for internally transferred goods, we find that the domestic producers’ AUV data for their internal consumption do not reflect values based on competition from suppliers of subject imports from Japan. Instead, TIMET reported that it ***.148 ATI reported ***.149
While the reporting of these values by TIMET and ATI may be acceptable for accounting purposes, these values *** do not reflect prices for titanium sponge based on competition in the U.S. market involving the domestic like product. The record indicates that most sales of titanium sponge by U.S. importers were under long‐term or annual contracts, and that these contracts often fix prices and quantities and often do not provide for price renegotiation.150 TIMET states that it currently has long‐term contracts to purchase titanium sponge from ***.151 Accordingly, ***. The prices paid for *** by other purchasers would obviously depend on the specific terms of the contracts that those purchasers negotiated with ***, which may differ substantially from the terms of the long‐term contracts that TIMET negotiated with ***. Thus, the AUV data reported by domestic producers for their internal consumption cannot serve as a
145 The industry’s ratio of COGS to net sales fell from *** percent in 2014 to *** percent in 2015
and then increased to *** percent in 2016. It was *** percent in interim 2016 and *** percent in interim 2017. CR/PR at Table VI‐1.
146 ATI’s net sales AUV was higher in interim 2017, at $*** per metric ton, than it was in interim 2016, at $*** per metric ton. CR/PR at Table VI‐3. By contrast, TIMET’s net sales AUV was lower in interim 2017, at $*** per metric ton, than it was in interim 2016, at $*** per metric ton. Id. The ratio of ATI’s COGS to net sales was *** percentage points lower in interim 2017, at *** percent, than it was in interim 2016, at *** percent. Id. By contrast, the ratio of TIMET’s COGS to net sales was *** percentage points higher in interim 2017, at *** percent, than it was in interim 2016, at *** percent. Id.
147 While ATI ceased domestic production of titanium sponge in 2016, it reported ***. ATI’s U.S. Producers’ Questionnaire at 12, Table II‐7. (EDIS Document No. 622812).
148 CR at VI‐4 n.13; PR at VI‐2 n.13; Petition Exh. 26; EDIS Document No. 623714 (email responses from *** to Commission staff questions).
149 CR at VI‐4 n.12; PR at VI‐2 n.12; EDIS Document No. 623716 (email response from *** to Commission staff questions). TIMET argues that ATI’s AUVs for its internal consumption are not reliable and are not based on fair market value. TIMET’s Postconference Brief at 25‐26. TIMET also contends that its domestic transfer prices for its internal consumption do not provide a useful measure of the impact of subject imports. Petition at 40 and Exh. GEN‐26 at 2. Instead, TIMET has argued that the Commission can simply decline to make price effects findings due to the lack of meaningful data. See Conference Tr. at 100 (Horgan). TIMET’s position cannot be reconciled with the Federal Circuit precedent. See Angus Chemical Co. v. United States, 140 F.3d 1478, 1484 (Fed. Cir. 1998).
150 CR at V‐3; PR at V‐2; CR/PR at Table V‐2; Conference Tr. at 108 (Sims), 169‐70 (Halford), 170‐71 (Forsythe); 171 (Perryman); U.S. Importers’ Postconference Brief at Exhibits 2‐5.
151 Petition at 24 and Exh. GEN‐20, Declaration of Henry Seiner, at Paragraph 7.

28
basis for a finding that subject imports affected the “prices” – here, the AUVs – that they received for their domestically produced titanium sponge products.152
Consequently, based on the available data in the record, we do not find that subject imports from Japan significantly undersold the domestic like product, or had the effect of depressing prices of the domestic like product to a significant degree or preventing prices increases that would otherwise have occurred to a significant degree. Accordingly, we do not find that subject imports from Japan caused significant price effects.
3. Impact of the Subject Imports153
The domestic industry’s performance indicators generally improved between 2014 and 2015 and then declined between 2015 and 2016, generally declining overall between 2014 and 2016. A number of indicators, including those pertaining to output and employment, were *** lower in interim 2017 than in interim 2016.154
The domestic industry’s capacity remained constant at *** metric tons from 2014 to 2016; it was *** metric tons in interim 2016 and *** metric tons in interim 2017.155 Production declined by *** percent from 2014 to 2016, increasing from *** metric tons in 2014 to *** metric tons in 2015 and then declining to *** metric tons in 2016; it was *** metric tons in interim 2016 and *** metric tons in interim 2017.156 Capacity utilization increased from *** percent in 2014 to *** percent in 2015, and then declined to *** percent in 2016; it was *** percent in interim 2016 and *** percent in interim 2017.157
Net sales quantity declined by *** percent from 2014 to 2016, increasing from *** metric tons in 2014 to *** metric tons in 2015, and then declining to *** metric tons in 2016; it was *** metric tons in interim 2016 and *** metric tons in interim 2017.158 U.S. shipments declined by *** percent from 2014 to 2016, increasing from *** metric tons in 2014 to *** metric tons in 2015, and then declining to *** metric tons in 2016; they were *** metric tons in interim 2016 and *** metric tons in interim 2017.159 The domestic industry’s share of apparent U.S. consumption increased from *** percent in 2014 to *** percent in 2015, and then declined to *** percent in 2016; it was *** percent in interim 2016 and *** percent in interim
152 Moreover, given the nature of the domestic industry’s operations, we find that we could not
obtain materially different – much less contrary – AUV or pricing information in any final phase investigation.
153 In its notice initiating the antidumping duty investigation, Commerce reported estimated dumping margins ranging from 69.69 to 95.20 percent for imports of titanium sponge from Japan. Titanium Sponge From Japan and Kazakhstan: Initiation of Less‐Than‐Fair Value Investigations, 82 Fed. Reg. 43939, 43942 (Sept. 20, 2017). For our analysis, we have considered that that all imports of subject merchandise from Japan are alleged to be sold at less than fair value.
154 CR/PR at Table C‐1. 155 CR/PR at Tables III‐4, C‐1. 156 CR/PR at Tables III‐4. C‐1. 157 CR/PR at Tables III‐4. C‐1. 158 CR/PR at Tables VI‐1, C‐1. 159 CR/PR at Tables III‐6, C‐1.

29
2017.160 Ending inventories of domestic producers rose by *** percent from 2014 to 2016, increasing from *** metric tons in 2014 to *** metric tons in 2015, and then to *** metric tons in 2016; they were *** metric tons in interim 2016 and *** metric tons in interim 2017.161
Employment declined by *** percent from 2014 to 2016, increasing from *** production‐related workers (PRWs) in 2014 to *** PRWs in 2015 and then declining to *** PRWs in 2016; it was *** PRWs in interim 2016 and *** PRWs in interim 2017.162 Hours worked declined by *** percent from 2014 to 2016, increasing from *** hours in 2014 to *** hours in 2015, and then declining to *** hours in 2016; they were *** hours in interim 2016 and *** hours in interim 2017.163 Wages paid declined by *** percent from 2014 to 2016, increasing from $*** in 2014 to $*** in 2015, and then declining to $*** in 2016; they were $*** in interim 2016 and $*** in interim 2017.164 Productivity increased by *** percent from 2014 to 2016, increasing (in metric tons per 1,000 hours) from *** in 2014 to *** in 2015 and 2016; it was *** metric tons per hour in interim 2016 and *** in interim 2017.165
Consequently, several of the domestic industry’s output and employment indicators were *** lower in interim 2017 than in interim 2016, including capacity, production, U.S. shipments, market share, employment, hours worked, and wages paid. Most of these declines appear to be attributable to ATI’s cessation of domestic production operations at its Rowley, Utah plant in 2016.166
While TIMET argues that ATI’s idling of its Rowley plant was due to low‐priced subject imports, we find that ATI ceased production at the plant for business reasons essentially unrelated to subject imports. Unlike TIMET, ATI was not an integrated producer of titanium sponge, and had to purchase the necessary magnesium and TiCl4 from suppliers in order to produce titanium sponge because it did not have internal sources of these raw materials.167 As TIMET acknowledges, a non‐integrated titanium sponge producer such as ATI has higher costs than an integrated producer such as TIMET.168 ATI’s costs for magnesium and TiCl4 from its suppliers were increasing in 2016. In addition, ATI’s rail transportation costs for TiCl4 ***, and there was an increasing risk, due to environmental concerns about the transportation and handling of toxic inhalants such as TiCl4, that railroads might refuse to deliver it.169 ATI has long‐term fixed‐price contracts with aerospace customers to supply downstream titanium mill products, and the increasing costs and insecurity of the raw materials for ATI’s titanium sponge
160 CR/PR at Tables IV‐9; C‐1. 161 CR/PR at Tables III‐8, C‐1. 162 CR/PR at Tables III‐10, C‐1. 163 CR/PR at Tables III‐10, C‐1. 164 CR/PR at Tables III‐10, C‐1. 165 CR/PR at Tables III‐10, C‐1. 166 TIMET’s capacity did not change between interim 2016 and interim 2017. Its production and
employment were *** lower in interim 2017 than in interim 2016. CR/PR at Tables III‐4, C‐2. 167 CR at VI‐7; PR at VI‐4; Conference Tr. at 107 (Sims). 168 Conference Tr. at 78‐79 (Seiner), 107 (Sims). According to ATI, ***. ATI’s Postconference
Brief, Exh. 4, Declaration of John Sims at paragraphs 21‐22 and attachment 1. 169 Conference Tr. at 107‐08, 146‐47 (Sims); ATI’s Postconference Brief, Exh. 4, Declaration of
John Sims at paragraphs 13‐14.

30
production created risks that could jeopardize its performance under those contracts with its largest downstream customers.170
According to ATI, as these costs increased, it conducted an assessment of the Rowley plant and its cost structure over a period of four years before it made the decision in 2016 to idle the plant.171 ATI considered various options, including fully integrating its production facility at Rowley with a facility to produce TiCl4, but concluded that the costs and *** would preclude such an option from being viable, and it was ***.172 ATI determined that the cost structure of the Rowley plant was not sustainable and made the decision to idle the plant in August 2016, and chose instead to extend its current long‐term supply agreements for imports of titanium sponge from *** producers ***, in order to give it security of supply to meet the needs of its downstream customers for titanium mill products.173 According to ATI, the pricing in these extensions and expansions of existing long‐term supply agreements *** did not change or result in significant price benefits to ATI.174 Thus, we find that the record indicates that ATI’s business decision to idle its Rowley plant was not the result of low‐priced subject imports, but rather the cost disadvantages of its non‐integrated facility.
We have considered TIMET’s argument that ATI’s invocation of a force majeure clause to suspend its supply contract with U.S. Magnesium (a supplier of magnesium to the Rowley plant) establishes that ATI’s decision to idle the facility was based on low‐priced subject imports. According to TIMET, this force majeure clause permitted ATI to suspend the supply contract based on ATI’s ability to obtain titanium sponge for a five‐year period at a price more than 15 percent below ATI’s variable cost of producing titanium sponge in the Rowley facility, and ATI’s invocation of the provision proves that its decision was based on the availability of low‐priced subject imports.175 As previously discussed, the record shows that ATI had a cost disadvantage as a non‐integrated producer of titanium sponge, and that its increasing costs of obtaining raw materials for its Rowley facility and the attendant supply risks were threatening to jeopardize its performance as a titanium sponge producer and its ability to serve its customers. Given that legitimate business reasons unrelated to subject imports existed for ATI to cease its domestic production operations – namely increasing costs at its Rowley facility and its inability to convert to an integrated production operation that would allow more effective competition with integrated titanium sponge producers such as TIMET – we cannot agree with TIMET that ATI’s invocation of the force majeure clause renders these reasons pretextual or not credible.
170 Conference Tr. at 107‐08, 147‐48 (Sims); ATI’s Postconference Brief, Exh. 4, Declaration of
John Sims at paragraphs 8, 13‐15. 171 Conference Tr. at 148‐49, 185 (Sims); ATI’s Postconference Brief, Exh. 4, Declaration of John
Sims at paragraph 12, and Exh. 11. 172 Conference Tr. at 180 (Sims); ATI’s Postconference Brief, Exh. 4, Declaration of John Sims at
paragraphs 15‐16, and Exh. 11. 173 Conference Tr. at 108, 110, 147‐48 (Sims); ATI’s Postconference Brief, Exh. 4, Declaration of
John Sims at paragraphs 19, 24. 174 Conference Tr. at 108, 110, 148 (Sims); ATI’s Postconference Brief, Exh. 4, Declaration of John
Sims at paragraphs 19, 24. 175 Petition at 35 and Exh. GEN‐1; TIMET’s Postconference Brief at 29.
31
Indeed, the record indicates that ATI made the decision to idle the facility and invoke the force majeure clause after a lengthy process of consideration over several years.176
The domestic industry’s financial indicators declined between 2014 and 2016 and its financial performance was worse in interim 2017 than in interim 2016. Revenues declined by *** percent from 2014 to 2016, increasing from $*** in 2014 to $*** in 2015, and then falling to $*** in 2016; they were $*** in interim 2016 and $*** in interim 2017.177 Total COGS declined by *** percent from 2014 to 2016, increasing from $*** in 2014 to $*** in 2015 and then declining to $*** in 2016; COGS were $*** in interim 2016 and $*** in interim 2017.178 The industry’s gross profit declined by *** percent from 2014 to 2016, increasing from $*** in 2014 to $*** in 2015, and then declined to $*** in 2016; it was $*** in interim 2016 and *** of $*** in interim 2017.179 Operating income declined by *** percent from 2014 to 2016, increasing from $*** in 2014 to $*** in 2015, and then falling to $*** in 2016; it was $*** in interim 2016 and *** of $*** in interim 2017.180 The industry’s operating income margin increased from *** percent in 2014 to *** percent in 2015 and then fell to *** percent in 2016; it was *** percent in interim 2016 and *** percent in interim 2017.181 Net income increased from $*** in 2014 to $*** in 2015, followed by *** of $*** in 2016; it was $*** in interim 2016, followed by a *** of $*** in interim 2017.182 Capital expenditures increased by *** percent between 2014 and 2016, declining from $*** in 2014 to $*** in 2015, and then increasing to $*** in 2016; they were $*** in interim 2016 and $*** in interim 2017.183
We find that the decline in the domestic industry’s financial performance during the POI was not a result of subject imports from Japan. To the extent the declines in financial performance were due to declines in output, we have found that ATI’s cessation of production was not due to subject imports from Japan.184 Moreover, TIMET, which did not engage in meaningful commercial sales of titanium sponge during the POI, could not have lost any such sales to the subject imports. To the extent the declines in financial performance were due to price declines, we found above that subject imports from Japan did not have any significant price effects.
TIMET argues that it faces a “make or buy” decision at its Henderson, Nevada plant as a result of low‐priced subject imports similar to the decision it asserts that ATI faced at its Rowley
176 The record compiled in these preliminary phase investigations concerning ATI’s idling of the
Rowley plant is detailed. We find that we would be unlikely to obtain contrary information on this issue in any final phase investigations.
177 CR/PR at Tables VI‐1, C‐1. 178 CR/PR at Tables VI‐1, C‐1. 179 CR/PR at Tables VI‐1, C‐1. 180 CR/PR at Tables VI‐1, C‐1. 181 CR/PR at Tables VI‐1, C‐1. 182 CR/PR at Tables VI‐1, C‐1. 183 CR/PR at Table VI‐4. The domestic industry incurred research and development (“R&D”)
expenses of $*** in 2014, $*** in 2015, and $*** in 2016. R&D expenses were $*** in interim 2016 and $*** in interim 2017. CR/PR at Table VI‐4.
184 Almost all of the domestic industry’s *** in 2016 was due to ATI’s asset impairment writedown of its Rowley plant. CR at VI‐9; PR at VI‐5; CR/PR at Table VI‐3.

32
plant.185 TIMET cites an internal white paper it prepared in 2016 in which it analyzed options with respect to ***, and considered as one option ***.186 We note that, ***, among the most relevant considerations for whether to produce titanium sponge domestically or choose to buy it from imported sources for the purpose of producing downstream titanium mill products are the requirements for production of downstream titanium mill products and the requirements of customers for those downstream products.187 Thus, TIMET’s argument about its possible “make or buy” decision is based largely on the structure of its downstream production of titanium mill products and the requirements of its customers for those downstream products. But our analysis of the impact of subject imports is limited by law to their impact on the operations of the domestic industry producing the domestic like product, and the difficulties of domestic industries producing other products are beyond the purview of these investigations.188
In view of the foregoing, we find no reasonable indication that subject imports from Japan are having a significant impact on the domestic industry. Accordingly, we find that there is no reasonable indication that the domestic industry is materially injured by reason of imports of titanium sponge from Japan that are allegedly sold in the United States at less than fair value.
D. No Reasonable Indication of Threat of Material Injury by Reason of Subject
Imports from Japan
The production capacity of the titanium sponge industry in Japan increased *** during the POI, but is not projected to increase in 2017 or 2018.189 The reported capacity utilization rate was *** percent in 2014, but increased by *** percentage points to *** percent in 2016. Capacity utilization remained above *** percent in interim 2017, and is projected to be above *** percent in both 2017 and 2018.190 Given the increase in the industry’s production and capacity utilization rate over the POI, the level of unused capacity of the industry in Japan declined over the POI.191 The titanium sponge industry in Japan is fairly export oriented,
185 Petition at 43‐45; TIMET’s Postconference Brief at 29‐30; Conference Tr. at 13 (Horgan). 186 Petition at 45 and Exh. GEN‐21; TIMET’s Postconference Brief at 34. 187 See Petition Exh. GEN‐21 at 6‐7 (***); see Conference Tr. at 83 (Seiner). 188 See 19 U.S.C. § 1677(7)(B)(i)(III) (impact analysis focuses on “domestic producers of domestic
like products . . . .”). 189 Reported production capacity in Japan was *** metric tons in 2014, and *** metric tons in
2015 and 2016; it was *** metric tons in interim 2016 and interim 2017. It is projected to be *** metric tons in 2017 and 2018. CR/PR at Table VII‐3.
190 The capacity utilization rate in Japan was *** percent in 2014, *** percent in 2015, *** percent in 2016; it was *** percent in interim 2016, and *** percent in interim 2017. It is projected to be *** percent in 2017 and *** percent in 2018. CR/PR at Table VII‐3.
191 Reported production of titanium sponge in Japan increased from *** metric tons in 2014 to *** metric tons in 2015 and *** metric tons in 2016; it was *** metric tons in interim 2016 and *** metric tons in interim 2017. It is projected to be *** metric tons in 2017 and *** metric tons in 2018. CR/PR at Table VII‐3. Unused capacity declined from *** metric tons in 2014 to *** metric tons in 2015 (Continued…)

33
although its home market shipments were larger than its export shipments throughout the POI.192 The United States was by far the largest export market for the industry in Japan during the POI.193
Inventories of titanium sponge held by subject producers in Japan declined from 2014 to 2015, but then increased in 2016, and reached a period high at the end of interim 2017.194 U.S. importers’ inventories of subject merchandise from Japan increased from 2014 to 2016, but were lower in interim 2017 than in interim 2016.195
(…Continued) and *** metric tons in 2016; it was *** metric tons in interim 2016 and *** metric tons interim 2017. It is projected to be *** metric tons in 2017 and *** metric tons in 2018. Id.
192 Total export shipments accounted for *** percent of total shipments by the industry in Japan in 2014, *** percent in 2015 and *** percent in 2016; they were *** percent in interim 2016, and *** percent in interim 2017. They are projected to account for *** percent of shipments in 2017 and *** percent of shipments in 2018. CR/PR at Table VII‐3. Home market shipments accounted for *** percent of total shipments by the industry in Japan in 2014, *** percent in 2015, *** percent in 2016; they were *** percent in interim 2016 and *** percent in interim 2017. They are projected to account for *** percent of shipments in 2017 and *** percent in 2018. Id.
193 Exports to the United States accounted for *** percent of total shipments by the industry in Japan in 2014, *** percent in 2015, and *** percent in 2016. They were *** percent in interim 2016 and *** percent in interim 2017. They are projected to account for *** percent of shipments in 2017 and *** percent in 2018. CR/PR at Table VII‐3. Exports to all other markets accounted for *** percent of total shipments by the industry in Japan in 2014, *** percent in 2015, and *** percent in 2016. They were *** percent in interim 2016 and *** percent in interim 2017. They are projected to account for *** percent of shipments in 2017 and *** percent in 2018. Id.
194 End‐of‐period inventories of subject producers in Japan were *** metric tons in 2014, *** metric tons in 2015, and *** metric tons in 2016. They were *** metric tons in interim 2016 and *** metric tons in interim 2017. They are projected to be *** metric tons in 2017 and *** metric tons in 2018. CR/PR at Table VII‐3. The industry in Japan had inventories equivalent to *** percent of production in 2014, *** percent in 2015, *** percent in 2016, *** percent in interim 2016, and *** percent in interim 2017. Its projected inventories are equivalent to *** percent of production in 2017 and *** percent in 2018. Id.
195 U.S. importers’ inventories of subject merchandise from Japan were *** metric tons in 2014, *** metric tons in 2015, *** metric tons in 2016; they were *** metric tons in interim 2016 and *** metric tons in interim 2017. CR/PR at Table VII‐11. The ratio of U.S. importers’ inventories of subject merchandise from Japan to U.S. shipments of imports from Japan was *** percent in 2014, *** percent in 2015, and *** percent in 2016. It was *** percent in interim 2016 and *** percent in interim 2017. Id.
Information available on the record indicates that product shifting is not an issue. The two subject Japanese producers reported that they *** switch production from titanium sponge to other products. CR at II‐7; PR at II‐5.
The record indicates that there are no antidumping or countervailing duty orders or investigations concerning titanium sponge from Japan in any other markets. CR at VII‐17; PR at VII‐12.

34
As previously discussed, the volume of subject imports from Japan increased by *** percent between 2014 and 2016, and was higher in interim 2017 than in interim 2016.196 The market share of subject imports from Japan increased over the 2014 to 2016 period and was *** higher in interim 2017 than in interim 2016.197 The volume of subject imports from Japan is accordingly likely to increase in the imminent future, but we do not think this will have adverse effects on the domestic industry’s output or TIMET’s continuing production operations during this period, given the lack of head‐to‐head competition between subject imports from Japan and the domestic like product. TIMET has asserted that it is considering substituting subject imports for domestic production of titanium sponge,198 but the record contains no information that such substitution is likely to occur in the imminent future.
We found above that subject imports from Japan are not currently having significant price effects. In light of the lack of head‐to‐head competition between the domestic like product and the subject imports, there is not likely to be significant underselling in the imminent future, even should subject import volume from Japan increase, for the same reason it did not occur during the period of investigation. By the same token, the absence of any significant relationship between subject imports and the domestic industry’s AUVs observed during the period of investigation will likely persist. Accordingly, we find that imports of subject merchandise from Japan are unlikely to enter at prices that are likely to have a significant depressing or suppressing effect on domestic prices, or are likely to increase demand for such imports.
We also find that subject imports from Japan are not likely to have an actual or potential negative effect on the domestic industry’s existing development and production efforts. The domestic industry reported *** capital expenditures over the POI, the *** of which were reported by TIMET. Even after ATI ceased production in 2016, the domestic industry’s capital expenditures were *** higher in interim 2017 than in interim 2016.199 TIMET asserts that its decision as to a capital investment to *** at its Henderson, Nevada facility will be adversely affected by low‐priced subject imports.200 However, given the absence of head‐to‐head competition between subject imports from Japan and the domestic like product, and the fact that the record does not contain any information that TIMET intends to replace its domestic titanium sponge production with imports in the imminent future, we do not believe that subject imports from Japan will have a negative effect on the domestic industry’s ability to make this capital investment. Finally, there is no evidence of any other demonstrable adverse
196 The volume of subject imports from Japan increased from *** metric tons in 2014 to ***
metric tons in 2015, and *** metric tons in 2016; it was *** metric tons in interim 2016 and *** metric tons in interim 2017.CR/PR at Table IV‐2.
197 The market share of subject imports from Japan was *** percent in 2014, *** percent in 2015, and *** percent in 2016; it was *** percent in interim 2016 and *** percent in interim 2017. CR/PR at Table IV‐9.
198 See Conference Tr. at 45‐46 (Seiner), 104‐105 (Horgan). 199 Capital expenditures increased by *** percent between 2014 and 2016, declining from $***
in 2014 to $*** in 2015, and then increasing to $*** in 2016; they were $*** in interim 2016 and $*** in interim 2017. CR/PR at Table VI‐4.
200 TIMET’s Postconference Brief at 34‐35; CR/PR at Table VI‐7.

35
trends that indicate the probability that subject imports from Japan will likely materially injure the domestic industry.
In view of the foregoing, we find that there is no reasonable indication that an industry in the United States is threatened with material injury by reason of subject imports from Japan that are allegedly sold in the United States at less than fair value.
E. No Reasonable Indication of Material Injury By Reason of Subject Imports from
Kazakhstan
1. Volume of Subject Imports
The volume of subject imports from Kazakhstan declined by *** percent between 2014 and 2016, but was *** higher in interim 2017 than in interim 2016. The quantity of subject imports from Kazakhstan increased from *** metric tons in 2014 to *** metric tons in 2015, and then declined to *** metric tons in 2016. It was *** metric tons in interim 2016 and *** metric tons in interim 2017.201 The market share of subject imports from Kazakhstan was *** percent in 2014, *** percent in 2015, and *** percent in 2016; it was *** percent in interim 2016 and *** percent in interim 2017.202 The volume of subject imports from Kazakhstan fluctuated sharply from calendar year to calendar year, peaking in 2015. The *** volume of subject imports from Kazakhstan in 2016 serves to exaggerate the magnitude of the rise in import volumes between interim 2016 and interim 2017. Subject imports from Kazakhstan had a *** share of the U.S. market during the POI. Thus we find that the volume of subject imports from Kazakhstan and any increase in that volume were not significant in absolute terms.
We also find that neither the volume nor the increase in volume in subject imports from Kazakhstan is significant relative to production or consumption in the United States. Market shares and market share shifts are of limited significance in the U.S. titanium sponge market given the absence of head‐to‐head competition between subject imports and the domestic like product. In light of this, sales garnered by subject imports are not necessarily “lost” to the domestic industry. By the same token, because essentially all domestic production is internally transferred or captively consumed, the percentage of imports relative to domestic production is not a particularly instructive metric.
Consequently, in light of the lack of direct competition between the domestic like product and subject imports from Kazakhstan, we find that the volume of subject imports from Kazakhstan, both in absolute terms and relative to domestic consumption and production, is not significant, notwithstanding the *** level of subject import volume and market penetration in interim 2017. Moreover, as explained below, these volumes of subject imports of Kazakhstan did not have significant price effects or impact in light of the conditions of competition.
201 CR/PR at Table IV‐2. The quantity of U.S. shipments of subject imports from Kazakhstan
declined from *** metric tons in 2014 to *** metric tons in 2015 and then to *** metric tons in 2016. It was *** metric tons in interim 2016 and *** metric tons in interim 2017. CR/PR at Table IV‐8.
202 CR/PR at Table IV‐9 (derived from data for U.S. shipments of subject imports).
36
2. Price Effects of the Subject Imports
The Commission collected data in these investigations concerning pricing of two titanium sponge products shipped to unrelated customers, as well as import purchase cost data.203 These data do not provide a basis for making a finding of significant price underselling by subject imports from Kazakhstan, given the absence of meaningful commercial sales of the domestic like product.204 TIMET concedes that, because of the nature of the domestic industry’s operations, the Commission cannot make meaningful pricing comparisons between subject imports and the domestic like product for purposes of an underselling analysis.205 Additionally, no purchasers responding to the Commission’s lost sales/lost revenues survey confirmed that the domestic industry lost any sales or revenues as a result of low‐priced subject imports from Kazakhstan.206
In examining whether subject imports from Kazakhstan significantly depressed or suppressed the prices of the domestic like product, we have used the facts available in the record. In light of the lack of meaningful commercial sales by the domestic industry, the data available are the industry’s reported net sales AUVs.207 These AUVs primarily reflect internal consumption by domestic producers, but also reflect some transfers to related parties as well as a very small volume of commercial sales.208 The domestic industry’s net sales AUV declined somewhat between 2014 and 2016, and was *** lower in interim 2017 than in interim 2016.209
203 CR at V‐4, V‐10; PR at V‐2 to V‐3, V‐4. 204 Commercial sales of the domestic like product to unrelated parties represented less than ***
percent of U.S. production in 2016, and *** percent of total subject imports in 2016. CR at V‐5 n.6; PR at V‐3 n.6.
205 TIMET’s Postconference Brief at 24, 26; Conference Tr. at 99‐100 (Horgan). TIMET acknowledges that the prices of its few commercial sales do not provide a meaningful basis for making pricing comparisons, stating that it sometimes charged premium prices in light of the administrative costs of processing sales of small volumes of titanium sponge. TIMET’s Postconference Brief at 25; Conference Tr. at 60, 85‐86 (Seiner); CR at VI‐3 n.10; PR at VI‐2 n.10.
206 CR at V‐16 to V‐20; PR at V‐5 to V‐6; CR/PR at Tables V‐8 through V‐10. 207 The only pricing data available for subject imports from Kazakhstan are direct import
purchase data for product 2 (standard quality premium sponge). These data indicate that direct purchase costs for product 2 from Kazakhstan declined by *** percent from the first quarter of 2014 to the second quarter of 2017. CR/PR at Table V‐7.
208 By value, *** percent of U.S. producers’ net sales in 2016 were internal consumption, *** percent were transfers to related firms, and less than *** percent were commercial sales. CR/PR at Table VI‐1.
209 The domestic industry’s net sales AUV fell by *** percent between 2014 and 2016, declining from $*** per metric ton in 2014 to $*** per metric ton in 2015, and $*** per metric ton in 2016. It was $*** per metric ton in interim 2016 and $*** per metric ton in interim 2017. CR/PR at Tables VI‐1, C‐1. The domestic industry’s AUV for internal consumption declined between 2014 and 2016, and was *** lower in interim 2017 than in interim 2016, while its AUV for transfers to related firms declined between 2014 and 2016, but was *** higher in interim 2017 than interim 2016. CR/PR at Table VI‐1. The domestic industry’s AUV for its small volume of commercial sales increased *** between 2014 and 2016, and was *** higher in interim 2017 than in interim 2016. Id.

37
The domestic industry’s ratio of COGS to net sales increased irregularly between 2014 and 2016 and was *** higher in interim 2017 than in interim 2016.210 While we have examined the data reported for the domestic industry as a whole, we observe that TIMET experienced adverse developments in its net sales AUVs and its ratio of COGS to net sales between interim 2016 and interim 2017, just as the domestic industry as a whole did, while ATI experienced positive developments in in its net sales AUVs and its ratio of COGS to net sales between these two interim periods.211
Because they largely reflect values derived for internally transferred goods, we find that the domestic producers’ AUV data for their internal consumption do not reflect values based on competition from suppliers of subject imports from Kazakhstan. Instead, TIMET reported that it ***.212 ATI reported ***.213 While the reporting of these values by TIMET and ATI may be acceptable for accounting purposes, these values *** do not reflect prices for titanium sponge based on competition in the U.S. market involving the domestic like product, for the reasons stated in section VII.C.2 above. Thus, the available data do not provide a basis for a finding that subject imports from Kazakhstan affected the “prices” – here, the AUVs – that domestic producers reported for their domestically produced titanium sponge products.214
Consequently, based on the available data in the record, we do not find that subject imports from Kazakhstan significantly undersold the domestic like product, or had the effect of depressing prices of the domestic like product to a significant degree or preventing prices increases that would otherwise have occurred to a significant degree. Accordingly, we do not find that subject imports from Kazakhstan caused significant price effects.
210 The industry’s ratio of COGS to net sales fell from *** percent in 2014 to *** percent in 2015
and then increased to *** percent in 2016. It was *** percent in interim 2016 and *** percent in interim 2017. CR/PR at Table VI‐1.
211 ATI’s net sales AUV was higher in interim 2017 ($*** per metric ton) than it was in interim 2016 ($*** per metric ton). CR/PR at Table VI‐3. By contrast, TIMET’s net sales AUV was lower in interim 2017 ($*** per metric ton) than it was in interim 2016 ($*** per metric ton). Id. The ratio of ATI’s COGS to net sales was *** percentage points lower in interim 2017, at *** percent, than it was in interim 2016, at *** percent. Id. By contrast, the ratio of TIMET’s COGS to net sales was *** percentage points higher in interim 2017, at *** percent, than it was in interim 2016, at *** percent. Id.
212 CR at VI‐4 n.13; PR at VI‐2 n.13; Petition Exh. 26; EDIS Document No. 623714 (email responses from *** to Commission staff questions).
213 CR at VI‐4 n.12; PR at VI‐2 n.12; EDIS Document No. 623716 (email response from *** to Commission staff questions). TIMET argues that ATI’s AUVs for its internal consumption are not reliable and are not based on fair market value. TIMET’s Postconference Brief at 25‐26. TIMET also contends that its domestic transfer prices for its internal consumption do not provide a useful measure of the impact of subject imports. Petition at 40 and Exh. GEN‐26 at 2. Instead, TIMET has argued that the Commission can simply decline to make price effects findings due to the lack of meaningful data. See Conference Tr. at 100 (Horgan). TIMET’s position cannot be reconciled with the Federal Circuit precedent. See Angus Chemical Co. v. United States, 140 F.3d 1478, 1484 (Fed. Cir. 1998).
214 Moreover, given the nature of the domestic industry’s operations, we do not believe that we could obtain materially different – much less contrary – AUV or pricing information in any final phase investigations.

38
3. Impact of the Subject Imports215
We incorporate by reference the discussion in section VII.C.3 above concerning the condition of the domestic industry during the POI. As that discussion indicates, a number of the domestic industry’s output and employment indicators declined from 2014 to 2016 and were *** lower in interim 2017 than in interim 2016, including capacity, production, U.S. shipments, market share, employment, hours worked, and wages paid. As we indicated above, most of these declines between the interim periods appear to be attributable to ATI’s cessation of domestic production operations at its Rowley, Utah plant in 2016. Our finding above that ATI’s cessation of domestic production was a business decision due to the cost disadvantages of a non‐integrated facility, and was not a result of low‐priced subject imports, is equally applicable to subject imports from Kazakhstan as it was to subject imports from Japan.
We also described above declines in the domestic industry’s financial performance that occurred during the POI. We find that these were not a result of subject imports from Kazakhstan. To the extent the declines in financial performance were due to declines in output, we have found that ATI’s cessation of production was not due to subject imports from Kazakhstan. Moreover, TIMET, which did not engage in meaningful commercial sales of titanium sponge during the POI, could not have lost any such sales to the subject imports. To the extent the declines in financial performance were due to price declines, we found above that subject imports from Kazakhstan did not have any significant price effects.216
In view of the foregoing, we do not find that subject imports from Kazakhstan are having a significant impact on the domestic industry. Accordingly, we find that there is no reasonable indication that the domestic industry is materially injured by reason of imports of titanium sponge from Kazakhstan that are allegedly sold in the United States at less than fair value and subsidized by the government of Kazakhstan.
F. No Reasonable Indication of Threat of Material Injury by Reason of Subject
Imports from Kazakhstan
The production capacity of the titanium sponge industry in Kazakhstan was constant during the POI, and is not projected to increase in 2017 or 2018.217 The industry’s production and capacity utilization rate increased irregularly between 2014 and 2016, while the level of
215 In its notice initiating the antidumping duty investigation, Commerce reported an estimated
dumping margin of 42.22 percent for imports of titanium sponge from Kazakhstan. Titanium Sponge From Japan and Kazakhstan: Initiation of Less‐Than‐Fair Value Investigations, 82 Fed. Reg. 43939, 43942 (Sept. 20, 2017). For our analysis, we have considered that that all imports of subject merchandise from Kazakhstan are alleged to be sold at less than fair value.
216 We also incorporate our discussion above concerning the lack of pertinence to our statutory inquiry of TIMET’s “make or buy” argument.
217 Reported production capacity in Kazakhstan was *** metric tons in 2014, 2015, and 2016; it was *** metric tons in interim 2016 and interim 2017. It is projected to be *** metric tons in 2017 and 2018. CR/PR at Table VII‐8.

39
unused capacity in Kazakhstan declined.218 The titanium sponge industry in Kazakhstan is fairly export oriented, although its export orientation declined *** in 2016, and its home market shipments were larger than its export shipments throughout the POI.219 The United States was one of the largest export markets for the industry in Kazakhstan during the POI.220 The titanium sponge industry in Kazakhstan reported *** end‐of‐period inventories throughout the POI.221 U.S. importers’ inventories of subject merchandise from Kazakhstan increased irregularly from 2014 to 2016, and were *** in interim 2016 and interim 2017.222
218 Reported production of titanium sponge in Kazakhstan increased from *** metric tons in
2014 to *** metric tons in 2015, and then declined to *** metric tons in 2016; it was *** metric tons in interim 2016 and *** metric tons in interim 2017. It is projected to be *** metric tons in 2017 and 2018. CR/PR at Table VII‐8. The capacity utilization rate in Kazakhstan was *** percent in 2014, *** percent in 2015, *** percent in 2016, *** percent in interim 2016, and *** percent in interim 2017. It is projected to be *** percent in 2017 and 2018. Id. Unused capacity declined from *** metric tons in 2014 to *** metric tons in 2015, and then increased to *** metric tons in 2016; it was *** metric tons in interim 2016 and *** metric tons interim 2017. It is projected to be *** metric tons in 2017 and 2018. Id.
219 Total export shipments accounted for *** percent of total shipments by the industry in Kazakhstan in 2014, *** percent in 2015 and *** percent in 2016; they were *** percent in interim 2016, and *** percent in interim 2017. They are projected to account for *** percent of shipments in 2017 and 2018. CR/PR at Table VII‐8. Home market shipments accounted for *** percent of total shipments by the industry in Kazakhstan in 2014, *** percent in 2015, *** percent in 2016; they were *** percent in interim 2016 and *** percent in interim 2017. They are projected to account for *** percent of shipments in 2017 and 2018. Id.
220 Exports to the United States accounted for *** percent of total shipments by the industry in Kazakhstan in 2014, *** percent in 2015, and *** percent in 2016. They were *** percent in interim 2016 and *** percent in interim 2017. CR/PR at Table VII‐8. They are projected to account for *** percent of shipments in 2017 and 2018. Exports to all other markets accounted for *** percent of total shipments by the industry in Kazakhstan in 2014, *** percent in 2015, and *** percent in 2016. They were *** percent in interim 2016 and *** percent in interim 2017. They are projected to account for *** percent of shipments in 2017 and 2018. Id.
221 CR/PR at Table VII‐8. 222 U.S. importers’ inventories of subject merchandise from Kazakhstan were *** metric tons in
2014, *** metric tons in 2015, *** metric tons in 2016; they were *** metric tons in interim 2016 and *** metric tons in interim 2017. CR/PR at Table VII‐11. The ratio of U.S. importers’ inventories of subject merchandise from Kazakhstan to U.S. shipments of subject imports from Kazakhstan was *** percent in 2014, *** percent in 2015, and *** percent in 2016. It was *** percent in interim 2016 and *** percent in interim 2017. Id.
Information available on the record indicates that product shifting is not an issue. The one responding subject Kazakh producer reported that it *** switch production from titanium sponge to other products. CR at II‐8; PR at II‐6.
The record indicates that there are no antidumping or countervailing duty orders or investigations concerning titanium sponge from Kazakhstan in any other markets. CR at VII‐17; PR at VII‐12.
We have also considered the nature of the alleged subsidies in the countervailing duty investigation on subject imports from Kazakhstan in our threat analysis. 19 U.S.C. § 1677(7)(F)(i)(I). (Continued…)

40
As previously discussed, the volume of subject imports from Kazakhstan fluctuated during the POI, declining by *** percent between 2014 and 2016, but was *** higher in interim 2017 than in interim 2016.223 The market share of subject imports from Kazakhstan similarly fluctuated over the POI, declining between 2014 and 2016, but was higher in interim 2017 than in interim 2016.224 The sharp fluctuations in subject import volume during the POI make likely subject import volumes from Kazakhstan difficult to project. Even assuming arguendo that the greater volume and market penetration of subject imports during interim 2017 make additional increases in subject import volume from Kazakhstan likely in the imminent future, such increased imports are unlikely to have adverse effects on the domestic industry’s output or TIMET’s continuing production operations, given the lack of head‐to‐head competition between subject imports from Kazakhstan and the domestic like product. TIMET has asserted that it is considering substituting subject imports for domestic production of titanium sponge,225 but the record contains no information that such substitution is likely to occur in the imminent future, or that it would be prompted to use imports from Kazakhstan as the substitute.
We found above that subject imports from Kazakhstan are not currently having significant price effects. In light of the lack of head‐to‐head competition between the domestic like product and the subject imports, there is not likely to be significant underselling in the imminent future, even should subject import volume from Kazakhstan increase, for the same reason it did not occur during the period of investigation. By the same token, the absence of any significant relationship between subject imports and the domestic industry’s AUVs observed during the period of investigation will likely persist. Accordingly, we find that imports of subject merchandise from Kazakhstan are unlikely to enter at prices that are likely to have a significant depressing or suppressing effect on domestic prices, or are likely to increase demand for such imports.
We also find that subject imports from Kazakhstan are not likely to have an actual or potential negative effect on the domestic industry’s existing development and production efforts. The domestic industry reported *** capital expenditures over the POI, the *** of which were reported by TIMET. Even after ATI ceased production in 2016, the domestic
(…Continued) Commerce initiated its countervailing duty investigation based on the following alleged subsidy programs in Kazakhstan: (1) Preferential Government Loan—State Program of Industrial Innovative Development; (2) Preferential Duty Waiver on Titanium Oxides; and (3) Discounted Electricity Tariffs. September 13, 2017 Department of Commerce Enforcement and Compliance Office of AD/CVD Operations Countervailing Duty Investigation Initiation Checklist at 7‐9 (EDIS Document No. 624004).
223 The volume of subject imports from Kazakhstan increased from *** metric tons in 2014 to *** metric tons in 2015, and then declined to *** metric tons in 2016. It was *** metric tons in interim 2016 and *** metric tons in interim 2017. CR/PR at Table IV‐2.
224 The market share of subject imports from Kazakhstan was *** percent in 2014, *** percent in 2015, and *** percent in 2016; it was *** percent in interim 2016 and *** percent in interim 2017. CR/PR at Table IV‐9.
225 See Conference Tr. at 45‐46 (Seiner), 104‐105 (Horgan).

industry’asserts thbe adverhead comthe fact tdomesticthat subjability toadverse tmateriall
Inin the UnKazakhstKazakhst
CVIII.
Foan industreason oin the Unallegedly
22
in 2014 toin interim
22
22
we wouldof importcumulatewell as anconcerninthe recordby the subor price–sindustry ptoken, ouand the dimports.
s capital exphat its decisirsely affectedmpetition bethat the recoc titanium spect imports make this ctrends that ily injure the n view of thenited States tan that are tan.
Conclusion
or the reasotry in the Unf subject imnited States y subsidized
26 Capital expeo $*** in 201m 2017. CR/PR27 TIMET’s Pos28 Although wd have reaches for each subd basis wouldny likely increng the lack of d provides nobject importssuppressing epricing and arr findings conomestic indu
penditures wion as to a cad by low‐prietween subjeord does notponge produfrom Kazakhcapital investindicate the domestic ine foregoing, is threateneallegedly so
ons stated abnited States ports of titaat less than by the Gove
enditures inc5, and then inR at Table VI‐stconference
we determineded the same rebject countryd have magnifases in the imeffects causeo data to supps or that the seffects pertainre equally appncerning the lstry’s conditi
were *** higapital investced subject ect imports ft contain anyuction with ihstan will hatment. Finaprobability
ndustry. we find thated with mateld at less tha
bove, we detis materiallynium spongefair value, aernment of K
reased by **ncreasing to $4. Brief at 34‐3d that the staesult under ay increased atfied both submminent futued by current port a findingubject imporn to the naturplicable to a clack of any cuon would be
41
gher in interitment to ***imports.227 from Kazakhy informatiomports in thave a negativlly, there is nthat subject
t there is noerial injury ban fair value
termine thaty injured or te from Japannd subject imKazakhstan.2
* percent bet$*** in 2016;
5; CR/PR at Ttutory requira cumulated a the end of thbject import vre. However,or likely subj
g that there wrts have or arere of the datacumulated anurrent or likelequally appli
im 2017 tha* at its HendHowever, ghstan and thon that TIMEhe imminentve effect on no evidencet imports fro
reasonableby reason of e and subsidi
t there is nothreatened wn and Kazakmports from228
tween 2014 a; they were $
Table VI‐7. rements for canalysis. We he POI. Measvolume and th, it would notject import vowas or will likee likely to hava in the recornalysis of subjy causal link icable to a cu
n in interim derson, Nevaiven the abshe domestic ET intends tot future, we the domeste of any otheom Kazakhst
indication tsubject impized by the g
o reasonablewith materiahstan that am Kazakhstan
and 2016, dec$*** in interim
cumulation wacknowledgesuring such vohe increase int have changeolumes. Our ely be significve significantd concerningect imports. between the mulated ana
2016.226 TIMada facility wsence of healike producto replace its do not belietic industry’ser demonstran will likely
that an indusorts from government
e indication tal injury by are allegedlyn that are
clining from $m 2016 and $
ere not satisfed that the voolume on a n that volumeed our concluconclusions tant undersell price‐depresg domestic By the same subject impolysis of subjec
MET will ad‐to‐t, and
eve s able y
stry
of
that
y sold
$*** $***
fied, olume
e, as usions that ling ssing
orts ct


I‐1
PART I: INTRODUCTION
BACKGROUND
These investigations result from petitions filed with the U.S. Department of Commerce (“Commerce”) and the U.S. International Trade Commission (“USITC” or “Commission”) by Titanium Metals Corporation (“TIMET”), Exton, Pennsylvania on August 24, 2017, alleging that an industry in the United States is materially injured and threatened with material injury by reason of less‐than‐fair‐value (“LTFV”) imports of titanium sponge1 from Japan and Kazakhstan and subsidized imports from Kazakhstan. The following tabulation provides information relating to the background of these investigations.2 3
Effective date Action
August 24, 2017 Petition filed with Commerce and the Commission; institution of Commission investigation (82 FR 41656, September 1, 2017)
September 13, 2017 Commerce’s notice of initiation of antidumping investigations (82 FR 43939, September 20, 2017)
September 13, 2017 Commerce’s notice of initiation of countervailing duty investigation (82 FR 43936, September 20, 2017)
September 14, 2017 Commission’s conference October 6, 2017 Commission’s vote October 10, 2017 Commission’s determination October 17, 2017 Commission’s views
1 See the section entitled “The Subject Merchandise” in Part I of this report for a complete description of the merchandise subject in this proceeding.
2 Pertinent Federal Register notices are referenced in appendix A, and may be found at the Commission’s website (www.usitc.gov).
3 A list of witnesses appearing at the conference is presented in appendix B of this report.

I‐2
STATUTORY CRITERIA AND ORGANIZATION OF THE REPORT
Statutory criteria
Section 771(7)(B) of the Tariff Act of 1930 (the “Act”) (19 U.S.C. § 1677(7)(B)) provides that in making its determinations of injury to an industry in the United States, the Commission—
shall consider (I) the volume of imports of the subject merchandise, (II) the effect of imports of that merchandise on prices in the United States for domestic like products, and (III) the impact of imports of such merchandise on domestic producers of domestic like products, but only in the context of production operations within the United States; and. . . may consider such other economic factors as are relevant to the determination regarding whether there is material injury by reason of imports.
Section 771(7)(C) of the Act (19 U.S.C. § 1677(7)(C)) further provides that‐‐4
In evaluating the volume of imports of merchandise, the Commission shall consider whether the volume of imports of the merchandise, or any increase in that volume, either in absolute terms or relative to production or consumption in the United States is significant.. . .In evaluating the effect of imports of such merchandise on prices, the Commission shall consider whether. . .(I) there has been significant price underselling by the imported merchandise as compared with the price of domestic like products of the United States, and (II) the effect of imports of such merchandise otherwise depresses prices to a significant degree or prevents price increases, which otherwise would have occurred, to a significant degree.. . . In examining the impact required to be considered under subparagraph (B)(i)(III), the Commission shall evaluate (within the context of the business cycle and conditions of competition that are distinctive to the affected industry) all relevant economic factors which have a bearing on the state of the industry in the United States, including, but not limited to. . . (I) actual and potential decline in output, sales, market share, gross profits, operating profits, net profits, ability to service debt, productivity, return on investments, return on assets, and utilization of capacity, (II) factors affecting domestic prices, (III) actual and potential negative effects on cash flow, inventories, employment, wages, growth, ability to raise capital, and investment, (IV) actual and potential negative
4 Amended by PL 114‐27 (as signed, June 29, 2015), Trade Preferences Extension Act of 2015.

I‐3
effects on the existing development and production efforts of the domestic industry, including efforts to develop a derivative or more advanced version of the domestic like product, and (V) in {an antidumping investigation}, the magnitude of the margin of dumping.
In addition, Section 771(7)(J) of the Act (19 U.S.C. § 1677(7)(J)) provides that—5 (J) EFFECT OF PROFITABILITY.—The Commission may not determine that there is no material injury or threat of material injury to an industry in the United States merely because that industry is profitable or because the performance of that industry has recently improved.
Organization of report
Part I of this report presents information on the subject merchandise, alleged subsidy/dumping margins, and domestic like product. Part II of this report presents information on conditions of competition and other relevant economic factors. Part III presents information on the condition of the U.S. industry, including data on capacity, production, shipments, inventories, and employment. Parts IV and V present the volume of subject imports and pricing of domestic and imported products, respectively. Part VI presents information on the financial experience of U.S. producers. Part VII presents the statutory requirements and information obtained for use in the Commission’s consideration of the question of threat of material injury as well as information regarding nonsubject countries.
MARKET SUMMARY
Titanium sponge is the basic form of titanium metal that results from the chemical reduction of titanium‐bearing ores and slag,6 and is typically processed further for eventual use in rotating engine parts for the aerospace industry (for premium grade sponge) or for non‐aerospace industrial applications (for standard grade sponge). TIMET is currently the only U.S. producer of titanium sponge, while leading producers of titanium sponge outside the United States include Osaka Titanium Technologies Co., Ltd. ("OTC") and Toho Titanium Company, Ltd. ("Toho") of Japan, and Ust‐Kamenogorsk Titanium and Magnesium Plant JSC ("UKTMP") of Kazakhstan. The leading U.S. importers of titanium sponge from Japan in 2016 were ***, ***7, and ***, while the sole importer of titanium sponge from Kazakhstan in 2016 was ***. Leading importers of titanium sponge from nonsubject countries (primarily Russia) include ***. *** was the only firm to report purchases of titanium sponge.
5 Amended by PL 114‐27 (as signed, June 29, 2015), Trade Preferences Extension Act of 2015. 6 Petition, p. 10. 7 ***.

I‐4
Apparent U.S. consumption of titanium sponge totaled approximately *** metric tons (“MT”) ($***) in 2016. U.S. producers’ U.S. shipments of titanium sponge totaled *** MT ($***) in 2016, and accounted for *** percent of apparent U.S. consumption by quantity and *** percent by value. U.S. shipments of imports from subject sources totaled 15,436 MT ($173.1 million) in 2016 and accounted for *** percent of apparent U.S. consumption by quantity and *** percent by value. U.S. shipments of imports from nonsubject sources totaled *** MT ($***) in 2016 and accounted for *** percent of apparent U.S. consumption by quantity and *** percent by value.8
SUMMARY DATA AND DATA SOURCES
A summary of data collected in these investigations is presented in appendix C, table C‐1. Except as noted, U.S. industry data are based on questionnaire responses of two firms that accounted for all U.S. production of titanium sponge during 2016.9 U.S. import data are based on the questionnaire responses of eight firms that accounted for virtually all imports of titanium sponge from Japan and Kazakhstan in 2016, based on proprietary Customs records.
PREVIOUS AND RELATED INVESTIGATIONS
In 1968, the Department of the Treasury issued an antidumping duty finding on titanium sponge from the U.S.S.R. after the Commission determined that the U.S. industry was being injured by reason of less than fair value imports of titanium sponge from the U.S.S.R. In 1984, Commerce published an antidumping duty order on titanium sponge from Japan following the Commission’s determination that an industry in the United States was threatened with material injury by reason of less than fair value imports of titanium sponge from Japan.
In 1998, the Commission instituted changed circumstances reviews and subsequently determined that revocation of the antidumping duty orders covering imports of titanium sponge from Japan, Kazakhstan, Russia and Ukraine10 was not likely to lead to continuation or recurrence of material injury to the U.S. industry. As a result of the determination by the Commission, Commerce revoked the antidumping duty orders on titanium sponge from the
8 U.S. producers and U.S. importers reported almost no U.S. commercial shipments, therefore, in this report discussion of U.S. shipments refers primarily to total U.S. shipments (inclusive of U.S. commercial shipments, internal consumption, and transfers to related firms).
9 TIMET is the only U.S. producer currently producing titanium sponge. ATI ceased production of titanium sponge in 2016.
10 In 1992, Commerce changed the original antidumping order against the U.S.S.R. to 15 separate antidumping duty orders covering the independent states formed from the dissolution of the Soviet Union. Commerce subsequently revoked all of those orders prior to 1998 except the orders on imports from Kazakhstan, Russia, and Ukraine.

I‐5
former Soviet states, Kazakhstan, Russia and Ukraine, and the antidumping duty order on titanium sponge from Japan, effective August 13, 1998.11
NATURE AND EXTENT OF ALLEGED SUBSIDIES AND SALES AT LTFV
Alleged subsidies
On September 20, 2017, Commerce published a notice in the Federal Register of the initiation of its countervailing duty investigation on titanium sponge from Kazakhstan.12 Commerce identified the following government programs in Kazakhstan for which it intends to conduct investigations:
Preferential Government Loan—State Program of Industrial Innovative Development (SPIID)
Preferential Duty Waiver On Titanium Oxides
Discounted Electricity Tariffs
Alleged sales at LTFV
On September 20, 2017, Commerce published a notice in the Federal Register of the initiation of its antidumping duty investigations on titanium sponge from Japan and Kazakhstan.13 Commerce has initiated antidumping duty investigations based on estimated dumping margins of 69.69 percent to 95.20 percent for titanium sponge from Japan and 42.22 percent for titanium sponge from Kazakhstan.
11 See Petition, p. 8, and Titanium Sponge From Japan, Kazakhstan, Russia, and Ukraine, Inv. Nos. 751‐TA‐17‐20, USITC Pub. 3119, p. 3.
12 Titanium Sponge From Kazakhstan: Initiation of Countervailing Duty Investigation, 82 FR 43936, September 20, 2017.
13 Titanium Sponge From Japan and Kazakhstan: Initiation of Less‐Than‐Fair‐Value Investigations, 82 FR 43939, September 20, 2017.

I‐6
THE SUBJECT MERCHANDISE
Commerce’s scope14
Commerce has defined the scope of these investigations as follows:
The product covered by these investigations is all forms and grades of titanium sponge, except as specified below. Titanium sponge is unwrought titanium metal that has not been melted. Expressly excluded from the scope of this investigation are: (1) Loose particles of unwrought titanium metal having a particle size of less than 20 mesh (0.84 mm); (2) alloyed or unalloyed briquettes of unwrought titanium metal that contain more than 0.2% oxygen on a dry weight basis; and (3) ultra‐high purity titanium sponge. In ultra‐high purity titanium sponge, metallic impurities do not exceed any of these amounts:
WT %
Aluminum 0.0005
Chromium 0.0001
Cobalt 0.0001
Copper 0.0002
Iron 0.0300
Manganese 0.0010
Nickel 0.0002
Vanadium 0.0002
Zirconium 0.0005
Carbon 0.0150
Hydrogen 0.0100
Nitrogen 0.0020
Oxygen 0.1000
14 Titanium Sponge From Kazakhstan: Initiation of Countervailing Duty Investigation, 82 FR 43936, September 20, 2017; Titanium Sponge From Japan and Kazakhstan: Initiation of Less‐Than‐Fair‐Value Investigations, 82 FR 43939, September 20, 2017.

I‐7
Tariff treatment
Based upon the scope set forth by the Department of Commerce, information available to the Commission indicates that the merchandise subject to these investigations are imported under statistical reporting number 8108.20.0010 of the Harmonized Tariff Schedule of the United States (“HTS”). The 2017 general rate of duty is 15 percent ad valorem for HTS subheading 8108.20.00.15 Decisions on the tariff classification and treatment of imported goods are within the authority of U.S. Customs and Border Protection.
THE PRODUCT
Description and applications
Titanium sponge is a porous, brittle, unwrought16 form of titanium, a metal that is highly valued for its physical characteristics, including a high strength‐to weight ratio (the highest of any metallic element), resistance to corrosion, and the ability to bond with high‐strength polymers. These physical properties make titanium ideal for certain aerospace, military, and industrial applications.17 Typically, titanium sponge (sometimes mixed with scrap titanium metal) is melted down to make titanium ingots, before being further processed through various manufacturing processes, depending on the intended end use of the final product. Titanium sponge is produced to meet ASTM International Standard B299‐13,18 and depending upon the grade of sponge, may also meet other industry standard specifications.
The two major grades of titanium sponge subject to these investigations are premium‐quality and standard‐quality sponge.19 Premium quality, which is commonly referred to as “rotor grade,” is used in rotating engine parts for the aerospace industry. Manufacturers of
15 Although Kazakhstan is eligible for the Generalized System of Preferences (GSP) Program, imports of titanium sponge from Kazakhstan entering under HTS 8108.20.0010 are not eligible for duty‐free treatment, as the benefit under HTS 8108.20.00 is reserved for designated least‐developed beneficiary countries. USITC, HTSUS (2017) — Revision 1, July 1, 2017, p. 81‐5 and General Note p. 13.
16 Unwrought titanium comes in the form of ingots, briquettes, sponge, powder, and other semi‐manufactured forms of titanium metal that are used in the production of titanium mill products, and is classified under HS subheading 8108.20.
17 Metal Supermarkets, “The Strongest Metals,” October 22, 2015, https://www.metalsupermarkets.com/the‐strongest‐metals/, (accessed September 18, 2017).
18 ASTM B299‐13 covers virgin titanium metal melting stock, and is commonly designated as titanium sponge due to its sponge‐like and porous texture. For more information, see: ASTM International, “ASTM B299‐13 Standard Specification for Titanium Sponge,” https://www.astm.org/Standards/B299.htm.
19 Ultra‐high purity titanium sponge is excluded from the scope of this investigation. Unlike premium and standard‐quality titanium sponge, ultra‐high purity sponge is produced using a sodium reduction process. Ultra‐high purity has a different chemical composition from the subject product (see Commerce’s scope), and different end uses (it is typically used in semiconductors).

I‐8
rotating engine parts and aircraft engines such as Pratt & Whitney, General Electric (GE), Rolls Royce, and Safran; as well as the Original Equipment Manufacturers (OEMs) that assemble aircraft, (e.g. Airbus and Boeing), require that premium‐quality titanium sponge producers complete a certification process to demonstrate they have sufficiently strict quality control systems in place to ensure that their product is free of dangerous technical flaws. According to the petitioner, it can take as long as seven years for a titanium sponge producer to receive this certification to produce premium‐quality titanium sponge used in rotating engine parts.20 In addition to having this certification, premium may also differ from standard‐quality titanium sponge by having lower quantities of trace elements that make up its chemical composition.21
Standard grade can be used in airframes and non‐rotating parts of aircraft engines, and in non‐aerospace industrial applications such as equipment for desalination,22 nuclear power plants,23 chemical processing equipment,24 medical implants, and others products.25 Although premium and standard‐quality titanium sponge are designated for different end uses, the petitioner indicated that both grades share similar production costs, product sold as standard‐grade titanium sponge often meets the chemical requirements established for premium‐grade, and premium‐grade can serve as a substitute for standard grade.26 One respondent also noted that downstream manufacturers may choose to use premium‐quality titanium sponge in standard grade applications, but this would depend on the availability of the material to the manufacturer.27
Depending on the intended end use of a downstream titanium mill product, titanium sponge can be alloyed with other metals such as aluminum, molybdenum, tin, vanadium, and zirconium. 28 It can also be blended with titanium scrap metal before being melted in a vacuum arc furnace. Due to the presence of higher levels of oxygen in titanium scrap metal, a melter cannot fully rely on scrap as a substitute for titanium sponge, and must therefore blend it with sponge to lower the oxygen content. The ratio of scrap to sponge used during the melting
20 Conference transcript, p. 89‐90 (Seiner). According to the petitioner, each major purchaser may have its own certification process that can vary in terms of quantity of sponge produced, testing of the product, and inspection procedures.
21 Conference transcript, p. 154‐155 (Halford). 22 International Titanium Association, “Titanium Industrial Business Opportunities in Global
Desalination,” http://www.titanium.org/default.asp?page=TTIndustryQ120132, (accessed September 15, 2017).
23 The Fabricator, “Titanium Trends,” March 9, 2009, http://www.thefabricator.com/article/tubepipefabrication/titanium‐trends, (accessed September 15, 2017).
24 Conference transcript, p. 172‐173 (Forsythe). 25 Titanium Industries, “Latest News,” http://titanium.com/the‐most‐fascinating‐titanium‐uses/,
(accessed September 15, 2017). 26 Petition, p. 21. 27 Conference transcript, p. 178 (Forsythe). 28 The following manufacturing steps apply to nonsubject products for which titanium sponge serves
as an input.

I‐9
process depends on a variety of factors, including end‐user specifications, the availability of scrap, and the price of scrap relative to titanium sponge.29 Prior to the melting process, titanium sponge and scrap metal are compacted using a press, and are then joined together by an arc melting in a vacuum or in an inert gas (usually argon) into an electrode. This electrode is then melted down, and the molten titanium metal is cooled in a crucible and solidifies to produce a first‐melt ingot. Ingots are typically melted one or two more times to rid the metal of any contaminants and obtain the level of quality specified by the end user.30 Figure I‐1 Titanium sponge: Various forms
Images of titanium sponge in its various forms, clockwise (from top left): Compacted in a cylindrical shape (120 grams), crushed, large mass after production. Sources: Chemical Elements: A Virtual Museum, “22 Ti Titanium,” http://images‐of‐elements.com/titanium.php, (accessed September 15, 2017); Toho Titanium Co., “Titanium Metals – Titanium Sponge,” https://www.toho‐titanium.co.jp/en/products/sponge.html, (accessed September 15, 2017); Japan Metal Bulletin, “Osaka Titanium Technologies Seeks Stable Sponge Material Procurement,” September 2, 2011, http://www.japanmetalbulletin.com/?p=17804, (accessed September 15, 2017).
29 Conference transcript, p. 92 (Seiner). 30 OTC, “Titanium ingot,” http://www.osaka‐ti.co.jp/e/e_product/titan/ingot.html, (accessed
September 18, 2017).

I‐10
Manufacturing processes
Raw materials
The production of titanium sponge starts with titanium concentrates such as rutile and ilmenite. Most ilmenite and rutile used in the production of titanium sponge in the United States is imported from other countries. Two companies, Chemours31 and Southern Ionics Minerals32 operate mines near Starke, Florida and Nahunta, Georgia; however, production at these mines has declined in recent years. Major global producers of ilmenite include South Africa, China, and Australia, while Australia and Sierra Leone are major producers of rutile.33
Rutile can be used as feedstock in its natural form, however ilmenite requires further processing in order to remove iron and obtain a level of a compound known as titanium dioxide (TiO2) of at least 85 percent.
34 Titanium sponge can also be produced using synthetic rutile, which is a chemically modified form of ilmenite,35 and titanium slag, which is an upgraded byproduct derived from ilmenite.36
The Kroll process
Globally, most titanium sponge producers use the Kroll process to produce premium and standard quality titanium sponge (figure I‐2). The first step of the Kroll process is known as chlorination. During this step, raw materials such as ilmenite, rutile, synthetic rutile, and titanium slag, all containing titanium dioxide, are combined with chlorine gas (Cl2) and coke to produce a chemical compound known as titanium tetrachloride (TiCl4).
37 The titanium tetrachloride is then reduced in a steel reactor with magnesium, by heating the mixture to approximately 2,012 degrees Fahrenheit through a vacuum distillation process. This process produces a large mass of titanium sponge (composed of multiple grades of sponge) and
31 Chemours, “About Our Plant,” https://www.chemours.com/Florida_Mine/en_US/about.html, (accessed September 12, 2017).
32 Southern Ionic Minerals, “Our Facilities,” http://www.southernionicsminerals.com/facilities/, (accessed September 12, 2017).
33 Bedinger, George. U.S. Geological Survey, Mineral Commodity Summaries, “Titanium Mineral Concentrations,” January 2017, https://minerals.usgs.gov/minerals/pubs/commodity/titanium/mcs‐2017‐titan.pdf, (accessed September 12, 2017).
34 How Products are Made, “Titanium: The Manufacturing Process,” http://www.madehow.com/Volume‐7/Titanium.html, (accessed September 18, 2017).
35 Iluka, “Synthetic Rutile,” https://www.iluka.com/docs/3.3‐operations/synthetic‐rutile.pdf, (accessed September 12, 2017).
36 Tronox, “Titanium slag,” http://www.tronox.com/products/titanium‐slag/, (accessed September 13, 2017).
37 Titanium tetrachloride (TiCl4) is commonly referred to as “tickle” in the titanium sponge industry.

I‐11
magnesium chloride as a byproduct. Some titanium sponge producers have the capability to recover the magnesium and chlorine and reuse these materials.38 Figure I‐2 Titanium sponge: The Kroll process
Source: Titanium Exposed, “Titanium industries – one metal, a thousand possibilities,” http://www.titaniumexposed.com/titanium‐industries.html, (accessed September 7, 2017).
Chlorine and magnesium recovery
During the recovery process, producers reduce magnesium chloride into magnesium and chlorine through an electrolytic decomposition process. However, even with this byproduct recovery capability, a small amount of raw chlorine and magnesium is needed to supplement the recovered byproduct.39 During the POI, ATI’s titanium sponge facility in Rowley, Utah was one of the only major production facilities in the world that did not have integrated chlorine and magnesium recovery capabilities.40
38 How Products are Made, “Titanium: The Manufacturing Process.” 39 Conference transcript, p. 90‐91 (Seiner); p. 157 (Thomas); p. 157 (Sando). 40 Conference transcript, p. 157 (Sims).

I‐12
Crushing, screening, and sorting
Prior to storage and transport, the titanium sponge is crushed into smaller particles that are sorted, screened, and tested. It is during this process that premium and standard‐quality sponge are graded. Steel drums are used to store titanium sponge and transport it to customers. Producers infuse these steel drums with argon gas to prevent the titanium sponge from reacting with oxygen to preserve the quality of the sponge and to prevent a potentially explosive reaction.41 42
DOMESTIC LIKE PRODUCT ISSUES
No issues with respect to domestic like product have been raised in these investigations. Petitioner proposes a single domestic like product, co‐extensive with the scope of the investigations.43 Respondents do not contest Petitioner’s proposed like product definition for the purposes of the preliminary phase of these investigations.44
41 Petition, Vol. 1, p. 11. 42 This is the last step in the production process for subject titanium sponge. Titanium sponge is used
as an input in the production of downstream titanium mill products, in addition to other materials such as titanium scrap metal and alloying metals.
43 Petitioner’s postconference brief, p. 5. 44 Conference transcript, p. 163‐164.

II-1
PART II: CONDITIONS OF COMPETITION IN THE U.S. MARKET
U.S. MARKET CHARACTERISTICS Titanium sponge is the primary input in the manufacturing of titanium mill products,
such as titanium ingots, billets, sheets or plates. Titanium sponge may be produced in either a standard quality grade or a premium quality grade, both of which have different end uses and are differentiated by the amount of trace elements they contain.1 The titanium sponge is finished to the customer’s specified grade and trace elements, and is sold throughout the United States.
Premium quality grades of titanium sponge are used to produce premium titanium ingots and other mill products, while standard quality grades of titanium sponge are used in the production of standard titanium ingots and other mill products. Standard and premium quality titanium sponge is used in a variety of applications, such as commercial and military aircraft, satellites, naval vessels, power plants, automotive products, biomedical devices, jewelry, bicycles, etc., with the grade, in some cases, depending on the end use. For example, both grades of titanium sponge are used in airframe and engine applications, but only premium quality titanium sponge can be used in rotating engine parts, while standard quality titanium sponge can be applied to airframes and the static, non-rotating parts of engines.
The domestic industry is highly concentrated, with two U.S. producers, ATI and TIMET, accounting for 100 percent of U.S. production of titanium sponge during the period of investigation. ATI did not report any commercial shipments during 2014-2016 as all of its production of titanium sponge was internally consumed. TIMET also internally consumes the vast majority of its titanium production, with *** percent of TIMET’s sponge production transferred to its affiliated melting plants in the United States, and the balance exported to TIMET’s overseas affiliates.2
Foreign production and U.S. consumption of the subject product are also relatively concentrated. Three import sources account for more than *** percent of U.S. imports of subject titanium sponge. In terms of consumption, three purchasers and two domestic producers accounted for more than *** percent of total consumption in 2016; very little titanium sponge is for resale as the majority of purchases and production are for internal consumption.
Overall, apparent U.S. consumption of titanium sponge, by quantity, was ***percent lower in 2016 than in 2014 and *** percent lower than in 2015. Apparent U.S. consumption of titanium sponge fluctuated during 2014-2016, increasing from *** metric tons in 2014 to *** metric tons in 2015 before decreasing to *** metric tons in 2016.
1 Trace elements include nitrogen, carbon, sodium, magnesium, chloride, iron, silicon, hydrogen, water, oxygen, chromium, nickel, and others.
2 Petition, Vol. I, p. 40.

II-2
CHANNELS OF DISTRIBUTION U.S. producers and importers sold of subject merchandise ***, as shown in table II-1.
Table II-1 Titanium sponge: U.S. producers’ and importers’ U.S. commercial shipments, by sources and channels of distribution, 2014-16, January to June 2016, and January to June 2017
* * * * * * *
GEOGRAPHIC DISTRIBUTION Less than *** percent of U.S. production and less than *** percent of U.S. imports of
titanium sponge is resold; the majority of production and imports are internally consumed by producers and importers. *** reported selling titanium sponge to the Midwest, Central Southwest, and Pacific Coast, while importers of subject merchandise from Japan reported selling to the Northeast and Midwest (table II-2). For U.S. producers, *** percent of sales were sold between 101 and 1,000 miles of the U.S. point of shipment and *** percent were over 1,000 miles. Importers sold *** percent within 100 miles of their U.S. point of shipment and *** percent between 101 and 1,000 miles. Table II-2 Titanium sponge: Geographic market areas in the United States served by U.S. producers and importers
Region U.S. producers Subject U.S. importers
Japan Northeast --- 2 Midwest *** 2 Southeast --- --- Central Southwest *** --- Mountain --- --- Pacific Coast *** --- Other1 --- --- All regions (except Other) --- --- Reporting firms *** 2
1 All other U.S. markets, including AK, HI, PR, and VI. Note--No importers of titanium sponge from Kazakhstan provided data to this question. Source: Compiled from data submitted in response to Commission questionnaires.
II-3
SUPPLY AND DEMAND CONSIDERATIONS
U.S. supply Domestic production
Based on available information, U.S. producers of titanium sponge have the ability to
respond to changes in demand with small-to-moderate changes in the quantity of shipments of U.S.-produced titanium sponge to the U.S. market. Factors limiting responsiveness of supply include limited availability of unused capacity and inventories, limited ability to shift shipments from alternate markets, and limited ability to shift production from alternate products. Industry capacity
Domestic capacity utilization increased from *** percent in 2014 to *** percent in 2015
before falling to *** percent in 2016. The increase in capacity utilization from 2014 to 2015 was driven primarily by an increase in production as both domestic producers increased production in 2015. A decrease in production was the primary factor for the decrease of capacity utilization from 2015 to 2016 as both domestic producers reduced production. Capacity utilization in January-June 2016 was *** percent and *** percent in January-June 2017. The primary reason for this difference is ATI’s idling of production at the end of 2016; production of domestic titanium sponge was *** metric tons in January-June 2016 and *** metric tons in January-June 2017. This relatively moderate level of capacity utilization suggests that U.S. producers may have moderate ability to increase production of titanium sponge in response to an increase in prices. Alternative markets
U.S. producers’ exports, as a percentage of total shipments, decreased from *** percent
in 2014 to *** percent in 2016, indicating that U.S. producers may have a limited ability to shift shipments between the U.S. market and other markets in response to price changes.3 U.S. producers reported the *** as their principal export markets. U.S. producers reported limited foreign sales and distribution networks as barriers to exporting. U.S producers also stated that demand for titanium sponge is driven by the aerospace industry, which makes the United States, France, and Great Britain primary markets for U.S. produced titanium sponge.
3 U.S. producers’ exports, as a share of total shipments, were *** percent in January-June 2016 and *** percent in January-June 2017. TIMET represented *** percent of all export shipments during January 2014 – June 2017. These shipments were to its foreign affiliates in the United Kingdom and France.

II-4
Inventory levels U.S. producers’ inventories increased from 2014 to 2016. Relative to total shipments,
U.S. producers’ inventory levels increased from *** percent in 2014 to *** percent in 2016. These inventory levels suggest that U.S. producers may have some ability to respond to changes in demand with changes in the quantity shipped from inventories. Production alternatives
*** responding U.S. producer stated that it could switch production from titanium
sponge to other products. U.S. producer TIMET reported that the equipment is built for the sole purpose of producing titanium sponge and has “no other practical use.” Subject imports from Japan
Based on available information, producers of titanium sponge from Japan have the
ability to respond to changes in demand with moderate changes in the quantity of shipments of titanium sponge to the U.S. market. The main contributing factors to this degree of responsiveness of supply are the availability of unused capacity and inventories and the ability to shift shipments from inventories. Industry capacity
Japan’s capacity utilization increased from *** percent in 2014 to *** percent in 2016.
The increase is primarily attributed to an increase in production, as overall production capacity remained steady during the period of investigation.4 This relative high level of capacity utilization suggests that Japan producers have limited ability to increase production of titanium sponge in response to an increase in prices. Alternative markets
Japanese shipments to markets other than the United States, as a percentage of total
shipments, increased from *** percent in 2014 to *** percent in 2016. Shipments to domestic markets fell from *** percent in 2014 to *** percent in 2016. Japanese non-U.S.-market shipments indicate that producers may have some ability to shift shipments between domestic or other markets and the U.S. market in response to price changes.
4 Overall production capacity for Japan remained unchanged from 2015 to 2016 at *** metric tons; production of titanium sponge increased from *** metric tons in 2015 to *** metric tons in 2016.

II-5
Inventory levels Japanese inventories of titanium sponge increased from *** metric tons in 2014 to ***
metric tons in 2016. Relative to total shipments, inventory levels increased from *** percent in 2014 to *** percent in 2016. These inventory levels suggest that responding foreign firms may have substantial ability to respond to changes in demand with changes in the quantity shipped from inventories. Production alternatives
Responding foreign producers from Japan – *** and *** – stated that they *** switch
production from titanium sponge to other products, but did not elaborate. Subject imports from Kazakhstan
Based on available information, producers of titanium sponge from Kazakhstan have the
ability to respond to changes in demand with moderate changes in the quantity of shipments of titanium sponge to the U.S. market. The main contributing factor to this degree of responsiveness of supply is the availability of unused capacity. Factors mitigating responsiveness of supply include limited availability of inventories, limited ability to shift shipments from alternate markets or inventories, and limited ability to shift production to or from alternate products. Industry capacity
Kazakhstan’s capacity utilization increased from *** percent in 2014 to *** percent in
2016. This relatively low level of capacity utilization suggests that Kazakhstan producers may have substantial ability to increase production of titanium sponge in response to an increase in prices. Alternative markets
Kazakhstan’s shipments to domestic markets, as a percentage of total shipments,
increased from *** percent in 2014 to *** in 2016, and shipments to export markets other than the United States, as a percentage of total shipments, decreased from *** percent in 2014 to *** percent in 2016. Kazakhstan’s exports indicate that producers may have limited ability to shift shipments between other markets and the U.S. market in response to price changes. Inventory levels
Relative to total shipments, inventory levels remain unchanged at *** percent from
2014 to 2016. These inventory levels suggest that responding foreign firms may have limited ability to respond to changes in demand with changes in the quantity shipped from inventories.

II-6
Production alternatives The responding foreign producer stated it *** switch production from titanium sponge
to other products, but did not elaborate. Nonsubject imports
Nonsubject imports represented less than *** percent of total imports in 2016. The
largest sources of nonsubject imports during 2014-2016 were Russia, Ukraine, and China. Combined, these countries accounted for *** percent of nonsubject imports in 2016.5 Supply constraints
No responding U.S. producers or importers reported any supply constraints since
January 1, 2014. One of the main purchasing factors reported by importers and purchasers was the availability and reliability of supply. *** noted it must have a consistent and reliable supply of titanium to support its customers’ long-term agreements. *** reported that it negotiated long-term titanium sponge supply agreements during 2014-2016 to match the length of the agreements with its customers. Purchasers and importers also noted that long-term agreements are negotiated 6-12 months in advance of a contract terminating to guarantee reliability and availability of supply. *** also reported that suppliers on its approved suppliers list are also audited on a scheduled basis to ensure compliance with its specifications. In testimony Allegheny Technologies Incorporated (ATI), a producer and purchaser of titanium sponge, cited the long-term supply commitments at globally competitive prices as a way to secure its ability to fulfill its contracts with downstream customers.6 ATI reported that its decision to expand its sourcing of subject imports was made because there were no other U.S. sourcing options and insufficient volume to meet its downstream customers’ needs.7
U.S. demand
Based on available information, the overall demand for titanium sponge is likely to
experience moderate changes in response to changes in price. The main contributing factors are the somewhat limited range of substitute products and the moderate cost share of titanium sponge in most of its end-use products.
5 Official U.S. import statistics collected by the U.S. Census Bureau. 6 Conference transcript, p.110 (Sims). 7 Ibid.

II-7
End uses and cost share
U.S. demand for titanium sponge depends on the demand for U.S.-produced downstream products. Reported end uses include ingot, slab, electrodes, aerospace engines, airframes, medical devices, billet and bloom, and titanium mill products. Titanium sponge accounts for a moderate share of the cost of the end-use products in which it is used. Reported cost shares for some end uses were:
• 13 to 35 percent of ingot • 30 percent of slab • 30 percent of electrodes • 17 to 25 percent for titanium mill products.
Business cycles
Both U.S. producers and three of eight importers indicated that the market was subject
to business cycles or distinctive conditions of competition. *** reports that titanium sponge markets fluctuate with industrial and aerospace markets. Importer *** reported, “As our suppliers' and sub-tier suppliers' costs are in local currencies and the U.S. dollar is our transactional currency, foreign exchange is a variable component of the cost of titanium sponge. Changes in freight costs are another variable component of titanium sponge costs.” *** U.S. producers and the majority of importers reported that there have been no changes to conditions of competition or business cycles for titanium sponge since 2014. Demand trends
Most firms reported an increase in U.S. demand for titanium sponge since January 1,
2014 (table II-3). Table II-3 Titanium sponge: Firms’ responses regarding U.S. demand and demand outside the United States
Item Increase No change Decrease Fluctuate Demand in the United States U.S. producers *** *** *** *** Importers 4 3 --- --- Demand outside the United States U.S. producers *** *** *** *** Importers 2 2 1 ---
Source: Compiled from data submitted in response to Commission questionnaires.
TIMET reported a “clear” increase in demand since 2014, and an increase in imports of standard quality titanium sponge from Japan.8 ATI pointed to growing demand for downstream
8 Conference transcript, p. 69 (Seiner).

II-8
titanium mill products by the aerospace industry affecting the demand for titanium sponge,9 along with changes in demand in the chemical processing, desalination, and industrial markets, also known as “commercially pure titanium markets”.10 As noted in Part V, long-term contracts for sales of titanium sponge and downstream products can extend for 5 to 10 years. According to estimates calculated by Deloitte, annual commercial aircraft production is anticipated to “increase by 29.3 percent over the next decade” despite decreases in orders since 2013 (figures II-1 and II-2).11 Figure II-1 History for large commercial aircraft orders, 2013 to September 2017
Source: The Boeing Company, “Order and deliveries,” accessed in September, 2017 http://www.boeing.com/commercial/#/orders-deliveries; Airbus Group, “Orders and deliveries,” accessed in September, 2017, http://www.aircraft.airbus.com/market/orders-deliveries/.
9 Conference transcript, p. 111 (Sims). 10 Conference transcript, pp. 172-173 (Forsythe). 11 Deloitte analysis of the following data: The Boeing Company, “Order and deliveries,” accessed in
November, 2016 http://active.boeing.com/commercial/orders/index.cfm; Airbus Group, “Orders and deliveries,” accessed in November, 2016, http://www.airbus.com/company/market/orders-deliveries/; UBS, US Aerospace and Defense Playbook, 14 October 2016; and Credit Suisse, Global Aerospace and Defense, 27 May 2016.

II-9
Figure II-2 Aircraft production, 2009 to 2025 (forecast)
Source: Deloitte, 2017 Global Aerospace and Defense Section Outlook: Growth Prospects Remain Upbeat, accessed September 2017. Substitute products
Substitutes for titanium sponge include titanium scrap. U.S. producer, TIMET, stated
that when producing titanium ingot, alloying additions like aluminum and vanadium are added to the sponge, or a firm can use scrap that already has aluminum and vanadium in it. However, TIMET reported that it cannot produce titanium ingot exclusively out of the scrap due to its higher oxygen content.12 Half of responding importers (four of eight) reported that there were no substitutes for titanium sponge.
SUBSTITUTABILITY ISSUES
The degree of substitution between domestic and imported titanium sponge depends
upon such factors as relative prices, quality (e.g., grade standards, defect rates, etc.), and conditions of sale (e.g., price discounts/rebates, lead times between order and delivery dates, reliability of supply, product services, etc.). Based on available data, staff believes that there is moderate-to-high degree of substitutability between domestically produced titanium sponge and titanium sponge imported from subject sources.
Lead times
Titanium sponge is primarily sold from inventory. U.S. producers reported that ***
percent of their commercial shipments were from inventory, with lead times averaging *** days. U.S. importers reported that *** percent of their commercial shipments were from
12 Conference transcript, pp. 63-64 (Seiner).

II-10
foreign inventory, with lead times averaging 90 days. The remaining *** percent of their commercial shipments were produced to order, with lead times averaging *** days.
Factors affecting purchasing decisions
Purchasers responding to lost sales lost revenue allegations were asked to identify the
main purchasing factors their firm considered in their purchasing decisions for titanium sponge. The most often cited top three factors firms considered in their purchasing decisions for titanium sponge were availability (3 firms), quality (2 firms), and terms of supply (2 firms). Purchasers cited a reliable and stable supply as an important purchasing factor due to the nature of downstream consumers of titanium products, such as the commercial aerospace sector, for which titanium mill producers must be able to supply on a long-term contractual basis, with terms often exceeding five years. Purchasers also reported that a diversified and reliable supply of titanium sponge is often a requirement of their customers.
Comparison of U.S.-produced and imported titanium sponge
In order to determine whether U.S.-produced titanium sponge can generally be used in
the same applications as imports from Japan and Kazakhstan, U.S. producers and importers were asked whether the products can always, frequently, sometimes, or never be used interchangeably. As shown in table II-4, U.S. producers and most importers stated that titanium sponge from the United States and subject countries is “always” or “sometimes” interchangeable. U.S. producers and most importers reported that titanium sponge from nonsubject countries is “sometimes” interchangeable with domestic and subject country titanium sponge. Table II-4 Titanium sponge: Interchangeability between titanium sponge produced in the United States and in other countries, by country pair
* * * * * * * In addition, producers and importers were asked to assess how often differences other
than price were significant in sales of titanium sponge from the United States, subject, or nonsubject countries. As seen in table II-5, U.S. producers *** differences other than price *** being significant in sales of titanium sponge, while most U.S. importers stated factors other than price are “never” significant in sales. Table II-5 Titanium sponge: Significance of differences other than price between titanium sponge produced in the United States and in other countries, by country pair
* * * * * * *

III‐1
PART III: U.S. PRODUCERS’ PRODUCTION, SHIPMENTS, AND EMPLOYMENT
The Commission analyzes a number of factors in making injury determinations (see 19 U.S.C. §§ 1677(7)(B) and 1677(7)(C)). Information on the subsidies and dumping margins was presented in Part I of this report and information on the volume and pricing of imports of the subject merchandise is presented in Part IV and Part V. Information on the other factors specified is presented in this section and/or Part VI and (except as noted) is based on the questionnaire responses of two firms that accounted for all U.S. production of titanium sponge during 2016.
U.S. PRODUCERS
The Commission issued a U.S. producer questionnaire to two firms based on information contained in the petition. Both firms provided usable data on their productive operations. Staff believes that these responses represent all U.S. production of titanium sponge in 2016.1 As discussed in greater detail below, both U.S. producers directly import the subject merchandise.
Table III‐1 lists U.S. producers of titanium sponge, their production locations, positions on the petition, and shares of total production. Table III-1 Titanium sponge: U.S. producers, their position on the petition, location of production, and share of reported production, 2016
Firm Position on petition Production location(s) Share of production
(percent) TIMET Support Henderson, NV ***ATI Oppose Rowley, UT ***
Total *** Source: Compiled from data submitted in response to Commission questionnaires.
Table III‐2 presents information on U.S. producers’ ownership, and related and/or
affiliated firms.
1 TIMET is currently the only U.S. producer of titanium sponge. Conference transcript, p. 28 (Seiner). ATI operated a titanium sponge production facility in Rowley, Utah until 2016. The idling process for this facility began in August 2016, and was completed in December 2016. ATI 2016 Annual Report, retrieved from http://ir.atimetals.com/~/media/Files/A/ATIMetals‐IR/annual‐reports/ati2016ar.pdf, September 13, 2017, p. F‐7.

III‐2
Table III-2 Titanium sponge: U.S. producers' ownership, related and/or affiliated firms
* * * * * * * Table III‐3 presents U.S. producers’ reported changes in operations since January 1,
2014.
Table III-3 Titanium sponge: U.S. producers' reported changes in operations, since January 1, 2014
* * * * * * *
U.S. PRODUCTION, CAPACITY, AND CAPACITY UTILIZATION
Table III‐4 and figure III‐1 present U.S. producers’ production, capacity, and capacity utilization. Capacity remained steady from 2014 to 2016, but was *** lower in January‐June 2017 than in January‐June 2016 following the closure of ATI’s titanium sponge production facility in Rowley, UT. Production rose *** percent from 2014 to 2015, and then declined *** percent from 2015 to 2016, for an overall *** percent decline in production from 2014 to 2016. Production was *** percent lower in January‐June 2017 than in January‐June 2016, again due to the closure of ATI’s Rowley, UT facility. Average capacity utilization rose *** percentage points from 2014 to 2015, and then declined *** percentage points from 2015 to 2016, for an overall decrease of *** percentage points from 2014 to 2016. Capacity utilization was *** percentage points lower in January‐June 2017 than in January‐June 2016. Both firms cited *** as the main constraint on production.2
2 TIMET reports “***” as a constraint, while ATI reports that the “***”. See U.S. producer questionnaire responses of TIMET and ATI, question II‐3d.

III‐3
Table III-4 Titanium sponge: U.S. producers' capacity, production, and capacity utilization, 2014-16, January to June 2016, and January to June 2017
* * * * * * *
Figure III-1 Titanium sponge: U.S. producers' capacity, production, and capacity utilization, 2014-16, January to June 2016, and January to June 2017
* * * * * * *
Alternative products
As shown in table III‐5, *** percent of the product produced during 2016 by U.S. producers was in‐scope product. *** reported producing other products, primarily ***.3
Table III-5 Titanium sponge: U.S. producers' overall capacity and production on the same equipment as subject production, 2014-16, January to June 2016, and January to June 2017
* * * * * * *
U.S. PRODUCERS’ U.S. SHIPMENTS AND EXPORTS
Table III‐6 presents U.S. producers’ U.S. shipments, export shipments, and total shipments. The majority of U.S. shipments were made up of internal consumption in 2016, accounting for *** percent of U.S. shipments by quantity and *** percent of U.S. shipments by value. Transfers to related firms constituted *** percent of U.S. shipments by quantity and *** percent of U.S. shipments by value in 2016.4 U.S. commercial shipments totaled *** MT in 2016, or less than *** percent of U.S. shipments by quantity and less than *** percent of U.S. shipments by value. U.S. shipments made up *** percent of total shipments by U.S. producers in 2016, while export shipments made up *** percent of total shipments in 2016.
U.S. shipments by quantity declined *** percent from 2014 to 2016, and were *** percent lower by quantity in January‐June 2017 than in January‐June 2016. U.S. shipments by value declined *** percent from 2014 to 2016, and were *** percent lower by value in January‐June 2017 than in January‐June 2016. Export shipments decreased *** percent by quantity and *** percent by value from 2014 to 2016. TIMET ***.
3 TIMET ***, however it reported that ***. ***, email to USITC auditor, September 18, 2017. 4 TIMET reported ***. ***, email to USITC auditor, September 18, 2017. ATI ***. ***, email to USITC auditor, September 18, 2017.

III‐4
Table III-6 Titanium sponge: U.S. producers' U.S. shipments, export shipments, and total shipments, 2014-16, January to June 2016, and January to June 2017
* * * * * * *
U.S. shipments by grade
Table III‐7 presents U.S. producers’ U.S. shipments of titanium sponge by grade. Most U.S. producers’ U.S. shipments of titanium sponge in 2016 were premium grade. As a share of total quantity, U.S. shipments of this grade decreased by *** percentage points from 2014 to 2016, while U.S. shipments of standard grade titanium sponge increased by *** percentage points over the same period.
Table III-7 Titanium sponge: U.S. producers' U.S. shipments by type and source, 2014-16, January to June 2016, and January to June 2017
* * * * * * *
U.S. PRODUCERS’ INVENTORIES
Table III‐8 presents U.S. producers’ end‐of‐period inventories and the ratio of these inventories to U.S. producers’ production, U.S. shipments, and total shipments. U.S. producers’ inventories increased *** percent from 2014 to 2016, and were *** percent lower in January‐June 2017 than in January‐June 2016. As a ratio to U.S. production, inventories increased *** percentage points from 2014 to 2016, and as a ratio to U.S. shipments, inventories increased over the same period by *** percentage points.
Table III-8 Titanium sponge: U.S. producers' inventories, 2014-16, January to June 2016, and January to June 2017
* * * * * * *

III‐5
U.S. PRODUCERS’ IMPORTS AND PURCHASES
U.S. producers’ imports and purchases of titanium sponge are presented in table III‐9. ATI’s total imports of titanium sponge increased *** percent from 2014 to 2016, increasing as a ratio to its U.S. production by *** percentage points.5 TIMET’s total imports of titanium sponge decreased *** percent from 2014 to 2016, decreasing as a ratio to its U.S. production by *** percentage points.6
Table III-9 Titanium sponge: U.S. producers' direct imports, 2014-16, January to June 2016, and January to June 2017
* * * * * * *
U.S. EMPLOYMENT, WAGES, AND PRODUCTIVITY
Table III‐10 shows U.S. producers’ employment‐related data. From 2014 to 2016, total PRWs declined *** percent, with ***. Total hours worked declined *** percent and total wages paid declined *** percent from 2014 to 2016. Hours worked per PRW increased by *** percent from 2014 to 2016 and hourly wages rose *** percent over the same period. The decline in most employment data in January‐June 2017 compared to January‐June 2016 reflects ATI’s closure of its Rowley, UT plant.
Table III-10 Titanium sponge: U.S. producers' employment related data, 2014-16, January to June 2016, and January to June 2017
* * * * * * *
5 ATI reported that its reason for importing was: “***.” ATI’s importer questionnaire response, question II‐4.
6 TIMET reported that its reason for importing was: “***.” TIMET’s importer questionnaire response, question II‐4.


IV‐1
PART IV: U.S. IMPORTS, APPARENT U.S. CONSUMPTION, AND MARKET SHARES
U.S. IMPORTERS
The Commission issued importer questionnaires to 10 firms believed to be importers of subject titanium sponge, as well as to all U.S. producers of titanium sponge.1 Usable questionnaire responses were received from eight companies,2 representing *** percent of U.S. imports from Japan in 2016, and *** U.S. imports from Kazakhstan in 2016, under HTS subheading 8108.20.0010. Table IV‐1 lists all responding U.S. importers of titanium sponge from Japan, Kazakhstan, and other sources, as well as their locations, and their shares of U.S. imports, in 2016.
Table IV-1 Titanium sponge: U.S. importers, their headquarters, and share of total imports by source, 2016
Firm Headquarters
Share of imports by source (percent)
Japan KazakhstanSubject sources
Nonsubject sources
All import sources
ATI Pittsburgh, PA *** *** *** *** ***Global Titanium Detroit, MI *** *** *** *** ***NF and M Monaca, PA *** *** *** *** ***Perryman Houston, PA *** *** *** *** ***RMI Niles, OH *** *** *** *** ***Sumitomo Rosemont, IL *** *** *** *** ***TIMET Exton, PA *** *** *** *** ***Toho Houston, TX *** *** *** *** ***
Total *** *** *** *** *** Source: Compiled from data submitted in response to Commission questionnaires.
U.S. IMPORTS
Table IV‐2 presents data for U.S. imports of titanium sponge from subject countries and all other sources. Imports of titanium sponge from subject countries increased 20.3 percent by quantity from 2014 to 2016, and were 40.6 percent higher in January‐June 2017 than in January‐June 2016. Imports from nonsubject sources decreased *** percent by quantity from
1 The Commission issued questionnaires to those firms identified in the petition, along with firms that, based on a review of data provided by U.S. Customs and Border Protection (“Customs”), may have accounted for more than one percent of total imports under HTS subheading 8108.20.0010 in 2016.
2 *** provided certification that it has not imported titanium sponge into the United States since January 1, 2014.

IV‐2
2014 to 2016, and were *** percent higher in January‐June 2017 than in January‐June 2016. According to submitted questionnaire responses, sources of nonsubject imports included ***. Table IV-2 Titanium sponge: U.S. imports, by source, 2014-16, January to June 2016, and January to June 2017
Item Calendar year January to June
2014 2015 2016 2016 2017 Quantity (metric tons) U.S. imports from.-- Japan *** *** *** *** ***
Kazakhstan *** *** *** *** ***Subject sources 13,193 16,998 15,868 7,341 10,321Nonsubject sources *** *** *** *** ***
All import sources *** *** *** *** *** Value (1,000 dollars) U.S. imports from.-- Japan *** *** *** *** ***
Kazakhstan *** *** *** *** ***Subject sources 175,255 199,906 166,938 75,374 107,257Nonsubject sources *** *** *** *** ***
All import sources *** *** *** *** *** Unit value (dollars per metric ton) U.S. imports from.-- Japan *** *** *** *** ***
Kazakhstan *** *** *** *** ***Subject sources 13,284 11,761 10,520 10,268 10,392Nonsubject sources *** *** *** *** ***
All import sources *** *** *** *** ***
* * * * * * *
Source: Compiled from data submitted in response to Commission questionnaires. Figure IV-1 Titanium sponge: U.S. import volumes and prices, 2014-16, January to June 2016, and January to June 2017
* * * * * * *

IV‐3
U.S. IMPORTERS’ SUBJECT U.S. SHIPMENTS AND EXPORTS
Table IV‐3 presents subject U.S. importers’ U.S. shipments, export shipments, and total shipments. Internal consumption constituted *** percent of total U.S. shipments by quantity in 2016, a *** percentage point increase from 2014. Commercial U.S. shipments accounted for *** percent of total U.S. shipments in 2016, a *** percentage point decrease from 2014.
Table IV-3 Titanium sponge: Subject U.S. importers' U.S. shipments, export shipments, and total shipments, 2014-16, January to June 2016, and January to June 2017
Item Calendar year January to June
2014 2015 2016 2016 2017 Quantity (metric tons) Commercial U.S. shipments *** *** *** *** *** Internal consumption *** *** *** *** *** Transfers to related firms *** *** *** *** ***
U.S. shipments 15,812 13,800 15,436 7,377 12,420Export shipments *** *** *** *** ***
Total shipments *** *** *** *** *** Value (1,000 dollars) Commercial U.S. shipments *** *** *** *** *** Internal consumption *** *** *** *** *** Transfers to related firms *** *** *** *** ***
U.S. shipments 217,841 171,024 173,099 81,801 133,267Export shipments *** *** *** *** ***
Total shipments *** *** *** *** *** Unit value (dollars per metric ton) Commercial U.S. shipments *** *** *** *** *** Internal consumption *** *** *** *** *** Transfers to related firms *** *** *** *** ***
U.S. shipments 13,777 12,393 11,214 11,089 10,730Export shipments *** *** *** *** ***
Total shipments *** *** *** *** ***
* * * * * * *
Source: Compiled from data submitted in response to Commission questionnaires.

IV‐4
NEGLIGIBILITY
The statute requires that an investigation be terminated without an injury determination if imports of the subject merchandise are found to be negligible.3 Negligible imports are generally defined in the Tariff Act of 1930, as amended, as imports from a country of merchandise corresponding to a domestic like product where such imports account for less than 3 percent of the volume of all such merchandise imported into the United States in the most recent 12‐month period for which data are available that precedes the filing of the petition or the initiation of the investigation. However, if there are imports of such merchandise from a number of countries subject to investigations initiated on the same day that individually account for less than 3 percent of the total volume of the subject merchandise, and if the imports from those countries collectively account for more than 7 percent of the volume of all such merchandise imported into the United States during the applicable 12‐month period, then imports from such countries are deemed not to be negligible.4 As shown in table IV‐4, Imports from Japan accounted for *** percent of total imports of titanium sponge by quantity from August 2016 to July 2017, while imports from Kazakhstan accounted for *** percent of total imports of titanium sponge by quantity from August 2016 to July 2017. Table IV-4 Titanium sponge: U.S. imports in the twelve month period preceding the filing of the petition, August 2016 through July 2017
* * * * * * *
CUMULATION CONSIDERATIONS
In assessing whether imports should be cumulated, the Commission determines whether U.S. imports from the subject countries compete with each other and with the domestic like product and has generally considered four factors: (1) fungibility, (2) presence of sales or offers to sell in the same geographical markets, (3) common or similar channels of distribution, and (4) simultaneous presence in the market. Information regarding channels of distribution, market areas, and interchangeability appear in Part II. Additional information concerning fungibility, geographical markets, and simultaneous presence in the market is presented below.
Fungibility
Table IV‐5 and figure IV‐2 present U.S. importers’ U.S. shipments of titanium sponge by grade for 2014 to 2016, as well as January‐June 2016 and January‐June 2017. U.S. importers’
3 Sections 703(a)(1), 705(b)(1), 733(a)(1), and 735(b)(1) of the Act (19 U.S.C. §§ 1671b(a)(1), 1671d(b)(1), 1673b(a)(1), and 1673d(b)(1)).
4 Section 771 (24) of the Act (19 U.S.C § 1677(24)).

IV‐5
shipments of titanium sponge imported from Japan in 2016 were *** premium grade titanium sponge. Shipments of premium grade titanium sponge from Japan constituted a *** percent share compared to a *** percent share for standard grade. The share of U.S. shipments of premium grade titanium sponge from Japan was *** percentage points lower in 2016 than in 2014.
U.S. importers’ shipments of titanium sponge imported from Kazakhstan in 2016 were *** standard grade titanium sponge. Reported U.S. shipments of premium grade titanium sponge from Kazakhstan in 2014 constituted a *** percent share of all U.S. shipments. In every other year or interim period of the POI, reported U.S. shipments of titanium sponge imported from Kazakhstan were *** standard grade titanium sponge. Table IV-5 Titanium sponge: U.S. importers’ U.S. shipments by grade, 2014-16, January to June 2016, and January to June 2017
* * * * * * *
Figure IV-2 Titanium sponge: U.S. imports, by source and type, January 2014 through June 2017 aggregated
* * * * * * *
Presence in the market
Table IV‐6 and figure IV‐3 present monthly imports of titanium sponge for January 2014 through June 2017. Subject imports from Japan were present in all 42 months. Subject imports from Kazakhstan were present in *** months. Imports from nonsubject sources were present in 39 months.

IV‐6
Table IV-6 Titanium sponge: U.S. imports, by source and month of entry, January 2014 to June 2017
Month of entry Japan subject
Kazakhstan subject
Subject sources
Nonsubject sources
Total U.S. imports
Quantity (metric tons) 2014.-- January 1,258 *** *** 441 ***
February 1,199 *** *** --- ***March 920 *** *** 205 ***April 571 *** *** 219 ***May 651 *** *** 174 ***June 1,093 *** *** 385 ***July 615 *** *** 196 ***August 1,976 *** *** 343 ***September 810 *** *** 521 ***October 1,994 *** *** 427 ***November 1,397 *** *** 396 ***December 838 *** *** 435 ***
2015.-- January 761 *** *** 471 ***
February 867 *** *** 260 ***March 1,356 *** *** 793 ***April 2,041 *** *** 356 ***May 1,739 *** *** 124 ***June 1,334 *** *** 54 ***July 1,774 *** *** 26 ***August 949 *** *** 149 ***September 1,165 *** *** 113 ***October 1,320 *** *** 212 ***November 1,327 *** *** 28 ***December 855 *** *** 27 ***
Table continued on next page.

IV‐7
Table IV-6--Continued. Titanium sponge: U.S. imports, by source and month of entry, 2014-16, January to June 2016, and January to June 2017
Month of entry Japan subject
Kazakhstan subject
Subject sources
Nonsubject sources
Total U.S. imports
Quantity (metric tons) 2016.-- January 873 *** *** 54 ***
February 1,196 *** *** 27 ***March 1,325 *** *** 51 ***April 1,300 *** *** --- ***May 1,306 *** *** 45 ***June 988 *** *** 21 ***July 1,609 *** *** 1 ***August 1,247 *** *** 63 ***September 1,632 *** *** --- ***October 1,339 *** *** 10 ***November 1,774 *** *** 14 ***December 1,260 *** *** 14 ***
2017.-- January 1,256 *** *** 14 ***
February 1,186 *** *** 441 ***March 2,231 *** *** 102 ***April 1,136 *** *** 240 ***May 1,824 *** *** 99 ***June 879 *** *** 158 ***
Source: Official U.S. import statistics and proprietary Customs records using HTS statistical reporting number 8108.20.0010, accessed September 20, 2017 and September 29, 2017.

IV‐8
Figure IV-3 Titanium sponge: U.S. imports, by source and month of entry, January 2014 to June 2017
* * * * * * *
Geographical markets
Table IV‐7 presents U.S. imports of titanium sponge by border of entry in 2016. Most subject imports came in through *** points of entry, followed by *** and *** points of entry. *** nonsubject imports were imported through *** points of entry. Table IV-7 Titanium sponge: U.S. imports, by source and border of entry, January 2014 through June 2017
Source East North South West Total
Quantity (metric tons) Japan 19,668 22,477 --- 11,024 53,169Kazakhstan *** *** *** *** ***
Subject sources *** *** *** *** ***Ukraine 4,204 --- --- --- 4,204China 2,419 49 --- 20 2,488Russia 542 383 --- --- 926Switzerland 50 --- --- --- 50Korea 2 30 --- --- 32United Kingdom 4 --- --- --- 4Canada 1 0 0 --- 1Germany 0 --- --- 0 0Taiwan --- --- 0 --- 0Sweden --- 0 --- --- 0
Nonsubject sources 7,223 462 0 21 7,706All import sources *** *** *** *** ***
Note.--Shares and ratios shown as "0" represent values greater than zero, but less than "0.05" percent. Source: Official U.S. import statistics and proprietary Customs records using HTS statistical reporting number 8108.20.0010, accessed September 20, 2017 and September 29, 2017.

IV‐9
APPARENT U.S. CONSUMPTION
Table IV‐8 and figure IV‐4 present data on apparent U.S. consumption for titanium sponge from 2014 to 2016, and for interim periods in 2016 and 2017. Table IV-8 Titanium sponge: Apparent U.S. consumption, 2014-16, January to June 2016, and January to June 2017
Item Calendar year January to June
2014 2015 2016 2016 2017 Quantity (metric tons) U.S. producers' total U.S. shipments *** *** *** *** ***U.S. importers' total U.S. shipments from.-- Japan *** *** *** *** ***
Kazakhstan *** *** *** *** ***Subject sources 15,812 13,800 15,436 7,377 12,420Nonsubject sources *** *** *** *** ***
All import sources *** *** *** *** ***Apparent U.S. consumption *** *** *** *** *** Value (1,000 dollars) U.S. producers' total U.S. shipments *** *** *** *** ***U.S. importers'total U.S. shipments from.-- Japan *** *** *** *** ***
Kazakhstan *** *** *** *** ***Subject sources 217,841 171,024 173,099 81,801 133,267Nonsubject sources *** *** *** *** ***
All import sources *** *** *** *** ***Apparent U.S. consumption *** *** *** *** ***Source: Compiled from data submitted in response to Commission questionnaires. Figure IV-4 Titanium sponge: Apparent U.S. consumption, 2014-16, January to June 2016, and January to June 2017
* * * * * * *
U.S. MARKET SHARES
U.S. market share data are presented in table IV‐9.
Table IV-9 Titanium sponge: Market share, 2014-16, January to June 2016, and January to June 2017
* * * * * * *
.


V-1
PART V: PRICING DATA
FACTORS AFFECTING PRICES
Raw material costs
The primary raw material inputs for titanium sponge are titanium ore ilmenite and titanium ore rutile. Raw material costs represented *** percent and *** percent of the costs of goods sold for U.S. producers of titanium sponge in 2014 and 2016, respectively, and declined to *** percent in interim 2017 from *** percent in 2016. As seen in figure V-1, the cost of ilmenite declined by *** percent between January 2014 and February 2017, and increased *** percent between February 2017 and September 2017. The cost of rutile declined *** percent from January 2014 to September 2017. The cost of ilmenite declined by *** percent from January 2014 to June 2017, and the cost of rutile declined by *** percent during the same period. Figure V-1 Raw materials: Titanium ore ilmenite (“ilmenite”) and titanium ore rutile (“rutile”), dollars per ton, monthly, January 2014-September 2017
* * * * * * *
U.S. inland transportation costs
The sole responding U.S. producer, ***, reported that purchasers typically arrange transportation of titanium sponge, while importers reported typically arrange transportation of titanium sponge to their customers. *** reported U.S. inland transportation costs of *** percent, while most importers reported costs of *** to *** percent.
PRICING PRACTICES
Pricing methods
U.S. producers reported using *** sales, while importers reported using transaction-by-
transaction negotiations, contracts, and other methods (table V-1).
Table V-1 Titanium sponge: U.S. producers’ and importers’ reported price setting methods, by number of responding firms1
* * * * * * *

V-2
*** reported that all of its commercial sales of titanium sponge were sold ***, while importers reported selling a large majority, *** percent, under long-term or annual contracts, with about *** under long-term contracts. They reported that long-term contacts can last anywhere from five to up to ten years.1 As shown in table V-2, U.S. producers and importers reported their 2016 U.S. commercial shipments of titanium sponge by type of sale. Table V-2 Titanium sponge: U.S. producers’ and importers’ shares of U.S. commercial shipments by type of sale, 2016
* * * * * * *
U.S. importers reported that annual and long-term contracts do not provide price renegotiation and fix prices and quantities. Purchasers provided a general description of their firms’ method of purchase for titanium sponge. ATEP stated that it purchases “the entirety of {its} sponge requirements via long-term contracts executed following a formalized bid process”.2 Perryman stated that it only purchases titanium sponge through long-term contracts from approved suppliers.3
Sales terms and discounts
U.S. producer *** typically quotes prices on an f.o.b. basis, and U.S. importers typically quote prices on a delivered basis. The majority of U.S. producers and importers do not offer discounts. U.S. producer *** reported sales terms of net 30 days, and U.S. importers reported sales terms of net 30 days and net 60 days.
PRICE DATA
The Commission requested U.S. producers and importers to provide quarterly data for
the total quantity and f.o.b. value of the following titanium sponge products shipped to unrelated U.S. customers during January 2014 to June 2017.
Product 1.-- Premium Quality Titanium Sponge that has been certified for use in critical
rotating aero-engine end-use applications and does not contain more than, by percentage of weight, any of the following:
Al: 0.03; C: 0.02; Cl: 0.120; Fe: 0.080; H2O: 0.020; Mg: 0.060; N: 0.015; O: 0.08; Si: 0.04; Sn: 0.286; Ni: 0.03; H: 0.020; Cr: 0.030.
1 Conference transcript, p. 127 (Kerwin). 2 Conference transcript, p. 114 (Halford). 3 Conference transcript, p. 119 (Perryman).

V-3
Product 2.-- Standard Quality Titanium Sponge that has not been certified for use in critical aero-engine end-use applications and/or contains more than, by percentage of weight, any of the following:
Al: 0.03; C: 0.02; Cl: 0.120; Fe: 0.080; H2O: 0.020; Mg: 0.060; N: 0.015; O: 0.08; Si: 0.04; Sn: 0.286; Ni: 0.03; H: 0.020; Cr: 0.030.
One U.S. producer and two importers provided usable pricing data for sales of the requested products, although not all firms reported pricing for all products for all quarters.4 Pricing data reported by these firms accounted for approximately *** percent5 of U.S. producers’ commercial shipments of product and *** percent of U.S. shipments of subject imports from Japan in 2016.6
Price data for products 1-2 are presented in tables V-3 to V-4 and figures V-2 to V-3. Table V-3 Titanium sponge: Weighted-average f.o.b. prices and quantities of domestic and imported product 1 and margins of underselling/(overselling), by quarters, January 2014- June 2017
* * * * * * *
Table V-4 Titanium sponge: Weighted-average f.o.b. prices and quantities of domestic and imported product 2 and margins of underselling/(overselling), by quarters, January 2014- June 2017
* * * * * * *
Figure V-2 Titanium sponge: Weighted-average prices and quantities of domestic and imported product 1, by quarters, January 2014- June 2017
* * * * * * * Figure V-3 Titanium sponge: Weighted-average prices and quantities of domestic and imported product 2, by quarters, January 2014- June 2017
* * * * * * *
4 Per-unit pricing data are calculated from total quantity and total value data provided by U.S. producers and importers. The precision and variation of these figures may be affected by rounding, limited quantities, and producer or importer estimates.
5 U.S. producer *** reported sales of *** of product 1 and 2 in its questionnaire, and reported *** of commercial shipments in its trade data submission.
6 No importers reported commercial sales for imports from Kazakhstan. Commercial sales to unrelated parties represented less than *** percent of U.S. production and *** percent of total subject imports during 2016.

V-4
Import purchase cost data
Five importers provided usable import purchase cost data for their internal use of products 1 and 2 imported from Japan and Kazakhstan, although not all firms reported purchase cost data for all quarters. The amount of product internally consumed, as a share of total imports, represented approximately *** percent of total imports from Japan in 2016 and *** percent of imports from Kazakhstan. Import purchase cost data is presented in tables V-5 to V-6 and figures V-4 to V-5.
In addition to the import purchase cost data, firms that imported titanium sponge for their internal use estimated that logistical and supply chain costs (including ocean freight, duties, brokerage fees, harbor maintenance fees, and U.S. inland transportation costs) accounted for 1 to 5 percent of the landed duty-paid value. They also estimated that insurance costs ranged from less than 1 percent to about 2 percent, and that warehousing costs were up to 4 percent. All five importers reported that they do not compare their costs to those of other importers and U.S. producers.
In general, firms cited the limited availability of U.S.-produced titanium sponge as the main factor for purchasing imported titanium sponge for their own use. Other benefits of directly importing included the ability to approve foreign suppliers and ensure consistent product quality. *** firms provided estimates for margins saved by directly importing titanium sponge for their own use. Table V-5 Titanium sponge: Weighted-average f.o.b. prices and quantities of domestic and landed duty paid costs of imported product 1, by quarter, January 2014-June 2017
* * * * * * *
Table V-6 Titanium sponge: Weighted-average f.o.b. prices and quantities of domestic and landed duty paid costs of imported product 2, by quarter, January 2014-June 2017
* * * * * * * Figure V-4 Titanium sponge: Weighted-average f.o.b. prices or landed duty-paid values and quantities of domestic and imported product 1, by quarters, January 2014- June 2017
* * * * * * *
Figure V-5 Titanium sponge: Weighted-average f.o.b. prices or landed duty-paid values and quantities of domestic and imported product 2, by quarters, January 2014- June 2017
* * * * * * *

V-5
Price trends
In general, prices decreased during January 2014 to June 2017. Table V-7 summarizes the price trends, by country and by product. As shown in the table, U.S.-produced product 1 prices increased by *** percent and priced for product 2 decreased by *** percent during January 2014 to June 2017, while import price decreases ranged from *** percent. Import purchase cost decreases ranged from *** percent during the period.
Table V-7 Titanium sponge: Summary of weighted-average f.o.b. prices for products 1-2 from the United States and each subject country
* * * * * * *
Price comparisons
As shown in table V-8, prices for titanium sponge imported from Japan7 were below those for U.S.-produced product in *** instances ***; margins of underselling ranged from *** percent. Prices for product 1 imported from Japan were below those for U.S.-produced product 1 in ***; margins of underselling ranged from *** percent. Prices for product 2 from Japan were below those for U.S.-produced product 2 in ***. Prices for product 2 from Japan were between *** percent above prices for the domestic product.
Table V-8 Titanium sponge: Instances of underselling/overselling and the range and average of margins, by product, January 2014- June 2017
* * * * * * *
LOST SALES AND LOST REVENUE
The Commission requested that U.S. producers of titanium sponge report purchasers where they experienced instances of lost sales or revenue due to competition from imports of titanium sponge from Japan and Kazakhstan during 2014-2016. One U.S. producer, ***, submitted lost sales and lost revenue allegations, identifying three firms where it lost sales. The other responding U.S. producer, ***, did not report lost sales or revenue allegations. ***.
Staff contacted three purchasers and received responses from three purchasers. Responding purchases reported purchasing and importing *** kilograms of subject titanium sponge during 2014-2016 (table V-9).
During 2016, responding purchasers purchased *** percent from U.S. producers; purchased and/or imported *** percent of product from Japan, *** percent of product from Kazakhstan, and *** percent of product from nonsubject countries. Of the responding
7 The Commission did not receive commercial pricing data from Kazakhstan.

V-6
purchasers, all three respondents reported not purchasing any domestic product during 2014-2016.
Purchasers were asked a series of questions regarding their sourcing decisions for titanium sponge. Of the three responding purchasers, two reported that, since 2014, they had either purchased imported titanium sponge or simply imported the product from Japan and Kazakhstan instead of U.S.-produced product. Only one of these purchasers reported data on subject import prices relative to U.S.-produced product prices. This firm reported that subject import prices were not lower than U.S.-produced product. Two of three purchasers reported that price was not a primary reason for purchasing imported product over U.S.-produced titanium sponge. All three respondents cited availability and reliability of supply as a major purchasing factor. Purchasers also noted that they did not receive formal offers of sale from domestic producers during 2014–2016.
Of the three responding purchasers, two reported that U.S. producers had not reduced prices in order to compete with lower-priced imports from subject countries (one reported that it did not know). Table V-9 Titanium sponge: Purchasers’ responses to purchasing and importing patterns
* * * * * * * Table V-10 Titanium sponge: Purchasers’ responses to purchasing subject imports instead of domestic product
* * * * * * *
Table V-11 Titanium sponge: Purchasers’ responses to U.S. producer price reductions
* * * * * * *
In responding to the lost sales lost revenue survey, some purchasers provided additional information on purchases and market dynamics. One of the three purchasers, ***, reported that the titanium sponge producers in the United States (TIMET) and Russia (VSMPO) are vertically integrated titanium melters that are not valid suppliers of titanium sponge on the open market. *** also reported that during 2014-2016, TIMET never brought any sponge to the open market for sale and never attempted to make a formal sales offer to it. *** also noted that TIMET is not an approved source for its titanium sponge purchases. TIMET would need to go through an approval process of 6 months to 3 years before its titanium sponge can be utilized by ***. Another purchaser, ***, noted that it did not offer any data on pricing because it never received formal commercial offers from any domestic producers.

VI‐1
PART VI: FINANCIAL EXPERIENCE OF U.S. PRODUCERS
BACKGROUND
This section of the report presents the financial data of ATI and TIMET, accounting for all known U.S. production of in‐scope titanium sponge in 2016.1 2 Nearly all titanium sponge production in the United States is captively consumed as internal consumption or transfers to related firms.3
ATI, a public company, is a global manufacturer of technically advanced materials and complex components with 2016 sales of over $3 billion to aerospace & defense, OCTG, medical, automotive, and other industrial markets. It operates in two business segments: High Performance Materials and Components (“HPMC”) and Flat Rolled Products. ATI’s titanium sponge operations are part of the HPMC segment, which includes the production of titanium sponge at Rowley, Utah and the downstream production, conversion, and distribution of “a wide range of high performance materials.”4 In 2016, 75 percent of the HPMC segment sales were to the aerospace & defense market, “led by products for commercial aerospace jet engines.”5 ATI announced the indefinite idling of its Rowley, Utah titanium sponge production in August 2016 and completed the idling process in December 2016, resulting in $471 million of long‐lived asset impairment charges.6
TIMET is a “fully integrated titanium component manufacturer” and part of the Forged Products segment of Precision Castparts Corp. (“PCC”), a public company. PCC operates three business segments: Investment Cast Products, Forged Products, and Airframe Products. The Forged Products segment of PCC includes the production of titanium and nickel‐based alloys, revert management, re‐melting, and seamless pipe at 92 manufacturing and administrative
1 Honeywell Electronic Materials (“Honeywell”), Salt Lake City, Utah, produces out‐of‐scope ultra‐high purity crystalline titanium sponge used in the manufacturing of semiconductors using a sodium reduction process. Petition, p. 6.
2 Financial results were reported on the basis of generally accepted accounting principles (GAAP). Both producers’ fiscal years end on December 31 and reported all financial data in calendar years. Prior to Berkshire Hathaway’s acquisition of PCC in February 2016, TIMET’s fiscal year ended on March 31.
3 TIMET ***. 4 ATI’s HPMC segment produces, converts, and distributes a wide range of high performance
materials including: titanium and titanium‐based alloys, nickel‐ and cobalt‐based alloys and super‐alloys, zirconium and related alloys including hafnium and niobium, advanced powder alloys and other specialty materials, in long product forms such as ingot, billet, bar, rod, wire, shapes and rectangles, and seamless tubes, plus precision forgings and castings, components and machined parts at over 20 locations in the United States and a number of locations worldwide. ATI 2016 Annual Report, retrieved from http://ir.atimetals.com/~/media/Files/A/ATIMetals‐IR/annual‐reports/ati2016ar.pdf, September 13, 2017, p. F‐3 and F‐14.
5 Ibid., pp. 1 and F‐3. 6 Ibid., p. F‐19.

VI‐2
locations in the United States and 27 additional locations worldwide.7 PCC reported net sales of $2.8 billion in the Forged Products segment, with approximately 40 percent of PCC’s sales in 2016.8 On January 29, 2016, Berkshire Hathaway acquired TIMET’s parent company, PCC, for $37.2 billion.9
OPERATIONS ON TITANIUM SPONGE
Table VI‐1 presents aggregated data on U.S. producers’ operations in relation to titanium sponge over the period examined; table VI‐2 presents the change in average unit values for the data presented in table VI‐1 between yearly periods; and table VI‐3 presents selected company‐specific financial data. One producer, TIMET, reported a very limited amount of open market sales that accounted for a less than *** percent of its total net sales.10 Because of the very limited number of open market transactions, changes in volumes, values, and unit values (from year to year) for commercial sales many not be indicative of actual trends.
***.11 Because of concerns regarding the representativeness of actual commercial sales as a surrogate for fair market value, fair market values for domestically‐produced titanium sponge were not based on the very limited amount of open market sales from 2014 to June 2017 and the method used to value net sales varied between the two producers. ATI ***.12 TIMET’s ***.13
7 PCC’s Forged Products segment manufactures “high‐performance, nickel‐based alloys used to produce forged components for aerospace and non‐aerospace applications in such markets as oil and gas, chemical processing and pollution control.” The products in the Forged Products segment include: fan discs, compressor discs, turbine discs, seals, spacers, shafts, hubs and cases, landing gear beams, bulkheads, wing structures, engine mounts, struts and tail flaps, and housings for commercial and military aircraft engines and industrial gas turbine power plants; mechanical and structural tubular products from steel and nickel alloys for domestic and international energy markets; and forged components for propulsion systems on nuclear submarines and aircraft carriers, forgings for pumps, valves and structural applications for naval defense applications. PCC’s titanium products are used to manufacture components for the commercial and military aerospace, power generation, energy, and industrial end markets. Commercial aerospace represented the largest market for PCC’s titanium alloys, with new generations of fuel‐efficient aircraft, such as the Boeing 787 and Aribus A350, “increasing the content of titanium in airframe and engine applications.” PCC 2016 10‐KT Transition Report (as filed), pp. 3‐6, 13, 17, and 57.
8 Ibid., p. 17. 9 Ibid., p. 61. 10 TIMET ***. TIMET explained that ***. ***, email to USITC auditor, September 18, 2017. 11 When asked for a reliable industry accepted fair market value methodology, ***. ATI responded:
***. ***, email to USITC auditor, September 18, 2017. 12 ATI’s ***. ***. ***, email to USITC auditor, September 18, 2017. 13 Petition, GEN‐26 to GEN‐29. TIMET additionally noted: ***. ***, September 18, 2017. ***. ***,
September 25, 2017.

VI‐3
In addition, ATI’s internal consumption ***.14 ATI ***. TIMET’s internal consumption reflected ***.15 TIMET classified ***.16 Total net sales (composed of ***), *** by quantity and *** percent by value from 2014 to 2016. Total net sales quantity was higher in January‐June 2017 than in January‐June 2016 while total net sales values were lower.17
Although both ATI and TIMET use the Kroll process during the vacuum distillation stage to make titanium sponge, only TIMET is a fully integrated producer of titanium sponge. TIMET’s Henderson plant is a “closed loop” facility that produces titanium sponge from reducing the titanium concentrates such as ilmenite, rutile, or titanium slag by reaction with chlorine gas and coke to form impure titanium tetrachloride (TiCl4), commonly known as “tickle”.18 Tickle is then combined with magnesium using the Kroll process to form titanium sponge and magnesium chloride (MgCl2). TIMET then recovers the magnesium for use for the feedstock of its titanium sponge production.19 Unlike TIMET, ATI is not an integrated producer and must source all of its tickle and magnesium used in its Kroll process and cannot recover or recycle the magnesium chloride20 or the titanium scrap at the end of the production process.21
ATI testified at the conference that tickle and magnesium prices increased, with transportation costs for tickle increasing *** percent. ATI reported that the raw material cost increases resulted in *** percent increase in the cost of titanium production.22 ATI reported that it did evaluate whether to invest in a fully integrated chlorination facility to reduce its raw material costs for sourcing tickle, but concluded that the capital cost of this facility *** was
14 ATI ***. 15 ***, email to USITC auditor, September 18, 2017. 16 Ibid. 17 ATI idled its plant in December 2016, ***. 18 ATI purchased tickle under a long‐term agreement with DuPont. Conference transcript, p. 79
(Seiner). 19 TIMET testified that it is the largest magnesium producer in the United States but recycles all of its
magnesium chloride into magnesium for titanium sponge production. Ibid., p. 91 (Seiner). 20 ATI used another firm, U.S. Magnesium, to recycle the magnesium chloride. Ibid., p. 79 (Seiner). 21 ATI reported ***. ATI U.S. producer questionnaire, II‐3a and ***, email to USITC auditor,
September 18, 2017. Revert is the recycled or scrap titanium that results from making sponge. Titanium scrap can be used for some portion of the downstream ingot production. TIMET testified at the conference that neither PQ or SQ titanium ingot can be made exclusively from revert/scrap because of the high oxygen content presence in the revert/scrap. Titanium sponge must be used to “sweet that scrap.” Conference transcript, pp. 63‐64, 92 (Seiner).
TIMET ***. ***, email to USITC auditor, September 18, 2017. 22 The price of tickle had increased from ***. ATI stated that ***. ATI’s postconference brief, p. 41
and exh. 4. ATI also reported additional transportation cost concerns regarding the availability of the raw material feedstock (tickle and magnesium). At the conference, ATI testified that tickle had to be “transported by rail across the United States before it could be processed into sponge at the Rowley facility. The cost of tickle supply and transportation were also increasing due to environmental concerns about the transportation and handling of toxic inhalants. There was also a risk that the railroads would not transport tickle at all.” Conference transcript, p. 107 (Sims).

VI‐4
“prohibitive.”23 TIMET did not incur these costs for tickle since it makes its own tickle from upstream titanium concentrates. TIMET also makes most of its own magnesium and chlorine from recovered magnesium chloride.24
As a result of each producer sourcing different raw materials in the production of sponge, ATI reported *** raw material costs than TIMET. ATI must purchase tickle and magnesium as raw materials whereas TIMET manufactured its own tickle from purchases of rutile, ilmenite ore, or titanium slag and generated its own magnesium from recovered magnesium chloride. On a per‐unit basis, ATI’s raw material costs were approximately *** higher than those of TIMET, primarily due to the non‐integrated process at ATI’s Rowley facility.25 Aggregated for both producers, raw materials, direct labor, other factory costs, and total COGS all *** from 2014 to 2016; raw materials and other factory costs were *** while direct labor was *** in January‐June 2017 than in January‐June 2016.
*** reported selling expenses. General and administrative expenses *** percent from 2014 to 2016 and were *** in January‐June 2017 than in January‐June 2016.26 ATI continued to report *** for its idled plant, testifying that it still has a maintenance crew on site “maintaining critical pieces of equipment in the event of some global supply shortage of sponge...{it} can start up as kind of an emergency supply capability.”27
ATI stated that one of the factors that negatively impacted the operating profit of its HPMC segment in 2015 and 2016 was the “strategic decision to use ATI‐produced titanium sponge rather than lower cost titanium scrap to manufacture certain titanium products.”28 ATI explained its decision to idle the Rowley titanium sponge production in its 2016 annual report:
“Over the last several years, significant global capacity has been added to produce titanium sponge, which is a key raw material used to produce ATI’s
23 ATI’s postconference brief, p. 42. 24 TIMET reported that ***. ***, email to USITC auditor, September 18, 2017. TIMET purchases a
“little bit” of chlorine and magnesium to “make up for traces that are lost in the closed loop process.” Conference transcript, p. 78 (Seiner). TIMET explained that it purchases chlorine via pipeline from another producer in Nevada and most of the magnesium from U.S. Magnesium. Ibid., p. 78 (Seiner).
25 TIMET testified that “sponge manufacturers try to make premium quality every time, but if when they have more PQ than what their customers need, they sell them the same sponge at a lower price, just marketed as SQ.” TIMET testified that it costs the same to produce premium or standard quality titanium sponge and uses the same equipment and workers. Each production run results in an 18,000‐pound batch of sponge, which is then sorted into quality types. The quality of sponge is certified by the end user throughout the production process. PQ is generally used for rotor applications such as jet engines and non‐rotating parts in high stress applications such as landing gear. SQ can be used in most applications except rotor type. Ibid., pp. 39, 64‐65 (Seiner).
26 ATI’s *** while TIMET’s ***. ATI and TIMET producer questionnaires, III‐4. 27 ATI reported that the cost to restart the Rowley plant would be ***. These costs would include
***. The restart process would take six to nine months and the sponge produced would need to be recertified as standard or premium quality. Conference transcript, p. 176 (Sims) and ATI’s postconference brief, exh. 4, no. 17.
28 ATI 2016 Annual Report, retrieved from http://ir.atimetals.com/~/media/Files/A/ATIMetals‐IR/annual‐reports/ati2016ar.pdf, September 13, 2017, p. F‐24 to F‐25, and F‐28.

VI‐5
titanium products. In addition, demand for industrial‐grade titanium products from global markets continues to be weak. As a result of these factors, titanium sponge, including aerospace quality sponge, can now be purchased from qualified global producers under long‐term supply agreements at prices lower than the production costs at ATI’s titanium sponge facility in Rowley, UT.29 Restructuring our HPMC segment titanium operations to improve cost competitiveness, including the indefinite idling of the Rowley, UT titanium sponge production facility, which resulted in $514 million of restructuring charges, including $11 million of titanium sponge inventory revaluation classified in cost of sales in the consolidated statement of operations. We entered into long‐term, cost competitive supply agreements with several leading global producers of premium‐grade and standard‐grade titanium sponge, with the lower cost titanium sponge purchased under these agreements replacing the titanium sponge produced at the Rowley facility. We recognized a $471 million asset impairment charge for the Rowley facility idling, along with $43 million primarily for related closure costs for Rowley.”30 The operating income margin *** from *** percent of total net sales in 2014 to ***
percent in 2015 and then declined to *** percent in 2016. Net income margin *** from *** percent of total net sales in 2014 to *** percent in 2015 and was *** percent in 2016 (primarily due to the asset impairment write‐down of ATI’s Rowley plant).31 Both operating and net income margins were lower in January‐June 2017 than in January‐June 2017. ***. Table VI-1 Titanium sponge: Results of operations of U.S. producers, 2014-16, January to June 2016, and January to June 2017
* * * * * * * Table VI-2 Titanium sponge: Changes in AUVs, between fiscal years and between partial year periods
* * * * * * * Table VI-3 Titanium sponge: Select results of operations of U.S. producers, by company, 2014-16, January to June 2016, and January to June 2017
* * * * * * *
29 Ibid., p. F‐7. 30 Ibid., pp. F‐19‐20. 31 ATI reported ***.

VI‐6
CAPITAL EXPENDITURES AND RESEARCH AND DEVELOPMENT EXPENSES
Table VI‐4 presents capital expenditures and research and development (“R&D”) expenses by firm. TIMET accounted for the *** capital expenditures throughout the period examined, with total capital expenditures *** from 2014 to 2016 and *** in January‐June 2017 than in January‐June 2016. TIMET reported ***. ATI’s reported ***. At the conference, ATI testified that it had to incur additional capital expenses related to “processing‐related changes” in order to achieve PQ certification in 2015.32 ATI idled its titanium sponge production in December 2016 and did ***. Table VI-4 Titanium sponge: Capital expenditures and research and development expenses for U.S. producers, by firm, 2014-16, January to June 2016, and January to June 2017
* * * * * * *
ASSETS AND RETURN ON ASSETS
Table VI‐5 presents data on the U.S. producers’ total assets and their return on assets (“ROA”).33 ROA is calculated as the ratio of operating income (or loss) to total assets. The aggregated trend for assets and ROA should be used with caution due to the indefinite idling of the Rowley plant in December 2016 and the aforementioned atypical aspects of reported revenue and costs (see page VI‐9). For TIMET, total net assets *** from 2014 to 2016, but return on assets ***, *** from 2014 to 2015, but *** to a negative ROA from 2015 to 2016. Table VI-5 Titanium sponge: U.S. producers’ total assets and return on assets 2014-16
* * * * * * *
CAPITAL AND INVESTMENT
The Commission requested U.S. producers of titanium sponge to describe any actual or potential negative effects of imports of titanium sponge from Japan and Kazakhstan on their firms’ growth, investment, ability to raise capital, development and production efforts, or the scale of capital investments. Table VI‐6 tabulates the responses of ATI and TIMET and table VI‐7 presents the detailed narrative responses regarding actual and anticipated negative effects of subject imports. TIMET explained that its ***.34
32 Conference transcript, p. 177 (Sims). 33 The return on assets is calculated as operating income divided by total assets. With respect to a
firm’s overall operations, the total asset value reflects an aggregation of a number of assets which are generally not product specific. Thus, high‐level allocations may have been required in order to report a total asset value for titanium sponge.
34 ***, email to USITC auditor, September 18, 2017.
VI‐7
Table VI-6 Titanium sponge: Actual and anticipated negative effects of imports on investment and growth and development
* * * * * * * Table VI-7 Titanium sponge: Narratives relating to actual and anticipated negative effects of imports on investment and growth and development, since January 1, 2014
* * * * * * *


VII‐1
PART VII: THREAT CONSIDERATIONS AND INFORMATION ON NONSUBJECT COUNTRIES
Section 771(7)(F)(i) of the Act (19 U.S.C. § 1677(7)(F)(i)) provides that—
In determining whether an industry in the United States is threatened with material injury by reason of imports (or sales for importation) of the subject merchandise, the Commission shall consider, among other relevant economic factors1‐‐ (I) if a countervailable subsidy is involved, such information as may be
presented to it by the administering authority as to the nature of the subsidy (particularly as to whether the countervailable subsidy is a subsidy described in Article 3 or 6.1 of the Subsidies Agreement), and whether imports of the subject merchandise are likely to increase,
(II) any existing unused production capacity or imminent, substantial increase in production capacity in the exporting country indicating the likelihood of substantially increased imports of the subject merchandise into the United States, taking into account the availability of other export markets to absorb any additional exports,
(III) a significant rate of increase of the volume or market penetration of imports of the subject merchandise indicating the likelihood of substantially increased imports,
(IV) whether imports of the subject merchandise are entering at prices that are likely to have a significant depressing or suppressing effect on domestic prices, and are likely to increase demand for further imports,
(V) inventories of the subject merchandise,
1 Section 771(7)(F)(ii) of the Act (19 U.S.C. § 1677(7)(F)(ii)) provides that “The Commission shall consider {these factors} . . . as a whole in making a determination of whether further dumped or subsidized imports are imminent and whether material injury by reason of imports would occur unless an order is issued or a suspension agreement is accepted under this title. The presence or absence of any factor which the Commission is required to consider . . . shall not necessarily give decisive guidance with respect to the determination. Such a determination may not be made on the basis of mere conjecture or supposition.”

VII‐2
(VI) the potential for titanium sponge‐shifting if production facilities in the foreign country, which can be used to produce the subject merchandise, are currently being used to produce other titanium sponges,
(VII) in any investigation under this title which involves imports of both a raw agricultural titanium sponge (within the meaning of paragraph (4)(E)(iv)) and any titanium sponge processed from such raw agricultural titanium sponge, the likelihood that there will be increased imports, by reason of titanium sponge shifting, if there is an affirmative determination by the Commission under section 705(b)(1) or 735(b)(1) with respect to either the raw agricultural titanium sponge or the processed agricultural titanium sponge (but not both),
(VIII) the actual and potential negative effects on the existing development and production efforts of the domestic industry, including efforts to develop a derivative or more advanced version of the domestic like titanium sponge, and
(IX) any other demonstrable adverse trends that indicate the probability that there is likely to be material injury by reason of imports (or sale for importation) of the subject merchandise (whether or not it is actually being imported at the time).2
Information on the nature of the alleged subsidies was presented earlier in this report; information on the volume and pricing of imports of the subject merchandise is presented in Parts IV and V; and information on the effects of imports of the subject merchandise on U.S. producers’ existing development and production efforts is presented in Part VI. Information on inventories of the subject merchandise; foreign producers’ operations, including the potential for “titanium sponge‐shifting;” any other threat indicators, if applicable; and any dumping in third‐country markets, follows. Also presented in this section of the report is information obtained for consideration by the Commission on nonsubject countries.
2 Section 771(7)(F)(iii) of the Act (19 U.S.C. § 1677(7)(F)(iii)) further provides that, in antidumping investigations, “. . . the Commission shall consider whether dumping in the markets of foreign countries (as evidenced by dumping findings or antidumping remedies in other WTO member markets against the same class or kind of merchandise manufactured or exported by the same party as under investigation) suggests a threat of material injury to the domestic industry.”

VII‐3
THE INDUSTRY IN JAPAN
The Commission issued foreign producers’ or exporters’ questionnaires to two firms believed to produce and/or export titanium sponge from Japan.3 Usable responses to the Commission’s questionnaire were received from two firms: Toho Titanium Co., Ltd. (“Toho”) and Osaka Titanium Technologies Co., Ltd (“OTC”). These firms’ exports to the United States accounted for *** U.S. imports of titanium sponge from Japan in 2016. According to estimates requested of the responding producers in Japan, the production of titanium sponge in Japan reported in this part accounts for virtually all of the country’s overall production. Table VII‐ 1 presents information on the titanium sponge operations of the responding producers and exporters in Japan.
Table VII-1 Titanium Sponge: Summary data for producers in Japan, 2016
Firm Production
(metric tons)
Share of reported
production (percent)
Exports to the United
States (metric tons)
Share of reported
exports to the United
States (percent)
Total shipments
(metric tons)
Share of firm's total
shipments exported
to the United States
(percent) Toho *** *** *** *** *** ***OTC *** *** *** *** *** ***
Total *** *** *** *** *** *** Source: Compiled from data submitted in response to Commission questionnaires.
OTC is the second largest producer of titanium products (including sponge) in the world after Russia’s VSMPO‐AVISMA. As of March 31, 2016, OTC employed 746 permanent workers at its facilities in Amagasaki and Kishiwada, in addition to a sales office in Tokyo.4 OTC produces high‐quality or premium‐grade titanium sponge and titanium ingots for a variety of end uses, in addition to titanium powder. Titanium sponge produced by OTC is used primarily in the production of components for aircraft engines.5
Toho produces titanium sponge, in addition to ingot, high‐purity titanium, and powder, among other titanium products. In FY 2016, Toho employed 883 workers at five manufacturing facilities throughout Japan.6 Toho uses electron beam (EB) melting and vacuum consumable arc
3 These firms were identified through a review of information submitted in the petition. 4 Osaka Titanium Technologies, “Outline,” http://www.osaka‐ti.co.jp/e/e_company/index.html,
(accessed August 31, 2017). 5 Osaka Titanium Technologies, “Products,” http://www.osaka‐ti.co.jp/e/e_product/index.html,
(accessed August 31, 2017). 6 Toho Titanium, “Corporate Profile,” https://www.toho‐titanium.co.jp/en/company/profile.html,
(accessed August 31, 2017).

VII‐4
remelting (VAR) furnaces to melt titanium sponge and produce titanium ingots.7 In January 2014, Toho agreed to establish a joint venture in Yanbu, Saudi Arabia with Saudi Arabia’s National Industrialization Company (Tasnee) and the National Titanium Dioxide Company Ltd. (Cristal), to produce titanium sponge. The joint venture is expected to operate at a production capacity of 15,600 MT per annum and benefit from Toho’s advanced sponge production technology and Saudi Arabia’s low electric‐power rates.8
Changes in operations
As presented in table VII‐2 producers in Japan reported several operational and organizational changes since January 1, 2014.
Table VII-2 Titanium Sponge: Japan’s producers' reported changes in operations, since January 1, 2013
* * * * * * *
Operations on titanium sponge
Table VII‐3 presents information on the titanium sponge operations of the responding producers and exporters in Japan. Capacity increased from 2014 to 2015, which is attributed to ***. Production increased from 2014 to 2016 but was lower in January to July, 2017 than in January to July, 2016. Capacity utilization increased from *** percent in 2014 to *** percent in 2016, but was lower in January to June 2017 than in January to June 2016. Home market shipments, exports to the United States, and exports to the other markets increased from 2014 to 2016. Inventory levels also rose. In 2016, *** percent of total shipments were internally consumed and *** percent were commercial shipments.
*** reported production of alternative products on the same equipment used to produce titanium sponge.
7 Toho Titanium, “Titanium Business,” https://www.toho‐titanium.co.jp/en/business/timetal.html, (accessed August 31, 2017).
8 S&P Global Platts, “Japan’s Toho Titanium, Saudi Arabian firms create sponge titanium joint venture,” January 22, 2014, https://www.platts.com/latest‐news/metals/tokyo/japans‐toho‐titanium‐saudi‐arabian‐firms‐create‐27851949, (accessed September 11, 2017).

VII‐5
Table VII-3 Titanium sponge: Data on industry in Japan, 2014-16, January to June 2016, and January to June 2017 and projection calendar years 2017 and 2018
* * * * * * *
Exports
According to the International Titanium Association (“ITA”), the leading export markets for titanium sponge from Japan include the United States and the European Union (table VII‐4). From 2014 to 2015, Japan’s exports of titanium sponge increased by 28.1 percent, but then declined 7.0 percent from 2015 to 2016. The United States was the largest export market for titanium sponge from Japan during the POI, and accounted for 87.0 percent of Japan’s exports during 2016. Exports to the United States increased by 30.7 percent during 2014‐16. Japan’s exports to its second largest export market, the European Union, increased by 90.8 percent from 2014 to 2015, but declined 65.8 percent from 2015 to 2016.
Table VII-4 Titanium sponge: Exports from Japan by destination market and quantity (metric tons), 2014-16
Destination market Calendar year
2014 2015 2016 United States 12,768 15,105 16,685European Union 2,556 4,878 1,668All other 775 636 818 Total 16,099 20,619 19,171Note.--Because of rounding, figures may not add to the totals shown. Source: ITA, Statistical Review 2012-16, http://www.titanium.org/.
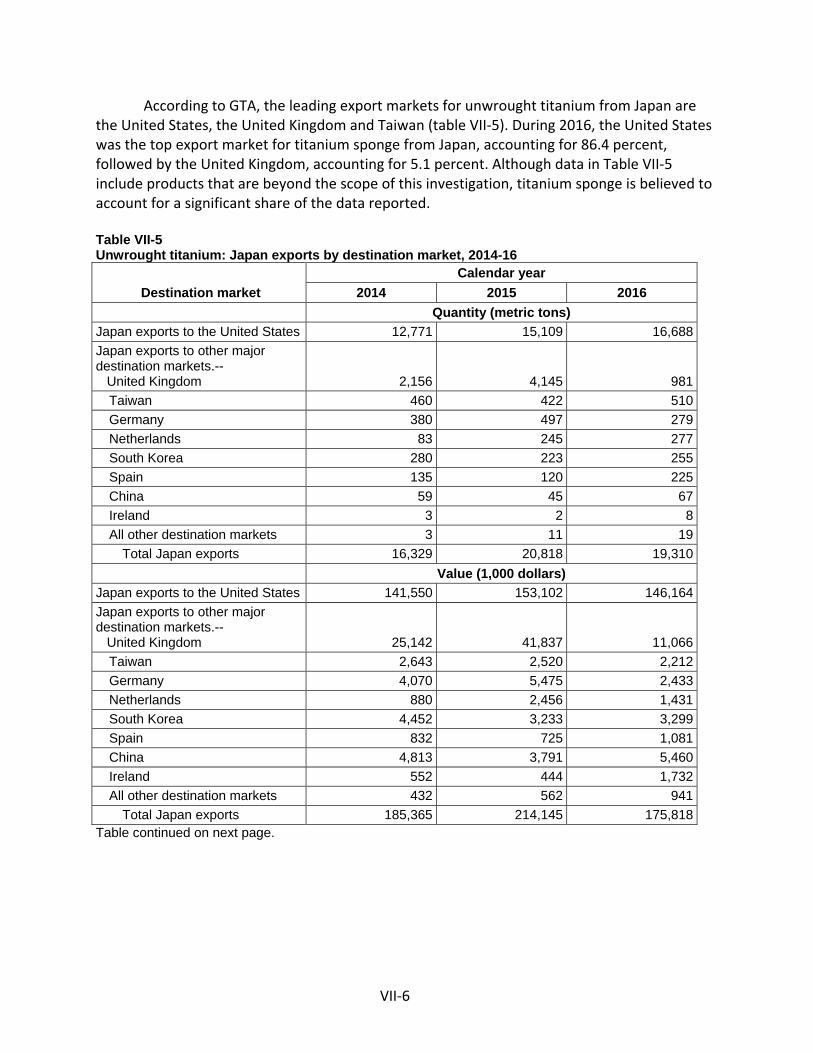
VII‐6
According to GTA, the leading export markets for unwrought titanium from Japan are the United States, the United Kingdom and Taiwan (table VII‐5). During 2016, the United States was the top export market for titanium sponge from Japan, accounting for 86.4 percent, followed by the United Kingdom, accounting for 5.1 percent. Although data in Table VII‐5 include products that are beyond the scope of this investigation, titanium sponge is believed to account for a significant share of the data reported.
Table VII-5 Unwrought titanium: Japan exports by destination market, 2014-16
Destination market Calendar year
2014 2015 2016 Quantity (metric tons) Japan exports to the United States 12,771 15,109 16,688 Japan exports to other major destination markets.-- United Kingdom 2,156 4,145 981
Taiwan 460 422 510 Germany 380 497 279 Netherlands 83 245 277 South Korea 280 223 255 Spain 135 120 225 China 59 45 67 Ireland 3 2 8 All other destination markets 3 11 19
Total Japan exports 16,329 20,818 19,310 Value (1,000 dollars) Japan exports to the United States 141,550 153,102 146,164 Japan exports to other major destination markets.-- United Kingdom 25,142 41,837 11,066
Taiwan 2,643 2,520 2,212 Germany 4,070 5,475 2,433 Netherlands 880 2,456 1,431 South Korea 4,452 3,233 3,299 Spain 832 725 1,081 China 4,813 3,791 5,460 Ireland 552 444 1,732 All other destination markets 432 562 941
Total Japan exports 185,365 214,145 175,818 Table continued on next page.

VII‐7
Table VII-5--Continued Titanium sponge: Japan exports by destination market, 2014-16
Destination market Calendar year
2014 2015 2016 Unit value (dollars per metric ton) Japan exports to the United States 11,084 10,133 8,759 Japan exports to other major destination markets.-- United Kingdom 11,661 10,094 11,277
Taiwan 5,741 5,968 4,337 Germany 10,721 11,019 8,717 Netherlands 10,667 10,026 5,174 South Korea 15,887 14,512 12,949 Spain 6,161 6,035 4,797 China 82,084 84,851 81,362 Ireland 220,933 221,756 210,817 All other destination markets 130,767 52,363 48,879
Total Japan exports 11,352 10,287 9,105 Share of quantity (percent) Japan exports to the United States 78.2 72.6 86.4 Japan exports to other major destination markets.-- United Kingdom 13.2 19.9 5.1
Taiwan 2.8 2.0 2.6 Germany 2.3 2.4 1.4 Netherlands 0.5 1.2 1.4 South Korea 1.7 1.1 1.3 Spain 0.8 0.6 1.2 China 0.4 0.2 0.3 Ireland 0.0 0.0 0.0 All other destination markets 0.0 0.1 0.1
Total Japan exports 100.0 100.0 100.0 Note.-- Data extracted using HS subheading 8108.20 which includes out-of-scope data. Note.--Shares and ratios shown as "0.0" represent values greater than zero, but less than "0.05" percent. Source: Official exports statistics under HS subheading 8108.20 as reported by Japan Ministry of Finance in the IHS/GTA database, accessed September 15, 2017.

VII‐8
THE INDUSTRY IN KAZAKHSTAN
The Commission issued foreign producers’ or exporters’ questionnaires to one firm believed to produce and/or export titanium sponge from Kazakhstan.9 A usable response to the Commission’s questionnaire was received from one firm, Ust‐Kamenogorsk Titanium and Magnesium Plant JSC (“UKTMP”). This firm’s exports to the United States accounted for all of U.S. imports of titanium sponge from Kazakhstan over the period being examined. According to estimates requested of the responding producer in Kazakhstan, the production of titanium sponge in Kazakhstan reported in this small part of the report accounts for virtually all of the country’s production in 2016. Table VII‐6 presents information on the titanium sponge operations of the responding producer and exporter in Kazakhstan.
Table VII-6 Titanium sponge: Summary data on firms in Kazakhstan, 2016
Firm Production
(metric tons)
Share of reported
production (percent)
Exports to the United
States (metric tons)
Share of reported
exports to the United
States (percent)
Total shipments
(metric tons)
Share of firm's total shipments exported to the United
States (percent)
UKTMP *** *** *** *** *** ***Total *** *** *** *** *** ***
Source: Compiled from data submitted in response to Commission questionnaires.
UKTMP is a fully integrated titanium producer and the sole producer of titanium sponge in Kazakhstan. UKTMP is believed to account for 14 percent of global titanium sponge production at its facility in Ust‐Kamenogorsk, Kazakhstan.10 UKTMP is one of the only known global producers of titanium sponge that has integrated upstream operations where the company mines its own titanium concentrates.11 UKTMP also has a joint venture with the Korean steel producer POSCO that produces titanium slabs at UKTMP’s operations in Kazakhstan.12 UKTMP has another joint venture with French metals manufacturer Aubert & Duval (ERAMET Group) in France13 that produces forged titanium products.14
9 These firms were identified through a review of information submitted in the petition. 10 UKAD, “Partners,” http://www.ukadforge.com/about‐us/partners/, (accessed August 31, 2017). 11 Conference transcript, p. 94 (Seiner) and Conference transcript, p. 188 (Thomas). 12 France‐Mateallurgie, “New titanium factory to be built in Kazakhstan,” October 19, 2011,
http://www.france‐metallurgie.com/new‐titanium‐factory‐to‐be‐built‐in‐kazakhstan‐us/, (accessed September 18, 2017).
13 Conference transcript, p.143 (Thomas). 14 UKAD, “Home,” http://www.ukadforge.com/, (accessed August 31, 2017).

VII‐9
Changes in operations
Table VII‐7 presents UKTMP’s reported operational changes since January 1, 2014.
Table VII-7 Titanium Sponge: Kazakh producers' reported changes in operations, since January 1, 2013
* * * * * * *
Operations on Titanium Sponge
Table VII‐8 presents information on the titanium sponge operations of the responding producer and exporter in Kazakhstan. UKTMP did not report production of alternative products on the same equipment used to produce titanium sponge.
Table VII-8 Titanium sponge: Data on industry in Kazakhstan, 2014-16, January to June 2016, and January to June 2017 and projection calendar years 2017 and 2018
* * * * * * *
Exports
According to the ITA, Kazakhstan’s exports of titanium sponge increased by 41.3 percent from 2014 and 2015 by quantity, but then declined by 39.9 percent from 2015 to 2016 (see table VII‐9). Table VII-9 Titanium sponge: Exports from Kazakhstan, Russia, and Ukraine, by quantity (metric tons), 2014-16
Item Calendar year
2014 2015 2016 Kazakhstan 2,895 4,092 2,460Russia 5,545 6,476 7,567Ukraine 8,887 6,324 4,929Total 17,327 16,892 14,956Note.--Because of rounding, figures may not add to the totals shown. Source: ITA, Statistical Review 2012-16, http://www.titanium.org/.
According to GTA, the leading export markets for unwrought titanium from Kazakhstan are Belgium, South Korea, and the United States (table VII‐10). These countries accounted for 45.3 percent, 32.7 percent, and 11.6 percent of unwrought titanium exports by quantity from Kazakhstan, respectively, in 2016. Although data in Table VII‐10 include products that are outside the scope of these investigations, titanium sponge is believed to account for a significant share of the data reported.

VII‐10
Table VII-10 Unwrought titanium: Exports from Kazakhstan by destination market, 2014-16
Destination market Calendar year
2014 2015 2016 Quantity (metric tons) Kazakhstan exports to the United States 1,125 2,190 900 Kazakhstan exports to other major destination markets.-- Belgium --- --- 3,515
South Korea 960 712 2,540 Netherlands 4,275 4,450 645 India 390 15 150 Japan --- 300 14 France --- 22 --- United Kingdom --- 600 --- All other destination markets --- --- ---
Total Kazakhstan exports 6,750 8,289 7,764 Value (1,000 dollars) Kazakhstan exports to the United States 10,058 17,270 6,104 Kazakhstan exports to other major destination markets.-- Belgium --- --- 60,301
South Korea 5,731 4,287 19,126 Netherlands 69,114 73,369 2,274 India 4,551 78 1,065 Japan --- 2,340 125 France --- 381 --- United Kingdom --- 4,680 --- All other destination markets --- --- ---
Total Kazakhstan exports 89,454 102,405 88,996 Table continued on next page.

VII‐11
Table VII-10--Continued. Unwrought titanium: Exports from Kazakhstan by destination market, 2014-16
Destination market Calendar year
2014 2015 2016 Unit value (dollars per metric ton) Kazakhstan exports to the United States 8,940 7,886 6,783 Kazakhstan exports to other major destination markets.-- Belgium --- --- 17,156
South Korea 5,970 6,022 7,530 Netherlands 16,168 16,486 3,526 India 11,670 5,200 7,100 Japan --- 7,800 8,900 France --- 17,546 --- United Kingdom --- 7,800 --- All other destination markets --- --- ---
Total Kazakhstan exports 13,253 12,354 11,463 Share of quantity (percent) Kazakhstan exports to the United States 16.7 26.4 11.6 Kazakhstan exports to other major destination markets.-- Belgium --- --- 45.3
South Korea 14.2 8.6 32.7 Netherlands 63.3 53.7 8.3 India 5.8 0.2 1.9 Japan --- 3.6 0.2 France --- 0.3 --- United Kingdom --- 7.2 --- All other destination markets --- --- ---
Total Kazakhstan exports 100.0 100.0 100.0 Note.-- Data extracted using HS subheading 810820 which includes out-of-scope data. Note.--Shares and ratios shown as "0.0" represent values greater than zero, but less than "0.05" percent. Source: Official exports statistics under HS subheading 8108.20 as reported by Customs Control Committee of the Ministry of Finance in the IHS/GTA database, accessed September 15, 2017.

VII‐12
U.S. INVENTORIES OF IMPORTED MERCHANDISE
Table VII‐11 presents data on U.S. importers’ reported inventories of titanium sponge.
Table VII-11 Titanium sponge: U.S. importers' end-of-period inventories of imports by source, 2014-16, January to June 2016, and January to June 2017
* * * * * * *
U.S. IMPORTERS’ OUTSTANDING ORDERS
The Commission requested importers to indicate whether they imported or arranged for the importation of titanium sponge from Japan or Kazakhstan after January 2016.These data are presented in Table VII‐12. Table VII-12 Titanium sponge: Arranged imports, July 2017 through June 2018
* * * * * * *
ANTIDUMPING OR COUNTERVAILING DUTY ORDERS IN THIRD‐COUNTRY MARKETS
Based on available information, titanium sponges from Japan and Kazakhstan have not been subject to other antidumping or countervailing duty investigations outside the United States.15
15 Conference transcript, p. 45 (Seiner); p. 185‐186 (Forsythe, Halford, Sando, Perryman, Thomas).

VII‐13
INFORMATION ON NONSUBJECT COUNTRIES
Global exports
Table VII‐13 presents global exports of titanium sponge during 2014‐16. According to ITA statistics, Japan, Russia, and Ukraine are the world’s three largest exporters of titanium sponge, while other notable sources include Kazakhstan and China. Total exports from these major producers increased by 5.0 percent from 2014 to 2015, then declined by 12.6 percent from 2015 to 2016. Tables VII‐13 and VII‐14 present trade data that include product that is out of scope, and may include countries that are not major exporters of titanium sponge, but are exporters of other forms of unwrought titanium.
Table VII-13 Titanium sponge: Global exports, by quantity, 2014-16
Country 2014 2015 2016 Quantity (metric tons) Japan 16,099 20,619 19,171Russia 5,545 6,476 7,567Ukraine 8,887 6,324 4,929Kazakhstan 2,895 4,092 2,460China 5,691 3,550 1,760 Total 39,117 41,061 35,887Note.--Excludes data that is not available. Source: ITA, Statistical Review 2012-16, http://www.titanium.org/.
Table VII‐14 presents global exports of unwrought titanium during 2014‐16. HS subheading 8108.20 includes unwrought forms of titanium that are excluded from the scope of these investigations, however titanium sponge is believed to account for a significant share of the product recorded under this subheading.

VII‐14
Table VII-14 Unwrought titanium: Global exports by exporter, 2014-16
Exporter Calendar year
2014 2015 2016 Quantity (metric tons) United States 9,780 9,044 10,201 Japan 16,329 20,818 19,310 Kazakhstan 6,750 8,289 7,764 All other major reporting exporters.-- Malaysia 10,796 28,324 22,020
Russia 9,298 8,045 8,550 Ukraine 8,002 6,349 4,929 Germany 2,122 3,323 3,361 Netherlands 2,928 2,484 2,090 China 6,231 3,917 2,051 Canada 472 650 1,370 United Kingdom 1,324 1,556 1,346 Italy 642 807 874 France 395 403 497 All other exporters 733 811 805
Total global exports 75,802 94,820 85,168 Value (1,000 dollars) United States 177,191 155,839 180,861 Japan 185,365 214,145 175,818 Kazakhstan 89,454 102,405 88,996 All other major reporting exporters.-- Malaysia 20,916 37,325 42,288
Russia 79,328 55,082 45,303 Ukraine 63,440 42,513 26,132 Germany 29,977 32,388 32,439 Netherlands 23,135 15,828 10,581 China 44,227 27,221 12,376 Canada 9,346 11,479 22,092 United Kingdom 24,221 23,340 17,507 Italy 9,602 10,118 11,052 France 5,714 4,763 6,737 All other exporters 12,619 12,050 13,854
Total global exports 774,536 744,498 686,036 Table continued on next page.
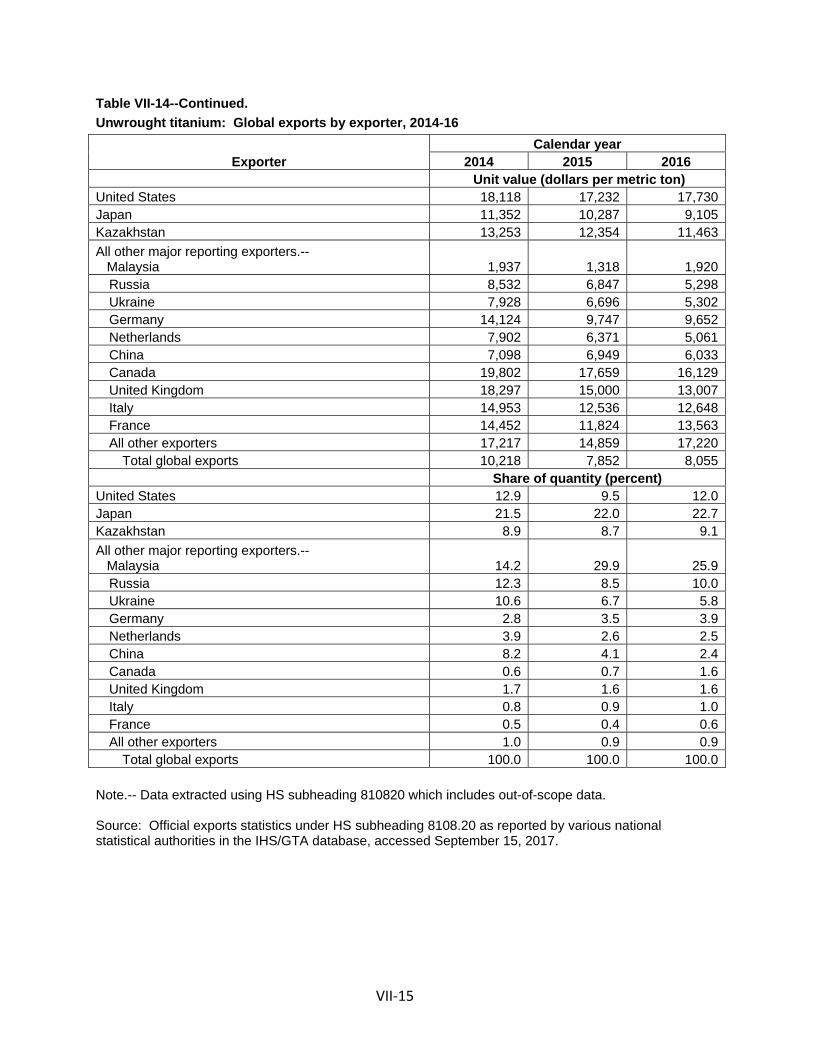
VII‐15
Table VII-14--Continued. Unwrought titanium: Global exports by exporter, 2014-16
Exporter Calendar year
2014 2015 2016 Unit value (dollars per metric ton) United States 18,118 17,232 17,730 Japan 11,352 10,287 9,105 Kazakhstan 13,253 12,354 11,463 All other major reporting exporters.-- Malaysia 1,937 1,318 1,920
Russia 8,532 6,847 5,298 Ukraine 7,928 6,696 5,302 Germany 14,124 9,747 9,652 Netherlands 7,902 6,371 5,061 China 7,098 6,949 6,033 Canada 19,802 17,659 16,129 United Kingdom 18,297 15,000 13,007 Italy 14,953 12,536 12,648 France 14,452 11,824 13,563 All other exporters 17,217 14,859 17,220
Total global exports 10,218 7,852 8,055 Share of quantity (percent) United States 12.9 9.5 12.0 Japan 21.5 22.0 22.7 Kazakhstan 8.9 8.7 9.1 All other major reporting exporters.-- Malaysia 14.2 29.9 25.9
Russia 12.3 8.5 10.0 Ukraine 10.6 6.7 5.8 Germany 2.8 3.5 3.9 Netherlands 3.9 2.6 2.5 China 8.2 4.1 2.4 Canada 0.6 0.7 1.6 United Kingdom 1.7 1.6 1.6 Italy 0.8 0.9 1.0 France 0.5 0.4 0.6 All other exporters 1.0 0.9 0.9
Total global exports 100.0 100.0 100.0 Note.-- Data extracted using HS subheading 810820 which includes out-of-scope data. Source: Official exports statistics under HS subheading 8108.20 as reported by various national statistical authorities in the IHS/GTA database, accessed September 15, 2017.

VII‐16
The Industry in China
In 2012, there were 14 producers of titanium sponge identified in China, with the five leading producers (Zunyi Titanium, Tanshan Tianhe Titanium, Shuangrui Wanji Titanium, Pangang Group, and Jinchuan Group) reportedly accounting for 54 percent of China’s titanium sponge production capacity.16 In 2013, Zunyi Titanium was estimated to be the largest titanium sponge producer in China with an annual operational capacity of 34,000 metric tons and was the only known producer to recover and reuse its own magnesium. The company supplies titanium sponge to various industrial end users throughout China, including the country’s emerging aerospace industry.17
***.18 According to counsel for the petitioner, China was once a principal market for Japan’s exports of standard‐quality titanium sponge, however in recent years China has become self‐sufficient.19 The petitioner also stated that Chinese producers are not known to have quality‐control systems in place that are mandated for the production of premium‐quality titanium sponge used in rotating engine parts for the aerospace industry.20 One respondent indicated that to its knowledge, the majority of titanium sponge produced in China is consumed by mill product producers and other downstream consumers in China, and that “relatively little is exported.”21
Table VII‐15 presents data on China’s exports of titanium sponge from 2014 to 2016. Its exports of titanium sponge declined by 69.1 percent during 2014‐16 (see table VII‐15). During 2016, South Korea, Germany, and Sweden were the three largest export destinations for China’s exports of titanium sponge, accounting for 62.3 percent, 9.7 percent, and 7.5 percent of China’s exports, respectively.
16 Dewhurst, Philip. Roskill Consulting Group Ltd. “Titanium Sponge Supply: Past, Present, and Future.” Presentation at TITANIUM 2013, Las Vegas, Nevada, October, 2013. Slide 21.
17 Quan, Benson. Wellmet International Inc. “Titanium Sponge Production in China.” Presentation at TITANIUM 2014, Chicago, Illinois, September 2014. Slides 2, 5.
18 ***. 19 Conference transcript, 36 (Horgan). 20 Conference transcript, 68 (Seiner). 21 Conference transcript, 113‐114 (Halford).
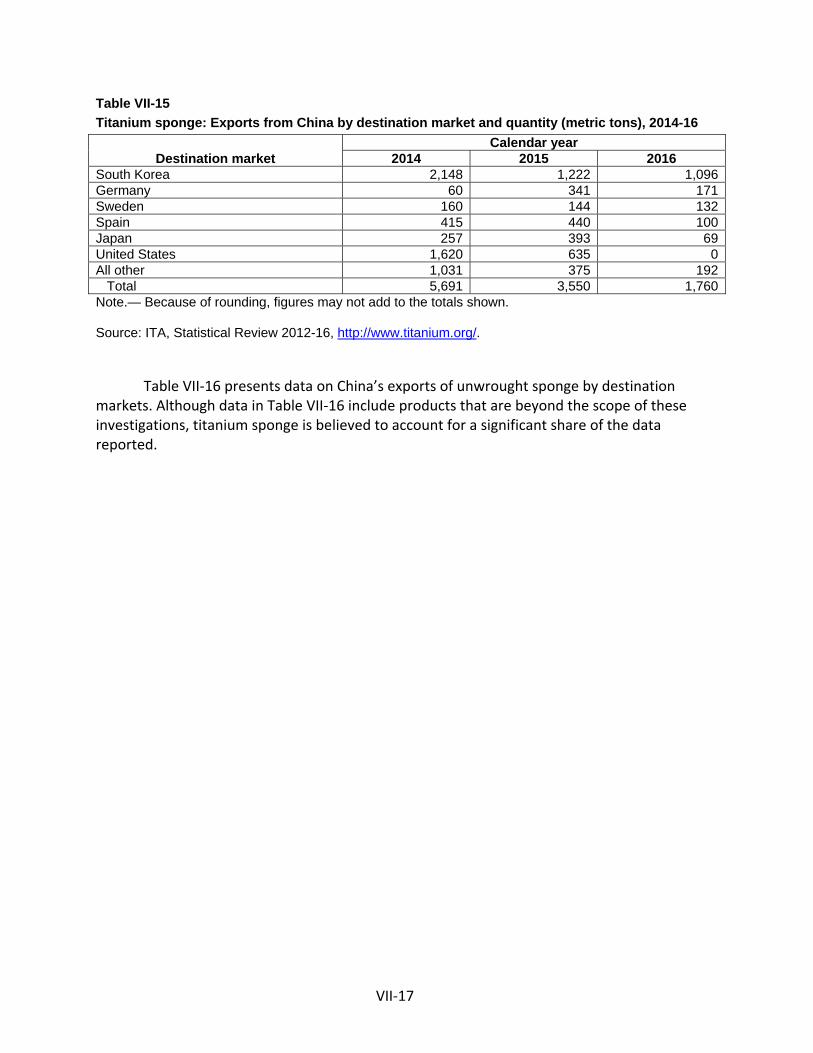
VII‐17
Table VII-15 Titanium sponge: Exports from China by destination market and quantity (metric tons), 2014-16
Destination market Calendar year
2014 2015 2016 South Korea 2,148 1,222 1,096Germany 60 341 171Sweden 160 144 132Spain 415 440 100Japan 257 393 69United States 1,620 635 0All other 1,031 375 192 Total 5,691 3,550 1,760Note.— Because of rounding, figures may not add to the totals shown. Source: ITA, Statistical Review 2012-16, http://www.titanium.org/.
Table VII‐16 presents data on China’s exports of unwrought sponge by destination markets. Although data in Table VII‐16 include products that are beyond the scope of these investigations, titanium sponge is believed to account for a significant share of the data reported.

VII‐18
Table VII-16 Unwrought titanium: China exports by destination market, 2014-16
Destination market Calendar year
2014 2015 2016 Quantity (metric tons) United States 1,720 760 100 Japan 325 399 117 Kazakhstan --- 2 --- All other major reporting exporters.-- Korea 2,213 1,234 1,102
Germany 301 360 208 Sweden 160 144 132 Spain 415 440 100 Hong Kong 0 76 81 United Kingdom 162 67 62 Netherlands 228 27 44 Taiwan 393 201 42 Italy 16 17 26 Belgium 270 58 10 All other exporters 27 132 27
Total global exports 6,231 3,917 2,051 Value (1,000 dollars) United States 13,590 6,644 1,879 Japan 2,761 3,139 964 Kazakhstan --- 0 --- All other major reporting exporters.-- Korea 13,174 6,378 4,352
Germany 2,315 2,329 1,511 Sweden 1,296 1,038 866 Spain 2,163 2,491 469 Hong Kong 0 798 275 United Kingdom 2,370 875 668 Netherlands 1,633 267 275 Taiwan 2,340 1,297 213 Italy 161 163 275 Belgium 1,997 727 242 All other exporters 427 1,073 386
Total global exports 44,227 27,221 12,376 Table continued on next page.

VII‐19
Table VII-16--Continued. Unwrought titanium: China exports by destination market, 2014-16
Destination market Calendar year
2014 2015 2016 Unit value (dollars per metric ton) United States 7,899 8,737 18,766 Japan 8,497 7,875 8,244 Kazakhstan --- 190 --- All other major reporting exporters.-- Korea 5,953 5,169 3,948
Germany 7,692 6,474 7,259 Sweden 8,102 7,208 6,563 Spain 5,213 5,662 4,694 Hong Kong 32,333 10,536 3,393 United Kingdom 14,620 13,041 10,729 Netherlands 7,161 9,873 6,295 Taiwan 5,947 6,448 5,073 Italy 9,856 9,597 10,517 Belgium 7,393 12,528 23,469 All other exporters 15,898 8,119 14,512
Total global exports 7,098 6,949 6,033 Share of quantity (percent) United States 27.6 19.4 4.9 Japan 5.2 10.2 5.7 Kazakhstan --- 0.1 --- All other major reporting exporters.-- Korea 35.5 31.5 53.7
Germany 4.8 9.2 10.1 Sweden 2.6 3.7 6.4 Spain 6.7 11.2 4.9 Hong Kong 0.0 1.9 3.9 United Kingdom 2.6 1.7 3.0 Netherlands 3.7 0.7 2.1 Taiwan 6.3 5.1 2.1 Italy 0.3 0.4 1.3 Belgium 4.3 1.5 0.5 All other exporters 0.4 3.4 1.3
Total global exports 100.0 100.0 100.0 Note.-- Data extracted using HS subheading 810820 which includes out-of-scope data. Note.--Shares and ratios shown as "0.0" represent values greater than zero, but less than "0.05" percent. Source: Official exports statistics under HS subheading 8108.20 as reported by China Customs in the IHS/GTA database, accessed September 28, 2017.
VII‐20
The Industry in Russia
VSMPO‐AVISMA is Russia’s and the world’s largest manufacturer of titanium products and has integrated operations ranging from raw‐material processing to finished machined products. VSMPO is certified to produce a variety of titanium‐based aerospace products by companies such as Airbus, Boeing, Pratt & Whitney, Rolls‐Royce, and Snecma, among others.22 VSMPO operates a joint venture with ATI called Uniti LLC that produces industrial titanium products for chemical and petroleum processing, desalination, power generation, and other industrial end uses. This joint venture does not produce titanium sponge or titanium products for the commercial aerospace, military, or medical industries.23
Russia’s exports of unwrought titanium during the POI are presented in table VII‐17. During 2014 to 2016, Russia’s exports decreased by 8.0 percent. Although data in Table VII‐17 include products that are beyond the scope of these investigations, titanium sponge is believed to account for a significant share of the data reported. In 2016, the Netherlands, Estonia, and Germany were the three largest export markets for Russia’s exports of unwrought titanium, accounting for 35.4 percent, 35.3 percent, and 10.9 percent of Russia’s exports in 2016, respectively. The United States was also a major export destination for exports of unwrought titanium products from Russia, accounting for 10.6 percent of exports in 2016.
22 VSMPO – AVISMA, “DB Certificate,” http://www.vsmpo.ru/en/pages/Organizacyi, (accessed September 18, 2017).
23 VSMPO – AVISMA, “UNITI,” http://www.vsmpo.ru/en/pages/UNITI, (accessed September 18, 2017).

VII‐21
Table VII-17 Unwrought titanium: Russia exports by destination market, 2014-16
Destination market Calendar year
2014 2015 2016 Quantity (metric tons) United States 2,478 1,687 904 Japan 414 0 270 Kazakhstan 6 9 5 All other major reporting exporters.-- Netherlands 2,841 2,198 3,028
Estonia 1,780 3,287 3,019 Germany 609 610 930 Italy 131 113 156 Romania 28 --- 90 France 137 72 77 Spain --- 18 40 Sweden --- --- 18 Brazil --- --- 12 Belarus 2 1 1 All other exporters 871 50 0
Total global exports 9,298 8,045 8,550 Value (1,000 dollars) United States 37,396 25,484 15,829 Japan 3,356 3 1,502 Kazakhstan 94 155 38 All other major reporting exporters.-- Netherlands 14,412 9,107 9,126
Estonia 7,476 12,716 8,252 Germany 5,562 4,670 6,126 Italy 1,226 906 1,958 Romania 465 --- 503 France 2,284 1,133 1,245 Spain --- 96 196 Sweden --- --- 125 Brazil --- --- 199 Belarus 36 26 24 All other exporters 7,022 786 183
Total global exports 79,328 55,082 45,303 Table continued on next page.

VII‐22
Table VII-17--Continued. Unwrought titanium: Russia exports by destination market, 2014-16
Destination market Calendar year
2014 2015 2016 Unit value (dollars per metric ton) United States 15,090 15,109 17,514 Japan 8,107 11,280 5,561 Kazakhstan 15,976 16,557 7,516 All other major reporting exporters.-- Netherlands 5,073 4,144 3,014
Estonia 4,199 3,869 2,733 Germany 9,127 7,652 6,586 Italy 9,389 7,990 12,549 Romania 16,705 --- 5,591 France 16,640 15,782 16,156 Spain --- 5,333 4,894 Sweden --- --- 6,921 Brazil --- --- 16,070 Belarus 22,395 21,774 28,239 All other exporters 8,059 15,777 ---
Total global exports 8,532 6,847 5,298 Share of quantity (percent) United States 26.7 21.0 10.6 Japan 4.5 0.0 3.2 Kazakhstan 0.1 0.1 0.1 All other major reporting exporters.-- Netherlands 30.6 27.3 35.4
Estonia 19.1 40.9 35.3 Germany 6.6 7.6 10.9 Italy 1.4 1.4 1.8 Romania 0.3 --- 1.1 France 1.5 0.9 0.9 Spain --- 0.2 0.5 Sweden --- --- 0.2 Brazil --- --- 0.1 Belarus 0.0 0.0 0.0 All other exporters 9.4 0.6 0.0
Total global exports 100.0 100.0 100.0 Note.-- Data extracted using HS subheading 810820 which includes out-of-scope data. Note.--Shares and ratios shown as "0.0" represent values greater than zero, but less than "0.05" percent. Source: Official exports statistics under HS subheading 8108.20 as reported by Customs Committee of Russia in the IHS/GTA database, accessed September 28, 2017.

VII‐23
The Industry in Ukraine
State‐owned Zaporozhye Titanium and Magnesium Combine (ZTMC) is the sole producer of titanium sponge in Ukraine. According to its website, ZTMC operates on a quality management system in accordance with International Organization for Standardization’s ISO 9001 standard.24 ZTMC produces titanium sponge, slag, titanium tetrachloride, ingots, and various mill products.25 In September 2016, the Government of Ukraine announced that it would privatize ZTMC and seek buyers for 51 percent of its stake in the company.26 ZTMC has received certification to supply titanium sponge to Baoji Titanium Industry Co. Ltd (Baoti), the largest producer of aerospace products in China.27 The petitioner stated that Ukraine does not have the quality control systems in place to supply premium‐quality titanium sponge and that the sponge produced in Ukraine is inferior and cannot be used for applications in the United States.28
Data on Ukraine’s exports of unwrought titanium during the POI are presented in table VII‐18. During 2014‐16, Ukraine’s exports decreased by 38.4 percent. Although data in Table VII‐18 include products that are beyond the scope of these investigations, titanium sponge is believed to account for a significant share of the data reported. China, Germany, and the Netherlands were the largest export destinations for unwrought titanium from Ukraine and accounted for 49.1 percent, 8.4 percent, and 7.5 percent of Ukraine’s exports in 2016, respectively. Ukraine’s exports to China increased more than its exports to any other country during the POI, which could be attributed to ZTMC receiving certification to sell titanium sponge to China’s Baoti.
24 ZTMC, “Certificates” http://ztmc.zp.ua/en/quality/certificates, (accessed September 15, 2017). 25 ZTMC, “Products: Titanium Sponge,” http://ztmc.zp.ua/en/products/titanium‐sponge, (accessed
September 15, 2017). 26 Bloomberg, “Company Overview of RE Zaporozhye Titanium & Magnesium Combine,” September
15, 2017, https://www.bloomberg.com/research/stocks/private/snapshot.asp?privcapid=49161736. 27 Adelis Trade, “ZTMC received the right to supply titanium sponge to the largest Chinese
manufacturer of aerospace products – the Baoji Company,” September 29, 2017), http://adelistrade.eu/2016/09/29/ztmc‐received‐the‐right‐to‐supply‐titanium‐sponge‐to‐the‐largest‐chinese‐manufacturer‐of‐aerospace‐products‐the‐baoji‐company/, (accessed September 18, 2017).
28 Conference transcript, p. 68 (Seiner) and p. 194 (Horgan).

VII‐24
Table VII-18 Unwrought titanium: Exports from Ukraine by destination market, 2014-16
Destination market Calendar year
2014 2015 2016 Quantity (metric tons) United States 1,656 720 234 Japan 720 980 227 Kazakhstan --- --- --- All other major reporting exporters.-- China 10 300 2,419
Germany 950 606 412 Netherlands 707 450 370 Italy 179 416 347 France 247 217 246 Romania 25 136 199 Russia 1,829 195 128 Spain 153 230 110 India 60 50 100 Korea 150 710 62 All other exporters 1,315 1,339 74
Total global exports 8,002 6,349 4,929 Value (1,000 dollars) United States 13,204 5,556 1,337 Japan 5,634 6,423 1,294 Kazakhstan --- --- --- All other major reporting exporters.-- China 80 1,757 12,261
Germany 7,604 3,669 2,188 Netherlands 4,931 2,782 1,993 Italy 1,529 2,894 2,155 France 1,734 1,366 1,332 Romania 209 1,007 1,199 Russia 16,095 1,334 719 Spain 1,012 1,407 534 India 400 319 478 Korea 1,265 4,260 368 All other exporters 9,742 9,739 275
Total global exports 63,440 42,513 26,132 Table continued on next page.
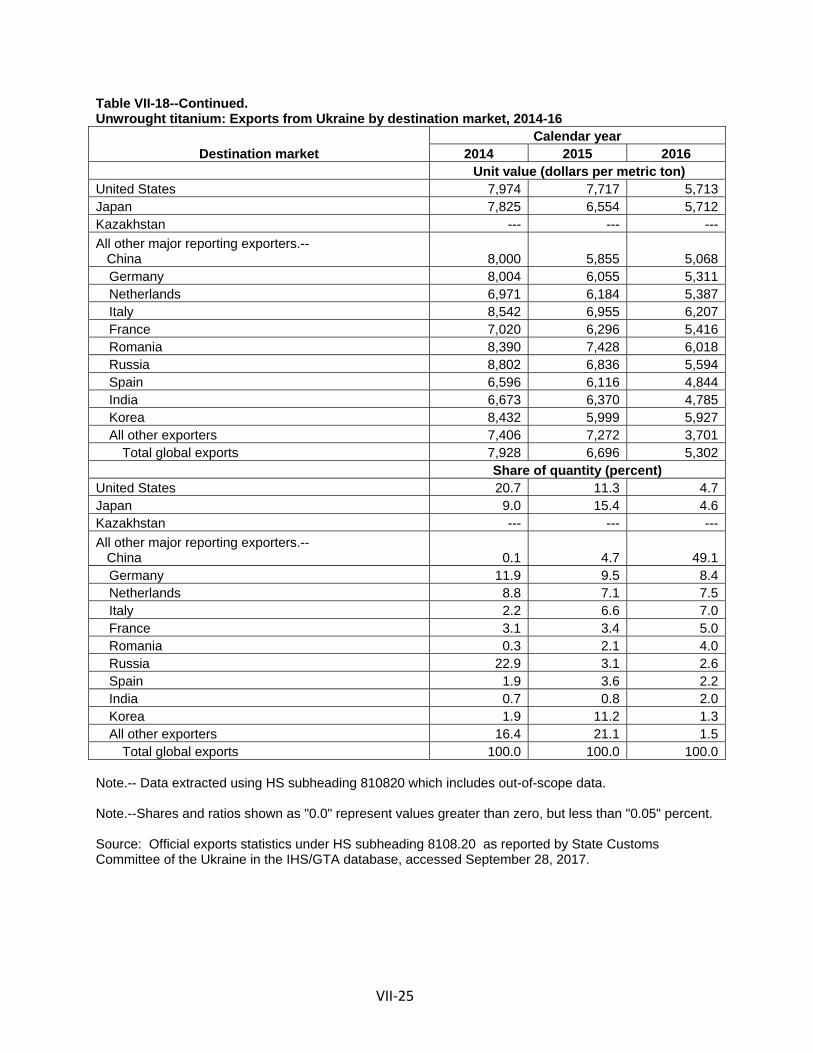
VII‐25
Table VII-18--Continued. Unwrought titanium: Exports from Ukraine by destination market, 2014-16
Destination market Calendar year
2014 2015 2016 Unit value (dollars per metric ton) United States 7,974 7,717 5,713 Japan 7,825 6,554 5,712 Kazakhstan --- --- --- All other major reporting exporters.-- China 8,000 5,855 5,068
Germany 8,004 6,055 5,311 Netherlands 6,971 6,184 5,387 Italy 8,542 6,955 6,207 France 7,020 6,296 5,416 Romania 8,390 7,428 6,018 Russia 8,802 6,836 5,594 Spain 6,596 6,116 4,844 India 6,673 6,370 4,785 Korea 8,432 5,999 5,927 All other exporters 7,406 7,272 3,701
Total global exports 7,928 6,696 5,302 Share of quantity (percent) United States 20.7 11.3 4.7 Japan 9.0 15.4 4.6 Kazakhstan --- --- --- All other major reporting exporters.-- China 0.1 4.7 49.1
Germany 11.9 9.5 8.4 Netherlands 8.8 7.1 7.5 Italy 2.2 6.6 7.0 France 3.1 3.4 5.0 Romania 0.3 2.1 4.0 Russia 22.9 3.1 2.6 Spain 1.9 3.6 2.2 India 0.7 0.8 2.0 Korea 1.9 11.2 1.3 All other exporters 16.4 21.1 1.5
Total global exports 100.0 100.0 100.0 Note.-- Data extracted using HS subheading 810820 which includes out-of-scope data. Note.--Shares and ratios shown as "0.0" represent values greater than zero, but less than "0.05" percent. Source: Official exports statistics under HS subheading 8108.20 as reported by State Customs Committee of the Ukraine in the IHS/GTA database, accessed September 28, 2017.

VII‐26
Global production capacity
Table VII‐19 presents global titanium sponge production capacity by country. During 2012‐16, U.S. titanium sponge production capacity remained stable while global capacity increased 3.9 percent between 2012 and 2013, and then declined 10.1 percent from 2013‐16. Japan’s production capacity declined 5.2 percent between 2012 and 2014, and remained stable during 2014‐16. Kazakhstan’s and Russia’s production capacity also remained stable during 2012‐16, while Ukraine’s production capacity increased by 16.5 percent during 2012‐15, and then remained stable from 2015 to 2016. During 2012‐16, production capacity was higher in China than in any other country. However, after increasing by 8.9 percent during 2012‐14, China’s titanium sponge production capacity declined by 21.4 percent during 2014‐16.
Table VII-19 Titanium sponge: Global production capacity, by quantity (metric tons), 2012-16
Item Calendar year 2012 2013 2014 2015 2016 United States 24,000 24,000 24,000 24,000 24,000 Japan 68,800 68,800 65,200 65,200 65,200 China 128,500 140,000 140,000 118,000 110,000 India 0 500 500 500 500 Kazakhstan 26,000 26,000 26,000 26,000 26,000 Russia 46,500 46,500 46,500 46,500 46,500 Ukraine 10,300 10,300 10,300 12,000 12,000 Rest of world total 211,300 223,300 223,300 203,000 195,000 World total 304,100 316,100 312,500 292,200 284,200 Note. — Because of rounding, figures may not add to the totals shown. Source: ITA, Statistical Review 2012-16, http://www.titanium.org/.

VII‐27
Global production
Table VII‐20 presents titanium sponge production for Japan, Russia, Kazakhstan, and Ukraine. Of the four countries for which public data are available, Japan is the only one whose industry recorded an increase in titanium sponge production over the POI, by 76.6 percent. Production in Russia increased by 0.9 percent from 2014 to 2015, and then declined by 5.3 percent from 2015 to 2016. Ukraine’s titanium sponge production increased by 6.7 percent from 2014 to 2015, and then declined by 35.2 percent from 2015 to 2016. Kazakhstan’s production decreased by 14.4 percent during 2014 to 2016 period. Table VII-20 Titanium sponge: Production data for Japan, Russia, Kazakhstan, and Ukraine, by quantity (metric tons), 2014-16
Country Calendar year
2014 2015 2016 Japan 30,919 41,885 54,594Russia 40,697 41,070 38,910Kazakhstan 9,000 8,700 7,700Ukraine 7,215 7,700 4,990Note.— Production data for China and the United States are not available. Source: ITA, Statistical Review 2012-16, http://www.titanium.org/.


A‐1
APPENDIX A
FEDERAL REGISTER NOTICES


A‐3
The Commission makes available notices relevant to its investigations and reviews on its website, www.usitc.gov. In addition, the following tabulation presents, in chronological order, Federal Register notices issued by the Commission and Commerce during the current proceeding.
Citation Title Link
82 FR 41656, September 1, 2017
Titanium Sponge From Japan and Kazakhstan; Institution of Antidumping and Countervailing Duty Investigations and Scheduling of Preliminary Phase Investigations
https://www.gpo.gov/fdsys/pkg/FR‐2017‐09‐01/pdf/2017‐18608.pdf
82 FR 43936, September 20, 2017
Titanium Sponge From Kazakhstan: Initiation of Countervailing Duty Investigation
https://www.gpo.gov/fdsys/pkg/FR‐2017‐09‐20/pdf/2017‐20029.pdf
82 FR 43939, September 20, 2017
Titanium Sponge From Japan and Kazakhstan: Initiation of Less‐Than‐Fair‐Value Investigations
https://www.gpo.gov/fdsys/pkg/FR‐2017‐09‐20/pdf/2017‐20028.pdf

B‐1
APPENDIX B
CALENDAR OF THE PUBLIC STAFF CONFERENCE


B‐3
CALENDAR OF PUBLIC PRELIMINARY CONFERENCE
Those listed below appeared as witnesses at the United States International Trade Commission’s preliminary conference:
Subject: Titanium Sponge from Japan and Kazakhstan
Inv. Nos.: 701-TA-587 and 731-TA-1385-1386 (Preliminary)
Date and Time: September 14, 2017 - 9:30 a.m.
Sessions were held in connection with these preliminary phase investigations in the Main
Hearing Room (Room 101), 500 E Street, S.W., Washington, DC.
OPENING REMARKS: Petitioners (J. Kevin Horgan, DeKieffer & Horgan, PLLC) Respondents (Kathleen Cannon, Kelley Drye & Warren LLP)
In Support of the Imposition of
Antidumping and Countervailing Duty Orders: DeKieffer & Horgan, PLLC Washington, DC on behalf of Titanium Metals Corporation (“TIMET”) Henry Seiner, Titanium Metals Corporation, Vice President of Business Strategy, TIMET Roy Houseman, Legislative Representative, United Steel Workers J. Kevin Horgan ) ) – OF COUNSEL Alexandra H. Salzman )

B‐4
In Opposition to the Imposition of Antidumping and Countervailing Duty Orders:
Kelley Drye & Warren LLP Washington, DC on behalf of Allegheny Technologies Incorporated John Sims, Executive Vice President, High Performance & Components, Allegheny Technologies Incorporated
Brad Forsythe, Vice President, Supply Chain, Allegheny Technologies Incorporated
Michael Kerwin, Director, Georgetown Economic Services
Kathleen Cannon ) ) – OF COUNSEL Laurence Lasoff ) Sidley Austin LLP Washington, DC on behalf of OSAKA Titanium technologies Co., Ltd. (“OTC”) Masayuki Tsuji, Executive Officer, OSAKA Titanium technologies Co., Ltd. Kiyoaki Sando, Sales and Marketing Department, OSAKA Titanium
technologies Co., Ltd.
Shinya Kuriyama, Assistant Manager, High Performance Materials Team, Specialty Steel Flat Rolled Products Business Department, Sumitomo
Corporation Global Metals Co., Ltd.
Akira Kudo, Product Manager, Light Metals and Specialty Steel Sheet Unit, Steel and Non-Ferrous Metal Group, Sumitomo Corporation of Americas
Richard L.A. Weiner )
Neil R. Ellis ) – OF COUNSEL Brenda A. Jacobs )

B‐5
In Opposition to the Imposition of Antidumping and Countervailing Duty Orders (continued):
Adduci Mastriani & Schaumberg LLP Washington, DC on behalf of The Perryman Company Frank Perryman, President and Chief Executive Officer,
The Perryman Company
Irvin Brown, Director of Commercial Operations, The Perryman Company
Deanna Tanner Okun ) ) – OF COUNSEL Elizabeth Regard ) Squires Patton Boggs (US) LLP Washington, DC on behalf of Ust-Kamenogorsk Titanium and Magnesium Plant JSC (“UKTMP”)
Ritchie T. Thomas )
) – OF COUNSEL Iain R. McPhie ) Crowell & Moring LLP Washington, DC on behalf of RMI Titanium Company Inc. Jeremy Halford, President, RMI Titanium Company Inc.
Alexander H. Schaefer ) – OF COUNSEL REBUTTAL/CLOSING REMARKS: Petitioner (J. Kevin Horgan, DeKieffer & Horgan, PLLC) Respondents (Deanna Tanner Okun, Adduci Mastriani & Schaumberg LLP)
-END-


C‐1
APPENDIX C
SUMMARY DATA

Table C‐1: Titanium sponge: Summary data concerning the total U.S. market ......................... C‐3
Table C‐2: Titanium sponge: Summary data excluding the U.S. producer *** .......................... C‐4

Table C-1Titanium sponge: Summary data concerning the U.S. market, 2014-16, January to June 2016, and January to June 2017
Jan-Jun2014 2015 2016 2016 2017 2014-16 2014-15 2015-16 2016-17
U.S. consumption quantity:Amount......................................................................... *** *** *** *** *** *** *** *** ***Producers' share (fn1).................................................. *** *** *** *** *** *** *** *** ***Importers' share (fn1):
Japan........................................................................ *** *** *** *** *** *** *** *** ***Kazakhstan............................................................... *** *** *** *** *** *** *** *** ***
Subject sources...................................................... *** *** *** *** *** *** *** *** ***Nonsubject sources................................................ *** *** *** *** *** *** *** *** ***
All import sources................................................ *** *** *** *** *** *** *** *** ***
U.S. consumption value:Amount......................................................................... *** *** *** *** *** *** *** *** ***Producers' share (fn1).................................................. *** *** *** *** *** *** *** *** ***Importers' share (fn1):
Japan........................................................................ *** *** *** *** *** *** *** *** ***Kazakhstan............................................................... *** *** *** *** *** *** *** *** ***
Subject sources...................................................... *** *** *** *** *** *** *** *** ***Nonsubject sources................................................ *** *** *** *** *** *** *** *** ***
All import sources................................................ *** *** *** *** *** *** *** *** ***
U.S. importers' U.S. shipments of imports from:Japan:
Quantity..................................................................... *** *** *** *** *** *** *** *** ***Value......................................................................... *** *** *** *** *** *** *** *** ***Unit value.................................................................. *** *** *** *** *** *** *** *** ***Ending inventory quantity.......................................... *** *** *** *** *** *** *** *** ***
Kazakhstan:Quantity..................................................................... *** *** *** *** *** *** *** *** ***Value......................................................................... *** *** *** *** *** *** *** *** ***Unit value.................................................................. *** *** *** *** *** *** *** *** ***Ending inventory quantity.......................................... *** *** *** *** *** *** *** *** ***
Subject sources:Quantity..................................................................... 15,812 13,800 15,436 7,377 12,420 (2.4) (12.7) 11.9 68.4Value......................................................................... 217,841 171,024 173,099 81,801 133,267 (20.5) (21.5) 1.2 62.9Unit value.................................................................. $13,777 $12,393 $11,214 $11,089 $10,730 (18.6) (10.0) (9.5) (3.2)Ending inventory quantity.......................................... *** *** *** *** *** *** *** *** ***
Nonsubject sources:Quantity..................................................................... *** *** *** *** *** *** *** *** ***Value......................................................................... *** *** *** *** *** *** *** *** ***Unit value.................................................................. *** *** *** *** *** *** *** *** ***Ending inventory quantity.......................................... *** *** *** *** *** *** *** *** ***
All import sources:Quantity..................................................................... *** *** *** *** *** *** *** *** ***Value......................................................................... *** *** *** *** *** *** *** *** ***Unit value.................................................................. *** *** *** *** *** *** *** *** ***Ending inventory quantity.......................................... *** *** *** *** *** *** *** *** ***
U.S. producers':Average capacity quantity............................................ *** *** *** *** *** *** *** *** ***Production quantity...................................................... *** *** *** *** *** *** *** *** ***Capacity utilization (fn1)............................................... *** *** *** *** *** *** *** *** ***U.S. shipments:
Quantity..................................................................... *** *** *** *** *** *** *** *** ***Value......................................................................... *** *** *** *** *** *** *** *** ***Unit value.................................................................. *** *** *** *** *** *** *** *** ***
Export shipments:Quantity..................................................................... *** *** *** *** *** *** *** *** ***Value......................................................................... *** *** *** *** *** *** *** *** ***Unit value.................................................................. *** *** *** *** *** *** *** *** ***
Ending inventory quantity............................................. *** *** *** *** *** *** *** *** ***Inventories/total shipments (fn1).................................. *** *** *** *** *** *** *** *** ***Production workers....................................................... *** *** *** *** *** *** *** *** ***Hours worked (1,000s)................................................. *** *** *** *** *** *** *** *** ***Wages paid ($1,000).................................................... *** *** *** *** *** *** *** *** ***Hourly wages (dollars).................................................. *** *** *** *** *** *** *** *** ***Productivity (metric tons per 1,000 hours)................... *** *** *** *** *** *** *** *** ***Unit labor costs (dollars per metric ton)....................... *** *** *** *** *** *** *** *** ***Net sales:
Quantity..................................................................... *** *** *** *** *** *** *** *** ***Value......................................................................... *** *** *** *** *** *** *** *** ***Unit value.................................................................. *** *** *** *** *** *** *** *** ***
Cost of goods sold (COGS)......................................... *** *** *** *** *** *** *** *** ***Gross profit or (loss)..................................................... *** *** *** *** *** *** *** *** ***SG&A expenses........................................................... *** *** *** *** *** *** *** *** ***Operating income or (loss)........................................... *** *** *** *** *** *** *** *** ***Net income or (loss)..................................................... *** *** *** *** *** *** *** *** ***Capital expenditures.................................................... *** *** *** *** *** *** *** *** ***Unit COGS................................................................... *** *** *** *** *** *** *** *** ***Unit SG&A expenses................................................... *** *** *** *** *** *** *** *** ***Unit operating income or (loss).................................... *** *** *** *** *** *** *** *** ***Unit net income or (loss).............................................. *** *** *** *** *** *** *** *** ***COGS/sales (fn1)......................................................... *** *** *** *** *** *** *** *** ***Operating income or (loss)/sales (fn1)......................... *** *** *** *** *** *** *** *** ***Net income or (loss)/sales (fn1)................................... *** *** *** *** *** *** *** *** ***
Notes:
fn1.--Reported data are in percent and period changes are in percentage points.fn2.--Undefined.
Source: Compiled from data submitted in response to Commission questionnaires.
(Quantity=metric tons; Value=1,000 dollars; Unit values, unit labor costs, and unit expenses=dollars per metric ton; Period changes=percent--exceptions noted)
C-3
Period changesCalendar year Calendar year
Reported dataJanuary to June
All producers

Table C-2Titanium sponge: Summary data concerning the U.S. market excluding one U.S. producer ***, 2014-16, January to June 2016, and January to June 2017
Jan-Jun2014 2015 2016 2016 2017 2014-16 2014-15 2015-16 2016-17
U.S. consumption quantity:Amount......................................................................... *** *** *** *** *** *** *** *** ***Producers' share (fn1):
Included firms............................................................ *** *** *** *** *** *** *** *** ***Excluded firms.......................................................... *** *** *** *** *** *** *** *** ***
All U.S. producers.................................................. *** *** *** *** *** *** *** *** ***Importers' share (fn1):
Japan........................................................................ *** *** *** *** *** *** *** *** ***Kazakhstan............................................................... *** *** *** *** *** *** *** *** ***
Subject sources...................................................... *** *** *** *** *** *** *** *** ***Nonsubject sources................................................ *** *** *** *** *** *** *** *** ***
All import sources................................................ *** *** *** *** *** *** *** *** ***U.S. consumption value:
Amount......................................................................... *** *** *** *** *** *** *** *** ***Producers' share (fn1):
Included firms............................................................ *** *** *** *** *** *** *** *** ***Excluded firms.......................................................... *** *** *** *** *** *** *** *** ***
All U.S. producers.................................................. *** *** *** *** *** *** *** *** ***Importers' share (fn1):
Japan........................................................................ *** *** *** *** *** *** *** *** ***Kazakhstan............................................................... *** *** *** *** *** *** *** *** ***
Subject sources...................................................... *** *** *** *** *** *** *** *** ***Nonsubject sources................................................ *** *** *** *** *** *** *** *** ***
All import sources................................................ *** *** *** *** *** *** *** *** ***U.S. importers' U.S. shipments of imports from:
Japan:Quantity..................................................................... *** *** *** *** *** *** *** *** ***Value......................................................................... *** *** *** *** *** *** *** *** ***Unit value.................................................................. *** *** *** *** *** *** *** *** ***Ending inventory quantity.......................................... *** *** *** *** *** *** *** *** ***
Kazakhstan:Quantity..................................................................... *** *** *** *** *** *** *** *** ***Value......................................................................... *** *** *** *** *** *** *** *** ***Unit value.................................................................. *** *** *** *** *** *** *** *** ***Ending inventory quantity.......................................... *** *** *** *** *** *** *** *** ***
Subject sources:Quantity..................................................................... 15,812 13,800 15,436 7,377 12,420 (2.4) (12.7) 11.9 68.4Value......................................................................... 217,841 171,024 173,099 81,801 133,267 (20.5) (21.5) 1.2 62.9Unit value.................................................................. $13,777 $12,393 $11,214 $11,089 $10,730 (18.6) (10.0) (9.5) (3.2)Ending inventory quantity.......................................... *** *** *** *** *** *** *** *** ***
Nonsubject sources:Quantity..................................................................... *** *** *** *** *** *** *** *** ***Value......................................................................... *** *** *** *** *** *** *** *** ***Unit value.................................................................. *** *** *** *** *** *** *** *** ***Ending inventory quantity.......................................... *** *** *** *** *** *** *** *** ***
All import sources:Quantity..................................................................... *** *** *** *** *** *** *** *** ***Value......................................................................... *** *** *** *** *** *** *** *** ***Unit value.................................................................. *** *** *** *** *** *** *** *** ***Ending inventory quantity.......................................... *** *** *** *** *** *** *** *** ***
Included U.S. producers':Average capacity quantity............................................ *** *** *** *** *** *** *** *** ***Production quantity...................................................... *** *** *** *** *** *** *** *** ***Capacity utilization (fn1)............................................... *** *** *** *** *** *** *** *** ***U.S. shipments:
Quantity..................................................................... *** *** *** *** *** *** *** *** ***Value......................................................................... *** *** *** *** *** *** *** *** ***Unit value.................................................................. *** *** *** *** *** *** *** *** ***
Export shipments:Quantity..................................................................... *** *** *** *** *** *** *** *** ***Value......................................................................... *** *** *** *** *** *** *** *** ***Unit value.................................................................. *** *** *** *** *** *** *** *** ***
Ending inventory quantity............................................. *** *** *** *** *** *** *** *** ***Inventories/total shipments (fn1).................................. *** *** *** *** *** *** *** *** ***Production workers....................................................... *** *** *** *** *** *** *** *** ***Hours worked (1,000s)................................................. *** *** *** *** *** *** *** *** ***Wages paid ($1,000).................................................... *** *** *** *** *** *** *** *** ***Hourly wages (dollars).................................................. *** *** *** *** *** *** *** *** ***Productivity (metric tons per 1,000 hours)................... *** *** *** *** *** *** *** *** ***Unit labor costs (dollars per metric ton)....................... *** *** *** *** *** *** *** *** ***Net sales:
Quantity..................................................................... *** *** *** *** *** *** *** *** ***Value......................................................................... *** *** *** *** *** *** *** *** ***Unit value.................................................................. *** *** *** *** *** *** *** *** ***
Cost of goods sold (COGS)......................................... *** *** *** *** *** *** *** *** ***Gross profit or (loss)..................................................... *** *** *** *** *** *** *** *** ***SG&A expenses........................................................... *** *** *** *** *** *** *** *** ***Operating income or (loss)........................................... *** *** *** *** *** *** *** *** ***Net income or (loss)..................................................... *** *** *** *** *** *** *** *** ***Capital expenditures.................................................... *** *** *** *** *** *** *** *** ***Unit COGS................................................................... *** *** *** *** *** *** *** *** ***Unit SG&A expenses................................................... *** *** *** *** *** *** *** *** ***Unit operating income or (loss).................................... *** *** *** *** *** *** *** *** ***Unit net income or (loss).............................................. *** *** *** *** *** *** *** *** ***COGS/sales (fn1)......................................................... *** *** *** *** *** *** *** *** ***Operating income or (loss)/sales (fn1)......................... *** *** *** *** *** *** *** *** ***Net income or (loss)/sales (fn1)................................... *** *** *** *** *** *** *** *** ***
Notes:fn1.--Reported data are in percent and period changes are in percentage points.fn2.--Undefined.
Source: Compiled from data submitted in response to Commission questionnaires.
C-4
(Quantity=metric tons; Value=1,000 dollars; Unit values, unit labor costs, and unit expenses=dollars per metric ton; Period changes=percent--exceptions noted)
Reported data Period changesCalendar year January to June Calendar year
Related party exclusion