Embed Size (px)
Citation preview


TITANIUM DIOXIDE LISTING BACKGROUNDDOCUMENT
FOR THE INORGANIC CHEMICAL LISTINGDETERMINATION
August 2000
U.S. ENVIRONMENTAL PROTECTION AGENCY1200 PENNSYLVANIA AVENUE, NW
WASHINGTON, D.C. 20460

i
TABLE OF CONTENTS
1. SECTOR OVERVIEW . . . . . . . . . . . . . . . . . . . . . . . . . . . . . . . . . . . . . . . . . . . . . . . . . . . . 11.1 SECTOR DEFINITION, FACILITY NAMES AND LOCATION . . . . . . . . . . . . 11.2 PRODUCTS, PRODUCT USAGE AND MARKETS . . . . . . . . . . . . . . . . . . . . . . 21.3 PRODUCTION CAPACITY . . . . . . . . . . . . . . . . . . . . . . . . . . . . . . . . . . . . . . . . . 41.4 PRODUCTION, PRODUCT AND PROCESS TRENDS . . . . . . . . . . . . . . . . . . . 4
2. DESCRIPTION OF MANUFACTURING PROCESSES . . . . . . . . . . . . . . . . . . . . . . . . . 62.1 PRODUCTION PROCESS DESCRIPTION . . . . . . . . . . . . . . . . . . . . . . . . . . . . . 62.2 PRODUCTION TRENDS, CHANGES AND IMPROVEMENTS . . . . . . . . . . . . 7
3. TITANIUM DIOXIDE WASTE CHARACTERIZATION, GENERATION,MANAGEMENT, SCREENING AND ASSESSMENT . . . . . . . . . . . . . . . . . . . . . . . . . . 93.1 CHARACTERIZATION OF TITANIUM DIOXIDE WASTES . . . . . . . . . . . . . . 123.2 EVALUATION OF TITANIUM DIOXIDE WASTE CATEGORIES . . . . . . . . . 13
3.2.1 Commingled Wastewaters from the Chloride Process, Including Wastewatersfrom Coke and Ore Recovery, Scrubber Water, Finishing Wastewaters andSludge Supernatants . . . . . . . . . . . . . . . . . . . . . . . . . . . . . . . . . . . . . . . . . . 13
3.2.2 Various Sands from Oxidation, Milling, and Scouring . . . . . . . . . . . . . . . . . 203.2.3 Gypsum from the Sulfate Process . . . . . . . . . . . . . . . . . . . . . . . . . . . . . . . . 243.2.4 Digestion Scrubber Water from the Sulfate Process . . . . . . . . . . . . . . . . . . 293.2.5 Sulfate Process Digestion Sludge . . . . . . . . . . . . . . . . . . . . . . . . . . . . . . . . 313.2.6 Commingled Wastewaters from the Chloride and Sulfate Process . . . . . . . . 353.2.7 Wastewater Treatment Sludges from Commingled Chloride and Sulfate
Process Wastewaters . . . . . . . . . . . . . . . . . . . . . . . . . . . . . . . . . . . . . . . . . 383.2.8 Waste Acid (Ferric Chloride) from the Chloride-Ilmenite Process . . . . . . . . 443.2.9 Non-Bevill-exempt Nonwastewaters from the Chloride-Ilmenite Process
. . . . . . . . . . . . . . . . . . . . . . . . . . . . . . . . . . . . . . . . . . . . . . . . . . . . . . . . . 523.2.10 HCl from Reaction Scrubber, Chloride-Ilmenite Process . . . . . . . . . . . . . . . 633.2.11 Commingled Wastewaters from Chloride-Ilmenite Process . . . . . . . . . . . . . 633.2.12 Aluminum-containing Additive Vent Filters Solids from Chloride-Ilmenite
Process . . . . . . . . . . . . . . . . . . . . . . . . . . . . . . . . . . . . . . . . . . . . . . . . . . . 683.2.13 Vanadium Sludge from Chloride-Ilmenite and Chloride Process . . . . . . . . . 683.2.14 Off-specification Titanium Dioxide Product . . . . . . . . . . . . . . . . . . . . . . . . . 693.2.15 Railcar/Trailer Product Washout . . . . . . . . . . . . . . . . . . . . . . . . . . . . . . . . . 70
3.3 OUT OF SCOPE WASTE . . . . . . . . . . . . . . . . . . . . . . . . . . . . . . . . . . . . . . . . . . 713.3.1 Bevill-exempt Wastes . . . . . . . . . . . . . . . . . . . . . . . . . . . . . . . . . . . . . . . . . 713.3.2 Debris and Non-Process Wastes . . . . . . . . . . . . . . . . . . . . . . . . . . . . . . . . 763.3.3 National Pollutant and Discharge System (NPDES) . . . . . . . . . . . . . . . . . . 76
3.3 FORMATION OF DIOXINS/FURANS IN CHLORINATOR . . . . . . . . . . . . . . 77
Appendix A: Summary of Analytical Data ResultsAppendix B: Split Sample Results

ii
Appendix C: Maps

iii
LIST OF TABLES
Table 1.1 - Titanium Dioxide Producers . . . . . . . . . . . . . . . . . . . . . . . . . . . . . . . . . . . . . . . . . . . . . . 1Table 1.2 - Titanium Dioxide Production Capacity . . . . . . . . . . . . . . . . . . . . . . . . . . . . . . . . . . . . . . 4Table 3.1 - Waste Reported by Titanium Dioxide Facilities Using the Chloride Process . . . . . . . . . . 10Table 3.2 - Waste Reported by Titanium Dioxide Facilities Using the Sulfate Process . . . . . . . . . . . 10Table 3.3 - Waste Reported by Titanium Dioxide Facilities Using the Chloride-Ilmenite Process
. . . . . . . . . . . . . . . . . . . . . . . . . . . . . . . . . . . . . . . . . . . . . . . . . . . . . . . . . . . . . . . . . . . . . 11Table 3.4 - Commingled Wastewaters from the Chloride Process . . . . . . . . . . . . . . . . . . . . . . . . . . 15Table 3.5 - Initial Screening Analysis for Commingled Wastewaters from Chloride Process . . . . . . 17Table 3.6 - Waste Management Practices and Volumes for Various Sands from Oxidation, Milling, and
Scouring . . . . . . . . . . . . . . . . . . . . . . . . . . . . . . . . . . . . . . . . . . . . . . . . . . . . . . . . . . . . . . 20Table 3.7 - Initial Screening Analysis for Milling Sand . . . . . . . . . . . . . . . . . . . . . . . . . . . . . . . . . . . 21Table 3.8 - Initial Screening Analysis for Scouring Sand . . . . . . . . . . . . . . . . . . . . . . . . . . . . . . . . . 23Table 3.9 - Waste Management Practices and Volumes for Gypsum from Sulfate Process . . . . . . . . 24Table 3.10 - Initial Screening Analysis for Primary and Secondary Gypsum . . . . . . . . . . . . . . . . . . . 26Table 3.11 - Waste Management Practices and Volumes for Digestion Scrubber Water from the
Sulfate Process . . . . . . . . . . . . . . . . . . . . . . . . . . . . . . . . . . . . . . . . . . . . . . . . . . . . . . . . . 30Table 3.12 - Initial Screening Analysis for Digestion Scrubber Water from the Sulfate Process
. . . . . . . . . . . . . . . . . . . . . . . . . . . . . . . . . . . . . . . . . . . . . . . . . . . . . . . . . . . . . . . . . . . . . 30Table 3.13 - Waste Management Practices and Volumes for Sulfate Process Digestion Sludge
. . . . . . . . . . . . . . . . . . . . . . . . . . . . . . . . . . . . . . . . . . . . . . . . . . . . . . . . . . . . . . . . . . . . . 32Table 3.14 - Initial Screening Analysis for Sulfate Process Digestion Sludge . . . . . . . . . . . . . . . . . . . 34Table 3.15 - Commingled Wastewaters from the Chloride and Sulfate Process . . . . . . . . . . . . . . . . 36Table 3.16 - Initial Screening Analysis for Commingled Wastewaters from the Chloride and Sulfate
Process . . . . . . . . . . . . . . . . . . . . . . . . . . . . . . . . . . . . . . . . . . . . . . . . . . . . . . . . . . . . . . . 37Table 3.17 - Estimation of Non-Exempt Solids Contribution to Wastewater Treatment Sludges from
Commingled Chloride and Sulfate Process Wastewaters at Millennium Baltimore. . . . . . . . . . . . . . . . . . . . . . . . . . . . . . . . . . . . . . . . . . . . . . . . . . . . . . . . . . . . . . . . . . . . . 39
Table 3.18 - Waste Management Practices and Volumes for Wastewater Treatment Sludges fromCommingled Chloride and Sulfate Process Wastewaters . . . . . . . . . . . . . . . . . . . . . . . . . . . 39
Table 3.19 - Initial Screening Analysis for Wastewater Treatment Sludges from Commingled Chlorideand Sulfate Process Wastewaters . . . . . . . . . . . . . . . . . . . . . . . . . . . . . . . . . . . . . . . . . . . . 42
Table 3.20 - Waste Management Practices and Volumes for Waste Acid (ferric chloride) from theChloride-Ilmenite Process . . . . . . . . . . . . . . . . . . . . . . . . . . . . . . . . . . . . . . . . . . . . . . . . . 45
Table 3.21 - Summary of Analytical Results for Waste Acid (ferric chloride) from the Chloride-IlmeniteProcess . . . . . . . . . . . . . . . . . . . . . . . . . . . . . . . . . . . . . . . . . . . . . . . . . . . . . . . . . . . . . . . 47
Table 3.22 - Summary of Analytical Results for Ferric Carbonate . . . . . . . . . . . . . . . . . . . . . . . . . . 50Table 3.23 - Estimation of Non-Bevill Exempt Solids Contribution to DuPont Edge Moor’s
Wastewater Treatment Solids . . . . . . . . . . . . . . . . . . . . . . . . . . . . . . . . . . . . . . . . . . . . . . . 53Table 3.24 - Estimate of Non-Bevill Exempt Solids Contribution to DuPont New Johnsonville’s
Wastewater Treatment Solids . . . . . . . . . . . . . . . . . . . . . . . . . . . . . . . . . . . . . . . . . . . . . . . 54Table 3.25 - Estimation of Non-Bevill Exempt Solids Contribution to DuPont DeLisle’s Wastewater
Treatment Solids . . . . . . . . . . . . . . . . . . . . . . . . . . . . . . . . . . . . . . . . . . . . . . . . . . . . . . . . 55

iv
Table 3.26 - Waste Management Practices and Volumes for Non-Bevill-exempt Nonwastewaters fromthe Chloride-Ilmenite Process . . . . . . . . . . . . . . . . . . . . . . . . . . . . . . . . . . . . . . . . . . . . . . . 56
Table 3.27 - Initial Screening Analysis for Non-Bevill-exempt Nonwastewaters from the Chloride-Ilmenite Process . . . . . . . . . . . . . . . . . . . . . . . . . . . . . . . . . . . . . . . . . . . . . . . . . . . . . . . . . 58
Table 3.28 - Comparison of Iron Rich® Total Analyses to Soil Screening Levels (SSL) . . . . . . . . . 61Table 3.29 - Volumes for Commingled Wastewaters from Chloride-Ilmenite Process . . . . . . . . . . . 64Table 3.30 - Initial Screening Analysis for Commingled Wastewaters from Chloride-Ilmenite Process66Table 3.31 - Volumes of Off-specification Titanium Dioxide Product . . . . . . . . . . . . . . . . . . . . . . . . 69Table 3.32 - Initial Screening Analysis for Off-specification Titanium Dioxide Product . . . . . . . . . . . 70Table 3.33 - Initial Screening Analysis for Railcar/Trailer Product Washout . . . . . . . . . . . . . . . . . . . 71Table 3.34 - Bevill-exempt-Waste Solids from Titanium Tetrachloride Production Via the Chloride
Process . . . . . . . . . . . . . . . . . . . . . . . . . . . . . . . . . . . . . . . . . . . . . . . . . . . . . . . . . . . . . . . 73Table 3.35 - Bevill-exempt Waste Solids from Titanium Tetrachloride Production via the Chloride-
Ilmenite Process . . . . . . . . . . . . . . . . . . . . . . . . . . . . . . . . . . . . . . . . . . . . . . . . . . . . . . . . 75Table 3.36 - Bevill-exempt Storage and Handling Wastes . . . . . . . . . . . . . . . . . . . . . . . . . . . . . . . . 75Table 3.37 - Debris and Non-Process Waste . . . . . . . . . . . . . . . . . . . . . . . . . . . . . . . . . . . . . . . . . 76Table 3.38 - Permitted NPDES Waste . . . . . . . . . . . . . . . . . . . . . . . . . . . . . . . . . . . . . . . . . . . . . 76
LIST OF FIGURES
Figure 1.1 - Geographical Distribution of Titanium Dioxide Producers . . . . . . . . . . . . . . . . . . . . . . . . 3Figure 2.1 - Process Flow Diagram for the Production of Titanium Dioxide . . . . . . . . . . . . . . . . . . . . 8

1Earlier this year, Kerr-McGee announced it will acquire Kemira's TiO2 facilities in Savannah, GA;ChemExpo; May 22, 2000.
Inorganic Listing Determination Titanium DioxideListing Background Document August, 20001
1. SECTOR OVERVIEW
1.1 SECTOR DEFINITION, FACILITY NAMES AND LOCATION
Titanium dioxide is produced in the United States by 9 manufacturers through the chloride, sulfate, orthe chloride-ilmenite processes (See Section 2). Cerac, Inc. located in Milwaukee, WI reportedproducing titanium dioxide but was not considered as part of this listing determination because thefacility is a specialty products manufacturer of many chemicals, including high purity titanium dioxide invery small amounts (16.2 kg./yr) for laboratories and the research community. Table 1.1 lists thenames and locations of the nine manufacturers and their respective type. Figure 1.1 shows thegeographical location of the facilities listed in Table 1.1.
Table 1.1 - Titanium Dioxide Producers
Facility Name Facility Location Production Process
1. Kemira Pigments, Inc.1 One Kemira RoadPO Box 368Savannah, GA 31402
Sulfate
Chloride
2. Millennium Inorganic Chemicals Inc.(formerly SCM)
3901 Fort Armistead RoadBaltimore, MD 21226
Sulfate
Chloride
3. Kerr-McGee Chemical Corp. 40034 Kerr-McGee RoadHamilton, MS 39746
Chloride
4. Kronos/Louisiana Pigment Co. 3300 Bayou Dinde RoadWest Lake, LA 70669
Chloride
5. Millennium Inorganic Chemicals, Inc. Plant I
2900 Middle RoadPO Box 310Ashtabula, OH 44004
Chloride
6. Millennium Inorganic Chemicals, Inc. Plant II
2426 Middle RoadPO Box 160Ashtabula, OH 44004
Chloride
7. E.I. DuPont de Nemours & Co.,DeLisle Plant
7685 Kiln-DeLisle RoadPO Box 430Pass Christian, MS 39571
Chloride-Ilmenite
8. E.I. DuPont de Nemours & Co., EdgeMoor Plant
4600 Hay Road (Shipping)104 Hay Rd. (Mailing)Edge Moor, DE 19809
Chloride-Ilmenite

Table 1.1 - Titanium Dioxide Producers
Facility Name Facility Location Production Process
2ECDIN Home Page, http://ecdin.etomep.net/cgibin_ecd
3ChemExpo Home Page, http://www.chemexpo.com/news/profile970912.cfm
4Ibid
5Ibid
6ChemExpo Home Page, http://www.chemexpo.com/news/profile970912.cfm.
Inorganic Listing Determination Titanium DioxideListing Background Document August, 20002
9. E.I. DuPont de Nemours & Co., NewJohnsonville Plant
One DuPont Rd.PO Box 2194New Johnsonville, TN
Chloride-Ilmenite
1.2 PRODUCTS, PRODUCT USAGE AND MARKETS
Titanium dioxide has the molecular formula TiO2, a molecular weight of 79.90, and, when used as apigment commonly is referred to as Pigment White 6 (Colour Index Number 77891). Titanium dioxideis a colorless solid at room temperature, melts at 1830 oC, and boils between 2500 and 3000 oC.2
More than 50 percent of the titanium dioxide produced is used in paints, varnishes and lacquer. Inpaints, titanium dioxide is used primarily to whiten and opacify polymeric binder systems. Even mediumto deep shades usually contain some titanium dioxide. It also is used in coatings where exteriordurability is needed.3
More than 25 percent of the titanium dioxide produced is used in paper and paperboard. The paperindustry uses titanium dioxide in two different applications: as a direct addition to whiten and opacify thepaper stock, and in the manufacture of coatings that are applied to the paper product.
Titanium dioxide is used in plastics to impart whiteness and opacity.4 Approximately 20 percent of thetitanium dioxide produced is used in plastics to impart whiteness and opacity.5
Titanium dioxide also is used in the manufacture of many other products including printing inks, rubber,floor coverings, ceramics, food and pharmaceuticals.6

Inorganic Listing Determination Titanium DioxideListing Background Document August, 20003
Figure 1.1 - Geographical Distribution of Titanium Dioxide Producers 1
ÜÝ ß Ù
à
Ú
ì
ÞÛ
1 See Table 1.1 for facility name and location.

7Ibid.
8ChemExpo Home Page, http://www.chemexpo.com/news/profile970912.cfm.
Inorganic Listing Determination Titanium DioxideListing Background Document August, 20004
1.3 PRODUCTION CAPACITY
In 1997 the maximum production capacity in the United States was approximately 1,405,000 metrictons per year (MT/yr).7 Table 1.2 provides the list of titanium dioxide production facilities and theirreported capacities.
Table 1.2 - Titanium Dioxide Production Capacity
Production Facility Production Process Capacity (103 MT/yr)
1. Kemira Pigments, Inc. Sulfate 60
Chloride 100
2. Millennium Inorganic Chemicals (formerly SCM), Baltimore Plant
Sulfate 44
Chloride 51
3. Kerr-McGee Chemical Corp. Chloride 160
4. Kronos/Louisiana Pigment Co. Chloride 110
5. Millennium Inorganic Chemicals, Inc.,Ashtabula Plant I
Chloride 104
6. Millennium Inorganic Chemicals, Inc.,Ashtabula Plant II
Chloride 86
7. E.I. DuPont de Nemours & Co., DeLislePlant
Chloride-Ilmenite 250
8. E.I. DuPont de Nemours & Co., EdgeMoor Plant
Chloride-Ilmenite 145
9. E.I. DuPont de Nemours & Co., NewJohnsonville Plant
Chloride-Ilmenite 295
1,405
1.4 PRODUCTION, PRODUCT AND PROCESS TRENDS
The 1997 data shows the demand for titanium dioxide as 1.175 million tons. The demand is projectedto be 1.362 million tons in the year 2001.8
For the period between 1987 and 1996, titanium dioxide sales have grown 2 to 2.5 percent per year.
9Ibid.
1054 FR 36592 (Sept. 1, 1989), 55 FR 2322 (Jan. 23, 1990), the July 31, 1990 Report to Congress on Wastesfrom Mineral Processing, and 56 FR 27300 (June 13, 1991).
11Titanium Tetrachloride Production by the Chloride Ilmenite Process, Technical Background Document,Office of Solid Waste, U.S. EPA, April 1998.
12Ibid.
Inorganic Listing Determination Titanium DioxideListing Background Document August, 20005
A 2 to 4 percent annual growth is projected through the year 2001. The sale price for titaniumdioxide was highest between the 1981 and 1996 at $ 1.04 per pound. The 1997 reported data showsthe price of titanium dioxide between $0.92 to $0.94 per pound.9
With the U.S. being a principal world producer, and limited foreign capacity, there has been leeway toraise world prices in the past years as demand increased. There is a limit to price elasticity, however,particularly in the paper industry, where competitive materials replace (or limit) the use of titaniumdioxide in some applications. The paper industry is striving to reduce consumption of titanium dioxidebecause of the high price levels. This has been done, particularly in plants using alkaline paper making,by increasing calcium carbonate use as a titanium dioxide extender. Although more difficult to replacein paint applications, a reduction and rationalization is a possibility if prices continue to rise.10
The oldest production process for titanium dioxide is the sulfate process. The major differencebetween the chloride and the chloride-ilmenite process is the process feed stock. The two main titaniumbearing minerals sources that are used as feedstock in the production of titanium dioxide are ilmeniteand rutile. The most abundant titanium bearing mineral is ilmenite and is comprised of approximately 43to 65 percent titanium dioxide. Synthetic rutile, from the acid leach of ilmenite, is the second majorfeedstock for titanium dioxide production and contains approximately 95 percent titanium dioxide. Titaniferrous slag, which is 70 to 80 percent titanium dioxide, is a co-product of smelting.11 Thechloride process produces a smaller quantity of waste materials than the sulfate process, but thechloride process is difficult to operate. The extreme corrosiveness of the high temperature chlorineemployed in the process contributes to the difficulty. The oxidation step in the process is also extremelydifficult to control due to burner configuration and product recovery. DuPont holds significant patentprotection in a technology that addresses this fundamental problem with the oxidation step.12

Inorganic Listing Determination Titanium DioxideListing Background Document August, 20006
2. DESCRIPTION OF MANUFACTURING PROCESSES
2.1 PRODUCTION PROCESS DESCRIPTION
As noted above in Section 1, titanium dioxide is manufactured using three processes: the chloride,sulfate, and chloride-ilmenite processes. The following are general descriptions of these threeproduction processes. Figure 2.1 contains general process flow diagrams for the production oftitanium dioxide via the chloride, sulfate and chloride-ilmenite processes. These descriptions and flowdiagrams do not account for specific process variations reported by the titanium dioxide manufacturers.
Chloride process
The chloride process begins with the conversion of rutile or high-grade ilmenite into titaniumtetrachloride (TiCl4). This step occurs in a fluidized bed chlorinator in the presence of chlorine gas at atemperature of approximately 900o C. Petroleum coke also is added as a reductant. The volatileTiCl4, including other metal chlorides such as vanadium oxychloride, exit the chlorinator as overheadvapor. The non-volatile chlorides and the unreacted coke and ore solids are removed from the gas stream and from the bottom of the chlorinator. The gaseous product stream is purified to separate thetitanium tetrachloride from other metal chloride impurities using condensation and chemical treatment. Vent gases from the chlorinator are scrubbed using water and caustic solutions prior to venting to theatmosphere. Finally, vanadium oxychloride (VOCl3), which has a boiling point close to that of TiCl4(136°C), is removed by complexing with mineral oil and reducing with hydrogen sulfide to VOCl2, orby complexing with copper. The purified TiCl4 is then oxidized to TiO2, driving off chlorine gas, whichis recycled to the chlorinator. The pure TiO2 is slurried and sent to the finishing process which includesmilling, addition of inorganic and organic surface treatments, and/or spray drying of the product TiO2. The product can be sold as a packaged dry solid or a water-based slurry.
Typical wastes generated by the chloride process includes wastewaters from chlorinator coke and oresolids recovery, reaction scrubbers, chemical tank storage scrubbers, product finishing operations andwastewater treatment solids decantation. Bevill-exempt waste solids are also generated during theproduction of titanium tetrachloride. Waste sands from finishing (milling) of the titanium dioxideproduct, scouring of oxidation process units, and blasting of reactor internal surfaces prior toreplacement of refractory are also generated. Sulfate process
The sulfate process starts with dried and milled slag being dissolved in sulfuric acid and water in adigester. This produces a titanyl sulfate liquor. From the digester the titanyl sulfate liquor goes to aclarification tank where the undissolved ore and solids are allowed to settle. The titanium liquor then isconcentrated and hydrolyzed to titanium dioxide hydrate. The titanium dioxide hydrate precipitatesfrom the ferrous sulfate and sulfuric acid and is separated through filtration. After filtration the hydratedtitanium dioxide slurry is sent to a calciner, where the titanium dioxide crystals grow to their final

Inorganic Listing Determination Titanium DioxideListing Background Document August, 20007
crystalline size and residual water and H2SO4 are removed. The dried titanium dioxide is sent topigments finishing. This finishing phase involves any required milling and or chemical treatment, suchas surface coating with silica or alumina.
Typical wastes generated by the sulfate process includes digestion scrubber water from the scrubbingof gasses generated during the digestion step. Digestion sludge is generated after the filtering of thebottom solids from the settled titanyl sulfate liquor generated during digestion. A waste acid isgenerated as a result of the filtering of the titanum dioxide hydrate. This waste acid is used in theproduction of commercial gypsum. Other wastewaters are generated during the calcination andfinishing steps of the process. Product milling sands is also generated during the finishing process. Chloride-ilmenite process
In the chloride-ilmenite process, titanium-bearing ore is converted to titanium tetrachloride. As in thechloride process, the chloride-ilmenite process takes place in a chlorinator where the ore is chlorinatedin the presence of coke as a reducing agent. The gaseous product stream is purified to separate thetitanium tetrachloride from other metal chloride impurities, including ferric chloride (FeCl3) which ispresent in higher concentrations than the chloride process because of the high iron content in the ore. The separation is done via condensation and chemical treatment. The process for converting TiCl4 toTiO2 is similar to that used in the chloride process, described above.
Typical wastes generated by the chloride-ilmenite process includes coke and ore solids (Bevill exempt)that remain unreacted during the chlorination process. A waste acid solution, usually called ferric oriron chloride waste acid, is also generated when the combined stream of unreacted coke and ore solids,metal chloride solids, and vanadium compounds is acidified using water or waste HCl from the reactionscrubber. Process and non-process wastewaters are generated from reaction and oxidation scrubbers,spent chemical treatment, product finishing, HCl storage vent scrubber, oxidation unit tank andequipment vents, supernatant from coke and ore solids and wastewater treatment disposalimpoundments. A vanadium waste is also generated in the purification process. Wastewater treatmentsolids are generated from the neutralization and settling of commingled process and non-processwastewater.
2.2 PRODUCTION TRENDS, CHANGES AND IMPROVEMENTS
The dependance of most of the titanium dioxide producers on Australian rutile, ilmenite, andtitaniferrous slags has led to strong price increases for these raw materials over the past years. TheU.S. plants that previously produced titanium dioxide by the higher cost sulfate route have beeneliminated or updated. In terms of conversion to the chloride process, the U.S. is considerably moreadvanced than other countries. This advantage will eliminate the capital expenditures associated with the conversion that many other countries will likely be required to make over the next decade in order

13 54 FR 36592 (Sept. 1, 1989), 55 FR 2322 (Jan. 23, 1990), the July 31, 1990 Report to Congress on Wastesfrom Mineral Processing, and 56 FR 27300 (June 13, 1991).
Inorganic Listing Determination Titanium DioxideListing Background Document August, 20008
Chlorinator
Scrubber
Condensation& Purification
Oxidation Finishing
Coke & OreRecovery
WWTP
TiO2Product
Wastewater
Rutile or HighGrade Ilmenite
Coke
Cl2
CrudeTiCl4 TiCl4 TiO2
Solids/Liquids
Scrubber
DigestClarification
(Settlers)
Digestion Sludge
Concentration,Precipitation,
Filtration
Waste Acid toGypsum Plant
Calcination
Scrubber
Finishing
Wastewater Wastewater
H2SO4
Wastewater
TiO2Product
Slag
Water
CHLORIDE/CHLORIDE-ILMENITE PROCESS
SULFATE PROCESS
to remain cost-competitive. 13
Figure 2.1 - Process Flow Diagram for the Production of Titanium Dioxide

Inorganic Listing Determination Titanium DioxideListing Background Document August, 20009
3. TITANIUM DIOXIDE WASTE CHARACTERIZATION, GENERATION,MANAGEMENT, SCREENING AND ASSESSMENT
For the purposes of this listing determination, the wastes generated as a result of the production oftitanium dioxide via the three production processes were grouped into categories. Tables 3.1, 3.2 and3.3 presents a summary of the chloride, sulfate and chloride-ilmenite waste categories that wereevaluated as part of this listing determination. Section 3.1 presents a discussion of the sampling andanalysis effort that was conducted to characterize the wastes of concern. Section 3.2 presents adiscussion of the volumes, management practices, and characterization for each of the waste categoriespresented in Tables 3.1, 3.2 and 3.3. A discussion of the initial risk screening for each waste categoryis also included as part of the discussion. Section 3.3 presents a discussion of the waste that aregenerated on-site at titanium dioxide facilities that are outside the scope of the consent decree.

Inorganic Listing Determination Titanium DioxideListing Background Document August, 200010
Table 3.1 - Waste Reported by Titanium Dioxide Facilities Using the Chloride Process
Facility
CommingledWastewaters
from thechloride process
WastewaterTreatment Sludgesfrom commingled
chloride andsulfate processwastewaters
Various Sandsfrom milling,scouring andoxidation
VanadiumOxy-
chlorideSludge
ChlorideSolids
Kemira Pigments, Inc. See Table 3.2 x x x
Millennium Inorganic Chemicals,Baltimore Plant
See Table 3.2 x x x
Kerr-McGee Chemicals Corporation x x x x
Kronos/Louisiana Pigment Co. x x
Millennium Inorganic Chemicals,Ashtabula Plant I
x x
Millennium Inorganic Chemicals,Ashtabula Plant II
x x
Table 3.2 - Waste Reported by Titanium Dioxide Facilities Using the Sulfate Process
Facility Gypsum from thesulfate process
Digestion ScrubberWater from thesulfate process
Sulfate ProcessDigestion Sludges
Commingled Wastewatersfrom chloride and sulfate
processes
Kemira Pigments, Inc. x x x x
Millennium Inorganic Chemicals x x x x

Inorganic Listing Determination Titanium DioxideListing Background Document August, 200011
Table 3.3 - Waste Reported by Titanium Dioxide Facilities Using the Chloride-Ilmenite Process
Facility
Waste Acid(ferric
chloride)
Non-Bevill-exempt
Nonwastewatersfrom the
chloride-ilmeniteprocess
Commingledwastewaters
from thechloride-ilmeniteprocess
Additive ventfilters solids
Vanadium Sludge
Off-specificatio
n TiO2
Product
Railcar/TrailerProductWash-
out
E.I. DuPont de Nemours &Co.; DeLisle Plant;Pass Christian, MS
x x x x x x
E.I. DuPont de Nemours &Co.;New Johnsonville, TN
x x x x x x
E.I. DuPont de Nemours &Co.;Edge Moor, DE
x x x x

Inorganic Listing Determination Titanium DioxideListing Background Document August, 200012
3.1 CHARACTERIZATION OF TITANIUM DIOXIDE WASTES
As part of the information gathering activities, EPA collected and analyzed samples of titanium dioxideproduction wastes at five facilities: E.I. du Pont de Nemours and Co. in Edge Moor, DE; KemiraPigments, Inc. in Savannah, GA; E.I. du Pont de Nemours and Co. in New Johnsonville, TN; Kerr-McGee Chemical Corp. in Hamilton, MS; and Millennium Inorganic Chemicals in Baltimore, MD. Thesampling and analysis of selected wastes provide the necessary characterization to determine what toxicconstituents are present in the wastes and at what concentrations. The waste concentrations in thewastes were used in the risk screening and risk modeling assessments.
Totals, TCLP, and/or SPLP analyses were conducted on each record sample collected for the listingdetermination. A summary of the analytical results for each sample is presented in Appendix A. Thecomplete set of analytical results, the validation report and a detailed report of the record sampling tripcan be found in the following reports:
Sampling and Analytical Data Report for Record Sampling and Characterization ofWastes From the Inorganic Titanium Dioxide Manufacturing Sector; DuPont Edge Moor,DE; September 7, 1999.
Sampling and Analytical Data Report for Record Sampling and Characterization ofWastes From the Inorganic Titanium Dioxide Manufacturing Sector; DuPont NewJohnsonville, TN; September 14, 1999.
Sampling and Analytical Data Report for Record Sampling and Characterization ofWastes From the Inorganic Titanium Dioxide Manufacturing Sector; MillenniumInorganics Co., Baltimore, MD; September 23 and September 30, 1999.
Sampling and Analytical Data Report for Record Sampling and Characterization ofWastes From the Inorganic Titanium Dioxide Manufacturing Sector; Kemira Pigments,Co., Savannah, GA; September 9, 1999.
Sampling and Analytical Data Report for Record Sampling and Characterization ofWastes From the Inorganic Sodium Chlorate and Titanium Dioxide ManufacturingSector for the Kerr-McGee Facility; July 17, 2000
These reports are available in the docket for this rulemaking.
The sampled facilities collected split-samples of some of the samples collected by EPA. The split-sample analytical results for two facilities are found in Appendix B.

Inorganic Listing Determination Titanium DioxideListing Background Document August, 200013
3.2 EVALUATION OF TITANIUM DIOXIDE WASTE CATEGORIES
3.2.1 Commingled Wastewaters from the Chloride Process, Including Wastewaters fromCoke and Ore Recovery, Scrubber Water, Finishing Wastewaters and SludgeSupernatants
Waste Generation
All six of the facilities that produce titanium dioxide via the chloride process commingle the wastewatersthat are generated at various points in the production process. At the two facilities that use the sulfateprocess, the chloride and sulfate process wastewaters are commingled. The evaluation of thesechloride/sulfate wastewaters is discussed in Section 3.2.6 with the “Commingled Wastewaters from theChloride and Sulfate Process” waste category. The wastewaters generated at the remaining four“chloride only” facilities were assessed as part of this waste category and include:
Wastewater From Coke and Ore Recovery
All four of the “chloride only” facilities generate these wastewaters during the separation of the slurryproduced during the initial chlorination reaction. The metal chloride impurities and unreacted coke andore solids are separated from the titanium tetrachloride produced during the chlorination process.
Scrubber Wastewater (HCl)
Hydrochloric acid (HCl) is generated by all of the “chloride only” facilities as a result of the scrubbing ofthe off-gas from the chlorination, purification, and oxidation parts of the manufacturing process. Thesewastewaters are commingled with other wastewaters and treated in each facility’s waste watertreatment system and are addressed in this category.
In addition, three of the chloride process facilities also report reusing a portion of the scrubber watersas hydrochloric acid. Millennium Plant I in Ohio uses the scrubber water onsite in titanium dioxideproduction and sells it as HCl for steel pickling. Kerr-McGee sends a portion of the scrubber wasteras HCl to their sister facility in Mobil, GA to be used in beneficiation (leaching) of ilmenite ore. LAPigments uses a portion of the scrubber water in the titanium dioxide process and sells a portion of theirscrubber water as HCl to be used as an acidizing agent in the oil field industry. According to thefacility, this HCl meets all the required specifications for HCl.
Finishing Wastewaters
Finishing wastewaters are generated in the product finishing operation. The wastewater is commingledwith other process wastewaters for treatment prior to NPDES discharge. Sludge Supernatant
Inorganic Listing Determination Titanium DioxideListing Background Document August, 200014
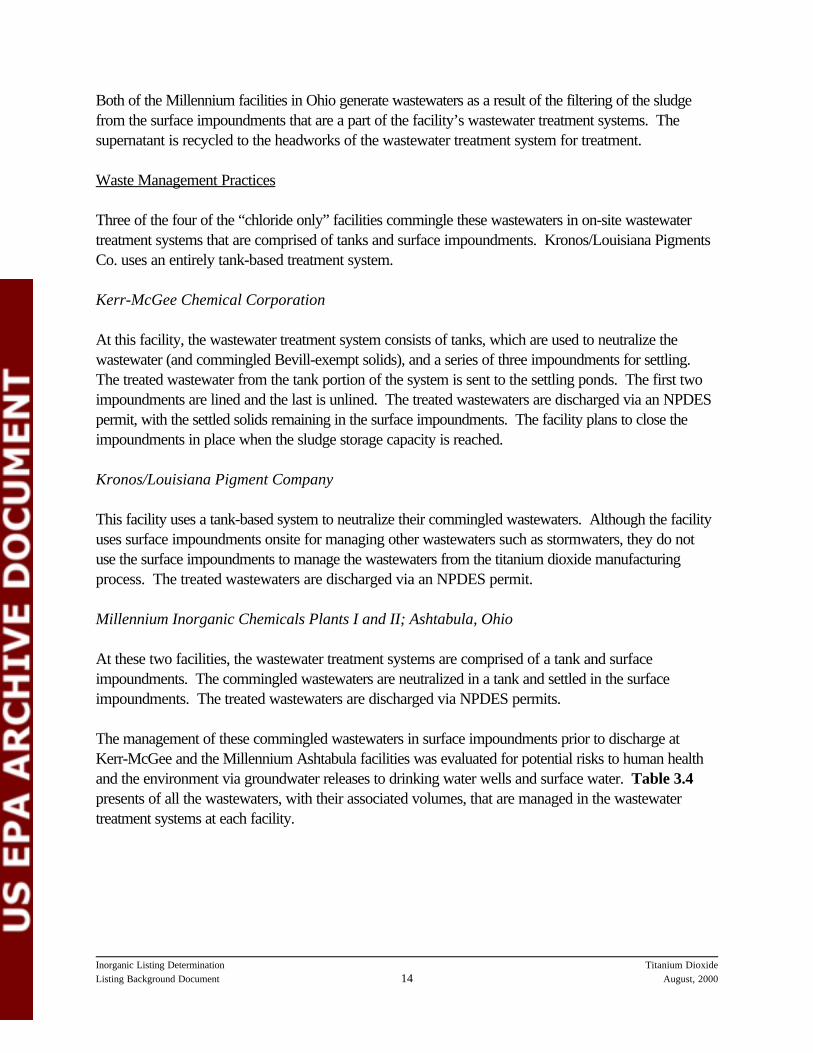
Both of the Millennium facilities in Ohio generate wastewaters as a result of the filtering of the sludgefrom the surface impoundments that are a part of the facility’s wastewater treatment systems. Thesupernatant is recycled to the headworks of the wastewater treatment system for treatment.
Waste Management Practices
Three of the four of the “chloride only” facilities commingle these wastewaters in on-site wastewatertreatment systems that are comprised of tanks and surface impoundments. Kronos/Louisiana PigmentsCo. uses an entirely tank-based treatment system.
Kerr-McGee Chemical Corporation
At this facility, the wastewater treatment system consists of tanks, which are used to neutralize thewastewater (and commingled Bevill-exempt solids), and a series of three impoundments for settling. The treated wastewater from the tank portion of the system is sent to the settling ponds. The first twoimpoundments are lined and the last is unlined. The treated wastewaters are discharged via an NPDESpermit, with the settled solids remaining in the surface impoundments. The facility plans to close theimpoundments in place when the sludge storage capacity is reached.
Kronos/Louisiana Pigment Company
This facility uses a tank-based system to neutralize their commingled wastewaters. Although the facilityuses surface impoundments onsite for managing other wastewaters such as stormwaters, they do notuse the surface impoundments to manage the wastewaters from the titanium dioxide manufacturingprocess. The treated wastewaters are discharged via an NPDES permit.
Millennium Inorganic Chemicals Plants I and II; Ashtabula, Ohio
At these two facilities, the wastewater treatment systems are comprised of a tank and surfaceimpoundments. The commingled wastewaters are neutralized in a tank and settled in the surfaceimpoundments. The treated wastewaters are discharged via NPDES permits.
The management of these commingled wastewaters in surface impoundments prior to discharge atKerr-McGee and the Millennium Ashtabula facilities was evaluated for potential risks to human healthand the environment via groundwater releases to drinking water wells and surface water. Table 3.4presents of all the wastewaters, with their associated volumes, that are managed in the wastewatertreatment systems at each facility.

14This facility also commingles wastewaters from sodium chlorate production, which accounts for a smallpercentage (<7%)of the total waste volume.
Inorganic Listing Determination Titanium DioxideListing Background Document August, 200015
Table 3.4 - Commingled Wastewaters from the Chloride Process
Facility Wastewater (RIN #)Total Volume
(MT/yr)
Kerr-McGee Chemical Corporation Wastewater from Coke and OreRecovery (RIN 1)
7,356,798
Kronos/Louisiana PigmentCompany
Wastewater from Coke and OreRecovery (RIN 4)
63,394
Scrubber Wastewater (RIN 2) 5,186
Millennium Inorganic Chemicals,Plant I; Ashtabula, OH
Wastewater from Coke and OreRecovery (RIN 1)
70,000
Scrubber Wastewater (RIN 2) 13,900
Millennium Inorganic ChemicalPlants II; Ashtabula, Ohio
Wastewater from Coke and OreRecovery (RIN 1)
90,000
Scrubber Wastewater (RIN 2) 13,900
Waste Characterization
The commingled wastewaters at Kerr-McGee are representative of the four “chloride only” facilitiesand was selected for sampling and analysis. The Sample KM-SI-01 collected during record samplingwas used to characterize this waste category. The sample was collected at the inlet to the surfaceimpoundment train.14 This waste contained solids and waste acids from the chlorination process thathad been mixed with other wastewaters. To isolate the impact of the wastewater on the environmentfrom that of the sludge, the analyses conducted on the sample were as follows: matrix (totals, TCLPand SPLP), filtrate SPLP, and leachate SPLP. The SPLP filtrate portion of the sample is assumed tobe representative of the wastewater throughout the settling ponds and was used to conduct an initialscreening analysis and subsequent full risk assessment modeling.
Table 3.5 presents the analytical results for the constituents detected in the filtrate with thecorresponding the Health-Based Levels (HBLs) and/or Ambient Water Quality Criteria (AWQC). Fordetails on the HBLs and AWQC please refer to Risk Assessment for the Listing Determinations forInorganic Chemical Manufacturing Wastes (August 2000).
Results of Initial Screening Analysis
EPA determined that the surface impoundment scenarios (Kerr-McGee and Millennium facilities) posea more significant potential risk than the tank based scenario (Louisiana Pigment) because it wasassumed that wastewater treatment tanks retain sufficient structural integrity to prevent wastewaterreleases to the subsurface (and therefore to groundwater). Also, overflow and spill controls prevent

15Fields Brook Project, SCM Plant 2, TiO2 Facility, Phase I RI Report, Rev. 1, 8/24/94.
Inorganic Listing Determination Titanium DioxideListing Background Document August, 200016
significant wastewater releases. The impoundments at the three “chloride only” facilities wereconsidered separately because there was no indication that the waste would be managed in any unitsother than those reported.
The surface impoundment at Kerr-McGee required further assessment beyond the initial screeninganalysis for infiltration to the river pathway and the groundwater contamination pathway due toexceedences of both the HBL and AWQC.
Millennium Ashtabula, Ohio Facilities
At these two facilities, the impoundments that make up the wastewater treatment system are located onor near the Fields Brook, which feeds into the Ashtabula River, that ultimately feeds into Lake Erie (2miles away). See map in Fields Brook Project, SCM Plant 2, TiO2 Facility, Phase I RI Report,Rev. 1. The localized groundwater flow is south toward the creeks, and the deeper flow is northwardto Lake Erie. The facility was not able to identify any private drinking water wells in the vicinity of theplant. All land between the facility and the Lake is industrial. A Superfund multimedia study of thisarea15 indicated that the groundwater is in a very low permeability formation, and that the publicdrinking water supply is from the lake. No further consideration of this scenario was required since thepotential exposure via the drinking water well scenario was assessed at the Kerr-McGee facility.
Kerr-McGee
The SPLP filtrate results for Sample KM-SI-01 were used to screen any surface water releases andpossible drinking water well contamination resulting from the management of this waste in the finalsurface impoundment of the facility’s wastewater treatment system.
The surface water release pathway for the wastewater from the settling ponds is to the nearbyTombigbee River. The RCRA Facility Assessment (RFA) of Kerr-McGee Chemical Corporation;Hamilton, MS; June 16, 1995; pp. II-44-45 states that “the groundwater flow near the surfaceimpoundments is to the northwest and discharges into on-site swamps. Regionally, however, thegroundwater flow direction is to the southwest and discharges into the Dose Maie Creek and theTombigbee River.” Kerr-McGee owns all of the land between the impoundments and the river(including the creek), which appears to be swampy and undeveloped on available maps. The potentialinfiltration of wastewater from the final unlined surface impoundment into the river were assessed forrisk.
The drinking water release pathway for the wastewater from the impoundment is to potential drinkingwater wells in the area. The RFA states “The Kerr-McGee facility is located approximately one milesouthwest of New Hamilton, MS and two miles from the Sulfur Springs School. According to a 1991EPA Chemical Safety Audit, the site is located in a predominantly agricultural setting. EPA estimatesthat there are less than 3,000 people living within 6 miles of the plant; however, some of the residentsown property adjacent to Kerr-McGee. At least six off-site ground-water wells are located in close

16Phone log. Ron Josephson (EPA) to Mr. Jim Hoffman, Mississippi Department of Environmental Quality,Office of Land and Water Resources. December 22, 1999.
17Phone log. Ron Josephson (EPA) to Mr. Jim Hoffman, Mississippi Department of Environmental Quality,Office of Land and Water Resources. December 22, 1999.
Inorganic Listing Determination Titanium DioxideListing Background Document August, 200017
proximity to the northern boundary of the site.16 The Hamilton facility encompasses wetland areasalong the western and southern portions of the site and along McKinley Creek.” See 1998 RCRA 3007Survey of Inorganic Chemicals Industry for Kerr-McGee Chemical for applicable maps. Based onUSGS data obtained from the state, a residential well (Q050) was reported just off the propertyboundary at 5,000 feet from the impoundment of concern. The closest property boundary to thisimpoundment is 2,000 feet. Due to uncertainty in groundwater flow direction (localized flow to thenorthwest in the vicinity of the impoundments, overall flow to the southwest), the potential impact onpotential drinking water wells to the north was assessed for risk.
The constituents of concern that were detected above the HBLs in Kerr-McGee’s wastewater areantimony, arsenic, molybdenum and thallium. The constituents of concern that exceeded AWQC areantimony, arsenic, thallium and manganese.
The drinking water release pathway for the wastewater from the impoundment is to potential drinkingwater wells in the area. The RFA states “The Kerr-McGee facility is located approximately one milesouthwest of New Hamilton, MS and two miles from the Sulfur Springs School. According to a 1991EPA Chemical Safety Audit, the site is located in a predominantly agricultural setting. EPA estimatesthat there are less than 3,000 people living within 6 miles of the plant; however, some of the residentsown property adjacent to Kerr-McGee. At least six off-site ground-water wells are located in closeproximity to the northern boundary of the site.17 The Hamilton facility encompasses wetland areasalong the western and southern portions of the site and along McKinley Creek.” See 1998 RCRA 3007Survey of Inorganic Chemicals Industry for Kerr-McGee Chemical for applicable maps. Based onUSGS data obtained from the state, a residential well (Q050) was reported just off the propertyboundary at 5,000 feet from the impoundment of concern. The closest property boundary to thisimpoundment is 2,000 feet. Due to uncertainty in groundwater flow direction (localized flow to thenorthwest in the vicinity of the impoundments, overall flow to the southwest), the potential impact onpotential drinking water wells to the north was assessed for risk.
Table 3.5 - Initial Screening Analysis for Commingled Wastewaters from Chloride Process
Constituent
KM-SI-01SPLP filtrate (mg/L)
HBL(mg/L)
AWQC(mg/L)(freshwater/saltwater)
Aluminum 0.013 16 0.087
Antimony 0.044 0.0063 0.014

Table 3.5 - Initial Screening Analysis for Commingled Wastewaters from Chloride Process
Constituent
KM-SI-01SPLP filtrate (mg/L)
HBL(mg/L)
AWQC(mg/L)(freshwater/saltwater)
18Thallium is identified as a potential constituent of concern because (1) it was detected in the totalsanalysis (0.086 mg/L) at levels exceeding the HBL and AWQC, and (2) the SPLP filtrate analysis detection limit wastoo high to confirm that mobile levels of thallium do not exceed these standards.
Inorganic Listing Determination Titanium DioxideListing Background Document August, 200018
Arsenic 0.001 * 0.00074 0.000018
Barium 0.23 1.1 NA
Beryllium <0.002 0.031 NA
Boron 0.39 1.4 NA
Cadmium <0.005 0.0078 0.0022/0.0093
Calcium 2,940 NA NA
Chromium <0.005 23 0.74
Cobalt <0.005 0.94 NA
Copper 0.007 1.3 0.0090/0.0031
Iron <0.05 5 1
Lead <0.003 0.015 0.0025/0.0081
Magnesium 60.5 NA NA
Manganese 0.46 0.73 0.05
Mercury <0.0002 0.0047 0.000050
Molybdenum 0.23 0.078 NA
Nickel <0.005 0.31 0.052/0.0082
Potassium 18.6 NA NA
Silver <0.001 0.078 0.0034/0.0019
Sodium 606 NA NA
Thallium <0.00518 0.0013 0.0017
Tin <0.01 9.4 NA
Titanium <0.005 NA NA
Vanadium 0.008 0.14 NA
Zinc <0.05 4.7 0.12 /0.081
Dioxins/Furans, (ng/L)

Table 3.5 - Initial Screening Analysis for Commingled Wastewaters from Chloride Process
Constituent
KM-SI-01SPLP filtrate (mg/L)
HBL(mg/L)
AWQC(mg/L)(freshwater/saltwater)
19TEF= Toxicity Equivalent Factor, provided in parentheses after congener name. Dioxin TEQs calculatedusing WHO-TEFs.
Inorganic Listing Determination Titanium DioxideListing Background Document August, 200019
2378-TCDF (TEF=0.1)19 <0.11 NA NA
Total TCDF <0.11 NA NA
2378-TCDD <0.11 NA NA
Total TCDD <0.11 NA NA
12378-PeCDF (0.05) <0.56 NA NA
23478-PeCDF (0.5) <0.56 NA NA
Total PeCDF <0.56 NA NA
12378-PeCDD (TEF=1) <0.56 NA NA
Total PeCDD <0.56 NA NA
123478-HxCDF (0.1) <0.56 NA NA
123678-HxCDF (0.1) <0.56 NA NA
234678-HxCDF (0.1) <0.56 NA NA
123789-HxCDF (0.1) <0.56 NA NA
Total HxCDF <0.56 NA NA
123478-HxCDD (0.1) <0.56 NA NA
123678-HxCDD (0.1) <0.56 NA NA
123789-HxCDD (0.1) <0.56 NA NA
Total HxCDD <0.56 NA NA
1234678-HpCDF (0.01) <13 NA NA
1234789-HpCDF (0.01) <13 NA NA
Total HpCDF <13 NA NA
1234678-HpCDD (0.01) <13 NA NA
Total HpCDD <13 NA NA
OCDF (0.0001) <1.1 NA NA
OCDD (0.0001) <1.1 NA NA

Table 3.5 - Initial Screening Analysis for Commingled Wastewaters from Chloride Process
Constituent
KM-SI-01SPLP filtrate (mg/L)
HBL(mg/L)
AWQC(mg/L)(freshwater/saltwater)
Inorganic Listing Determination Titanium DioxideListing Background Document August, 200020
2378-TCDD TEQ 0 ng/L 0.0071 ng/L 0.0031 ng/L
NA- Not AvailableNR- Not Reported In Analytical Data Report *Results are less than the typical laboratory reporting limit, but are greater than the calculated instrument detectionlimits.
For the Commingled Wastewaters from Chloride Process waste category, the potential groundwaterreleases to both surface water and drinking wells were assessed as described above. The air pathwaywas not assessed for this waste category because no volatile organic or other constituents that pose riskdue to air releases were detected. Please refer to the Risk Assessment for the ListingDeterminations for Inorganic Chemical Manufacturing Wastes (August 2000) for the details of the risk assessment.
3.2.2 Various Sands from Oxidation, Milling, and Scouring
Waste Generation and Management
Kemira Pigments and Millennium Inorganic Chemicals in Baltimore reported generating milling sandsduring finishing operations. Kemira Pigments also generates a scouring sand during product finishing. Kerr-McGee reported generating an “oxidation sand” when silica sand is used to remove thecrystalized titanium dioxide from cooling tub surfaces after the oxidation step of the chloride process.
Kemira Pigments sends their waste sand to an off-site Subtitle D landfill. Millennium InorganicChemicals (Baltimore, MD) sends their waste sand to an on-site landfill. Kerr-McGee sends this wasteto an on-site dedicated industrial Subtitle D landfill. Table 3.6 presents the chloride process wastesands, with the associated volumes and management practices, reported by each facility.
Table 3.6 - Waste Management Practices and Volumes for Various Sands from Oxidation,Milling, and Scouring
Facility Waste Sand (RIN #) Management Total Volume
(MT/yr)
Kemira Pigments Milling Sand (RIN 10) Off-site industrial Subtitle Dlandfill
200
Scouring Sand (RIN 8) Off-site industrial Subtitle Dlandfill
2,300
Millennium InorganicChemicals; Baltimore, MD
Milling Sand (RIN 14) On-site Subtitle D landfill 50

Milling, and Scouring
Facility Waste Sand (RIN #) Management Total Volume
(MT/yr)
Inorganic Listing Determination Titanium DioxideListing Background Document August, 200021
Kerr-McGee Oxidation Sand (RIN 2) On-site Subtitle D monofill 6,935
Waste Characterization
During record sampling, two samples were collected from the Kemira Pigments facility to characterizethis waste category. Sample KP-SO-04 of the scouring sand was taken from a container holding thismaterial by compositing four grab samples of the material; a milling sand sample (KP-SO-05) wascollected by compositing four grab samples of this wet slurry-like material from a container holding thismaterial. Although a sample of oxidation sand was not available during the record sampling time frame,the sand is assumed to be similar in composition to the milling and scouring sands because they are allassociated with product finishing operations.
Results of Initial Screening
Milling Sand
Since the milling sand is managed in an industrial Subtitle D landfill, the SPLP results for Sample KP-SO-05 were compared against the HBLs for each constituent to determine if further risk assessmentwas necessary. Table 3.7 presents the analytical results for the constituents detected in the SPLP andthe corresponding HBLs and/or AWQC. The only constituent detected above the HBL was antimony. Therefore, further analysis of the risk for antimony under the industrial Subtitle D landfill scenario wasassessed for the groundwater ingestion pathway. Refer to the Risk Assessment for the ListingDeterminations for Inorganic Chemical Manufacturing Wastes (August 2000) for the details of the risk assessment.
Table 3.7 - Initial Screening Analysis for Milling Sand
ConstituentKP-SO-05SPLP (mg/L) HBL (mg/L)
Aluminum <0.1 16
Antimony 0.024 0.0063
Barium 0.21 1.1
Boron 0.19 1.4
Calcium 0.73 NA
Chromium <0.005 23
Chromium, +6 <0.02** 0.047
Copper 0.003 1.3
Iron <0.05 5
Magnesium 0.083 NA

Table 3.7 - Initial Screening Analysis for Milling Sand
ConstituentKP-SO-05SPLP (mg/L) HBL (mg/L)
Inorganic Listing Determination Titanium DioxideListing Background Document August, 200022
Manganese <0.005 0.73
Nickel 0.044 0.31
Sodium 4.0 NA
Tin <0.01 9.4
Titanium 0.12 NA
Zinc 0.032* 4.7
*Results are less than the typical laboratory reporting limit, but are greater than calculated instrument DL.**Determined from DI leach.NA- Not Available
Scouring Sand
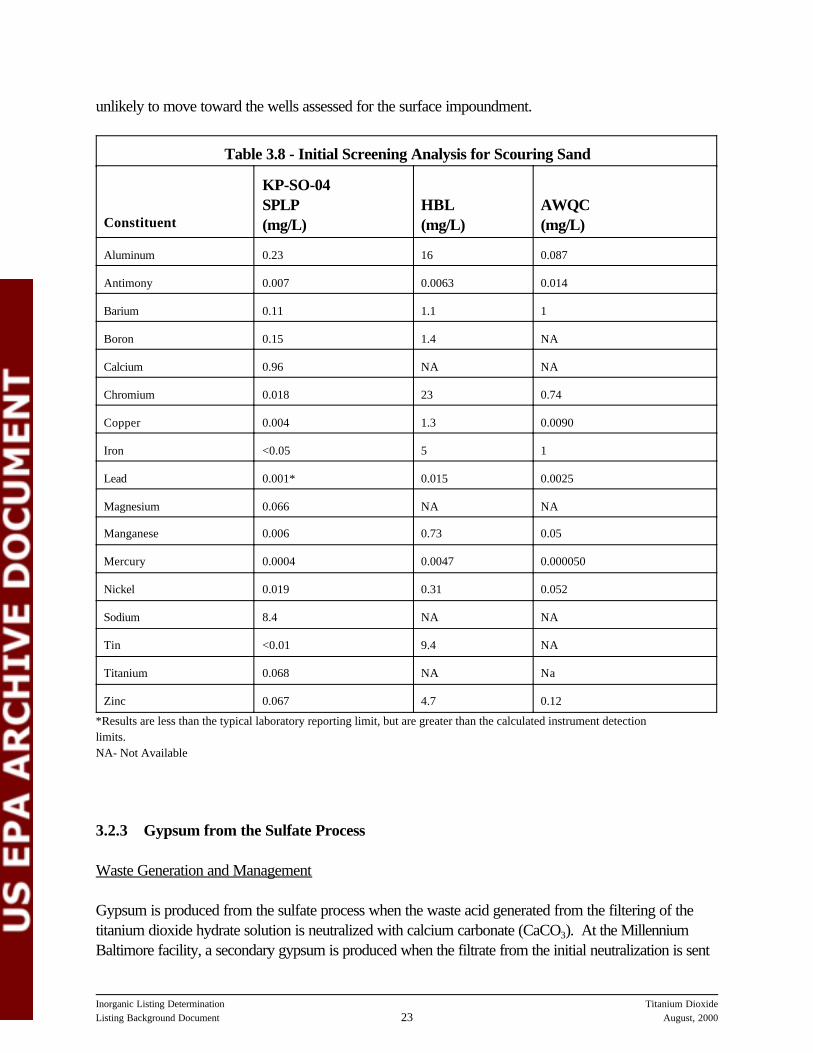
The relevant risk scenarios for the scouring sand waste are an on-site Subtitle D industrial landfill(monofill) at Kerr-McGee and an off-site Subtitle D industrial landfill at Kemira. The SPLP results forKP-SO-04 are believed to be representative of the leachate from both landfill scenarios. Table 3.8 presents a comparison of the analytical results for the constituents detected in the SPLP leachate andthe corresponding HBLs and AWQC. The antimony concentration in the SPLP leachate exceeds theantimony the HBL only by a factor of 1.1. Since direct ingestion of the off-site landfill leachate is highlyunlikely, it is assumed that antimony does not pose a risk via groundwater ingestion under either on-siteor off-site industrial landfill scenarios.
However, aluminum and mercury were detected above the AWQC by a factors of 3 and 8(respectively) and are constituents of concern for the on-site landfill scenario via the surface waterpathway. Subsurface releases from this landfill may reach the Tombigbee River, approximately 500feet to the west. The Kerr-McGee RFA states that “the groundwater flow near the surfaceimpoundments (the landfill is on the southern side of the impoundments) is to the northwest anddischarges into onsite swamps. Regionally, however, the groundwater flow direction is to thesouthwest and discharges into the Dose Maie Creek and the Tombigbee River.” It is highly likely thatthe 500' subsurface transport scenario and the dilution into the river scenario would result in a DAFsignificantly greater than eight thus bringing the mercury and aluminum concentration below the AWQC. Therefore, it is assumed this waste screens out. Further support to this assumption is the fact that thelandfill has a double liner and a leachate collection system.
Note that unlike the surface impoundments that manage “commingled chloride wastewaters” and thatwere assessed for potential releases to drinking water wells at this site, the sand landfill is located at thesoutheast corner of Kerr-McGee’s property approximately 1800 feet (center-to-center) to thesouthwest of the modeled surface impoundment. Groundwater flows in the vicinity of this landfill are
Inorganic Listing Determination Titanium DioxideListing Background Document August, 200023
unlikely to move toward the wells assessed for the surface impoundment.
Table 3.8 - Initial Screening Analysis for Scouring Sand
Constituent
KP-SO-04SPLP(mg/L)
HBL(mg/L)
AWQC(mg/L)
Aluminum 0.23 16 0.087
Antimony 0.007 0.0063 0.014
Barium 0.11 1.1 1
Boron 0.15 1.4 NA
Calcium 0.96 NA NA
Chromium 0.018 23 0.74
Copper 0.004 1.3 0.0090
Iron <0.05 5 1
Lead 0.001* 0.015 0.0025
Magnesium 0.066 NA NA
Manganese 0.006 0.73 0.05
Mercury 0.0004 0.0047 0.000050
Nickel 0.019 0.31 0.052
Sodium 8.4 NA NA
Tin <0.01 9.4 NA
Titanium 0.068 NA Na
Zinc 0.067 4.7 0.12
*Results are less than the typical laboratory reporting limit, but are greater than the calculated instrument detectionlimits.NA- Not Available
3.2.3 Gypsum from the Sulfate Process
Waste Generation and Management
Gypsum is produced from the sulfate process when the waste acid generated from the filtering of thetitanium dioxide hydrate solution is neutralized with calcium carbonate (CaCO3). At the MillenniumBaltimore facility, a secondary gypsum is produced when the filtrate from the initial neutralization is sent

Inorganic Listing Determination Titanium DioxideListing Background Document August, 200024
through a secondary neutralization process. During the secondary neutralization step, more CaCO3 isadded and the slurry is mixed and filtered. At both Kemira and Millennium, the treated wastewaterformed during the neutralization process is discharged via permitted NPDES outfalls.
At both facilities the gypsum is stored in piles for drying (without pads or liners) before it is sold forcommercial use. Kemira sells its gypsum for use in the manufacture of wallboard, cement, agriculturalchemicals or chemical products. At Millennium, primary gypsum is sold for use in wallboard or sent tothe facility’s on-site Subtitle D landfill. The secondary gypsum also is sent to the on-site landfill. Table3.9 provides the management practices and volumes for the gypsum generated at both facilities.
Table 3.9 - Waste Management Practices and Volumes for Gypsum from Sulfate Process
Facility Waste (RIN #) Management PracticeTotal Volume
(MT/yr)
MillenniumInorganics; Baltimore,MD
Primary Gypsum(RIN 10)
Storage in piles, sold for use inwallboard
160,027
Primary Gypsum*(RIN 10)
Storage in piles, sent to facility’soff-site landfill
17,781
Secondary Gypsum(RIN 12)
Storage in piles, sent to facility’soff-site landfill
51,710
Kemira Pigments;Savannah, GA
Primary Gypsum(no RIN assigned)
Storage in pile, sold for use inagricultural chemicals (useconstituting disposal)
Not Reported
Storage in pile, sold for use incement
Not Reported
Storage in pile, sold for use inchemical products
Not Reported
Storage in pile, sold for use inwallboard
Not Reported
*The facility reported during a site visit that about 10% of the primary gypsum produced is sent to thelandfill, and the rest is sold for use in wallboard.
Waste Characterization
Samples of the primary and secondary gypsum were collected during record sampling to characterizethis waste. At Kemira Pigments Inc., a sample (KP-SO-O1) of the primary gypsum was collected bycompositing four scoops of this wastestream from the perimeter of a pile of this material discharged bya conveyor belt directly from the process. At Millennium Inorganics in Baltimore, MD, samples of boththe primary (MI-SO-04) and the secondary (MI-SO-03) gypsum were collected by compositingscoops of the material from separate locations around the perimeter of similarly-generated piles of

Inorganic Listing Determination Titanium DioxideListing Background Document August, 200025
gypsum.
Results of Initial Screening
The initial screening of this waste category considered each of the reported management scenarios thatinvolve land placement: agricultural chemicals, cement, piles and landfills. The potential releases to bothair and groundwater were evaluated.
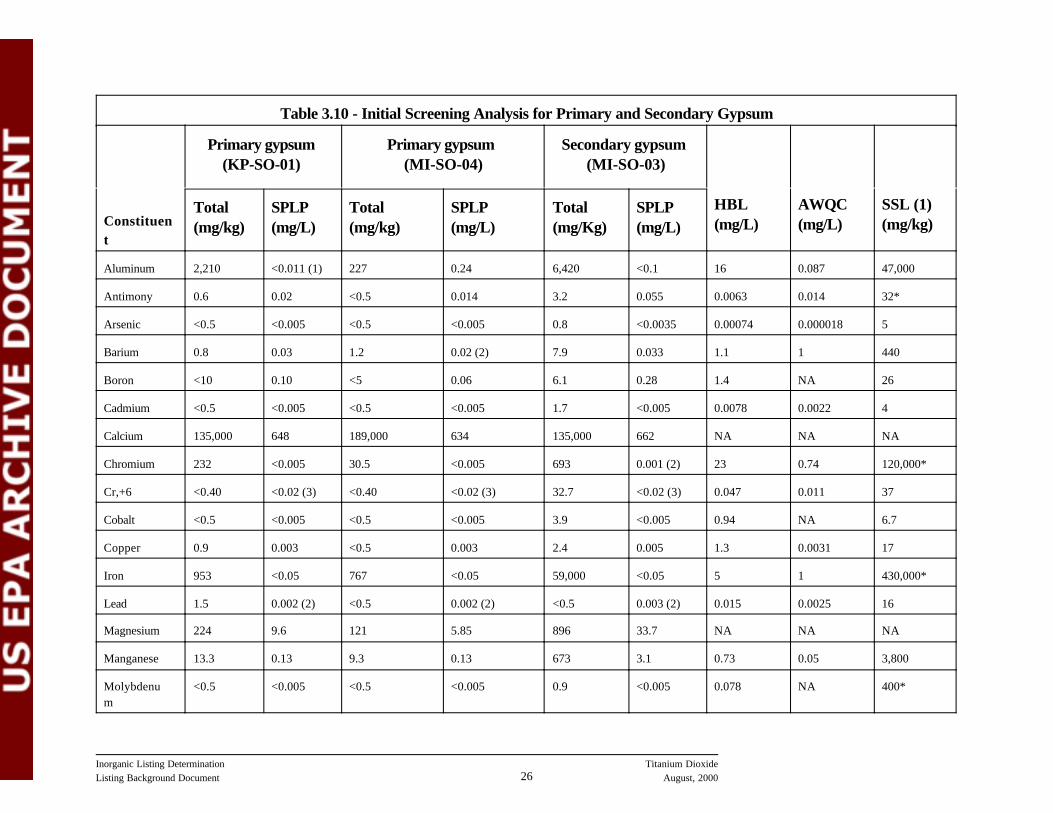
Table 3.10 presents the analytical results for the constituents detected in the relevant samples with thecorresponding applicable regulatory limit (HBLs, AWQC, etc.).
Inorganic Listing Determination Titanium DioxideListing Background Document August, 200026
Table 3.10 - Initial Screening Analysis for Primary and Secondary Gypsum
Constituent
Primary gypsum (KP-SO-01)
Primary gypsum (MI-SO-04)
Secondary gypsum (MI-SO-03)
HBL(mg/L)
AWQC(mg/L)
SSL (1)(mg/kg)
Total(mg/kg)
SPLP(mg/L)
Total(mg/kg)
SPLP(mg/L)
Total(mg/Kg)
SPLP(mg/L)
Aluminum 2,210 <0.011 (1) 227 0.24 6,420 <0.1 16 0.087 47,000
Antimony 0.6 0.02 <0.5 0.014 3.2 0.055 0.0063 0.014 32*
Arsenic <0.5 <0.005 <0.5 <0.005 0.8 <0.0035 0.00074 0.000018 5
Barium 0.8 0.03 1.2 0.02 (2) 7.9 0.033 1.1 1 440
Boron <10 0.10 <5 0.06 6.1 0.28 1.4 NA 26
Cadmium <0.5 <0.005 <0.5 <0.005 1.7 <0.005 0.0078 0.0022 4
Calcium 135,000 648 189,000 634 135,000 662 NA NA NA
Chromium 232 <0.005 30.5 <0.005 693 0.001 (2) 23 0.74 120,000*
Cr,+6 <0.40 <0.02 (3) <0.40 <0.02 (3) 32.7 <0.02 (3) 0.047 0.011 37
Cobalt <0.5 <0.005 <0.5 <0.005 3.9 <0.005 0.94 NA 6.7
Copper 0.9 0.003 <0.5 0.003 2.4 0.005 1.3 0.0031 17
Iron 953 <0.05 767 <0.05 59,000 <0.05 5 1 430,000*
Lead 1.5 0.002 (2) <0.5 0.002 (2) <0.5 0.003 (2) 0.015 0.0025 16
Magnesium 224 9.6 121 5.85 896 33.7 NA NA NA
Manganese 13.3 0.13 9.3 0.13 673 3.1 0.73 0.05 3,800
Molybdenum
<0.5 <0.005 <0.5 <0.005 0.9 <0.005 0.078 NA 400*
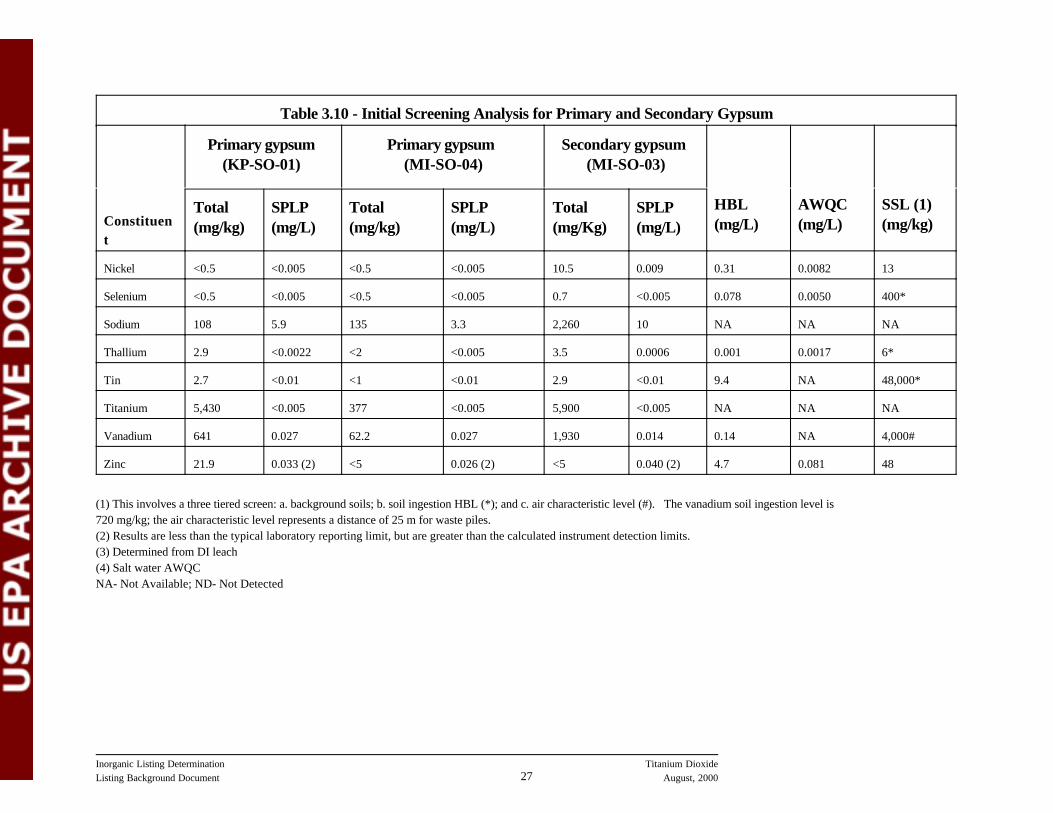
Table 3.10 - Initial Screening Analysis for Primary and Secondary Gypsum
Constituent
Primary gypsum (KP-SO-01)
Primary gypsum (MI-SO-04)
Secondary gypsum (MI-SO-03)
HBL(mg/L)
AWQC(mg/L)
SSL (1)(mg/kg)
Total(mg/kg)
SPLP(mg/L)
Total(mg/kg)
SPLP(mg/L)
Total(mg/Kg)
SPLP(mg/L)
Inorganic Listing Determination Titanium DioxideListing Background Document August, 200027
Nickel <0.5 <0.005 <0.5 <0.005 10.5 0.009 0.31 0.0082 13
Selenium <0.5 <0.005 <0.5 <0.005 0.7 <0.005 0.078 0.0050 400*
Sodium 108 5.9 135 3.3 2,260 10 NA NA NA
Thallium 2.9 <0.0022 <2 <0.005 3.5 0.0006 0.001 0.0017 6*
Tin 2.7 <0.01 <1 <0.01 2.9 <0.01 9.4 NA 48,000*
Titanium 5,430 <0.005 377 <0.005 5,900 <0.005 NA NA NA
Vanadium 641 0.027 62.2 0.027 1,930 0.014 0.14 NA 4,000#
Zinc 21.9 0.033 (2) <5 0.026 (2) <5 0.040 (2) 4.7 0.081 48
(1) This involves a three tiered screen: a. background soils; b. soil ingestion HBL (*); and c. air characteristic level (#). The vanadium soil ingestion level is720 mg/kg; the air characteristic level represents a distance of 25 m for waste piles.(2) Results are less than the typical laboratory reporting limit, but are greater than the calculated instrument detection limits.(3) Determined from DI leach(4) Salt water AWQCNA- Not Available; ND- Not Detected

Inorganic Listing Determination Titanium DioxideListing Background Document August, 200028
Cement and Agricultural Use Scenarios
Kemira uses on-specification gypsum in cement. This cement scenario was screened out by comparingthe total levels for Sample KP-SO-01 to Soil Screening Levels (SSL). The agricultural chemicalsscenario is associated with Kemira which sells the gypsum to peanut farmers for use as a nutrient usedto harden the peanut shells. This scenario also was screened by comparing the total constituentanalyses to the Soil Screening Levels. All constituents are below these levels and thus this scenarioscreens out.
Landfill Scenario
As discussed previously, the gypsum is landfilled at the Millennium facility in Baltimore. In addition,CPC (a barium carbonate manufacturer) indicated that they purchase red gypsum from Kemira for usein treating their wastes. CPC’s wastes are subsequently landfilled. The assessment of the landfillscenario is discussed below.
The Millennium Inorganic Chemicals (Baltimore, MD) landfill was screened for impacts via thegroundwater pathway from the primary and secondary gypsum since both are placed in the landfill. The primary and secondary gypsum were assessed separately because they are generated at differentplaces in the process. The SPLP results for both the primary and the secondary gypsum were used toscreen potential releases to groundwater since there is no contact with municipal landfill leachate in thereported management practices. For the primary gypsum (MI-SO-04), antimony was detected abovethe HBL, and aluminum and manganese were detected above the AWQC. For the secondary gypsum(MI-SO-03), the constituents detected above the HBL were antimony, manganese, and arsenic. Theconstituents detected above the AWQC are manganese and arsenic. Copper and nickel were detectedabove the saltwater AWQC.
The primary gypsum contained lower levels of leachable metals than the secondary gypsum so theassessment focused on the secondary gypsum as it was more likely to show risk and the managementscenarios are identical (they are placed in the same on-site industrial landfill). Furthermore, the volumeof the primary gypsum sent to the landfill was smaller. Therefore, the on-site Subtitle D industrial landfillscenario was assessed for secondary gypsum via the surface water pathway and potential drinkingwater pathway because of the HBL and AWQC exceedences. (See Section 3.2.5 for a discussion ofthe selection of these modeling pathways - this onsite landfill was modeled for several wastes.) See1998 RCRA 3007 Survey for the Inorganic Chemicals Industry for the Millennium facility in Baltimore,MD for the relevant maps showing unit locations. Refer to the Risk Assessment for the ListingDeterminations for Inorganic Chemical Manufacturing Wastes (August 2000) for the details of the risk assessment.
Piles Scenario
As discussed above, both facilities use piles to store and dry their gypsum prior to landfilling or sales. We believe neither site uses pads or liners for these piles and so the groundwater and air pathwayassociated with the pile scenario were assessed. For Millennium, the landfill scenario for this waste,

20U.S. Environmental Protection Agency, "Revised Risk Assessment for the Air Characteristic Study", EPA530-R-99-019a, November 1999, Table 4-3.
Inorganic Listing Determination Titanium DioxideListing Background Document August, 200029
which is more conservative due to its size in comparison to the pile, is being assessed. Therefore, nofurther assessment of the groundwater impact from the piles at this site is necessary.
For Kemira, the SPLP leachate results (because the waste is managed onsite with no potential contactwith municipal landfill leachate) for Sample KP-SO-01 were used to screen the groundwater pathwayassociated with the pile scenario. Antimony was detected above the HBL and manganese wasdetected above the AWQC; both exceedences were minor. Initially, the gypsum is placed on“gypsum hills” for two weeks for drying, and then moved to piles under a roof (no side walls) prior tosales. The risk assessment was not conducted on the potential impact of drinking water wells becausea risk assessment for the more conservative Millennium landfill scenario was conducted. Kemira isunaware of any drinking water wells in the vicinity and the pile is substantially smaller than theMillennium landfill. The Kemira waste also contains lower toxic constituent levels than Millennium. EPA assumed the Kemira surface water scenario screens out based on the (a) low required dilutionattenuation factor (DAF) to reduce exposure concentrations below HBLs, (b) small exposed pilesurface area, estimated dimensions of 30 feet in diameter and 12 feet in height, (c) the 3,500 footdistance to the two nearby rivers, and (d) expected large dilution in either of the two rivers. See USGSmap in Appendix C for map of facility and adjoining water bodies.
For the air pathway, both facilities place their piles outside in exposed areas. This scenario wasassessed by comparing all constituent levels to soil screening levels. In all cases the constituents werebelow these levels. All were below the direct soil ingestion levels, except for one sample of vanadiumin secondary gypsum (this makes up a small fraction of the gypsum generated at the site), which wasonly 2.7 times the ingestion level. It is highly unlikely that any particulate release from the waste pilewould approach the soil ingestion level for this constituent. Furthermore, the vanadium level is belowthe air characteristic level, which assessed risks from direct inhalation.20 Therefore, air releases fromthe pile were not assessed further.
3.2.4 Digestion Scrubber Water from the Sulfate Process
Waste Generation Management
Digestion scrubber wastewaters are generated when the vented gases from the digestion process arescrubbed to remove the acidic components. Both facilities that produce titanium dioxide via the sulfateprocess generate this waste. At Millennium Inorganic Chemicals (Baltimore, MD), this waste isneutralized and sent to a dedicated settling pond. The neutralized wastewater is discharged via anNPDES permitted outfall. At Kemira Pigments, Inc., the sulfate process digestion scrubber water iscommingled with wastewaters from the chloride and sulfate process in the facility’s wastewatertreatment system. Kemira’s sulfate process digestion scrubber wastewater is assessed as part of the“Commingled Wastewaters from the Chloride and Sulfate Processes” waste category in Section 3.2.6. Table 3.11 presents the management practices and the volumes of the digestion scrubber water fromthe sulfate process at each facility.

21Antimony also exceeded the HBL (1.7xHBL), but at such low levels that it was assumed it would screenout. Antimony also was detected in the equipment blank at 0.05 mg/L.
Inorganic Listing Determination Titanium DioxideListing Background Document August, 200030
Table 3.11 - Waste Management Practices and Volumes for Digestion Scrubber Waterfrom the Sulfate Process
Facility (RIN #) ManagementTotal Volume
(MT/yr)
Kemira Pigments, Inc. (RIN 1) Tank, surface impoundment 298,000
Millennium Inorganic Chemicals;Baltimore, MD (RIN 5)
Dedicated surface impoundment 1,702,333
Waste Characterization
A sample was collected from Millennium Inorganic Chemicals to characterize the sulfate processscrubber wastewater. Sample MI-WW-03 was collected from a pipe that transports the wastewaterinto the settling pond. Total analyses were conducted on the sample collected. TCLP and SPLPanalyses were not necessary because the solids content was within the method criterion.
Results of Initial Screening
This surface impoundment scenario was screened using the analytical results for Sample MI-WW-03. The surface impoundment is separated from the Patapsco River by a dike. In addition, Maryland DEQmade the facility install an asphaltic slurry wall between the impoundment and the river. There arerecovery wells at the slurry wall that collect groundwater, which is then sent to the wastewatertreatment system for processing. Groundwater flow is east towards the river. Table 3.12 presents theanalytical results for the constituents detected in the filtrate with the corresponding HBLs and/orAWQC. The constituents detected21 above the AWQC were aluminum, manganese, and mercury. Copper was detected above the saltwater AWQC.
This dedicated surface impoundment was assessed for potential surface water releases. The drinkingwater well scenario is not of concern since there are no HBL exceedences of concern. Refer to theRisk Assessment for the Listing Determinations for Inorganic Chemical Manufacturing Wastes(August 2000) for the details of the full risk assessment.
Table 3.12 - Initial Screening Analysis for Digestion Scrubber Waterfrom the Sulfate Process
ConstituentMI-WW-03Total (mg/L)
HBL(mg/L)
AWQC( mg/L)
Aluminum 0.58 16 0.087

Table 3.12 - Initial Screening Analysis for Digestion Scrubber Waterfrom the Sulfate Process
ConstituentMI-WW-03Total (mg/L)
HBL(mg/L)
AWQC( mg/L)
Inorganic Listing Determination Titanium DioxideListing Background Document August, 200031
Antimony 0.010 B 0.0063 0.014
Barium 0.041 1.1 1
Boron 1.35 1.4 NA
Chromium 0.013 23 0.74
Chromium, hexavalent <0.02 0.047 0.011
Copper 0.006 1.3 0.0031
Iron 1.53 5 1
Manganese 0.58 0.73 0.05
Mercury 0.0032 0.0047 0.000050
Molybdenum 0.006 0.078 NA
Nickel 0.008 0.31 0.0082
Titanium 0.44 B NA NA
Vanadium 0.03 0.14 NA
NA- Not available
3.2.5 Sulfate Process Digestion Sludge
Waste Generation and Management
This sludge is generated as a result of the clarification of the titanyl sulfate liquor that is produced duringthe digester step. Both of the facilities that produce titanium dioxide via the sulfate process reportedgenerating this waste. Dedicated management units are used at both facilities to manage this waste.
Kemira Pigments Inc, reported generating 34,000 metric tons per year of this waste (RIN 2) which isneutralized in a tank in the first step of the waste treatment process. The settled solids from theneutralization tank (RIN 13) are then sent to a dedicated surface impoundment where the solids aresettled out. The solids remain in place and the supernatant effluent from this pond is sent to thewastewater treatment system and is commingled with other process wastewaters from the sulfate andthe chloride process in the wastewater treatment system. At Millennium Inorganic Chemicals, thiswaste is generated during clarification of the titanyl sulfate product to remove unreacted solids andother impurities. The solids are filtered out using a filter press, accumulated in temporary waste piles,and then sent to the facility’s on-site Subtitle D industrial landfill via dump truck. Table 3.13 presentsthe waste management practices and volumes for the digestion sludge at both facilities.

Inorganic Listing Determination Titanium DioxideListing Background Document August, 200032
Table 3.13 - Waste Management Practices and Volumes for Sulfate Process DigestionSludge
Facility (RIN #) Management PracticeTotal Volume
(MT/yr)
Kemira Pigments, Inc.(RIN 13)
Solids settling in dedicated unlined surfaceimpoundment, supernatant wastewater goesto wastewater treatment system
17,000
Millennium InorganicChemicals; Baltimore,MD (RIN 7)
On-site Subtitle D industrial landfill 24,494
Waste Characterization
Two samples of this waste were collected during record sampling for characterization purposes, one ateach of the generating facilities.
At Kemira Pigments, Inc. Sample KP-SO-03 was collected from a small weir at the point ofneutralization prior to the neutralized slurry going to the dedicated surface impoundment. It was notpractical to collect a sample of the sludge from the impoundment due to limited accessibility. At theMillennium Baltimore facility, Sample MI-SO-02 was collected directly after the filter press bycompositing four scoops of the solids from four locations around the covered waste pile.
Totals, TCLP, and SPLP analyses were conducted on the samples. A summary of the analytical resultsfor each sample is presented in Appendix A. Detailed reports of the record sampling trip, the completeset of analytical data and the validation reports are available in the “Sampling and Analytical DataReport For Record Sampling and Characterization of Wastes from the Inorganic Titanium DioxideManufacturing Sector” for Millennium Inorganic Chemicals (Baltimore, MD) and Kemira Pigments. These reports are available in the docket for this rulemaking.
Results of Screening Analysis
Summary
The on-site landfill at Millennium required further assessment for (1) infiltration and dilution of leachateinto the Patapsco River and (2) landfill leachate contamination of potential drinking water wells in thevicinity. The surface impoundment at Kemira did not require further assessment based on initialscreening against health based criteria.
Both scenarios, the on-site landfill and surface impoundment, were screened by comparing actual SPLPleachate analytical results with the HBL and AWQC for each constituent. Table 3.14 presents theanalytical results for the constituents detected in the SPLP leachate with the corresponding HBLsand/or AWQC.

Inorganic Listing Determination Titanium DioxideListing Background Document August, 200033
Kemira, On-Site Surface Impoundment Scenario
For the on-site surface impoundment scenario at Kemira, manganese was the only constituent detectedin the SPLP at levels above the HBL; the exceedence is less than a factor of 1.3. Zinc and nickel weredetected above the AWQC at factors of 2.5 and 2.7, respectively. This surface impoundment is lessthan 100 ft from the Savannah River. There are no groundwater receptors in the vicinity. Anygroundwater intercepting a plume from this impoundment discharges into the river, resulting in asignificant DAF which clearly would be many orders of magnitude greater than the lowest AWQCexceedence factor of 2.5. Therefore, it was determined that the surface impoundment scenario atKemira does not pose a threat to human health or the environment and no further risk assessment wasnecessary.
Millennium, Landfill Scenario
For the landfill scenario (Millennium Baltimore), antimony and vanadium were the constituents ofconcern detected in the SPLP above the HBL. The constituents of concern detected above theAWQC were aluminum, copper, lead, manganese, and zinc. Because the landfill is located in anestuary, the lower of the freshwater or saltwater AWQC for the protection of aquatic life were used toscreen against the toxicants in the sludge managed in the landfill. The landfill is located approximately1,000 feet from the Patapsco River.
Because of residential areas in the vicinity of the landfill, a drinking water well scenario was assessed. See USGS map of facility and surrounding area in Appendix C. Groundwater flow is expected to bewest to east toward the river. See Update of the Hazardous Waste Groundwater Task Force;April, 1998. Definitive flow direction studies, however, are not available. (The referenced studyaddresses an on-site surface impoundment, which is located about 1,000 feet from the landfill andimmediately adjacent to the river). Millennium was not aware of any drinking water wells in the area. Although there no known groundwater receptors downgradient of the landfill, we modeled impacts onpotential drinking water wells in the residential area to the southeast of the site (Swan Creek). Notethat Susan Egan (MD Department of Public Works) confirmed that the Swan Creek community,located 2,500 ft south of the Millennium facility, is on a public water supply. Refer to the RiskAssessment for the Listing Determinations for Inorganic Chemical Manufacturing Wastes(August 2000) for the details of the full risk assessment.
The landfill scenario was also assessed for infiltration and dilution to the Patapsco River. Theunderlying soils for the on-site surface impoundment located near the landfill are characterized as clayand silt, except in the northeast quarter where the underlying sediment is a beach sand. However, weused the soils information from national data bases (e.g., STATSGO) to characterize the soilsunderlying the landfill. Using calculated infiltration rates to the river using the landfill model and the riverflow rate, we calculated the DAF and compared it against the HBLs. The flushing rate for theriver/estuary is reported to be 201 to 206 cubic meters per second according to Carl F. Cerco of theU.S. Army Corps of Engineers. Refer to the Risk Assessment for the Listing Determinations forInorganic Chemical Manufacturing Wastes (August 2000) for the details of the full risk assessment.

Inorganic Listing Determination Titanium DioxideListing Background Document August, 200034
Table 3.14 - Initial Screening Analysis for Sulfate Process Digestion Sludge
Constituent
MI-SO-02(Landfill Scenario)SPLP (mg/L)
KP-SO-03 (SurfaceImpoundment Scenario)SPLP (mg/L)
HBL(mg/L)
AWQC(mg/L)
Aluminum 2.0 <0.01 16 0.087
Antimony 0.023 <0.005 0.0063 0.014
Barium 0.07 0.061 1.1 1
Boron 0.23 0.53 1.4 NA
Calcium 0.9 796 NA NA
Chromium 0.17 <0.005 23 0.74
Cr +6 <0.02 <0.02 0.047 0.011
Cobalt <0.005 <0.005 0.94 NA
Copper 0.37 <0.005 1.3 0.0031
Iron 12.0 <0.05 5 1
Lead 0.004 (1) <0.005 0.015 0.0025
Magnesium 5.5 146 -- NA
Manganese 0.36 0.93 0.73 0.05
Mercury <0.00011 (1) <0.0002 0.0047 0.000050
Molybdenum <0.005 <0.005 0.078 NA
Nickel 0.007 0.022 0.31 0.0082
Sodium 3.6 998 NA NA
Thallium <0.0022 <0.005 0.0013 0.0017
Tin <0.01 <0.01 9 NA
Titanium 0.28 <0.005 NA NA
Vanadium 0.42 <0.005 0.14 NA
Zinc 0.30 0.20 4.7 0.081
(1) Results are less than the typical laboratory reporting limit, but are greater than the calculated instrument detectionlimits.NA- Not Available

Inorganic Listing Determination Titanium DioxideListing Background Document August, 200035
3.2.6 Commingled Wastewaters from the Chloride and Sulfate Process
Waste Generation
As indicated above in Section 3.2.1, the two facilities that use both the chloride and sulfate processes toproduce titanium dioxide, commingle the wastewaters generated at various points in the sulfate and thechloride production processes.
Chloride Process Wastewaters
At Kemira Pigments, the chloride process wastewaters that are included in this category are neutralizedwastewaters from the scrubbing of the chlorinator off-gases and the product finishing wastewater. TheMillennium Inorganic Chemicals (Baltimore, MD) chloride process wastewaters include the acidicdigestion scrubber wastewaters and wastewater from purification of titanium tetrachloride generatedduring chlorination (coke and ore/acid mixture).
Sulfate Process Wastewaters
At Kemira, the sulfate process wastewaters include the wastewaters from scrubbing of gases producedduring digestion, evaporator condensate from the precipitation unit, the calciner scrubber wastewater,the sulfate waste sludge settling pond supernatant (as described above in Section 3.2.5) and productfinishing wastewaters. At Millennium Inorganic Chemicals (Baltimore, MD) sulfate processwastewaters include the calciner scrubber wastewater and finishing wastewaters.
Waste Management Practices
Both facilities commingle the wastewaters described above prior to being treated in their on-sitewastewater treatment systems.
Kemira Pigments, Inc.
At Kemira, the wastewater treatment system is comprised of a concrete neutralization tank followed bya series of unlined settling ponds. The effluent from the settling ponds is discharged via a permittedNPDES outfall.
Millennium Inorganic Chemicals, Inc.
At Millennium Inorganic Chemicals (Baltimore, MD) the wastewater treatment system consists oftanks for neutralization and a series of unlined settling ponds. The effluent from the settling ponds isdischarged via a permitted NPDES outfall.
Table 3.15 presents the wastewaters that are managed in the unlined units that are a part of the

22Includes “Chloride Waste Acid” (RIN 7) volume.
Inorganic Listing Determination Titanium DioxideListing Background Document August, 200036
wastewater treatment systems at each facility.
Table 3.15 - Commingled Wastewaters from the Chloride and Sulfate Process
Facility Wastewater (RIN #)Total Volume
(MT/yr)
Kemira Pigments Digestion Scrubber Purge (RIN 1) 298,000
Primary Pond Effluent/Sulfate SludgePond (RIN 3)
325,000
Evaporator Condensate (RIN 4) 7,945,000
Calciner Scrubber (RIN 5) 298,000
Neutralized chloride acid (RIN 17)22 831,000
Finishing wastewater (RIN 9) 3,150,000
Millennium Inorganic Chemicals;Baltimore, MD
Purification Wastewater (RIN 1) 1,578,120
Scrubber Wastewater/HCl (RIN 2) 4,536
Calciner Scrubber Wastewater (RIN 8) 1,380,781
Finishing Wastewater (RIN 13) 373,594
Waste Characterization
Samples of this waste were collected at both the Millennium and Kemira facilities. At KemiraPigments, Inc., Sample KP-WW-01 was collected at the point where the weir discharges the effluentinto the first settling pond. At the Millennium facility in Baltimore, Sample MI-WW-04 was collectedof the treated wastewater from the lime neutralization process of the wastewater treatment systemupstream of the first settling pond.
Totals and SPLP filtrate analyses were conducted on the samples. The samples contained high levelsof solids as a result of the facilities’ practice of mixing waste solids and wastewaters in the same unit. To isolate the impact of the wastewater on the environment from that of the sludge, we conducted theSPLP on the waste matrix, and separately analyzed the filtrate and the leachate generated from theleaching step.
A summary of the analytical data results are presented in Appendix A. Detailed reports of the recordsampling trips, the complete set of analytical data and the validation reports is available in the“Sampling and Analytical Data Report For Record Sampling and Characterization of Wastes from theInorganic Titanium Dioxide Manufacturing Sector” for Millennium Inorganics (Baltimore, MD) andKemira Pigments. These reports are available in the docket for this rulemaking.
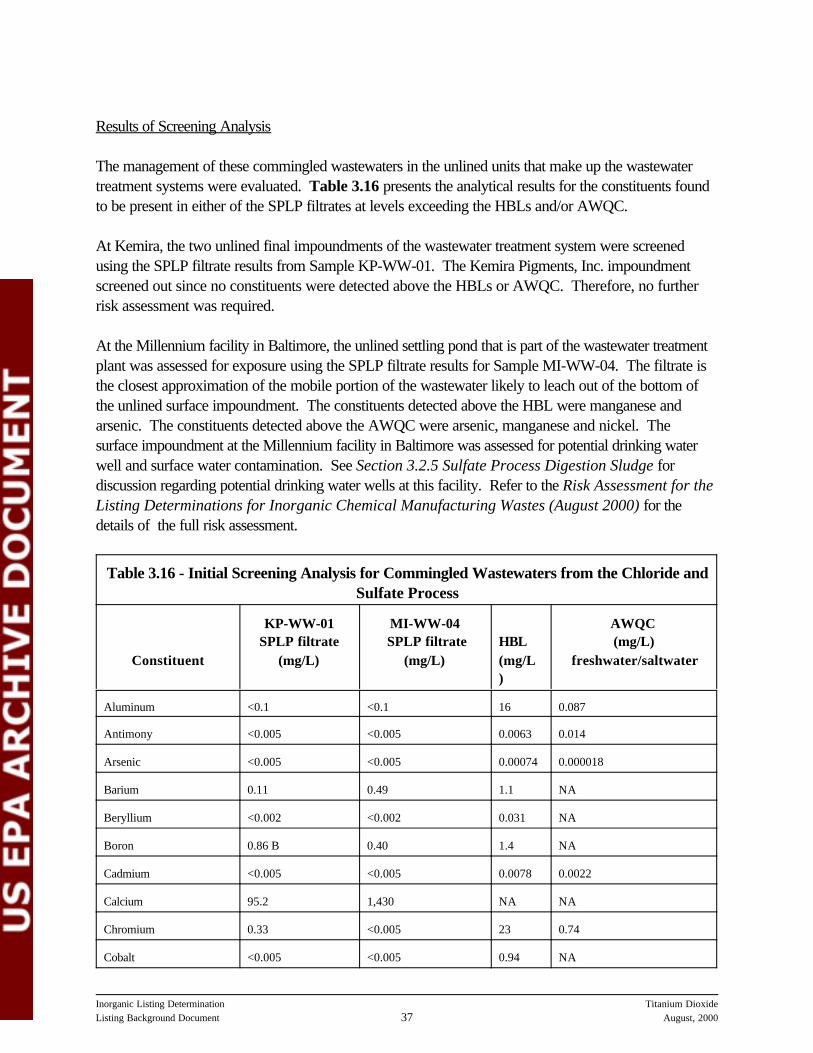
Inorganic Listing Determination Titanium DioxideListing Background Document August, 200037
Results of Screening Analysis
The management of these commingled wastewaters in the unlined units that make up the wastewatertreatment systems were evaluated. Table 3.16 presents the analytical results for the constituents foundto be present in either of the SPLP filtrates at levels exceeding the HBLs and/or AWQC.
At Kemira, the two unlined final impoundments of the wastewater treatment system were screenedusing the SPLP filtrate results from Sample KP-WW-01. The Kemira Pigments, Inc. impoundmentscreened out since no constituents were detected above the HBLs or AWQC. Therefore, no furtherrisk assessment was required.
At the Millennium facility in Baltimore, the unlined settling pond that is part of the wastewater treatmentplant was assessed for exposure using the SPLP filtrate results for Sample MI-WW-04. The filtrate isthe closest approximation of the mobile portion of the wastewater likely to leach out of the bottom ofthe unlined surface impoundment. The constituents detected above the HBL were manganese andarsenic. The constituents detected above the AWQC were arsenic, manganese and nickel. Thesurface impoundment at the Millennium facility in Baltimore was assessed for potential drinking waterwell and surface water contamination. See Section 3.2.5 Sulfate Process Digestion Sludge fordiscussion regarding potential drinking water wells at this facility. Refer to the Risk Assessment for theListing Determinations for Inorganic Chemical Manufacturing Wastes (August 2000) for thedetails of the full risk assessment.
Table 3.16 - Initial Screening Analysis for Commingled Wastewaters from the Chloride andSulfate Process
Constituent
KP-WW-01SPLP filtrate
(mg/L)
MI-WW-04 SPLP filtrate
(mg/L)HBL(mg/L)
AWQC (mg/L)
freshwater/saltwater
Aluminum <0.1 <0.1 16 0.087
Antimony <0.005 <0.005 0.0063 0.014
Arsenic <0.005 <0.005 0.00074 0.000018
Barium 0.11 0.49 1.1 NA
Beryllium <0.002 <0.002 0.031 NA
Boron 0.86 B 0.40 1.4 NA
Cadmium <0.005 <0.005 0.0078 0.0022
Calcium 95.2 1,430 NA NA
Chromium 0.33 <0.005 23 0.74
Cobalt <0.005 <0.005 0.94 NA

Table 3.16 - Initial Screening Analysis for Commingled Wastewaters from the Chloride andSulfate Process
Constituent
KP-WW-01SPLP filtrate
(mg/L)
MI-WW-04 SPLP filtrate
(mg/L)HBL(mg/L)
AWQC (mg/L)
freshwater/saltwater
Inorganic Listing Determination Titanium DioxideListing Background Document August, 200038
Copper <0.005 <0.005 1.3 0.0090/0.0031
Iron <0.05 <0.05 5 1
Lead <0.003 <0.003 0.015 0.0025
Magnesium 180 152 NA NA
Manganese <0.005 9.95 0.73 0.05
Mercury <0.0002 <0.0002 0.0047 0.000050
Molybdenum 0.045 0.006 0.078 NA
Nickel <0.005 0.011 0.31 0.052/ 0.0082
Potassium 129 17.3 NA NA
Silver <0.001 <0.001 0.078 0.0034 /0.0019
Sodium 236 661 NA NA
Thallium <0.005 0.004 0.0013 0.0017
Tin <0.01 <0.01 9.4 NA
Titanium <0.005 <0.005 NA NA
Vanadium 0.045 <0.005 0.14 NA
Zinc <0.05 0.072 4.7 0.12 /0.081
NA- Not Available*Results are less than the typical laboratory reporting limit, but are greater than the calculated instrument detectionlimits.
3.2.7 Wastewater Treatment Sludges from Commingled Chloride and Sulfate ProcessWastewaters
Waste Generation and Management
This waste is generated at the two facilities that use both the chloride and sulfate processes to producetitanium dioxide. As indicated above, these facilities commingle the chloride process solids associatedwith the titanium tetrachloride portion of the titanium dioxide manufacturing process, which are Bevill-exempt mineral processing wastes under the Bevill exemption, with other non-Bevill-exemptwastewaters in the facility’s wastewater treatment system. After commingling of the Bevill-exempt

Inorganic Listing Determination Titanium DioxideListing Background Document August, 200039
solids with the non-Bevill-exempt wastewaters, the resulting solids from the commingled wastewaterscontain a mixture of Bevill-exempt and non-Bevill-exempt wastewater treatment solids. Data providedby these two facilities show that this waste contains at least 35 percent non-Bevill-exempt solids. Table3.17 shows the calculation deriving the percent solids from the various wastewater streams based onthe reported information for the Millennium facility in Baltimore, MD. The percent solids for theKemira facility are expected to contain a similarly high percentage of non-exempt solids (perhapshigher) because Kemira’s exempt solids from the reactor are managed in a dedicated unit, and becauseKemira (unlike Millennium) also commingles their sulfate process digestion scrubber wastes.
Table 3.17 - Estimation of Non-Exempt Solids Contribution to WastewaterTreatment Sludges from Commingled Chloride and Sulfate Process Wastewaters at
Millennium Baltimore
Waste (RIN #) Volume (MT/yr)Estimated SolidsLoading (MT/yr)
Wastewaters bearing Bevill-exempt Solids*
Unreacted coke and ore, waste acids (RIN 1) 1,578,120 154,656
Chloride process air emission scrubber (RIN 2) 4,536 667
Wastewaters bearing non-Bevill-exempt solids**
Air emissions scrubber (sulfate process) (RIN 8) 380,781 69,039
Finishing wastewater (sulfate process) (RIN 13) 373,594 18,680
Totals 3,337,031 243,042
Percent non-Bevill-exempt solids = [(69,039+18,680)/243,042] = 36%
*Calculated using % solids measured during EPA’s record sampling (see Analytical Data Report)**Calculated using % solids reported in Table III.1 of RCRA 3007 Survey
At Kemira Pigments, Inc., all of the wastewaters generated during the production of titanium dioxide viathe sulfate and chloride process are sent to the wastewater treatment system. A sludge is generated inthe final settling pond of the facility’s wastewater treatment system. The solids are dredged from thisimpoundment, filtered using a filter press, placed in piles for drainage and then sent to an on-siteindustrial landfill. At Millennium Inorganics (Baltimore, MD), the sludge is also dredged from thewastewater treatment system settling impoundment, filter pressed, and then placed in an on-siteindustrial landfill.
Table 3.18 presents the management of the wastewater treatment sludges from commingled chlorideand sulfate process wastewaters at each facility.

Inorganic Listing Determination Titanium DioxideListing Background Document August, 200040
Table 3.18 - Waste Management Practices and Volumes for Wastewater TreatmentSludges from Commingled Chloride and Sulfate Process Wastewaters
Facility (RIN #) Management Practice Total Volume (MT/yr)
Millennium Inorganic Chemical Plant,Baltimore, Maryland (RIN 4)
Dredged from impoundment,filter pressed, placed in on-siteindustrial landfill
93,121
Kemira Pigments, Inc. (RIN 14) Dredged from impoundment,filter pressed, drainage piles,placed in on-site industriallandfill
66,000
Waste Characterization
This waste was characterized using samples collected from the Kemira and Millennium Baltimorefacilities. At Kemira, Sample KP-SO-02 was collected as a composite sample from the waste pileimmediately after the filter press. At the Millennium facility in Baltimore, Sample MI-SO-01 wascollected immediately after the filter press as a composite sample of eight scoops from the sludge pile,prior to the sludge being transferred to the on-site landfill.
Totals, TCLP, and SPLP analyses were conducted on both samples. Table 3.19 presents theanalytical results for the constituents detected in the filtrate and the corresponding HBLs and/orAWQC. A summary of the analytical results for each sample is presented in Appendix A. Detailedreports of the record sampling trips, the complete set of analytical data, and the validation reports areavailable in the “Sampling and Analytical Data Report For Record Sampling and Characterization ofWastes from the Inorganic Titanium Dioxide Manufacturing Sector” for Millennium Inorganics(Baltimore, MD) and Kemira Pigments. These reports are available in the docket for this rulemaking.
Results of Initial Screening Analysis
Summary
At Kemira the exposure pathways were found not to present a risk under the initial screening analysisand required no further assessment. The landfill at the Millennium facility in Baltimore required furtherassessment beyond the initial screening analysis for infiltration of landfill leachate to the river pathwayand the groundwater contamination pathway due to exceedences of both the HBL and AWQC.
Kemira Facility
The SPLP results for Sample KP-SO-02 were used to screen the pile and landfill scenario at KemiraPigments, Inc. for impacts to the groundwater and air pathways.
For the groundwater pathway from the piles and landfill, the SPLP results showed HBL exceedencesfor antimony, arsenic, molybdenum, and thallium. However, the only potential receptors are the

23Phone log. Ron Josephson (EPA) to Jim McKirgan, Chatham County, GA Department of Public Works. December 22, 1999.
24Maps are provided in Appendix C.
25 U.S. Environmental Protection Agency, "Revised Risk Assessment for the Air Characteristic Study",EPA 530-R-99-019a, November 1999, Table 4.1 (Landfills)
Inorganic Listing Determination Titanium DioxideListing Background Document August, 200041
Savannah and Wilmington Rivers and the adjacent marshlands. A review of various land-use maps andgroundwater flow directions, and interviews with local county and plant officials about drinking watersources for the nearest communities, has revealed there is no reason to believe that any potentiallyimpacted drinking water wells exist.23,24 Even if such wells were to exist, none of the four potentialconstituents of concern require DAFs greater than three, and two of the four constituents of concernsare only being assessed at ½ the detection limit. The closest potential downgradient communities are3,000 feet away from the management units. With respect to potential impacts on the rivers andadjacent marshes, again, none of the constituents of concern require DAFs greater than three to bebelow the AWQC. Considering these factors, it is assumed that the groundwater pathway does notpresent a risk under the initial screening analysis.
Assessment of the air pathway for the piles and landfill indicates that all constituent concentrations inKemira’s waste sample are below the SSLs except thallium which is only slightly greater than the soilingestion HBL (a factor of 1.3 higher). Thus, the air pathway was not assessed further.
Millennium’s Baltimore, Maryland Facility
The SPLP results for Sample MI-SO-01 were used to screen the landfill scenario at MillenniumBaltimore for impacts to surface water and drinking water wells. The constituents detected in the SPLPabove the AWQC were aluminum, arsenic, manganese, and thallium; manganese also exceeded theHBL. Therefore, further risk modeling assessment was required for the wastewater treatment sludgesin the landfill scenario. Based on the distance of the landfill from the Patapsco River and the fact thatthe potential existence of drinking water wells to the southeast, the groundwater pathway cannot beruled out and both scenarios required a full risk assessment. See Section 3.2.5 Sulfate ProcessDigestion Sludge for a discussion of the assumptions for this assessment. Refer to the RiskAssessment for the Listing Determinations for Inorganic Chemical Manufacturing Wastes(August 2000) for the details of the full risk assessment.
Assessment of the air pathway for the landfill indicates no significant risks are likely from particulatereleases for several reasons. First, all constituents were below soil ingestion levels, except for manganese and vanadium, which exceed the soil ingestion levels by a factors of about 3. In both casesthese constituents were below the air characteristic levels for waste piles shown in Table 3.19. The aircharacteristic levels calculated for landfills were an order of magnitude higher (20,000 mg/kg in bothcases)25 It is also highly unlikely that wind blown particulates from landfills would be significant due tothe common usage of longer-term cover at landfills. Furthermore, the waste is generated and disposedof as a wet sludge, making the formation particulates less likely.

26TEF=Toxicity Equivalent Factor, provided in parentheses following congener name. Dioxin TEQscalculated using WHO-TEFs.
Inorganic Listing Determination Titanium DioxideListing Background Document August, 200042
Table 3.19 - Initial Screening Analysis for Wastewater Treatment Sludges fromCommingled Chloride and Sulfate Process Wastewaters
ConstituentMI-SO-01Totals(mg/kg)
MI-SO-01SPLP (mg/L)
KP-SO-02Totals(mg/kg)
KP-SO-02 SPLP(mg/L)
HBL(mg/L)
AWQC(mg/L)
SSL(1) (mg/kg)
Aluminum 8,740 0.24 4,520 <0.1 16 0.087 47,000
Antimony 0.6 0.006 0.8 0.013 0.0063 0.014 32*
Arsenic 1.6 0.00005 (2) 2.4 <0.0035 0.00074 0.000018 5
Barium 49.8 0.06 40.2 0.078 1.1 1 440
Beryllium 1.5 <0.002 0.4 <0.002 0.031 NA 160*
Boron 9.4 0.15 16.9 0.28 1.4 NA 26
Chromium 1,230 0.001 (2) 712 0.001 (2) 23 0.74 120,000*
Cobalt 2.6 <0.005 2.4 <0.005 0.94 NA 6.7
Copper 16.7 <0.002 12.6 0.004 1.3 0.0031 17
Iron 62,700 <0.05 36,500 <0.05 5 1 430,000*
Lead 1.3 0.002 (2) 0.002 0.001 (2) 0.015 0.0025 400*
Manganese 12,700 2.63 3,130 <0.005 0.73 0.05 3,800*(3)
Molybdenum 1.6 0.013 10.6 0.093 0.078 NA 400*(4)
Nickel 59.9 <0.005 47.1 <0.005 0.31 0.0082 1,600*
Silver 0.6 <0.001 1.5 <0.001 0.078 0.0019 SWAWQC
400*
Thallium 3.0 0.003 (2) 8.1 <0.0022 0.0013 0.0017 6.4 (4)
Tin 2.7 <0.01 75.2 <0.01 9 NA 48,000*
Titanium 5,270 <0.005 8,310 <0.005 NA NA NA
Vanadium 2,320 0.004 (2) 1,570 0.039 0.14 NA 720 (5)
Zinc 2.9 0.025 (2) 31.5 0.02 (2) 4.7 0.08 24,000*
Dioxins/Furans (ng/kg for totals and ng/L for SPLP)
2378-TCDF(TEF=0.1)26
1710 <0.010 2.2 <0.010 NA NA NA

Table 3.19 - Initial Screening Analysis for Wastewater Treatment Sludges fromCommingled Chloride and Sulfate Process Wastewaters
ConstituentMI-SO-01Totals(mg/kg)
MI-SO-01SPLP (mg/L)
KP-SO-02Totals(mg/kg)
KP-SO-02 SPLP(mg/L)
HBL(mg/L)
AWQC(mg/L)
SSL(1) (mg/kg)
Inorganic Listing Determination Titanium DioxideListing Background Document August, 200043
Total TCDF 2,530 <0.010 21.5 <0.010 NA NA NA
2378-TCDD (1.0) <0.3 <0.010 <0.3 <0.010 NA NA NA
Total TCDD 1.9 <0.010 <0.3 <0.010 NA NA NA
12378-PeCDF (0.05) 6,580 <0.051 3.3 <0.052 NA NA NA
23478 PeCDF (0.5) 921 <0.051 2.0 <0.052 NA NA NA
Total PeCDF 9,870 <0.051 8.5 <0.052 NA NA NA
12378-PeCDD (1.0) <1.6 <0.051 <1.3 <0.052 NA NA NA
Total PeCDD <1.6 <0.051 <1.3 <0.052 NA NA NA
123478 HxCDF (0.1) 12,200 <0.051 4.7 <0.052 NA NA NA
123678 HxCDF (0.1) 1,890 <0.051 <1.3 <0.052 NA NA NA
234678 HxCDF (0.1) 102 <0.051 <1.3 <0.052 NA NA NA
123789 HxCDF (0.1) 1,380 <0.051 1.7 <0.052 NA NA NA
Total HxCDF 18,100 <0.051 6.3 <0.052 NA NA NA
123478-HxCDD(0.1)
<16.1 <0.051 <1.3 <0.052 NA NA NA
123678-HxCDD(0.1)
<16.1 <0.051 <1.3 <0.052 NA NA NA
123789-HxCDD(0.1)
<16.1 <0.051 <1.3 <0.052 NA NA NA
Total HxCDD <16.1 <0.051 <1.3 <0.052 NA NA NA
1234678 HpCDF(0.01)
3,620 <0.051 2.0 <0.052 NA NA NA
1234789 HpCDF(0.01)
5,920 <0.051 3.0 <0.052 NA NA NA
Total HpCDF 11,500 <0.051 6.6 <0.052 NA NA NA
1234678-HpCDD(0.01)
<16.1 <0.051 <1.3 <0.052 NA NA NA
Total HpCDD <16.1 <0.051 <1.3 <0.052 NA NA NA
OCDF (0.0001) 22,000 <0.100 55 <0.100 NA NA NA

Table 3.19 - Initial Screening Analysis for Wastewater Treatment Sludges fromCommingled Chloride and Sulfate Process Wastewaters
ConstituentMI-SO-01Totals(mg/kg)
MI-SO-01SPLP (mg/L)
KP-SO-02Totals(mg/kg)
KP-SO-02 SPLP(mg/L)
HBL(mg/L)
AWQC(mg/L)
SSL(1) (mg/kg)
Inorganic Listing Determination Titanium DioxideListing Background Document August, 200044
OCDD (0.0001) <197 0.110 3.3 <0.100 NA NA NA
2378-TCDD TEQ 2,615 0.00011 ng/Lor 0.11 ppq
2.08 ND 0.0071ng/L
0.0031 ng/L 45 ng/kg*(6)
NA- Not Available(1) Soil screening levels (SSLs) are based on soil background, except where soil ingestion levels are otherwise notedby the symbol “*”; in all cases the background levels are equivalent to or below soil ingestion levels. Aircharacteristic levels are noted when soil ingestion levels are exceeded. See “Risk Assessment for the ListingDeterminations for Inorganic Chemical Manufacturing Wastes (August 2000) in the docket for details and sourcesof the HBLs and SSLs.(2) Results are less than the typical laboratory reporting limit, but are greater than the calculated instrument detectionlimits.(3) The air characteristic level is 3,000 mg/kg at 25m and drops to 30,000 at 150m.(4) An air characteristic level has not been determined.(5) The air characteristic level is 4,000 mg/kg at 25 m.
3.2.8 Waste Acid (Ferric Chloride) from the Chloride-Ilmenite Process
Waste Generation and Management
This waste is generated at all three facilities that use the chloride-ilmenite process in the production oftitanium dioxide. The ferric chloride waste acid is generated after solids are removed from the acidifiedsolution of metal-chloride solids, unreacted coke and ore solids, and impurities formed during the initialchlorination reaction.
The DuPont facilities in Mississippi and Tennessee generate the majority of their Bevill-exempt- solidsfrom the filtration of this waste acid. The DuPont facility in Mississippi disposes of its ferric chloridewaste acid in an on-site underground injection well. The DuPont facility in Tennessee recycles aportion of this waste back to the reaction and uses the remaining portion in the production of sodiumchloride (NaCl). At this facility, an iron carbonate (FeCO3) waste is generated as a result of the NaClproduction. As discussed in Section 3.3, this FeCO3 residual was not evaluated further.
The DuPont facility in Delaware has a slightly different process. The majority of their Bevill-exemptsolids are generated prior to the generation of the acid. Once the waste acid is removed from theproduct stream, this facility adds a processing chemical to their waste acid, removes solids, and storesthe acid in tanks (as well as in an impoundment when their tank capacity is exceeded). The waste acidis then marketed for use as a wastewater and drinking water treatment reagent. Table 3.20 presentsthe management of this waste at each facility.

Inorganic Listing Determination Titanium DioxideListing Background Document August, 200045
Table 3.20 - Waste Management Practices and Volumes for Waste Acid (ferric chloride)from the Chloride-Ilmenite Process
Facility Management Total Volume
E.I. DuPont de Nemours & Co.; DeLisle Plant;Pass Christian, MS (RIN 5)
On-site hazardous wasteunderground injection well
1,035,869 MT/yr
E.I. DuPont de Nemours & Co.; New Johnsonville,TN
Used on-site in the productionof NaCl
791,840 MT/yr
E.I. DuPont de Nemours & Co.; Edge Moor, DE Storage in tanks and surfaceimpoundment prior to sales
60,000-70,000 dry tonat <40% concentration
(~148,000 MT/yr)
Waste Characterization
The DuPont facility in Mississippi reported D002, D007 and D008 waste codes for this waste in theirRCRA §3007 questionnaire. All three generators also reported this waste with pH levels of 1 or less. One sample collected during record sampling was used to characterize this waste. Sample DPE-WW-03 was collected at the influent to the storage pond at the DuPont Edge Moor facility during recordsampling.
EPA conducted totals and SPLP analyses on Sample DPE-WW-03. There was not sufficient samplevolume to conduct TCLP analysis of EPA’s sample. A summary of EPA’s analytical results ispresented in Table 3.21 and Appendix A. Detailed reports of the record sampling trips, the completeset of analytical data, and the validation reports are available in the “Sampling and Analytical DataReport for Record Sampling and Characterization of Wastes From the Inorganic Titanium DioxideManufacturing Sector” for the DuPont Edge Moor facility. This report is available in the docket for thisrulemaking.
Results of Screening Analysis
EPA determined that this waste does not warrant listing because of the characteristic nature of thiswaste and the adequacy of existing enforcement authorities under Subtitle C to ensure propermanagement of this waste. Note, however, that, as described above, EPA did collect a sample of thismaterial during our field investigation (see Table 3.21).
As detailed below, all three generators of the ferric chloride waste acid acknowledge the hazardousnature of this waste.
DuPont DeLisle Plant; Pass Christian, MS
The DuPont facility in Mississippi disposes of this waste via deep well injection onsite and assignedthree separate characteristic codes to this material (D002, D007, D008). In their survey response, the

27The TC standards for both chromium and lead is 5 mg/L.
Inorganic Listing Determination Titanium DioxideListing Background Document August, 200046
Mississippi facility reported TCLP results for chromium as 443 mg/L and for lead as 167 mg/L 27. TheMississippi facility manages its ferric chloride via a permitted Class I injection well. DuPont’s no-migration petition for the injection wells was approved by EPA Region IV via a letter dated May 5,2000. There is no land placement of the material prior to injection. The Safe Drinking Water Actprovides regulatory control of the deep well injection scenario.
DuPont New Johnsonville, TN Facility
The Tennessee facility uses the waste acid (RIN 10) to manufacture sodium chloride (NaCl), generatinga FeCO3 waste stream. DuPont characterized RIN 10 as having a pH of 1 and total chromium levelsof 144 mg/kg and total lead levels of 64.9 mg/kg.
As discussed in Section 3.3.2, the FeCO3 waste stream did not warrant further assessment because it isgenerated from an out-of scope production process. The use of ferric chloride in the production ofNaCl was not investigated in depth because there was no known exposure route associated with themanagement of the material prior to inserting it into a non-consent decree production process. Note,however, that EPA did collect a sample of the ferric carbonate residual (DPN-SO-03) during our fieldinvestigation. The results of the ferric carbonate analyses are provided in Table 3.22.
DuPont Edge Moor, DE Facility
Sample DPE-WW-03 was collected at the Delaware facility prior to placement of this material on theland. Our pH analysis showed a pH of less than 1.0. The facility’s split sample results showed TCLPresults of 415 mg/L for chromium and 49 mg/L for lead.

Inorganic Listing Determination Titanium DioxideListing Background Document August, 200047
Table 3.21 - Summary of Analytical Results for Waste Acid (ferric chloride) from the Chloride-Ilmenite Process
Constituent
DPE-WW-03 (mg/L) DuPont Split Sample
HBL(mg/L)
AWQC(mg/L)Totals
SPLPFiltrate
SPLPLeachate
Totals(mg/L)
TCLP(mg/L)
Aluminum 2,090 2,360 77.2 2,520 16 0.087
Antimony 2.26 1.8 <0.5 <50 0.0063 0.014
Arsenic <2.5 <3.5 <0.5 <0.25 <20 0.00074 0.000018
Barium 15.5 19.6 15.6 13.9 16.8 1.1 1
Beryllium <2 <0.24 <0.2 <2.5 0.031 NA
Boron 2.32 10.3 <5 <13 1.4 NA
Cadmium 5.09 3.03 <0.5 <10 <2.0 0.0078 0.0022
Calcium 94.3 310 16.8 53.8 NA NA
Chromium 101 113 3.76 119 415 23 0.74
Chromium, +6 <0.2 NR 43 0.047 0.011
Cobalt 8.44 6.86 <0.5 7.44 0.94 NA
Copper 29.2 27.1 1.56 15.9 1.3 0.0090
Iron 164,000 175,000 5,310 [cbi] 5 1
Lead 62.2 76.4 2.66 70.9 49 0.015 0.0025
Magnesium 245 385 12.2 150 NA NA
Manganese 1,770 1,790 51.6 1,870 0.73 0.05
Mercury 0.021 0.0007 0.0002 <0.020 <0.020 0.0047 0.000050
Molybdenum 31 34.6 1.48 16.8 0.078 NA
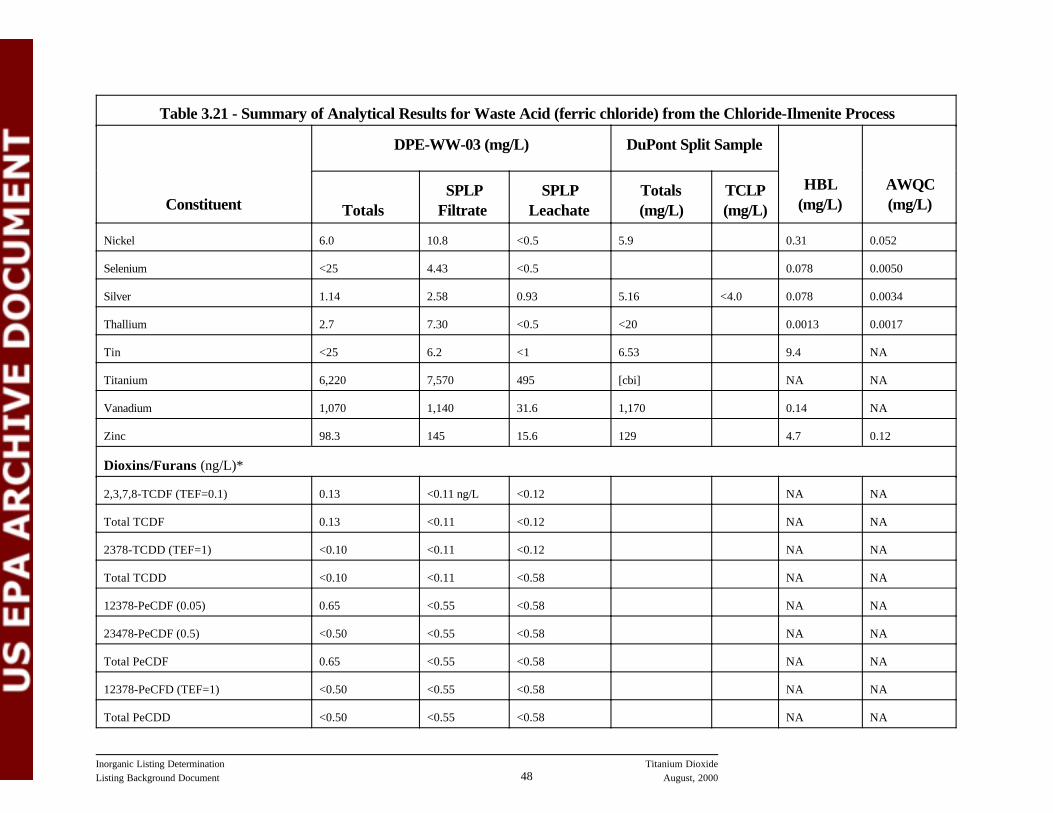
Table 3.21 - Summary of Analytical Results for Waste Acid (ferric chloride) from the Chloride-Ilmenite Process
Constituent
DPE-WW-03 (mg/L) DuPont Split Sample
HBL(mg/L)
AWQC(mg/L)Totals
SPLPFiltrate
SPLPLeachate
Totals(mg/L)
TCLP(mg/L)
Inorganic Listing Determination Titanium DioxideListing Background Document August, 200048
Nickel 6.0 10.8 <0.5 5.9 0.31 0.052
Selenium <25 4.43 <0.5 0.078 0.0050
Silver 1.14 2.58 0.93 5.16 <4.0 0.078 0.0034
Thallium 2.7 7.30 <0.5 <20 0.0013 0.0017
Tin <25 6.2 <1 6.53 9.4 NA
Titanium 6,220 7,570 495 [cbi] NA NA
Vanadium 1,070 1,140 31.6 1,170 0.14 NA
Zinc 98.3 145 15.6 129 4.7 0.12
Dioxins/Furans (ng/L)*
2,3,7,8-TCDF (TEF=0.1) 0.13 <0.11 ng/L <0.12 NA NA
Total TCDF 0.13 <0.11 <0.12 NA NA
2378-TCDD (TEF=1) <0.10 <0.11 <0.12 NA NA
Total TCDD <0.10 <0.11 <0.58 NA NA
12378-PeCDF (0.05) 0.65 <0.55 <0.58 NA NA
23478-PeCDF (0.5) <0.50 <0.55 <0.58 NA NA
Total PeCDF 0.65 <0.55 <0.58 NA NA
12378-PeCFD (TEF=1) <0.50 <0.55 <0.58 NA NA
Total PeCDD <0.50 <0.55 <0.58 NA NA

Table 3.21 - Summary of Analytical Results for Waste Acid (ferric chloride) from the Chloride-Ilmenite Process
Constituent
DPE-WW-03 (mg/L) DuPont Split Sample
HBL(mg/L)
AWQC(mg/L)Totals
SPLPFiltrate
SPLPLeachate
Totals(mg/L)
TCLP(mg/L)
Inorganic Listing Determination Titanium DioxideListing Background Document August, 200049
123478-HxCDF (0.1) 7.70 <0.55 <0.58 NA NA
123678-HxCDF (0.1) <0.50 <0.55 <0.58 NA NA
234678-HxCDF (0.1) <0.50 <0.55 <0.58 NA NA
123789-HxCDF (0.1) <0.50 <0.55 <0.58 NA NA
Total HxCDF 8.2 <0.55 <0.58 NA NA
123478-HxCDD (0.1) <0.50 <0.55 <0.58 NA NA
123678-HxCDD (0.1) <0.50 <0.55 <0.58 NA NA
123789-HxCDD (0.1) <0.50 <0.55 <0.58 NA NA
Total HxCDD <0.50 <0.55 <0.58 NA NA
1234678-HpCDF (0.01) 5.3 <0.55 <0.58 NA NA
1234789-HpCDF (0.01) 5.00 <0.55 <0.58 NA NA
Total HpCDF 13.0 <0.55 <0.58 NA NA
1234678-HpCDD (0.01) <0.50 <0.55 <0.58 NA NA
Total HpCDD <0.50 <0.55 <0.58 NA NA
OCDF (0.0001) 1,200 1.3 <1.2 NA NA
OCDD (0.0001) <1.0 <1.1 <1.2 NA NA
2378 TCDD TEQ ** 1.038 ng/L 0.00013ng/L
ND 0.0071 ng/L 0.0031 ng/L
NA- Not Available

Inorganic Listing Determination Titanium DioxideListing Background Document August, 200050
* TEF = Toxicity Equivalent Factor** Toxicity Equivalents (TEQ) calculated using WHO-TEFs.

Inorganic Listing Determination Titanium DioxideListing Background Document August, 200051
Table 3.22 - Summary of Analytical Results for Ferric Carbonate
Constituent
DPN-SO-03
HBL(mg/L)
AWQC(mg/L)
Total(mg/kg)
TCLP(mg/L)
SPLP(mg/L)
Aluminum 15,600 <1 0.17 16 0.087
Antimony <0.5 <0.5 0.009 0.0063 0.014
Arsenic 2.1 <0.5 <0.0035 0.00074 0.000018
Barium 97.5 1.7 0.30 1.1 1
Beryllium 1.4 <0.02 <0.002 0.031 NA
Boron <10 <2 0.21 1.4 NA
Cadmium 2.0 <0.05 <0.005 0.0078 0.0022
Calcium 12,300 59.9 2.2
Chromium 3,040 0.01 <0.005 23 0.74
Chromium, +6 NA <0.02 0.047 0.047 0.011
Cobalt 6.1 <0.05 <0.005 0.94 NA
Copper 41.2 <0.25 0.007 1.3 0.0090
Iron 180 <0.05 5 5 1
Lead 46.0 0.02 0.002 0.015 0.0025
Magnesium 13,100 120 24.1
Manganese 30,200 59.4 0.18 0.73 0.05
Mercury <0.1 <0.002 <0.0002 0.0047 0.000050
Molybdenum 7.2 <0.2 0.12
Nickel 138 1.1 0.002 0.31 0.052
Selenium 1.5 <0.5 <0.005 0.078 0.0050
Silver 3.9 <0.1 <0.001 0.078 0.0034
Thallium <2 <2 <0.005 0.0013 0.0017
Tin <1 <0.5 <0.01
Titanium 10,000 0.04 0.002
Vanadium 6,690 0.05 0.14 0.14 NA
Zinc <5 0.54 0.041 4.7 0.12
Dioxins/Furans (ng/L)

Table 3.22 - Summary of Analytical Results for Ferric Carbonate
Constituent
DPN-SO-03
HBL(mg/L)
AWQC(mg/L)
Total(mg/kg)
TCLP(mg/L)
SPLP(mg/L)
Inorganic Listing Determination Titanium DioxideListing Background Document August, 200052
2,3,7,8-TCDF (TEF=0.1) <0.7 n/a <0.01
Total TCDF 44.9 n/a <0.01
2378-TCDD (TEF=1) <0.7 n/a <0.01
Total TCDD <0.7 n/a <0.01
12378-PeCDF (0.05) 46.2 n/a <0.052
23478-PeCDF (0.5) 11.7 n/a <0.052
Total PeCDF 193 n/a <0.052
12378-PeCFD (TEF=1) <3.4 n/a <0.052
Total PeCDD <3.4 n/a <0.052
123478-HxCDF (0.1) 235 n/a <0.052
123678-HxCDF (0.1) 26.2 n/a <0.052
234678-HxCDF (0.1) 10.4 n/a <0.052
123789-HxCDF (0.1) <3.4 n/a <0.052
Total HxCDF 518 n/a <0.052
123478-HxCDD (0.1) <3.4 n/a <0.052
123678-HxCDD (0.1) <3.4 n/a <0.052
123789-HxCDD (0.1) <3.4 n/a <0.052
Total HxCDD <3.4 n/a <0.052
1234678-HpCDF (0.01) <3.4 n/a <0.052
1234789-HpCDF (0.01) <3.4 n/a <0.052
Total HpCDF <3.4 n/a <0.052
1234678-HpCDD (0.01) <3.4 n/a <0.052
Total HpCDD <3.4 n/a <0.052
OCDF (0.0001) 7,590 n/a <0.1
OCDD (0.0001) 10.4 n/a <0.1
2378 TCDD TEQ ** 39.3 n/a ND 0.0071 ng/L 0.0031ng/L

28See Letter from Jonathan R. Bacher, Manager, Ash marketing, VFL Technology Corporation, to Ms.Nancy Marker, Solid Waste Management Branch - DNREC, re DNREC Approval SWA-95/29, DuPont Iron-Rich FilterCake, dated July 27, 1999
Inorganic Listing Determination Titanium DioxideListing Background Document August, 200053
n/a = TCLP analysis for Dioxins/Furans not performed.
3.2.9 Non-Bevill-exempt Nonwastewaters from the Chloride-Ilmenite Process
Waste Generation and Management
Non-Bevill-exempt nonwastewaters are generated in several different ways at the three chloride-ilmenite facilities. All three DuPont facilities that produce titanium dioxide via the chloride-ilmeniteprocess commingle their process wastewaters and subsequently generate wastewater treatment solidsthat fall within the non-Bevill-exempt nonwastewater category. This waste category consists of solidsthat drop out in on-site settling ponds or are filtered out of the treated wastewater prior to discharge. As discussed below, the wastewater treatment solids contain both Bevill-exempt and non-Bevill-exempt components.
Non-Bevill-exempt nonwastewaters may be generated at several other places in the chloride-ilmeniteprocess. Vanadium compounds removed from the titanium tetrachloride product stream are not Bevillexempt and are commingled with the Bevill-exempt solids and/or ferric chloride waste acid streams. Inaddition, solids removed from ferric chloride waste acid at the Edge Moor site after the end of mineralprocessing are also not Bevill exempt and are covered by this waste category.
DuPont Edge Moor, DE Facility
The facility commingles several sources of solids and markets the mixture as Iron Rich®, also describedas Solids Co-Product I, or SCP I. DuPont describes this material as “soil for landfill capping” andreports annual generation of 120,000 - 140,000 short tons. DuPont has asserted a variety of end usesfor the Iron Rich®.28 The predominant recent use has been for the construction of dikes to containdredged river sediments at various Corp of Engineer disposal facilities in the vicinity of the plant. Thisscenario was assessed as comparable to an industrial Subtitle D landfill scenario. The Iron Rich® hasalso been used as daily cover at a municipal landfill (demonstration project) and as final cover for aclosed onsite landfill. Other proposed uses include use as subsidence fill at a closed municipal landfill,structural fill by the local Port Authority, surcharge for road bed compaction, and construction of awildlife refuge at the site of a closed landfill.
The primary components of this waste are:
1. “Iron-containing metal chlorides and coke/ore solids” from the Reaction Area (80%) that resultfrom the neutralization of RIN 14 (“solids to neutralizer”) and RIN 4 (“metal chlorides withcoke and ore solids”)
2. “Iron-containing metal chlorides and coke/ore solids from ... Solids Co-Product II area”

Inorganic Listing Determination Titanium DioxideListing Background Document August, 200054
(<10%) that results from the removal of solids from ferric chloride (i.e., SCP II)
3. “Iron hydroxide slurry from the HCl neutralizer and from the wastewater treatment system”(>10%), that results from wastewater treatment.
Each of these components of Iron Rich® contain differing proportions of Bevill-exempt and non-Bevill-exempt materials. The first category consists of the bulk of the Bevill-exempt solids generated by EdgeMoor. An unknown portion of this stream is derived from non-Bevill-exempt vanadium compoundsremoved from the titanium tetrachloride product stream. The second category consists of solidsremoved from this facility’s ferric chloride waste acid stream. These solids are not Bevill-exemptbecause they are removed from the waste acid after mineral processing has ended and the productionof ferric chloride has begun (marked by the addition of a processing chemical prior to solids removal). This stream is also derived to an unknown degree from non-Bevill-exempt vanadium compoundsremoved from the titanium tetrachloride product stream. The third category, wastewater treatmentsolids, contains both Bevill-exempt and non-Bevill-exempt solids. Table 3.23 summarizes thecontribution of Bevill-exempt and non-Bevill-exempt solids to Edge Moor’s wastewater treatmentsolids.
Table 3.23 - Estimation of Non-Bevill Exempt Solids Contribution to DuPont Edge Moor’sWastewater Treatment Solids
Waste (RIN #)Volume (MT/yr)
Estimated SolidsLoading*(MT/yr)
Wastewaters bearing Bevill-exempt Solids
Pre-treated reaction area scrubber (RIN 1) 10,521** 52.6
Coke and ore washwater (RIN 2) 97,611 9,761
Fume disposal/HCl scrubber (RIN 3) 169,609 3,392
Calcium chloride filtrate (RIN 8) 605,513 182
Purification scrubber (RIN 12) 1,769,305 0
Wastewaters bearing non-Bevill-exempt solids
Chlorine scrubber water (RIN 7) 4,354 0
OVS scrubber water (RIN 9) 59,589 595
Oxidation and finishing wastewater (RINs 6 & 11) 4.53 <0.5***
Dryer scrubber wastewater (RIN 13) 124,259 621
Totals 2,840,765 14,604
Percent non-Bevill-exempt solids = [(0+595+0.5+621)/14,604] = 8.3%*Calculated using % solids reported in Table III.1 of RCRA §3007 Survey

Inorganic Listing Determination Titanium DioxideListing Background Document August, 200055
**RIN 1 volume of 70,110 MT/yr includes commingled RIN 9 volume of 59,589 MT/yr. For this analysis,the volumes are reported separately to reflect the potential for RIN 9 to contain non-Bevill-exempt solids
subject to the listing.***Loading estimate provided in August, 2000 correspondence from Angie Strzelecki, DuPont.
Overall, we estimate that the Iron Rich® is currently comprised of over 10% non-Bevill-exempt solids(<10% ferric chloride solids + 0.08* 10% WWT solids). This estimate is based on the facility’sengineering estimates of solids content in their various untreated wastewaters (EPA does not haveindependent analytical results) and does not account for any non-Bevill-exempt volume contributionsassociated with the vanadium compounds that are removed from the titanium tetrachloride product.
New Johnsonville, TN Facility
At the DuPont facility in Tennessee, non-Bevill-exempt nonwastewaters are predominantly associatedwith wastewater treatment sludge. Table 3.24 summarizes the contributions of Bevill-exempt and non-Bevill-exempt solids to the Tennessee facility wastewater treatment solids.
Table 3.24 - Estimate of Non-Bevill Exempt Solids Contribution to DuPont NewJohnsonville’s Wastewater Treatment Solids
Waste (RIN #)Volume (MT/yr)
Estimated SolidsLoading*(MT/yr)
Wastewaters bearing Bevill-exempt Solids
Purification area scrubber water (RIN 3) 82,000 1
Maintenance scrubber (Reaction Area) (RIN 103) 11,112 <1
Recovered ore wastewater (RIN 4) 442,800 8,856
Pre-treated Reaction Area scrubber water (RIN 2) 246,000 36,900
Reaction startup scrubber (RIN 102) 3,268 <1
Reaction maintenance wastewater (RIN 109) 1,900 20
Wastewaters bearing non-Bevill-exempt solids
Chlorine unloading scrubber water (RIN 101) 82 12
Maintenance washhouse scrubber water (RIN 105) 4,540 681
HCl Storage tank scrubber water (RIN 5) 9,110 <1
Hillside Pond wastewater** (RIN 106) 102,200 1,042
Finishing wastewaters (RINs 6, 111, & 113) 6,566,998 600 - 2,000***
Washhouse wash water (RIN 114) 454 5
Oxidation scrubber water (RIN 104) 6 1

Table 3.24 - Estimate of Non-Bevill Exempt Solids Contribution to DuPont NewJohnsonville’s Wastewater Treatment Solids
Waste (RIN #)Volume (MT/yr)
Estimated SolidsLoading*(MT/yr)
Inorganic Listing Determination Titanium DioxideListing Background Document August, 200056
Totals 7,470,470 48,818 +/- 700
Percent non-Bevill-exempt solids = [(12+681+0+1042+1300+5+1)/48,818] = 6.2% (+/- 1.3)
*Calculated using % solids reported in Table III.1 of RCRA §3007 Survey.**Contains Bevill-exempt and non-Bevill-exempt solids; breakdown not provided.
***Loading estimate provided in August, 2000 correspondence from Angie Strzelecki, DuPont.
This facility’s wastewater treatment system includes a series of three unlined surface impoundments. The solids from the first two surface impoundments are dredged and placed in the “Hillside Pond” forde-watering. When this “Hillside Pond” is full, the solids are removed and placed in the facility’s on-site landfill. These solids contain a mixture of Bevill-exempt and non-Bevill-exempt solids.
The Bevill-exempt coke and ore solids from filtering the iron chloride waste acid are placed in the samelandfill as wastewater treatment sludge. These solids are commingled with non-Bevill-exempt materialto the extent that the mass contains vanadium compounds removed from the titanium tetrachloridestream.
DuPont DeLisle Plant; Pass Christian, MS Facility
The DuPont facility in Mississippi generates wastewater treatment solids which contain non-Bevill-exempt solids. Table 3.25 summarizes the contributions of Bevill-exempt and non-Bevill-exempt solidsto the Mississippi facility’s wastewater treatment solids.
Table 3.25 - Estimation of Non-Bevill Exempt Solids Contribution to DuPont DeLisle’sWastewater Treatment Solids
Waste (RIN #)Volume (MT/yr)
Estimated SolidsLoading*(MT/yr)
Wastewaters bearing Bevill-exempt Solids
Pre-treated reaction scrubber water (RIN 3) 328,802 49,320
Return water from Borrow Pit (RIN 109) 191,000 2
Wastewater from Reaction Emergency Scrubber (RIN 102) 15,536 2,331
Wastewaters bearing non-Bevill-exempt solids

Table 3.25 - Estimation of Non-Bevill Exempt Solids Contribution to DuPont DeLisle’sWastewater Treatment Solids
Waste (RIN #)Volume (MT/yr)
Estimated SolidsLoading*(MT/yr)
Inorganic Listing Determination Titanium DioxideListing Background Document August, 200057
Chlorine unloading scrubber water (RIN 101) 202 30
HCl storage scrubber (RIN 9) 3,835 <1
Oxidation scrubber (RIN 6 ) 9,259 1,385
Oxidation and Finishing wastewater (RIN 8, 103, & 104) 2,859,842 200 - 600**
Totals 3,408,476 53,468 (+/- 200)
Percent non-Bevill-exempt solids = [(30+0+1385+400)/53,468] = 3.4% (+/- 0.4)*Calculated using % solids reported in Table III.1 of RCRA §3007 Survey
**Loading estimate provided in August, 2000 correspondence from Angie Strzelecki, DuPont.
The commingled wastewaters are managed in lined on-site surface impoundments. The wastewatertreatment solids are dredged from the surface impoundments and placed in the “Borrow Pit area” at thefacility. The solids are dredged periodically and placed in an on-site landfill. The Bevill-exempt cokeand ore solids from filtering the iron chloride waste acid are placed in the same landfill as thewastewater treatment sludge. These solids are commingled with non-Bevill-exempt vanadiumcompounds removed from the titanium tetrachloride product stream.
Table 3.26 summarizes the management for this waste category at each facility. This table reflectscurrent management of commingled non-Bevill-exempt and Bevill-exempt streams and provides arough estimate of the portion of the commingled waste that is covered by the non-Bevill–exemptnonwastewater category. We have no data to estimate loading contributions associated with non-Bevill-exempt vanadium compounds that are removed from the titanium tetrachloride product streamand are commingled with the Bevill-exempt solids removed from the ferric chloride waste acid stream.
Table 3.26 - Waste Management Practices and Volumes for Non-Bevill-exemptNonwastewaters from the Chloride-Ilmenite Process
Facility (RIN #) Management Practices
Total VolumeCombined Bevillexempt and non-
Bevill exempt(MT/yr)
Estimatednon-Bevill-
exemptVolume(MT/yr)
E.I. DuPont de Nemours & Co. Edge Moor, DE (RIN 23)
Combines with other solids,stores in piles, and markets
as “Iron Rich®”
117,936 12,800

Table 3.26 - Waste Management Practices and Volumes for Non-Bevill-exemptNonwastewaters from the Chloride-Ilmenite Process
Facility (RIN #) Management Practices
Total VolumeCombined Bevillexempt and non-
Bevill exempt(MT/yr)
Estimatednon-Bevill-
exemptVolume(MT/yr)
Inorganic Listing Determination Titanium DioxideListing Background Document August, 200058
E.I. DuPont de Nemours & Co. New Johnsonville, TN (RIN 108)
Wastewater treatmentsludges de-watered andplace in on-site landfill*
18,890 1,200
E.I. DuPont de Nemours & Co.;DeLisle Plant; Pass Christian, MS(RIN 108)
Wastewater treatmentsludges dredged from on-sitesurface impoundment, de-watered, and placed in on-site landfill*
17,237 600
*Volumes from solids removed from ferric chloride were not reported.
Waste Characterization
Two samples were collected during record sampling to characterize this waste. At the Delawarefacility, Sample DPE-SO-01 was collected from the Iron Rich® dewatering operation just prior totruck loading operation for off-site transport to the customer. At the Tennessee facility, Sample DPN-SO-01 was collected directly from the “Hillside Pond.”
Totals, TCLP, and SPLP analyses were conducted on both samples. A summary of the analyticalresults for each sample is presented in Appendix A. Detailed reports of the record sampling trips, thecomplete set of analytical data, and the validation reports are available in the “Sampling and AnalyticalData Report For Record Sampling and Characterization of Wastes from the Inorganic TitaniumDioxide Manufacturing Sector” for the DuPont Edge Moor, DE and New Johnsonville, TN facilities. These reports are available in the docket tor today’s rulemaking.
Results of Screening Analysis
The SPLP results for Sample DPN-SO-01, and the total, SPLP, and TCLP results for Sample DPE-SO-01 were used for the initial screening analysis for this waste. Table 3.27 presents the constituentsdetected in the SPLP analysis of Sample DPN-SO-1 and the TCLP analysis for Sample DPE-SO-01and the associated HBLs and AWQC for the constituents.

Inorganic Listing Determination Titanium DioxideListing Background Document August, 200059
Table 3.27 - Initial Screening Analysis for Non-Bevill-exempt Nonwastewaters from the Chloride-Ilmenite Process
ConstituentDPE-SO-01Total(mg/kg)
DPE-SO-01TCLP (mg/L)
DPE-SO-01SPLP (mg/L)
DPN-SO-01Total (mg/kg)
DPN-SO-01SPLP (mg/L)
HBL(mg/L)
AWQC(mg/L)
SSL (1)(mg/kg)
Aluminum 10,100 <1 <0.1 5,770 <0.1 16 0.087 47,000
Antimony 0.9 <0.021 (2) 0.02 0.7 0.021 0.0063 0.014 32*
Arsenic 2.2 <0.0035 0.001 2.8 <0.0035 0.00074 0.000018 5.2
Barium 178 2.4 (2) 0.92 49.6 0.12 1.1 1 440
Beryllium 1.2 <0.00024 <0.002 0.5 <0.002 0.031 NA 160*
Boron 30.0 1.7 0.61 24.5 0.45 1.4 NA 7,200
Cadmium 0.6 <0.0013 <0.005 0.0078 0.0022 4.3
Calcium 28,500 1,330 1,230 1,500 14.0 NA NA NA
Chromium 777 <0.05 0.002 499 <0.005 23 0.74 120,000*
Chromium, +6 <0.40 NA <0.02 <0.4 <0.02 (3) 0.047 0.011 37
Cobalt 44.5 0.43 <0.005 7.0 <0.005 0.94 NA 4,800*
Copper 28.5 0.014 (2) 0.003 15.8 0.003 1.3 0.0090 17
Iron 91,600 348 0.18 63,200 2.2 5 1 430,000
Lead 309 0.03 (2) 0.003 42.4 0.002 (2) 0.015 0.0025 400*
Magnesium 3,140 61.3 33.4 769 8.0 NA NA NA
Manganese 10,600 252 16.3 2,890 1.5 0.73 0.05 3,800* (4)
Mercury <0.1 <0.002 <0.0002 0.2 <0.0002 0.0047 0.00005 0.06
Molybdenum 7.4 0.026 (2) 0.005 4.5 0.006 0.078 NA 400*
Nickel 91.8 0.5 <0.005 59.8 0.007 0.31 0.052 1,600*

Table 3.27 - Initial Screening Analysis for Non-Bevill-exempt Nonwastewaters from the Chloride-Ilmenite Process
ConstituentDPE-SO-01Total(mg/kg)
DPE-SO-01TCLP (mg/L)
DPE-SO-01SPLP (mg/L)
DPN-SO-01Total (mg/kg)
DPN-SO-01SPLP (mg/L)
HBL(mg/L)
AWQC(mg/L)
SSL (1)(mg/kg)
Inorganic Listing Determination Titanium DioxideListing Background Document August, 200060
Selenium <0.5 <0.5 <0.005 0.5 <0.005 0.078 0.0050 400*
Silver <0.1 <0.1 <0.001 0.2 <0.001 0.078 0.0034 400*
Thallium 3.7 0.28 0.012 7.2 <0.00225 0.0013 0.0017 6.4*
Tin 53.2 0.025 <0.01 12.9 <0.01 9.4 NA 48,000*
Titanium 6,380 <0.05 <0.005 5,360 <0.005 NA NA NA
Vanadium 240 0.0003 (2) <0.005 1,060 <0.005 0.14 NA 720*
Zinc 122 1.1 (2) 0.03 57.2 0.073 (2) 4.7 0.12 24,000*
Dioxins/Furans (ng/kg; ng/L) (5)
2378-TCDF (TEF=0.1) 12.2 NA <0.010 121 <0.010 NA NA NA
Total TCDF 88.8 NA <0.010 506 <0.010 NA NA NA
2378-TCDD (TEF=1 ) <0.4 NA <0.010 <0.3 <0.010 NA NA NA
Total TCDD <0.4 NA <0.010 <0.3 <0.010 NA NA NA
12378PeCDF (0.05) 21.8 NA <0.051 371 <0.052 NA NA NA
23478PeCDF (0.5) 48.1 NA <0.051 91.0 <0.052 NA NA NA
Total PeCDF 141 NA <0.051 1,100 <0.052 NA NA NA
12378-PeCDD (TEF=1) <1.8 NA <0.051 <1.7 <0.052 NA NA NA
Total PeCDD <1.8 NA <0.051 <1.7 <0.052 NA NA NA
123478HxCDF (0.1) 237 NA <0.051 2,490 <0.052 NA NA NA

Table 3.27 - Initial Screening Analysis for Non-Bevill-exempt Nonwastewaters from the Chloride-Ilmenite Process
ConstituentDPE-SO-01Total(mg/kg)
DPE-SO-01TCLP (mg/L)
DPE-SO-01SPLP (mg/L)
DPN-SO-01Total (mg/kg)
DPN-SO-01SPLP (mg/L)
HBL(mg/L)
AWQC(mg/L)
SSL (1)(mg/kg)
Inorganic Listing Determination Titanium DioxideListing Background Document August, 200061
123678HxCDF (0.1) 8.1 NA <0.051 155 <0.052 NA NA NA
234678HxCDF (0.1) 2.5 NA <0.051 74.1 <0.052 NA NA NA
123789HxCDF (0.1) 5.6 NA <0.051 142 <0.052 NA NA NA
Total HxCDF 289 NA <0.051 3,370 <0.052 NA NA NA
123478-HxCDD (0.1) <1.8 NA <0.051 <1.7 <0.052 NA NA NA
123678-HxCDD (0.1) <1.8 NA <0.051 <1.7 <0.052 NA NA NA
123789-HxCDD (0.1) <1.8 NA <0.051 <1.7 <0.052 NA NA NA
Total HxCDD <1.8 NA <0.051 2.8 <0.052 NA NA NA
1234678HpCDF (0.01) 189 NA <0.051 1,520 <0.052 NA NA NA
1234789HpCDF (0.01) 126 NA <0.051 1,690 <0.052 NA NA NA
Total HpCDF 366 NA <0.051 3,710 <0.052 NA NA NA
1234678-HpCDD (0.01) <1.8 NA <0.051 <11.1 <0.052 NA NA NA
Total HpCDD <1.8 NA <0.051 15.8 <0.052 NA NA NA
OCDF (0.0001) 24,000 NA <0.100 60,700 <0.100 NA NA NA
OCDD (0.0001) 22.2 NA <0.100 404 <0.100 NA NA NA
2378 TCDD TEQ (5) 58.7 ppt NA ND 402 ppt ND 0.0071 ppt 0.0031 ppt 45 (6)
NA - not available; ND - non detect(1) Soil screening levels (SSLs) are based on soil background, except where soil ingestion levels are noted by the symbol “*”; in all cases the backgroundlevels are equivalent to or below soil ingestion levels. Air characteristic levels are noted when soil ingestion levels are exceeded. See “Risk Assessment for theListing Determinations for Inorganic Chemical Manufacturing Wastes (August 2000) in the docket for details and sources of the HBLs and SSLs.(2) Results are less than the typical laboratory reporting limit, but are greater than the calculated instrument detection limits.

Inorganic Listing Determination Titanium DioxideListing Background Document August, 200062
(3) Determined from DI water leach.(4) The air characteristic level is 3,000 mg/kg at 25m and drops to 30,000 at 150m.(5) TEQs calculated using WHO-TEFs.
(6) No air characteristic level has been determined.

Inorganic Listing Determination Titanium DioxideListing Background Document August, 200063
DuPont Edge Moor, DE Facility
As described above, this facility markets a material that has been used as Subtitle D landfill cover,structural fill, and containment dikes for dredged spoils that is in part derived from non-Bevill-exemptsolids (i.e., the filter solids from the production of ferric chloride and their wastewater treatment solids. The non-Bevill-exempt portion of the Iron Rich® is approximately 10% of the total volume of thiswaste. The entire volume of material was assessed in light of its current commingled status, theuncertainty associated with the actual percentage of non-Bevill-exempt material in the Iron-Rich®, andthe physical impossibility of collecting a sample of the non-Bevill-exempt-only portion of this material. Sample DPE-SO-01 was used to assess the Edge Moor facility’s management practices. The SPLPconstituents of concern exceeding the HBLs include antimony, arsenic, manganese, and thallium. Constituents exceeding the AWQC include antimony, arsenic, lead, manganese, and thallium. TheTCLP constituents of concern include antimony, arsenic, barium, boron, iron, lead, manganese, andthallium.
EPA assessed the risks for disposal in an off-site industrial D landfill because this seemed to best fit thevaried potential disposal or land-based use scenarios. The municipal landfill scenario may be less likely,but may still be relevant given the demonstration project at the nearby municipal landfill. Ourassessment addresses the municipal scenario qualitatively. These scenarios were assessed for potentialreleases to drinking water wells. Refer to the Risk Assessment for the Listing Determinations forInorganic Chemical Manufacturing Wastes (August 2000) for the details of the full groundwaterpathway risk assessment.
We also conducted a screening analysis of the air pathway given the reported use of this material aslandfill cover and caps and in other non-encapsulated methods. Table 3.28 compares the constituentsthat were detected in the total analyses at levels exceeding the background soil levels to the soilingestion HBLs and the Air Characteristics Study.
Table 3.28 - Comparison of Iron Rich® Total Analyses to Soil Screening Levels (SSL)
Constituent
Total WasteConcentration(DPE-SO-01)(mg/kg)
SSL (mg/kg)
BackgroundSoil Level
Soil IngestionHBL
Air CharacteristicsStudy*
Antimony 0.9 0.7 32 NA
Beryllium 1.2 0.9 160 9,000 @25 m (adult)
Chromium 777 54 120,000 NA
Cobalt 44.5 9.1 4,800 3,000
Copper 28.5 25 NA NA
Lead 309 19 400 600,000

Table 3.28 - Comparison of Iron Rich® Total Analyses to Soil Screening Levels (SSL)
Constituent
Total WasteConcentration(DPE-SO-01)(mg/kg)
SSL (mg/kg)
BackgroundSoil Level
Soil IngestionHBL
Air CharacteristicsStudy*
Inorganic Listing Determination Titanium DioxideListing Background Document August, 200064
Manganese 10,600 550 3,800 20,000 (@25 m)100,000 (@150 m)
Molybdenum 7.4 1.0 NA NA
Nickel 91.8 19 1,600 90,000
Thallium 3.7 1.9 6.4 NA
Vanadium 240 80 720 20,000
Zinc 122 60 24,000 NA
2378 TCDD TEQ 58.7 ppt 5 ppt 45 ppt NA
*U.S. Environmental Protection Agency, "Revised Risk Assessment for the Air Characteristic Study", EPA530-R-99-019a, November 1999, Table 4.1 (Landfills).NA = not available
This analysis shows that most metals present in the waste are at concentrations below their respectivesoil ingestion levels. The limited number of constituents exceeding the soil ingestion levels are still belowthe air characteristics study levels, indicating a minimal potential risk from the air pathway for a landfillscenario. However, we cannot judge with any certainty potential risks if the material were more widelydispersed, such as might occur in some of the projected uses reported by the generator.
New Johnsonville, TN Facility
The scenario of concern for this waste is the on-landfill and the Hillside Ponds. The SPLP results forSample DPN-SO-01 (from the Hillside Pond) were used to screen the landfill and Hillside Pondscenario. The constituents of concern in the SPLP extracts were antimony and manganese. Arsenicand thallium are present in the wastes but are below the reported SPLP detection limits. Since ½ theSPLP detection limits is greater than the HBL for these two constituents, they were identified aspotential constituents of concern. Considering AWQC, iron is a constituent of concern. Mercury alsofalls in this category (½ detection limit is above AWQC). Manganese also exceeds AWQC. The on-site landfill scenario was assessed for potential releases to surface water. We assessed whether thelandfill or Hillside Ponds could impact groundwater that serves as a source of drinking water. Asillustrated on the map provided by the facility in their RCRA §3007 Survey, the facility is located on alarge tract of land bordered to the west by the Tennessee River. The management units are located ona ridge facing the river. Groundwater flow, while not definitively studied, is expected to be toward the

29E-mail from Scott L. Goodman, DuPont to Max Diaz, U.S. EPA; December 9, 1999; RE: Drinking Water WellLocation at New Johnsonville, TN Facility.
30E-mail from Scott L. Goodman, DuPont to Max Diaz, U.S. EPA; March 22, 2000; RE: Groundwater FlowDirection at New Johnsonville, TN Facility.
Inorganic Listing Determination Titanium DioxideListing Background Document August, 200065
river.29,30 The facility did identify a drinking water well on the southeast corner of the plant propertywhich is approximately 2 miles to the east of the management units. The groundwater pathway,therefore, did not seem plausible. Note, however, that the drinking water risks from releases togroundwater were assessed using the off-site landfill scenario noted above for the Delaware facility. Because any groundwater releases from these management units are likely to be toward the river, weassessed potential exposure to contaminated surface water for this site. Refer to the Risk Assessmentfor the Listing Determinations for Inorganic Chemical Manufacturing Wastes (August 2000) forthe details of the full risk assessment.
DuPont DeLisle Plant; Pass Christian, MS Facility
As described above, this facility places its commingled wastewaters in on-site surface impoundments;the dredged solids from these units are placed in an on-site landfill. The solids filtered from this facility’sferric chloride are also placed in this landfill. No sample was collected from this site for this waste. However, EPA believes the sampling and assessment of the Tennessee and Delaware facilities is anappropriate surrogate for this waste given the similar nature of the processes.
3.2.10 HCl from Reaction Scrubber, Chloride-Ilmenite Process
This waste is generated by all three facilities that use the chloride-ilmenite process to produce titaniumdioxide. This waste is generated as a result of the scrubbing of reactor off-gas and is recycled back tothe process at the DuPont facilities in Tennessee and Mississippi. The DuPont facility in Delawarecommingles this waste with other process wastewaters at the facilities wastewater treatment system. The waste from this facility is assessed below as part of the “Commingled wastewaters from chloride-ilmenite process”.
3.2.11 Commingled Wastewaters from Chloride-Ilmenite Process
Waste Generation
Process wastewaters are generated at various points of the chloride-ilmenite production process. Thesewastewaters are generated from coke and ore solids recovery, reaction and oxidation scrubbers, spentcaustic treatment, product finishing, raw material storage vent scrubbers, equipment vents andsupernatant from wastewater impoundments, etc.
Waste Management Practices
At the DuPont facility in Delaware, the commingled wastewaters are treated in tanks and pass through

Inorganic Listing Determination Titanium DioxideListing Background Document August, 200066
an unlined cooling pond just before discharge via an NPDES permit. Discharge is through an unlinedchannel. The DuPont facilities in Tennessee and Mississippi manage their commingled wastewaters in aseries of surface impoundments prior to NPDES discharge. The treated effluents from the wastewatertreatment systems at these facilities are regulated under the Clean Water Act and were not assessed. However, the management of these commingled wastewaters in surface impoundments prior todischarge was evaluated. Table 3.29 presents the reported volumes for the wastewaters that arecommingled in the wastewater treatment systems at each facility.
Table 3.29 - Volumes for Commingled Wastewaters from Chloride-Ilmenite Process
Facility Wastewater (RIN #) Total Volume
(MT/yr)
E.I. DuPont de Nemours &Co.; Edge Moor, DE
Reaction area & chlorine scrubber pretreated effluent(RIN 1)
10,521
Coke & ore wash water (RIN 2) 97,611
HCl pretreatment effluent (RIN 3) 169,609
Chlorine scrubber water to WWT (RIN 7) 4,354
SCP1 CaCl3 filtrate to WWT (RIN 8) 605,513
Oxidation wastewater to reaction area pretreatment(RIN 9)
59,589
Oxidation wastewater washwater (RIN 11) 5
Finishing sump (RIN 10) (Combined in RIN 11volume)
Purification wastewater (RIN 12) 1,769,305
Dryer scrubber to WWT (RIN 13) 124,259
E.I. DuPont de Nemours &Co.; New Johnsonville, TN
Reaction scrubber pretreater wastewater (RIN 2) 246,000
Purification scrubber wastewater (RIN 3) 82,000
Solids removal wastewater (RIN 4) 442,800
HCl storage tank scrubber (RIN 5) 9,110
Finishing wastewater (RINs 6, 111, & 113) 6,566,998
Chlorine unloading scrubber wastewater (RIN 101) 82
Reaction startup scrubber (RIN 102) 3,268
Reaction area maintenance scrubber (RIN 103) 11,112
Oxidation scrubber (RIN 104) 6
Maintenance wash house scrubber (RIN 105) 4540
Hillside Pond wastewater (RIN 106) 102,200

Table 3.29 - Volumes for Commingled Wastewaters from Chloride-Ilmenite Process
Facility Wastewater (RIN #) Total Volume
(MT/yr)
Inorganic Listing Determination Titanium DioxideListing Background Document August, 200067
Reaction maintenance wastewater (RIN 109) 1,900
Wash house wash water (RIN 114) 454
E.I. DuPont de Nemours &Co.; DeLisle Plant; PassChristian, MS
Scrubber wastewater (RIN 2) 216,286
Reaction area scrubber pretreater wastewater (RIN 3) 328,802
Wastewater from oxidation scrubber to spentchemical pretreatment (see RIN 7) (RIN 6)
9,259
Spent chemical treatment wastewater (RIN 7)(treatment of RINs 6, 101, & 102)
24,997
HCl storage vent scrubber (RIN 9) 3,835
Chlorine unloading scrubber to spent chemicalpretreatment (see RIN 7) (RIN 101)
202
Emergency chlorine scrubber to spent chemicalpretreatment (see RIN 7) (RIN 102)
15,536
Scrubs unloading vent scrubber (RIN 104), finishingwastewater (RIN 8), & oxidation scrubber wastewater(RIN 103)
2,859,842
Borrow Pit slurry water return to WWT (RIN 109) 191,000
Waste Characterization
Two samples were collected during record sampling to characterize this waste. At the DuPont facilityin Delaware Sample DPE-WW-01 was collected directly from the influent to the finishing (cooling)pond. At the DuPont facility in Tennessee, Sample DPN-WW-01 was collected a the point where thewastewater leaves the weir and enters the first settling pond.
Totals analysis were conducted on Samples DPE-WW-01 and DPN-WW-01. A summary of theanalytical results for each sample is presented in Appendix A. The detailed reports of the recordsampling trips, the complete set of analytical data, and the validation reports for these samples areavailable in the “Sampling and Analytical Data Report for Record Sampling and Characterization ofWastes From the Inorganic Titanium Dioxide Manufacturing Sector” for the DuPont Edge Moor, DEand New Johnsonville, TN facilities. These reports are available in the docket for this rulemaking.
Results of Screening Analysis
Table 3.30 presents the constituents detected in Samples DPE-WW-01 and DPN-WW-01 and theassociated HBLs and AWQC for each constituent.

Inorganic Listing Determination Titanium DioxideListing Background Document August, 200068
Table 3.30 - Initial Screening Analysis for Commingled Wastewaters from Chloride-Ilmenite Process
Constituent
DuPont EdgeMoorDPE-WW-01(mg/L)
DuPont NewJohnsonvilleDPN-WW-01(mg/L)
HBL(mg/L)
AWQC(mg/L)(freshwater/saltwater)
Aluminum 0.65 3.1 16 0.087
Barium 0.62 0.030 1.1 1
Boron 0.72 B 0.05 1.4 NA
Chromium <0.005 0.25 23 0.74
Chromium, +6 <0.02 <0.02* 0.047 0.011
Copper 0.03 0.007 1.3 0.009 /0.0031
Iron 1.44 16.7 5 1
Lead <0.003 0.005 B 0.015 0.0025
Magnesium 142 5.19 NA NA
Manganese 3.3 3.34 0.73 0.05
Molybdenum 0.009 0.006 0.078 NA
Nickel** 0.013 0.020 0.31 0.052 /0.0082
Thallium <0.005 0.013 0.0013 0.0017
Titanium 0.32 13.6 NA NA
Vanadium 0.018 0.63 0.14 NA
Dioxins/Furans (ng/L) *
2378-TCDF (TEF=0.1) <0.0096 ng/L <0.010 NA NA
Total TCDF <0.0096 <0.010 NA NA
12378-PeCDF (0.05) <0.048 <0.052 NA NA
23478-PeCDF (0.5) <0.048 <0.052 NA NA
Total PeCDF <0.048 <0.052 NA NA
123478-HxCDF (0.1) <0.048 <0.052 NA NA
123678-HxCDF (0.1) <0.048 <0.052 NA NA
234678-HxCDF (0.1) <0.048 <0.052 NA NA
123789-HxCDF (0.1) <0.048 <0.052 NA NA
Total HxCDF <0.048 <0.052 NA NA

Table 3.30 - Initial Screening Analysis for Commingled Wastewaters from Chloride-Ilmenite Process
Constituent
DuPont EdgeMoorDPE-WW-01(mg/L)
DuPont NewJohnsonvilleDPN-WW-01(mg/L)
HBL(mg/L)
AWQC(mg/L)(freshwater/saltwater)
Inorganic Listing Determination Titanium DioxideListing Background Document August, 200069
1234678-HpCDF (0.01) <0.048 0.064 ng/L NA NA
1234789-HpCDF (0.01) <0.048 <0.052 NA NA
Total HpCDF <0.048 0.064 NA NA
Total HpCDD <0.048 <0.052 NA NA
OCDF (0.0001) 1.1 ng/L EB 1.4 ng/L NA NA
OCDD (0.0001) <0.096 <0.10 NA NA
2378-TCDD TEQ* 0.00011 ng/L or 0.11ppq
0.00078 ng/L or 0.78 ppq 0.0071 ng/L 0.0031ng/L
NA-Not Available*TEQs calculated using WHO-TEFs.**Both of these values exceed the AWQC for saltwater. We will use the higher of the two values forDeLisle.EB: Detected in equipment blank at 0.47 ng/L.
DuPont Edge Moor, DE
As discussed above, this facility treats wastewaters in tanks until just before discharge, when they passthrough an unlined cooling pond. This unit is located on the north end of the plant adjacent to theDelaware River. The relevant sample of this wastewater was collected at the influent to the coolingpond, directly from the effluent clarifiers (DPE-WW-01). The constituents detected above the AWQCwere aluminum, copper, iron, manganese, and nickel. Manganese was also detected above the HBL. It was assumed that any releases from the cooling pond at this facility would be intercepted by the river,and would be comparable in concentration, but much less volume than the actual NPDES dischargepoint which is subject to NPDES permitting. DuPont New Johnsonville, TN
At this facility, the combined wastewaters are settled in a series of three impoundments prior toNPDES discharge. The relevant sample of the combined wastewater was collected prior to the settlingponds (DPN-WW-01) The constituents detected above the AWQC were aluminum, iron, lead,manganese, and thallium. Vanadium and thallium were also detected above the HBL.
The groundwater ingestion pathway is not believed to be of concern for this site as described in theprevious waste category. Thallium and vanadium, therefore, were not considered further for thisfacility. The ponds are adjacent to the Tennessee River. The surface impoundment scenario was

31 See Appendix C for facsimile from Heather Lott (USGS, Water Resources Division) to Max Diaz (EPA);Wells within a 2-Mile Radius of a Site in Pass Christian; August 29, 2000.
Inorganic Listing Determination Titanium DioxideListing Background Document August, 200070
assessed for infiltration and dilution to the Tennessee River. Refer to the Risk Assessment for theListing Determinations for Inorganic Chemical Manufacturing Wastes (August 2000) for thedetails of the risk assessment.
DuPont DeLisle Plant; Pass Christian, MS
No samples were collected at this facility. As indicated above, this facility manages the commingledwastewaters in a series of three impoundments. We assessed this site to determine whethergroundwater releases might impact drinking water wells on the vicinity. We obtained a USGS waterwell inventory printout for the 2 mile radius around the DeLisle plant.31 We also reviewed a USGStopographic map for the vicinity (see Appendix C). From these sources we determined that there areresidences (a community named “Shell Beach”) and a “home” drinking water well approximately 2,000feet to the south and west of the facility. There are additional residences to the west and numerousdrinking water wells throughout the region. Given the hydraulic gradient depicted in the potentiometricmap submitted in DeLisle’s RCRA §3007 Survey, the nearest drinking water well appears to beupgradient. It is not possible to tell definitively whether the other wells in the vicinity are down-gradientor side-gradient. The groundwater gradients may change offsite or change seasonally. We do not havesufficient information to rule out such possibilities. As a result, we modeled the potential impact of theimpoundments on drinking water wells within a range of 2,000 to 3,000 ft. We also assessed thesurface water pathway given the proximity of the impoundments to the Bay of St. Louis (locateddirectly south of the facility). The analytical data from the Delaware and Tennessee facilities were usedfor the risk assessment. Refer to the Risk Assessment for the Listing Determinations for InorganicChemical Manufacturing Wastes (August 2000) for the details of the full risk assessment.
3.2.12 Aluminum-containing Additive Vent Filters Solids from Chloride-Ilmenite Process
The DuPont facility in Mississippi facility reported generating <1 MT/year of this waste. This waste isfrom vent filters used in the air pollution control devices for the oxidation process. This material isplaced in an off-site industrial D landfill. Information from the facility indicates that this waste ispredominantly composed of aluminum and is a small volume. The Agency, therefore, does not believethis material poses a risk to human health and the environment if it is disposed of in compliance withapplicable Federal and state regulations.
3.2.13 Vanadium Sludge from Chloride-Ilmenite and Chloride Process
All three chloride-ilmenite facilities and Kerr-McGee reported generating a vanadium sludge. Thiswaste is generated during the purification of the titanium tetrachloride produced during the chlorinationprocess. All of the facilities reported recycling this waste to recover titanium tetrachloride. Thevanadium content of this material is incorporated into the waste solids streams and/or waste acidstreams. There is no potential for exposure (i.e., land placement) associated with the recovery of thetitanium tetrachloride. However, the chloride-ilmenite facility in Delaware also reported using a portion

Inorganic Listing Determination Titanium DioxideListing Background Document August, 200071
of this waste to produce their “Iron Rich®”. This waste category is discussed as part of the “Non-Bevill-exempt nonwastewaters from the Chloride-Ilmenite Process” waste category in Section 3.2.9and the “Ferric chloride” waste category in Section 3.2.8. 3.2.14 Off-specification Titanium Dioxide Product
Waste Generation and Management
The DuPont facilities in Tennessee and Mississippi reported generating off-specification titanium dioxideproduct when the product specifications are not met and the material cannot be reworked back into theprocess. The Tennessee facility indicated that this material usually is recycled back to the process, butthe waste is sent to an off-site landfill when purity standards are not met. The Mississippi facility storesthis waste in containers and then sends it an off-site landfill. Table 3.31 presents a summary of thevolumes for this waste.
Table 3.31 - Volumes of Off-specification Titanium Dioxide Product
Facility (RIN #)Total Volume
(MT/yr)
E.I. DuPont de Nemours & Co.; New Johnsonville, TN (RIN 110) 295
E.I. DuPont de Nemours & Co.; DeLisle Plant; Pass Christian, MS (RIN 107) 267.8
Waste Characterization
A sample of this waste was collected from the Tennessee facility to characterize this waste. Sample(DPN-SO-02) was collected from a 50 pound bag located in the production warehouse.
Totals, TCLP and SPLP analyses were conducted on the sample. A summary of the analytical resultsfor this sample is presented in Appendix A. The detailed report for the record sampling trip, thecomplete set of analytical data and the validation report for this sample is available in the “Sampling andAnalytical Data Report for Record Sampling and Characterization of Wastes From the InorganicTitanium Dioxide Manufacturing Sector” for the DuPont New Johnsonville, TN facility. This report isavailable in the docket for this rulemaking.
Results of Screening Analysis
The landfills that accept this waste accept both municipal and industrial waste. Therefore, the TCLP(with somewhat higher leaching levels than the SPLP) results for Sample DPN-SO-02 were used toscreen the municipal landfill scenario. Table 3.32 presents the constituent(s) detected in Sample DPN-SO-02 and the corresponding HBLs.
Lead was the only constituent detected in the TCLP above the HBL and AWQC. Boron alsoexceeded the HBL, but only by a factor of 1.5. This constituent was therefore screened out. The off-site municipal landfill scenario was assessed for lead. Refer to the Risk Assessment for the Listing

Inorganic Listing Determination Titanium DioxideListing Background Document August, 200072
Determinations for Inorganic Chemical Manufacturing Wastes (August 2000) for the details of thefull risk assessment.
Table 3.32 - Initial Screening Analysis for Off-specification Titanium Dioxide Product
ConstituentDPN-SO-02TCLP (mg/L) HBL (mg/L)
Aluminum 60.8 16
Antimony 0.007 * 0.0063
Barium <2 1.1
Boron 2.2 1.4
Chromium <0.05 23
Cr,+6 NA 0.047
Copper <0.25 1.3
Iron <1 5
Lead 0.06* 0.015
Magnesium 1.0 NA
Nickel <0.2 0.31
Tin <0.5 9.4
Titanium 0.18 NA
Zinc 0.88* 4.7
NA- Not Available*Results are less than the typical laboratory reporting limit, but are greater than the calculated instrumentdetection limits.** Determined from DI water leach.
3.2.15 Railcar/Trailer Product Washout
The DuPont facility in Tennessee reported generating this waste when the tank cars and railcars used toship the TiO2 to customers are cleaned. The washwater, containing titanium dioxide, is placed in asurface impoundment. The water from this pond is subsequently sent to wastewater treatment where itis commingled with all other chloride-ilmenite wastewaters, (discussed above in Section 3.2.11). Thetitanium dioxide product that settles to the bottom of this pond is mechanically removed and reused inthe production process. The potential impact of this impoundment was screened using the SPLPanalysis collected for Sample DPN-SO-02 of off-specification product. The SPLP results were usedto assess this management scenario because there is no potential for contact with municipal landfillleachate. There were no constituents concern detected above their HBLs in the SPLP analysis of thissample. This waste did not warrant further assessment.

Inorganic Listing Determination Titanium DioxideListing Background Document August, 200073
Table 3.33 - Initial Screening Analysis for Railcar/Trailer Product Washout
ConstituentDPN-SO-02 SPLP (mg/L)
HBL(mg/L)
Aluminum 0.05* 16
Antimony 0.008 0.0063
Barium 0.054 1.1
Boron 0.17 1.4
Chromium 0.001* 23
Cr,+6 <0.02** 0.047
Copper 0.002 1.3
Iron <0.05 5
Lead 0.002* 0.015
Magnesium 0.08 NA
Nickel <0.005 0.31
Tin <0.01 9.4
Titanium <0.005 NA
Zinc 0.02* 4.7
NA- Not Available*Results are less than the typical laboratory reporting limit, but are greater than the calculated instrumentdetection limits.** Determined from DI water leach.
3.3 OUT OF SCOPE WASTE
In addition to the wastes presented in Tables 3.1, 3.2 and 3.3, there are other wastes generated duringthe production of titanium dioxide that are beyond the scope of the consent decree.
3.3.1 Bevill-exempt Wastes
The consent decree does not require EPA to make listing determinations for wastes that are Bevillexempt under EPA rules implementing the so-called “Bevill exemption” for mining wastes. As stated in40 CFR 261.4(b)(7)(ii)(S), chloride process waste solids from titanium tetrachloride production areBevill-exempt waste. These solids are generated during the chlorination reaction of the titanium ore inthe reducing presence of coke at elevated temperatures, and are generated from both the chlorideprocess and the chloride-ilmenite process. The majority of these solids leave the reactor as a mass andare quenched, neutralized, settled and disposed as Bevill-exempt materials. Additional solids from thereactor are carried overhead with the TiCl4 and are subsequently removed in various scrubbing units. These solids are also identified as Bevill-exempt solids as they are derived from the same unreacted ore

32 The analytical results for this sample can be found in the “Sodium Chlorate Listing BackgroundDocument.” The predominant potential constituent of concern in the sodium chlorate solids is chromium; theanalytical data for the commingled solids (KM-SI-04) show that the SPLP concentration is <0.05 mg/L and thereforenot of concern.Inorganic Listing Determination Titanium DioxideListing Background Document August, 200074
and coke solids leaving the chlorination reactor. These Bevill-exempt waste solids that are generated atthe facilities that use the chloride or the chloride-ilmenite process to produce titanium dioxide arediscussed below.
Solids also are generated from the oxidation and finishing stages of titanium dioxide production that arecaptured in air pollution control devices such as scrubbers. These solids are non-Bevill-exempt solidwastes (not covered by the Bevill exemption). Most titanium dioxide producers comminglewastewaters from titanium tetrachloride production with wastewaters from oxidation and finishing,resulting in wastewater treatment sludges with Bevill-exempt and non-Bevill-exempt components.
Due to process variations, each facility generates its Bevill-exempt and non-Bevill-exempt solids inslightly different ways. The following is a discussion of the status, Bevill exempt vs non-Bevill exempt,of these solids at the facilities that use the chloride or chloride-ilmenite process.
Waste Solids from Titanium Tetrachloride Production via the Chloride Process
All of the facilities that use the chloride process generate these waste. These solids are generated as aresult of the separation of the residual coke and ore from the titanium tetrachloride product streamproduced during the chlorination process. As discussed above, these solids are Bevill exempt and areoutside of the scope of the consent decree. However, some of these facilities commingle this Bevill-exempt waste with non-Bevill-exempt wastewaters in their on-site wastewater treatment systems.
Based on the information available to EPA, it appears that Kemira and Louisiana Pigment do notcommingle these 100 percent Bevill-exempt waste solids from the production of titanium tetrachloridewith any other waste. Kemira sends these solids to a dedicated settling pond and Louisiana Pigmentuses a tank based system to segregate these solids and then sends the solids to an on-site landfill. Atthese two facilities, the solids from the production of titanium tetrachloride are clearly outside of theconsent decree and do not warrant further assessment.
The Kerr-McGee facility commingles these solids with wastewaters from the production of sodiumchlorate in the facility’s wastewater treatment system. The sodium chlorate wastewaters account for asmall percentage of the total volume of managed wastewater, and solids generated.32 It does notappear that Kerr-McGee commingles any wastewaters from oxidation or finishing (that might containnon-Bevill-exempt solids).
At both of the Millennium facilities in Ohio, the wastewaters from titanium tetrachloride productionthat bear the Bevill-exempt solids are commingled with wastewaters from oxidation and finishing. Although neither facility reported any solids in the oxidation or finishing wastewaters, data from similarwastewaters from the chloride-ilmenite process indicate that very low levels of solids are present inthese wastewaters.

33Generated in a surface impoundment of the facility’s wastewater treatment system. Assessed as part of“Wastewater Treatment Sludges from Commingled Chloride and Sulfate Process Wastewaters” waste category inSection 3.2.7.
34The name and description for this waste is from telephone contact with the facility. It should also benoted that the facility did not report any wastewaters or solids from oxidation and finishing.Inorganic Listing Determination Titanium DioxideListing Background Document August, 200075
At Kemira and the Millennium Baltimore facility, chloride process waste solids also are collected inthe wastewater treatment systems. Both facilities commingle sulfate and chloride process wastewatersin their wastewater treatment systems. The resulting wastewater treatment sludge is composed of asignificant amount of non-Bevill-exempt solids. These wastewater treatment solids are discussed inSection 3.2.7 as part of the “Wastewater Treatment Sludges From Commingled Chloride and SulfateProcess Wastewaters” waste category.
Table 3.34 presents the “Bevill-exempt” waste solids generated during the production of titaniumtetrachloride at the facilities that use the chloride processes. The facilities were only required to identifyBevill-exempt wastes in the RCRA §3007 questionnaire. No volume or waste managementinformation was required.
Table 3.34 - Bevill-exempt-Waste Solids from Titanium Tetrachloride Production Via the Chloride Process
Facility Waste (RIN #)
Kemira Pigments, Inc. Chlorination waste solids (RIN 6)
Millennium Inorganic Chemicals, Baltimore, MD Filter Cake (RIN 4)33
Kerr-McGee Chemicals Corporation Chlorinator Solids (RIN 3) 34
Kronos/Louisiana Pigment Filter Cake (RIN 5)
Millennium Inorganic Chemicals, Plants I and II, Ashtabula, OH Nonhazardous filter cake (RIN 4)
Solids from the Chloride-Ilmenite Process
All three chloride-ilmenite facilities generate waste solids from the chloride-ilmenite process. TheDuPont facilities in Tennessee and Mississippi use landfills to manage these wastes. The DuPont facilityin Delaware is currently managing this waste in a landfill, but has used the material for various landapplication purposes in the past. The solids managed in these landfills contain contributions from Bevill-exempt mineral processing solids as well as non-Bevill-exempt solids. The site-specific variations in theprocesses determined the composition of the Bevill-exempt versus the non-Bevill-exempt solids in theseunits. The generation and management of these Bevill-exempt and non-Bevill-exempt solids isdiscussed below for each facility.
DuPont Edge Moor, DE Facility
The DuPont facility in Delaware generates solids at three places in their production process. These

Inorganic Listing Determination Titanium DioxideListing Background Document August, 200076
solids include the Bevill-exempt chloride process solids from the titanium tetrachloride productionprocess (reactor solids), solids removed from ferric chloride waste acid, and wastewater treatmentsludge. A portion of these Bevill-exempt reactor solids (unreacted coke and ore) are recycled to theprocess. This facility combines and neutralizes these three sources of solids and markets this materialas “Iron Rich®” for a variety of uses.
The Delaware facility adds a processing chemical prior to removal of solids from the ferric chloride toimprove the ferric chloride properties. The production of ferric chloride is not mineral processing, andthis process step is chemical manufacturing (and/or an ancillary operation) beginning at the point wherethe facility adds the processing chemical prior to solids removal. Since the solids are removed after thepoint in the process where mineral processing ends, they are non-Bevill-exempt solid wastes.
Per the data reported by the Delaware facility in their RCRA §3007 questionnaire, 8.3% of thewastewater treatment solids are derived from oxidation and finishing. The assessment of the solidsgenerated at the Delaware facility is presented in Section 3.2.9 as part of the “Non-Bevill-exemptnonwastewaters from the Chloride-Ilmenite Process” waste category.
DuPont DeLisle Plant; Pass Christian, MS
The DuPont facility in Mississippi generates the bulk of its Bevill-exempt solids from the filtration of theferric chloride waste acid and a lesser amount in the wastewater treatment system at the facility. Thesolids from the filtration of the ferric chloride are Bevill exempt because this step is simply removal ofBevill-exempt solids prior to disposal of the waste acid. The solids are placed in a pond, and thedredged solids from the pond are placed in a dedicated on-site landfill cell. The facility also reportedthree additional Bevill-exempt waste streams that were generated as a result of the recovery of cokeand solids from the initial chlorination reaction. The solids generated in the facility’s wastewatertreatment system are assessed as part of “Non-Bevill-exempt nonwastewaters from the chloride-ilmenite process” waste category, discussed in Section 3.2.9.
DuPont New Johnsonville, TN
The DuPont facility in Tennessee also generates the bulk of its Bevill-exempt chloride process solidsfrom the filtration of the ferric chloride waste acid and a small amount in the wastewater treatmentsystem at the facility. This facility removes the bulk of the unreacted coke and ore solids during thefiltration of their ferric chloride. These solids are landfilled as a discrete waste. The wastewatertreatment solids are discussed in Section 3.2.9 as part of the “Non-Bevill-exempt Nonwastewatersfrom the Chloride-Ilmenite Process” waste category.
Table 3.35 presents the “Bevill-exempt” waste solids generated during the production of titaniumtetrachloride during the chloride-ilmenite process. The facilities were only required to identify Bevill-exempt wastes in the RCRA §3007 questionnaire. No information on the volumes generated ormanagement practices were required.

35Facility did not assign RIN.
36Ibid.
37Solids from filtration of iron chloride. Inorganic Listing Determination Titanium DioxideListing Background Document August, 200077
Table 3.35 - Bevill-exempt Waste Solids from Titanium Tetrachloride Production via theChloride-Ilmenite Process
Facility Waste Description (RIN #)
E.I. DuPont de Nemours & Co.; Edge Moor, DE Coke and ore solids 35
E.I. DuPont de Nemours & Co.; DeLisle Plant;Pass Christian, MS
Reaction area solids (RIN 18)
Solids recovery area silica (RIN 13)
Solids recovery recovered cole & ore (RIN 14)
Solids recovery silica (RIN 15)
Environmental coke and ore solids (RIN 16)
E.I. DuPont de Nemours & Co; New Johnsonville, TN Titanium tetrachloride solids36
Coke and ore solids (RIN 9)37
In addition to the Bevill-exempt mineral processing wastes (chloride process waste solids),beneficiation wastes generated from the storage and handling of various raw materials are also Bevillexempt. The three chloride-ilmenite facilities generate several wastes as a result of the storage andhandling of the process raw materials. Kronos/ Louisiana Pigments also reported generating filter clothsas a result of the dewatering of slurry from the chlorination process. These filter cloths are stored inroll-off bins because the facility has not located a landfill to take this waste because of elevated NORM(radium 226 and 228). Table 3.36 presents the Bevill-exempt beneficiation waste associated with thestorage and handling of the process raw materials.
Table 3.36 - Bevill-exempt Storage and Handling Wastes
Facility Waste Name (RIN #)
E.I. DuPont de Nemours & Co.; DeLisle Plant;Pass Christian, MS
Coke and ore storage and unloading bag dust (RIN 10)
Ore dust (RIN 11)
Transfer pump solids to landfill (RIN 12)
Coke and ore storage dust (RIN 110)
Coke and ore transfer dust collection to storage (RIN 111)
Coke and ore transfer pump (RIN 112)
Recycle water storage solids (RIN 113)

Table 3.36 - Bevill-exempt Storage and Handling Wastes
Facility Waste Name (RIN #)
38Sand used to clean the walls of the chlorinator prior to replacement of refractoryInorganic Listing Determination Titanium DioxideListing Background Document August, 200078
E.I. DuPont de Nemours & Co.; Edge Moor, DE
Dust control (RIN 21)
Kronos/Louisiana Pigment Filter cloths (RIN 12)
The DuPont facility in Mississippi reported two additional Bevill-exempt wastes (“Recycle watersolids”- RIN 17 and “Solids with water”- RIN 18) that are recycled back to the process.
3.3.2 Debris and Non-Process Wastes
Some kinds of debris and plant component materials do not fall within the scope of the consent decree. Most of the wastes that fell in this category were refractory brick wastes generated when facilitiesrefurbished plant furnaces. This material is derived from a structural component of the plant whereproduction takes place rather than a waste from the “production” of an inorganic chemical. This debrisfrom process equipment is also out of scope of this consent decree. Table 3.37 presents the reportedvolumes for these materials.
Table 3.37 - Debris and Non-Process Waste
Facility Material (RIN #) Management
TotalVolume(MT/yr)
Kronos/Louisiana PigmentCo.
Chlorinator Bed Material (RIN 10) On-site landfill 49
Refractory Brick (RIN 9) Off-site Subtitle C landfill 594
Blasting Material (RIN 11)38 Off-site Subtitle C landfill 105
3.3.3 National Pollutant and Discharge System (NPDES)
Industrial wastewater discharges that are point sources and subject to regulation under Section 402 ofthe Clean Water Act, are not solid wastes subject to RCRA (see 40 CFR 261.4(a)(2)). Several of thetitanium dioxide facilities reported discharging treated wastewaters to surface waters under the NationalPollutant and Discharge Elimination System (NPDES). These discharges require a permit and areregulated under the Clean Water Act (Act) and were not evaluated. Table 3.38 presents the reportedvolumes for these permitted discharges.
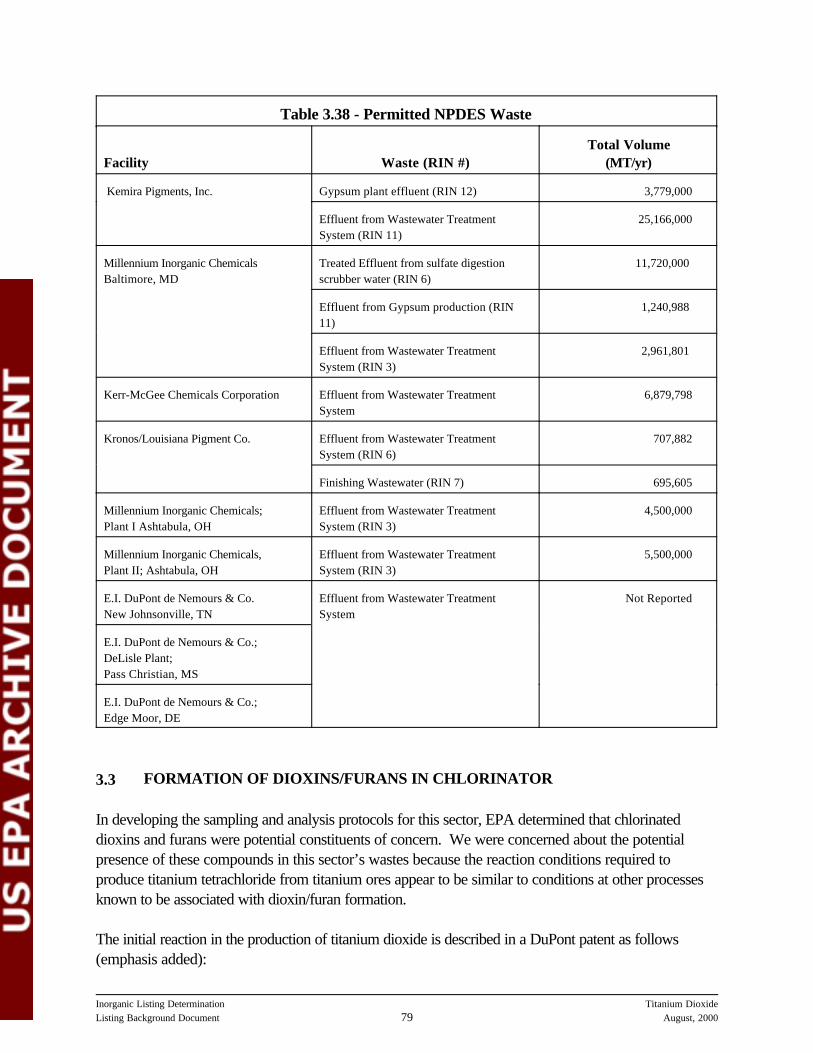
Inorganic Listing Determination Titanium DioxideListing Background Document August, 200079
Table 3.38 - Permitted NPDES Waste
Facility Waste (RIN #)Total Volume
(MT/yr)
Kemira Pigments, Inc. Gypsum plant effluent (RIN 12) 3,779,000
Effluent from Wastewater TreatmentSystem (RIN 11)
25,166,000
Millennium Inorganic ChemicalsBaltimore, MD
Treated Effluent from sulfate digestionscrubber water (RIN 6)
11,720,000
Effluent from Gypsum production (RIN11)
1,240,988
Effluent from Wastewater TreatmentSystem (RIN 3)
2,961,801
Kerr-McGee Chemicals Corporation Effluent from Wastewater TreatmentSystem
6,879,798
Kronos/Louisiana Pigment Co. Effluent from Wastewater TreatmentSystem (RIN 6)
707,882
Finishing Wastewater (RIN 7) 695,605
Millennium Inorganic Chemicals;Plant I Ashtabula, OH
Effluent from Wastewater TreatmentSystem (RIN 3)
4,500,000
Millennium Inorganic Chemicals,Plant II; Ashtabula, OH
Effluent from Wastewater TreatmentSystem (RIN 3)
5,500,000
E.I. DuPont de Nemours & Co. New Johnsonville, TN
Effluent from Wastewater TreatmentSystem
Not Reported
E.I. DuPont de Nemours & Co.;DeLisle Plant;Pass Christian, MS
E.I. DuPont de Nemours & Co.;Edge Moor, DE
3.3 FORMATION OF DIOXINS/FURANS IN CHLORINATOR
In developing the sampling and analysis protocols for this sector, EPA determined that chlorinateddioxins and furans were potential constituents of concern. We were concerned about the potentialpresence of these compounds in this sector’s wastes because the reaction conditions required toproduce titanium tetrachloride from titanium ores appear to be similar to conditions at other processesknown to be associated with dioxin/furan formation.
The initial reaction in the production of titanium dioxide is described in a DuPont patent as follows(emphasis added):

39United States Patent. Number 3,977,863. August 31, 1976. “Process for Selectively Chlorinating theTitanium Content of Titaniferous Materials” Assignee: E.I. Du Pont de Nemours and Company, Wilmington,Delaware.
40Cleverly, D., J. Schaum, D. Winters, G. Schweer. 1999. Inventory of sources and release of dioxin-likecompounds in the United States. Presented at Dioxin ‘99, the 19th International Symposium on HalogenatedEnvironmental Organic Pollutants and POPs, held September 12-17 in Venice, Italy. Short paper in, OrganohalogenCompounds, Volume 41:467-472.
41Toxicological Profile for Chlorinated Dibenzo-p-dioxins (Update). U.S. Department of Health & HumanServices. Public Health Service. Agency for Toxic Substances and Disease Registry. December 1998
42This residual is generated from treatment of RIN 1 (Chloride solids/waste acid) and other commingledwastes.Inorganic Listing Determination Titanium DioxideListing Background Document August, 200080
A reduction/chlorination process is provided for the treatment of titaniferous materials such asilmenite ores. The chlorination is selective in that the titanium constituents of the titaniferousmaterial is chlorinated, but there is no appreciable net yield of iron chloride form the ironconstituent. Where other metals such as vanadium are present they may be chlorinated with thetitanium. The reduction utilizes as the reductant an amount of carbonaceous materialwhich, based on oxygen in the titaniferous material, is at least stoichiometric to produce carbonmonoxide. The selective chlorination utilizes as the chlorinating agent either ferrouschloride (FeCl2) alone or certain combinations of ferrous chloride and one or more otherchlorine-containing members, notably molecular chlorine (Cl2) and hydrogen chloride(HCl). The use of ferric chloride (FeCl3) as a part or all of the chlorinating agent is theequivalent of using a FeCl2/0.5 C.2 mixture. Preferably, sufficient chlorine atoms are providedby the chlorinating agent to react with essentially all of the titanium in the titaniferous material. An elevated temperature in the range of 950° to 1400°C is maintained during thechlorination, but depending upon the composition of the chlorinating agent, there may be aminimum temperature in the range which is needed to maintain selectivity.39
The patent illustrates a number of conditions which are important for the formation of dioxins andfurans: a carbon source, a chlorine source, and a heat source. The chloride process and the chlorideilmenite process utilize these conditions in their reactors to convert titanium ores and slags into titaniumtetrachloride, which is subsequently purified and then oxidized to form the product titanium dioxide. EPA has catalogued many different sources of dioxins and furans, the vast majority of which involvethese three critical conditions of carbon, chlorine and heat.40,41
The results of EPA’s record sampling and analysis for wastes from the production of titanium dioxideconfirmed the expectation that dioxins and furans were likely to be formed during the chlorinationprocess. The following samples (with their respective TCDD TEQs) were collected from wastesgenerated in conjunction with the chlorinators:
C Millennium Baltimore, MI-WW-01, Chloride solids/waste acid (RIN 1): 812 ng/LC Millennium Baltimore, MI-SO-01, Filter press solids (RIN 4)42: 2,615 ng/kg.C DuPont Edge Moor, DPE-SO-01, Iron Rich: 58.7 ng/kg.C DuPont New Johnsonville, DPN-SO-01, Wastewater treatment solids: 402 ng/kg.

43Toxicological Profile for Chlorinated Dibenzo-p-Dioxins (update), p. 357.
44As described in Section 3.2.9, DuPont Edge Moor removes solids from its ferric chloride waste acid. Comparable solids generated at DeLisle and New Johnsonville are exempt solids. Edge Moor’s solids, however, losetheir exempt status due to the processing that Edge Moor conducts prior to solids removal (i.e., mineral processingand the production of titanium tetrachloride have ended and the ferric chloride processing is considered chemicalmanufacturing and/or an ancillary operation).Inorganic Listing Determination Titanium DioxideListing Background Document August, 200081
As described in earlier sections, each of these wastes contains significant levels of solids from thechlorinator. These chlorinator solids are classified as the exempt mineral processing waste from theproduction of titanium tetrachloride. Based on engineering judgement, we expect that dioxins andfurans formed in the chlorinator would adhere to these solids given the affinity of these compounds tosolids, as well as their low volatility and solubility.
[Chlorinated dioxins and furans] have a low solubility in water and a low volatility. Chlorinateddioxins have an affinity for particulates and readily partition to particles in air, water, and soil.43
Our data support this contention that the dioxins and furans formed in the chlorinator would tend toadhere to the reactor solids:
C The Millennium Baltimore chloride solids/waste acid (RIN 1, MI-WW-01) conveys thereactor solids to treatment and contained 812 ng/L 2,3,7,8-TCDD TEQ. The reactorscrubber water (RIN 2, MI-WW-02), in contrast, contained only 0.000018 ng/L2,3,7,8-TCDD TEQ.
C Kerr-McGee commingles all wastewaters and reactor solids in a series ofimpoundments. The total analysis of this commingled wastestream contained 65.6 ng/L2,3,7,8-TCDD TEQ. In contrast, the SPLP filtrate portion of Kerr-McGee’swastewater (KM-SI-01) contained no detectable dioxins or furans.
C Kemira’s wastewater (KP-WW-01), sampled at the influent to their settlingimpoundment contained 0.000038 ng/L 2,3,7,8-TCDD TEQ.
C DuPont Edgemoor’s treated wastewater (DPE-WW-01) contained only 0.00011 ng/L2,3,7,8-TCDD TEQ in contrast to their Iron Rich (DPE-SO-01) which contained 58.7ng/kg 2,3,7,8-TCDD TEQ.
C Similarly, DuPont New Johnsonville’s wastewater (DPN-WW-01) contained only0.00078 ng/L 2,3,7,8-TCDD TEQ, while their wastewater treatment solids (DPN-SO-01) contained 402 ng/kg 2,3,7,8-TCDD TEQ.
Our listing determination for K178 differentiates between exempt and non-exempt solids. With oneexception44, the non-exempt solids are associated with oxidation and finishing wastewaters. We do notbelieve that there should be dioxin/furan contamination of these non-exempt solids from oxidation andfinishing. The oxidation step is designed to remove chlorine as the titanium tetrachloride is oxidized toform titanium dioxide. The chlorine offgas is returned to the chlorinator. In addition, at this point in theprocess we believe that very little carbon (one of the 3 important dioxin precursors) remains in theproduct stream as a result of the numerous purification steps which occur prior to oxidation. Our

45 Ibid.
46“If EPA finds that this exemption is not protective of human health and the environment and if anexamination of titanium tetrachloride waste management shows any continuing or new problems, the Agency willreconsider this subtitle D determination for chloride process waste solids from titanium tetrachloride production.” 56FR 27300, June 13, 1991.Inorganic Listing Determination Titanium DioxideListing Background Document August, 200082
prediction that the dioxins and furans are not associated with the non-exempt solids from oxidation andfinishing is borne out by the following analytical results:
C A sample of off-specification titanium dioxide (DPN-SO-02) collected at DuPont NewJohnsonville, contained 0.0026 ng/kg 2,3,7,8-TCDD TEQ.
C The Kemira settling pond solids (KP-SO-02) which contained the highest percentageof non-exempt solids (>35 %) of the 5 facilities sampled contained the lowest level of2,3,7,8-TCDD TEQ (3 ng/kg).
For these reasons, we conclude that the dioxins and furans detected in the record samples supportingthe titanium dioxide listing determinations are associated with the exempt solids, or with the ferricchloride solids,45 and therefore are not within the scope of the consent decree. These compoundswere not assessed as part of the rulemakings which established the mineral processing exemptions, andso these results could present new issues for these wastes if such compounds were found to poseunacceptable risks. During the development of the mineral processing exemption, EPA anticipatedcertain conditions might suggest the appropriateness of re-opening these exemptions46. We areconsidering whether we should re-assess the status of these wastes as exempt mineral processingwastes. Any reassessment of these wastes would involve a separate analysis and opportunity for noticeand comment.

Inorganic Listing Determination Titanium DioxideListing Background Document August, 200083
APPENDIX ASUMMARIES OF ANALYTICAL DATA RESULTS FOR EACH WASTE SAMPLE
Inorganic Listing Determination Titanium DioxideListing Background Document August, 200084
APPENDIX BSUMMARIES OF ANALYTICAL RESULTS FOR SPLIT-SAMPLES

Inorganic Listing Determination Titanium DioxideListing Background Document August, 200085
APPENDIX CMAPS

![Titanium dioxide and modified titanium dioxide by silver ...cdmf.org.br/wp-content/uploads/2019/02/Titanium-dioxide...zinc oxide [6,7], titanium dioxide [8,9], hydroxyapatite and chlorhexidine,](https://img.pdfslide.us/doc/110x75/60ff91e8d40a2e46c9475976/titanium-dioxide-and-modified-titanium-dioxide-by-silver-cdmforgbrwp-contentuploads201902titanium-dioxide.jpg)