Embed Size (px)
Citation preview

Project co-funded by the European Commission and TITAN consortium.
TITAN Turnaround Integration in Trajectory And Network
Project Number: 233690
CBA Methodology
CLASSIFICATION: PU ISSUE: 1.0 DATE: 12/07/2011
DOCUMENT REFERENCE
Project Work Package Partner Nature Number
TITAN WP5 BRT DEL 01

Cost Benefit Analysis Methodology Issue: 1.0
Date:12/07/2011
TITAN: Turnaround Integration in Trajectory And Network Page 2 of 41
DOCUMENT CHANGE LOG
Issue Date Author Affected Sections /
Comments
0.1 12/10/2010 Javier García First Draft
0.2 12/20/2010
Jolanta Rekiel, Lourdes García, Laura Serrano, Valeria Salaris,
Javier García Second Draft (with comments from partners)
0.3 17/01/211 Javier García Third Draft
1.0 12/07/2011 Ana Sáez Final version
DOCUMENT CONTROL
Responsible Organisation Name Date
Author BR&TE Javier García 12/01/2011
Partners involved
ECORYS/INECO/JEPPESENJolanta Rekiel, Lourdes García, Laura Serrano, Valeria Salaris
12/01/2011
Reviewer All Laura Serrano 17/01/2011
Approver INECO Laura Serrano 17/01/2011

Cost Benefit Analysis Methodology Issue: 1.0
Date:12/07/2011
TITAN: Turnaround Integration in Trajectory And Network Page 3 of 41
DOCUMENT DISTRIBUTION (Working Draft Only)
To/Cc Organisation Name
To European Commission Remy Denos
To INECO Laura Serrano
To INECO Lourdes García
To Jeppesen Alicia Grech
To Jeppesen Niels Stark
To Jeppesen John Butcher
To ECORYS Robert Piers
To ECORYS Jolanta Rekiel
To Isdefe Vicente Bordón
To Isdefe Valeria Salaris
To BR&T-E Javier García
Cc SESAR JU Paul Adamson
Cc AENA/SESAR JU Alejandro Egido
Cc AENA/SESAR JU Francisco Javier Fernández de Liger
Addressees may distribute the document for revision purposes as deemed necessary.

Cost Benefit Analysis Methodology Issue: 1.0
Date:12/07/2011
TITAN: Turnaround Integration in Trajectory And Network Page 4 of 41
TABLE OF CONTENTS
Executive Summary ........................................................................................................... 6
1. Introduction .................................................................................................................. 7
1.1 PURPOSE ............................................................................................................................. 7
1.2 INTENDED AUDIENCE ........................................................................................................ 7
1.3 REFERENCES ...................................................................................................................... 7
1.4 ABBREVIATIONS AND ACRONYMS .................................................................................. 7
2. TITAN Project ................................................................................................................ 9
2.1 THE PROJECT ..................................................................................................................... 9
2.2 THE TITAN TOOL ................................................................................................................ 9
2.3 THE METHODOLOGY AND THE SCOPE OF THE COST BENEFIT ANALYSIS .............. 9
3. Cost Benefit Analysis IN Air Transport System projects ........................................ 10
4. Cost Benefit Analysis Process .................................................................................. 12
4.1 PROCESS OVERVIEW ...................................................................................................... 12
5. Cost Benefit Analysis PHases ................................................................................... 14
5.1 PHASE 1: DEFINITIONS, ASSUMPTIONS AND ALTERNATIVES .................................. 14
5.1.1 Project Definition and Objectives ........................................................................... 14
5.1.2 Assumptions for the analysis ................................................................................. 15
5.1.3 Alternatives ............................................................................................................... 15
5.2 PHASE 2: IDENTIFICATION AND ESTIMATION .............................................................. 16
5.2.1 Costs Identification .................................................................................................. 16
5.2.2 Costs Assessment ................................................................................................... 17
5.2.3 Benefit Identification ................................................................................................ 18
5.2.3.1 Benefits Identification ..................................................................................... 19
5.2.4 Benefit Estimation .................................................................................................... 20
5.2.4.1 Intangible Benefits .......................................................................................... 22
5.3 PHASE 3: MODELLING AND ANALYSIS ......................................................................... 22
5.3.1 Create and run economic models ........................................................................... 22
5.3.1.1 Influence Diagrams ......................................................................................... 23
5.3.1.2 Model Spreadsheets ....................................................................................... 24
5.3.2 Analysis and Interpretation of Results ................................................................... 25
5.3.2.1 Sensitivity Analysis ......................................................................................... 25
5.3.2.2 Probabilistic Risk Analysis .............................................................................. 26
5.3.2.3 Analysis and Interpretation of Results ............................................................ 26

Cost Benefit Analysis Methodology Issue: 1.0
Date:12/07/2011
TITAN: Turnaround Integration in Trajectory And Network Page 5 of 41
5.3.2.4 Detailed Revision Process .............................................................................. 27
5.4 PHASE 4: PRESENTATION OF RESULTS ....................................................................... 27
6. TITAN Specifics: Methodology .................................................................................. 29
6.1 SCOPE ................................................................................................................................ 29
6.2 STAKEHOLDERS .............................................................................................................. 30
6.3 EXPECTED BENEFITS ...................................................................................................... 30
6.4 FEEDBACK FROM STAKEHOLDERS .............................................................................. 31
7. Final Considerations .................................................................................................. 33
ANNEX A. Dialogue with Stakeholders: Workshops and Interviews .......................... 35
ANNEX B. Identification of Data Sources ...................................................................... 37
ANNEX C. Dealing with Uncertainties ............................................................................ 38
ANNEx D. Glossary and definitions ............................................................................... 39
LIST OF FIGURES
Figure 1: CBA Process Overview ................................................................................................... 12
Figure 2: Influence diagram example .............................................................................................. 23
Figure 3: Influence Diagrams and Spreadsheet Models ................................................................. 24
Figure 4: Tornado Diagram Example .............................................................................................. 26
Figure 5: Cumulative Probabilistic Distribution Example ................................................................ 26
Figure 6: TITAN scope .................................................................................................................... 29
Figure 7: Dialogue Process with Stakeholders ............................................................................... 35
Figure 8: Data. Multi-point estimations: values and associated probabilities .................................. 38
LIST OF TABLES
Table 1: Stakeholders List .............................................................................................................. 30
Table 2: TITAN KPAs and related targets ....................................................................................... 31

Cost Benefit Analysis Methodology Issue: 1.0
Date:12/07/2011
TITAN: Turnaround Integration in Trajectory And Network Page 6 of 41
Executive Summary The Turnaround Integration in Trajectory and Network (TITAN) project directly addresses the airport operations focusing on the turnaround process. The team working in the project consortium will develop a new advanced operational concept for the turnaround process fully compatible and complementary with the Concept of Operations developed within SESAR as will also develop a specific tool (The TITAN Tool) for the Airlines to benefit from the concept.
This document is the deliverable of WP 5.1 “Cost Benefit Analysis Methodology”. This methodology is developed in order to analyze the TITAN tool to be ready at the later stages of the project from an economic point of view. The methodology will be used for the development of the Cost Benefit Analysis (CBA) and will also serve as a guide to understand the process and the results derived from cost benefit analysis effort.
The methodology deals with a generic approach to conduct CBA; however it is also tailored to the TITAN specifics as shown in this document.
TITAN project considers four groups of stakeholders: Airports, Air Navigation Service Providers, Ground Handlers and Airlines. During the initial phases of TITAN, some interactions with them (i.e. Stakeholder’s Workshop) have been conducted. Highlights related to the CBA effort are also included here, but further conversations and meetings are envisaged in order to precise and to clarify the information obtained from stakeholders during the workshop and to complete the information required to perform the economic analysis.
Finally, the methodology development is a mean for CBA experts –not necessarily turnaround specialists- to collect specific information on the project and to interact with other TITAN researchers and stakeholders to the extension required to prepare the CBA.

Cost Benefit Analysis Methodology Issue: 1.0
Date:12/07/2011
TITAN: Turnaround Integration in Trajectory And Network Page 7 of 41
1. INTRODUCTION
1.1 Purpose TITAN will aim at raising common awareness during the turnaround process of the impact of each stakeholder’s performance in the global process performance and stressing the importance of making the conditions of transfer of responsibility among actors much more detailed and explicit.
This document is the WP 5.1 deliverable “Cost Benefit Analysis Methodology”.
The aim of this document is to describe the methodology for the Cost Benefit Analysis (CBA).
The methodology is developed in order to establish a basis for calculating the costs and benefits of the implementation of TITAN tool. The methodology is based on the research of advanced techniques for economic analysis. The general ATM methodology has been tailored to TITAN project specific. This methodology will also serve as a guide to understand the process and the results derived from cost benefit analysis effort that will be conducted under TITAN WP 5.2
1.2 Intended audience This document is public and may be distributed freely, both within and outside the TITAN consortium.
1.3 References 1. TITAN Performance Framework Definition D.1.3, Issue 1, October 2010
2. TITAN D1.1 Deliverable “Analysis of the current situation”, v1.5, April 2010
3. TITAN D7.7 Report on Stakeholder’s needs Workshop, Issue 1, May 2010
4. TITAN D1.4 Deliverable “Operational Concept”, October 2010
5. EMOSIA. European MOdel for ATM Strategic Investment Analysis. (http://www.eurocontrol.int/ecosoc/public/standard_page/emosia.html)
6. Standard Inputs for CBA, EUROCONTROL, 4.0, October 2009
7. FP7-AAT-2008-RDT-1 Work Programme
8. EUROCONTROL Guidelines for the economic appraisal of EATMP projects, Edition 1.3, September 2000
9. EUROCONTROL Approach to assess benefits from Air Traffic Services improvements. Edition 1, June 2003
10. TITAN Annex I “Description of the Work”. August 31st, 2009
1.4 Abbreviations and Acronyms ANSP Air Navigation Service Provider
AOBT Actual Off-Blocks Time
AIBT
ATCO
Actual In-Block Time
Air Traffic COntroller

Cost Benefit Analysis Methodology Issue: 1.0
Date:12/07/2011
TITAN: Turnaround Integration in Trajectory And Network Page 8 of 41
ATFCM
ATM
ATSP
B/C
Air Traffic Flow and Capacity Management
Air Traffic Management
Air Traffic Service Provision
Benefit to Cost ratio
CAPEX
CBA
Capital Expenditures
Cost Benefit Analysis
CDM
CNS
CODA
EATMP
ECBAG
ICAO
KPA
MET
NGT
NPV
Collaborative Decision Making
Communications, Navigation and Surveillance
Central Office of Delay Analysis
European Air Traffic Management Programme
EATMP CBA Advisory Group
International Civil Aviation Organization
Key Performance Area
Meteorological
Nominal Group Technique
Net Present Value
OI
OPEX
PRU
R&D
SAR
SESAR
Operational Improvement
Operational Expenses
Performance Review Unit
Research & Development
Search And Rescue
Single European Sky ATM Research
SLA
SPF
TITAN
Service Level Agreement
Strategic Performance Framework
Turnaround Integration in Trajectory And Network

Cost Benefit Analysis Methodology Issue: 1.0
Date:12/07/2011
TITAN: Turnaround Integration in Trajectory And Network Page 9 of 41
2. TITAN PROJECT
The high level TITAN project and tool descriptions included herein are in progress as per current TITAN Description of Work and TITAN work. The purpose of this section is to inform the reader on the purpose and development of the TITAN project in order to understand the Cost Benefit Analysis (CBA) framework without the need of using any other reference.
2.1 The project The TITAN project directly addresses the airport operations focusing on the turnaround process. The consortium will develop a new advanced operational concept for the turnaround process fully compatible and complementary with the ConOps developed within SESAR as well as a specific tool (The TITAN Tool) for the Airlines to benefit from the concept.
2.2 The TITAN Tool The objective of work package “Development of the TITAN tool” (WP4) within TITAN project is to develop a decision support tool for airlines to increase the efficiency of turnaround process. The starting point for the tool development is the turnaround model designed in the project. The decision support tool will allow an airline to better evaluate and adopt any changes in their schedule due to modifications affecting the turnaround process of one or several of their aircraft.
As stated in the TITAN Annex I “Description of the Work”:
The tool will receive inputs or triggers from external actors (ground handling, ATC, land-side, etc) and modify the Estimated Off Block Times (EOBTs) according with the new situation. The airline will be able to configure the tool to reflect not only its fleet and schedule, but also define the priorities (e.g. give more priority to international flights). Furthermore, the airline will be able to analyse different possible scenarios (“What if …?”) and the tool would recalculate the EOBTs. The chosen solution will determine which of the pre-defined turnaround milestones will be used for a given flight and target times are then assigned to the selected milestones that fit best with the selected solution. Some of the milestones will be visible to external turnaround stakeholders; some will be internal to the airline. The progress of the finalization of the public milestones will be published by the tool.
2.3 The methodology and the scope of the Cost Benefit Analysis The objective of TITAN WP5 “Cost Benefit Analysis” is to develop a methodology for Cost Benefit Analysis for TITAN project and to perform a CBA of the TITAN tool. The WP5.1 is aimed at developing a tailored methodology in order to perform a CBA for TITAN tool. This document represents the above mentioned methodology and it is the result of the research from WP 5.1.
It is important to remark that the CBA to be performed within the WP 5.2 will focus on the TITAN tool. This tool will be outlined during the WP4 of the TITAN project. The scope of the TITAN CBA is the tool, and therefore, the CBA will consider the benefits the tool is expected to deliver to potential users and will also consider the costs required to develop, implement and operate such tool.
The process of gathering, modelling and analyzing these data is part of the CBA methodology and will be outlined in this document.

Cost Benefit Analysis Methodology Issue: 1.0
Date:12/07/2011
TITAN: Turnaround Integration in Trajectory And Network Page 10 of 41
3. COST BENEFIT ANALYSIS IN AIR TRANSPORT SYSTEM PROJECTS
Investments in the air transport environment are required continuously in order to maintain safety, reliability and to improve the quality of service and match system capacity with the expected traffic growth. The providers of air navigation services, airports, handling agents, airlines, the financing organizations, and the public all need to be convinced of the economic viability of proposed new projects. Decision makers, responsible for selecting the appropriate projects, will require a clear understanding of the advantages and disadvantages of the proposals. While choices between different proposals must draw on experience and judgement, they normally also benefit from systematic economic appraisal. In the face of a variety of diverse projects it is important to ask which represent the most effective use of resources.
CBA is an increasingly important tool in the assessment of investment decisions in the ATM environment. It is a tool for decision makers used to evaluate whether the investment is economically viable for Stakeholders.
There is no formal definition of CBA, but the following interpretation by Federal Aviation Administration meets very well TITAN needs as an air transport project:
“Benefit-Cost analysis calls for the examination of all costs related to the production and consumption of an output, whether the costs are borne by the producer, the consumer, or third party. Similarly the method requires an examination of all benefits resulting from the production and consumption of the output, regardless who realizes the benefits”
How this is implemented may vary, but basically the best procedures are based on:
Estimating all costs by Stakeholders related to the implementation of an application/service;
Estimating all benefits by Stakeholders related to the implementation of an application/service;
Taking full account of the times at which costs are paid and at which benefits accrue;
Taking account of uncertainty;
Obtaining a figure of merit and performing sensitivity and risk analysis.
CBA often uses incremental costs and incremental benefits. Incremental means that the cash flows (costs and benefits) taken into account for the CBA are only cash flows that are different between the situation with the project (product or service) implemented and the baseline (do nothing alternative).
The concept of both Costs and Benefits is often misunderstood. Too often negative cash flows are considered costs, whereas positive cash flows are considered as benefits. This is not correct: Costs are to be understood as the resources used to generate the outputs, while benefits are the utility to the relevant parties of those generated outputs (regardless of the sign of cash flows although typically positive overall).
Most times CBA is not only used to evaluate different investment opportunities or alternatives, it is also a valuable tool in many decision making processes helping understand the outcomes in the system produced by the actions of choice subject to study. It provides relevant data to compare and prioritise between the different alternatives under consideration (including the baseline or “do-nothing” option). For a CBA to be effective in comparing projects, it must be applied in a consistent manner.

Cost Benefit Analysis Methodology Issue: 1.0
Date:12/07/2011
TITAN: Turnaround Integration in Trajectory And Network Page 11 of 41
Usually a CBA is conducted as a net present value analysis by cumulating and discounting annual cash flows associated with the proposed project. On the basis of such an approach, summary statistics such as net present value, benefit/cost ratio, pay-off periods and internal rates of return can be determined. In practice things are not usually quite so straightforward. While costs and most types of benefits can generally be quantified after a little research, an economic breakdown of all the projected benefits can be more elusive due to varying degrees of uncertainty around them. The same approach can get even more complex since intangibles (those costs or benefits not easily quantifiable albeit evident) can also be very relevant for the final decision to be made.
A CBA process can be performed in any phase of the project cycle, and the level of accuracy can vary depending on the needs and/or development conditions. Once the investment decision is made, this kind of analysis can provide useful benchmarking information regarding the execution of the project and the impact for the affected stakeholders.
Lastly, and most important, stakeholders are the owners of the CBA process. Inadequate management of this fact will surely yield poor and misleading results that might end up with the incorrect decision.
TITAN CBA will focus on the TITAN tool and will basically compare the “do nothing” alternative with the “tool in place” alternative in a generic operating scenario. This scenario (the scope of the CBA) will be defined during the CBA process.
Cost Benefit Analysis Methodology Issue: 1.0
Date:12/07/2011
TITAN: Turnaround Integration in Trajectory And Network Page 12 of 41
4. COST BENEFIT ANALYSIS PROCESS
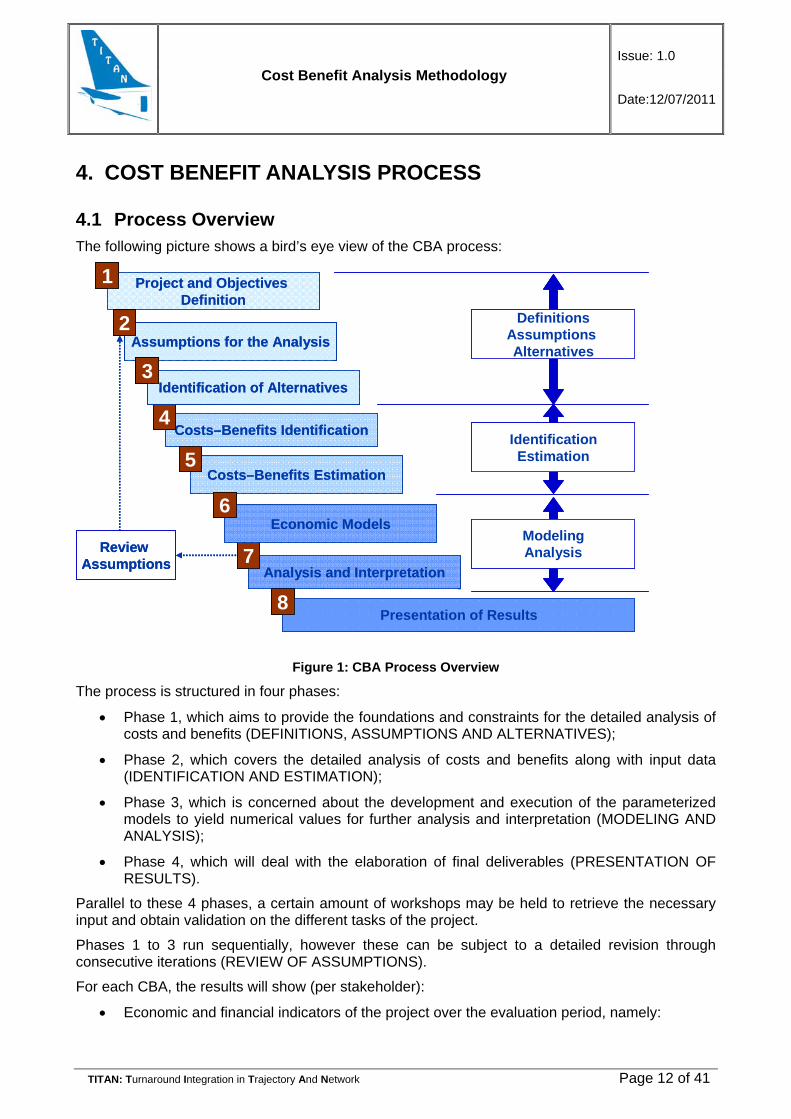
4.1 Process Overview The following picture shows a bird’s eye view of the CBA process:
Figure 1: CBA Process Overview
The process is structured in four phases:
Phase 1, which aims to provide the foundations and constraints for the detailed analysis of costs and benefits (DEFINITIONS, ASSUMPTIONS AND ALTERNATIVES);
Phase 2, which covers the detailed analysis of costs and benefits along with input data (IDENTIFICATION AND ESTIMATION);
Phase 3, which is concerned about the development and execution of the parameterized models to yield numerical values for further analysis and interpretation (MODELING AND ANALYSIS);
Phase 4, which will deal with the elaboration of final deliverables (PRESENTATION OF RESULTS).
Parallel to these 4 phases, a certain amount of workshops may be held to retrieve the necessary input and obtain validation on the different tasks of the project.
Phases 1 to 3 run sequentially, however these can be subject to a detailed revision through consecutive iterations (REVIEW OF ASSUMPTIONS).
For each CBA, the results will show (per stakeholder):
Economic and financial indicators of the project over the evaluation period, namely:
Project and Objectives Definition
1
Assumptions for the Analysis2
Costs–Benefits Estimation
Costs–Benefits Identification4
5
Analysis and Interpretation7
Presentation of Results8
Economic Models6
Identification of Alternatives3
Review Assumptions
DefinitionsAssumptions Alternatives
ModelingAnalysis
IdentificationEstimation
Project and Objectives Definition
1
Assumptions for the Analysis2
Assumptions for the Analysis2
Costs–Benefits Estimation
Costs–Benefits Identification4
5
Analysis and Interpretation7
Presentation of Results8
Economic Models6
Identification of Alternatives3
Identification of Alternatives3
Review Assumptions
DefinitionsAssumptions Alternatives
ModelingAnalysis
IdentificationEstimation
Cost Benefit Analysis Methodology Issue: 1.0
Date:12/07/2011
TITAN: Turnaround Integration in Trajectory And Network Page 13 of 41
Net Present Value (NPV)
Benefit to Cost Ratio (B/C)
Breakeven point
Payback Period
The financial indicator we will use in the TITAN Tool CBA is the NPV, i.e. sum of the discounted cash flows generated by the implementation and operation of the TITAN tool. Cash flows include cash inflows and cash outflows (see Appendix D for further explanation on NPV);
Sensitivity analysis identifying the most critical variables to the economic success of the project;
Risk analysis showing the likelihood of the project delivering a certain net present value;
Recommendations for project investments including focus for further research.
The phases and steps outlined here will be explained with further detail in the following sections.

Cost Benefit Analysis Methodology Issue: 1.0
Date:12/07/2011
TITAN: Turnaround Integration in Trajectory And Network Page 14 of 41
5. COST BENEFIT ANALYSIS PHASES
5.1 Phase 1: Definitions, assumptions and Alternatives The first phase of the CBA process focuses in establishing the common ground for the later phases:
Providing technical and business foundations for the project;
Providing a view of when and how they will be deployed;
Providing an understanding on to whom and how the project –if implemented-will affect the way of doing things;
Providing an overview on how the future will look like;
Providing a set of other assumptions or constraints for the analysis.
To achieve these objectives, Phase 1 is structured in three tasks which run sequentially:
Project Definition and Objectives;
Assumptions;
Identification of alternatives.
5.1.1 Project Definition and Objectives
A project is a proposal of actions to be done in order to fulfil a unique (non repetitive) objective within a given timeframe and limited availability of resources.
The first task that has to be accomplished within any CBA process is to define clearly:
the project and the objectives it seeks;
the envisaged outputs;
what decisions are to be supported by the CBA;
why it is necessary to carry out the project and why now;
what are the practical implementation details of the project;
who is involved;
when it will start;
where it will be implemented;
Identify stakeholders.
CBA studies are typically accomplished as part of the decision making process, they traditionally take place before actual execution of the project, therefore assuming a certain degree of uncertainty around many of the previous relevant issues.
For any CBA, it is of vital importance to identify all parties that are affected (directly or indirectly) by the project, otherwise important effects and consequences (either positive or negative) will be omitted, and thus inducing biased and distorted conclusions about the project. These parties are known as the “Stakeholders” of the project.

Cost Benefit Analysis Methodology Issue: 1.0
Date:12/07/2011
TITAN: Turnaround Integration in Trajectory And Network Page 15 of 41
Within air transport system investment projects, the list of stakeholders is widely accepted to be segmented in the following classification:
1. Airspace Users;
2. Air Navigation Service Providers (ANSP);
3. Airport Operators / Authorities;
4. Ground Handlers;
5. Aeronautics industry;
6. Passengers;
7. Overall community (society).
Segments 1 to 4 are called focus segments, or equivalently segments for which the question of economic viability will be addressed in economic valuation of investments. Segments 5 to 7 are contributing segments, segments that contribute to a complete coverage of costs and benefits but for which no specific economic valuations will be conducted under this methodology (out of scope). TITAN will address the so called focus segments, namely: Airspace Users (Airlines), ANSPs, Airports, and Ground Handlers.
To ensure commitment from the different stakeholders to the investment decisions, they must be actively involved in the development and evaluation of the economic impact.
It is good practice that at this stage of the CBA process, each Stakeholder make a formal statement about why they consider themselves a stakeholder in the project and what their expectations are (either in terms of economical return, effort, risk, etc). For TITAN Stakeholders’ expectations are defined in the D1.2 (Ref. 4).
5.1.2 Assumptions for the analysis
Prior to analysis of costs and benefits, the project has to be fully stated and characterised. This requires establishment of assumptions that will guide the overall CBA process.
Due to the varying degrees of uncertainty, any economic analysis on a project will necessarily have to be performed on a set of assumptions. These will have to be identified and clearly defined along with the basis for their establishment (i.e. expert judgement, forecast predictions, standard input data, etc).
The identification of assumptions is flexible as in some cases it is not possible to define them in the beginning of the analysis and in other occasions they can be changed or modified along the CBA process as more reliable data becomes available.
5.1.3 Alternatives
The Baseline Scenario is the alternative choice for continuing with the current situation or approved plans for investment (also known as the “Business As Usual” or “do-nothing” option). It is the reference case against which the project is appraised. It doesn’t imply that all investment initiatives will be blocked, but rather what the air traffic business will be if the project should not be implemented.
Whenever possible, all scenarios in the analysis, including the baseline, should be structured in the same way and provide a similar approach to its description.

Cost Benefit Analysis Methodology Issue: 1.0
Date:12/07/2011
TITAN: Turnaround Integration in Trajectory And Network Page 16 of 41
The value of the Baseline option is intimately linked to the fact that airspace capacity will be outstripped by demand; airports, ANSPs, aircraft operators and the overall community might lose revenue if the do-nothing option is taken. Not taking any action is likely to cause an opportunity cost that has to be quantified.
Addressing the Baseline scenario is typically the first step prior to other scenario definitions. It is very important to evaluate it explicitly and precisely enough as to allow to calculate the economic consequences of the improvements due to the implementation of the alternative(s).
A mentioned before, CBA often uses incremental costs and incremental benefits, comparing the baseline with the alternatives. In other words, the cash flows (costs and benefits) taken into account for the CBA are only cash flows that are different between the situation with the alternative or alternatives implemented and the baseline (do nothing alternative).
5.2 Phase 2: Identification and Estimation Analysts team will need to know at an early stage:
What type of benefits the project is likely to bring;
How much (approximately) these benefits will be worth in economic terms;
Who will receive the benefits (beneficiaries);
What the associated costs and usage of resources are likely to be.
The second phase of the CBA process is concerned about the identification of the associated costs & benefits for the stakeholders identified in the previous phase. It is also the purpose of this phase to provide a quantification of those expected costs and benefits.
To achieve these objectives, Phase 2 is structured in two main tasks which can be run either sequentially or in parallel:
Identifying & Assessing (estimating) Costs;
Identifying & Assessing (estimating) Benefits.
To accomplish these tasks, an approach to the identification and assessment tasks is made in other sections within the document. For best results, guidelines for the identification of data sources and use of expert judgement are also presented in the appendixes. Finally, a list of common pitfalls to avoid is also presented afterwards in this document.
The following sections provide a practical approach to the identification of costs and benefits.
5.2.1 Costs Identification
The purpose of this section is to support the capture of the costs of the investments required from different stakeholders’ points of view by an appropriate breakdown structure, at each phase of the life-cycle (from R&D to operations).
It is important to stress that costs should be seen as the resources or efforts invested in deploying and operating the project. Diminished returns in specific areas due to the project are not costs, and should be considered as “negative benefits”.
As a full and comprehensive breakdown structure definition depends on both the phase of the project and its nature, it is not the intention of this section to give a detailed list of costs to be used in any CBA; these will have to be derived from expenditure and operational plans (CAPEX and OPEX).

Cost Benefit Analysis Methodology Issue: 1.0
Date:12/07/2011
TITAN: Turnaround Integration in Trajectory And Network Page 17 of 41
Again, it is very important to realize that for CBA purposes only differential costs are relevant, that is, those costs that are incremental to the baseline case (the reference scenario which is to do nothing or not to implement the project). It should be noted as well that any costs that have already been incurred (or already committed) are to be accounted as sunk costs. These include any R&D performed plus the cost of any trials/validation.
The costs breakdown will follow the EATMP CBA Advisory Group (ECBAG) Guidelines (Ref. 8). Costs for applications can be characterised and further categorised in three different dimensions:
By system destination:
Space;
Airborne;
Ground.
By project phase:
R&D;
Implementation including Implementation Planning;
Operations;
Decommission.
By recurring characteristics:
Investment;
Operating;
Transition costs.
The cost assessment at the strategic level will have as a starting point the cost breakdown per project phase, and a more detailed cost breakdown per stakeholder segment.
5.2.2 Costs Assessment
This section, mainly for reference purposes, identifies the cost categories that are envisaged to be used at the strategic level and the type of assessment that will be carried out at this level. Considering that strategic economic evaluations will have to be carried out in different phases of the life cycle, a categorisation per phase of the life cycle is used. The cost categories are:
R&D;
Implementation;
Operations and Maintenance;
Termination.
R&D costs
These comprise all the costs incurred in the research, technology and development planned for an application. Examples are simulation studies, trials, development of prototypes including contributions made by the different stakeholders such as aircraft for airborne trials or ATCO for real-time simulations.
Implementation Costs

Cost Benefit Analysis Methodology Issue: 1.0
Date:12/07/2011
TITAN: Turnaround Integration in Trajectory And Network Page 18 of 41
These costs are associated with the expenditure in assets and all activities needed to bring them into revenue operation including the transition from the existing one:
The acquisition and installation of equipment and property;
One-off expenditure for the project, including services and operating start-up costs.
The term “One-Off implementation costs”, often used in ATM CBAs, refers to costs of co-ordination, facilitation, and definition of procedures and of other planning activities needed to implement the project. One-Off Costs are also costs as result from training, implementing changes to systems, certification, contingency and transition between the old and the new systems. The launching of operations also involves monitoring and transition costs that are necessary during the period when legacy systems have to be retained and run in parallel with the new ones. The decommissioning of systems at the end of their working life, temporary closure or reduction of major facilities resulting in delays, diversions, cancellations, etc should also be considered under this category.
Operating costs
These are all the incremental recurrent costs incurred by the different stakeholders as a result of the deployment and operation of the project. The following costs should be evaluated under this category:
Staff (internal and external);
Recurring (refreshing) training;
Regular Operations (maintenance, repairs, materials, supplies, utilities and other services);
Overheads (administration, personnel, training, insurance);
Costs that result from maintenance of backup systems.
Termination Costs
Often neglected in CBA, these are mainly dismantling costs (i.e. remove, and dispose of old buildings, equipment, spare parts, etc.) When studying large ATM projects (involving the investment in large facilities and lands) these costs should not be ignored because the impact in the NPV of the project.
It is also worth to mention here the Savage Value. Even though usually not a cost, it is the value, if any, of the investment equipment at the end of its expected life. It is treated as an offset to termination costs.
Note that the assessment of the cost of an investment will vary depending on the phase of the life-cycle. Costs that have already been incurred are sunk costs and are thus irrelevant for a decision on whether to continue with a project or not. For example, for a project that has already gone past the R&D phase, the investment cost already incurred in R&D should not be considered when making a go/no go decision (the R&D cost would be the same for the ‘go’ and ‘no go’ cases). Sunk costs should, however, be collected and monitored to provide input to future assessments.
5.2.3 Benefit Identification
This part of the process aims to support the capture of the benefits of the project from the different stakeholders’ viewpoints by an appropriate breakdown structure, at each phase of the life cycle (development, deployment, operation).

Cost Benefit Analysis Methodology Issue: 1.0
Date:12/07/2011
TITAN: Turnaround Integration in Trajectory And Network Page 19 of 41
Benefit is a direct consequence of the deployment of the project. Benefits are perceptible, substantiated and tangible improvements for a partner accruing from organizational, institutional, attitude, operational and/or technical changes inherent in the implementation of the project.
The benefits breakdown will follow the ECBAG Guidelines (Ref.8).
The ATM projects are expected to provide a number of benefits for stakeholders in the areas of safety, security, capacity, cost effectiveness, efficiency and the environment.
TITAN will not be considering environmental issues. As explained in D1.3 (see references) the monetised environmental cost (i.e. the impact of emissions in economics terms using, for instance, existing Emissions Trade Schemes) is not included at this stage because of its complexity, small impact of turnaround improvements on the environment, and the lack of standardization to apply these trade schemes.
5.2.3.1 Benefits Identification
Monetary benefits can come in two different forms:
Additional revenues for a stakeholder;
Cost savings or Cost avoidance for stakeholder.
Regardless the shape benefits come in these can and have to be categorized. There is a widely agreed categorisation scheme that can be used as a safe starting point:
Additional Revenue to Stakeholders: Potential revenue from increased capacity, measurable in terms of revenue per additional flight, revenue per km controlled or revenue per service unit;
Investment Expense Savings: Investment expenses (e.g. replacement or upgrade of facilities) that will not need to be done because of the implementation of the project;
Flight Efficiency Improvements: Savings from more efficient flight profiles. Measured in terms of savings in flying time and in fuel burn and in the emissions caused by non-optimal flight profiles;
Improvements in Productivity of ATSP: Savings from more efficient provision of Air Traffic Services, measured in terms of the difference in flight-hours controlled per ATCO or in costs per ATCO without and with the deployment and operation of the project. Improvements in productivity can be also applied to other stakeholders.
Reliability Savings: Savings from more reliable (less likely to fail) systems, reduced maintenance costs and/or reduced costs of delay cancellation and diversion caused by equipment failure;
Delay Cost Savings or Avoidance: Savings (or avoidance) from less ground and air delay (measured in minutes of delay) and also from fewer cancellations. For ATSP, when applicable, savings from lower penalties to be paid;
Environmental Benefits: Savings from less emissions and noise due to operation of the project (some of these savings might result from flight efficiency improvements). Airspace users may also have specific savings from paying fewer fines. Airports with a noise quota might be able to get additional revenue from a positive impact of the project on the noise of flights;

Cost Benefit Analysis Methodology Issue: 1.0
Date:12/07/2011
TITAN: Turnaround Integration in Trajectory And Network Page 20 of 41
Safety Benefits: Increase in safety level assessed qualitatively or quantitatively. Quantitative measurement: reduction in number of ATM risk bearing incidents and accidents;
Security: Increase level of security and improve security management;
More Predictability of Operations: Decrease in unexpected changes to operations, such as unforeseen flight delays. Ultimately, unforeseen irregularities can force airspace users to invest in spare aircraft, crews and other resources to ensure normal running of operations;
Airports Operating Expense Savings: Reduction in operating expenses (staff, maintenance and support);
Contingency Benefits: Safety benefit and/or avoidance of delay/cancellation and diversion costs caused by system failure or a reduced level of service. Reduced revenue loss;
Upgradeability: Benefit if a project facilitates future upgrades. This benefit is assessed in qualitative terms;
International Commitments: Benefit if the project is necessary to fulfil international commitments;
Harmonization, Co-ordination, Convergence and Standardization: Benefits of the project that involve harmonization, co-ordination and central planning. Without that co-ordination individual organizations would have higher costs in exchanging, distributing information and taking decisions.
5.2.4 Benefit Estimation
There are three main operational benefits requiring special attention in ATM projects. They are:
1. Delay savings and avoidance including flight cancellations, diversions and re-routings;
2. Flight efficiency savings, that is savings from more efficient flight profiles;
3. Air Traffic Service productivity improvements.
The evaluation of these benefits will be carried out outside the economic model using more detailed and better-suited tools available (e.g. simulations), but the results of these evaluations will be a key input to the economic model. The economic model will then value these benefits.
The following sections are generic and for reference. They focus on each of these benefit categories (i.e. delay, flight efficiency and productivity), providing some clues to assess and to include them in a CBA process for generic ATM improvements (Ref. 8).
Approach to assess delay costs savings
Delay cost savings or avoidance are savings that result from shorter ground, airborne and associated reactionary delay (delay that is a consequence of previous ATM delay). The modelling of delay over several years can also include delay that airlines incorporate into their schedules from one year to the next. This delay is less costly than the unforeseen delay. Delay savings also include savings from fewer flight cancellations and fewer re-routings.
These cost savings and avoidance benefit all focus stakeholder segments: airspace users, airports and those ATSP who have to pay penalties for excessive delays.
Assuming that in the medium/long term delay is reduced to an optimum level (that is a level of optimum trade-off between investing in more capacity and the delay cost caused by the lack of that

Cost Benefit Analysis Methodology Issue: 1.0
Date:12/07/2011
TITAN: Turnaround Integration in Trajectory And Network Page 21 of 41
capacity) the delay benefit from then onwards will be assessed as delay avoidance instead of actual delay reduction.
In previous CBAs in ATM, assessment of delays has used the result of the Strategic Performance Framework (SPF) capacity assessment as an input and provided the following input to the economic evaluation:
Delay – change in minutes of ground, air delay, reactionary unforeseen delay and foreseen delay. Air delay is assumed to include re-routings;
Flight cancellations – change in flight cancellations as a result of the operational improvement introduced by the project. Flight cancellations happen when there is excessive delay. Modelling assumptions based on different airspace users when faced with delays might have to be made.
Changes to this situation can be estimated using analytical or fast-simulation tools. The corresponding impact on ATSP in terms of delay penalties will also need to be assessed. This approach can also be used if deemed necessary.
Initial estimates for cost of a minute of ground, air delay and of a flight cancellation can be obtained from Standard Inputs. However, these values are overall averages; stakeholders may want to provide specific values for their segment.
Approach to assess improvements in flight efficiency
Flight efficiency improvements can be of three types:
1. Shortening of route extension (horizontal flight efficiency);
2. Improvements in the vertical flight profile (vertical flight efficiency);
3. Flight speed closer to the optimum (optimum from the airspace users' viewpoint may not be the environmental optimum). This is a more complex improvement to assess which will not be considered for the time being.
All three types eventually affect flying times and fuel burn. Additional fuel burn brings additional cost not only to airspace users but also to the environment at large through increased emissions.
The estimates of changes to additional flying time and fuel burn brought by more efficient flight profiles will be an input to the economic evaluation. Once these estimates are provided, cost savings from more efficient flight profiles can be directly calculated by using standard input values for the cost of additional flying time and the cost of fuel. However, as the input value for the cost of additional flying time is an overall average, stakeholders might want to provide values specific to their segment.
Existing operational improvement validation reports that contain results on flight efficiency can be used for the economic evaluation. In addition, a simulation study will have to be carried out prior to the economic evaluation to obtain a more complete and accurate picture of the operational improvement on horizontal and vertical flight efficiency.
Approach to assess benefits from Air Traffic Services improvements
Other benefits, such as additional revenue from providing more capacity, lower ATS costs and delay savings often result from increased productivity.
Air Traffic Services productivity improvements benefit ANSPs offering them the possibility of reducing costs and/or increasing capacity (and reducing delay). They also benefit airspace users through lower route charges and/or fewer delays.

Cost Benefit Analysis Methodology Issue: 1.0
Date:12/07/2011
TITAN: Turnaround Integration in Trajectory And Network Page 22 of 41
To estimate the impact of the application on productivity, the cost per flight-hour controlled is decomposed into two components: flight-hours controlled per ATCO (physical productivity) and costs per ATCO.
The impact of applications operational improvements on physical productivity is assessed and will be an input to the economic evaluation. The additional flight-hours controlled per ATCO will be translated to additional revenue and delay savings (if needed) or to reduced costs of ATS provision. The translation of productivity improvements into monetary benefits will depend on the projected situation for certain airspace. If that airspace is expected to be capacity constrained there will be a benefit provided by additional capacity and by delay cost savings. If that airspace is not expected to be constrained the benefit will be provided by the possibility to reduce the cost of ATS provision.
The impact of the project operations on costs per ATCO (the second component of productivity) will be assessed in the scope of the economic evaluation with input from ATSP.
EUROCONTROL Performance Review Unit (PRU) has gathered data from ATSPs as part of regular benchmarking of productivity. These data can be used for the baseline in year 0. Assumptions on the evolution of ATCO costs will be taken with input from ATSP.
5.2.4.1 Intangible Benefits
It should be noted that a benefit need not be quantifiable to be recognized as a real benefit. As far as possible any benefit should be expressed in monetary terms in order to be compared against the costs.
Nevertheless, for certain reasons (availability of time and resources, difficulty to find a consensus on a yardstick for measurement, etc) some benefits cannot be monetised. In this case, effort will be placed on assessing the benefit in quantitative terms (e.g. physical units). Whenever such quantification is too difficult or impossible, all qualitative or intangible benefits will be exhaustively enumerated, documented, explained and justified.
5.3 Phase 3: Modelling and Analysis Phase 3 of the CBA is intended to produce the numerical results of the CBA, turning the formal knowledge and inputs from Phase 2 into the desired CBA outputs.
Phase 3 is structured in the following consecutive tasks:
The creation of economic models for stakeholders and running that models;
Analyzing and interpreting the results.
Additionally, a revision process should be established to improve reliability and accuracy of results, mitigating risks and improving results.
5.3.1 Create and run economic models
Economic models enable a transition between the conceptual scheme of quantifiable costs and benefits to a spreadsheet that actually delivers the sought after numerical results about the project (NPV, charts, etc).
The way this is accomplished is through the creation of influence diagrams that model the intrinsic cost-benefit mechanisms of each stakeholders, and can be parameterised with the relevant data identified both for deterministic and stochastic (i.e. uncertain) variables.

Cost Benefit Analysis Methodology Issue: 1.0
Date:12/07/2011
TITAN: Turnaround Integration in Trajectory And Network Page 23 of 41
5.3.1.1 Influence Diagrams
The influence diagram is a graphical representation that shows all the variables that impact a specific value (e.g. the NPV for a project). It is actually an alternative representation to a decision tree.
Influence diagrams are composed of a number of graphical elements or shapes known as nodes. Each of the four types of node represents a specific type of information as shown in the following example.
There are four types of nodes:
Value – contains instructions for how to calculate the value of the project in various stages;
Deterministic – expresses constant values or equations combining other variables;
Uncertainty – expresses a lack of knowledge concerning the distribution of the variable;
Decisions – include the quantities with one or more possible outcomes which can be manually controlled.
Each influence diagram highlights:
The inputs required for the analysis versus the functions used to calculate cost and benefit and to describe the timing of the costs and benefits;
The uncertainties and where they fit in to the analysis model;
The inter-relationships between all the variables (inputs and calculations based on inputs).
When two uncertainties do not have an arrow between them, it implies that the variables are independent. That means that knowing the outcome of one uncertainty does not change our prediction for another uncertainty. This is an important consideration when we interpret the tornado diagram.
Figure 2: Influence diagram example
R&DInvestment
Benefits Costs
CostsVariable
CostsFix
Predictability
Delay Red. Savings
Cost Red.Flexibility
Efficiency
ValueInvest?
R&DInvestment
BenefitsBenefits CostsCosts
CostsVariableCosts
VariableCosts
FixCosts
Fix
PredictabilityPredictability
Delay Red. Savings
Delay Red. Savings
Cost Red.Flexibility Flexibility
EfficiencyEfficiency
ValueInvest?

Cost Benefit Analysis Methodology Issue: 1.0
Date:12/07/2011
TITAN: Turnaround Integration in Trajectory And Network Page 24 of 41
Influence diagrams may provide (using specific tools):
A deterministic evaluation of the project by identifying the most critical variables and displaying them in a Tornado diagram;
A probabilistic evaluation of the project by assessing probability distributions of the critical uncertainties.
5.3.1.2 Model Spreadsheets
Influence diagrams translate into Excel spreadsheets that retain all the calculations needed. This is the first level of output – a spreadsheet displaying inputs, intermediate calculations, the NPV and cash flows (outputs). A spreadsheet may be generated by each stakeholder.
These Excel spreadsheets can then be used to validate the data and to produce charts and to calculate additional indicators such as:
Payback period;
Internal rate of return;
Benefit to cost ratio.
These spreadsheets will then be fed with the data identified in previous sections in order to generate the numerical results. Different data sets will allow playing What-if with the models in different scenarios.
Figure 3: Influence Diagrams and Spreadsheet Models
A B C D E F G H1 Inputs Values2 A3 B4 C5 D678 NPV9
10 Cashflows 2004 2005 2006 2007 2008 2009 201011 Benefit12 Costs13 CashFlows
Results (NPV)
Value (Result)
DependentVariables
(Functions)
Independent Variables (inputs)
IndependentVariables (inputs)
DependentVariables
(Functions)
Value (Result)
Benefit Variable A
Benefits
Net Present Value
Costs
Cost Variable C
Benefit Variable B
Cost Variable D
INVEST IN THE PROJECT?Value (Result)
DependentVariables
(Functions)
IndependentVariables (inputs)
A B C D E F G H1 Inputs Values2 A3 B4 C5 D678 NPV9
10 Cashflows 2004 2005 2006 2007 2008 2009 201011 Benefit12 Costs13 CashFlows
Results (NPV)
Value (Result)
DependentVariables
(Functions)
Independent Variables (inputs)
IndependentVariables (inputs)
DependentVariables
(Functions)
Value (Result)
Benefit Variable A
BenefitsBenefits
Net Present Value
Net Present Value
CostsCosts
Cost Variable C
Benefit Variable B
Cost Variable D
INVEST IN THE PROJECT?Value (Result)
DependentVariables
(Functions)
IndependentVariables (inputs)

Cost Benefit Analysis Methodology Issue: 1.0
Date:12/07/2011
TITAN: Turnaround Integration in Trajectory And Network Page 25 of 41
Figure above illustrates the similarities between Influence Diagram and Spreadsheet Models. It is important to mention here the recommendation to generate spreadsheets (models) in a structured / standardised manner. As shown, it is recommendable to establish an area for the inputs (independent variables), other for values, and finally an area for calculations or dependent variables (functions). This will facilitate further utilizations and management of the models.
5.3.2 Analysis and Interpretation of Results
Once the Excel spreadsheets and data sets are combined and run, the results have to be appraised as to reach useful conclusions and being able to prepare an adequate action plan.
The appraisal of results is typically done by:
Expected NPV;
Analysing sensitivity of the results to model variables (Sensitivity Analysis);
Analysing the probabilistic distribution of the results (Risk Analysis).
The purpose of these reports is to provide the decision maker of the project with the best available information and in a structured way, as to allow him to make a well informed decision.
5.3.2.1 Sensitivity Analysis
Sensitivity analysis examines the sensitivity of the project’s economic performance – its cots and benefits – to the variation of individual parameters in order to identify the most critical issues and the degree of their impact. The most significant parameters to be considered in the conduct of a sensitivity analysis will vary from project case to project case and cannot be brought in advance.
The results of a sensitivity analysis are usually presented graphically. Tornado Graphs are the standard tool for this purpose. A Tornado Graph compares the results of multiple analyses. The X-axis is drawn in the units of the expected value (typically NPV), and then for each variable (listed on the Y-axis), a bar is drawn between the extreme values of the expected value calculated from the lower and upper bound values. See the following picture for an illustration. The variable with the greatest range is plotted on the top of the graph, and the remaining variables proceed down the Y-axis with decreasing range. The longest bar in the graph is associated with the variable that has the largest potential impact on expected value, and thus needs careful attention.
Base Value (all variables equal to base case) NPV = 94
• Tornado Diagrams show the change in the value (NPV) when a variable changes from the high to the low value while keeping the rest variables to the base value
• In this example, when the variable “Total Infrastructur.” equals to 3950 the NPV is 250 (Blue Arrow). However, if the variable is 4253, the NPV is -75 (Red Arrow).
• Tornado diagram allows “What If Analysis…” (i.e. What happens to the NPV of this projects if the value of the variable equals to …)

Cost Benefit Analysis Methodology Issue: 1.0
Date:12/07/2011
TITAN: Turnaround Integration in Trajectory And Network Page 26 of 41
Figure 4: Tornado Diagram Example
The Tornado graph brings attention to the variables that require further attention. In most real projects, the Pareto rule will happen, as 20% of the variables will typically account for 80% of possible expected value excursion.
5.3.2.2 Probabilistic Risk Analysis
Probabilistic Risk analysis provides the probability distributions of output magnitudes. The decision-maker can then have a complete picture of all the possible outcomes.
These probability distributions can then be used to perform different assessments:
Determine a correct range for the results;
Identify probability of occurrence for each possible outcome.
As a result, it is easy to get an overview of the risks involved and a feeling for how they should be addressed.
The probabilistic risk analysis is often based on Monte Carlo simulation, but may also be based on calculations (e.g. solving a decision tree) using the multi-point estimations with the associated probabilities. In both cases, the confidence intervals associated with the uncertainties of the model have to be carefully assessed in order to get the results as reliable as they can be.
The following picture shows a typical cumulative probabilistic distribution:
Figure 4: Probabilistic diagram Example
Figure 5: Cumulative Probabilistic Distribution Example
5.3.2.3 Analysis and Interpretation of Results
Stakeholder and expert judgment will make conclusions and recommendations for decision makers. These can either lead to a new iteration of the process or to the acceptance of the results.
• Cumulative Probability Curves show the probability that a variable (NPV) is less than or equal to a given value. • In this example the probability of obtaining an NPV equal to or less than 0 is 35%• Makes it easy to compare alternatives (black, red, and green) from a risk and reward standpoint
• Cumulative Probability Curves show the probability that a variable (NPV) is less than or equal to a given value. • In this example the probability of obtaining an NPV equal to or less than 0 is 35%• Makes it easy to compare alternatives (black, red, and green) from a risk and reward standpoint

Cost Benefit Analysis Methodology Issue: 1.0
Date:12/07/2011
TITAN: Turnaround Integration in Trajectory And Network Page 27 of 41
5.3.2.4 Detailed Revision Process
The detailed revision process is intended to improve results by means of an iterative process.
The process will typically take place whenever it is required to achieve:
greater accuracy in the model or data;
less uncertainty (dispersion) on the results (potential outcomes).
Accuracy can be improved by refining the models along with the quest of more accurate input data; on the other hand, uncertainty can be reduced by introducing mitigation measures for the risks identified or carrying out studies that reduce uncertainty on different outcomes. Modifying any of these elements requires going through an iteration of Phases 1 to 3.
The iteration process typically takes place every time that, once reached this point in the process, the working group considers that there is still value to be added by an extra iteration taking into account the estimated required effort and boundary conditions given (i.e. budget and/or deadlines).
These can be justified if there is a need to:
Upgrade models/data to better resemble reality:
o Introduce decision making points in the model;
o Provide more reliable and/or precise input data;
o Revise confidence intervals for uncertainties;
o Introduce new stakeholders;
o Other.
Introduce mitigation measures to manage risk:
o Perform market prospecting studies;
o Insurance contracts;
o Contracting clauses;
o Other.
In a well designed CBA process, the first iteration usually yields results from which most conclusions can be drawn. Only a few iterations are needed to provide stable and reliable results that require no further fine tuning.
5.4 Phase 4: Presentation of Results Phase 4 deals with the presentation to the stakeholder of CBA outcomes and the elaboration of final report.
The CBA is a tool for decision makers, used to evaluate whether the investment is economically viable for Partners/Stakeholders. The majority of times, the person performing the analysis is not the same person making the decision. The presentation of results depends on the knowledge about the tools employed by the analyst that the decision maker has. It is important that the decision maker is familiarized with the process followed.
The most adequate form to present the results and the recommendations is to follow the methodology described in this document and some other tasks:
Project and Objective Definition;

Cost Benefit Analysis Methodology Issue: 1.0
Date:12/07/2011
TITAN: Turnaround Integration in Trajectory And Network Page 28 of 41
Assumptions;
Identification of Alternatives;
Costs and Benefits Identification and estimation;
Present the Economic Models and its mechanisms;
Create and Run Economic Models;
Analysis and Interpretation of Results;
Presentation of results;
Global evaluation of the project;
Comparative analysis of the different alternatives or scenarios;
Summary and recommendations.
Within the project group, the following have to be clearly defined:
Management summary;
Purpose and Scope of the document;
Procedure followed;
Presentation of results and conclusions;
Supporting data;
References.
A formal review process will then be undertaken to achieve the best possible consensus from all participants and the minimum number of ambiguities, mistakes and/or omissions.

Cost Benefit Analysis Methodology Issue: 1.0
Date:12/07/2011
TITAN: Turnaround Integration in Trajectory And Network Page 29 of 41
6. TITAN SPECIFICS: METHODOLOGY
6.1 Scope The TITAN project addresses the airport operations focusing on the turnaround process. Its final objective is to prepare the aircraft and achieve the AOBT on time.
Figure 6: TITAN scope
The proposed TITAN solution is described in the ConOps [Ref. 4] which develops the new advanced operational concept for the turnaround process aimed to improve predictability, flexibility, efficiency, cost effectiveness and to provide a common situational awareness to those actors involved in the process. The scope is limited to the sequence of ground operations required to service the aircraft in the turnaround from the in-block to the off-block time as well as those external services which have a direct influence on it.
The Concept of Operations is expressed in a process-based, service-oriented way based on principles like net-centricity, information management or collaborative decision making. It describes how the turnaround process will be performed from different perspectives by identifying functions and processes, and their corresponding interactions and information flows; concerned actors, their roles and responsibilities.
Regarding processes, main focus is on landside processes and their link with airside ones, a description of how to track passenger and baggage flow is addressed among others. Also common and off-airport processes are considered to ensure an extended handling view by including processes hitherto not, or not fully, considered in the Collaborative Decision Making view.
In order to be executed, those processes require various services which, in turn, support end-user applications that are the operational interface to the outside world (for humans) or to external environments without human intervention. Services in the TITAN concept of operation context include both operational and supporting services but exclude technical/IT services. As an application of those services, TITAN collects technical performance data as well as data on planned and actually performed trajectories, warnings (time issued and time in advance), actions, etc. The aim is to provide sufficient data to end-user applications that generate performance information for the different partners, including trends and problem source analyses.
TITAN is aligned with and complements A-CDM through a better management of the turnaround. To this aim, TITAN will use the procedures and rules established for A-CDM supplemented by those developed for the turnaround. Besides A-CDM milestones, a set of specifically turnaround milestones have been defined to support the monitoring of the turnaround process progress. Those significant events that occur during the planning or progress of the aircraft trajectory and may have an impact on coming events aimed to link the air and landside, improve current information flows and predict forthcoming events.

Cost Benefit Analysis Methodology Issue: 1.0
Date:12/07/2011
TITAN: Turnaround Integration in Trajectory And Network Page 30 of 41
From CBA point of view it is important to remark that TITAN will deliver a prototype of a tool not a final product. The main implication from this fact is that further investment will be required to develop a final tool for the market place. This investment has to be considered in the CBA for the TITAN tool.
The CBA will help stakeholders make the best-informed decision for the investment / acquisition in a TITAN Tool based on TITAN project findings. To establish the economic and financial impact of the TITAN Tool, CBA team will use generic assumptions, i.e. will not be using specific data from a particular stakeholder. In other words, stakeholders’ models and data will represent the industry in general, not company specific.
TITAN WP5 will deliver a complete CBA based in a business model (TBD) for a future marketable TITAN tool.
Finally, we can advance here that the baseline scenario (i.e. the do nothing alternative) of the CBA for the TITAN tool is the turnaround process without the TITAN Tool.
6.2 Stakeholders The following table summarizes the stakeholders considered in TITAN. CBA will address all these stakeholders:
Stakeholder
Airlines
Airports
Air Navigation Service Providers
Ground Handling Agents
Table 1: Stakeholders List
The airline will be the stakeholder responsible for operating the tool. Airlines are key beneficiaries from the implementation of the tool as they are key actors in the decision making process for turnaround. They should be expected to have the highest ratio of costs. However, the implementation of the tool has (monetary) impacts to other stakeholders.
The operation of the tool by multiple airlines at a single airport is the envisaged operating scenario. Derived from this operation, other stakeholders (Ground Handlers, ANSP, and Airports) will also receive benefits (i.e. more predictability, better resource allocation, etc.)
The industry (Tool Provider) will provide inputs for the CBA analysis on the costs and benefits of the TITAN tool implementation.
The implications of each stakeholder related to the TITAN Tool (roles, costs and benefits) will be defined in the CBA (WP 5.2 deliverable). However it can be anticipated here that Stakeholders models will represent the industry in general, i.e. .will not be company specific.
6.3 Expected Benefits This section presents initial thoughts for the CBA Phase II. A more detailed study will be necessarily performed during the CBA of the TITAN tool.
TITAN expected benefits are intimate linked to the high level objectives defined in TITAN project. These are:

Cost Benefit Analysis Methodology Issue: 1.0
Date:12/07/2011
TITAN: Turnaround Integration in Trajectory And Network Page 31 of 41
Increase of predictability (due to the turnaround process);
Reduction of the operational costs (handling companies and airlines);
Increase efficiency of airlines operations (punctuality).
The objectives are related to Key Performance Areas (KPAs). The identification of these KPAs has been done in deliverable of WP 1.3 “TITAN Performance Framework Definition”. The definitions of the selected KPAs for TITAN are further explained in this document. According to these objectives, the following KPAs are considered for the TITAN project:
Predictability;
Efficiency;
Cost Effectiveness, and
Flexibility.
Table 2: TITAN KPAs and related targets
As mentioned in the “TITAN Performance Framework Definition”, although capacity might be enhanced by improving the efficiency of the Turnaround process, it is not an objective of the project to focus on the turnaround capacity. Therefore, CBA will initially not consider capacity increases as a benefit derived from TITAN tool implementation.
6.4 Feedback from Stakeholders During 2010, as part of the TITAN project, a workshop was held with stakeholders with the following objectives:
to present the TITAN project and the Consortium to the attendees;
to detect stakeholders’ problems, needs and gaps during the turnaround process, and
to share experiences among stakeholders in order to identify possible solutions to the previously discussed problems.
The workshop report (Ref. 3) presents the output from the sessions. Main considerations and conclusions directly related to the CBA are also presented here (per stakeholder). Most of them require further discussion / clarifications:
Airports:
Who benefits from an efficient handling?;
Who pays for the environment?;
Conflicting business models/objectives.
20%
9 %
3 minutes
Target
FP7-AAT-2008-RDT-1
Reduction of operational costs during Turnaround
Cost Effectiveness
TITAN ObjectiveReduction of the total numbers of delayed flights (flights with a departure
delay > 15 minutes)
Efficiency
TITAN ObjectiveReduction of the standard deviation of the Turnaround Process
Predictability
CommentsIndicatorKPA

Cost Benefit Analysis Methodology Issue: 1.0
Date:12/07/2011
TITAN: Turnaround Integration in Trajectory And Network Page 32 of 41
ANSP:
Currently there are penalties in case of delays (are they monetary penalties?)
Ground Handlers:
Standard format for the information should be defined but will require investment;
Many airlines impose Service Level Agreements (SLAs) with malus clauses (are they economic penalties?);
Airlines:
Information sharing will produce benefits if stakeholders use the information it to improve their processes.
Some conclusions from the workshop were:
For Airlines, predictability and efficiency are the areas from where most of the benefits are expected. Ground handler agents also think predictability is a major issue for turnaround process.
Information sharing is the key to improve turnaround process, mainly throughout delays and inefficiencies reduction. There is a need to establish and put into practice a CDM mentality. To implement this mentality to main factors are: using incentives policies instead of penalties and educate (training) people.
Proposed solutions require an economic investment, but it is not defined who should pay for it.
This last issue is critical for the CBA development. In future interactions within the TITAN team and with stakeholders it must be defined who is going to pay and who is going to get benefits.

Cost Benefit Analysis Methodology Issue: 1.0
Date:12/07/2011
TITAN: Turnaround Integration in Trajectory And Network Page 33 of 41
7. FINAL CONSIDERATIONS
In many CBAs there are a series of commonly made mistakes that will distort the numbers and may prevent the audience from reaching the right conclusions. These have to be understood in order to deliberately avoid incurring them. The following list is a non exhaustive list of the most common ones based on previous experiences and good practices in ATM CBAs.
Double Counting
Probably the most common problem with large projects in the aviation field arises because of inter-dependencies between different projects and trade-offs between benefits. Take for instance two projects expected to deliver the same benefit. The sum of both individually quantified contributions need not be the contribution of both projects as a whole, because of the law of diminishing returns on the resources put at stake. If each project is expected to provide a 5% increase in airspace capacity considering that all the rest of parameters/environment are kept constant, that doesn’t mean that concurrent implementation of both projects will yield a 10% increase in capacity. Once the bottleneck has been somewhat alleviated, the marginal benefit of the second project will decrease, because the context for its implementation is now different (the first project has already been accomplished).
Another mechanism for double counting arises from incorrect allocation of benefits. When an operational improvement can be applied in the shape of two or more benefits that have a trade-off between them, there is the risk of applying it in full to all of them. Assume for instance that an operational improvement can either reduce in 5% the already collapsed ATCO workload or conversely increase 3% airport throughput and consequent revenue. The correct thing to do would be to apply all the savings to either a 5% decrease in ATC operational costs, or to 3% increased airport revenue, or some balanced trade-off between them, but never to both of them in full at the same time.
Double counting is a simple concept. The difficulty comes in making sure that people are aware of the mechanisms through which double counting happens, and the relevant information required to assess it.
Overlooked or underestimated costs
Within any project there is a natural tendency to minimise costs because of the optimistic nature and enthusiasm about its objectives. Here follows a tentative list of costs that are often overlooked or underestimated, and will be carefully investigated:
Integration costs (part of R&D): costs of making different applications work together;
Validation and trials (part of R&D);
Transition costs (part of implementation and operating costs): costs of making two systems (old and new) working in parallel for a transition period;
Certification costs;
Simulation equipment upgrades (aircraft operators, ATSP);
Diverse overhead costs;
Contingency costs;
Consistency

Cost Benefit Analysis Methodology Issue: 1.0
Date:12/07/2011
TITAN: Turnaround Integration in Trajectory And Network Page 34 of 41
Consistency across projects/alternatives is very important when performing different CBAs. The same CBA guidelines should be applied to all competing projects. This includes using the same cost and benefit data where applicable and following the same guidelines for expert judgement.
Cash Flows
Too often monetary flows are estimated using different accounting standards. It is usually best practice to use cash flows in constant currency (inflation excluded), discounting them using a constant price discount rate. Of course, TITAN will use constant price (unadjusted for inflation) cash flows. Whatever the choice is, it has to be consistent all along the process, for all monetary streams considered, in every country considered, and at any point in time.
Missing dependencies between variables
Sometimes uncertain variables exhibit a strong degree of correlation. This may be due to a true dependency between them distorted by sampling noise or insufficient data. Relationships of dependency should be modelled as deterministic whenever possible, and only occasionally (if deterministic methods are unavailable or too complex) as correlated variables.

Cost Benefit Analysis Methodology Issue: 1.0
Date:12/07/2011
TITAN: Turnaround Integration in Trajectory And Network Page 35 of 41
ANNEX A. DIALOGUE WITH STAKEHOLDERS: WORKSHOPS AND INTERVIEWS
Dialogue Process
Dialogue with stakeholders is key events critical for the success of the project. This dialogue may be materialized by face to face meetings, workshops, etc. The dialogue is intended for working the foundations of the CBA study, namely:
1. Details on Reference and Baseline scenarios
2. Identification and Assessment of Costs & Benefits
3. Expert Judgement
The areas previously mentioned are open to debate. Experience and good practices suggest physical meetings to achieve complete understanding and consensus.
Additional workshops will be scheduled if deemed necessary. Workshops will be held at stakeholders’ premises whenever possible.
The following picture shows the dialogue process based on good practices. The idea here is to establish a coordinated approach to the CBA from the beginning to the end of the decision making process with all the parties involved.
Figure 7: Dialogue Process with Stakeholders
Expert Judgement
Whenever possible the assessment of costs and benefits will rely on quantitative data analyses using existing data and/or tools such as simulation models. Expert judgement on benefits and costs will be used when these data are not available or to fill gaps in knowledge. Expert Judgement is often the main source for Costs and Benefits estimations. To improve expert judgement accuracy (especially in estimating quantitative values) a structured method that combines and challenges various judgements should be used not only for the economic but also for the related performance assessments (safety, capacity and environment). The method should meet the following requirements:
enable consensus;
provide credible results;
Modeling andAnalysis
Presentationof Results
(Follow Up)
CBA Team
Stakeholders, Decision Makers
Decision
DefinitionsAssumptionsAlternatives
IdentificationEstimation
Experts to Provide Information Needed During The Activity
Modeling andAnalysis
Presentationof Results
(Follow Up)
CBA Team
Stakeholders, Decision Makers
Decision
DefinitionsAssumptionsAlternatives
IdentificationEstimation
Experts to Provide Information Needed During The Activity

Cost Benefit Analysis Methodology Issue: 1.0
Date:12/07/2011
TITAN: Turnaround Integration in Trajectory And Network Page 36 of 41
provide consistent and non-biased results.
Several approaches can be considered:
Facilitated and structured workshops with all relevant experts to gather their opinions;
Delphi technique: a structured group technique where one controls the exchange of information between anonymous panellists over a number of rounds or iterations of self-administered questionnaires. After each round, the facilitator analyses and statistically summarises the responses and these summaries are then presented to the panellists for further consideration. In the final round an aggregated statistic (median, average etc) is taken as the group estimate;
Nominal Group Technique (NGT) also known as estimate-talk-estimate procedure is an alternative to brainstorming. This technique differs from Delphi in that feedback after each iteration is done through verbal interaction between the panellists.
The Delphi technique has the positive attributes of interacting groups such as knowledge from a variety of sources and creative synthesis without negative aspects such as conflicts and manipulation of groups. It also has the advantages of not requiring that people based in different geographical locations meet, and of providing a means of communication for experts with diverse backgrounds and frames of reference who would find it difficult to communicate in a traditional group setting.
However, to obtain significant results with the Delphi technique it is recommended that a reasonable number of panellists are gathered and that these panellists are independent. This may be difficult to ensure for some projects. The resources required to develop, test, analyse results, re-develop questionnaires and re-assess results for several rounds are also significant. Another difficulty might be to find a wide enough range of panellists who are available to fill in questionnaires in several rounds.
Considering the above remarks a more abbreviated approach than the Delphi technique can be used for strategic performance assessments:
1. First iteration: interview or ask panel experts to fill a pre-prepared questionnaire;
2. Summary of results of first iteration is discussed at workshops with all participating experts;
3. Second iteration: experts are asked to review their initial responses and final results are determined.
An approach such as the one above requires:
1. Identification of possible experts in the different groups (stakeholder organisations, EEC and manufacturing industry). The overall knowledge and experience of the panel must cover the whole range of an ATM system and all the performance areas;
2. Preparation of the questionnaires. The questionnaires should include questions for experts to assess their own knowledge of the subject and the number of questions should be as small as possible;
3. Preparation of documentation to assist experts in answering the questionnaires;
4. Both questionnaires and documentation should be tested on individuals who are not part of the panel.

Cost Benefit Analysis Methodology Issue: 1.0
Date:12/07/2011
TITAN: Turnaround Integration in Trajectory And Network Page 37 of 41
ANNEX B. IDENTIFICATION OF DATA SOURCES
Data sources need be identified within the CBA process (particularly when it comes to expert judgement and ad-hoc industry data) as an integral part of the identification and assessment of costs and benefits. There are various potential sources of data that should be investigated. Here follows a preliminary list:
Expert judgement. This is probably the quickest and least expensive. It is most valid if accompanied by the basis upon which the opinion was made and the likely accuracy;
Raw data. Typically this comes from past projects and/or previous phases of the current project. They will vary in the level of detail they can offer depending on how directly related they are to the information sought;
Models. These can be expensive and take time, although any assumptions that are made can be tailored to the assessment required;
Research. At times this is widely available and already complete, either form simulation or technical studies. However, the assumptions made for the research may be incompatible or the results require further processing;
Prototyping. The results of trials of proposed systems may offer valuable data;
Databases. These will vary in usefulness depending on how amenable the framework is to interpretation. Since they are already established they should be inexpensive and quick to use.
Whenever possible, use of Standard Inputs should be made in order to maintain coherence with other ATM projects.
In order to apply a homogeneous and consistent CBA methodology, it is essential to establish a data base which contains data that facilitate the conduct of any future economic appraisal while guaranteeing the application of uniform measures to the quantification of costs and benefits.
The database should include:
Historical and projected costs;
Traffic forecast;
System performance constraints and requirements;
Performance data of prototype systems.
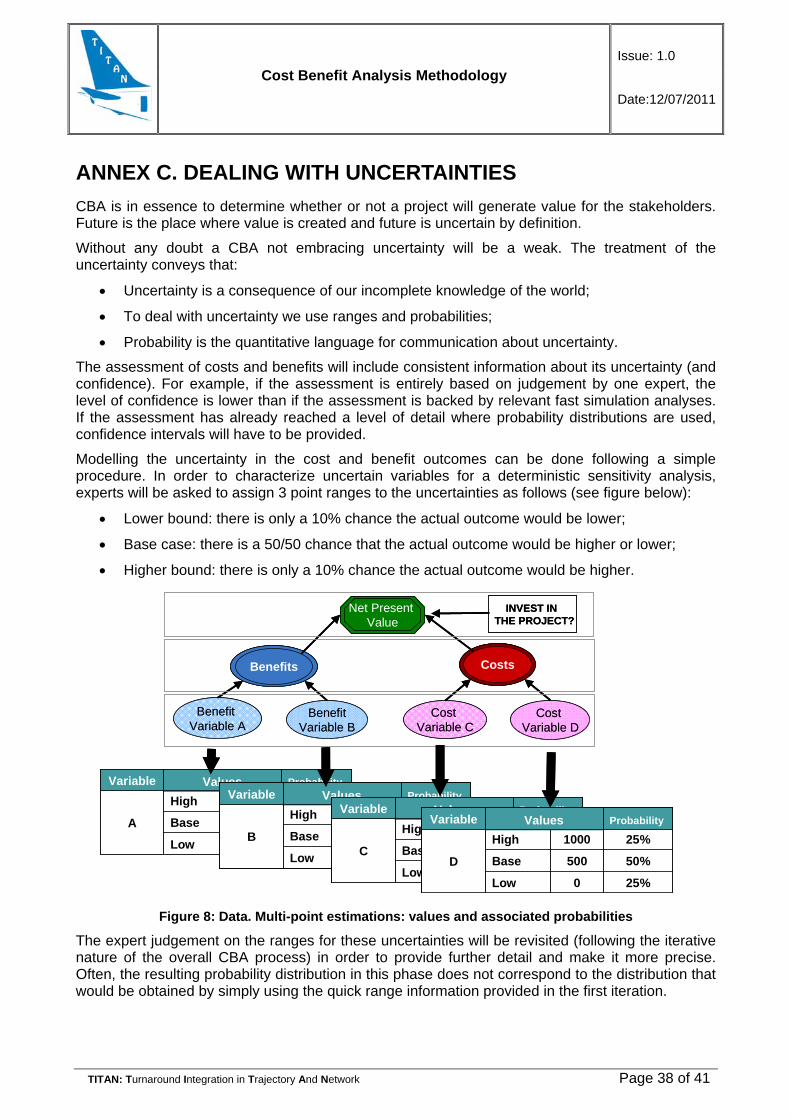
Cost Benefit Analysis Methodology Issue: 1.0
Date:12/07/2011
TITAN: Turnaround Integration in Trajectory And Network Page 38 of 41
ANNEX C. DEALING WITH UNCERTAINTIES
CBA is in essence to determine whether or not a project will generate value for the stakeholders. Future is the place where value is created and future is uncertain by definition.
Without any doubt a CBA not embracing uncertainty will be a weak. The treatment of the uncertainty conveys that:
Uncertainty is a consequence of our incomplete knowledge of the world;
To deal with uncertainty we use ranges and probabilities;
Probability is the quantitative language for communication about uncertainty.
The assessment of costs and benefits will include consistent information about its uncertainty (and confidence). For example, if the assessment is entirely based on judgement by one expert, the level of confidence is lower than if the assessment is backed by relevant fast simulation analyses. If the assessment has already reached a level of detail where probability distributions are used, confidence intervals will have to be provided.
Modelling the uncertainty in the cost and benefit outcomes can be done following a simple procedure. In order to characterize uncertain variables for a deterministic sensitivity analysis, experts will be asked to assign 3 point ranges to the uncertainties as follows (see figure below):
Lower bound: there is only a 10% chance the actual outcome would be lower;
Base case: there is a 50/50 chance that the actual outcome would be higher or lower;
Higher bound: there is only a 10% chance the actual outcome would be higher.
Figure 8: Data. Multi-point estimations: values and associated probabilities
The expert judgement on the ranges for these uncertainties will be revisited (following the iterative nature of the overall CBA process) in order to provide further detail and make it more precise. Often, the resulting probability distribution in this phase does not correspond to the distribution that would be obtained by simply using the quick range information provided in the first iteration.
25%800Low
50%1000Base
25%1500High
A
ProbabilityValuesVariable
Benefit Variable A
Benefits
Net Present Value
Costs
Cost Variable C
Benefit Variable B
Cost Variable D
INVEST IN THE PROJECT?
25%80Low
50%100Base
25%120High
B
ProbabilityValuesVariable
25%40Low
50%50Base
25%60High
C
ProbabilityValuesVariable
25%0Low
50%500Base
25%1000High
D
ProbabilityValuesVariable
25%800Low
50%1000Base
25%1500High
A
ProbabilityValuesVariable
25%800Low
50%1000Base
25%1500High
A
ProbabilityValuesVariable
Benefit Variable A
BenefitsBenefits
Net Present Value
Net Present Value
CostsCosts
Cost Variable C
Benefit Variable B
Cost Variable D
INVEST IN THE PROJECT?
25%80Low
50%100Base
25%120High
B
ProbabilityValuesVariable
25%80Low
50%100Base
25%120High
B
ProbabilityValuesVariable
25%40Low
50%50Base
25%60High
C
ProbabilityValuesVariable
25%40Low
50%50Base
25%60High
C
ProbabilityValuesVariable
25%0Low
50%500Base
25%1000High
D
ProbabilityValuesVariable
25%0Low
50%500Base
25%1000High
D
ProbabilityValuesVariable

Cost Benefit Analysis Methodology Issue: 1.0
Date:12/07/2011
TITAN: Turnaround Integration in Trajectory And Network Page 39 of 41
ANNEX D. GLOSSARY AND DEFINITIONS
Air Navigation Services: This term includes air traffic management (ATM); communication, navigation and surveillance (CNS) services; meteorological services for air navigation (MET); search and rescue (SAR) and aeronautical information services (AIS). These services are provided to air traffic during all phases of operations (approach, ATC and en route) (ICAO Doc 9161/3).
ANS Charges: The sum of En-Route Charges and Landing Charges (including lighting and terminal navigation charges but excluding passenger charges, cargo charges, parking and hangar charges, security charges, noise charges, and other charges on air traffic operations). These charges cover all Air Navigation Services as defined above.
Air Traffic Flow and Capacity Management (ATFCM): A service consisting of tactical and strategic planning activities with the objective of ensuring an optimum flow of air traffic to or through areas during times when demand exceeds or is expected to exceed the available capacity of the air traffic control system (ICAO Doc 9161/3).
Air Traffic Management (ATM): A systems approach with the objective of enabling aircraft operators to meet their planned times of departure and arrival and adhere to their preferred flight profiles with minimum constraints, without compromising agreed levels of safety. It comprises ground elements and airborne elements which, when functionally integrated, form a total ATM system. The airborne part consists of the elements necessary to allow functional integration with the ground part. The ground part comprises air traffic services (ATS), air traffic flow management (ATFM) and airspace management, where ATS is the primary component (ICAO 9161/3).
Benefit-Cost Ratio: The ratio of the discounted benefits to the discounted costs. An acceptable project would have a B/C equal to or greater than 1.
Capital Cost Implementation: Investment costs associated with the initial acquisition of equipment and property, for the Operational Improvement Cluster (OI C) implementation. Capital cost implementation distinguishes from Pre-implementation Costs, Replacement Costs, Operating Costs, and One-Off Implementation Costs.
Cost of Capital: The required return necessary to make a capital budgeting project - such as building a new factory - worthwhile. Cost of capital would include the cost of debt and the cost of equity. The cost of capital determines how a company can raise money (through a stock issue, borrowing, or a mix of the two). This is the rate of return that a firm would receive if it invested its money someplace else with similar risk.
Delay: the difference between a Scheduled Time of a flight event and the Actual Time of that event (CODA definition). This difference is generally expressed in minutes. A delay can be measured on all phases of flight.
Depreciation: In accounting, an expense recorded to allocate a tangible asset's cost over its useful life. It is a non-cash expense.
Differential Costs: those costs are incremental to the baseline case (the reference scenario) which is not to implement the project.
Discount Rate: An economic measure of the pure time value of money. It should not be confused with the rate of inflation. Although the discount rate can vary from commercial to governmental organisations and from an organisation to another, by convention it has been fixed at 8% (for constant price cash flows) in order to make comparable all the CBA and to have a consistent portfolio of Operational Improvement Clusters. Nevertheless, the models will allow the users to make their calculations with their own rate. In practice a rate can be derived from indicators such

Cost Benefit Analysis Methodology Issue: 1.0
Date:12/07/2011
TITAN: Turnaround Integration in Trajectory And Network Page 40 of 41
as the net total return on a panel of shares or the net return on capital employed for a panel of companies.
Expected Net Present Value: The weighted average, using probabilities, of possible NPV.
Financial Costs: the benefits and costs are discounted (see NPV definition and method) without taking into account how the cash flows are funded (where the money is coming from). This is done in order to separate the decision to invest of the decision of how to fund the project.
Flight Path Efficiency: The degree to which an individual flight travels the preferred flight path.
Full Operating Capability: The time at which an Operational Improvement Cluster is fully operating, with infrastructure and equipage 100% complete, yielding steady state benefit.
Ground Costs: Costs associated to a ground system, e.g. new ground simulator, ground simulator upgrade.
Inflation: The rate at which the general level of prices for goods and services is rising, and, subsequently, purchasing power is falling.
Influence Diagram: A graphical representation that shows all the variables that impact the net present value of a project.
Internal Rate of Return (IRR): The IRR is the discount rate that equates the present value of the project’s future net cash flows with the project’s initial outlay. The IRR can be compared with the rates that could be earned by investing the money in other projects to identify the projects that provide the best value for money.
Landing charges (including lighting and terminal navigation charges): This includes charges and fees collected for the use of runways, taxiways and apron areas, including associated lighting, as well as for the provision of approach and ATC. (ICAO Doc 9562). These charges cover all the Air Navigation Services for the airport phase of operations: any or all phases of aircraft operation involving approach, landing, take-off and/or departure (ICAO Doc 9161/3).
Net Present Value (NPV): The difference between the present value of the cash inflows (additional or incremental costs of a new investment) and the present value of the cash outflows (benefits accruing from the new investment and originating from new revenue opportunities and/or cost savings). The NPV gives the magnitude of a project value.
CBA is much more than discounting cash flows, however the figure of merit we will use in the TITAN Tool CBA is the sum of the discounted cash flows generated by the implementation and operation of the TITAN tool. This figure is the Net Present Value. Cash flows include cash inflows and cash outflows. The NPV is computed as follows:
NPV = CFi / (1 + r )i
Where:
CFi represents the net cash flow generated in year i. It is computed by subtracting the outflows (costs) in year i from the inflows (benefits) in year i. The outflows may include investment, transition and operating costs;
i represents a year in the life cycle and runs from year 0, the year the initial investment is made, to year n, the final year of the applications cluster life cycle;
r represents the annual discount rate used.
One-off Implementation Costs: Costs represented by one-off services, one-off operating start-up costs, and other one-off expenditure for the Operational Improvement Cluster (OI C) implementation. They distinguish from Equipage Costs, Ground Costs, and Space costs.

Cost Benefit Analysis Methodology Issue: 1.0
Date:12/07/2011
TITAN: Turnaround Integration in Trajectory And Network Page 41 of 41
Operating Costs: Expenditure associated to the operating phase of the Operational Improvement Cluster (OI C), comprising staff (operating and support staff, internal or external, civil or military); operations (maintenance and repair, material, supplies, utilities and other services); and overhead (administration, personnel, training).
Operational Environment: An environment in the ATM system such as Ground, TMA and En-route.
Operational Improvement: A single operational change that improves the performance of the ATM system in terms of capacity, safety, environment, or cost.
Opportunity Cost: The cost of an alternative that must be forgone in order to pursue a certain action. Put another way, the benefits you could have received by taking an alternative action.
Net Revenue/Net Saving: This is the total revenue or total saving diminished with associated costs, direct or indirect. E.g. the social costs should be deduced from the benefit of staff force reduction or savings.
Payback Period: The amount of time that it will take for the cash inflows of a project to cover the cash outflows.
Pre-implementation Costs: Expenditure directly or indirectly associated to an Operational Improvement Cluster (OI C) before the implementation phase of the life cycle. These costs distinguish from Capital Implementation, Capital Replacement, One-off Implementation or Operating Costs. They are e.g.: Research, Development, and Overhead costs.
Present value: The equivalent value of some amount of resources after adjustment for time preference by discounting.
Punctuality: The CODA definition of punctuality is; a flight event is punctual if the difference between the Scheduled Time of a flight event and the Actual Time of that event is within an agreed threshold. A generally agreed time frame is 15 minutes, but this time window can be narrowed or enlarged.
Sensitivity Analysis: An analysis of what would happen to the results of a calculation if one of its input parameters were changed while the others remained the same. A practical way to represent a sensitivity analysis is the tornado diagram.
Staff Costs: These costs generally cover two types of costs: operational staff and support staff.
Structural Delay and Structural Delay Savings: Structural delay is delay that is predictable to allow for inclusion in flight schedules and repetitive. Savings in structural delay may bring cost savings for airlines (more efficient operation of their network) but also GA and Military (shorter flight times).
Sunk Costs: Costs already spent or committed before the decision is taken. These costs do not depend on the decision and should not be counted in a CBA that aims to guide the decision. In other words, are irrelevant for a decision on whether to fund or to continue with a project or not.
Tornado Diagram: A diagram that shows the relative impact of the uncertainties in a decision model to the objective of interest, usually net present value. The objective of the tornado diagram is to focus discussion and effort on the critical uncertainties in the decision problem.
Transition Costs: Transition costs occur when it is necessary to maintain parts of the current system during the transition period to a new system. These costs are frequently overlooked in CBA, but should be included in the One-off Implementation Costs.