Embed Size (px)
Citation preview
Titan Company Limited Delivering value by creating brands Earnings Presentation – Q3 FY ’19 and 9 Months FY’19 (For quarter and 9 months ended 31tstDecember, 2018) 01st February, 2019
1
Disclaimer
This document, which has been prepared by Titan Company Limited (the “Company”/”we”/”our”), are solely for information purpose and do not constitute any offer, invitation, recommendation, invitation to purchase or subscribe for any of the securities, and shall not form the basis of or be relied on in connection with any contract or binding commitment whatsoever.
Certain statements are included in this release which contain words or phrases such as “will,” “aim,” “will likely result,” “believe,” “expect,” “will continue,” “anticipate,” “estimate,” “intend,” “plan,” “contemplate,” “seek to,” “future,” “objective,” “goal,” “project,” “should,” “will pursue” and similar expressions or variations of these expressions that are “forward-looking statements”. Actual results may differ materially from those suggested by the forward-looking statements due to certain risks or uncertainties associated with our expectations with respect to, but not limited to, our ability to implement our strategy successfully, the market acceptance of and demand for our products, our growth and expansion, the adequacy of our allowance for credit to franchisees, dealers and distributors, technological changes, volatility in income, cash flow projections and our exposure to market and operational risks. By their nature, certain of the market risk disclosures are only estimates and could be materially different from what may actually occur in the future. As a result, actual future gains, losses or impact on net income could materially differ from those that have been estimated.
In addition, other factors that could cause actual results to differ materially from those estimated by the forward-looking statements contained in this document include, but are not limited to: general economic and political conditions in India and the other countries which have an impact on our business activities; inflation, unanticipated turbulence in interest rates, foreign exchange rates, the prices of raw material including gold and diamonds, or other rates or prices; changes in Indian and foreign laws and regulations, including tax and accounting regulations; and changes in competition and the pricing environment in India. The Company may, from time to time make additional written and oral forward-looking statements, including statements contained in the Company’s filings with SEBI and the Stock Exchanges and our reports to shareholders. The Company does not undertake to update any forward-looking statements that may be made from time to time by or on behalf of the Company, to reflect events or circumstances after the date thereof.
2
Table of Contents
• Overview
– Company
– Watches
– Jewellery
– Eyewear
• Q3 Performance
• Financials : Q3 & 9 Months FY’19
• Historical Performance Trends
• Awards and Recognition
• Sustainability at Titan
3
4
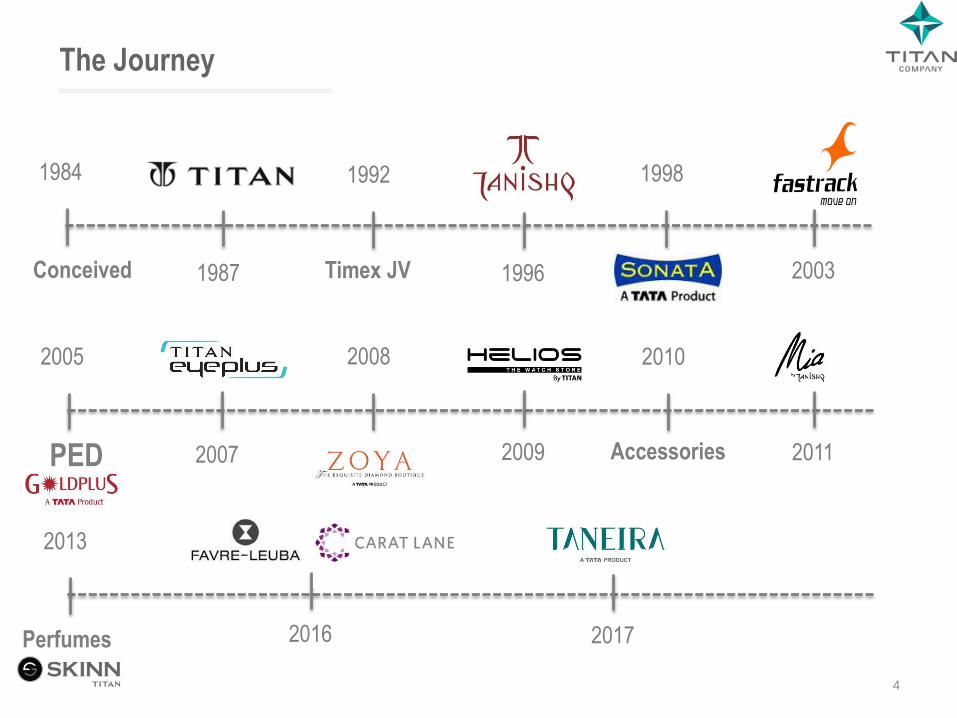
The Journey
1984
Conceived 1987
1992
Timex JV 1996
1998
2003
2005
PED 2007
2008
2009
2010
Accessories
2016
2013
Perfumes
2011
2017
5
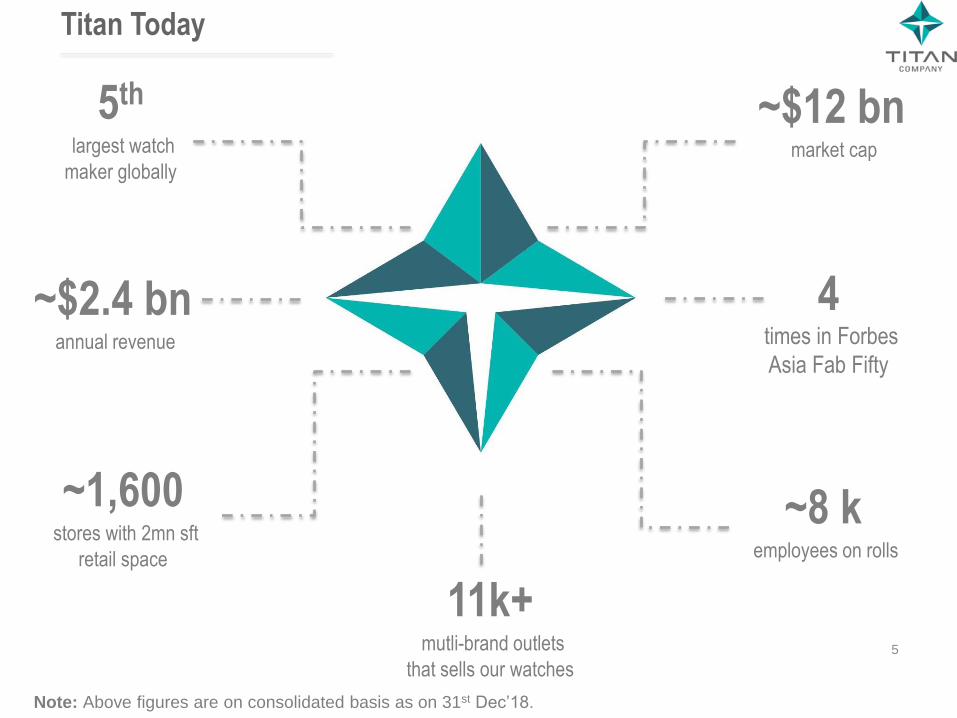
Titan Today
5th
largest watch
maker globally
~$12 bn market cap
~$2.4 bn annual revenue
11k+
mutli-brand outlets
that sells our watches
~8 k
employees on rolls
~1,600
stores with 2mn sft
retail space
4
times in Forbes
Asia Fab Fifty
Note: Above figures are on consolidated basis as on 31st Dec’18.
6
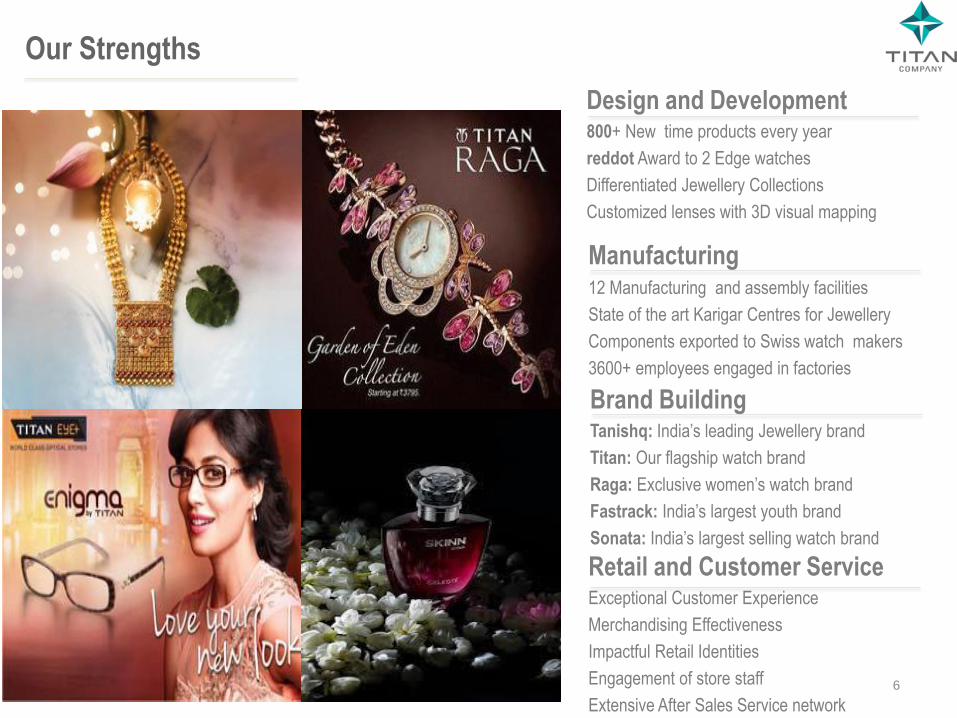
Our Strengths
Design and Development 800+ New time products every year
reddot Award to 2 Edge watches
Differentiated Jewellery Collections
Customized lenses with 3D visual mapping
Retail and Customer Service Exceptional Customer Experience
Merchandising Effectiveness
Impactful Retail Identities
Engagement of store staff
Extensive After Sales Service network
Manufacturing 12 Manufacturing and assembly facilities
State of the art Karigar Centres for Jewellery
Components exported to Swiss watch makers
3600+ employees engaged in factories
Brand Building Tanishq: India’s leading Jewellery brand
Titan: Our flagship watch brand
Raga: Exclusive women’s watch brand
Fastrack: India’s largest youth brand
Sonata: India’s largest selling watch brand
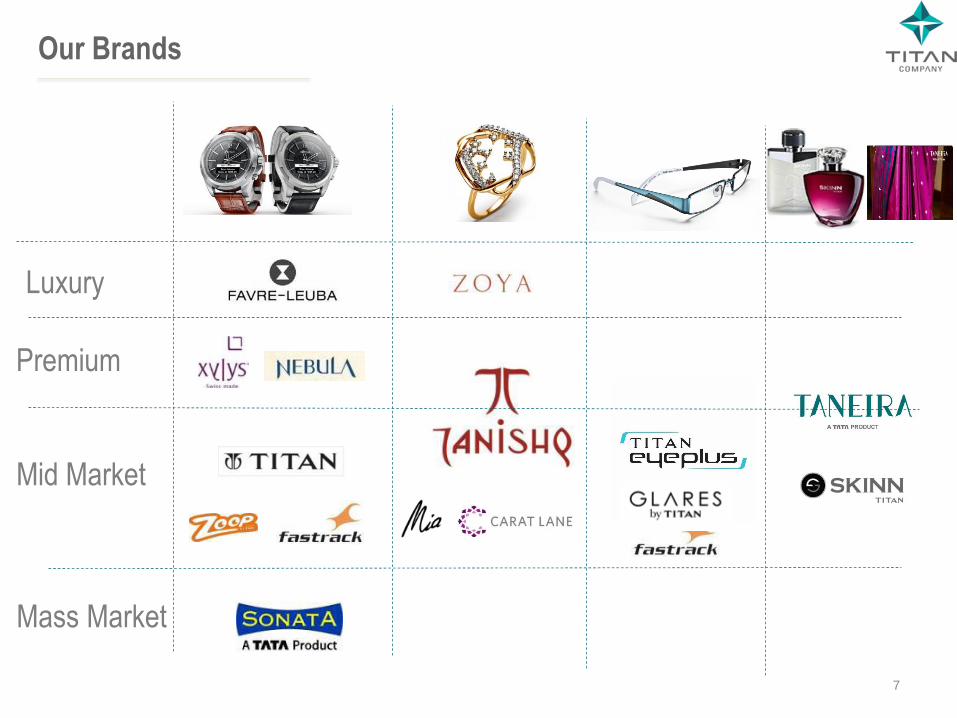
Our Brands
Luxury
Premium
Mid Market
Mass Market
7
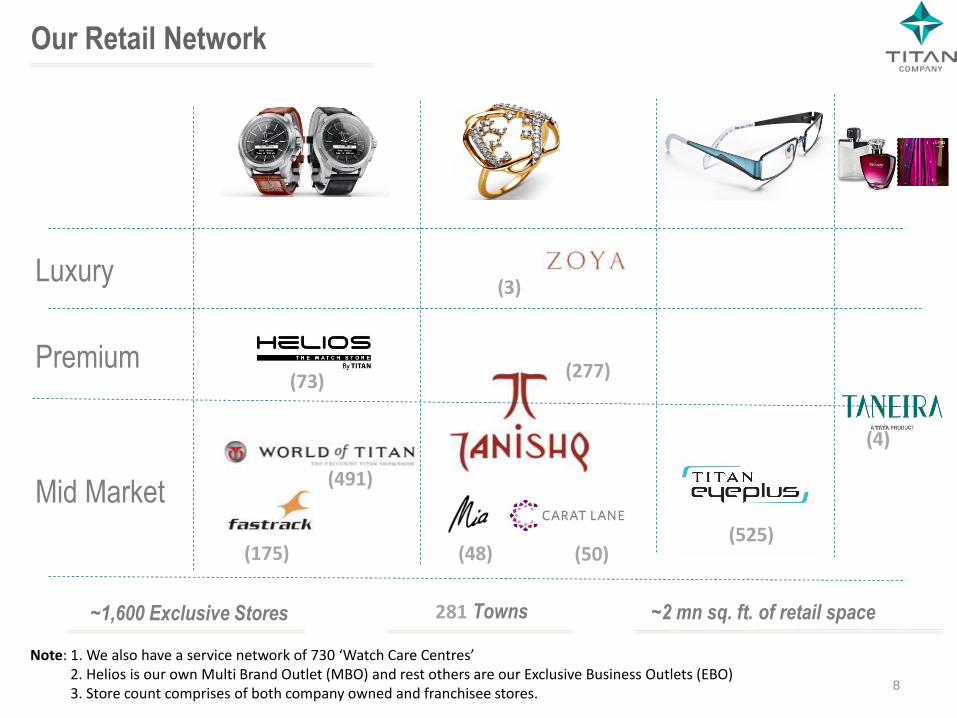
Our Retail Network
Luxury
Premium
Mid Market (491)
(73)
(175)
~1,600 Exclusive Stores 281 Towns ~2 mn sq. ft. of retail space
Note: 1. We also have a service network of 730 ‘Watch Care Centres’ 2. Helios is our own Multi Brand Outlet (MBO) and rest others are our Exclusive Business Outlets (EBO) 3. Store count comprises of both company owned and franchisee stores.
(3)
(277)
(525)
8
(4)
(48) (50)
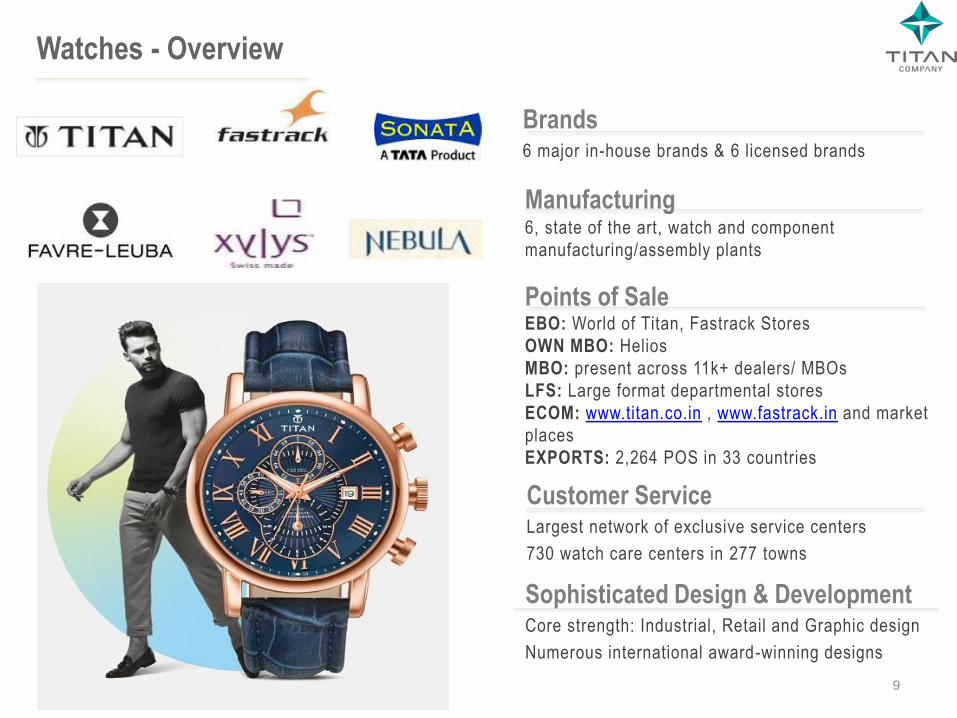
Watches - Overview
Brands 6 major in-house brands & 6 licensed brands
Customer Service Largest network of exclusive service centers
730 watch care centers in 277 towns
Manufacturing 6, state of the art, watch and component
manufacturing/assembly plants
Points of Sale EBO: World of Titan, Fastrack Stores
OWN MBO: Helios
MBO: present across 11k+ dealers/ MBOs
LFS: Large format departmental stores
ECOM: www.titan.co.in , www.fastrack.in and market
places
EXPORTS: 2,264 POS in 33 countries
Sophisticated Design & Development Core strength: Industrial, Retail and Graphic design
Numerous international award-winning designs
9
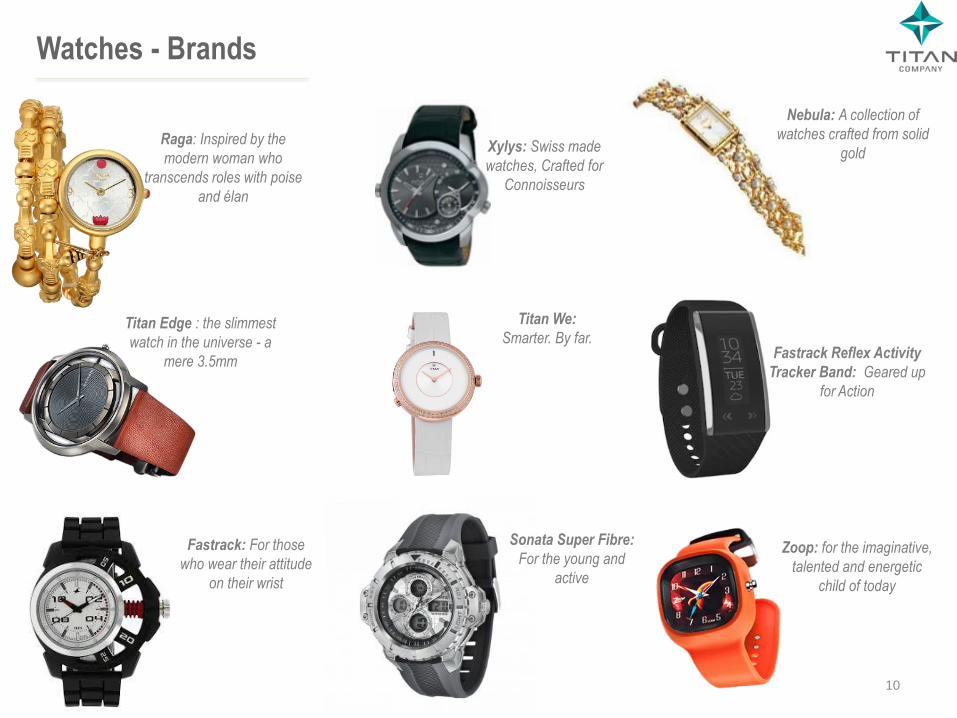
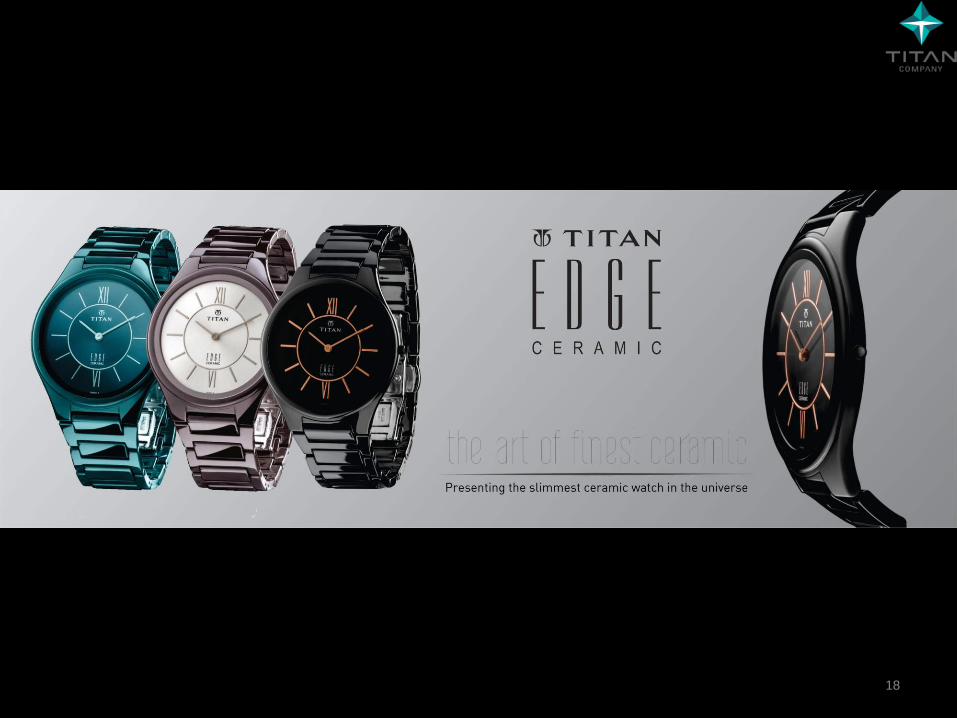
Titan Edge : the slimmest
watch in the universe - a
mere 3.5mm
Nebula: A collection of
watches crafted from solid
gold
Zoop: for the imaginative,
talented and energetic
child of today
Xylys: Swiss made
watches, Crafted for
Connoisseurs
Fastrack: For those
who wear their attitude
on their wrist
Sonata Super Fibre:
For the young and
active
Watches - Brands
Raga: Inspired by the
modern woman who
transcends roles with poise
and élan
Fastrack Reflex Activity
Tracker Band: Geared up
for Action
Titan We:
Smarter. By far.
10
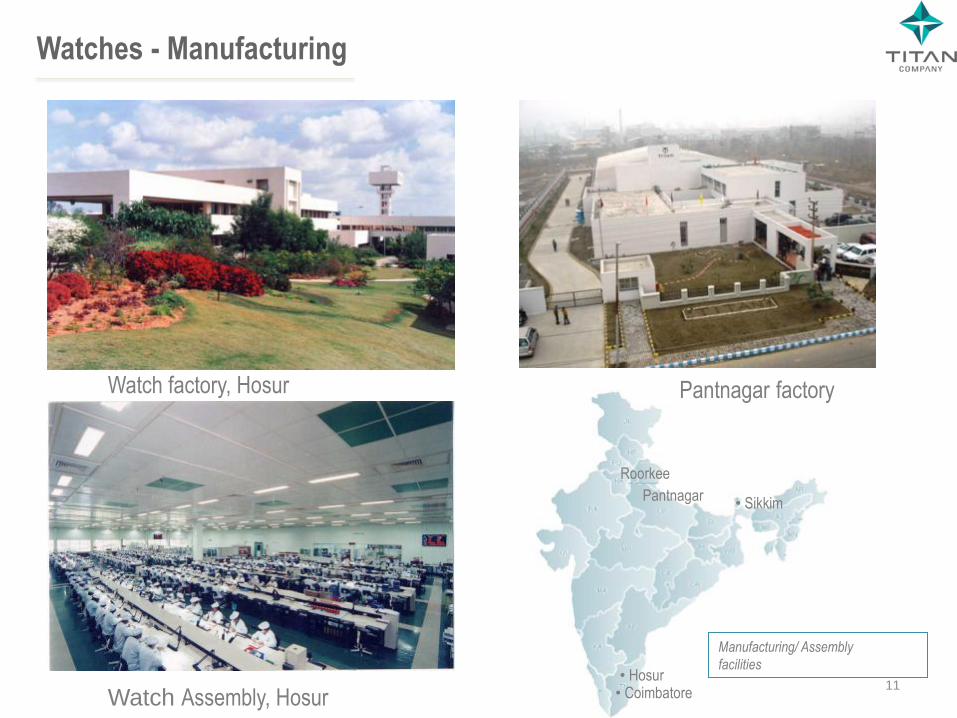
• Hosur
Pantnagar
Roorkee
Manufacturing/ Assembly
facilities
• Coimbatore
Watch factory, Hosur
Watch Assembly, Hosur
Pantnagar factory
Watches - Manufacturing
• Sikkim
11
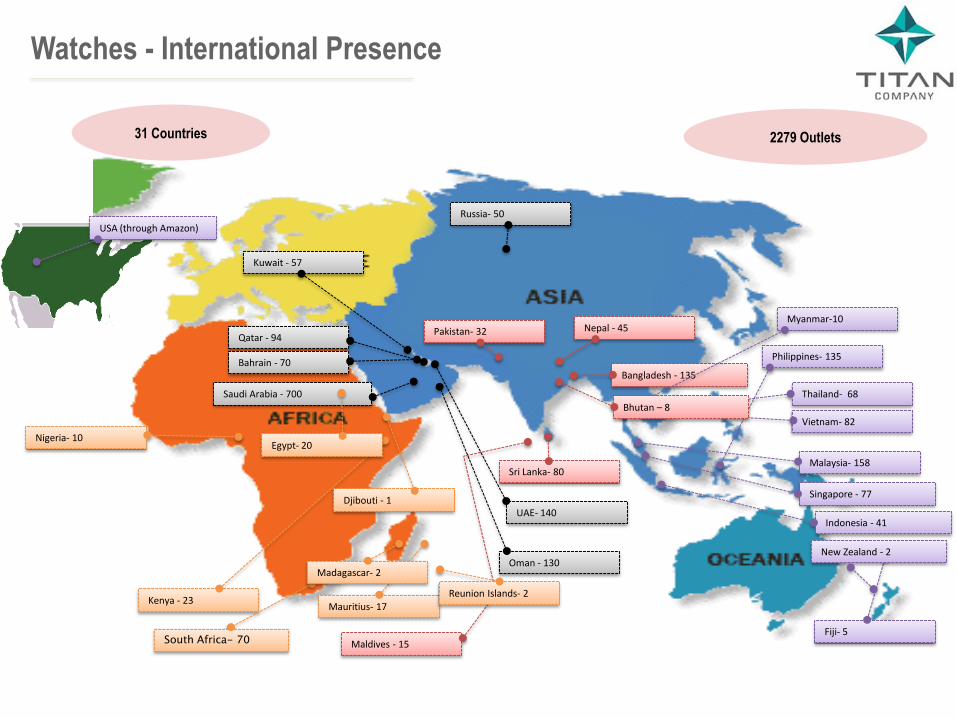
Singapore - 77
Malaysia- 158
Thailand- 68
Pakistan- 32
Sri Lanka- 80
Bangladesh - 135
Maldives - 15
Nepal - 45
Fiji- 5
Vietnam- 82
UAE- 140
Oman - 130
Saudi Arabia - 700
Qatar - 94
Bahrain - 70
Kuwait - 57
Mauritius- 17 Kenya - 23
Djibouti - 1
Nigeria- 10
Philippines- 135
South Africa- 70
Myanmar-10
Russia- 50
Indonesia - 41
2279 Outlets 31 Countries
New Zealand - 2
Bhutan – 8
Egypt- 20
USA (through Amazon)
Madagascar- 2
Reunion Islands- 2
Watches - International Presence
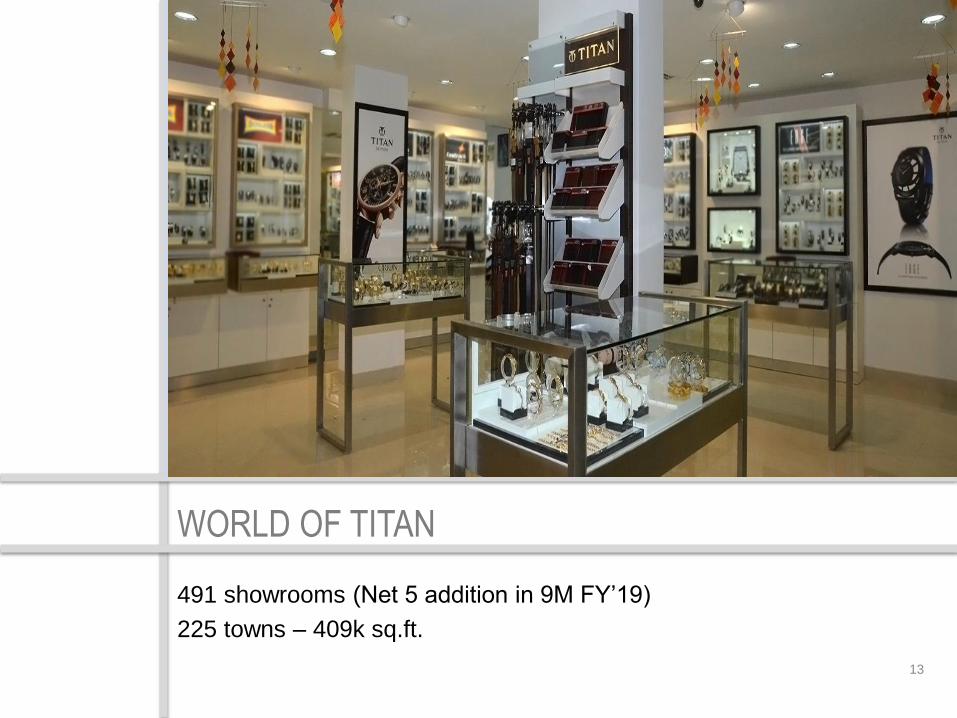
WORLD OF TITAN
491 showrooms (Net 5 addition in 9M FY’19)
225 towns – 409k sq.ft.
13
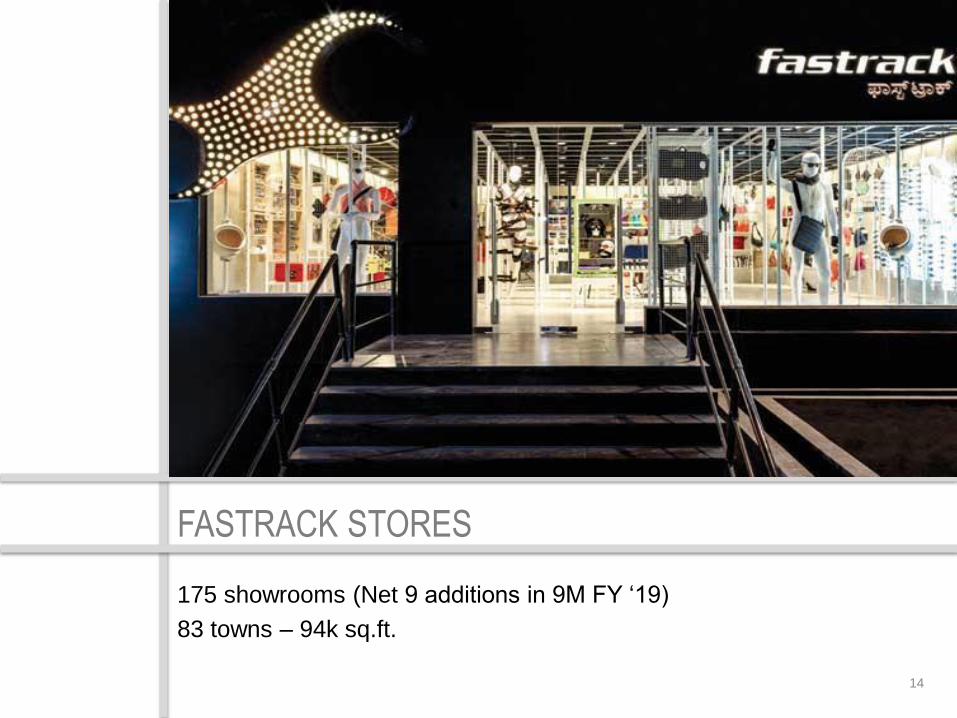
FASTRACK STORES
175 showrooms (Net 9 additions in 9M FY ‘19)
83 towns – 94k sq.ft.
14
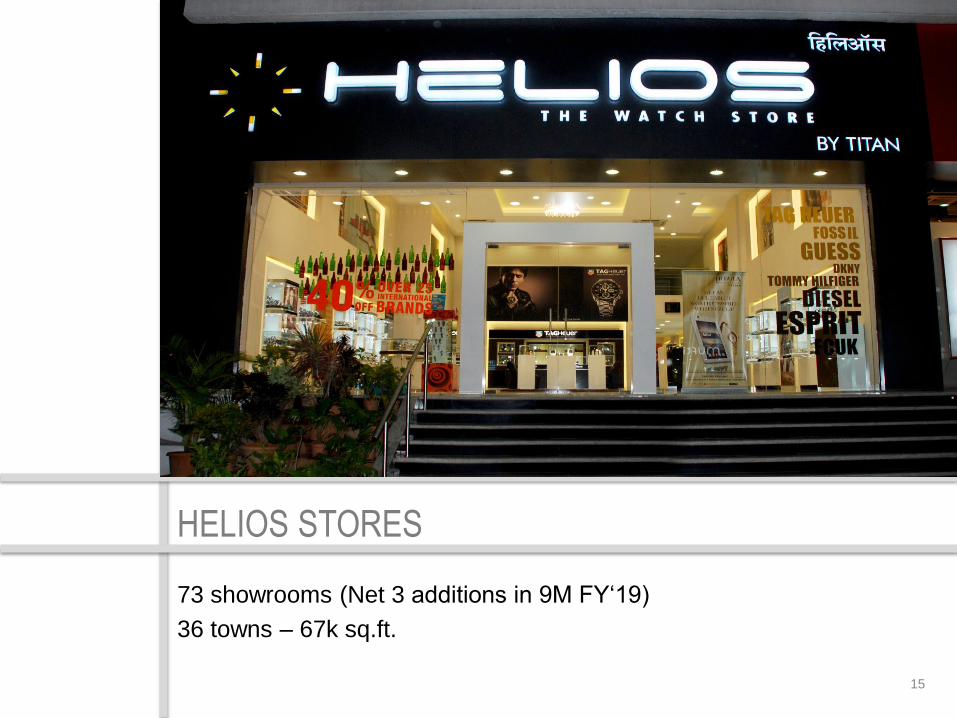
HELIOS STORES
73 showrooms (Net 3 additions in 9M FY‘19)
36 towns – 67k sq.ft.
15
16
17
18
Jewellery
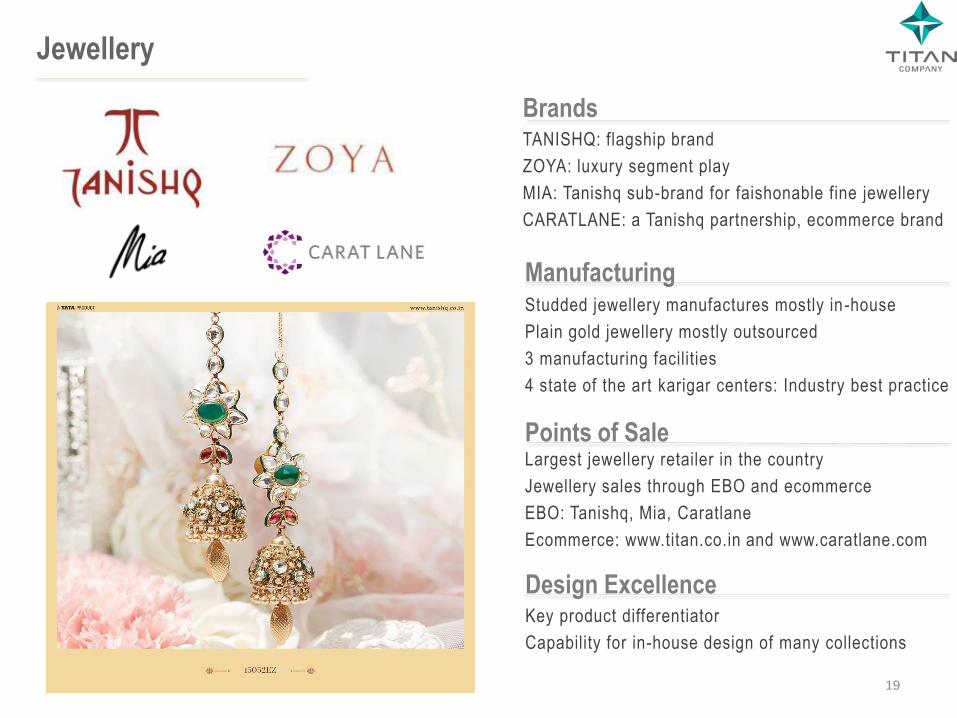
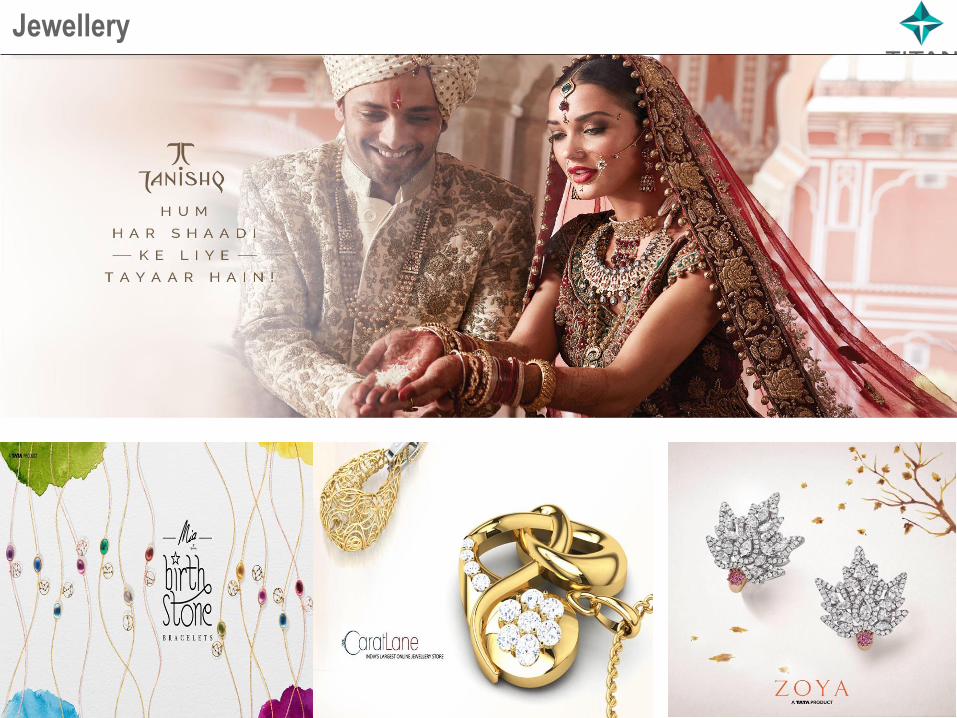
Brands TANISHQ: flagship brand
ZOYA: luxury segment play
MIA: Tanishq sub-brand for faishonable fine jewellery
CARATLANE: a Tanishq partnership, ecommerce brand
Manufacturing Studded jewellery manufactures mostly in-house
Plain gold jewellery mostly outsourced
3 manufacturing facilities
4 state of the art karigar centers: Industry best practice
Points of Sale Largest jewellery retailer in the country
Jewellery sales through EBO and ecommerce
EBO: Tanishq, Mia, Caratlane
Ecommerce: www.titan.co.in and www.caratlane.com
Design Excellence Key product differentiator
Capability for in-house design of many collections
19
20
Jewellery
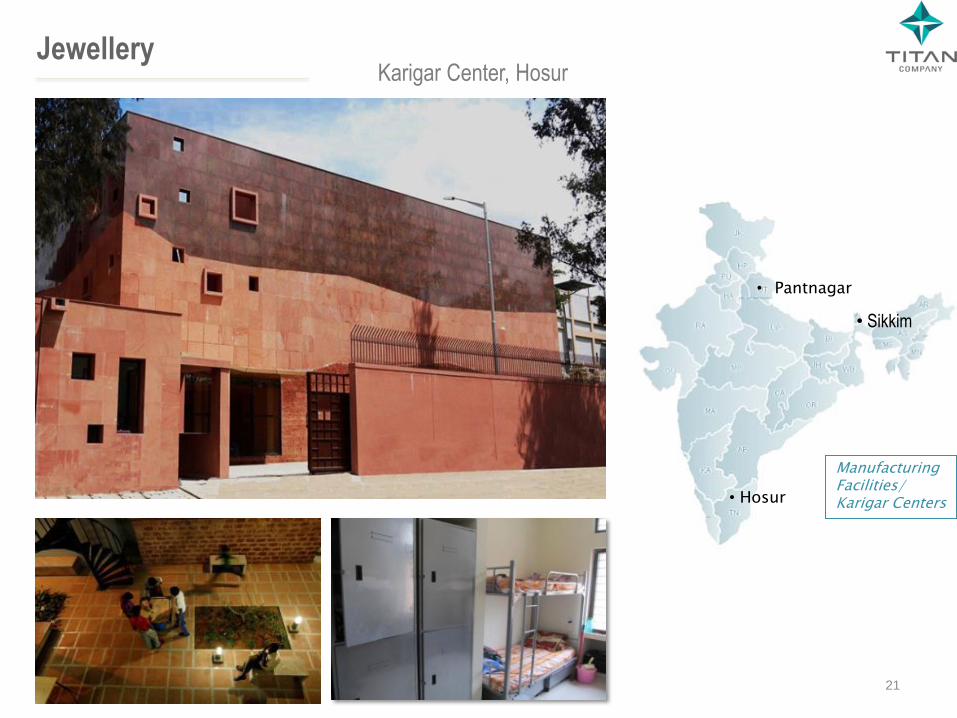
• Hosur
• Pantnagar
Manufacturing Facilities/ Karigar Centers
Karigar Center, Hosur Jewellery
• Sikkim
21
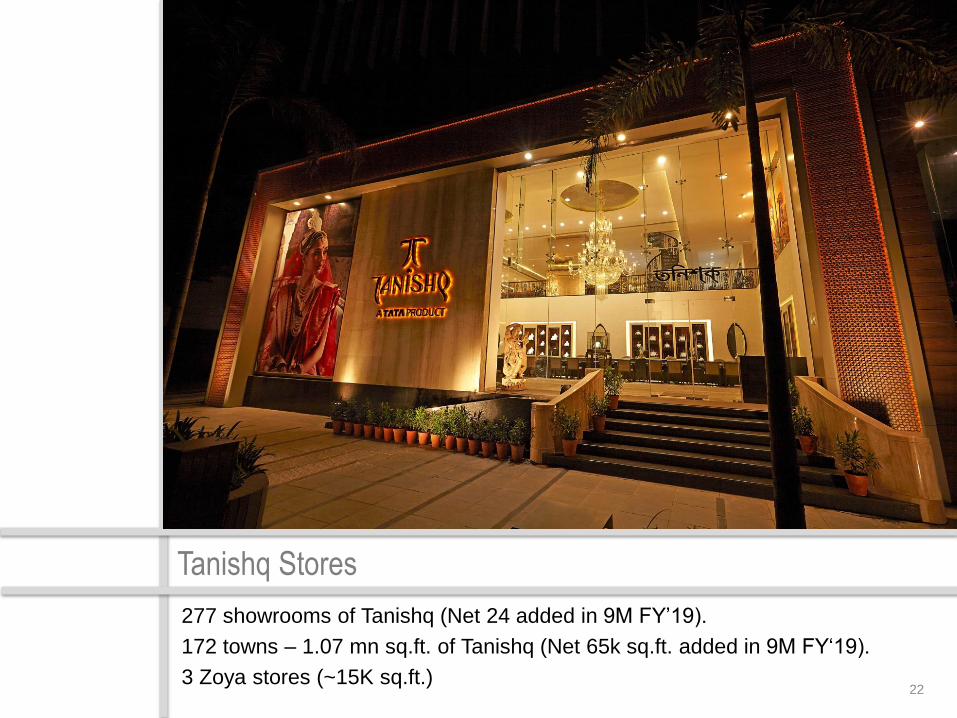
Tanishq Stores
277 showrooms of Tanishq (Net 24 added in 9M FY’19).
172 towns – 1.07 mn sq.ft. of Tanishq (Net 65k sq.ft. added in 9M FY‘19).
3 Zoya stores (~15K sq.ft.) 22
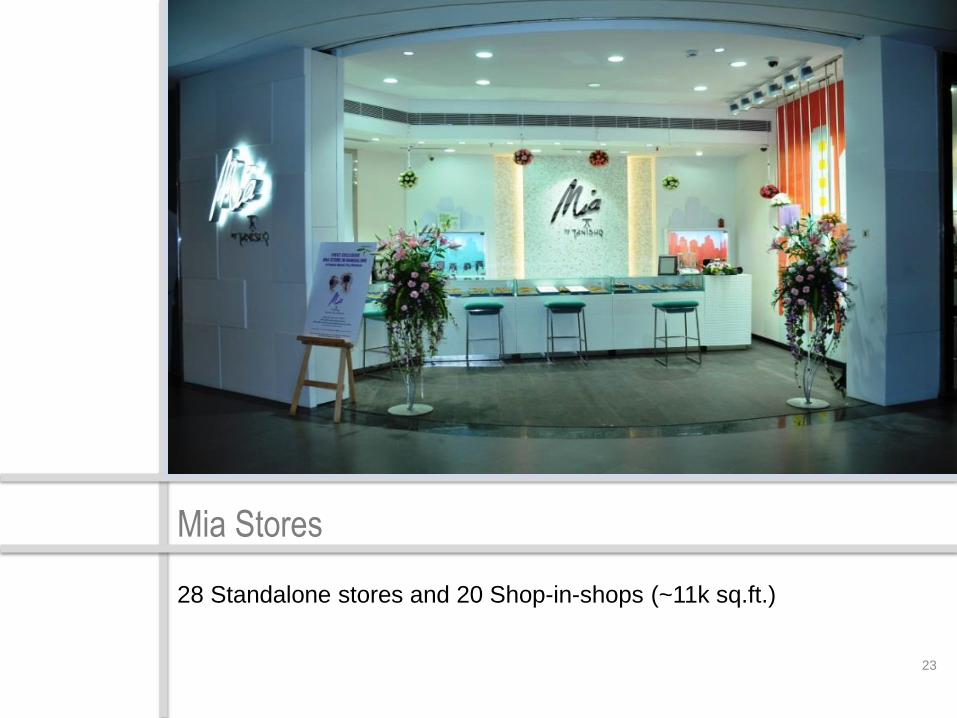
Mia Stores
28 Standalone stores and 20 Shop-in-shops (~11k sq.ft.)
23
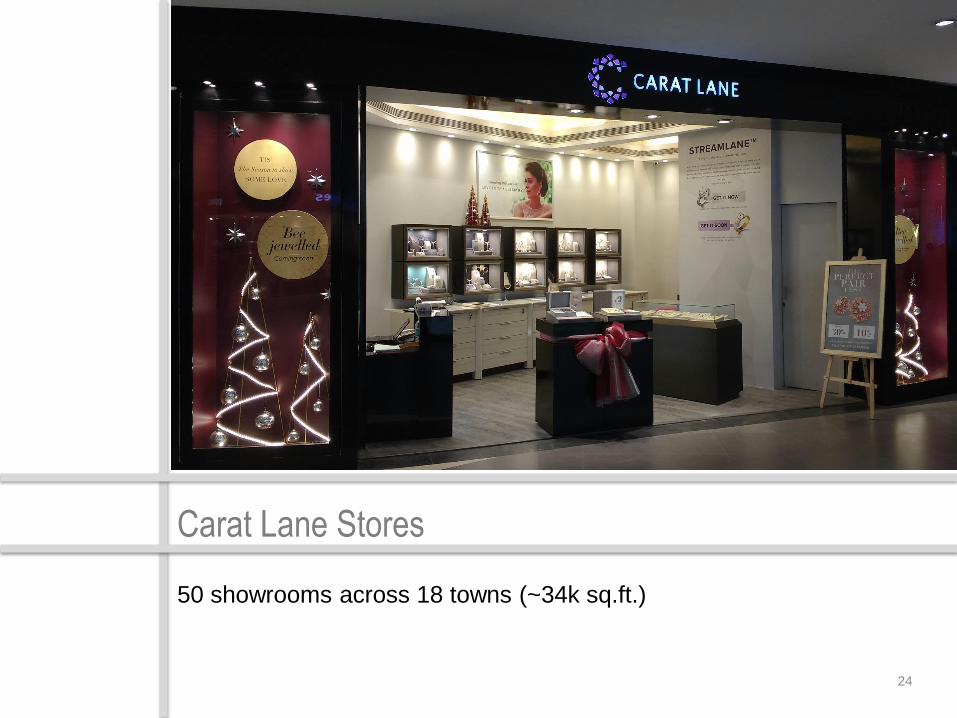
Carat Lane Stores
50 showrooms across 18 towns (~34k sq.ft.)
24
25
26
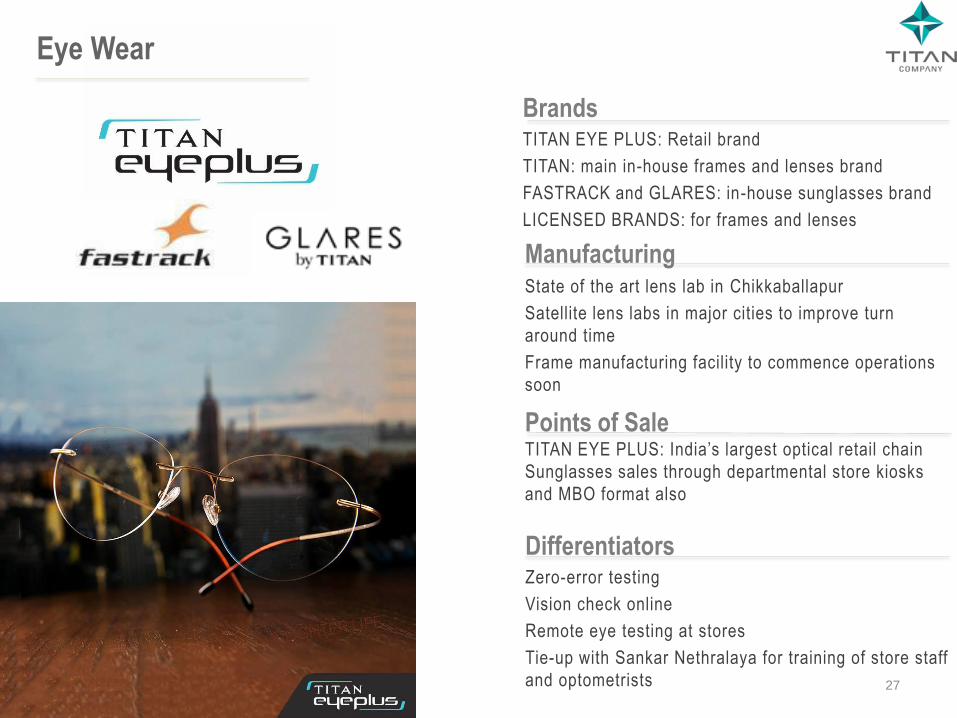
Eye Wear
Brands TITAN EYE PLUS: Retail brand
TITAN: main in-house frames and lenses brand
FASTRACK and GLARES: in-house sunglasses brand
LICENSED BRANDS: for frames and lenses
Manufacturing State of the art lens lab in Chikkaballapur
Satellite lens labs in major cities to improve turn
around time
Frame manufacturing facility to commence operations
soon
Points of Sale TITAN EYE PLUS: India’s largest optical retail chain
Sunglasses sales through departmental store kiosks
and MBO format also
Differentiators Zero-error testing
Vision check online
Remote eye testing at stores
Tie-up with Sankar Nethralaya for training of store staff
and optometrists
27
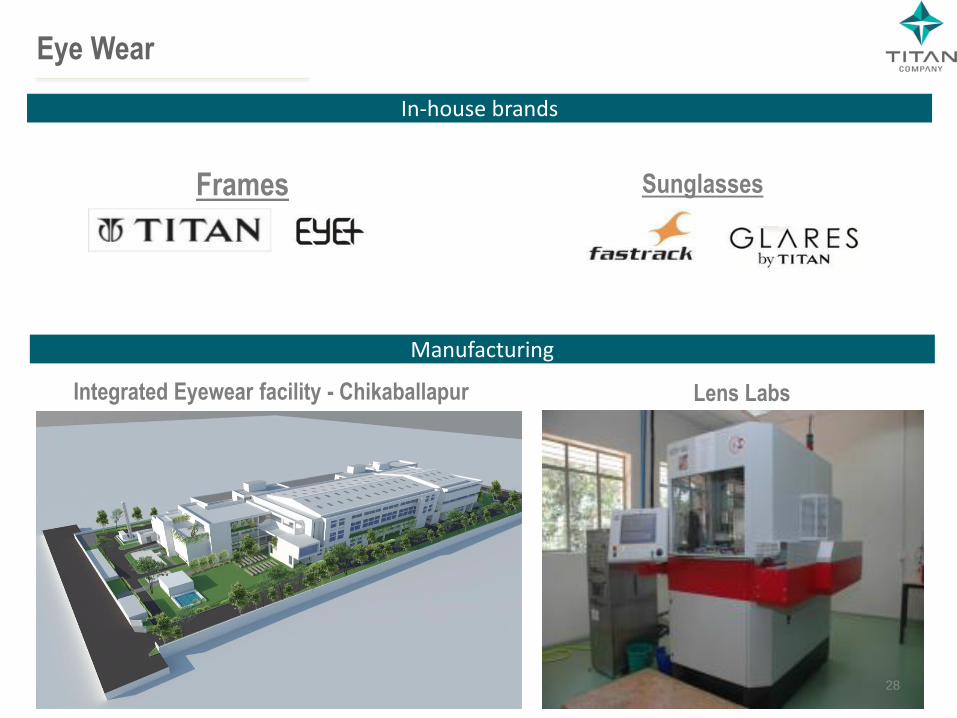
Frames
Sunglasses
Lens Labs
Eye Wear
In-house brands
Manufacturing
Integrated Eyewear facility - Chikaballapur
28
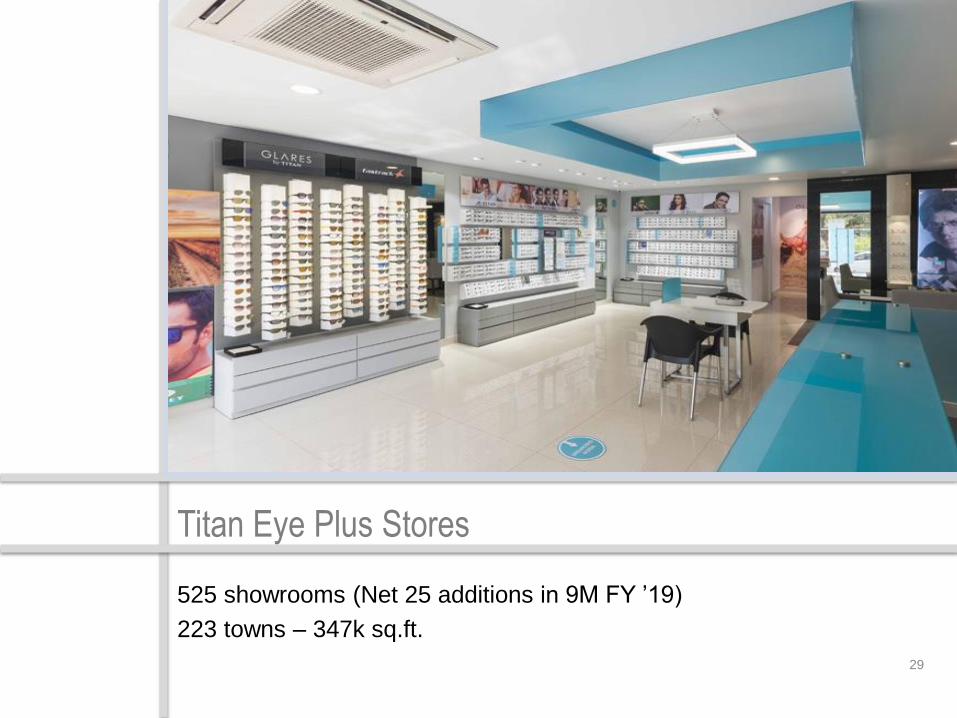
Titan Eye Plus Stores
525 showrooms (Net 25 additions in 9M FY ’19)
223 towns – 347k sq.ft.
29

30
31
Fragrance
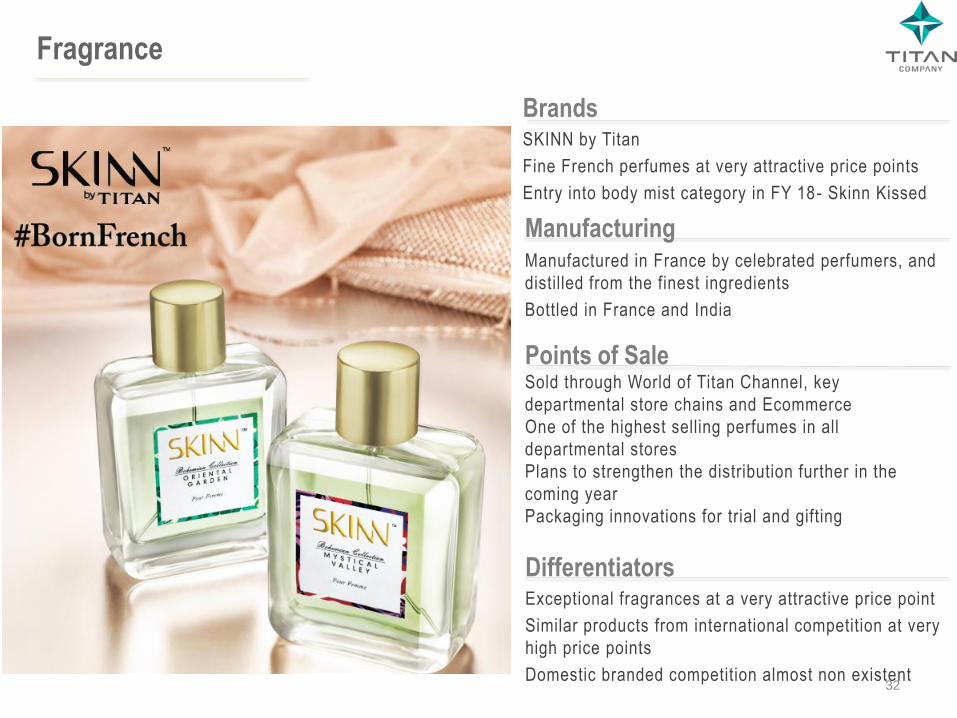
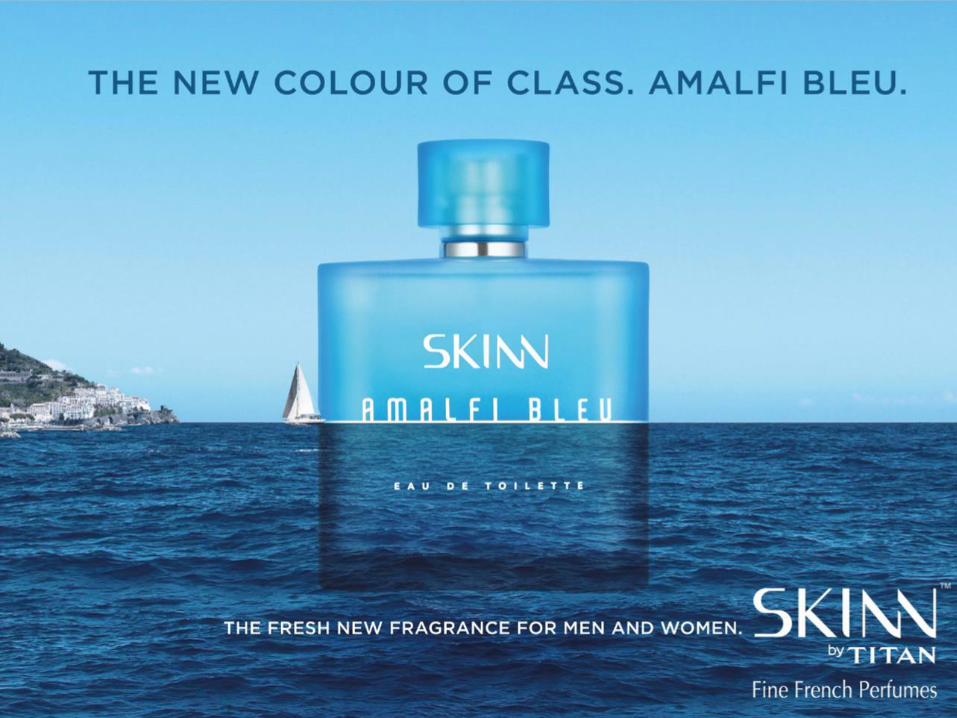
Brands SKINN by Titan
Fine French perfumes at very attractive price points
Entry into body mist category in FY 18- Skinn Kissed
Manufacturing Manufactured in France by celebrated perfumers, and
distilled from the finest ingredients
Bottled in France and India
Points of Sale Sold through World of Titan Channel, key
departmental store chains and Ecommerce
One of the highest selling perfumes in all
departmental stores
Plans to strengthen the distribution further in the
coming year
Packaging innovations for trial and gifting
Differentiators Exceptional fragrances at a very attractive price point
Similar products from international competition at very
high price points
Domestic branded competition almost non existent
32
33
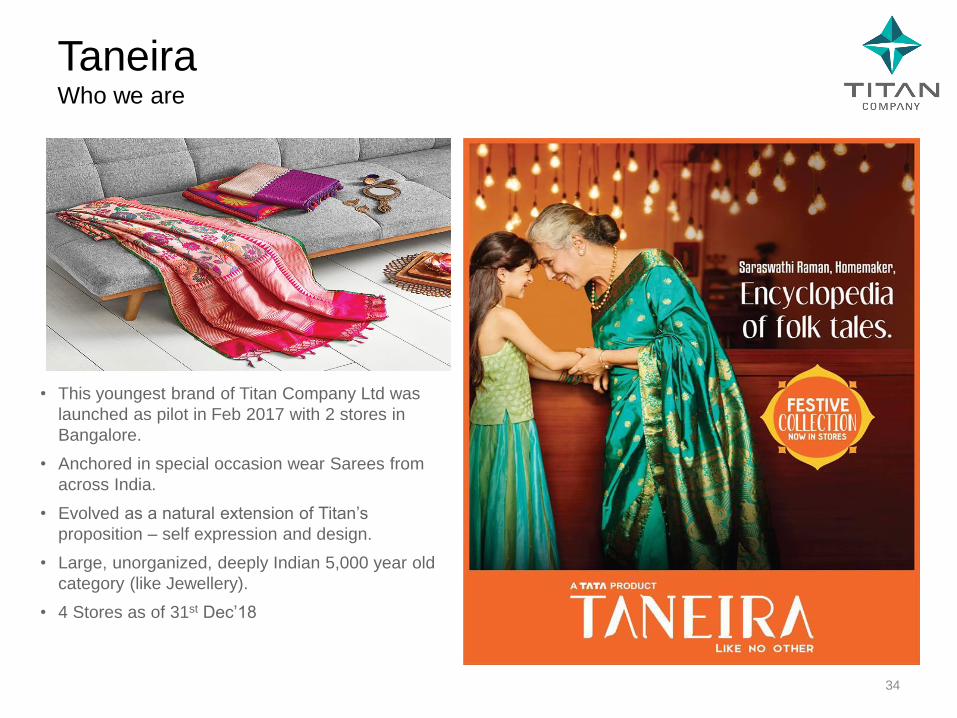
Taneira Who we are
• This youngest brand of Titan Company Ltd was
launched as pilot in Feb 2017 with 2 stores in
Bangalore.
• Anchored in special occasion wear Sarees from
across India.
• Evolved as a natural extension of Titan’s
proposition – self expression and design.
• Large, unorganized, deeply Indian 5,000 year old
category (like Jewellery).
• 4 Stores as of 31st Dec’18
34
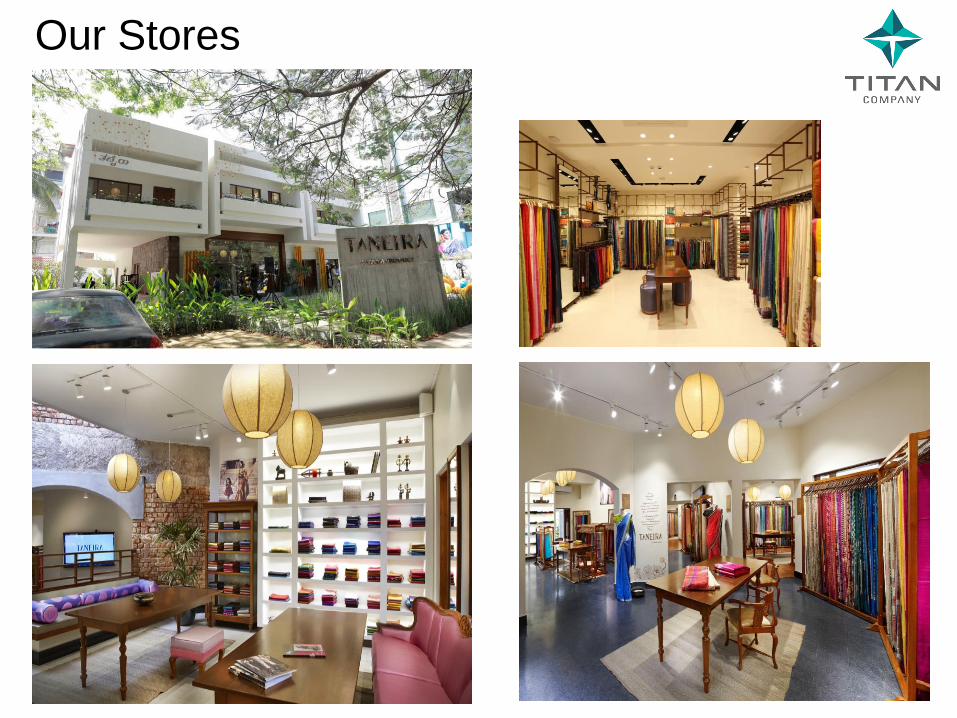
Our Stores
35
Titan Company Limited
Q3 Performance
36
Q3 Performance - Standalone
Company
• The Company continued the good growth momentum across all its businesses in the seasonally strong third quarter as well, demonstrating the inherent strength of virtually all the brands in its portfolio, and the strong connect with our consumers.
• Revenue for the company grew by 34% and PBT up by 42% .
• The Company added 67 stores with a retail space of 88k square feet in 9M FY’19, on net basis.
• While there is still no public information on the ability of the IL&FS group to repay its dues, the Company considered it prudent to make a further provision of INR 70 cr in Q3 for its investments in the group, taking the cumulative provision to INR 99 cr of the total exposure of INR 145 crores.
• CRISIL has revised its rating outlook on the long-term bank facilities of the company to ‘Positive’ from ‘Stable’, and reaffirmed the ‘CRISIL AA+’ rating.
• December saw the successful completion of the ECHO ('Educate to carry her onwards') campaign. The program created awareness among close to 6 lakh children on child safety, especially on 'good touch and bad touch' and has also raised funds to educate 18,000+ underprivileged girl children.
37
Q3 Performance - Standalone
Jewellery
• The Jewellery division had a good festive season and recorded strong revenue growth of 37%, on back of strong growth in both studded and plain jewellery category.
• Plain category also benefitted from a large institutional order of ~INR 200 crores of gold
coins.
• EBIT margin was higher at 13.3% led by higher gross margins, lower discount, inventory valuation loss recovered from the last quarter (INR 18 crores), lower advertising spends in the quarter as well as operating leverage driven by strong revenue growth.
• Studded ratio was line with the previous year at 25%.
• Golden Harvest and Gold exchange programmes continue to drive customer acquisitions.
• Tanishq added 24 stores in 9M FY’19, adding 65k square feet, on net basis.
38
Q3 Performance - Standalone
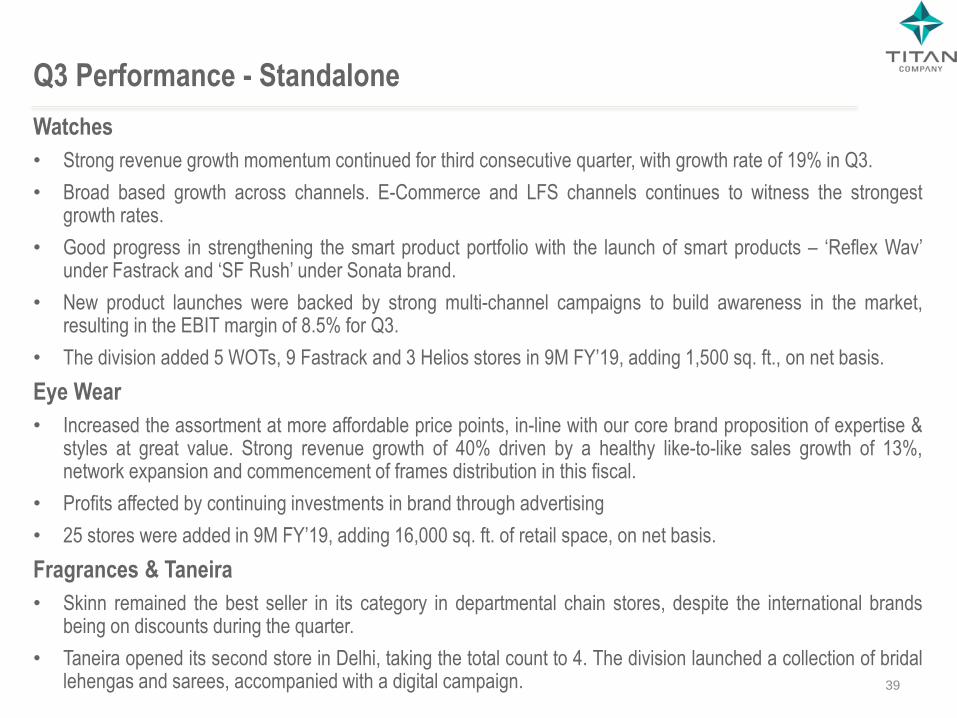
Watches
• Strong revenue growth momentum continued for third consecutive quarter, with growth rate of 19% in Q3.
• Broad based growth across channels. E-Commerce and LFS channels continues to witness the strongest growth rates.
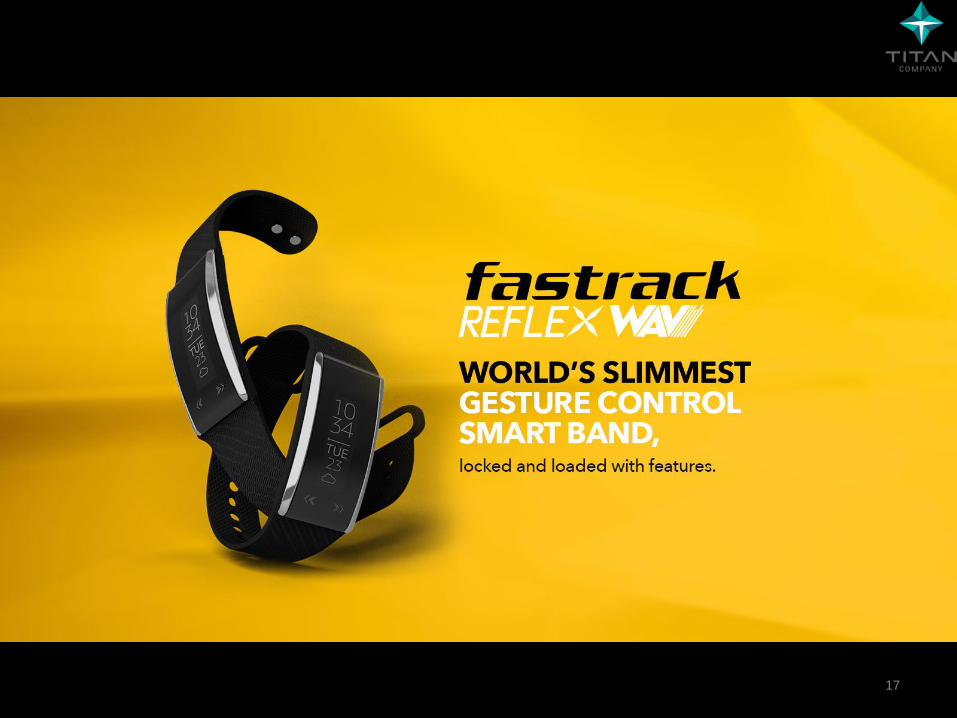
• Good progress in strengthening the smart product portfolio with the launch of smart products – ‘Reflex Wav’ under Fastrack and ‘SF Rush’ under Sonata brand.
• New product launches were backed by strong multi-channel campaigns to build awareness in the market, resulting in the EBIT margin of 8.5% for Q3.
• The division added 5 WOTs, 9 Fastrack and 3 Helios stores in 9M FY’19, adding 1,500 sq. ft., on net basis.
Eye Wear
• Increased the assortment at more affordable price points, in-line with our core brand proposition of expertise & styles at great value. Strong revenue growth of 40% driven by a healthy like-to-like sales growth of 13%, network expansion and commencement of frames distribution in this fiscal.
• Profits affected by continuing investments in brand through advertising
• 25 stores were added in 9M FY’19, adding 16,000 sq. ft. of retail space, on net basis.
Fragrances & Taneira
• Skinn remained the best seller in its category in departmental chain stores, despite the international brands being on discounts during the quarter.
• Taneira opened its second store in Delhi, taking the total count to 4. The division launched a collection of bridal lehengas and sarees, accompanied with a digital campaign. 39
Q3 Performance – Subsidiaries and JV
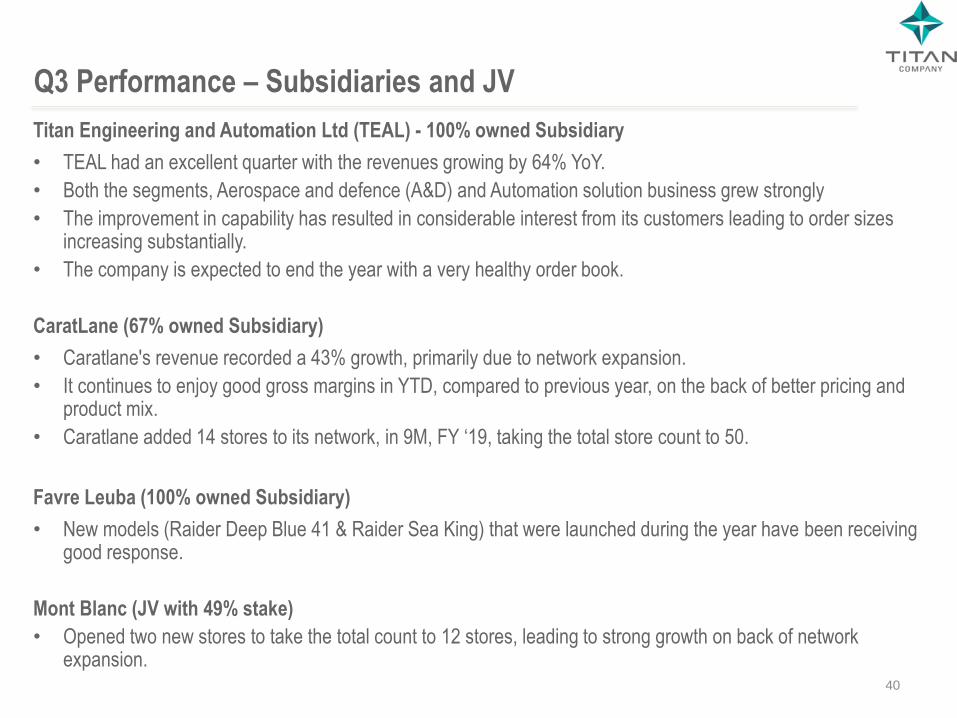
Titan Engineering and Automation Ltd (TEAL) - 100% owned Subsidiary
• TEAL had an excellent quarter with the revenues growing by 64% YoY.
• Both the segments, Aerospace and defence (A&D) and Automation solution business grew strongly
• The improvement in capability has resulted in considerable interest from its customers leading to order sizes increasing substantially.
• The company is expected to end the year with a very healthy order book.
CaratLane (67% owned Subsidiary)
• Caratlane's revenue recorded a 43% growth, primarily due to network expansion.
• It continues to enjoy good gross margins in YTD, compared to previous year, on the back of better pricing and product mix.
• Caratlane added 14 stores to its network, in 9M, FY ‘19, taking the total store count to 50.
Favre Leuba (100% owned Subsidiary)
• New models (Raider Deep Blue 41 & Raider Sea King) that were launched during the year have been receiving good response.
Mont Blanc (JV with 49% stake)
• Opened two new stores to take the total count to 12 stores, leading to strong growth on back of network expansion.
40
Q3’19 9M FY’19
Sales value
growth
Like-to-Like
growth
Sales value
growth
Like-to-Like
growth
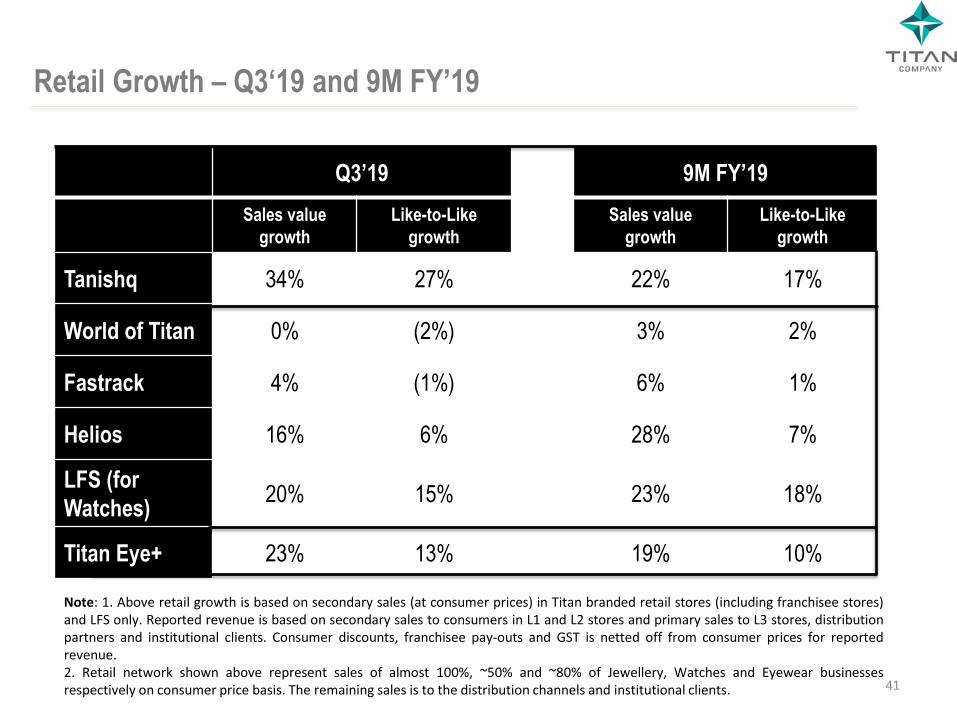
Tanishq 34% 27% 22% 17%
World of Titan 0% (2%) 3% 2%
Fastrack 4% (1%) 6% 1%
Helios 16% 6% 28% 7%
LFS (for
Watches) 20% 15% 23% 18%
Titan Eye+ 23% 13% 19% 10%
Retail Growth – Q3‘19 and 9M FY’19
Note: 1. Above retail growth is based on secondary sales (at consumer prices) in Titan branded retail stores (including franchisee stores) and LFS only. Reported revenue is based on secondary sales to consumers in L1 and L2 stores and primary sales to L3 stores, distribution partners and institutional clients. Consumer discounts, franchisee pay-outs and GST is netted off from consumer prices for reported revenue. 2. Retail network shown above represent sales of almost 100%, ~50% and ~80% of Jewellery, Watches and Eyewear businesses respectively on consumer price basis. The remaining sales is to the distribution channels and institutional clients. 41
42
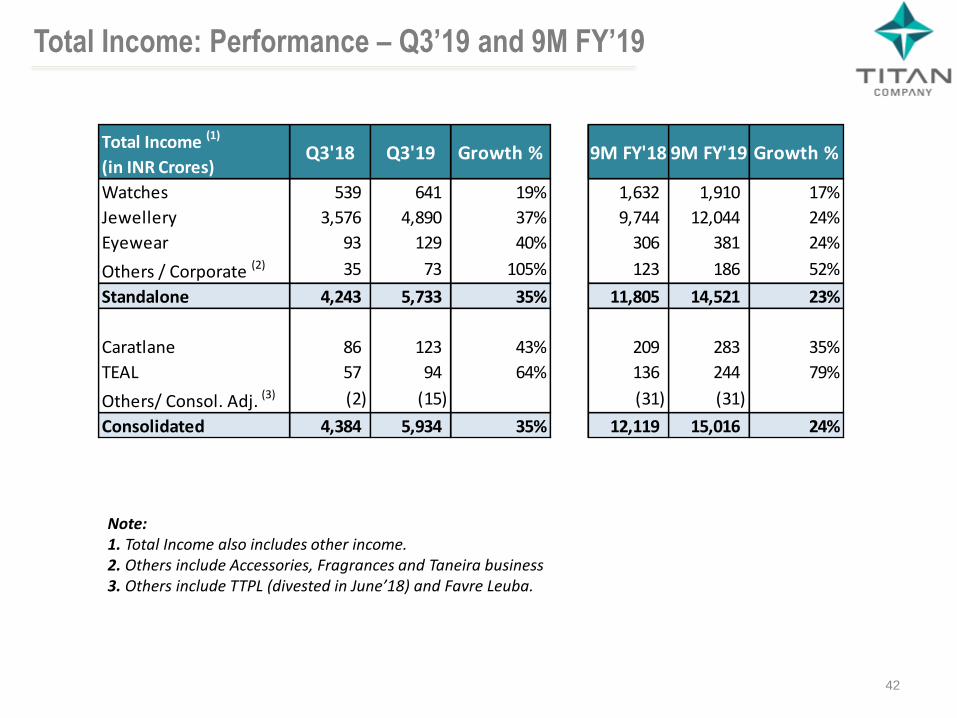
Total Income: Performance – Q3’19 and 9M FY’19
Note: 1. Total Income also includes other income. 2. Others include Accessories, Fragrances and Taneira business 3. Others include TTPL (divested in June’18) and Favre Leuba.
Total Income (1)
(in INR Crores)Q3'18 Q3'19 Growth % 9M FY'18 9M FY'19 Growth %
Watches 539 641 19% 1,632 1,910 17%
Jewellery 3,576 4,890 37% 9,744 12,044 24%
Eyewear 93 129 40% 306 381 24%
Others / Corporate (2) 35 73 105% 123 186 52%
Standalone 4,243 5,733 35% 11,805 14,521 23%
Caratlane 86 123 43% 209 283 35%
TEAL 57 94 64% 136 244 79%
Others/ Consol. Adj. (3) (2) (15) (31) (31)
Consolidated 4,384 5,934 35% 12,119 15,016 24%
43
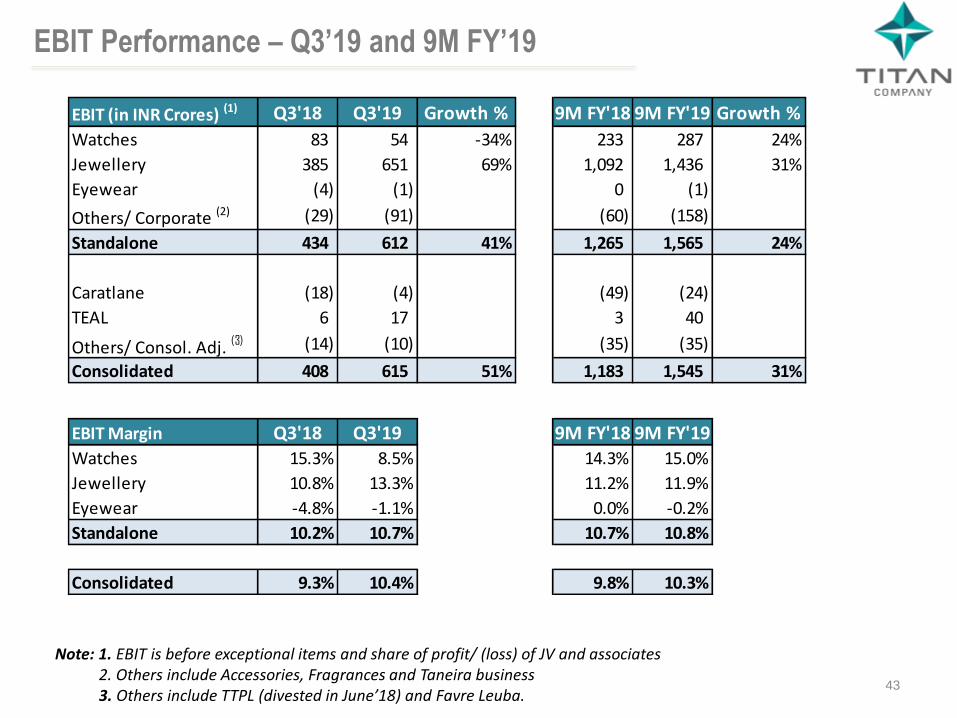
EBIT Performance – Q3’19 and 9M FY’19
Note: 1. EBIT is before exceptional items and share of profit/ (loss) of JV and associates 2. Others include Accessories, Fragrances and Taneira business 3. Others include TTPL (divested in June’18) and Favre Leuba.
EBIT (in INR Crores) (1) Q3'18 Q3'19 Growth % 9M FY'18 9M FY'19 Growth %
Watches 83 54 -34% 233 287 24%
Jewellery 385 651 69% 1,092 1,436 31%
Eyewear (4) (1) 0 (1)
Others/ Corporate (2) (29) (91) (60) (158)
Standalone 434 612 41% 1,265 1,565 24%
Caratlane (18) (4) (49) (24)
TEAL 6 17 3 40
Others/ Consol. Adj. (3) (14) (10) (35) (35)
Consolidated 408 615 51% 1,183 1,545 31%
EBIT Margin Q3'18 Q3'19 9M FY'18 9M FY'19
Watches 15.3% 8.5% 14.3% 15.0%
Jewellery 10.8% 13.3% 11.2% 11.9%
Eyewear -4.8% -1.1% 0.0% -0.2%
Standalone 10.2% 10.7% 10.7% 10.8%
Consolidated 9.3% 10.4% 9.8% 10.3%
44
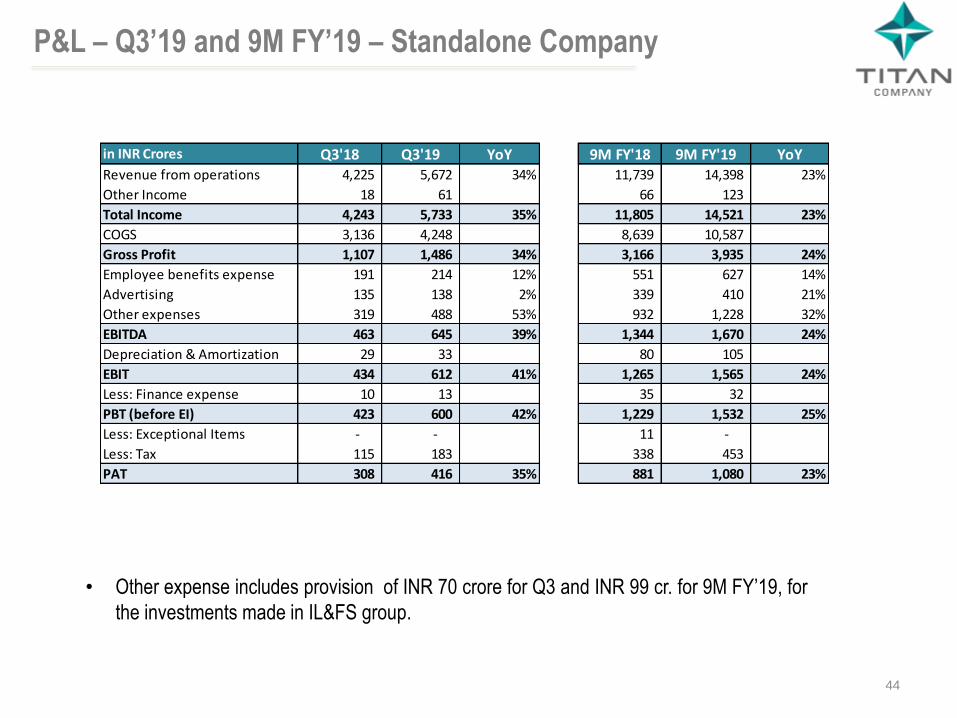
P&L – Q3’19 and 9M FY’19 – Standalone Company
• Other expense includes provision of INR 70 crore for Q3 and INR 99 cr. for 9M FY’19, for
the investments made in IL&FS group.
in INR Crores Q3'18 Q3'19 YoY 9M FY'18 9M FY'19 YoYRevenue from operations 4,225 5,672 34% 11,739 14,398 23%
Other Income 18 61 66 123
Total Income 4,243 5,733 35% 11,805 14,521 23%
COGS 3,136 4,248 8,639 10,587
Gross Profit 1,107 1,486 34% 3,166 3,935 24%
Employee benefits expense 191 214 12% 551 627 14%
Advertising 135 138 2% 339 410 21%
Other expenses 319 488 53% 932 1,228 32%
EBITDA 463 645 39% 1,344 1,670 24%
Depreciation & Amortization 29 33 80 105
EBIT 434 612 41% 1,265 1,565 24%
Less: Finance expense 10 13 35 32
PBT (before EI) 423 600 42% 1,229 1,532 25%
Less: Exceptional Items - - 11 -
Less: Tax 115 183 338 453
PAT 308 416 35% 881 1,080 23%
45
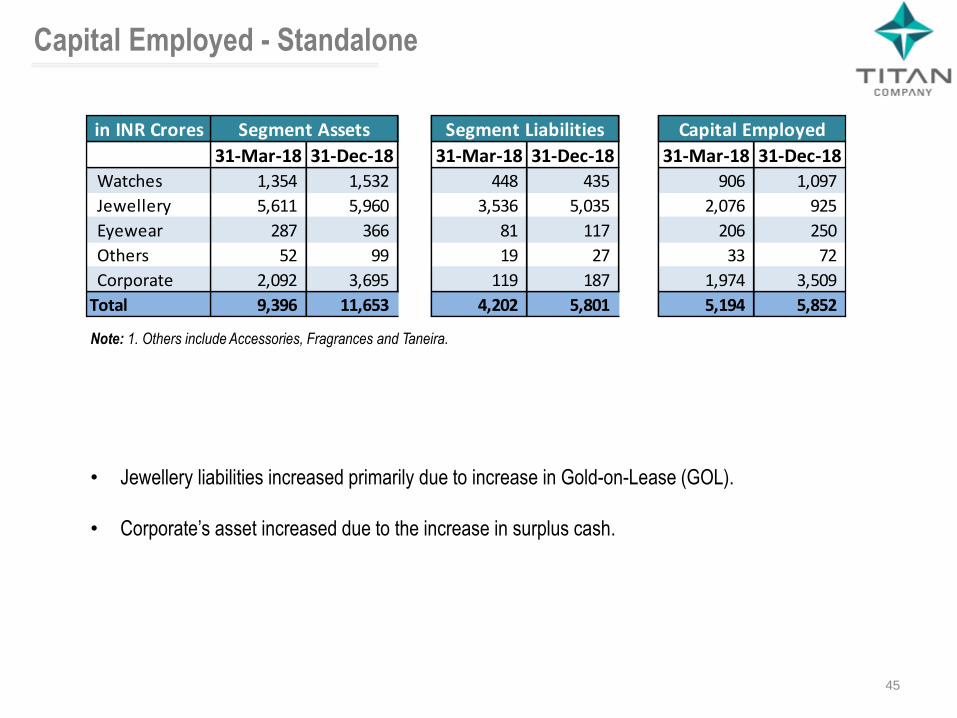
• Jewellery liabilities increased primarily due to increase in Gold-on-Lease (GOL).
• Corporate’s asset increased due to the increase in surplus cash.
Capital Employed - Standalone
Note: 1. Others include Accessories, Fragrances and Taneira.
in INR Crores
31-Mar-18 31-Dec-18 31-Mar-18 31-Dec-18 31-Mar-18 31-Dec-18
Watches 1,354 1,532 448 435 906 1,097
Jewellery 5,611 5,960 3,536 5,035 2,076 925
Eyewear 287 366 81 117 206 250
Others 52 99 19 27 33 72
Corporate 2,092 3,695 119 187 1,974 3,509
Total 9,396 11,653 4,202 5,801 5,194 5,852
Segment Assets Segment Liabilities Capital Employed
46
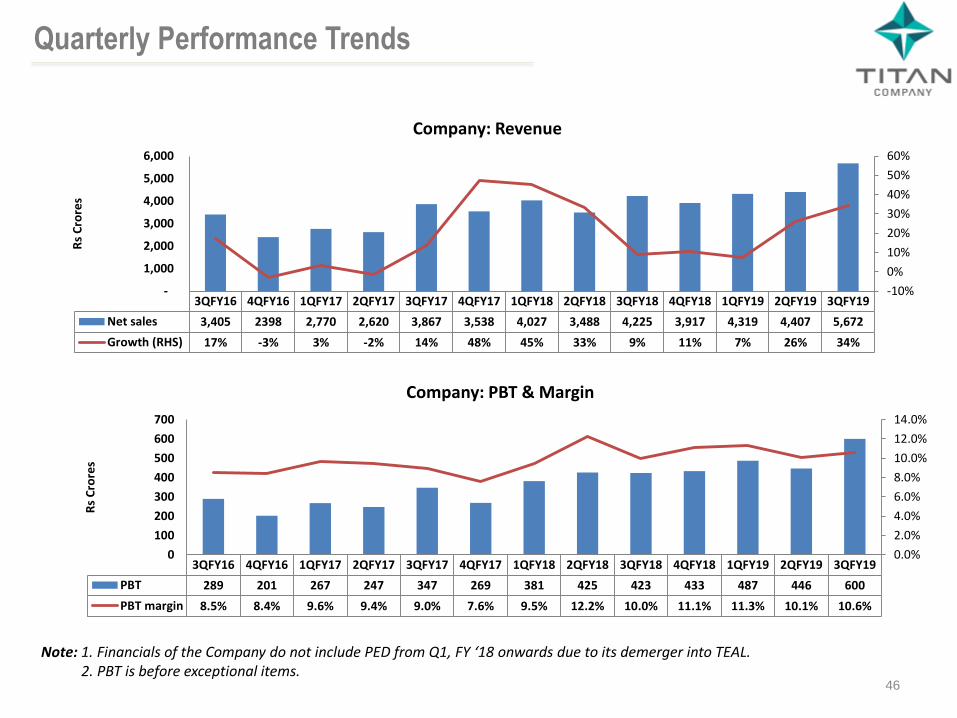
Quarterly Performance Trends
Note: 1. Financials of the Company do not include PED from Q1, FY ‘18 onwards due to its demerger into TEAL. 2. PBT is before exceptional items.
3QFY16 4QFY16 1QFY17 2QFY17 3QFY17 4QFY17 1QFY18 2QFY18 3QFY18 4QFY18 1QFY19 2QFY19 3QFY19
PBT 289 201 267 247 347 269 381 425 423 433 487 446 600
PBT margin 8.5% 8.4% 9.6% 9.4% 9.0% 7.6% 9.5% 12.2% 10.0% 11.1% 11.3% 10.1% 10.6%
0.0%
2.0%
4.0%
6.0%
8.0%
10.0%
12.0%
14.0%
0
100
200
300
400
500
600
700
Rs
Cro
res
Company: PBT & Margin
3QFY16 4QFY16 1QFY17 2QFY17 3QFY17 4QFY17 1QFY18 2QFY18 3QFY18 4QFY18 1QFY19 2QFY19 3QFY19
Net sales 3,405 2398 2,770 2,620 3,867 3,538 4,027 3,488 4,225 3,917 4,319 4,407 5,672
Growth (RHS) 17% -3% 3% -2% 14% 48% 45% 33% 9% 11% 7% 26% 34%
-10%
0%
10%
20%
30%
40%
50%
60%
-
1,000
2,000
3,000
4,000
5,000
6,000
Rs
Cro
res
Company: Revenue
47
Quarterly Performance Trends
Note: 1. EBIT is before exceptional items.
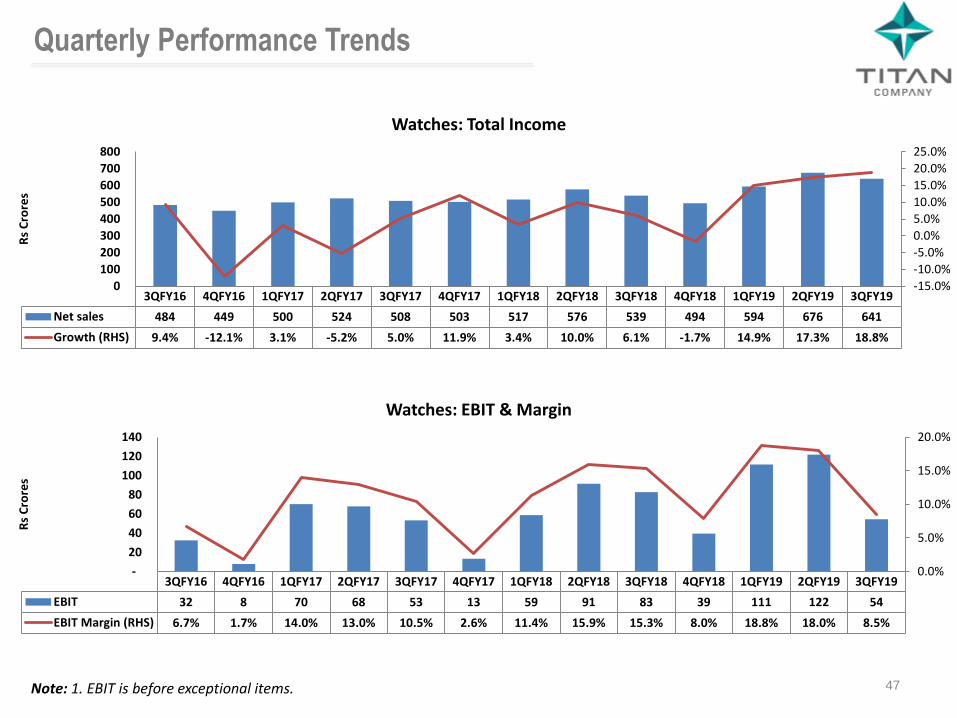
3QFY16 4QFY16 1QFY17 2QFY17 3QFY17 4QFY17 1QFY18 2QFY18 3QFY18 4QFY18 1QFY19 2QFY19 3QFY19
Net sales 484 449 500 524 508 503 517 576 539 494 594 676 641
Growth (RHS) 9.4% -12.1% 3.1% -5.2% 5.0% 11.9% 3.4% 10.0% 6.1% -1.7% 14.9% 17.3% 18.8%
-15.0%
-10.0%
-5.0%
0.0%
5.0%
10.0%
15.0%
20.0%
25.0%
0
100
200
300
400
500
600
700
800
Rs
Cro
res
Watches: Total Income
3QFY16 4QFY16 1QFY17 2QFY17 3QFY17 4QFY17 1QFY18 2QFY18 3QFY18 4QFY18 1QFY19 2QFY19 3QFY19
EBIT 32 8 70 68 53 13 59 91 83 39 111 122 54
EBIT Margin (RHS) 6.7% 1.7% 14.0% 13.0% 10.5% 2.6% 11.4% 15.9% 15.3% 8.0% 18.8% 18.0% 8.5%
0.0%
5.0%
10.0%
15.0%
20.0%
-
20
40
60
80
100
120
140
Rs
Cro
res
Watches: EBIT & Margin
48
Quarterly Performance Trends
Note: 1. EBIT is before exceptional items.
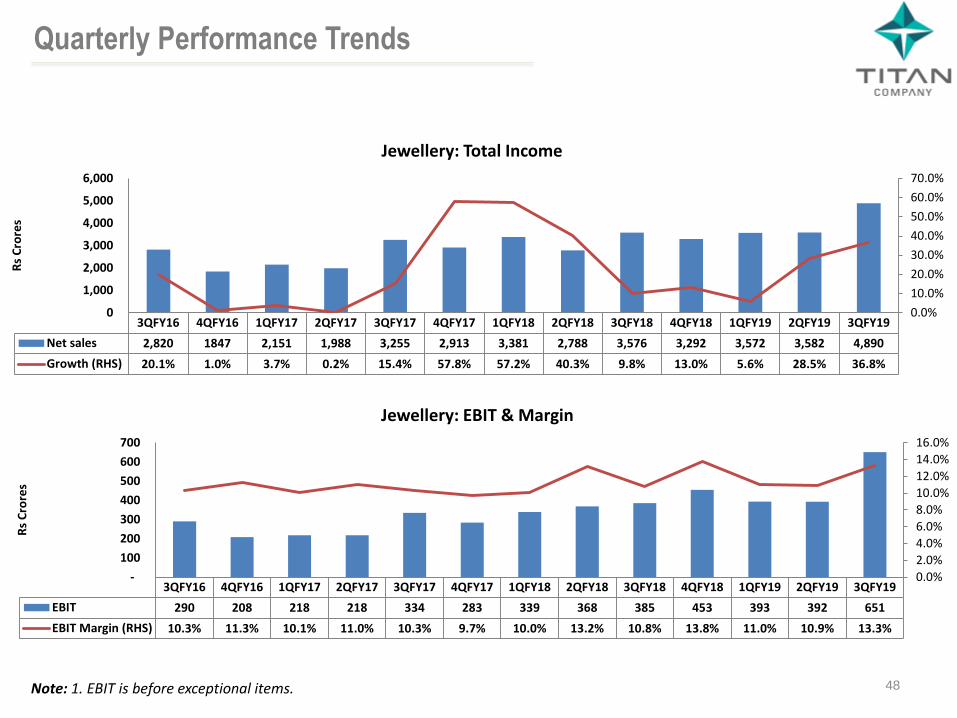
3QFY16 4QFY16 1QFY17 2QFY17 3QFY17 4QFY17 1QFY18 2QFY18 3QFY18 4QFY18 1QFY19 2QFY19 3QFY19
Net sales 2,820 1847 2,151 1,988 3,255 2,913 3,381 2,788 3,576 3,292 3,572 3,582 4,890
Growth (RHS) 20.1% 1.0% 3.7% 0.2% 15.4% 57.8% 57.2% 40.3% 9.8% 13.0% 5.6% 28.5% 36.8%
0.0%
10.0%
20.0%
30.0%
40.0%
50.0%
60.0%
70.0%
0
1,000
2,000
3,000
4,000
5,000
6,000
Rs
Cro
res
Jewellery: Total Income
3QFY16 4QFY16 1QFY17 2QFY17 3QFY17 4QFY17 1QFY18 2QFY18 3QFY18 4QFY18 1QFY19 2QFY19 3QFY19
EBIT 290 208 218 218 334 283 339 368 385 453 393 392 651
EBIT Margin (RHS) 10.3% 11.3% 10.1% 11.0% 10.3% 9.7% 10.0% 13.2% 10.8% 13.8% 11.0% 10.9% 13.3%
0.0%
2.0%
4.0%
6.0%
8.0%
10.0%
12.0%
14.0%
16.0%
-
100
200
300
400
500
600
700
Rs
Cro
res
Jewellery: EBIT & Margin
49
Quarterly Performance Trends
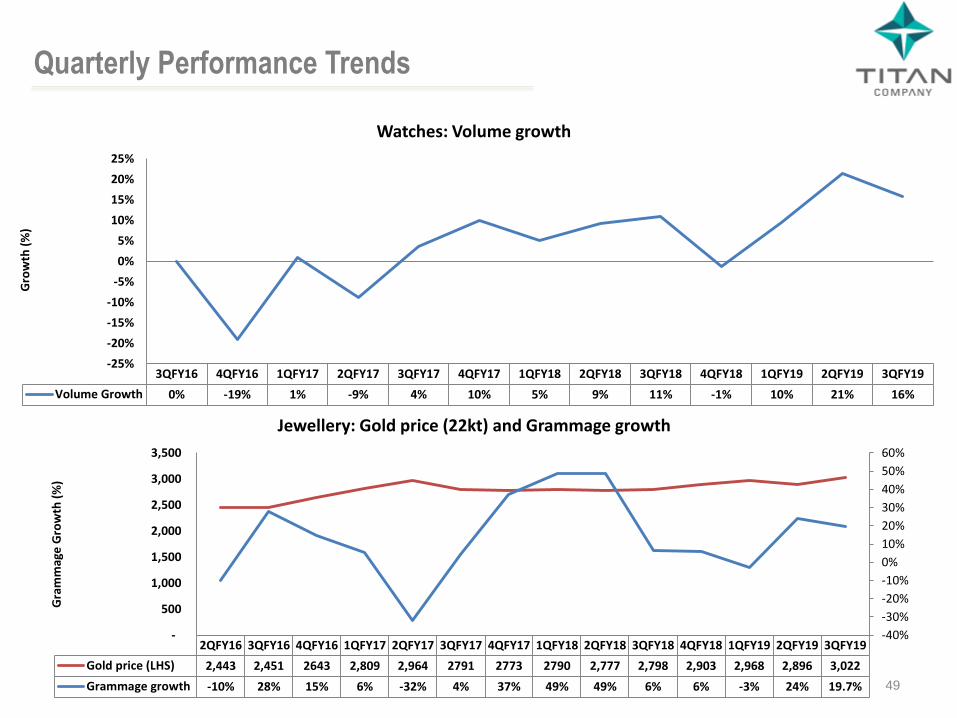
3QFY16 4QFY16 1QFY17 2QFY17 3QFY17 4QFY17 1QFY18 2QFY18 3QFY18 4QFY18 1QFY19 2QFY19 3QFY19
Volume Growth 0% -19% 1% -9% 4% 10% 5% 9% 11% -1% 10% 21% 16%
-25%
-20%
-15%
-10%
-5%
0%
5%
10%
15%
20%
25%
Gro
wth
(%
)
Watches: Volume growth
2QFY16 3QFY16 4QFY16 1QFY17 2QFY17 3QFY17 4QFY17 1QFY18 2QFY18 3QFY18 4QFY18 1QFY19 2QFY19 3QFY19
Gold price (LHS) 2,443 2,451 2643 2,809 2,964 2791 2773 2790 2,777 2,798 2,903 2,968 2,896 3,022
Grammage growth -10% 28% 15% 6% -32% 4% 37% 49% 49% 6% 6% -3% 24% 19.7%
-40%
-30%
-20%
-10%
0%
10%
20%
30%
40%
50%
60%
-
500
1,000
1,500
2,000
2,500
3,000
3,500
Gra
mm
age
Gro
wth
(%
)
Jewellery: Gold price (22kt) and Grammage growth
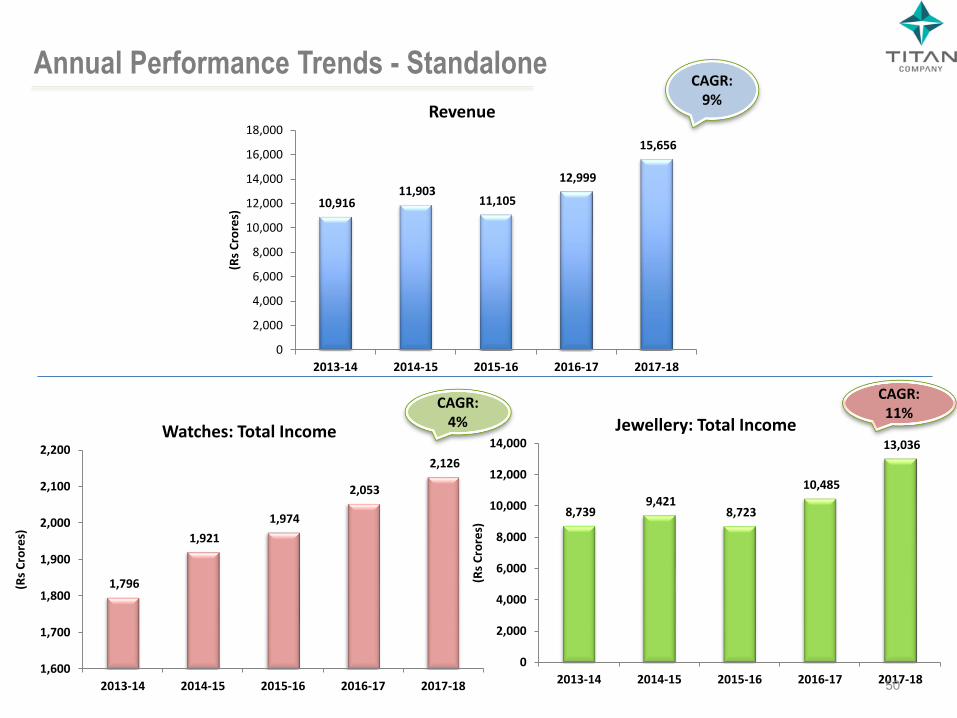
8,739 9,421
8,723
10,485
13,036
0
2,000
4,000
6,000
8,000
10,000
12,000
14,000
2013-14 2014-15 2015-16 2016-17 2017-18
(Rs
Cro
res)
Jewellery: Total Income
1,796
1,921
1,974
2,053
2,126
1,600
1,700
1,800
1,900
2,000
2,100
2,200
2013-14 2014-15 2015-16 2016-17 2017-18
(Rs
Cro
res)
Watches: Total Income
10,916 11,903
11,105
12,999
15,656
0
2,000
4,000
6,000
8,000
10,000
12,000
14,000
16,000
18,000
2013-14 2014-15 2015-16 2016-17 2017-18
(Rs
Cro
res)
Revenue
CAGR: 9%
CAGR: 11%
CAGR: 4%
Annual Performance Trends - Standalone
50
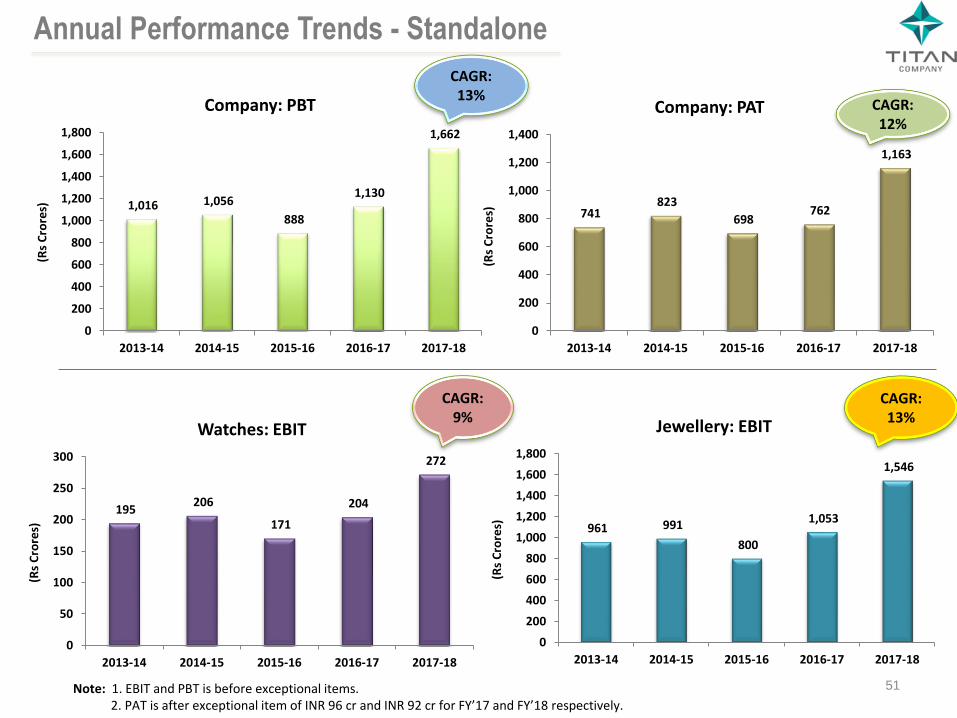
961 991
800
1,053
1,546
0
200
400
600
800
1,000
1,200
1,400
1,600
1,800
2013-14 2014-15 2015-16 2016-17 2017-18
(Rs
Cro
res)
Jewellery: EBIT
741 823
698 762
1,163
0
200
400
600
800
1,000
1,200
1,400
2013-14 2014-15 2015-16 2016-17 2017-18
(Rs
Cro
res)
Company: PAT CAGR: 12%
CAGR: 13%
CAGR: 9%
CAGR: 13%
Annual Performance Trends - Standalone
Note: 1. EBIT and PBT is before exceptional items. 2. PAT is after exceptional item of INR 96 cr and INR 92 cr for FY’17 and FY’18 respectively.
1,016 1,056
888
1,130
1,662
0
200
400
600
800
1,000
1,200
1,400
1,600
1,800
2013-14 2014-15 2015-16 2016-17 2017-18
(Rs
Cro
res)
Company: PBT
195 206
171
204
272
0
50
100
150
200
250
300
2013-14 2014-15 2015-16 2016-17 2017-18
(Rs
Cro
res)
Watches: EBIT
51
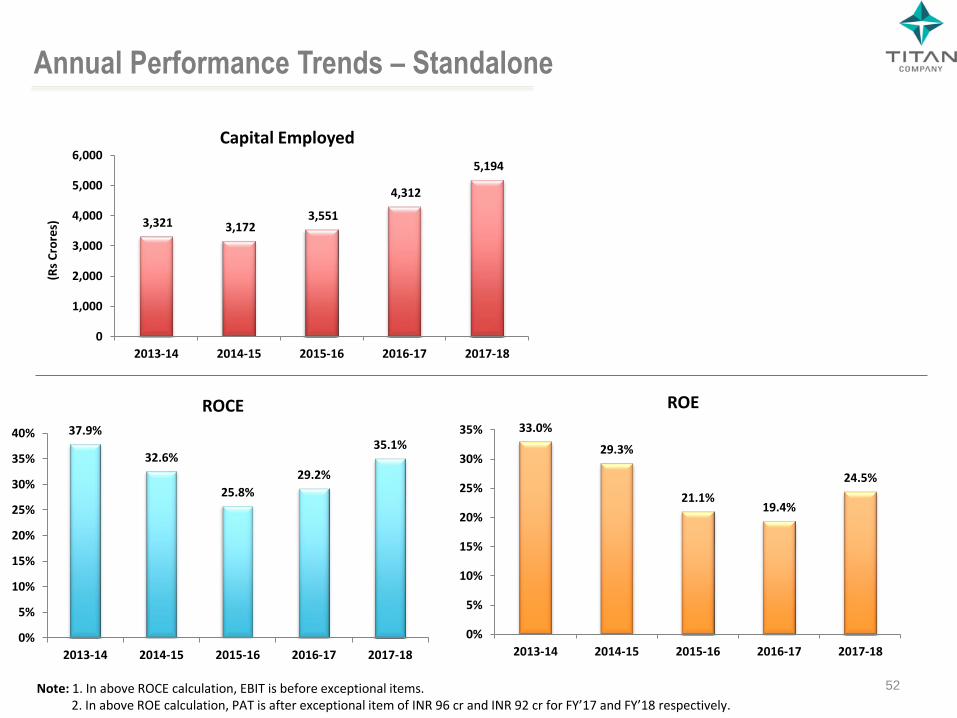
33.0%
29.3%
21.1% 19.4%
24.5%
0%
5%
10%
15%
20%
25%
30%
35%
2013-14 2014-15 2015-16 2016-17 2017-18
ROE
Annual Performance Trends – Standalone
Note: 1. In above ROCE calculation, EBIT is before exceptional items. 2. In above ROE calculation, PAT is after exceptional item of INR 96 cr and INR 92 cr for FY’17 and FY’18 respectively.
3,321 3,172 3,551
4,312
5,194
0
1,000
2,000
3,000
4,000
5,000
6,000
2013-14 2014-15 2015-16 2016-17 2017-18
(Rs
Cro
res)
Capital Employed
37.9%
32.6%
25.8%
29.2%
35.1%
0%
5%
10%
15%
20%
25%
30%
35%
40%
2013-14 2014-15 2015-16 2016-17 2017-18
ROCE
52
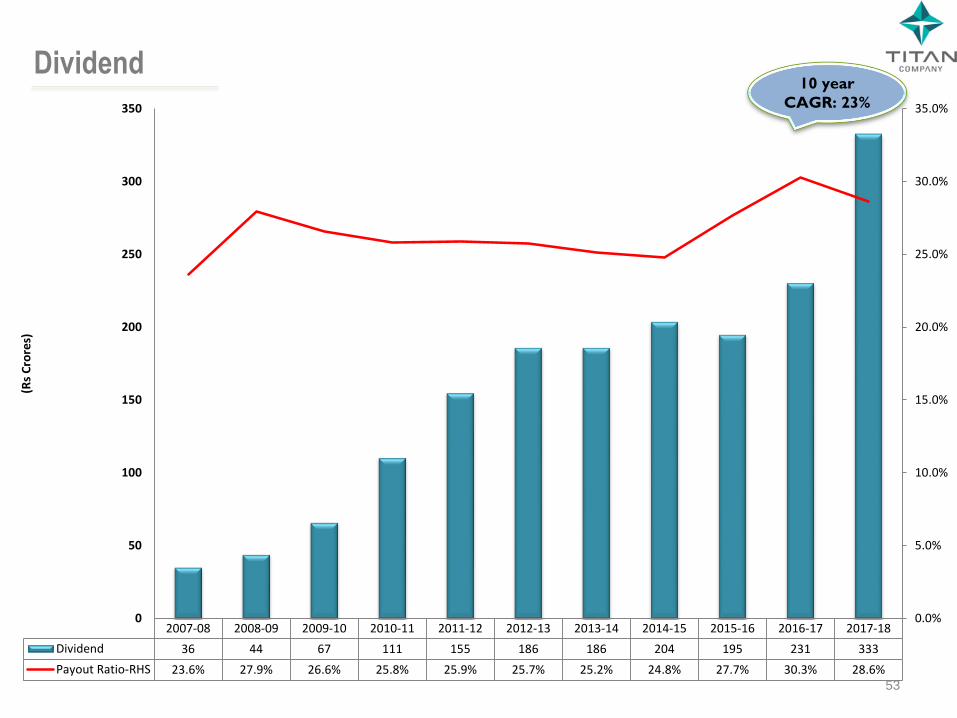
Dividend 10 year
CAGR: 23%
2007-08 2008-09 2009-10 2010-11 2011-12 2012-13 2013-14 2014-15 2015-16 2016-17 2017-18
Dividend 36 44 67 111 155 186 186 204 195 231 333
Payout Ratio-RHS 23.6% 27.9% 26.6% 25.8% 25.9% 25.7% 25.2% 24.8% 27.7% 30.3% 28.6%
0.0%
5.0%
10.0%
15.0%
20.0%
25.0%
30.0%
35.0%
0
50
100
150
200
250
300
350
(Rs
Cro
res)
53
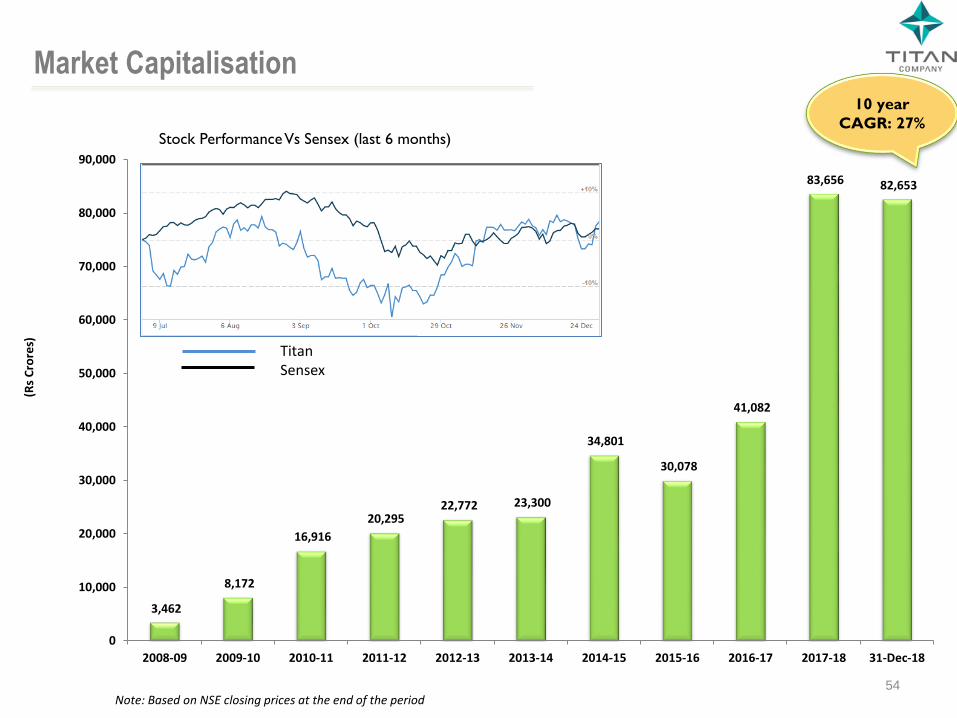
3,462
8,172
16,916
20,295 22,772 23,300
34,801
30,078
41,082
83,656 82,653
0
10,000
20,000
30,000
40,000
50,000
60,000
70,000
80,000
90,000
2008-09 2009-10 2010-11 2011-12 2012-13 2013-14 2014-15 2015-16 2016-17 2017-18 31-Dec-18
(Rs
Cro
res)
10 year
CAGR: 27%
Note: Based on NSE closing prices at the end of the period
Market Capitalisation
Stock Performance Vs Sensex (last 6 months)
Titan Sensex
54
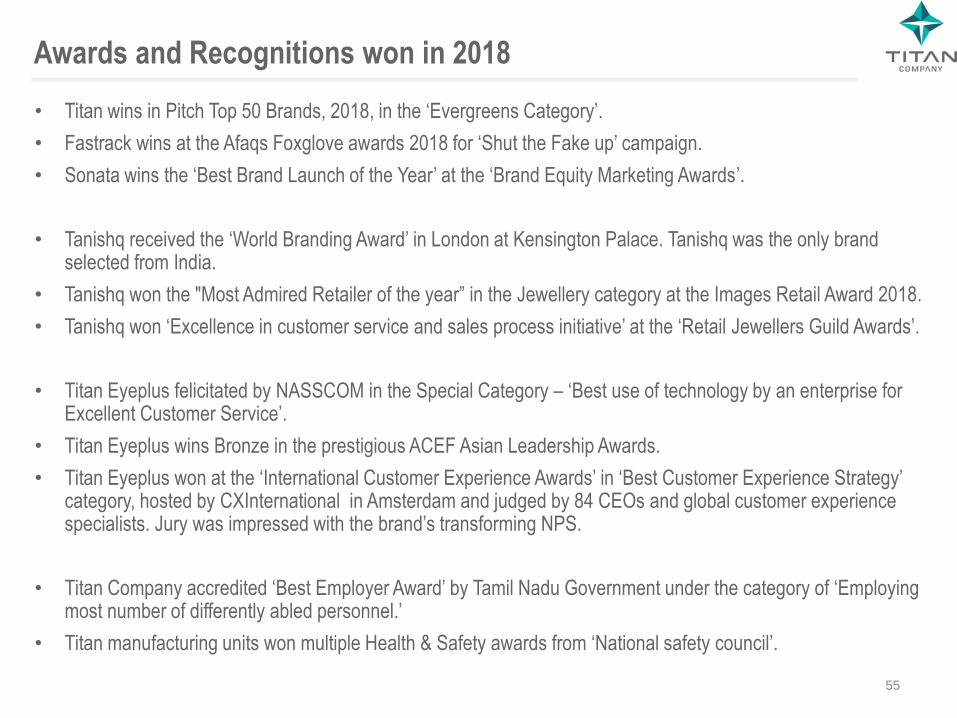
Awards and Recognitions won in 2018
• Titan wins in Pitch Top 50 Brands, 2018, in the ‘Evergreens Category’.
• Fastrack wins at the Afaqs Foxglove awards 2018 for ‘Shut the Fake up’ campaign.
• Sonata wins the ‘Best Brand Launch of the Year’ at the ‘Brand Equity Marketing Awards’.
• Tanishq received the ‘World Branding Award’ in London at Kensington Palace. Tanishq was the only brand selected from India.
• Tanishq won the "Most Admired Retailer of the year” in the Jewellery category at the Images Retail Award 2018.
• Tanishq won ‘Excellence in customer service and sales process initiative’ at the ‘Retail Jewellers Guild Awards’.
• Titan Eyeplus felicitated by NASSCOM in the Special Category – ‘Best use of technology by an enterprise for Excellent Customer Service’.
• Titan Eyeplus wins Bronze in the prestigious ACEF Asian Leadership Awards.
• Titan Eyeplus won at the ‘International Customer Experience Awards’ in ‘Best Customer Experience Strategy’ category, hosted by CXInternational in Amsterdam and judged by 84 CEOs and global customer experience specialists. Jury was impressed with the brand’s transforming NPS.
• Titan Company accredited ‘Best Employer Award’ by Tamil Nadu Government under the category of ‘Employing most number of differently abled personnel.’
• Titan manufacturing units won multiple Health & Safety awards from ‘National safety council’.
55
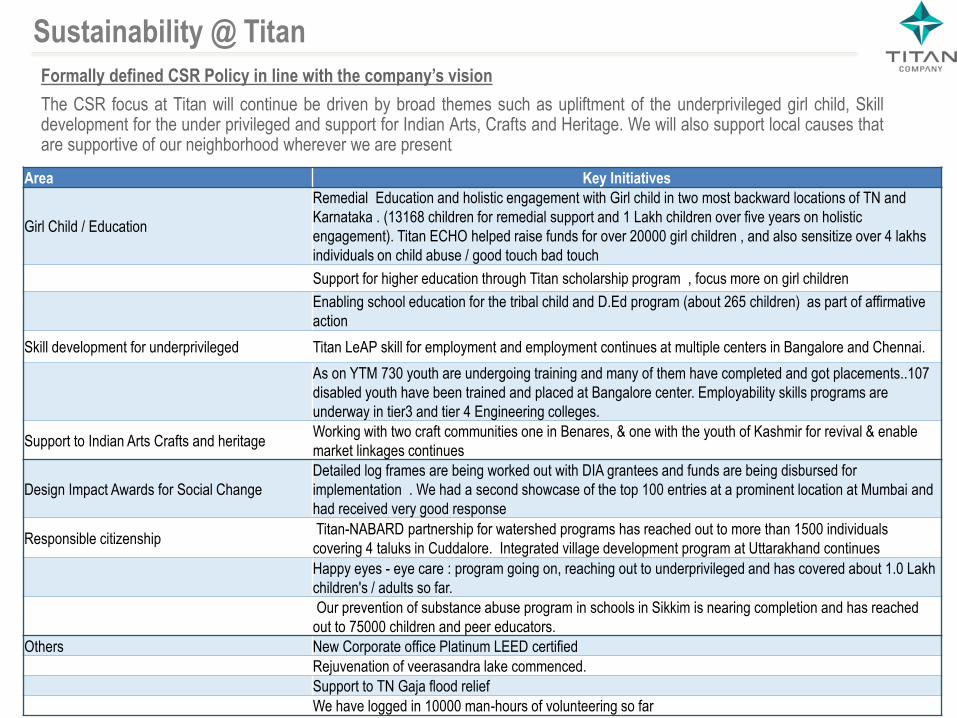
Sustainability @ Titan
Formally defined CSR Policy in line with the company’s vision
The CSR focus at Titan will continue be driven by broad themes such as upliftment of the underprivileged girl child, Skill development for the under privileged and support for Indian Arts, Crafts and Heritage. We will also support local causes that are supportive of our neighborhood wherever we are present
56
Area Key Initiatives
Girl Child / Education
Remedial Education and holistic engagement with Girl child in two most backward locations of TN and
Karnataka . (13168 children for remedial support and 1 Lakh children over five years on holistic
engagement). Titan ECHO helped raise funds for over 20000 girl children , and also sensitize over 4 lakhs
individuals on child abuse / good touch bad touch
Support for higher education through Titan scholarship program , focus more on girl children
Enabling school education for the tribal child and D.Ed program (about 265 children) as part of affirmative
action
Skill development for underprivileged Titan LeAP skill for employment and employment continues at multiple centers in Bangalore and Chennai.
As on YTM 730 youth are undergoing training and many of them have completed and got placements..107
disabled youth have been trained and placed at Bangalore center. Employability skills programs are
underway in tier3 and tier 4 Engineering colleges.
Support to Indian Arts Crafts and heritage Working with two craft communities one in Benares, & one with the youth of Kashmir for revival & enable
market linkages continues
Design Impact Awards for Social Change
Detailed log frames are being worked out with DIA grantees and funds are being disbursed for
implementation . We had a second showcase of the top 100 entries at a prominent location at Mumbai and
had received very good response
Responsible citizenship Titan-NABARD partnership for watershed programs has reached out to more than 1500 individuals
covering 4 taluks in Cuddalore. Integrated village development program at Uttarakhand continues
Happy eyes - eye care : program going on, reaching out to underprivileged and has covered about 1.0 Lakh
children's / adults so far.
Our prevention of substance abuse program in schools in Sikkim is nearing completion and has reached
out to 75000 children and peer educators.
Others New Corporate office Platinum LEED certified
Rejuvenation of veerasandra lake commenced.
Support to TN Gaja flood relief
We have logged in 10000 man-hours of volunteering so far
Thank You


![Audited Financial Results FY 2018-19 April 24, 2019 · Key Financial Highlights: FY 18-19 vs FY 17-18 as per Indian Accounting Standards [IndAS] Key Financial Highlights: Q4 FY 18-19](https://img.pdfslide.us/doc/110x75/5f1a178b938ef210d370e190/audited-financial-results-fy-2018-19-april-24-2019-key-financial-highlights-fy.jpg)