Embed Size (px)
Citation preview
Tissue Engineering of a Differentiated Skeletal Muscle
Construct with Controllable Structure and Function
by
Weining Bian
Department of Biomedical Engineering Duke University
Date:_______________________ Approved:
___________________________ Nenad Bursac, Supervisor
___________________________
George A. Truskey
___________________________ Kam W. Leong
___________________________
Willam E. Kraus
___________________________ Robert G. Dennis
Dissertation submitted in partial fulfillment of the requirements for the degree of Doctor of Philosophy in the Department of
Biomedical Engineering in the Graduate School of Duke University
2011
ABSTRACT
Tissue Engineering of a Differentiated Skeletal Muscle
Construct with Controllable Structure and Function
by
Weining Bian
Department of Biomedical Engineering Duke University
Date:_______________________ Approved:
___________________________ Nenad Bursac, Supervisor
___________________________
George A. Truskey
___________________________ Kam W. Leong
___________________________
William E. Kraus
___________________________ Robert G. Dennis
An abstract of a dissertation submitted in partial fulfillment of the requirements for the degree of Doctor of Philosophy in the Department of Biomedical Engineering in the Graduate School
of Duke University
2011

Copyright by Weining Bian
2011
iv
Abstract
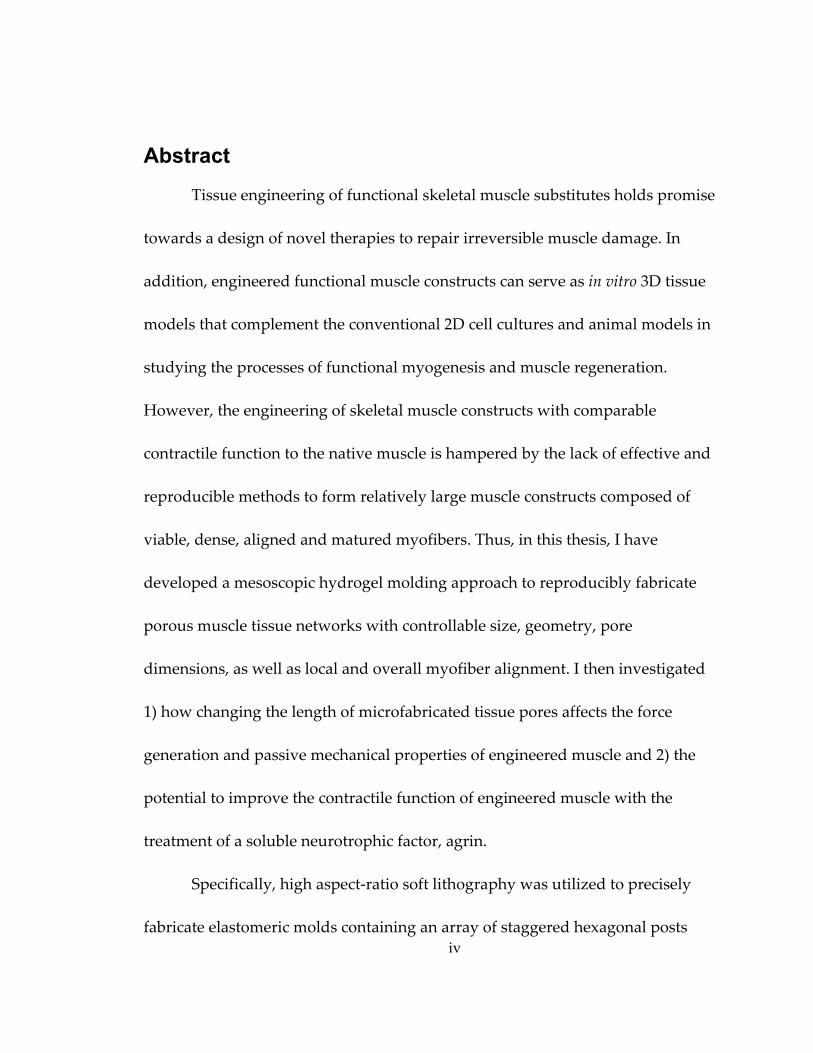
Tissue engineering of functional skeletal muscle substitutes holds promise
towards a design of novel therapies to repair irreversible muscle damage. In
addition, engineered functional muscle constructs can serve as in vitro 3D tissue
models that complement the conventional 2D cell cultures and animal models in
studying the processes of functional myogenesis and muscle regeneration.
However, the engineering of skeletal muscle constructs with comparable
contractile function to the native muscle is hampered by the lack of effective and
reproducible methods to form relatively large muscle constructs composed of
viable, dense, aligned and matured myofibers. Thus, in this thesis, I have
developed a mesoscopic hydrogel molding approach to reproducibly fabricate
porous muscle tissue networks with controllable size, geometry, pore
dimensions, as well as local and overall myofiber alignment. I then investigated
1) how changing the length of microfabricated tissue pores affects the force
generation and passive mechanical properties of engineered muscle and 2) the
potential to improve the contractile function of engineered muscle with the
treatment of a soluble neurotrophic factor, agrin.
Specifically, high aspect‐ratio soft lithography was utilized to precisely
fabricate elastomeric molds containing an array of staggered hexagonal posts
v
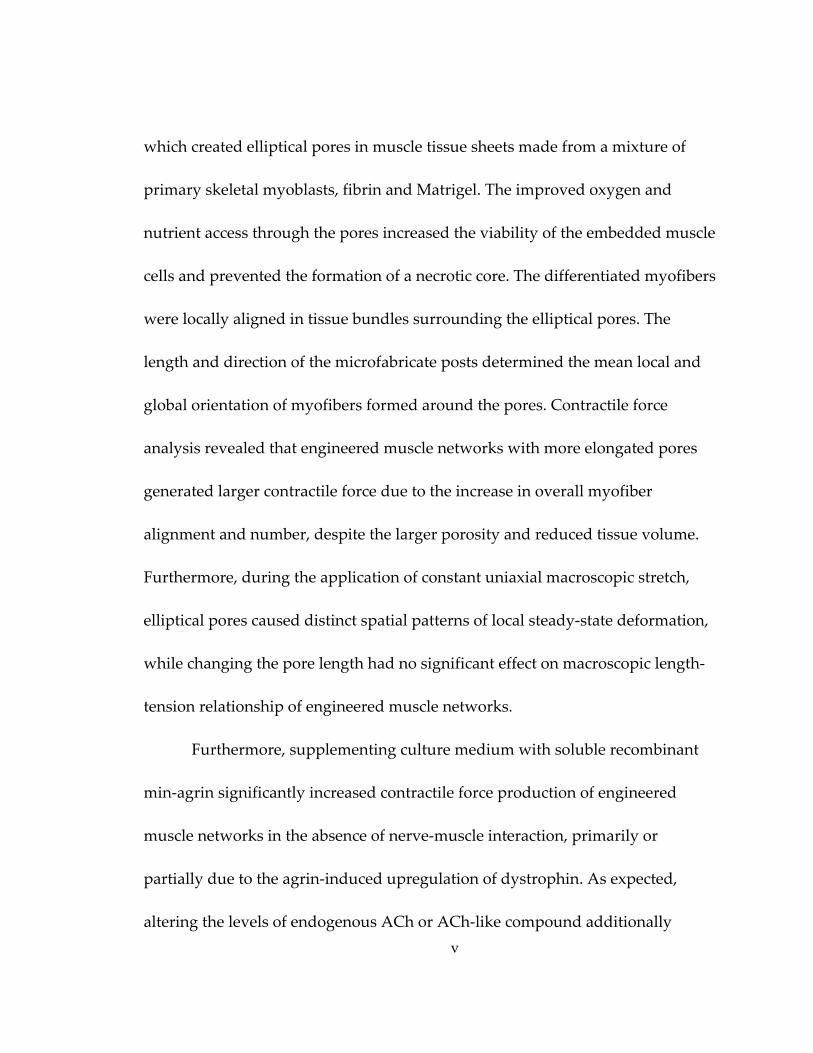
which created elliptical pores in muscle tissue sheets made from a mixture of
primary skeletal myoblasts, fibrin and Matrigel. The improved oxygen and
nutrient access through the pores increased the viability of the embedded muscle
cells and prevented the formation of a necrotic core. The differentiated myofibers
were locally aligned in tissue bundles surrounding the elliptical pores. The
length and direction of the microfabricate posts determined the mean local and
global orientation of myofibers formed around the pores. Contractile force
analysis revealed that engineered muscle networks with more elongated pores
generated larger contractile force due to the increase in overall myofiber
alignment and number, despite the larger porosity and reduced tissue volume.
Furthermore, during the application of constant uniaxial macroscopic stretch,
elliptical pores caused distinct spatial patterns of local steady‐state deformation,
while changing the pore length had no significant effect on macroscopic length‐
tension relationship of engineered muscle networks.
Furthermore, supplementing culture medium with soluble recombinant
min‐agrin significantly increased contractile force production of engineered
muscle networks in the absence of nerve‐muscle interaction, primarily or
partially due to the agrin‐induced upregulation of dystrophin. As expected,
altering the levels of endogenous ACh or ACh‐like compound additionally
vi
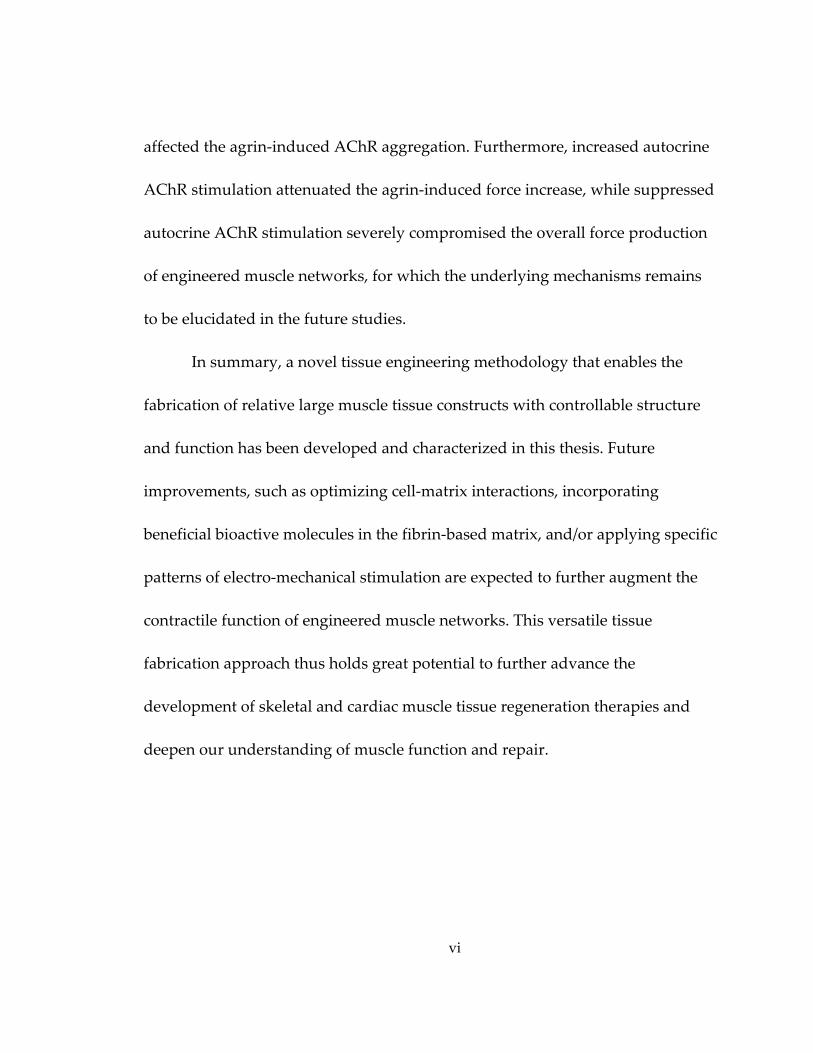
affected the agrin‐induced AChR aggregation. Furthermore, increased autocrine
AChR stimulation attenuated the agrin‐induced force increase, while suppressed
autocrine AChR stimulation severely compromised the overall force production
of engineered muscle networks, for which the underlying mechanisms remains
to be elucidated in the future studies.
In summary, a novel tissue engineering methodology that enables the
fabrication of relative large muscle tissue constructs with controllable structure
and function has been developed and characterized in this thesis. Future
improvements, such as optimizing cell‐matrix interactions, incorporating
beneficial bioactive molecules in the fibrin‐based matrix, and/or applying specific
patterns of electro‐mechanical stimulation are expected to further augment the
contractile function of engineered muscle networks. This versatile tissue
fabrication approach thus holds great potential to further advance the
development of skeletal and cardiac muscle tissue regeneration therapies and
deepen our understanding of muscle function and repair.

vii
Dedication
To my dear parents, Yu‐Chang Bian and Chun‐Lan Liu
viii
Contents
Abstract ......................................................................................................................................... iv
List of Tables .............................................................................................................................. xiii
List of Figures .............................................................................................................................xiv
Acknowledgements ................................................................................................................ xviii
1. Introduction ............................................................................................................................... 1
2. Background ................................................................................................................................ 6
2.1 Skeletal muscle damage, regeneration, and differentiation ....................................... 6
2.2 Force transmission in skeletal muscle ......................................................................... 10
2.3 The role of agrin in skeletal muscle differentiation ................................................... 12
2.4 Current strategies for skeletal muscle repair .............................................................. 14
2.4.1 Autologous muscle transposition ........................................................................... 15
2.4.2 Myoblast transplantation ......................................................................................... 15
2.5 Skeletal muscle tissue engineering ............................................................................... 16
2.5.1 Ideal properties of engineered skeletal muscle tissues ........................................ 17
2.5.2 Current state of the field ........................................................................................... 18
2.5.3 Challenges and opportunities in the field .............................................................. 22
2.6 Hydrogel micropatterning ............................................................................................ 25
2.7 Significance ...................................................................................................................... 28
3. Materials and Methods........................................................................................................... 29
3.1 Isolation of neonatal rat skeletal myoblasts ................................................................ 29
3.2 Culture of C2C12 myoblasts ......................................................................................... 30
ix
3.3 Floating disc assay for quantification of gel compaction .......................................... 30
3.4 Morphometric assessment of tissue constructs .......................................................... 31
3.4.1 Measurement of tissue thickness ............................................................................ 31
3.4.2 Measurement of pore dimensions, bundle width and porosity ......................... 31
3.4.3 Estimation of tissue volume ..................................................................................... 32
3.5 Cell viability .................................................................................................................... 33
3.6 Histological assessment ................................................................................................. 33
3.7 Quantitative immunofluorescence assessment .......................................................... 34
3.7.1 Immunostaining procedure ..................................................................................... 34
3.7.2 Quantification of cell alignment .............................................................................. 35
3.7.3 Quantification of AChR clustering ......................................................................... 36
3.7.4 Quantification of myogenin index .......................................................................... 37
3.8 DNA content quantification .......................................................................................... 37
3.9 Quantitative RT‐PCR ..................................................................................................... 38
3.10 Western blot analysis ................................................................................................... 40
3.11 Measurements of isometric contractile force and passive tension ........................ 42
3.12 Analysis of steady‐state local tissue deformation due to global uniaxial stretch ................................................................................................................................................ .44
3.13 Sensitivity of contractile force amplitude to extracellular Ca2+ concentration ..... 48
3.14 Mapping of intracellular Ca2+ transients ................................................................... 49
3.15 Statistical analysis ......................................................................................................... 50
4. Mesoscopic Hydrogel Molding to Control Tissue Geometry of Engineered Muscle ... 51
4.1 Fabrication of engineered muscle networks ............................................................... 54
x
4.1.1 Fabrication of silicon master template .................................................................... 54
4.1.2 Double‐casting of PDMS replicas ............................................................................ 57
4.1.3 Alternative method to fabricate PDMS tissue molds ........................................... 59
4.1.4 Cell/gel molding and culture of engineered muscle networks ........................... 60
4.2 Characterization of cell‐mediated gel compaction .................................................... 63
4.3 Cell viability, distribution, and differentiation in engineered muscle networks .. 66
4.4 Control of tissue thickness ............................................................................................ 72
4.5 Control of pore dimensions and tissue porosity ........................................................ 74
4.6 Control of cell alignment ............................................................................................... 76
4.7 Control of regional cell orientation .............................................................................. 79
4.8 Discussion ........................................................................................................................ 81
4.8.1 A comparison with other solid scaffold‐ and hydrogel‐based tissue engineering methods ......................................................................................................... 82
4.8.2 The ability to independently control tissue thickness, porosity and cell alignment.. ........................................................................................................................... 84
4.8.3 High mechanical compliance of fibrin gel allows long‐term culture of vigorously contracting skeletal muscle networks .......................................................... 86
4.8.4 Potential substitutes for tumorigenic Matrigel and nylon/Velcro frame for future clinical applications ................................................................................................ 87
4.8.5 Future developments of mesoscopic molding methodology to engineer skeletal muscle with superior force generating capability ........................................... 88
5. Force Generation in Engineered Muscle Networks with Varied Pore Lengths ............. 90
5.1 Fabrication of engineered muscle networks with different pore lengths ............... 91
5.2 Effects of varied post length on pore shape and gel compaction in engineered muscle networks ................................................................................................................... 93
xi
5.3 Effects of varied post length on global and local myofiber alignment in engineered muscle networks .............................................................................................. 96
5.4 Increase of contractile force in engineered muscle networks with longer pores .. 99
5.5 Determinants of contractile force amplitude in engineered muscle networks with different pore lengths ......................................................................................................... 100
5.5.1 Derivation of fe and fm .............................................................................................. 103
5.5.2 Element force in engineered muscle networks as a function of post length .. 105
5.5.3 Force per myonucleus in engineered muscle networks as a function of post length…… .......................................................................................................................... 106
5.6 Twitch‐to‐tetanus ratio and twitch kinetics in engineered muscle networks with different pore lengths ......................................................................................................... 114
5.7 Analysis of local deformations and tension‐length relationships in engineered muscle networks with different pore lengths ................................................................. 115
5.7.1 Local deformation analysis during application of uniaxial tissue stretch ...... 116
5.7.2 Passive tension–length relationships ................................................................... 123
5.8 Discussion ...................................................................................................................... 125
5.8.1 Determinants of increased contractile force in engineered muscle networks with longer pores .............................................................................................................. 125
5.8.2 Distinct changes in local strains of bundle and node regions with applied uniaxial macroscopic stretch ........................................................................................... 129
6. Effect of Soluble Mini‐agrin on Force Production of Engineered Muscle Networks .. 131
6.1 Effect of mini‐agrin on contractile force generation of engineered muscle networks .............................................................................................................................. 133
6.2 Effect of mini‐agrin on Ca2+ sensitivity of contractile force .................................... 135
6.3 Effect of mini‐agrin on expression of muscle myosin ............................................. 138
xii
6.4 Effect of mini‐agrin on dystrophin, utrophin, and dystroglycan gene expression ............................................................................................................................................... 140
6.5 Effect of mini‐agrin and altered endogenous acetylcholine level on AChR aggregation .......................................................................................................................... 141
6.6 Effect of autocrine AChR stimulation on spontaneous twitching activity and agrin‐induced change in force production ..................................................................... 145
6.7 Discussion ...................................................................................................................... 150
6.7.1 Agrin‐induced increase in contractile force of engineered muscle networks . 151
6.7.2 Effect of endogenous ACh or ACh‐lc level on agrin‐induced AChR clustering in engineered muscle networks ...................................................................................... 152
6.7.3 Effect of autocrine AChR stimulation on spontaneous twitching activity and contractile force generation in engineered muscle networks ..................................... 153
6.7.4 Potential application of mini‐agrin in the development of tissue engineering therapies for skeletal muscle repair ............................................................................... 155
7. Summary ................................................................................................................................ 157
8. Future Work ........................................................................................................................... 161
Appendix: Protocol for mesoscopic hydrogel molding ....................................................... 165
References .................................................................................................................................. 182
Biography ................................................................................................................................... 200
xiii
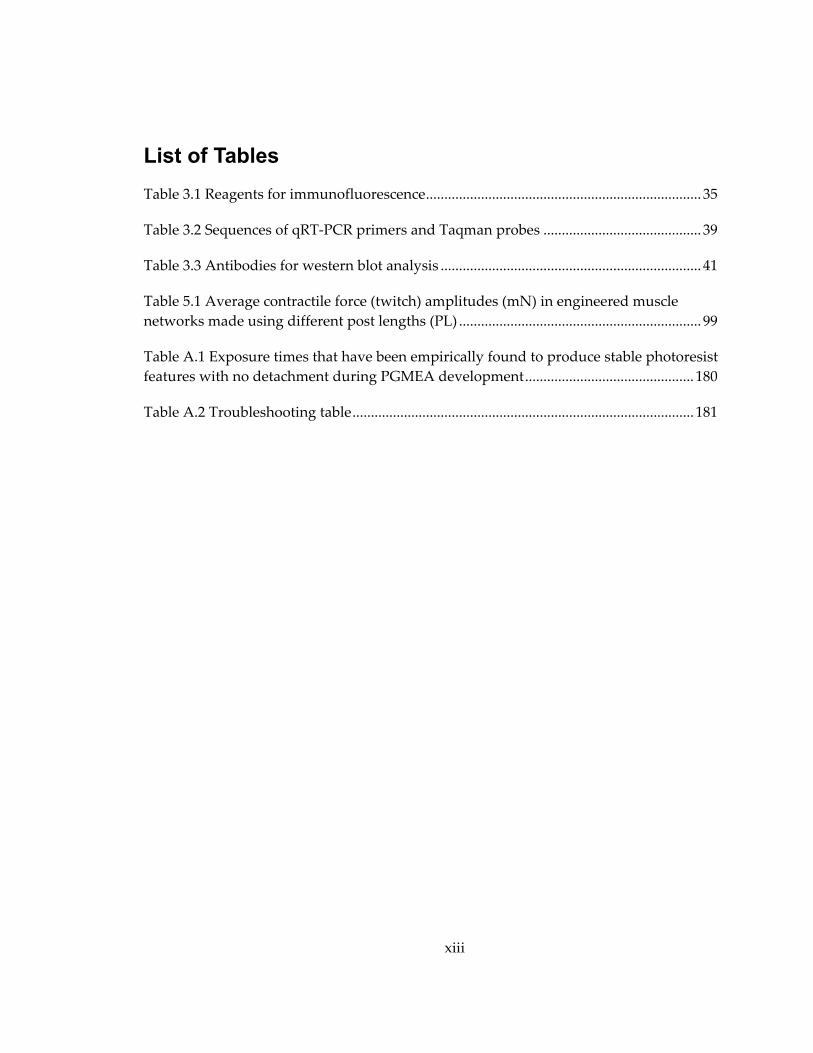
List of Tables Table 3.1 Reagents for immunofluorescence ........................................................................... 35
Table 3.2 Sequences of qRT‐PCR primers and Taqman probes ........................................... 39
Table 3.3 Antibodies for western blot analysis ....................................................................... 41
Table 5.1 Average contractile force (twitch) amplitudes (mN) in engineered muscle networks made using different post lengths (PL) .................................................................. 99
Table A.1 Exposure times that have been empirically found to produce stable photoresist features with no detachment during PGMEA development .............................................. 180
Table A.2 Troubleshooting table ............................................................................................. 181
xiv
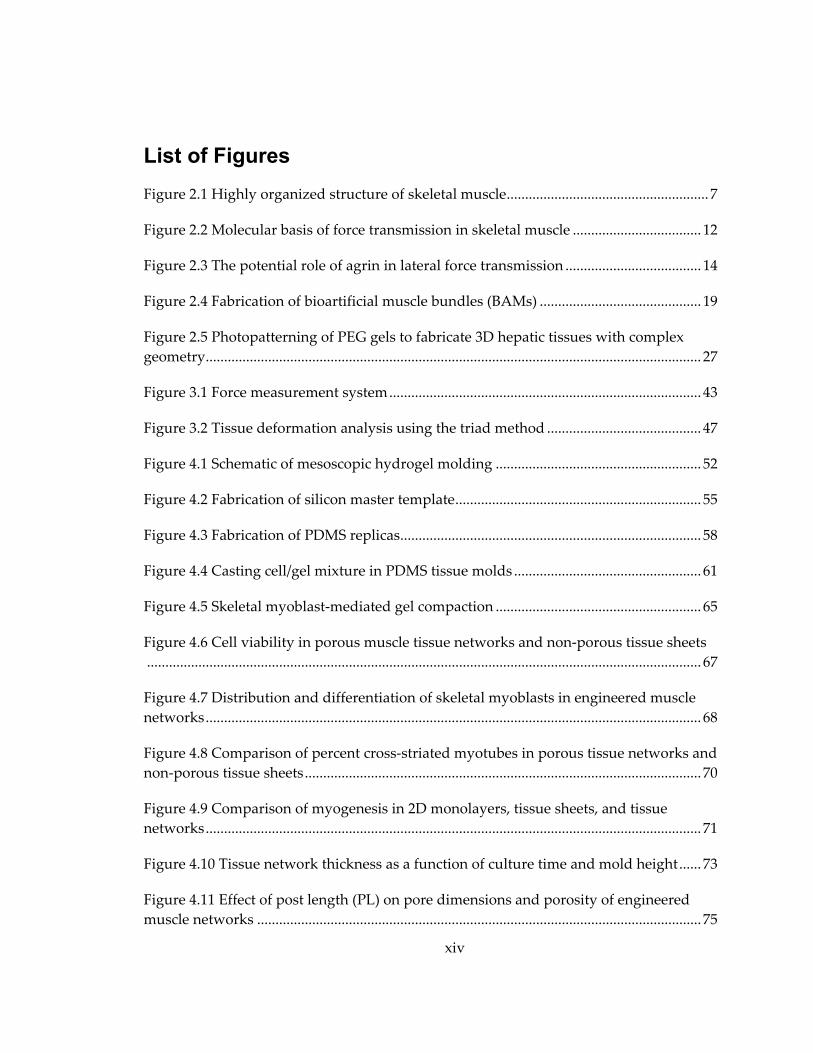
List of Figures Figure 2.1 Highly organized structure of skeletal muscle ....................................................... 7
Figure 2.2 Molecular basis of force transmission in skeletal muscle ................................... 12
Figure 2.3 The potential role of agrin in lateral force transmission ..................................... 14
Figure 2.4 Fabrication of bioartificial muscle bundles (BAMs) ............................................ 19
Figure 2.5 Photopatterning of PEG gels to fabricate 3D hepatic tissues with complex geometry ....................................................................................................................................... 27
Figure 3.1 Force measurement system ..................................................................................... 43
Figure 3.2 Tissue deformation analysis using the triad method .......................................... 47
Figure 4.1 Schematic of mesoscopic hydrogel molding ........................................................ 52
Figure 4.2 Fabrication of silicon master template ................................................................... 55
Figure 4.3 Fabrication of PDMS replicas .................................................................................. 58
Figure 4.4 Casting cell/gel mixture in PDMS tissue molds ................................................... 61
Figure 4.5 Skeletal myoblast‐mediated gel compaction ........................................................ 65
Figure 4.6 Cell viability in porous muscle tissue networks and non‐porous tissue sheets ....................................................................................................................................................... 67
Figure 4.7 Distribution and differentiation of skeletal myoblasts in engineered muscle networks ....................................................................................................................................... 68
Figure 4.8 Comparison of percent cross‐striated myotubes in porous tissue networks and non‐porous tissue sheets ............................................................................................................ 70
Figure 4.9 Comparison of myogenesis in 2D monolayers, tissue sheets, and tissue networks ....................................................................................................................................... 71
Figure 4.10 Tissue network thickness as a function of culture time and mold height ...... 73
Figure 4.11 Effect of post length (PL) on pore dimensions and porosity of engineered muscle networks ......................................................................................................................... 75
xv
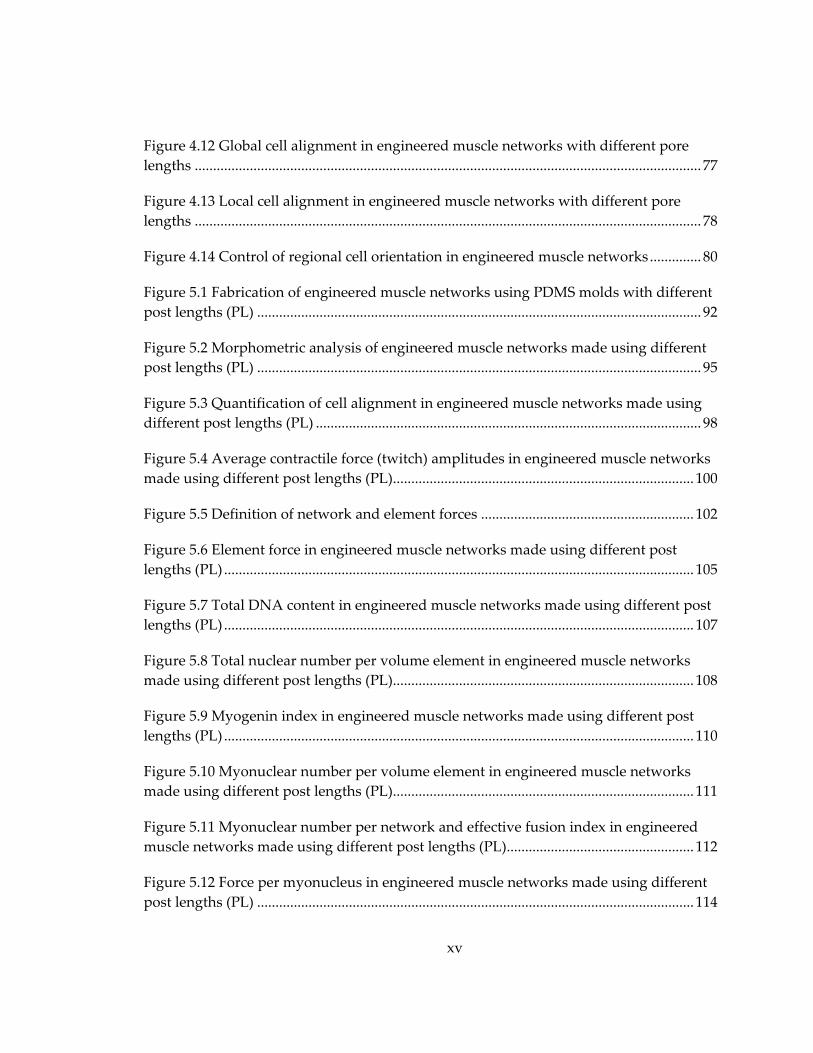
Figure 4.12 Global cell alignment in engineered muscle networks with different pore lengths .......................................................................................................................................... 77
Figure 4.13 Local cell alignment in engineered muscle networks with different pore lengths .......................................................................................................................................... 78
Figure 4.14 Control of regional cell orientation in engineered muscle networks .............. 80
Figure 5.1 Fabrication of engineered muscle networks using PDMS molds with different post lengths (PL) ......................................................................................................................... 92
Figure 5.2 Morphometric analysis of engineered muscle networks made using different post lengths (PL) ......................................................................................................................... 95
Figure 5.3 Quantification of cell alignment in engineered muscle networks made using different post lengths (PL) ......................................................................................................... 98
Figure 5.4 Average contractile force (twitch) amplitudes in engineered muscle networks made using different post lengths (PL) .................................................................................. 100
Figure 5.5 Definition of network and element forces .......................................................... 102
Figure 5.6 Element force in engineered muscle networks made using different post lengths (PL) ................................................................................................................................ 105
Figure 5.7 Total DNA content in engineered muscle networks made using different post lengths (PL) ................................................................................................................................ 107
Figure 5.8 Total nuclear number per volume element in engineered muscle networks made using different post lengths (PL) .................................................................................. 108
Figure 5.9 Myogenin index in engineered muscle networks made using different post lengths (PL) ................................................................................................................................ 110
Figure 5.10 Myonuclear number per volume element in engineered muscle networks made using different post lengths (PL) .................................................................................. 111
Figure 5.11 Myonuclear number per network and effective fusion index in engineered muscle networks made using different post lengths (PL) ................................................... 112
Figure 5.12 Force per myonucleus in engineered muscle networks made using different post lengths (PL) ....................................................................................................................... 114
xvi
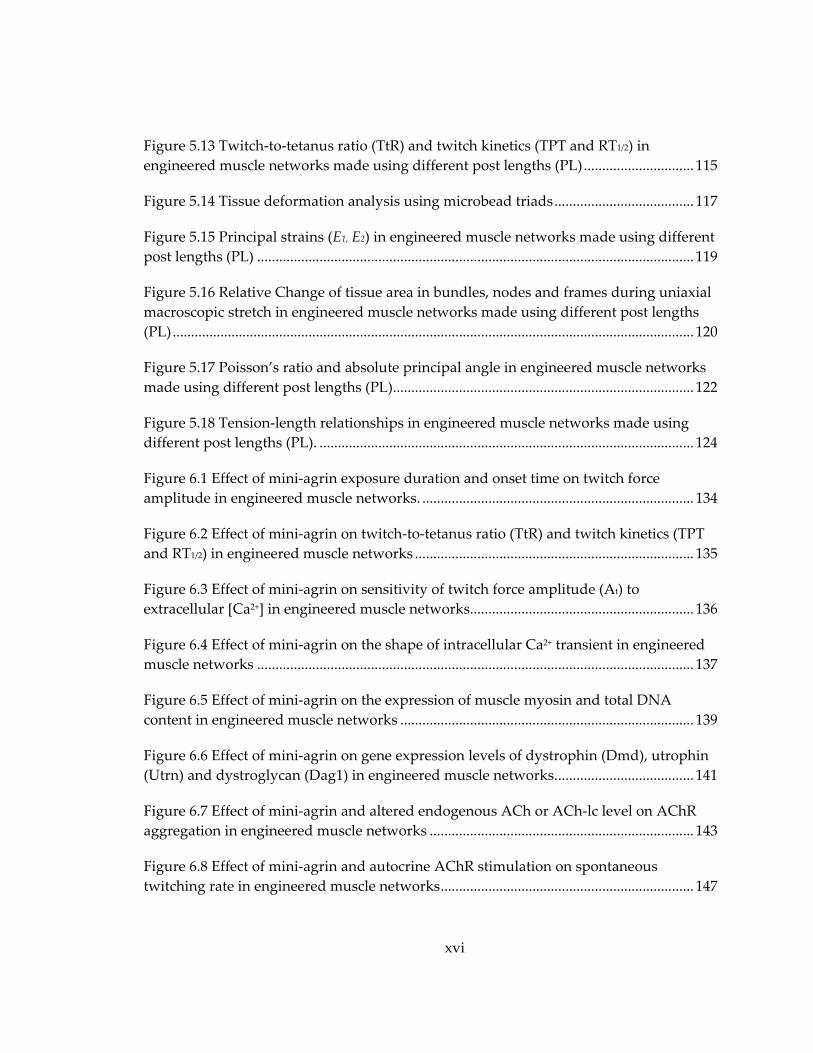
Figure 5.13 Twitch‐to‐tetanus ratio (TtR) and twitch kinetics (TPT and RT1/2) in engineered muscle networks made using different post lengths (PL) .............................. 115
Figure 5.14 Tissue deformation analysis using microbead triads ...................................... 117
Figure 5.15 Principal strains (E1, E2) in engineered muscle networks made using different post lengths (PL) ....................................................................................................................... 119
Figure 5.16 Relative Change of tissue area in bundles, nodes and frames during uniaxial macroscopic stretch in engineered muscle networks made using different post lengths (PL) .............................................................................................................................................. 120
Figure 5.17 Poisson’s ratio and absolute principal angle in engineered muscle networks made using different post lengths (PL) .................................................................................. 122
Figure 5.18 Tension‐length relationships in engineered muscle networks made using different post lengths (PL). ...................................................................................................... 124
Figure 6.1 Effect of mini‐agrin exposure duration and onset time on twitch force amplitude in engineered muscle networks. .......................................................................... 134
Figure 6.2 Effect of mini‐agrin on twitch‐to‐tetanus ratio (TtR) and twitch kinetics (TPT and RT1/2) in engineered muscle networks ............................................................................ 135
Figure 6.3 Effect of mini‐agrin on sensitivity of twitch force amplitude (At) to extracellular [Ca2+] in engineered muscle networks............................................................. 136
Figure 6.4 Effect of mini‐agrin on the shape of intracellular Ca2+ transient in engineered muscle networks ....................................................................................................................... 137
Figure 6.5 Effect of mini‐agrin on the expression of muscle myosin and total DNA content in engineered muscle networks ................................................................................ 139
Figure 6.6 Effect of mini‐agrin on gene expression levels of dystrophin (Dmd), utrophin (Utrn) and dystroglycan (Dag1) in engineered muscle networks. ..................................... 141
Figure 6.7 Effect of mini‐agrin and altered endogenous ACh or ACh‐lc level on AChR aggregation in engineered muscle networks ........................................................................ 143
Figure 6.8 Effect of mini‐agrin and autocrine AChR stimulation on spontaneous twitching rate in engineered muscle networks ..................................................................... 147

xvii
Figure 6.9 Effect of mini‐agrin and autocrine AChR stimulation on twitch force, DNA content, and normalized twitch force in engineered muscle networks ............................ 148
Figure 6.10 Effect of min‐agrin and autocrine AChR stimulation on tetanus‐to‐twitch ratio (TtR) ................................................................................................................................... 149

xviii
Acknowledgements This work might not have been possible without the contributions and kindly
help from these individuals.
First of all, I am deeply indebted to my advisor, Dr. Bursac, for his thoughtful
guidance and constant enthusiasm in my work over the past 5 years. His genuine
scientific curiosity, attention to details and critical reading also helped me to
significantly improve the scientific quality of my work, as well as sharpen my thinking
concerning the design of novel tissue engineering methods to address existing
challenges and learn to write manuscripts in a concise and precise manner.
Then I would like to thank every member of my dissertation committee for their
constructive suggestions of my preliminary proposal and their precious time to read my
over 200 page long thesis in their busy schedules. I want to express my deepest
appreciation to Dr. Dennis for providing me the force transducer, the key component of
the force measurement system I have built, and his technical assistance for trouble
shooting. I also would like to thank Dr. Truskey and Dr. Kraus for their insightful
discussions about tissue deformation analysis and the preliminary results of agrin study.
I would like to thank all the current and previous members in Bursac lab who
have made the atmosphere in the lab joyful and homey. I am truly grateful to Ava Krol,
our lab manager, who always made timely and errorless orders of reagents and supplies
for me, especially those very urgent ones. I also want to thank Rob Kirkton to teach me
xix
the basics of western blot, Woohyun Yoon and Brian Liau for their helpful advice on RT‐
PCR analysis.
In addition, I want to express my highest gratitude to Dr. Hyung‐Suk Kim, the
director of UNC gene expression facility, whose technical expertise in the design of
Taqman‐based quantitative RT‐PCR assay made the gene expression analysis a painless
process. I also would like to thank Sam Johnson, the director of Duke Light Microscopy
Core Facility (LMCF) for his technical assistance of confocal microscopy, Mark Walters
and Kirk Bryson, the staff in Duke Shared Materials Instrumentation Facility (SMIF) for
their technical assistance of microfabrication, and Dr. Farshid Guilak, for allowing me to
use their confocal microscope to take the composite images of my tissue constructs. I am
also grateful to Caroline Rhim for her help to start my very first C2C12 cell cultures.
Finally, I would like to dedicate this thesis to my parents, Yu‐chang Bian and
Chun‐lan Liu. Their continual support and cheerful encouragement always gave me
strength and patience to overcome the tough obstacles I encountered in my Ph.D. study.
1
1. Introduction
Adult skeletal muscle is limited in its self‐repairing ability to restore the
massive tissue loss due to traumatic injuries, congenital defects, tumor ablation,
prolonged denervation or a variety of myopathies such as Duchene muscular
dystrophy (DMD) and spinal muscular atrophy (SMA).[1] Transplantation of
exogenous myogenic cells (satellite cells and myoblasts) has been proposed as an
alternative to current reconstructive therapies such as autologous muscle
transposition.[1, 2] However, the modest clinical outcomes from the
intramusclular injection of allogenic myoblasts due to poor cell retention,
survival and donor‐host integration necessitate the development of more
efficacious transplantation therapies as well as a better understanding of critical
processes that underlie myogenesis and muscle regeneration.
The emergence of tissue engineering technology in the past decade has
enabled the in vitro fabrication of bioartificial muscle constructs with the
potential to recapitulate the structure and function of the native muscle. The
potential benefits of this approach for muscle regeneration therapies include
instant structural repair, prolonged implant survival, and accelerated functional
recovery. In addition, engineered muscle constructs can serve as in vitro 3D tissue
models that complement the conventional 2D cell cultures and small animal
2
models for the basic studies of muscle development, regeneration, and
pathophysiology.
Despite intensive research in the recent years, the current progress in
tissue engineering of functional skeletal muscle is hindered by several technical
challenges including the: 1) lack of reliable methods to uniformly and densely
align muscle cells within a relatively large and thick 3D tissue construct; 2) lack
of effective means to deliver sufficient oxygen and nutrient throughout the thick
construct to match the high metabolic demand of contracting muscle cells and
prevent the formation of a necrotic core[3]; 3) lack of fabrication techniques that
can ensure structural and functional reproducibility of engineered muscle
constructs, an essential requirement for the future off‐the‐shelf supply of
standardized engineered muscle tissues; 4) limited understanding of the roles of
multiple environmental factors (e.g., matrix composition and stiffness[4‐6],
soluble factors[7‐9]) and various types of biophysical stimuli (e.g., mechanical
stretch[10‐13], electrical stimulation[14, 15], neuromotor pulse[16, 17]) in the
proliferation, growth, differentiation, and maturation of myogenic cells.
Thus in this thesis, to advance the current state of the field, I have set to
develop a novel methodology for reproducible engineering of differentiated
skeletal muscle tissues with controllable structure and function. I applied this
3
methodology to further study structure‐function relationships in such
engineered skeletal muscle tissues and explore the potential of specific
neurotrophic factors to improve the force generating capacity of engineered
muscle in vitro. . Relevant background information and a description of these
studies are provided in the remainder of the document as follows.
Chapter 2 presents the relevant knowledge on skeletal muscle biology,
physiology, and pathology with a focus on the processes that underlie muscle
damage and regeneration, force transmission, and the potential roles that agrin, a
specific neurotrophic factor, plays in skeletal muscle differentiation and function.
The current state of skeletal muscle tissue engineering and technical challenges
that hamper its progress to clinical practice are also described in detail. In
addition, the advantages and disadvantages of applying the hydrogel
micropatterning technology to skeletal muscle tissue engineering are reviewed.
The significance of this thesis work is summarized at the end of the chapter.
Chapter 3 describes in detail the materials and methods used in the
skeletal myoblast isolation and culture, as well as structural and functional
assessment of engineered muscle tissue constructs including morphometric and
immunohistological characterization, gene and protein expression analysis,
4
studies of tissue passive and active mechanical properties, and analysis of Ca2+
handling .
Chapter 4 introduces a novel mesoscopic hydrogel molding approach for
the reproducible engineering of relatively large porous skeletal muscle tissue
constructs composed of viable, dense, aligned and differentiated muscle cells.
The ability of this novel tissue engineering methodology to precisely control the
tissue size, thickness and porosity, as well as local and overall myofiber
alignment is demonstrated using different structural and morphometric
assessments.
Chapter 5 presents a detailed analysis of contractile force generation in
engineered skeletal muscle constructs with different pore lengths fabricated
using the mesoscopic hydrogel molding approach. The steady‐state local tissue
deformations (strains) and the passive tension‐tissue length relationship as a
function of pore length are also analyzed during the application of macroscopic
uniaxial stretch.
Chapter 6 focuses on the effect of soluble recombinant mini‐agrin on the
contractile function of the porous skeletal muscle constructs. Different structural
and functional assays including quantitative immunostaining, quantitative RT‐
PCR, western blot analysis, isometric contractile force measurements, and
5
mapping of intracellular Ca2+ transients were utilized to elucidate the underlying
mechanisms of the agrin‐induced change in contractile function of engineered
muscle constructs. The interplay between agrin treatment and altered autocrine
stimulation of acetylcholine receptors has also been investigated with respect to
its effect on contractile function of engineered muscle.
Chapter 7 summarizes the main findings in this thesis.
Chapter 8 suggests the potential directions and future studies to further
improve the structure and function of engineered skeletal muscle constructs
made using the mesoscopic hydrogel molding and discusses the potential
application of this versatile methodology in the engineering of primary or stem
cell‐derived cardiac tissues.
6
2. Background
2.1 Skeletal muscle damage, regeneration, and differentiation
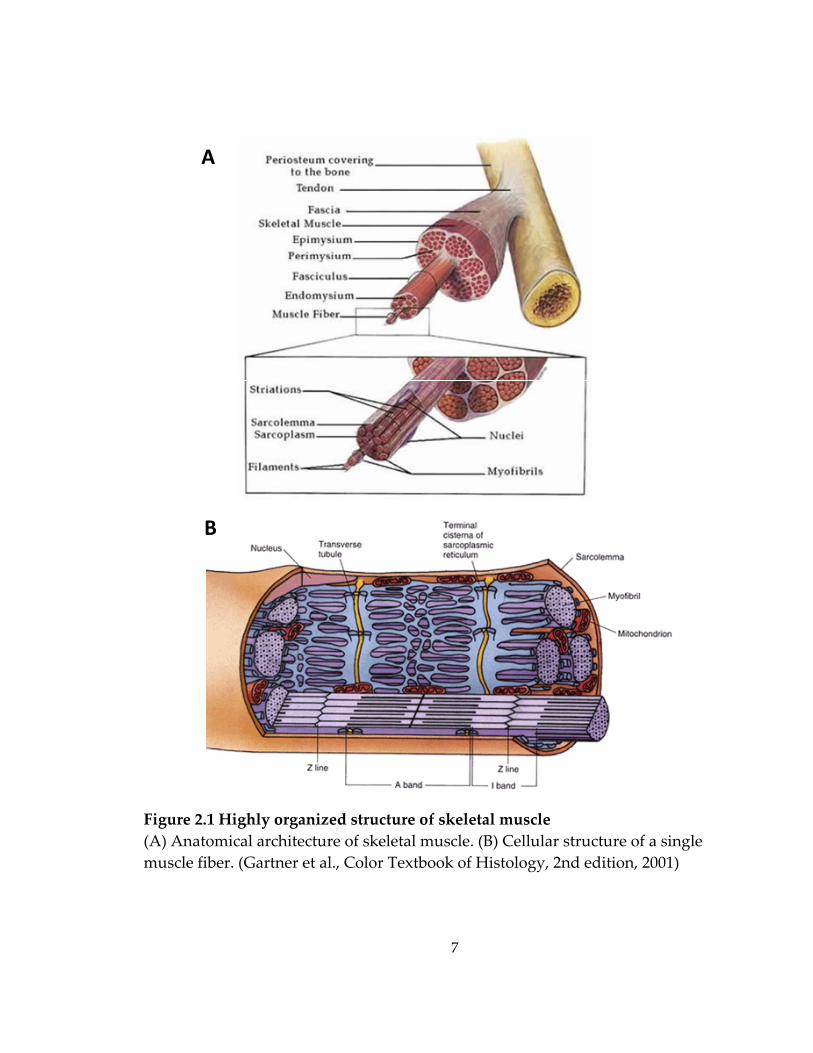
Adult skeletal muscle is composed of highly aligned, densely packed,
multinucleated and cross‐striated muscle fibers (Figure 2.1.A). The striated,
thread‐like myofibrils that occupy the most space within the muscle cell are the
cellular apparatus of muscle contraction and consist of repetitive functional units
that are named sarcomeres. Each sarcomere contains thick filaments made of
myosin and thin filaments made of actin (Figure 2.1.B). The sliding movement of
the thick and thin filaments leads to the shortening and lengthening of the
muscle and the generation of the contractile force.[18, 19]
The damage of skeletal muscle that occurs in a variety of muscular
diseases or injuries can disrupt the sarcomeric organization, membrane integrity,
excitation‐contraction coupling and calcium homeostasis, cause the weakening
and loss of muscle fibers and hence significantly impair muscle function. For
example, Duchene muscular dystrophy (DMD) and spinal muscular atrophy
(SMA) are two commonly seen myopathies resulting in severe muscle loss and
dysfunction. DMD is a lethal inherited muscular disorder caused by the defected
dystrophin gene on the X‐chromosome. The absence or malfunction of
7
Figure 2.1 Highly organized structure of skeletal muscle (A) Anatomical architecture of skeletal muscle. (B) Cellular structure of a single muscle fiber. (Gartner et al., Color Textbook of Histology, 2nd edition, 2001)
A
B
8
dystrophin, a vital protein associated with muscle cell membrane (sarcolemma)
that links the cytoskeleton to the extracellular matrix, causes membrane
destabilization and in turn the necrosis of muscle fibers.[20] The SMA is caused
by the degeneration of motor neurons in the spinal cord. The prolonged
denervation eliminates the positive impact of neuromotor impulses and
neurotrophic factors on the protein synthesis in skeletal muscle and results in
significant loss of muscle mass along with sarcomeric disorganization and
myofibrillar disruption.[21, 22] In addition, severe ischemic injuries to the
skeletal muscle can induce extensive muscle cell death and lead to loss of muscle
mass and function.[23] The significant muscle loss can also result from traumatic
injuries, tumor ablation and congenital defects. Moreover, the loss of muscle
mass and strength can occur during biological aging, in a process known as age‐
related sarcopenia. Multiple factors have been suggested to contribute to skeletal
muscle deterioration in sarcopenia, including reduced protein synthesis,
increased level of apoptosis, as well as decreased cell turnover rate.[24, 25]
The multinucleated muscle fibers in the adult mammalian skeletal muscle
have limited regenerative capability. However, satellite cells, a population of
monocleated muscle precursor cells residing between the basal lamina and
9
sarcolemma of the myofibers, can be activated in response to injury by the factors
released from the damaged myofibers and subsequently undergo a defined
program of proliferation and differentiation to replace the damaged fibers.
Activation of satellite cells causes the hypertrophy of cell organelles, the
expansion of cytoplasm and the change of cell shape. Those activated satellite
cells proliferate and the daughter cells, called myoblasts, express myogenic
transcripton factors (Myf5 and MyoD) and muscle‐specific filament proteins
(desmin).[26] The differentiation of myoblasts into mature multinucleated
myofibers primarily depends on four transcription factors, Myf5, MyoD,
myogenin and Mrf4. They respectively control the major differentiation steps
including cell proliferation, withdrawal from the cell cycle, fusion into existing
myofibers or the formation of new myofibers, and advanced muscle
maturation.[27, 28]
The further maturation of nascent myotubes involves the expression and
assembly of contractile and adhesive proteins participating in force generation
and transmission and the changes in the electromechanical properties of the
maturing myotubes. As the muscle fibers mature, embryonic and neonatal MHC
isoforms are replaced with slow (type I) and/or fast (type IIA, IIB and IIX) adult
isoforms.[29] Dystrophin‐associated protein complex (DAPC) and focal adhesion
10
proteins (e.g., α7 integrins, paxillin, vinculin and talin) are expressed and
assembled at the costameres, myotedinous junctions and intrafascicular fiber
terminations to link the cytoskeleton to the extracellular matrix and transmit
force in both the longitudinal and transverse direction.[30, 31] Furthermore,
mature sarcomeres are formed containing parallel Z‐disks with the attached
thick and thin filaments and well‐defined A, H, I and M bands. Intermediate
filaments anchor to Z‐disks and yield striated desmin patterns. Nuclei flatten,
elongate and migrate to the periphery of myoplasm. Thinner primary fibers fuse
to form thicker secondary fibers.[29] With advance in differentiation, membrane
resting potential of muscle cells hyperpolarizes followed by the increase in
amplitude and upstroke velocity of action potentials as well as the amplitude of
calcium transients.[32, 33] The t‐tubules and sarcoplasmic reticulum
simultaneously mature to form the efficient apparatus for excitation‐contraction
coupling.[34, 35] The diffuse acetylcholine receptors aggregate at the motor end
plates in sarcolemma[16, 36], which leads to the increase in electrical excitability
of the maturing muscle fibers.[22, 37]
2.2 Force transmission in skeletal muscle
The force production capacity of the skeletal muscle depends not only on
the synthesis and function of contractile proteins (myosin and actin) and their
11
ancillaries (tropomyosin and troponin) in sarcomeres, but also on expression and
assembly of proteins involved in force transmission from a single muscle fiber to
the entire tissue. In general, multiple force transmission trajectories exist in
skeletal muscles, all of which can be categorized into the two systems,
longitudinal and lateral.[30, 38] The longitudinal force transmission primarily
occurs either at the myotendinous junctions (MTJ) in ‘spanning myo‐fibered’
muscles with all the muscle fibers spanning the full length of the fascicle[38], or
at the intrafascicular fiber terminations (IFT) in ‘in series myo‐fibered’ muscles
with overlapping myofibers ending within the length of the fascicle and not
extending from one bony or tendinous attachment site to the other [38, 39]. On
the other hand, numerous experimental studies suggest that among parallel
muscle fibers, active force can also be transmitted transversely from intracellular
sarcomeres to the extracellular collagen/laminin network through costameres, a
sub‐sarcolemmal unit linking the Z‐disks to the sarcolemma.[30, 40] The
underlying molecular basis of force transmission involves two major cell‐matrix
adhesion protein assemblies, the dystrophin‐associated protein complex (DAPC)
and the vinculin/talin/integrin complex (Figure 2.2).[40, 41] In particular, the
main components of DAPC are dystrophin, α‐ and β‐dystroglycan, sarcoglycan,
sarcospan and syntrophin.[42] These two protein systems usually colocalize at
12
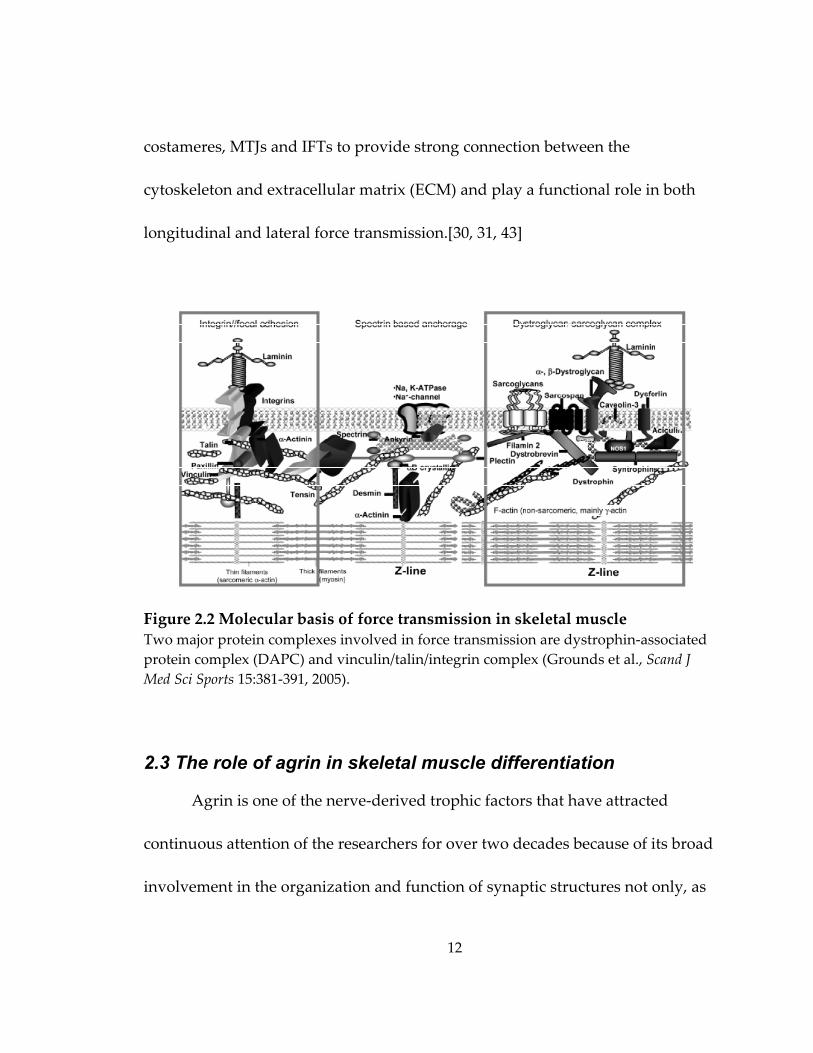
costameres, MTJs and IFTs to provide strong connection between the
cytoskeleton and extracellular matrix (ECM) and play a functional role in both
longitudinal and lateral force transmission.[30, 31, 43]
Figure 2.2 Molecular basis of force transmission in skeletal muscle Two major protein complexes involved in force transmission are dystrophin‐associated protein complex (DAPC) and vinculin/talin/integrin complex (Grounds et al., Scand J Med Sci Sports 15:381‐391, 2005).
2.3 The role of agrin in skeletal muscle differentiation
Agrin is one of the nerve‐derived trophic factors that have attracted
continuous attention of the researchers for over two decades because of its broad
involvement in the organization and function of synaptic structures not only, as
13
is well known, in the neuromuscular system and central nervous system but also,
as recently revealed, in the immune system.[44] In skeletal muscle, agrin plays a
crucial role in the postsynaptic differentiation at the neuromuscular junction
(NMJ), and in particular, the formation and stabilization of acetylcholine receptor
(AChR) clusters.[44] Specially, agrin can bind the muscle‐specific kinase (MuSK)
and trigger tyrosine phosphorylation of the cytoplasmic domain of MuSK. The
phosphorylated MuSK then activates several downstream proteins including
rapsyn, Src‐family kinase and AChR β subunit that are involved in AChR
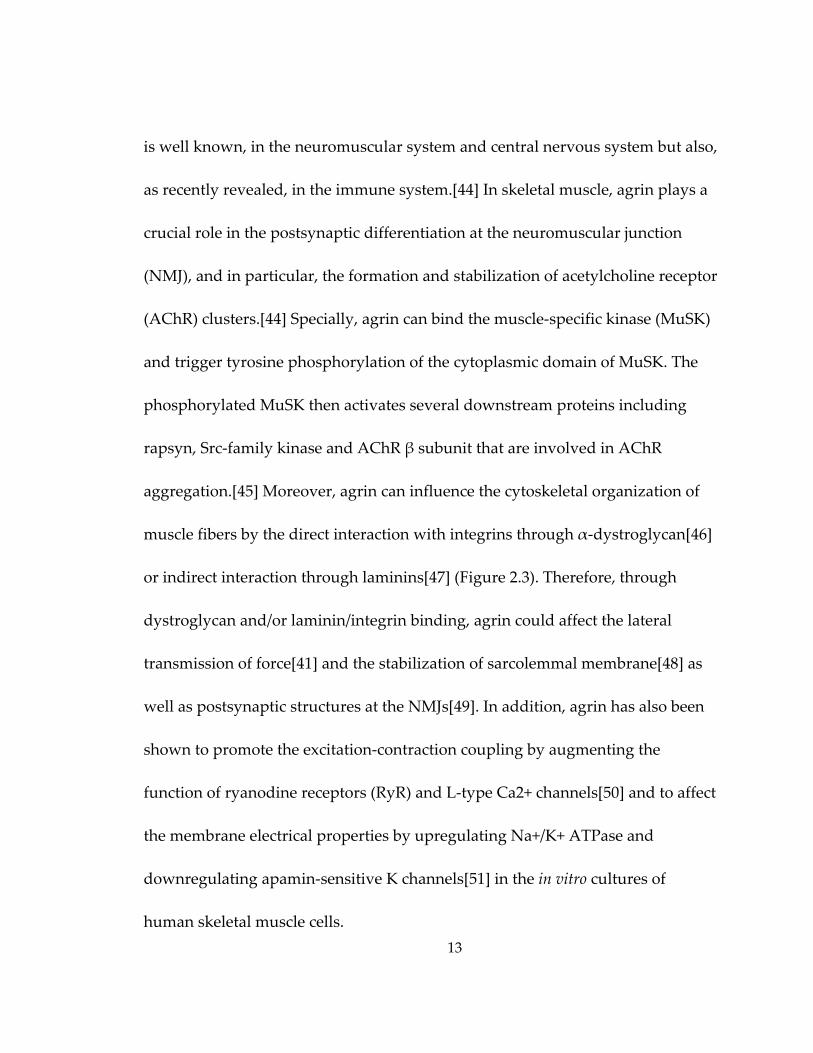
aggregation.[45] Moreover, agrin can influence the cytoskeletal organization of
muscle fibers by the direct interaction with integrins through α‐dystroglycan[46]
or indirect interaction through laminins[47] (Figure 2.3). Therefore, through
dystroglycan and/or laminin/integrin binding, agrin could affect the lateral
transmission of force[41] and the stabilization of sarcolemmal membrane[48] as
well as postsynaptic structures at the NMJs[49]. In addition, agrin has also been
shown to promote the excitation‐contraction coupling by augmenting the
function of ryanodine receptors (RyR) and L‐type Ca2+ channels[50] and to affect
the membrane electrical properties by upregulating Na+/K+ ATPase and
downregulating apamin‐sensitive K channels[51] in the in vitro cultures of
human skeletal muscle cells.
14
Figure 2.3 The potential role of agrin in lateral force transmission Agrin interacts with the dystrophin‐associated protein complex (DAPC) and vinculin/talin/integrin complex, both of which are involved in force transmission of skeletal muscle. (Bezakova et al., Nat Rev Mol Cell Biol 4:295‐308, 2003)
2.4 Current strategies for skeletal muscle repair
Despite the existence of satellite cells that are capable of regeneration,
their incidence in skeletal muscle is low (1‐ 5%) and dependent on age and
muscle fiber composition.[52] Hence the endogenous population of satellite cells
is often insufficient to replace the large number of necrotic muscle fibers and
restore the function of the failing muscle due to severe muscular diseases or
injuries. Currently, autologous muscle transposition and myoblast
15
transplantation are two proposed treatment strategies to reconstruct the
damaged muscle tissue.
2.4.1 Autologous muscle transposition
Autologous muscle transposition is a common surgical intervention for
functional and aesthetic reconstruction of the lost muscle tissue. Healthy muscle
tissue is transferred from the local or distant sites to the injury area to repair the
muscle damage. However, this technique has only yielded modest clinical
outcomes due to a number of limitations. Specifically, the adverse environment
at the injury site often compromises the function of the transferred healthy
muscle tissue, while, simultaneously, the donor site can suffer from significant
morbidity which further leads to muscle volume deficiency and loss of
function.[1]
2.4.2 Myoblast transplantation
Myoblast transplantation therapy (MTT) has been proposed as a
promising treatment for muscular dystrophies on the basis of the encouraging
findings obtained in the mdx mouse model of DMD, where intramuscular
injection of normal myoblasts restored the dystrophin expression and increased
muscle strength.[53] However, the following clinical trials of MTT only yielded
minimal therapeutic benefits due to the immediate massive cell death following
16
injection, poor dispersion of the injected cells and immunorejection of the
allogenic myoblasts.[54] Despite a challenging task for medical researchers to
improve clinical efficacy of MTT for DMD treatment, MTT has been suggested in
recent clinical trials to be more feasible for localized repair of diseased skeletal
muscle caused by Oculo‐Pharyngeal Muscular Dystrophy (OPMD) and Fascio‐
Scapulo‐Humeral Muscular Dystrophy (FSHD).[55] The autologous myoblasts
isolated from the muscle spared by the disease have been shown to have
comparable growth and differentiation characteristics to the myoblasts from
muscles of healthy donors and were injected into the dystrophied muscle to
facilitate the muscle regeneration.[55, 56] The use of autologous myoblasts
prevents the adverse immune response but the low survival rate and poor
spread of the injected cells still remain unresolved.
2.5 Skeletal muscle tissue engineering
The emergence of tissue engineering technology in the past two decades
provides an alternative approach to the transplantation of exogenous cells into
the host tissue by using biocompatible materials as cell carries.[57] The favorable
microenvironment created within the tissue engineering constructs could
promote cell survival upon implantation by protecting donor cells from the
17
harsh environment of the host. The use of tissue engineering constructs is also
expected to allow the implantation of a large number of cells and localized cell
distribution at the engraftment site.[58‐61]
In addition, in vitro engineering of functional mature skeletal muscle
tissues could bring several unique advantages that would lead to future effective
treatment of specific muscular disorders or injuries, such as traumatic injury or
congenital defects (e.g., herniated diaphragm). These advantages are: 1) the
ability to preengineer custom tissue architecture for precise structural repair at
the site of injury; 2) the ability to precondition engineered tissue constructs for
specific mechanically or metabolically demanding host environment; and 3)
localized delivery of concentrated angiogenic and anti‐apoptotic paracrine
factors upon implantation.[62]
2.5.1 Ideal properties of engineered skeletal muscle tissues
The engineered skeletal muscle tissue is expected to have several ideal
structural and functional properties in order to effectively restore the lost muscle
function.[62]
Structurally, from a biomimetic perspective, the engineered skeletal
muscle tissue should: 1) be adequately large and thick, 2) consist of densely
packed and highly differentiated muscle fibers, and 3) mimic the aligned
18
architecture of native muscle. These structural characteristics would ideally
provide sufficient and appropriately distributed active forces to directly augment
the contractile function of the host muscle.
Functionally, aside from the adequate force production capacity, the
engineered skeletal muscle tissue needs to be rapidly vascularized and
innervated to promote long‐term survival and functional donor‐host integration
upon implantation. Neovascularization could prevent hypoxia‐induced cell
damage particularly in thick tissue grafts after implantation while innervation
would connect the engineered muscle to the host neuromuscular system and
further accelerate the functional recovery of the host muscle.
2.5.2 Current state of the field
Intensive research efforts have been undertaken in recent years to achieve
the aforementioned structural and functional properties of the engineered
skeletal muscle.
The high density and alignment of muscle cells were previously
attempted by constraining cell growth within thin and long muscle bundles by:
1) centrifugal packing in cylindrically shaped collagen gels[63], 2) casting a
mixture of skeletal muscle cells, collagen and Matrigel in cylindrical tissue
molds[12] (Figure 2.4.A1‐2), or 3) self‐organization of cells in scaffold‐free
19
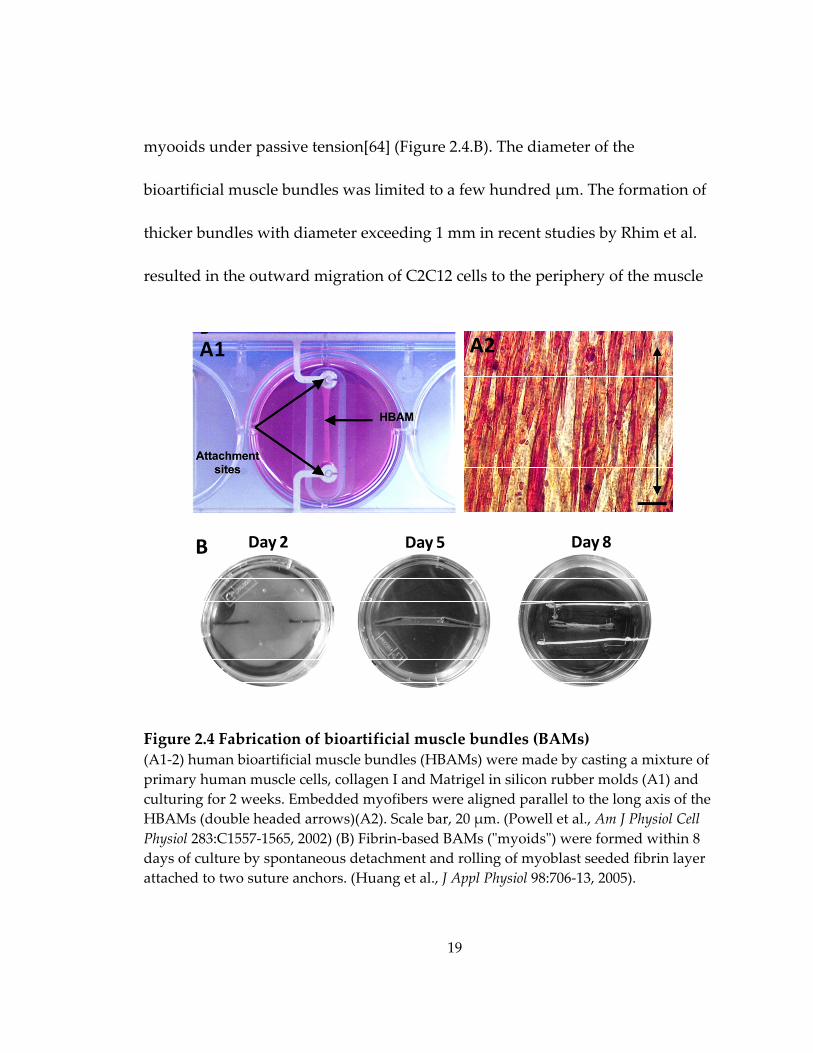
myooids under passive tension[64] (Figure 2.4.B). The diameter of the
bioartificial muscle bundles was limited to a few hundred μm. The formation of
thicker bundles with diameter exceeding 1 mm in recent studies by Rhim et al.
resulted in the outward migration of C2C12 cells to the periphery of the muscle
Figure 2.4 Fabrication of bioartificial muscle bundles (BAMs) (A1‐2) human bioartificial muscle bundles (HBAMs) were made by casting a mixture of primary human muscle cells, collagen I and Matrigel in silicon rubber molds (A1) and culturing for 2 weeks. Embedded myofibers were aligned parallel to the long axis of the HBAMs (double headed arrows)(A2). Scale bar, 20 μm. (Powell et al., Am J Physiol Cell Physiol 283:C1557‐1565, 2002) (B) Fibrin‐based BAMs (ʺmyoidsʺ) were formed within 8 days of culture by spontaneous detachment and rolling of myoblast seeded fibrin layer attached to two suture anchors. (Huang et al., J Appl Physiol 98:706‐13, 2005).
A1 A2
B Day 2 Day 5 Day 8
20
bundle and the formation of a relatively acellular core, likely due to the limited
oxygen and nutrient transport to the center of the muscle bundle.[65] Recently,
aligned porous structures have been fabricated using relatively thick (2 ‐ 2.5mm)
polymeric scaffolds made of collagen[66] or poly(lactic‐co‐glycolic) acid[67] in an
attempt to orient muscle cells throughout a relatively large volume.
In order to augment the force generating capability of the engineered
skeletal muscle, static and cyclic mechanical stretch have been extensively
investigated for their impact on muscle cell growth and differentiation. Previous
studies using either 2D cultures or excised mature muscle show that cyclic
strains of lower magnitude (<10%) enhances differentiation over proliferation,
while strains of higher magnitude (>15%) inverted this pattern[10, 11, 13]. In
addition, strains of even higher magnitude (>20%) or high strain rates may
damage the muscle[68‐70], reduce power output and stimulate additional
proliferation to induce a repair response[71, 72]. In 3D engineered skeletal muscle
constructs, application of chronic passive tension has been shown to regulate 3D
cell spreading in a collagen matrix[73] and, when applied uniaxially, facilitate the
alignment and fusion of myoblasts into multinucleated myotubes[74, 75].
Applying specific patterns of mechanical stretch also increased the force
21
production of engineered muscle by increasing myofiber diameter and
density[12, 73].
Furthermore, a number of promising approaches have been proposed to
promote the vascularization and innervation of engineered skeletal muscle. For
example, coculture of C2C12 myblasts, embryonic fibroblasts and endothelial
cells on highly porous and biodegradable polymer scaffolds resulted in the
formation of endothelial networks within the engineered muscle constructs in
vitro and enhanced vascularization, blood perfusion and survival of the tissue
grafts in vivo.[76] Other methods for vascularization include the formation of
engineered muscle tissue with or around the in vivo perfusion systems such as
the arterio‐venous loop or femoral artery.[77, 78] On the other hand, coculturing
muscle constructs with nerve cells[16, 17] or inducing construct neurotization
using transected nerves[79] not only enhanced the differentiation and force
production of muscle cells but also yielded the formation of acetylcholine‐
sensitive neuromuscular junctions which might facilitate the integration of
engrafted tissue constructs into the host neuromuscular system upon
implantation.
22
2.5.3 Challenges and opportunities in the field
A number of challenges in the field of skeletal muscle tissue engineering
currently hamper the development of clinically useful tissue engineering
therapies for the treatment of muscular disease and injury. First, reliable methods
to uniformly and densely align muscle cells within a relatively large and thick 3D
tissue construct are still lacking. Second, the present tissue engineering methods
cannot provide sufficient oxygen and nutrient supply to match the high
metabolic demand within the thick contractile muscle tissue and prevent the
formation of a necrotic core.[3] Third, the existing methodologies lack the
structural and functional reproducibility that is essential for the future off‐the‐
shelf supply of standardized engineered muscle tissues. The use of naturally
derived hydrogels (e.g., collagen[12, 63] and fibrin[17, 64]) as the scaffolding
materials may offer means to overcome this specific technical limitation by
allowing spatially uniform and dense cell entrapment[80], significant cell
spreading, higher ultimate cell density due to cell‐ mediated gel compaction[6,
81] and control of cell alignment through the application of geometrical
constraints or mechanical tension[82, 83].
Furthermore, while the previous studies suggest the beneficial effect of
specific regimes of mechanical stretch on growth, differentiation and force
23
production of engineered muscle[12, 13], the potential of electrical stimulation,
biochemical microenvironment, tissue structure, matrix stiffness and cell‐matrix
interactions to promote the formation of 3D functional skeletal muscle deserve
further investigations. In particular, the application of electrical stimulation to 2D
myoblast cultures has been shown to facilitate sarcomere assembly and myofiber
maturation through induced electrical activity[14, 15] However, whether
electrical stimulation can promote the differentiation and maturation of 3D
engineered skeletal muscle remains unknown. Similarly, optimal myotube
differentiation has been demonstrated to occur on 2D substrates with mechanical
stiffness similar to that of native muscle[4], but a clear understanding of how to
translate the concept of 2D substrate stiffness into a 3D tissue environment has
started to emerge only recently[5, 84]. Moreover, the addition of insulin‐like
growth factor I (IGF‐1) to cell culture media has been shown to promote the
differentiation, hypertrophy and force generation of tissue‐engineered muscle.[7‐
9],12 Nevertheless, more research efforts are needed to identify different growth
factors, cytokines and genes (or a combinations of these molecules) that can be
incorporated into tissue engineering scaffolds and released in the cell vicinity in
a temporally controlled and spatially uniform fashion to regulate myogenesis in
a 3D environment. In addition, the smaller myofiber size and density within the
24
engineered muscle, relative to those found in native muscle, are likely to amplify
the role of cell‐matrix interaction in force generation and transmission.[30]
Therefore, it is important to extend our limited understanding of the biochemical
and physical factors that regulate the expression and assembly of
dystrophin/dystrophin‐associated protein complex (DAPC) and
vinculin/talin/integrin complex, the two major protein complexes that link the
cytoskeleton to the extracellular matrix in 3D tissue‐engineered skeletal muscle.
Furthermore, while several promising approaches have been developed to
enhance the in vitro vascularization of the engineered muscle[76‐78], the in vivo
implantation outcomes might still be compromised by the poor integration of
tissue grafts into the host vascular system. The addition of angiogenic factors,
either by genetic alteration of donor cells[85, 86] or by controlled release from
bioactive scaffolds[87], may promote the neovascularization after implantation
and facilitate the long‐term survival and functioning of the engineered tissue
grafts. Moreover, although the cocultured nerve‐muscle constructs show
improved differentiation and force production, the underlying mechanisms of
improvement need to be elucidated by separating the two major players, the
neuromotor impulse and neurotrophic factors. The coculture of engineered
muscle tissues with nerve cells has several limitations, including demanding
25
culture conditions for live nerve explants and, upon implantation, the potential
difficulty in connecting donor nerves from the neuromusclular tissue grafts to
the host neural system. If the neurotrophic factors could be identified that exert
similar beneficial effects on engineered muscle function to those from nerve
explants (with or without simultaneous electrical stimulation), there would be no
need for use of the nerve‐muscle cocultures. Future implantation studies will be
able to reveal the potential benefits that the cocultured or neurotrophic factor‐
treated constructs may have to in vivo innervation and functional integration of
engineered muscle tissues.
2.6 Hydrogel micropatterning
The use of naturally derived hydrogels (e.g., collagen[12, 63] and fibrin[17,
64]) as the scaffolding material for skeletal muscle tissue engineering has
numerous advantages including: spatially uniform and dense cell
entrapment[80], significant cell spreading, higher ultimate cell density due to
cell‐ mediated gel compaction[6, 81], support of macroscopic contractions, and
control of cell alignment through the application of geometrical constraints or
mechanical tension[82, 83]. On the other hand, one of the major disadvantages
for hydrogels has been a difficulty to fabricate cell/gel tissue constructs with
arbitrary 3D geometry. The emerging field of rapid prototyping presents the
26
possibility to reproducibly control the 3D hydrogel shape, assemble obtained 3D
objects in a layer‐by‐layer fashion, and fabricate complex tissue structures with
high accuracy and repeatability using computer‐aided design.[80, 88, 89]
Cell/hydrogel patterning has been recently used as a simplified version of rapid
prototyping to produce controllable hydrogel geometry in a number of proof‐of‐
concept studies. This approach allows direct and reproducible confinement of
live cells in predefined spatially discrete locations in 3D to facilitate the
formation of desired tissue organization. For example, the groups of Tien[90],
Desai[91] and others[92, 93] demonstrated that photo‐ and soft‐lithographic
patterning of hydrogels can provide control over gel thickness as well as micro‐
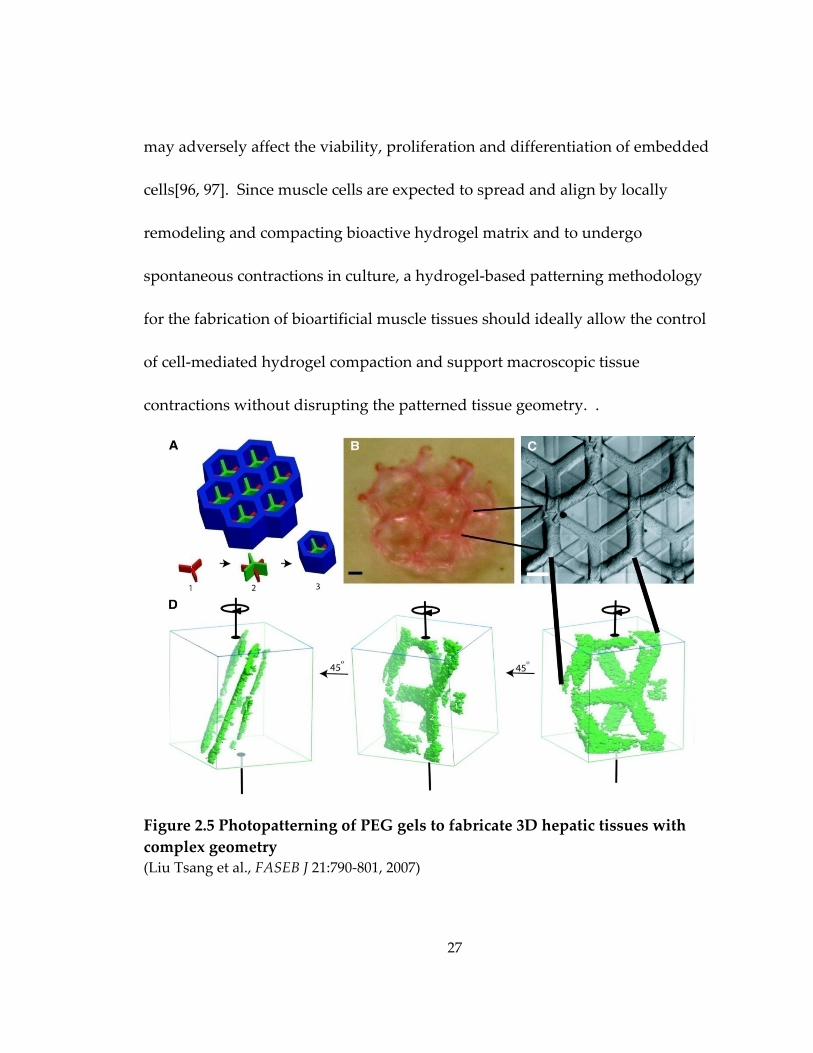
and macroscopic 3D architecture. Moreover, Tang et al.[90] and Tsang et al.[92]
(Figure 2.5) demonstrated the feasibility of stacking the free‐standing patterned
gels into thicker 3D tissue structures. Compared to soft‐lithography that
involves the use of biocompatible elastomer, polydimethylsiloxane (PDMS)[94],
photo‐lithographical patterning has some limitations for the application in
muscle tissue engineering such as : 1) the photocrosslinkable hydrogels are
synthetic[92] or chemically modified naturally‐derived materials[95] that often
possess limited ability to support muscle cell spreading and growth; 2) the use of
photosensitive crosslinkers and ultraviolet radiation for hydrogel polymerization
27
may adversely affect the viability, proliferation and differentiation of embedded
cells[96, 97]. Since muscle cells are expected to spread and align by locally
remodeling and compacting bioactive hydrogel matrix and to undergo
spontaneous contractions in culture, a hydrogel‐based patterning methodology
for the fabrication of bioartificial muscle tissues should ideally allow the control
of cell‐mediated hydrogel compaction and support macroscopic tissue
contractions without disrupting the patterned tissue geometry. .
Figure 2.5 Photopatterning of PEG gels to fabricate 3D hepatic tissues with complex geometry (Liu Tsang et al., FASEB J 21:790‐801, 2007)
28
2.7 Significance
The in vitro engineering of functional skeletal muscle substitutes for
potential therapeutic applications is still a daunting task due to 1) the inability to
engineer relatively large and thick muscle tissues composed of dense, aligned
and differentiated myofibers and 2) the limited understanding of the factors that
can promote muscle cell growth, differentiation, and force production within a
3D environment of engineered muscle. To address these two issues, my Ph.D.
dissertation project was aimed to: 1) develop a novel reproducible fabrication
method to obtain porous, relatively large and thick skeletal muscle constructs
consisting of viable, dense, aligned and differentiated skeletal muscle fibers, 2)
characterize the potential of this methodology to control the tissue organization
and functionality of the engineered muscle constructs, and 3) investigate the role
of selected factors in the function of engineered muscle with a specific focus on
the impact of cell alignment, cell‐mediated gel compaction, and neurotrophic
factors on the tissue active and passive mechanical properties. This work is
expected to 1) establish a novel enabling technology for the engineering of
functional skeletal and other muscle tissues and 2) expand our knowledge of the
factors controlling myogenesis and force production in 3D engineered muscle.
29
3. Materials and Methods
3.1 Isolation of neonatal rat skeletal myoblasts
Neonatal rat skeletal myoblasts (NRSKMs) were isolated as described by
De Deyne[14]. Briefly, muscle tissue from the lower hindlimbs of 2~3 day old
Sprague‐Dawley rats was dissected, separated from bones and connective tissue,
minced into a coarse slurry, pooled in a 60mm dish and treated with 1mg/ml
collagenase (Worthington) in Wyles solution (137mM NaCl, 5mM KCl, 21mM
HEPES, 0.7mM Na2HPO4, 100mM glucose, and 0.1 mg/ml BSA) for 2 hrs at 37°C.
The slurry was passed through a 40μm strainer (BD), centrifuged, resuspended
in growth medium (DMEM, 10% (vol/vol) fetal bovine serum, 50 unit/mL
penicillin G, 50 μg/mL streptomycin, 5 μg/mL gentamicin) and preplated for 30
min at 37°C to reduce the portion of fibroblasts and obtain an enriched myoblast
population. The average cell yield was 12.8 ± 3.4 million cells/pup. Myoblasts
identified as MyoD positive cells comprised 79.9 ± 8.0% of the total cell
population. The freshly isolated cells were either plated on coverslips at a density
of 0.6×10⁶ cells/cm2 for monolayer cultures or mixed with hydrogels to form
engineered tissue constructs. All experiments involving animals were conformed
to the protocols in the Guide for the Care and Use of Laboratory Animals (NIH
30
Publication No. 85‐23, Revised 1996) and the animal protocol was approved by
Duke Animal Care and Use Committee.
3.2 Culture of C2C12 myoblasts
Murine C2C12 myoblasts (< 4 passages; American Type Culture
Collection, Manassas, VA) were maintained at below 70% confluence in growth
medium containing DMEM (American Type Culture Collection), 10% fetal
bovine serum (Gibco) and 1% penicillin‐streptomycin (Gibco).
3.3 Floating disc assay for quantification of gel compaction
Two hundred μL of gel solution (with collagen:fibrin volume ratios of 1:0,
3:1, 1:1, 1:3, or 0:1) containing 5×10⁶ Cell Tracker Green (Molecular probes)
labeled C2C12 myoblasts per ml of gel were allowed to polymerize inside the
wells of a 24‐well plate previously coated with 0.2% pluronic F‐127 and rinsed
with PBS. The diameters of the resulting free‐floating discs (relative to the well
size) were measured daily starting from culture day 0 (7 hrs after gelation) to day
10 using a fluorescence microscope (Eclipse TE 2000E, Nikon), a cooled CCD
camera (Sensicam QE, Cooke Corp.) and IPLab software (Scanalytics).

31
3.4 Morphometric assessment of tissue constructs
3.4.1 Measurement of tissue thickness
Three‐dimensional video‐rate optical coherence tomography (OCT)[98]
was used to non‐invasively acquire volume images of the same tissue construct
on culture days 1, 4, 6, 9, 11 and 15. Tissue thickness was measured by averaging
multiple OCT cross‐sections of the sample using ImageJ software (NIH). The
obtained values were expressed relative to the height of the PDMS mold to
quantify the decrease in tissue thickness with culture time due to cell‐mediated
gel compaction.
3.4.2 Measurement of pore dimensions, bundle width and porosity
Pore dimensions, tissue bundle width and tissue porosity were measured
using 2 sets of images: 1) phase contrast microscopic images of fresh tissue
constructs within PDMS molds (4x magnification) taken by a CCD camera
(Sensicam QE); The 4x field of view only captures part of the tissue construct; 2)
composite confocal microscopic images (2.5x magnification) of F‐actin in fixed
tissue constructs (stained with Alexa488‐conjugated phalloidin, Invitrogen). The
field of view in composite image encompassed the entire tissue construct.
The maximum length and width of individual pores (pl: pore length; pw:
pore width) and the minimum width of the tissue bundles (bw: bundle width)
32
were measured in both sets of microscopic images using ImageJ software. Pore
elongation was defined as pl/pw.
Tissue porosity was directly determined by calculating the ratio of
acellular area to the total area in the composite confocal F‐actin images of the
entire tissue construct. In the 4x phase contrast images that contained part of the
tissue construct, since the entire tissue construct was composed of repeating
identical rectangular subunits, the overall tissue porosity was determined by
averaging the ratio of the acellular area to the total area in 3 representative
subunits of each tissue construct. Image analysis was performed using Matlab
(Mathworks).
The initial pore dimensions (pl and pw), pore elongation (pl/pw), bundle
width (bw), and tissue porosity prior to gel compaction were analogously
derived from the corresponding photomask patterns.
3.4.3 Estimation of tissue volume
The total tissue volume of a tissue construct was estimated as (total area ×
porosity × average thickness). The total area and porosity was obtained from the
analysis of composite confocal F‐actin images of the entire tissue construct. The
tissue thickness was determined by OCT measurement as described in section
3.4.1.
33
3.5 Cell viability
Tissue constructs were washed with PBS and incubated with agitation for
30min at 37°C in DMEM medium containing 5μM SYTO13 green nuclear stain
(Molecular probes) to label all cells and 4μM ethidium homodimer‐1 (EthD‐1,
Molecular probes) red nuclear stain to label dead cells. Confocal microscopic
images of the stained cell nuclei at a tissue depth of 40μm were analyzed using a
nuclei counting algorithm written in Matlab (Mathworks) to determine the cell
viability (i.e., (total number ‐ number of dead)/total number of cells).
3.6 Histological assessment
For conventional histology, tissue constructs were fixed in formalin at 4°C
overnight, dehydrated in ethanol, embedded in paraffin, sectioned into 10μm
sections and stained with hematoxylin and eosin (H&E)[99]. Alternatively, tissue
constructs were fixed with 4% formaldehyde (Electron Microscopy Sciences) for
20 min at room temperature with agitation, soaked in sucrose solutions of
increasing concentration, embedded in O.C.T. medium (Tissue‐Tek) on dry ice,
cryosectioned into 20μm sections and immunostained with FITC‐conjugated
phalloidin (Sigma) and DAPI (Sigma).
34
3.7 Quantitative immunofluorescence assessment
3.7.1 Immunostaining procedure
Tissue constructs were fixed with 4% formaldehyde for 2 hrs at 4°C with
agitation. Cell monolayers were fixed with 2% formaldehyde for 10 min at room
temperature. Cells were then permeabilized with 0.1% Triton‐X, blocked with
20% chicken serum in 1% bovine serum albumin (BSA, Sigma), incubated with
primary antibodies (Table 3.1) for 1 hr at room temperature (monolayers) or
overnight at 4°C with agitation (tissue constructs). Secondary antibodies (Table
3.1) were then applied together with a nuclear dye (DAPI or PI) or fluophore‐
conjugated phalloidin (Table 3.1) for 1 hr (monolayers) or 2 ‐ 3 hrs with agitation
(tissue constructs) at room temperature[62, 100]. Images were acquired using a
fluorescence microscope (Eclipse TE 2000E) or a Zeiss confocal microscope
(LSM510, Carl Zeiss MicroImaging Inc.).
35
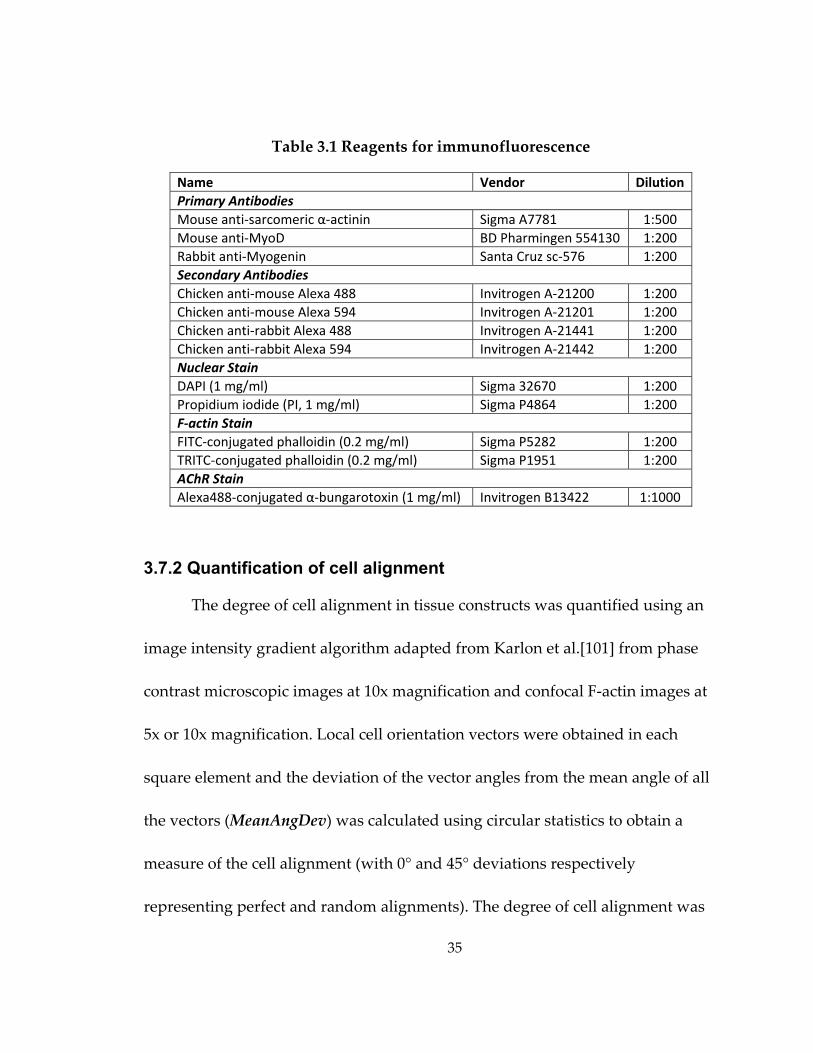
Table 3.1 Reagents for immunofluorescence
Name Vendor Dilution Primary Antibodies Mouse anti‐sarcomeric α‐actinin Sigma A7781 1:500 Mouse anti‐MyoD BD Pharmingen 554130 1:200 Rabbit anti‐Myogenin Santa Cruz sc‐576 1:200 Secondary Antibodies Chicken anti‐mouse Alexa 488 Invitrogen A‐21200 1:200 Chicken anti‐mouse Alexa 594 Invitrogen A‐21201 1:200 Chicken anti‐rabbit Alexa 488 Invitrogen A‐21441 1:200 Chicken anti‐rabbit Alexa 594 Invitrogen A‐21442 1:200 Nuclear Stain DAPI (1 mg/ml) Sigma 32670 1:200 Propidium iodide (PI, 1 mg/ml) Sigma P4864 1:200 F‐actin Stain FITC‐conjugated phalloidin (0.2 mg/ml) Sigma P5282 1:200 TRITC‐conjugated phalloidin (0.2 mg/ml) Sigma P1951 1:200 AChR Stain Alexa488‐conjugated α‐bungarotoxin (1 mg/ml) Invitrogen B13422 1:1000
3.7.2 Quantification of cell alignment
The degree of cell alignment in tissue constructs was quantified using an
image intensity gradient algorithm adapted from Karlon et al.[101] from phase
contrast microscopic images at 10x magnification and confocal F‐actin images at
5x or 10x magnification. Local cell orientation vectors were obtained in each
square element and the deviation of the vector angles from the mean angle of all
the vectors (MeanAngDev) was calculated using circular statistics to obtain a
measure of the cell alignment (with 0° and 45° deviations respectively
representing perfect and random alignments). The degree of cell alignment was
36
defined as 1 – MeanAngDev/45° (0: random orientation; 1: perfect alignment).
Global cell alignment of the entire tissue construct was estimated by quantifying
and averaging the degree of alignment in 3 repeating rectangular subunits, each
subunit containing one central elliptical pore. Local cell alignment was
determined in both the central portion of tissue bundles between the elliptical
pores and the node regions connecting two neighboring subunits.
3.7.3 Quantification of AChR clustering
Tissue constructs were fixed in 4% formaldehyde for 2 hrs at 4°C and
incubated with 1 μg/ml Alexa488‐conjugated α‐bungarotoxin to label the
membrane‐bound acetylcholine receptors (AChRs) and DAPI to simultaneously
stain nuclei (Table 3.1). Stained constructs were then imaged at 20x magnification
with a Zeiss confocal microscope (LSM510). A total of 9 images in 3 constructs
from 3 independent isolations were manually analyzed for each experimental
group, as follows. Background fluorescence was increased to a minimum level
that allowed visualization of the myotube boundaries. The percentage of
myotubes containing AChR clusters was measured by dividing the number of
positively stained with the total number of myotubes. The number of AChR
clusters per positively stained myotube was also quantified. In addition, the
cluster lengths (longest diameter in the cluster) was measured for all AChR
37
clusters and classified into one of the 3 ranges: 0 ‐ 20 μm, 20 ‐ 40 μm and 40 ‐ 60
μm. The percent of AChR clusters in each range and the average cluster length
were also quantified for each experimental group.
3.7.4 Quantification of myogenin index
Tissue constructs were fixed and stained with anti‐myogenin antibody
and DAPI (Table 3.1) as described in section 3.7.1. The myogenin index was
measured by dividing the number of myogenin‐positive nuclei with the total
number of DAPI‐labeled nuclei in 20x confocal microscopic images acquired at 3
different tissue depths (50, 100, and 150 μm) using MetaMorph software
(Molecular Devices).
3.8 DNA content quantification
Tissue constructs were rapidly frozen in liquid nitrogen. Genomic DNA of
each construct was isolated using a DNeasy blood and tissue kit (Qiagen) and
eluted in 200μl AE buffer (10mM Tris‐Cl, 0.5mM EDTA, pH 9.0). The
concentration of the isolated DNA was measured using a spectrometer
(Nanodrop 1000, NanoDrop products) to obtain the total DNA content of a tissue
construct. The volume density of DNA in a particular tissue construct was
estimated as (DNA content / tissue volume) and considered as an indicator of cell
density.
38
3.9 Quantitative RT-PCR
The total RNA from frozen tissue constructs was isolated using an RNeasy
mini kit (Qiagen) per the manufacturer’s instructions. The quality of isolated
RNA was checked using a Nanodrop 1000 spectrophotometer and only RNA
with A260/A280 ratio larger than 1.8 was used in the one‐step qRT‐PCR analysis.
To prepare each 30 μl qRT‐PCR reaction, 50 ng total RNA (5 ng/μl in 10μl) was
mixed with 15 μl 2x one‐step qRT‐PCR master mix (ABgene) and 5 μl aqueous
solution containing 5 unit reverse transcriptase (SuperScript II, Invitrogen),
primers (0.05 μg for genes of medium abundance, e.g., GAPDH; 0.1 μg for genes
of low abundance, e.g., Chrne and Dmd) and 20 pm Taqman probes (primers
and Taqman probes were kindly provided by Dr. Hyung‐Suk Kim at UNC‐
Chapel Hill). The sequences of forward and reverse primers as well as the
corresponding Taqman probes for the genes used in the analysis are listed in
Table 3.2. The efficiency of primer/probe sets for the target genes were
comparable to that for the reference gene and all primer/probe sets had >90%
efficiency. Reactions were then loaded in a 96‐well MicroAmpTM plate (Applied
Biosystems) and run on an ABI7300 real‐time PCR system (Applied Biosystems)
with a 30 min RT cycle at 48°C followed by a 10 min initial PCR at 95°C and 50
repeated 2‐step PCR cycles (15 sec at 95°C, then 1 min at 60°C). The fold changes
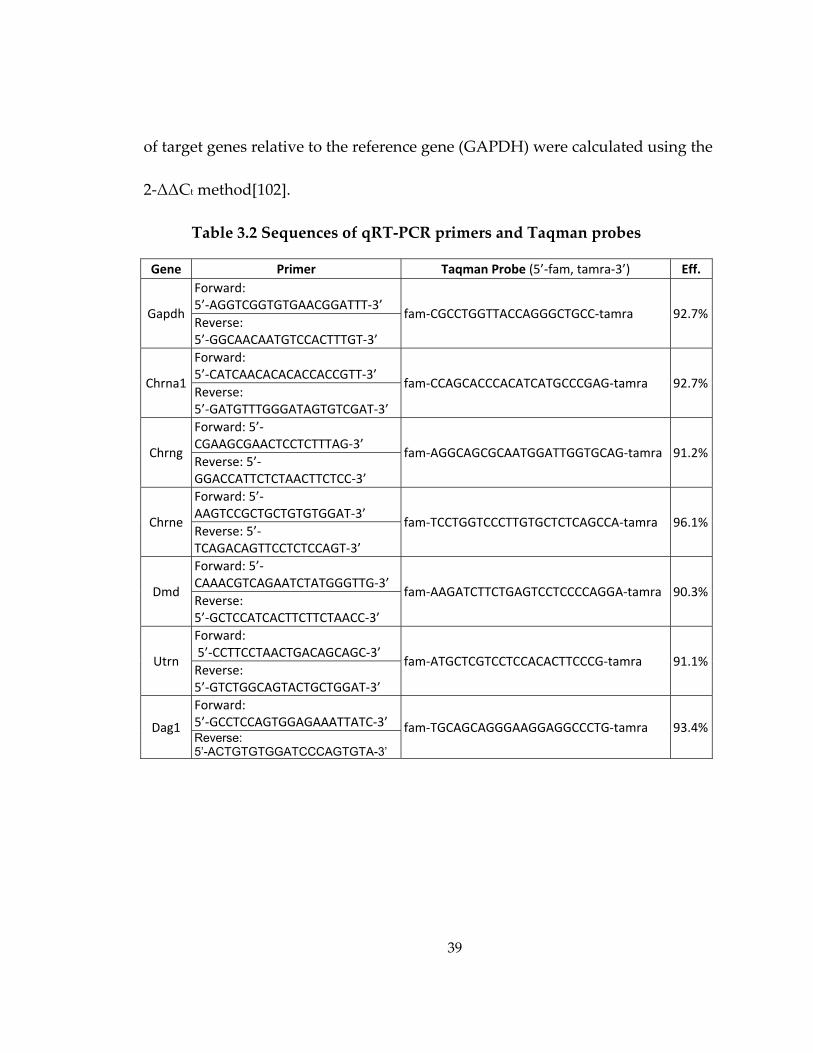
39
of target genes relative to the reference gene (GAPDH) were calculated using the
2‐ΔΔCt method[102].
Table 3.2 Sequences of qRT‐PCR primers and Taqman probes
Gene Primer Taqman Probe (5’‐fam, tamra‐3’) Eff.
Gapdh
Forward: 5’‐AGGTCGGTGTGAACGGATTT‐3’
fam‐CGCCTGGTTACCAGGGCTGCC‐tamra 92.7%Reverse: 5’‐GGCAACAATGTCCACTTTGT‐3’
Chrna1
Forward: 5’‐CATCAACACACACCACCGTT‐3’
fam‐CCAGCACCCACATCATGCCCGAG‐tamra 92.7%Reverse: 5’‐GATGTTTGGGATAGTGTCGAT‐3’
Chrng
Forward: 5’‐CGAAGCGAACTCCTCTTTAG‐3’
fam‐AGGCAGCGCAATGGATTGGTGCAG‐tamra 91.2%Reverse: 5’‐GGACCATTCTCTAACTTCTCC‐3’
Chrne
Forward: 5’‐AAGTCCGCTGCTGTGTGGAT‐3’
fam‐TCCTGGTCCCTTGTGCTCTCAGCCA‐tamra 96.1%Reverse: 5’‐TCAGACAGTTCCTCTCCAGT‐3’
Dmd
Forward: 5’‐CAAACGTCAGAATCTATGGGTTG‐3’
fam‐AAGATCTTCTGAGTCCTCCCCAGGA‐tamra 90.3%Reverse: 5’‐GCTCCATCACTTCTTCTAACC‐3’
Utrn
Forward: 5’‐CCTTCCTAACTGACAGCAGC‐3’
fam‐ATGCTCGTCCTCCACACTTCCCG‐tamra 91.1%Reverse: 5’‐GTCTGGCAGTACTGCTGGAT‐3’
Dag1
Forward: 5’‐GCCTCCAGTGGAGAAATTATC‐3’ fam‐TGCAGCAGGGAAGGAGGCCCTG‐tamra 93.4%Reverse: 5’-ACTGTGTGGATCCCAGTGTA-3’
40
3.10 Western blot analysis
Tissue constructs were digested with 20 μg/ml bovine plasmin (Innovative
Research) for 2 hrs (i.e., until fully dissolved). Dissociated cells were collected by
centrifuging, lysed in RIPA buffer (Sigma, containing 50 mM Tris‐HCl, pH 8.0
with 150 mM sodium chloride, 1.0% NP‐40, 0.5% sodium deoxycholate and 0.1%
sodium dodecyl sulfate) with 1% (vol/vol) protease inhibitor (Sigma) for 2 hrs on
ice, and centrifuged at 12,000 rpm for 20 min at 4°C. The supernatant was
collected and frozen at ‐20°C for later use. The concentration of total protein
contained in the supernatant was measured using a BCA kit (Pierce). The total
protein isolated from tissue constructs was then mixed with 2x Laemmli
buffer[103] (Biorad, containing 62.5 mM Tris HCl, pH 6.8 with 2% SDS, 25%
glycerol, 5% β‐mercaptoethanol, 0.01% bormophenol blue) and boiled for 5 min.
Total protein was loaded (10 μg per lane) on a 7.5% MiniPROTEAN® TGX™
precast gel (Biorad) (total myosin and β‐tubulin) or 5% Ready Gel Tris‐HCl
precast gel (Biorad)(total myosin and fast myosin) and electrophoresis was run in
a MiniPROTEAN® Tetra Cell system (Biorad) at 100V for 5 min followed by
160V for about 1hr in Tris/Glycine/SDS buffer (Biorad, containing 25 mM Tris,
192 mM glycine, 0.1% SDS, pH 8.3). Protein was then transferred onto a
nitrocellulose membrane in modified Tris/Glycine/SDS buffer containing 20%
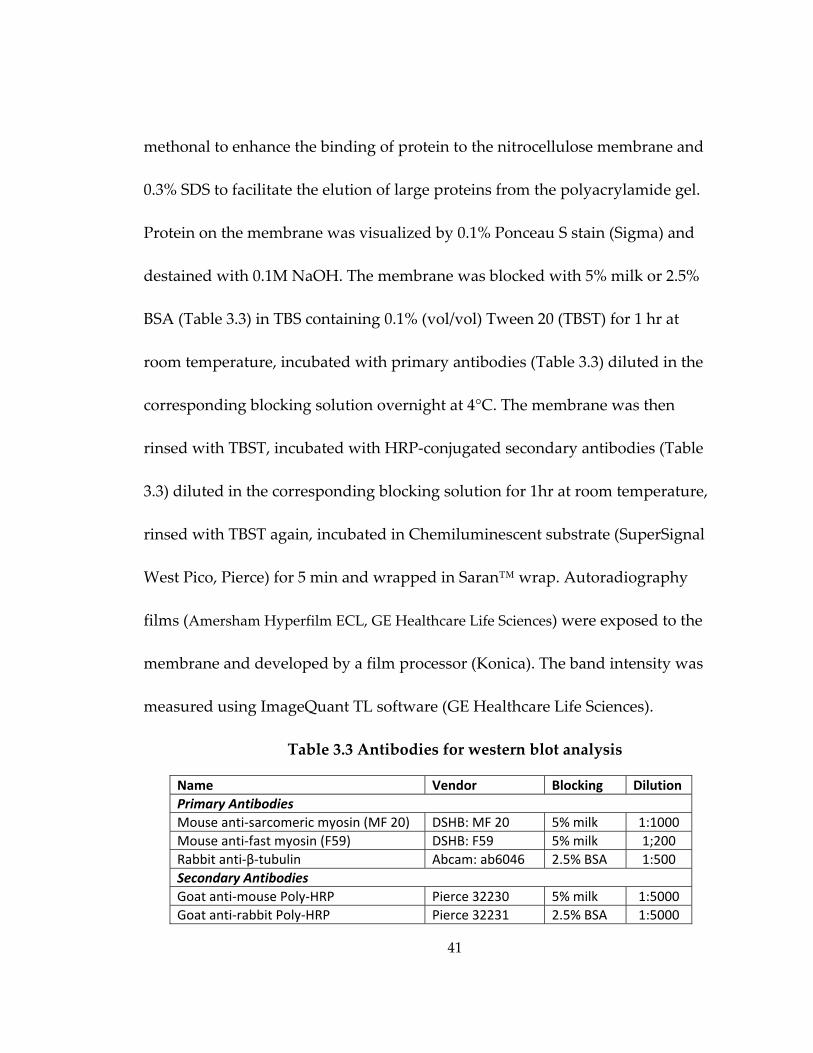
41
methonal to enhance the binding of protein to the nitrocellulose membrane and
0.3% SDS to facilitate the elution of large proteins from the polyacrylamide gel.
Protein on the membrane was visualized by 0.1% Ponceau S stain (Sigma) and
destained with 0.1M NaOH. The membrane was blocked with 5% milk or 2.5%
BSA (Table 3.3) in TBS containing 0.1% (vol/vol) Tween 20 (TBST) for 1 hr at
room temperature, incubated with primary antibodies (Table 3.3) diluted in the
corresponding blocking solution overnight at 4°C. The membrane was then
rinsed with TBST, incubated with HRP‐conjugated secondary antibodies (Table
3.3) diluted in the corresponding blocking solution for 1hr at room temperature,
rinsed with TBST again, incubated in Chemiluminescent substrate (SuperSignal
West Pico, Pierce) for 5 min and wrapped in Saran™ wrap. Autoradiography
films (Amersham Hyperfilm ECL, GE Healthcare Life Sciences) were exposed to the
membrane and developed by a film processor (Konica). The band intensity was
measured using ImageQuant TL software (GE Healthcare Life Sciences).
Table 3.3 Antibodies for western blot analysis
Name Vendor Blocking Dilution Primary Antibodies Mouse anti‐sarcomeric myosin (MF 20) DSHB: MF 20 5% milk 1:1000 Mouse anti‐fast myosin (F59) DSHB: F59 5% milk 1;200 Rabbit anti‐β‐tubulin Abcam: ab6046 2.5% BSA 1:500 Secondary Antibodies Goat anti‐mouse Poly‐HRP Pierce 32230 5% milk 1:5000 Goat anti‐rabbit Poly‐HRP Pierce 32231 2.5% BSA 1:5000
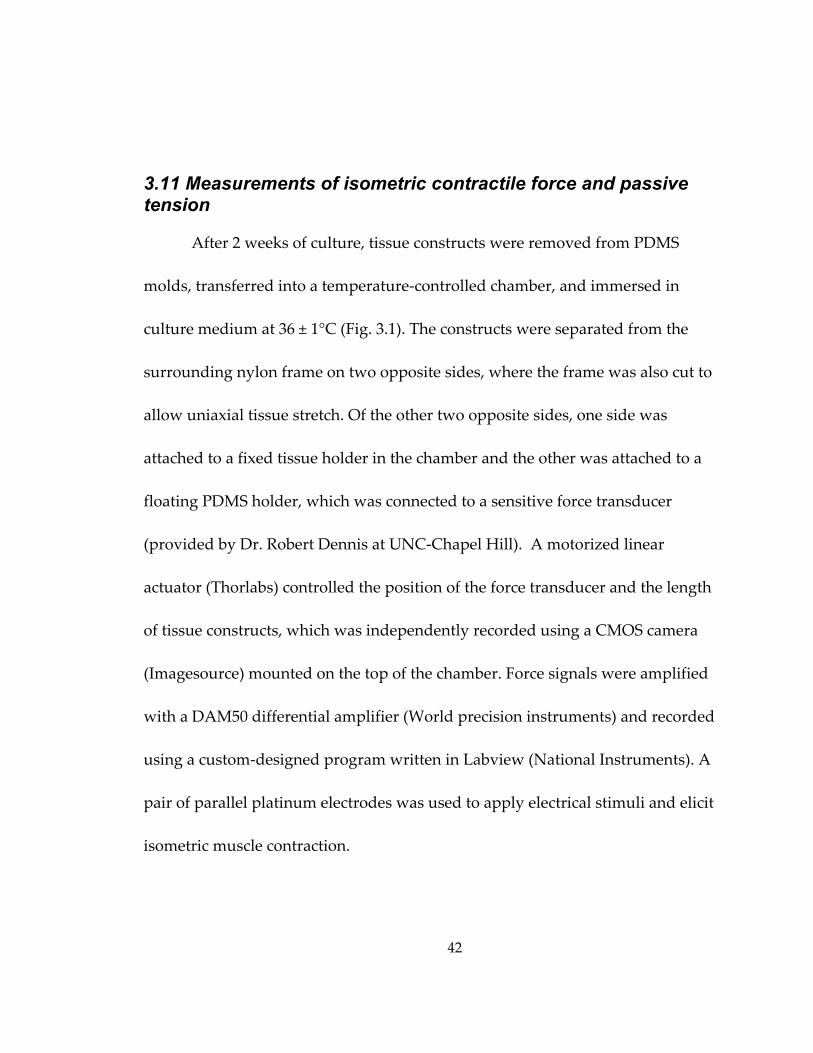
42
3.11 Measurements of isometric contractile force and passive tension
After 2 weeks of culture, tissue constructs were removed from PDMS
molds, transferred into a temperature‐controlled chamber, and immersed in
culture medium at 36 ± 1°C (Fig. 3.1). The constructs were separated from the
surrounding nylon frame on two opposite sides, where the frame was also cut to
allow uniaxial tissue stretch. Of the other two opposite sides, one side was
attached to a fixed tissue holder in the chamber and the other was attached to a
floating PDMS holder, which was connected to a sensitive force transducer
(provided by Dr. Robert Dennis at UNC‐Chapel Hill). A motorized linear
actuator (Thorlabs) controlled the position of the force transducer and the length
of tissue constructs, which was independently recorded using a CMOS camera
(Imagesource) mounted on the top of the chamber. Force signals were amplified
with a DAM50 differential amplifier (World precision instruments) and recorded
using a custom‐designed program written in Labview (National Instruments). A
pair of parallel platinum electrodes was used to apply electrical stimuli and elicit
isometric muscle contraction.
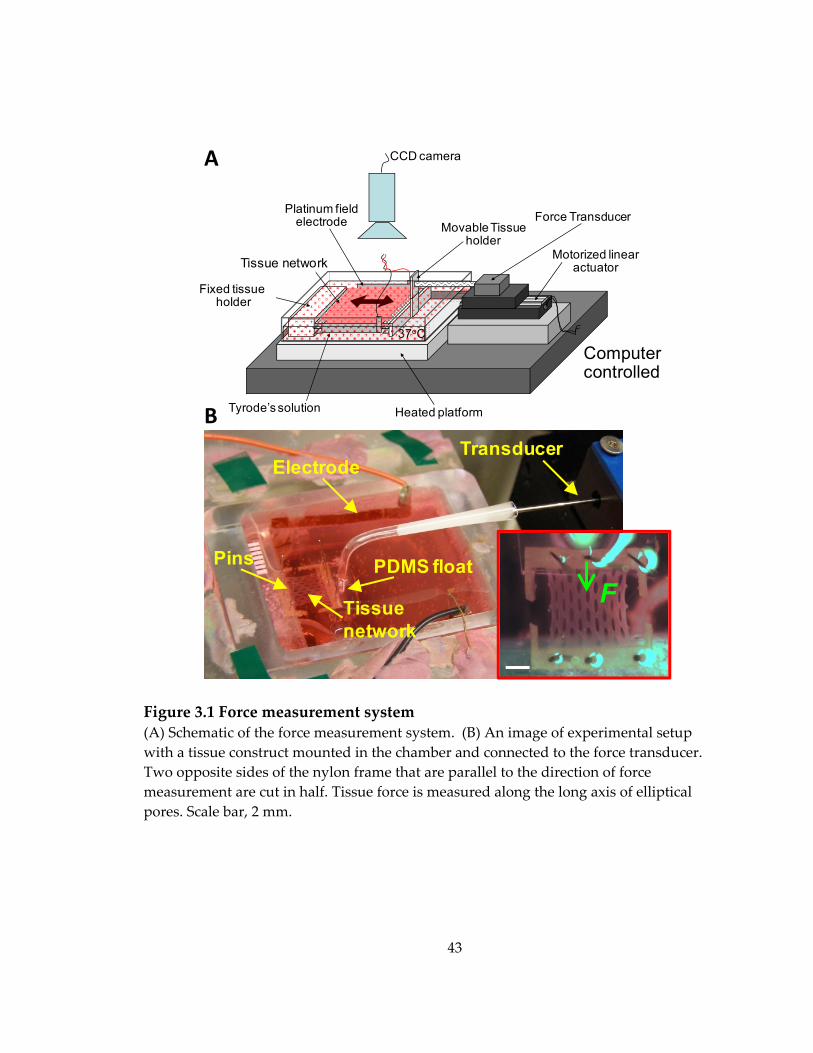
43
Figure 3.1 Force measurement system (A) Schematic of the force measurement system. (B) An image of experimental setup with a tissue construct mounted in the chamber and connected to the force transducer. Two opposite sides of the nylon frame that are parallel to the direction of force measurement are cut in half. Tissue force is measured along the long axis of elliptical pores. Scale bar, 2 mm.
Cardiac patch
Tyrode’s solution Heated platform
Movable Tissue holder
Platinum field electrode
37oC
Motorized linear actuator
Force Transducer
Fixed tissueholder
CCD camera
Computer controlled
5mmHolder
oat
Elec
trode
Tissue network
Tissue network
PDMS float
Electrode
Pins
Transducer
F
A
B
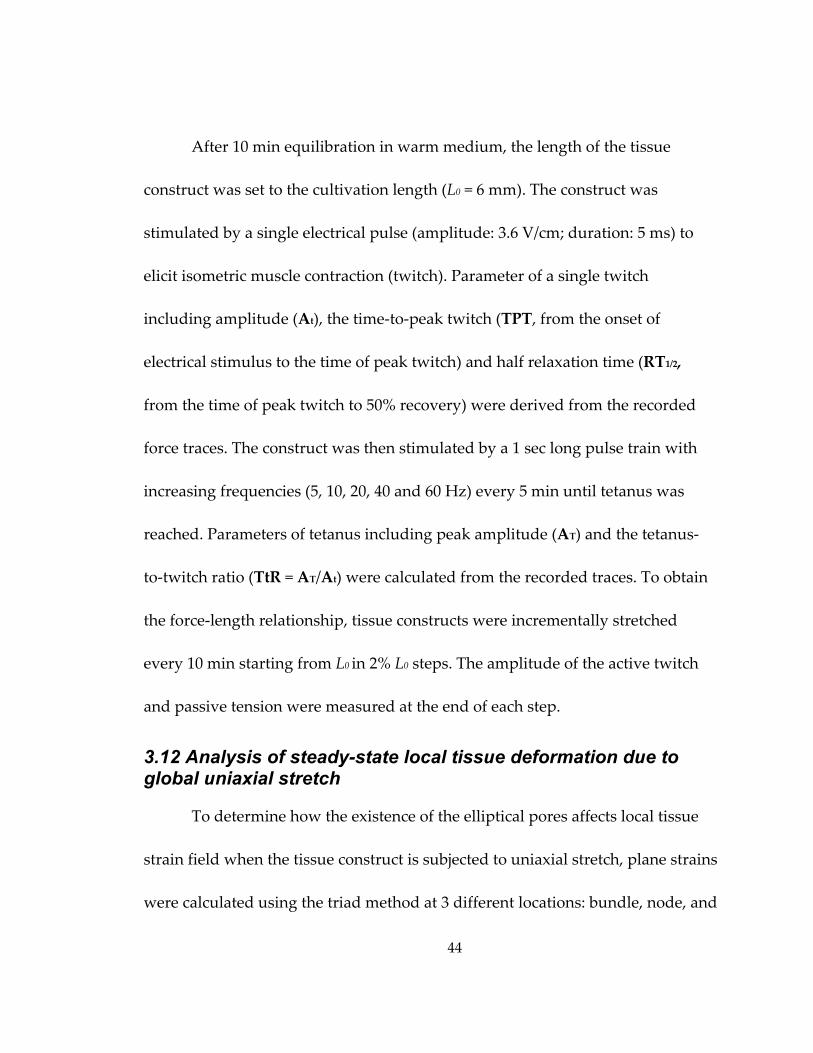
44
After 10 min equilibration in warm medium, the length of the tissue
construct was set to the cultivation length (L0 = 6 mm). The construct was
stimulated by a single electrical pulse (amplitude: 3.6 V/cm; duration: 5 ms) to
elicit isometric muscle contraction (twitch). Parameter of a single twitch
including amplitude (At), the time‐to‐peak twitch (TPT, from the onset of
electrical stimulus to the time of peak twitch) and half relaxation time (RT1/2,
from the time of peak twitch to 50% recovery) were derived from the recorded
force traces. The construct was then stimulated by a 1 sec long pulse train with
increasing frequencies (5, 10, 20, 40 and 60 Hz) every 5 min until tetanus was
reached. Parameters of tetanus including peak amplitude (AT) and the tetanus‐
to‐twitch ratio (TtR = AT/At) were calculated from the recorded traces. To obtain
the force‐length relationship, tissue constructs were incrementally stretched
every 10 min starting from L0 in 2% L0 steps. The amplitude of the active twitch
and passive tension were measured at the end of each step.
3.12 Analysis of steady-state local tissue deformation due to global uniaxial stretch
To determine how the existence of the elliptical pores affects local tissue
strain field when the tissue construct is subjected to uniaxial stretch, plane strains
were calculated using the triad method at 3 different locations: bundle, node, and
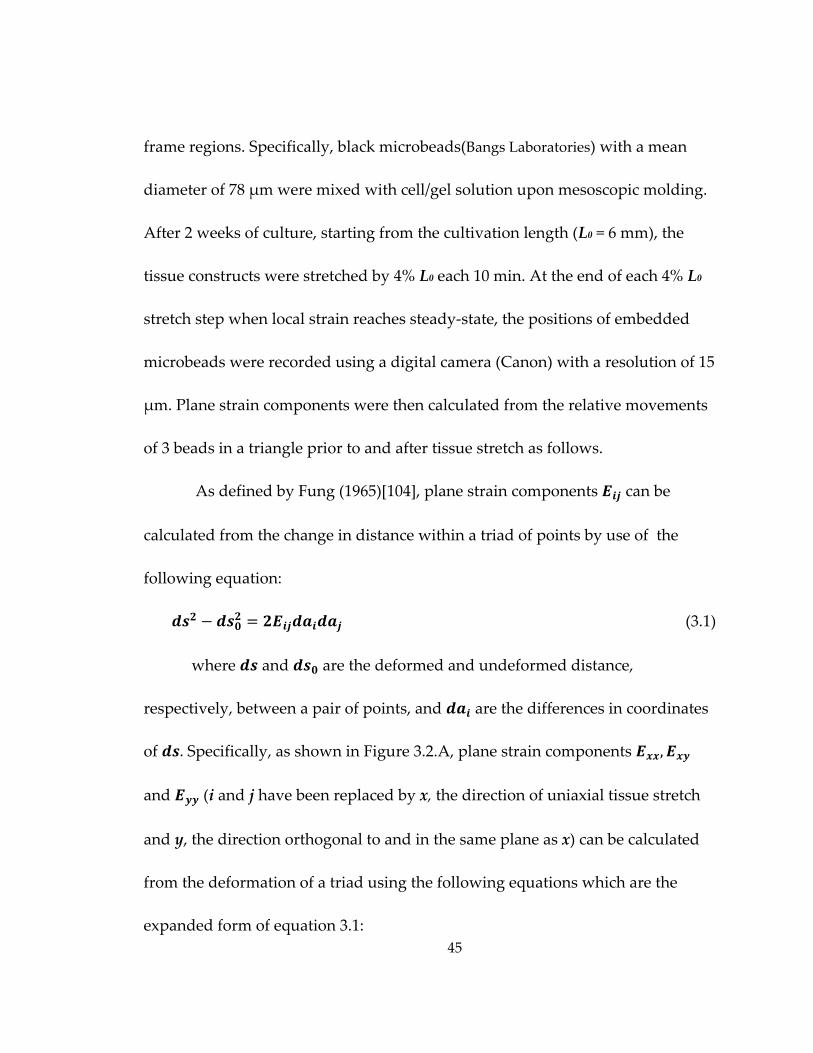
45
frame regions. Specifically, black microbeads(Bangs Laboratories) with a mean
diameter of 78 μm were mixed with cell/gel solution upon mesoscopic molding.
After 2 weeks of culture, starting from the cultivation length (L0 = 6 mm), the
tissue constructs were stretched by 4% L0 each 10 min. At the end of each 4% L0
stretch step when local strain reaches steady‐state, the positions of embedded
microbeads were recorded using a digital camera (Canon) with a resolution of 15
μm. Plane strain components were then calculated from the relative movements
of 3 beads in a triangle prior to and after tissue stretch as follows.
As defined by Fung (1965)[104], plane strain components can be
calculated from the change in distance within a triad of points by use of the
following equation:
(3.1)
where and are the deformed and undeformed distance,
respectively, between a pair of points, and are the differences in coordinates
of . Specifically, as shown in Figure 3.2.A, plane strain components ,
and (i and j have been replaced by x, the direction of uniaxial tissue stretch
and y, the direction orthogonal to and in the same plane as x) can be calculated
from the deformation of a triad using the following equations which are the
expanded form of equation 3.1:
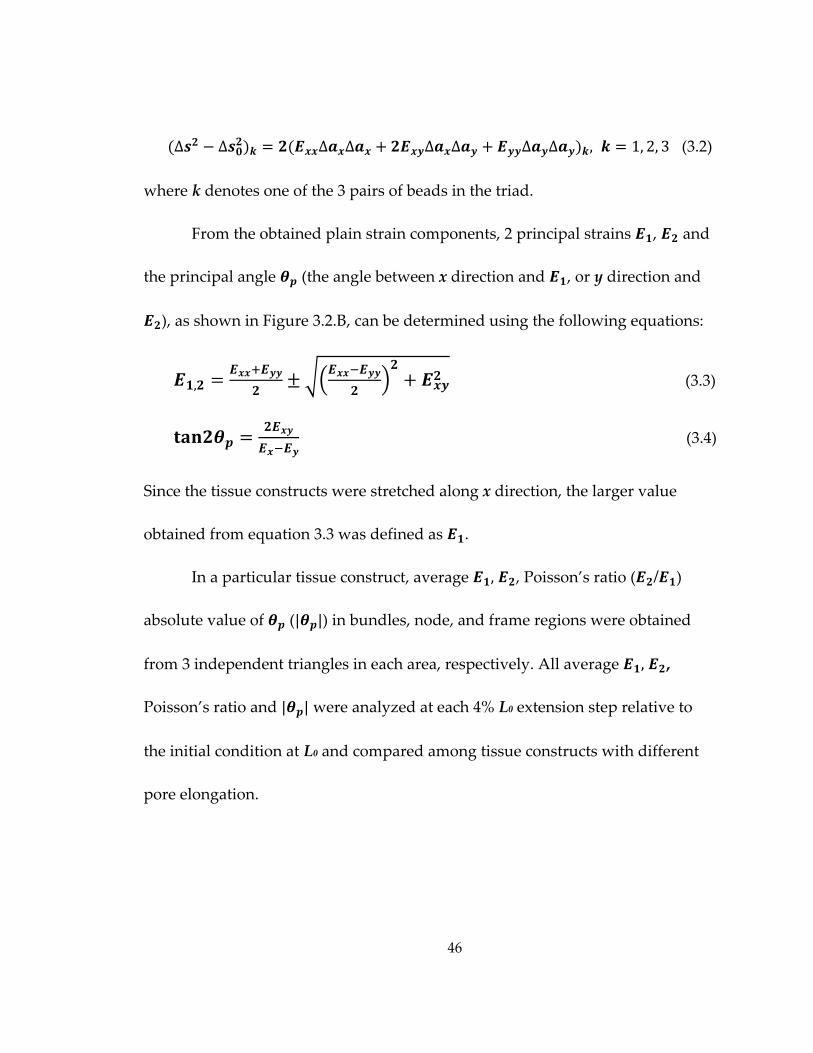
46
∆ ∆ ∆ ∆ ∆ ∆ ∆ ∆ , 1, 2, 3 (3.2)
where k denotes one of the 3 pairs of beads in the triad.
From the obtained plain strain components, 2 principal strains , and
the principal angle (the angle between x direction and , or y direction and
), as shown in Figure 3.2.B, can be determined using the following equations:
, (3.3)
(3.4)
Since the tissue constructs were stretched along x direction, the larger value
obtained from equation 3.3 was defined as .
In a particular tissue construct, average , , Poisson’s ratio ( / )
absolute value of (| |) in bundles, node, and frame regions were obtained
from 3 independent triangles in each area, respectively. All average , ,
Poisson’s ratio and | | were analyzed at each 4% L0 extension step relative to
the initial condition at L0 and compared among tissue constructs with different
pore elongation.
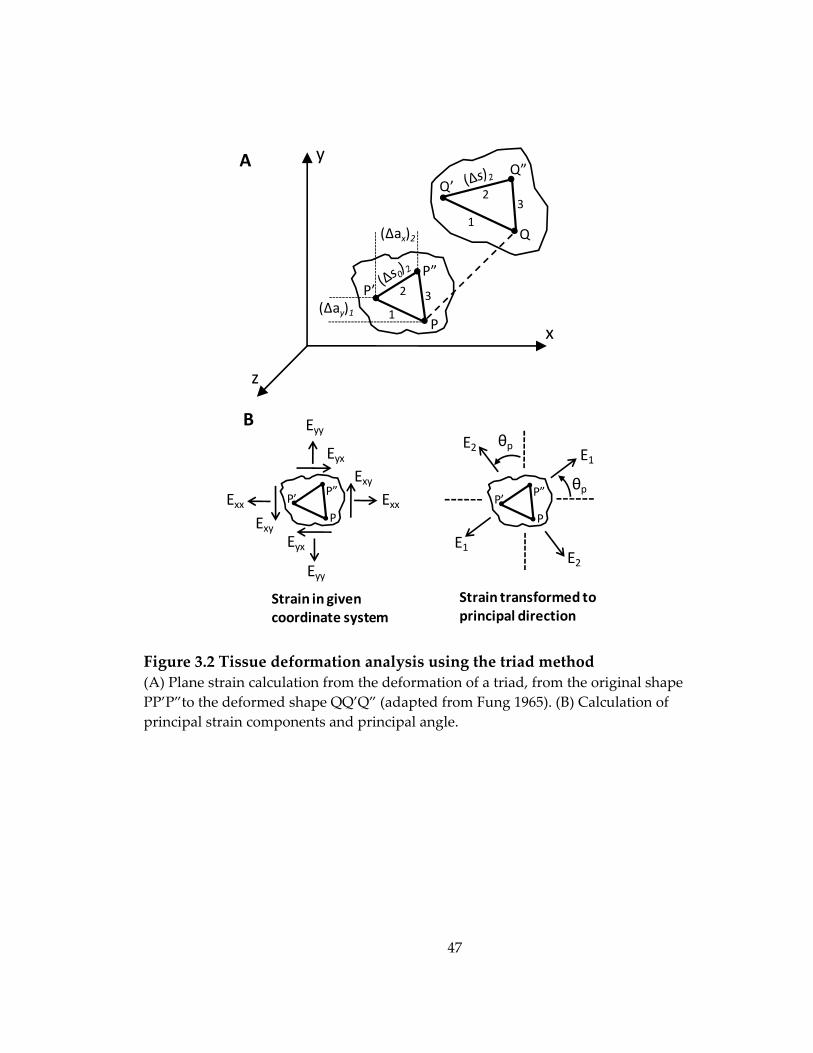
47
Figure 3.2 Tissue deformation analysis using the triad method (A) Plane strain calculation from the deformation of a triad, from the original shape PP’P”to the deformed shape QQ’Q” (adapted from Fung 1965). (B) Calculation of principal strain components and principal angle.
y
x
z
P’P”
Q’
Q
Q”
1
23
3
1
2
(Δax)2
(Δay)1P
P
P”P’ ExxExx
Eyy
Eyy
Eyx
EyxExy
Exy P
P”P’
E1
E1E2
E2
θp
θp
A
B
Strain in given coordinate system
Strain transformed to principal direction
48
3.13 Sensitivity of contractile force amplitude to extracellular Ca2+ concentration
Tissue constructs were first incubated at resting length in Ca2+‐free, 1mM
EDTA containing saline solution to prevent active force generation.
Subsequently, the extracellular Ca2+ concentration ([Ca2+]) was elevated every 20
min to a higher value (0.1 mM, 0.2 mM, 0.4 mM, 0.8 mM, 1.2 mM, 1.6 mM, 2.4
mM,3.2 mM, and 4.8 mM), and a 5ms long, 3.6 V/cm electrical pulse was applied
to elicit isometric contraction (twitch). The twitch amplitude (At) was expressed
as a function of pCa = ‐log10([Ca2+]), and At(pCa) curves were compared among
different groups after normalization with the respective At0 at the highest [Ca2+]
of 4.8 mM. The At(pCa) curves were then fitted using the Hill equation,
· 3.5
to obtain the Hill coefficient, h and pCa50, the pCa value when At = At0[105].
Statistical analysis were applied on the pCa50 values and the log form of Hill
coefficient, log10(h), both of which exhibited a normal distribution in
physiological data.
49
3.14 Mapping of intracellular Ca2+ transients
The tissue constructs were incubated in serum‐free medium containing
5μM calcium sensitive dye Rhod‐2 (Invitrogen) for 30 min at 37˚C, followed by
20 min incubation in dye‐free medium. The stained constructs were then
transferred into a custom chamber mounted on an inverted fluorescence
microscope (Nikon TE2000) and perfused with warm (36±1˚) Tyrode’s solution
(in mM: 135 NaCl, 5.4 KCl, 1.8 CaCl, 1 MgCl, 0.33 NaHPO, 5 HEPES, 5 glucose).
Blebbistatin (5 μM) was added to inhibit contractions and eliminate motion
artifacts during recordings[106]. The stained constructs were electrically
stimulated (5 ms, 3.6 V/mm pulses) with a pair of parallel platinum electrodes,
illuminated by green light (520 ± 25nm) and emitted fluorescence signals (605 ±
30nm) were simultaneously recorded from 504 sites within a circular field of
view (diameter: 5 mm) at 1.2 kHz sampling rate and 187 μm resolution using a
photodiode array (RedShirt Imaging). Signals in the pore regions of the construct
were identified by thresholding (<20% of maximum signal) and were discarded
from further analysis. The mean trace of Ca2+ transient was obtained by first
normalizing individual Ca2+ transients with their respective maximum amplitude
and then averaging the normalized Ca2+ transients in all active sites. The half‐
50
width (Ca50) and 80% width (Ca80) of the mean Ca2+ transient was measured from
the time of maximum transient upstroke to 50% and 80% recovery, respectively.
3.15 Statistical analysis
Data are expressed as mean ± SD. Statistical significance was determined
by student t test between two groups and one‐way ANOVA test among three
and more groups. Tukey post hoc test was applied to compare all group pairs
among three or more groups analyzed with ANOVA test. To account for the
variations of cell quality from different isolations, paired t test or repeated
measure ANOVA was used to compare results among different isolations.
Differences were considered to be significant when p <0.05. Correlation was
assessed using linear regression analysis.
51
4. Mesoscopic Hydrogel Molding to Control Tissue Geometry of Engineered Muscle
This chapter describes a novel soft‐lithography‐based mesoscopic
hydrogel molding approach to fabricate relatively large and thick porous muscle
tissue constructs in which 3D tissue geometry and local muscle fiber alignments
can be precisely varied.
Specifically, as illustrated in Figure 4.1, a high aspect‐ratio (height‐to‐
width ratio of 5‐10) soft‐lithography technique has been optimized to create
PDMS tissue molds containing an array of staggered, sub‐millimeter sized posts.
These posts are one to two orders of magnitude taller (up to 2.5 mm) than the
photolithographic features typically used in microfluidic[107] and other
biological applications[108]. A mixture of muscle cells and fibrin‐based gel is
then cultured within the PDMS tissue molds to allow the formation of a muscle
sheet with elliptical pores formed around the posts. These tissue constructs in the
form of muscle sheets with elliptical pores are termed ʺengineered muscle
networksʺ in this thesis. Through cell‐mediated gel compaction and gel
anchoring at the ends of the posts, a strain field is formed within the hydrogel
that guides local 3D cell alignment
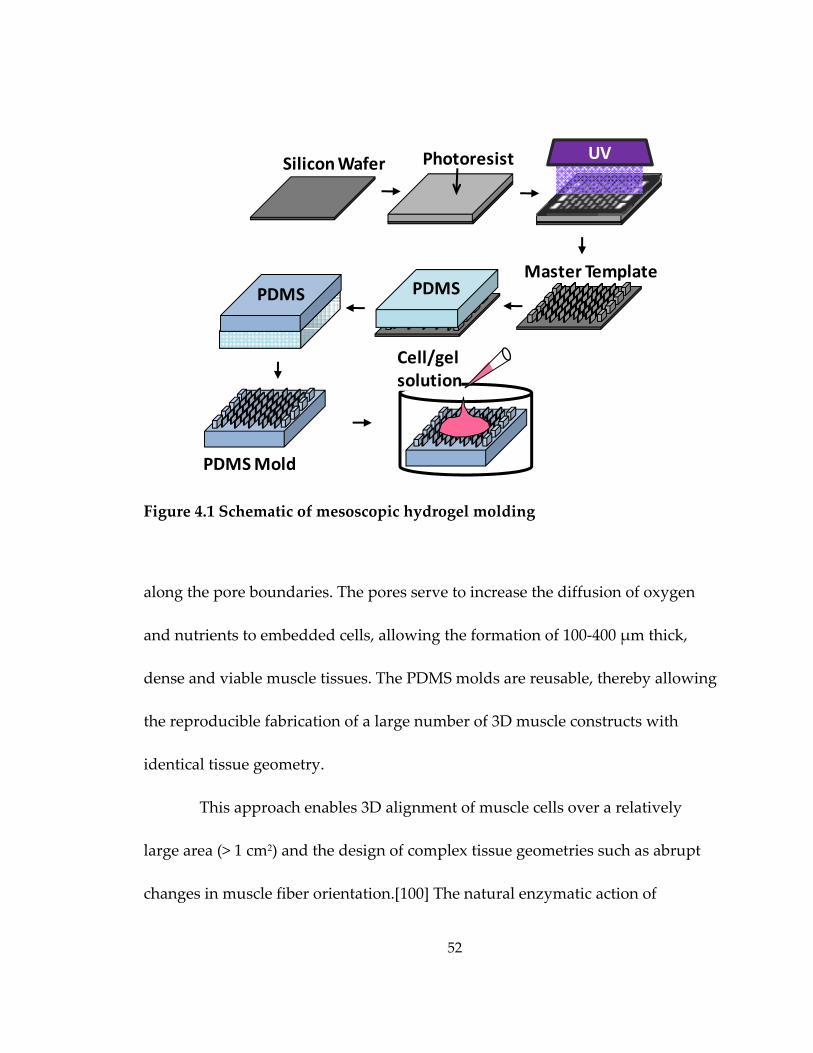
52
Figure 4.1 Schematic of mesoscopic hydrogel molding
along the pore boundaries. The pores serve to increase the diffusion of oxygen
and nutrients to embedded cells, allowing the formation of 100‐400 μm thick,
dense and viable muscle tissues. The PDMS molds are reusable, thereby allowing
the reproducible fabrication of a large number of 3D muscle constructs with
identical tissue geometry.
This approach enables 3D alignment of muscle cells over a relatively
large area (> 1 cm2) and the design of complex tissue geometries such as abrupt
changes in muscle fiber orientation.[100] The natural enzymatic action of
UVSilicon Wafer
Master TemplatePDMSPDMS
PDMS Mold
Cell/gel solution
Photoresist
53
thrombin on fibrinogen[109] during hydrogel polymerization has no adverse
effects on embedded cells. The abundant cell adhesion sites present in fibrin gel
facilitate the interaction between the cells and the extracellular matrix (ECM),
and, subsequently, the structural and biochemical remodeling of the ECM by the
cells. The facilitated ECM remodeling, along with the topographical and
mechanical cues provided by the PDMS mold, guide the proper 3D assembly and
integration of cells into a functional, aligned bioartificial muscle tissue. Long
term spontaneous contractions of differentiated muscle fibers are adequately
supported by the relatively high compliance of fibrin gel.[110]
Importantly, the computer‐aided design of photomasks used to fabricate
the template wafers enables precise variations in tissue mold parameters, such as
post height, length, width, orientation, and spacing, which, in turn, determine
the resulting tissue size, thickness, porosity, local and overall myofiber alignment
as well as the dimensions of the formed tissue bundles.
The process and characterization of this novel tissue fabrication
methodology is presented in the following sections. A detailed protocol is
described in Appendix.
54
4.1 Fabrication of engineered muscle networks
4.1.1 Fabrication of silicon master template
A method based on the standard UV‐photolithography techniques has
been developed to create well‐defined, high aspect ratio photoresist features.
Multiple layers of SU‐8 photoresist are spin‐coated on a master silicon wafer to a
final thickness of up to 2.5 mm. After extensive soft‐baking to remove residual
solvent, the template is patterned by selective exposure to ultraviolet light
through a transparency photomask (Figure 4.2.A). The resulting photoresist
features, i.e., hexagonal posts, typically have a width of no less than 0.2 mm and
a height‐to‐width aspect ratio between 5:1 and 10:1 (Figure 4.2.B1‐4 and C1‐2). By
changing the design of photomask, the direction of posts can be arbitrarily varied
(Figure 4.2.B3‐4). However, creating taller and higher aspect ratio features has
not been possible using this protocol. The use of x‐ray lithography[111] would be
recommended if this was to be attempted.
Silicon wafers are first “piranha etched” to remove traces of carbon
residue for better photoresist adhesion. After dehydrating the wafer for 10 min at
200°C to maximize the adhesion of photoresist, SU‐8 100 photoresist
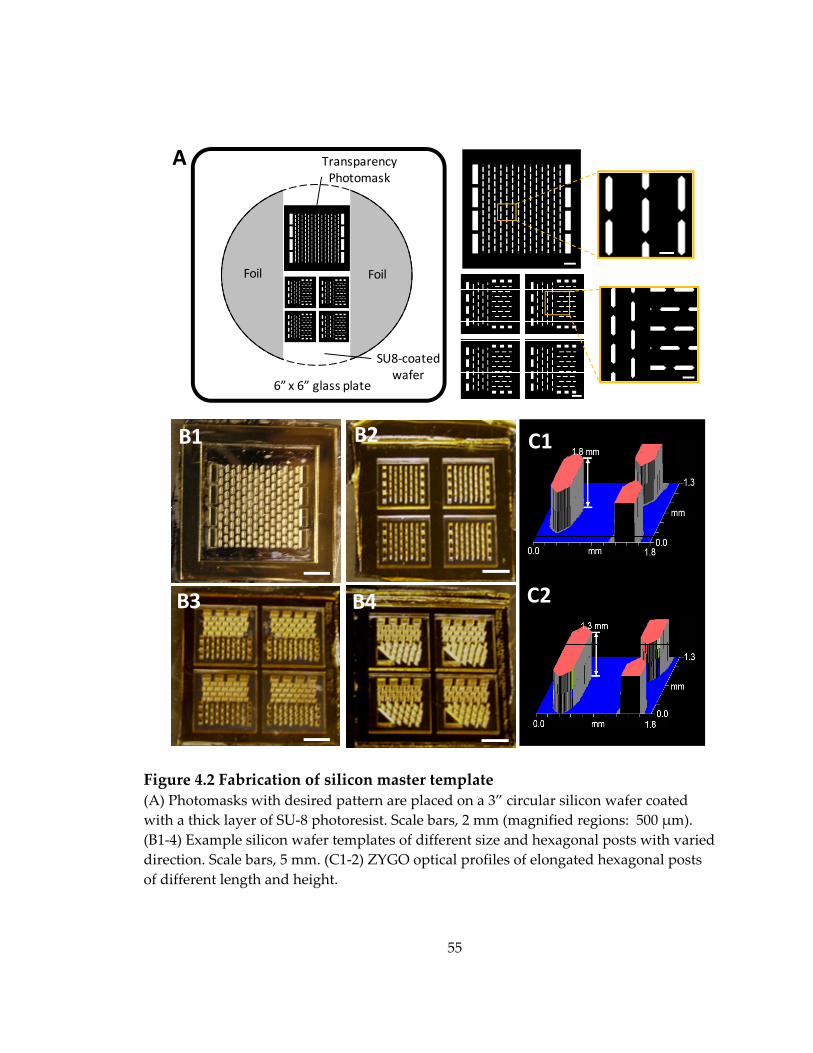
55
Figure 4.2 Fabrication of silicon master template (A) Photomasks with desired pattern are placed on a 3” circular silicon wafer coated with a thick layer of SU‐8 photoresist. Scale bars, 2 mm (magnified regions: 500 μm). (B1‐4) Example silicon wafer templates of different size and hexagonal posts with varied direction. Scale bars, 5 mm. (C1‐2) ZYGO optical profiles of elongated hexagonal posts of different length and height.
A
1.3
C1
C2
B1 B2
B4B3
Wafer
Transparency Photomask
Foil
6” x 6” glass plate
Foil
SU8‐coated wafer
56
(Microchem) is spin‐coated on the wafer using a three‐step protocol: 1) ramping
up to 500 RPM at 100 RPM/s for 10 sec; 2) ramping up to 1000 RPM at 300 RPM/s
for 30 sec; 3) ramping down to 0 RPM at 300 RPM/s. This results in a 250 μm
thick photoresist layer. The wafer is then soft‐baked at 65°C for 15 min, followed
by 95°C for 2 hr. For taller features (up to 2.5 mm), SU‐8 100 is layered
sequentially by reiterating this coating‐baking step. Upon spin‐coating the final
layer onto the wafer, a final, longer soft‐bake is performed at 95°C for at least 10
hr (or overnight).
The wafer is then exposed to UV on a mask aligner through a
transparency photomask taped on a glass plate (6” x 6” square). Long time UV
exposure (e.g. 24 min) is then performed using multiple 1 min steps to prevent
the over‐heating of the photoresist followed by a post‐exposure bake (PEB) at
40°C for at least 24 hr. This long duration, low temperature PEB allows the
photoresist to crosslink while minimizing the diffusion of photo‐crosslinker
through the resin, thus maintaining high feature fidelity. The wafer is cooled
down by ramping down the temperature at 10°C/hr to room temperature. The
wafer is then immersed in PGMEA developer overnight to etch away the
uncrosslinked photoresist, rinsed with isopropyl alcohol, and dried with air.
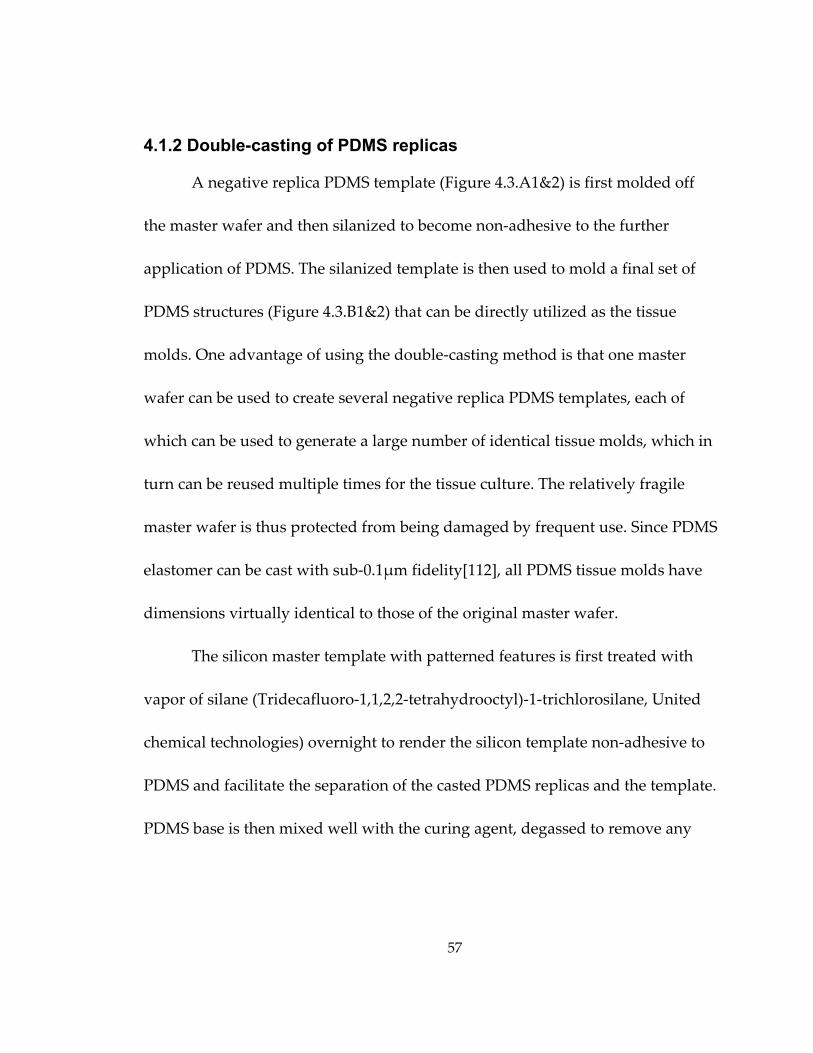
57
4.1.2 Double-casting of PDMS replicas
A negative replica PDMS template (Figure 4.3.A1&2) is first molded off
the master wafer and then silanized to become non‐adhesive to the further
application of PDMS. The silanized template is then used to mold a final set of
PDMS structures (Figure 4.3.B1&2) that can be directly utilized as the tissue
molds. One advantage of using the double‐casting method is that one master
wafer can be used to create several negative replica PDMS templates, each of
which can be used to generate a large number of identical tissue molds, which in
turn can be reused multiple times for the tissue culture. The relatively fragile
master wafer is thus protected from being damaged by frequent use. Since PDMS
elastomer can be cast with sub‐0.1μm fidelity[112], all PDMS tissue molds have
dimensions virtually identical to those of the original master wafer.
The silicon master template with patterned features is first treated with
vapor of silane (Tridecafluoro‐1,1,2,2‐tetrahydrooctyl)‐1‐trichlorosilane, United
chemical technologies) overnight to render the silicon template non‐adhesive to
PDMS and facilitate the separation of the casted PDMS replicas and the template.
PDMS base is then mixed well with the curing agent, degassed to remove any
58
Figure 4.3 Fabrication of PDMS replicas (A1‐2) Negative PDMS replicas cast off the silicon wafer template. Inset in A2 shows the cross section of the negative PDMS replica indicated by the white dashed line. Scale bars, 5 mm in A1, 1 mm in A2, 500 μm in A2 inset. (B1‐2) Positive PDMS replicas cast off the negative PDMS replicas. They have the identical geometry of the silicon wafer template. Inset in B2 shows the cross section of the positive PDMS replica indicated by the white dashed line. Scale bars, 5 mm in B1, 1 mm in B2, 500 μm in B2 inset.
trapped air bubbles, poured on top of the template wafer, degassed again and
baked at 80°C for at least 4 hr to allow PDMS polymerization. The polymerized
PDMS is then cooled down and gently peeled off the template wafer. This
negative PDMS replica of the patterned master template serves as a template in
c
PDMS
PDMS
A1 A2
B1 B2
59
the next casting step to produce the positive PDMS replica of the master
template.
Similarly, the negative PDMS replica is silanized until it turns opaque
(Figure 4.3.A1&A2). Mixed PDMS prepolymer is then casted in the negative
PDMS replica and baked at 80°C to allow polymerization. The polymerized
PDMS is gently separated from the negative PDMS template after sufficient
cooling (Figure 4.3.B1&B2).
4.1.3 Alternative method to fabricate PDMS tissue molds
PDMS tissue molds can also be fabricated using rapid photopatterning
with a thiolene‐based optical adhesive, Norland 81 (Norland Products)[113]. The
liquid adhesive is poured within a ~1mm thick PDMS spacer on a glass slide and
covered by the photomask coated with a thin layer of PDMS. After a short UV
exposure, the photomask and the PDMS spacer are removed and the glass slide
with the patterned adhesive is immersed in acetone to dissolve the uncrosslinked
adhesive residuals. The slide is dried with nitrogen, exposed to UV to solidify the
adhesive and baked overnight at 50°C. Dip‐coating of Novelty EGC‐1700 reagent
(3M) is utilized to prevent PDMS adhesion. The PDMS prepolymer mixture is
degassed, poured onto the master templates and baked overnight at 80°C. The
60
polymerized PDMS is carefully peeled off the master template to yield a replica
of the tissue mold.
Compared with tissue mold fabrication using standard UV‐
photolithography followed by double‐casting of PDMS, which requires a longer
processing time (>30 hrs) but provides feature heights of up to 2mm with feature
dimensions down to 200 μm (i.e., up to a 10:1 aspect ratios), rapid photo
patterning with Norland 81, which has processing times of less than 12hrs but
yields feature heights of up to 1mm with sizes down to only 400μm (i.e., ~2.5:1
ratios). The silanized SU8 photoresist templates can be repeatedly used to cast
PDMS molds (tested >5 times) while solidified Norland 81 adhesive patterns are
limited to 1‐2 times of usage because of the damage to the master template
caused by the stress encountered during removal of the molded PDMS. For both
methods, the obtained PDMS molds can be reused for several tissue cultures.
4.1.4 Cell/gel molding and culture of engineered muscle networks
The PDMS tissue molds are rendered hydrophilic by oxygen plasma
treatment and coated with 0.2% (wt/vol) solution of pluronic F‐127 to prevent
hydrogel adhesion. A nylon (Cerex®) or Velcro® frame is pinned within the
tissue mold (Figure 4.4.A) to anchor the hydrogel. The frame provides
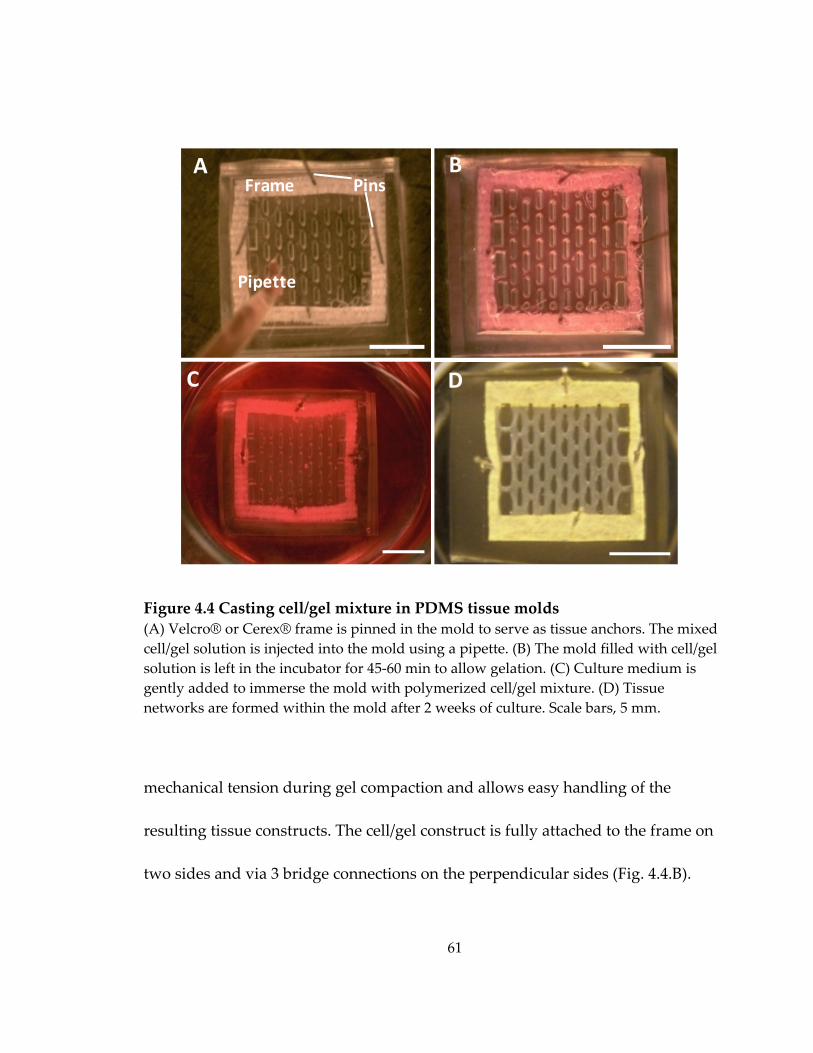
61
Figure 4.4 Casting cell/gel mixture in PDMS tissue molds (A) Velcro® or Cerex® frame is pinned in the mold to serve as tissue anchors. The mixed cell/gel solution is injected into the mold using a pipette. (B) The mold filled with cell/gel solution is left in the incubator for 45‐60 min to allow gelation. (C) Culture medium is gently added to immerse the mold with polymerized cell/gel mixture. (D) Tissue networks are formed within the mold after 2 weeks of culture. Scale bars, 5 mm.
mechanical tension during gel compaction and allows easy handling of the
resulting tissue constructs. The cell/gel construct is fully attached to the frame on
two sides and via 3 bridge connections on the perpendicular sides (Fig. 4.4.B).
Frame Pins
Pipette
A B
DC
62
The bridge connections allow easy separation of tissue constructs from the frame
when conducting force measurement.
Isolated NRSKMs are mixed with 2x growth medium (2x DMEM (made
from powder DMEM), 20% (vol/vol) fetal bovine serum, 100 unit/mL penicillin
G, 100 μg/mL streptomycin, 10 μg/mL gentamicin), bovine fibrinogen (Sigma),
and 10% (vol/vol) Matrigel (BD) on ice. The cell/gel mixture contains 10 million
cells/ml NRSKMs and 4 mg/ml fibrinogen. Bovine thrombin is added into the
cell/gel mixture at a concentration of 0.2 unit per mg fibrinogen to initiate the
polymerization of fibrin. Immediately following the addition of thrombin, the
cell/gel mixture is injected into the PDMS molds and polymerized at 37°C
(Figure 4.4.B) for 45‐60 min. For a mold with dimensions of 9 × 9 × 1.2 mm3
(length × width × height), the volume of cell/hydrogel mixture is ~100 μL. The
hydrogel‐containing PDMS molds are then immersed in growth medium (Figure
4.4.C) and cultured in static conditions for 2 weeks to allow the formation of
viable, dense and aligned skeletal muscle networks (Figure 4.4.D). On culture
day 4, high serum‐containing growth medium (10% fetal bovine serum) is
switched to low serum‐containing differentiation medium (3% horse serum) to
promote the fusion of myoblasts into myotubes. Tissue networks are cultured in
differentiation medium for 10 days to allow the differentiation and maturation of
63
embedded nascent myotubes as well as extracellular matrix remodeling during
cell‐mediated gel compaction. Culture medium is supplemented with 1 mg/ml
aminocaproic acid (Sigma) to prevent the degradation of fibrin.
4.2 Characterization of cell-mediated gel compaction
Collagen and fibrin are two types of naturally‐derived hydrogels that
have been previously reported to support high viability and spreading of skeletal
myoblasts[12, 64]. They both interact with embedded myoblasts and undergo
significant compaction due to the cell‐mediated remodeling of extracellular
matrix. Since variations of cell‐mediated gel compaction due to different gel
composition could significantly affect tissue structure of the skeletal muscle
networks, a simple floating disk assay (Figure 4.5.A1) was conducted using
C2C12 myoblasts to characterize the time course of the cell/gel compaction and
examine the influence of gel composition (i.e., the mixing ratio of collagen and
fibrin gels) on the degree of compaction. The compaction largely occurred in the
first 2 days after gelation while the disk diameter remained unchanged after day
6 (Figure 4.5.A2). The “pure” collagen gel compacted significantly less than the
“pure” fibrin gel (69.5 ± 3.7% vs. 80.5 ± 2.1% decrease in the disc diameter after 10
days, n = 3). The composite gels compacted to a similar level independent of the
fraction of fibrin (collagen:fibrin 3:1, 77.5 ± 0.4%; 1:1, 77.3 ± 1.1%; 1:3, 81.5 ± 2.2%
64
decrease in the disc diameter after 10 days, n = 3 for each group). The increased
compaction of fibrin containing disks appeared to occur due to the increased
volume loss immediately upon gelation (Figure 4.5.A2).
The compaction of gels with different collagen:fibrin ratios was also tested
in tissue networks made of the NRSKMs. Interestingly, after the NRSKM
differentiation was initiated, tissue bundles in the networks containing collagen
gel exhibited significant thinning and eventually ruptured. In particular, the
NRSKM tissue networks made of “pure” collagen gel ruptured as early as 3 ‐ 4
days after switching to the differentiation medium (Figure 4.5.B1), concomitant
with the myotube fusion and the onset of spontaneous contractions, while the
networks made of composite gel with a 1:1 collagen:fibrin ratio ruptured on
differentiation days 10‐11 (Figure 4.5.B2) when tissue contractions were the most
vigorous. In contrast, tissue networks composed of only sporadically contracting
C2C12 myotubes in collagen containing gels remained intact even after 14 days
of differentiation. Importantly, despite significant thinning of the tissue bundles
and continuous contractions, the tissue networks made of “pure” fibrin gel
remained intact during the entire course of study, i.e., up to 17 days of
differentiation (Figure 4.5.B3). Therefore, “pure” fibrin gel was found to be
superior to “pure” collagen and composite collagen/fibrin gels as the scaffolding
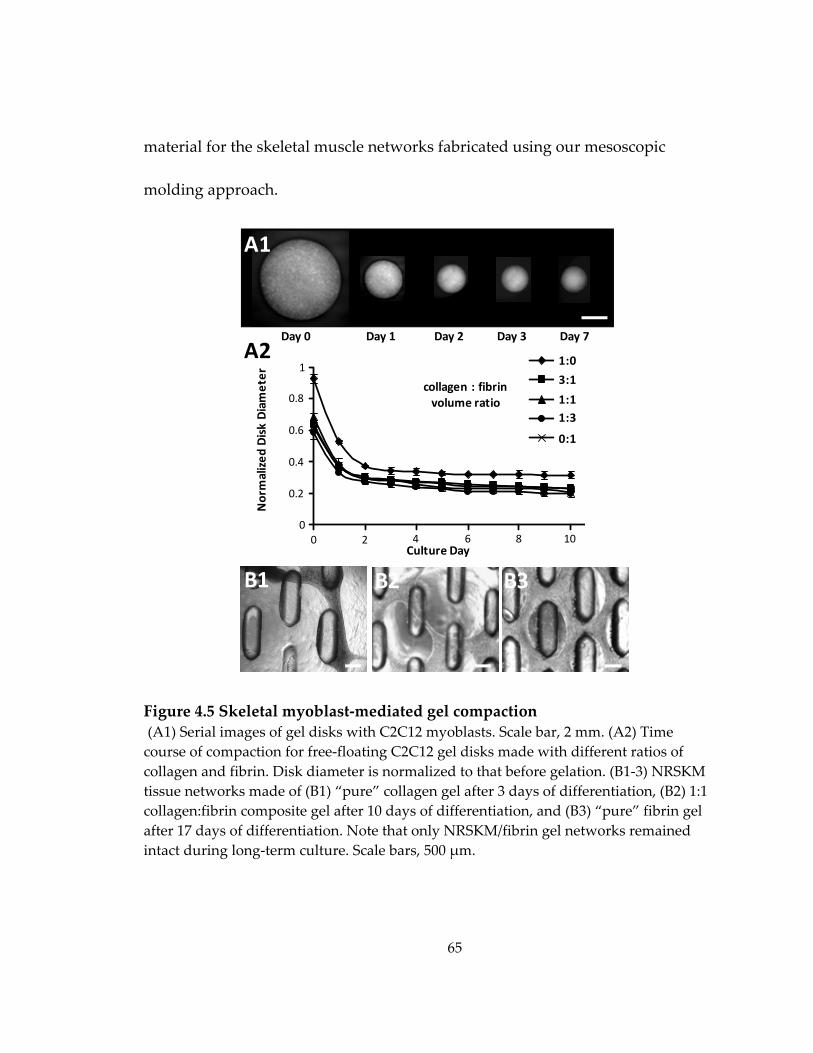
65
material for the skeletal muscle networks fabricated using our mesoscopic
molding approach.
Figure 4.5 Skeletal myoblast‐mediated gel compaction (A1) Serial images of gel disks with C2C12 myoblasts. Scale bar, 2 mm. (A2) Time course of compaction for free‐floating C2C12 gel disks made with different ratios of collagen and fibrin. Disk diameter is normalized to that before gelation. (B1‐3) NRSKM tissue networks made of (B1) “pure” collagen gel after 3 days of differentiation, (B2) 1:1 collagen:fibrin composite gel after 10 days of differentiation, and (B3) “pure” fibrin gel after 17 days of differentiation. Note that only NRSKM/fibrin gel networks remained intact during long‐term culture. Scale bars, 500 μm.
1 to3 to1 to1 to0 to
Culture Day
Normalized
Disk Diameter
collagen : fibrinvolume ratio
1:0
3:1
1:11:3
0:1
0 2 4 6 8 100
0.2
0.4
0.6
0.8
1A2
Day 0 Day 1 Day 2 Day 3
A1
B1 B2 B3
Day 7
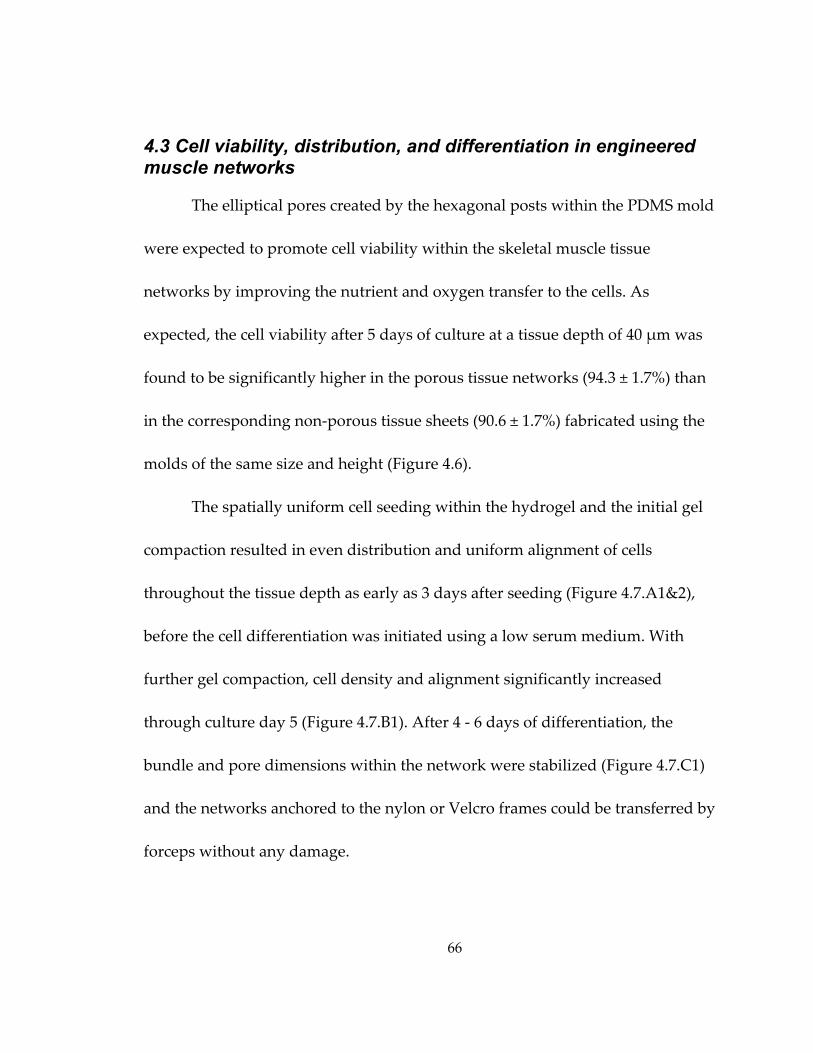
66
4.3 Cell viability, distribution, and differentiation in engineered muscle networks
The elliptical pores created by the hexagonal posts within the PDMS mold
were expected to promote cell viability within the skeletal muscle tissue
networks by improving the nutrient and oxygen transfer to the cells. As
expected, the cell viability after 5 days of culture at a tissue depth of 40 μm was
found to be significantly higher in the porous tissue networks (94.3 ± 1.7%) than
in the corresponding non‐porous tissue sheets (90.6 ± 1.7%) fabricated using the
molds of the same size and height (Figure 4.6).
The spatially uniform cell seeding within the hydrogel and the initial gel
compaction resulted in even distribution and uniform alignment of cells
throughout the tissue depth as early as 3 days after seeding (Figure 4.7.A1&2),
before the cell differentiation was initiated using a low serum medium. With
further gel compaction, cell density and alignment significantly increased
through culture day 5 (Figure 4.7.B1). After 4 ‐ 6 days of differentiation, the
bundle and pore dimensions within the network were stabilized (Figure 4.7.C1)
and the networks anchored to the nylon or Velcro frames could be transferred by
forceps without any damage.
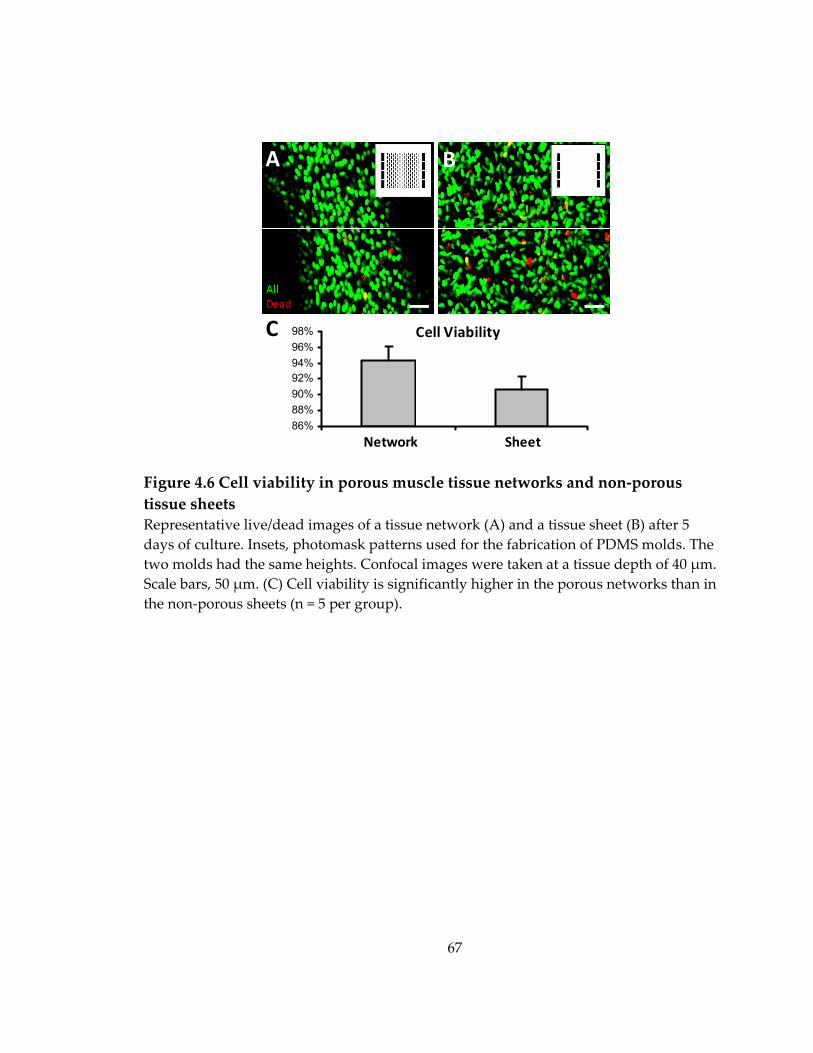
67
Figure 4.6 Cell viability in porous muscle tissue networks and non‐porous tissue sheets Representative live/dead images of a tissue network (A) and a tissue sheet (B) after 5 days of culture. Insets, photomask patterns used for the fabrication of PDMS molds. The two molds had the same heights. Confocal images were taken at a tissue depth of 40 μm. Scale bars, 50 μm. (C) Cell viability is significantly higher in the porous networks than in the non‐porous sheets (n = 5 per group).
86%88%90%92%94%96%98%
AllDead
Network Sheet
Cell Viability
A B
C
68
Figure 4.7 Distribution and differentiation of skeletal myoblasts in engineered muscle networks (A1‐2) Longitudinal cross‐sections of 3 day old tissue bundles showing evenly distributed cells throughout the tissue thickness. Scale bars, 50 μm. (B1‐3) Representative immunofluorescence images revealing densely packed and highly aligned skeletal muscle cells in the tissue networks after 4‐5 days of culture. Arrows in B2 and B3 denote the fusing myotubes. Scale bars, (B1) 50 μm, (B2) 200 μm, (B3) 20 μm. (C1‐3) Representative immunofluorescence images showing the ubiquitous differentiation of NRSKMs into striated myotubes after 10 days of culture. Virtually all fused nuclei were myogenin positive. Scale bars, (C1) 200 μm, (C2) 20 μm, (C3) 10 μm.
H&E
A
F‐actinDAPI
A1
α‐actininNuclei
B1
α‐actininMyogenin
C3
α‐actininNuclei
B2
F‐actinNuclei
B3
α‐actininNuclei
C2
A2
α‐actininNuclei
B1
α‐actininNuclei
C1
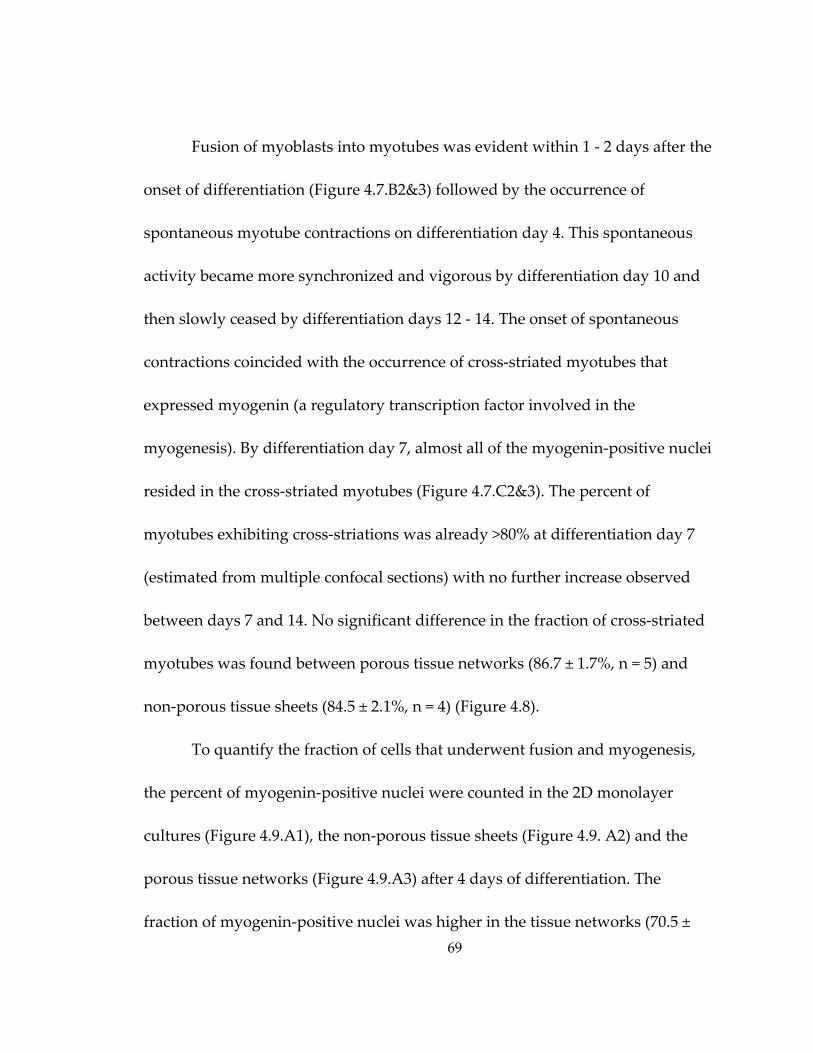
69
Fusion of myoblasts into myotubes was evident within 1 ‐ 2 days after the
onset of differentiation (Figure 4.7.B2&3) followed by the occurrence of
spontaneous myotube contractions on differentiation day 4. This spontaneous
activity became more synchronized and vigorous by differentiation day 10 and
then slowly ceased by differentiation days 12 ‐ 14. The onset of spontaneous
contractions coincided with the occurrence of cross‐striated myotubes that
expressed myogenin (a regulatory transcription factor involved in the
myogenesis). By differentiation day 7, almost all of the myogenin‐positive nuclei
resided in the cross‐striated myotubes (Figure 4.7.C2&3). The percent of
myotubes exhibiting cross‐striations was already >80% at differentiation day 7
(estimated from multiple confocal sections) with no further increase observed
between days 7 and 14. No significant difference in the fraction of cross‐striated
myotubes was found between porous tissue networks (86.7 ± 1.7%, n = 5) and
non‐porous tissue sheets (84.5 ± 2.1%, n = 4) (Figure 4.8).
To quantify the fraction of cells that underwent fusion and myogenesis,
the percent of myogenin‐positive nuclei were counted in the 2D monolayer
cultures (Figure 4.9.A1), the non‐porous tissue sheets (Figure 4.9. A2) and the
porous tissue networks (Figure 4.9.A3) after 4 days of differentiation. The
fraction of myogenin‐positive nuclei was higher in the tissue networks (70.5 ±
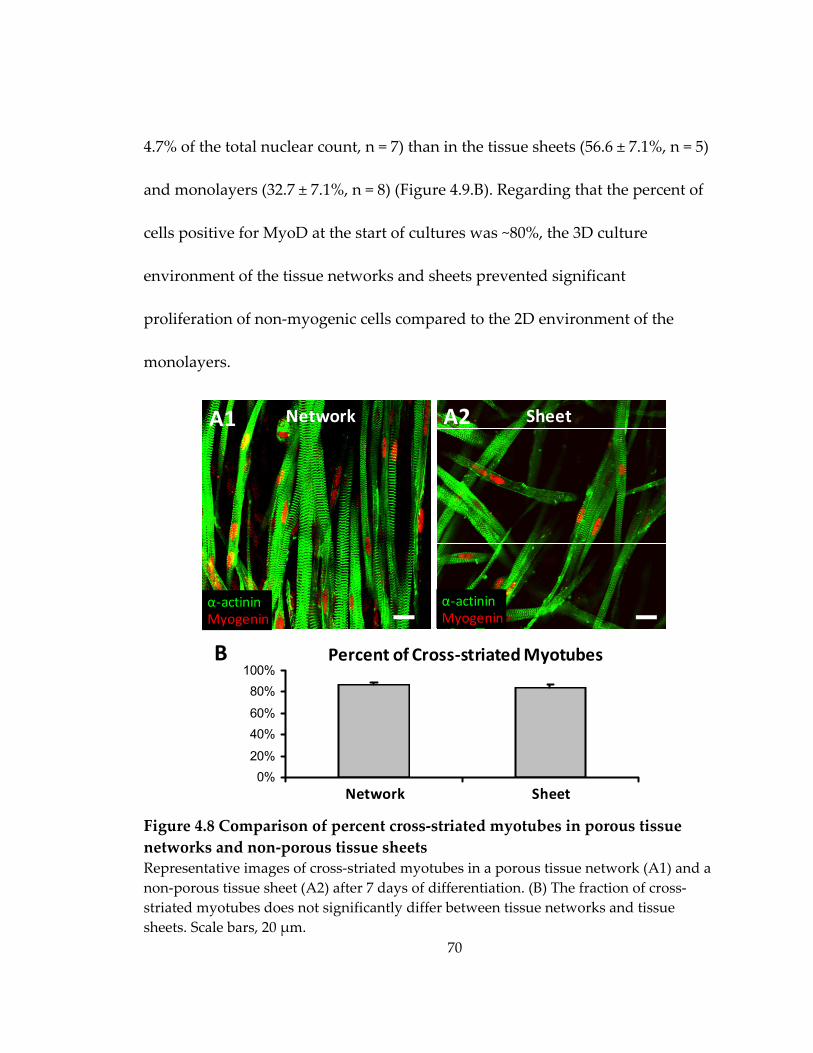
70
4.7% of the total nuclear count, n = 7) than in the tissue sheets (56.6 ± 7.1%, n = 5)
and monolayers (32.7 ± 7.1%, n = 8) (Figure 4.9.B). Regarding that the percent of
cells positive for MyoD at the start of cultures was ~80%, the 3D culture
environment of the tissue networks and sheets prevented significant
proliferation of non‐myogenic cells compared to the 2D environment of the
monolayers.
Figure 4.8 Comparison of percent cross‐striated myotubes in porous tissue networks and non‐porous tissue sheets Representative images of cross‐striated myotubes in a porous tissue network (A1) and a non‐porous tissue sheet (A2) after 7 days of differentiation. (B) The fraction of cross‐striated myotubes does not significantly differ between tissue networks and tissue sheets. Scale bars, 20 μm.
Network
α‐actininMyogenin
Sheet
0%20%
40%60%
80%100%
1 2Network Sheet
Percent of Cross‐striated Myotubes
α‐actininMyogenin
A1 A2
B
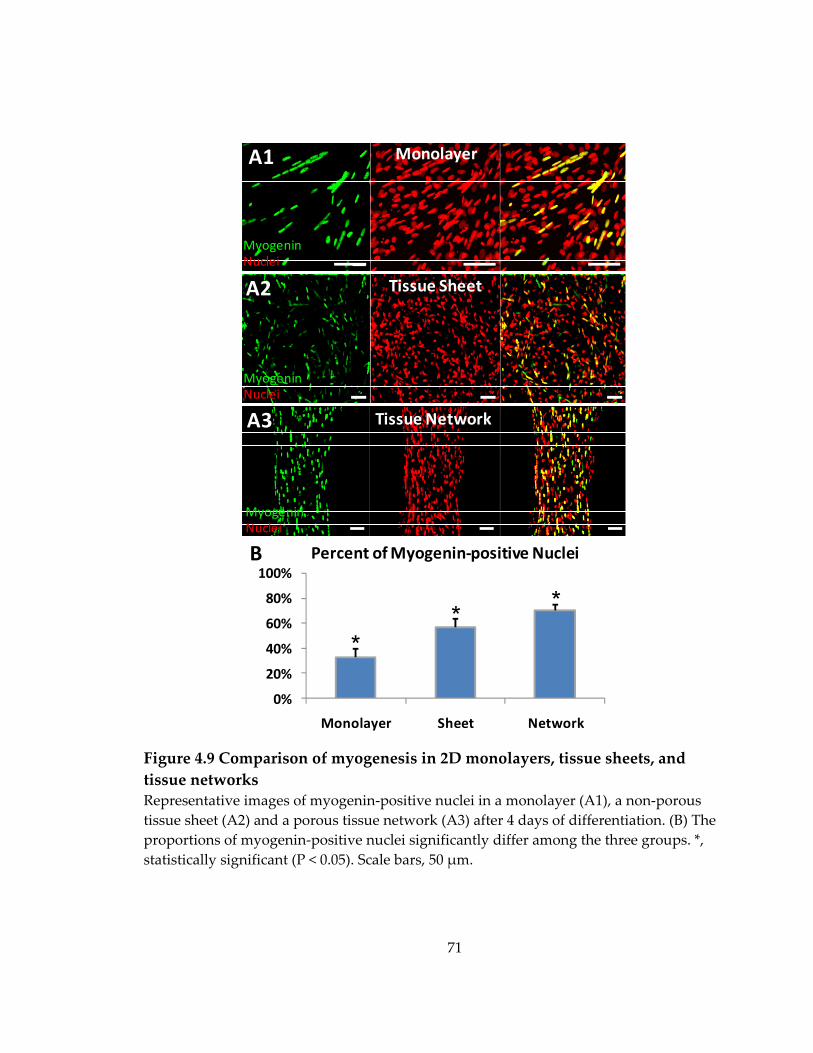
71
Figure 4.9 Comparison of myogenesis in 2D monolayers, tissue sheets, and tissue networks Representative images of myogenin‐positive nuclei in a monolayer (A1), a non‐porous tissue sheet (A2) and a porous tissue network (A3) after 4 days of differentiation. (B) The proportions of myogenin‐positive nuclei significantly differ among the three groups. *, statistically significant (P < 0.05). Scale bars, 50 μm.
0%
20%
40%
60%
80%
100%
Monolayer Sheet Network
MyogeninNuclei
MyogeninNuclei
A3
A1
A2
MyogeninNuclei
Tissue Sheet
Monolayer
Tissue Network
Percent of Myogenin‐positive NucleiB
* *
*
72
Simultaneously, virtually all MyoD‐positive myoblasts in the tissue
networks fused into myogenin‐positive myotubes and underwent further
maturation into aligned striated myofibers. Furthermore, lower percent of
myogenin‐positive cells in the same age non‐porous 3D tissue sheets (Figure
4.9.B), indicated that the local myoblast alignment, specific strain patterns,
and/or improved mass transfer through the tissue pores may all have
contributed to superior myoblast fusion and maturation within the network vs.
sheet 3D environments.
4.4 Control of tissue thickness
Without any geometrical constraints imposed in z‐direction, the final
thickness of our skeletal muscle networks was solely dependent on the degree of
cell‐mediated gel compaction and the height of PDMS molds (initially filled up
with cell/hydrogel solution). The tissue thickness was monitored over the 2 week
culture period using the non‐invasive 3D OCT imaging (Figure 4.10.A). The final
decrease in the tissue network thickness was found to be comparable with that
of the C2C12 myoblast disks (compare Figure 4.10.B and 4.5.A2), while the time
course of gel compaction was slower in NRSKM than C2C12 constructs, possibly
due to a longer time required by the NRSKMs to recover from enzymatic
isolation.
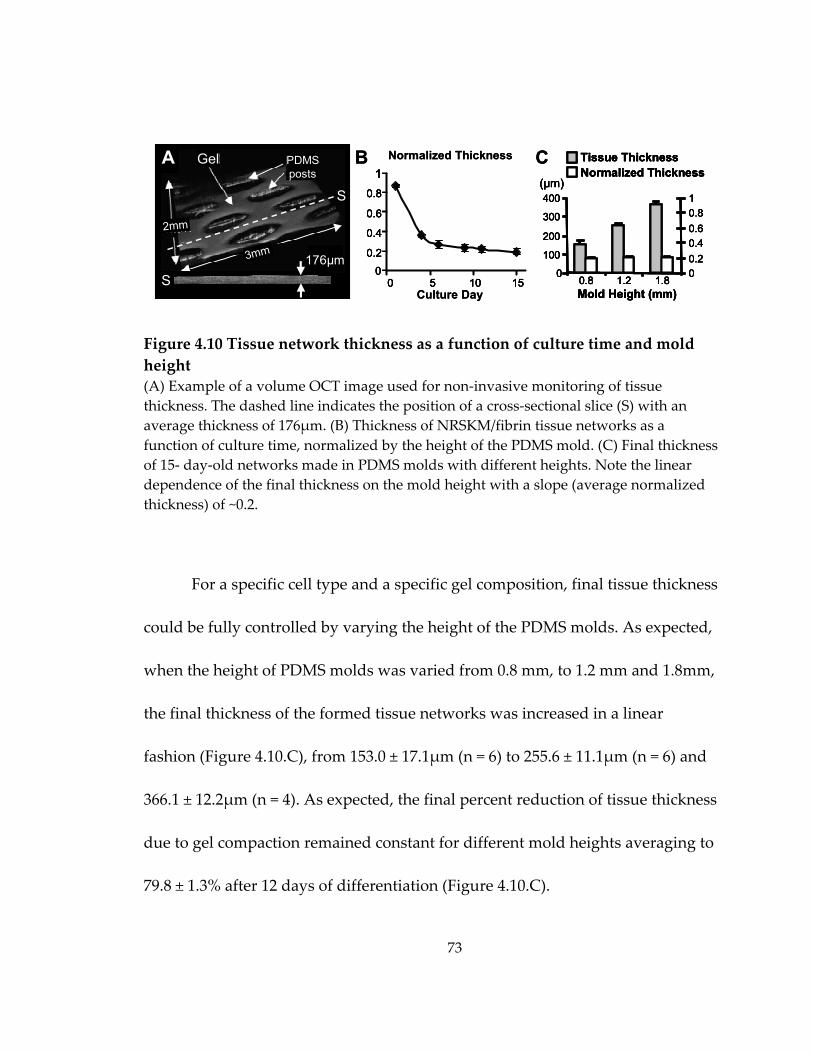
73
Figure 4.10 Tissue network thickness as a function of culture time and mold height (A) Example of a volume OCT image used for non‐invasive monitoring of tissue thickness. The dashed line indicates the position of a cross‐sectional slice (S) with an average thickness of 176μm. (B) Thickness of NRSKM/fibrin tissue networks as a function of culture time, normalized by the height of the PDMS mold. (C) Final thickness of 15‐ day‐old networks made in PDMS molds with different heights. Note the linear dependence of the final thickness on the mold height with a slope (average normalized thickness) of ~0.2.
For a specific cell type and a specific gel composition, final tissue thickness
could be fully controlled by varying the height of the PDMS molds. As expected,
when the height of PDMS molds was varied from 0.8 mm, to 1.2 mm and 1.8mm,
the final thickness of the formed tissue networks was increased in a linear
fashion (Figure 4.10.C), from 153.0 ± 17.1μm (n = 6) to 255.6 ± 11.1μm (n = 6) and
366.1 ± 12.2μm (n = 4). As expected, the final percent reduction of tissue thickness
due to gel compaction remained constant for different mold heights averaging to
79.8 ± 1.3% after 12 days of differentiation (Figure 4.10.C).
(μm)
Tissue ThicknessNormalized Thickness
Mold Height (mm)0.8 1.2 1.8
0
100
200
300
400
00.20.40.60.81
(μm)
Tissue ThicknessNormalized Thickness
Mold Height (mm)0.8 1.2 1.8
0
100
200
300
400
00.20.40.60.81
00.2
0.4
0.6
0.8
1
0 5 10 150
0.2
0.4
0.6
0.8
1
0 5 10 15
S
S176µm
2mm
3mm
PDMSposts
GelA B
Culture Day
Normalized Thickness C(μm)
Tissue ThicknessNormalized Thickness
Mold Height (mm)0.8 1.2 1.8
0
100
200
300
400
00.20.40.60.81
(μm)
Tissue ThicknessNormalized Thickness
Mold Height (mm)0.8 1.2 1.8
0
100
200
300
400
00.20.40.60.81
00.2
0.4
0.6
0.8
1
0 5 10 150
0.2
0.4
0.6
0.8
1
0 5 10 15
S
S176µm
2mm
3mm
PDMSposts
GelA B
Culture Day
Normalized Thickness C
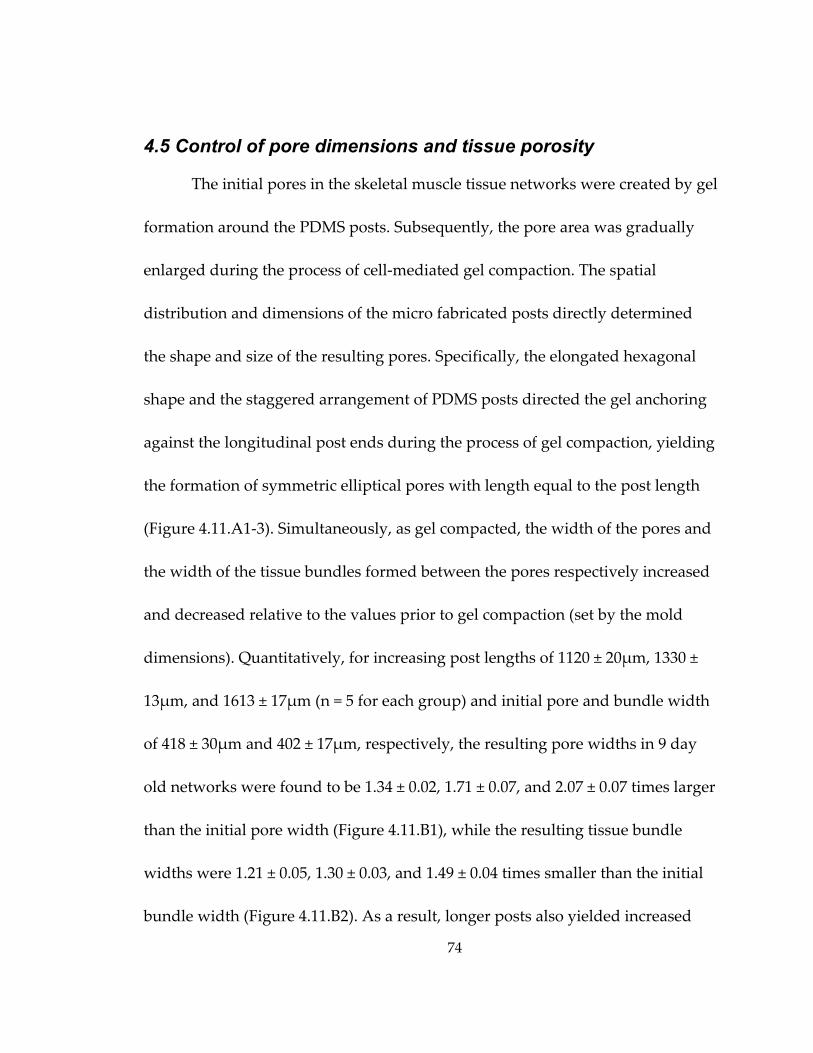
74
4.5 Control of pore dimensions and tissue porosity
The initial pores in the skeletal muscle tissue networks were created by gel
formation around the PDMS posts. Subsequently, the pore area was gradually
enlarged during the process of cell‐mediated gel compaction. The spatial
distribution and dimensions of the micro fabricated posts directly determined
the shape and size of the resulting pores. Specifically, the elongated hexagonal
shape and the staggered arrangement of PDMS posts directed the gel anchoring
against the longitudinal post ends during the process of gel compaction, yielding
the formation of symmetric elliptical pores with length equal to the post length
(Figure 4.11.A1‐3). Simultaneously, as gel compacted, the width of the pores and
the width of the tissue bundles formed between the pores respectively increased
and decreased relative to the values prior to gel compaction (set by the mold
dimensions). Quantitatively, for increasing post lengths of 1120 ± 20μm, 1330 ±
13μm, and 1613 ± 17μm (n = 5 for each group) and initial pore and bundle width
of 418 ± 30μm and 402 ± 17μm, respectively, the resulting pore widths in 9 day
old networks were found to be 1.34 ± 0.02, 1.71 ± 0.07, and 2.07 ± 0.07 times larger
than the initial pore width (Figure 4.11.B1), while the resulting tissue bundle
widths were 1.21 ± 0.05, 1.30 ± 0.03, and 1.49 ± 0.04 times smaller than the initial
bundle width (Figure 4.11.B2). As a result, longer posts also yielded increased
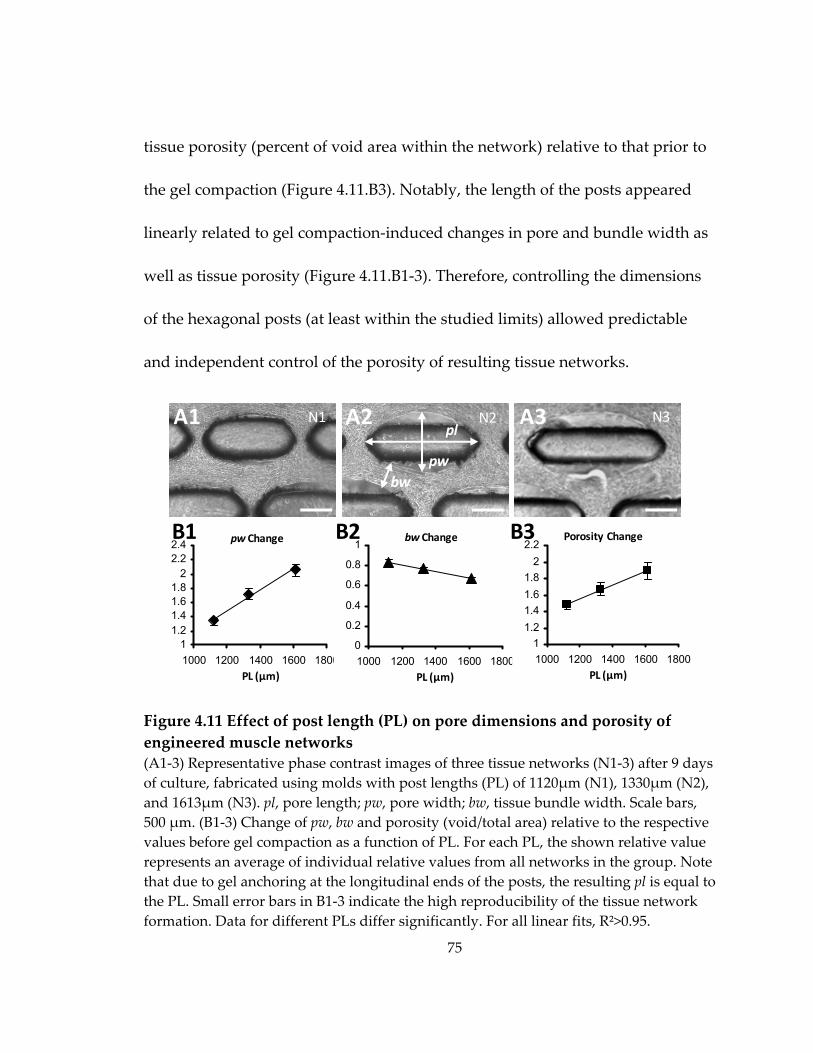
75
tissue porosity (percent of void area within the network) relative to that prior to
the gel compaction (Figure 4.11.B3). Notably, the length of the posts appeared
linearly related to gel compaction‐induced changes in pore and bundle width as
well as tissue porosity (Figure 4.11.B1‐3). Therefore, controlling the dimensions
of the hexagonal posts (at least within the studied limits) allowed predictable
and independent control of the porosity of resulting tissue networks.
Figure 4.11 Effect of post length (PL) on pore dimensions and porosity of engineered muscle networks (A1‐3) Representative phase contrast images of three tissue networks (N1‐3) after 9 days of culture, fabricated using molds with post lengths (PL) of 1120μm (N1), 1330μm (N2), and 1613μm (N3). pl, pore length; pw, pore width; bw, tissue bundle width. Scale bars, 500 μm. (B1‐3) Change of pw, bw and porosity (void/total area) relative to the respective values before gel compaction as a function of PL. For each PL, the shown relative value represents an average of individual relative values from all networks in the group. Note that due to gel anchoring at the longitudinal ends of the posts, the resulting pl is equal to the PL. Small error bars in B1‐3 indicate the high reproducibility of the tissue network formation. Data for different PLs differ significantly. For all linear fits, R²>0.95.
11.21.41.61.8
22.22.4
1000 1200 1400 1600 18000
0.2
0.4
0.6
0.8
1
1000 1200 1400 1600 18001
1.21.41.61.8
22.2
1000 1200 1400 1600 1800
pl
pwbw
A1 N2 N3
PL (µm) PL (µm)
bw Change Porosity Change
PL (µm)
N1
B1 pw Change
A2 A3
B3B2
76
4.6 Control of cell alignment
The use of elongated hexagonal posts to control the spatial pattern of gel
compaction not only allowed the precise control of the pore dimensions, but also
served to locally guide the cell alignment within the resulting tissue bundles
between the pores. Considering that tissue networks consisted of repeating
rectangular subunits with similar tissue structure, the global cell alignments
were compared (Figure 4.12.A1‐3) in networks, as well as the local alignments
within the formed tissue bundles (Figure 4.13), by studying representative
network subunits. For all the three studied post lengths, the mean (global) cell
alignment in the network was directed along the long axis of the posts (Figure
4.12.A1‐3). The deviations from the global alignment (22.8° ± 1.1°, 28.8° ± 1.9° and
25.3° ± 0.6°, Figure 4.12.B1) but not the deviations within tissue bundles (12.5° ±
3.5°, 12.1 ± 3.9° and 11.8 ± 3.7°, Figure 4.13.B) significantly differed for the three
post lengths, suggesting that pore shape is one of the factors that determined the
cell alignment in the network. In particular, the cells were expected to better
align along more elongated pores and at locations closer to the pore boundary.
Therefore, the deviation from the unidirectional cell alignment in a subunit was
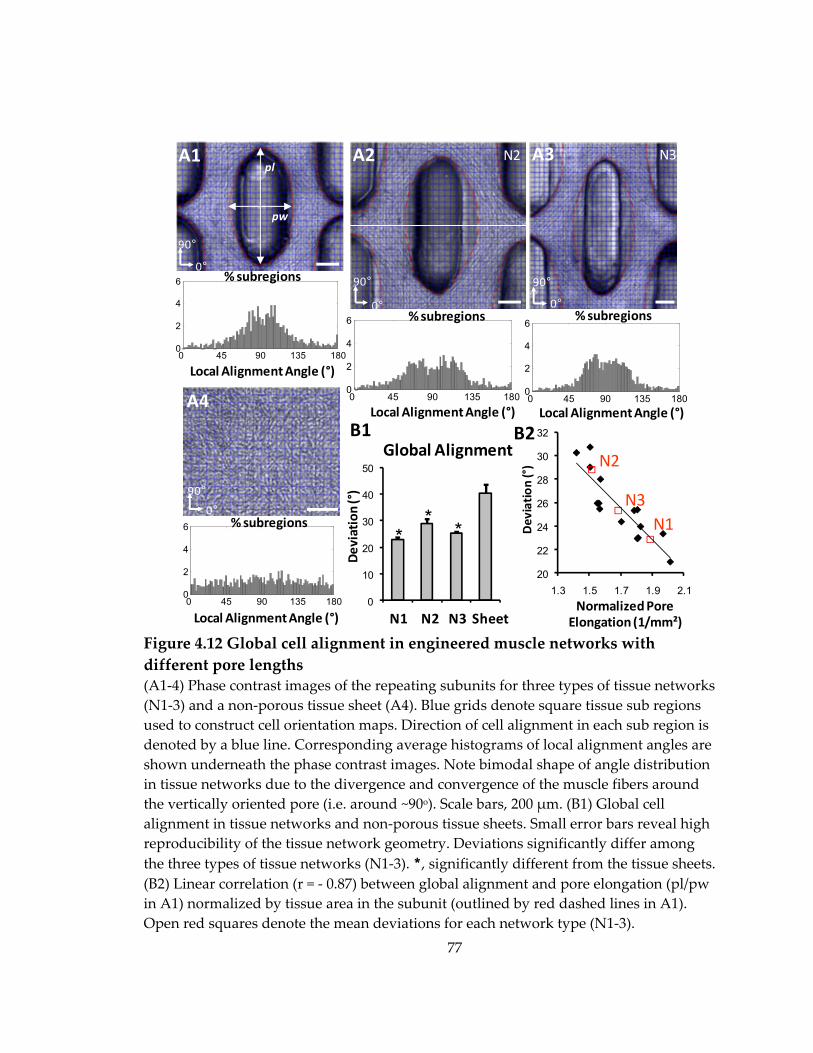
77
Figure 4.12 Global cell alignment in engineered muscle networks with different pore lengths (A1‐4) Phase contrast images of the repeating subunits for three types of tissue networks (N1‐3) and a non‐porous tissue sheet (A4). Blue grids denote square tissue sub regions used to construct cell orientation maps. Direction of cell alignment in each sub region is denoted by a blue line. Corresponding average histograms of local alignment angles are shown underneath the phase contrast images. Note bimodal shape of angle distribution in tissue networks due to the divergence and convergence of the muscle fibers around the vertically oriented pore (i.e. around ~90o). Scale bars, 200 μm. (B1) Global cell alignment in tissue networks and non‐porous tissue sheets. Small error bars reveal high reproducibility of the tissue network geometry. Deviations significantly differ among the three types of tissue networks (N1‐3). *, significantly different from the tissue sheets. (B2) Linear correlation (r = ‐ 0.87) between global alignment and pore elongation (pl/pw in A1) normalized by tissue area in the subunit (outlined by red dashed lines in A1). Open red squares denote the mean deviations for each network type (N1‐3).
0
10
20
30
40
50
20
22
24
26
28
30
32
1.3 1.5 1.7 1.9 2.1
0 45 90 135 1800
2
4
6
0 45 90 135 1800
2
4
6 % subregions
Local Alignment Angle (°)
0°
90°
A1
pw
pl
0 45 90 135 1800
2
4
6 % subregions
Local Alignment Angle (°)
0°90°
A4 0 45 90 135 1800
2
4
6% subregions % subregions
Local Alignment Angle (°) Local Alignment Angle (°)
N2 N3
0°
90°
0°90°
A2 A3
Deviation
(°)
N1 N2 N3 Sheet
Global AlignmentB1
** *
Normalized Pore Elongation (1/mm²)
Deviation
(°)
B2
N1
N2
N3
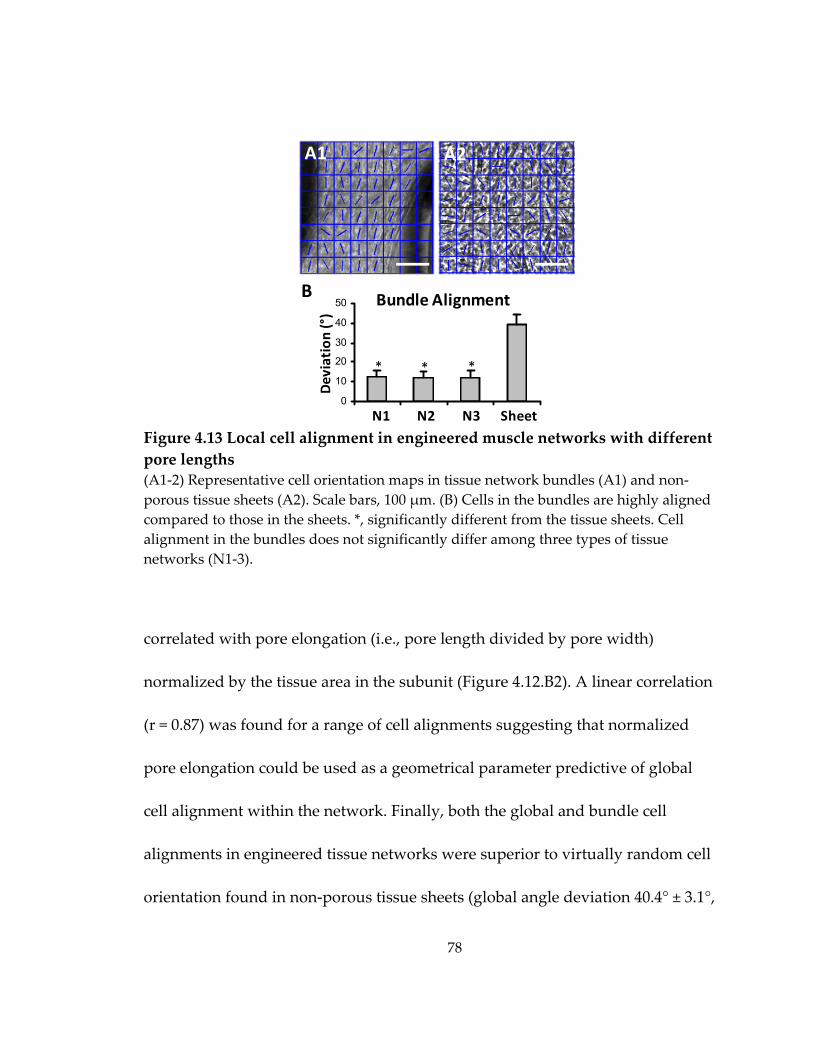
78
Figure 4.13 Local cell alignment in engineered muscle networks with different pore lengths (A1‐2) Representative cell orientation maps in tissue network bundles (A1) and non‐porous tissue sheets (A2). Scale bars, 100 μm. (B) Cells in the bundles are highly aligned compared to those in the sheets. *, significantly different from the tissue sheets. Cell alignment in the bundles does not significantly differ among three types of tissue networks (N1‐3).
correlated with pore elongation (i.e., pore length divided by pore width)
normalized by the tissue area in the subunit (Figure 4.12.B2). A linear correlation
(r = 0.87) was found for a range of cell alignments suggesting that normalized
pore elongation could be used as a geometrical parameter predictive of global
cell alignment within the network. Finally, both the global and bundle cell
alignments in engineered tissue networks were superior to virtually random cell
orientation found in non‐porous tissue sheets (global angle deviation 40.4° ± 3.1°,
B2A1 A2
0
10
20
30
40
50
N1 N2 N3 Sheet
Deviation
(°)
Bundle Alignment
* * *
B
79
Figure 4.12.A4 and local angle deviation in the central area of the sheet 39.4° ±
4.8°, Figure 4.13.B).
4.7 Control of regional cell orientation
The ability to precisely control local myofiber orientation within the
relatively large engineered muscle tissues may allow for the more efficient
structural and functional repair of complex muscle injuries (e.g. during aesthetic
reconstructions). To demonstrate the ability to locally control myofiber directions
in the tissue networks, I fabricated an abrupt change in the orientation of the
hexagonal posts in adjacent regions of the PDMS mold ranging from 30˚ to 90˚
(Figure 4.14.A1‐4). The tissue bundles that formed between the pores rapidly
changed orientation within the 500μm wide border between the two regions.
When traversing the border, long myotubes curved to adapt to changes in the
pore and bundle orientation (Figure 4.14.B1&2). Conceivably, by controlling the
shape and orientation of the individual posts within the mold (potentially based
on the histological or non‐invasive images of muscle structure), the local
directions of the muscle bundles and myofibers could be arranged into
customized engineered tissue structures with potential to better “blend in” with
the host muscle upon implantation.
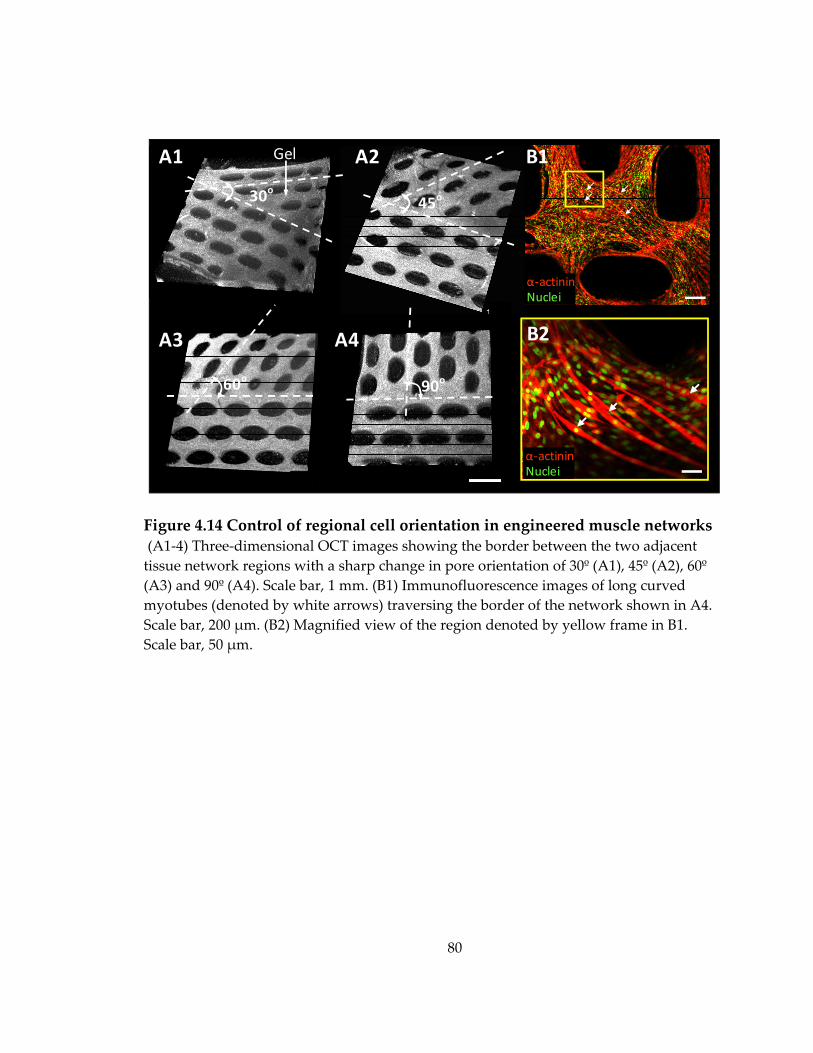
80
Figure 4.14 Control of regional cell orientation in engineered muscle networks (A1‐4) Three‐dimensional OCT images showing the border between the two adjacent tissue network regions with a sharp change in pore orientation of 30º (A1), 45º (A2), 60º (A3) and 90º (A4). Scale bar, 1 mm. (B1) Immunofluorescence images of long curved myotubes (denoted by white arrows) traversing the border of the network shown in A4. Scale bar, 200 μm. (B2) Magnified view of the region denoted by yellow frame in B1. Scale bar, 50 μm.
A1 A2
A3 A4
30o 45o
60o 90o
Gel B1
B2
α‐actininNuclei
α‐actininNuclei
81
4.8 Discussion
A novel mesoscopic hydrogel molding approach has been developed for
the reproducible fabrication of relatively large skeletal muscle tissue networks
made of viable, densely packed, highly aligned, cross‐striated, and
spontaneously contractile myofibers. The precise design of PDMS molds
containing an array of staggered, pore‐generating posts allowed us to
systematically control engineered tissue size, thickness, and porosity. The
presence of micro fabricated tissue pores facilitated nutrient and oxygen
transport within the relatively thick (100 ‐ 400 μm) and metabolically active
muscle constructs, thereby increasing the cell viability compared to that of non‐
porous muscle sheets and enabling the uniformly high cell density throughout
the entire tissue volume. Simultaneously, the shape, distribution and orientation
of the elongated PDMS posts governed the local cell‐mediated gel compaction
and enabled control of cell alignment over a relatively large area (0.5 ‐ 2 cm2). The
3D muscle tissue network environment limited the proliferation of non‐
myogenic cells and promoted the myoblast fusion and formation of myogenin‐
positive myofibers compared to both 2D myoblast monolayers and 3D non‐
porous muscle sheets.
82
4.8.1 A comparison with other solid scaffold- and hydrogel-based tissue engineering methods
Rapid 3D prototyping techniques have been recently employed for the
production of solid biodegradable polymer scaffolds with controlled pore size
and geometry[114]. However, these scaffolds are unsuitable for the engineering of
dense and highly ordered muscle tissues due to: 1) the discontinuities in tissue
structure created by the polymer scaffold and 2) the random structural and
biochemical changes that would result from the polymer degradation.
Alternatively, photopatterning and stereo lithographic techniques have been used
to directly fabricate soft tissue constructs in the form of reproducible, cell‐laden
hydrogel structures.[115] In particular, layer‐by‐layer assembly of photopatterned
poly‐ethylene glycol (PEG) hydrogels yielded the formation of functional 3D
hepatic tissue constructs with complex internal architecture and controllable
porosity.[92] Spatiotemporal 3D patterning of legends, growth factors,
extracellular matrix components and controlled release particles in micro
fabricated PEG hydrogels was also demonstrated using similar methods.[116]
However, the ability of modified and unmodified PEG hydrogels to support cell
proliferation, adhesion and spreading is, in general, inferior to the naturally
derived gels, such as fibrin and collagen. Importantly, unlike fibrin and collagen
83
gels, PEG hydrogel does not undergo significant cell‐mediated compaction that
allows for the: 1) high ultimate tissue density and 2) induction and control of cell
alignment by applying specific geometrical constraints, both of which are
required for the engineering of functional muscle tissues.
Therefore, for the fabrication of skeletal muscle tissue networks in this
study, we relied on the ability of skeletal myoblasts to exhibit stress fibers and
undergo alignment when collagen and fibrin gel compaction is restricted by
immobilization at one or more surfaces or points.[12, 65] Theoretical models
predict that this cell alignment arises from the imposed strains on the gel.[117]
Compaction of the gel is critically dependent on the engagement of integrins to
the cytoskeleton and contraction of the cytoskeleton. The stiffness of the 3D
reconstituted tissue is dependent upon actin polymerization inside the cells[118]
and the spatial rearrangement of gel fibers and has been shown to increase with
gel compaction.[119] Following compaction, the mechanical strength increases
further as collagen and other extracellular matrix proteins are synthesized by cells
in a proper 3D orientation.[120] This phenomenon has been previously utilized to
induce alignment of muscle cells in engineered blood vessels[120], skeletal and
cardiac muscle bundles[12, 65, 102] and heart valves[121]. Nevertheless, as the
specific geometrical constraints[82] were only applied at the outer boundary of
84
the gels, these methods were limited to achieving uniform cell alignment in
tissues with simple geometry (e.g., thin muscle bundles[12, 65] or rings[122]) or a
rough control of bulk cell alignment within a relative large tissue area (e.g., heart
valves[121]). In the current study, gel compaction between the boundaries of
staggered hexagonal posts was utilized to create a large number of interconnected
muscle bundles containing highly aligned cells. Importantly, control of the post
geometry, orientation, and distribution allowed for the precise control of the local
myofiber alignment throughout the entire tissue area.
4.8.2 The ability to independently control tissue thickness, porosity and cell alignment
In the specific setting of the molded muscle tissue networks, the nylon or
Velcro® frame was used to control (constrain) the total network area while
enabling the unconstrained compaction of the tissue thickness. Unconstrained gel
compaction to 20 ~ 30% of initial gel dimensions exerted by the primary neonatal
rat and mouse C2C12 skeletal myoblasts in this study (Figure 4.5.A2&C2) is
similar to those previously shown for C2C12 myoblasts and human fetal and
adult skeletal muscle cells[12, 65], but lower than the compactions induced by
neonatal rat cardiomyocytes[102], rat aortic smooth muscle cells[110] or bovine
chordal fibroblasts[123], confirming the dependence of the degree of gel
85
compaction on the specific cell type. Furthermore, the higher skeletal myoblast‐
mediated compaction of fibrin versus collagen gels found in this study was
consistent with previous findings for rat aortic smooth muscle cells[110]. In
contrast to the unconstrained gel compaction (Figure 4.5.A1‐2), where the initial
tissue area decreased ~25 times (~5 times for each dimension), constrained gel
compaction in the tissue network plane yielded only a 1.4‐1.7 times decrease in
the total gel area (i.e., a 1.5‐1.9 times increase in the tissue porosity, Figure
4.11.B3). Notably, this increase in the tissue porosity and the decrease in the
bundle width were linearly related to the length of the hexagonal posts (Figure
4.11.B2&3). While cell alignment within the tissue bundles was not affected by the
post length, the overall (global) cell alignment in the tissue network could be
predicted by measuring a geometrical parameter related to the pore length‐to‐
width ratio (elongation) per tissue area (Figure 4.12.B2). Taken together, the
described mesoscopic molding approach allowed the independent control of the
engineered muscle thickness, porosity, and cell alignment in a predictable and
reproducible fashion, by controlling the thickness of the PDMS mold, the length
and width of the hexagonal post and the area of the tissue network subunit.
86
4.8.3 High mechanical compliance of fibrin gel allows long-term culture of vigorously contracting skeletal muscle networks
An interesting finding of this study was that the vigorous contractions of
differentiated skeletal myofibers resulted in the rupture of collagen but not fibrin
gel based tissue networks. Higher mechanical stability of the contracting cell‐
laden fibrin gels in this study may stem from the improved endogenous synthesis
of extracellular matrix proteins (e.g. elastin, collagen I) that was previously shown
to occur in smooth muscle cells and dermal fibroblasts embedded in fibrin
compared with collagen gels[124, 125]. In addition, fibrin fibers have been shown
to exhibit two orders of magnitude lower stiffness (Young’s modulus, ~15 MPa)
than collagen fibrils (2 ‐ 5 GPa)[126, 127] and, similarly, pure fibrin gel based
smooth muscle tissue constructs were found to be more compliant than those
made of a mixture of collagen and fibrin gels or collagen gel alone[110]. Therefore,
the relatively thin network bundles with aligned, densely packed and
spontaneously contractile myofibers may be less prone to rupture when made of
more elastic fibrin gel than stiffer collagen gel. However, it is also possible that the
lower myofiber density and/or larger bundle diameter, previously used for the
engineering of single collagen gel based muscle bundles, would yield lower
87
contractile forces and therefore allow for the long‐term culture of intact muscle
tissue networks made of the collagen gel.
4.8.4 Potential substitutes for tumorigenic Matrigel and nylon/Velcro frame for future clinical applications
It is important to note that similar to other skeletal and cardiac muscle
tissue engineering approaches with hydrogel scaffolds[12, 65, 122], Matrigel was
also used in this study to promote muscle cell spreading and differentiation. It is
well recognized, however, that Matrigel cannot be used in human studies due to
its murine origin and potential tumorigenicity. Instead, a defined combination of
extracellular matrix proteins and/or growth factors similar to those identified for
engineered cardiac tissues[128], or a reconstituted human derived basement
membrane matrix[129] will need to be developed to enable potential translation of
this and similar approaches to clinics. Furthermore, a Velcro frame was used in
this study (and studies by others[12, 65, 102]) to anchor the cell/gel mixture and,
by acting as a surrogate for the native tendon, facilitated the generation of passive
tension and cell alignment. Although maintaining the tension of engineered
muscle for a certain period after implantation would likely be necessary to
prevent its atrophy, Velcro would not be used for this purpose because of its
potential to cause tissue inflammation. Instead, tissue engineered tendons or
88
segments of native tendon[16] or porous anchors made of biocompatible materials
(e.g. polyurethane, polycaprolactone, BioVyon[130], etc.) would be used to
facilitate the surgical attachment of the engineered muscle to the host tendon or
bone.
4.8.5 Future developments of mesoscopic molding methodology to engineer skeletal muscle with superior force generating capability
The potential of bioartificial skeletal muscle to generate contractile forces
comparable to those of the native muscle is critically dependent on the ability to
engineer dense, uniformly aligned, and differentiated myofibers throughout the
entire tissue volume. The superior force generating capability of the muscle tissue
networks is expected to arise from high myoblast density and alignment that both
mimic native tissue structure and facilitate muscle fusion and maturation. On the
other hand, the necessity to introduce pores (i.e., space void of muscle fibers)
within the engineered muscle in order to facilitate metabolic supply to the
embedded cells and fabricate thicker tissue constructs is expected to adversely
affect the tissue tensile strength and generated contractile force. Therefore, in
order to maximize the force generating capability of the engineered skeletal
muscle tissue networks, the tissue porosity should be minimized under
conditions of high cell viability, density and alignment. This goal could be
89
achieved by creating PDMS molds with tall and thin posts via the use of high
aspect ratio microfabrication. While our current ability to fabricate relatively thick
(several hundreds of microns to millimeters) features with 10:1 aspect ratio is
already approaching the limits of the UV photolithography, other techniques such
as X‐ray lithography[111] and high resolution stereolithography may offer room
for further improvements. In addition, minimizing the deviation from the global
and local unidirectional myofiber alignment within the engineered muscle tissue
is expected to further augment the generated contractile force (in the direction of
the cell alignment). While it is apparent that the elongated pore shape and
uniform pore distribution are needed to induce cell alignment throughout the
tissue network, a particular post geometry (e.g., hexagon, rectangle, diamond)
and subunit size that would yield maximum local and global cell alignment are
still to be determined. Future computational and experimental studies are thus
warranted to investigate the role of muscle tissue network topology in the
generation of contractile force. Finally, stacking the multiple networks (either in
vitro or during implantation), while maintaining the tissue porosity and viability,
would further augment the force generation capacity of the engineered muscle
tissue networks.
90
5. Force Generation in Engineered Muscle Networks with Varied Pore Lengths
This chapter describes how pores of different length within engineered
muscle tissue networks affect the generation of contractile force, local tissue
deformations during the application of uniaxial stretch, and passive tension‐
length relationships.
As demonstrated in section 4.5, the length of microfabricated PDMS posts
within tissue molds (post length, PL) directly determines the length, width, and
elongation (length/width) of elliptical pores in engineered muscle networks.
These changes in network topology in turn alter the local and overall alignment
of muscle fibers. As the variations in PL also affect the degree of cell‐mediated
gel compaction, and consequently myofiber volume density, I hypothesized that
skeletal muscle networks with more elongated pores would generate larger
contractile forces due to the increased total myofiber number and alignment.
This hypothesis was tested in the first part of this chapter.
Furthermore, immunostaining assessment (Figure 4.7) has revealed that
engineered muscle networks contain staggered elliptical pores with sides
bordered by bundles of aligned myotubes and ends separated by node regions
containing randomly oriented cells. I expected that under the application of
91
macroscopic uniaxial stretch at tissue edges, the presence of fabricated pores and
the resulting variations in myotube alignment would alter local tissue strains in
the muscle networks as compared to the non‐porous muscle sheets. Changing
the pore elongation would be expected to cause distinct patterns of local tissue
strains and potentially affect the macroscopic tension‐length relationship in the
tissue networks. These expectations were tested in the second part of this chapter.
5.1 Fabrication of engineered muscle networks with different pore lengths
Skeletal muscle tissue networks with different pore elongations were
fabricated by casting a mixture of NRSKMs, fibrin gel and Matrigel in PDMS
molds containing posts of three distinct lengths. Specifically, photomasks were
designed using Postscript language to contain an array of staggered posts (Figure
5.1.A1‐3) with post lengths (PLs) of 0.6 mm (Figure 5.1.A1), 1.2 mm (Figure
5.1.A2) or 1.8 mm (Figure 5.1.A3). Post width (PW), horizontal post spacing
(hPS), and vertical post spacing (vPS) were kept constant at 0.2, 0.5 and 0.3 mm,
respectively. Using the high aspect ratio soft lithography technique described in
section 4.1.1, master templates were obtained with an array of 1.5 mm tall
hexagonal posts with lengths of 0.62 ± 0.02 mm (Figure 5.1.B1), 1.19 ± 0.03 mm
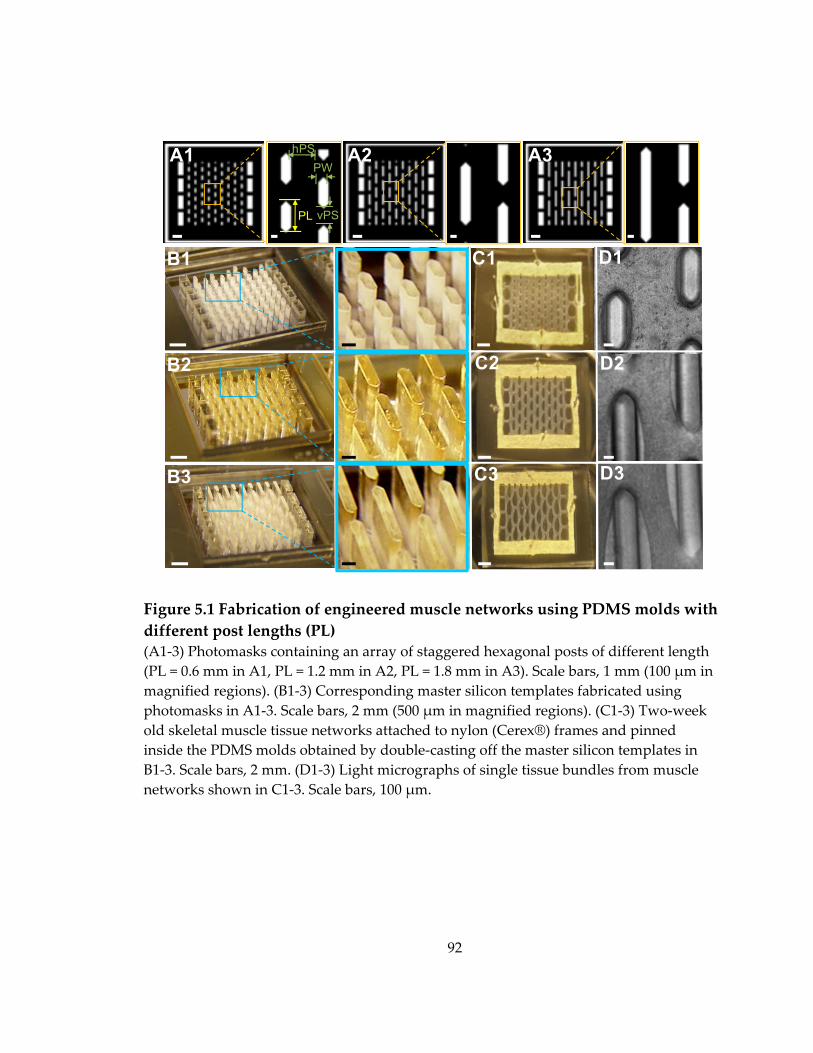
92
Figure 5.1 Fabrication of engineered muscle networks using PDMS molds with different post lengths (PL) (A1‐3) Photomasks containing an array of staggered hexagonal posts of different length (PL = 0.6 mm in A1, PL = 1.2 mm in A2, PL = 1.8 mm in A3). Scale bars, 1 mm (100 μm in magnified regions). (B1‐3) Corresponding master silicon templates fabricated using photomasks in A1‐3. Scale bars, 2 mm (500 μm in magnified regions). (C1‐3) Two‐week old skeletal muscle tissue networks attached to nylon (Cerex®) frames and pinned inside the PDMS molds obtained by double‐casting off the master silicon templates in B1‐3. Scale bars, 2 mm. (D1‐3) Light micrographs of single tissue bundles from muscle networks shown in C1‐3. Scale bars, 100 μm.
A1 A2 A3
B1
B2
B3
PL
D2
D3
C1
C2
C3
D1
PWhPS
vPS
93
(Figure 5.1.B2) and 1.81± 0.02 mm (Figure 5.1.B3). PDMS was then double‐cast
off the silicon templates to yield elastomeric molds. NRSKMs were mixed with
fibrin gel and Matrigel at a density of 10 million cells/ml of gel solution, injected
to fill the tissue molds, allowed to gel at 37°C for 45‐60 min, and cultured for 2
weeks (4 days in growth medium and 10 days in differentiation medium) to
allow myotube formation and maturation. As expected, the longer posts yielded
more elongated elliptical pores and thinner tissue bundles surrounding the pores
(Figure 5.1.C1‐3 and D1‐3).
5.2 Effects of varied post length on pore shape and gel compaction in engineered muscle networks
To quantify the effect of varying post length (PL) on morphometric
characteristics of muscle tissue networks, the final pore dimensions, tissue
bundle width, and tissue porosity and volume were compared among networks
made using PDMS molds with different PLs.
Pore length (pl), pore width (pw) and tissue bundle width (bw) were
measured from composite confocal F‐actin images of the entire skeletal muscle
network using Image J (Figure 5.2.A1‐3). Different PLs of 0.6, 1.2, and 1.8 mm
yielded pore lengths (pls) of 0.59 ± 0.01, 1.21 ± 0.01, and 1.84 ± 0.02 mm,
respectively (n = 8 per group), which, together with results from Chapter 4,
94
clearly demonstrates that the length of elliptical pores was solely determined by
the length of posts that created them (Figure 5.2.B). Pore width (pw) and tissue
bundle width (bw) also varied with changes in PL, such that longer posts yielded
wider pores and narrower (more compacted) tissue bundles (Figure 5.2.B). The
elongation (length‐to‐width ratio) of elliptical pores significantly increased with
the increase of PL, from 2.1 ± 0.2, to 2.9 ± 0.2 and 3.3 ± 0.2, for PLs of 0.6, 1.2, and
1.8 mm, respectively (Figure 5.2.B inset).
To further quantify the resulting changes in overall tissue porosity after 2
weeks of culture, acellular area determined from the composite F‐actin images of
the entire tissue network was divided by the total tissue area. Increase in PL
resulted in a significant increase in tissue porosity from 13.9 ± 0.9, to 28.4 ±
3.5and 42.0 ± 1.8%, for PL = 0.6, 1.2, and 1.8 mm, respectively (n = 5 per group,
Figure 5.2.C). Compared with the initial porosities estimated by the ratio of post
area (white area in the photomask, Figure 5.1.A1‐3) to the total mold area (i.e.,
10.7%, 14.7% and 17%, for PL = 0.6 mm, 1.2 mm and 1.8 mm, respectively), longer
posts led to a higher fold increase of porosity due to the cell‐mediated gel
compaction (1.3 ± 0.1, 1.9 ± 0.2 and 2.5 ± 0.1 fold increase, for PL = 0.6, 1.2, and
1.8mm, respectively).
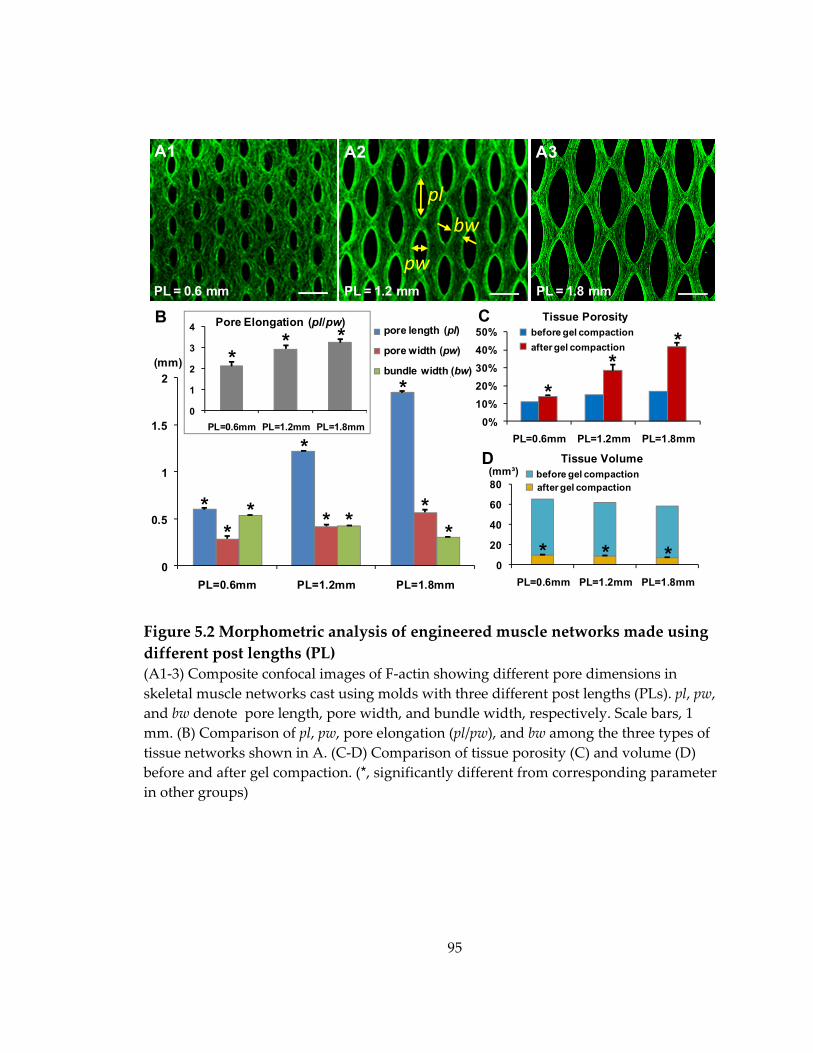
95
Figure 5.2 Morphometric analysis of engineered muscle networks made using different post lengths (PL) (A1‐3) Composite confocal images of F‐actin showing different pore dimensions in skeletal muscle networks cast using molds with three different post lengths (PLs). pl, pw, and bw denote pore length, pore width, and bundle width, respectively. Scale bars, 1 mm. (B) Comparison of pl, pw, pore elongation (pl/pw), and bw among the three types of tissue networks shown in A. (C‐D) Comparison of tissue porosity (C) and volume (D) before and after gel compaction. (*, significantly different from corresponding parameter in other groups)
0
0.5
1
1.5
2
PL=0.6mm PL=1.2mm PL=1.8mm
Pore Length (pl)
Pore Width (pw)
Bundle Width (bw)
pore length (pl)
pore width (pw)
*
*
*(mm)
A1 A2 A3
pl
pw
bw
B
0
1
2
3
4
PL=0.6mm PL=1.2mm PL=1.8mm
Pore Elongation (pl/pw)
** *
0%10%20%30%40%50%
PL=0.6mm PL=1.2mm PL=1.8mm
Series1Series2
Cbefore gel compactionafter gel compaction
Tissue Porosity
**
*
D Tissue Volume
0
20
40
60
80
PL=0.6mm PL=1.2mm PL=1.8mm
(mm³)after gel compactionbefore gel compaction
* * *
PL = 0.6 mm PL = 1.2 mm PL = 1.8 mm
bundle width (bw)
** * * *
*
96
Simultaneously, tissue thickness measured by 3D video‐rate optical
coherence tomography (OCT) was comparable in skeletal muscle networks made
with different PLs, amounting in average to 232 ± 5 μm (n = 3 per group). Total
tissue volumes estimated as (total area × porosity × thickness) were 9.51 ± 0.62,
8.46 ± 0.61, and 6.72 ± 0.42 mm³ for PL = 0.6, 1.2, and 1.8 mm, respectively (n = 5
per group, Figure 5.2.D). Compared with the initial cell/gel volumes of 55.85,
53.56, and 51.88 mm³ (for PL = 0.6, 1.2, and 1.8 mm, respectively) injected to fill
the tissue molds, the final tissue volumes significantly decreased with the
increase in PL by 83.0 ± 1.1, 84.2 ± 1.1, and 87.1 ± 0.8%, respectively, revealing
that the longer posts resulted in a higher degree of cell‐mediated gel compaction.
5.3 Effects of varied post length on global and local myofiber alignment in engineered muscle networks
As discussed in section 4.8.5, besides myofiber density, myofiber
alignment is the other critical determinant of the force generating capability of
skeletal muscle networks. Thus, similar to section 4.6, cell orientation maps were
generated from the F‐actin confocal images of myotubes embedded in tissue
networks and the degree of cell alignment on a scale of 0 ‐ 1 (0: randomly
orientated; 1: perfectly aligned) was estimated from the mean deviation of
orientation vectors in a region of interest (Figure 5.3.A&B1‐3). The degree of
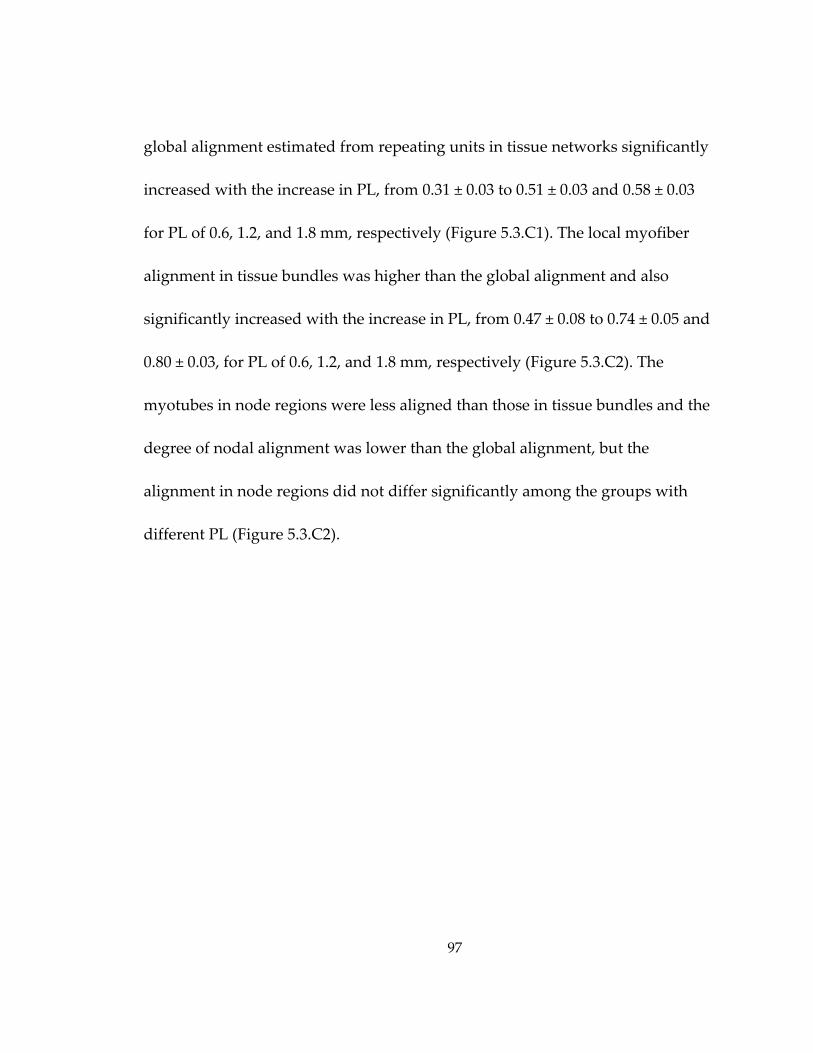
97
global alignment estimated from repeating units in tissue networks significantly
increased with the increase in PL, from 0.31 ± 0.03 to 0.51 ± 0.03 and 0.58 ± 0.03
for PL of 0.6, 1.2, and 1.8 mm, respectively (Figure 5.3.C1). The local myofiber
alignment in tissue bundles was higher than the global alignment and also
significantly increased with the increase in PL, from 0.47 ± 0.08 to 0.74 ± 0.05 and
0.80 ± 0.03, for PL of 0.6, 1.2, and 1.8 mm, respectively (Figure 5.3.C2). The
myotubes in node regions were less aligned than those in tissue bundles and the
degree of nodal alignment was lower than the global alignment, but the
alignment in node regions did not differ significantly among the groups with
different PL (Figure 5.3.C2).
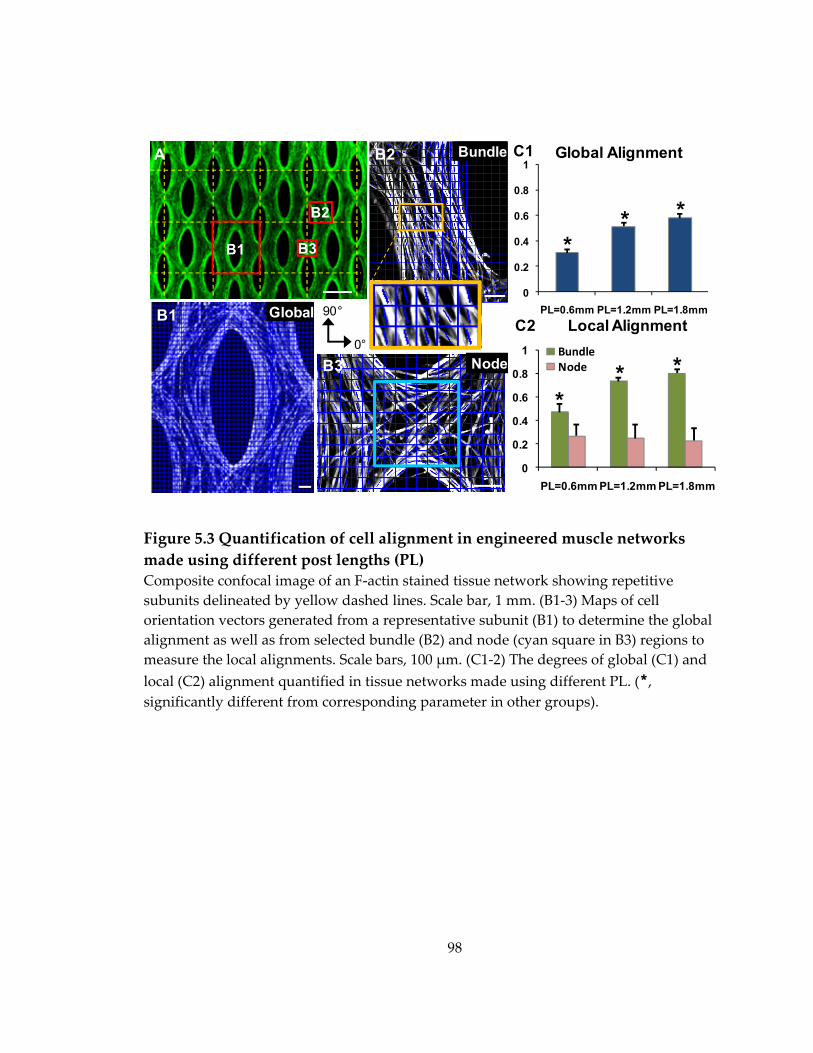
98
Figure 5.3 Quantification of cell alignment in engineered muscle networks made using different post lengths (PL) Composite confocal image of an F‐actin stained tissue network showing repetitive subunits delineated by yellow dashed lines. Scale bar, 1 mm. (B1‐3) Maps of cell orientation vectors generated from a representative subunit (B1) to determine the global alignment as well as from selected bundle (B2) and node (cyan square in B3) regions to measure the local alignments. Scale bars, 100 μm. (C1‐2) The degrees of global (C1) and local (C2) alignment quantified in tissue networks made using different PL. (*, significantly different from corresponding parameter in other groups).
0
0.2
0.4
0.6
0.8
1
PL=0.6mm PL=1.2mm PL=1.8mm
Series1Series2BundleNode
** *
0
0.2
0.4
0.6
0.8
1
PL=0.6mm PL=1.2mm PL=1.8mm
B1
B2
B3
B1
B2
B3
A C1 Global Alignment
Global
Node
Bundle
** *
C2 Local Alignment0°
90°
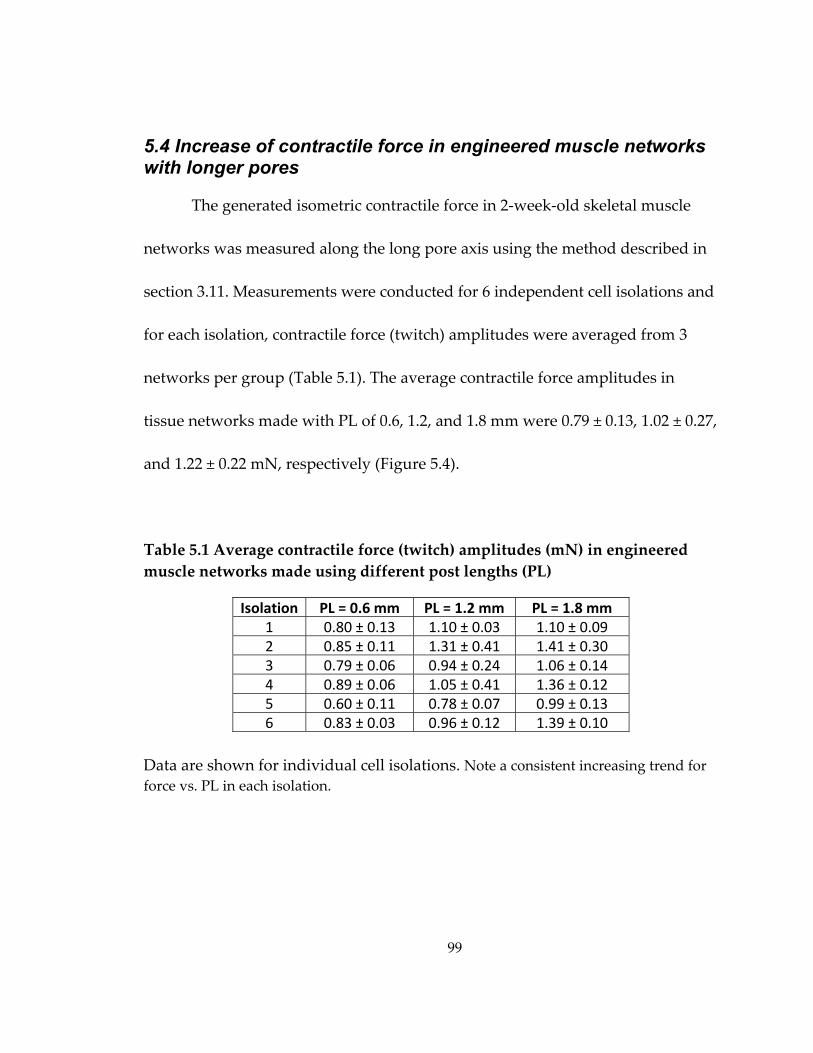
99
5.4 Increase of contractile force in engineered muscle networks with longer pores
The generated isometric contractile force in 2‐week‐old skeletal muscle
networks was measured along the long pore axis using the method described in
section 3.11. Measurements were conducted for 6 independent cell isolations and
for each isolation, contractile force (twitch) amplitudes were averaged from 3
networks per group (Table 5.1). The average contractile force amplitudes in
tissue networks made with PL of 0.6, 1.2, and 1.8 mm were 0.79 ± 0.13, 1.02 ± 0.27,
and 1.22 ± 0.22 mN, respectively (Figure 5.4).
Table 5.1 Average contractile force (twitch) amplitudes (mN) in engineered muscle networks made using different post lengths (PL)
Isolation PL = 0.6 mm PL = 1.2 mm PL = 1.8 mm 1 0.80 ± 0.13 1.10 ± 0.03 1.10 ± 0.09 2 0.85 ± 0.11 1.31 ± 0.41 1.41 ± 0.30 3 0.79 ± 0.06 0.94 ± 0.24 1.06 ± 0.14 4 0.89 ± 0.06 1.05 ± 0.41 1.36 ± 0.12 5 0.60 ± 0.11 0.78 ± 0.07 0.99 ± 0.13 6 0.83 ± 0.03 0.96 ± 0.12 1.39 ± 0.10
Data are shown for individual cell isolations. Note a consistent increasing trend for force vs. PL in each isolation.
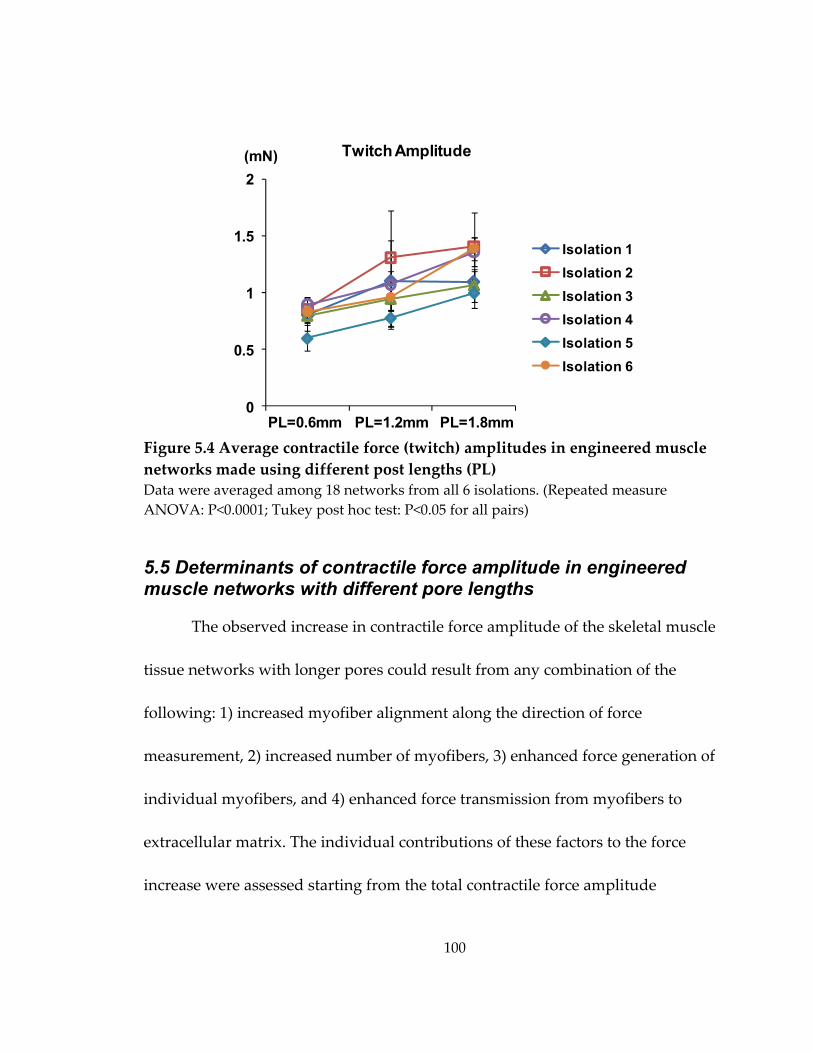
100
Figure 5.4 Average contractile force (twitch) amplitudes in engineered muscle networks made using different post lengths (PL) Data were averaged among 18 networks from all 6 isolations. (Repeated measure ANOVA: P<0.0001; Tukey post hoc test: P<0.05 for all pairs)
5.5 Determinants of contractile force amplitude in engineered muscle networks with different pore lengths
The observed increase in contractile force amplitude of the skeletal muscle
tissue networks with longer pores could result from any combination of the
following: 1) increased myofiber alignment along the direction of force
measurement, 2) increased number of myofibers, 3) enhanced force generation of
individual myofibers, and 4) enhanced force transmission from myofibers to
extracellular matrix. The individual contributions of these factors to the force
increase were assessed starting from the total contractile force amplitude
Twitch Amplitude(mN)
0
0.5
1
1.5
2
Isolation 1Isolation 2Isolation 3Isolation 4Isolation 5Isolation 6
PL=0.6mm PL=1.2mm PL=1.8mm
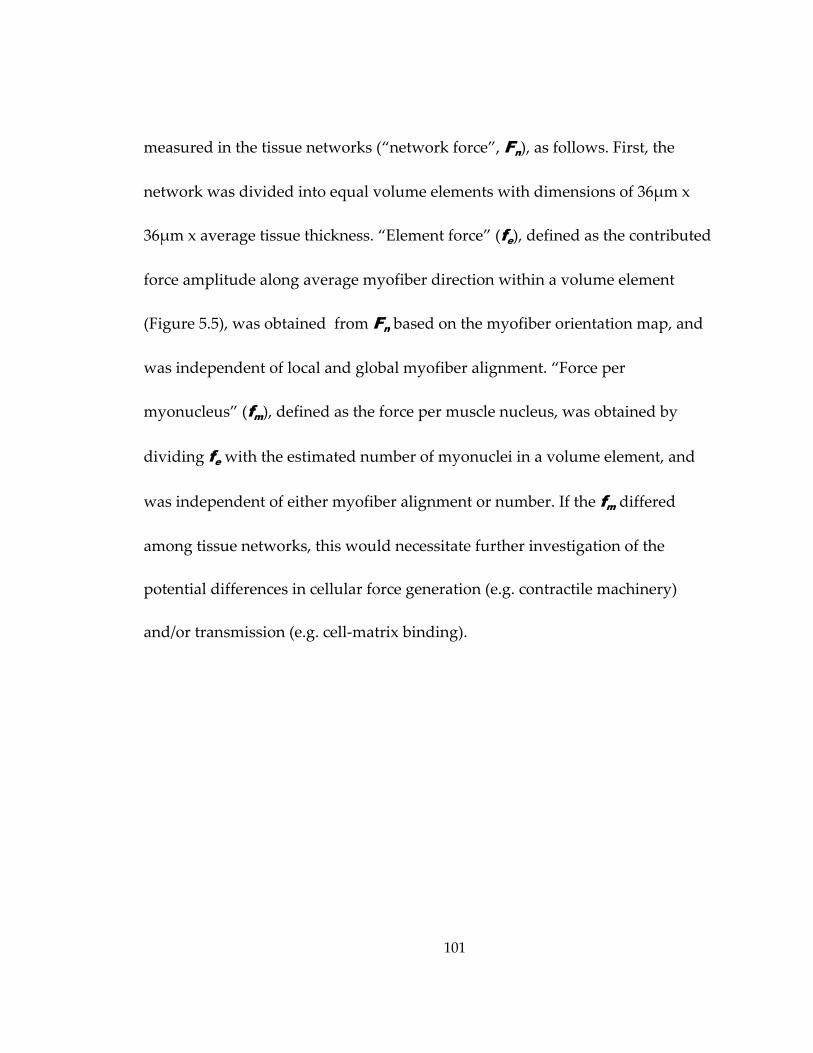
101
measured in the tissue networks (“network force”, Fn), as follows. First, the
network was divided into equal volume elements with dimensions of 36μm x
36μm x average tissue thickness. “Element force” (fe), defined as the contributed
force amplitude along average myofiber direction within a volume element
(Figure 5.5), was obtained from Fn based on the myofiber orientation map, and
was independent of local and global myofiber alignment. “Force per
myonucleus” (fm), defined as the force per muscle nucleus, was obtained by
dividing fe with the estimated number of myonuclei in a volume element, and
was independent of either myofiber alignment or number. If the fm differed
among tissue networks, this would necessitate further investigation of the
potential differences in cellular force generation (e.g. contractile machinery)
and/or transmission (e.g. cell‐matrix binding).
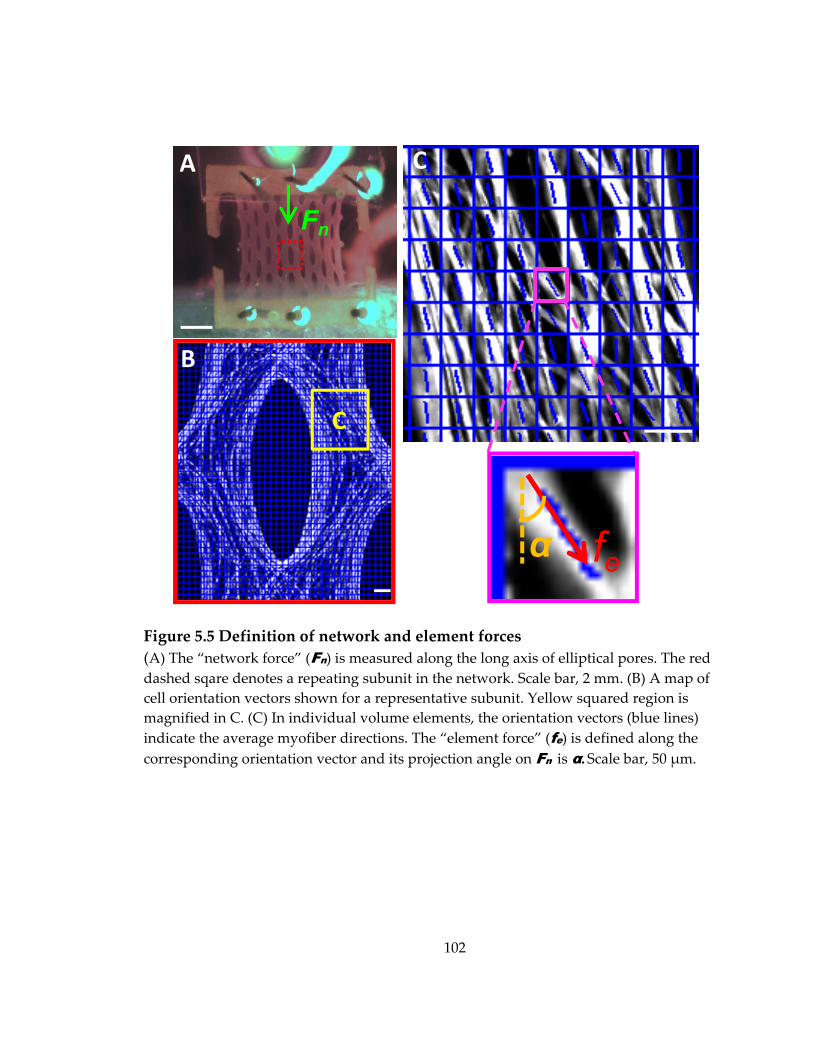
102
Figure 5.5 Definition of network and element forces (A) The “network force” (Fn) is measured along the long axis of elliptical pores. The red dashed sqare denotes a repeating subunit in the network. Scale bar, 2 mm. (B) A map of cell orientation vectors shown for a representative subunit. Yellow squared region is magnified in C. (C) In individual volume elements, the orientation vectors (blue lines) indicate the average myofiber directions. The “element force” (fe) is defined along the corresponding orientation vector and its projection angle on Fn is α. Scale bar, 50 μm.
Fn
feα
A
B
C
C
103
5.5.1 Derivation of fe and fm
Based on the detailed visual assessment of myofiber distribution and
incidence of cross‐striations, the muscle fibers were assumed to be uniformly
distributed and similarly differentiated throughout the entire volume of the
network. Based on this assumption, the “element force” (fe), was adopted as
constant in all volume elements. Furthermore, the networks were composed of
Nu repeating rectangular subunits (Figures 5.3.A and 5.5.A&B) with m elements
each. These repeating subunits were assumed to have identical myofiber
orientation pattern and to generate equal forces (Fu) in the direction of the
measured “network force” (Fn). The fe was then derived using the following
equation:
5.1
where αi is the projection angle of fe on the direction of Fn (Figure 5.5.C). This
angle was obtained from the orientation map of F‐actin labeled myotubes
derived as described in section 3.7.2.
The “force per myonucleus”(fm) was then obtained by dividing fe with the
myonuclear number (Nmyo) in a volume element, i.e.,

104
5.2
Based on the assumption that the fractions of muscle and non‐muscle cells and
cell volume density were constant throughout the entire network volume, the
Nmyo was estimated from the measured fraction of myogenin‐positive nuclei
(myogenin index, Imyogenin) and the number of total nuclei per volume element
(Ntotal) using the following equation:
5.3
Ntotal was calculated from the average DNA volume density (DNAvol), DNA
content per nucleus (DNAnucleus) and the volume of a volume element (Ve ) using
the following equation:
5.4
where DNAvol was obtained by dividing the measured total DNA content
(DNAtotal) with total volume (Vn) of the tissue network, i.e.,
/ 5.5
and DNAnucleus was measured as described in section 5.5.3.
105
5.5.2 Element force in engineered muscle networks as a function of post length
For each network, element forces fe was calculated starting from the
measurements of Fn and using equation 5.1 simplified as /
where ∑ ) was derived from the orientation maps of 3
subunits per network. The networks with PL of 0.6, 1.2, and 1.8 mm contained Nu
= 35, 20 and 15 subunits, respectively. Average fe was obtained from 3 networks
within each of the 6 isolations from Figure 5.4. The average fe calculated from all
18 networks was 34.2 ± 5.5, 43.7 ± 11.7, and 63.1 ± 11.5 nN for PL of 0.6, 1.2, and
1.8 mm, respectively (Figure 5.6). The fe in skeletal muscle tissue networks thus
significantly increased with the increase in PL.
Figure 5.6 Element force in engineered muscle networks made using different post lengths (PL)
0
20
40
60
80
100
Isolation 1Isolation 2Isolation 3Isolation 4Isolation 5Isolation 6
Element Force (fe) (nN)
PL=0.6mm PL=1.2mm PL=1.8mm
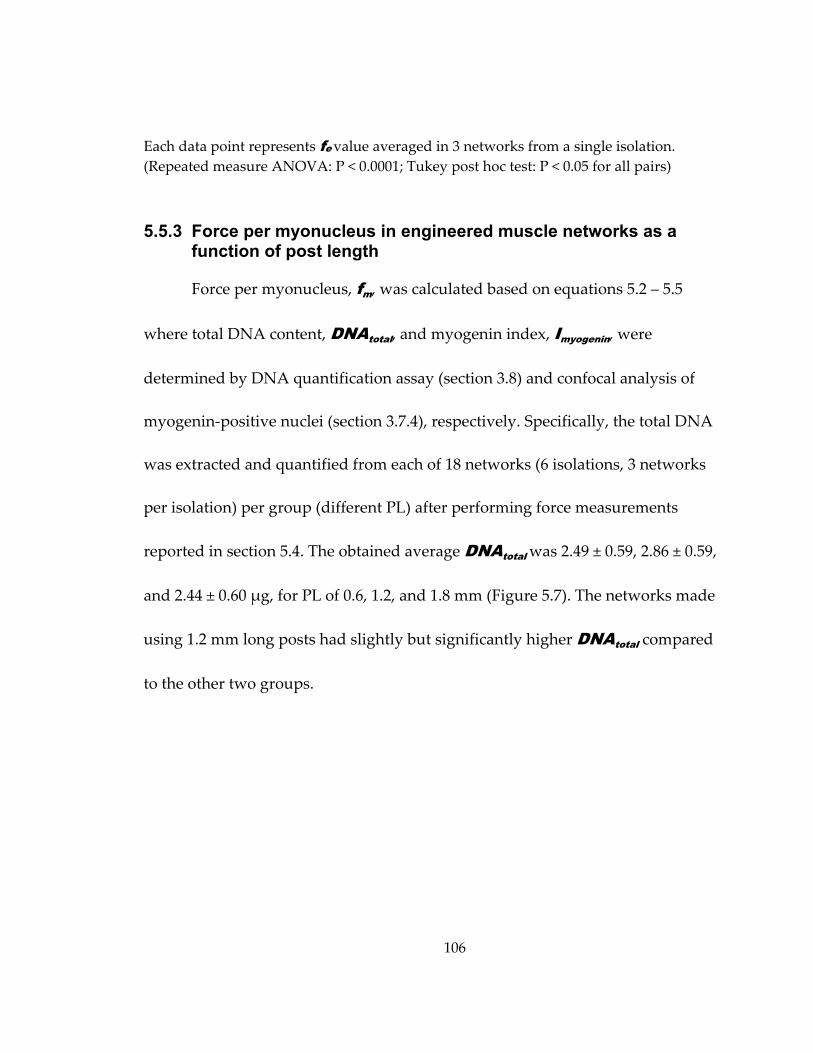
106
Each data point represents fe value averaged in 3 networks from a single isolation. (Repeated measure ANOVA: P < 0.0001; Tukey post hoc test: P < 0.05 for all pairs)
5.5.3 Force per myonucleus in engineered muscle networks as a function of post length
Force per myonucleus, fm, was calculated based on equations 5.2 – 5.5
where total DNA content, DNAtotal, and myogenin index, Imyogenin, were
determined by DNA quantification assay (section 3.8) and confocal analysis of
myogenin‐positive nuclei (section 3.7.4), respectively. Specifically, the total DNA
was extracted and quantified from each of 18 networks (6 isolations, 3 networks
per isolation) per group (different PL) after performing force measurements
reported in section 5.4. The obtained average DNAtotal was 2.49 ± 0.59, 2.86 ± 0.59,
and 2.44 ± 0.60 μg, for PL of 0.6, 1.2, and 1.8 mm (Figure 5.7). The networks made
using 1.2 mm long posts had slightly but significantly higher DNAtotal compared
to the other two groups.
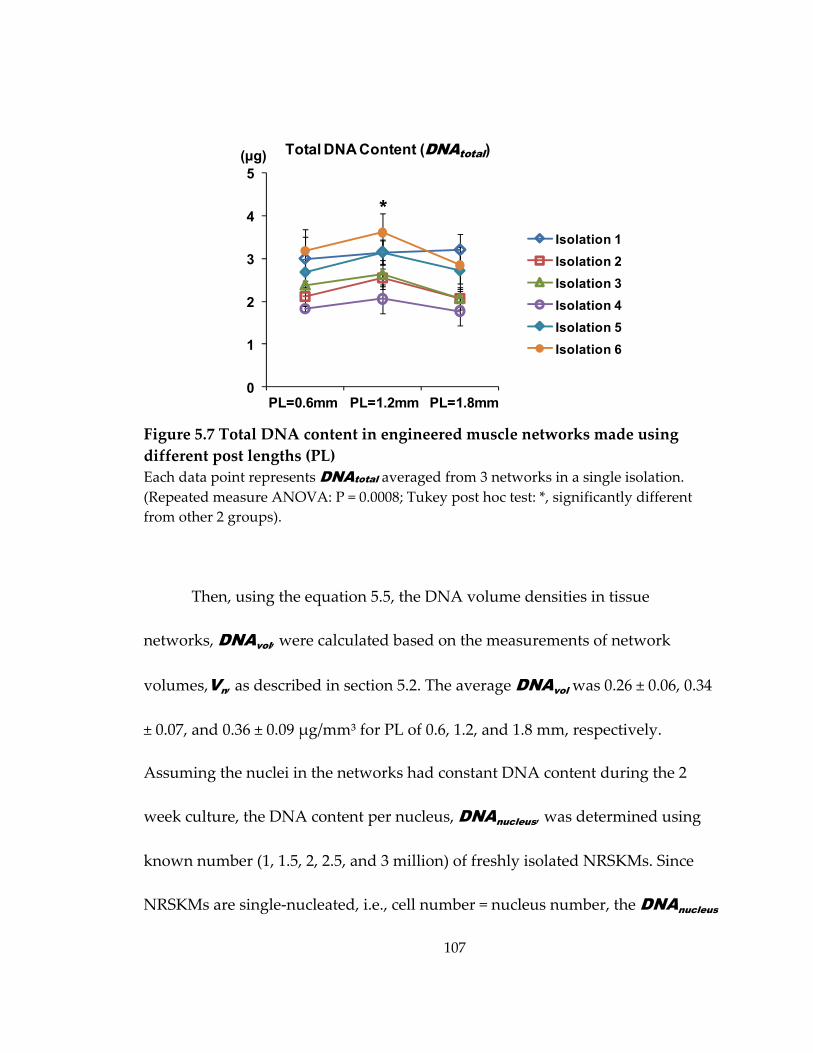
107
Figure 5.7 Total DNA content in engineered muscle networks made using different post lengths (PL) Each data point represents DNAtotal averaged from 3 networks in a single isolation. (Repeated measure ANOVA: P = 0.0008; Tukey post hoc test: *, significantly different from other 2 groups).
Then, using the equation 5.5, the DNA volume densities in tissue
networks, DNAvol, were calculated based on the measurements of network
volumes,Vn, as described in section 5.2. The average DNAvol was 0.26 ± 0.06, 0.34
± 0.07, and 0.36 ± 0.09 μg/mm³ for PL of 0.6, 1.2, and 1.8 mm, respectively.
Assuming the nuclei in the networks had constant DNA content during the 2
week culture, the DNA content per nucleus, DNAnucleus, was determined using
known number (1, 1.5, 2, 2.5, and 3 million) of freshly isolated NRSKMs. Since
NRSKMs are single‐nucleated, i.e., cell number = nucleus number, the DNAnucleus
0
1
2
3
4
5
Isolation 1Isolation 2Isolation 3Isolation 4Isolation 5Isolation 6
Total DNA Content (DNAtotal) (µg)
*
PL=0.6mm PL=1.2mm PL=1.8mm
108
was derived from the liner fit of extracted total DNA vs. cell number graph. The
average DNAnucleus from 3 independent isolations was 2.2 ± 0.5 pg/nucleus,
which is similar to the previously reported value for primary skeletal muscle
cells[131]. The average number of nuclei per volume element (Ntotal) calculated
using equation 5.4 was 35.1 ± 8.4, 47.0 ± 9.6 and 49.7 ± 12.2 for PL of 0.6 mm, 1.2
mm and 1.8 mm, respectively (Figure 5.8). The networks made using 0.6 mm
long posts had slightly but significantly lower Ntotal compared to the other two
groups.
Figure 5.8 Total nuclear number per volume element in engineered muscle networks made using different post lengths (PL) Each data point represents Ntotal averaged from 3 networks in a single isolation. (Repeated measure ANOVA: P < 0.0001; Tukey post hoc test: *, significantly different from other 2 groups).
0
10
20
30
40
50
60
70
80
Isolation 1Isolation 2Isolation 3Isolation 4Isolation 5Isolation 6
Total Nuclear Number per Volume Element (Ntotal)
*
PL=0.6mm PL=1.2mm PL=1.8mm
109
Finally, the Imyogenin in tissue bundles and nodes of the networks made
using three different PLs was derived from immunostaining images by dividing
the number of myogenin‐positive nuclei with the number of all DAPI‐labeled
nuclei (Figure 5.9.A1‐3). Imyogenin, for the network was obtained by weight‐
averaging Imyogenin, in bundles and nodes with their respective fractional areas in
the network. This network Imyogenin was then used to calculate fm. As virtually all
of the myogenin‐positive nuclei resided within the force‐generating
multinucleated myotubes (Figure 5.9.A1‐3), the Imyogenin approximately
represented the active muscle cell fraction. The average Imyogenin was 32.7 ± 5.0%,
34.2 ± 4.6%, and 44.9 ± 4.4% for PL of 0.6, 1.2, and 1.8 mm (4 networks per group
with 3 bundles and 3 nodes analyzed per network and 3 images at depths of 50,
100 and 150 μm analyzed per each bundle and node), respectively (Figure 5.9.B).
The networks made using 1.8 mm long posts had significantly higher Imyogenin
compared to the other two groups.
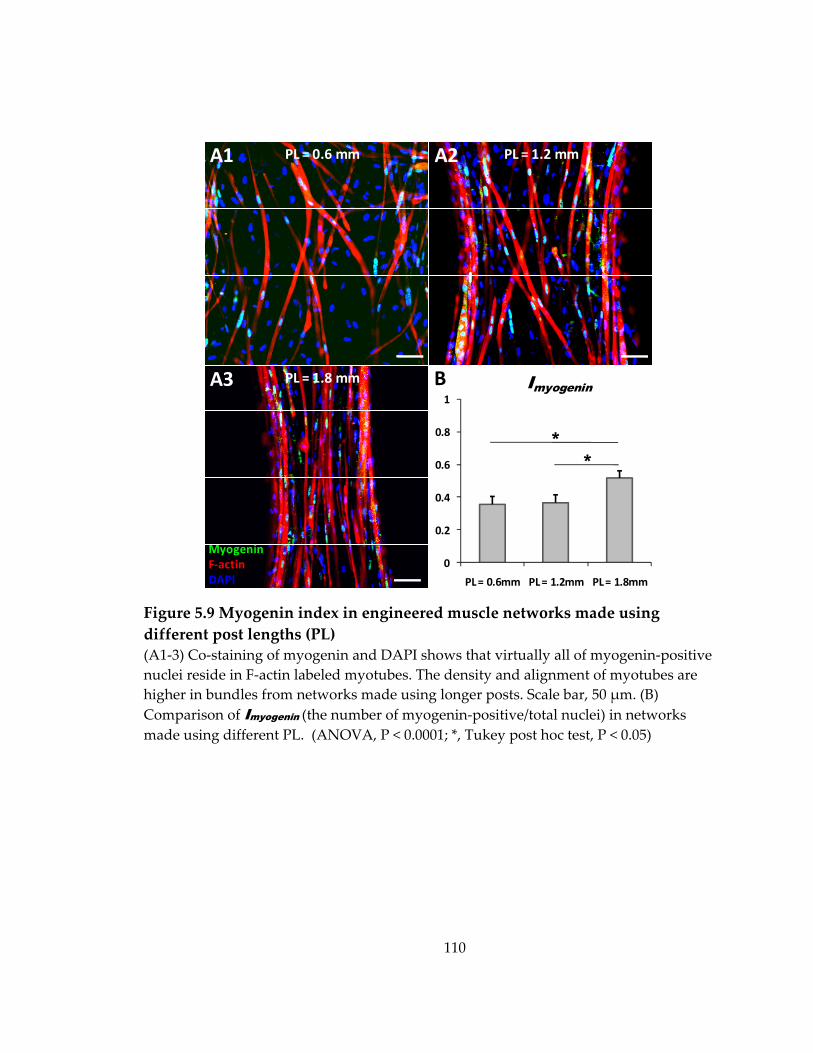
110
Figure 5.9 Myogenin index in engineered muscle networks made using different post lengths (PL) (A1‐3) Co‐staining of myogenin and DAPI shows that virtually all of myogenin‐positive nuclei reside in F‐actin labeled myotubes. The density and alignment of myotubes are higher in bundles from networks made using longer posts. Scale bar, 50 μm. (B) Comparison of Imyogenin (the number of myogenin‐positive/total nuclei) in networks made using different PL. (ANOVA, P < 0.0001; *, Tukey post hoc test, P < 0.05)
0
0.2
0.4
0.6
0.8
1
PL = 0.6mm PL = 1.2mm PL = 1.8mm
MyogeninF‐actinDAPI
A1 A2
A3
PL = 0.6 mm PL = 1.2 mm
PL = 1.8 mm B Imyogenin
**
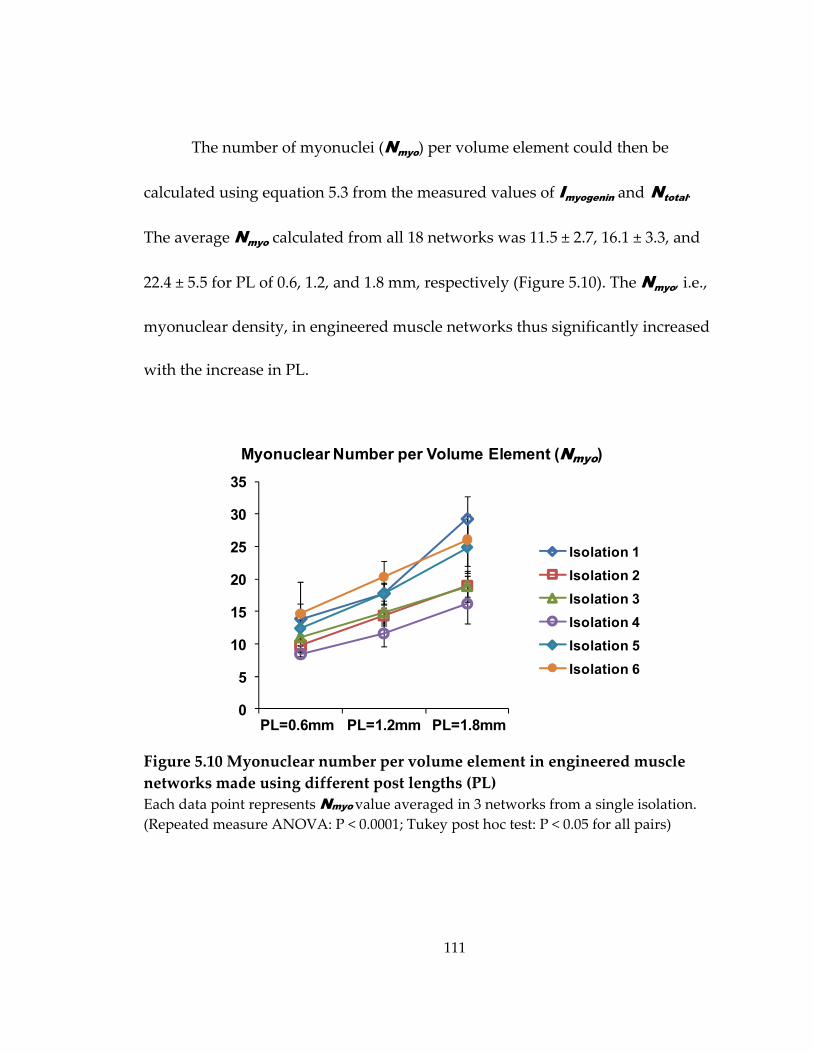
111
The number of myonuclei (Nmyo) per volume element could then be
calculated using equation 5.3 from the measured values of Imyogenin and Ntotal.
The average Nmyo calculated from all 18 networks was 11.5 ± 2.7, 16.1 ± 3.3, and
22.4 ± 5.5 for PL of 0.6, 1.2, and 1.8 mm, respectively (Figure 5.10). The Nmyo, i.e.,
myonuclear density, in engineered muscle networks thus significantly increased
with the increase in PL.
Figure 5.10 Myonuclear number per volume element in engineered muscle networks made using different post lengths (PL) Each data point represents Nmyo value averaged in 3 networks from a single isolation. (Repeated measure ANOVA: P < 0.0001; Tukey post hoc test: P < 0.05 for all pairs)
Myonuclear Number per Volume Element (Nmyo)
0
5
10
15
20
25
30
35
Isolation 1Isolation 2Isolation 3Isolation 4Isolation 5Isolation 6
PL=0.6mm PL=1.2mm PL=1.8mm
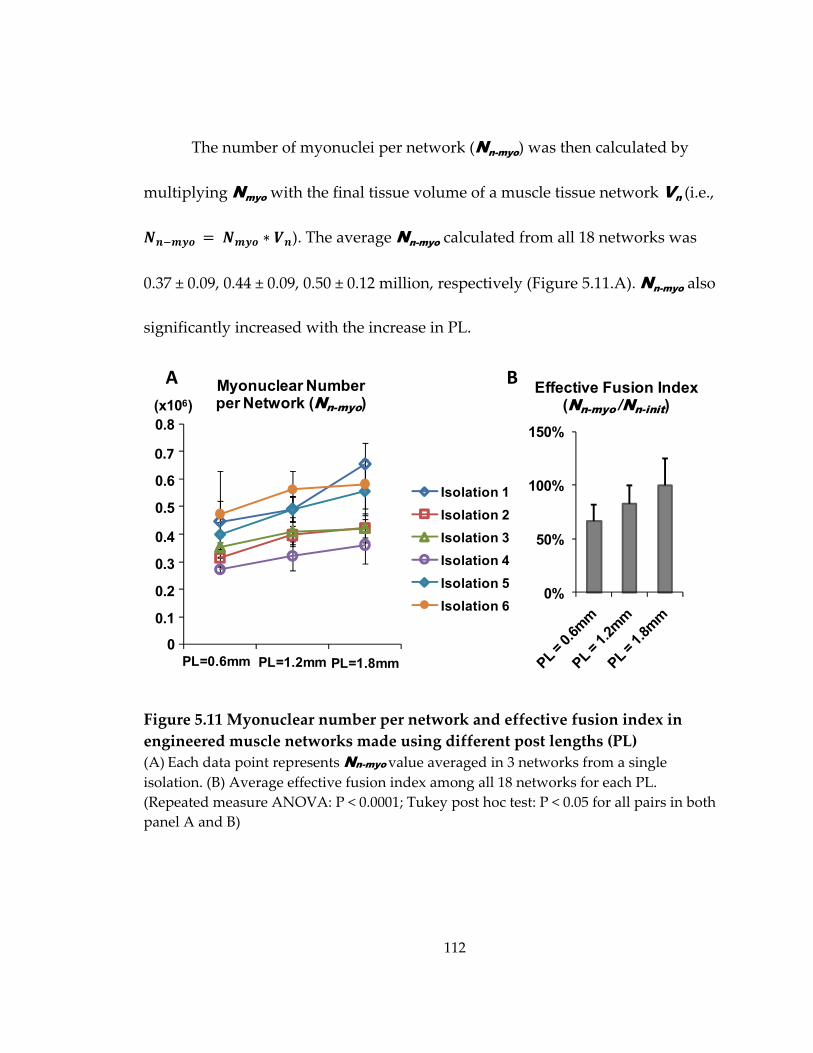
112
The number of myonuclei per network (Nn-myo) was then calculated by
multiplying Nmyo with the final tissue volume of a muscle tissue network Vn (i.e.,
). The average Nn-myo calculated from all 18 networks was
0.37 ± 0.09, 0.44 ± 0.09, 0.50 ± 0.12 million, respectively (Figure 5.11.A). Nn-myo also
significantly increased with the increase in PL.
Figure 5.11 Myonuclear number per network and effective fusion index in engineered muscle networks made using different post lengths (PL) (A) Each data point represents Nn-myo value averaged in 3 networks from a single isolation. (B) Average effective fusion index among all 18 networks for each PL. (Repeated measure ANOVA: P < 0.0001; Tukey post hoc test: P < 0.05 for all pairs in both panel A and B)
0%
50%
100%
150%
Isolation 1Isolation 2Isolation 3Isolation 4Isolation 5Isolation 6
0
0.1
0.2
0.3
0.4
0.5
0.6
0.7
0.8(x106)
PL=0.6mm PL=1.2mm PL=1.8mm
Myonuclear Number per Network (Nn-myo)
Effective Fusion Index (Nn-myo /Nn-init)
BA
113
In addition, the ratio of Nn-myo in 2‐week‐old muscle networks relative to
the total number of cells molded initially for each network at culture day 0 (Nn-
init, calculated by multiplying cell seeding density 10 million/ml with the initial
cell/gel volume per network reported in section 5.2), termed as “effective fusion
index”, was calculated and considered as an approximate measure of overall
fusion efficiency in engineered muscle networks made using different PL. The
effective fusion index from all 18 networks was 66.3 ± 15.8%, 82.4 ± 17.4%, and
100 ± 25%, respectively (Figure 5.11.B). Overall fusion efficiency significantly
increased with the increase of PL.
Finally, by incorporating the calculated Nmyo and Imyogenin in equation 5.2,
the resulting fm was found to be comparable in the three groups (3.15 ± 0.95, 2.91
± 1.27, and 3.00 ± 1.06 nN per myonucleus for PL of 0.6, 1.2, and 1.8 mm,
respectively, Figure 5.12). Thus, the increased contractile force in networks made
using longer posts was fully accounted for by the resulting increase in myofiber
alignment as well as the total number of myonuclei per network due to the
increased fusion efficiency, with no or only a minor role played by potential
changes in the cellular force generation and/or transmission.
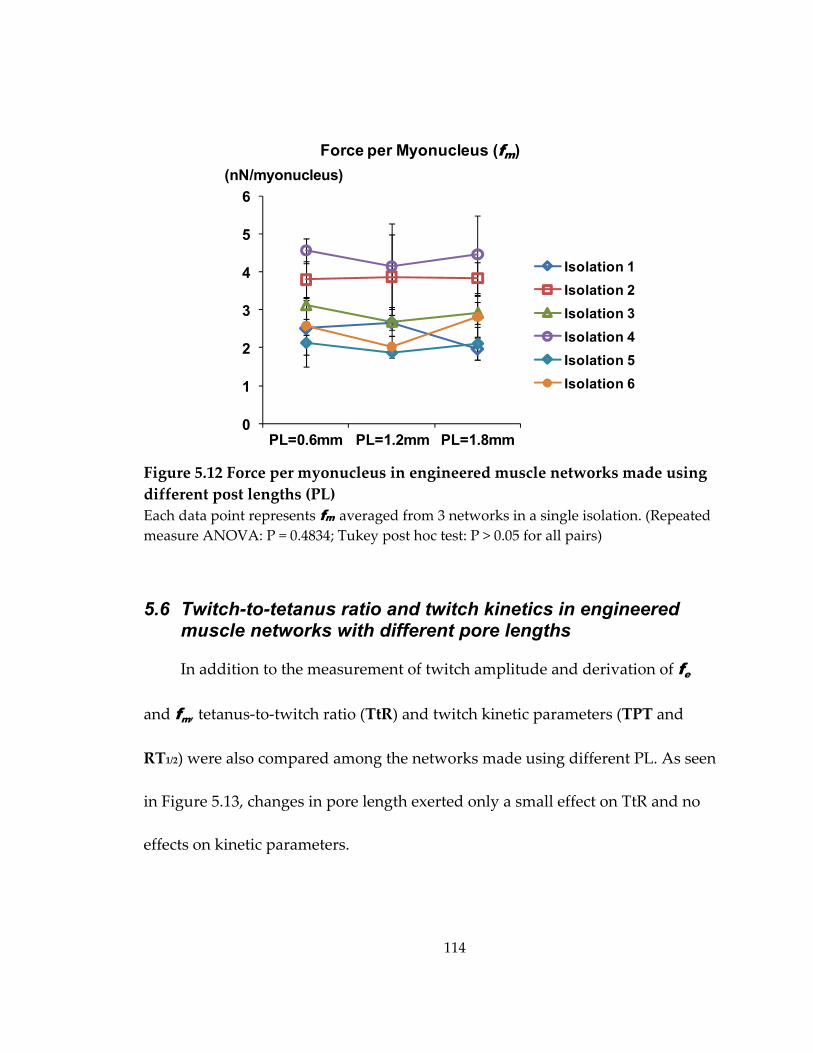
114
Figure 5.12 Force per myonucleus in engineered muscle networks made using different post lengths (PL) Each data point represents fm averaged from 3 networks in a single isolation. (Repeated measure ANOVA: P = 0.4834; Tukey post hoc test: P > 0.05 for all pairs)
5.6 Twitch-to-tetanus ratio and twitch kinetics in engineered muscle networks with different pore lengths
In addition to the measurement of twitch amplitude and derivation of fe
and fm, tetanus‐to‐twitch ratio (TtR) and twitch kinetic parameters (TPT and
RT1/2) were also compared among the networks made using different PL. As seen
in Figure 5.13, changes in pore length exerted only a small effect on TtR and no
effects on kinetic parameters.
0
1
2
3
4
5
6
Isolation 1Isolation 2Isolation 3Isolation 4Isolation 5Isolation 6
Force per Myonucleus (fm) (nN/myonucleus)
PL=0.6mm PL=1.2mm PL=1.8mm
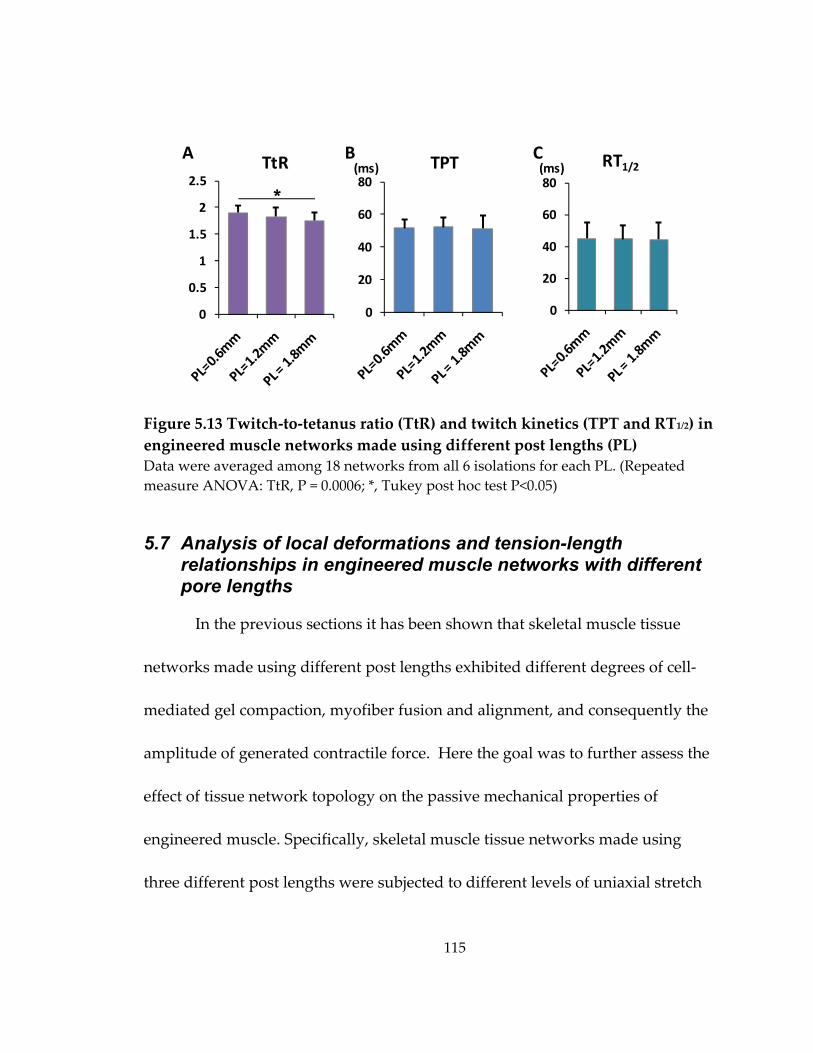
115
Figure 5.13 Twitch‐to‐tetanus ratio (TtR) and twitch kinetics (TPT and RT1/2) in engineered muscle networks made using different post lengths (PL) Data were averaged among 18 networks from all 6 isolations for each PL. (Repeated measure ANOVA: TtR, P = 0.0006; *, Tukey post hoc test P<0.05)
5.7 Analysis of local deformations and tension-length relationships in engineered muscle networks with different pore lengths
In the previous sections it has been shown that skeletal muscle tissue
networks made using different post lengths exhibited different degrees of cell‐
mediated gel compaction, myofiber fusion and alignment, and consequently the
amplitude of generated contractile force. Here the goal was to further assess the
effect of tissue network topology on the passive mechanical properties of
engineered muscle. Specifically, skeletal muscle tissue networks made using
three different post lengths were subjected to different levels of uniaxial stretch
0
0.5
1
1.5
2
2.5
0
20
40
60
80
A TtR B TPT(ms)C
0
20
40
60
80(ms) RT1/2
*
116
and compared with respect to the resulting steady‐state distribution of local
(microscopic) strains and macroscopic passive tension‐length relationship.
5.7.1 Local deformation analysis during application of uniaxial tissue stretch
As described in section 3.12, the steady‐state local deformation fields in
three distinct regions of a tissue network (bundle, node, and frame) were
quantified using the triad method (Figure 5.14). Specifically, the local tissue
deformation was measured by tracking the positional changes of three
microbeads embedded in the tissue network that formed a triangle when the
network was stretched from the culture length (L0) to 1.6 L0 in 4% L0 steps. At
each stretch step, two principal strain components ( , ), the absolute principal
angle (| |), and the Poisson’s ratio ( / ) were calculated using 3 independent
microbead triangles from the bundle, node, or frame regions. A total of 3
networks were analyzed for each PL (0.6, 1.2, or 1.8 mm).
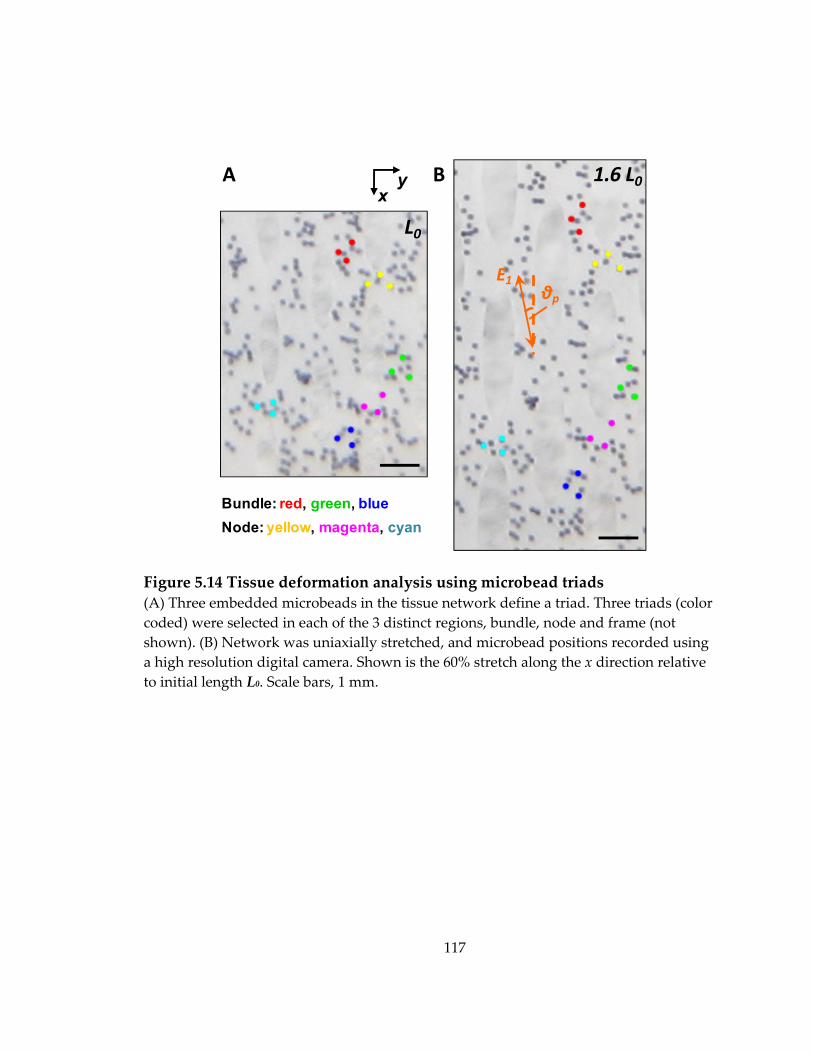
117
Figure 5.14 Tissue deformation analysis using microbead triads (A) Three embedded microbeads in the tissue network define a triad. Three triads (color coded) were selected in each of the 3 distinct regions, bundle, node and frame (not shown). (B) Network was uniaxially stretched, and microbead positions recorded using a high resolution digital camera. Shown is the 60% stretch along the x direction relative to initial length L0. Scale bars, 1 mm.
xy
Bundle: red, green, blueNode: yellow, magenta, cyan
L0
1.6 L0A B
E1θp
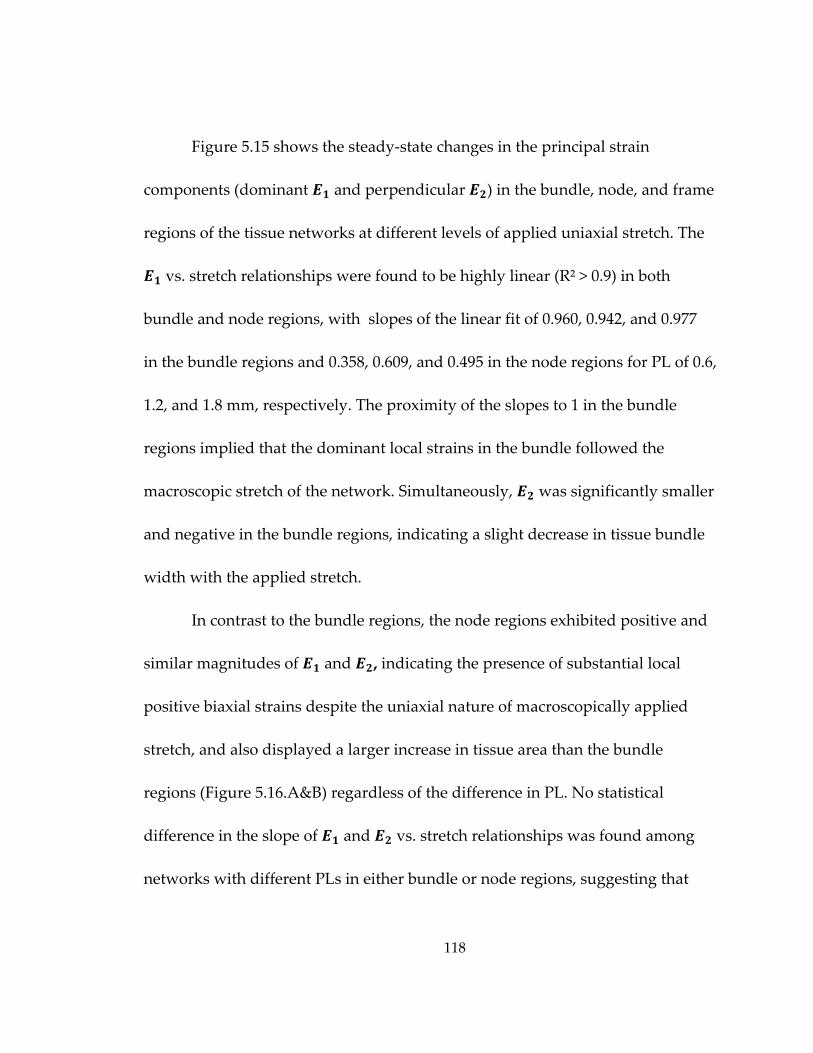
118
Figure 5.15 shows the steady‐state changes in the principal strain
components (dominant and perpendicular ) in the bundle, node, and frame
regions of the tissue networks at different levels of applied uniaxial stretch. The
vs. stretch relationships were found to be highly linear (R² > 0.9) in both
bundle and node regions, with slopes of the linear fit of 0.960, 0.942, and 0.977
in the bundle regions and 0.358, 0.609, and 0.495 in the node regions for PL of 0.6,
1.2, and 1.8 mm, respectively. The proximity of the slopes to 1 in the bundle
regions implied that the dominant local strains in the bundle followed the
macroscopic stretch of the network. Simultaneously, was significantly smaller
and negative in the bundle regions, indicating a slight decrease in tissue bundle
width with the applied stretch.
In contrast to the bundle regions, the node regions exhibited positive and
similar magnitudes of and , indicating the presence of substantial local
positive biaxial strains despite the uniaxial nature of macroscopically applied
stretch, and also displayed a larger increase in tissue area than the bundle
regions (Figure 5.16.A&B) regardless of the difference in PL. No statistical
difference in the slope of and vs. stretch relationships was found among
networks with different PLs in either bundle or node regions, suggesting that
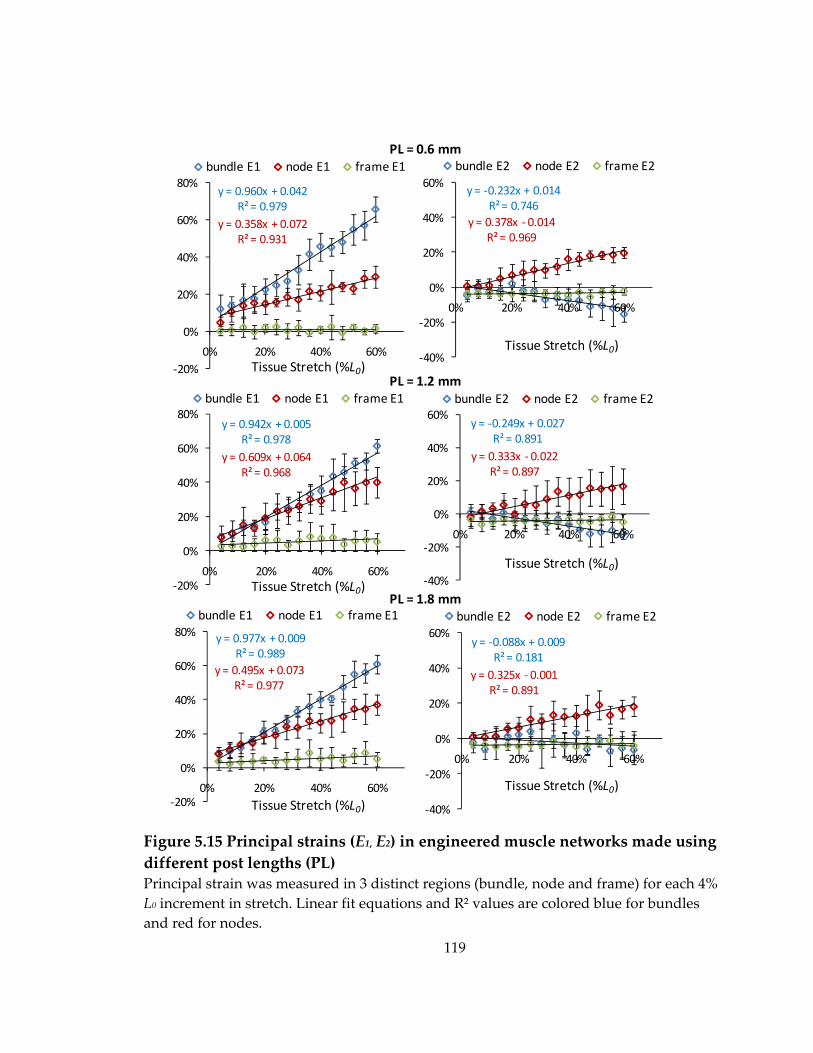
119
Figure 5.15 Principal strains (E1, E2) in engineered muscle networks made using different post lengths (PL) Principal strain was measured in 3 distinct regions (bundle, node and frame) for each 4% L0 increment in stretch. Linear fit equations and R² values are colored blue for bundles and red for nodes.
y = ‐0.249x + 0.027R² = 0.891
y = 0.333x ‐ 0.022R² = 0.897
‐40%
‐20%
0%
20%
40%
60%
0% 20% 40% 60%
bundle E2 node E2 frame E2
y = ‐0.232x + 0.014R² = 0.746
y = 0.378x ‐ 0.014R² = 0.969
‐40%
‐20%
0%
20%
40%
60%
0% 20% 40% 60%
bundle E2 node E2 frame E2
y = 0.942x + 0.005R² = 0.978
y = 0.609x + 0.064R² = 0.968
‐20%
0%
20%
40%
60%
80%
0% 20% 40% 60%
bundle E1 node E1 frame E1
y = ‐0.088x + 0.009R² = 0.181
y = 0.325x ‐ 0.001R² = 0.891
‐40%
‐20%
0%
20%
40%
60%
0% 20% 40% 60%
bundle E2 node E2 frame E2
y = 0.977x + 0.009R² = 0.989
y = 0.495x + 0.073R² = 0.977
‐20%
0%
20%
40%
60%
80%
0% 20% 40% 60%
bundle E1 node E1 frame E1
y = 0.960x + 0.042R² = 0.979
y = 0.358x + 0.072R² = 0.931
‐20%
0%
20%
40%
60%
80%
0% 20% 40% 60%
bundle E1 node E1 frame E1PL = 0.6 mm
PL = 1.2 mm
PL = 1.8 mm
Tissue Stretch (%L0)
Tissue Stretch (%L0)
Tissue Stretch (%L0)
Tissue Stretch (%L0)
Tissue Stretch (%L0)Tissue Stretch (%L0)
120
Figure 5.16 Relative Change of tissue area in bundles, nodes and frames during uniaxial macroscopic stretch in engineered muscle networks made using different post lengths (PL) Stretch‐induced changes in triad area (relative to the area at 0% stretch) averaged from 9 triads in 3 networks are shown for different PLs. Note a similar, relatively linear increase in both bundle and node regions with stretch, regardless of the difference in PL and <5% increase in frame regions.
differences in tissue pore geometry did not significantly affect local passive
properties of the muscle constructs.
As expected, rigid frame around the tissue network did not significantly
deform during the applied stretch, and thus and values in the frame
regions remained less than 5% for all levels of stretch.
Poisson’s ratio ( / ) and principal angle (|θp|, the angle between the
directions of and unaxial stretch, Figure 5.14.B) were also determined for
‐20%
0%
20%
40%
60%
80%
0% 20% 40% 60%
PL=0.6mm
PL=1.2mm
PL=1.8mm
‐20%
0%
20%
40%
60%
80%
0% 50%
PL=0.6mmPL=1.2mmPL=1.8mm
‐20%
0%
20%
40%
60%
80%
0% 20% 40% 60%
PL=0.6mm
PL=1.2mm
PL=1.8mm
Bundle Node FrameA B C% Area Increase
% Area Increase
% Area Increase
Tissue Stretch (%L0) Tissue Stretch (%L0) Tissue Stretch (%L0)
121
different levels of stretch (Figure 5.17). As expected, the sign of total average
(over all stretch levels) Poisson’s ratio was positive in bundle and negative in
node region. Furthermore, within the same networks, the bundle regions
exhibited lower |θp| than the node regions that mainly deformed along the axis
of the applied stretch. However, no significant changes in either average
Poissonʹs ratio or |θp|were found among networks with different pore lengths.
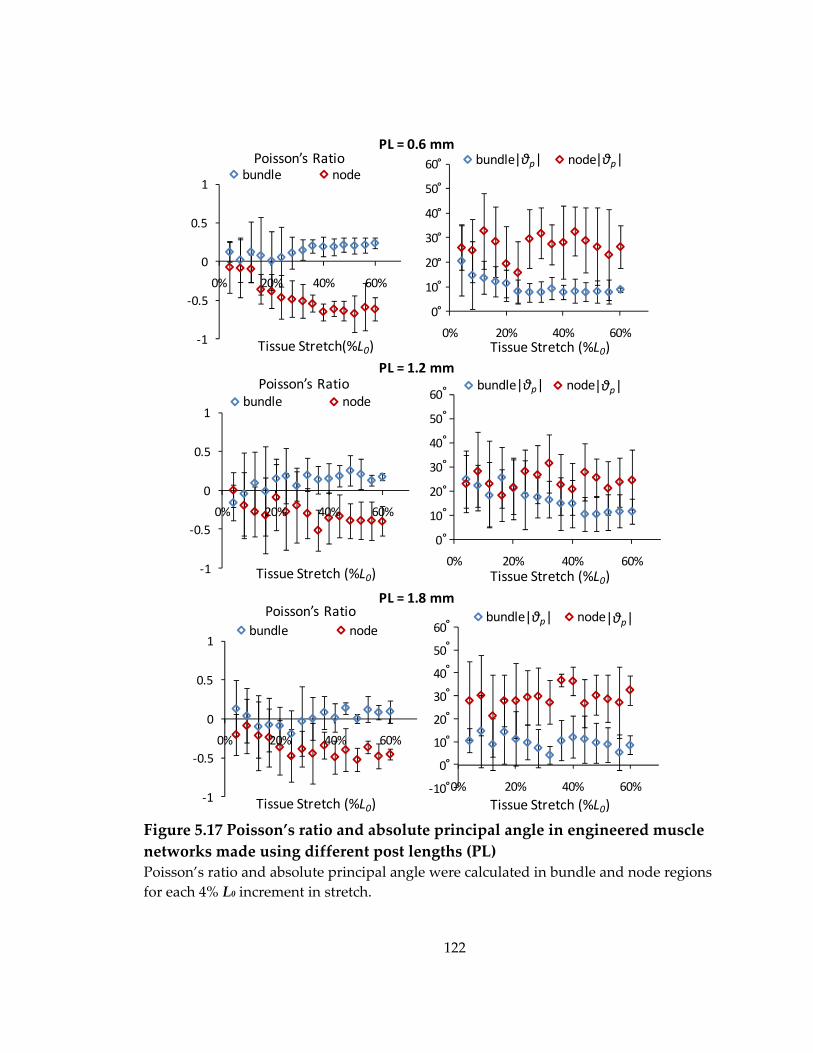
122
Figure 5.17 Poisson’s ratio and absolute principal angle in engineered muscle networks made using different post lengths (PL) Poisson’s ratio and absolute principal angle were calculated in bundle and node regions for each 4% L0 increment in stretch.
‐10
0
10
20
30
40
50
60
0% 20% 40% 60%
bundle node
‐1
‐0.5
0
0.5
1
0% 20% 40% 60%
bundle node
0
10
20
30
40
50
60
0% 20% 40% 60%
bundle node
‐1
‐0.5
0
0.5
1
0% 20% 40% 60%
bundle node
‐1
‐0.5
0
0.5
1
0% 20% 40% 60%
bundle node
0
10
20
30
40
50
60
0% 20% 40% 60%
bundle nodePoisson’s Ratio
Tissue Stretch(%L0)
Poisson’s Ratio
Tissue Stretch (%L0)
Poisson’s Ratio
Tissue Stretch (%L0)
|θp| |θp|
|θp||θp|
|θp| |θp|
Tissue Stretch (%L0)
Tissue Stretch (%L0)
Tissue Stretch (%L0)
PL = 0.6 mm
PL = 1.2 mm
PL = 1.8 mm
°
°
°
°
°
°
°
°
°
°
°
°
°
°
°
°
°
°
°
°
°
°
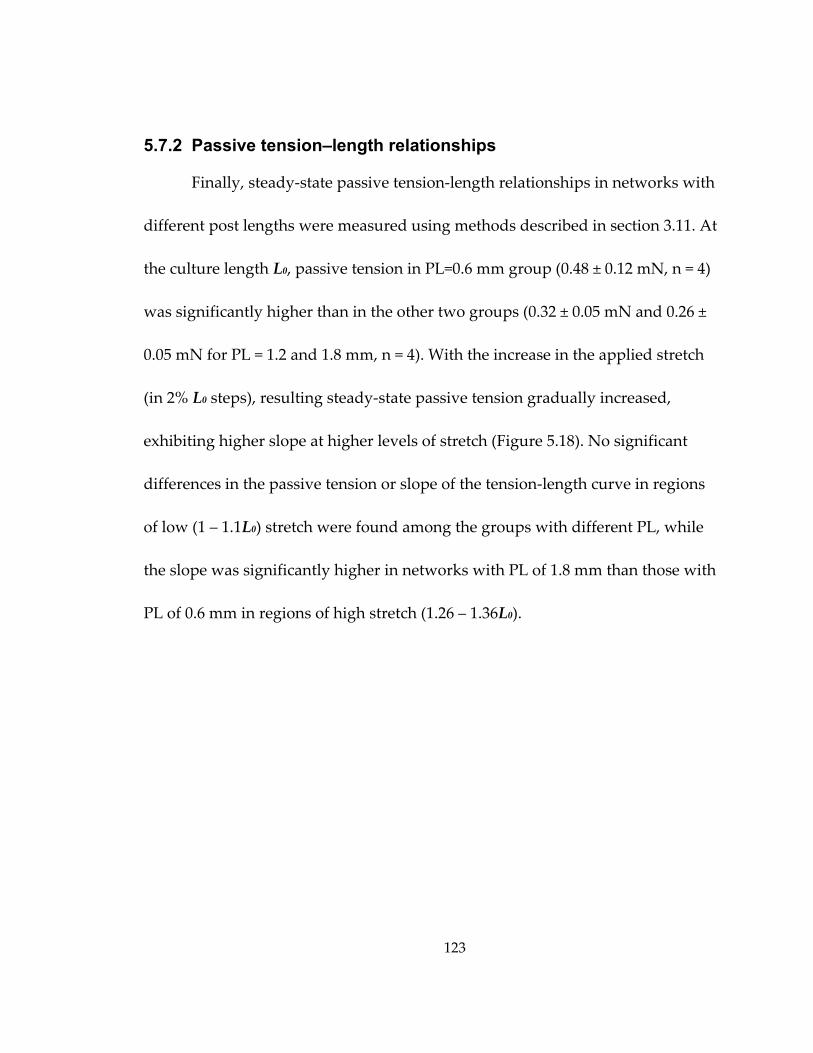
123
5.7.2 Passive tension–length relationships
Finally, steady‐state passive tension‐length relationships in networks with
different post lengths were measured using methods described in section 3.11. At
the culture length L0, passive tension in PL=0.6 mm group (0.48 ± 0.12 mN, n = 4)
was significantly higher than in the other two groups (0.32 ± 0.05 mN and 0.26 ±
0.05 mN for PL = 1.2 and 1.8 mm, n = 4). With the increase in the applied stretch
(in 2% L0 steps), resulting steady‐state passive tension gradually increased,
exhibiting higher slope at higher levels of stretch (Figure 5.18). No significant
differences in the passive tension or slope of the tension‐length curve in regions
of low (1 – 1.1L0) stretch were found among the groups with different PL, while
the slope was significantly higher in networks with PL of 1.8 mm than those with
PL of 0.6 mm in regions of high stretch (1.26 – 1.36L0).
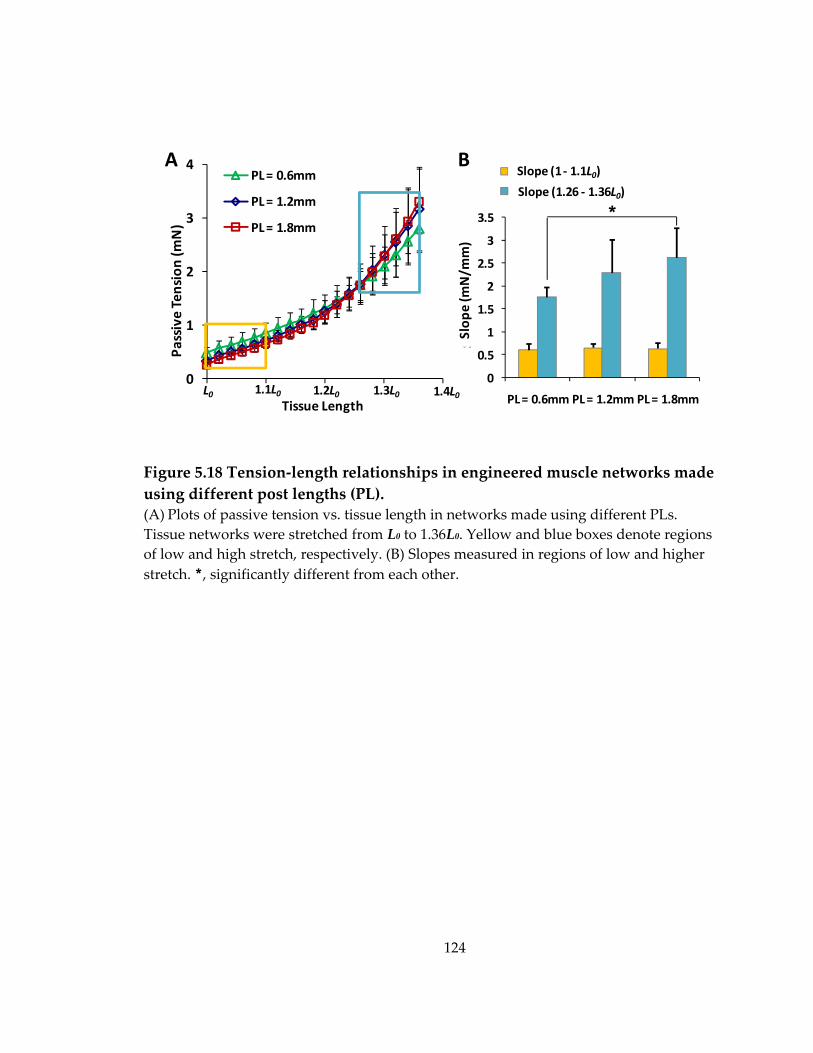
124
Figure 5.18 Tension‐length relationships in engineered muscle networks made using different post lengths (PL). (A) Plots of passive tension vs. tissue length in networks made using different PLs. Tissue networks were stretched from L0 to 1.36L0. Yellow and blue boxes denote regions of low and high stretch, respectively. (B) Slopes measured in regions of low and higher stretch. *, significantly different from each other.
0
0.5
1
1.5
2
2.5
3
3.5
PL = 0.6mm PL = 1.2mm PL = 1.8mm
Stiffne
ss (m
N/m
m)
Stiffness (0 ‐ 10% extension)
Stiffness (26 ‐ 36% extension)
B
*
Slope (1 ‐ 1.1L0)
Slope (1.26 ‐ 1.36L0)
0
1
2
3
4
0% 10% 20% 30% 40%
Passive Tension (m
N)
PL = 0.6mm
PL = 1.2mm
PL = 1.8mm
L0 1.1L0 1.2L0 1.3L0 1.4L0Tissue Length
A
Slop
e (m
N/m
m)
125
5.8 Discussion
Using the mesoscopic hydrogel molding approach described in Chapter 4,
skeletal muscle tissue networks were engineered to contain elliptical pores with
different shape by changing the length of microfabricated posts within the
elastomeric molds. The resulting differences in network topology were studied
with respect to their effect on active and passive mechanical properties of the
tissue networks, including the generation of contractile force, the distribution of
local strains during application of uniaxial macroscopic stretch, and the passive
tension‐length relationship. The use of longer posts to generate skeletal muscle
tissue networks led to: 1) the increase in myofiber volume density (due to
increased gel compaction), number (due to increased fusion), and overall
alignment (due to increase in pore elongation), 2) the increase in amplitude of
generated isometric contractile force, 3) minor changes in the pattern of local
tissue strains during applied uniaxial stretch or the tension‐‐length relationship.
5.8.1 Determinants of increased contractile force in engineered muscle networks with longer pores
As discussed in Chapter 4, mesoscopic hydrogel molding was developed to
introduce elongated pores in the engineered muscle tissues in order to: 1)
improve the access of nutrients and oxygen to formed myofibers and 2) promote
126
unidirectional myofiber alignment over the entire tissue area. One of the main
advantages of this approach is that variations in the height, length and direction
of microfabricated posts allow the precise and reproducible control of the tissue
thickness, pore dimensions, overall tissue porosity, and local and global
myofiber alignment. However, the engineered pores also represent the void
(acellular) space in the tissue that reduces the force generating capacity relative
to that of the same‐size aligned, non‐porous muscle.
This adverse effect could be minimized by optimizing pore shape, size,
and distribution. In this study, the length of hexagonal posts (PL) was varied to
elucidate effects of change in pore elongation on functional properties of muscle
constructs. Although longer posts yielded a larger tissue porosity and a reduced
total tissue volume (Figure 5.2), the simultaneous increase in overall myofiber
alignment (Figure 5.3) and total myonuclear number (Fig. 5.11) countered this
effect and yielded an increase in generated contractile force (Figure 5.4). These
effects of network pore length on the amplitude of contractile force could be fully
accounted after normalization for the PL‐induced differences in myofiber
alignment and myonuclear number (yielding the same force per myonucleus in
networks made using different PLs, Figure 5.12). This result suggested that in 2‐
week‐old muscle networks, other independent contributors to contractile force
127
generation, such as cellular contractile machinery and/or cell‐matrix interactions,
have not been significantly affected by PL‐induced changes in muscle network
topology.
Interestingly, the pore elongation from 1.2 mm to 1.8 mm induced a
smaller increase in the degree of overall myofiber alignment (Figure 5.3), but a
comparable increase in total myoclear number Nn-myo than the elongation from
0.6 mm to 1.2 mm (Figure 5.11.A). This result suggests that the increase of Fn
when the pore length was increased from 0.6 mm to 1.2 mm could be attributed
to the increase in both Nn-myo and myofiber alignment, while the increase of
Nn-myo was the primary contributor to the further increase of Fn when the pores
were elongated from 1.2 mm to 1.8 mm. In addition, by calculating the ratio of
Nn-myo /Nn-init, the overall fusion efficiency was shown to increase with a similar
magnitude with network pores were elongated from 1.2 mm to 1.8 mm relative
to the elongation from 0.6 mm to 1.2 mm (Figure 5.11.B). Previous studies using
2D microgrooved substrates or patterned lines of adhesive proteins (e.g.,
laminin)[132, 133] showed that cell alignment was beneficial to myoblast fusion
in 2D cultures. In addition, uniaxial passive tension has been shown to enhance
the fusion of different types of myoblasts into aligned myotubes in collagen or
128
fibrin‐based BAMs[12, 64, 65, 74]. In the fibrin‐based muscle networks studied in
this thesis, the increased fusion index with the pore elongation from 0.6 mm to
1.2 mm could primarily result from the increased total nuclear number in more
compacted and aligned network bundles, while the further increase of overall
fusion efficiency with the pore elongation from 1.2 mm to 1.8 mm was probably
due to the larger uniaxial passive tension exerted by the 1.8 mm long posts on
the embedded primary rat muscle cells along their aligned direction.
Although the further increase in post length (PL) may additionally
enhance myoblast fusion (potentially through increase in local strains imposed
on the cells) and to a less extent myofiber alignment, these beneficial effects on
force production would be countered by the resulting increase in tissue porosity
and decrease in tissue volume, as well as the decrease in bundle width which
could compromise mechanical integrity of tissue networks during handling.
Recent studies from our group (Hinds et al., submitted to Biomaterials) have
shown that the variations of hydrogel matrix composition in engineered muscle
bundles, in particular, the increase in Matrigel concentration, significantly
reduced the degree of cell‐mediated gel compaction, while simultaneously
inducing cellular hypertrophy, intracellular Ca2+ transient prolongation, and
consequently, a significant increase in generated contractile. Therefore, the future
129
optimization of hydrogel matrix composition and/or PDMS post shape will be
likely needed to minimize the degree of cell‐mediated gel compaction and
further improve the overall cell alignment in muscle networks with PL>1.8 mm.
Other approaches to augment the contractile force of engineered muscle
networks are discussed in Chapter 8.
5.8.2 Distinct changes in local strains of bundle and node regions with applied uniaxial macroscopic stretch
Muscle tissue networks with different pore lengths were also tested for
their elastic material properties by applying increasing steps of macroscopic
stretch and performing steady‐state measurements of the resulting microscopic
strains and macroscopic tension. As shown in section 5.7, during the application
of macroscopic stretch, tissue bundles underwent largest strains with
magnitudes similar to that of the applied stretch, while node regions exhibited
smaller magnitude positive biaxial strains and increase in tissue area that was
caused by the ʺpullingʺ action of the bundles that interconnected them (Figure
5.14‐16). As a result, the nodal (but not the bundle) regions exhibited auxetic
material properties characterized by negative planar Poissonʹs ratio (Figure 5.17).
Despite these heterogeneities in local strain distribution as well as distinct tissue
architecture, the macroscopic tension‐length relationship of the muscle tissue
130
networks exhibited length‐dependent stiffening (Figure 5.18), a typical material
property of compact soft tissues[134] including native muscle[135].
One interesting finding of this study was that despite the significant effect
on active force generation in tissue networks (through the increase in myofiber
number and alignment), the length of microfabricated pores had little or no effect
on studied passive tissue properties (local strains and macroscopic tension).
These results suggest that rather than tissue network topology and myofiber
number or alignment, other factors such as viscoelastic properties of surrounding
hydrogel, non‐muscle cells, and/or cell‐matrix interactions determine passive
mechanical properties of tissue networks. Nevertheless, the distinct strain
amplitudes and distributions in the bundle and node regions may yield specific
cellular responses to the potential application of electrical and/or mechanical
stimulation and thus allow the manipulation of resulting contractile properties to
better match that of native muscle tissue.
131
6. Effect of Soluble Mini-Agrin on Force Production of Engineered Muscle Networks
Co‐cultures of engineered muscle tissues with nerve explants have been
previously shown to improve the muscle functionality including a 2 fold and 1.7
fold increase of twitch and tetanus force, respectively, as well as the formation of
functional neuromuscular junctions (NMJs)[16, 17]. These effects were likely
caused by neuronal secretion of different neurotransmitters that directly
stimulated muscle contractile activity and/or different neurotrophic factors that
potentially benefited the growth, differentiation, and maturation of skeletal muscle
[136‐138]. However, the specific and relative influences of different nerve‐
secreted factors on the structure and function of engineered muscle constructs
remain to be studied.
In particular, neural agrin, a 220kDa heparin sulfate proteoglycan, is a
major neurotrophic factor secreted by motor neurons at NMJs[139]. This
molecule contains multiple domains that interact with different downstream
targets in skeletal muscle and elicit pleiotropic effects on the muscle innervation
and maturation. For example, C‐terminal of agrin 1) activates the muscle‐specific
receptor tyrosine kinase (MuSK) and induces the aggregation of acetylcholine
receptors (AChRs) in the muscle sarcolemma[140, 141] and 2) binds to α‐
132
dystroglycan[142], a component of the large membrane‐bound “dystrophin‐
associated protein complex” (DAPC) involved in lateral force transmission
between the ECM and the cytoskeleton[41] as well as the stabilization of AChR
clusters[49]. Interestingly, the AChR aggregation is not abolished by the absence
of α‐dystroglycan[143, 144], which suggests that the agrin binding to α‐
dystroglycan plays a minor role in triggering the clustering of AChRs. N‐
terminal of agrin on the other hand binds extracellularly to several isoforms of
laminin (laminin‐1, ‐2 and ‐4)[47] and can indirectly engage integrins to affect the
stabilization of AChR clusters and the lateral force transmission through the cell‐
ECM linkage[41]. In addition, agrin has been shown to promote the maturation
of excitation‐contraction (E‐C) coupling[50] and ion channel expression[51] in
developing human myotubes in vitro via yet unexplained mechanisms.
Importantly, it remains unknown if the application of agrin alone could benefit
the functional properties of engineered skeletal muscle tissues similar to what
has been observed in the co‐cultures with primary nerve explants[16, 17]. To
address this question, the effects of applying a soluble recombinant C‐terminal
agrin (90kDa), termed hereafter “mini‐agrin”, on the function of engineered
skeletal muscle networks have been systematically investigated.
133
6.1 Effect of mini-agrin on contractile force generation of engineered muscle networks
Skeletal muscle networks were exposed to 10 nM soluble mini‐agrin (R&D
systems, rrC‐Ag3,4,8, recombinant C‐terminal agrin) for 2, 4, or 8 days starting
on differentiation day 0 (culture day 4). At differentiation day 10, the measured
twitch force amplitudes for 2, 4, and 8 day agrin exposure were increased relative
to controls by 1.4 ± 0.1, 1.7 ± 0.2, and 1.7 ± 0.2 fold, respectively (Figure 6.1).
When the 4‐day agrin exposure started at differentiation day 4, instead of day 0,
the resulting increase in force amplitude was reduced to 1.5 ± 0.2 fold. These
results suggested that the favorable effect of soluble mini‐agrin on the muscle
contractile force generation depended not only on the duration of exposure to
agrin, but also on the stage of myogenic differentiation when the exposure was
started. Based on these results, all subsequent experiments were performed with
4 day agrin exposure starting on differentiation day 0.
In addition to the increase in twitch amplitude, the 4‐day exposure of
muscle networks to agrin starting on differentiation day 0 yielded a slight but
statistically significant increase in twitch‐to‐tetanus ratio, TtR, (1.74 ± 0.04 vs.
1.68 ± 0.05 in controls) and time‐to‐peak twitch, TPT, (52.2 ± 4.7 vs. 48.5 ± 2.7 ms
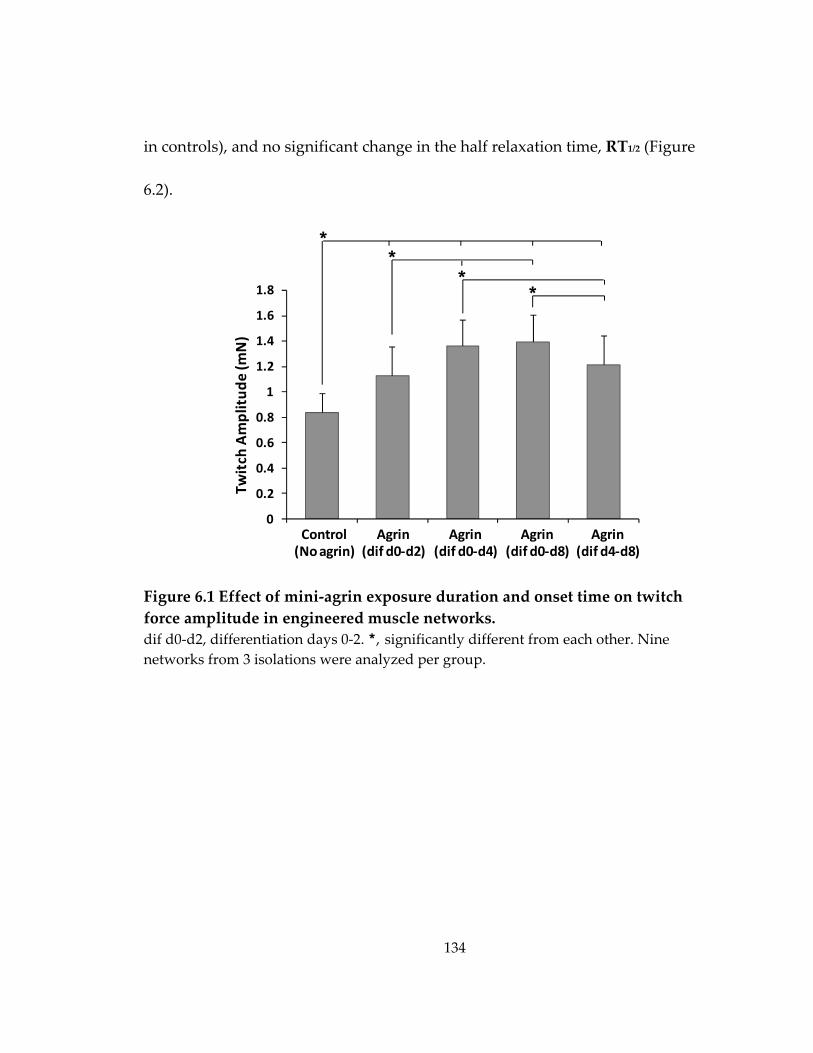
134
in controls), and no significant change in the half relaxation time, RT1/2 (Figure
6.2).
Figure 6.1 Effect of mini‐agrin exposure duration and onset time on twitch force amplitude in engineered muscle networks. dif d0‐d2, differentiation days 0‐2. *, significantly different from each other. Nine networks from 3 isolations were analyzed per group.
0
0.2
0.4
0.6
0.8
1
1.2
1.4
1.6
1.8
Force (m
N)
**
Twitch
Amplitud
e (m
N)
Control(No agrin)
Agrin(dif d0‐d2)
Agrin(dif d0‐d4)
Agrin(dif d0‐d8)
Agrin(dif d4‐d8)
**
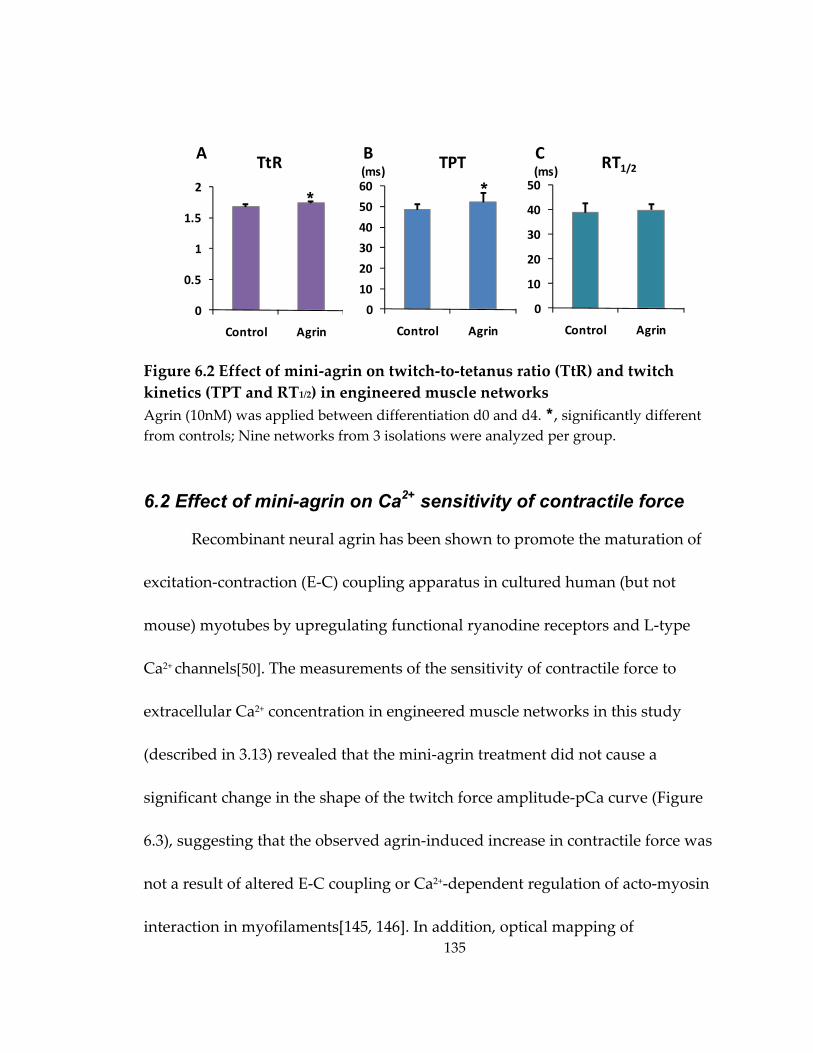
135
Figure 6.2 Effect of mini‐agrin on twitch‐to‐tetanus ratio (TtR) and twitch kinetics (TPT and RT1/2) in engineered muscle networks Agrin (10nM) was applied between differentiation d0 and d4. *, significantly different from controls; Nine networks from 3 isolations were analyzed per group.
6.2 Effect of mini-agrin on Ca2+ sensitivity of contractile force
Recombinant neural agrin has been shown to promote the maturation of
excitation‐contraction (E‐C) coupling apparatus in cultured human (but not
mouse) myotubes by upregulating functional ryanodine receptors and L‐type
Ca2+ channels[50]. The measurements of the sensitivity of contractile force to
extracellular Ca2+ concentration in engineered muscle networks in this study
(described in 3.13) revealed that the mini‐agrin treatment did not cause a
significant change in the shape of the twitch force amplitude‐pCa curve (Figure
6.3), suggesting that the observed agrin‐induced increase in contractile force was
not a result of altered E‐C coupling or Ca2+‐dependent regulation of acto‐myosin
interaction in myofilaments[145, 146]. In addition, optical mapping of
0
10
20
30
40
50
Control Agrin
0
10
20
30
40
50
60
Control Agrin
0
0.5
1
1.5
2
Control Agrin
A TtR B TPT(ms)C(ms) RT1/2
* *
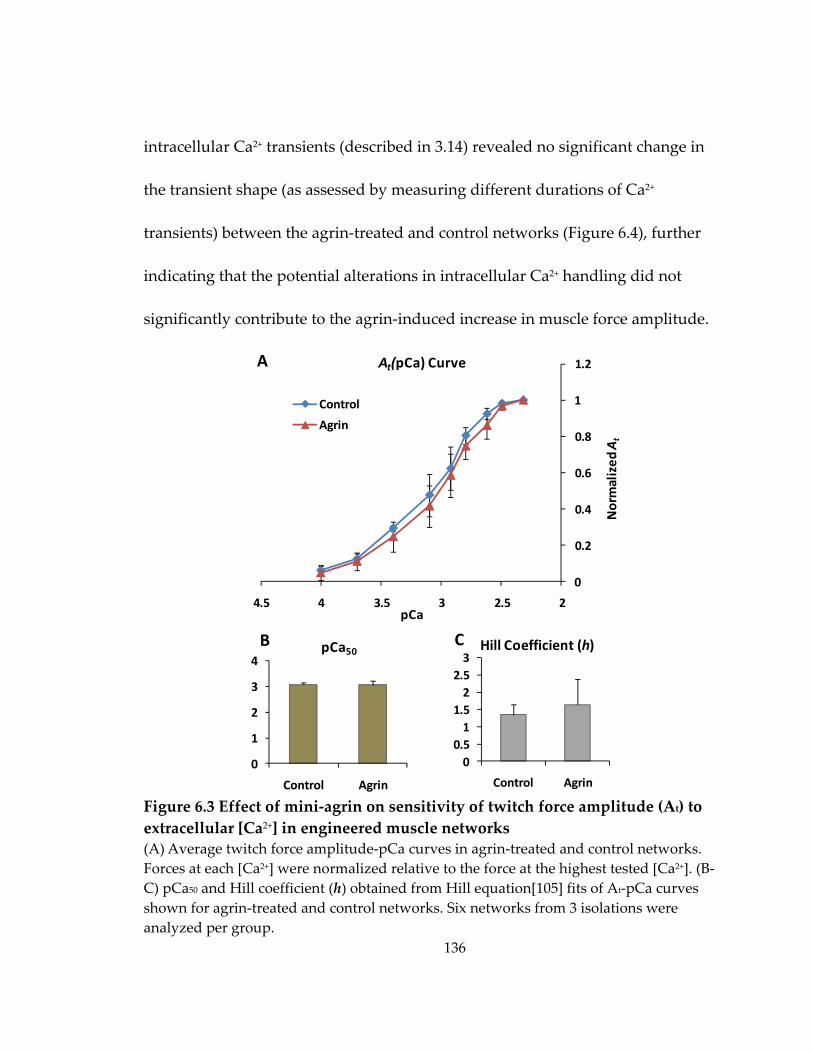
136
intracellular Ca2+ transients (described in 3.14) revealed no significant change in
the transient shape (as assessed by measuring different durations of Ca2+
transients) between the agrin‐treated and control networks (Figure 6.4), further
indicating that the potential alterations in intracellular Ca2+ handling did not
significantly contribute to the agrin‐induced increase in muscle force amplitude.
Figure 6.3 Effect of mini‐agrin on sensitivity of twitch force amplitude (At) to extracellular [Ca2+] in engineered muscle networks (A) Average twitch force amplitude‐pCa curves in agrin‐treated and control networks. Forces at each [Ca2+] were normalized relative to the force at the highest tested [Ca2+]. (B‐C) pCa50 and Hill coefficient (h) obtained from Hill equation[105] fits of At‐pCa curves shown for agrin‐treated and control networks. Six networks from 3 isolations were analyzed per group.
0
0.2
0.4
0.6
0.8
1
1.2
22.533.544.5Normalized
Force
pCa
Control
Agrin
00.51
1.52
2.53
Control Agrin0
1
2
3
4
Control Agrin
A At(pCa) Curve
B pCa50 Hill Coefficient (h)C
Normalized
At
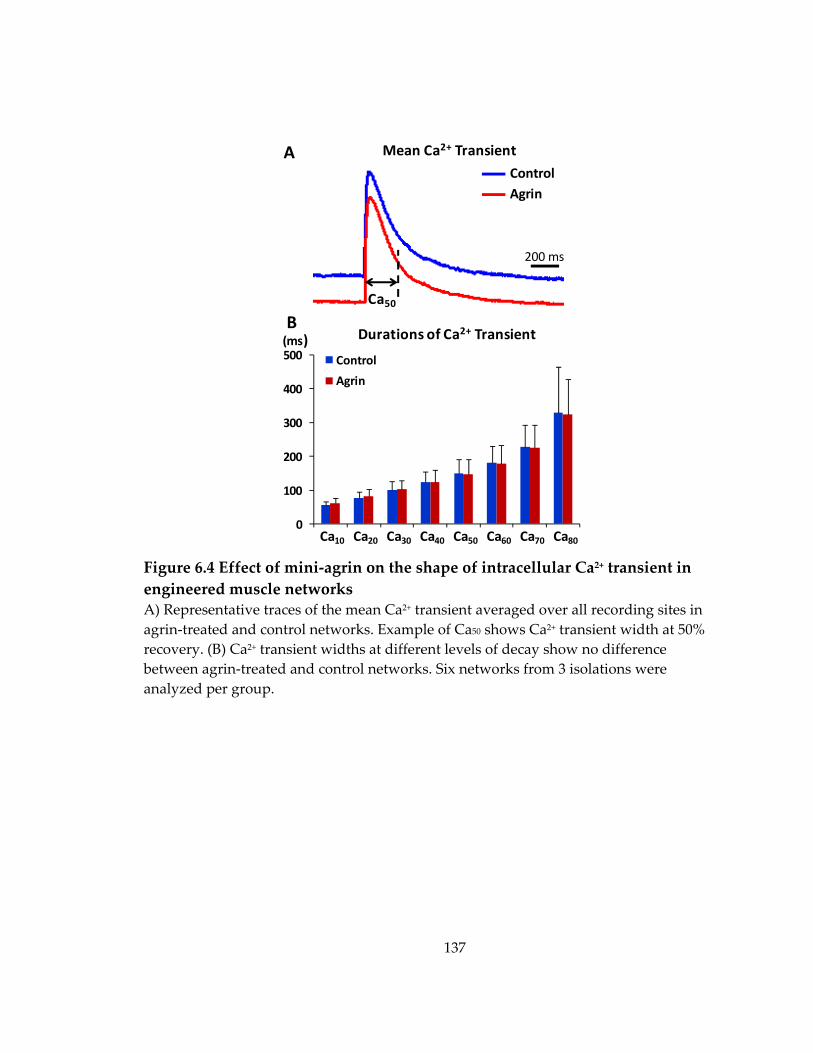
137
Figure 6.4 Effect of mini‐agrin on the shape of intracellular Ca2+ transient in engineered muscle networks A) Representative traces of the mean Ca2+ transient averaged over all recording sites in agrin‐treated and control networks. Example of Ca50 shows Ca2+ transient width at 50% recovery. (B) Ca2+ transient widths at different levels of decay show no difference between agrin‐treated and control networks. Six networks from 3 isolations were analyzed per group.
200 ms
Mean Ca2+ TransientA
Ca50
ControlAgrin
0
100
200
300
400
500 Control
Agrin
Ca10 Ca20 Ca30 Ca40 Ca50 Ca60 Ca70 Ca80
B(ms) Durations of Ca2+ Transient
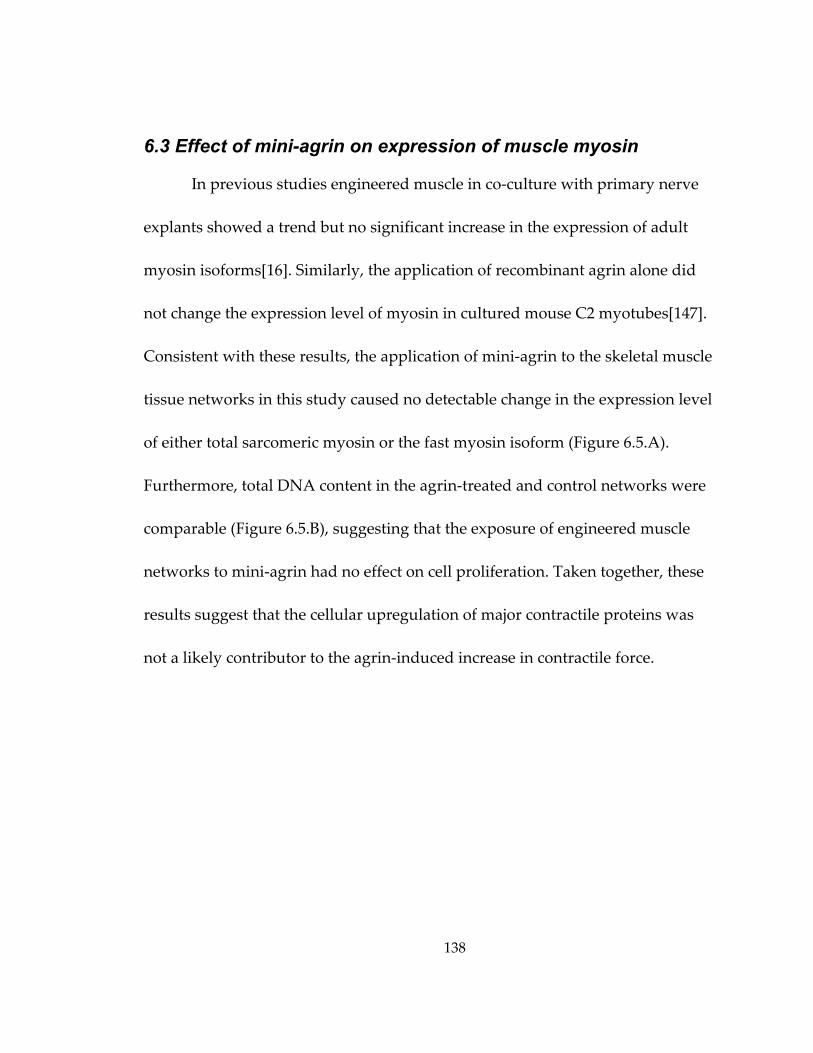
138
6.3 Effect of mini-agrin on expression of muscle myosin
In previous studies engineered muscle in co‐culture with primary nerve
explants showed a trend but no significant increase in the expression of adult
myosin isoforms[16]. Similarly, the application of recombinant agrin alone did
not change the expression level of myosin in cultured mouse C2 myotubes[147].
Consistent with these results, the application of mini‐agrin to the skeletal muscle
tissue networks in this study caused no detectable change in the expression level
of either total sarcomeric myosin or the fast myosin isoform (Figure 6.5.A).
Furthermore, total DNA content in the agrin‐treated and control networks were
comparable (Figure 6.5.B), suggesting that the exposure of engineered muscle
networks to mini‐agrin had no effect on cell proliferation. Taken together, these
results suggest that the cellular upregulation of major contractile proteins was
not a likely contributor to the agrin‐induced increase in contractile force.
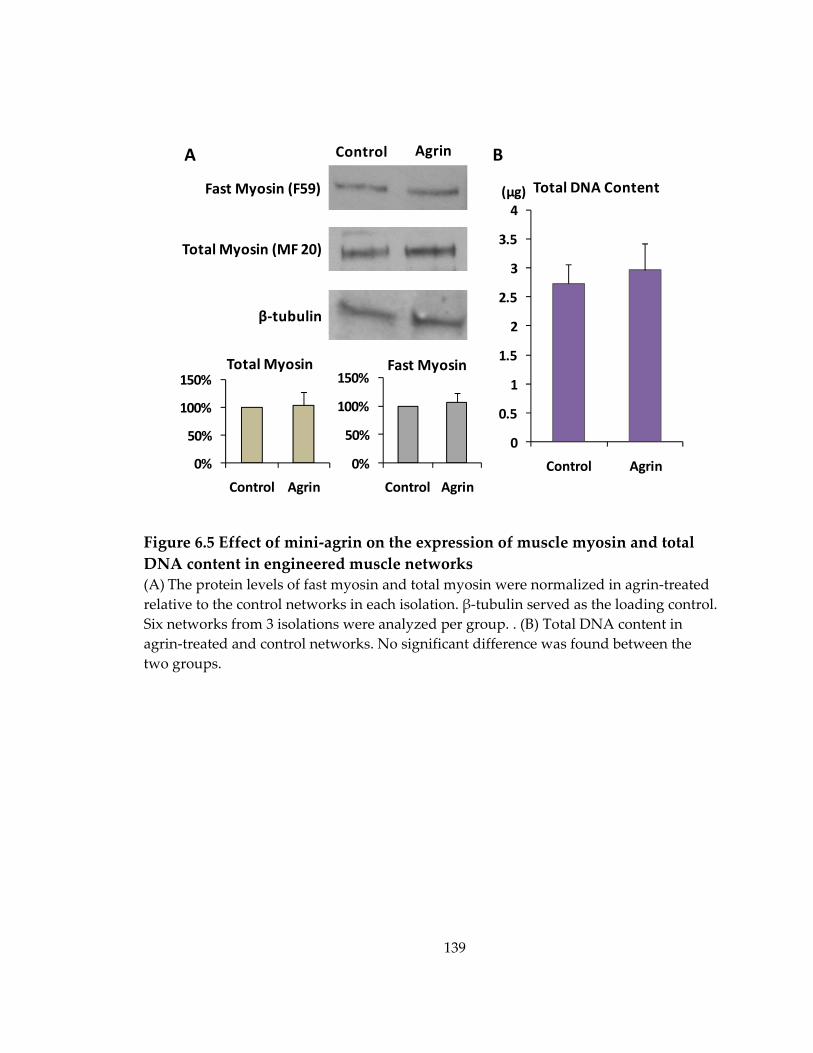
139
Figure 6.5 Effect of mini‐agrin on the expression of muscle myosin and total DNA content in engineered muscle networks (A) The protein levels of fast myosin and total myosin were normalized in agrin‐treated relative to the control networks in each isolation. β‐tubulin served as the loading control. Six networks from 3 isolations were analyzed per group. . (B) Total DNA content in agrin‐treated and control networks. No significant difference was found between the two groups.
0%
50%
100%
150%
Control Agrin
0%
50%
100%
150%
Control Agrin
Fast Myosin (F59)
Total Myosin (MF 20)
β‐tubulin
Control Agrin
Fast MyosinTotal Myosin
0
0.5
1
1.5
2
2.5
3
3.5
4
Control Agrin
Total DNA Content(µg)
A B
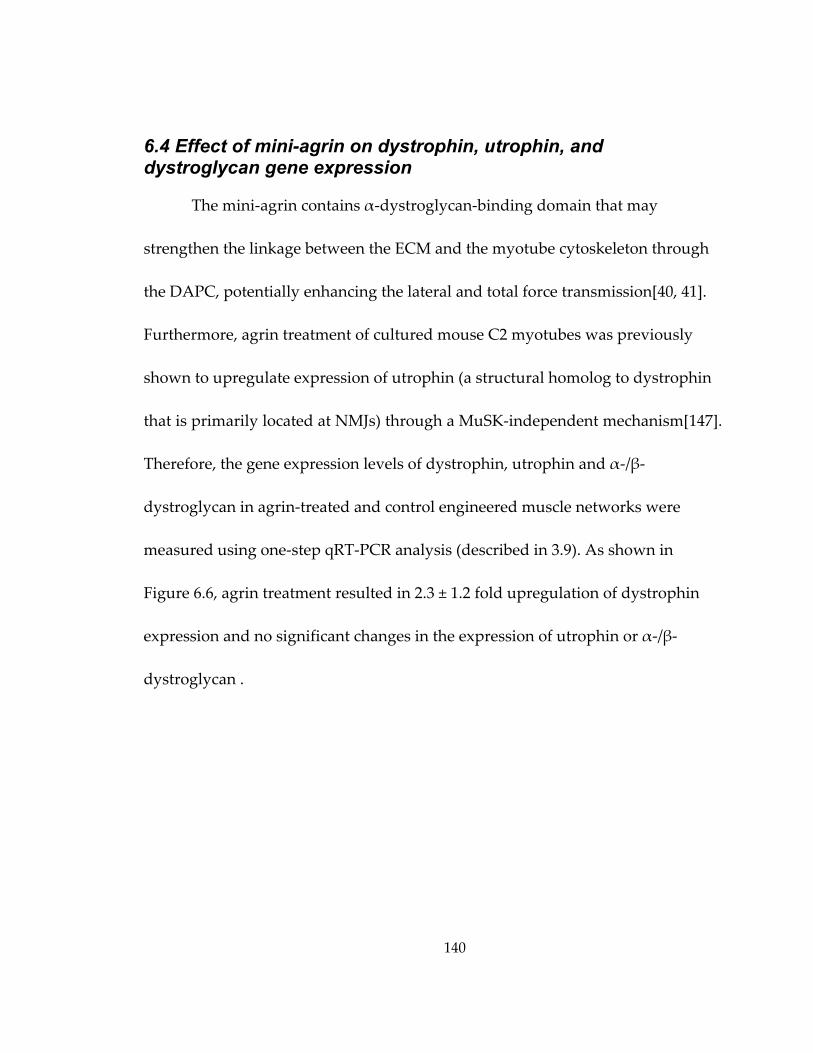
140
6.4 Effect of mini-agrin on dystrophin, utrophin, and dystroglycan gene expression
The mini‐agrin contains α‐dystroglycan‐binding domain that may
strengthen the linkage between the ECM and the myotube cytoskeleton through
the DAPC, potentially enhancing the lateral and total force transmission[40, 41].
Furthermore, agrin treatment of cultured mouse C2 myotubes was previously
shown to upregulate expression of utrophin (a structural homolog to dystrophin
that is primarily located at NMJs) through a MuSK‐independent mechanism[147].
Therefore, the gene expression levels of dystrophin, utrophin and α‐/β‐
dystroglycan in agrin‐treated and control engineered muscle networks were
measured using one‐step qRT‐PCR analysis (described in 3.9). As shown in
Figure 6.6, agrin treatment resulted in 2.3 ± 1.2 fold upregulation of dystrophin
expression and no significant changes in the expression of utrophin or α‐/β‐
dystroglycan .
141
Figure 6.6 Effect of mini‐agrin on gene expression levels of dystrophin (Dmd), utrophin (Utrn) and dystroglycan (Dag1) in engineered muscle networks. Gene expression levels are shown relative to control group.*, significantly different from control. Ten networks from 5 isolations were analyzed per group.
6.5 Effect of mini-agrin and altered endogenous acetylcholine level on AChR aggregation
While neural agrin has been known to stimulate aggregation of
acetylcholine receptors (AChRs) in skeletal muscle cells[140, 141], recent studies
in transgenic mice have suggested that this effect is countered by the action of
acetylcholyine[148, 149]. Regarding that agrin alone increased the amplitude of
contractile force in engineered muscle tissue networks (Figure 6.1), the further
pharmacological studies were designed to explore the potential interplay of agrin
and endogenous acetylcholine in the force generating capacity of engineered
muscle. Specifically, mini‐agrin (exposure on differentiation days 0 ‐ 4) was
applied simultaneously with either α‐NETA[150], an inhibitor of choline
‐1
0
1
2
3
4
Dmd Utrn Dag1
*
Fold Cha
nge
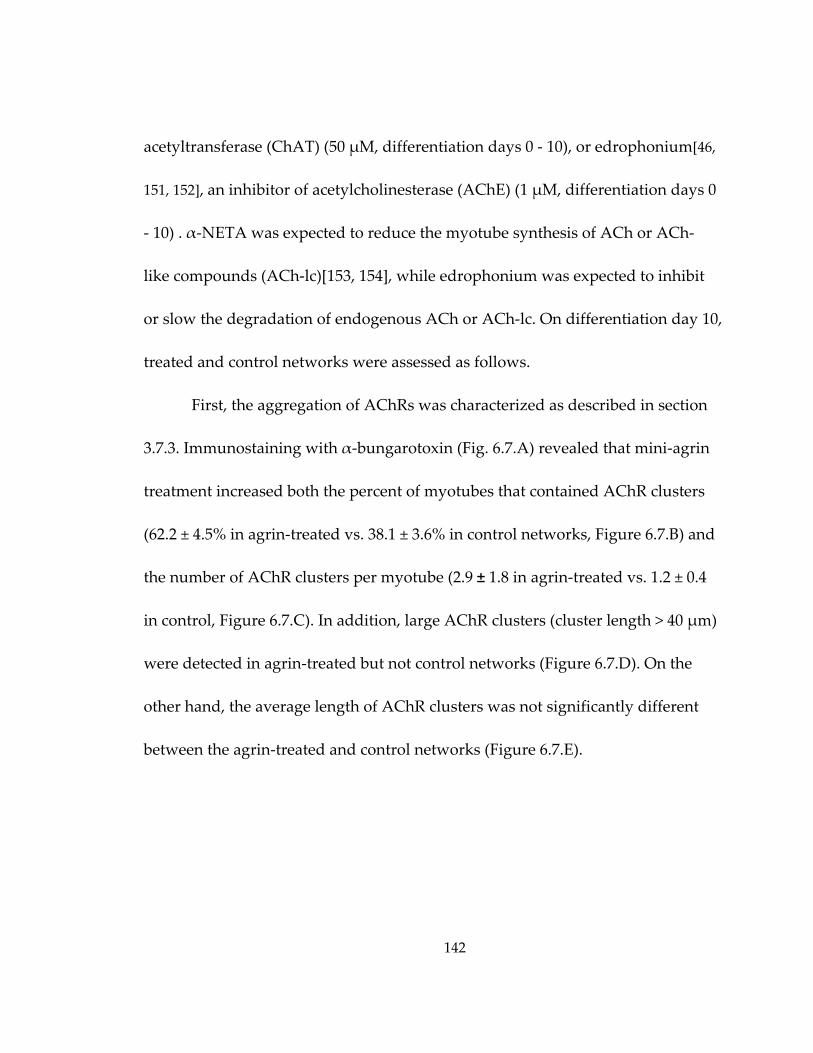
142
acetyltransferase (ChAT) (50 μM, differentiation days 0 ‐ 10), or edrophonium[46,
151, 152], an inhibitor of acetylcholinesterase (AChE) (1 μM, differentiation days 0
‐ 10) . α‐NETA was expected to reduce the myotube synthesis of ACh or ACh‐
like compounds (ACh‐lc)[153, 154], while edrophonium was expected to inhibit
or slow the degradation of endogenous ACh or ACh‐lc. On differentiation day 10,
treated and control networks were assessed as follows.
First, the aggregation of AChRs was characterized as described in section
3.7.3. Immunostaining with α‐bungarotoxin (Fig. 6.7.A) revealed that mini‐agrin
treatment increased both the percent of myotubes that contained AChR clusters
(62.2 ± 4.5% in agrin‐treated vs. 38.1 ± 3.6% in control networks, Figure 6.7.B) and
the number of AChR clusters per myotube (2.9 ± 1.8 in agrin‐treated vs. 1.2 ± 0.4
in control, Figure 6.7.C). In addition, large AChR clusters (cluster length > 40 μm)
were detected in agrin‐treated but not control networks (Figure 6.7.D). On the
other hand, the average length of AChR clusters was not significantly different
between the agrin‐treated and control networks (Figure 6.7.E).
143
Figure 6.7 Effect of mini‐agrin and altered endogenous ACh or ACh‐lc level on AChR aggregation in engineered muscle networks (A) Representative confocal images of α‐bungarotoxin‐labeled AChR clusters in tissue networks under different treatments. NETA and Edro denote α‐NETA or Edrophonium supplementation, respectively. Scale bars, 20 μm. (B‐E) Effect of treatments on the percentage of myotubes containing AChR clusters (B), the average number of AChR
0%
20%
40%
60%
80%
100%
120%
0‐20 µm 20‐40 µm > 40 µm
Control AgrinAgrin+NETA Agrin+Edro
0%
20%
40%
60%
80%
100%
0123456
0
5
10
15
20
25
30
Control Agrin Agrin+ NETA Agrin+ Edro
α‐Bungarotoxin DAPIA
B Percent of Myotubeswith AChR Clusters
C Number of AChRClusters per Myotube
*
*
*#
D Length Distribution of AChR Clusters
AChRCluster Length
E Mean AChRCluster Length
(µm)
*#
* * *
*
*
#
#
#
144
clusters per myotube (C), distribution of AChR cluster lengths (D), and the mean length of AChR cluster (E). * and #, significantly different from the control or agrin‐treated group, respectively. Note the number of >40 μm clusters in control and agrin+edrophonium group is 0. A total of 9 images from 3 networks (in 3 independent isolations) were analyzed for each group.
The agrin‐induced increase in the percent of myotubes with AChR
clusters was not affected by the α‐NETA‐induced suppression of the autocrine
AChR stimulation (Figure 6.7.B). However, α‐NETA partially countered the
agrin‐induced increase in the number of AChR clusters per myotube (Figure
6.7.C), while simultaneously increasing the relative fraction of larger clusters
(Figure 6.7.D) and, consequently, the average AChR cluster length (Figure 6.7.E).
On the other hand, edrophonium‐induced increase in endogenous ACh or ACh‐
lc level showed no significant effect on the agrin‐induced changes in AChR
clustering (Figure 6.7.B‐E) except for the absence of >40 μm clusters, suggesting
that edrophonium prevented the formation of large clusters that was promoted
by α‐NETA. Collectively, mini‐agrin promoted the occurrence of AChR clusters
in the myotube membranes while the addition of α‐NETA to simultaneously
attenuate the opposing effects of endogenous ACh or ACh‐lc further increased
AChR cluster length. Interestingly, the simultaneous inhibition or slowing of
ACh or ACh‐lc degradation by edrophonium was not able to oppose agrin‐
145
induced increase in occurrence of AChR clusters, but prevented the formation of
large AChR clusters.
Neural agrin has also been shown to upregulate the expression of AChR
ε‐subunit in vivo, which substitutes the fetal γ‐subunit during the maturation of
NMJs [155, 156]. However, quantitative RT‐PCR analysis (described in 3.9)
showed no significant change in the expression level of AChR α‐, γ‐ or ε‐subunit
genes in agrin‐treated vs. control networks (AChR α‐subunit: P =0.29; AChR γ‐
subunit: P = 0.26; AChR ε‐subunit: P = 0.40).
6.6 Effect of autocrine AChR stimulation on spontaneous twitching activity and agrin-induced change in force production
In addition to the potential roles in AChR clustering in vivo, the autocrine
stimulation of AChRs via endogenous ACh or ACh‐lc has been shown to affect the
spontaneous twitching of cultured murine primary myotubes primarily by
modulating the frequency of spontaneous Ca2+ spikes, which has been suggested
to be an important mechanism that can sustain the muscle activity in aneural
myotubes and promote their survival.[151, 157] However, it remains unknown if
the alterations of autocrine AChR stimulation to affect spontaneous twitching
and/or intracellular Ca2+ signaling can influence the maturation of cell
contraction machinery and, consequently, the force generation capacity of
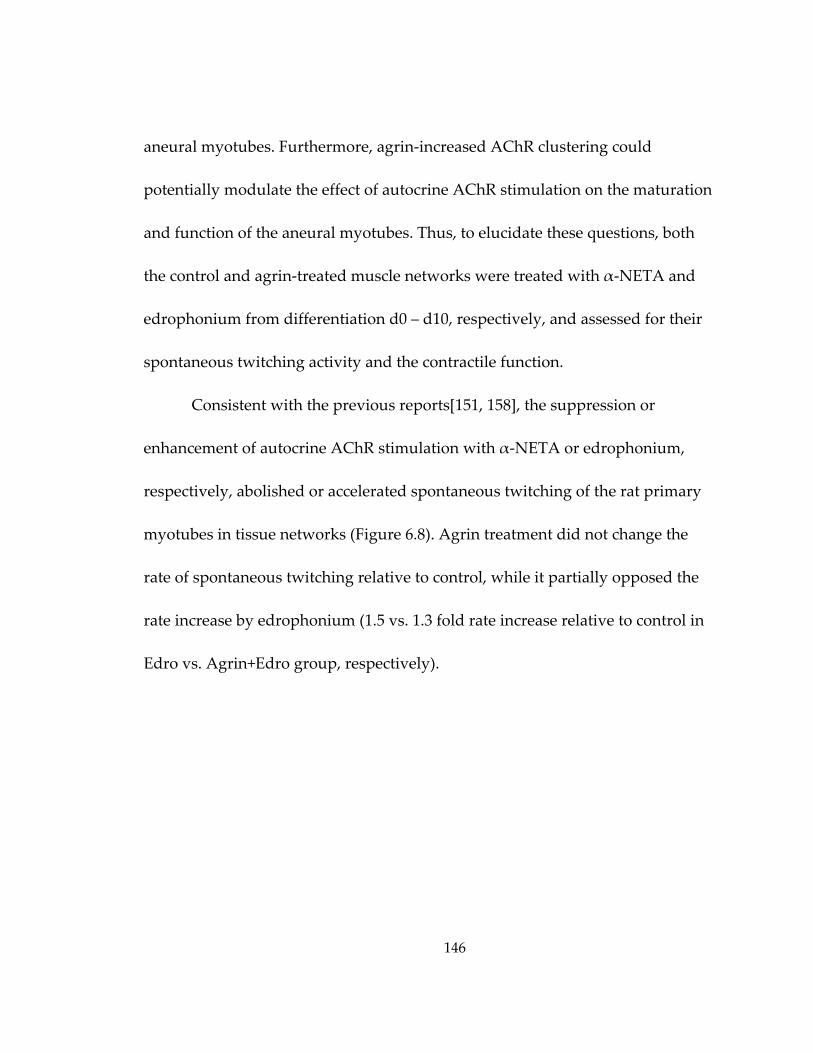
146
aneural myotubes. Furthermore, agrin‐increased AChR clustering could
potentially modulate the effect of autocrine AChR stimulation on the maturation
and function of the aneural myotubes. Thus, to elucidate these questions, both
the control and agrin‐treated muscle networks were treated with α‐NETA and
edrophonium from differentiation d0 – d10, respectively, and assessed for their
spontaneous twitching activity and the contractile function.
Consistent with the previous reports[151, 158], the suppression or
enhancement of autocrine AChR stimulation with α‐NETA or edrophonium,
respectively, abolished or accelerated spontaneous twitching of the rat primary
myotubes in tissue networks (Figure 6.8). Agrin treatment did not change the
rate of spontaneous twitching relative to control, while it partially opposed the
rate increase by edrophonium (1.5 vs. 1.3 fold rate increase relative to control in
Edro vs. Agrin+Edro group, respectively).
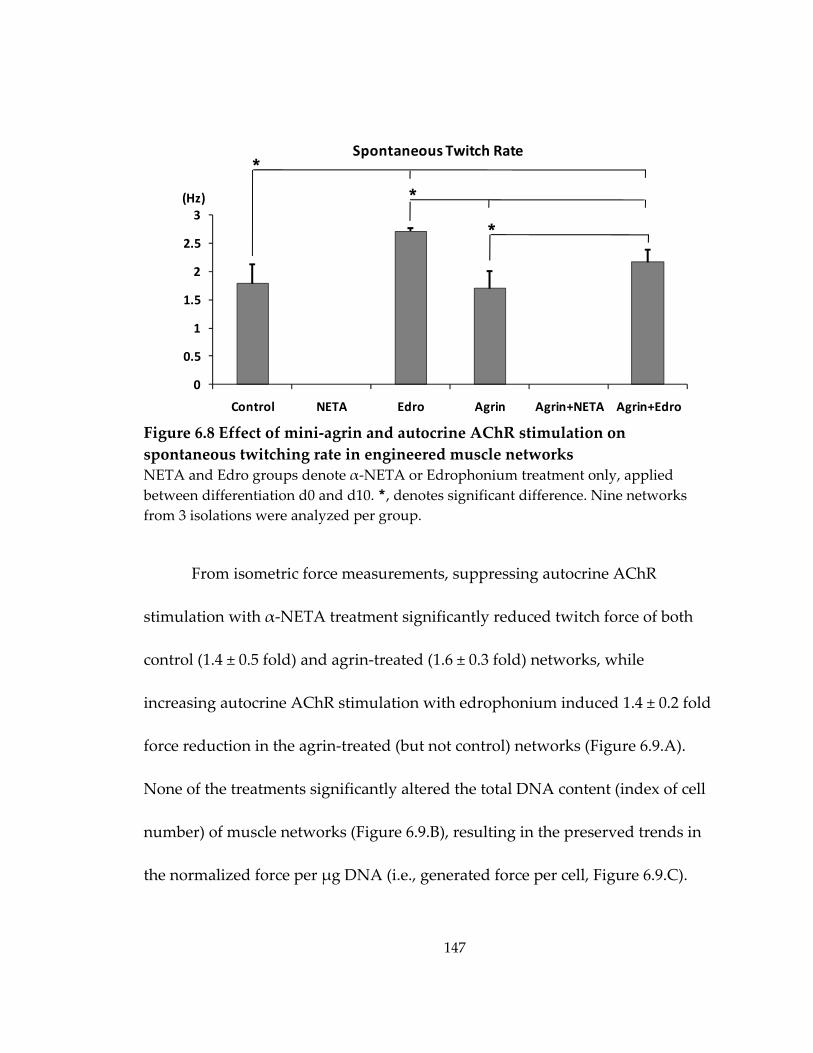
147
Figure 6.8 Effect of mini‐agrin and autocrine AChR stimulation on spontaneous twitching rate in engineered muscle networks NETA and Edro groups denote α‐NETA or Edrophonium treatment only, applied between differentiation d0 and d10. *, denotes significant difference. Nine networks from 3 isolations were analyzed per group.
From isometric force measurements, suppressing autocrine AChR
stimulation with α‐NETA treatment significantly reduced twitch force of both
control (1.4 ± 0.5 fold) and agrin‐treated (1.6 ± 0.3 fold) networks, while
increasing autocrine AChR stimulation with edrophonium induced 1.4 ± 0.2 fold
force reduction in the agrin‐treated (but not control) networks (Figure 6.9.A).
None of the treatments significantly altered the total DNA content (index of cell
number) of muscle networks (Figure 6.9.B), resulting in the preserved trends in
the normalized force per μg DNA (i.e., generated force per cell, Figure 6.9.C).
0
0.5
1
1.5
2
2.5
3
Control NETA Edro Agrin Agrin+NETA Agrin+Edro
(Hz)
Spontaneous Twitch Rate *
*
*
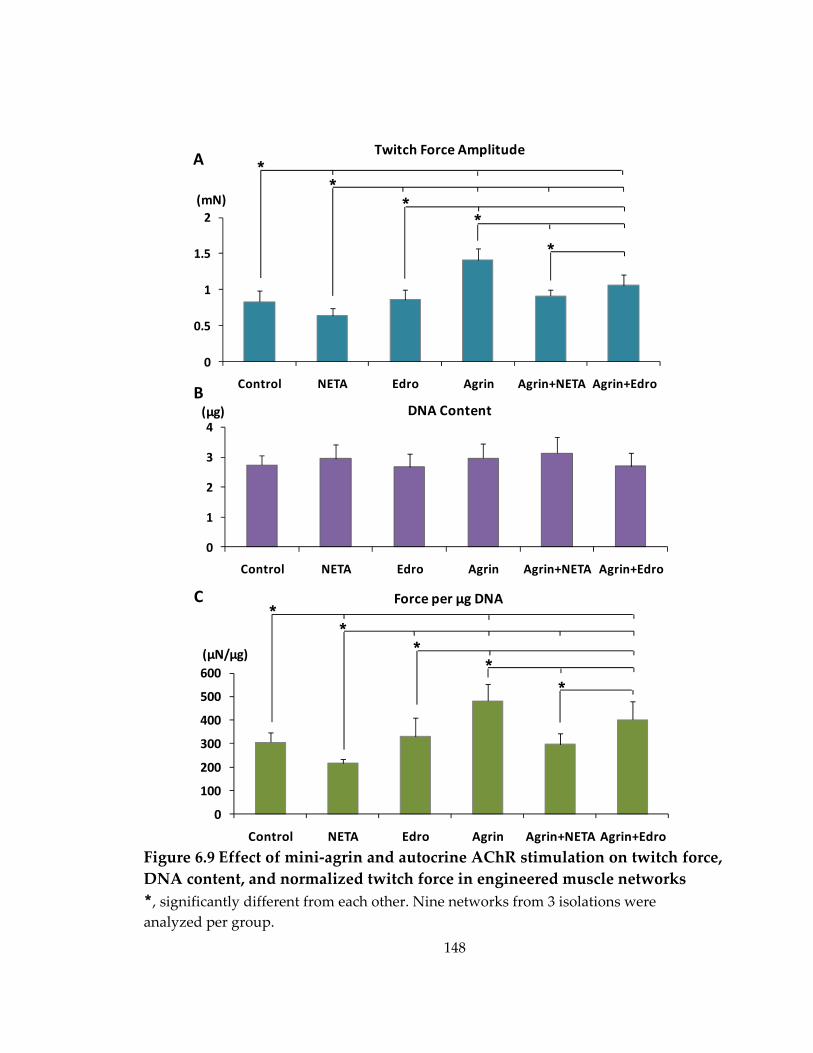
148
Figure 6.9 Effect of mini‐agrin and autocrine AChR stimulation on twitch force, DNA content, and normalized twitch force in engineered muscle networks *, significantly different from each other. Nine networks from 3 isolations were analyzed per group.
0
100
200
300
400
500
600
Control NETA Edro Agrin Agrin+NETA Agrin+Edro
0
0.5
1
1.5
2
Control NETA Edro Agrin Agrin+NETA Agrin+Edro
0
1
2
3
4
Control NETA Edro Agrin Agrin+NETA Agrin+Edro
Force per µg DNA
(µN/µg)
DNA Content(µg)B
*Twitch Force Amplitude
(mN)
A
C
**
**
**
**
*
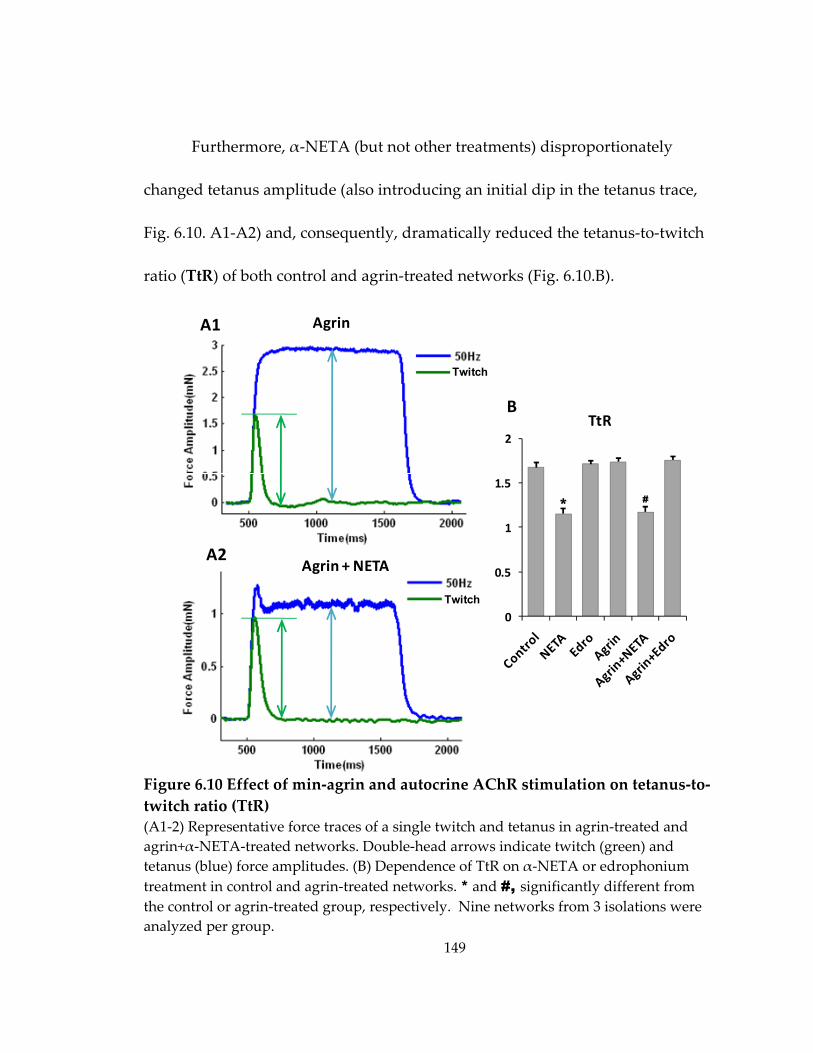
149
Furthermore, α‐NETA (but not other treatments) disproportionately
changed tetanus amplitude (also introducing an initial dip in the tetanus trace,
Fig. 6.10. A1‐A2) and, consequently, dramatically reduced the tetanus‐to‐twitch
ratio (TtR) of both control and agrin‐treated networks (Fig. 6.10.B).
Figure 6.10 Effect of min‐agrin and autocrine AChR stimulation on tetanus‐to‐twitch ratio (TtR) (A1‐2) Representative force traces of a single twitch and tetanus in agrin‐treated and agrin+α‐NETA‐treated networks. Double‐head arrows indicate twitch (green) and tetanus (blue) force amplitudes. (B) Dependence of TtR on α‐NETA or edrophonium treatment in control and agrin‐treated networks. * and #, significantly different from the control or agrin‐treated group, respectively. Nine networks from 3 isolations were analyzed per group.
0
0.5
1
1.5
2
Twitch
Twitch
Agrin
Agrin + NETA
A1
A2
BTtR
#*
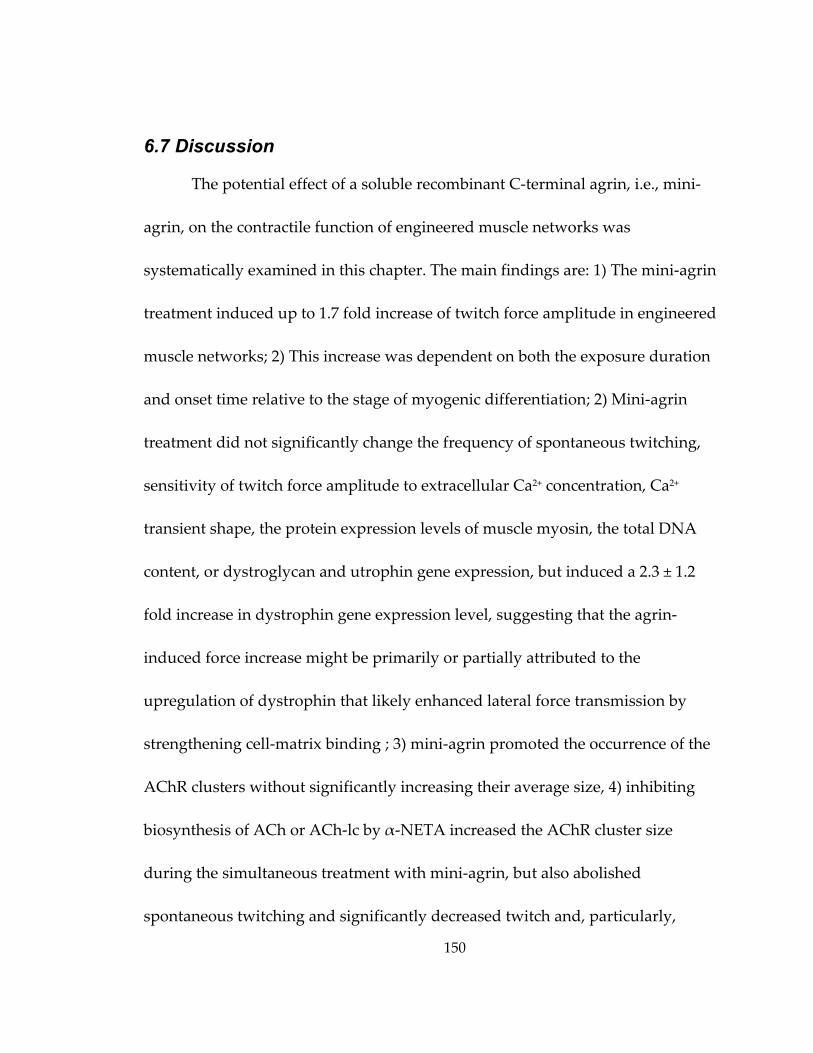
150
6.7 Discussion
The potential effect of a soluble recombinant C‐terminal agrin, i.e., mini‐
agrin, on the contractile function of engineered muscle networks was
systematically examined in this chapter. The main findings are: 1) The mini‐agrin
treatment induced up to 1.7 fold increase of twitch force amplitude in engineered
muscle networks; 2) This increase was dependent on both the exposure duration
and onset time relative to the stage of myogenic differentiation; 2) Mini‐agrin
treatment did not significantly change the frequency of spontaneous twitching,
sensitivity of twitch force amplitude to extracellular Ca2+ concentration, Ca2+
transient shape, the protein expression levels of muscle myosin, the total DNA
content, or dystroglycan and utrophin gene expression, but induced a 2.3 ± 1.2
fold increase in dystrophin gene expression level, suggesting that the agrin‐
induced force increase might be primarily or partially attributed to the
upregulation of dystrophin that likely enhanced lateral force transmission by
strengthening cell‐matrix binding ; 3) mini‐agrin promoted the occurrence of the
AChR clusters without significantly increasing their average size, 4) inhibiting
biosynthesis of ACh or ACh‐lc by α‐NETA increased the AChR cluster size
during the simultaneous treatment with mini‐agrin, but also abolished
spontaneous twitching and significantly decreased twitch and, particularly,

151
tetanus amplitude, and 5) slowing the degradation of ACh or ACh‐lc by
edrophonium yielded accelerated spontaneous twitching, but had little or no
effect on agrin‐induced increase in AChR clustering, and only affected
(decreased) twitch and tetanus amplitudes in the presence of mini‐agrin.
6.7.1 Agrin-induced increase in contractile force of engineered muscle networks
Although agrin plays critical roles in the formation and maturation of
post‐synaptic structures by triggering and stabilizing the aggregation of AChRs
on the muscle sarcolemma[159‐161], its specific effects on the muscle contractile
force generation are difficult to dissect in vivo (independent from other secreted
factors) or study in vitro using conventional 2D cultures grown on rigid
substrate .
Here, using 3D engineered muscle tissue networks composed of
developing aneural rat primary myotubes, a soluble form of recombinant C‐
terminal agrin, “mini‐agrin”, has been shown for the first time to induce
significant increase in muscle contractile force. This effect was most pronounced
when mini‐agrin was applied at early stages of differentiation (day 0‐4) and was
at least partially attributed to the later upregulation of dystrophin on
differentiation day 10, i.e., 6 says after removel of mini‐agrin from the culture
152
medium (rather than the alterations in Ca2+‐related mechanisms of force
generation or the increased expression of muscle contractile proteins) (Figure
6.1&3‐6). This interesting finding suggests that a brief exposure to agrin during
the initial stage of myogenic differentiation in aneural muscle cells might be able
to trigger a series of specific signaling cascades that could upregulate the
expression level of dystrophin as the nascent myotubes further maturate, and
subsequently yield the increased force generation due to the strengthened link
between the cytoskeleton and ECM.
6.7.2 Effect of endogenous ACh or ACh-lc level on agrin-induced AChR clustering in engineered muscle networks
Consistent with the findings previously reported using transgenic mice
and cultured muscle cells[148, 149], the reduced level of endogenous ACh or
ACh‐lc by α‐NETA further promoted the AChR clustering induced by mini‐
agrin and significantly increased the cluster size, while increased endogenous
ACh or ACh‐lc level by edrophonium prevented the formation of large clusters
(Figure 6.7). However, neither α‐NETA nor edrophonium changed the percent of
myotubes containing AChR clusters in agrin‐treated networks, suggesting that
while mini‐agrin promotes the initial induction of AChR aggregation but does
not alter AChR size, endogenous ACh or ACh‐lc affects the additional generation
153
and/or stabilization of large AChR clusters in the developing primary rat
myotubes.
In addition to promoting AChR clustering, agrin has been previously
shown to induce the switch of AChR γ‐subunit to ε‐subunit in denervated
muscle fibers[155] as well as the upregulatin of AChR ε‐subunit in engineered
muscle constructs cocultured with nerve explants[17]. However, soluble mini‐
agrin did not significantly increase the expression of AChR ε‐subunit in
engineered muscle networks. This result may be due to the lack of laminin‐
binding N‐terminal fragment in the soluble mini‐agrin, which has been
previously suggested as being necessary for the induction of AChR ε‐subunit
expression[162]. Incorporating full‐length recombinant agrin into the
fibrin/Matrigel matrix in the future studies might further promote the maturation
of post‐synaptic structures on myotube membrane and improve the integration
of engineered muscle into the host neuromuscular system upon implantation.
6.7.3 Effect of autocrine AChR stimulation on spontaneous twitching activity and contractile force generation in engineered muscle networks
Previous studied have suggested that the autocrine stimulation of AChRs
can elicit the spontaneous contractions of cultured mouse primary myotubes by
inducing membrane depolarization and subsequently spontaneous Ca2+
154
spikes[151, 157]. Consistent with this previous finding, the suppression of
autocrine AChR stimulation (by α‐NETA) efficiently abolished, while its
enhancement (by edrophonium) significantly accelerated spontaneous activity of
myotubes in engineered muscle networks (Figure 6.8). In addition, the autocrine
AChR stimulation has been suggested to play a novel role in sustaining muscle
activity and promoting cell survival through evoking spontaneous Ca2+ spikes in
developing myotubes before the onset of innervation[151, 163]. It is therefore
possible that the enhancement and suppression of AChR stimulation affected the
contractile force generation of developing rat primary myotubes (Figure 6.9&10)
by modulating the spontaneous fluctuations of intracellular [Ca2+]. On the other
hand, agrin‐induced upregulation of dystrophin expression (Figure 6.6), in
conjunction with the known tyrosine phosphorylation of AChRs[164] that could
have affected the desensitization and/or the spontaneous opening rate of
AChRs[165], resulted in complex modulatory effects of agrin on spontaneous
activity (Figure 6.8) and force generation (Figure 6.9&10) in muscle networks
with varied autocrine AChR stimulation.
155
6.7.4 Potential application of mini-agrin in the development of tissue engineering therapies for skeletal muscle repair
Based on the findings reported in this chapter, soluble mini‐agrin might
be a beneficial molecule to be applied in the future to improve the structure and
function of engineered muscle constructs as well as in vivo innervation upon
implantation.
First, a relatively short application of mini‐agrin at the initial stage of
myogenic differentiation has been shown to induce a significant and sustained
increase in contractile force of engineered muscle networks (Figure 6.1) with a
similar magnitude to the force increase previously reported in engineered muscle
constructs cocultured with primary nerve explants[16]. This finding implies the
potential of replacing nerve explants with recombinant agrin alone or together
with other soluble factors and biophysical stimulations in the future, to engineer
standardized and reproducible muscle tissue constructs for off‐shelf supply and
easy clinical use.
Second, recombinant agrin can be modified using the state‐of‐the‐art
molecular biology techniques to contain different functional domains and the
application of a specific modified agrin molecule can then be optimized

156
regarding to its dosage, duration and onset timing to engineer muscle constructs
with different desirable structural and functional properties.
Third, the agrin‐induced increase in AChR aggregation is expected to
facilitate the establishment of robust nerve‐muscle contacts between the
transplanted muscle constructs and the host motor nerves, which can not only
promote the restoration of compromised muscle function but also improve the
graft survival with the established nerve‐muscle interactions.

157
7. Summary
The main focus of this thesis has been the development and
characterization of a novel mesoscopic hydrogel molding approach to engineer
highly functional skeletal muscle tissues with independently controlled size,
thickness, porosity, and the degree of local and overall myofiber alignment.
The high aspect‐ratio soft‐lithography technique was utilized to fabricate
elastomeric tissue molds containing an array of staggered hexagonal posts with
precise control of post geometry (length, width, height, and spacing). These posts
1) created elliptical pores to facilitate the oxygen and nutrient transport
throughout the fibrin‐based construct, resulting in the increased cell viability
compared to the non‐porous tissue sheets of the same thickness, and 2) induced
local myofiber alignment along boundaries of the elliptical pores. The degree of
cell‐mediated compaction of the composite fibrin/Matrigel constructs was
controlled in a predictable fashion by altering the geometry of the
microfabricated posts, yielding different tissue thickness, pore elongation, overall
porosity, and myofiber alignment. In particular, the post length directly
determined the length of resulting elliptical pores and uniquely affected the pore
width through its effect on gel compaction. Furthermore, the direction of each
hexagonal post defined the mean orientation of the surrounding myofibers, thus
158
allowing the engineering of complex muscle tissue structures through controlling
the direction of individual posts. To maximize the amplitude of generated
contractile force, however, in this thesis I focused on studies using tissues made
with unidirectionally aligned posts.
Based on the expectation that larger elliptical pores would adversely affect
the force generating capability of engineered muscle constructs by introducing
more void, muscle‐free space, the muscle networks with different pore lengths
were compared for their capacity to generate active force. It was found that
despite the larger porosity and reduced total tissue volume, muscle networks
with the increased pore length generated more contractile force through the
synergistic increase in overall myofiber alignment in the direction of the posts
(due to a smaller off‐axis angle of network bundles) and the total myofiber
number (due to increased myoblast fusion).
In addition to the influence on active force generation, the existence of
elliptical pores introduced a unique spatial distribution of local steady‐state
strains in the tissue when uniaxially stretched with different magnitude at the
ends of the muscle network. Specifically, the tissue bundles predominantly
experienced uniaxial strain with a magnitude similar to that of the applied
macroscopic stretch, while the node regions (that connected bundles) were
159
biaxially deformed exhibiting auxetic material properties. The steady‐state
macroscopic tension‐length relationship in engineered muscle networks
exhibited characteristic length‐dependent stiffening and did not change
significantly with the alteration in pore length.
Using the setting of engineered muscle tissue network, in the last part of
my thesis, I also investigated the effect of a soluble recombinant C‐terminal agrin
(“mini‐agrin”), a nerve‐derived trophic factor with multiple downstream
targets[47, 140, 142], and its interplay with the autocrine AChR stimulation that
has been suggested to play a novel role in the survival of aneural myotubes[151],
on the contractile function of engineered muscle networks. The biochemical and
functional assessment of agrin‐treated muscle networks showed that mini‐agrin
induced the largest force increase when applied during the first 4 days of
myogenic differentiation and that the delayed upregulation of dystrophin 6 days
after agrin removal might have primarily or partially contributed to the observed
force increase. Furthermore, the autocrine AChR stimulation affected the
spontaneous twitching activity as well as the contractile force generation of
engineered muscle networks, probably through its modulation of spontaneous
fluctuations of intracellular Ca2+ concentration[151]. The simultaneous mini‐agrin
treatment changed the effect of autocrine AChR stimulation on both the
160
spontaneous twitching activity and the contractile function of engineered muscle
networks, possibly due to agrin‐induced tyrosine phosphorylation of AChRs that
as previously reported [164‐166], could desensitize or alter gating properties of
ACh receptors.
Together, the above studies showed the specific manipulations of
microscopic tissue organization and soluble factor conditioning that can
independently alter and improve both the differentiation state of developing
muscle cells as well as active and passive properties of engineered muscle
tissues.
161
8. Future Work
There are several avenues for improving the developed tissue engineering
approach. A recent study from our group (Hinds et al., submitted to Biomaterials)
has suggested that the integrin‐specific cell‐matrix interactions play a critical role
in maturation and contractile function of engineered muscle bundles (BAMs),
thus representing an important target for improving the force generating
capability of engineered skeletal muscle. In addition, as discussed in section 6.7.2
and suggested in previous studies[167, 168], incorporating a matrix‐bound form
of regulatory proteins, such as the neurotrophic factor, agrin, and/or the
angiogenic factor, VEGF in fibrin‐based hydrogels may yield further benefits
towards the innervation and vascularization of transplanted muscle construct.
Importantly, for the most beneficial outcomes, the modification of pore geometry
and distribution to maintain or improve unidirectional cell alignment will have
to accompany both the optimization of cell‐matrix interactions to enhance force
transmission as well as the introduction of vasculogenic and synaptogenic factors
to improve the integration of muscle constructs in vivo. An iterative approach
between the optimization of culture conditions in vitro and integration studies in
rat dorsal window chambers in vivo is one potential strategy to perform these
studies.
162
In addition, electro‐mechanical stimulations, including the application of
cyclic strain within a specific range of magnitude[10, 11, 13], intermittent stretch‐
relaxation pattern[12, 73], and electrical pulses alone or coordinated with the
mechanical stretch[14, 15], have been demonstrated to promote the growth,
differentiation and/or maturation of skeletal muscle cells in 2D cell cultures and
3D BAMs. Thus, future studies using a combination of state‐of‐the‐art bioreactor
design and computational stress‐strain analysis under the complex boundary
conditions defined by the network geometry are expected to elucidate the effect
of specific patterns of electro‐mechanical stimulation on the structure and
function of engineered muscle networks.
Although the brief application of soluble mini‐agrin during the first 4 days
of differentiation induced significant increase of contractile force generation in 2‐
week‐old engineered muscle networks, possibly resulting from the delayed
upregulation of dystrophin in the later stage of muscle differentiation and
maturation (likely through the binding to α‐dystroglycan), a thorough study is
needed in the future to further elucidate the underlying mechanisms as well as
better characterize the interplay of agrin and autocrine AChR stimulation in
engineered muscle force generation. Specific loss‐ or gain‐of‐function studies
aimed at downstream signaling targets could be performed using viral and

163
silencing RNA technology. Such studies can generate insights on how
innervation, through the secretion of agrin, changes the development program
and force production in aneural myotubes and suggest strategies for in vitro
conditioning of engineered muscle to facilitate its neural integration in vivo..
In addition, regarding the differences in agrin‐induced maturation of E‐C
coupling apparatus between the developing human and rodent myotubes
(mouse and rat)[50], caution should be taken in extrapolating the described
functional findings in engineered muscle composed of rodent cells to potential
human therapies. Comparison studies between engineered tissues made of
rodent and human muscle cells will be needed in the future to clarify the species‐
related differences. To this end, one of the very important aspects of future work
will be to optimize culture conditions and hydrogel molding approach for
engineering skeletal muscle tissue using human primary or induced pluripotent
stem cell(iPSC)‐derived myoblasts[169, 170].
Lastly, the mesoscopic hydrogel molding approach has been recently
applied by our group to also engineer cardiac muscle tissues with controllable
structure and function made of primary neonatal rat or mouse pluripotent stem
cell‐derived cardiomyocytes. Importantly, computer‐aided design of tissue
molds in this approach is directly compatible with clinical imaging techniques
164
such as diffusion tensor MRI. This unique feature allows the fabrication of large
functional constructs with local cell orientations that accurately follow directions
of cardiac fibers in the human heart, thus enabling the generation of customized
tissue structures tailored to the needs of individual patients. Future use of
human stem cells and further methodological improvements including the
optimization of extracellular matrix composition, use of specific soluble factors,
and/or biomimetic electro‐mechanical stimulation will be needed to advance this
approach towards potential clinical applications.
165
Appendix: Protocol for mesoscopic hydrogel molding
MATERIALS REAGENTS Mold Fabrication
• Sulfuric acid (95-98% (vol/vol), A.C.S. grade) (Sigma, cat. no. 258105)
CAUTION: Highly hazardous in case of skin or eye contact, ingestion, and
inhalation. Handle with care under a chemical hood.
• Hydrogen peroxide (30% (vol/vol) solution, A.C.S. grade) (VWR, cat. no. JT2186) CAUTION: Corrosive and an oxidizer. Handle with care under a chemical hood.
Avoid inhalation and contact with skin or eyes.
• Deionized water
• SU-8 100 photoresist (Microchem)
• Polypropylene glycol monomethyl ether acetate (PGMEA) (Aldrich, cat. no.
537543)
CAUTION: Toxic. Handle with care under a chemical hood.
• Isopropyl alcohol (EMD chemicals, cat. no. PX1830)
• (Tridecafluoro-1,1,2,2-tetrahydrooctyl)-1-trichlorosilane (United chemical
technologies, cat. no. T2492) referred to in the further text as “silane”
CAUTION: Highly corrosive. Avoid inhalation and contact with skin or eyes.
• Poly-dimethyl-siloxane (PDMS) base and curing agent (Dow Corning, Sylgard
184)
• Dow Corning 200® Fluid 20 Cst (Dow Corning)
Hydrogel Patterning and Cell Culture
• Fibrinogen from bovine plasma (Sigma, cat. no. F4753)
• Thrombin from bovine plasma (Sigma, cat. no. T6200)
• Matrigel (BD, cat. no. 356234)
• Pluronic F-127 (Invitrogen, cat. no. P6867)
• 70% (vol/vol) Ethanol
• Tissue culture water (Sigma, cat. no. W3500)
166
• Powder DMEM (Gibco, cat. no. 31600034)
• Liquid 1x DMEM (Gibco, cat. no. 10567)
• Penicillin-Streptomycin (Gibco, cat. no. 15140)
• Gentamicin (Gibco, cat. no. 15750)
• Penicillin G potassium salt (Sigma, cat. no. P7794)
• Fetal bovine serum (Gibco, cat. no. 16000-044)
• Heat-inactivated horse serum (Hyclone, cat. no. SH30074)
• Chicken embryo extract (US biological, cat. no. C3999)
• Aminocaproic acid (Sigma, cat. no. A7824)
• Trypsin (US Biologicals, cat. no. 22715)
• Collagenase Type 2 (Worthington, cat. no. LS004176)
Histological Analysis
• 1x DPBS without CaCl2 and MgCl2 (Gibco, cat. no. 14190)
• Tissue-Tek O.C.T. compound (Electron Microscopy Sciences, cat. no. 62550-01)
• 16% (wt/vol) Paraformaldehyde (Electron Microscopy Sciences, cat. no. 15710)
• Methanol (A.C.S. grade) (EMD chemicals, cat. no. MX0485)
• Acetone (VWR, cat. no. BDH2002)
• Triton X-100 (Sigma, cat. no. X100)
• Fluoromount G (Electron Microscopy Sciences, cat. no. 17984-25)
• Chicken serum (Sigma, cat. no. C5405)
• Rabbit polyclonal anti-myogenin (Santa Cruz, cat. no. sc-576)
• Mouse monoclonal anti-α-actinin (sarcomeric) (Sigma, cat. no. A7811)
• Rabbit polyclonal anti-connexin 43 (Cx 43) (Zymed, cat. no. 71-0700)
• Mouse monoclonal anti-vimentin (Sigma, cat. no. V6630)
• Alexa Fluor 488/594 chicken anti-mouse IgG (Invitrogen, cat. no. A21200/21201)
• Alexa Fluor 488/594 chicken anti-rabbit IgG (Invitrogen, cat. no. A21441/21422)
• 4′,6-Diamidino-2-phenylindole dihydrochloride (DAPI) (Sigma, cat. no. D9542)
• Phalloidin, fluorescein isothiocyanate (FITC) labeled (Sigma, cat. no. P5282)
167
EQUIPMENT Mold Fabrication
• Silicon wafers (3” diameter) (Wafer World, cat. no. 1182)
• 6” digital caliper (Carrera Precision, cat. no. CP5906)
• Non-tissue culture treated Petri dishes, 60 mm (BD Falcon, cat. no. 351007) and
100mm in diameter (BD Falcon, cat. no. 351029)
• Fine needles (27 gauge) (BD, cat. no. 305109)
• Wafer tweezers (SPI Supplies, cat. no. 0S4WF-XD)
• Cutting pliers
• Spin-coater (PWM32, Headway Research)
• Programmable hotplate (PMC DataPlate 720 series)
• Photoplotted transparency photomasks (prepared by Advanced Reproductions
from CAD files provided by the user)
• Glass plate (6” x 6” x 0.08” square)(United Scientific)
• Mask Aligner with UV illuminator (Karl Suss MA6/BA6, Suss Microtec)
• Vacuum desiccator (SPI Supplies, cat. no. 01922-AB)
• Chemical fume hood
Hydrogel Patterning and Cell Culture
• 6- or 12-well tissue culture treated plates (sterile) (BD Falcon, cat. no. 353046 or
353043)
• Eppendorf tubes (autoclaved) (Eppendorf, cat. no. 2236320-4)
• Velcro tapes (Velcro®, USA)
• Surgical scissors (Fine Science Tools)
• Minute pins (Fine Science Tools, cat. no. 26002-20)
• Plasma Asher (K-1050X, Emitech)
• Stereomicroscope (SM-4T, AmScope)
• Sonicator (1510, Branson)
• CO2 water-jacketed incubator (Nuaire)
• Biosafety cabinet
168
Histological Analysis
• Cryostat (HM505E, Microm)
• Tissue-Tek cryomolds (15 × 15 × 5 mm) (Electron Microscopy Sciences, cat. no.
4566)
• Superfrost plus micro slides (VWR, cat. no. 48311-703)
• 22 × 22 mm glass cover slips (Electron Microscopy Sciences, cat. no. 72198-10)
• Upright and inverted confocal microscopes (LSM 510, Zeiss)
• Inverted microscope (TE-2000U, Nikon)
REAGEANT SETUP
• 1x cardiac culture medium (sterile) contains: DMEM, 10% (vol/vol) heat-
inactivated horse serum, 2% (vol/vol) chicken embryo extract, 100 unit/mL
penicillin G, 1 mg/mL aminocaproic acid.
• 2x cardiac culture medium (sterile) for making cell/hydrogel mixture contains: 2x
DMEM (made from powder DMEM), 20% (vol/vol) heat-inactivated horse serum, 4%
(vol/vol) chicken embryo extract, 200 unit/mL penicillin G.
• 1x skeletal myoblast growth medium (sterile) contains: DMEM, 10% (vol/vol) fetal
bovine serum, 50 unit/mL penicillin G, 50 µg/mL streptomycin, 5 µg/mL gentamicin,
1 mg/mL aminocaproic acid.
• 2x skeletal myoblast growth medium (sterile) for making cell/hydrogel mixture
contains: 2x DMEM (made from powder DMEM), 20% (vol/vol) fetal bovine serum,
100 unit/mL penicillin G, 100 µg/mL streptomycin, 10 µg/mL gentamicin.
• Skeletal myoblast differentiation medium (sterile) contains: DMEM, 3% (vol/vol)
horse serum, 50 unit/mL penicillin G, 50 µg/mL streptomycin, 5 µg/mL gentamicin,
1 mg/mL aminocaproic acid.
All the media can be stored at 4°C for up to 2 weeks. Note that culture media
contain the only source of calcium ions that are required for fibrin gelation. The
mixed cell/gel solution that is injected into tissue molds contains a final calcium
concentration of 1.8 mM.
• Matrigel: Prepare 100 µL aliquots, store at -20°C.
169
• Fibrinogen: Prepare 10 mg/mL stock solution in DPBS (containing no Ca2+) by
dissolving at 37°C, and store at 4°C.
• Thrombin: Prepare 50 unit/mL stock solution in 0.1% (wt/vol) BSA in DPBS
(containing no Ca2+), store 50 µL aliquots at -20°C.
• Cell preparation
Neonatal rat ventricular myocytes (NRVMs): NRVMs were dissociated from the
ventricles of 2-day-old Sprague-Dawley rats using trypsin and collagenase and
then resuspended in 1x cardiac culture medium, as previously described in
detail[171, 172]. One 45 min differential preplating step was applied to enrich the
fraction of cardiac myocytes.
Neonatal rat skeletal myoblasts (NRSKMs): NRSKMs were dissociated from the
hind limbs of 2-day-old Sparague-Dawley rats using collagenase and then
resuspended in 1x skeletal myblast growth medium, as previously described[173].
Two sequential 45 min preplatings were applied to enrich the fraction of skeletal
myoblasts.
PROCEDURE Preparation of silicon wafers 1. Place a programmable hotplate inside a fume hood and heat to 80°C.
2. To improve photoresist adhesion, silicon wafers are “piranha etched” to remove
traces of carbon residue. In the chemical fume hood at room temperature (25ºC),
prepare 200 mL of Piranha Etching solution by pouring 150 mL of concentrated
sulfuric acid into a clean beaker followed by 50 mL of hydrogen peroxide. Strong
effervescence should be observed.
♦ CAUTION: Piranha Etch will rapidly corrode almost all carbon-based compounds
including any exposed skin. Please exercise caution and use appropriate safety
equipment such as nitrile or rubber gloves, lab coat, and safety goggles.
3. Place the beaker of Piranha Etching solution on the hotplate.
4. Using a wafer tweezer, gently submerge up to 4 silicon wafers into the Piranha
Etching solution. For maximum effectiveness, place silicon wafers back-to-back and
submerge two wafers at a time. Allow to etch for 15 min.
170
5. Using a wafer tweezer, carefully remove the wafers from the Piranha Etching
solution and wash sequentially in two large (1 L) volumes of deionized water. Dry
each wafer with air.
6. Dispose of the Piranha Etching solution according to the laboratory safety guidelines.
♦ PAUSE POINT: Piranha-etched wafers can be stored for several months at room
temperature in clean covered Petri dishes until needed.
7. Reset the hotplate to 200°C and place the etched silicon wafers on the hotplate face-
up. Dehydrate the wafers for 10 min. Let cool to room temperature.
♦ CRITICAL STEP: Silicon wafers need to be dehydrated before use to maximize the
adhesion of photoresist.
Preparation of photoresist layer 8. Place the dehydrated silicon wafer on a clean sheet of aluminum foil and pour on 2 -
3 mL of SU-8 100.
9. Spin-coat SU-8 100 using the following protocol at room temperature.
• Ramp up to 500 RPM at 100 RPM/s, maintain for 10 s
• Ramp up to 1000 RPM at 300 RPM/s, maintain for 30 s
• Ramp down to 0 RPM at 300 RPM/s
This will result in a 250 µm thick photoresist layer.
10. Soft-bake the wafer on a hotplate at 65°C for 15 min, followed by 95°C for 2 hr.
11. Turn off hotplate and cool the wafer and hotplate to room temperature.
12. For taller features (up to 2.5 mm), layer SU-8 100 sequentially by reiterating steps 8 -
11.
13. Upon spin-coating the final layer onto the wafer, perform a final, longer soft-bake at
95°C for at least 10 hr (or overnight).
14. Turn off hotplate and cool the wafer and hotplate to room temperature. The thickness
of the photoresist layer can be estimated with a caliper. The photoresist layer should
be hard, and no indentations should be left by the tweezers or caliper.
♦ Troubleshooting
171
Aligning and exposing photoresist layer 15. Tape the transparency photomasks to a glass plate (6” x 6” square). Tape semi-
circular pieces of aluminum foil to cover all areas of the wafer not covered by the
photomasks (Figure 2, see panel a). Load the glass photomask and a photoresist-
coated wafer into the mask aligner and align them to be in the center of the wafer.
16. Expose the wafers using 365 nm UV light at 12 mW/cm2. To prevent the over-
heating of the photoresist, the exposure should be performed in 1 min steps
interrupted by 2 min breaks for a total exposure duration specified in Table 1.
♦ CAUTION: Use UV-safe glasses or a face shield when working with strong UV light
sources.
Post-exposure bake and development 17. Perform post-exposure bake (PEB) by placing the exposed wafer on a
programmable hotplate set to 40°C for at least 24 hr. This long duration, low
temperature PEB allows the photoresist to crosslink while minimizing the diffusion of
photo-crosslinker through the resin, thus maintaining high feature fidelity.
18. Let the wafer cool by ramping down the temperature at 10°C/hr to room temperature.
This slow cooling prevents cracks in the wafer, since crosslinked SU-8 exerts
significant stress on the silicon substrate due to differential expansion and
contraction.
19. Immerse the wafer in PGMEA developer overnight.
20. Discard the used developer and immerse the wafer in fresh PGMEA for another
hour.
21. Rinse the wafer with isopropyl alcohol and dry with air.
♦ CRITICAL STEP: If a white residue is seen during the wash with isopropyl alcohol,
the development is incomplete. Let the wafer develop for another 1-2 hours.
♦ PAUSE POINT: The SU-8 master (Figure 2, see panel b) is now complete, and can
be stored for several months at room temperature under clean, dry conditions.
♦ Troubleshooting

172
Casting negative PDMS templates 22. Silanize the SU-8 master by placing it in a vacuum desiccator, in the presence of 2
microscope slides containing approximately 500 µL of silane and apply vacuum
overnight.
♦ CAUTION: Silane is highly corrosive. Wear gloves and use glass transfer pipettes,
not plastic pipettes. Avoid inhalation of silane vapors when opening the vacuum
desiccator.
23. Prepare 20 g of PDMS solution by mixing PDMS base, PDMS curing agent and Dow
Corning 200® Fluid in a 10:1:1 ratio. Degas for 1 hr in a vacuum desiccator.
24. Place the SU-8 master face-up in a clean, non-tissue culture treated 100 mm
diameter Petri dish and pour approximately 35 mL PDMS on top of the template
wafer. The wafer should be completely submerged in PDMS. Degas for 1 hr in a
vacuum desiccator. Remove the trapped air bubbles using fine needle (27 gauge).
25. Cure PDMS in an oven at 80°C for at least 4 hr.
26. Let PDMS cool to room temperature and then carefully break the edges of the Petri
dish with a pair of cutting pliers. Remove the shards of the Petri dish and then gently
peel the resulting negative replica PDMS template from the template wafer.
♦ CRITICAL STEP: The relatively fragile master wafer can be readily damaged at this
point. Exercise great caution when subjecting the wafer to stress.
27. Cut the PDMS template down to the patterned areas of interest. Place the PDMS
template face-up on a clean glass slide and perform silanization as described in step
22. At this point, the transparent PDMS template should become more opaque
(Figure 2, see panels c and d).
♦ PAUSE POINT: The PDMS templates (Figure 2, see panel d) can be stored for
several months at room temperature under clean, dry conditions.
Casting PDMS tissue molds 28. Prepare 35 g of PDMS solution as described in step 23.
29. Place the silanized PDMS template in a clean, non-tissue culture treated 60 mm
Petri dish and add approximately 15 mL prepared PDMS solution. The PDMS

173
template should be completed submerged in PDMS solution, producing a base of the
PDMS mold.
30. Use fine needles (27 gauge) to carefully remove air bubbles from the void spaces in
the PDMS template and transfer to a vacuum desiccator to degas for 1 hr.
♦ CRITICAL STEP: It is very important that all air bubbles be removed from the void
spaces in the PDMS master so that they can be filled with PDMS. Bubbles can be
easily detected visually through their refractive effect, which is distinct from the filled
void spaces.
31. Cure PDMS and peel it off the template as explained in steps 25 and 26.
♦ PAUSE POINT: The resulting PDMS tissue molds (Figure 2, see panel e) can be
stored for several months at room temperature under clean, dry conditions.
Preparation of PDMS tissue molds for cell/hydrogel molding 32. Place PDMS molds in the plasma asher and set the power to 100 W.
33. Apply plasma with oxygen for 1 min.
34. Remove the PDMS molds from the plasma asher and immerse them in deionized
water.
♦ CRITICAL STEP: The PDMS molds need to be made hydrophilic to allow filling with
the cell/hydrogel solution.
♦ PAUSE POINT: The plasma-treated PDMS molds can be stored in deionized water
for up to 2 weeks at room temperature under clean conditions.
35. Cut Velcro tape into a square frame and pin it to the base of the PDMS mold. The
Velcro frame is typically 0.5 mm thick and 2 mm wide on each side. The Velcro
frame should be in contact with the PDMS base at all points along its perimeter. Use
a minimum of 4 pins (as depicted in Figure 1, panel f) to ensure that contact is
achieved.
36. Place the PDMS molds with the pinned Velcro frames in a clean 100 mm Petri dish
filled with ethanol and leave it exposed to UV in a biological hood overnight.
37. Rinse PDMS molds with tissue culture water twice and dry with nitrogen.
♦ CRITICAL STEP: Perform steps 37 – 39 in a biological hood to keep the PDMS mold
sterile.
174
38. Immerse the sterilized PDMS molds in 0.2% (wt/vol) pluronic solution for 1 hr. The
coating with pluronic solution will prevent adhesion of hydrogel to the PDMS molds.
39. Rinse and store the PDMS molds in sterile tissue culture grade water.
♦ PAUSE POINT: The PDMS molds can be stored in sterile tissue culture grade water
for up to 24 hr at room temperature in a biological hood before cell/hydrogel molding.
Molding of cell/hydrogel mixture 40. Prepare cells for culture using one of our previously published cell isolation
protocols[171-173].
♦ CRITICAL STEP: Perform steps 40, 43 – 48 in a biological hood to maintain sterility.
41. Place 2x cardiac culture medium or 2x skeletal myoblast growth medium, Matrigel,
fibrinogen (10 mg/mL) and thrombin (50 unit/mL) stock solutions on ice.
42. Calculate the volume of each ingredient in the cell/hydrogel mixture.
Define V as the total volume of cell/hydrogel mixture. Use 2 mg/mL hydrogel as the
working concentration of fibrinogen. Use 0.4 unit of thrombin /mg fibrinogen to initiate
the fibrin gel polymerization.
Calculate V = volume of cell/hydrogel mixture per mold x number of molds (≤ 4)
For a mold with dimensions of 20 × 20 × 1.5 mm3 (length × width × height), the
volume of cell/hydrogel mixture is 500 µL. The rapid crosslinking of fibrinogen by
thrombin limits the maximum number of molds that can be consecutively filled with
the same cell/hydrogel mixture at room temperature to 4.
Volume of fibrinogen solution:
Vfibrinogen = V × 2 mg/mL / 10mg/mL = 0.2V
Volume of 2x medium:
V2x medium = Vfibrinogen = 0.2V
Volume of Matrigel:
VMatrigel = 10% × V = 0.1V
Volume of thrombin:
Vthrombin = (V × 2 mg/mL × 0.4 unit/mg) / 50 unit/mL = 0.016V
Volume of cell solution in 1x medium:
Vcells = V - Vfibrinogen - V2x medium - VMatrigel - Vthrombin = 0.484V
175
43. Prepare hydrogel mixture by adding 2x medium, Matrigel, and fibrinogen solutions in
an eppendorf tube on ice.
44. Resuspend centrifuged NRVM and NRSKM pellets in their corresponding 1x culture
media to obtain the total volumes of 0.484V. Add cell solution into the hydrogel
mixture on ice and gently mix.
45. Dry PDMS molds with nitrogen and place them in the wells of a 6- or 12-well tissue
culture plate.
46. Add thrombin into the cell/hydrogel mixture to initiate polymerization. Quickly inject
the cell/hydrogel mixture into PDMS molds using a pipette under a stereomicroscope.
♦ CRITICAL STEP: At the specified thrombin concentration, fibrin gel polymerizes
within 10 - 15 min at room temperature and 30 - 40 min on ice. Injecting the
cell/hydrogel mixture in a liquid state is critical to forming a uniform distribution of
cells upon molding.
♦ Troubleshooting
47. Add several drops of culture medium next to the mold in each well to provide
moisture and place the tissue culture plate with molds in an incubator (37˚C, 5% CO2)
for 45 min.
48. Gently add culture medium in each well until PDMS molds are fully immersed. Place
the plate back in the incubator for long-term culture.
♦ Troubleshooting
Tissue culture 49. Change the culture medium every other day. For NRSKMs, switch from growth
medium to differentiation medium on culture day 4 to promote the fusion of
myoblasts into myotubes. Perform in a biological hood.
♦ Troubleshooting
Assessment of engineered muscle tissues The resulting muscle tissue constructs can be structurally assessed at various
time points during culture using the following options: Option A, analysis of cell
176
alignment; Option B, immunohistological assessment of cellular content, differentiation
and connectivity; and Option C, assessment of cross-sectional cell distribution.
(A) Analysis of cell alignment (i) Immerse the molds with tissue constructs in a tissue culture plate containing DPBS
for 10 min. Repeat two more times using fresh DPBS solution.
(ii) Incubate tissue constructs in 4% (wt/vol) paraformaldehyde at 4˚C for 2 hrs.
(iii) Rinse tissue constructs as described in step (i).
(iv) Incubate tissue constructs in 0.5% (vol/vol) Triton X-100 in DPBS at room
temperature for 30 min.
(v) Rinse tissue constructs as described in step (i).
(vi) Incubate tissue constructs in a blocking solution (20% (vol/vol) chicken serum and
1% (wt/vol) BSA in DPBS) at room temperature for 2 hr.
(vii) Rinse tissue constructs as described in step (i).
(viii) Incubate tissue constructs with FITC-labeled phalloidin (50 µg/mL in DPBS) in low
light at room temperature for 2 hr.
(ix) Rinse tissue constructs as described in step (i). Keep the stained constructs
covered to avoid exposure to light.
♦ PAUSE POINT: The stained tissue constructs can be stored in DPBS for 1 week at
4˚C before imaging.
(x) Image tissue constructs while in the tissue molds at 5x magnification using an
upright confocal microscope (LSM510, Zeiss). Phalloidin staining allows
visualization of filamentous actin in the cells.
♦ Troubleshooting
(xi) Analyze the confocal fluorescence images using an intensity gradient algorithm
adapted from Karlon et al.[101] written in Matlab[174]. Obtain a cell orientation
vector in each 50 μm x 50 µm subregion. Plot the histogram showing the angle
distribution of all orientation vectors. Calculate the mean angle and the standard
deviation of all the angles. Use the standard deviation as a quantitative measure of
the degree of cell alignment.
177
(B) Immunostaining of tissue constructs (i) Immerse the molds with tissue constructs in a tissue culture plate containing DPBS
for 10 min. Repeat two more times using fresh DPBS solution.
(ii) Fix tissue constructs by following option (a) for staining of myogenin or vimentin,
and option (b) for staining of connexin 43. Choose either option for staining of
sarcomeric α-actinin.
(a) Incubate tissue constructs in 4% (wt/vol) paraformaldehyde (PFA) at 4˚C for 2
hr.
(b) Incubate tissue constructs in 50% methanol / 50% acetone (vol/vol) at room
temperature for 10 min.
(iii) Rinse tissue constructs as described in step (i).
(iv) If following option (a) in step (ii), incubate tissue constructs in 0.5% (vol/vol) Triton
X-100 in DPBS at room temperature for 30 min. If following option (b) in step
(ii), proceed to step (vi).
(v) Rinse tissue constructs as described in step (i).
(vi) Incubate tissue constructs in a blocking solution (20% (vol/vol) chicken serum and
1% (wt/vol) BSA in DPBS) at room temperature for 2 hr.
(vii) Rinse tissue constructs as described in step (i).
(viii) Incubate tissue constructs in primary antibodies (1% (vol/vol) solution in DPBS) at
4˚C overnight.
(ix) Rinse tissue constructs as described in step (i).
(x) Incubate tissue constructs in fluorophore-conjugated secondary antibodies (0.5%
(vol/vol) solution in DPBS) and nuclear stain DAPI (100 µg/mL in DPBS) at room
temperature for 2 hr, covered by aluminum foil.
(xi) Rinse tissue constructs as described in step (i). Cover the stained constructs with
aluminum foil to avoid exposure to light.
(xii) In dark conditions, gently remove tissue constructs attached to Velcro frame from
the PDMS molds using forceps and immerse in DPBS. Use surgical scissors to
separate tissue constructs from Velcro frames. Keep tissue constructs in DPBS
when cutting.
♦ CRITICAL STEP: The hydrogel-based tissue constructs without Velcro frames
collapse in air, so it is important to always handle tissues in DPBS.
178
(xiii) In dark conditions, place a drop of Fluoromount G solution on a glass slide and
carefully transfer the tissue constructs cut out of the Velcro frames onto the
Fluoromount G drop. Gently place a glass coverslip on top. Leave the mounted
tissue constructs covered from the light at room temperature overnight.
(xiv) Seal the edge of the glass coverslip with nail-polish.
♦ PAUSE POINT: The mounted tissue constructs can be stored for 1 week at 4ºC in
dark and dry conditions before imaging.
(xv) Image the stained and mounted tissue constructs at 40x magnification using an
inverted confocal microscope (LSM 510, Zeiss) to visualize the cells.
♦ Troubleshooting
(C) Assessment of cross-sectional cell distribution (i) Immerse the molds with tissue constructs in a tissue culture plate containing
DPBS for 10 min. Repeat two more times using fresh DPBS solution.
(ii) Fix tissue constructs in 4% (wt/vol) paraformaldehyde at 4˚C for 2 hr.
(iii) Rinse tissue constructs as in step (i).
(iv) Cut one side of the Velcro frame using surgical scissors. Fill 2/3 of the volume in
cryomolds with the Tissue-Tek O.C.T. compound. Transfer tissue constructs with
the Velcro frame onto the O.C.T. compound. Use a pair of tweezers to position
tissue constructs within the O.C.T. compound.
(v) Place cryomolds on dry ice until O.C.T. compound becomes translucent. Fill the
rest of the volume in cryomolds with O.C.T. compound. Leave cryomolds on dry
ice until O.C.T. compound becomes opaque and solid.
(vi) Remove the frozen block from the cryomold and mount it on the cryostat. Start
sectioning from the side without the Velcro frame. When the Velcro frame is
visible, cut the mounted block by a scalpel to remove the two parallel sides of the
frame. Collect 20 µm thick sections on superfrost plus slides.
♦ CRITICAL STEP: Although the Velcro frame facilitates tissue embedding, it needs
to be removed during sectioning to allow smooth passage of the blade that yields
intact sections.
179
♦ PAUSE POINT: The slides with cryosections can be stored for 1-2 weeks at 4°C
before staining.
(vii) Rinse slides with DPBS 3 times, leaving them immersed in DPBS for 5 min during
each rinse.
(viii) Permeabilize cells in 0.1% (vol/vol) Triton X-100 in DPBS for 10 min.
(ix) Rinse sections as described in step (vii).
(x) Incubate slides in a blocking solution (20% (vol/vol) chicken serum and 1% (wt/vol)
BSA in DPBS) at room temperature for 1 hr.
(xi) Rinse sections as described in step (vii).
(xii) Incubate in primary antibodies (1% (vol/vol) solution in DPBS) at room temperature
for 1 hr.
(xiii) Rinse sections as described in step (vii).
(xiv) Incubate in fluorophore-conjugated secondary antibodies (0.5% (vol/vol) solution in
DPBS) and nuclear stain DAPI (100 µg/mL in DPBS) in dark at room temperature
for 1 hr.
(xv) Rinse sections as described in step (vii).
(xvi) Gently place a drop of Fluoromount G on the stained sections followed by a glass
coverslip on top. Leave the mounted slides in dark at room temperature overnight.
(xvii) Seal the glass coverslip with nail-polish.
♦ PAUSE POINT: The mounted sections can be stored for 1 - 2 weeks at 4ºC
under dark and dry conditions before imaging.
(xviii) Image the stained sections at 20x or 40x magnification using an inverted confocal
microscope to assess the cross-sectional cell distribution.
TIMING Preparation of silicon wafers (Steps 1 - 7): 1 hr
Preparation of photoresist layer (Steps 8 - 14): 24 - 36 hrs
Aligning and exposing photoresist layer (Steps 15 - 16): 30 min - 1 hr
Post-exposure bake and development (Steps 17 - 21): 40 - 48 hr
Casting negative replica PDMS templates (Steps 22 - 27): 5 hr
Casting PDMS tissue molds (Steps 28 - 31): 5 hr
Preparation of PDMS molds for cell/hydrogel patterning (Steps 32 - 39): 14 hr
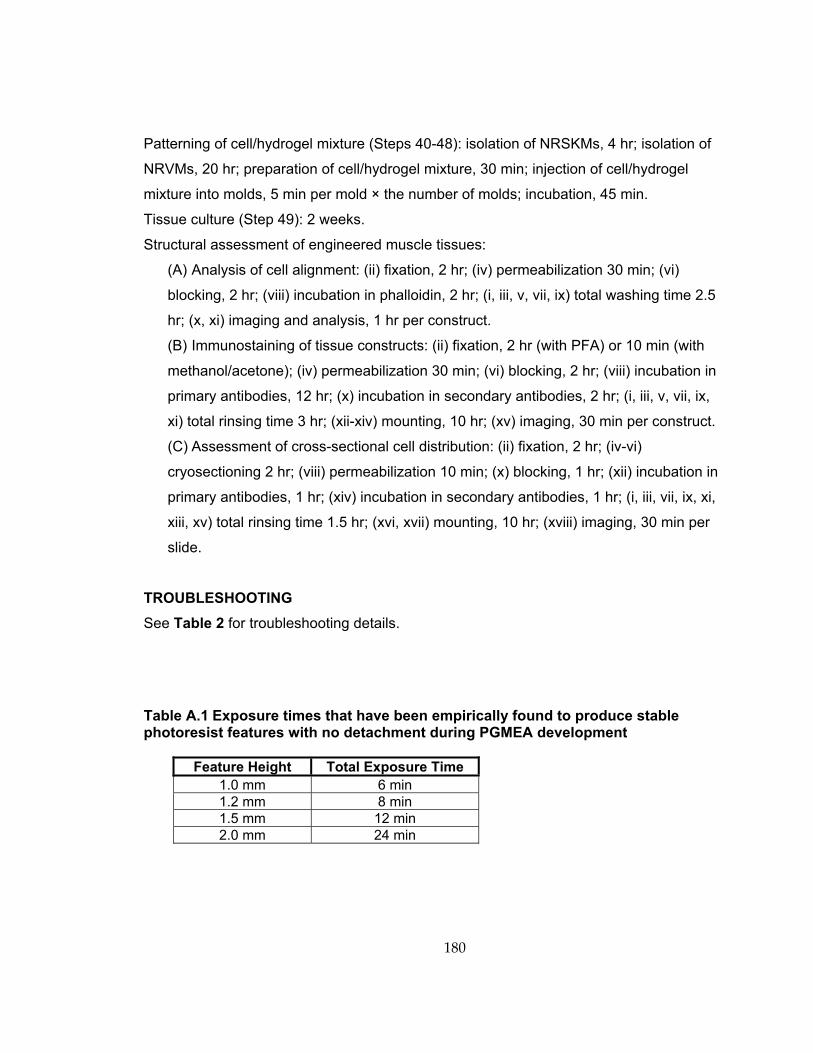
180
Patterning of cell/hydrogel mixture (Steps 40-48): isolation of NRSKMs, 4 hr; isolation of
NRVMs, 20 hr; preparation of cell/hydrogel mixture, 30 min; injection of cell/hydrogel
mixture into molds, 5 min per mold × the number of molds; incubation, 45 min.
Tissue culture (Step 49): 2 weeks.
Structural assessment of engineered muscle tissues:
(A) Analysis of cell alignment: (ii) fixation, 2 hr; (iv) permeabilization 30 min; (vi)
blocking, 2 hr; (viii) incubation in phalloidin, 2 hr; (i, iii, v, vii, ix) total washing time 2.5
hr; (x, xi) imaging and analysis, 1 hr per construct.
(B) Immunostaining of tissue constructs: (ii) fixation, 2 hr (with PFA) or 10 min (with
methanol/acetone); (iv) permeabilization 30 min; (vi) blocking, 2 hr; (viii) incubation in
primary antibodies, 12 hr; (x) incubation in secondary antibodies, 2 hr; (i, iii, v, vii, ix,
xi) total rinsing time 3 hr; (xii-xiv) mounting, 10 hr; (xv) imaging, 30 min per construct.
(C) Assessment of cross-sectional cell distribution: (ii) fixation, 2 hr; (iv-vi)
cryosectioning 2 hr; (viii) permeabilization 10 min; (x) blocking, 1 hr; (xii) incubation in
primary antibodies, 1 hr; (xiv) incubation in secondary antibodies, 1 hr; (i, iii, vii, ix, xi,
xiii, xv) total rinsing time 1.5 hr; (xvi, xvii) mounting, 10 hr; (xviii) imaging, 30 min per
slide.
TROUBLESHOOTING See Table 2 for troubleshooting details.
Table A.1 Exposure times that have been empirically found to produce stable photoresist features with no detachment during PGMEA development
Feature Height Total Exposure Time 1.0 mm 6 min 1.2 mm 8 min 1.5 mm 12 min 2.0 mm 24 min
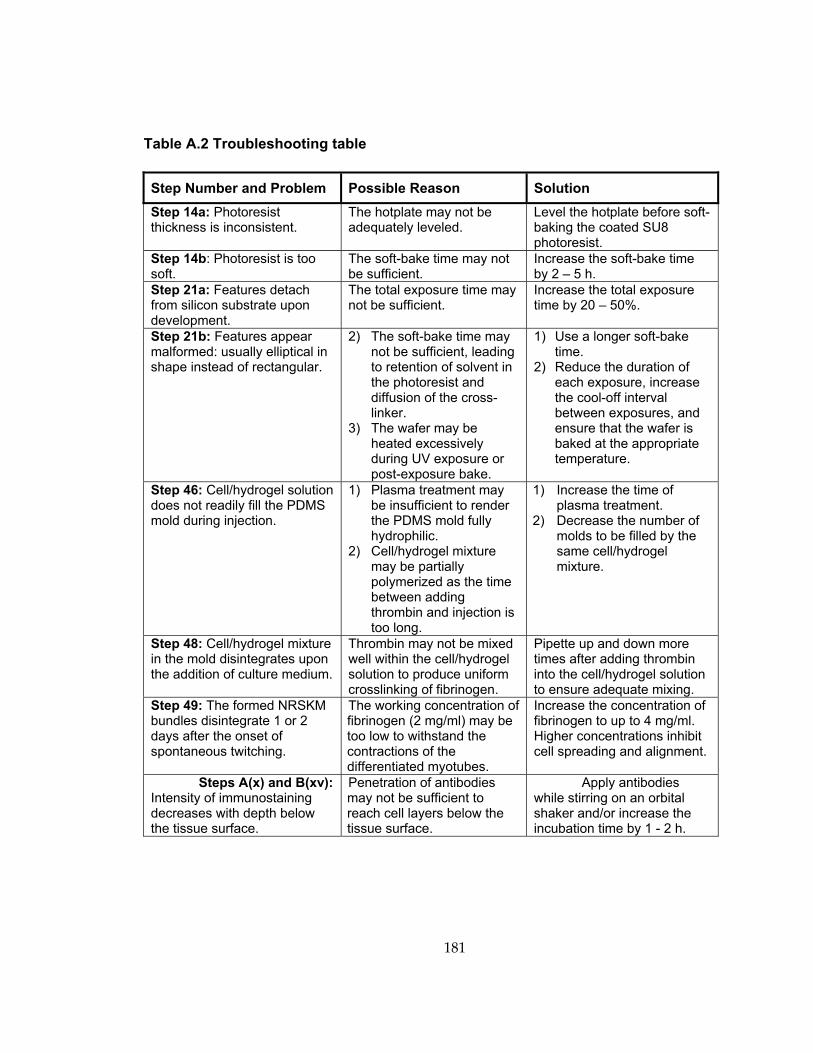
181
Table A.2 Troubleshooting table
Step Number and Problem Possible Reason Solution Step 14a: Photoresist thickness is inconsistent.
The hotplate may not be adequately leveled.
Level the hotplate before soft-baking the coated SU8 photoresist.
Step 14b: Photoresist is too soft.
The soft-bake time may not be sufficient.
Increase the soft-bake time by 2 – 5 h.
Step 21a: Features detach from silicon substrate upon development.
The total exposure time may not be sufficient.
Increase the total exposure time by 20 – 50%.
Step 21b: Features appear malformed: usually elliptical in shape instead of rectangular.
2) The soft-bake time may not be sufficient, leading to retention of solvent in the photoresist and diffusion of the cross-linker.
3) The wafer may be heated excessively during UV exposure or post-exposure bake.
1) Use a longer soft-bake time.
2) Reduce the duration of each exposure, increase the cool-off interval between exposures, and ensure that the wafer is baked at the appropriate temperature.
Step 46: Cell/hydrogel solution does not readily fill the PDMS mold during injection.
1) Plasma treatment may be insufficient to render the PDMS mold fully hydrophilic.
2) Cell/hydrogel mixture may be partially polymerized as the time between adding thrombin and injection is too long.
1) Increase the time of plasma treatment.
2) Decrease the number of molds to be filled by the same cell/hydrogel mixture.
Step 48: Cell/hydrogel mixture in the mold disintegrates upon the addition of culture medium.
Thrombin may not be mixed well within the cell/hydrogel solution to produce uniform crosslinking of fibrinogen.
Pipette up and down more times after adding thrombin into the cell/hydrogel solution to ensure adequate mixing.
Step 49: The formed NRSKM bundles disintegrate 1 or 2 days after the onset of spontaneous twitching.
The working concentration of fibrinogen (2 mg/ml) may be too low to withstand the contractions of the differentiated myotubes.
Increase the concentration of fibrinogen to up to 4 mg/ml. Higher concentrations inhibit cell spreading and alignment.
Steps A(x) and B(xv): Intensity of immunostaining decreases with depth below the tissue surface.
Penetration of antibodies may not be sufficient to reach cell layers below the tissue surface.
Apply antibodies while stirring on an orbital shaker and/or increase the incubation time by 1 - 2 h.
182
References 1. Bach, A.D., et al., Skeletal muscle tissue engineering. J Cell Mol Med, 2004. 8(4): p.
413‐22.
2. Vilquin, J.T., Myoblast transplantation: clinical trials and perspectives. Mini‐review. Acta Myol, 2005. 24(2): p. 119‐27.
3. Davis, B.H., et al., An in vitro system to evaluate the effects of ischemia on survival of cells used for cell therapy. Ann Biomed Eng, 2007. 35(8): p. 1414‐24.
4. Engler, A.J., et al., Myotubes differentiate optimally on substrates with tissue‐like stiffness: pathological implications for soft or stiff microenvironments. J Cell Biol, 2004. 166(6): p. 877‐87.
5. Huebsch, N., et al., Harnessing traction‐mediated manipulation of the cell/matrix interface to control stem‐cell fate. Nat Mater, 2010. 9(6): p. 518‐26.
6. Rowe, S.L. and J.P. Stegemann, Interpenetrating collagen‐fibrin composite matrices with varying protein contents and ratios. Biomacromolecules, 2006. 7(11): p. 2942‐8.
7. Gawlitta, D., et al., The influence of serum‐free culture conditions on skeletal muscle differentiation in a tissue‐engineered model. Tissue Eng Part A, 2008. 14(1): p. 161‐71.
8. Takano, K., et al., Nebulin and N‐WASP cooperate to cause IGF‐1‐induced sarcomeric actin filament formation. Science, 2010. 330(6010): p. 1536‐40.
9. Vandenburgh, H., et al., Drug‐screening platform based on the contractility of tissue‐engineered muscle. Muscle Nerve, 2008. 37(4): p. 438‐47.
10. Kumar, A., et al., Cyclic mechanical strain inhibits skeletal myogenesis through activation of focal adhesion kinase, Rac‐1 GTPase, and NF‐kappaB transcription factor. FASEB J, 2004. 18(13): p. 1524‐35.
183
11. Otis, J.S., T.J. Burkholder, and G.K. Pavlath, Stretch‐induced myoblast proliferation is dependent on the COX2 pathway. Exp Cell Res, 2005. 310(2): p. 417‐25.
12. Powell, C.A., et al., Mechanical stimulation improves tissue‐engineered human skeletal muscle. Am J Physiol Cell Physiol, 2002. 283(5): p. C1557‐65.
13. Tatsumi, R., et al., Mechanical stretch induces activation of skeletal muscle satellite cells in vitro. Exp Cell Res, 2001. 267(1): p. 107‐14.
14. De Deyne, P.G., Formation of sarcomeres in developing myotubes: role of mechanical stretch and contractile activation. Am J Physiol Cell Physiol, 2000. 279(6): p. C1801‐11.
15. Fujita, H., T. Nedachi, and M. Kanzaki, Accelerated de novo sarcomere assembly by electric pulse stimulation in C2C12 myotubes. Exp Cell Res, 2007. 313(9): p. 1853‐65.
16. Larkin, L.M., et al., Functional evaluation of nerve‐skeletal muscle constructs engineered in vitro. In Vitro Cell Dev Biol Anim, 2006. 42(3‐4): p. 75‐82.
17. Bach, A.D., J.P. Beier, and G.B. Stark, Expression of Trisk 51, agrin and nicotinic‐acetycholine receptor epsilon‐subunit during muscle development in a novel three‐dimensional muscle‐neuronal co‐culture system. Cell Tissue Res, 2003. 314(2): p. 263‐74.
18. Gartner, L.P. and J.L. Hiatt, Color Textbook of Histology. 2nd ed. 2001, Philadelphia, Pennsylvania: Saunders. 592.
19. Sadava, D., et al., Life: The Science of Biology. Vol. III. 2008: Sinauer Associates Inc. and W.H. Freeman and Company. 1121.
20. Nowak, K.J. and K.E. Davies, Duchenne muscular dystrophy and dystrophin: pathogenesis and opportunities for treatment. EMBO Rep, 2004. 5(9): p. 872‐6.
184
21. Lunn, M.R. and C.H. Wang, Spinal muscular atrophy. Lancet, 2008. 371(9630): p. 2120‐33.
22. Midrio, M., The denervated muscle: facts and hypotheses. A historical review. Eur J Appl Physiol, 2006. 98(1): p. 1‐21.
23. Petrasek, P.F., S. Homer‐Vanniasinkam, and P.M. Walker, Determinants of ischemic injury to skeletal muscle. J Vasc Surg, 1994. 19(4): p. 623‐31.
24. Marzetti, E. and C. Leeuwenburgh, Skeletal muscle apoptosis, sarcopenia and frailty at old age. Exp Gerontol, 2006. 41(12): p. 1234‐8.
25. Welle, S., Cellular and molecular basis of age‐related sarcopenia. Can J Appl Physiol, 2002. 27(1): p. 19‐41.
26. Wozniak, A.C., et al., Signaling satellite‐cell activation in skeletal muscle: markers, models, stretch, and potential alternate pathways. Muscle Nerve, 2005. 31(3): p. 283‐300.
27. Charge, S.B. and M.A. Rudnicki, Cellular and molecular regulation of muscle regeneration. Physiol Rev, 2004. 84(1): p. 209‐38.
28. Parker, M.H., P. Seale, and M.A. Rudnicki, Looking back to the embryo: defining transcriptional networks in adult myogenesis. Nat Rev Genet, 2003. 4(7): p. 497‐507.
29. Cooper, S.T., et al., C2C12 co‐culture on a fibroblast substratum enables sustained survival of contractile, highly differentiated myotubes with peripheral nuclei and adult fast myosin expression. Cell Motil Cytoskeleton, 2004. 58(3): p. 200‐11.
30. Monti, R.J., et al., Transmission of forces within mammalian skeletal muscles. J Biomech, 1999. 32(4): p. 371‐80.
185
31. Paul, A.C., et al., Localization of alpha 7 integrins and dystrophin suggests potential for both lateral and longitudinal transmission of tension in large mammalian muscles. Cell Tissue Res, 2002. 308(2): p. 255‐65.
32. Capote, J., et al., Calcium transients in developing mouse skeletal muscle fibres. J Physiol, 2005. 564(Pt 2): p. 451‐64.
33. Ward, K.M. and A.C. Wareham, Changes in membrane potential and potassium and sodium activities during postnatal development of mouse skeletal muscle. Exp Neurol, 1985. 89(3): p. 554‐68.
34. Franzini‐Armstrong, C., Simultaneous maturation of transverse tubules and sarcoplasmic reticulum during muscle differentiation in the mouse. Dev Biol, 1991. 146(2): p. 353‐63.
35. Flucher, B.E., S.B. Andrews, and M.P. Daniels, Molecular organization of transverse tubule/sarcoplasmic reticulum junctions during development of excitation‐contraction coupling in skeletal muscle. Mol Biol Cell, 1994. 5(10): p. 1105‐18.
36. Bevan, S. and J.H. Steinbach, The distribution of alpha‐bungarotoxin binding sites of mammalian skeletal muscle developing in vivo. J Physiol, 1977. 267(1): p. 195‐213.
37. Dennis, R.G. and D.E. Dow, Excitability of skeletal muscle during development, denervation, and tissue culture. Tissue Eng, 2007. 13(10): p. 2395‐404.
38. Huijing, P.A., Muscle as a collagen fiber reinforced composite: a review of force transmission in muscle and whole limb. J Biomech, 1999. 32(4): p. 329‐45.
39. Young, M., et al., Examination of intrafascicular muscle fiber terminations: implications for tension delivery in series‐fibered muscles. J Morphol, 2000. 245(2): p. 130‐45.
40. Bloch, R.J. and H. Gonzalez‐Serratos, Lateral force transmission across costameres in skeletal muscle. Exerc Sport Sci Rev, 2003. 31(2): p. 73‐8.
186
41. Berthier, C. and S. Blaineau, Supramolecular organization of the subsarcolemmal cytoskeleton of adult skeletal muscle fibers. A review. Biol Cell, 1997. 89(7): p. 413‐34.
42. Ehmsen, J., E. Poon, and K. Davies, The dystrophin‐associated protein complex. J Cell Sci, 2002. 115(Pt 14): p. 2801‐3.
43. Anastasi, G., et al., Distribution and localization of vinculin‐talin‐integrin system and dystrophin‐glycoprotein complex in human skeletal muscle. Immunohistochemical study using confocal laser scanning microscopy. Cells Tissues Organs, 2003. 175(3): p. 151‐64.
44. Bezakova, G. and M.A. Ruegg, New insights into the roles of agrin. Nat Rev Mol Cell Biol, 2003. 4(4): p. 295‐308.
45. Willmann, R. and C. Fuhrer, Neuromuscular synaptogenesis: clustering of acetylcholine receptors revisited. Cell Mol Life Sci, 2002. 59(8): p. 1296‐316.
46. Gesemann, M., et al., Agrin is a high‐affinity binding protein of dystroglycan in non‐muscle tissue. J Biol Chem, 1998. 273(1): p. 600‐5.
47. Denzer, A.J., et al., Agrin binds to the nerve‐muscle basal lamina via laminin. J Cell Biol, 1997. 137(3): p. 671‐83.
48. Williams, M.W. and R.J. Bloch, Extensive but coordinated reorganization of the membrane skeleton in myofibers of dystrophic (mdx) mice. J Cell Biol, 1999. 144(6): p. 1259‐70.
49. Jacobson, C., et al., The dystroglycan complex is necessary for stabilization of acetylcholine receptor clusters at neuromuscular junctions and formation of the synaptic basement membrane. J Cell Biol, 2001. 152(3): p. 435‐50.
50. Bandi, E., et al., Neural agrin controls maturation of the excitation‐contraction coupling mechanism in human myotubes developing in vitro. Am J Physiol Cell Physiol, 2008. 294(1): p. C66‐73.
187
51. Jurdana, M., et al., Neural Agrin Changes the Electrical Properties of Developing Human Skeletal Muscle Cells. Cell Mol Neurobiol, 2008.
52. Allen, R.E., et al., Skeletal muscle satellite cell cultures. Methods Cell Biol, 1997. 52: p. 155‐76.
53. Partridge, T.A., et al., Conversion of mdx myofibres from dystrophin‐negative to ‐positive by injection of normal myoblasts. Nature, 1989. 337(6203): p. 176‐9.
54. Urish, K., Y. Kanda, and J. Huard, Initial failure in myoblast transplantation therapy has led the way toward the isolation of muscle stem cells: potential for tissue regeneration. Curr Top Dev Biol, 2005. 68: p. 263‐80.
55. Mouly, V., et al., Myoblast transfer therapy: is there any light at the end of the tunnel? Acta Myol, 2005. 24(2): p. 128‐33.
56. Vilquin, J.T., et al., Normal growth and regenerating ability of myoblasts from unaffected muscles of facioscapulohumeral muscular dystrophy patients. Gene Ther, 2005. 12(22): p. 1651‐62.
57. Langer, R. and J.P. Vacanti, Tissue engineering. Science, 1993. 260(5110): p. 920‐6.
58. Christman, K.L., et al., Injectable fibrin scaffold improves cell transplant survival, reduces infarct expansion, and induces neovasculature formation in ischemic myocardium. J Am Coll Cardiol, 2004. 44(3): p. 654‐60.
59. Kutschka, I., et al., Collagen matrices enhance survival of transplanted cardiomyoblasts and contribute to functional improvement of ischemic rat hearts. Circulation, 2006. 114(1 Suppl): p. I167‐73.
60. Tao, S., et al., Survival, migration and differentiation of retinal progenitor cells transplanted on micro‐machined poly(methyl methacrylate) scaffolds to the subretinal space. Lab Chip, 2007. 7(6): p. 695‐701.
188
61. Thorrez, L., et al., Growth, differentiation, transplantation and survival of human skeletal myofibers on biodegradable scaffolds. Biomaterials, 2008. 29(1): p. 75‐84.
62. Bian, W. and N. Bursac, Tissue engineering of functional skeletal muscle: challenges and recent advances. IEEE Eng Med Biol Mag, 2008. 27(5): p. 109‐13.
63. Okano, T. and T. Matsuda, Tissue engineered skeletal muscle: preparation of highly dense, highly oriented hybrid muscular tissues. Cell Transplant, 1998. 7(1): p. 71‐82.
64. Huang, Y.C., et al., Rapid formation of functional muscle in vitro using fibrin gels. J Appl Physiol, 2005. 98(2): p. 706‐13. Epub 2004 Oct 8.
65. Rhim, C., et al., Morphology and ultrastructure of differentiating three‐dimensional mammalian skeletal muscle in a collagen gel. Muscle Nerve, 2007. 36(1): p. 71‐80.
66. Kroehne, V., et al., Use of a novel collagen matrix with oriented pore structure for muscle cell differentiation in cell culture and in grafts. J Cell Mol Med., 2008. 12: p. 1582‐1838.
67. Bursac, N., et al., Novel anisotropic engineered cardiac tissues: studies of electrical propagation. Biochem Biophys Res Commun, 2007. 361(4): p. 847‐53.
68. Barbee, K.A., Mechanical cell injury. Ann N Y Acad Sci, 2005. 1066: p. 67‐84.
69. Lieber, R.L., T.M. Woodburn, and J. Friden, Muscle damage induced by eccentric contractions of 25% strain. J Appl Physiol, 1991. 70(6): p. 2498‐507.
70. McNeil, P.L. and R.A. Steinhardt, Loss, restoration, and maintenance of plasma membrane integrity. J Cell Biol, 1997. 137(1): p. 1‐4.
71. Burkholder, T.J., Permeability of C2C12 myotube membranes is influenced by stretch velocity. Biochem Biophys Res Commun, 2003. 305(2): p. 266‐70.
189
72. Clarke, M.S. and D.L. Feeback, Mechanical load induces sarcoplasmic wounding and FGF release in differentiated human skeletal muscle cultures. FASEB J, 1996. 10(4): p. 502‐9.
73. Vandenburgh, H.H., et al., Skeletal muscle growth is stimulated by intermittent stretch‐relaxation in tissue culture. Am J Physiol, 1989. 256(3 Pt 1): p. C674‐82.
74. Cheema, U., et al., 3‐D in vitro model of early skeletal muscle development. Cell Motil Cytoskeleton, 2003. 54(3): p. 226‐36.
75. Vandenburgh, H.H. and P. Karlisch, Longitudinal growth of skeletal myotubes in vitro in a new horizontal mechanical cell stimulator. In Vitro Cell Dev Biol, 1989. 25(7): p. 607‐16.
76. Levenberg, S., et al., Engineering vascularized skeletal muscle tissue. Nat Biotechnol, 2005. 23(7): p. 879‐84.
77. Borschel, G.H., et al., Tissue‐engineered axially vascularized contractile skeletal muscle. Plast Reconstr Surg, 2006. 117(7): p. 2235‐42.
78. Messina, A., et al., Generation of a vascularized organoid using skeletal muscle as the inductive source. Faseb J, 2005. 19(11): p. 1570‐2.
79. Dhawan, V., et al., Neurotization improves contractile forces of tissue‐engineered skeletal muscle. Tissue Eng, 2007. 13(11): p. 2813‐21.
80. Tsang, V.L. and S.N. Bhatia, Three‐dimensional tissue fabrication. Adv Drug Deliv Rev, 2004. 56(11): p. 1635‐47.
81. Shi, Y., L. Rittman, and I. Vesely, Novel geometries for tissue‐engineered tendonous collagen constructs. Tissue Eng, 2006. 12(9): p. 2601‐9.
190
82. Costa, K.D., E.J. Lee, and J.W. Holmes, Creating alignment and anisotropy in engineered heart tissue: role of boundary conditions in a model three‐dimensional culture system. Tissue Eng, 2003. 9(4): p. 567‐77.
83. Girton, T.S., V.H. Barocas, and R.T. Tranquillo, Confined compression of a tissue‐equivalent: collagen fibril and cell alignment in response to anisotropic strain. J Biomech Eng, 2002. 124(5): p. 568‐75.
84. Kloxin, A.M., et al., Photodegradable hydrogels for dynamic tuning of physical and chemical properties. Science, 2009. 324(5923): p. 59‐63.
85. De Coppi, P., et al., Angiogenic gene‐modified muscle cells for enhancement of tissue formation. Tissue Eng, 2005. 11(7‐8): p. 1034‐44.
86. Suzuki, K., et al., Cell transplantation for the treatment of acute myocardial infarction using vascular endothelial growth factor‐expressing skeletal myoblasts. Circulation, 2001. 104(12 Suppl 1): p. I207‐12.
87. Zisch, A.H., M.P. Lutolf, and J.A. Hubbell, Biopolymeric delivery matrices for angiogenic growth factors. Cardiovasc Pathol, 2003. 12(6): p. 295‐310.
88. Fedorovich, N.E., et al., Hydrogels as extracellular matrices for skeletal tissue engineering: state‐of‐the‐art and novel application in organ printing. Tissue Eng, 2007. 13(8): p. 1905‐25.
89. Leong, K.F., C.M. Cheah, and C.K. Chua, Solid freeform fabrication of three‐dimensional scaffolds for engineering replacement tissues and organs. Biomaterials, 2003. 24(13): p. 2363‐78.
90. Tang, M.D., A.P. Golden, and J. Tien, Molding of three‐dimensional microstructures of gels. J Am Chem Soc, 2003. 125(43): p. 12988‐9.
91. Tan, W. and T.A. Desai, Microfluidic patterning of cells in extracellular matrix biopolymers: effects of channel size, cell type, and matrix composition on pattern integrity. Tissue Eng, 2003. 9(2): p. 255‐67.
191
92. Liu Tsang, V., et al., Fabrication of 3D hepatic tissues by additive photopatterning of cellular hydrogels. FASEB J, 2007. 21(3): p. 790‐801. Epub 2006 Dec 28.
93. Revzin, A., et al., Fabrication of poly(ethylene glycol) hydrogel microstructures using photolithography. Langmuir, 2001. 17(18): p. 5440‐7.
94. Whitesides, G.M., et al., Soft lithography in biology and biochemistry. Annu Rev Biomed Eng, 2001. 3: p. 335‐73.
95. Gonen‐Wadmany, M., L. Oss‐Ronen, and D. Seliktar, Protein‐polymer conjugates for forming photopolymerizable biomimetic hydrogels for tissue engineering. Biomaterials, 2007. 28(26): p. 3876‐86.
96. Fedorovich, N.E., et al., The effect of photopolymerization on stem cells embedded in hydrogels. Biomaterials, 2009. 30(3): p. 344‐53.
97. Williams, C.G., et al., Variable cytocompatibility of six cell lines with photoinitiators used for polymerizing hydrogels and cell encapsulation. Biomaterials, 2005. 26(11): p. 1211‐8.
98. Yelbuz, T.M., et al., Optical coherence tomography: a new high‐resolution imaging technology to study cardiac development in chick embryos. Circulation, 2002. 106(22): p. 2771‐4.
99. Bursac, N., et al., Cultivation in rotating bioreactors promotes maintenance of cardiac myocyte electrophysiology and molecular properties. Tissue Eng, 2003. 9(6): p. 1243‐53.
100. Bian, W., et al., Mesoscopic hydrogel molding to control the 3D geometry of bioartificial muscle tissues. Nat Protoc, 2009. 4(10): p. 1522‐34.
101. Karlon, W.J., et al., Automated measurement of myofiber disarray in transgenic mice with ventricular expression of ras. Anat Rec, 1998. 252(4): p. 612‐25.
192
102. Zimmermann, W.H., et al., Three‐dimensional engineered heart tissue from neonatal rat cardiac myocytes. Biotechnol Bioeng, 2000. 68(1): p. 106‐14.
103. Laemmli, U.K., Cleavage of structural proteins during the assembly of the head of bacteriophage T4. Nature, 1970. 227(5259): p. 680‐5.
104. Fung, Y.C., Foundation of solid mechanics. 1965, Englewood Cliffs, New Jersey: Prentice‐Hall.
105. Walker, J.S., X. Li, and P.M. Buttrick, Analysing force‐pCa curves. J Muscle Res Cell Motil, 2010. 31(1): p. 59‐69.
106. Fedorov, V.V., et al., Application of blebbistatin as an excitation‐contraction uncoupler for electrophysiologic study of rat and rabbit hearts. Heart Rhythm, 2007. 4(5): p. 619‐26.
107. Whitesides, G.M., The origins and the future of microfluidics. Nature, 2006. 442(7101): p. 368‐73.
108. Tan, J.L., et al., Cells lying on a bed of microneedles: an approach to isolate mechanical force. Proc Natl Acad Sci U S A, 2003. 100(4): p. 1484‐9.
109. Andreatta, R.H., R.K. Liem, and H.A. Scheraga, Mechanism of action of thrombin on fibrinogen. I. Synthesis of fibrinogen‐like peptides, and their proteolysis by thrombin and trypsin. Proc Natl Acad Sci U S A, 1971. 68(2): p. 253‐6.
110. Cummings, C.L., et al., Properties of engineered vascular constructs made from collagen, fibrin, and collagen‐fibrin mixtures. Biomaterials, 2004. 25(17): p. 3699‐706.
111. Perennes, F., et al., Replication of deep x‐ray lithography fabricated microstructures through casting of soft material. J. Microlith Microfab Microsyst, 2006. 5(1): p. 011007.
193
112. McDonald, J.C. and G.M. Whitesides, Poly(dimethylsiloxane) as a material for fabricating microfluidic devices. Acc Chem Res, 2002. 35(7): p. 491‐9.
113. Harrison, C., et al., A rapid prototyping technique for the fabrication of solvent‐resistant structures. J Micromech Microeng, 2004. 14: p. 153‐158.
114. Zein, I., et al., Fused deposition modeling of novel scaffold architectures for tissue engineering applications. Biomaterials, 2002. 23(4): p. 1169‐85.
115. Du, Y., et al., Directed assembly of cell‐laden microgels for fabrication of 3D tissue constructs. Proc Natl Acad Sci U S A, 2008. 105(28): p. 9522‐7.
116. Mapili, G., et al., Laser‐layered microfabrication of spatially patterned functionalized tissue‐engineering scaffolds. J Biomed Mater Res B Appl Biomater, 2005. 75(2): p. 414‐24.
117. Ohsumi, T.K., et al., Three‐dimensional simulation of anisotropic cell‐driven collagen gel compaction. Biomech Model Mechanobiol, 2008. 7(1): p. 53‐62.
118. Wakatsuki, T., et al., Cell mechanics studied by a reconstituted model tissue. Biophys J, 2000. 79(5): p. 2353‐68.
119. Wille, J.J., E.L. Elson, and R.J. Okamoto, Cellular and matrix mechanics of bioartificial tissues during continuous cyclic stretch. Ann Biomed Eng, 2006. 34(11): p. 1678‐90.
120. Isenberg, B.C. and R.T. Tranquillo, Long‐term cyclic distention enhances the mechanical properties of collagen‐based media‐equivalents. Ann Biomed Eng, 2003. 31(8): p. 937‐49.
121. Robinson, P.S., et al., Functional Tissue‐Engineered Valves from Cell‐Remodeled Fibrin with Commissural Alignment of Cell‐Produced Collagen. Tissue Eng., 2007.
122. Zimmermann, W.H., et al., Tissue engineering of a differentiated cardiac muscle construct. Circ Res, 2002. 90(2): p. 223‐30.
194
123. Shi, Y. and I. Vesely, Fabrication of mitral valve chordae by directed collagen gel shrinkage. Tissue Eng, 2003. 9(6): p. 1233‐42.
124. Long, J.L. and R.T. Tranquillo, Elastic fiber production in cardiovascular tissue‐equivalents. Matrix Biol, 2003. 22(4): p. 339‐50.
125. Clark, R.A., et al., Collagen matrices attenuate the collagen‐synthetic response of cultured fibroblasts to TGF‐beta. J Cell Sci, 1995. 108 ( Pt 3): p. 1251‐61.
126. Yang, L., et al., Micromechanical bending of single collagen fibrils using atomic force microscopy. J Biomed Mater Res A, 2007. 82(1): p. 160‐8.
127. Collet, J.P., et al., The elasticity of an individual fibrin fiber in a clot. Proc Natl Acad Sci U S A, 2005. 102(26): p. 9133‐7. Epub 2005 Jun 20.
128. Naito, H., et al., Optimizing engineered heart tissue for therapeutic applications as surrogate heart muscle. Circulation, 2006. 114(1 Suppl): p. I72‐8.
129. Siegal, G.P., et al., Development of a novel human extracellular matrix for quantitation of the invasiveness of human cells. Cancer Lett, 1993. 69(2): p. 123‐32.
130. Eastwood, M., D.A. McGrouther, and R.A. Brown, A culture force monitor for measurement of contraction forces generated in human dermal fibroblast cultures: evidence for cell‐matrix mechanical signalling. Biochim Biophys Acta, 1994. 1201(2): p. 186‐92.
131. Hayward, L.J., Y.Y. Zhu, and R.J. Schwartz, Cellular localization of muscle and nonmuscle actin mRNAs in chicken primary myogenic cultures: the induction of alpha‐skeletal actin mRNA is regulated independently of alpha‐cardiac actin gene expression. J Cell Biol, 1988. 106(6): p. 2077‐86.
132. Clark, P., D. Coles, and M. Peckham, Preferential adhesion to and survival on patterned laminin organizes myogenesis in vitro. Exp Cell Res, 1997. 230(2): p. 275‐83.
195
133. Wang, P.Y., H.T. Yu, and W.B. Tsai, Modulation of alignment and differentiation of skeletal myoblasts by submicron ridges/grooves surface structure. Biotechnol Bioeng, 2010. 106(2): p. 285‐94.
134. Ogden, R.W., Nonlinear elasticity, anisotropy, material stability and residual stress in soft tissue, in Biomechanics of soft tissue in cardiovascular systems, G.A. Holzapfel and R.W. Ogden, Editors. 2003, Springer: New York. p. 65‐108.
135. Lieber, R.L., Skeletal Muscle Structure, Function, and Plasticity: The Physiological Basis of Rehabilitation. 2nd ed, ed. T. Julet. 2002, Baltimore, MD: Lippincott Williams & Wilkins.
136. Chevrel, G., R. Hohlfeld, and M. Sendtner, The role of neurotrophins in muscle under physiological and pathological conditions. Muscle Nerve, 2006. 33(4): p. 462‐76.
137. Ford, B.D., B. Han, and G.D. Fischbach, Differentiation‐dependent regulation of skeletal myogenesis by neuregulin‐1. Biochem Biophys Res Commun, 2003. 306(1): p. 276‐81.
138. Kim, D., et al., Neuregulin stimulates myogenic differentiation in an autocrine manner. J Biol Chem, 1999. 274(22): p. 15395‐400.
139. Nitkin, R.M., et al., Identification of agrin, a synaptic organizing protein from Torpedo electric organ. J Cell Biol, 1987. 105(6 Pt 1): p. 2471‐8.
140. Glass, D.J., et al., Agrin acts via a MuSK receptor complex. Cell, 1996. 85(4): p. 513‐23.
141. Herbst, R., E. Avetisova, and S.J. Burden, Restoration of synapse formation in Musk mutant mice expressing a Musk/Trk chimeric receptor. Development, 2002. 129(23): p. 5449‐60.
142. Hopf, C. and W. Hoch, Agrin binding to alpha‐dystroglycan. Domains of agrin necessary to induce acetylcholine receptor clustering are overlapping but not identical to the alpha‐dystroglycan‐binding region. J Biol Chem, 1996. 271(9): p. 5231‐6.
196
143. Cote, P.D., et al., Chimaeric mice deficient in dystroglycans develop muscular dystrophy and have disrupted myoneural synapses. Nat Genet, 1999. 23(3): p. 338‐42.
144. Grady, R.M., et al., Maturation and maintenance of the neuromuscular synapse: genetic evidence for roles of the dystrophin‐‐glycoprotein complex. Neuron, 2000. 25(2): p. 279‐93.
145. Brandt, P.W., R.N. Cox, and M. Kawai, Can the binding of Ca2+ to two regulatory sites on troponin C determine the steep pCa/tension relationship of skeletal muscle? Proc Natl Acad Sci U S A, 1980. 77(8): p. 4717‐20.
146. MacIntosh, B.R., Role of calcium sensitivity modulation in skeletal muscle performance. News Physiol Sci, 2003. 18: p. 222‐5.
147. Gramolini, A.O., et al., Muscle and neural isoforms of agrin increase utrophin expression in cultured myotubes via a transcriptional regulatory mechanism. J Biol Chem, 1998. 273(2): p. 736‐43.
148. An, M.C., et al., Acetylcholine negatively regulates development of the neuromuscular junction through distinct cellular mechanisms. Proc Natl Acad Sci U S A, 2010. 107(23): p. 10702‐7.
149. Misgeld, T., et al., Agrin promotes synaptic differentiation by counteracting an inhibitory effect of neurotransmitter. Proc Natl Acad Sci U S A, 2005. 102(31): p. 11088‐93.
150. Sastry, B.V., et al., 2‐(alpha‐Naphthoyl)ethyltrimethylammonium iodide and its beta‐isomer: new selective, stable and fluorescent inhibitors of choline acetyltransferase. J Pharmacol Exp Ther, 1988. 245(1): p. 72‐80.
151. Bandi, E., et al., Autocrine activation of nicotinic acetylcholine receptors contributes to Ca2+ spikes in mouse myotubes during myogenesis. J Physiol, 2005. 568(Pt 1): p. 171‐80.
197
152. Ferry, C.B. and A.R. Marshall, Action of edrophonium on acetylcholinesterase at the mammalian neuromuscular junction. Br J Pharmacol, 1971. 43(2): p. 435P.
153. Entwistle, A., et al., A role for acetylcholine receptors in the fusion of chick myoblasts. J Cell Biol, 1988. 106(5): p. 1703‐12.
154. Hamann, M., et al., Synthesis and release of an acetylcholine‐like compound by human myoblasts and myotubes. J Physiol, 1995. 489 ( Pt 3): p. 791‐803.
155. Rimer, M., et al., gamma‐AChR/epsilon‐AChR switch at agrin‐induced postsynaptic‐like apparatus in skeletal muscle. Mol Cell Neurosci, 1997. 9(4): p. 254‐63.
156. Schaeffer, L., A. de Kerchove dʹExaerde, and J.P. Changeux, Targeting transcription to the neuromuscular synapse. Neuron, 2001. 31(1): p. 15‐22.
157. Cognard, C., et al., Appearance and evolution of calcium currents and contraction during the early post‐fusional stages of rat skeletal muscle cells developing in primary culture. Development, 1993. 117(3): p. 1153‐61.
158. Franco‐Obregon, A., Jr. and J.B. Lansman, Spontaneous opening of the acetylcholine receptor channel in developing muscle cells from normal and dystrophic mice. J Neurosci Res, 1995. 42(4): p. 452‐8.
159. Bezakova, G., et al., Effects of purified recombinant neural and muscle agrin on skeletal muscle fibers in vivo. J Cell Biol, 2001. 153(7): p. 1441‐52.
160. Gautam, M., et al., Defective neuromuscular synaptogenesis in agrin‐deficient mutant mice. Cell, 1996. 85(4): p. 525‐35.
161. McMahan, U.J., The agrin hypothesis. Cold Spring Harb Symp Quant Biol, 1990. 55: p. 407‐18.
198
162. Jones, G., et al., Substrate‐bound agrin induces expression of acetylcholine receptor epsilon‐subunit gene in cultured mammalian muscle cells. Proc Natl Acad Sci U S A, 1996. 93(12): p. 5985‐90.
163. Miledi, R. and C.R. Slater, On the degeneration of rat neuromuscular junctions after nerve section. J Physiol, 1970. 207(2): p. 507‐28.
164. Qu, Z. and R.L. Huganir, Comparison of innervation and agrin‐induced tyrosine phosphorylation of the nicotinic acetylcholine receptor. J Neurosci, 1994. 14(11 Pt 2): p. 6834‐41.
165. Swope, S.L., et al., Regulation of ligand‐gated ion channels by protein phosphorylation. Adv Second Messenger Phosphoprotein Res, 1999. 33: p. 49‐78.
166. Ferns, M., M. Deiner, and Z. Hall, Agrin‐induced acetylcholine receptor clustering in mammalian muscle requires tyrosine phosphorylation. J Cell Biol, 1996. 132(5): p. 937‐44.
167. Ehrbar, M., et al., Endothelial cell proliferation and progenitor maturation by fibrin‐bound VEGF variants with differential susceptibilities to local cellular activity. J Control Release, 2005. 101(1‐3): p. 93‐109.
168. Zisch, A.H., et al., Engineered fibrin matrices for functional display of cell membrane‐bound growth factor‐like activities: study of angiogenic signaling by ephrin‐B2. Biomaterials, 2004. 25(16): p. 3245‐57.
169. Barberi, T., et al., Derivation of engraftable skeletal myoblasts from human embryonic stem cells. Nat Med, 2007. 13(5): p. 642‐8.
170. Stavropoulos, M.E., I. Mengarelli, and T. Barberi, Differentiation of multipotent mesenchymal precursors and skeletal myoblasts from human embryonic stem cells. Curr Protoc Stem Cell Biol, 2009. Chapter 1: p. Unit 1F 8.
171. Bursac, N., et al., Cardiac muscle tissue engineering: toward an in vitro model for electrophysiological studies. Am J Physiol, 1999. 277(2 Pt 2): p. H433‐44.
199
172. Pedrotty, D.M., et al., Structural coupling of cardiomyocytes and noncardiomyocytes: quantitative comparisons using a novel micropatterned cell pair assay. Am J Physiol Heart Circ Physiol, 2008. 295(1): p. H390‐400.
173. Bian, W. and N. Bursac, Engineered skeletal muscle tissue networks with controllable architecture. Biomaterials, 2009. 30(7): p. 1401‐12.
174. Badie, N. and N. Bursac, Novel micropatterned cardiac cell cultures with realistic ventricular microstructure. Biophys J, 2009. 96(9): p. 3873‐85.
200
Biography
Born in Shanghai, P. R. China on April 13, 1981
Education
Aug 2005‐ Jan 2011 (expected) Duke University, Durham, NC Ph.D. in Biomedical Engineering Advisor: Nenad Bursac, Ph.D.
Sep 2003 – Jul 2005 The Johns Hopkins University, Baltimore, MD M.S.E. in Biomedical Engineering Advisor: Leslie Tung, Ph.D.
Sep 1999 – Jun 2003 Tsinghua University, Beijing, P.R. China B.S. in Biomedical Engineering
Honors and Awards
• Lew’s fellowship, Duke Center for Biomolecular and Tissue Engineering (2010‐2011) • Student achievement award, Duke Center for Biomolecular and Tissue Engineering (2010) • Finalist of student poster competition, Tissue Engineering and Regenerative Medicine International Society (TERMIS) North America annual conference (2008)
• Poster award (honorable mention), Duke Center for Biomolecular and Tissue Engineering (2007)
Publications
1. Bian W*, Liau B*, Bursac N. Mesoscopic hydrogel molding to control the 3D geometry of bioartificial muscle tissues. Nat Protoc, 4(10):1522‐34, 2009 (*, equally contributed)
2. Bian W, Bursac N. Engineered skeletal muscle tissue networks with controllable architecture. Biomaterials, 30(7):1401‐12, 2009
3. Bian W, Bursac N. Tissue engineering of functional skeletal muscle: challenges and recent advances. IEEE Eng Med Biol Mag, 27(5):109‐113, 2008
4. Bian W, Tung L. Structure‐related initiation of reentry by rapid pacing in monolayers of cardiac cells. Circ Res, 98(4):e29‐38, 2006
201
5. Christoforou N, Oskouei BN, Esteso P, Hill CM, Zimmet JM, Bian W, Bursac N, Leong KW, Hare JM, Gearhart JD. Implantation of mouse embryonic stem cell‐derived cardiac progenitor cells preserves function of infarcted murine hearts. PLoS One, 5(7):e11536, 2010
6. Hinds S, Bian W, Dennis RG, Bursac N. The role of extracellular matrix composition in structure and function of bioengineered skeletal muscle. (submitted to Biomaterials)
7. Bian W, Liau B, Badie N, Pfeiler W, Himel D, Bursac N. Functional cardiac tissue patches with realistic myofiber orientations. (in preparation)
8. Bian W, Bursac N. Effect of soluble mini‐agrin on in vitro maturation and function of fibrin‐based skeletal muscle tissue networks. (in preparation)
9. Bian W, Bursac N. Elongation of pores improves force generation in engineered skeletal muscle tissue networks. (in preparation)
Conference Presentations
1. Bian W, Liau B, Badie N, Bursac N. Large functional cardiac tissue patches with realistic human fiber orientations. Tissue Engineering and Regenerative Medicine International Society (TERMIS) North America annual conference and exposition, Orlando, FL, Dec 2010
2. Bian W, Liau B, Badie N, Bursac N. Engineering of functional cardiac tissue patch with realistic myofiber orientations. American Heart Association (AHA) Scientific Sessions, Chicago, IL, Nov 2010
3. Bian W, Bursac N. Contractile force of engineered skeletal muscle depends on myofiber density and local alignment. Biomedical Engineering Society (BMES) annual fall meeting, Austin, TX, Oct 2010
4. Hinds S, Bian W, Bursac N. Force generation in engineered muscle tissues is significantly affected by cell‐matrix interactions. Biomedical Engineering Society (BMES) annual fall meeting, Austin, TX, Oct 2010
5. Bian W, Bursac N. Soluble Mini‐agrin increases contractility of engineered skeletal muscle tissues. Biomedical Engineering Society (BMES) annual fall meeting, Austin, TX, Oct 2010
6. Bian W, Bursac N. Large 3‐dimensional tissue engineered cardiac patch with controlled electrical anisotropy. American Heart Association (AHA) scientific sessions, Orlando, FL, Nov 2009
7. Bian W, Liau B, Bursac N. Engineering functional anisotropy of myocardial tissue by hydrogel micromolding. Biomedical Engineering Society (BMES) annual fall meeting, Pittsburgh, PA, Oct 2009
202
8. Hinds S., Bian W, Bursac N. Optimized Cell/gel Composition for Engineering of Functional Skeletal Muscle Bundles. Biomedical Engineering Society (BMES) annual fall meeting, Pittsburgh, PA, Oct 2009
9. Bian W, Bursac N. Aligned and differentiated skeletal muscle tissue with controllable architecture and function. Tissue Engineering and Regenerative Medicine International Society (TERMIS) North America annual conference and exposition, San Diego, CA, Dec 2008
10. Bian W, Bursac N. Functional skeletal muscle tissue networks made of aligned and differentiated myofibers. Biomedical Engineering Society (BMES) annual fall meeting, St Louis, MO, Oct 2008
11. Bian W, Bursac N. Micromolded cardiac network patches for treatment of infarct repair. American Heart Association (AHA) scientific sessions, Orlando, FL, Nov 2007
12. Bian W, Bursac N. Micromolding of a functional cardiac patch for heart repair. NIH symposium on cardiovascular regenerative medicine, Bethesda, MD, Oct 2007
13. Bian W, Bursac N. Micromolded aligned skeletal muscle tissue networks, Biomedical Engineering Society (BMES) annual fall meeting, Los Angeles, CA, Sept 2007
14. Bian W, Bursac N. Micromolding of a 3D cardiac network patch with controllable anisotropy. Biomedical Engineering Society (BMES) annual fall meeting, Los Angeles, CA, Sept 2007
15. Bian W, Bursac N. Aligned skeletal muscle tissue networks with controllable porosity and thickness engineered by 3D hydrogel micromolding. 11th Hilton Head workshop (Engineering tissues: replace, repair and regenerate), Hilton Head, SC, Mar 2007
16. Bian W, Tung L. Asymmetry facilitates reentry induction in monolayers of cardiac cells with zigzag conduction. Biomedical Engineered Society (BMES) annual fall meeting, Baltimore, MD, Sept 2005
17. Bian W, Emokpae R, Tung L. Pacing‐induced reentry in monolayers of cardiomyocytes with a central island of zig‐zag conduction. Heart Rhythm Society (HRS) scientific sessions, New Orleans, LA, May 2005