Embed Size (px)
Citation preview
Original Research
Tissue Edema Does Not Change Gadolinium-Diethylenetriamine Pentaacetic Acid (Gd-DTPA)-Enhanced T1 Relaxation Times of ViableMyocardium
Gang Li, MD, PhD,1,2,3 Bo Xiang, DDS,1 Guangping Dai, PhD,1 Anthony Shaw, PhD,1
Hongyu Liu, MD, PhD,3 Baofeng Yang, PhD,3 Mike Jackson, PhD,1
Roxanne Deslauriers, PhD,1,2 and Ganghong Tian, MD, PhD1,2*
Purpose: To determine whether tissue edema changes gad-olinium-diethylenetriamine pentaacetic acid (Gd-DTPA)-enhanced T1 relaxation times of the viable myocardium.
Materials and Methods: A total of 16 isolated pig heartswere divided into four groups (N � 4/group) and perfused ina Langendorff apparatus. Gd-DTPA was injected into theaortic perfusion line. Tissue edema was then induced bytwo hours of simultaneous arterial/venous perfusion(SAVP). Myocardial water content and T1 relaxation timeswere monitored throughout SAVP. The volumes of the ex-tracellular and intracellular compartments were assessedusing 31P MRS-detectable markers, phenylphosphonic acid(PPA) and dimethyl methylphosphonate (DMMP).
Results: Tissue water content in both viable and infarctedmyocardium increased significantly during two-hour SAVP.However, Gd-DTPA-enhanced T1 relaxation times of theviable myocardium remained relatively unchanged. In-farcted myocardium, on the other hand, exhibited signifi-cant T1 shortening during SAVP. Furthermore, SAVP re-sulted in significant expansions of both extracellular andintracellular compartments, but the ratio of the volumes ofthe two compartments remained relatively constant.
Conclusion: Tissue edema in the viable myocardium doesnot increase the relative distribution volume of the contrastagent. As a result, edema does not change Gd-DTPA-en-hanced T1 relaxation times of the viable myocardium.
Key Words: magnetic resonance imaging; myocardial in-farction; MR contrast agent; tissue edema; pig heartJ. Magn. Reson. Imaging 2005;21:744–751.Published 2005 Wiley-Liss, Inc.
THE DIFFERENTIATION of viable from nonviable myo-cardium has important clinical significance for patientmanagement. Patients with varying degrees of myocar-dial injury may require different therapeutic manage-ment and have different prognoses (1,2). At present,reliable assessment of myocardial injury remains achallenge in cardiology, and methods that can accu-rately assess myocardial viability are still needed clini-cally.
MR imaging has been extensively studied for the as-sessment of myocardial infarction because of its highspatial resolution, excellent tissue contrast, and noionic radiation (1,2). Gadolinium-diethylenetriaminepentaacetic acid (Gd-DTPA)-enhanced T1-weighted im-aging has been shown to be very useful in assessingmyocardial viability (1–3). Since loss of the cell mem-brane integrity increases the distribution volume of thecontrast agent, Gd-DTPA-enhanced T1 relaxation timesof the infarcted myocardium are shorter than those ofthe normal myocardium (3). Consequently, on delay-enhanced T1 images the infarcted myocardium appearsbrighter than the normal myocardium.
Several studies have reported that Gd-DTPA-en-hanced T1 imaging can overestimate infarct size (4–7).Tissue edema has been suggested as the underlyingmechanism of the overestimation (4–7). It is believedthat tissue edema in the viable myocardium (for exam-ple, the periinfarct region) causes a significant expan-sion of the extracellular compartment, leading to anincrease in contrast distribution volume. As a result, on
1Institute for Biodiagnostics, National Research Council, Winnipeg,Canada.2Department of Physiology and Surgery, University of Manitoba, Win-nipeg, Canada.3Department of Cardiac Surgery and Pharmacology, the Second Affili-ated Hospital, Harbin Medical University, Harbin, China.Contract grant sponsor: Heart and Stroke Foundation of Manitoba;Contract grant sponsor: National Research Council Canada; Contractgrant sponsor: Canadian Institutes for Health Research; Contract grantnumber: 200203OP-100575-BME-CDAA-42533.Results of this work were presented orally at the 10th Annual Meetingof ISMRM, Honolulu, 2002, and the 11th Annual Meeting of ISMRM,Toronto, Canada, 2003, respectively.*Address reprint requests to: G.T., Institute for Biodiagnostics, NationalResearch Council Canada, 435 Ellice Ave., Winnipeg, Manitoba, Can-ada R3B 1Y6. E-mail: [email protected] February 9, 2004; Accepted March 3, 2005.DOI 10.1002/jmri.20330Published online in Wiley InterScience (www.interscience.wiley.com).
JOURNAL OF MAGNETIC RESONANCE IMAGING 21:744–751 (2005)
© 2005 Government of Canada. Exclusive worldwidepublication rights in the article have been transferredto Wiley-Liss, Inc.
744
T1 images the viable myocardium in the periinfarct re-gion may have similar signal intensities as does theinfarcted myocardium. The size of the infarcted myo-cardium may therefore be overestimated. Up to now,however, no studies have clearly demonstrated thattissue edema increases the distribution volume of Gd-DTPA and shortens contrast-enhanced T1 relaxationtimes of the viable myocardium. The present study wastherefore undertaken to assess the effect of tissueedema on Gd-DTPA-enhanced T1 relaxation times andthe volumes of the extracellular and intracellular com-partments.
MATERIALS AND METHODS
Isolated Pig Heart Preparation
All animals used in this study received humane care incompliance with the “Guide to the Care and Use ofExperimental Animals” formulated by the CanadianCouncil on Animal Care. The protocols of this studywere approved by the Animal Care Committee of Na-tional Research Council of Canada.
A total of 16 domestic pigs weighing 40–50 kg weredivided into four groups (N � 4 per group) and sedatedwith an intramuscular injection of atropine (0.05mg/kg of body weight), diazepam (0.33 mg/kg of bodyweight), and ketamine (0.22 mg/kg of body weight).Anesthesia was maintained with 1.5% to 2.0% isoflu-rane in a mixture of oxygen and medical air. The rateand volume of positive pressure ventilation were ad-justed to keep the arterial blood gases within the nor-mal physiological range. The brachiocephalic arterywas cannulated at the level of the common carotid ar-tery for arterial pressure monitoring, blood sampling,and injection of cardioplegic solution.
A sternotomy was performed along the midline. Thegreat arteries and veins were isolated and ligated. Afterclamping the superior and inferior vena cava, a coldcardioplegic solution (118 mmol/liter NaCl, 14.8 mmol/liter KCl, 16 mmol/liter MgSO4, 0.5 mmol/liter ethyl-enediamine-tetraacetic acid, 1.2 mmol/liter, KH2PO4,11 mmol/liter glucose, 25 mmol/liter NaHCO3, 1.75mmol/liter CaCl2, and 0.625% bovine serum albumin)was infused into the carotid cannula to arrest the heart.The pig heart was then excised and immersed to thecold cardioplegic solution for instrumentation. Pigblood in the chest was collected and mixed in 1:1 ratiowith Krebs-Henseleit (K-H) solution. The mixture wasused to perfuse the isolated pig heart during experi-ment. The hemoglobin concentrations in the pig bloodand the mixture were 9.7 � 0.5 and 5.1 � 0.1 gm/dL,respectively. Hematocrit of the mixture was maintainedat 11% to 13%. The mixture was oxygenated with 95%O2 and 5% CO2 to a final pH and pO2 of 7.42 � 0.02 pHunits and 538 � 25 mmHg, respectively.
After removal from the animals, the hearts wereweighed and cannulated through the aorta and coro-nary sinus. The hemiazygos vein was ligated to facilitatevenous perfusion for inducing myocardial edema. Bothventricles were drained with a short length of polyeth-ylene tubing pieced through ventricular walls to pre-vent accumulation of perfusion medium. A hydraulic
occluder was placed at the origin of the left anteriordescending coronary artery (LAD) of the hearts in thegroups II and IV to create regional myocardial infarc-tion. The pig hearts were mounted on a Langendorffperfusion apparatus, which was placed in the center ofa 7-Tesla magnet. The coil chamber was also drainedcontinuously. The temperature of the hearts was main-tained at 37 � 1°C throughout the experiment.
Protocols
Effect of Tissue Edema on Gd-DTPA-EnhancedMyocardial T1 Relaxation Times
The pig hearts in the group I (viable group, N � 4) werefirst perfused through the aorta for five minutes. After-wards, Gd-DTPA (0.05 mmol/kg) was injected into theaortic perfusion line. Once the contrast agent reachedits steady state, the perfusion modality was switched toSAVP for two hours to induce myocardial edema (8).SAVP was started after the steady state of the contrastagent so that Gd-DTPA-enhanced T1 relaxation timescould be measured before and after edema. SAVP wasperformed with perfusion pressure at the aorta andcoronary sinus at �60 and � 40 mmHg, respectively.The steady state of the contrast agent was ensured byobserving a constant T1 signal intensity over a five-minute period. The hearts in this group were perfusedwith a hyperkalemic mixture (20 mmol/liter KCl and 20mmol/liter MgSO4) of pig blood and K-H solutionthroughout the protocol.
The pig hearts in the group II (infarct group) were firstperfused through the aorta with a normokalemic mix-ture (4.7 mmol/liter KCl and 1.2 mmol/liter MgSO4).The LAD of the heart was occluded for one hour toinduce regional myocardial infarction. At the beginningof reperfusion, Gd-DTPA (0.05 mmol/kg) was injectedinto the perfusion line. Once the contrast agent reachedsteady state, the perfusion modality was switched toSAVP for two hours to induce myocardial edema. Dur-ing the two hours of SAVP, the hearts were perfusedwith the hyperkalemic mixture.
Myocardial water content and T1 relaxation times inboth groups were monitored continuously throughoutthe protocols. At the end of the SAVP, localized 31Pspectra were acquired from the LAD-supported myocar-dium to assess myocardial viability. The pig hearts werethen weighed and sectioned into 5-mm thick slices for2�3�5-triphenyl tetrazolium chloride (TTC) staining.
The experimental protocols are illustrated in Fig. 1.
Effect of Tissue Edema on the Volumes of Extra- andIntracellular Compartments
It has been shown that PPA distributes only into theextracellular compartment while DMMP distributes tothe entire water space (9–11). Both compounds arechemically inert and nontoxic. Their levels can bereadily monitored using 31P MR spectroscopy (9–11).Thus, in this part of the study, PPA (10 mmol/liter) andDMMP (20 mmol/liter) were added to the perfusionmedium to monitor the changes in the volumes of thetwo compartments during tissue edema. The two chem-ical markers have been used by others for the measure-
Tissue Edema and Myocardial T1 Value 745
ment of the cellular compartments (9). The results werecomparable to those determined with histological tech-niques (10,11).
The pig hearts in group III were first perfused throughthe aorta for five minutes to measure the baseline levelsof PPA and DMMP. The hearts were then subjected to atwo-hour SAVP to induce tissue edema. The levels ofPPA, DMMP, and high-energy phosphates (adenosinetriphosphate [ATP], phosphocreatine [PCr], and inor-ganic phosphate [Pi]) were monitored continuously us-ing a Helmholtz coil surrounding the whole pig heart.Throughout the protocol, the hearts were perfused withthe hyperkalemic perfusion medium containing PPA(10 mmol/liter) and DMMP (20 mmol/liter).
To create regional myocardial infarction the pighearts in the group IV underwent a five-minute controlperfusion and a one-hour LAD occlusion, followed by afive-minute reperfusion. During the control perfusionand a one-hour LAD occlusion, the hearts were per-fused with the normokalemic mixture. Following theshort period of reperfusion, the hearts were then sub-jected to a two-hour SAVP. The hearts were perfusedwith the hyperkalemic mixture during reperfusion andSAVP. Changes in PPA, DMMP, and the high-energyphosphates in the LAD region were monitored using a15-mm diameter surface coil positioned over the LAD-supported myocardium.
In groups III and IV, a plastic ball filled with 1 mL of500 mM methylphosphonic acid (MPA) was placed inthe right ventricles (RV) as a reference for quantificationof DMMP and PPA. After SAVP, the hearts in bothgroups were weighed and then cut into 5-mm slices forTTC staining to define the infarcted region.
The experimental protocols are illustrated in Fig. 1.
Near Infrared Spectroscopy
Near infrared (NIR) spectroscopy was performed using aNIR spectrometer (Foss NIR System 6500; Silver
Springs, MD, USA), equipped with a fiber optic probe(Fiberguide, Stirling, NJ, USA). The probe was con-structed of nonmetallic materials to allow acquisitionsof the NIR spectra while the heart was being perfusedinside a magnet. A background single-beam spectrum,Iref, was obtained by suspending the probe �2 cm abovea reflectance standard and acquiring 32 scans, with abandwidth of 10 nm and data points every 2 nm. Inter-action spectra, Iheart, were measured by placing theprobe tip into gentle contact with the LAD-supportedmyocardium and collecting single beam spectra withthe same parameters as for the background. The spec-tra were then converted to pseudoabsorbance units A �–log (Iheart/Iref).
NIR spectra were acquired with a two-minute tempo-ral resolution. Acquisition time for each spectrum was�30 seconds. Changes in water content of the myocar-dium were assessed using the intensity of the waterabsorption at 975 nm.
MR Imaging
MR imaging was performed on a 7-Tesla, 40-cm hori-zontal bore magnet equipped with a Bruker console(Bruker, Karlsruhe, Germany) using a Helmholtz coil.To measure T1 relaxation times of the myocardium,nine T1-weighted images were acquired using a Turbo-FLASH sequence (TR � 6.6 msec, TE � 3.6 msec, flipangle � 5°) with various inversion recovery intervals(10, 100, 200, 400, 700, 1200, 2000, 5000, and 10,000msec). The image data were acquired with centric phaseencoding. Each image covered a 12 � 12 cm field of viewwith a 128 � 128 matrix, leading to a pixel size of0.93 � 0.93 mm. All images were acquired from a 5-mmslice of the heart parallel to the short cardiac axis. T1
relaxation times of the myocardium were then calcu-lated by fitting the signal intensities of these imagesusing the following function:
SI � A�1 � 2 exp� � �t � q�/T1�
where SI is the signal intensity, A is the initial signalintensity at time zero, t is the inversion recovery inter-val, and q is the time shift between the actual TI (inver-sion recovery time) and preset TI.
31P MR Spectroscopy31P MR spectroscopy was performed to assess the ef-fects of tissue edema on the volumes of the extracellularand intracellular compartments and to evaluate myo-cardial viability. In groups I and II, localized 31P MRspectroscopy was performed using a surface coil at theend of experiment to assess myocardial viability bymonitoring myocardial energy metabolites. The energymetabolites include ATP and PCr. The surface coil waspositioned on the anterior wall of the left ventricle thatwas supported by LAD. In the groups III and IV, 31P MRspectroscopy was carried out throughout protocol tofollow DMMP and PPA. In group III, 31P MR spectra wereacquired with a Helmholtz coil that surrounds thewhole heart, while a surface coil was used in group IV.Free induction decay (FID) signals were acquired with a
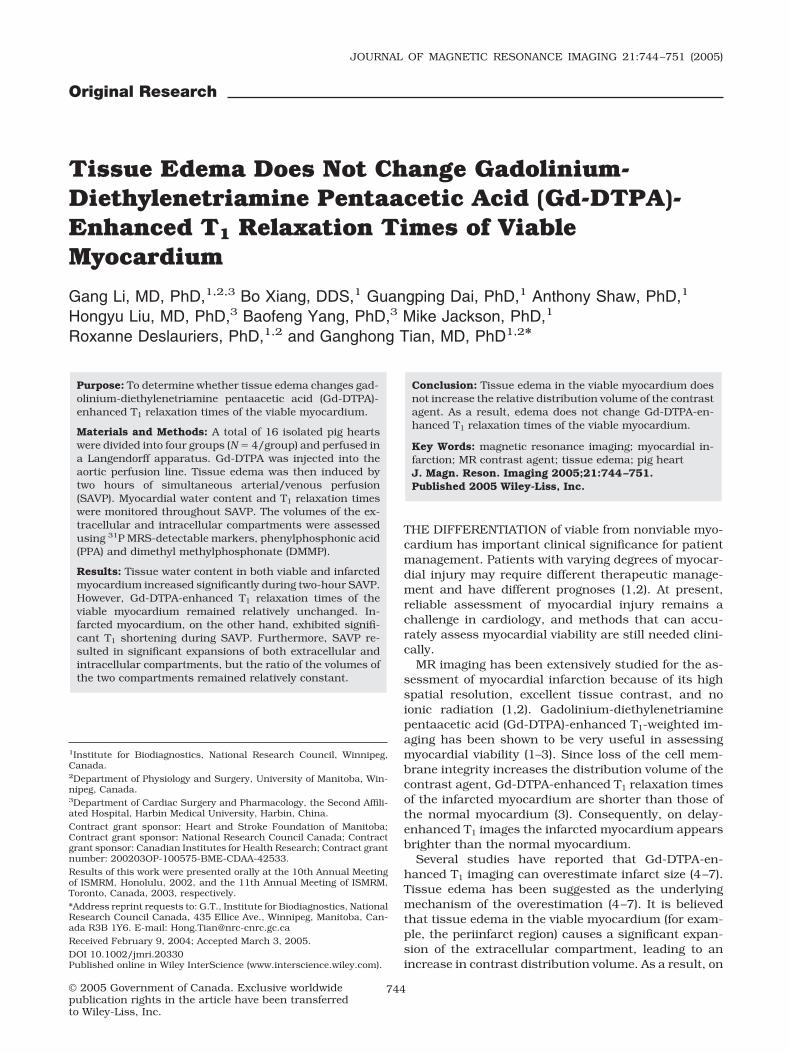
Figure 1. Schematic illustration of the experimental proto-cols. CP, control perfusion; SAVP, simultaneous arterial/ve-nous perfusion; LAD, left anterior descending coronary artery.
746 Li et al.
single hard pulse. The pulse length and repetition timewere 75 sec and 2.0 seconds, respectively. A total of 60FID signals were accumulated for each spectrum. Thus,each 31P spectrum was averaged over a two-minutesampling period. FID signals were exponentially filteredwith a line-broadening factor of 20 Hz.
Since the T1 relaxation times of PPA (4.7 seconds) andDMMP (5.9 seconds) in the myocardium are signifi-cantly longer than TR (2 seconds) of the sequence usedto acquire the spectra, PPA and DMMP could be par-tially saturated (9,10). To prevent the measurementerror, the peak areas of the chemical markers werecorrected using their corresponding saturation factorsdetermined preexperimentally.
Calculation of Intra- and Extracellular Volumes
Measurement of intra- and extracellular compartmentsusing DMMP and PPA was first introduced by Clarke etal (9) in 1994. The detail of the method has been previ-ously described (9).
Briefly, the volumes of total water space and extra-cellular space can be estimated based on the peak areasof DMMP and PPA, respectively, using the followingequations.
ADMMP � MDMMP � CDMMP � Vt
APPA � MPPA � CPPA � Ve
AMPA � MMPA � CMPA � VMPA
where A, M, and C is the peak area, amount, and con-centration of the chemicals, respectively. Vt representsthe volume of the total water space whereas Ve. standsfor the volume of the extracellular compartment.
Since MMPA, CDMMP, CPPA are known factors, the volumeof total water space (Vt) and the extracellular space (Ve)can be readily calculated from the following equations:
Vt � �ADMMP � MMPA�/�AMPA � CDMMP�
Ve � �APPA � MMPA�/�AMPA � CPPA�
As a result, the volume of intracellular compartment (Vi)can be estimated by the difference between Vt and Ve:
Vi � Vt � Ve
Data Analysis
Image data were processed using Marevisi and Evident5.2 (Institute for Biodiagnostics, NRC, Winnipeg, Can-ada). The regions of interest were determined with ahand-draw approach based on the TTC-stained heartslices.
Statistical analyses were performed using STATIS-TICA (Statsoft, Tulsa, Oklahoma, USA). All numericalresults were expressed as the mean � standard devia-tion of the mean. One-way analysis of variance (ANOVA)was used to determine significant changes in T1 relax-ation times, relative changes in the extracellular and
intracellular compartments. A significant differencewas deemed to exist at a probability value of less than0.05.
RESULTS
Effect of Tissue Edema on Gd-DTPA-enhancedMyocardial T1 Relaxation Times
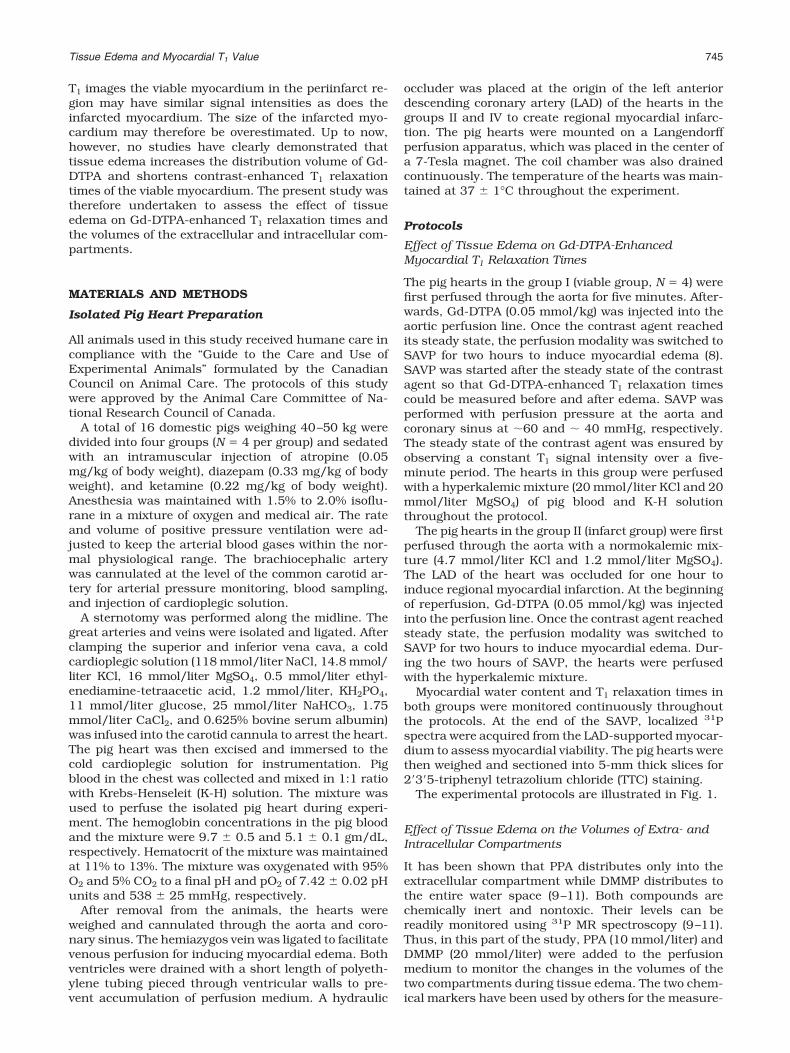
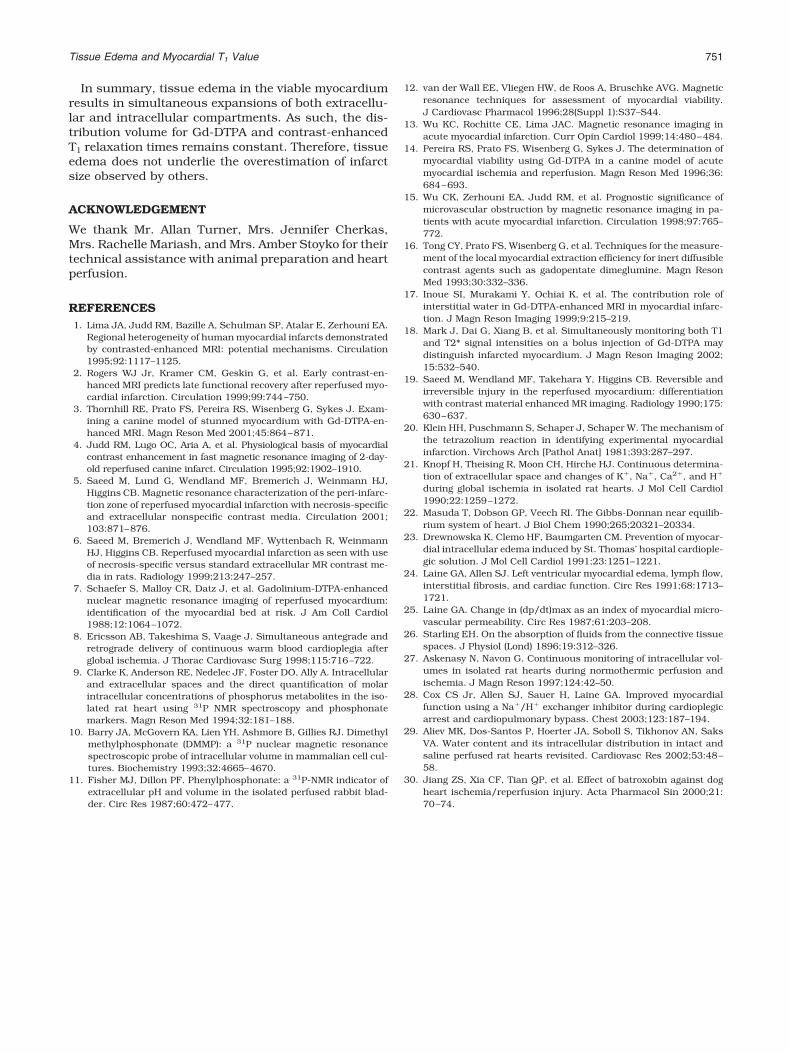
Time courses of the water peaks on the NIR spectrameasured from the LAD-supported myocardium in theviable (group I) and infarcted hearts (group II) areshown in the top and bottom panels of Fig. 2, respec-tively. The average of the signal intensities of the firsteight NIR spectra was set at 100%. The signal intensi-ties of the water peaks were then expressed as a per-centage relative to the control value. Both groups of thehearts showed a gradual and significant increase inwater content during SAVP. At the end of experiment,the water peak increased to 160 � 12% and 152 � 22%relative to the control values in the viable and infarctedhearts, respectively, suggesting severe myocardialedema.
As a result, both groups of hearts showed significantincreases in heart weight (37 � 4% in group I and 32 �2% in group II; P � 0.05). By dividing the weight gainusing 80% of the initial heart weight (assuming that
Figure 2. Time courses of water peak measured from LAD-supported myocardium of the viable (group I, top) and in-farcted hearts (group II, bottom). SAVP, simultaneous arterial/venous perfusion; LAD, left anterior descending coronaryartery.
Tissue Edema and Myocardial T1 Value 747
water accounts for approximately 80% of tissue weight),the percentage of myocardial edema was calculated tobe 46 � 6% and 41 � 2%, in group I and group II,respectively (Table 1; P � 0.05).
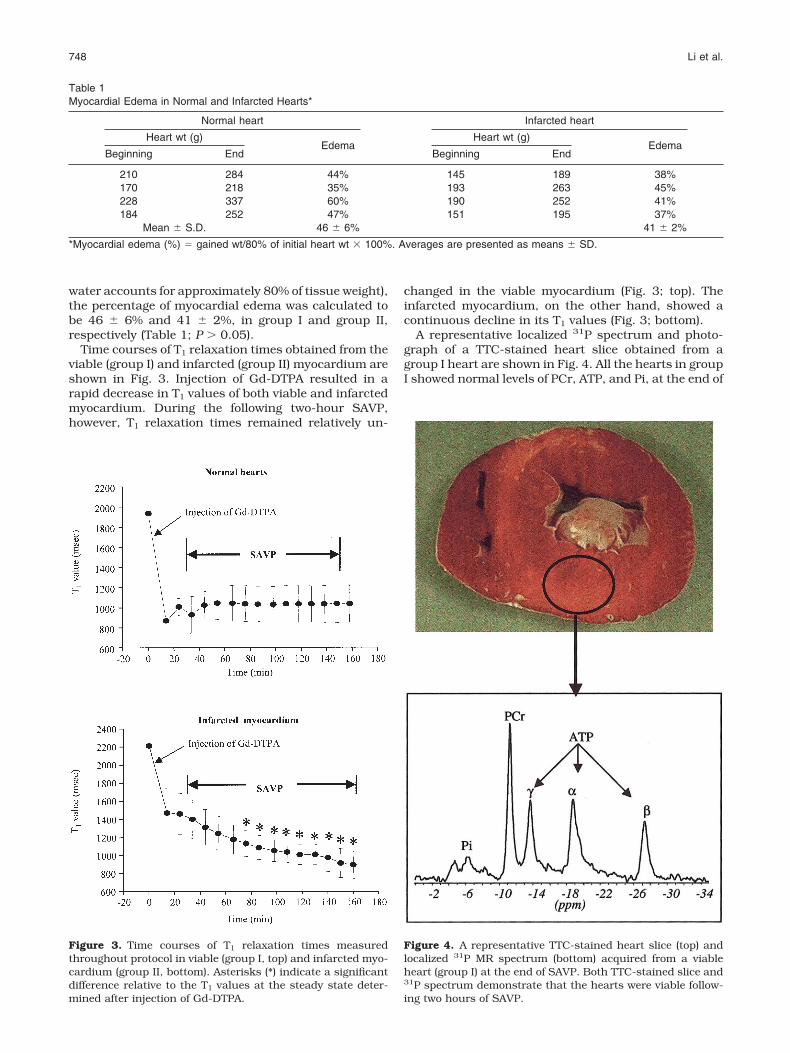
Time courses of T1 relaxation times obtained from theviable (group I) and infarcted (group II) myocardium areshown in Fig. 3. Injection of Gd-DTPA resulted in arapid decrease in T1 values of both viable and infarctedmyocardium. During the following two-hour SAVP,however, T1 relaxation times remained relatively un-
changed in the viable myocardium (Fig. 3; top). Theinfarcted myocardium, on the other hand, showed acontinuous decline in its T1 values (Fig. 3; bottom).
A representative localized 31P spectrum and photo-graph of a TTC-stained heart slice obtained from agroup I heart are shown in Fig. 4. All the hearts in groupI showed normal levels of PCr, ATP, and Pi, at the end of
Table 1Myocardial Edema in Normal and Infarcted Hearts*
Normal heart Infarcted heart
Heart wt (g)Edema
Heart wt (g)Edema
Beginning End Beginning End
210 284 44% 145 189 38%170 218 35% 193 263 45%228 337 60% 190 252 41%184 252 47% 151 195 37%
Mean � S.D. 46 � 6% 41 � 2%
*Myocardial edema (%) � gained wt/80% of initial heart wt � 100%. Averages are presented as means � SD.
Figure 3. Time courses of T1 relaxation times measuredthroughout protocol in viable (group I, top) and infarcted myo-cardium (group II, bottom). Asterisks (*) indicate a significantdifference relative to the T1 values at the steady state deter-mined after injection of Gd-DTPA.
Figure 4. A representative TTC-stained heart slice (top) andlocalized 31P MR spectrum (bottom) acquired from a viableheart (group I) at the end of SAVP. Both TTC-stained slice and31P spectrum demonstrate that the hearts were viable follow-ing two hours of SAVP.
748 Li et al.
SAVP. On the other hand, the 31P MR spectra acquiredfrom the infarcted myocardium (group II) showed noATP or PCr peaks. The TTC-stained heart slices fromgroup II showed a large area of unstained myocardiumin the LAD-supported region (data not shown).
Effect of Tissue Edema on the Volumes of Extra-and Intracellular Compartments
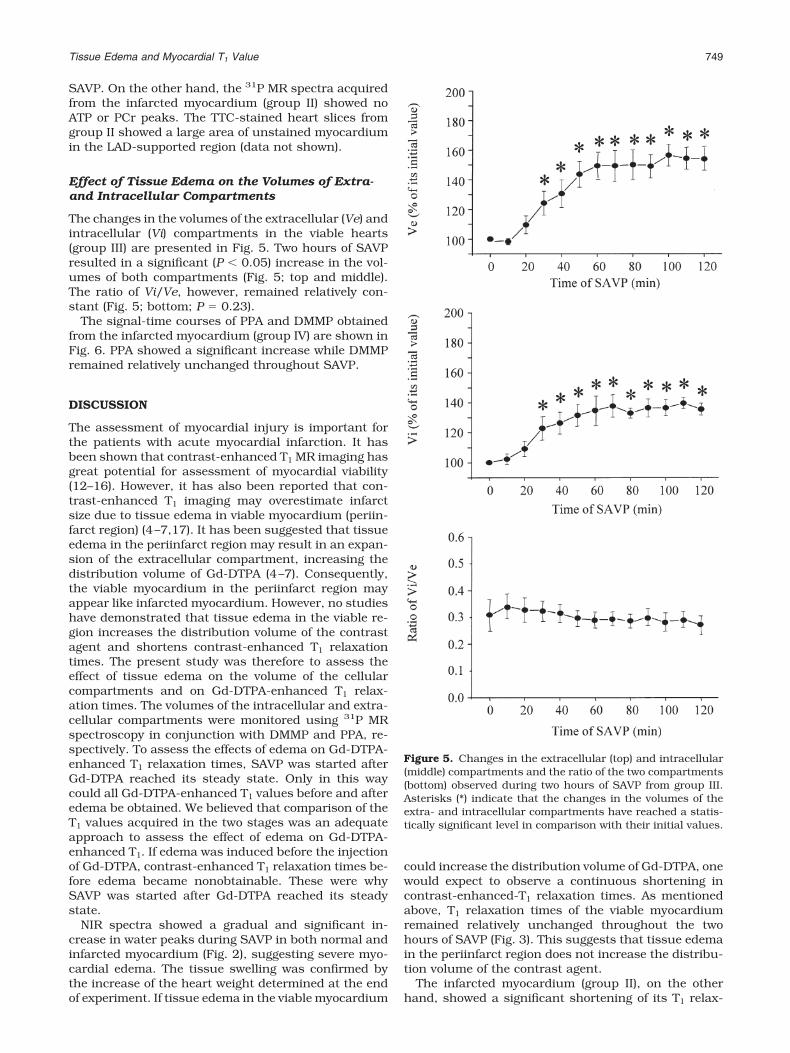
The changes in the volumes of the extracellular (Ve) andintracellular (Vi) compartments in the viable hearts(group III) are presented in Fig. 5. Two hours of SAVPresulted in a significant (P � 0.05) increase in the vol-umes of both compartments (Fig. 5; top and middle).The ratio of Vi/Ve, however, remained relatively con-stant (Fig. 5; bottom; P � 0.23).
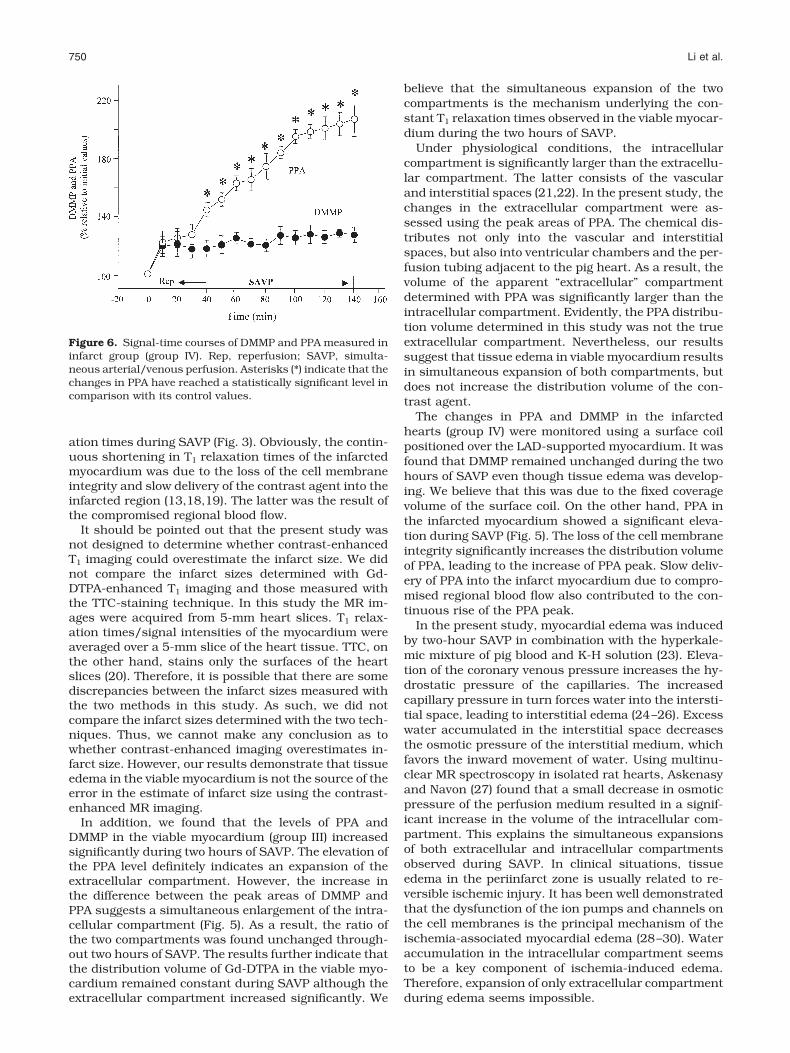
The signal-time courses of PPA and DMMP obtainedfrom the infarcted myocardium (group IV) are shown inFig. 6. PPA showed a significant increase while DMMPremained relatively unchanged throughout SAVP.
DISCUSSION
The assessment of myocardial injury is important forthe patients with acute myocardial infarction. It hasbeen shown that contrast-enhanced T1 MR imaging hasgreat potential for assessment of myocardial viability(12–16). However, it has also been reported that con-trast-enhanced T1 imaging may overestimate infarctsize due to tissue edema in viable myocardium (periin-farct region) (4–7,17). It has been suggested that tissueedema in the periinfarct region may result in an expan-sion of the extracellular compartment, increasing thedistribution volume of Gd-DTPA (4–7). Consequently,the viable myocardium in the periinfarct region mayappear like infarcted myocardium. However, no studieshave demonstrated that tissue edema in the viable re-gion increases the distribution volume of the contrastagent and shortens contrast-enhanced T1 relaxationtimes. The present study was therefore to assess theeffect of tissue edema on the volume of the cellularcompartments and on Gd-DTPA-enhanced T1 relax-ation times. The volumes of the intracellular and extra-cellular compartments were monitored using 31P MRspectroscopy in conjunction with DMMP and PPA, re-spectively. To assess the effects of edema on Gd-DTPA-enhanced T1 relaxation times, SAVP was started afterGd-DTPA reached its steady state. Only in this waycould all Gd-DTPA-enhanced T1 values before and afteredema be obtained. We believed that comparison of theT1 values acquired in the two stages was an adequateapproach to assess the effect of edema on Gd-DTPA-enhanced T1. If edema was induced before the injectionof Gd-DTPA, contrast-enhanced T1 relaxation times be-fore edema became nonobtainable. These were whySAVP was started after Gd-DTPA reached its steadystate.
NIR spectra showed a gradual and significant in-crease in water peaks during SAVP in both normal andinfarcted myocardium (Fig. 2), suggesting severe myo-cardial edema. The tissue swelling was confirmed bythe increase of the heart weight determined at the endof experiment. If tissue edema in the viable myocardium
could increase the distribution volume of Gd-DTPA, onewould expect to observe a continuous shortening incontrast-enhanced-T1 relaxation times. As mentionedabove, T1 relaxation times of the viable myocardiumremained relatively unchanged throughout the twohours of SAVP (Fig. 3). This suggests that tissue edemain the periinfarct region does not increase the distribu-tion volume of the contrast agent.
The infarcted myocardium (group II), on the otherhand, showed a significant shortening of its T1 relax-
Figure 5. Changes in the extracellular (top) and intracellular(middle) compartments and the ratio of the two compartments(bottom) observed during two hours of SAVP from group III.Asterisks (*) indicate that the changes in the volumes of theextra- and intracellular compartments have reached a statis-tically significant level in comparison with their initial values.
Tissue Edema and Myocardial T1 Value 749
ation times during SAVP (Fig. 3). Obviously, the contin-uous shortening in T1 relaxation times of the infarctedmyocardium was due to the loss of the cell membraneintegrity and slow delivery of the contrast agent into theinfarcted region (13,18,19). The latter was the result ofthe compromised regional blood flow.
It should be pointed out that the present study wasnot designed to determine whether contrast-enhancedT1 imaging could overestimate the infarct size. We didnot compare the infarct sizes determined with Gd-DTPA-enhanced T1 imaging and those measured withthe TTC-staining technique. In this study the MR im-ages were acquired from 5-mm heart slices. T1 relax-ation times/signal intensities of the myocardium wereaveraged over a 5-mm slice of the heart tissue. TTC, onthe other hand, stains only the surfaces of the heartslices (20). Therefore, it is possible that there are somediscrepancies between the infarct sizes measured withthe two methods in this study. As such, we did notcompare the infarct sizes determined with the two tech-niques. Thus, we cannot make any conclusion as towhether contrast-enhanced imaging overestimates in-farct size. However, our results demonstrate that tissueedema in the viable myocardium is not the source of theerror in the estimate of infarct size using the contrast-enhanced MR imaging.
In addition, we found that the levels of PPA andDMMP in the viable myocardium (group III) increasedsignificantly during two hours of SAVP. The elevation ofthe PPA level definitely indicates an expansion of theextracellular compartment. However, the increase inthe difference between the peak areas of DMMP andPPA suggests a simultaneous enlargement of the intra-cellular compartment (Fig. 5). As a result, the ratio ofthe two compartments was found unchanged through-out two hours of SAVP. The results further indicate thatthe distribution volume of Gd-DTPA in the viable myo-cardium remained constant during SAVP although theextracellular compartment increased significantly. We
believe that the simultaneous expansion of the twocompartments is the mechanism underlying the con-stant T1 relaxation times observed in the viable myocar-dium during the two hours of SAVP.
Under physiological conditions, the intracellularcompartment is significantly larger than the extracellu-lar compartment. The latter consists of the vascularand interstitial spaces (21,22). In the present study, thechanges in the extracellular compartment were as-sessed using the peak areas of PPA. The chemical dis-tributes not only into the vascular and interstitialspaces, but also into ventricular chambers and the per-fusion tubing adjacent to the pig heart. As a result, thevolume of the apparent “extracellular” compartmentdetermined with PPA was significantly larger than theintracellular compartment. Evidently, the PPA distribu-tion volume determined in this study was not the trueextracellular compartment. Nevertheless, our resultssuggest that tissue edema in viable myocardium resultsin simultaneous expansion of both compartments, butdoes not increase the distribution volume of the con-trast agent.
The changes in PPA and DMMP in the infarctedhearts (group IV) were monitored using a surface coilpositioned over the LAD-supported myocardium. It wasfound that DMMP remained unchanged during the twohours of SAVP even though tissue edema was develop-ing. We believe that this was due to the fixed coveragevolume of the surface coil. On the other hand, PPA inthe infarcted myocardium showed a significant eleva-tion during SAVP (Fig. 5). The loss of the cell membraneintegrity significantly increases the distribution volumeof PPA, leading to the increase of PPA peak. Slow deliv-ery of PPA into the infarct myocardium due to compro-mised regional blood flow also contributed to the con-tinuous rise of the PPA peak.
In the present study, myocardial edema was inducedby two-hour SAVP in combination with the hyperkale-mic mixture of pig blood and K-H solution (23). Eleva-tion of the coronary venous pressure increases the hy-drostatic pressure of the capillaries. The increasedcapillary pressure in turn forces water into the intersti-tial space, leading to interstitial edema (24–26). Excesswater accumulated in the interstitial space decreasesthe osmotic pressure of the interstitial medium, whichfavors the inward movement of water. Using multinu-clear MR spectroscopy in isolated rat hearts, Askenasyand Navon (27) found that a small decrease in osmoticpressure of the perfusion medium resulted in a signif-icant increase in the volume of the intracellular com-partment. This explains the simultaneous expansionsof both extracellular and intracellular compartmentsobserved during SAVP. In clinical situations, tissueedema in the periinfarct zone is usually related to re-versible ischemic injury. It has been well demonstratedthat the dysfunction of the ion pumps and channels onthe cell membranes is the principal mechanism of theischemia-associated myocardial edema (28–30). Wateraccumulation in the intracellular compartment seemsto be a key component of ischemia-induced edema.Therefore, expansion of only extracellular compartmentduring edema seems impossible.
Figure 6. Signal-time courses of DMMP and PPA measured ininfarct group (group IV). Rep, reperfusion; SAVP, simulta-neous arterial/venous perfusion. Asterisks (*) indicate that thechanges in PPA have reached a statistically significant level incomparison with its control values.
750 Li et al.
In summary, tissue edema in the viable myocardiumresults in simultaneous expansions of both extracellu-lar and intracellular compartments. As such, the dis-tribution volume for Gd-DTPA and contrast-enhancedT1 relaxation times remains constant. Therefore, tissueedema does not underlie the overestimation of infarctsize observed by others.
ACKNOWLEDGEMENT
We thank Mr. Allan Turner, Mrs. Jennifer Cherkas,Mrs. Rachelle Mariash, and Mrs. Amber Stoyko for theirtechnical assistance with animal preparation and heartperfusion.
REFERENCES1. Lima JA, Judd RM, Bazille A, Schulman SP, Atalar E, Zerhouni EA.
Regional heterogeneity of human myocardial infarcts demonstratedby contrasted-enhanced MRI: potential mechanisms. Circulation1995;92:1117–1125.
2. Rogers WJ Jr, Kramer CM, Geskin G, et al. Early contrast-en-hanced MRI predicts late functional recovery after reperfused myo-cardial infarction. Circulation 1999;99:744–750.
3. Thornhill RE, Prato FS, Pereira RS, Wisenberg G, Sykes J. Exam-ining a canine model of stunned myocardium with Gd-DTPA-en-hanced MRI. Magn Reson Med 2001;45:864–871.
4. Judd RM, Lugo OC, Aria A, et al. Physiological basis of myocardialcontrast enhancement in fast magnetic resonance imaging of 2-day-old reperfused canine infarct. Circulation 1995;92:1902–1910.
5. Saeed M, Lund G, Wendland MF, Bremerich J, Weinmann HJ,Higgins CB. Magnetic resonance characterization of the peri-infarc-tion zone of reperfused myocardial infarction with necrosis-specificand extracellular nonspecific contrast media. Circulation 2001;103:871–876.
6. Saeed M, Bremerich J, Wendland MF, Wyttenbach R, WeinmannHJ, Higgins CB. Reperfused myocardial infarction as seen with useof necrosis-specific versus standard extracellular MR contrast me-dia in rats. Radiology 1999;213:247–257.
7. Schaefer S, Malloy CR, Datz J, et al. Gadolinium-DTPA-enhancednuclear magnetic resonance imaging of reperfused myocardium:identification of the myocardial bed at risk. J Am Coll Cardiol1988;12:1064–1072.
8. Ericsson AB, Takeshima S, Vaage J. Simultaneous antegrade andretrograde delivery of continuous warm blood cardioplegia afterglobal ischemia. J Thorac Cardiovasc Surg 1998;115:716–722.
9. Clarke K, Anderson RE, Nedelec JF, Foster DO, Ally A. Intracellularand extracellular spaces and the direct quantification of molarintracellular concentrations of phosphorus metabolites in the iso-lated rat heart using 31P NMR spectroscopy and phosphonatemarkers. Magn Reson Med 1994;32:181–188.
10. Barry JA, McGovern KA, Lien YH, Ashmore B, Gillies RJ. Dimethylmethylphosphonate (DMMP): a 31P nuclear magnetic resonancespectroscopic probe of intracellular volume in mammalian cell cul-tures. Biochemistry 1993;32:4665–4670.
11. Fisher MJ, Dillon PF. Phenylphosphonate: a 31P-NMR indicator ofextracellular pH and volume in the isolated perfused rabbit blad-der. Circ Res 1987;60:472–477.
12. van der Wall EE, Vliegen HW, de Roos A, Bruschke AVG. Magneticresonance techniques for assessment of myocardial viability.J Cardiovasc Pharmacol 1996;28(Suppl 1):S37–S44.
13. Wu KC, Rochitte CE, Lima JAC. Magnetic resonance imaging inacute myocardial infarction. Curr Opin Cardiol 1999;14:480–484.
14. Pereira RS, Prato FS, Wisenberg G, Sykes J. The determination ofmyocardial viability using Gd-DTPA in a canine model of acutemyocardial ischemia and reperfusion. Magn Reson Med 1996;36:684–693.
15. Wu CK, Zerhouni EA, Judd RM, et al. Prognostic significance ofmicrovascular obstruction by magnetic resonance imaging in pa-tients with acute myocardial infarction. Circulation 1998;97:765–772.
16. Tong CY, Prato FS, Wisenberg G, et al. Techniques for the measure-ment of the local myocardial extraction efficiency for inert diffusiblecontrast agents such as gadopentate dimeglumine. Magn ResonMed 1993;30:332–336.
17. Inoue SI, Murakami Y, Ochiai K, et al. The contribution role ofinterstitial water in Gd-DTPA-enhanced MRI in myocardial infarc-tion. J Magn Reson Imaging 1999;9:215–219.
18. Mark J, Dai G, Xiang B, et al. Simultaneously monitoring both T1and T2* signal intensities on a bolus injection of Gd-DTPA maydistinguish infarcted myocardium. J Magn Reson Imaging 2002;15:532–540.
19. Saeed M, Wendland MF, Takehara Y, Higgins CB. Reversible andirreversible injury in the reperfused myocardium: differentiationwith contrast material enhanced MR imaging. Radiology 1990;175:630–637.
20. Klein HH, Puschmann S, Schaper J, Schaper W. The mechanism ofthe tetrazolium reaction in identifying experimental myocardialinfarction. Virchows Arch [Pathol Anat] 1981;393:287–297.
21. Knopf H, Theising R, Moon CH, Hirche HJ. Continuous determina-tion of extracellular space and changes of K , Na , Ca2 , and H
during global ischemia in isolated rat hearts. J Mol Cell Cardiol1990;22:1259–1272.
22. Masuda T, Dobson GP, Veech RI. The Gibbs-Donnan near equilib-rium system of heart. J Biol Chem 1990;265;20321–20334.
23. Drewnowska K, Clemo HF, Baumgarten CM. Prevention of myocar-dial intracellular edema induced by St. Thomas’ hospital cardiople-gic solution. J Mol Cell Cardiol 1991;23:1251–1221.
24. Laine GA, Allen SJ. Left ventricular myocardial edema, lymph flow,interstitial fibrosis, and cardiac function. Circ Res 1991;68:1713–1721.
25. Laine GA. Change in (dp/dt)max as an index of myocardial micro-vascular permeability. Circ Res 1987;61:203–208.
26. Starling EH. On the absorption of fluids from the connective tissuespaces. J Physiol (Lond) 1896;19:312–326.
27. Askenasy N, Navon G. Continuous monitoring of intracellular vol-umes in isolated rat hearts during normothermic perfusion andischemia. J Magn Reson 1997;124:42–50.
28. Cox CS Jr, Allen SJ, Sauer H, Laine GA. Improved myocardialfunction using a Na /H exchanger inhibitor during cardioplegicarrest and cardiopulmonary bypass. Chest 2003;123:187–194.
29. Aliev MK, Dos-Santos P, Hoerter JA, Soboll S, Tikhonov AN, SaksVA. Water content and its intracellular distribution in intact andsaline perfused rat hearts revisited. Cardiovasc Res 2002;53:48–58.
30. Jiang ZS, Xia CF, Tian QP, et al. Effect of batroxobin against dogheart ischemia/reperfusion injury. Acta Pharmacol Sin 2000;21:70–74.
Tissue Edema and Myocardial T1 Value 751