Embed Size (px)
Citation preview
TIPSTIPSAnnual Forum 2008Annual Forum 2008
““The Sustainability of South Africa’s Energy The Sustainability of South Africa’s Energy Resources: The Impact of International Resources: The Impact of International
Trade”Trade”
… Marcel Kohler

Research Funded By: ERSA/DME
Research Motivation:Research Motivation:
• SA’s competitiveness is largely dependent on SA’s competitiveness is largely dependent on country’s abundant natural resources.country’s abundant natural resources.
• Mining and resource based industries have Mining and resource based industries have benefited from SA’s policy of subsidising benefited from SA’s policy of subsidising industrial energy prices.industrial energy prices.
• Reason to believe that SA’s trade has a Reason to believe that SA’s trade has a significant impact on the country’s energy significant impact on the country’s energy resources.resources.
Research Funded By: ERSA/DME
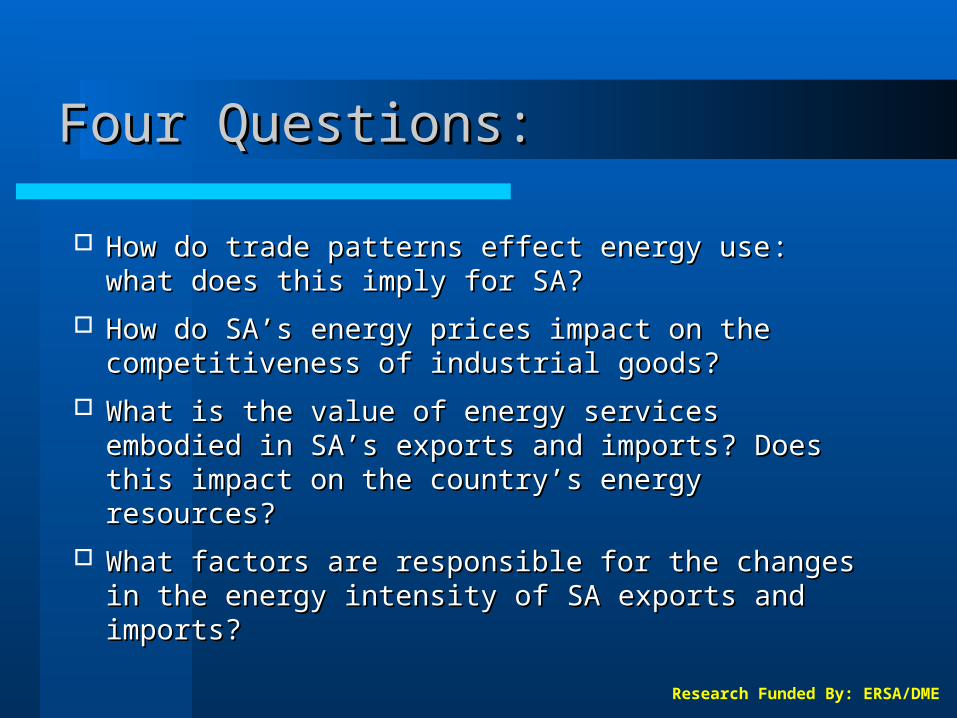
Four Questions:Four Questions:
HHow ow do do trade patterns effect energy usetrade patterns effect energy use: : what what does does this imply for Sthis imply for SAA? ?
How do SA’s How do SA’s energy prices impact on the energy prices impact on the competitiveness of competitiveness of industrial industrial goodsgoods??
What is What is the value of energy services embodied the value of energy services embodied in Sin SAA’s exports and imports’s exports and imports? Doe? Does s this this impact impact on the country’s energy resourceson the country’s energy resources??
What factors are responsible for the changes What factors are responsible for the changes in the energy intensity of in the energy intensity of SA SA exports and exports and imports? imports?
Research Funded By: ERSA/DME
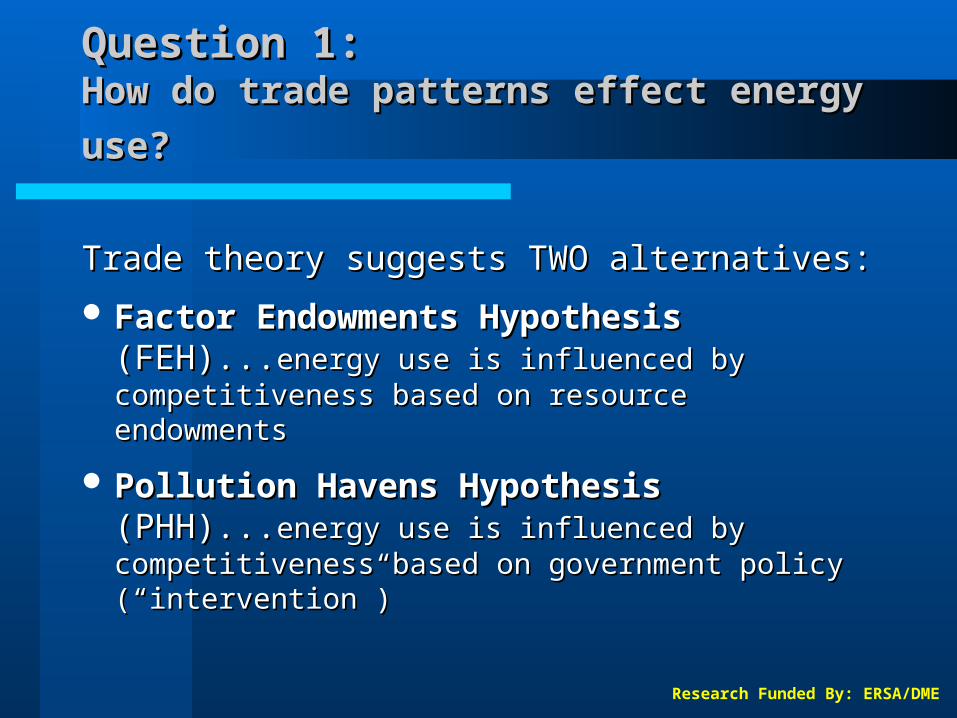
Question 1:Question 1:HHow ow do do trade patterns effect energy trade patterns effect energy
use?use?
Trade theory suggests TWO alternatives:Trade theory suggests TWO alternatives:
Factor Endowments HypothesisFactor Endowments Hypothesis (FEH)...(FEH)...energy use is influenced by energy use is influenced by competitiveness based on resource competitiveness based on resource endowmentsendowments
Pollution Havens Hypothesis Pollution Havens Hypothesis (PHH)...(PHH)...energy use is influenced by energy use is influenced by competitiveness based on government policy competitiveness based on government policy (“intervention”)(“intervention”)

Research Funded By: ERSA/DME
Energy use effects?Energy use effects?
FEH:FEH: DCs rich in capital (energy) and hence export energy-DCs rich in capital (energy) and hence export energy-
intensive productsintensive products
LDCs rich in labour and hence import energy-intensive LDCs rich in labour and hence import energy-intensive productsproducts
PHH:PHH: DCs have strict environmental standards (eg: energy taxes) DCs have strict environmental standards (eg: energy taxes)
and hence import (dirty) energy-intensive productsand hence import (dirty) energy-intensive products
LDCs have lax environmental standards (eg: energy LDCs have lax environmental standards (eg: energy subsidies) and hence export (dirty) energy-intensive subsidies) and hence export (dirty) energy-intensive productsproducts
Research Funded By: ERSA/DME
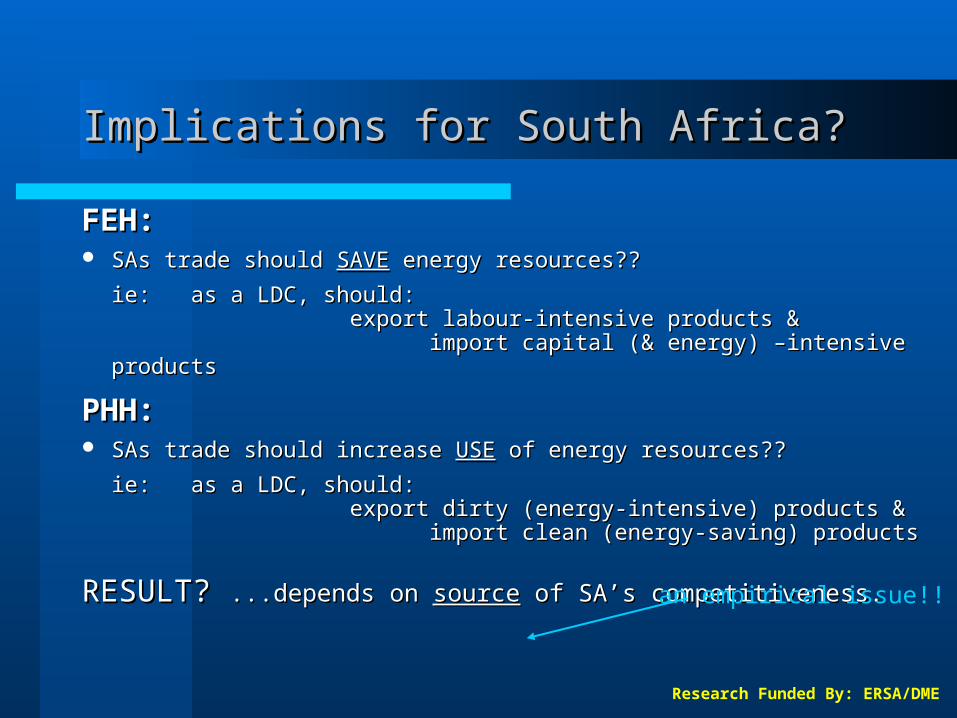
Implications for South Africa?Implications for South Africa?
FEH:FEH: SAs trade should SAs trade should SAVESAVE energy resources?? energy resources??
ie: as a LDC, should: ie: as a LDC, should: export export labour-intensive products & labour-intensive products & import capital import capital (& energy) –intensive products(& energy) –intensive products
PHH:PHH: SAs trade should increase SAs trade should increase USEUSE of energy resources?? of energy resources??
ie:ie: as a LDC, should: as a LDC, should: export dirty (energy-intensive) products & export dirty (energy-intensive) products & import import clean (energy-saving) productsclean (energy-saving) products
RESULT? RESULT? ...depends on ...depends on sourcesource of SA’s competitiveness. of SA’s competitiveness.an empirical issue!!
Research Funded By: ERSA/DME
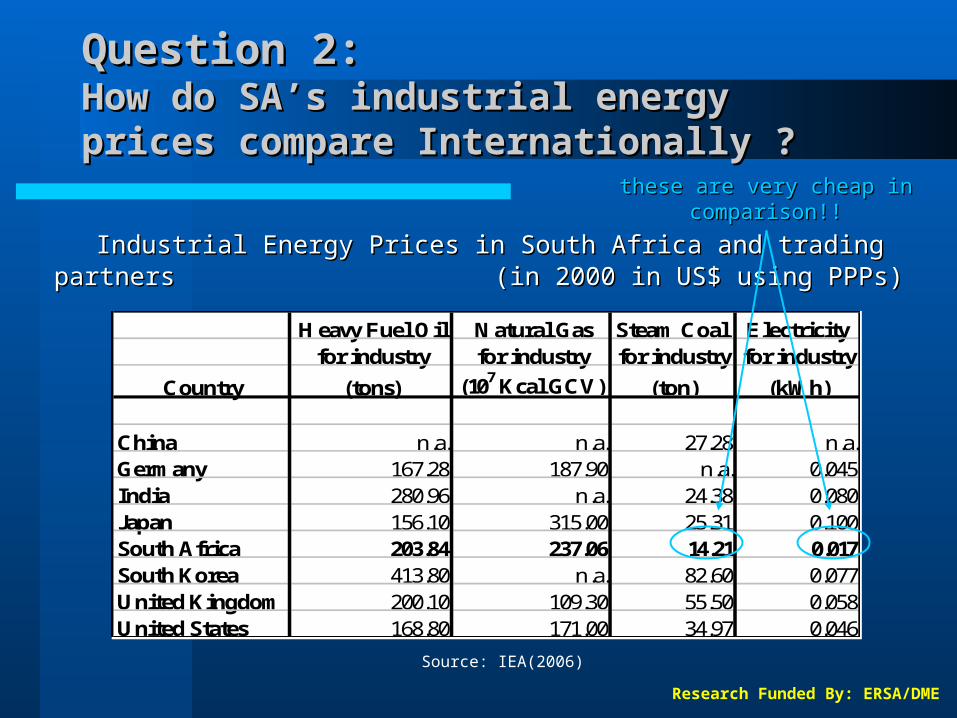
Question 2:Question 2:How do SA’s industrial energy prices How do SA’s industrial energy prices compare Internationally compare Internationally ??
Heavy Fuel Oil Natural Gas Steam Coal Electricity for industry for industry for industry for industry
Country (tons) (107 Kcal GCV) (ton) (kWh)
China n.a. n.a. 27.28 n.a.Germany 167.28 187.90 n.a. 0.045India 280.96 n.a. 24.38 0.080Japan 156.10 315.00 25.31 0.100South Africa 203.84 237.06 14.21 0.017South Korea 413.80 n.a. 82.60 0.077United Kingdom 200.10 109.30 55.50 0.058United States 168.80 171.00 34.97 0.046
Industrial Energy Prices in South Africa and trading partnersIndustrial Energy Prices in South Africa and trading partners (in 2000 in US$ using PPPs)(in 2000 in US$ using PPPs)
Source: IEA(2006)
these are very cheap in these are very cheap in comparison!!comparison!!
Research Funded By: ERSA/DME
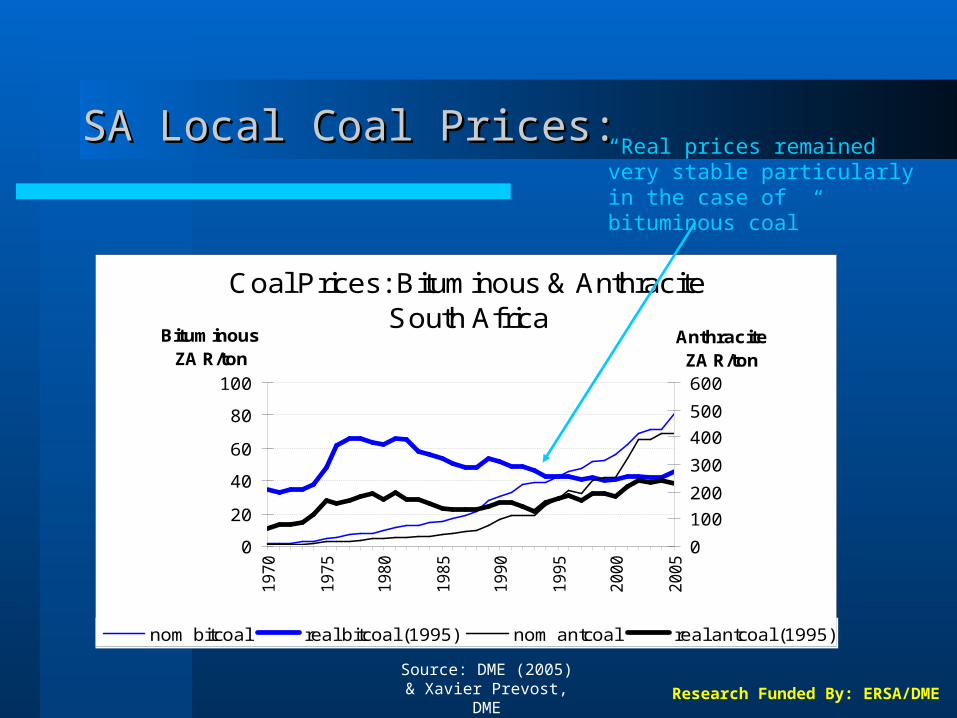
Coal Prices: Bituminous & AnthraciteSouth Africa
0
20
40
60
80
100
1970
1975
1980
1985
1990
1995
2000
2005
BituminousZA R/ton
0
100
200
300
400
500
600
AnthraciteZA R/ton
nom bitcoal real bitcoal (1995) nom antcoal real antcoal (1995)
SA Local Coal Prices:SA Local Coal Prices:“Real prices remained very stable particularly in the case of bituminous coal”
Source: DME (2005) & Xavier Prevost,
DME

Research Funded By: ERSA/DME
Industrial Electricity Prices:South Africa
0
5
10
15
20
1970
1975
1980
1985
1990
1995
2000
2005
ZA c/KWh
nom elec real elec (1995)
SA Electricity Prices:SA Electricity Prices:“ SA electricity prices amongst cheapest in
the world ”
Source: DME (2005)
Real prices rel. Real prices rel. unchanged since unchanged since
1995 !1995 !
Nominal prices Nominal prices remained remained
artificially low !artificially low !
Research Funded By: ERSA/DME
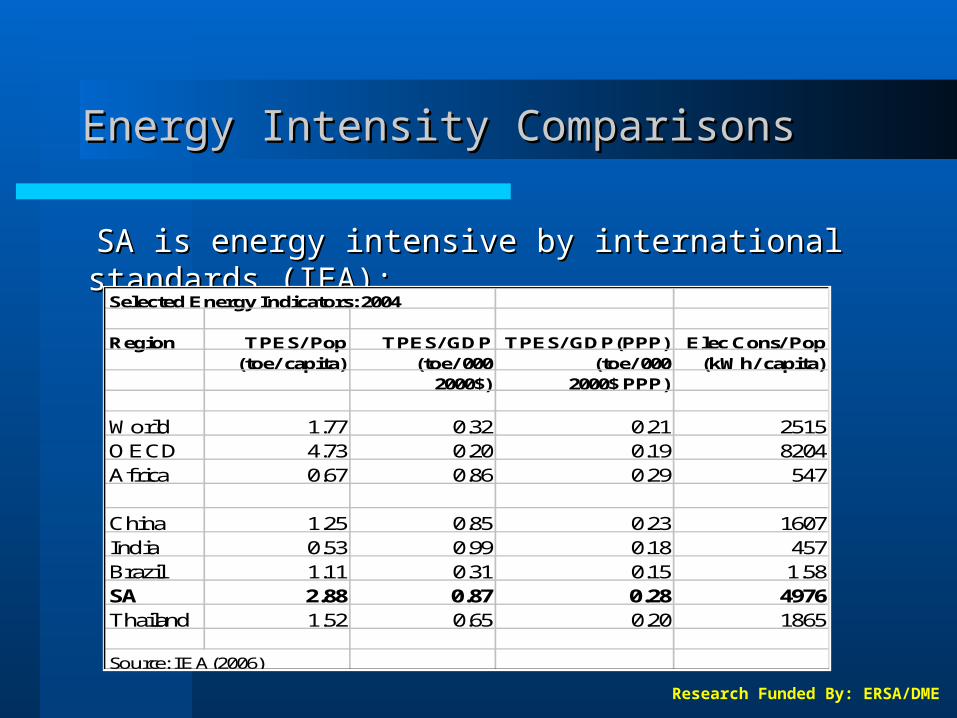
Energy Intensity ComparisonsEnergy Intensity Comparisons
SA is energy intensive by international standards SA is energy intensive by international standards (IEA):(IEA):
Selected Energy Indicators: 2004
Region TPES/Pop TPES/GDP TPES/GDP(PPP) Elec Cons/Pop(toe/ capita) (toe/000 (toe/000 (kWh/capita)
2000$) 2000$ PPP)
World 1.77 0.32 0.21 2515OECD 4.73 0.20 0.19 8204Africa 0.67 0.86 0.29 547
China 1.25 0.85 0.23 1607India 0.53 0.99 0.18 457Brazil 1.11 0.31 0.15 1.58SA 2.88 0.87 0.28 4976Thailand 1.52 0.65 0.20 1865
Source: IEA(2006)
Research Funded By: ERSA/DME
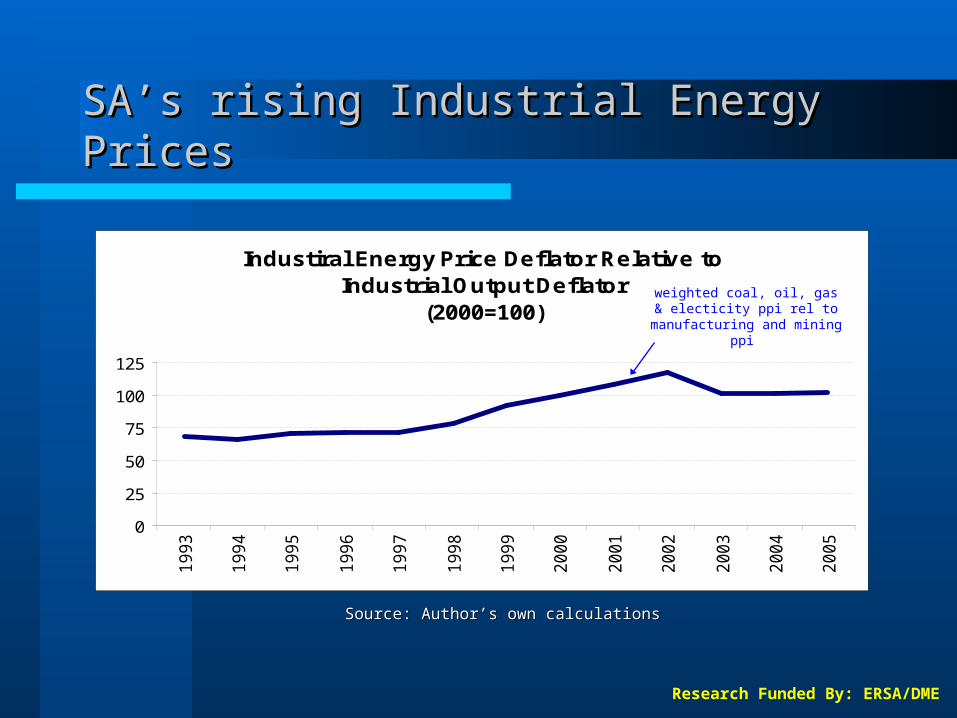
SA’s rising Industrial Energy PricesSA’s rising Industrial Energy Prices
Source: Author’s own calculationsSource: Author’s own calculations
Industiral Energy Price Deflator Relative to Industrial Output Deflator
(2000=100)
0
25
50
75
100
125
1993
1994
1995
1996
1997
1998
1999
2000
2001
2002
2003
2004
2005
weighted coal, oil, gas & electicity ppi rel to
manufacturing and mining ppi
Research Funded By: ERSA/DME
Implications for SA’s Implications for SA’s competitiveness?competitiveness?
SA’s energy policies have lowered the cost of industrial SA’s energy policies have lowered the cost of industrial energy inputs substantially in particular coal and energy inputs substantially in particular coal and electicity costs (IEA, 2006)electicity costs (IEA, 2006)
Coal is responsible for 75% of SA’s industrial energy Coal is responsible for 75% of SA’s industrial energy requirements (DME, 2006)requirements (DME, 2006)
Globally viewed, SA industrial activities are uniquely Globally viewed, SA industrial activities are uniquely dependent on electicity derived from coal (Fine, 1996)dependent on electicity derived from coal (Fine, 1996)
This includes: mining & minerals processing and This includes: mining & minerals processing and manufacturing activities closely related to MEC such as manufacturing activities closely related to MEC such as iron&steel, base metals and chemicals (Fine, 1996)iron&steel, base metals and chemicals (Fine, 1996)
SA’s rising energy prices should act as a catalyst for SA’s rising energy prices should act as a catalyst for implementing energy-saving technologies.implementing energy-saving technologies.
Research Funded By: ERSA/DME
Question 3:Question 3:How much energy is embodied in How much energy is embodied in SA’s exports and importsSA’s exports and imports??
Methodology:
Study adopts a “structural input-output” Study adopts a “structural input-output” approach in order to quantify the energy approach in order to quantify the energy embodied in SA’s trade in industrial goodsembodied in SA’s trade in industrial goods
Study then applies “shift-share” analysis to Study then applies “shift-share” analysis to energy use patterns in energy use patterns in SASA traded industrial traded industrial goodgoods, s, to decompose the to decompose the factors driving factors driving changes?changes? ....ie, are these ....ie, are these structural, structural, technological or input-output factors?technological or input-output factors?

Research Funded By: ERSA/DME
Methodology: “The Mathematics”Methodology: “The Mathematics”
The decomposition relies on the standard The decomposition relies on the standard Leontief Leontief I/O identity:I/O identity:
Given certain assumptions:Given certain assumptions:
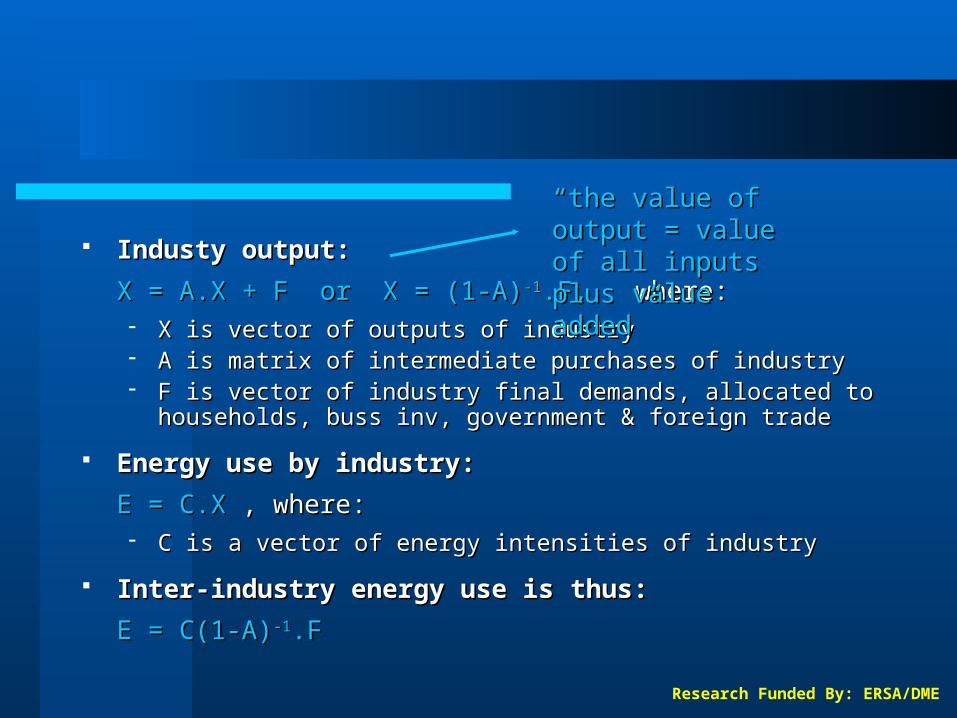
Research Funded By: ERSA/DME
Industy output: Industy output:
X = AX = A..X + F or X + F or X = (1-A)X = (1-A)-1-1.F,.F, where: where: X is vector of outputs of industryX is vector of outputs of industry A is matrix of intermediate purchases of industryA is matrix of intermediate purchases of industry F is vector of industry final demands, allocated to F is vector of industry final demands, allocated to
households, buss inv, government & foreign tradehouseholds, buss inv, government & foreign trade
Energy use by industry:Energy use by industry:
E = CE = C..XX , where: , where: C is a vector of energy intensities of industryC is a vector of energy intensities of industry
IInter-industry energy use isnter-industry energy use is thus thus::
E = C(1-A)E = C(1-A)-1-1.F.F
““the value of the value of output = value of output = value of all inputs plus all inputs plus value added”value added”
Research Funded By: ERSA/DME
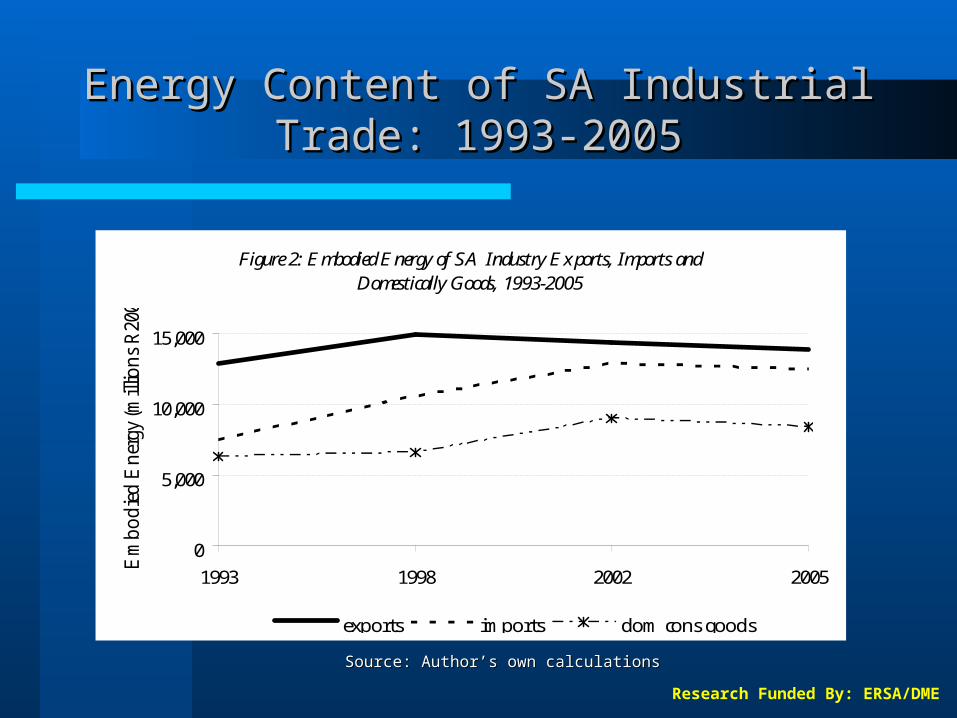
Energy Content of SA Energy Content of SA IndustrialIndustrial Trade: 1993-2005Trade: 1993-2005
Figure 2: Embodied Energy of SA Industry Exports, Imports and Domestically Goods, 1993-2005
0
5,000
10,000
15,000
1993 1998 2002 2005
Em
bodied E
ner
gy (m
illio
ns R20
00)
exports imports dom cons goods
Source: Author’s own calculationsSource: Author’s own calculations
Research Funded By: ERSA/DME
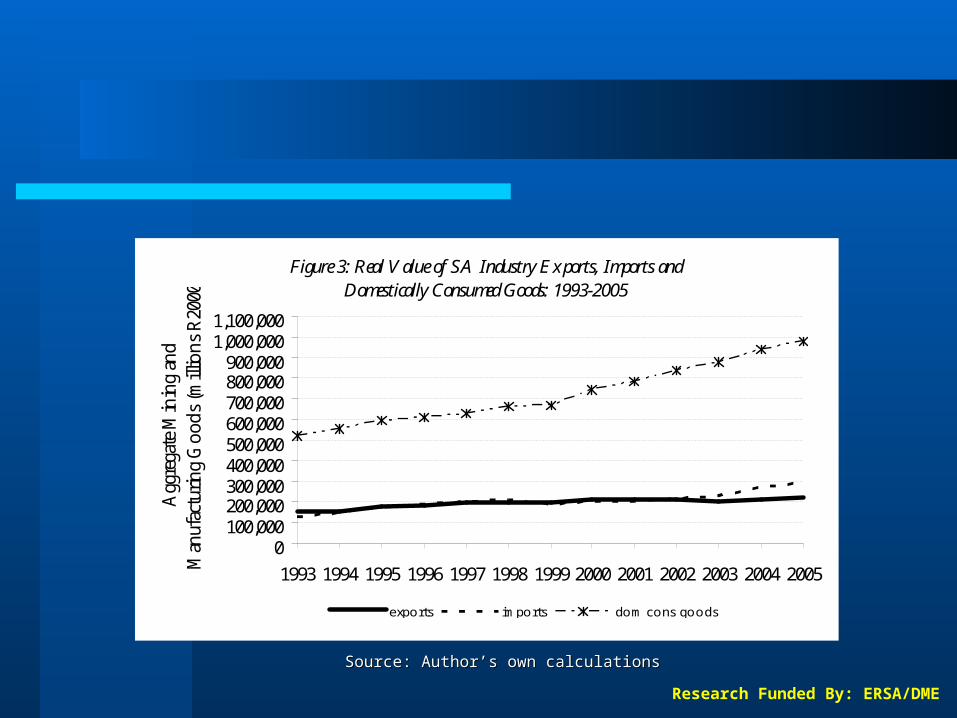
Figure 3: Real Value of SA Industry Exports, Imports and Domestically Consumed Goods: 1993-2005
0100,000200,000300,000400,000500,000600,000700,000800,000900,000
1,000,0001,100,000
1993 1994 1995 1996 1997 1998 19992000 2001 2002 2003 2004 2005
Agg
rega
te M
inin
g an
d M
anuf
actu
ring
Goo
ds (m
illio
ns R
2000
)
exports imports dom cons goods
Source: Author’s own calculationsSource: Author’s own calculations

Research Funded By: ERSA/DME
Embodied Energy per Rands of Embodied Energy per Rands of SA SA Industrial Goods:Industrial Goods:
The energy intensity of exports exceeds that of importsThe energy intensity of exports exceeds that of imports
Figure 4: Embodied Energy Intensity of SA Industry Exports, Imports and Domestically Consumed Goods, 1993-2005
0.000.01
0.020.030.04
0.050.060.07
0.080.09
1993 1998 2002 2005
Rea
l Ran
ds (2
000)
exports imports dom cons goods
Source: Author’s own calculationsSource: Author’s own calculations

Research Funded By: ERSA/DME
Embodied Energy per Rands of Embodied Energy per Rands of SA SA IndustrialIndustrial GoodGoods:s:
Source: Author’s own calculationsSource: Author’s own calculations
The energy embodied in traded goods exceeds that of The energy embodied in traded goods exceeds that of domestically consumed goodsdomestically consumed goods
The energy intensity of exports and imports falls by The energy intensity of exports and imports falls by approx. 2c/Rand over the period 1993-2005 approx. 2c/Rand over the period 1993-2005

Research Funded By: ERSA/DME
Energy Intensities of SA Energy Intensities of SA IndustriesIndustries::
Source: Author’s own calculationsSource: Author’s own calculations
Non-ferrous metals and iron & steel are by far the most Non-ferrous metals and iron & steel are by far the most energy-intensive SA industrial sectors energy-intensive SA industrial sectors
Research Funded By: ERSA/DME
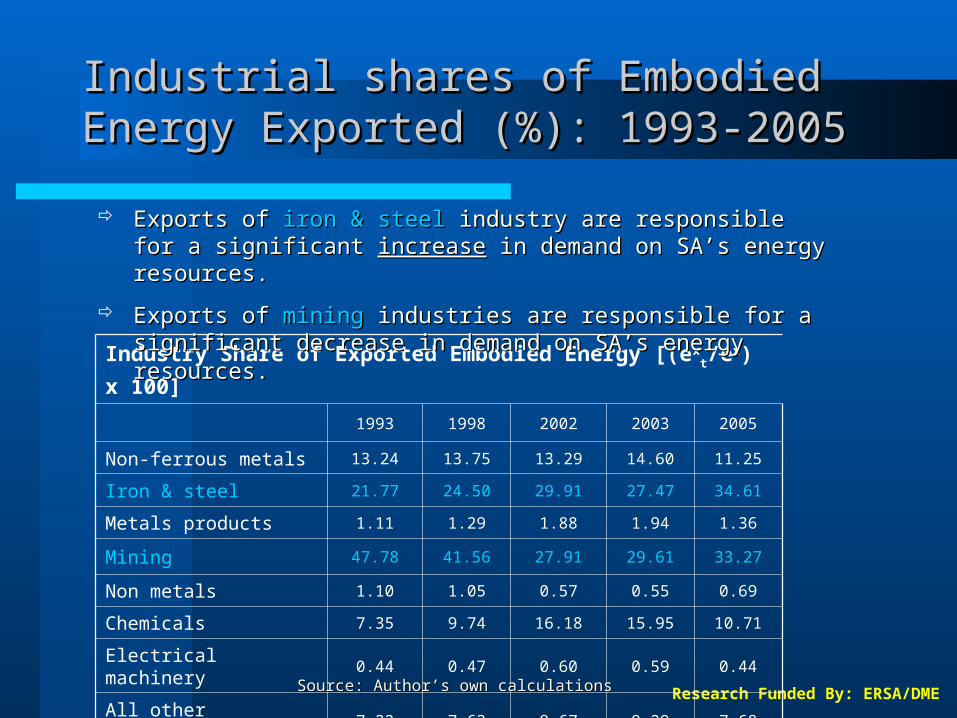
Industrial shares of Embodied Industrial shares of Embodied Energy Exported (%): 1993-2005Energy Exported (%): 1993-2005
Industry Share of Exported Embodied Energy [(ext/e
x) x
100]
1993 1998 2002 2003 2005
Non-ferrous metals 13.24 13.75 13.29 14.60 11.25
Iron & steel 21.77 24.50 29.91 27.47 34.61
Metals products 1.11 1.29 1.88 1.94 1.36
Mining 47.78 41.56 27.91 29.61 33.27
Non metals 1.10 1.05 0.57 0.55 0.69
Chemicals 7.35 9.74 16.18 15.95 10.71
Electrical machinery 0.44 0.47 0.60 0.59 0.44
All other manufactures
7.22 7.63 9.67 9.29 7.68
Exports of Exports of iron & steeliron & steel industry are responsible for a industry are responsible for a significant significant increaseincrease in demand on SA’s energy resources. in demand on SA’s energy resources.
Exports of Exports of miningmining industries are responsible for a significant industries are responsible for a significant decrease in demand on SA’s energy resources.decrease in demand on SA’s energy resources.
Source: Author’s own calculationsSource: Author’s own calculations

Research Funded By: ERSA/DME
Industrial shares of Embodied Industrial shares of Embodied Energy Imported (%): 1993-2005Energy Imported (%): 1993-2005
Industry Share of Imported Embodied Energy [(ext/e
x) x
100]
1993 1998 2002 2003 2005
Non-ferrous metals 8.83 12.37 14.21 15.12 11.43
Iron & steel 14.89 14.36 16.53 11.26 14.81
Metals products 1.32 1.79 2.41 2.31 1.86
Mining 30.08 19.84 11.53 12.14 19.13
Non metals 2.29 2.64 1.18 1.14 1.70
Chemicals 20.50 24.00 31.34 31.51 24.16
Electrical machinery 2.75 2.59 1.94 2.40 2.03
All other manufactures
19.35 22.41 20.86 24.12 24.88
Imports of Imports of chemicalschemicals sector and sector and ‘other manufacturing’‘other manufacturing’ sectors help sectors help savesave a significant proportion of SA’s energy a significant proportion of SA’s energy resources through the implicit importation of embodied resources through the implicit importation of embodied energy services from abroad.energy services from abroad.
Source: Author’s own calculationsSource: Author’s own calculations
Research Funded By: ERSA/DME
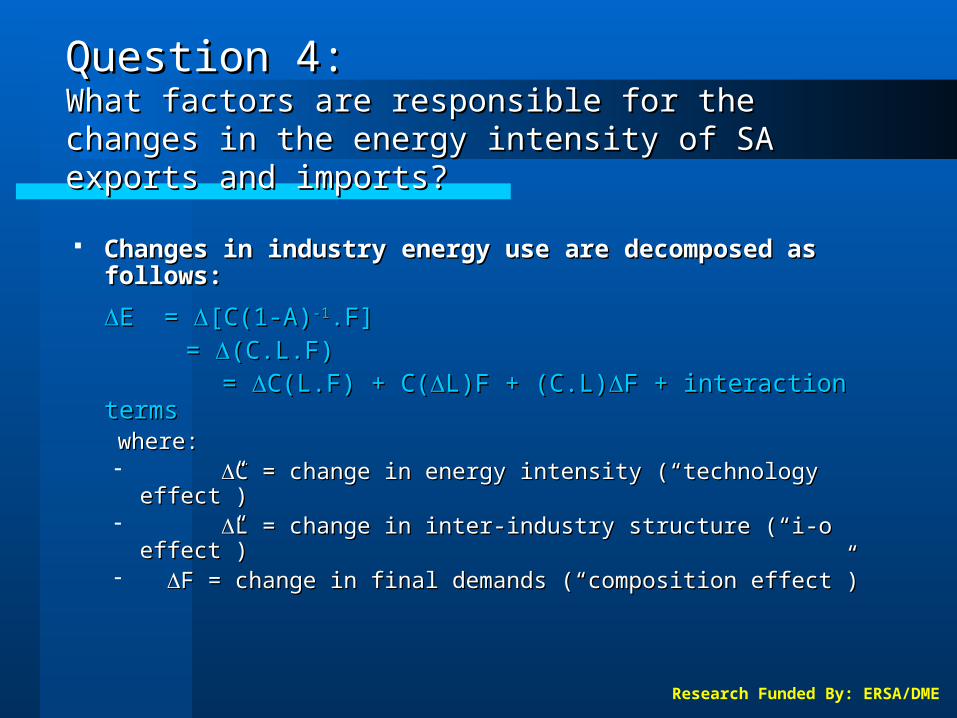
Changes in industry energy use are decomposedChanges in industry energy use are decomposed as followsas follows::
E E = = [[C(1-A)C(1-A)-1-1.F].F] = = (C.L.F)(C.L.F) = = C(L.F) + C(C(L.F) + C(L)F + (C.L)L)F + (C.L)F + interaction F + interaction
termsterms wherewhere:: C = change in energy intensity (“technology C = change in energy intensity (“technology
effect”)effect”) L = change in inter-industry structure (“i-o L = change in inter-industry structure (“i-o
effect”)effect”) F = change in final demands (“composition effect”)F = change in final demands (“composition effect”)
Question 4:Question 4:What factors are responsible for the changes in What factors are responsible for the changes in the energy intensity of the energy intensity of SA SA exports and exports and imports? imports?
Research Funded By: ERSA/DME
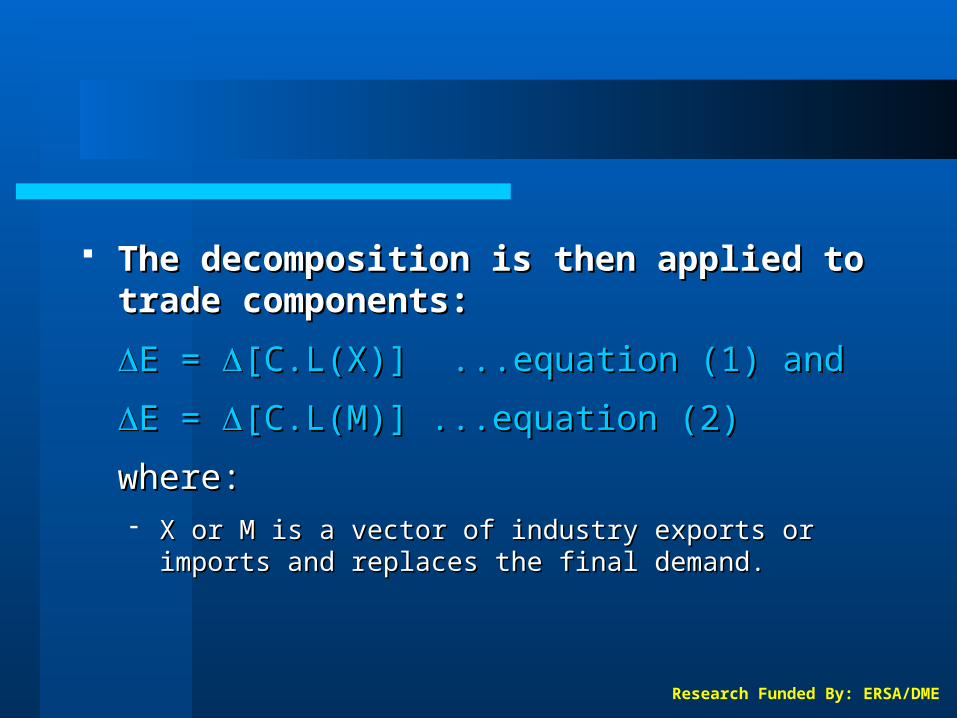
The decomposition is then applied to The decomposition is then applied to trade components:trade components:
E = E = [[C.L(X)C.L(X)] ...equation (1) and] ...equation (1) and
E = E = [[C.L(M)C.L(M)] ...equation (2)] ...equation (2)
where:where: X or M is a vector of industry exports or imports and X or M is a vector of industry exports or imports and
replaces the final demandreplaces the final demand..
Research Funded By: ERSA/DME
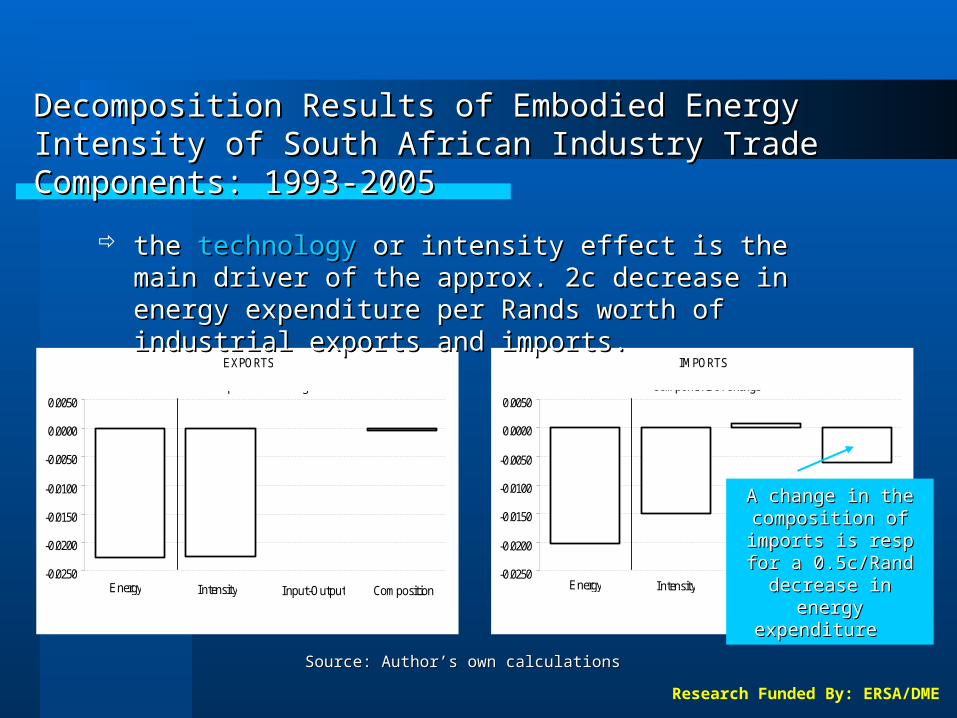
Decomposition Results of Embodied Energy Intensity of Decomposition Results of Embodied Energy Intensity of South African Industry South African Industry Trade Components: 1993-2005Trade Components: 1993-2005
EXPORTS
Energy Intensity Input-Output Composition-0.0250
-0.0200
-0.0150
-0.0100
-0.0050
0.0000
0.0050Change Components of Change
IMPORTS
Energy Intensity Input-Output Composition-0.0250
-0.0200
-0.0150
-0.0100
-0.0050
0.0000
0.0050Change Components of Change
the the technologytechnology or intensity effect is the main driver or intensity effect is the main driver of the approx. 2c decrease in energy expenditure of the approx. 2c decrease in energy expenditure per Rands worth of industrial exports and imports.per Rands worth of industrial exports and imports.
A change in the A change in the composition of composition of
imports is resp for a imports is resp for a 0.5c/Rand decrease 0.5c/Rand decrease
in energy in energy expenditureexpenditure
Source: Author’s own calculationsSource: Author’s own calculations

Research Funded By: ERSA/DME
Findings of Research:Findings of Research:
SA industrial exports are on average more energy SA industrial exports are on average more energy intensive than her imports for the period 1993-2005.intensive than her imports for the period 1993-2005.
SA is adding significantly to her domestic energy SA is adding significantly to her domestic energy requirements by being a requirements by being a net exporter of energy servicesnet exporter of energy services embodied in industrial traded goods. embodied in industrial traded goods.
Energy resources along with other natural resources are a Energy resources along with other natural resources are a significant source of SA‘s industrial competitiveness.significant source of SA‘s industrial competitiveness.
In the decomposition of changes in energy intensity in SA‘s In the decomposition of changes in energy intensity in SA‘s traded goods: the traded goods: the technologytechnology or intensity effect is the or intensity effect is the main driver of the decreases in energy intensity recorded. main driver of the decreases in energy intensity recorded.

Research Funded By: ERSA/DME
Policy Suggestions?Policy Suggestions?
SA can decrease demand on her domestic energy resources by:– exporting industrial goods that are less energy-
intensive (e.g.: higher value added goods which are less materials intensive)
– importing industrial goods that are more energy-intensive
This will require a significant change in the composition of the goods traded
An increase in the price of SA’s energy inputs can result in signif. investments in energy-saving technologies which will help conserve her domestic energy resources.

Research Funded By: ERSA/DME
Thank You