Embed Size (px)
Citation preview
Tip-enhanced Raman spectroscopy and related techniques in studies of
biological materials
Thomas Schmid*, Aleksandar Sebesta, Johannes Stadler, Lothar Opilik, Roman M. Balabin,
Renato Zenobi
Department of Chemistry and Applied Biosciences, ETH Zurich, 8093 Zurich, Switzerland
*[email protected]; phone +41-44-6326112; fax +41-44-6321292; www.zenobi.ethz.ch
ABSTRACT
Biological materials can be highly heterogeneous at the nanometer scale. The investigation of nanostructures is often
hampered by the low spatial resolution (e.g. spectroscopic techniques) or very little chemical information (e.g. atomic
force microscopy (AFM), scanning tunneling microscopy (STM)) provided by analytical techniques. Our research
focuses on combined instruments, which allow the analysis of the exactly same area of a sample by complementary
techniques, such as AFM and Raman spectroscopy. Tip-enhanced Raman spectroscopy (TERS) combines the high
spatial resolution of AFM or STM with the chemical information provided by Raman spectroscopy. The technique is
based on enhancement effects known from surface-enhanced Raman scattering (SERS). In TERS the enhancing metallic
nanostructure is brought to the sample by an AFM or STM tip. With a TERS-active tip, enhanced Raman signals can be
generated from a sample area as small as 10-50 nm in diameter. AFM analysis of bacterial biofilms has demonstrated
their heterogeneity at the nanometer scale, revealing a variety of nanostructures such as pili, flagella, and extracelullar
polymers. TERS measurements of the biopolymers alginate and cytochrome c have yielded spectroscopic fingerprints
even of such weak Raman scatterers, which in future can allow their localization in complex matrices. Furthermore,
biofilms of the bacterium Halomonas meridiana were studied, which was found to be involved in the generation of the
mineral dolomite. Only combined AFM–Raman analysis was able to identify the nanoglobules found in laboratory
cultures of H. meridiana as dolomite nanoparticles. Our combined setups are and will be applied to the investigation of
biofilms, fish spermatozoa as well as biological membranes.
Keywords: Nanoscale chemical analysis, tip-enhanced Raman spectroscopy (TERS), atomic force microscopy (AFM),
scanning tunneling microscopy (STM), biofilms, biopolymers, lipids
1. INTRODUCTION
Nanostructures play an important role in several biological systems. Bacteria, for example, adhere to surfaces by using
their pili, i.e. nanometer-sized structures on their cell wall. Large bacterial aggregates, the so-called biofilms, are held
together by a stable matrix formed by extracellular polymeric substances (EPS)1-5
. They are known to consist of poly-
saccharides, proteins, humic substances, DNA and other biopolymers6, 7
. The composition varies depending on bacterial
species and environment. There is only little knowledge about the arrangement of the different polymers and interactions
between them and with components of the bacterial cell walls. This is due to the fact that analytical techniques used for
their study so far are limited in spatial resolution (e.g. optical microscopies and spectroscopic techniques) or chemical
information content (e.g. atomic force microscopy (AFM) or electron microscopy). Furthermore, analytical techniques
with high spatial resolution often have to be performed in vacuum, which can induce artifacts in such fragile systems.
Another example for nano-heterogeneous biological matter is the membrane of biological cells, which mainly consists of
different lipids, cholesterol, membrane-bound and transmembrane proteins, glycolipids, and other biomolecules8. Cell
membranes undoubtedly play an important role in different biological processes, such as exchange of substances (ions,
small molecules and large biopolymers) between intracellular compartments with the environment, regulation of cell-cell
signaling, differentiation and growth, interaction with pathogens, and various enzymatic reactions. It is therefore not
surprising that membrane proteins have become a major topic in pharmaceutical research. Membrane proteins comprise
Invited Paper
Synthesis and Photonics of Nanoscale Materials VII, edited by Jan J. Dubowski, David B. Geohegan, Frank Träger, Proc. of SPIE Vol. 7586, 758603 · © 2010 SPIE · CCC code: 0277-786X/10/$18 · doi: 10.1117/12.845471
Proc. of SPIE Vol. 7586 758603-1
Downloaded from SPIE Digital Library on 04 May 2010 to 129.132.202.35. Terms of Use: http://spiedl.org/terms
approximately 45% of current drug targets9. There are still many open questions regarding structure and function of the
highly dynamic and chemically heterogeneous system of a cell membrane, which are often controversially discussed in
the scientific community. The lipid raft model is one of those ‘hot topics’10
. According to this theory, sphingolipids and
cholesterol self-assemble in the cell membrane to nanometer-sized domains that are surrounded by phospholipids9.
Certain membrane proteins preferably are located in such lipid domains, where raft formation can potentially have an
influence on folding and function of the protein. Until now, cell membranes have been studied only with certain
experimental restrictions, such as limited spatial resolution, no chemical information, need for labeling or vacuum
conditions11, 12
. Thus, there is still no clear evidence for or against the existence of such lipid rafts.
Biofilms and cell membranes are two examples, which demonstrate the need for tools that make chemical analysis of
biological materials at the nanometer scale possible. Such a technique should ideally provide topographic and chemical
images, both with a resolution in the nanometer range. In order to work under almost native conditions, the experiments
have to be performed at atmospheric pressure and should preferably work in aqueous buffer solutions. This analytical
tool should yield chemical information without the need for labeling. The use of chemical labels can unpredictably
influence the complex system of a cell membrane. Also, appropriate labels have to be available, which is not the case for
every potential analyte. Furthermore, techniques that are based on labeling, such as fluorescence imaging, are often
restricted to the observation of only a few different chemical species simultaneously and finally, the presence of a certain
molecule has to be known before the experiment, because only labeled molecules can be detected. Therefore, a technique
for chemical analysis at the nanometer scale should provide chemical fingerprints without labeling.
In this communication we present combinations of atomic force microscopy (AFM) or scanning tunneling microscopy
(STM) with Raman microspectroscopy. AFM and STM provide imaging with nanometer resolution, whereas Raman
spectroscopy yields spectra with sharp bands that are characteristic for functional groups, molecules, folding states, and
crystal structures. Performing high resolution imaging and chemical analyses at the exactly same spot of a biological
sample can yield much deeper insight than the analysis with just one technique, even if the spectroscopic analysis is
restricted in spatial resolution to the upper nanometer to micrometer range due to the optical diffraction limit. By using
tip-enhanced Raman spectroscopy (TERS), we can break the diffraction limit13-15
. Metal-coated (AFM) or etched full
metal tips (STM) are brought in close contact with the sample and illuminated with a focused laser beam. If appropriate
laser wavelengths, tip materials and tip shapes are used, the tip can act as a nano antenna and thus, collect and locally
enhance the electromagnetic field at the apex. Raman scattering of molecules in close contact to the tip can be
dramatically enhanced. This overcomes two issues of Raman spectroscopy: Low Raman scattering cross-sections of
many molecules and limited spatial resolution due to the optical diffraction limit. In conventional Raman
microspectroscopy the lateral resolution is given by the size of the laser focus. Our experience shows that the lateral
resolution of a confocal Raman microscope is on the order of 400–500 nm. In TERS, the Raman signals of molecules
directly below the tip, are dramatically enhanced. Since the tip radius is only a few tens of nanometers (or even less), the
lateral resolution that is reported for TERS is approx. 10–50 nm16-19
. After introducing the experimental setups for TERS
in our lab, we will give an overview on different biological applications of TERS and related techniques, such as AFM–
Raman combinations.
2. EXPERIMENTAL
For both, combined AFM–Raman microspectroscopy at the exactly same part of a sample and tip-enhanced Raman
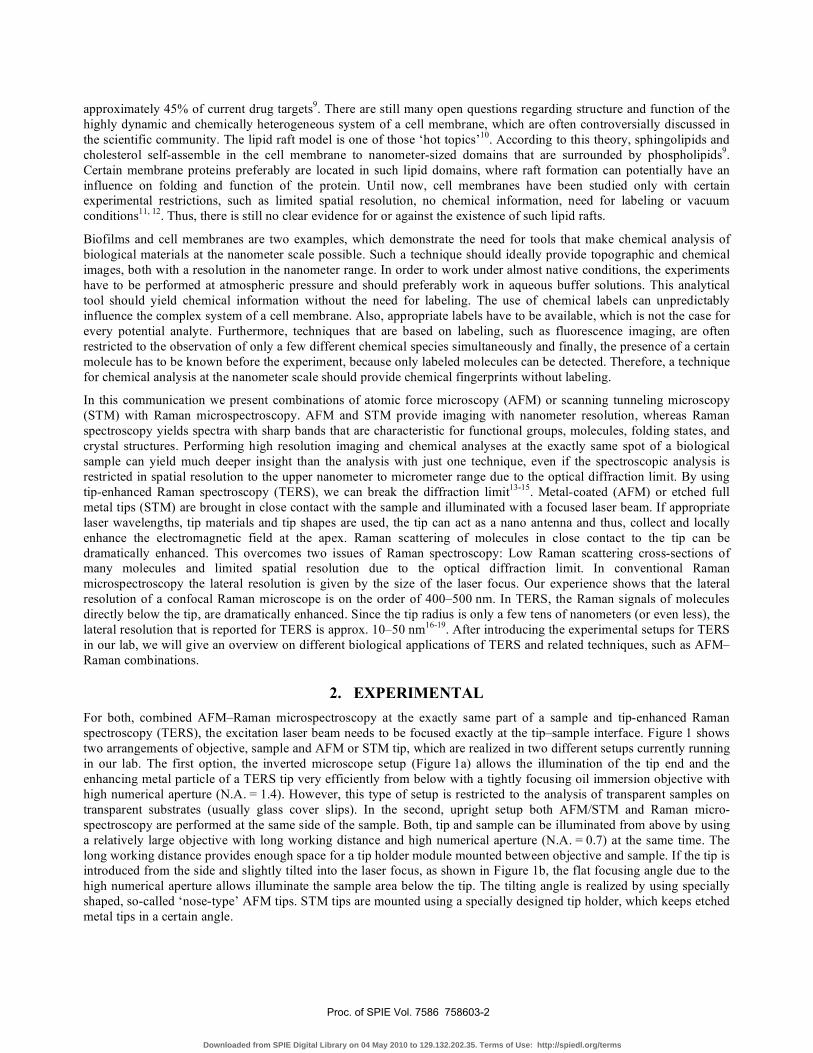
spectroscopy (TERS), the excitation laser beam needs to be focused exactly at the tip–sample interface. Figure 1 shows
two arrangements of objective, sample and AFM or STM tip, which are realized in two different setups currently running
in our lab. The first option, the inverted microscope setup (Figure 1a) allows the illumination of the tip end and the
enhancing metal particle of a TERS tip very efficiently from below with a tightly focusing oil immersion objective with
high numerical aperture (N.A. = 1.4). However, this type of setup is restricted to the analysis of transparent samples on
transparent substrates (usually glass cover slips). In the second, upright setup both AFM/STM and Raman micro-
spectroscopy are performed at the same side of the sample. Both, tip and sample can be illuminated from above by using
a relatively large objective with long working distance and high numerical aperture (N.A. = 0.7) at the same time. The
long working distance provides enough space for a tip holder module mounted between objective and sample. If the tip is
introduced from the side and slightly tilted into the laser focus, as shown in Figure 1b, the flat focusing angle due to the
high numerical aperture allows illuminate the sample area below the tip. The tilting angle is realized by using specially
shaped, so-called ‘nose-type’ AFM tips. STM tips are mounted using a specially designed tip holder, which keeps etched
metal tips in a certain angle.
Proc. of SPIE Vol. 7586 758603-2
Downloaded from SPIE Digital Library on 04 May 2010 to 129.132.202.35. Terms of Use: http://spiedl.org/terms
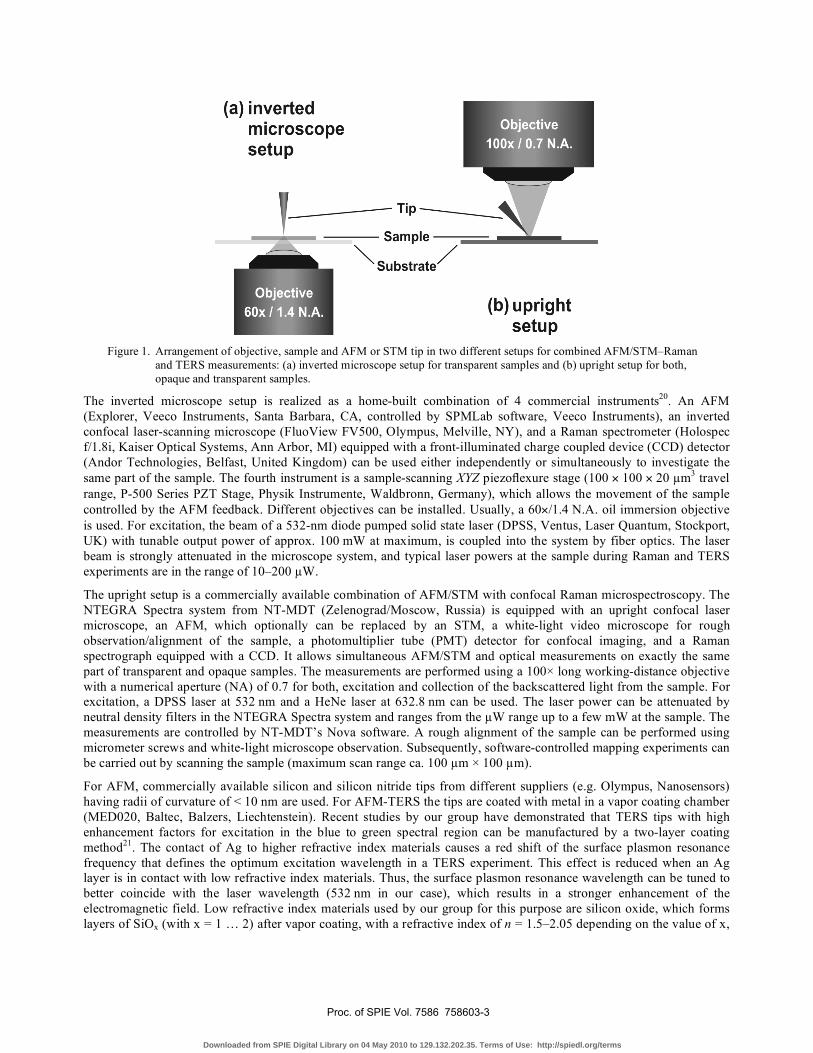
Figure 1. Arrangement of objective, sample and AFM or STM tip in two different setups for combined AFM/STM–Raman
and TERS measurements: (a) inverted microscope setup for transparent samples and (b) upright setup for both,
opaque and transparent samples.
The inverted microscope setup is realized as a home-built combination of 4 commercial instruments20
. An AFM
(Explorer, Veeco Instruments, Santa Barbara, CA, controlled by SPMLab software, Veeco Instruments), an inverted
confocal laser-scanning microscope (FluoView FV500, Olympus, Melville, NY), and a Raman spectrometer (Holospec
f/1.8i, Kaiser Optical Systems, Ann Arbor, MI) equipped with a front-illuminated charge coupled device (CCD) detector
(Andor Technologies, Belfast, United Kingdom) can be used either independently or simultaneously to investigate the
same part of the sample. The fourth instrument is a sample-scanning XYZ piezoflexure stage (100 100 20 m3 travel
range, P-500 Series PZT Stage, Physik Instrumente, Waldbronn, Germany), which allows the movement of the sample
controlled by the AFM feedback. Different objectives can be installed. Usually, a 60 /1.4 N.A. oil immersion objective
is used. For excitation, the beam of a 532-nm diode pumped solid state laser (DPSS, Ventus, Laser Quantum, Stockport,
UK) with tunable output power of approx. 100 mW at maximum, is coupled into the system by fiber optics. The laser
beam is strongly attenuated in the microscope system, and typical laser powers at the sample during Raman and TERS
experiments are in the range of 10–200 W.
The upright setup is a commercially available combination of AFM/STM with confocal Raman microspectroscopy. The
NTEGRA Spectra system from NT-MDT (Zelenograd/Moscow, Russia) is equipped with an upright confocal laser
microscope, an AFM, which optionally can be replaced by an STM, a white-light video microscope for rough
observation/alignment of the sample, a photomultiplier tube (PMT) detector for confocal imaging, and a Raman
spectrograph equipped with a CCD. It allows simultaneous AFM/STM and optical measurements on exactly the same
part of transparent and opaque samples. The measurements are performed using a 100 long working-distance objective
with a numerical aperture (NA) of 0.7 for both, excitation and collection of the backscattered light from the sample. For
excitation, a DPSS laser at 532 nm and a HeNe laser at 632.8 nm can be used. The laser power can be attenuated by
neutral density filters in the NTEGRA Spectra system and ranges from the W range up to a few mW at the sample. The
measurements are controlled by NT-MDT’s Nova software. A rough alignment of the sample can be performed using
micrometer screws and white-light microscope observation. Subsequently, software-controlled mapping experiments can
be carried out by scanning the sample (maximum scan range ca. 100 m 100 m).
For AFM, commercially available silicon and silicon nitride tips from different suppliers (e.g. Olympus, Nanosensors)
having radii of curvature of < 10 nm are used. For AFM-TERS the tips are coated with metal in a vapor coating chamber
(MED020, Baltec, Balzers, Liechtenstein). Recent studies by our group have demonstrated that TERS tips with high
enhancement factors for excitation in the blue to green spectral region can be manufactured by a two-layer coating
method21
. The contact of Ag to higher refractive index materials causes a red shift of the surface plasmon resonance
frequency that defines the optimum excitation wavelength in a TERS experiment. This effect is reduced when an Ag
layer is in contact with low refractive index materials. Thus, the surface plasmon resonance wavelength can be tuned to
better coincide with the laser wavelength (532 nm in our case), which results in a stronger enhancement of the
electromagnetic field. Low refractive index materials used by our group for this purpose are silicon oxide, which forms
layers of SiOx (with x = 1 … 2) after vapor coating, with a refractive index of n = 1.5–2.05 depending on the value of x,
Proc. of SPIE Vol. 7586 758603-3
Downloaded from SPIE Digital Library on 04 May 2010 to 129.132.202.35. Terms of Use: http://spiedl.org/terms
250 nrn
and AlF3 with n = 1.4. A typical recipe for TERS tip preparation is to coat an AFM tip with 20 nm AlF3 or SiOx followed
by 30 nm silver. The nanometer values are nominal thicknesses measured on the horizontal sensor surface of a quartz
crystal microbalance inside the coating chamber. The thickness of the coating on the sharp tip is significantly smaller.
The upright setup can be operated in STM mode as well. In this case, the sample is usually coated onto a conductive gold
substrate. The STM tips are prepared in our lab by electrochemical etching of thin silver wires.
3. RESULTS AND DISCUSSION
3.1 Biofilms
Biofilms are the predominant life-form of bacteria. They can form at almost every aqueous interface and are found in
natural environments, in wastewater treatment plants, and in industrial systems where they cause biofouling of tubes,
valves, filters etc. Furthermore, they play an important role in medicine as potential contaminants of instruments and as
the cause of persistent infections)1-3
. The colonization of solid surfaces begins with the adsorption of single bacteria
mediated by pili that are nanostructures on the bacterial cell wall. Larger colonies of bacteria grow by cell division and
adherence of other bacteria from the liquid stage. Stable films are finally formed due to generation of so-called
extracellular polymeric substances (EPS). The composition of this mixture of biopolymers depends on bacterial species
and environment and often consists of polysaccharides and proteins with smaller amounts of humic substances, DNA
and other biopolymers. EPS form hydrogels in water, which provide a stable matrix for the bacteria allowing the
formation of larger colonies, where cell–cell signaling and the concerted degradation of dissolved compounds by
different species can be performed more efficiently than by a suspension of individual bacteria. Furthermore, nutrients
can bind and accumulate in the EPS matrix, which also serves as a protective barrier against biocides and changes of
environmental conditions (e.g temperature, humidity, pH)4, 5
.
Figure 2: AFM tapping mode images of different bacterial biofilms. (a, d) Topography images of Halomonas meridiana
biofilms. (b, e) Phase images showing nanometer-sized pili at one pole of a river-water bacterium during the first
stages of biofilm formation. (c) Phase image showing spherical hydrocolloids adsorbed to the flagellum of a
bacterium. (f) River-water bacteria after several days of growth on an aqueous–solid interface. The phase image
shows bacterial cells coated with the network-like structure of the EPS matrix. Images (b), (c), and (f) modified
from Ref. 22
Proc. of SPIE Vol. 7586 758603-4
Downloaded from SPIE Digital Library on 04 May 2010 to 129.132.202.35. Terms of Use: http://spiedl.org/terms
(a)
62
5201160
1521
200 400 600 800 1000 1200 1400 1600
Raman shift Icm
(e)
5 pm
2.5 pm
0
5 pm
Ii(b)
5 pm
".SS
5 pm
Figure 2 shows AFM images of different biofilms22, 23
. They clearly demonstrate the heterogeneity of such systems at the
nanometer scale. The biofilms consist of 1–2 m long rod-shaped bacteria in an extracellular matrix. In the AFM studies
we found several extracellular nanostructures, such as flagella and pili, used by bacteria to move in water and adsorb to
liquid–solid interfaces, respectively. Biofilms grown from river-water bacteria contained spherical hydrocolloids, most
likely consisting of humic substances, which were integrated into the extracellular matrix (see Figure 2c). When growing
biofilms of river-water bacteria over several days, formation of EPS was observed. The bacteria were coated with
network-like structures formed by biopolymers (see Figure 2f). The EPS structure appeared very similar to AFM images
of calcium alginate hydrogel [Anal Bioanal Chem]. Alginate and its complexes with divalent cations are known to be a
stabilizing agent in the EPS of several biofilms. Therefore, its spectroscopic features were studied as mentioned below in
section 3.2. Biofilms of Halomonas meridiana additionally contained inorganic nanoglobules that were found adsorbed
to the cell walls and in the extracellular matrix23
. The characterization of these nanoparticles by Raman spectroscopy is
described below. In general, the found extracellular structures are in the size range from a few nanometers up to several
micrometers22
. For example, pili and flagella are 2–4 nm thick and reach a length of several micrometers. The EPS
structures were typically 10 nm thick and features like pores were approx. 100 nm wide. In general, the size of most
nanostructures is compatible with the spatial resolution provided by TERS. Raman microscopy (approx. 500 nm lateral
resolution) and TERS investigations (10–50 nm lateral resolution) can definitely yield deeper insight into such complex
biological systems. For example, studying the arrangement of different EPS and their interactions with the cells can help
to understand, which substances are important for the stability of the hydrogel and can therefore help to develop new
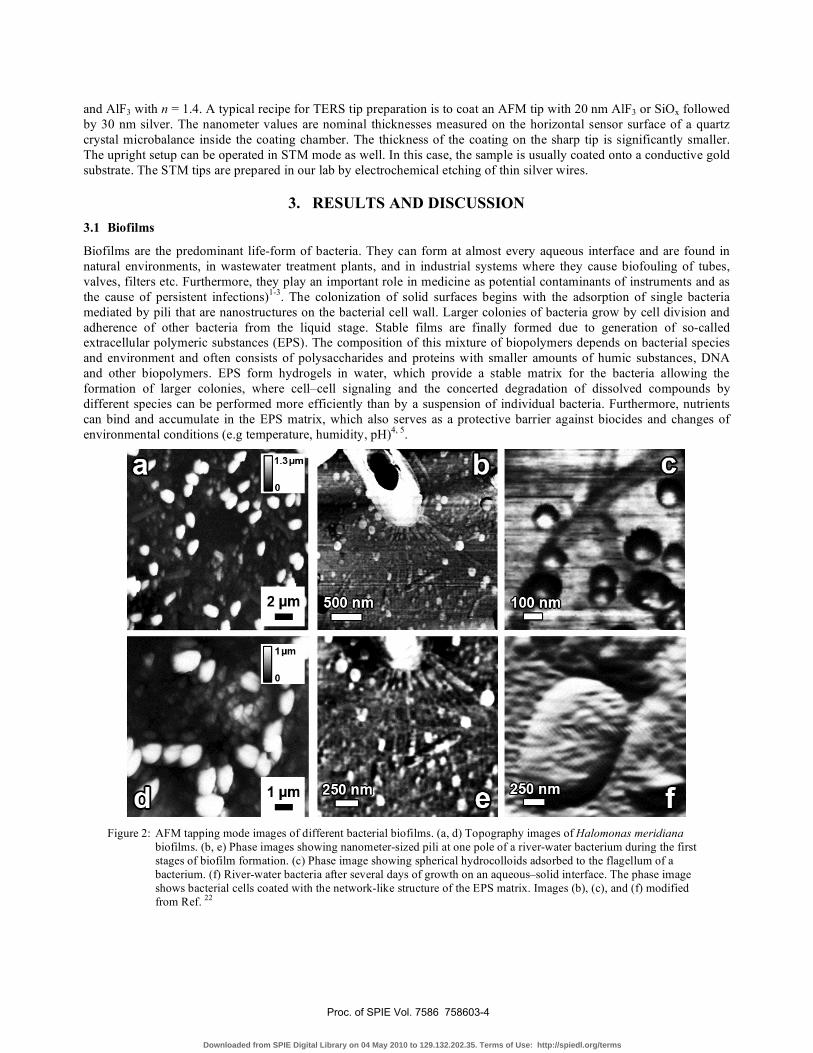
biocides and anti-fouling strategies. Figure 3 demonstrates the advantages of using a combined approach to study
biofilms.
Figure 3: Biofilm sample containing cyanobacteria studied by different techniques simultaneously. (a) Typical Raman
spectrum of the sample containing a band at 520 cm-1
that is the Si-Si stretching mode of the silicon AFM tip and
bands at 1160 cm-1
and 1521 cm-1
assignable to -carotene ( = 532 nm, 8 s collection time). The raise of the
baseline is due to autofluorescence of the biological matter. The step at approx. 200 cm-1
is due to the edge filter
used for Raman measurements. (b) AFM tapping mode topography and (c) phase images, as well as optical
confocal images based on (d) back-reflected light intensity, (e) autofluorescence intensity, (f) intensity of the
Raman band at 1160 cm-1
and (g) intensity of the Raman band at 1521 cm-1
.
Proc. of SPIE Vol. 7586 758603-5
Downloaded from SPIE Digital Library on 04 May 2010 to 129.132.202.35. Terms of Use: http://spiedl.org/terms
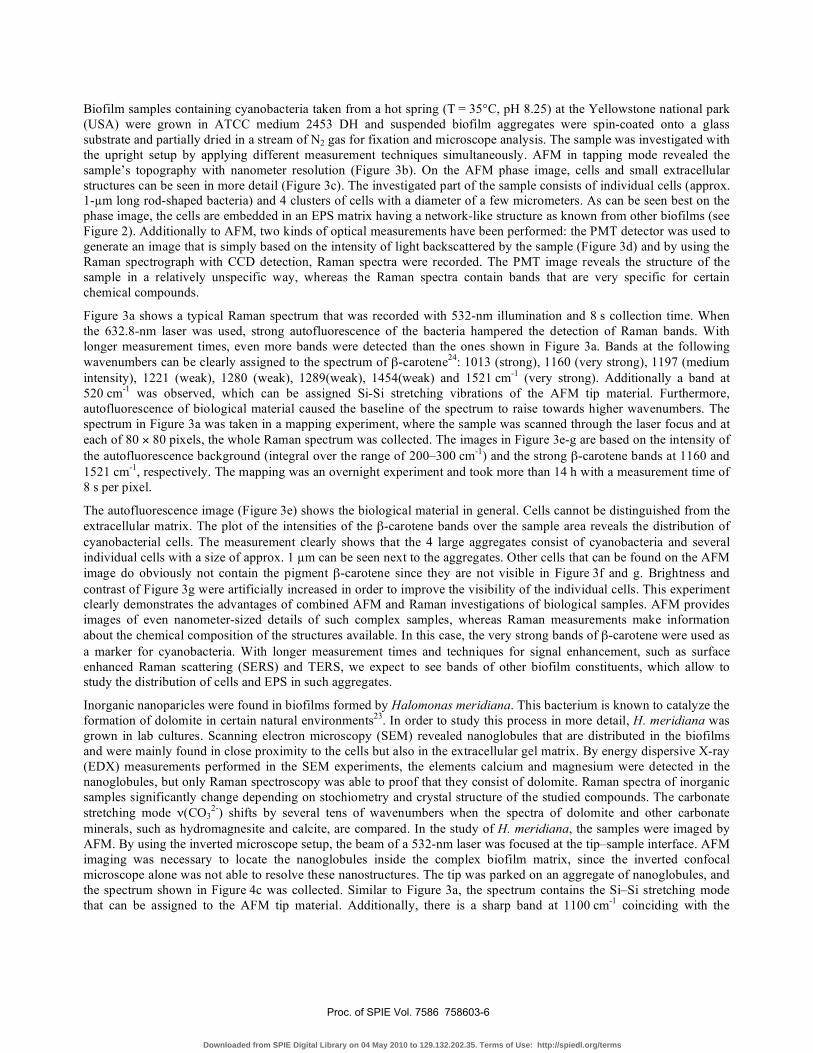
Biofilm samples containing cyanobacteria taken from a hot spring (T = 35°C, pH 8.25) at the Yellowstone national park
(USA) were grown in ATCC medium 2453 DH and suspended biofilm aggregates were spin-coated onto a glass
substrate and partially dried in a stream of N2 gas for fixation and microscope analysis. The sample was investigated with
the upright setup by applying different measurement techniques simultaneously. AFM in tapping mode revealed the
sample’s topography with nanometer resolution (Figure 3b). On the AFM phase image, cells and small extracellular
structures can be seen in more detail (Figure 3c). The investigated part of the sample consists of individual cells (approx.
1- m long rod-shaped bacteria) and 4 clusters of cells with a diameter of a few micrometers. As can be seen best on the
phase image, the cells are embedded in an EPS matrix having a network-like structure as known from other biofilms (see
Figure 2). Additionally to AFM, two kinds of optical measurements have been performed: the PMT detector was used to
generate an image that is simply based on the intensity of light backscattered by the sample (Figure 3d) and by using the
Raman spectrograph with CCD detection, Raman spectra were recorded. The PMT image reveals the structure of the
sample in a relatively unspecific way, whereas the Raman spectra contain bands that are very specific for certain
chemical compounds.
Figure 3a shows a typical Raman spectrum that was recorded with 532-nm illumination and 8 s collection time. When
the 632.8-nm laser was used, strong autofluorescence of the bacteria hampered the detection of Raman bands. With
longer measurement times, even more bands were detected than the ones shown in Figure 3a. Bands at the following
wavenumbers can be clearly assigned to the spectrum of -carotene24
: 1013 (strong), 1160 (very strong), 1197 (medium
intensity), 1221 (weak), 1280 (weak), 1289(weak), 1454(weak) and 1521 cm-1
(very strong). Additionally a band at
520 cm-1
was observed, which can be assigned Si-Si stretching vibrations of the AFM tip material. Furthermore,
autofluorescence of biological material caused the baseline of the spectrum to raise towards higher wavenumbers. The
spectrum in Figure 3a was taken in a mapping experiment, where the sample was scanned through the laser focus and at
each of 80 80 pixels, the whole Raman spectrum was collected. The images in Figure 3e-g are based on the intensity of
the autofluorescence background (integral over the range of 200–300 cm-1
) and the strong -carotene bands at 1160 and
1521 cm-1
, respectively. The mapping was an overnight experiment and took more than 14 h with a measurement time of
8 s per pixel.
The autofluorescence image (Figure 3e) shows the biological material in general. Cells cannot be distinguished from the
extracellular matrix. The plot of the intensities of the -carotene bands over the sample area reveals the distribution of
cyanobacterial cells. The measurement clearly shows that the 4 large aggregates consist of cyanobacteria and several
individual cells with a size of approx. 1 m can be seen next to the aggregates. Other cells that can be found on the AFM
image do obviously not contain the pigment -carotene since they are not visible in Figure 3f and g. Brightness and
contrast of Figure 3g were artificially increased in order to improve the visibility of the individual cells. This experiment
clearly demonstrates the advantages of combined AFM and Raman investigations of biological samples. AFM provides
images of even nanometer-sized details of such complex samples, whereas Raman measurements make information
about the chemical composition of the structures available. In this case, the very strong bands of -carotene were used as
a marker for cyanobacteria. With longer measurement times and techniques for signal enhancement, such as surface
enhanced Raman scattering (SERS) and TERS, we expect to see bands of other biofilm constituents, which allow to
study the distribution of cells and EPS in such aggregates.
Inorganic nanoparicles were found in biofilms formed by Halomonas meridiana. This bacterium is known to catalyze the
formation of dolomite in certain natural environments23
. In order to study this process in more detail, H. meridiana was
grown in lab cultures. Scanning electron microscopy (SEM) revealed nanoglobules that are distributed in the biofilms
and were mainly found in close proximity to the cells but also in the extracellular gel matrix. By energy dispersive X-ray
(EDX) measurements performed in the SEM experiments, the elements calcium and magnesium were detected in the
nanoglobules, but only Raman spectroscopy was able to proof that they consist of dolomite. Raman spectra of inorganic
samples significantly change depending on stochiometry and crystal structure of the studied compounds. The carbonate
stretching mode (CO32-
) shifts by several tens of wavenumbers when the spectra of dolomite and other carbonate
minerals, such as hydromagnesite and calcite, are compared. In the study of H. meridiana, the samples were imaged by
AFM. By using the inverted microscope setup, the beam of a 532-nm laser was focused at the tip–sample interface. AFM
imaging was necessary to locate the nanoglobules inside the complex biofilm matrix, since the inverted confocal
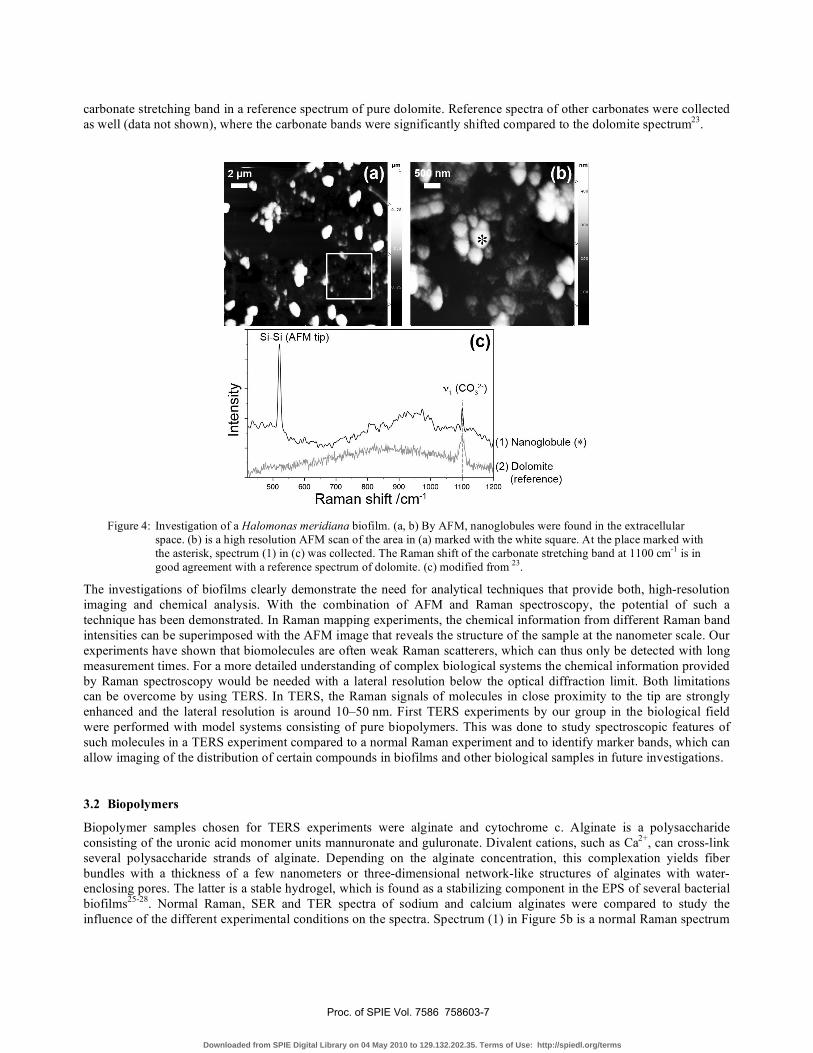
microscope alone was not able to resolve these nanostructures. The tip was parked on an aggregate of nanoglobules, and
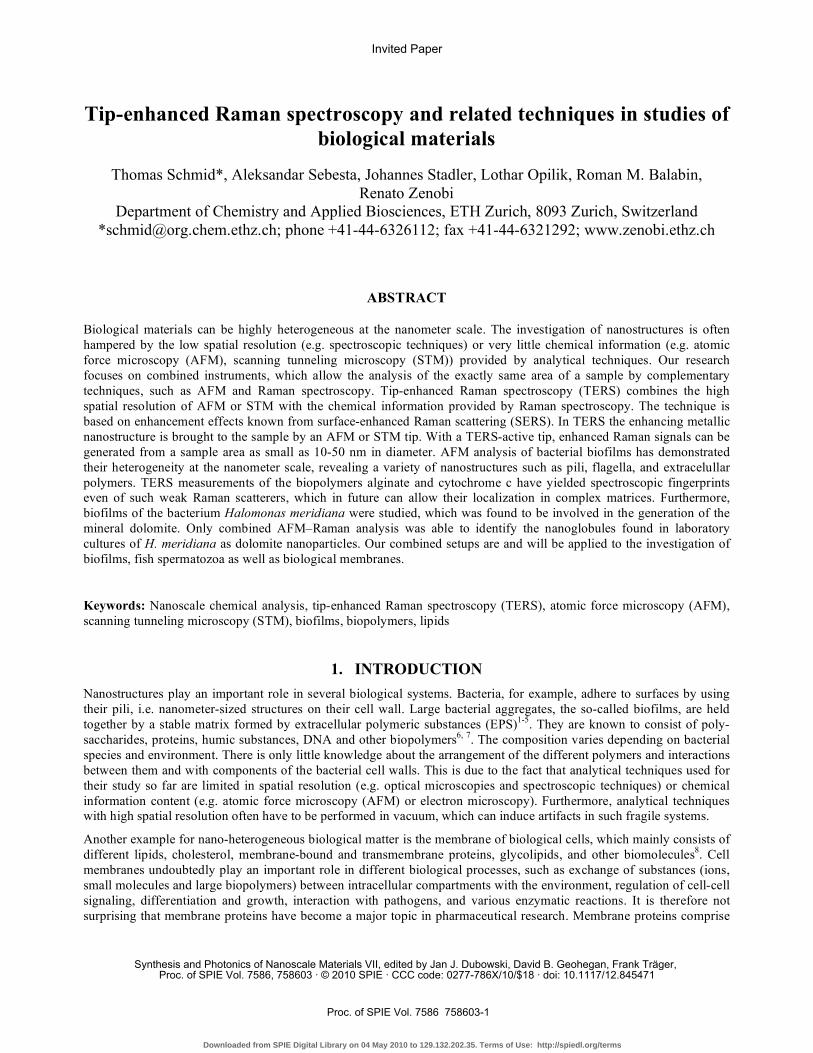
the spectrum shown in Figure 4c was collected. Similar to Figure 3a, the spectrum contains the Si–Si stretching mode
that can be assigned to the AFM tip material. Additionally, there is a sharp band at 1100 cm-1
coinciding with the
Proc. of SPIE Vol. 7586 758603-6
Downloaded from SPIE Digital Library on 04 May 2010 to 129.132.202.35. Terms of Use: http://spiedl.org/terms
500 600 700 800 900 1000
Raman shift 1cm11100 1200
Dolomite(reference)
Nanoglobu!e (*)
Si-Si (AFM tip)
carbonate stretching band in a reference spectrum of pure dolomite. Reference spectra of other carbonates were collected
as well (data not shown), where the carbonate bands were significantly shifted compared to the dolomite spectrum23
.
Figure 4: Investigation of a Halomonas meridiana biofilm. (a, b) By AFM, nanoglobules were found in the extracellular
space. (b) is a high resolution AFM scan of the area in (a) marked with the white square. At the place marked with
the asterisk, spectrum (1) in (c) was collected. The Raman shift of the carbonate stretching band at 1100 cm-1
is in
good agreement with a reference spectrum of dolomite. (c) modified from 23
.
The investigations of biofilms clearly demonstrate the need for analytical techniques that provide both, high-resolution
imaging and chemical analysis. With the combination of AFM and Raman spectroscopy, the potential of such a
technique has been demonstrated. In Raman mapping experiments, the chemical information from different Raman band
intensities can be superimposed with the AFM image that reveals the structure of the sample at the nanometer scale. Our
experiments have shown that biomolecules are often weak Raman scatterers, which can thus only be detected with long
measurement times. For a more detailed understanding of complex biological systems the chemical information provided
by Raman spectroscopy would be needed with a lateral resolution below the optical diffraction limit. Both limitations
can be overcome by using TERS. In TERS, the Raman signals of molecules in close proximity to the tip are strongly
enhanced and the lateral resolution is around 10–50 nm. First TERS experiments by our group in the biological field
were performed with model systems consisting of pure biopolymers. This was done to study spectroscopic features of
such molecules in a TERS experiment compared to a normal Raman experiment and to identify marker bands, which can
allow imaging of the distribution of certain compounds in biofilms and other biological samples in future investigations.
3.2 Biopolymers
Biopolymer samples chosen for TERS experiments were alginate and cytochrome c. Alginate is a polysaccharide
consisting of the uronic acid monomer units mannuronate and guluronate. Divalent cations, such as Ca2+
, can cross-link
several polysaccharide strands of alginate. Depending on the alginate concentration, this complexation yields fiber
bundles with a thickness of a few nanometers or three-dimensional network-like structures of alginates with water-
enclosing pores. The latter is a stable hydrogel, which is found as a stabilizing component in the EPS of several bacterial
biofilms25-28
. Normal Raman, SER and TER spectra of sodium and calcium alginates were compared to study the
influence of the different experimental conditions on the spectra. Spectrum (1) in Figure 5b is a normal Raman spectrum
Proc. of SPIE Vol. 7586 758603-7
Downloaded from SPIE Digital Library on 04 May 2010 to 129.132.202.35. Terms of Use: http://spiedl.org/terms
v(C-C). Glycosidicv(C-O), ring
b(C-C-H), breathing v,(COO) s,(COO)o(C-C-O)
600 800 1000 1200 1400 1600
Raman shift 1cm1
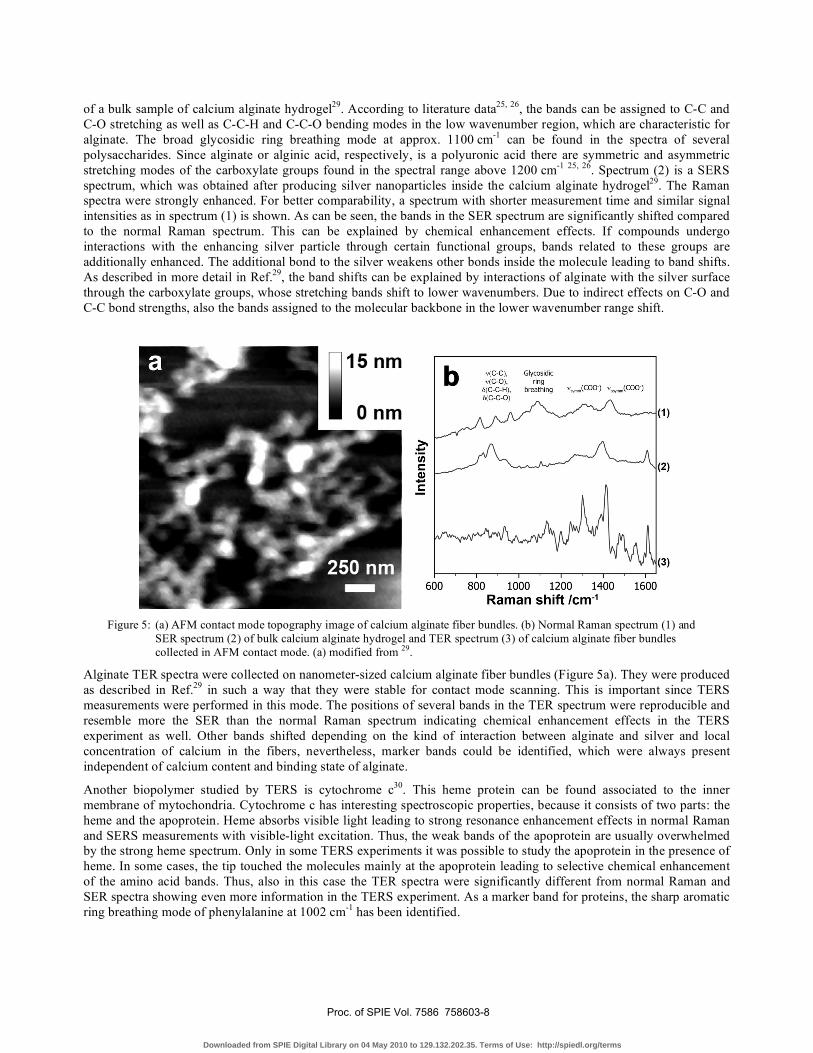
of a bulk sample of calcium alginate hydrogel29
. According to literature data25, 26
, the bands can be assigned to C-C and
C-O stretching as well as C-C-H and C-C-O bending modes in the low wavenumber region, which are characteristic for
alginate. The broad glycosidic ring breathing mode at approx. 1100 cm-1
can be found in the spectra of several
polysaccharides. Since alginate or alginic acid, respectively, is a polyuronic acid there are symmetric and asymmetric
stretching modes of the carboxylate groups found in the spectral range above 1200 cm-1 25, 26
. Spectrum (2) is a SERS
spectrum, which was obtained after producing silver nanoparticles inside the calcium alginate hydrogel29
. The Raman
spectra were strongly enhanced. For better comparability, a spectrum with shorter measurement time and similar signal
intensities as in spectrum (1) is shown. As can be seen, the bands in the SER spectrum are significantly shifted compared
to the normal Raman spectrum. This can be explained by chemical enhancement effects. If compounds undergo
interactions with the enhancing silver particle through certain functional groups, bands related to these groups are
additionally enhanced. The additional bond to the silver weakens other bonds inside the molecule leading to band shifts.
As described in more detail in Ref.29
, the band shifts can be explained by interactions of alginate with the silver surface
through the carboxylate groups, whose stretching bands shift to lower wavenumbers. Due to indirect effects on C-O and
C-C bond strengths, also the bands assigned to the molecular backbone in the lower wavenumber range shift.
Figure 5: (a) AFM contact mode topography image of calcium alginate fiber bundles. (b) Normal Raman spectrum (1) and
SER spectrum (2) of bulk calcium alginate hydrogel and TER spectrum (3) of calcium alginate fiber bundles
collected in AFM contact mode. (a) modified from 29
.
Alginate TER spectra were collected on nanometer-sized calcium alginate fiber bundles (Figure 5a). They were produced
as described in Ref.29
in such a way that they were stable for contact mode scanning. This is important since TERS
measurements were performed in this mode. The positions of several bands in the TER spectrum were reproducible and
resemble more the SER than the normal Raman spectrum indicating chemical enhancement effects in the TERS
experiment as well. Other bands shifted depending on the kind of interaction between alginate and silver and local
concentration of calcium in the fibers, nevertheless, marker bands could be identified, which were always present
independent of calcium content and binding state of alginate.
Another biopolymer studied by TERS is cytochrome c30
. This heme protein can be found associated to the inner
membrane of mytochondria. Cytochrome c has interesting spectroscopic properties, because it consists of two parts: the
heme and the apoprotein. Heme absorbs visible light leading to strong resonance enhancement effects in normal Raman
and SERS measurements with visible-light excitation. Thus, the weak bands of the apoprotein are usually overwhelmed
by the strong heme spectrum. Only in some TERS experiments it was possible to study the apoprotein in the presence of
heme. In some cases, the tip touched the molecules mainly at the apoprotein leading to selective chemical enhancement
of the amino acid bands. Thus, also in this case the TER spectra were significantly different from normal Raman and
SER spectra showing even more information in the TERS experiment. As a marker band for proteins, the sharp aromatic
ring breathing mode of phenylalanine at 1002 cm-1
has been identified.
Proc. of SPIE Vol. 7586 758603-8
Downloaded from SPIE Digital Library on 04 May 2010 to 129.132.202.35. Terms of Use: http://spiedl.org/terms
The results show that even Raman signals of weakly scattering biomolecules can be enhanced in a TERS experiment and
marker bands can be identified, which can allow the detection of such molecules in complex biological matrices with
high spatial resolution in future investigations. For correct assignment of bands in the spectra of biological ‘real-world’
samples, reference measurements have to be performed, which include normal Raman, SERS and TERS, since
enhancement effects and the small sample fraction that is probed by a TERS tip can significantly influence the spectra.
To our experience, measurements at elevated laser powers can easily lead to sample decomposition and formation of a
carbon contamination layer on the tip. Amorphous carbon is known to be a strong Raman scatterer and can lead to
randomly fluctuating bands in the spectra due to different carbon modifications being enhanced at different times (e.g.
because of diffusion or re-orientation of carbon on the tip)31, 32
. Such bands can be misinterpreted as signals from
analytes on the sample or at least make the interpretation of the spectra very difficult. In measurements with low laser
power, this effect can be avoided, but then strongly enhancing tips are needed to study samples within reasonable
measurement times. We have demonstrated that TERS tips produced by the two-layer coating method can provide such
strong enhancement21
, even though the enhancement factors still vary from tip to tip.
3.3 Fish sperm cells
Speciation is one of the biggest issues in evolutionary biology. It can occur when populations are split and these
separated populations are hindered to interbreed, e.g. by a geographical barrier. After a certain period of time, the
evolution apart from one another may lead to the genesis of distinct species. The requirement for the evolution of a new,
distinct species is reproductive isolation from the former parental species, which means that these two species cannot sire
offspring or their offspring will be infertile, respectively33
. For this research field, fast evolving species are an optimal
subject of study. Cichlid fish are known for their fast evolution and are among the most species-rich vertebrate families34
.
These fishes are primarily widespread in the Great Lakes of Africa, of which the most prominent are the Lakes Victoria,
Tanganyika and Malawi.
In an evolutionary study, the sperm cells of different cichlid fishes, such as Neochromis omnicaeruleus, have been
investigated by different techniques. Fishes were taken from Lakes Victoria and Malawi and grown in aquaria at the
Swiss Federal Institute of Aquatic Science and Technology (EAWAG). The extracted sperm cells were stabilized in
formalin and refrigerated for storage. In our lab, suspended sperm cells were spin coated onto glass substrates and
studied by AFM and Raman microspectroscopy.
The goal of our research was to find significant differences in morphology and spectroscopic features between sperm
cells of different species, closely related species and different phenotypes of one species. Special interest lies on sperm
cells of species that are closely related to each other on Darwin’s tree of life (e.g. Neochromis omnicaeruleus and
Pundamilia nyererei) and different phenotypes of Neochromis omnicaeruleus, which are thought to be the first step
towards the formation of new species. We performed AFM topography measurements of the sperm cells and extracted 4
morphological parameters of the sperm heads from the AFM data: width, length, height, and length at half height.
Furthermore, by focusing the laser beam of our Raman microscope into the sperm heads, Raman spectra have been
collected.
Preliminary results demonstrate that models for multivariate analysis35, 36
, such as K nearest neighbours (KNN), linear
discriminant analysis (LDA), quadratic discriminant analysis (QDA), and supported vector machine (SVM) can
significantly distinguish between sperm cells of different species, even in the case of evolutionary closely related species.
Thus, morphometric analysis provides useful information for evolutionary studies. Raman spectra of the sperm heads
contain bands that are assignable to different biomolecules and are dominated by the Raman signature of DNA. Raman
shifts assignable to nucleic acids are37
: 785 cm-1
(DNA backbone), 921 cm-1
(deoxyribose gycosidic ring vibrations),
1098 cm-1
(PO2 symmetric stretching mode), 1257 cm-1
(adenine), 1337 cm-1
(adenine), and 1372 cm-1
(guanine). In
further studies, also the spectroscopic data will be evaluated by multivariate data analysis. Raman spectra probably
provide an additional possibility to distinguish sperm cells of different species or phenotypes. Detailed data on
spectroscopic and morphometric analysis of fish sperm cells will be published elsewhere. The membrane of sperm cells
is an interesting subject for TERS experiments, since they are known to consist of different chemical compounds that are
mainly lipids and a relatively high amount of different membrane proteins.
Proc. of SPIE Vol. 7586 758603-9
Downloaded from SPIE Digital Library on 04 May 2010 to 129.132.202.35. Terms of Use: http://spiedl.org/terms
3.4 Lipid layers and cell membranes
As mentioned above, cell membranes are a very interesting target for TERS studies, because they are chemically
heterogeneous at the nanometer scale, their function dramatically depends on these heterogeneities (e.g. arrangement of
membrane proteins), and there are many open questions regarding nanometer-sized structures and domains, such as lipid
rafts. There have been recently first publications describing TERS measurements on cell surfaces38, 39
. Raman spectra
have been successfully enhanced by tips in contact with cell surfaces. The interpretation of the spectra is a difficult task,
mainly because of two reasons: (1) there are many different chemical species in a cell membrane and the Raman (and
TER) spectra are known only for a few of them, and (2) a cell membrane is a highly dynamic system.
Therefore, our approach to study lipid layers and cell membranes is to start with well-defined model systems that are
pure, commercially available lipids in the form of bulk samples as well as mono- and bilayers prepared for example by
the Langmuir-Blodgett method. These investigations will be followed by the analysis of supported lipid bilayers and
similar model systems without and with integrated proteins. Finally, we plan to study real biological cell membranes. For
Raman and TERS mappings, we plan to apply mild fixation methods, which provide a snapshot of the actual
arrangement of the different compounds. Dynamic processes in the cell membrane can probably be studied by parking a
tip on a membrane and performing time-dependent TERS measurements.
First experiments have shown that different lipids can be distinguished based on their Raman spectra. For example, the
Raman spectrum of dioleylphosphatidylcholine (DOPC) contains a band at 1650 cm-1
, which can be assigned to a C=C
stretching vibration40
, which is not present in the saturated phospholipid dipalmitoylphosphatidylcholine (DPPC). More
pronounced differences are expected between the spectra of lipids with different head groups and between spectra of
lipids, cholesterol and proteins. Thus, Raman spectra are expected to allow the differentiation of various compounds in
supported lipid layers and cell membranes. Recently, our group has taken an important step towards the study of cell
membranes under native conditions. In order to preserve the native state of lipid arrangement and proteins as well as the
dynamics and functions of a cell membrane, the sample has to be kept in an aqueous environment, i.e. a buffer solution.
Lately, we have published a proof-of-principle study demonstrating TERS measurement in an aqueous environment. By
using specially prepared TERS tips, the spectrum of a self-assembled monolayer of thiophenolate on a gold surface was
successfully enhanced with both, tip and sample totally immersed in a drop of water41
. This paves the way for TERS
measurements of biological membranes in aqueous buffer solutions. For a correct interpretation of the spectra, the
collection of reference spectra (normal Raman, SERS, and TERS) of relevant compounds will be an important part of
this project.
4. OUTLOOK
Since the first demonstration of the tip-enhancement effect in 200013-15
, several improvements of TERS have been
achieved. Our group for example has published a two-layer coating method for AFM tips, which yields strongly
enhancing TERS tips for excitation wavelengths in the blue to green spectral region 21
and recently has demonstrated an
AFM-TERS experiment working in liquid environment 41
. STM-TERS approaches have been shown to allow even
single-molecule measurements42, 43
. Recent experiments with this approach in the upright setup described above
demonstrate the potential for chemical imaging experiments with a spatial resolution on the order of 10 nm. Furthermore,
several applications of TERS for strong Raman scatterers such as dye molecules13, 21, 42, 43
and carbon nanotubes 44, 45
and
a few ‘real-world’ applications in the biological field have been described29, 30, 38, 39
. Adding chemical contrast to AFM
images by TERS has certainly a high impact in various fields of application. For that reason, several AFM suppliers offer
combinations of AFM with confocal laser microscopes nowadays, and some of their brochures show TERS data.
Nevertheless, TERS is still far from being a technique for chemical routine analysis. This is mainly due to the quality of
used tips. To our knowledge every group working in this field has its own recipe for tip production and its own method
for characterization of tips and calculation of enhancement factors. A comprehensive comparison of different tips is still
missing. Furthermore, there are certainly still many possibilities for optimization of the tips that have not been tried so
far. These include the use of different metals apart from silver or gold. One could even think of using alloys for
improving both, enhancement and robustness of tips. Also, protection layers against contamination and oxidation of the
metal offer room for improvement. Our experience shows that TERS tips need to be freshly prepared before the
measurement and last for about one day in a normal lab environment. After this time, they lose activity due to
contamination and oxidation of the silver. In the future, one part of our research will focus on further improvements of
TERS. The other part will be the application of TERS and related techniques to real-world samples. In the biological
Proc. of SPIE Vol. 7586 758603-10
Downloaded from SPIE Digital Library on 04 May 2010 to 129.132.202.35. Terms of Use: http://spiedl.org/terms
field, we will go on with the investigation of biofilm samples from different environments. The study of lipids and their
layers on solid supports should pave the way for investigations of biological cell surfaces. For a correct interpretation of
the spectra, the buildup of a spectral database containing normal Raman, SER and TER reference spectra of relevant
compounds is certainly necessary.
5. ACKNOWLEDGEMENTS
We gratefully acknowledge the financial support by ETH Zurich and Swiss National Science Foundation (R’EQUIP
206021-117373). We would like to thank the following collaboration partners for providing samples: Dr. Mónica
Sánchez Román (ETH Zurich, Switzerland, H. meridiana biofilms), Dr. Maria Dittrich (EAWAG, Switzerland,
cyanobacteria biofilms and fish sperm cells), and Dr. Michele Pierotti (EAWAG, fish sperm cells).
REFERENCES
[1] Costerton, J. W., Lewandowski, Z., Caldwell, D. E., Korber, D. R. and Lappinscott, H. M., "Microbial
Biofilms", Annu. Rev. Microbiol. 49, 711-745 (1995).
[2] O'Flaherty, V., Moran, A. P., Stoodley, P., Mahony, T. and Lens, P., "Biofilms in Medicine, Industry and
Environmental Biotechnology – Characteristics, Analysis and Control", IWA Publishing, London, Pages
(2003).
[3] Sutherland, I. W., "The Biofilm Matrix – an Immobilized but Dynamic Microbial Environment", Trends
Microbiol. 9, 222-227 (2001).
[4] Stoodley, P., Sauer, K., Davies, D. G. and Costerton, J. W., "Biofilms as Complex Differentiated
Communities", Annu. Rev. Microbiol. 56, 187-209 (2002).
[5] Watnick, P. and Kolter, R., "Biofilm, City of Microbes", J. Bacteriol. 182, 2675-2679 (2000).
[6] Branda, S. S., Vik, A., Friedman, L. and Kolter, R., "Biofilms: The Matrix Revisited", Trends Microbiol. 13,
20-26 (2005).
[7] Sutherland, I. W., "Biofilm Exopolysaccharides: A Strong and Sticky Framework", Microbiology-(UK) 147, 3-
9 (2001).
[8] Semrau, S. and Schmidt, T., "Membrane Heterogeneity – from Lipid Domains to Curvature Effects", Soft
Matter 5, 3176-3186 (2009).
[9] Drews, J., "Drug Discovery: A Historical Perspective", Science 287, 1960-1964 (2000).
[10] Karnovsky, M. J., Kleinfeld, A. M., Hoover, R. L. and Klausner, R. D., "The Concept of Lipid Domains in
Membranes", J. Cell. Biol. 94, 1-6 (1982).
[11] de Bakker, B. I., Bodnár, A., van Dijk, E. M. H. P., Vámosi, G., Damjanovich, S., Waldmann, T. A., van Hulst,
N. F., Jenei, A. and Garcia-Parajo, M. F., "Nanometer-Scale Organization of the Alpha Subunits of the
Receptors for IL2 and IL15 in Human T Lymphoma Cells", J. Cell Sci. 121, 627-633 (2008).
[12] Kraft, M. L., Weber, P. K., Longo, M. L., Hutcheon, I. D. and Boxer, S. G., "Phase Separation of Lipid
Membranes Analyzed with High-Resolution Secondary Ion Mass Spectrometry", Science 313, 1948-1951
(2006).
[13] Stöckle, R. M., Suh, Y. D., Deckert, V. and Zenobi, R., "Nanoscale Chemical Analysis by Tip-Enhanced
Raman Spectroscopy", Chem. Phys. Lett. 318, 131-136 (2000).
[14] Anderson, M. S., "Locally Enhanced Raman Spectroscopy with an Atomic Force Microscope", Appl. Phys.
Lett. 76, 3130-3132 (2000).
[15] Hayazawa, N., Inouye, Y., Sekkat, Z. and Kawata, S., "Metallized Tip Amplification of Near-Field Raman
Scattering", Opt. Commun. 183, 333-336 (2000).
Proc. of SPIE Vol. 7586 758603-11
Downloaded from SPIE Digital Library on 04 May 2010 to 129.132.202.35. Terms of Use: http://spiedl.org/terms
[16] Hartschuh, A., Anderson, N. and Novotny, L., "Near-Field Raman Spectroscopy Using a Sharp Metal Tip", J.
Microsc.-Oxford 210, 234-240 (2003).
[17] Hayazawa, N., Yano, T., Watanabe, H., Inouye, Y. and Kawata, S., "Detection of an Individual Single-Wall
Carbon Nanotube by Tip-Enhanced Near-Field Raman Spectroscopy", Chem. Phys. Lett. 376, 174-180 (2003).
[18] Pettinger, B., Ren, B., Picardi, G., Schuster, R. and Ertl, G., "Tip-Enhanced Raman Spectroscopy (TERS) of
Malachite Green Isothiocyanate at Au(111): Bleaching Behavior Under the Influence of High Electromagnetic
Fields", J. Raman Spectrosc. 36, 541-550 (2005).
[19] Schmid, T., Yeo, B. S., Zhang, W. and Zenobi, R., "Use of Tip-Enhanced Vibrational Spectroscopy for
Analytical Applications in Chemistry, Biology and Materials Science", in: Kawata, S. and Shalaev, V. M.
(eds.), "Tip Enhancement: Advances in Nano-Optics and Nano-Photonics", Elsevier B.V., Amsterdam, 115-155
(2007).
[20] Vannier, C., Yeo, B. S., Melanson, J. E. and Zenobi, R., "Multifunctional Microscope for Far-Field and Tip-
Enhanced Raman Spectroscopy", Rev. Sci. Instrum. 77, 023104 (2006).
[21] Yeo, B. S., Schmid, T., Zhang, W. and Zenobi, R., "Towards Rapid Nanoscale Chemical Analysis using Tip-
Enhanced Raman Spectroscopy with Ag-Coated Dielectric Tips", Anal. Bioanal. Chem. 387, 2655-2662 (2007).
[22] Schmid, T., Burkhard, J., Yeo, B. S., Zhang, W. H. and Zenobi, R., "Towards Chemical Analysis of
Nanostructures in Biofilms I: Imaging of Biological Nanostructures", Anal. Bioanal. Chem. 391, 1899-1905
(2008).
[23] Sánchez-Román, M., Vasconcelos, C., Schmid, T., Dittrich, M., McKenzie, J. A., Zenobi, R. and Rivadeneyra,
M. A., "Aerobic Microbial Dolomite at the Nanometer Scale: Implications for the Geologic Record", Geology
36, 879-882 (2008).
[24] de Gelder, J., de Gussem, K., Vandenabeele, P. and Moens, L., "Reference Database of Raman Spectra of
Biological Molecules", J. Raman Spectrosc. 38, 1133-1147 (2007).
[25] Chourpa, I., Carpentier, P., Maingault, P. and Dubois, P., "Structural Characterization of Pharmaceutical Fibers
of Alginate Salts by Confocal Raman Spectral Imaging", Proc. SPIE 3608, 48-54 (1999).
[26] Chourpa, I., Carpentier, P., Maingault, P., Fetissoff, F. and Dubois, P., "Raman Probing of Molecular
Interactions of Alginate Biopolymers with Cells", Proc. SPIE 3918, 166-173 (2000).
[27] Martinsen, A., Skjakbraek, G. and Smidsrod, O., "Alginate As Immobilization Material .1. Correlation Between
Chemical And Physical-Properties Of Alginate Gel Beads", Biotechnol. Bioeng. 33, 79-89 (1989).
[28] Tonnesen, H. H. and Karlsen, J., "Alginate in Drug Delivery Systems", Drug Dev. Ind. Pharm. 28, 621-630
(2002).
[29] Schmid, T., Messmer, A., Yeo, B. S., Zhang, W. H. and Zenobi, R., "Towards Chemical Analysis of
Nanostructures in Biofilms II: Tip-Enhanced Raman Spectroscopy of Alginates", Anal. Bioanal. Chem. 391,
1907-1916 (2008).
[30] Yeo, B. S., Madler, S., Schmid, T., Zhang, W. H. and Zenobi, R., "Tip-Enhanced Raman Spectroscopy Can See
More: The Case of Cytochrome C", J. Phys. Chem. C 112, 4867-4873 (2008).
[31] Kudelski, A. and Pettinger, B., "SERS on Carbon Chain Segments: Monitoring Locally Surface Chemistry",
Chem. Phys. Lett. 321, 356-362 (2000).
[32] Ferrari, A. C. and Robertson, J., "Resonant Raman Spectroscopy of Disordered, Amorphous, and Diamondlike
Carbon", Phys. Rev. B 64, 075414 (2001).
[33] Swanson, W. J. and Vacquier, V. D., "The Rapid Evolution of Reproductive Proteins", Nat. Rev. Genet. 3, 137-
144 (2002).
[34] Maan, M. E., Eshuis, B., Haesler, M. P., Schneider, M. V., van Alphen, J. J. M. and Seehausen, O., "Color
Polymorphism and Predation in a Lake Victoria Cichlid Fish", Copeia 621-629 (2008).
Proc. of SPIE Vol. 7586 758603-12
Downloaded from SPIE Digital Library on 04 May 2010 to 129.132.202.35. Terms of Use: http://spiedl.org/terms
[35] Bishop, C. M., "Pattern Recognition and Machine Learning", Springer, New York, Pages (2007).
[36] Balabin, R. M. and Safieva, R. Z., "Motor Oil Classification by Base Stock and Viscosity Based on Near
Infrared (NIR) Spectroscopy Data", Fuel 87, 2745-2752 (2008).
[37] Peticolas, W. L., Patapoff, T. W., Thomas, G. A., Postlewait, J. and Powell, J. W., "Laser Raman Microscopy of
Chromosomes in Living Eukaryotic Cells: DNA Polymorphism In Vivo", J. Raman Spectrosc. 27, 571-578
(1996).
[38] Böhme, R., Richter, M., Cialla, D., Rösch, P., Deckert, V. and Popp, J., "Towards a Specific Characterisation of
Components on a Cell Surface – Combined TERS-Investigations of Lipids and Human Cells", J. Raman
Spectrosc. 40, 1452-1457 (2009).
[39] Neugebauer, U., Schmid, U., Baumann, K., Ziebuhr, W., Kozitskaya, S., Deckert, V., Schmitt, M. and Popp, J.,
"Towards a Detailed Understanding of Bacterial Metabolism – Spectroscopic Characterization of
Staphylococcus epidermidis", Chemphyschem 8, 124-137 (2007).
[40] Cherney, D. P., Conboy, J. C. and Harris, J. M., "Optical-Trapping Raman Microscopy Detection of Single
Unilamellar Lipid Vesicles", Anal. Chem. 75, 6621-6628 (2003).
[41] Schmid, T., Yeo, B. S., Leong, G., Stadler, J. and Zenobi, R., "Performing Tip-Enhanced Raman Spectroscopy
in Liquids", J. Raman Spectrosc. 40, 1392-1399 (2009).
[42] Zhang, W., Yeo, B. S., Schmid, T. and Zenobi, R., "Single Molecule Tip-Enhanced Raman Spectroscopy with
Silver Tips", J. Phys. Chem. C 111, 1733-1738 (2007).
[43] Steidtner, J. and Pettinger, B., "Tip-Enhanced Raman Spectroscopy and Microscopy on Single Dye Molecules
with 15 nm Resolution", Phys. Rev. Lett. 100, 236101 (2008).
[44] Cancado, L. G., Hartschuh, A. and Novotny, L., "Tip-Enhanced Raman Spectroscopy of Carbon Nanotubes", J.
Raman Spectrosc. 40, 1420-1426 (2009).
[45] Hartschuh, A., "Tip-Enhanced Near-Field Optical Microscopy", Angew. Chem.-Int. Ed. 47, 2-18 (2008).
Proc. of SPIE Vol. 7586 758603-13
Downloaded from SPIE Digital Library on 04 May 2010 to 129.132.202.35. Terms of Use: http://spiedl.org/terms