Embed Size (px)
Citation preview
MINISTRY OF AVIATION
AERONAUTICAL RESEARCH COUNCIL REPORTS AND MEMORANDA
R. & M. No. 3316
Tip-Clearance Flow and Losses for an Compressor Blade
By B. LAKSHMINARAYANA and J. H. HORLOCK
DEPARTMENT OF ~/~ECHANICAL ENGINEERING, THE UNIVERSITY OF LIVERPOOL
Isolated
LONDON: HER MAJESTY,S STATIONERY OFFICE I963
TEN SHILLINGS NET
Tip-Clearance Flow and Losses for an.::,Isolated Compressor Blade
By B. LAKSttMINARAYANA and J. H. HORLOCK
DEPARTMENT OF MECHANICAL ENGINEERING, THE UNIVERSITY OF LIVERPOOL
Reports and Memoranda No. 33z6 *
June, z962
Summary. The effect of a gap in an isolated aerofoil spanning a tunnel has been investigated both theoretically and
experimentally. Two flow models have been suggested; one is valid for moderately large gap/chord ratios and the other for the small gap/chord ratios used in turbomachinery practice. The latter model takes into account the lift retained at the tip due to circulation bridging the gap.
At small gap/chord ratios the decrease in total lift and the increase in drag are very small and the flow disturbance at the tip has very little effect on the pressure distributions at small distances from the tip.
Flow visualization and vorticity measurements indicate that the position and strength of the tip vortex varies with the gap size. At small gap/chord ratios, the leakage flow is very nearly perpendicular to the chord. It forms a vortex sheet which rolls up into a single discrete vortex at some distance from the suction surface and its spanwise distance from the tip is very small. At high gap/chord ratios the leakage flow takes place at an angle to the chord. It shows a tendency to roll up into a single vortex immediately it reaches suction surface and the core of this vortex is located a little inwards from the tip.
1. Introduction.
The leakage flow through a tip-clearance region, together with the consequent decrease in lift
and increase in drag, has been one of the known causes of turbine and compressor inefficiency.
Without a complete understanding of component losses the high efficiency required for modern turbomachines cannot be realized.
I t is only relatively recently that an at tempt has been made to bridge the gap between the older
empirical methods in turbomachinery and those based on aerodynamic concepts. Th e aim of the
investigation described in this paper is to show how 'aerofoil theory ' may be used to predict the
nature of the tip-clearance flow and the associated losses. Theoretical predictions of t ip-clearance
flows have generally followed two lines of approach. Betz 1 evaluates the losses f rom the shed vortices
due to the gradient in circulation distribution. Rains ~ and Vavra 3 estimate losses on the assumption
that a leakage flow, resulting f rom the pressure difference across the blade tip, occurs in an annulus
of height equal to clearance height and that the leakage flow which occurs, perpendicular to the
chord, rolls up into a vortex whose energy cannot be recovered. T h e former approach assumes the
flow direction to be parallel to the chord line. This assumption agrees well With observed tip- clearance flow patterns for large gap/chord ratios.
* Replaces A.R.C. 23,818.
The essential character of this investigation is to establish the validity of the assumption that a wing spanning a tunnel, but with a narrow central slot, gives a fair representation of clearance flows in turbomachines. The plane of symmetry through the slot represents the wall at the end of a blade. In the absence of any variation in approach velocity there is no secondary flow and the effects
of tip clearance only may be studied. A theoretical and experimental study is made of the flow over such a split aerofoil placed in a
wind tunnel of rectangular cross-section. The length of the gap was varied and, at each gap, the lift and drag were measured and the nature of leakage flow observed. The theory is developed for
inviscid, incompressible flow. The result of this investigation suggests that Glauert's type of analysis (Appendix I) can be
applied only at larger values of A, (gap/chord ratio). At smaller A, the lifting-line theory is not
adequate. For viscous effects, the finite thickness and chord of the blade, and the consequent retention of the lift at the tip, have to be considered. An analysis (Appendix II) based on the assumption that the circulation is uniform along the blade and that only a part of the bound circulation is shed off at the tip gives values of induced drag that agree closely with experimentally observed values. This
analysis is recommended for very low gap/chord ratios.
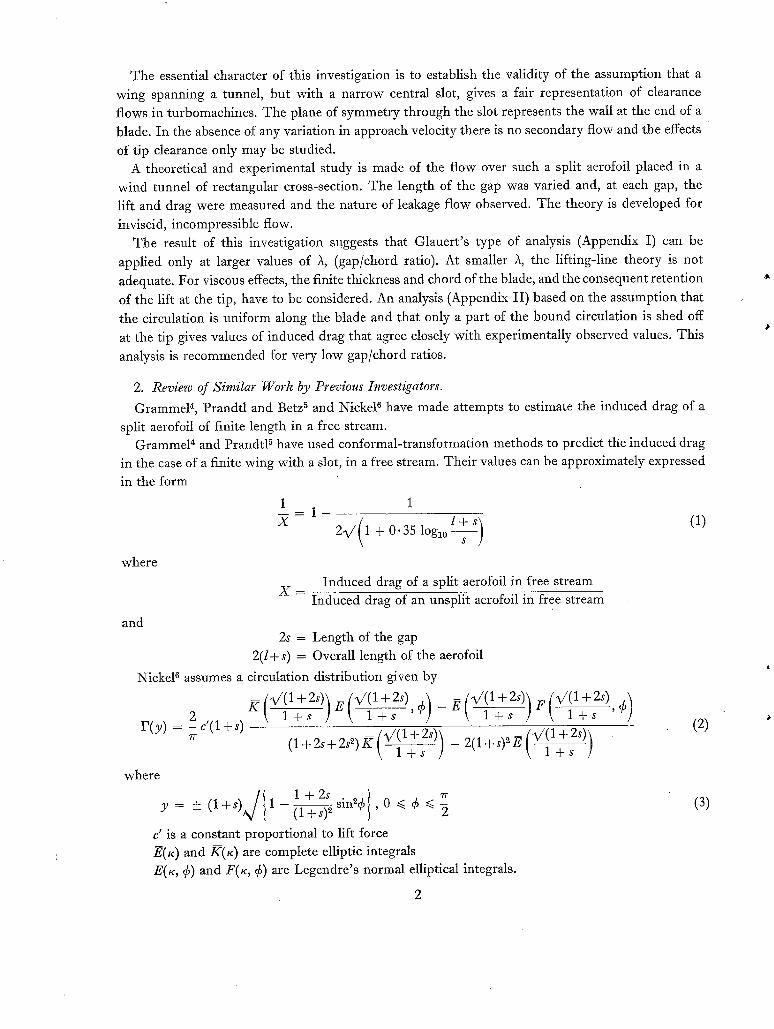
2. Review of Similar Work by Previous Investigators. Grammel a, Prandtl and Betz 5 and Nickel 6 have made attempts to estimate the induced drag of a
split aerofoil of finite length in a free stream. GrammeP and PrandtP have used conformal-transformation methods to predict the induced drag
in the case of a finite wing with a slot, in a free stream. Their values can be approximately expressed
in the form
1 1
X - 1 - 2,v/(1 + 0.35 lOgl0/__+s_S ) (1)
where
and
X = Induced drag of a split aerofoil in free stream
Induced drag of an unsplit aerofoil in free stream
2s = Length of the gap 2(l+ s) = Overall length of the aerofoil
Nickel 6 assumes a circulation distribution given by
K t g~-s I N \ gL~_s , \ gL~s ] 1 [~-s ' r ( y ) = _ 2 dO+s )
where
y =
77"
,/l l l + 2 s sine $ 0 ~< q~ ~<-~ + ( l+s ) 1 (l+s)~ ,
c' is a constant proportional to lift force R(K) and/~(K) are complete elliptic integrals E(K, $) and F(Jc, (o) are Legendre's normal elliptical integrals.
2
(2)
(3)
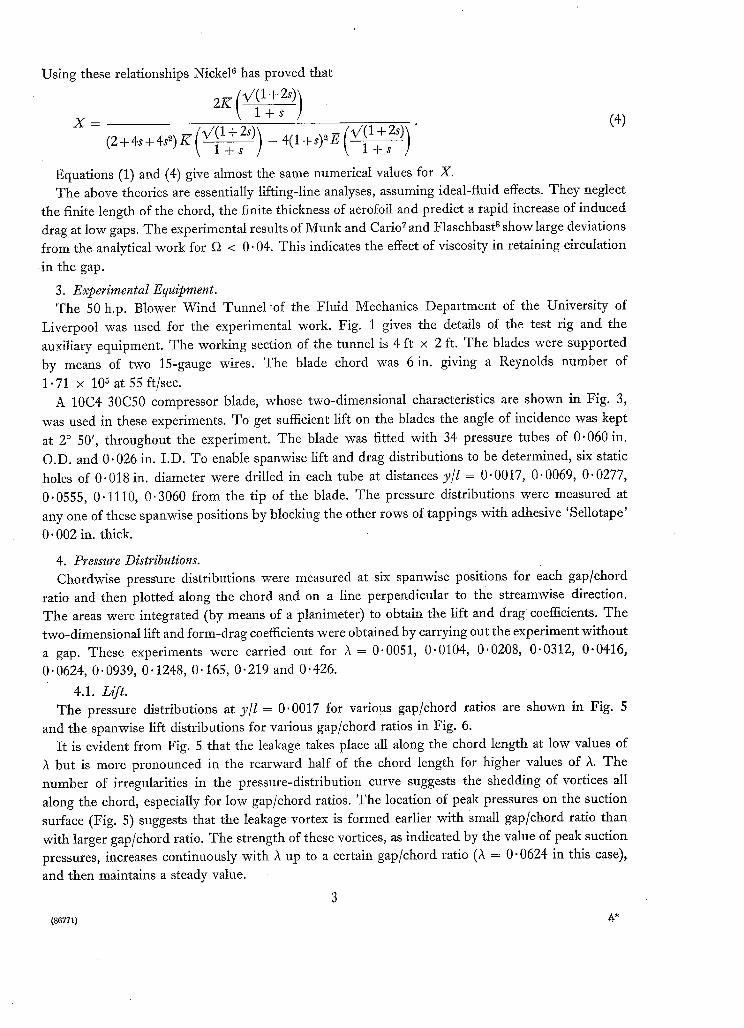
Using these relationships NickeP has proved that
2K \ l + s / x = (4)
• A a s ) \ ( 2 + 4 s + e s ) ~ i t s ) - 4 ( l + s ) ~ E \ i + s ]
Equations (1) and (4) give almost the same numerical values for X. The above theories are essentially lifting-line analyses, assuming ideal-fluid effects. They neglect
the finite length of the chord, the finite thickness of aerofoil and predict a rapid increase of induced drag at low gaps. The experimental results of Munk and Cario 7 and Flaschbast 8 show large deviations from the analytical work for fl < 0.04. This indicates the effect of viscosity in retaining circulation
in the gap.
3. Experimental Equipment. The 50 h.p. Blower Wind Tunnel o f the Fluid Mechanics Department of the University of
Liverpool was used for the experimental work. Fig. 1 gives the details of the test rig and the auxiliary equipment. The working section of the tunnel is 4 ft x 2 ft. The blades were supported by means of two 15-'gauge wires. The blade chord was 6 in. giving a Reynolds number of
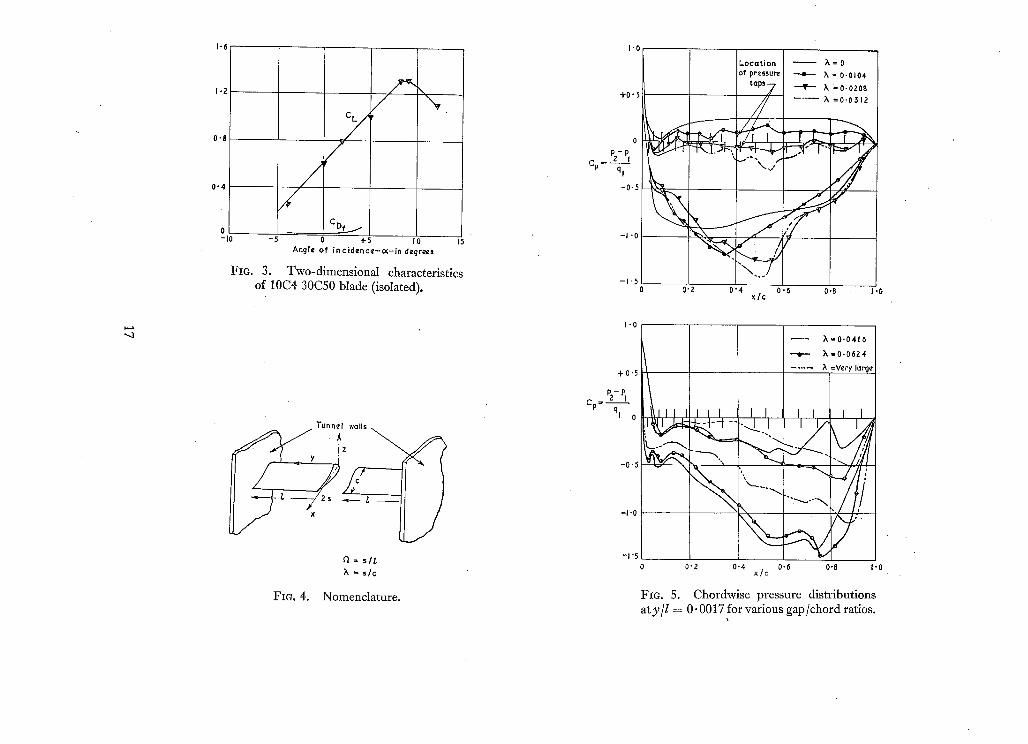
1.71 x 10⁵ at 55 ft/sec. A 10C4 30C50 compressor blade, whose two-dimensional characteristics are shown in Fig. 3,
was used in these experiments. To get sufficient lift on the blades the angle of incidence was kept
at 2 ° 50', throughout the experiment. The blade was fitted with 34 pressure tubes of 0.060 in. O.D. and 0. 026 in. I.D. To enable spanwise lift and drag distributions to be determined, six static
holes of 0. 018 in. diameter were drilled in each tube at distances y/l = 0. 0017, 0. 0069, 0. 0277, 0.0555, 0. 1110, 0.3060 from the tip of the blade. The pressure distributions were measured at any one of these spanwise positions by blocking the other rows of tappings with adhesive 'Sellotape'
0. 002 in. thick.
4. Pressure Distributions. Chordwise pressure distributions were measured at six spanwise positions for each gap/chord
ratio and then plotted along the chord and on a line perpendicular to the streamwise direction. The areas were integrated (by means of a planimeter) to obtain the lift and drag coefficients. The two-dimensional lift and form-drag coefficients were obtained by carrying out the experiment without a gap. These experiments were carried out for A = 0.0051, 0.0104, 0.0208, 0.0312, 0.0416,
0. 0624, 0. 0939, 0' 1248, 0" 165, 0" 219 and 0. 426.
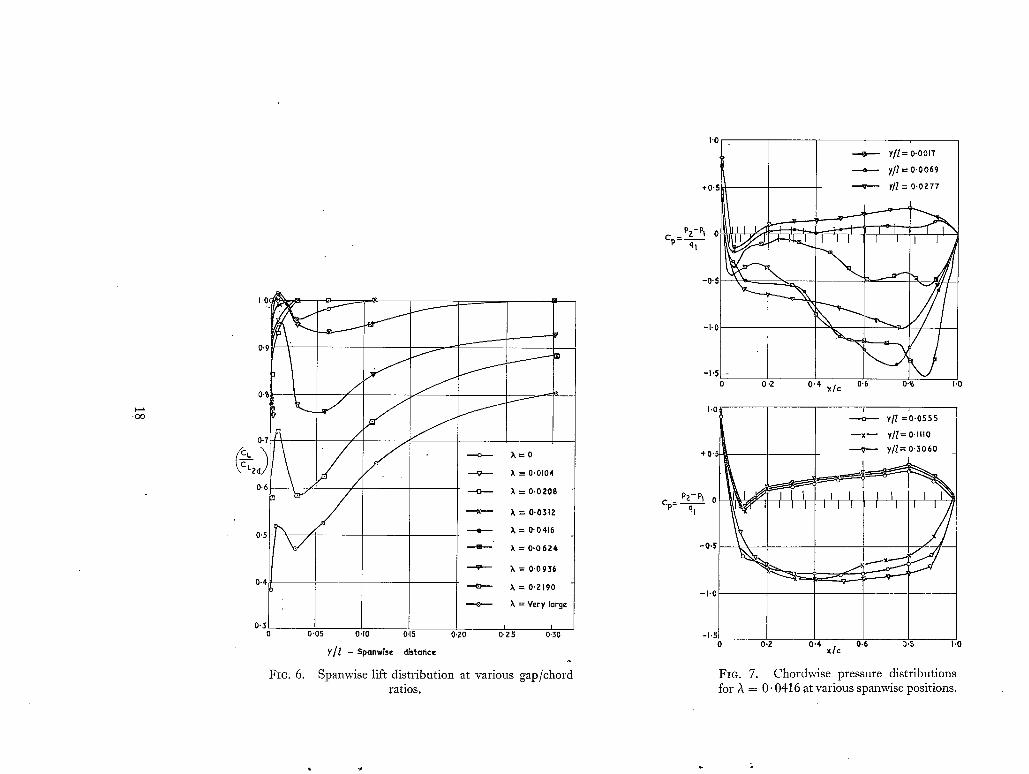
4.1. Lift. The pressure distributions at y/l = 0.0017 for various gap/chord ratios are shown in Fig. 5
and the spanwise lift distributions for various gap/chord ratios in Fig. 6. It is evident from Fig. 5 that the leakage takes place ali along the chord length at low values of
A but is more pronounced in the rearward half of the chord length for higher values of A. The number of irregularities in the pressure-distribution curve suggests the shedding of vortices all along the chord, especially for low gap/chord ratios. The location of peak pressures on the suction surface (Fig. 5) suggests that the leakage vortex is formed earlier with small gap/chord ratio than with larger gap/chord ratio. The strength of these vortices, as indicated by the value of peak suction pressures, increases continuously with A up to a certain gap/chord ratio (A = 0.0624 in this case),
and then maintains a steady value.
3
(86771) 4*
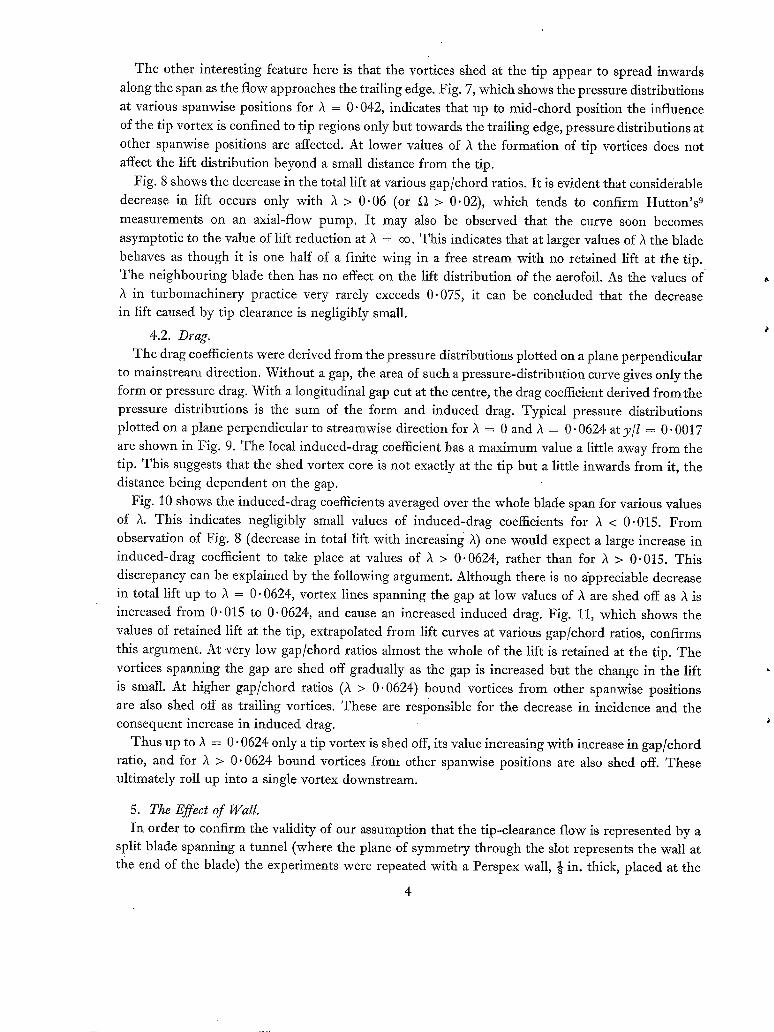
The other interesting feature here is that the vortices shed at the tip appear to spread inwards
along the span as the flow approaches the trailing edge. Fig. 7, which shows the pressure distributions at various spanwise positions for A = 0.042, indicates that up to mid-chord position the influence of the tip vortex is confined to tip regions only but towards the trailing edge, pressure distributions at
other spanwise positions are affected. At lower values of ~ the formation of tip vortices does not affect the lift distribution beyond a small distance from the tip.
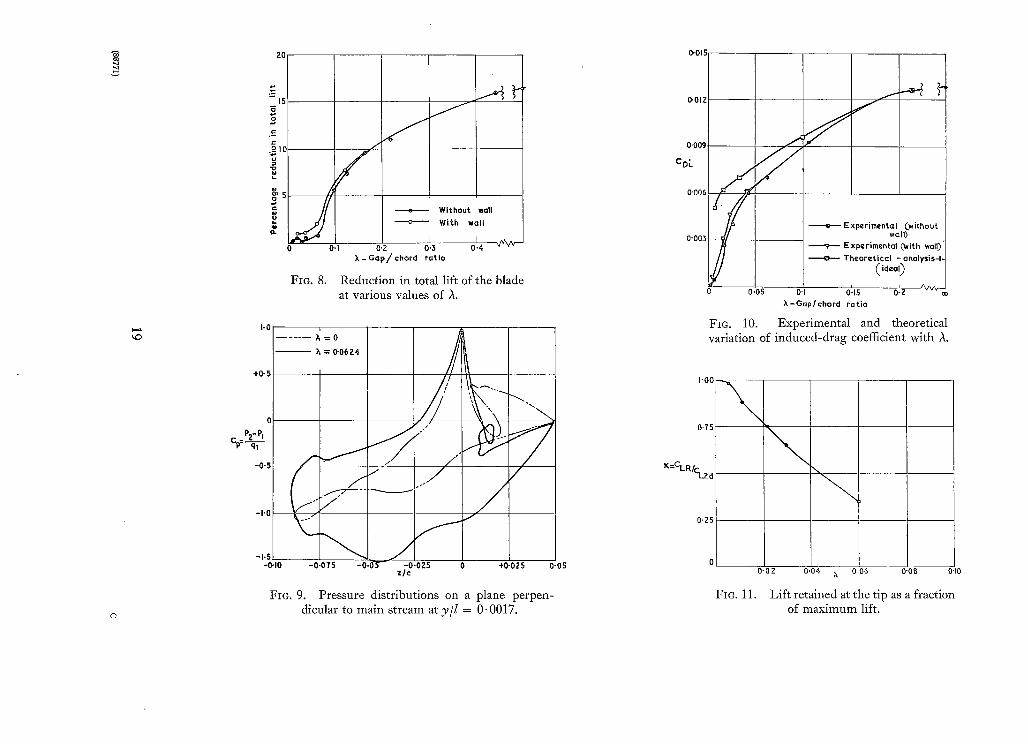
Fig. 8 shows the decrease in the total lift at various gap/chord ratios. It is evident that considerable
decrease in lift occurs only with ~ > 0.06 (or f~ > 0.02), which tends to confirm Hutton's 9
measurements on an axial-flow pump. It may also be observed that the curve soon becomes asymptotic to the value of lift red,ration at ~ = co. This indicates that at larger values of 2t the blade
behaves as though it is one half of a finite wing in a free stream with no retained lift at the tip. The neighbouring blade then has no effect on the lift distribution of the aerofoil. As the values of Z in turbomachinery practice very rarely exceeds 0.075, it can be concluded that the decrease in lift caused by tip clearance is negligibly small.
4.2. Drag. The drag coefficients were derived from the pressure distributions plotted on a plane perpendicular
to mainstream direction. Without a gap, the area of such a pressure-distribution curve gives only the form or pressure drag. With a longitudinal gap cut at the centre, the drag coefficient derived fromthe pressure distributions is the sum of the form and induced drag. Typical pressure distributions plotted on a plane perpendicular to streamwise direction for )t = 0 and ;t = 0. 0624 at y/l = 0. 0017
are shown in Fig. 9. The local induced-drag coefficient has a maximum value a little away from the tip. This suggests that the shed vortex core is not exactly at the tip but a little inwards from it, the distance being dependent on the gap.
Fig. 10 shows the induced-drag coefficients averaged over the whole blade span for various values of ;~. This indicates negligibly small values of induced-drag coefficients for A < 0.015. From observation of Fig. 8 (decrease in total lift with increasing h) one would expect a large increase in induced-drag coefficient to take place at values of h > 0. 0624, rather than for ~ > 0. 015. This discrepancy can be explained by the following argument. Although there is no appreciable decrease in total lift up to )t = 0.0624, vortex lines spanning the gap at low values of A are shed off as )t is increased from 0.015 to 0.0624, and cause an increased induced drag. Fig. 11, which shows the
values of retained lift at the tip, extrapolated from lift curves at various gap/chord ratios, confirms
this argument. At very low gap/chord ratios almost the whole of the lift is retained at the tip. The vortices spanning the gap are shed off gradually as the gap is increased but the change in the lift
is small. At higher gap/chord ratios (~ > 0' 0624) bound vortices from other spanwise positions are also shed off as trailing vortices. These are responsible for the decrease in incidence and the consequent increase in induced drag.
Thus up to A = 0. 0624 only a tip vortex is shed off, its value increasing with increase in gap/chord ratio, and for ;~ > 0. 0624 bound vortices from other spanwise positions are also shed off. These ultimately roll up into a single vortex downstream.
5. The Effect of Wall. In order to confirm the validity of our assumption that the tip-clearance flow is represented by a
split blade spanning a tunnel (where the plane of symmetry through the slot represents the wall at the end of the blade) the experiments were repeated with a Perspex wall, ~ in. thick, placed at the
4
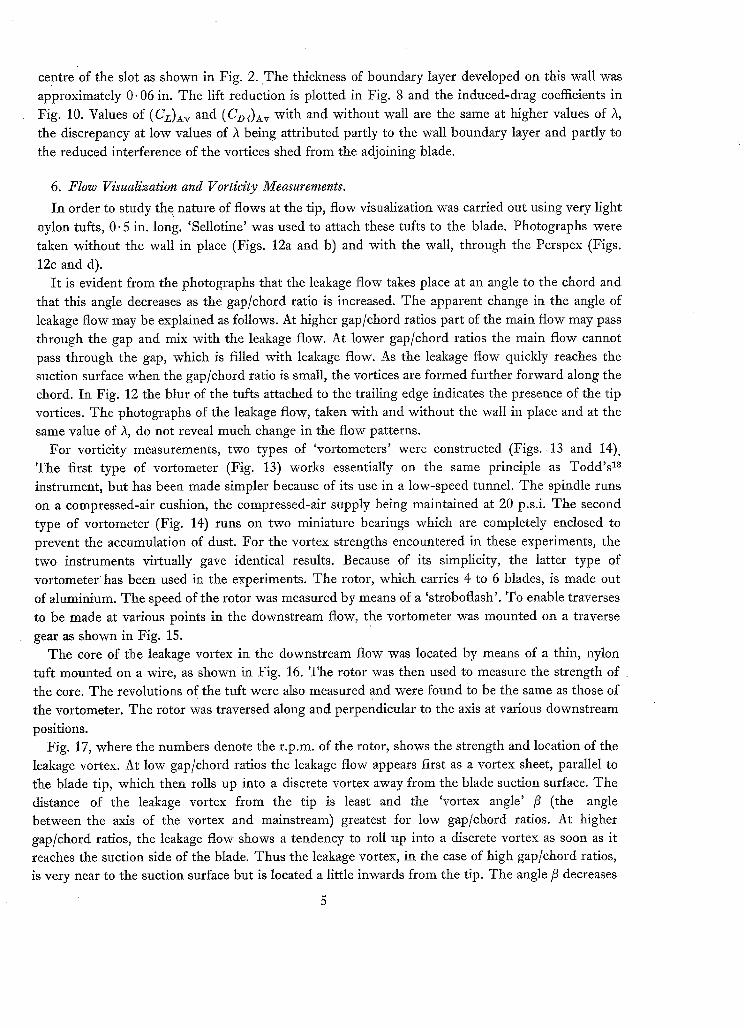
centre of the slot as shown in Fig. 2. The thickness of boundary layer developed on this wall was approximately 0.06 in. The lift reduction is plotted in Fig. 8 and the induced-drag coefficients in
Fig. 10. Values of (CL)Av and (CD~)~ v with and without wall are the same at higher values of A,
the discrepancy at low values of A being attributed partly to the wall boundary layer and partly to
the reduced interference of the vortices shed from the adjoining blade.
6. Flow Visualization and Vorticity Measurements.
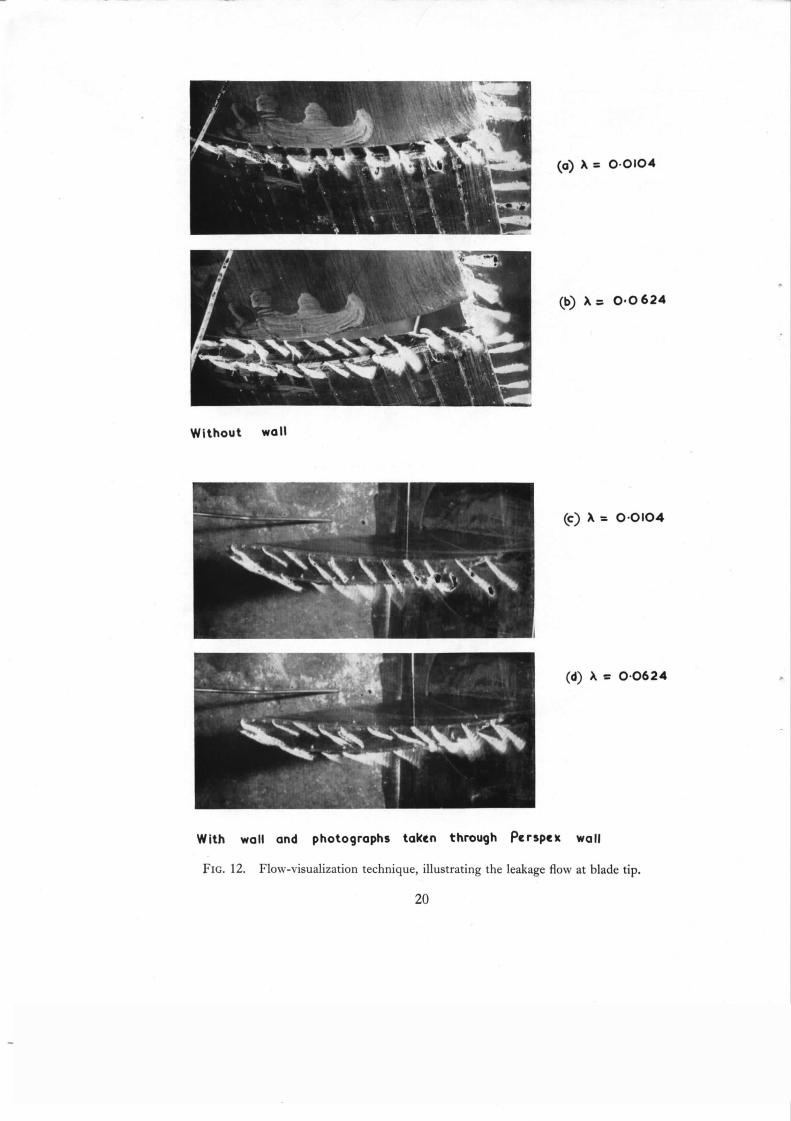
In order to study the nature of flows at the tip, flow visualization was carried out using very light
nylon tufts, 0.5 in. long. 'Sellotine' was used to attach these tufts to the blade. Photographs were
taken without the wall in place (Figs. 12a and b) and with the wall, through the Perspex (Figs.
12c and d). It is evident from the photographs that the leakage flow takes place at an angle to the chord and
that this angle decreases as the gap/chord ratio is increased. The apparent change in the angle of
leakage flow may be explained as follows. At higher gap/chord ratios part of the main flow may pass through the gap and mix with the leakage flow. At lower gap/chord ratios the main flow cannot pass through the gap, which is filled with leakage flow. As the leal~age flow quickly reaches the suction surface when the gap/chord ratio is small, the vortices are formed further forward along the chord. In Fig. 12 the blur of the tufts attached to the trailing edge indicates the presence of the tip vortices. The photographs of the leakage flow, taken with and without the wall in place and at the same value of A, do not reveal much change in the flow patterns.
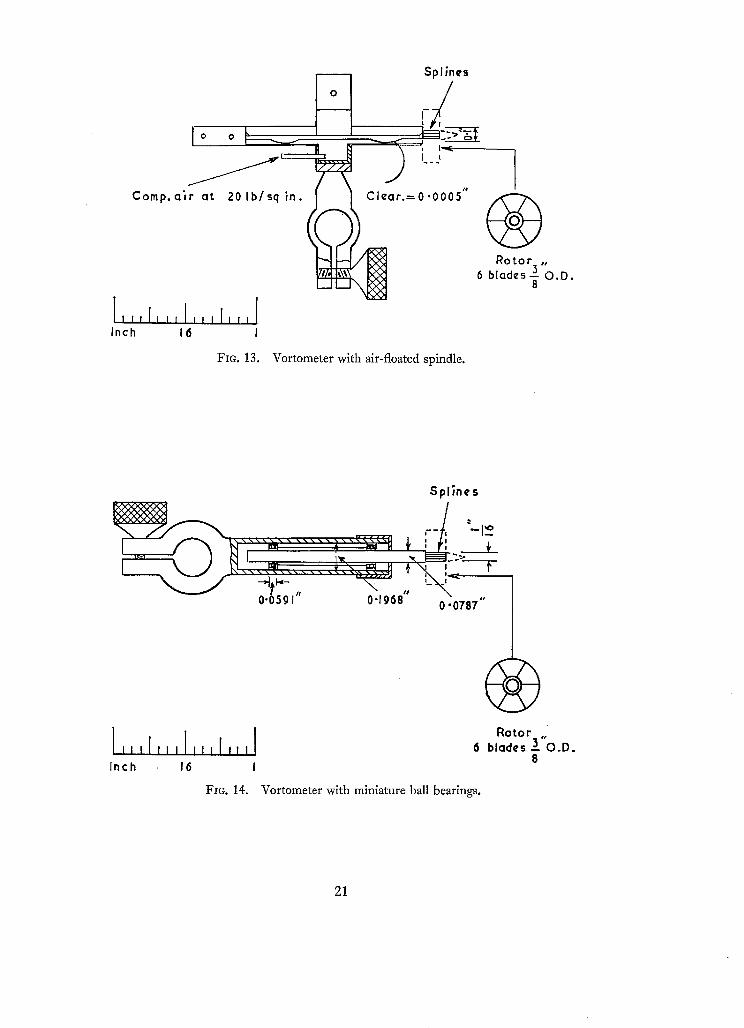
For vorticity measurements, two types of 'vortometers' were constructed (Figs . 13 and 14). The first type of vortometer (Fig. 13) works essentially on the same principle as Todd's 1~ instrument, but has been made simpler because of its use in a low-speed tunnel. The spindle runs on a compressed-air cushion, the compressed-air supply being maintained at 20 p.s.i. The second type of vortometer (Fig. 14) runs on two miniature bearings which are completely enclosed to
prevent the accumulation of dust. For the vortex strengths encountered in these experiments, the two instruments virtually gave identical results. Because of its simplicity, the latter type of
vortometer has been used in the experiments. The rotor, which carries 4 to 6 blades, is made out of aluminium. The speed of the rotor was measured by means of a 'stroboflash'. To enable traverses
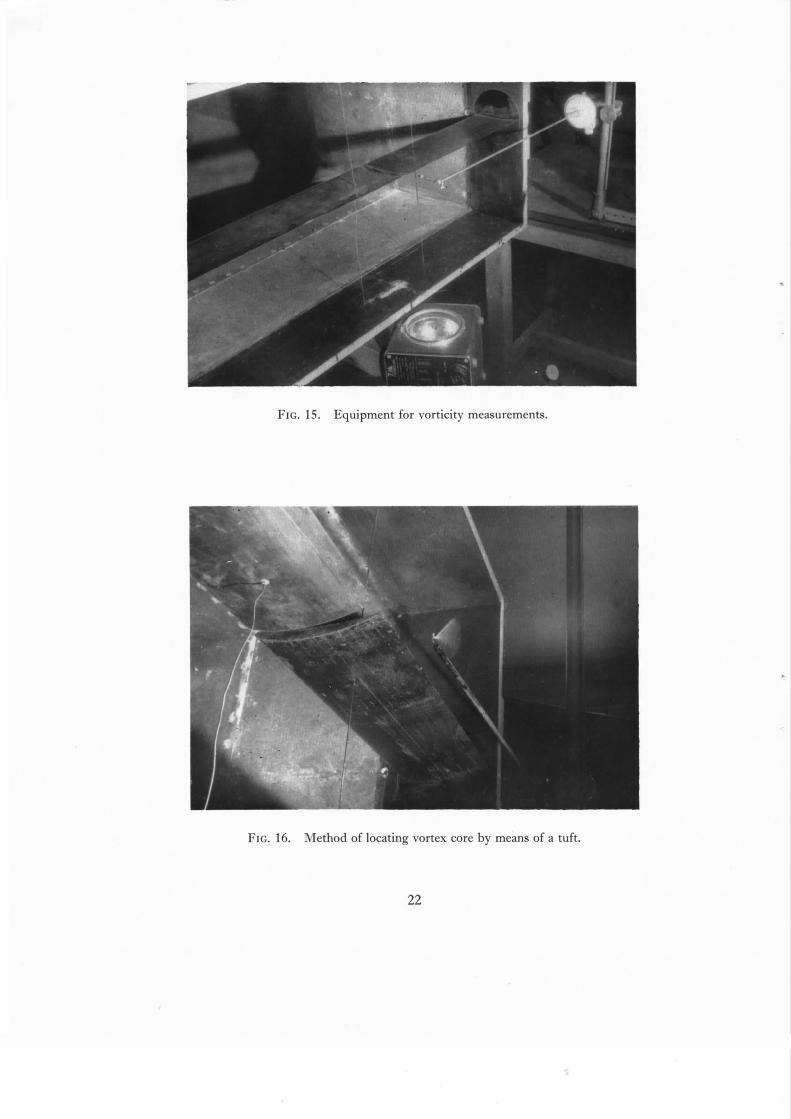
to be made at various points in the downstream flow, the vortometer was mounted on a traverse
gear as shown in Fig. 15. The core of the leakage vortex in the downstream flow was located by means of a thin, nylon
tuft mounted on a wire, as shown in Fig. 16. The rotor was then used to measure the strength of
the core. The revolutions of the tuft were also measured and were found to be the same as those of the vortometer. The rotor was traversed along and perpendicular to the axis at various downstream
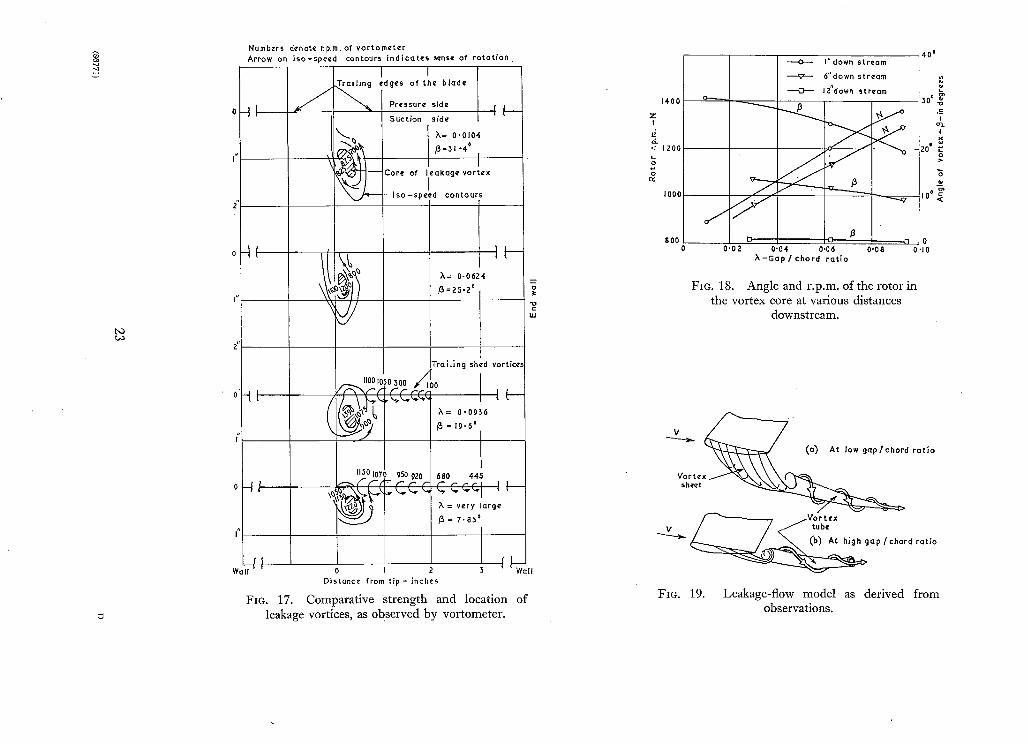
positions. Fig. 17, where the numbers denote the r.p.m, of the rotor, shows the strength and location of the
leakage vortex. At low gap/chord ratios the leakage flow appears first as a vortex sheet, parallel to the blade tip, which then rolls up into a discrete vortex away from the blade suction surface. The distance of the leakage vortex from the tip is least and the 'vortex angle' /9 (the angle between the axis of the vortex and mainstream) greatest for low gap/chord ratios. At higher gap/chord ratios, the leakage flow shows a tendency to roll up into a discrete vortex as soon as it reaches the suction side of the blade. Thus the leakage vortex, in the case of high gap/chord ratios, is very near to the suction surface but is located a little inwards from the tip. The angle fi decreases
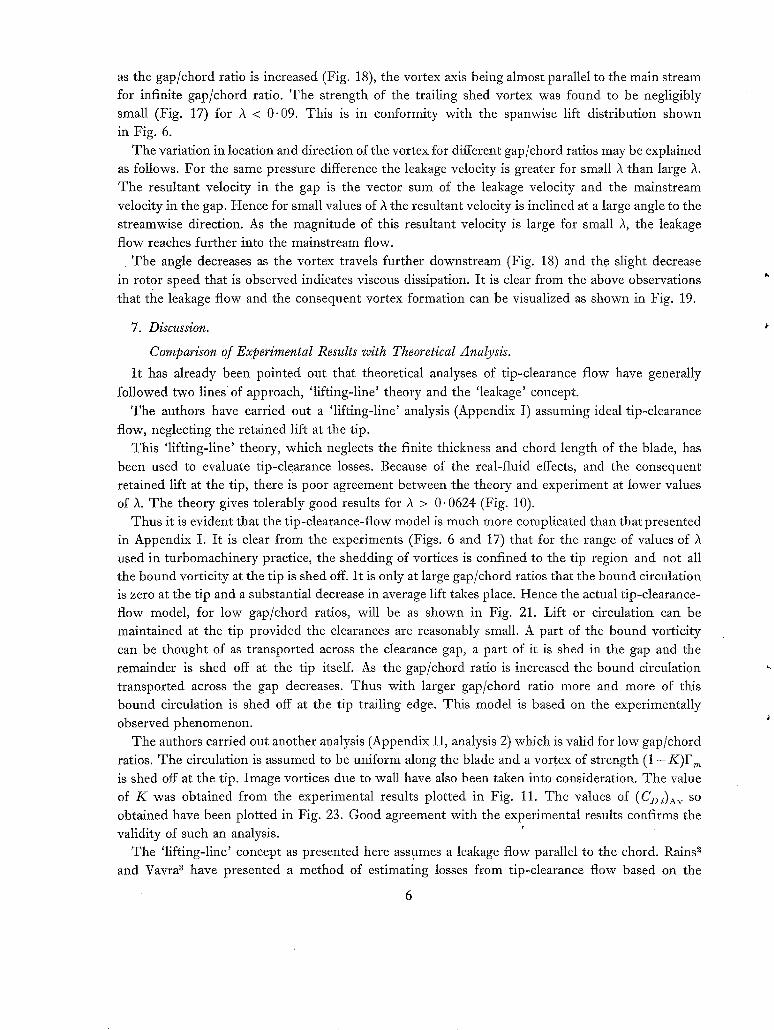
as the gap/chord ratio is increased (Fig. 18), the vortex axis being almost parallel to the main stream for infinite gap/chord ratio. The strength of the trailing shed vortex was found to be negligibly small (Fig. 17) for )t < 0" 09. This is in conformity with the spanwise lift distribution shown in Fig. 6.
The variation in location and direction of the vortex for different gap/chord ratios may be explained as follows. For the same pressure difference the leakage velocity is greater for small ;~ than large )t. The resultant velocity in the gap is the vector sum of the leakage velocity and the mainstream
velocity in the gap. Hence for small values of 2t the resultant velocity is inclined at a large angle to the streamwise direction. As the magnitude of this resultant velocity is large for small ;~, the leakage flow reaches further into the mainstream flow.
The angle decreases as the vortex travels further downstream (Fig. 18) and the slight decrease
in rotor speed that is observed indicates viscous dissipation. It is clear from the above observations that the leakage flow and the consequent vortex formation can be visualized as shown in Fig. 19.
7. Discussion.
Comparison of Experimental Results with Theoretical Analysis.
It has already been pointed out that theoretical analyses of tip-clearance flow have generally
followed two lines of approach, 'lifting-line' theory and the 'leakage' concept. The authors have carried out a 'lifting-line' analysis (Appendix I) assuming ideal tip-clearance
flow, neglecting the retained lift at the tip. This 'lifting-line' theory, which neglects the finite thickness and chord length of the blade, has
been used to evaluate tip-clearance losses. Because of the real-fluid effects, and the consequent retained lift at the tip, there is poor agreement between the theory and experiment at lower values of )t. The theory gives tolerably good results for Z > 0. 0624 (Fig. 10).
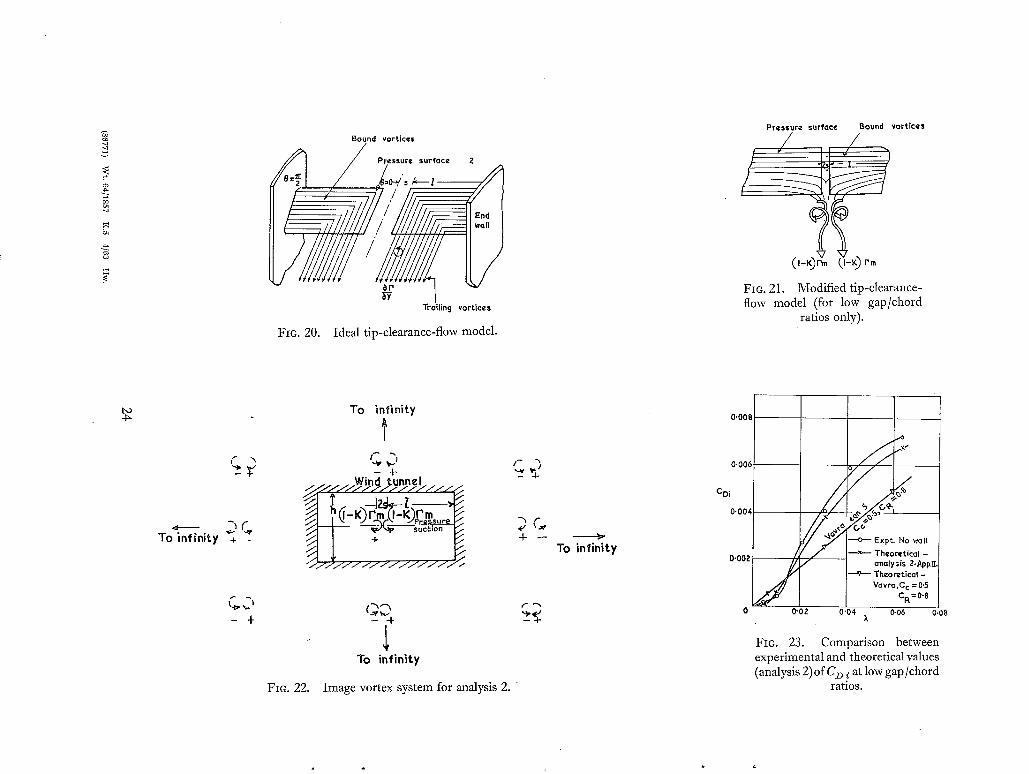
Thus it is evident that the tip-clearance-flow model is much more complicated than that presented in Appendix I. It is clear from the experiments (Figs. 6 and 17) that for the range of values of )t used in turbomachinery practice, the shedding of vortices is confined to the tip region and not all the bound vorticity at the tip is shed off. It is only at large gap/chord ratios that the bound circulation is zero at the tip and a substantial decrease in average lift takes place. Hence the actual tip-clearance- flow model, for low gap/chord ratios, will be as shown in Fig. 21. Lift or circulation can be maintained at the tip provided the clearances are reasonably small. A part of the bound vorticity can be thought of as transported across the clearance gap, a part of~ it is shed in the gap and the remainder is shed off at the tip itself. As the gap/chord ratio is increased the bound circulation transported across the gap decreases. Thus with larger gap/chord ratio more and more of this bound circulation is shed off at the tip trailing edge. This model is based on the experimentally observed phenomenon.
The authors carried out another analysis (Appendix II, analysis 2) which is valid for low gap/chord ratios. The circulation is assumed to be uniform along the blade and a vortex of strength (1 - K ) F m is shed off at the tip. Image vortices due to wall have also been taken into consideration. The value of K was obtained from the experimental results plotted in Fig. 11. The values of (Cxoi)A~ so
obtained have been plotted in Fig. 23. Good agreement with the experimental results confirms the validity of such an analysis.
The 'lifting-line' concept as presented here assumes a leakage flow parallel to the chord. Rains 2 and Vavra 3 have presented a method of estimating losses from tip-clearance flow based on the
6
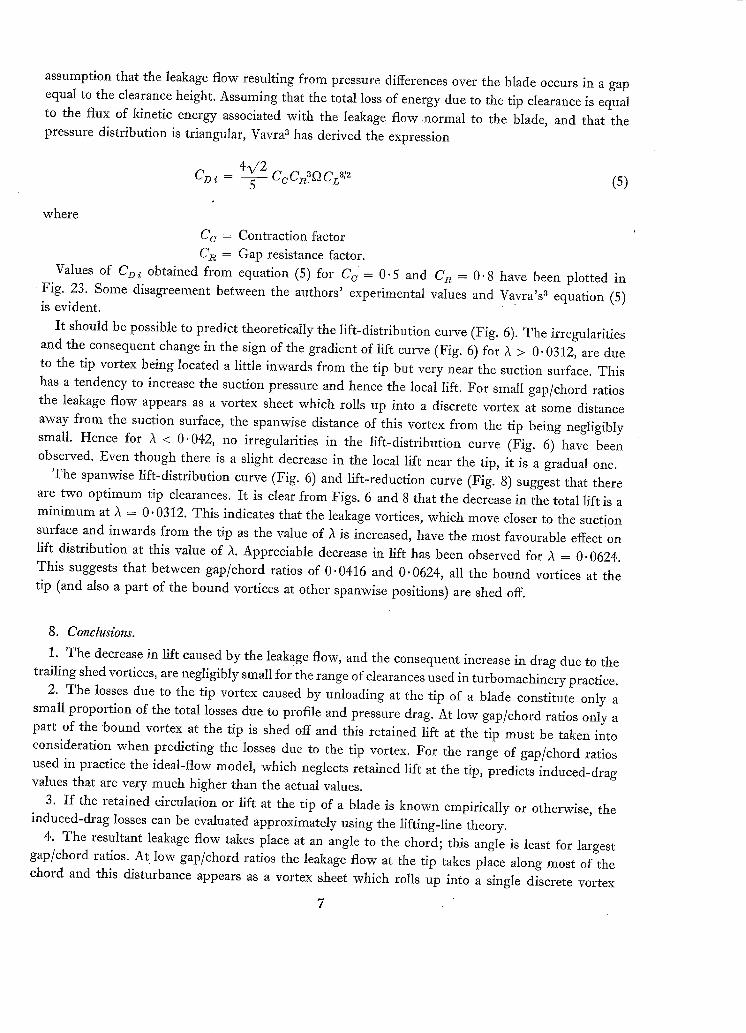
assumption that the leakage flow resulting from pressure differences over the blade occurs in a gap equal to the clearance height. Assuming that the total loss of energy due to the tip clearance is equal to the flux of kinetic energy associated with the leakage flow normal to the blade, and that the pressure distribution is triangular, Vavra 3 has derived the expression
C~¢ - 4~/2 5 (5)
where
C o = Contraction factor C2~ = Gap resistance factor.
Values of CDi obtained from equation (5) for Co= 0"5 and C;~ = 0.8 have been plotted in F i g . 23. Some disagreement between the authors' experimental values and Vavra's a equation (5) is evident.
It should be possible to predict theoretically the lift-distribution curve (Fig. 6). The irregularities and the consequent change in the sign of the gradient of lift curve (Fig. 6) for A > 0.0312, are due
to the tip vortex being located a little inwards from the tip but very near the suction surface. This
has a tendency to increase the suction pressure and hence the local lift. For small gap/chord ratios
the leakage flow appears as a vortex sheet vchich rolls up into a discrete vortex at some distance away from the suction surface, the spanwise distance of this vortex from the tip being negligibly small. Hence for A < 0. 042, no irregularities in the lift-distribution curve (Fig. 6) have been observed. Even though there is a slight decrease in the local lift near the tip, it is a gradual one.
The spanwise lift-distribution curve (Fig. 6) and lift-reduction curve (Fig. 8) suggest that there
are two optimum tip clearances. It is clear from Figs. 6 and 8 that the decrease in the total lift is a minimum at A = 0. 0312. This indicates that the leakage vortices, which move closer to the suction surface and inwards from the tip as the value of A is increased, have the most favourable effect'on lift distribution at this value of A. Appreciable decrease in lift has been observed for A = 0. 0624.
This suggests that between gap/chord ratios of 0.0416 and 0.0624, all the bound vortices at the tip (and also a part of the bound vortices at other spanwise positions) are shed off.
8. Conclusions.
1. The decrease in lift caused by the leakage flow, and the consequent increase in drag due to the trailing shed vortices, are negligibly small for the range of clearances used in turbomachinery practice.
2. The losses due to the tip vortex caused by unloading at the tip of a blade constitute only a small proportion of the total losses due to profile and pressure drag. At low gap/chord ratios only a
part of the bound vortex at the tip is shed off and this retained lift at the tip must be taken into consideration when predicting the losses due to the tip vortex. For the range of gap/chord ratios used in practice the ideal-flow model, which neglects retained lift at the tip, predicts induced-drag values that are very much higher than the actual values.
3. If the retained circulation or lift at the tip of a blade is known empirically or otherwise, the induced-drag losses can be evaluated approximately using the lifting-line theory.
4. The resultant leakage flow takes place at an angle to the chord; this angle is least for largest gap/chord ratios. At low gap/chord ratios the leakage flow at the tip takes place along most of the chord and this disturbance appears as a vortex sheet which rolls up into a single discrete vortex
7
downstream. The location of the vortex varies with the gap/chord ratio. It is very near to the suction surface, and a little inwards from the tip, for large gapichord ratios, but for small values it is
located much farther away from the suction surface. 5. The effect of leakage flow, and the consequent formation of tip vortices, is to decrease the
pressure on the suction and pressure surfaces. At low gap/chord ratios the decrease in positive pressure is often compensated by the increase in suction pressure. Hence the blade experiences
little or no lift reduction at lower gap/chord ratios. 6 . Vortices are formed further forward along the chord in the case of low gap/chord ratios.
At very large gap/chord ratios the vortex is formed near the trailing edge of the tip. 7. The presence of a very thin wall at the centre of the gap does not make much difference to the
lift and drag coefficients. This confirms that the split blade spanning a tunnel is a valid model for
studying tip-clearance flows.
Acknowledgments. The authors wish to express their thanks to Professor J. H. Preston for making the wind tunnel
available for this work, and to Mr. H. Ainsworth for his assistance in the construction of the apparatus.
2s
2(l+s) F
x, y
h
~2
(X
%
P2
Pl
ql
K
u + i v
V
A1, A8 . . . . A.
O, 01
L
D
P
¢,
A
r.p.m.
C
6/0
h
LIST OF SYMBOLS
Length of the gap (Fig. 4)
Total length of the blade
Local values of wing circulation
Chordwise and spanwise co-ordinates (Fig. 4)
A ratio representing s/c
A ratio representing s/l
Angle of incidence
Angle of incidence measured from the attitude of no lift
Drag coefficient
Lift coefficient
Static pressure on the blade
Upstream static pressure
Upstream dynamic pressure
A ratio representing C L R/Cz ~a
Complex velocity where v represents the vertical velocity
Mainstream velocity
Fourier coefficients
Spanwise angular co-ordinates
Total lift of the blade
Total drag of the blade
Density of the fluid medium
Stream function
Angle between the axis of leakage vortex and the mainstream direction
Aspect of ratio of each wing = l/c
Revolutions per minute
Complex co-ordinate (x + iy)
Chord length
Pressure coefficient
A ratio representing aoc/8l
Slope of the two-dimensional-lift/incidence curve
Height of the wind-tunnel worldng section (Fig. 22)
9

~uffixeS
2d
i
R
Av
m
f
L
LIST OF SYMBOLS--continued
Two-dimensional value
Induced
Retained at the tip
Average value
Maximum value
Form or pressure
Leakage
10
No. Author(s)
1 A. Betz . . . .
2 D.A. Rains ..
3 M . H . Vavra ..
4 R. Grammel ..
5 L. Prandtl and A. Betz
6 K. Nickel . . . .
7 M. Munk and G. Cario
8 O. Flaschbart ..
9 S.P. Hutton ..
10 H. Glauert ..
11 H. Villat . . . .
12 A. Toussaint . .
13 K . W . Todd ..
R E F E R E N C E S
Title, etc.
Uber die Vorgange an den Schaufel-enden yon Kaplan-Turbinen. Hydraulische Probleme. p. 161. ¥DI---Verlag, Berlin. 1926.
Tip clearance flows in axial flow compressors and pumps. California Institute of Technology, U.S.A. Mech. Eng. Lab. Report 5.
1954.
Aero thermodynamics and flow in turbo-machines, p. 381. John Wiley and Sons, New York. 1960.
Die hydrodynamischen Grundlagen des Fl@es. p. 84. F. Vieweg, Braun Schweig. 1917.
Vier Abhandlungen zur Hydrodynamik und Aerodynamik. p. 52. Selbstverlag des Kaiser Wilhelm-Instituts ffir Stromungsforsehung, G6ttingen. 1927.
Uber spezielle Tragfliigelsysteme. Ingenieur-Archiv. Vol. 20. p. 26. 1952.
Fliigel mit Spar in Fahrtrichtung. Technische Berichte der Flugzeug- Meisterei. Vol 1. p. 219.
Spaltverluste an Tragfltigeln. Z.A.M.M. Vol. 11. Part 6. pp. 411 to 414. 1931.
Three dimensional motion in axial flow impellers. Proc. Inst. Mech. Eng. Vol. 170. pp. 863 to 873. 1956.
Aerofoil and Airscrew Theory. Cambridge University Press. 2nd Edition 1948.
Legons sur la theorie des tourbillons, p. 56. Gauthier-Villars, Paris. 1930.
Experimental methods--Wind tunnels. Aerodynamic theory. W. F. Durand, editor. Vol. I I I . p. 252. Springer.
1935.
Some developments in instrumentation of air flow analysis. Proc. Inst. Mech. Eng. Vol. 161. p. 213. 1949.
11
A P P E N D I X I
On the Extension of Glauert's Analysis to Tip-Clearance Flow in a Split Compressor Blade
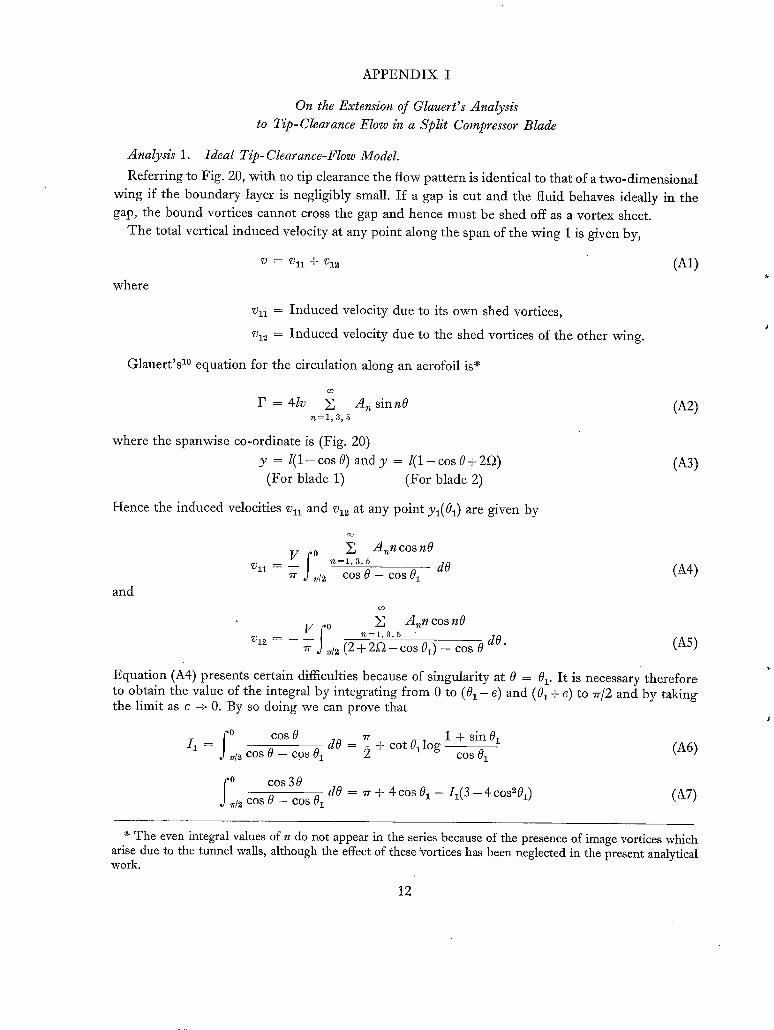
Analysis 1. Ideal Tip-Clearance-Flow Model.
Referring to Fig. 20, w k h no tip clearance the flow pattern is identical to that of a two-dimensional
wing if the boundary layer is negligibly small. I f a gap is cut and the fluid behaves ideally in the
gap, the bound vortices cannot cross the gap and hence must be shed off as a vortex sheet.
T h e total vertical induced velocity at any point along the span of the wing 1 is given by,
where
v = v n + v 1 2 (A1)
Vll = Induced velocity due to its own shed vortices,
vl~ = Induced velocity due to the shed vortices of the other wing.
Glauert 's 1° equation for the circulation along an aerofoil is ~
c~
P =41v ~ A~sinnO ~,~,=1, 3, 5
where the spanwise co-ordinate is (Fig. 20)
y = / ( 1 - c o s 0 ) a n d y = l ( 1 - c o s 0 + 2 g 2 )
(For blade 1) (For blade 2)
Hence the induced velocities vll and v12 at any point y1(01) are given by
(A2)
(A3)
and
ao
V o ~ A~ncosnO f n = l , 3, 5
v11= ~- ~/2 c o s 0 - c o s 0 ~ dO (A4)
GO
V ro ~ A~ncosnO _ i ~ = 1 , 8, 5
(2 cos 01) - cos 0 dO. (AS)
Equat ion (A4) presents certain difficulties because of singularity at 0 = 0 t. I t is necessary therefore to obtain the value of the integral by integrating from 0 to (01 - e) and (01 + e) to 7r/2 and by taking the limit as e -+ 0. By so doing we can prove that
f 0 cos 0 I z =
~/~ cos 0 - cos 01 1 + sin 01
dO = ~ + cot 01 log - - c o s 01 (A6)
f 0 cos 30 ~/2 cos O - ~os 01 dO = ~r + 4cos 01 - / 1 ( 3 -4cos201) (A7)
'* The even integral values of n do not appear in the series because of the presence of image vortices which arise due to the tunnel walls, although the effect of these 'vortices has been neglected in the present analytical work.
12
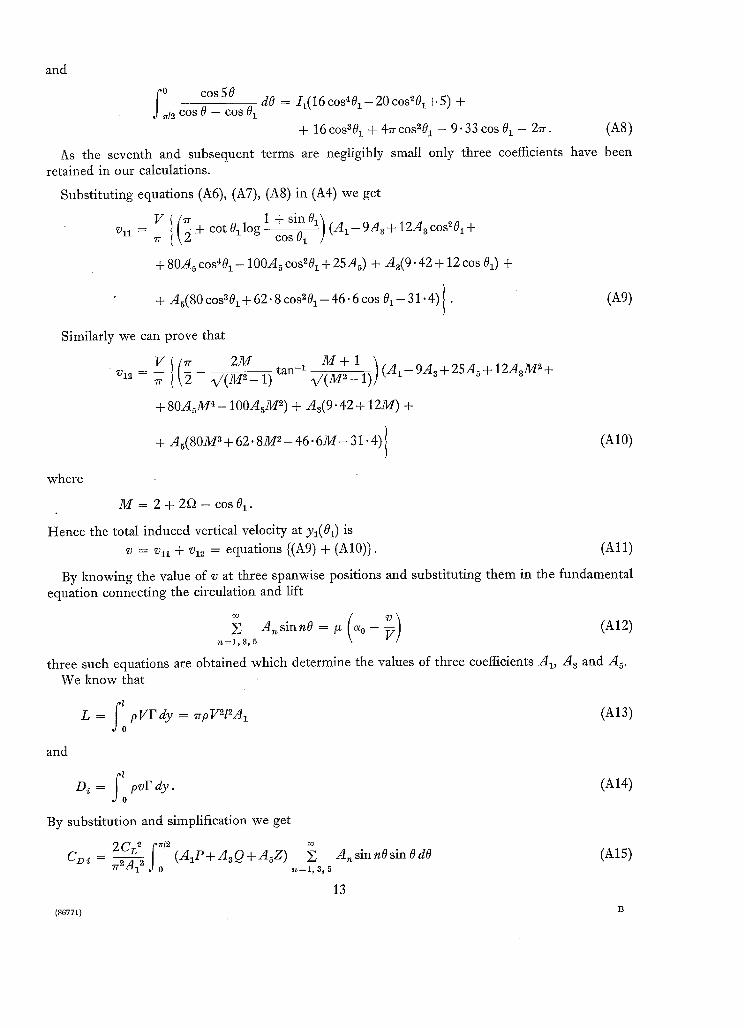
and
f 0 cos50 dO = Ii(16cos401-20cos201+ 5) + ~/~ cos 0 - cos 01
+ 16 cos301 + 4~ cos201 - 9.33 cos 0, - 27r. (A8)
As the seventh and subsequent terms are negligibly small only three coefficients have been retained in our calculations.
Substituting equations (A6), (A7), (AS) in (A4) we get
Vii = ~- + c°t011°g" cos t ] (A1-9Aa+12Aac°Sz01+
+ 80A 5 cos401- 100As cos201 + 25A5) + A3(9" 42 + 12 cos 01) +
62.8 cos~01- 46.6 cos 0~ - 31.4) I " (A9) + A5(80 COS301
Similarly we can prove that
V I ( 2 2 M M + I ) vl~ = ~- ~ / (M 2 - 1) tan-1 ~/-(MY--1) (A1-9A3+25As+ 12AaM~+
where
+ 80A.~M 4 - 100AsM 2) + A8(9 .42+ 12M) +
+ A~(80M 8 + 6 2 . 8 M 2 - 46" 6 M - 31.4) }
M = 2 + 2 f ~ - c o s 0 1 .
(A10)
Hence the total induced vertical velocity at y1(01) is v = v n + v12 = equations {(A9) + (A10)}. (Al l )
By knowing the value of v at three spanwise positions and substituting them in the fundamental equation connecting the circulation and lift
A~sinnO = /x c~ 0 - (A12)
three such equations are obtained which determine the values of three coefficients A1, Aa and A 5. We know that
f l
L = p VF dy = wp V~12Ax 0
and
(A13)
(A14)
O9 A~ sin nO sin O dO (A15)
n=l , 3, 5
13
f l
D i = pvF dy. o
By substitution and simplification we get
CD~ -- 2CLe [.1~ (AxP+A3Q+A5 Z) w2Ax 2 .]o
(86771) B
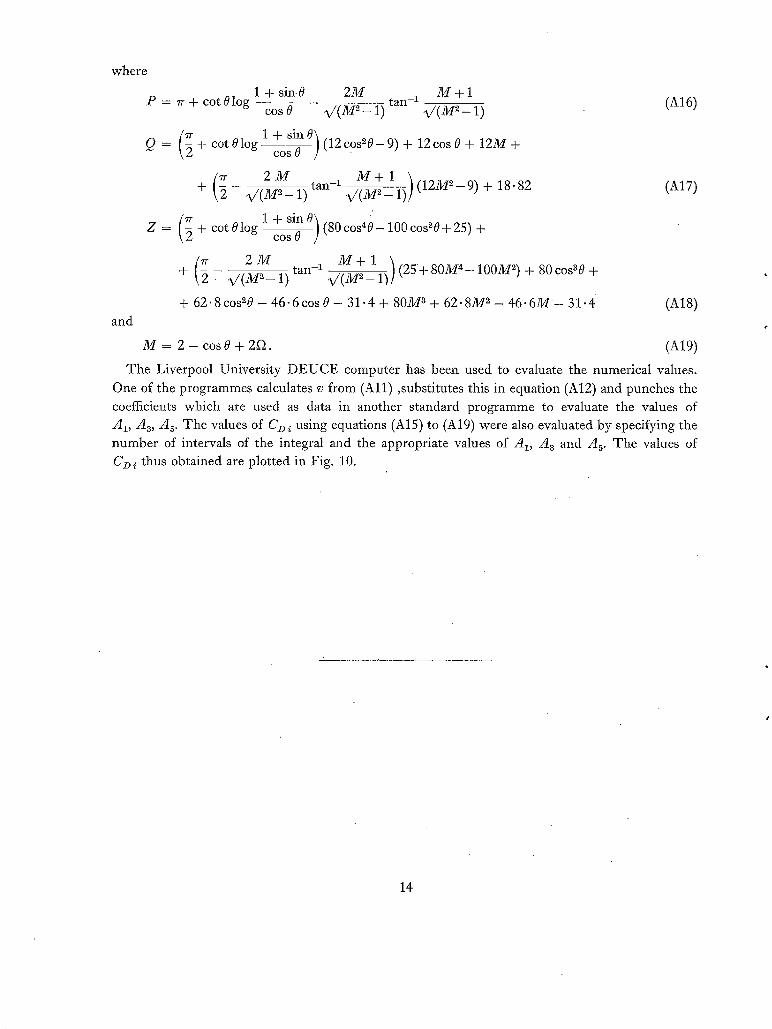
where
P = ~ r + c o t 0 1 o g
and
Z =
1 + sin-0 2M M + 1 tan-1
cos 0 V ( M ~ - 1) ~ / (M~- 1)
+ cot 0 log -1 +cosSin0 0) (12 cos20. - 9) + 12 cos 0 + 12M +
(2 ~/(M2-1)2M M + I '~ + tan -1 V(M~_I)I(lZM2-9 ) + 18.82
+ o
(2 2M M+! ~(25+80M4_lOOM 2)+80cos30+ + ~ / ( m =- 1) tan-1 ~ / (m =- 1)1
+ 6 2 . 8 c o s 2 0 - 4 6 . 6 c o s 0 - 31.4 + 80Ma+ 62 .8M 2 - 4 6 . 6 M - 31.4
(A16)
(A17)
(AlS)
M = 2 - cos0 + 2 ~ . (A19)
The Liverpool University DEUCE computer has been used to evaluate the numerical values. One of the programmes calculates v from (All) ,substitutes this in equation (A12) and punches the coefficients which are used as data in another standard programme to evaluate the values of A1, As, A 5. The values of Co i using equations (A15) to (A19) were also evaluated by specifying the number of intervals of the integral and the appropriate values of A1, A 8 and A~. The values of CD~ thus obtained are plotted in Fig. 10.
14
APPENDIX II
Modified Tip-Clearance-Flow Model for Low Gap~Chord Ratios
Analysis 2.
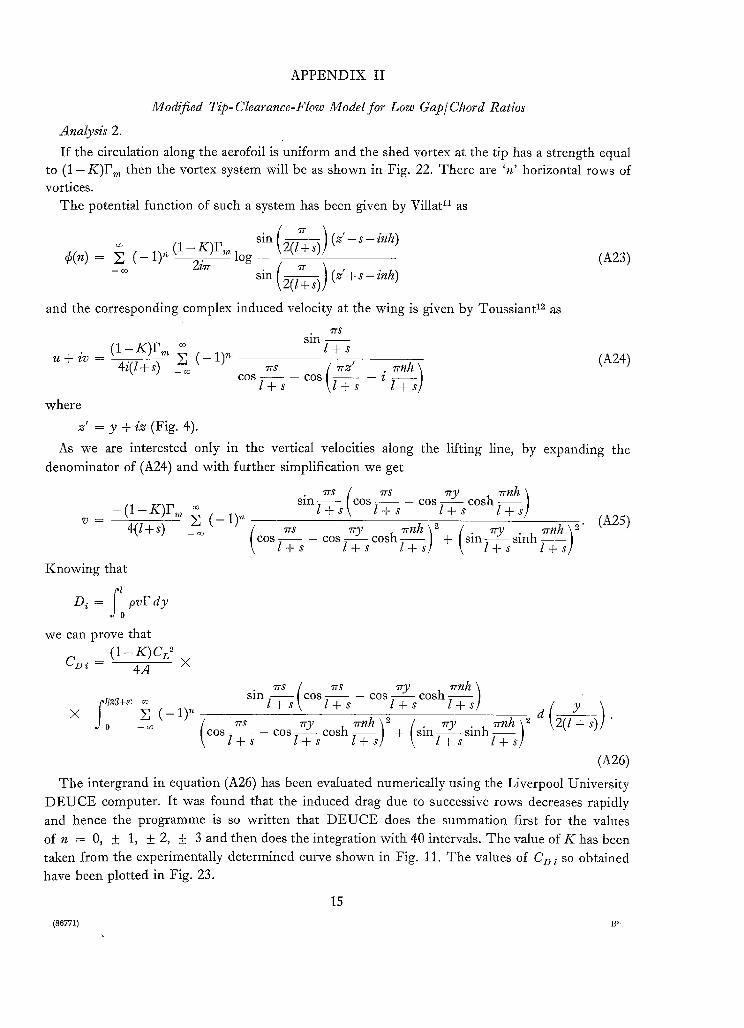
If the circulation along the aerofoil is uniform and the shed vortex at the tip has a strength equal to ( 1 - K ) P ~ then the vortex system will be as shown in Fig. 22. There are 'n' horizontal rows of vortices.
The potential function of such a system has been given by Villat ~1 as
co (1 - K)F,,,, sin (z - s - inh) ¢(n) = Z ( - 1) '~ log (A23)
_co 2 i r r s in(2(@+s))(z ,+s_inh )
and the corresponding complex induced velocity at the wing is given by Toussiant lz as
77S
( 1 - K)P,,~ sin l co S
u + i v - 4i(l+s) ~_~(-1)~ ~s { ; z ' ~nh~ (A24) - cos/ - cos - i
+ s \ l + s l + s ] where
z' = y + iz (Fig. 4).
As we are interested only in the vertical velocities along the lifting line, by expanding the denominator of (A24) and with further simplification we get
7rs ( rrs Try . 7rnh \ _ - ( 1 - K ) r m co s i n / ~ \ C ° S l + s - C ° S l + s C ° S h l - ~ ) . (A25)
v 4(l+s) -~co(-1)~ coS/~sTrS C ° S l + s C ° S h / ~ s) + s l n l + s S i n h ~ s )
Try . 7rnh \ • ~rs 7rs - cos c o s h ~ } f,/2(1+8'. ~ s m l ~ C ° S l + s l + s ~ t s / ( y )
~0 - C O S l + s - C O S / + s C O S h / ~ ) + S m l + s S i n h l + s J
(A26)
The intergrand in equation (A26) has been evaluated numerically using the Liverpool University DEUCE computer. It was found that the induced drag due to successive rows decreases rapidly and hence the programme is so written that DEUCE does the summation first for the values of n - 0, + 1, + 2, + 3 and then does the integration with 40 intervals. The value of K has been taken from the experimentally determined curve shown in Fig. 11. The values of C Di so obtained have been plotted in Fig. 23.
15
(86771) B*
Knowing that
D i = pvP dy 0
we can prove that ( 1 - K)Qr. 2
CD i -- 4A X
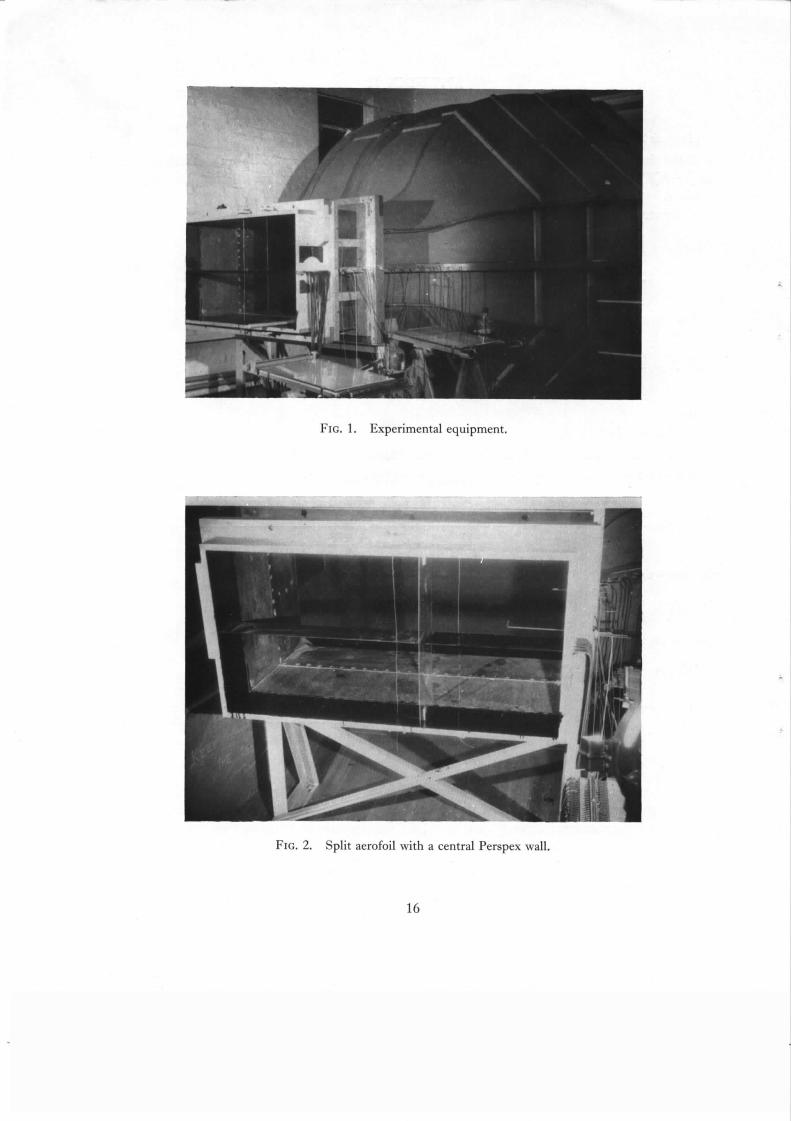
Fie. 1. Experimental equipment.
FIG. 2. Split aerofoil with a central Perspex wall.
16
w-= "-3
1"6
I-2
0"8
0"4
O -10
f -5 O ÷5 10 15
Angle of incidence-o<-in degrees
FIG. 3. Two-dimensional characteristics of 10C4 30C50 blade (isolated).
To?o , + a , , s . .
y
n = sH.
~. - s ic
F Io . 4. N o m e n c l a t u r e .
l
I-0
0
Cp ~ W
-0-5
Locat.Jon of pressure
taps 7 -t-0-5 //
- i .0 +,~..+ (+++ + /
-1"5 0 0"2
- h = 0
• h = 0-0104
¥ h ~- 0-0208 =0-0512
/
0"4 0"6 0-8 x /c
I '0
+°+it P2- ', I
Cp= - -
ql 0 ! ,
-I "0
-I "5 I 0
~ 1 1 I I I I
~ . - 0 - 0 4 1 6
~.-0.06Z4
. . . . . =Very large
0"2 0-4 0-6 0-8 x / c
FIG. 5. Chordwise pressure distributions aty/l = 0. 0017 for various gap/chord ratios.
1,0
•Ex)
0-7
~g
0.t
0.6 ~ ~ / ~
0.5 ~ ? /
0-4
FIG. 6.
0.5 0
f
/ j = / /
/ /
---o.--- X = O
X = 0.0104
- - -o- - - ). = O, OZ08
P,~ ~, = 0 . 0 3 1 ; '
e X = 0"0416
X = 0 '0 624.
X = 0'0936
X = 0"2190
X = Very large
o.os o. lo o-is o.zo o!zs o!3o
Y / I - spcmwlse d~startc¢
Spanwise lift distribution at various gap/chord ratios,
1.0
+0"5
C - Pz- Pl 0 P---qT-~
-0"5
-I-0
-1'5 -- 0
I'Oi
+0'-=
Cp= ~ 0
-0 -5
-I'0
ill I L , ' ~ , ~
\
y/Z = o.ool7
,,---e,---- y],7 = 0.0 069
• ---v---- y/7 = 0.0Z77
0.2 0.4 x / c 0.6 O.t,
i J - - - o - - - Y/Z = 0 - 0 5 5 5
~ x ~ y / l = o . m o
y/Z= o .3o6o
I-0
-I,S 0 0,2 0"4 0-6 O'g 1.0
x / e
FIG. 7. Chordwise pressure distributions for )t = 0" 0416 at various spanwise positions.
v
20
15
.~1(~
&5 2 ¢
¢ i_/ 0 0"1
FIG. 8.
/
J / o Without wall c----- With wall
I I ~^ O'Z 0'5 0'4 v
~.- Gap/chord ratio
Reduction in total lift of the blade at various values of t .
1.0
~0"5
Pz-Pl cp=-g;-
- 0 - 5
-I'0
-I.5 -0"10
L h = 0
), = 0"0624
/
-0-075 -0
/ -0-025
z l c
/ /
f 0 *0.0iS 0"05
FIG. 9. Pressure distributions on a plane perpen- dicular to main stream at y/l = 0" 0017.
0"015
0-012
0"009
CDL
0"006
0"003
0 0,05
FIG. 10.
Experimcntal (without wall)
Experirnentol (with wall) Theoretical - onolysis-I-
(id¢al)
0"1 0-15 0-2 oo
;~-Gap/chord ratio
Experimental and theoretical variation of induced-drag coefficient with 2~.
I'00 - ~
0'75
O.ZS
\ \
0 I 0'02 0.04 ~. 0.06 0"08 0"I0
Fro. 11. Lift retained at the tip as a fraction of maximum lift.
(a) X : 0 . 0 1 0 4
(b) X : 0 . 0 6 2 4
Wi thou t wal l
(C~ X = 0 " 0 1 0 4
(d) X = 0 .0624
With wall and photographs taken through Pcrspcx wall
FIG. 12. Flow-visualization technique, illustrating the leakage flow at blade tip.
20
Spl;nes
C o m p . " . = • ' ~
I,,,~ I, , ,1 I n c h 16 I
FIG. 13. Vortometer with air-floated spindle.
@ Rotor ,,
6 blades 30.D. B
K - ~ U ' " ' ~ . . . . . . . i " ~ % ' ~
0-0591
SpI;nes
/--_o
2 -T 0"1968 0 "0787
I I i ! I n c h J6 I
R o t o r 3 " 6 b l a d e s - - O . D .
8
Fla. 14. Vortometer with miniature ball bearings.
21
FIQ. 15. Equipment for vorticity measurements.
Fic. 16. Method of locating vortex core by means of a tuft.
22
hO
Numbers denote r.p.m, of vor tometer Arrow on iso-speed contours ind ica tes sense of ro ta t i on .
I i edges of the blade
j - t l P .... ur, sld, I [ Suction side
~ K= 0.0104
\ ' ~ i ~=3 , -4 ' Core of Ileokag¢ vortex
- I s o - s p e e d contours
-4t It
~=25"z o
7 ul
4(
Trahlng shed vort.lce~
11001050 300 ~ 1 0 0
11501070 950 920 680 443 f ~ . . f " K~f ~ /'- r ~ ( - ,.~ r t - I !
h = very large
/3= 7.850
Wall 0 I 2 3 Wall Distance from t i p - inches
FIG. 17. Comparative strength and location of leakage vortices, as observed by vortometer.
1400
z !
& ~: IZO0
1000
---0--- I" down stream
6"down stream
12"down stream
~3 0'02
8oo 13 0 0"04 0-0~ 0"08
X - G a p / c h o r d ra t i o
0 O'lO
Fzc. 18. Angle and r.p.m, of the rotor in the vortex core at various distances
downstream.
400
L 300
I
ZOrn
tO °
~ " (o) At low gap/chord ratio Vortex l J ' % x . \ \ \ r ~ sheet
/ V o r t e x / / <-- ~ub,
g a p / c h o r d r a h o
FIG. 19. Leakage-flow model as derived from observations.
~o
~n l Bound vort ices
Trailing vortices
Fro. 20. Ideal tip-clearance-flow model.
Pressure surface Bound vort ices
FIG. 21. Modified tip-clearance- flow model (for low gap/chord
ratios only).
b~ 4~
{" "N
- - +
To infinity ~ ~ .f. --
- +
FIG. 22.
To infinity
t - -F
Wi tunnel
q-K)
- / ; / 7 / / . ' I / . / / / / / / ; 4 -
+ --
( .~ ~,~, - 4
To infinity
Image vortex system for analysis 2.
To infinity
0"008
0.006
CDi
0 - 0 0 4
O'OOZ
Expt. No wall
~ Theoretical - / analysis Z-App.~,
Theoretical -
Vavra,C c = 0"5 CR=0-8
O'OZ 0"04 frO6 0.08 X
FIC. 23. Comparison between experimental and theoretical values (analysis 2) of C D ~ at low gap/chord
ratios.
Publications of the Aeronautical Research Council
A N N U A L T E C H N I C A L R E P O R T S O F T H E A E R O N A U T I C A L R E S E A R C H C O U N C I L ( B O U N D V O L U M E S )
x94z Vol. I. Aero and Hydrodynamics, Aerofoils, Airscrews, Engines. 75s. (post 2s. 9d.) Vol. II. Noise, Parachutes, Stability and Control, Structures, Vibration, Wind Tunnels. 47s. 6d. (post 2~. 3d.)
I943 Vol. I. Aerodynamics, Aerofoils, Airscrews. 8os. (post 2s. 6d.) Vol. II. Engines, Flutter, Materials, Parachutes, Performance, Stability and Control, Structures.
9os. (post 2s. 9(t.) r944 Vol. I . Aero and Hydrodynamics, Aerofoils, Aircraft; Airscrews, Controls. 84s. (post 3s.)
Vol. II. Flutter and Vibration, Materials, Miscellaneous, Navigation, Parachutes, Performance, Plates and Panels, Stabihw, Structures, Test Equipment, Wind Tunnels. 84s. (post 3s.)
I945 Vol. I. Aero and Hydrodynamics, Aerofoils. i3os. (post 3s. 6d.) Vol. II. Aircraft, Airserews, Controls. I3os. (post 3s. 6d.) Vol. III. Flutter and Vibration, Instruments, Miscellaneous, Parachutes, Plates and Panels, Propulsion.
I3os. (post 3s. 3d.) Vol. IV. Stability, Structures, Wind Tunnels, Wind Tunnel Technique. I3os. (post 3s. 3d.)
x946 Vol. L Accidents, Aerodynamics, Aerofoils and Hydrofoils. i68s. (post 3s. 9d.) Vol. II. Airserews, Cabin Cooling, Chemical Hazards, Controls, Flames, Flutter, Helicopters, Instruments and
Instrumentation, Interference, Jets, Miscdlaneous, Parachutes. i68s. (post 3s. 3d.) Vo!. III. Performance, Propulsion, Seaplanes, Stability, Structures, Wind Tunnels. ,68s. (post 3s. 6d.)
I947 Vol. I. Aerodynamics, Aerofoils, Aircraft. i68s. (post 3s. 9d.) Vol. II. Airscrews and Rotors, Controls, Flutter, Materials, Miscellaneous, Paraehutes, Propulsion, Seaplanes,
Stability, Structures, Take-off and Landing. x68s. (post 3s. 9d.)
*948 Vol. I. Aerodynamics, Aerofoils, Aircraft, Airserews, Controls, Flutter and Vibration, Helicopters, Instruments, Propulsion, Seaplane, Stability, Structures, Wind Tunnels. I3os. (post 3s. 3d.)
Vol. II. Aerodynamics, Aerofoils, Aircraft, Airscrews, Controls, Flutter and Vibration, Helicopters, Instruments, Propulsion, Seaplane, Stability, Structures, Wind Tunnels. iios. (post 3s. 3d.)
Special Volumes Vol. I. Aero and Hydrodynamics, Aerofoils, Controls, Flutter, Kites, Parachutes, Performance, Propulsion,
Stability. ,26s. (post 3s.) Vol. II. Aero and Hydrodynamics, Aerofoils, Airserews, Controls, Flutter, Materials, Miscellaneous, Parachutes,
Propulsion, Stability, Structures. x47s. (post 3s.) Vol. III. Aero and Hydrodynamics, Aerofoils, Airscrews, Controls, Flutter, Kites, Miscellaneous, Parachutes,
Propulsion, Seaplanes, Stability, Structures, Test Equipment. ~89s. (post 3s. 9d.)
Reviews of the Aeronautical Research Council I939-48 3s. (pose 6d.) I949-54 5s. (post 5d.)
Index to all Reports and Memoranda published in the Annual Technical Reports I9o9-x947 R. & M. 2600 (out of print)
Indexes to the Reports and Memoranda of the Aeronautical Research Council Between Nos. 235x-2449 R. & M. No. 2450 2s. (post 3d.) Between Nos. 2451-2549 Between Nos. 2551--2649 Between Nos. 2651-2749 Between Nos. 2751-2849 Between Nos. 2851-2949 Between Nos. 295I-3o49 Between Nos. 3o51-3149
R . & M . R . & M . R . & M . R . & M . R . & M . R . & M . R . & M .
No. z55o 2s. 6d. (post 3d.) No. 2650 2s. 6d. (post 3d.) No. 275 ° 2s. 6d. (post 3d.) No. 285 ° 2s. 6d. (post 3d.) No. 2950 3 s. (post 3d.) No. 3050 3s. 6d. (pose 3d.) No. 3z5o 3s. 6d. (post 3d.)
HER MAJESTY'S STATIONERY OFFICE from the addresses overleaf
~o & Mo Neo 3316
© Crown copyright I963
Printed and published by HER MAJESTY'S STATIONERY OFFICE
To be purchased from York House, Kingsway, London w.c.z
423 Oxford Street, London w.i I3A Castle Street, Edinburgh z
Io 9 St. Mary Street, Cardiff 39 King Street, Madchester 2
5 ° Fairfax Street, Bristol i 35 Smallbrook, Ringway, Birmkngham 5
80 Chichester Street, Belfast x or through any bookseller
Printed in England
~o & Mo No. 33~t6
S.Oo Code No. 23-3316