Embed Size (px)
Citation preview

TIMING PRO LIGHT GATES

Timing Pro Light Gates consists of a set of Primary and Secondary Light Gates with Bluetooth
connectivity to a smart device or PC. The Primary Light Gate has built in timer, solenoid attachment
port and two channels( Primary & Secondary) on which unlimited Secondary Light Gates can be
daisy changed. It has several advanced features over the conventional Timer by making use of
dedicated software on PC and apps for Android/iOS which graphically displays the blocked pulse as
a function of time for two channels. The Primary Light Gate contains Micro-controller having crystal
controlled time base to accurately measure the time with least count time resolution of
0.1millisecond. Communication between Primary and Secondary Light Gates as well as Primary
Light Gate and Solenoid is carried on via wire link and that between the Primary Light Gate and
Computer is made through wireless Bluetooth link.
TIMING PRO LIGHT GATES
It can be used with Air track and Dynamic Trolleys to comprehensively study several experiments on
kinematics and dynamics which requires light gate. An inbuilt rechargeable cell on Primary Light
Gate provides power for the set-up. The Primary light gate also provides both power and trigger to an
optional solenoid. Special circuits conserve battery power on the Light Gates and Solenoid. The
solenoid has sensing circuits to detect object placed and then only energises the solenoid. The
Solenoid winding has a resettable thermal fuse to prevent from overheating. The user-friendly
software also contains templates for various experiments: Velocity, Acceleration, Collision, Picket
Fence. ‘g’ by Free Fall and many more.

TIMING PRO LIGHT GATES
Attachment with ‘g’ by Free Fall
Magnetic object like steel ball or dowel can be placed here. The solenoid circuit will sense it and hold it and the Object Present LED lights up.
Sensor detects object placed and then only energises the Solenoid thereby saving battery.
Knob to tighten solenoid box with ‘g’ by Free Fall stand.
Hold alignment of Light Gate with ‘g’ by Free Fall stand.
Pointer to read scale.
Primary Light Gate port for attachment for additional Light Gates
Sensitivity Adjustment Pot
Solenoid attachment port
Align cable and insert
Sensitivity Adjustment Pot
ON/OFF switch
Charging Port
Primary Light Gate port for attachment for additional Light Gates
Solenoid
Steel Ball
Timing Pro PrimaryLight Gate
Timing Pro SecondaryLight Gate
Object Present
Pointer to read scale
Knob Screw to tighten Light Gate with ‘g’ by Free Fall stand
Hold alignment of Light Gate with ‘g’ by Free Fall stand
Dual light gate connection ports allow daisy chaining
g’ by FreeFall Stand
Light Gate Cable
Solenoid Cable
TIMING PRO LIGHT GATES
Easy fit attachments
Timing Pro Light Gate with Rod attachment can be screwed in five orthogonal positions.
Timing Pro Light Gate with Inspire Air Track attachment maintain perfect alignment for experiments.
Timing Pro Light Gate with Inspire Law of Motion Kit maintain perfect alignment for experiments.
Rod can be screwed here
Accessories can be pressed attached and tightened with knob at desired location on Air Track
Knob to tighten on Air track
Air Track attachment forLight Gate
Knob to tighten on track at desired location
Light Gate can be pressed and attached
Pointer to read scale
Slot on attachment to slide the Light Gates in position

To get started, you need to install the 'Timing Pro Light Gates Software' in your computer.
Basic & Advanced Features
When the application is launched, a screen appears to allow the user to choose either Basic or Advanced version.
BASIC & ADVANCED MODE
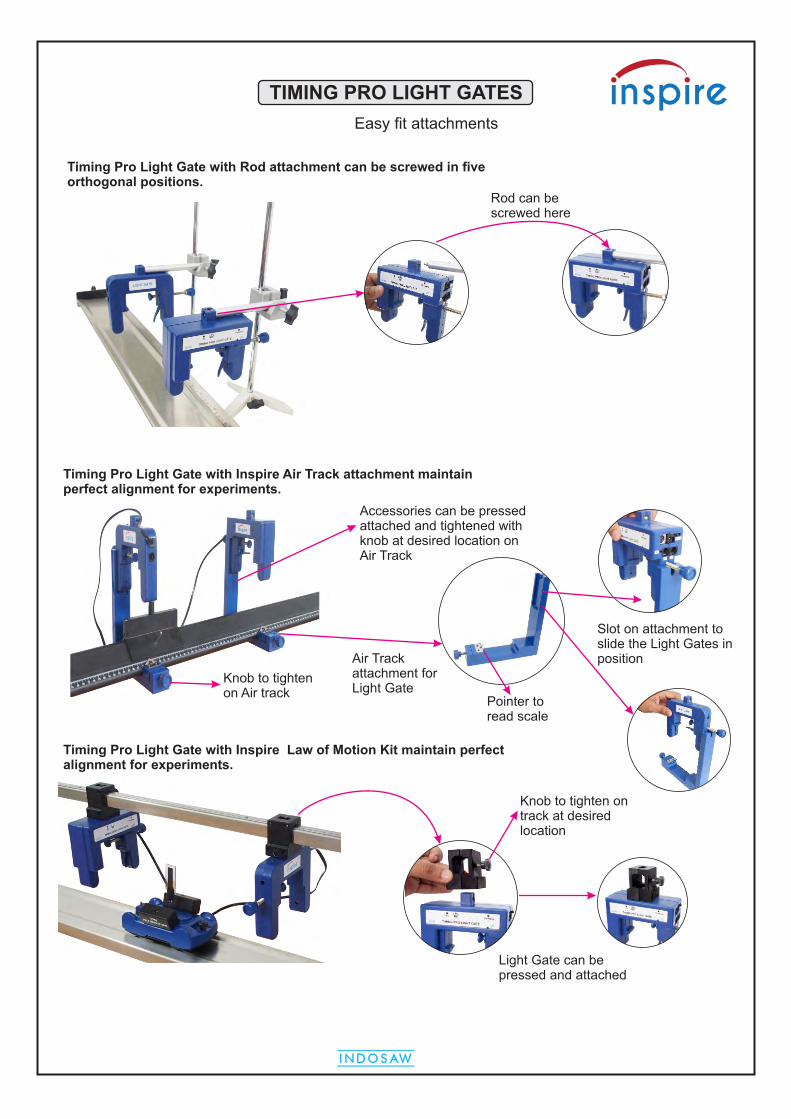
SCREENSHOT
Menu Bar
Icon Bar
Table AreaOutputData
Tables
Status Bar
Upper level of Primary Light Gates Pulse. It indicates that Light Gate is interrupted.
Lower level of Primary Light Gates Pulse. It indicates that Light Gate is not blocked.
Lower level of Secondary Light Gates Pulse. It indicates that Light Gate is not blocked.
Upper level of Secondary Light Gates Pulse. It indicates that Light Gate is interrupted.
Secondary Light gate pulse (blue colour)
Primary Light gate Pulse (red colour)
When clicked the Cursor shows the time value of the pointer when moved over the graph area.
The theory of current experiment can be viewed from here.
The time value of the Cursor pointer is displayed here.

BASIC MODE
Gate mode: Time difference is measured from rising edge to falling edge.
1-Gate mode: Time difference is measured from average time (of rising edge and falling edge) of first interruption to the average time (of rising edge and falling edge) of second interruption. Hence, the timer actually measures the average time between two successive blockings of the beam.
2-Gate mode: Time difference is measured from average time (of rising edge and falling edge) of first interruption at one light gates to the average time (of rising edge and falling edge) of second interruption at second light gate. Hence, the timer actually measures the average time between two successive blockings of the beam at two different Light Gates.
Frequency: Frequency Mode measures the number of interruptions per second of the Photogate beam from leading edge of the first interruption to leading edge of the last interruption.
Pendulum: Pendulum Mode measures time between 1st and 3rd interruptions of the Light Gates beam i.e. from average time (of rising edge and falling edge) of first interruption to the average time (of rising edge and falling edge) of third interruption.
Count: This mode simply counts the blocking of photogates at regular intervals of time as specified by the user.
t
t
t
t
t

BASIC MODE: PENDULUM
T 2l
g
g 4 2 l
T 2
=
=Or,
Substituting l = 0.858 m and T (Time period) = 1.86s in the above
2equation, we obtain g = 9.79 m/s

COLLISION MODE
This mode helps to find the velocities of cars/trolleys or any other moving objects before and after collision.
You have to use 1b - Picket or one blockage (equivalent to 1b-Picket) or 2b-Picket to find velocities.
1. Go to Advanced Collision.
2. Arrange the set-up as per the requirement of the experiment.
3. Mount either the blockage (or 1b - Picket) or 2b-Picket on the moving objects and ensure that they would block the light gate beams while passing through them.
Length of Mask
Length of Mask
Width of Shaded
Area
Width of Clear Area
Gate Mode
tVelocity =
Length of Mask
1 Gate Mode
t
tVelocity =
Width of Shaded Area + Width of Clear Area
4. (a) If using 1b - Picket or any other blockage card, then click on Gate Mode. (b) If using 2b - Picket, then click on 1-Gate Mode.

COLLISION MODE
5. Click on Settings: (a) If using 1b - Picket, or any other blockage card, then enter length of Mask.
(b) If using 2b - Picket, then enter Width of Shaded Area & Width of Clear Area.
6. Establish Bluetooth connectivity and Perform collision.
7. Observe velocities before and after collisions in output data tables and analyse those data.
Bar Graph Area: It displays the bar graph of output data (velocity).

FENCE MODE
This mode helps to find the 'g', acceleration due to the gravity using 10-b Picket Fence.
1. Go to Basic / Advanced 'g' by Free Fall Fence.
2. Click on Settings: Enter the width of shaded area and clear area as indicated.
3. Switch on the Timing Pro Light Gate (Primary) and establish Bluetooth connectivity.
4. Drop the Fence through the Light Gate. (a) You may drop the fence using hand as shown. (b) Alternatively, you may drop the fence using the solenoid mounted on 'g' by Free Fall Stand. Place the light gate at 40 cm mark in this case.
5. A v ~ t data is displayed in the output data and the corresponding graph is also displayed. A best fitting straight line along with equation is also displayed in the software interface.
Shaded Area
Clear Area

FENCE MODE (Continued)
Timing pulse at the Primary Light Gate
v (velocity) ~ t (time) Data in the Output Data Table
v ~ t Graph
Best fit linear regression line for v ~ t Data
Best fit linear regression line equation for v ~ t Data
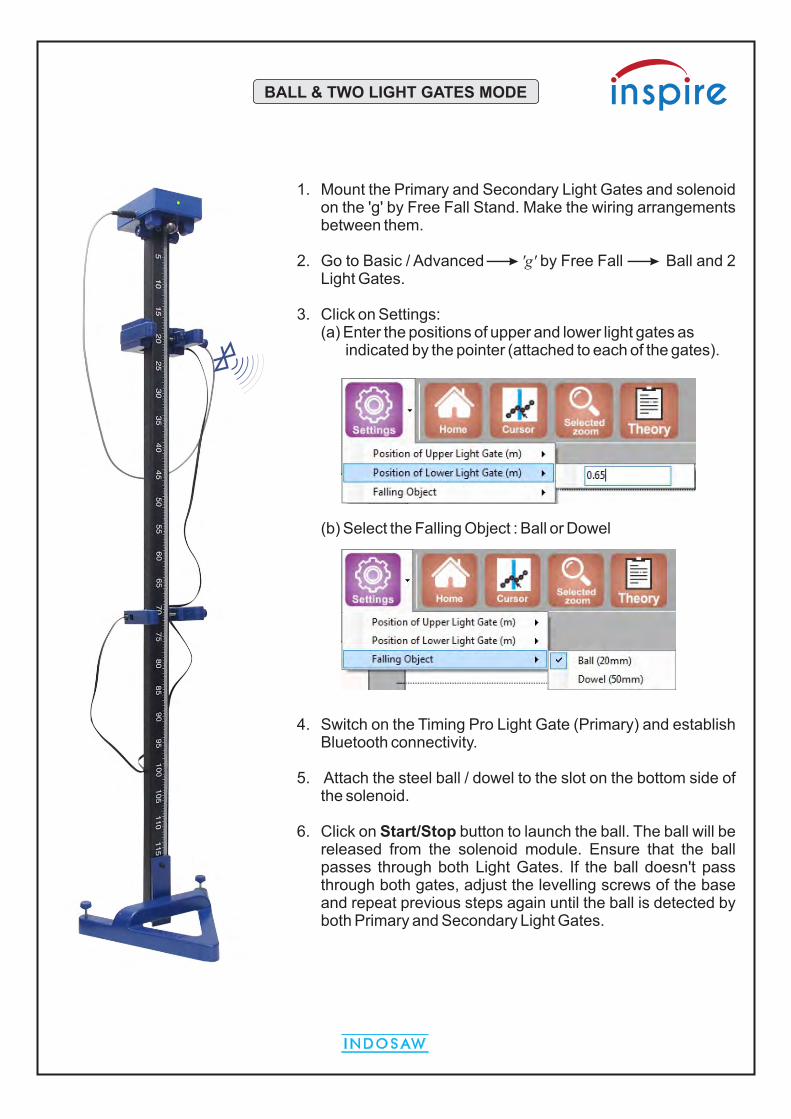
BALL & TWO LIGHT GATES MODE
1. Mount the Primary and Secondary Light Gates and solenoid on the 'g' by Free Fall Stand. Make the wiring arrangements between them.
2. Go to Basic / Advanced 'g' by Free Fall Ball and 2 Light Gates.
3. Click on Settings: (a) Enter the positions of upper and lower light gates as indicated by the pointer (attached to each of the gates).
(b) Select the Falling Object : Ball or Dowel
4. Switch on the Timing Pro Light Gate (Primary) and establish Bluetooth connectivity.
5. Attach the steel ball / dowel to the slot on the bottom side of the solenoid.
6. Click on Start/Stop button to launch the ball. The ball will be
released from the solenoid module. Ensure that the ball passes through both Light Gates. If the ball doesn't pass through both gates, adjust the levelling screws of the base and repeat previous steps again until the ball is detected by both Primary and Secondary Light Gates.

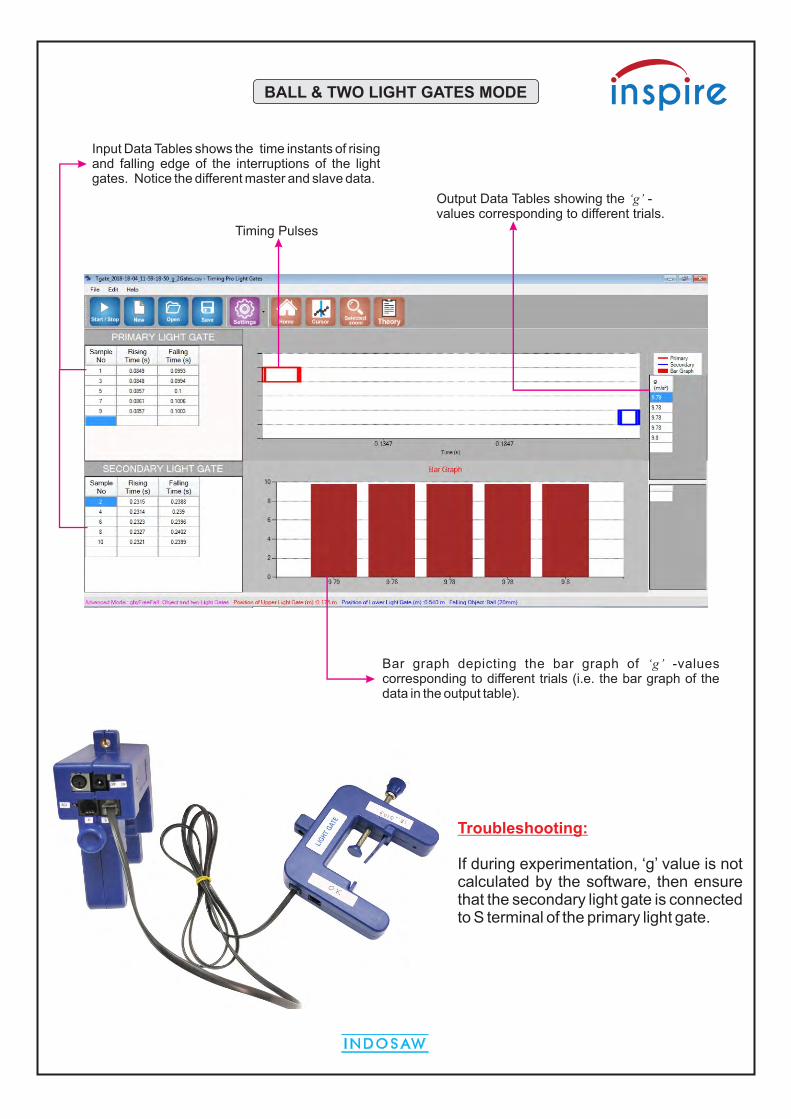
BALL & TWO LIGHT GATES MODE
Input Data Tables shows the time instants of rising and falling edge of the interruptions of the light gates. Notice the different master and slave data.
Troubleshooting:
If during experimentation, ‘g’ value is not calculated by the software, then ensure that the Secondary Light Gate is connected to S terminal of the Primary Light Gate.
Timing Pulses
Output Data Tables showing the ‘g’ -values corresponding to different trials.
Bar graph depicting the bar graph of ‘g’ -values corresponding to different trials (i.e. the bar graph of the data in the output table).

BALL & ONE LIGHT GATES MODE
1. Mount the Primary Light Gate and solenoid on the 'g' by Free Fall Stand. Make the wiring arrangements between them.
2. Go to Basic / Advanced 'g' by Free Fall Ball and 1 Light Gate.
3. Switch on the Timing Pro Light Gate (Primary) and establish Bluetooth connectivity.
4. Click on Settings: (a) Enter the positions of upper and lower light gates as indicated by the pointer (attached to each of the gates).
This position corresponding to height h (b) Select the Falling Object : Ball or Dowel
5. Attach the steel ball / dowel to the slot on the bottom side of the solenoid.
6. Click on Start/Stop button to launch the ball. The ball will be
released from the solenoid module. Ensure that the ball would pass through the light gate. If the ball doesn't pass through both Gate, adjust the levelling screws of the base and repeat previous steps again until the ball is detected by Light Gate.

BALL & ONE LIGHT GATES MODE
Upon successful interruption of the Light Gate by the ball, a pulse would be generated. Average of rising time and falling time would give the Free Fall Time t corresponding to height h.
2Free Fall Time, t =
Rising time + Falling time
Rising time Falling time
27. An window will be open displaying the best fit line equation of both h ~ t and h ~ t graph. Click on OK.
8. Change the position of light gate and repeat steps 4 to 7 for another measurement.
9. Take at least 5 to 7 different measurements for different heights and calculate 2
‘g’ = 2 x slope of h ~ t graph
Notes: 2Ÿ The h ~ t and h ~ t plot (along with best fit line equation and curve includes the (0,0) point and the
other available data point.
Ÿ If any data point seems incorrect to you, you may delete the data point by the following method:Right click on the Data Row Delete Row. The graph will be updated in the next trial.

BALL & TWO LIGHT GATES MODE
Input Data Tables shows the time instants of rising and falling edge of the interruptions of the light gates. Notice the different master and slave data.
Troubleshooting:
If during experimentation, ‘g’ value is not calculated by the software, then ensure that the secondary light gate is connected to S terminal of the primary light gate.
Timing Pulses
Output Data Tables showing the ‘g’ -values corresponding to different trials.
Bar graph depicting the bar graph of ‘g’ -values corresponding to different trials (i.e. the bar graph of the data in the output table).