Embed Size (px)
Citation preview

DEPARTMENT OF FISH AND GAMEHABITAT CONSERVATION DIVISION
Native Anadromous Fish and Watershed BranchStream Evaluation Program
TIMING, COMPOSITION AND ABUNDANCE OF JUVENILEANADROMOUS SALMONID EMIGRATION IN THESACRAMENTO RIVER NEAR KNIGHTS LANDING
OCTOBER 1997–SEPTEMBER 1998
by
Bill Sniderand
Robert G. Titus
Stream Evaluation Program Technical Report No. 00-05
July 2000

DEPARTMENT OF FISH AND GAMEHABITAT CONSERVATION DIVISION
Native Anadromous Fish and Watershed BranchStream Evaluation Program
TIMING, COMPOSITION AND ABUNDANCE OF JUVENILEANADROMOUS SALMONID EMIGRATION IN THESACRAMENTO RIVER NEAR KNIGHTS LANDING
OCTOBER 1997–SEPTEMBER 19981/,2/
by
Bill Sniderand
Robert G. Titus
July 2000
1/ Conducted by the Department of Fish and Game. Funded partially by the CaliforniaDepartment of Water Resources through the Interagency Ecological Program.
2/ Stream Evaluation Program Technical Report No. 00-5.

ii
TABLE OF CONTENTS
SUMMARY . . . . . . . . . . . . . . . . . . . . . . . . . . . . . . . . . . . . . . . . . . . . . . . . . . . . . . . . . . . . . . . ii
INTRODUCTION . . . . . . . . . . . . . . . . . . . . . . . . . . . . . . . . . . . . . . . . . . . . . . . . . . . . . . . . . . 1
METHODS . . . . . . . . . . . . . . . . . . . . . . . . . . . . . . . . . . . . . . . . . . . . . . . . . . . . . . . . . . . . . . . . 3
RESULTS and DISCUSSION . . . . . . . . . . . . . . . . . . . . . . . . . . . . . . . . . . . . . . . . . . . . . . . . . . 5General Sampling Conditions . . . . . . . . . . . . . . . . . . . . . . . . . . . . . . . . . . . . . . . . . . . . . 5Rotary Screw Trap Results . . . . . . . . . . . . . . . . . . . . . . . . . . . . . . . . . . . . . . . . . . . . . . 5
Chinook Salmon Emigration . . . . . . . . . . . . . . . . . . . . . . . . . . . . . . . . . . . . . . . . 5Late-Fall-Run-Sized Chinook Salmon . . . . . . . . . . . . . . . . . . . . . . . . . . 12Winter-Run-Sized Chinook Salmon . . . . . . . . . . . . . . . . . . . . . . . . . . . . 13Spring-Run-Sized Chinook Salmon . . . . . . . . . . . . . . . . . . . . . . . . . . . . 17Fall-Run-Sized Chinook Salmon . . . . . . . . . . . . . . . . . . . . . . . . . . . . . . 17
Steelhead Trout Emigration . . . . . . . . . . . . . . . . . . . . . . . . . . . . . . . . . . . . . . . 18Adult Steelhead . . . . . . . . . . . . . . . . . . . . . . . . . . . . . . . . . . . . . . . . . . . 18Yearling Steelhead . . . . . . . . . . . . . . . . . . . . . . . . . . . . . . . . . . . . . . . . 19
RST Gear Efficiency Using Mark-Recapture . . . . . . . . . . . . . . . . . . . . . . . . . . . . . . . . 21Relative Abundance Estimates . . . . . . . . . . . . . . . . . . . . . . . . . . . . . . . . . . . . . . . . . . . 21
ACKNOWLEDGMENTS . . . . . . . . . . . . . . . . . . . . . . . . . . . . . . . . . . . . . . . . . . . . . . . . . . . . 26
REFERENCES . . . . . . . . . . . . . . . . . . . . . . . . . . . . . . . . . . . . . . . . . . . . . . . . . . . . . . . . . . . . 26
FIGURES . . . . . . . . . . . . . . . . . . . . . . . . . . . . . . . . . . . . . . . . . . . . . . . . . . . . . . . . . . . . . . . . 28
APPENDIX . . . . . . . . . . . . . . . . . . . . . . . . . . . . . . . . . . . . . . . . . . . . . . . . . . . . . . . . . . . . . . A-1
iii
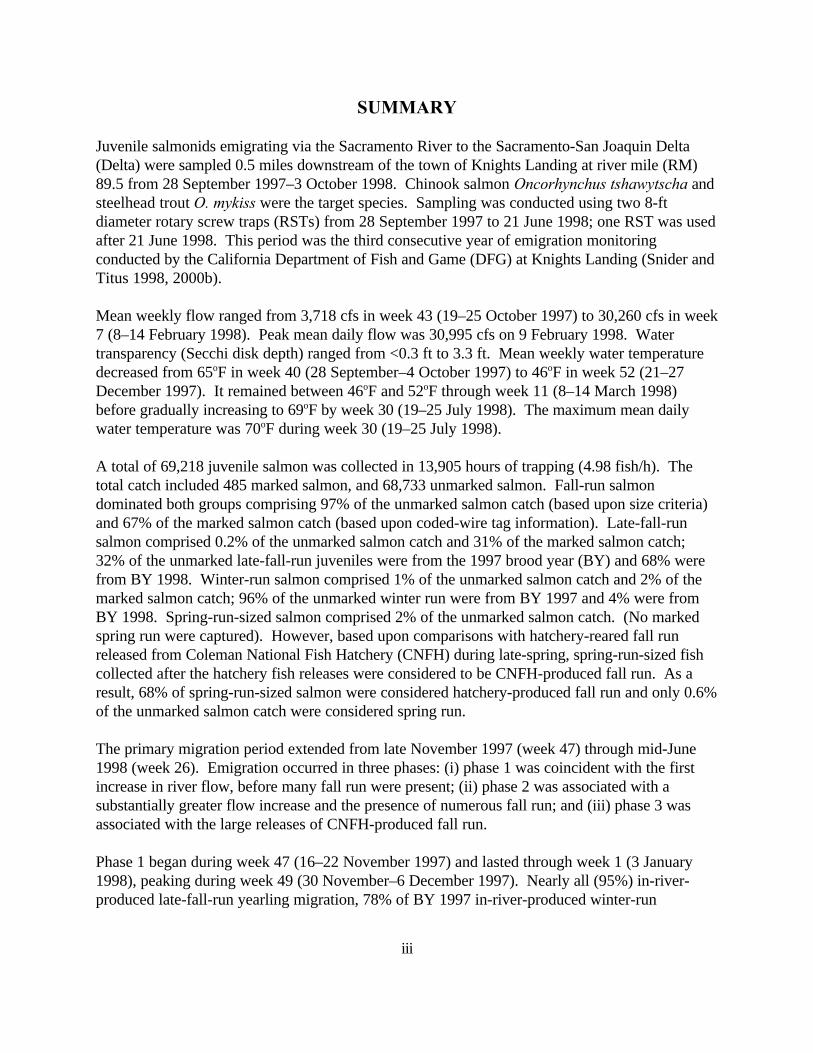
SUMMARY
Juvenile salmonids emigrating via the Sacramento River to the Sacramento-San Joaquin Delta(Delta) were sampled 0.5 miles downstream of the town of Knights Landing at river mile (RM)89.5 from 28 September 1997–3 October 1998. Chinook salmon Oncorhynchus tshawytscha andsteelhead trout O. mykiss were the target species. Sampling was conducted using two 8-ftdiameter rotary screw traps (RSTs) from 28 September 1997 to 21 June 1998; one RST was usedafter 21 June 1998. This period was the third consecutive year of emigration monitoringconducted by the California Department of Fish and Game (DFG) at Knights Landing (Snider andTitus 1998, 2000b).
Mean weekly flow ranged from 3,718 cfs in week 43 (19–25 October 1997) to 30,260 cfs in week7 (8–14 February 1998). Peak mean daily flow was 30,995 cfs on 9 February 1998. Watertransparency (Secchi disk depth) ranged from <0.3 ft to 3.3 ft. Mean weekly water temperaturedecreased from 65oF in week 40 (28 September–4 October 1997) to 46oF in week 52 (21–27December 1997). It remained between 46oF and 52oF through week 11 (8–14 March 1998)before gradually increasing to 69oF by week 30 (19–25 July 1998). The maximum mean dailywater temperature was 70oF during week 30 (19–25 July 1998).
A total of 69,218 juvenile salmon was collected in 13,905 hours of trapping (4.98 fish/h). Thetotal catch included 485 marked salmon, and 68,733 unmarked salmon. Fall-run salmondominated both groups comprising 97% of the unmarked salmon catch (based upon size criteria)and 67% of the marked salmon catch (based upon coded-wire tag information). Late-fall-runsalmon comprised 0.2% of the unmarked salmon catch and 31% of the marked salmon catch;32% of the unmarked late-fall-run juveniles were from the 1997 brood year (BY) and 68% werefrom BY 1998. Winter-run salmon comprised 1% of the unmarked salmon catch and 2% of themarked salmon catch; 96% of the unmarked winter run were from BY 1997 and 4% were fromBY 1998. Spring-run-sized salmon comprised 2% of the unmarked salmon catch. (No markedspring run were captured). However, based upon comparisons with hatchery-reared fall runreleased from Coleman National Fish Hatchery (CNFH) during late-spring, spring-run-sized fishcollected after the hatchery fish releases were considered to be CNFH-produced fall run. As aresult, 68% of spring-run-sized salmon were considered hatchery-produced fall run and only 0.6%of the unmarked salmon catch were considered spring run.
The primary migration period extended from late November 1997 (week 47) through mid-June1998 (week 26). Emigration occurred in three phases: (i) phase 1 was coincident with the firstincrease in river flow, before many fall run were present; (ii) phase 2 was associated with asubstantially greater flow increase and the presence of numerous fall run; and (iii) phase 3 wasassociated with the large releases of CNFH-produced fall run.
Phase 1 began during week 47 (16–22 November 1997) and lasted through week 1 (3 January1998), peaking during week 49 (30 November–6 December 1997). Nearly all (95%) in-river-produced late-fall-run yearling migration, 78% of BY 1997 in-river-produced winter-run
iv
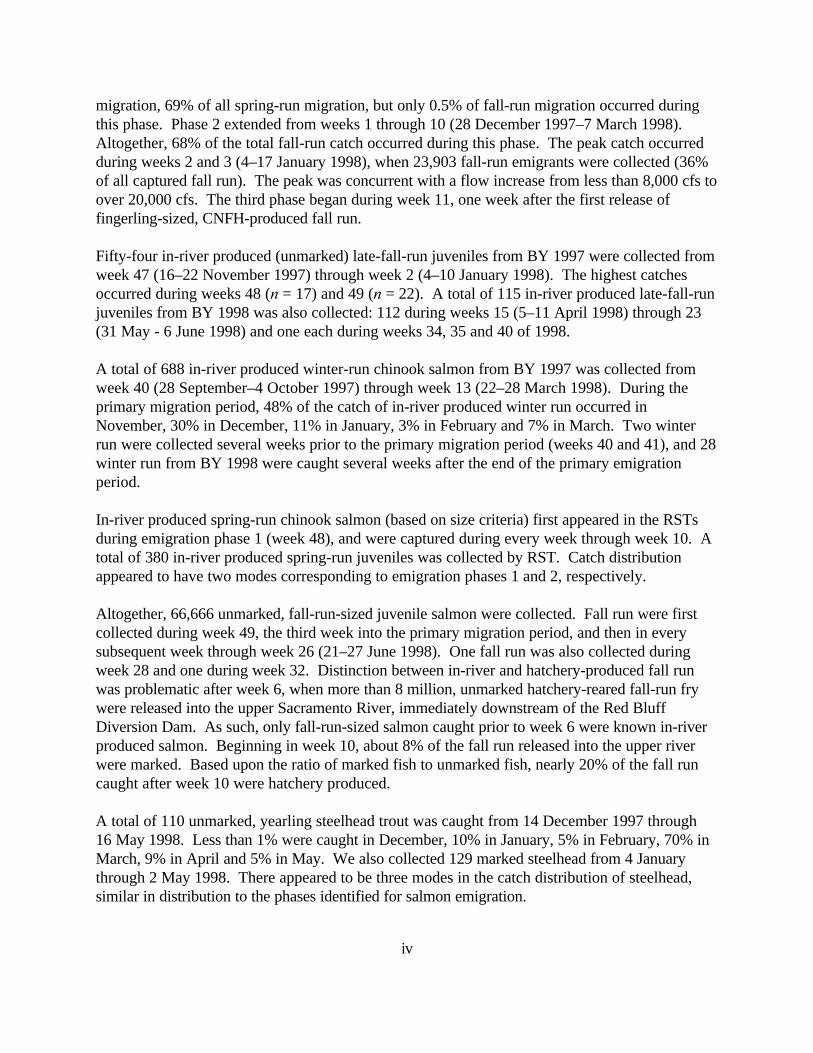
migration, 69% of all spring-run migration, but only 0.5% of fall-run migration occurred duringthis phase. Phase 2 extended from weeks 1 through 10 (28 December 1997–7 March 1998). Altogether, 68% of the total fall-run catch occurred during this phase. The peak catch occurredduring weeks 2 and 3 (4–17 January 1998), when 23,903 fall-run emigrants were collected (36%of all captured fall run). The peak was concurrent with a flow increase from less than 8,000 cfs toover 20,000 cfs. The third phase began during week 11, one week after the first release offingerling-sized, CNFH-produced fall run.
Fifty-four in-river produced (unmarked) late-fall-run juveniles from BY 1997 were collected fromweek 47 (16–22 November 1997) through week 2 (4–10 January 1998). The highest catchesoccurred during weeks 48 (n = 17) and 49 (n = 22). A total of 115 in-river produced late-fall-runjuveniles from BY 1998 was also collected: 112 during weeks 15 (5–11 April 1998) through 23(31 May - 6 June 1998) and one each during weeks 34, 35 and 40 of 1998.
A total of 688 in-river produced winter-run chinook salmon from BY 1997 was collected fromweek 40 (28 September–4 October 1997) through week 13 (22–28 March 1998). During theprimary migration period, 48% of the catch of in-river produced winter run occurred inNovember, 30% in December, 11% in January, 3% in February and 7% in March. Two winterrun were collected several weeks prior to the primary migration period (weeks 40 and 41), and 28winter run from BY 1998 were caught several weeks after the end of the primary emigrationperiod.
In-river produced spring-run chinook salmon (based on size criteria) first appeared in the RSTsduring emigration phase 1 (week 48), and were captured during every week through week 10. Atotal of 380 in-river produced spring-run juveniles was collected by RST. Catch distributionappeared to have two modes corresponding to emigration phases 1 and 2, respectively.
Altogether, 66,666 unmarked, fall-run-sized juvenile salmon were collected. Fall run were firstcollected during week 49, the third week into the primary migration period, and then in everysubsequent week through week 26 (21–27 June 1998). One fall run was also collected duringweek 28 and one during week 32. Distinction between in-river and hatchery-produced fall runwas problematic after week 6, when more than 8 million, unmarked hatchery-reared fall-run frywere released into the upper Sacramento River, immediately downstream of the Red BluffDiversion Dam. As such, only fall-run-sized salmon caught prior to week 6 were known in-riverproduced salmon. Beginning in week 10, about 8% of the fall run released into the upper riverwere marked. Based upon the ratio of marked fish to unmarked fish, nearly 20% of the fall runcaught after week 10 were hatchery produced.
A total of 110 unmarked, yearling steelhead trout was caught from 14 December 1997 through 16 May 1998. Less than 1% were caught in December, 10% in January, 5% in February, 70% inMarch, 9% in April and 5% in May. We also collected 129 marked steelhead from 4 Januarythrough 2 May 1998. There appeared to be three modes in the catch distribution of steelhead,similar in distribution to the phases identified for salmon emigration.

v
Estimates of the relative abundance of juvenile salmonids emigrating past Knights Landing areprovided based upon a mean RST efficiency of 0.80% (range: 0.0%–4.08%; SD = 0.96%; 80%CI: 0.53%–1.07%; n = 22). The estimated number of in-river salmon that passed KnightsLanding included 9,625 BY 1997 late-fall run and 16,250 BY 1998 late-fall run; 108,000 BY1997 winter run and 3,500 BY 1998 winter run; 54,250 spring run; and 8,458,150 fall run. Theestimated number of in-river produced yearling steelhead passing Knights Landing was 8,634.
The estimated number of hatchery-produced chinook salmon passing Knights Landing was 19,875late-fall run, 1,125 winter run, and 575,269 fall run. The estimated number of hatchery-producedsteelhead trout passing Knights Landing was 22,259.
Emigration from the upper Sacramento River system to the Delta is exclusively through KnightsLanding until flow increases require diversion through the Sutter Bypass, upstream of KnightsLanding. Typically, diversion to the bypass via the Tisdale Weir occurs when flow exceeds about23,000 cfs. In 1998, flow exceeded 23,000 cfs during week 4 and remained above that levelthrough most of the primary emigration period. Since the proportion of juvenile salmonids thatemigrates through the bypass is unknown, the magnitude of salmonids emigrating to the Deltacannot be estimated by just using Knights Landing results. However, the temporal distributionand, likely, the relative abundance of juvenile salmonids migrating toward the Delta are reflectedin the Knights Landing results.
1 Listed as endangered under both the California and Federal Endangered Species acts.
1
INTRODUCTION
Juvenile anadromous salmonid emigration was monitored on the Sacramento River near KnightsLanding (RM 89.5) for the third consecutive year (Snider and Titus 1998, Snider and Titus2000b). Monitoring was conducted to develop information on timing, composition (race andspecies), and relative abundance of juvenile chinook salmon Oncorhynchus tshawytscha andsteelhead O. mykiss emigrating from the upper Sacramento River system. This informationprovides early warning of emigration into the Sacramento-San Joaquin Delta (Delta) to enableimplementation of management actions deemed necessary to protect juvenile anadromoussalmonids as they pass into and through the Delta. Data acquired over several years will improveunderstanding of the attributes of emigration and identify implications of management actionsboth up- and downstream of the Delta relative to protection and recovery of the SacramentoRiver’s anadromous salmonid populations.
The indigenous, anadromous salmonid populations of California’s Central Valley have beenseverely reduced due to a variety of man-caused alterations to their environment. The region’schinook salmon and steelhead trout populations have been extirpated from most of their historicrange and the existence of the few remaining depleted populations is constantly challenged. Beginning in the mid-1800's through the mid-1900's, the construction of dams on most of themajor streams within the Valley progressively eliminated use of more than 90% of these fishes’historic habitat. Changes in water quality and drastic modifications in stream channel form beganwith the unbridled quest for gold in 1849 and continue today with escalating urban expansion andintensive agriculture and industrial development. Stream channels have been modified to protectcities and agriculture. Pollutants ranging from elevated water temperatures to urban andagricultural runoff and associated, sophisticated toxicants, including pesticides and treatedeffluent, have further degraded much of the region’s stream habitats. Increasing water diversioncontinues to modify the timing and magnitude of flow that sustain most of the remaining habitat.
Emigrating fish are continually lost as they attempt to navigate the many diversions that liebetween their natal streams and the Pacific Ocean. Potentially, the most imposing of thesediversions are the State Water Project’s Harvey Banks Delta Pumping Plant and the CentralValley Project’s Tracy Pumping Plant both located in the southern Sacramento-San JoaquinDelta. The work summarized in this report is a portion of an ongoing effort upon the part ofwater developers and fishery managers to reduce the deleterious impacts of these facilities onCentral Valley salmon and steelhead, to preserve one of California’s valued natural heritages.
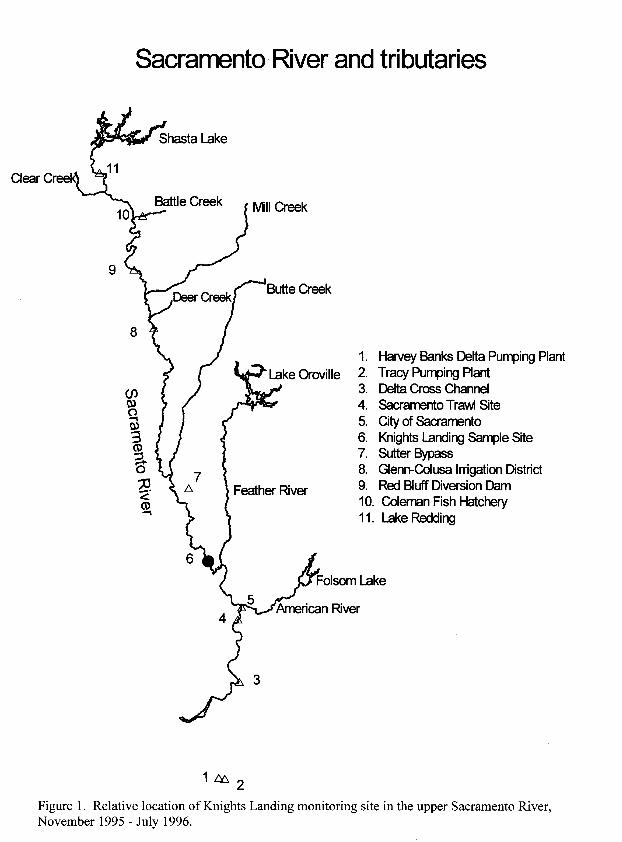
Anadromous salmonids produced in the Sacramento River system upstream of the Feather River(RM 80) are of special concern. The upper Sacramento River and several of its tributaries (Figure 1) provide most of the essential spawning and rearing habitat for the Central Valley’sdepleted, anadromous salmonid populations. The winter-run chinook salmon1, unique toCalifornia’s Central Valley, spawns and rears exclusively in the upper Sacramento River. Central

2Listed as threatened under both the California and Federal Endangered Species acts.
3Listed as threatened under the Federal Endangered Species Act.
2
Valley spring-run chinook salmon2 are nearly exclusive to the upper Sacramento system whereremnant populations occur in a few isolated locations including Deer, Mill and Butte creeks(Figure 1). All late-fall-run chinook salmon, most steelhead trout3 and a major portion of thenatural, or in-river-produced, fall-run chinook salmon spawn and rear in the upper SacramentoRiver and its tributaries. The continued existence of these populations could well depend uponthe ability to protect the juveniles as they emigrate from their natal waters, into and through theDelta on their way to the Pacific Ocean.
Accurate estimates of the abundance and timing of emigrating anadromous salmonids as theyenter the Delta would improve the ability to address critical water management questions. Watermanagement activities in the Delta can influence survival of anadromous salmonids. Variousrestrictions have been placed on project operations to protect juvenile salmonids migratingthrough and residing within the Delta. For example, Delta diversions are limited seasonallypredicated on the presence of winter-run chinook salmon. Water management decisions could beconsidered for the other anadromous salmonids under increasing concern (i.e., spring-run chinooksalmon and steelhead trout) if better information existed on timing, abundance, and overallemigration attributes. Improved estimates of the timing and relative abundance of these species asthey enter the Delta should improve confidence in defining impacts and protective measures toenhance overall protection, and potentially maximize water management flexibility.
An appropriately located and operated monitoring site would provide early warning of emigratingjuvenile salmonids entering the Delta and improve the ability to use water project flexibility andother actions to protect winter-run chinook salmon and, potentially, other anadromous species ofconcern. As such, representatives of agencies involved in fishery and water management issueswithin the Central Valley recommended establishing a monitoring station to:
1) Provide early warning to trigger Central Valley Project and State Water Project operationmodifications (e.g., manipulation of Delta Cross Channel gate operation and water exportlevels).
2) Provide a monitoring station intermediate between the Glenn-Colusa Irrigation District(GCID) diversion and the Delta.
3) Provide opportunity to follow movement of juvenile salmonids downstream in response tovarious environmental conditions, including flow.
4) Determine the relative proportion of winter-run chinook salmon fry and pre-smolts thatenter and potentially rear in the lower river and Delta through the fall and early-wintermonths.
5) Develop abundance estimates for juvenile salmonids entering the lower river and Delta.

4Emigrants can enter the Sutter Bypass, upstream of Knights Landing when flow in thevicinity of the bypass surpasses 23,000 cfs. The proportion of emigrants entering the bypass isunknown; their survival to the Delta is also unknown.
3
To address the feasibility of monitoring the timing and abundance of juvenile anadromoussalmonids emigrating exclusively from the upper Sacramento River system into the Sacramento-San Joaquin Delta, a pilot monitoring station was established near Knights Landing on theSacramento River at RM 89.5 (Figure 1) in November 1995. Potentially, progenies of all CentralValley winter run and late-fall run, most spring run, a major portion of fall run, and most in-riverproduced steelhead trout emigrate past the Knights Landing sampling site4. Other monitoringprograms within the Sacramento River system are either too far upstream of the Delta toaccurately monitor the timing and abundance of emigration into the Delta (e.g., Red BluffDiversion Dam (RBDD) at RM 245 and GCID diversion at RM 206), or are too close to theDelta and can have difficulty in discriminating fish originating from the upper Sacramento Riversystem and those produced in the Feather and American rivers (e.g., Sacramento at RM 55).
Knights Landing was selected as the pilot monitoring site, relative to downstream locations, dueto apparent favorable channel and flow conditions. It appeared to have greater opportunity forusing a diversity of fish sampling methods including relatively efficient gear types such as rotaryscrew traps (RSTs). The river channel is relatively narrow and there is less flow than in theSacramento River downstream of the Feather and American rivers and upstream of the SutterBypass. The site also provided an intermediate monitoring point between GCID, the nextsampling station upstream (RM 206), and the Delta.
METHODS
Juvenile salmonids emigrating via the Sacramento River to the Delta were sampled 0.5 milesdownstream of the town of Knights Landing at RM 89.5 (Figure 1). Sampling occurred from 28September 1997 through 21 June 1998 using two 8-ft diameter RSTs; one RST was used from 22June 1998 through 3 October 1998.
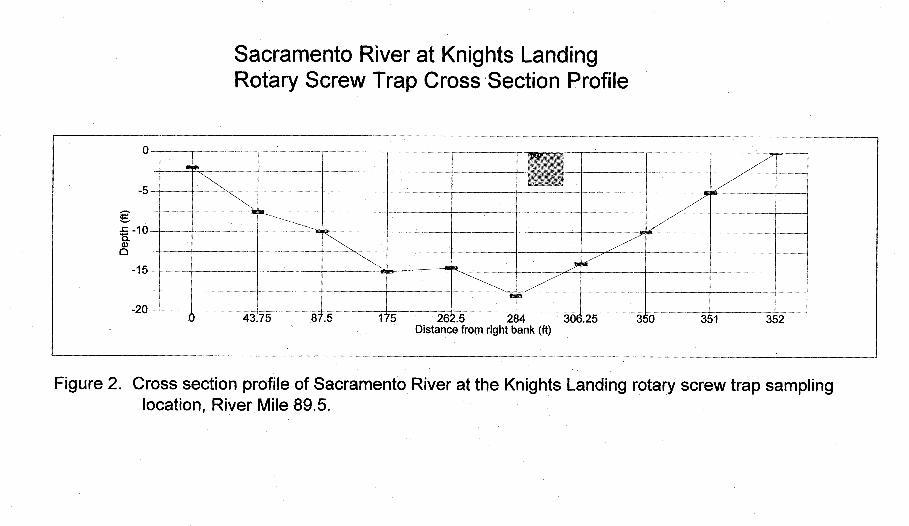
The two RSTs were lashed together and located on the outside of a wide bend in the riverapproximately 100 ft from the east bank. Three 40-pound Dansforth anchors and 3/8" diameterwire ropes were used to position and secure the two traps in the stream channel. The trapcomplex was also secured to the east bank with a safety line of 1/4" diameter wire rope. Waterdepth at the trap location was 20 ft at a flow of 15,000 cfs; mean current velocity was 3.0 ft/s. The sample site cross sectional profile measured at 10,000 cfs is presented in Figure 2.
Data acquired from each trap per servicing included total time fished since the last servicing,current velocity at the trap opening, the average number of cone revolutions per minute, and the
5Salmon race was determined using size-at-time criteria developed by Frank Fisher(California Department of Fish and Game, Northern California - North Coast Region, unpubl.data).
4
cumulative number of cone revolutions since the last servicing. All salmonids were counted byspecies, and race for chinook salmon5. All salmon classified as winter run, spring run and late-fallrun were measured (fork length [FL] in mm and weight in g). At each trap servicing, up to 150fall-run-sized salmon per trap were selected and measured using a random-stratified subsamplingprotocol. All juvenile steelhead trout were counted and measured. The traps were serviced up totwo times per day: once in mid-morning and once near dusk.
The data are reported on a weekly time step to smooth variation in effort and trap efficiency whileretaining sufficient detail to evaluate trends in timing and abundance. Data were typically reducedto weekly sums or weekly means. Weeks began on Sunday and ended on Saturday and wereidentified by number. Week 1 was defined as the first week of 1998 (i.e., contains 1 January1998). Weeks prior to week 1 were consecutively numbered in descending order from 52; weeksafter week 1 were numbered in ascending order.
Flow at Knights Landing was obtained from records of the U. S. Geological Survey gagingstation at Wilkins Slough. Water transparency was measured each day at the RST using a Secchidisk following standard methods (Orth 1983). Water temperature was measured using electronicrecording thermographs beginning in week 44 of 1997. Prior to week 44, temperature wasmeasured during each trap servicing using a hand-held thermometer.
Trap efficiency was evaluated using a mark-and-recapture technique. All trapped chinook salmon(except winter-run-sized chinook) were marked using Bismark Brown Y stain (e.g. Deacon 1961)then released about 0.5 miles upstream of the traps. Efficiency was calculated as the percentageof marked fish that were recaptured in the traps on a weekly basis. Salmon were generallymarked and released each day beginning in week 2 (4 January 1998). Our objective was to markand release at least 100 salmon per trial. When <100 salmon were collected in a day, fish wereheld until >100 fish were available for marking, or up to 3 days maximum, whichever occurredfirst.
All adipose-fin clipped (marked) fish were collected and coded-wire tags (CWTs) were read todetermine the fish’s origin including race. Information on race derived from the tag wascompared with the original race designation based upon size. Race classification was changed toreflect the tag data for individual fish and groups of fish when the tagged fish appeared torepresent the unmarked portion of the catch.
5
RESULTS and DISCUSSION
General Sampling Conditions
Mean weekly flow ranged from 3,718 cfs in week 43 (19–25 October 1997) to 30,260 cfs in week7 (8–14 February 1998) (Table 1). Mean daily flow peaked at 30,995 cfs on 9 February 1998(Figure 3). Mean weekly water temperature decreased from 65 oF in week 40 (28 September–4October 1997) to 46 oF in week 52 (21–27 December 1997) (Table 1). It then remained between46 oF and 52 oF through week 11 (8–14 March 1998) before gradually increasing to 69 oF byweek 30 (19–25 July 1998). The minimum mean daily temperature was 45 oF during week 52 (21–27 December 1997) and the maximum mean daily temperature was 70 oF during week 30 (19–25 July 1998) (Figure 3).
Mean daily water temperature was weakly negatively correlated with mean daily river flow r =!0.44), and although there was a significant linear regression (p<0.0001) of temperature on flow,the model only explained about 19% of the variation in temperature as a function of flow. Looking at temperature by date (Figure 3), it seems evident that water temperature at KnightsLanding is primarily a function of seasonal variation in ambient temperature (i.e., cold in winter,warm in summer, with an overall gradual increase or decrease in thermograph during theintervening seasons).
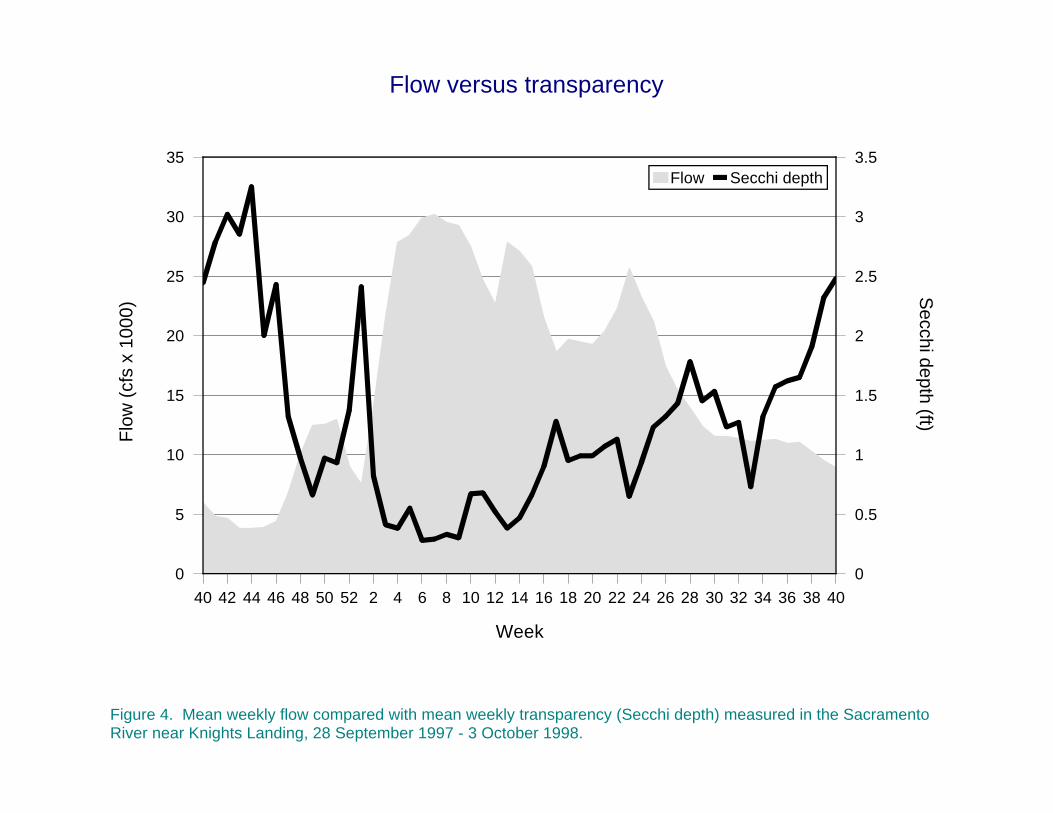
Water transparency (Secchi disk depth) was very poor throughout the survey (Figure 4), andranged from <0.3 ft to 3.3 ft (Table 1). Transparency was inversely related to flow. Meanweekly transparency (as ln Secchi disk depth) was highly negatively correlated r = !0.88) withmean weekly river flow. There was a good linear fit (r2 = 0.78, p<0.0001) of ln transparency onflow (Appendix Figure 1).
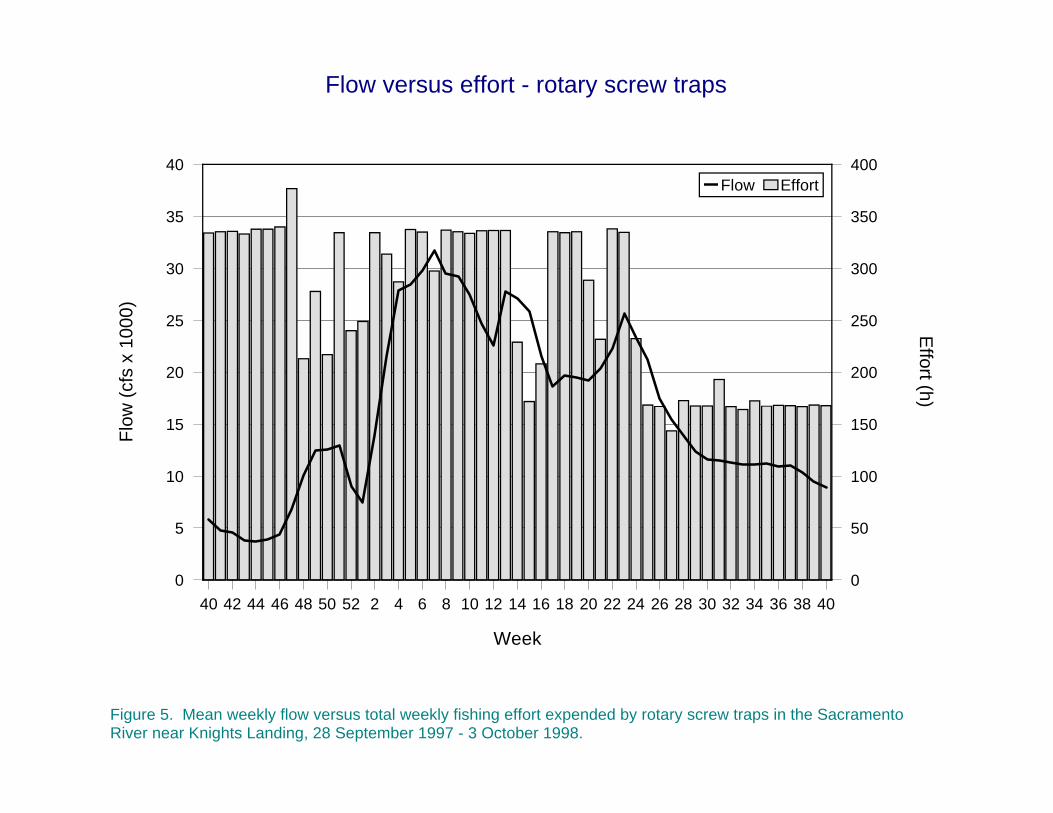
The two RSTs were successfully operated within a fairly wide range of flows (<4,000 to >30,000cfs; Figure 5). Interruptions in sampling were typically less than 24 h within a week and weregenerally due to debris buildup that disabled the traps. Longer interruptions occurred duringweeks 48 and 52 of 1997 and week 1 of 1998 when the traps were raised during holidays. Debris-induced interruptions occurred during weeks 50 (7–13 December 1997) and 14, 15 and 16(29 March–18 April 1998). The only week during which neither trap was fishing for more than24 h at a time was week 50. Overall, the two RSTs fished nearly 87% of the time averaging 291h/week out of a possible 336 h.
Rotary Screw Trap Results
Chinook Salmon Emigration
Two juvenile salmon were captured by RST prior to the typical initiation of the primary migrationperiod (late November; Snider and Titus 1998). One winter-run-sized salmon was collected on 3October 1997 (week 40), and a second winter run was caught on 6 October 1997

6
Table 1. Summary of mean weekly sampling conditions in the Sacramento River nearKnights Landing during juvenile salmonid emigration investigation, 28 September1997–3 October 1998.
Week Beginning
date Mean flow
(cfs) Mean water
temperature (oF) Mean Secchi depth
(ft)
40 28 Sep 1997 5,781 65 2.4
41 5 Oct 1997 4,836 62 2.8
42 12 Oct 1997 4,408 61 3.0
43 19 Oct 1997 3,718 63 2.9
44 26 Oct 1997 3,778 59 3.3
45 2 Nov 1997 3,892 61 2.0
46 9 Nov 1997 4,396 56 2.4
47 16 Nov 1997 6,807 54 1.3
48 23 Nov 1997 10,004 55 1.0
49 30 Nov 1997 12,471 51 0.7
50 7 Dec 1997 12,529 50 1.0
51 14 Dec 1997 12,965 48 1.0
52 21 Dec 1997 9,016 46 1.4
1 28 Dec 1997 7,490 47 2.3
2 4 Jan 1998 13,943 48 0.8
3 11 Jan 1998 21,466 49 0.5
4 18 Jan 1998 27,830 50 0.4
5 25 Jan 1998 28,426 50 0.6
6 1 Feb 1998 29,781 50 0.3
7 8 Feb 1998 30,260 49 0.3
8 15 Feb 1998 29,510 49 0.3
9 22 Feb 1998 29,240 49 0.3
10 1 Mar 1998 27,465 51 0.7
11 8 Mar 1998 24,690 51 0.7
12 15 Mar 1998 22,615 57 0.5
13 22 Mar 1998 27,782 54 0.4

7
Table 1 (continued)
Week Beginning dateMean flow
(cfs)Mean water
temperature (oF)Mean Secchi depth
(ft)
14 29 Mar 1998 27,069 52 0.5
15 5 Apr 1998 25,824 53 0.7
16 12 Apr 1998 21,529 55 0.9
17 19 Apr 1998 18,606 60 1.3
18 26 Apr 1998 19,679 61 1.0
19 3 May 1998 19,460 59 1.0
20 10 May 1998 19,248 57 1.0
21 17 May 1998 20,300 59 1.1
22 24 May 1998 22,317 58 1.1
23 31 May 1998 25,639 61 0.7
24 7 Jun 1998 23,183 62 1.0
25 14 Jun 1998 21,217 64 1.2
26 21 Jun 1998 17,417 65 1.3
27 28 Jun 1998 14,932 65 1.4
28 5 Jul 1998 13,895 68 1.8
29 12 Jul 1998 12,329 68 1.5
30 19 Jul 1998 11,555 69 1.5
31 26 Jul 1998 11,472 69 1.2
32 2 Aug 1998 11,306 69 1.3
33 9 Aug 1998 11,136 69 1.1
34 16 Aug 1998 11,154 67 1.3
35 23 Aug 1998 11,250 66 1.6
36 30 Aug 1998 10,976 68 1.6
37 6 Sep 1998 11,032 67 1.7
38 13 Sep 1998 10,311 67 1.9
39 20 Sep 1998 9,509 64 2.3
40 27 Sep 1998 8,920 64 2.5
8
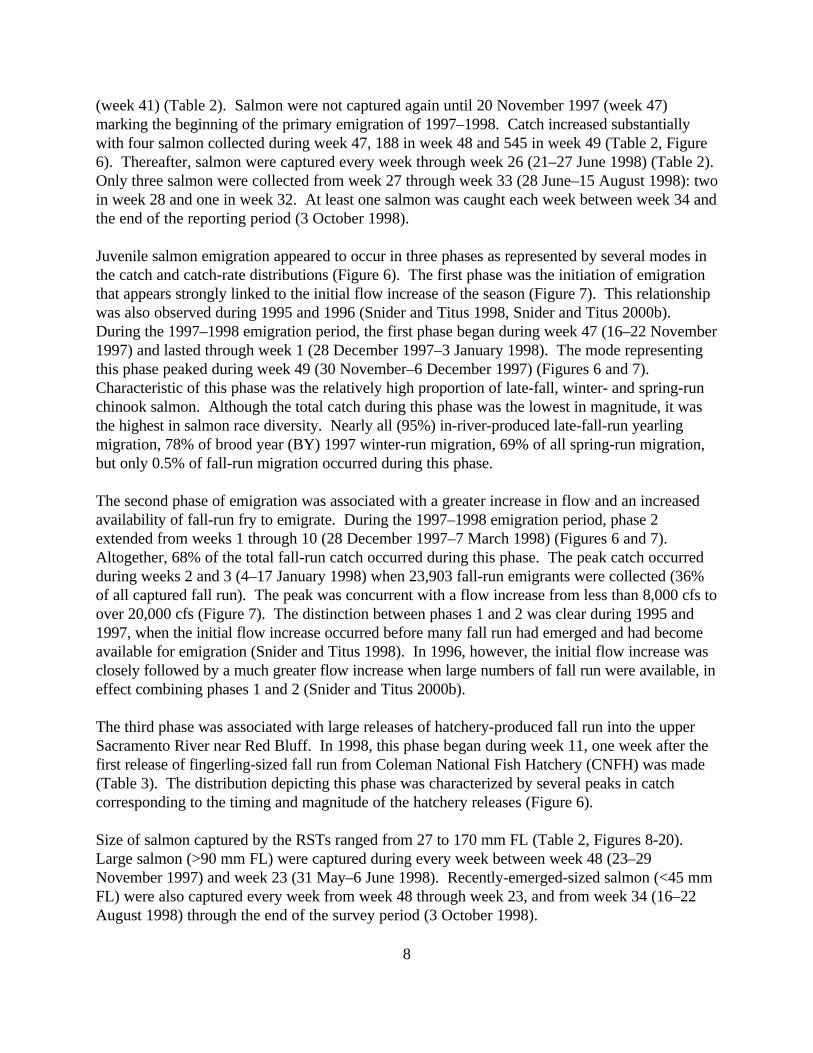
(week 41) (Table 2). Salmon were not captured again until 20 November 1997 (week 47)marking the beginning of the primary emigration of 1997–1998. Catch increased substantiallywith four salmon collected during week 47, 188 in week 48 and 545 in week 49 (Table 2, Figure6). Thereafter, salmon were captured every week through week 26 (21–27 June 1998) (Table 2). Only three salmon were collected from week 27 through week 33 (28 June–15 August 1998): twoin week 28 and one in week 32. At least one salmon was caught each week between week 34 andthe end of the reporting period (3 October 1998).
Juvenile salmon emigration appeared to occur in three phases as represented by several modes inthe catch and catch-rate distributions (Figure 6). The first phase was the initiation of emigrationthat appears strongly linked to the initial flow increase of the season (Figure 7). This relationshipwas also observed during 1995 and 1996 (Snider and Titus 1998, Snider and Titus 2000b). During the 1997–1998 emigration period, the first phase began during week 47 (16–22 November1997) and lasted through week 1 (28 December 1997–3 January 1998). The mode representingthis phase peaked during week 49 (30 November–6 December 1997) (Figures 6 and 7). Characteristic of this phase was the relatively high proportion of late-fall, winter- and spring-runchinook salmon. Although the total catch during this phase was the lowest in magnitude, it wasthe highest in salmon race diversity. Nearly all (95%) in-river-produced late-fall-run yearlingmigration, 78% of brood year (BY) 1997 winter-run migration, 69% of all spring-run migration,but only 0.5% of fall-run migration occurred during this phase.
The second phase of emigration was associated with a greater increase in flow and an increasedavailability of fall-run fry to emigrate. During the 1997–1998 emigration period, phase 2extended from weeks 1 through 10 (28 December 1997–7 March 1998) (Figures 6 and 7). Altogether, 68% of the total fall-run catch occurred during this phase. The peak catch occurredduring weeks 2 and 3 (4–17 January 1998) when 23,903 fall-run emigrants were collected (36%of all captured fall run). The peak was concurrent with a flow increase from less than 8,000 cfs toover 20,000 cfs (Figure 7). The distinction between phases 1 and 2 was clear during 1995 and1997, when the initial flow increase occurred before many fall run had emerged and had becomeavailable for emigration (Snider and Titus 1998). In 1996, however, the initial flow increase wasclosely followed by a much greater flow increase when large numbers of fall run were available, ineffect combining phases 1 and 2 (Snider and Titus 2000b).
The third phase was associated with large releases of hatchery-produced fall run into the upperSacramento River near Red Bluff. In 1998, this phase began during week 11, one week after thefirst release of fingerling-sized fall run from Coleman National Fish Hatchery (CNFH) was made(Table 3). The distribution depicting this phase was characterized by several peaks in catchcorresponding to the timing and magnitude of the hatchery releases (Figure 6).
Size of salmon captured by the RSTs ranged from 27 to 170 mm FL (Table 2, Figures 8-20). Large salmon (>90 mm FL) were captured during every week between week 48 (23–29November 1997) and week 23 (31 May–6 June 1998). Recently-emerged-sized salmon (<45 mmFL) were also captured every week from week 48 through week 23, and from week 34 (16–22August 1998) through the end of the survey period (3 October 1998).
9
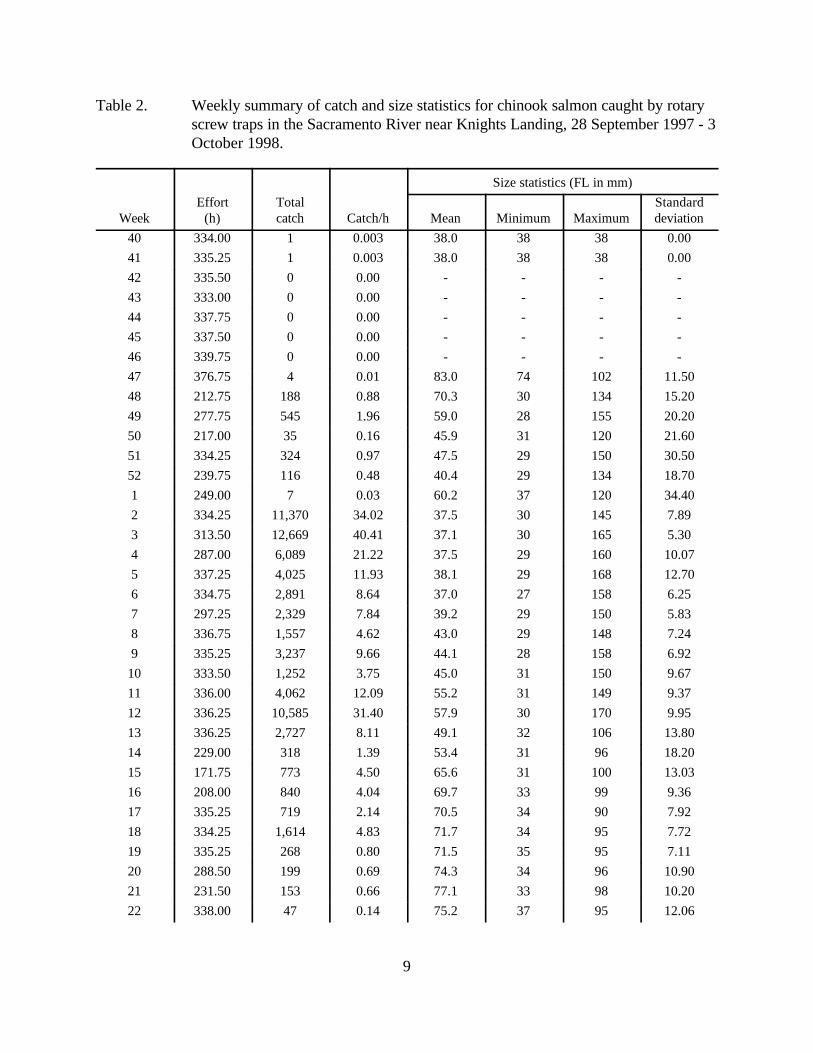
Table 2. Weekly summary of catch and size statistics for chinook salmon caught by rotaryscrew traps in the Sacramento River near Knights Landing, 28 September 1997 - 3October 1998.
WeekEffort
(h)Totalcatch Catch/h
Size statistics (FL in mm)
Mean Minimum MaximumStandarddeviation
40 334.00 1 0.003 38.0 38 38 0.00
41 335.25 1 0.003 38.0 38 38 0.00
42 335.50 0 0.00 - - - -
43 333.00 0 0.00 - - - -
44 337.75 0 0.00 - - - -
45 337.50 0 0.00 - - - -
46 339.75 0 0.00 - - - -
47 376.75 4 0.01 83.0 74 102 11.50
48 212.75 188 0.88 70.3 30 134 15.20
49 277.75 545 1.96 59.0 28 155 20.20
50 217.00 35 0.16 45.9 31 120 21.60
51 334.25 324 0.97 47.5 29 150 30.50
52 239.75 116 0.48 40.4 29 134 18.70
1 249.00 7 0.03 60.2 37 120 34.40
2 334.25 11,370 34.02 37.5 30 145 7.89
3 313.50 12,669 40.41 37.1 30 165 5.30
4 287.00 6,089 21.22 37.5 29 160 10.07
5 337.25 4,025 11.93 38.1 29 168 12.70
6 334.75 2,891 8.64 37.0 27 158 6.25
7 297.25 2,329 7.84 39.2 29 150 5.83
8 336.75 1,557 4.62 43.0 29 148 7.24
9 335.25 3,237 9.66 44.1 28 158 6.92
10 333.50 1,252 3.75 45.0 31 150 9.67
11 336.00 4,062 12.09 55.2 31 149 9.37
12 336.25 10,585 31.40 57.9 30 170 9.95
13 336.25 2,727 8.11 49.1 32 106 13.80
14 229.00 318 1.39 53.4 31 96 18.20
15 171.75 773 4.50 65.6 31 100 13.03
16 208.00 840 4.04 69.7 33 99 9.36
17 335.25 719 2.14 70.5 34 90 7.92
18 334.25 1,614 4.83 71.7 34 95 7.72
19 335.25 268 0.80 71.5 35 95 7.11
20 288.50 199 0.69 74.3 34 96 10.90
21 231.50 153 0.66 77.1 33 98 10.20
22 338.00 47 0.14 75.2 37 95 12.06

10
23 334.50 210 0.63 69.4 32 117 17.90
Table 2 (Continued)
WeekEffort
(h)Totalcatch Catch/h
Size statistics (FL in mm)
Mean Minimum MaximumStandarddeviation
24 232.25 15 0.06 73.3 61 83 5.71
25 168.50 11 0.07 77.5 70 89 4.81
26 167.00 3 0.02 75.0 75 75 0.00
27 143.50 0 0.00 67.0 67 67 0.00
28 172.75 2 0.01 90.5 83 98 7.50
29 167.50 0 0.00 - - - -
30 167.50 0 0.00 - - - -
31 193.00 0 0.00 - - - -
32 166.75 1 0.006 87.0 87 87 0.00
33 164.00 0 0.00 - - - -
34 172.50 4 0.02 45.5 35 76 17.61
35 167.25 4 0.02 40.0 36 49 5.24
36 168.00 5 0.03 36.4 34 39 1.85
37 167.75 1 0.006 48.0 48 48 0.00
38 166.75 5 0.03 38.0 37 39 0.89
39 168.50 3 0.02 36.0 34 38 1.63
40 167.75 9 0.05 40.2 31 77 13.16
Total 13,905.25 69,218 4.98
11
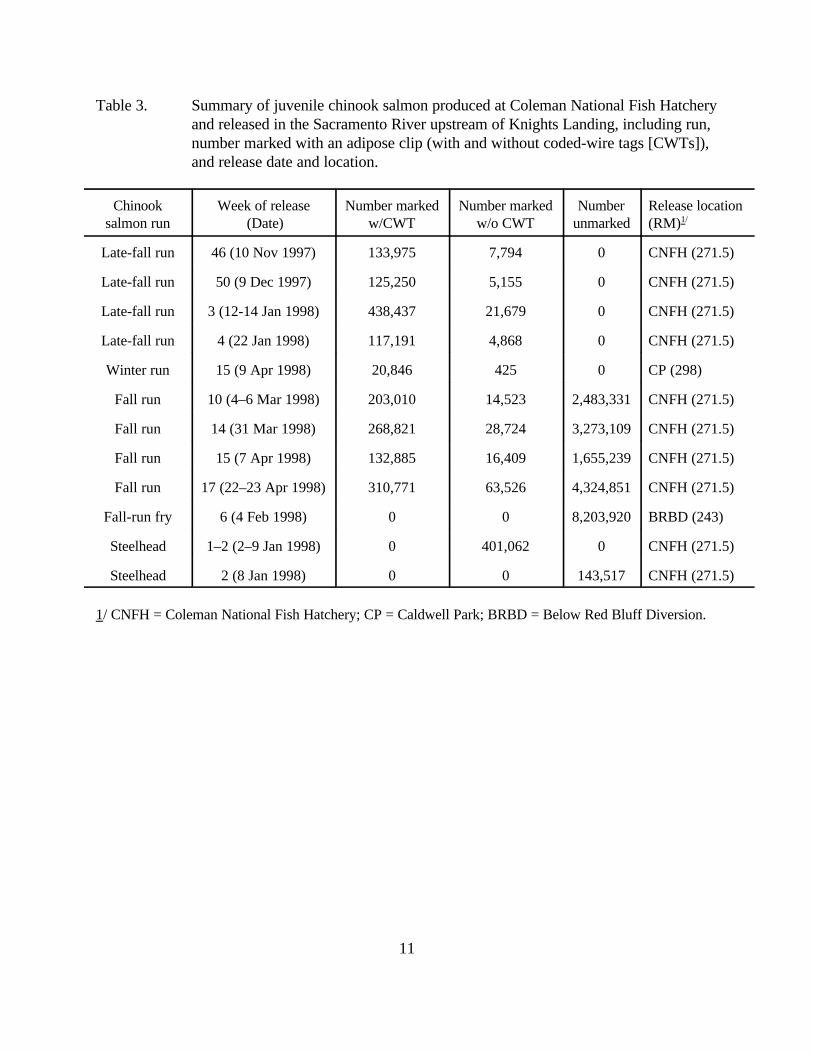
Table 3. Summary of juvenile chinook salmon produced at Coleman National Fish Hatcheryand released in the Sacramento River upstream of Knights Landing, including run,number marked with an adipose clip (with and without coded-wire tags [CWTs]),and release date and location.
Chinooksalmon run
Week of release (Date)
Number markedw/CWT
Number markedw/o CWT
Numberunmarked
Release location(RM)1/
Late-fall run 46 (10 Nov 1997) 133,975 7,794 0 CNFH (271.5)
Late-fall run 50 (9 Dec 1997) 125,250 5,155 0 CNFH (271.5)
Late-fall run 3 (12-14 Jan 1998) 438,437 21,679 0 CNFH (271.5)
Late-fall run 4 (22 Jan 1998) 117,191 4,868 0 CNFH (271.5)
Winter run 15 (9 Apr 1998) 20,846 425 0 CP (298)
Fall run 10 (4–6 Mar 1998) 203,010 14,523 2,483,331 CNFH (271.5)
Fall run 14 (31 Mar 1998) 268,821 28,724 3,273,109 CNFH (271.5)
Fall run 15 (7 Apr 1998) 132,885 16,409 1,655,239 CNFH (271.5)
Fall run 17 (22–23 Apr 1998) 310,771 63,526 4,324,851 CNFH (271.5)
Fall-run fry 6 (4 Feb 1998) 0 0 8,203,920 BRBD (243)
Steelhead 1–2 (2–9 Jan 1998) 0 401,062 0 CNFH (271.5)
Steelhead 2 (8 Jan 1998) 0 0 143,517 CNFH (271.5)
1/ CNFH = Coleman National Fish Hatchery; CP = Caldwell Park; BRBD = Below Red Bluff Diversion.

12
Late-Fall-Run-Sized Chinook Salmon
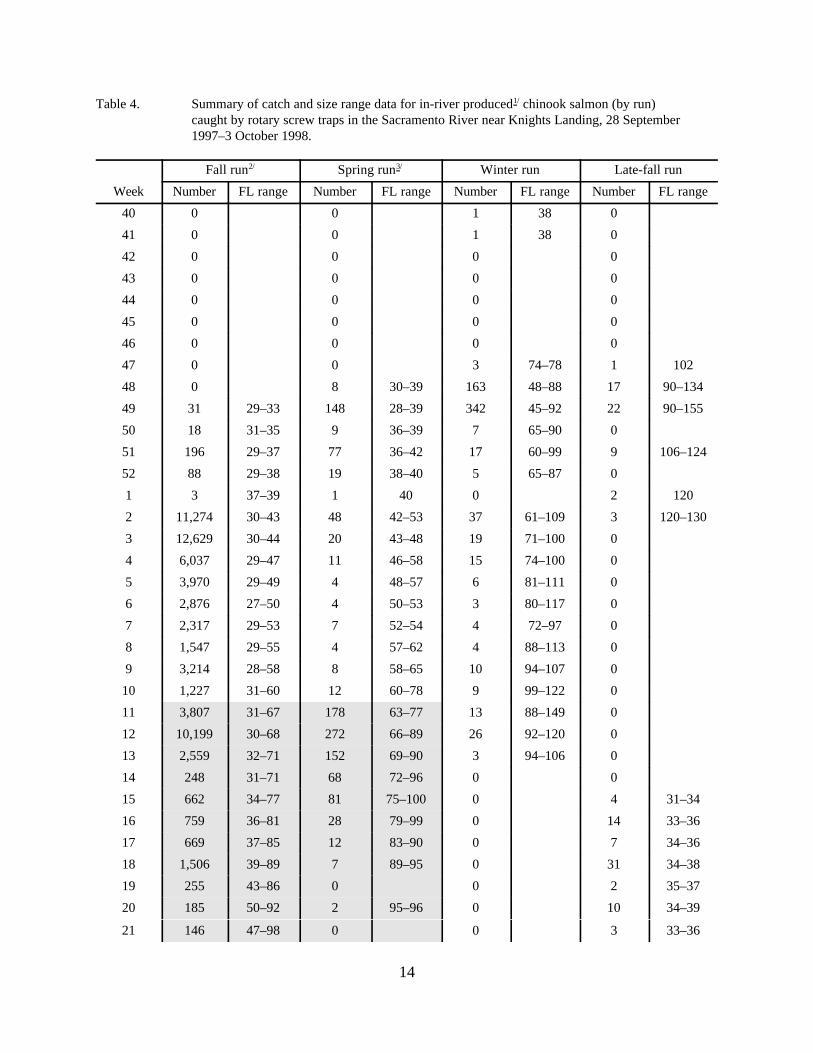
All late-fall run released from CNFH were marked. As such, we considered all unmarked late-fall-run chinook salmon to have been produced in-river, based on size criteria (F. Fisher and S.Greene, unpubl. data). The first in-river produced late-fall-run chinook salmon was caught duringweek 47 (Table 4, Figure 21). Altogether, 54 in-river produced late-fall-run juveniles from BY1997 were collected from week 47 through week 2 (4–10 January 1998). The highest catchesoccurred during weeks 48 (n = 17) and 49 (n = 22). These fish ranged from 90 to 155 mm FL(Table 4).
A total of 115 in-river produced late-fall-run juveniles from BY 1998 was also collected: 112from week 15 (5–11 April 1998) through week 23 (31 May–6 June 1998) and one each duringweeks 34, 35 and 40 (Figure 21). These fish ranged from 31 to 77 mm FL (Table 4).
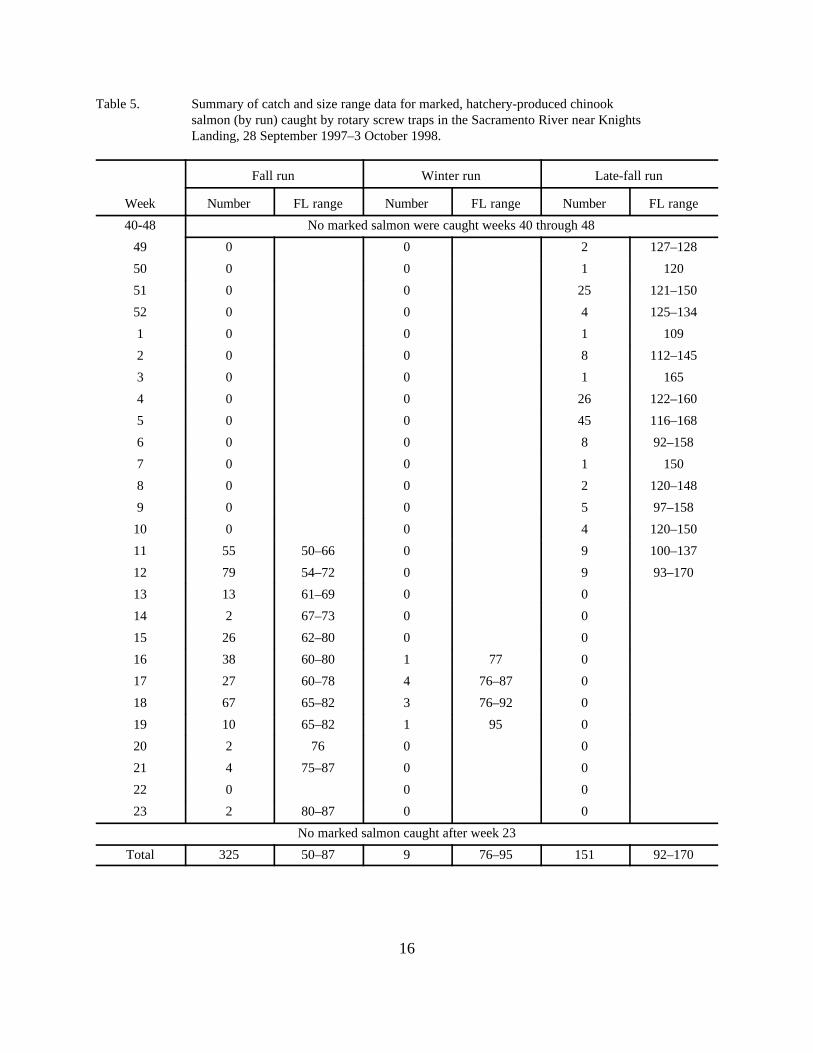
We collected 151 marked late-fall run (Table 5). These fish were collected from week 49 (30November–6 December 1997) through week 12 (15–21 March 1998) (Figure 22). Relativelyhigh catches occurred during weeks 51 (n = 25), 4 (n = 26) and 5 (n = 45). Ninety-three of the151 marked fish were late-fall-run-sized (BY 1997) of which 91 had CWTs that identified them aslate-fall run from CNFH. (The two fish without a CWT were also classified as late-fall run fromCNFH). CWT data also revealed that an additional 48 of these marked fish were classified by sizeas winter run but were actually late-fall run from CNFH. We also classified 10 winter-run-sizedmarked salmon without CWTs as late-fall run based upon the proportion of marked winter-run-sized salmon bearing CWTs that were actually CNFH late-fall run (48 out of 48).
A total of 854,349 late-fall run produced at CNFH was marked, tagged with CWTs and releasedinto Battle Creek, approximately 180 miles upstream of Knights Landing. Of these, an estimated39,696 were marked but either shed or otherwise did not have a CWT when released. Fourreleases consisting of six distinct tag groups were made over a period of 10 weeks, between 10November 1997 and 22 January 1998 (Table 3). Each tag group was comparable in size. Wecaptured 5 (0.003%) fish from the first release, 40 (0.032%) from the second, 20, 38 and 9(0.015% total) from the three tag groups released on 12, 13 and 14 January 1998, and 27(0.022%) from the last release (Table 5, Figure 22). Fish from the first release were collected atKnights Landing from 21 to 51 days after their release (mean = 33 days); fish from the secondrelease were collected from 5 to 101 days later (mean = 23 days); fish from the third release werecollected 3 to 65 days later (mean = 22 days). The last fish from the second through fourth taggroups was collected in week 12, during emigration phase 3 (Figure 6), coincident with the peakcatch during that phase and following the initial release of fingerling-sized CNFH produced fallrun (Table 3). Twelve percent of all marked late-fall run were collected during phase 3 (weeks 11and 12).
13
Winter-Run-Sized Chinook Salmon
As with late fall, all winter run released from CNFH were marked and all unmarked winter run(based on size) were considered to have been produced in-river. A total of 688 in-river producedwinter-run chinook salmon from BY 1997 was collected from week 40 (28 September–4 October1997) through week 13 (22–28 March 1998) (Table 4, Figure 21). During the primary migrationperiod, 48% of the catch of in-river produced winter run occurred in November, 30% inDecember, 11% in January, 3% in February, and 7% in March.
We observed three peaks in catches of in-river produced winter run during the primary migrationperiod, corresponding to the three phases of emigration discussed above (Figure 21, cf. Figure 6). Winter-run catch first peaked in week 49 then declined to a low in week 1 (phase 1). Catchpeaked again in week 2 then gradually declined (phase 2) before peaking a third time during week12 (phase 3). Over 78% of in-river produced winter run were captured during phase 1, coincidentwith the first major increase in flow. Some 13% were captured during phase 2, in associationwith increased flow and a large number of fall-run migrants. Nine percent were captured duringphase 3. Much of the phase 3 movement of winter run occurred prior to the week 12 peak,possibly in response to the release of a large number of CNFH-produced fry into the upperSacramento River during week 6. Winter-run migration ended in week 13, immediately followingthe peak of emigration during phase 3 (Figure 21, cf. Figure 6).
In addition, two winter run were collected several weeks prior to the primary migration period(weeks 40 and 41), and 28 winter run from BY 1998 were caught several weeks after the end ofthe primary emigration period, after week 33 (16 August–3 October 1998).
We captured 67 winter-run-sized marked salmon. Of these, only nine were confirmed to bewinter run released from CNFH (Table 5). As discussed above, 48 of the 67 were identified aslate-fall run from CNFH based on CWT codes, and 10 did not have a CWT. Based upon theproportion of late-fall to winter run for the fish with CWTs, we estimated that all 10 of the fishwithout tags were late-fall run.
Only 20,846 marked and tagged winter run (425 were marked without tags) were released intothe upper Sacramento River on 9 April 1998 (week 15), about 200 river miles upstream ofKnights Landing (Table 3). The nine (0.04%) confirmed marked winter run were captured fromweek 16 through week 19 (Table 5, Figure 22).
14
Table 4. Summary of catch and size range data for in-river produced1/ chinook salmon (by run)caught by rotary screw traps in the Sacramento River near Knights Landing, 28 September1997–3 October 1998.
Week
Fall run2/ Spring run3/ Winter run Late-fall run
Number FL range Number FL range Number FL range Number FL range
40 0 0 1 38 0
41 0 0 1 38 0
42 0 0 0 0
43 0 0 0 0
44 0 0 0 0
45 0 0 0 0
46 0 0 0 0
47 0 0 3 74–78 1 102
48 0 8 30–39 163 48–88 17 90–134
49 31 29–33 148 28–39 342 45–92 22 90–155
50 18 31–35 9 36–39 7 65–90 0
51 196 29–37 77 36–42 17 60–99 9 106–124
52 88 29–38 19 38–40 5 65–87 0
1 3 37–39 1 40 0 2 120
2 11,274 30–43 48 42–53 37 61–109 3 120–130
3 12,629 30–44 20 43–48 19 71–100 0
4 6,037 29–47 11 46–58 15 74–100 0
5 3,970 29–49 4 48–57 6 81–111 0
6 2,876 27–50 4 50–53 3 80–117 0
7 2,317 29–53 7 52–54 4 72–97 0
8 1,547 29–55 4 57–62 4 88–113 0
9 3,214 28–58 8 58–65 10 94–107 0
10 1,227 31–60 12 60–78 9 99–122 0
11 3,807 31–67 178 63–77 13 88–149 0
12 10,199 30–68 272 66–89 26 92–120 0
13 2,559 32–71 152 69–90 3 94–106 0
14 248 31–71 68 72–96 0 0
15 662 34–77 81 75–100 0 4 31–34
16 759 36–81 28 79–99 0 14 33–36
17 669 37–85 12 83–90 0 7 34–36
18 1,506 39–89 7 89–95 0 31 34–38
19 255 43–86 0 0 2 35–37
20 185 50–92 2 95–96 0 10 34–39
21 146 47–98 0 0 3 33–36

15
Table 4 (Continued)
Week
Fall run2/ Spring run Winter run Late-fall run
Number FL range Number FL range Number FL range Number FL range
22 44 70–95 0 0 3 37–38
23 168 53–109 2 110–117 0 38 32–41
24 15 61–83 0 0 0
25 11 70–89 0 0 0
26 3 75 0 0 0
27 0 0 0 0
28 2 83–98 0 0 0
29 0 0 0 0
30 0 0 0 0
31 0 0 0 0
32 1 87 0 0 0
33 0 0 0 0
34 0 0 3 35–36 1 34
35 0 0 3 36–38 1 49
36 0 0 5 34–39 0
37 0 0 1 48 0
38 0 0 5 37–39 0
39 0 0 3 34–38 0
40 0 0 8 31–39 1 77
Total 66,666 27–109 380 4/
802 5/28–78
63–117688 6/
28 7/38–14931–48
54 6/
115 7/90–15531–77
1/ Unmarked salmon were considered in-river produced fish except as noted below.2/ A large portion of the fall run listed in this table were likely of hatchery origin since in-river and
hatchery-produced fall run could not be distinguished. Less than 6% of fall run released fromCNFH were marked.
3/ All spring-run-sized salmon collected after week 10 (shaded area) were considered CNFH-produced fallrun based upon CWT data and size distributions of fall run released from CNFH (see text).
4/ Total captured before week 11, considered in-river produced spring run.5/ Total captured after week 10, considered CNFH produced fall run.6/ BY 19977/ BY 1998
16
Table 5. Summary of catch and size range data for marked, hatchery-produced chinooksalmon (by run) caught by rotary screw traps in the Sacramento River near KnightsLanding, 28 September 1997–3 October 1998.
Week
Fall run Winter run Late-fall run
Number FL range Number FL range Number FL range
40-48 No marked salmon were caught weeks 40 through 48
49 0 0 2 127–128
50 0 0 1 120
51 0 0 25 121–150
52 0 0 4 125–134
1 0 0 1 109
2 0 0 8 112–145
3 0 0 1 165
4 0 0 26 122–160
5 0 0 45 116–168
6 0 0 8 92–158
7 0 0 1 150
8 0 0 2 120–148
9 0 0 5 97–158
10 0 0 4 120–150
11 55 50–66 0 9 100–137
12 79 54–72 0 9 93–170
13 13 61–69 0 0
14 2 67–73 0 0
15 26 62–80 0 0
16 38 60–80 1 77 0
17 27 60–78 4 76–87 0
18 67 65–82 3 76–92 0
19 10 65–82 1 95 0
20 2 76 0 0
21 4 75–87 0 0
22 0 0 0
23 2 80–87 0 0
No marked salmon caught after week 23
Total 325 50–87 9 76–95 151 92–170

17
Spring-Run-Sized Chinook Salmon
No hatchery-reared spring-run chinook salmon were released upstream of Knights Landing.Several thousand wild, spring-run juveniles caught in Butte Creek were marked and released backinto Butte Creek. Butte Creek enters the upper portion of the Sutter Bypass and, depending uponflow conditions, the marked fish released into Butte Creek could have entered either theSacramento River upstream of Knights Landing or the bypass. All unmarked, spring-run-sizedchinook salmon captured through week 10 (1–7 March 1998; Figure 21) were considered in-riverproduced spring run. Beginning in week 11, all spring-run-sized salmon were considered fall-runjuveniles based upon the following information:
• A substantial increase in the catch of spring-run-sized salmon began in week 11 (n = 55)concurrent with the arrival of marked, hatchery-produced fall run released into the upperriver during week 10 (Table 5).
• Many of the fall run measured just prior to their release during week 10 were spring-runsized.
In-river produced spring-run chinook salmon (based on size criteria) first appeared in the RSTsduring phase 1 of emigration (week 48), and were captured during every week through week 10(Table 4, Figure 21). A total of 380 in-river produced spring-run juveniles was collected by RST(Table 4). Their catch distribution had two primary modes corresponding to emigration phases 1and 2. The first peak occurred during week 49, coincident with the first flow increase of theseason. The second peak occurred during week 2 corresponding to the second major flowepisode and a substantial increase in fall-run emigration.
Twenty spring-run-sized, marked salmon were caught by RST. All of these fish were caught afterweek 11. Of these 20 marked fish, four were identified as winter run and 16 were identified as fallrun, based upon CWT information.
Fall-Run-Sized Chinook Salmon
Fall-run-sized chinook clearly dominated the catch of in-river-produced juvenile salmon in theRSTs. Altogether, 66,666 fall-run-sized salmon were collected (Table 4). Fall run were firstcollected during week 49, the third week into the primary migration period, and then in everysubsequent week through week 26 (21–27 June 1998; Figure 21). One fall run was also collectedduring each of weeks 28 and 32.
The catch distribution exhibited several peaks consistent with the emigration phases introducedearlier. As with the other salmon runs collected during the survey, the first peak occurred duringthe initial high flow event (weeks 49–52) followed by a peak during the second high flow event(weeks 2–3). The highest catches occurred during this second event. The last two peaks (weeks
18
12 and 18) were coincident with the arrival of known (based on CWT data) hatchery-reared fallrun released from CNFH (Table 3, Figures 21 and 22).
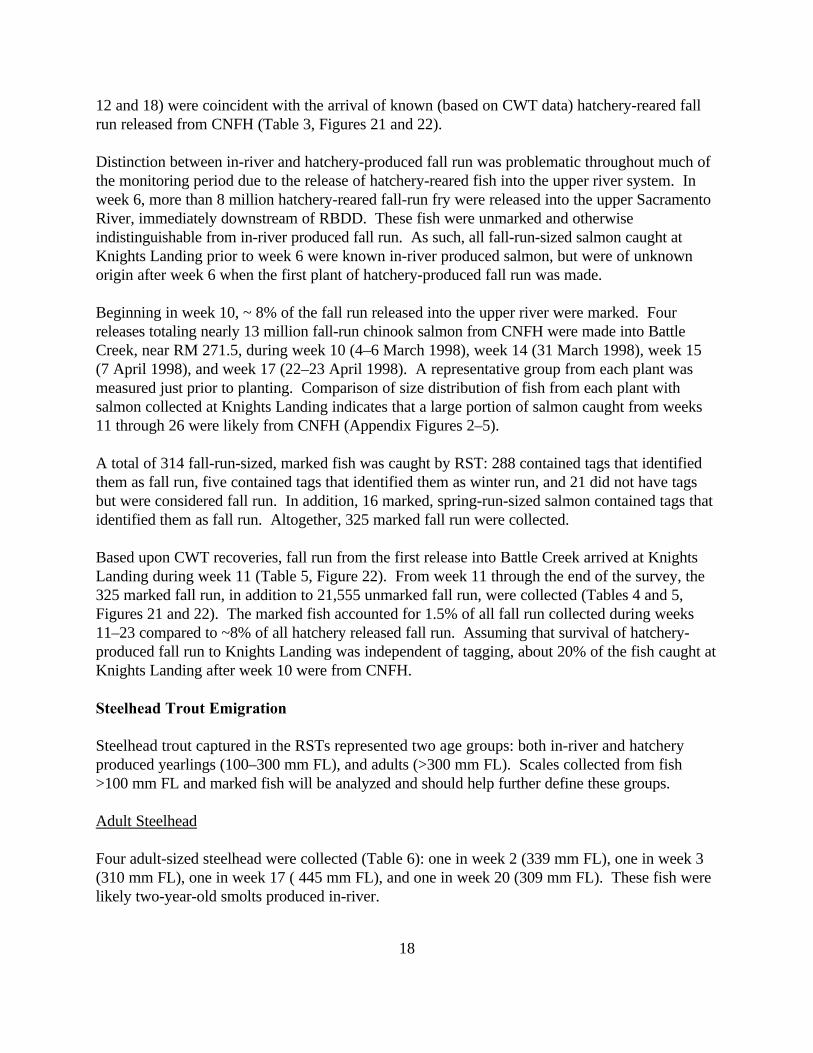
Distinction between in-river and hatchery-produced fall run was problematic throughout much ofthe monitoring period due to the release of hatchery-reared fish into the upper river system. Inweek 6, more than 8 million hatchery-reared fall-run fry were released into the upper SacramentoRiver, immediately downstream of RBDD. These fish were unmarked and otherwiseindistinguishable from in-river produced fall run. As such, all fall-run-sized salmon caught atKnights Landing prior to week 6 were known in-river produced salmon, but were of unknownorigin after week 6 when the first plant of hatchery-produced fall run was made.
Beginning in week 10, ~ 8% of the fall run released into the upper river were marked. Fourreleases totaling nearly 13 million fall-run chinook salmon from CNFH were made into BattleCreek, near RM 271.5, during week 10 (4–6 March 1998), week 14 (31 March 1998), week 15(7 April 1998), and week 17 (22–23 April 1998). A representative group from each plant wasmeasured just prior to planting. Comparison of size distribution of fish from each plant withsalmon collected at Knights Landing indicates that a large portion of salmon caught from weeks11 through 26 were likely from CNFH (Appendix Figures 2–5).
A total of 314 fall-run-sized, marked fish was caught by RST: 288 contained tags that identifiedthem as fall run, five contained tags that identified them as winter run, and 21 did not have tagsbut were considered fall run. In addition, 16 marked, spring-run-sized salmon contained tags thatidentified them as fall run. Altogether, 325 marked fall run were collected.
Based upon CWT recoveries, fall run from the first release into Battle Creek arrived at KnightsLanding during week 11 (Table 5, Figure 22). From week 11 through the end of the survey, the325 marked fall run, in addition to 21,555 unmarked fall run, were collected (Tables 4 and 5,Figures 21 and 22). The marked fish accounted for 1.5% of all fall run collected during weeks11–23 compared to ~8% of all hatchery released fall run. Assuming that survival of hatchery-produced fall run to Knights Landing was independent of tagging, about 20% of the fish caught atKnights Landing after week 10 were from CNFH.
Steelhead Trout Emigration
Steelhead trout captured in the RSTs represented two age groups: both in-river and hatcheryproduced yearlings (100–300 mm FL), and adults (>300 mm FL). Scales collected from fish>100 mm FL and marked fish will be analyzed and should help further define these groups.
Adult Steelhead
Four adult-sized steelhead were collected (Table 6): one in week 2 (339 mm FL), one in week 3(310 mm FL), one in week 17 ( 445 mm FL), and one in week 20 (309 mm FL). These fish werelikely two-year-old smolts produced in-river.
19
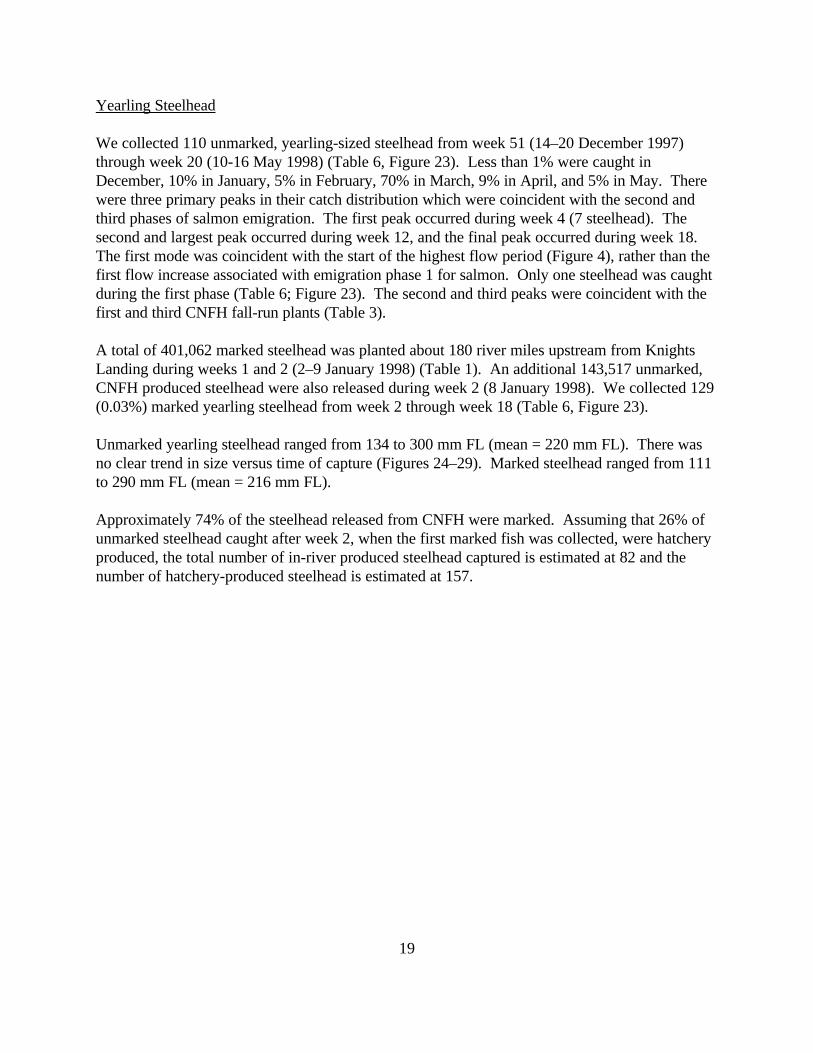
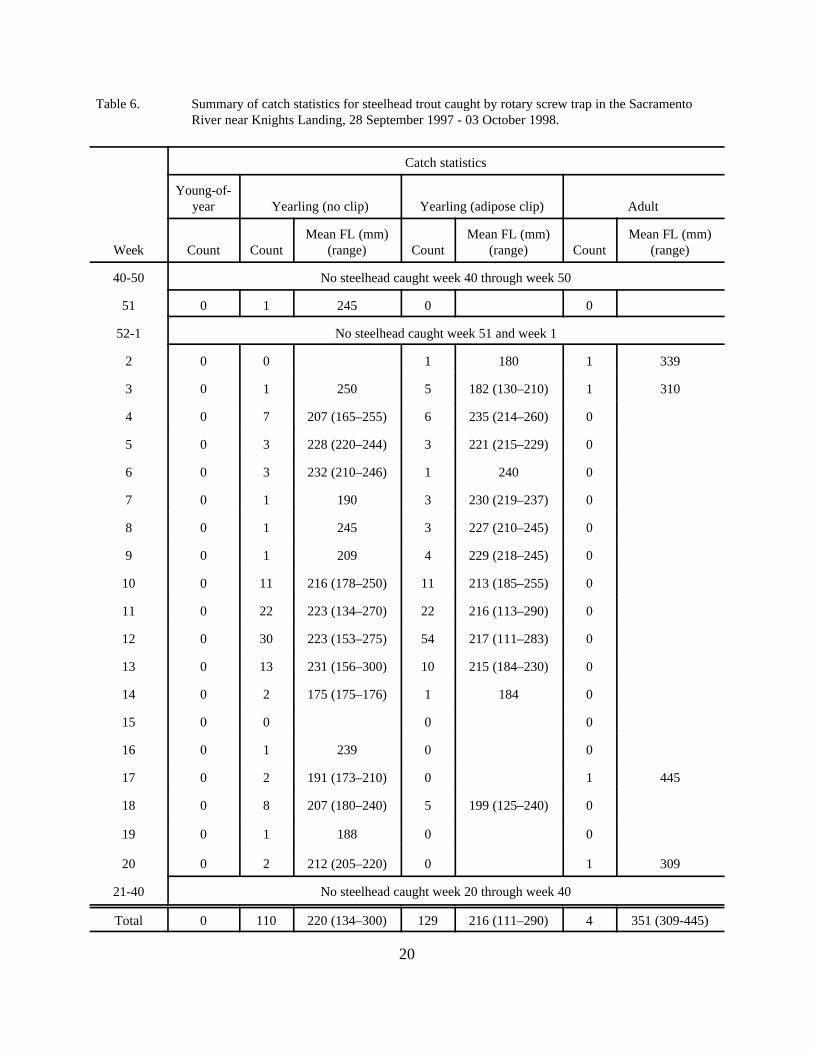
Yearling Steelhead
We collected 110 unmarked, yearling-sized steelhead from week 51 (14–20 December 1997)through week 20 (10-16 May 1998) (Table 6, Figure 23). Less than 1% were caught inDecember, 10% in January, 5% in February, 70% in March, 9% in April, and 5% in May. Therewere three primary peaks in their catch distribution which were coincident with the second andthird phases of salmon emigration. The first peak occurred during week 4 (7 steelhead). Thesecond and largest peak occurred during week 12, and the final peak occurred during week 18. The first mode was coincident with the start of the highest flow period (Figure 4), rather than thefirst flow increase associated with emigration phase 1 for salmon. Only one steelhead was caughtduring the first phase (Table 6; Figure 23). The second and third peaks were coincident with thefirst and third CNFH fall-run plants (Table 3).
A total of 401,062 marked steelhead was planted about 180 river miles upstream from KnightsLanding during weeks 1 and 2 (2–9 January 1998) (Table 1). An additional 143,517 unmarked,CNFH produced steelhead were also released during week 2 (8 January 1998). We collected 129(0.03%) marked yearling steelhead from week 2 through week 18 (Table 6, Figure 23). Unmarked yearling steelhead ranged from 134 to 300 mm FL (mean = 220 mm FL). There wasno clear trend in size versus time of capture (Figures 24–29). Marked steelhead ranged from 111to 290 mm FL (mean = 216 mm FL).
Approximately 74% of the steelhead released from CNFH were marked. Assuming that 26% ofunmarked steelhead caught after week 2, when the first marked fish was collected, were hatcheryproduced, the total number of in-river produced steelhead captured is estimated at 82 and thenumber of hatchery-produced steelhead is estimated at 157.
20
Table 6. Summary of catch statistics for steelhead trout caught by rotary screw trap in the SacramentoRiver near Knights Landing, 28 September 1997 - 03 October 1998.
Week
Catch statistics
Young-of-year Yearling (no clip) Yearling (adipose clip) Adult
Count CountMean FL (mm)
(range) CountMean FL (mm)
(range) CountMean FL (mm)
(range)
40-50 No steelhead caught week 40 through week 50
51 0 1 245 0 0
52-1 No steelhead caught week 51 and week 1
2 0 0 1 180 1 339
3 0 1 250 5 182 (130–210) 1 310
4 0 7 207 (165–255) 6 235 (214–260) 0
5 0 3 228 (220–244) 3 221 (215–229) 0
6 0 3 232 (210–246) 1 240 0
7 0 1 190 3 230 (219–237) 0
8 0 1 245 3 227 (210–245) 0
9 0 1 209 4 229 (218–245) 0
10 0 11 216 (178–250) 11 213 (185–255) 0
11 0 22 223 (134–270) 22 216 (113–290) 0
12 0 30 223 (153–275) 54 217 (111–283) 0
13 0 13 231 (156–300) 10 215 (184–230) 0
14 0 2 175 (175–176) 1 184 0
15 0 0 0 0
16 0 1 239 0 0
17 0 2 191 (173–210) 0 1 445
18 0 8 207 (180–240) 5 199 (125–240) 0
19 0 1 188 0 0
20 0 2 212 (205–220) 0 1 309
21-40 No steelhead caught week 20 through week 40
Total 0 110 220 (134–300) 129 216 (111–290) 4 351 (309-445)

21
RST Gear Efficiency Using Mark-Recapture
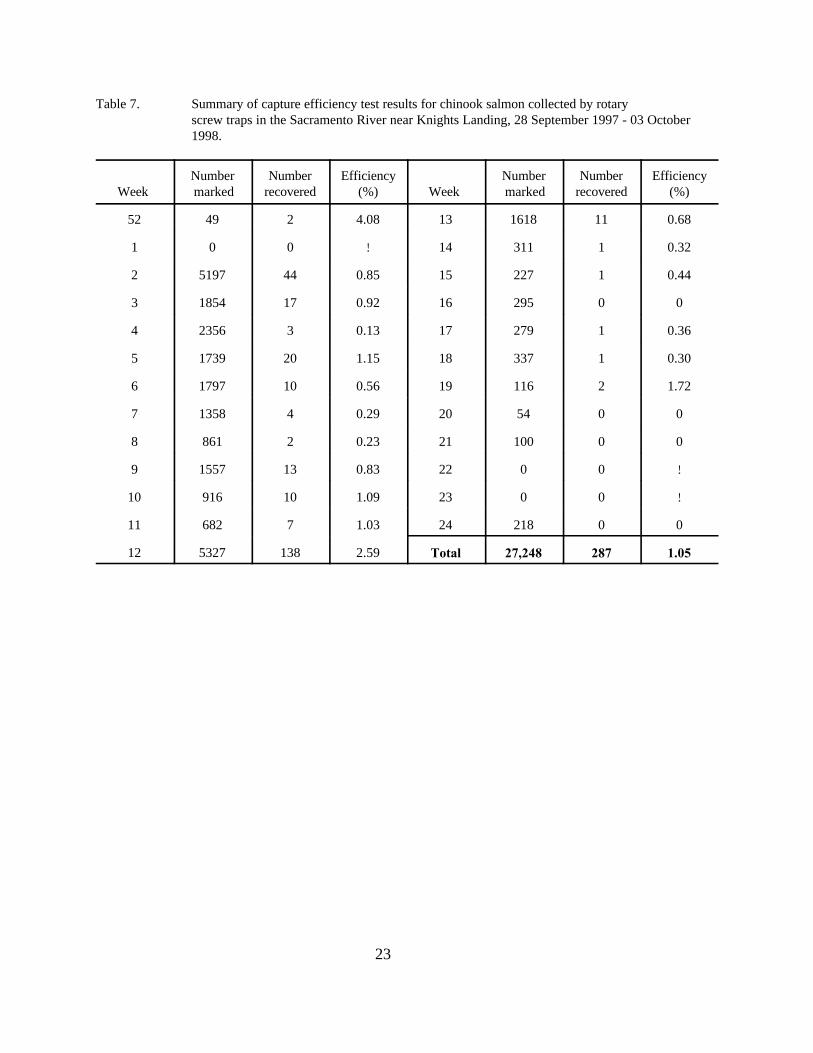
Salmon were marked for efficiency evaluations beginning in week 52 (Table 7). A total of 27,248chinook salmon was marked from week 52 through week 24; 287 (1.05%) were recaptured. Thepercent recaptured, by week, ranged from 0% during four weeks (two weeks when the numbermarked was <100), to 4.08% during week 52. The mean trap efficiency during the 22-weekperiod was 0.80% (SD = 0.96%).
For comparison, mean ± SD RST efficiency on other large Central Valley rivers was: 0.81% ±0.89% on the upper Sacramento River at Balls Ferry (RM 278) during 1997–1998 (CaliforniaDepartment of Fish and Game 1999); 0.8% (range = 0.39%–1.75%) at Thermalito and 0.2%(range = 0%–0.53%) at Live Oak on the Feather River during 1997–1998 (California Departmentof Water Resources 1999); and 0.75% ± 0.70% at Watt Avenue on the lower American Riverduring 1996–1997 (Snider and Titus 2000a). Mean trap efficiency at Knights Landing was thuswithin the range of RST efficiencies seen on other large Central Valley rivers.
There were no significant correlations between weekly trap efficiency and the number of fishmarked per week r = 0.23, p = 0.30), number of fish caught per week r = 0.19, p = 0.39), ormean weekly water transparency r = 0.24, p = 0.28). There was a significant but weak negativecorrelation between efficiency and mean weekly flow r = !0.47, p = 0.03). Because trapefficiency varied independently of any measured factor, and to allow for determination ofconfidence intervals using standard statistical methods (e.g. Zar 1984), abundance estimates werecalculated using the mean of weekly trap efficiency estimates (see below).
Relative Abundance Estimates
A primary objective of monitoring at Knights Landing is to make an abundance estimate forjuvenile salmonids emigrating from the upper Sacramento River system into the lower river andDelta. Mean weekly trap efficiency (0.008) and associated 80% confidence interval(0.005–0.011) were used to estimate the abundance of each salmon run and steelhead. Both thein-river and hatchery-produced portions of each group were estimated. Estimates of hatchery-produced juveniles were made only for groups containing marked fish. Thus, no attempt wasmade to determine the number of salmon captured at Knights Landing that came from the 8.2million unmarked fall-run fry planted 4 February 1998.
In order to estimate the number of fish that passed Knights Landing during the entire emigrationperiod, including those few weeks when trapping effort was less than 100%, we expanded thetotal catch of each species and race to represent 100% effort. The weekly catch was estimatedfor those weeks when trapping effort was less than 100% by expanding the catch in proportion tothe percentage of actual effort (e.g., if effort was 80% the estimate was made by dividing theactual catch by 0.8). The catch of unmarked fish was increased by 3,807 for fall run, 54 for spring

22
run, 176 for winter run from BY 1997, 15 for late-fall from BY 1997, 15 for late-fall from BY1998 and 3 for steelhead. The marked catch was increased by 52 for fall run, 8 for late-fall runand 2 for steelhead. These numbers were added to the actual counts and used in the calculationof the total estimates (Tables 8 and 9).
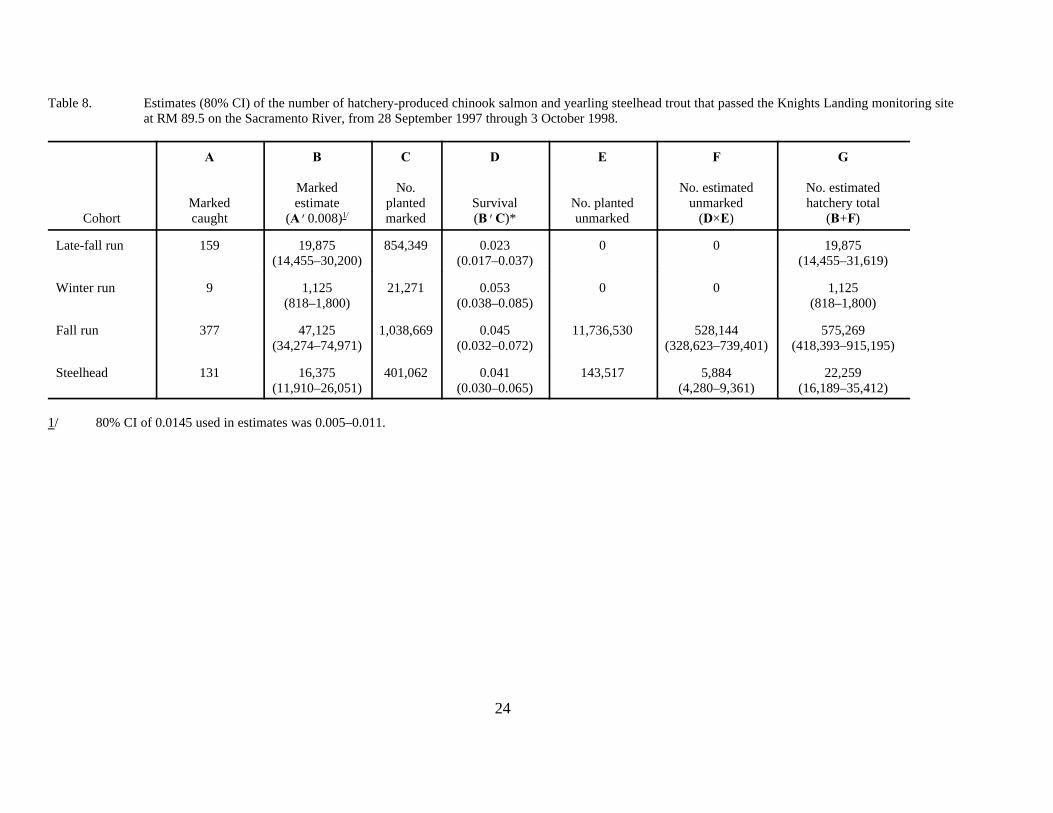
The estimated number of marked and unmarked hatchery-produced fish was determined as shownin Table 8. Estimated survival to Knights Landing of hatchery salmonids by run/species rangedfrom 2.3% to 5.3%.
In-river produced fish were estimated by subtracting the estimated hatchery-produced componentpassing Knights Landing (results from Table 8), by cohort, from the estimated total abundance ofeach cohort moving past the site (Table 9). Overall, an estimated 9.2 million chinook salmon(80% CI, 6.7 million–14.6 million) emigrated past Knights Landing into the lower SacramentoRiver and Delta. About 94% of those were estimated to have been produced in-river. Anestimated 30,500 yearling steelhead (80% CI, ~22,000–48,000) emigrated past Knights Landing. In contrast to salmon, only 27% of those fish were estimated to have been produced in-river.
Emigration from the upper Sacramento River system to the Delta is exclusively through KnightsLanding until flow increases require diversion through the Sutter Bypass, upstream of KnightsLanding. Typically, diversion to the bypass via the Tisdale Weir occurs when flow exceeds about23,000 cfs (California Department of Water Resources, Division of Flood Management, pers.comm., 14 July 1998). In 1998, flow exceeded 23,000 cfs during week 4 and remained abovethat level through the emigration period. Since the proportion of juvenile salmonids thatemigrates through the bypass is unknown, the magnitude of salmonids emigrating to the Deltacannot be estimated by just using Knights Landing results. However, the temporal distributionand, likely, the relative abundance of juvenile salmonids migrating toward the Delta are reflectedin the Knights Landing results.
23
Table 7. Summary of capture efficiency test results for chinook salmon collected by rotaryscrew traps in the Sacramento River near Knights Landing, 28 September 1997 - 03 October1998.
Week
Number marked
Numberrecovered
Efficiency(%)
Week
Number marked
Numberrecovered
Efficiency(%)
52 49 2 4.08 13 1618 11 0.68
1 0 0 ! 14 311 1 0.32
2 5197 44 0.85 15 227 1 0.44
3 1854 17 0.92 16 295 0 0
4 2356 3 0.13 17 279 1 0.36
5 1739 20 1.15 18 337 1 0.30
6 1797 10 0.56 19 116 2 1.72
7 1358 4 0.29 20 54 0 0
8 861 2 0.23 21 100 0 0
9 1557 13 0.83 22 0 0 !
10 916 10 1.09 23 0 0 !
11 682 7 1.03 24 218 0 0
12 5327 138 2.59 Total 27,248 287 1.05
24
Table 8. Estimates (80% CI) of the number of hatchery-produced chinook salmon and yearling steelhead trout that passed the Knights Landing monitoring siteat RM 89.5 on the Sacramento River, from 28 September 1997 through 3 October 1998.
Cohort
A
Markedcaught
B
Markedestimate
(A'0.008)1/
C
No.plantedmarked
D
Survival(B'C)*
E
No. plantedunmarked
F
No. estimatedunmarked
(D×E)
G
No. estimatedhatchery total
(B+F)
Late-fall run 159 19,875(14,455–30,200)
854,349 0.023(0.017–0.037)
0 0 19,875(14,455–31,619)
Winter run 9 1,125(818–1,800)
21,271 0.053(0.038–0.085)
0 0 1,125(818–1,800)
Fall run 377 47,125(34,274–74,971)
1,038,669 0.045(0.032–0.072)
11,736,530 528,144(328,623–739,401)
575,269(418,393–915,195)
Steelhead 131 16,375(11,910–26,051)
401,062 0.041(0.030–0.065)
143,517 5,884(4,280–9,361)
22,259(16,189–35,412)
1/ 80% CI of 0.0145 used in estimates was 0.005–0.011.

25
Table 9. Estimates (80% CI) of the number of in-river-produced chinook salmon and yearling steelhead trout that passed the KnightsLanding monitoring site at RM 89.5 on the Sacramento River, from 28 September 1997 through 3 October 1998.
Cohort
A
Total caught
B
Estimated total(A'0.008)1/
C
Hatchery total(from Table 8)
D
In-river-produced total(B!!C)
Late-fall run (BY 1997) 228 28,500(20,728–45,341)
18,875(13,727–30,200)
9,625(7,000–15,312)
Late-fall run (BY 1998) 130 16,250(11,819–25,852)
0 16,250(11,819–25,852)
Winter run (BY 1997) 873 109,125(79,367–173,607)
1,125(818–1,800)
108,000(78,548–171,817)
Winter run (BY 1998) 28 3,500(2,545–5,600)
0 3,500(2,545–5,600)
Spring run 434 54,250(39,456–86,306)
0 54,250(39,456–86,306)
Fall run 1/ 71,652 8,956,500(6,514,062–14,248,895)
498,350(358,168–804,401)
8,458,150(6,151,612–13,456,070)
Total salmon 73,345 9,168,125(6,679,977– 14,585,574)
518,350( 372,713– 836,401)
8,649,775( 6,290,981– 13,760,927)
Steelhead 244 30,500(22,183–48,522)
21,866(15,889–34,985)
8,634(6,280–13,736)
1/ Includes spring-run-sized salmon collected after week 10.2/ 80% CI of 0.0145 used in estimates was 0.005–0.011.
26
ACKNOWLEDGMENTS
The Knights Landing monitoring project is part of the Interagency Ecological Program (IEP)Salmonid Project Work Team’s (SPWT) juvenile salmonid monitoring program. It was partiallyfunded by the California Department of Water Resources (DWR) as part of DWR’s contributionto the IEP. Many of the agencies and private entities involved in management activities within theSacramento-San Joaquin Delta and its tributaries are represented on the SPWT, includingNational Marine Fisheries Service, U. S. Fish and Wildlife Service, California Department ofWater Resources, California Department of Fish and Game, State Water Contractors, andMetropolitan Water District.
We wish to thank the field crews consisting of Jannette Bushard, Keely Carroll, Robert Coyan,Bill Guthrie, Doug Hayes, Jennifer Ikemoto, Jordan McKay, Shawn Oliver, Brian Sardella, MikeStiehr, and Mark Van Dam of the California Department of Fish and Game. A special thanksgoes to Katherine Berry and Glenn Sibbald for their assistance in data management and analysisand preparation of the numerous graphics.
REFERENCES
California Department of Fish and Game. 1999. Central Valley Anadromous Fish-HabitatEvaluations, October 1997 through September 1998. Annual progress report by Calif. Dept. FishGame, Stream Evaluation Program. Prepared for U. S. Fish and Wildlife Service, Central ValleyAnadromous Fish Restoration Program. 21 pp. + figs., apps.
California Department of Water Resources. 1999. Feather River study, chinook salmonemigration survey, December 1997–June 1998. Calif. Dept. Water Resources, EnvironmentalServices Office. 31 pp.
Deacon, J. E. 1961. A staining method for marking large numbers of small fish. Prog. Fish Cult. 23:41–42.
Orth, D. J. 1983. Aquatic habitat measurements. Pages 61-84 in: L. A. Nielsen and D. L.Johnson eds. Fisheries Techniques. American Fisheries Society, Bethesda, Md.
Snider, B. and R. G. Titus. 1998. Evaluation of juvenile anadromous salmonid emigration in theSacramento River near Knights Landing, November 1995–July 1996. Calif. Dept. Fish Game,Environmental Services Division, Stream Evaluation Program Report. 67 pp.
Snider, B., and R. G. Titus. 2000a. Lower American River emigration survey, October1996–September 1997. Calif. Dept. Fish Game, Habitat Conservation Division, StreamEvaluation Program Technical Report No. 00-2. 25 pp. + figs., apps.

27
Snider, B., and R. G. Titus. 2000b. Timing, composition and abundance of juvenile anadromoussalmonid emigration in the Sacramento River near Knights Landing, September 1996–October1997. Calif. Dept. Fish Game, Habitat Conservation Division, Stream Evaluation ProgramTechnical Report No. 00-4. xx pp.
Zar, J. H. 1984. Biostatistical analysis, 2nd ed. Prentice Hall, Englewood Cliffs, NJ. 718 pp.

FIGURES

Sacramento River flow and water temperature near Knights Landing
Figure 3. Mean daily flow measured in the Sacramento River near Knights Landing at Wilkins Slough, and mean daily water temperature measured at Knights Landing, 28 September 1997 - 3 October 1998.
28-S
ep5
Oct
12-O
ct19
-Oct
26-O
ct2
Nov
9 N
ov16
-Nov
23-N
ov30
-Nov
7 D
ec14
-Dec
21-D
ec28
-Dec
Ja
n11
-Jan
18-J
an25
-Jan
Fe
b8
Feb
15-F
eb22
-Feb
1
Ma
r8
Mar
15-M
ar22
-Mar
29-M
ar5
Apr
12-A
pr19
-Apr
26-A
pr3
May
10-M
ay17
-May
24-M
ay31
-May
7
Ju
n14
-Jun
21-J
un28
-Jun
5
Ju
l12
-Jul
19-J
ul26
-Jul
2 A
ug9
Aug
16-A
ug23
-Aug
30-A
ug6
Sep
13-S
ep20
-Sep
27-S
ep
0
5
10
15
20
25
30
35
40
45
50
55
60
65
70
75
Wa
ter T
em
pe
ratu
re (F
)
Flow Temperature
4Ja
n
4F
eb Mar
Jun
Jul
Flo
w (
cfs
x 1
00
0)
Flow versus transparency
Figure 4. Mean weekly flow compared with mean weekly transparency (Secchi depth) measured in the Sacramento River near Knights Landing, 28 September 1997 - 3 October 1998.
40 42 44 46 48 50 52 2 4 6 8 10 12 14 16 18 20 22 24 26 28 30 32 34 36 38 40
Week
0
5
10
15
20
25
30
35
0
0.5
1
1.5
2
2.5
3
3.5
Secch
i depth
(ft)
Flow Secchi depth
Flo
w (
cfs
x 1
00
0)
Flow versus effort - rotary screw traps
Figure 5. Mean weekly flow versus total weekly fishing effort expended by rotary screw traps in the Sacramento River near Knights Landing, 28 September 1997 - 3 October 1998.
40 42 44 46 48 50 52 2 4 6 8 10 12 14 16 18 20 22 24 26 28 30 32 34 36 38 40
Week
0
5
10
15
20
25
30
35
40
0
50
100
150
200
250
300
350
400
Effo
rt (h)
Flow Effort
Flo
w (
cfs
x 1
00
0)

Weekly total chinook salmon catch and catch/hour by rotary screw traps
Figure 6. Weekly total catch and weekly catch rate of chinook salmon collected by rotary screw traps in the Sacramento River near Knights Landing, 28 September 1997 - 3 October 1998.
40 42 44 46 48 50 52 2 4 6 8 10 12 14 16 18 20 22 24 26 28 30 32 34 36 38 40
Week
0
2,000
4,000
6,000
8,000
10,000
12,000
14,000
0
10
20
30
40
Catch
/h
Total catch Catch/h
No
. o
f sa
lmo
n c
au
gh
t
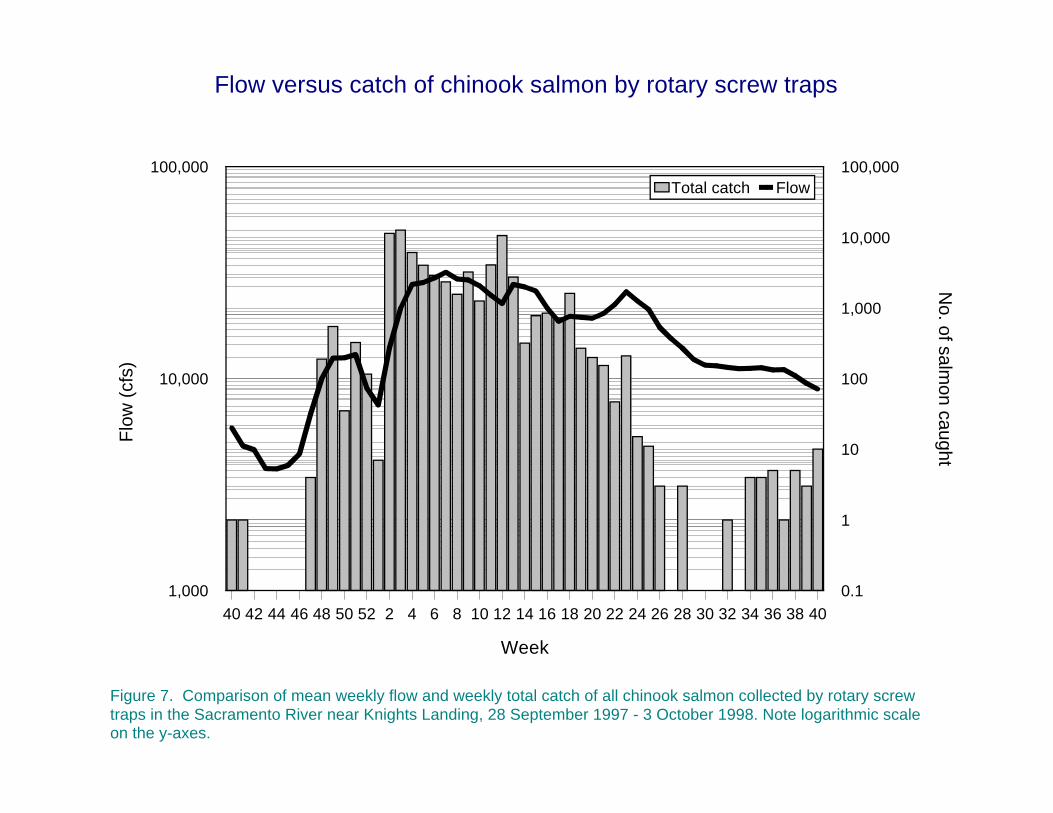
Flow versus catch of chinook salmon by rotary screw traps
Figure 7. Comparison of mean weekly flow and weekly total catch of all chinook salmon collected by rotary screw traps in the Sacramento River near Knights Landing, 28 September 1997 - 3 October 1998. Note logarithmic scale on the y-axes.
40 42 44 46 48 50 52 2 4 6 8 10 12 14 16 18 20 22 24 26 28 30 32 34 36 38 40
Week
1,000
10,000
100,000
0.1
1
10
100
1,000
10,000
100,000
No. o
f salm
on ca
ught
Total catch Flow
Flo
w (
cfs)
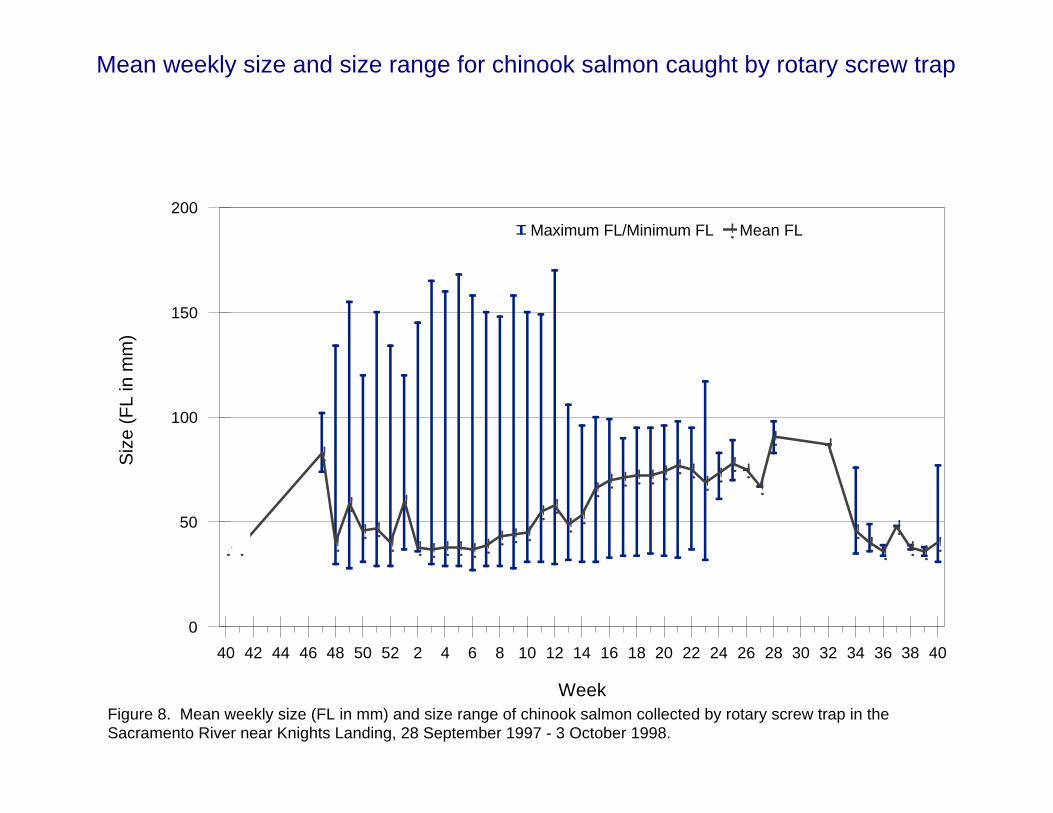
Mean weekly size and size range for chinook salmon caught by rotary screw trap
Figure 8. Mean weekly size (FL in mm) and size range of chinook salmon collected by rotary screw trap in the Sacramento River near Knights Landing, 28 September 1997 - 3 October 1998.
! !!
!
!
!
! !!
!
! ! ! ! ! !! ! !
! !! !
! !! ! ! !
! !! !
! !!
! !
!! !
!! !
40 42 44 46 48 50 52 2 4 6 8 10 12 14 16 18 20 22 24 26 28 30 32 34 36 38 40
Week
0
50
100
150
200
Maximum FL/Minimum FL Mean FL!
Siz
e (
FL
in m
m)
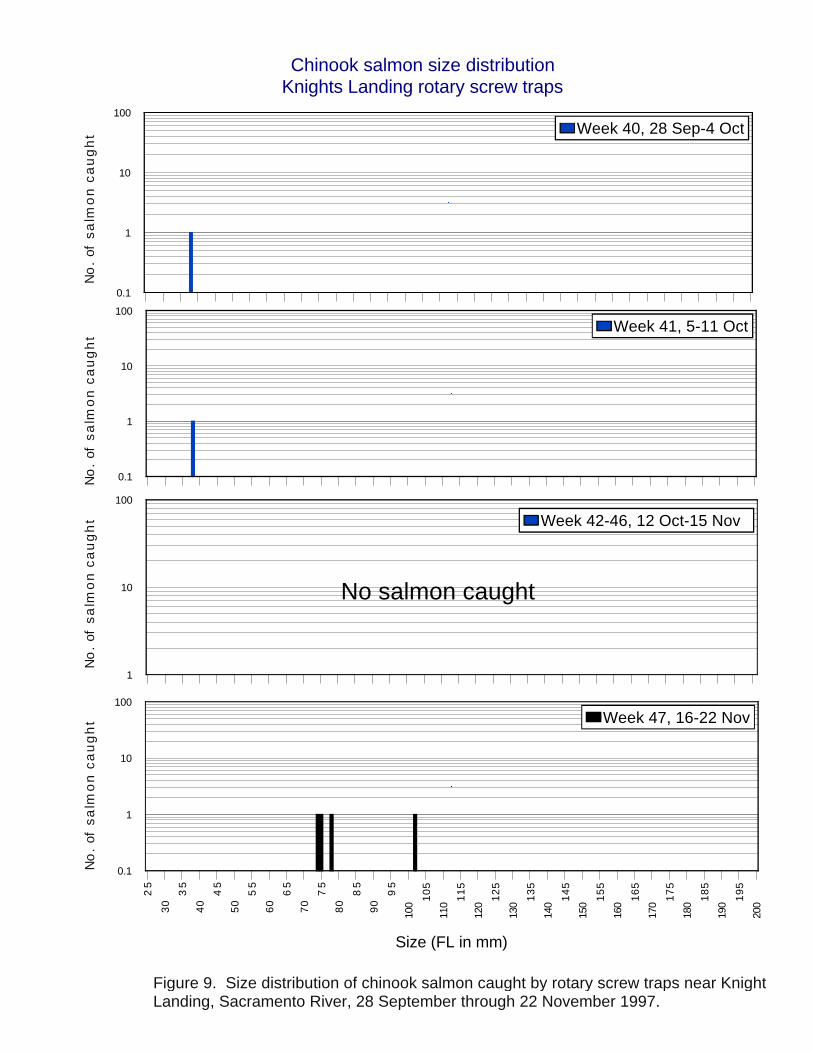
Figure 9. Size distribution of chinook salmon caught by rotary screw traps near Knights Landing, Sacramento River, 28 September through 22 November 1997.
25
30
35
40
45
50
55
60
65
70
75
80
85
90
95
100
10
5
110
11
5
120
12
5
130
13
5
140
14
5
150
15
5
160
16
5
170
17
5
180
18
5
190
19
5
200
Size (FL in mm)
0.1
1
10
100
Week 47, 16-22 Nov
1
10
100
Week 42-46, 12 Oct-15 Nov
0.1
1
10
100
Week 41, 5-11 Oct
Chinook salmon size distributionKnights Landing rotary screw traps
0.1
1
10
100
Week 40, 28 Sep-4 Oct
No salmon caught
No
. of
sa
lmo
n c
au
gh
tN
o.
ofs
alm
on
ca
ug
ht
No
. of
sa
lmo
n c
au
gh
tN
o.
ofs
alm
on
ca
ug
ht

Figure 10. Size distribution of chinook salmon caught by rotary screw traps near Knights Landing, Sacramento River, 23 November through 20 December 1997.
25
30
35
40
45
50
55
60
65
70
75
80
85
90
95
100
10
5
110
11
5
120
12
5
130
13
5
140
14
5
150
15
5
160
16
5
170
17
5
180
18
5
190
19
5
200
Size (FL in mm)
0.1
1
10
100
Week 51, 14-20 Dec
0.1
1
10
100
Week 50, 7-13 Dec
0.1
1
10
100
Week 49, 30 Nov-6 Dec
Chinook salmon size distributionKnights Landing rotary screw traps
0.1
1
10
100
Week 48, 23-29 Nov
No
. of
sa
lmo
n c
au
gh
tN
o.
ofs
alm
on
ca
ug
ht
No
. of
sa
lmo
n c
au
gh
tN
o.
ofs
alm
on
ca
ug
ht

Figure 11. Size distribution of chinook salmon caught by rotary screw traps near Knights Landing, Sacramento River, 21 December 1997 through 17 January 1998.
25
30
35
40
45
50
55
60
65
70
75
80
85
90
95
10
0 10
5
11
0 11
5
12
0 12
5
13
0 13
5
14
0 14
5
15
0 15
5
16
0 16
5
17
0 17
5
18
0 18
5
19
0 19
5
20
0
Size (FL in mm)
0.1
1
10
100
1000
Week 03, 11-17 Jan
0.1
1
10
100
1000
Week 02, 4-10 Jan
0.1
1
10
100
Week 01, 28 Dec-3 Jan
Chinook salmon size distributionKnights Landing rotary screw traps
0.1
1
10
100
Week 52, 21-27 Dec
No
. of
sa
lmo
n c
au
gh
tN
o.
ofs
alm
on
ca
ug
ht
No
. of
sa
lmo
n c
au
gh
tN
o.
ofs
alm
on
ca
ug
ht
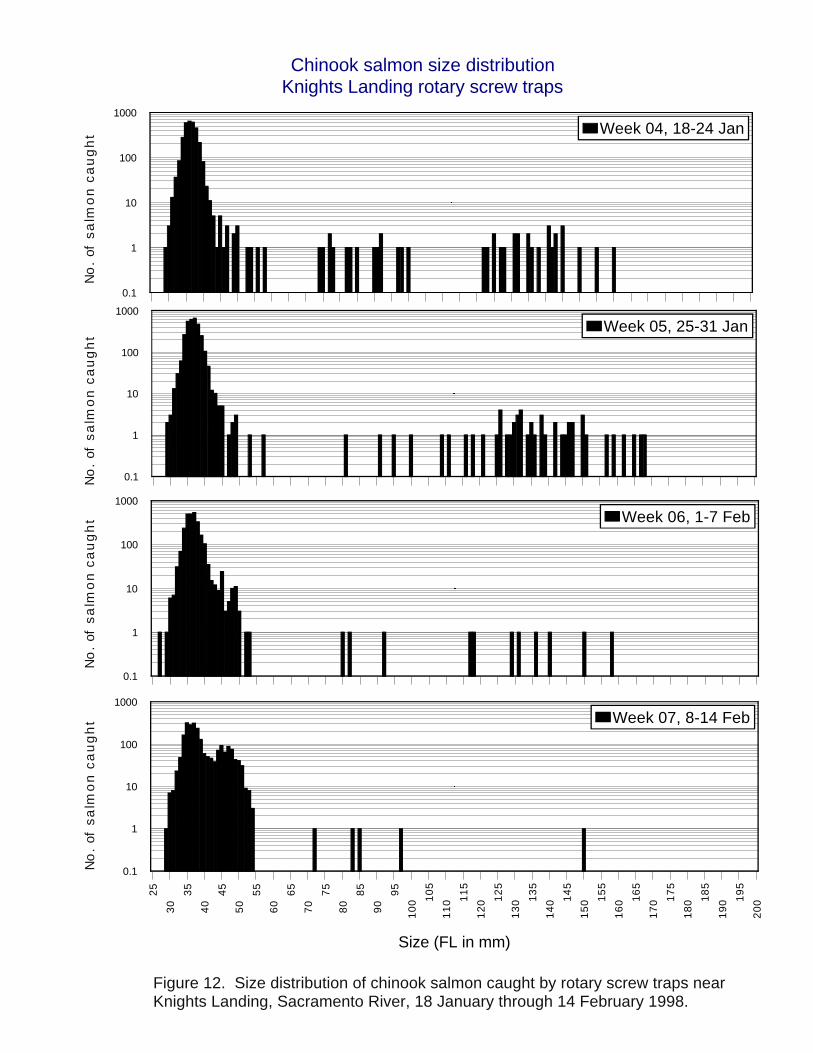
Figure 12. Size distribution of chinook salmon caught by rotary screw traps near Knights Landing, Sacramento River, 18 January through 14 February 1998.
25
30
35
40
45
50
55
60
65
70
75
80
85
90
95
10
0 10
5
11
0 11
5
12
0 12
5
13
0 13
5
14
0 14
5
15
0 15
5
16
0 16
5
17
0 17
5
18
0 18
5
19
0 19
5
20
0
Size (FL in mm)
0.1
1
10
100
1000
Week 07, 8-14 Feb
0.1
1
10
100
1000
Week 06, 1-7 Feb
0.1
1
10
100
1000
Week 05, 25-31 Jan
Chinook salmon size distributionKnights Landing rotary screw traps
0.1
1
10
100
1000
Week 04, 18-24 Jan
No
. of
sa
lmo
n c
au
gh
tN
o.
ofs
alm
on
ca
ug
ht
No
. of
sa
lmo
n c
au
gh
tN
o.
ofs
alm
on
ca
ug
ht

Figure 13. Size distribution of chinook salmon caught by rotary screw traps near Knights Landing, Sacramento River, 15 February through 14 March 1998.
25
30
35
40
45
50
55
60
65
70
75
80
85
90
95
10
0 10
5
11
0 11
5
12
0 12
5
13
0 13
5
14
0 14
5
15
0 15
5
16
0 16
5
17
0 17
5
18
0 18
5
19
0 19
5
20
0
Size (FL in mm)
0.1
1
10
100
1000
Week 11, 8-14 Mar
0.1
1
10
100
1000
Week 10, 1-7 Mar
0.1
1
10
100
1000
Week 09, 22-28 Feb
Chinook salmon size distributionKnights Landing rotary screw traps
0.1
1
10
100
1000
Week 08, 15-21 Feb
No
. of
sa
lmo
n c
au
gh
tN
o.
ofs
alm
on
ca
ug
ht
No
. of
sa
lmo
n c
au
gh
tN
o.
ofs
alm
on
ca
ug
ht
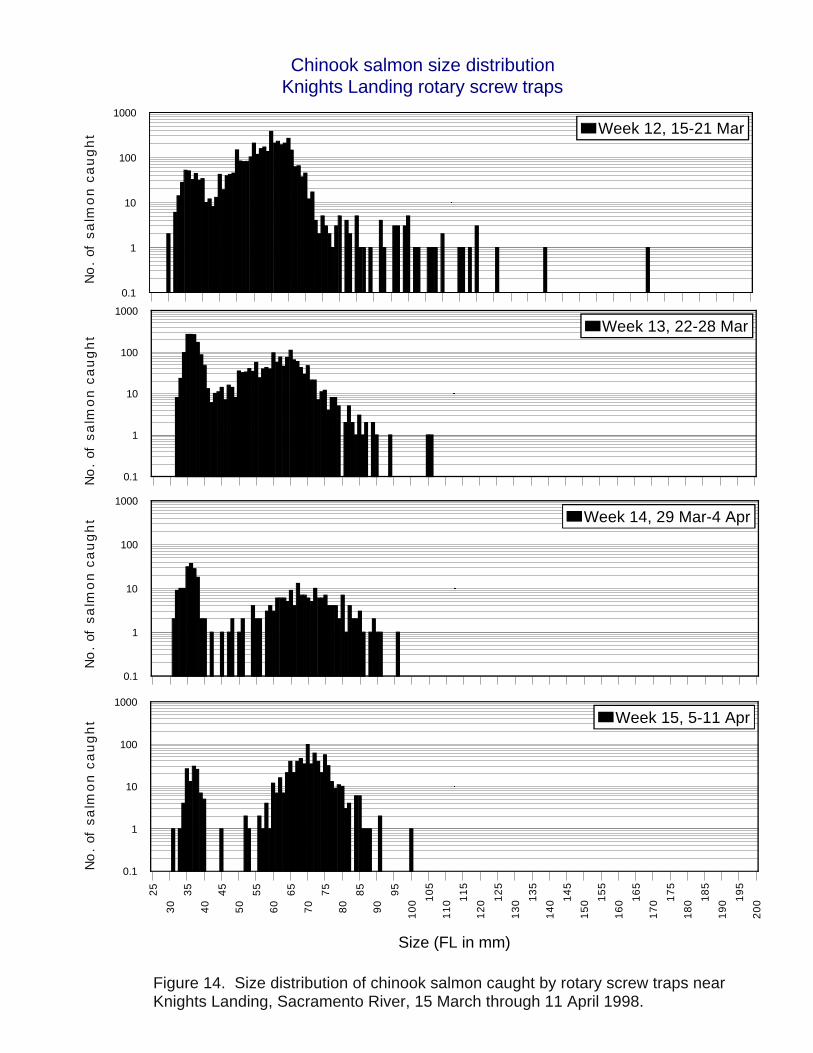
Figure 14. Size distribution of chinook salmon caught by rotary screw traps near Knights Landing, Sacramento River, 15 March through 11 April 1998.
25
30
35
40
45
50
55
60
65
70
75
80
85
90
95
10
0 10
5
11
0 11
5
12
0 12
5
13
0 13
5
14
0 14
5
15
0 15
5
16
0 16
5
17
0 17
5
18
0 18
5
19
0 19
5
20
0
Size (FL in mm)
0.1
1
10
100
1000
Week 15, 5-11 Apr
0.1
1
10
100
1000
Week 14, 29 Mar-4 Apr
0.1
1
10
100
1000
Week 13, 22-28 Mar
Chinook salmon size distributionKnights Landing rotary screw traps
0.1
1
10
100
1000
Week 12, 15-21 Mar
No
. of
sa
lmo
n c
au
gh
tN
o.
ofs
alm
on
ca
ug
ht
No
. of
sa
lmo
n c
au
gh
tN
o.
ofs
alm
on
ca
ug
ht
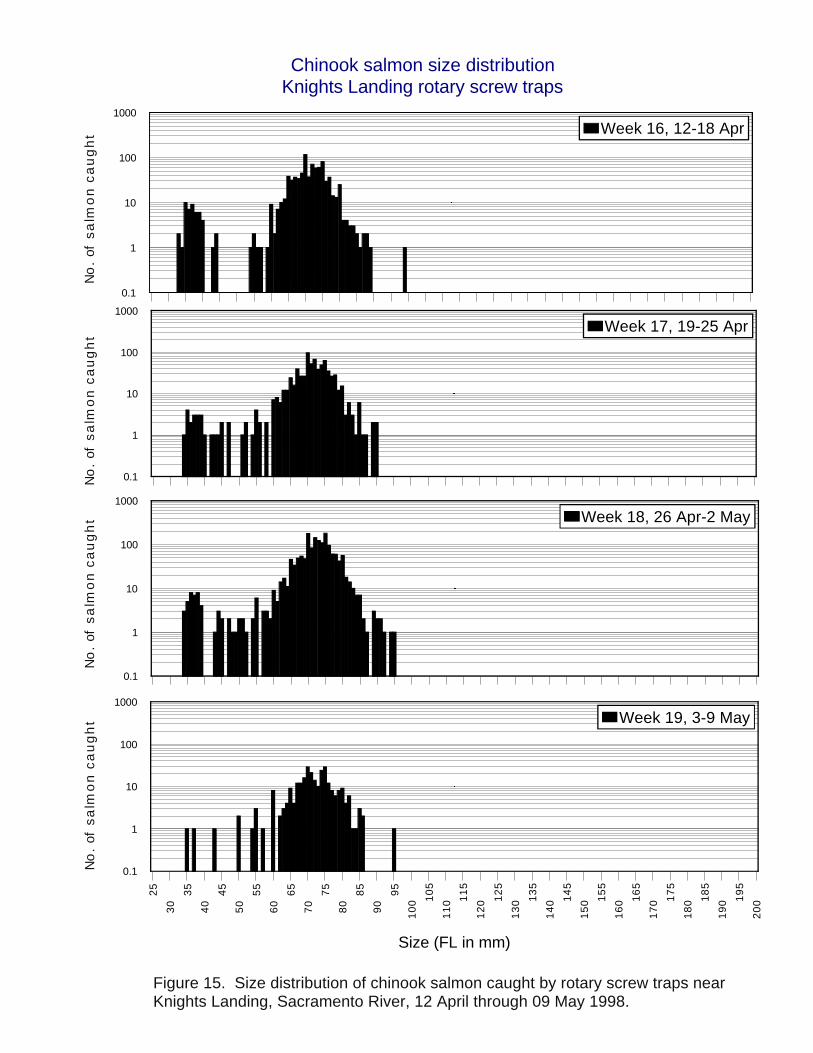
Figure 15. Size distribution of chinook salmon caught by rotary screw traps near Knights Landing, Sacramento River, 12 April through 09 May 1998.
25
30
35
40
45
50
55
60
65
70
75
80
85
90
95
10
0 10
5
11
0 11
5
12
0 12
5
13
0 13
5
14
0 14
5
15
0 15
5
16
0 16
5
17
0 17
5
18
0 18
5
19
0 19
5
20
0
Size (FL in mm)
0.1
1
10
100
1000
Week 19, 3-9 May
0.1
1
10
100
1000
Week 18, 26 Apr-2 May
0.1
1
10
100
1000
Week 17, 19-25 Apr
Chinook salmon size distributionKnights Landing rotary screw traps
0.1
1
10
100
1000
Week 16, 12-18 Apr
No
. of
sa
lmo
n c
au
gh
tN
o.
ofs
alm
on
ca
ug
ht
No
. of
sa
lmo
n c
au
gh
tN
o.
ofs
alm
on
ca
ug
ht
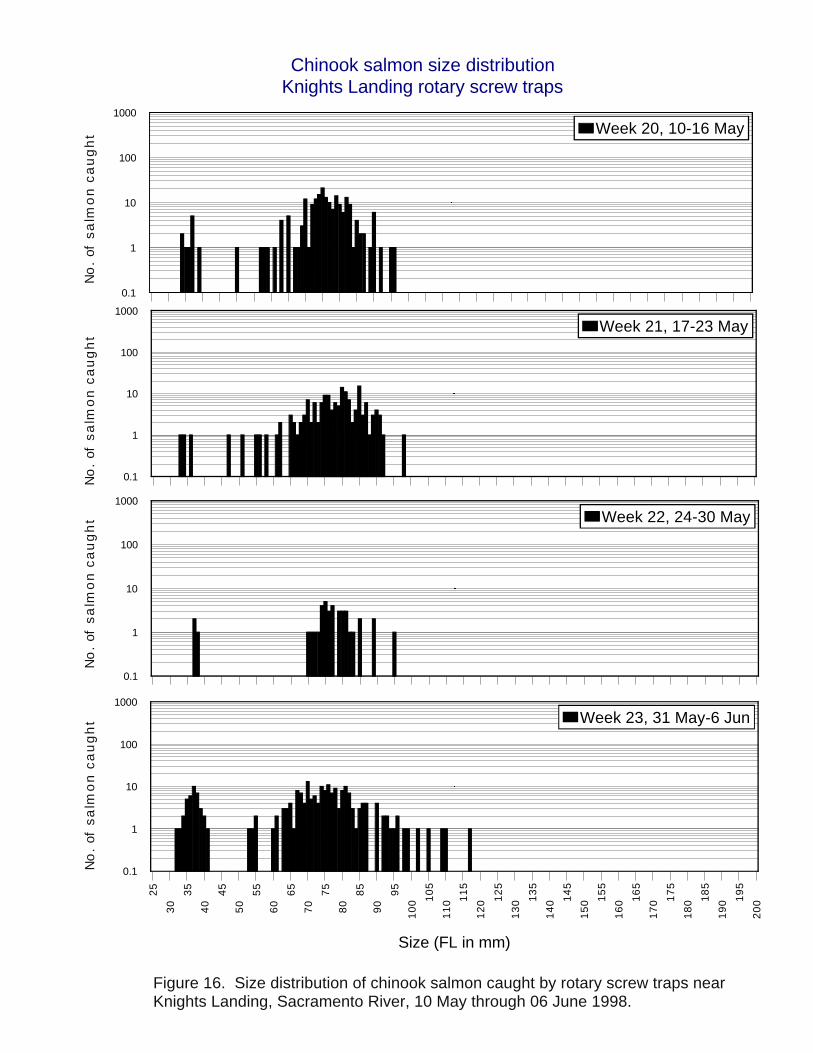
Figure 16. Size distribution of chinook salmon caught by rotary screw traps near Knights Landing, Sacramento River, 10 May through 06 June 1998.
25
30
35
40
45
50
55
60
65
70
75
80
85
90
95
10
0 10
5
11
0 11
5
12
0 12
5
13
0 13
5
14
0 14
5
15
0 15
5
16
0 16
5
17
0 17
5
18
0 18
5
19
0 19
5
20
0
Size (FL in mm)
0.1
1
10
100
1000
Week 23, 31 May-6 Jun
0.1
1
10
100
1000
Week 22, 24-30 May
0.1
1
10
100
1000
Week 21, 17-23 May
Chinook salmon size distributionKnights Landing rotary screw traps
0.1
1
10
100
1000
Week 20, 10-16 May
No
. of
sa
lmo
n c
au
gh
tN
o.
ofs
alm
on
ca
ug
ht
No
. of
sa
lmo
n c
au
gh
tN
o.
ofs
alm
on
ca
ug
ht
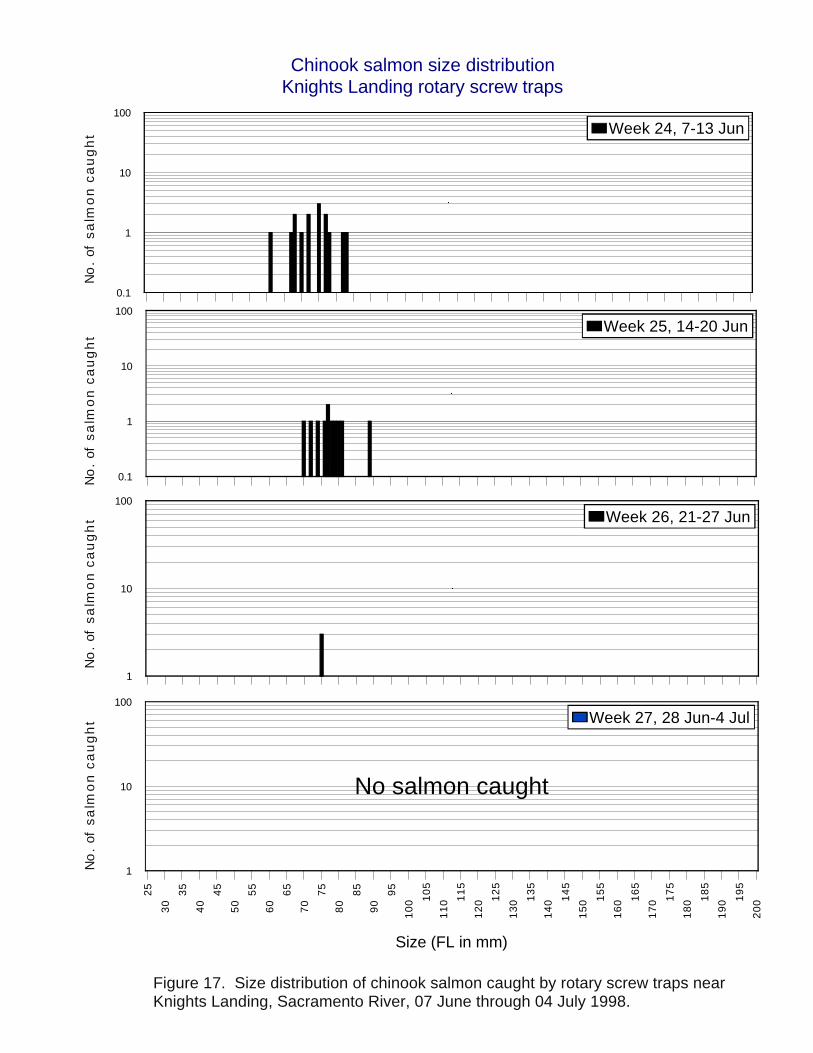
Figure 17. Size distribution of chinook salmon caught by rotary screw traps near Knights Landing, Sacramento River, 07 June through 04 July 1998.
25
30
35
40
45
50
55
60
65
70
75
80
85
90
95
10
0 10
5
11
0 11
5
12
0 12
5
13
0 13
5
14
0 14
5
15
0 15
5
16
0 16
5
17
0 17
5
18
0 18
5
19
0 19
5
20
0
Size (FL in mm)
1
10
100
Week 27, 28 Jun-4 Jul
1
10
100
Week 26, 21-27 Jun
0.1
1
10
100
Week 25, 14-20 Jun
Chinook salmon size distributionKnights Landing rotary screw traps
0.1
1
10
100
Week 24, 7-13 Jun
No salmon caught
No
. of
sa
lmo
n c
au
gh
tN
o.
ofs
alm
on
ca
ug
ht
No
. of
sa
lmo
n c
au
gh
tN
o.
ofs
alm
on
ca
ug
ht
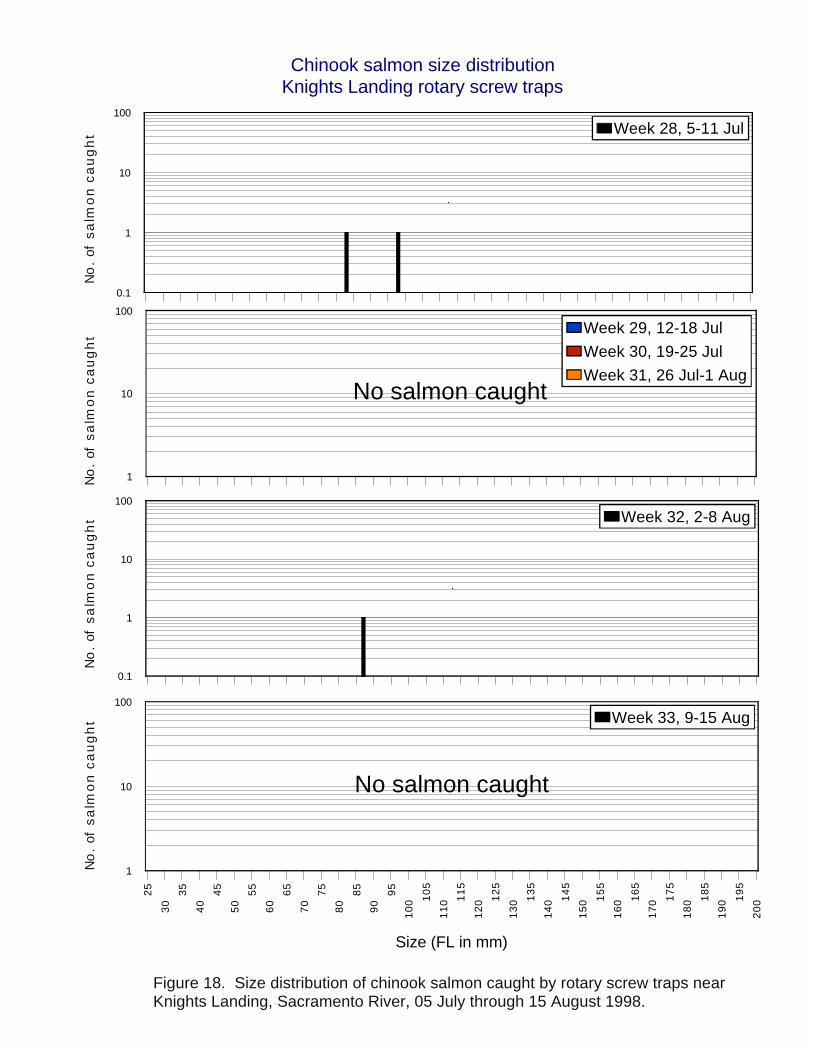
Figure 18. Size distribution of chinook salmon caught by rotary screw traps near Knights Landing, Sacramento River, 05 July through 15 August 1998.
25
30
35
40
45
50
55
60
65
70
75
80
85
90
95
10
0 10
5
11
0 11
5
12
0 12
5
13
0 13
5
14
0 14
5
15
0 15
5
16
0 16
5
17
0 17
5
18
0 18
5
19
0 19
5
20
0
Size (FL in mm)
1
10
100
Week 33, 9-15 Aug
0.1
1
10
100
Week 32, 2-8 Aug
1
10
100
Week 29, 12-18 Jul
Week 30, 19-25 Jul
Week 31, 26 Jul-1 Aug
Chinook salmon size distributionKnights Landing rotary screw traps
0.1
1
10
100
Week 28, 5-11 Jul
No salmon caught
No salmon caught
No
. of
sa
lmo
n c
au
gh
tN
o.
ofs
alm
on
ca
ug
ht
No
. of
sa
lmo
n c
au
gh
tN
o.
ofs
alm
on
ca
ug
ht
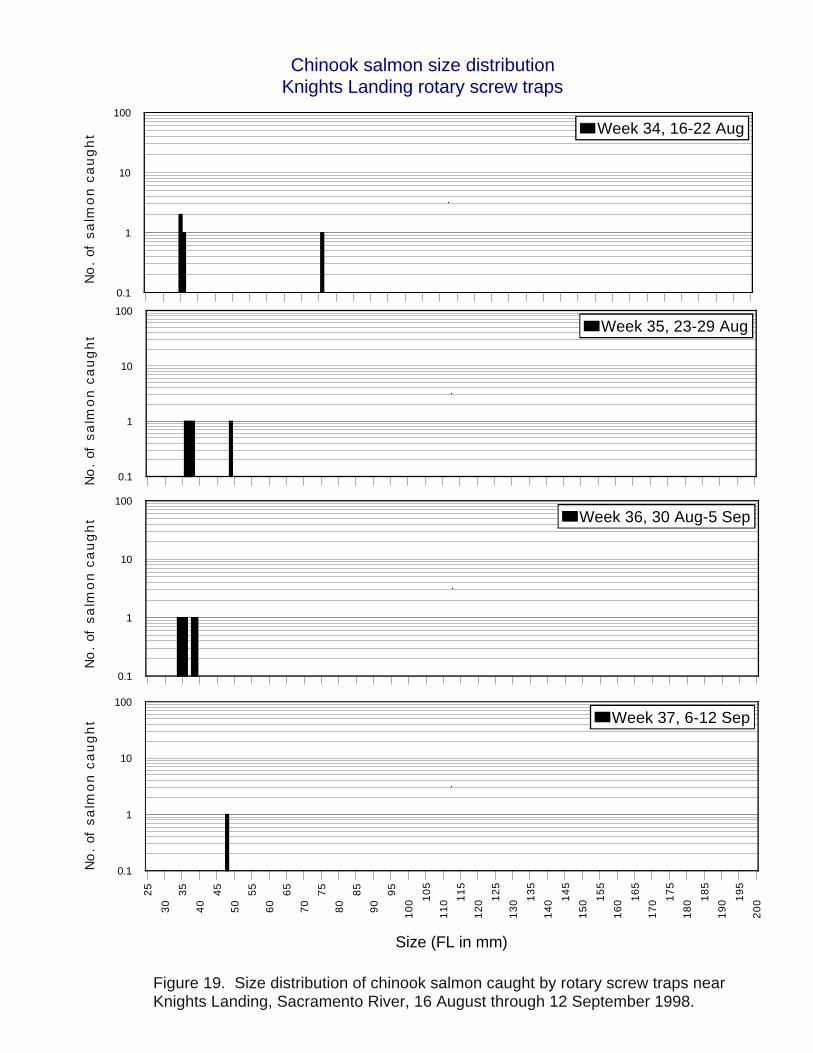
Figure 19. Size distribution of chinook salmon caught by rotary screw traps near Knights Landing, Sacramento River, 16 August through 12 September 1998.
25
30
35
40
45
50
55
60
65
70
75
80
85
90
95
10
0 10
5
11
0 11
5
12
0 12
5
13
0 13
5
14
0 14
5
15
0 15
5
16
0 16
5
17
0 17
5
18
0 18
5
19
0 19
5
20
0
Size (FL in mm)
0.1
1
10
100
Week 37, 6-12 Sep
0.1
1
10
100
Week 36, 30 Aug-5 Sep
0.1
1
10
100
Week 35, 23-29 Aug
Chinook salmon size distributionKnights Landing rotary screw traps
0.1
1
10
100
Week 34, 16-22 Aug
No
. of
sa
lmo
n c
au
gh
tN
o.
ofs
alm
on
ca
ug
ht
No
. of
sa
lmo
n c
au
gh
tN
o.
ofs
alm
on
ca
ug
ht

Figure 20. Size distribution of chinook salmon caught by rotary screw traps near Knights Landing, Sacramento River, 13 September through 03 October 1998.
25
30
35
40
45
50
55
60
65
70
75
80
85
90
95
10
0 10
5
11
0 11
5
12
0 12
5
13
0 13
5
14
0 14
5
15
0 15
5
16
0 16
5
17
0 17
5
18
0 18
5
19
0 19
5
20
0
Size (FL in mm)
0.1
1
10
100
Week 40, 27 Sep-3 Oct
0.1
1
10
100
Week 39, 20-26 Sep
Chinook salmon size distributionKnights Landing rotary screw traps
0.1
1
10
100
Week 38, 13-19 Sep
No
. of
sa
lmo
n c
au
gh
tN
o.
ofs
alm
on
ca
ug
ht
No
. of
sa
lmo
n c
au
gh
tN
o.
ofs
alm
on
ca
ug
ht
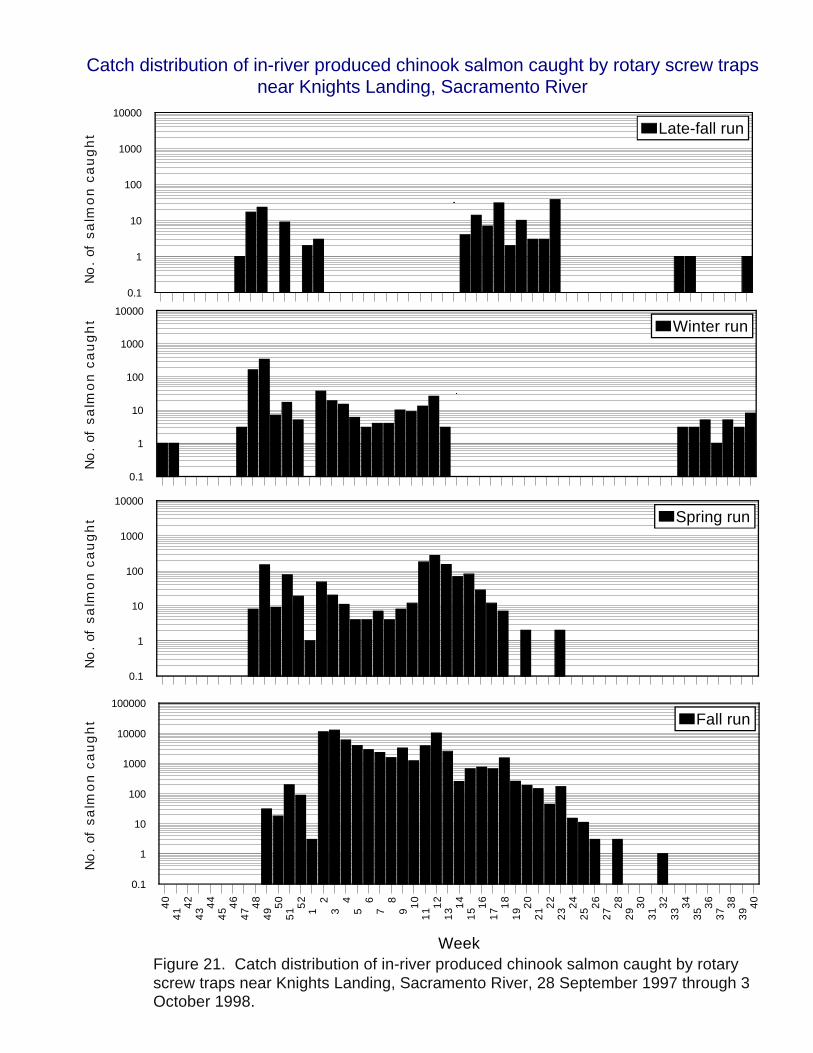
Figure 21. Catch distribution of in-river produced chinook salmon caught by rotary screw traps near Knights Landing, Sacramento River, 28 September 1997 through 3 October 1998.
40
41 4
24
3 44
45 4
64
7 48
49 5
05
1 52
12
34
56
78
9 10
11 1
21
3 14
15 1
61
7 18
19 2
02
1 22
23 2
42
5 26
27 2
82
9 30
31 3
23
3 34
35 3
63
7 38
39 4
0
Week
0.1
1
10
100
1000
10000
100000
Fall run
0.1
1
10
100
1000
10000
Spring run
0.1
1
10
100
1000
10000
Winter run
Catch distribution of in-river produced chinook salmon caught by rotary screw traps near Knights Landing, Sacramento River
0.1
1
10
100
1000
10000
Late-fall run
No
. of
sa
lmo
n c
au
gh
tN
o.
ofs
alm
on
ca
ug
ht
No
. of
sa
lmo
n c
au
gh
tN
o.
ofs
alm
on
ca
ug
ht

Figure 22. Catch distribution of adipose fin-clipped chinook salmon caught by rotary screw traps near Knights Landing, Sacramento River, 28 September 1997 through 03 October 1998.
40
41 4
24
3 44
45 4
64
7 48
49 5
05
1 52
12
34
56
78
9 10
11 1
21
3 14
15 1
61
7 18
19 2
02
1 22
23 2
42
5 26
27 2
82
9 30
31 3
23
3 34
35 3
63
7 38
39 4
0
Week
1
10
100
Fall run
1
10
100
Spring run
0.1
1
10
100
Winter run
Catch distribution of adipose fin-clipped chinook salmon caught by rotary screw traps near Knights Landing, Sacramento River
0.1
1
10
100
Late-fall run
No adipose fin-clipped spring run were captured
No
. of
sa
lmo
n c
au
gh
tN
o.
ofs
alm
on
ca
ug
ht
No
. of
sa
lmo
n c
au
gh
tN
o.
ofs
alm
on
ca
ug
ht
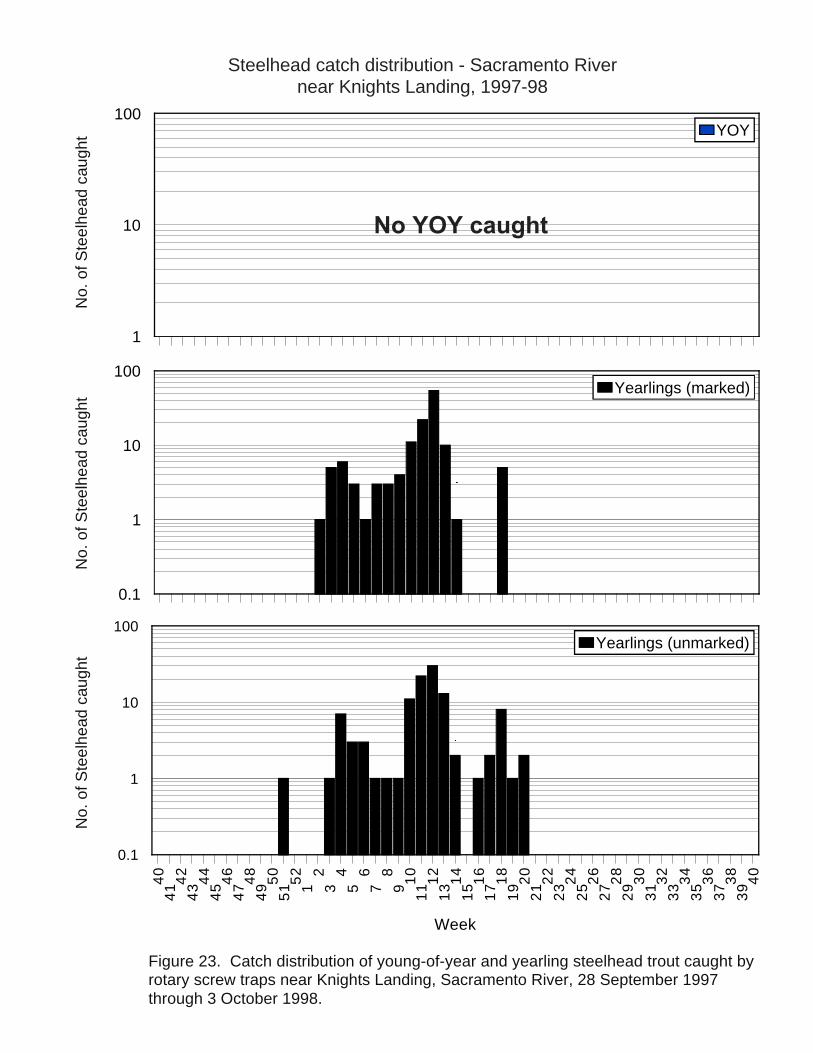
Figure 23. Catch distribution of young-of-year and yearling steelhead trout caught by rotary screw traps near Knights Landing, Sacramento River, 28 September 1997 through 3 October 1998.
Steelhead catch distribution - Sacramento Rivernear Knights Landing, 1997-98
1
10
100YOY
0.1
1
10
100Yearlings (marked)
40
41 4
24
3 44
45 4
64
7 48
49 5
05
1 52
12
34
56
78
9 10
11 1
21
3 14
15 1
61
7 18
19 2
02
1 22
23 2
42
5 26
27 2
82
9 30
31 3
23
3 34
35 3
63
7 38
39 4
0
Week
0.1
1
10
100Yearlings (unmarked)
No YOY caught
No
. o
f S
tee
lhe
ad
ca
ug
ht
No
. o
f S
tee
lhe
ad
ca
ug
ht
No
. o
f S
tee
lhe
ad
ca
ug
ht
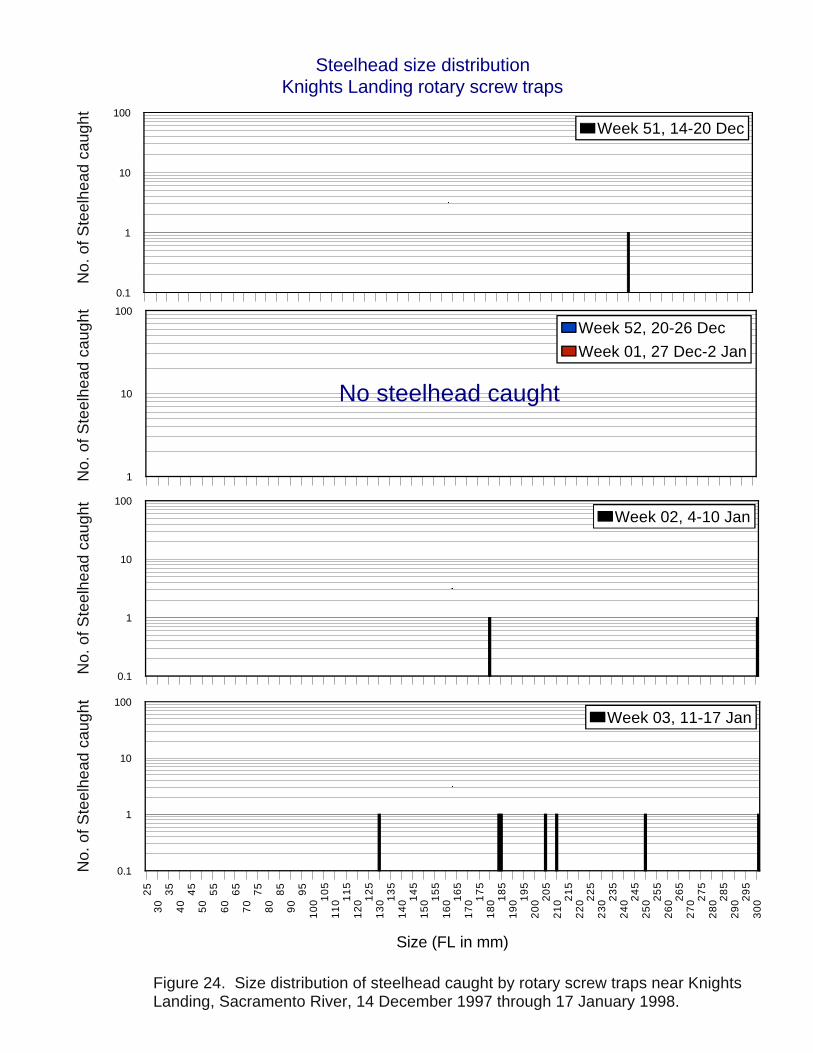
Figure 24. Size distribution of steelhead caught by rotary screw traps near Knights Landing, Sacramento River, 14 December 1997 through 17 January 1998.
25
30
35
40
45
50
55
60
65
70
75
80
85
90
95
10
0 10
51
10 1
15
12
0 12
51
30 1
35
14
0 14
51
50 1
55
16
0 16
51
70 1
75
18
0 18
51
90 1
95
20
0 20
52
10 2
15
22
0 22
52
30 2
35
24
0 24
52
50 2
55
26
0 26
52
70 2
75
28
0 28
52
90 2
95
30
0
Size (FL in mm)
0.1
1
10
100
Week 03, 11-17 Jan
0.1
1
10
100
Week 02, 4-10 Jan
1
10
100
Week 52, 20-26 Dec
Week 01, 27 Dec-2 Jan
Steelhead size distributionKnights Landing rotary screw traps
0.1
1
10
100
Week 51, 14-20 Dec
No steelhead caught
No
. o
f S
tee
lhe
ad
ca
ug
ht
No
. o
f S
tee
lhe
ad
ca
ug
ht
No
. o
f S
tee
lhe
ad
ca
ug
ht
No
. o
f S
tee
lhe
ad
ca
ug
ht

Figure 25. Size distribution of steelhead caught by rotary screw traps near Knights Landing, Sacramento River, 18 January through 14 February 1998.
25
30
35
40
45
50
55
60
65
70
75
80
85
90
95
10
0 10
51
10 1
15
12
0 12
51
30 1
35
14
0 14
51
50 1
55
16
0 16
51
70 1
75
18
0 18
51
90 1
95
20
0 20
52
10 2
15
22
0 22
52
30 2
35
24
0 24
52
50 2
55
26
0 26
52
70 2
75
28
0 28
52
90 2
95
30
0
Size (FL in mm)
0.1
1
10
100
Week 07, 8-14 Feb
0.1
1
10
100
Week 06, 1-7 Feb
0.1
1
10
100
Week 05, 25-31 Jan
Steelhead size distributionKnights Landing rotary screw traps
0.1
1
10
100
Week 04, 18-24 Jan
No
. o
f S
tee
lhe
ad
ca
ug
ht
No
. o
f S
tee
lhe
ad
ca
ug
ht
No
. o
f S
tee
lhe
ad
ca
ug
ht
No
. o
f S
tee
lhe
ad
ca
ug
ht

Figure 26. Size distribution of steelhead caught by rotary screw traps near Knights Landing, Sacramento River, 15 February through 14 March 1998.
25
30
35
40
45
50
55
60
65
70
75
80
85
90
95
10
0 10
51
10 1
15
12
0 12
51
30 1
35
14
0 14
51
50 1
55
16
0 16
51
70 1
75
18
0 18
51
90 1
95
20
0 20
52
10 2
15
22
0 22
52
30 2
35
24
0 24
52
50 2
55
26
0 26
52
70 2
75
28
0 28
52
90 2
95
30
0
Size (FL in mm)
0.1
1
10
100
Week 11, 8-14 Mar
0.1
1
10
100
Week 10, 1-7 Mar
0.1
1
10
100
Week 09, 22-28 Feb
Steelhead size distributionKnights Landing rotary screw traps
0.1
1
10
100
Week 08, 15-21 Feb
No
. o
f S
tee
lhe
ad
ca
ug
ht
No
. o
f S
tee
lhe
ad
ca
ug
ht
No
. o
f S
tee
lhe
ad
ca
ug
ht
No
. o
f S
tee
lhe
ad
ca
ug
ht

Figure 27. Size distribution of steelhead caught by rotary screw traps near Knights Landing, Sacramento River, 15 March through 11 April 1998.
25
30
35
40
45
50
55
60
65
70
75
80
85
90
95
10
0 10
51
10 1
15
12
0 12
51
30 1
35
14
0 14
51
50 1
55
16
0 16
51
70 1
75
18
0 18
51
90 1
95
20
0 20
52
10 2
15
22
0 22
52
30 2
35
24
0 24
52
50 2
55
26
0 26
52
70 2
75
28
0 28
52
90 2
95
30
0
Size (FL in mm)
1
10
100
Week 15, 5-11 Apr
0.1
1
10
100
Week 14, 29 Mar-4 Apr
0.1
1
10
100
Week 13, 22-28 Mar
Steelhead size distributionKnights Landing rotary screw traps
0.1
1
10
100
Week 12, 15-21 Mar
No steelhead caught
No
. o
f S
tee
lhe
ad
ca
ug
ht
No
. o
f S
tee
lhe
ad
ca
ug
ht
No
. o
f S
tee
lhe
ad
ca
ug
ht
No
. o
f S
tee
lhe
ad
ca
ug
ht
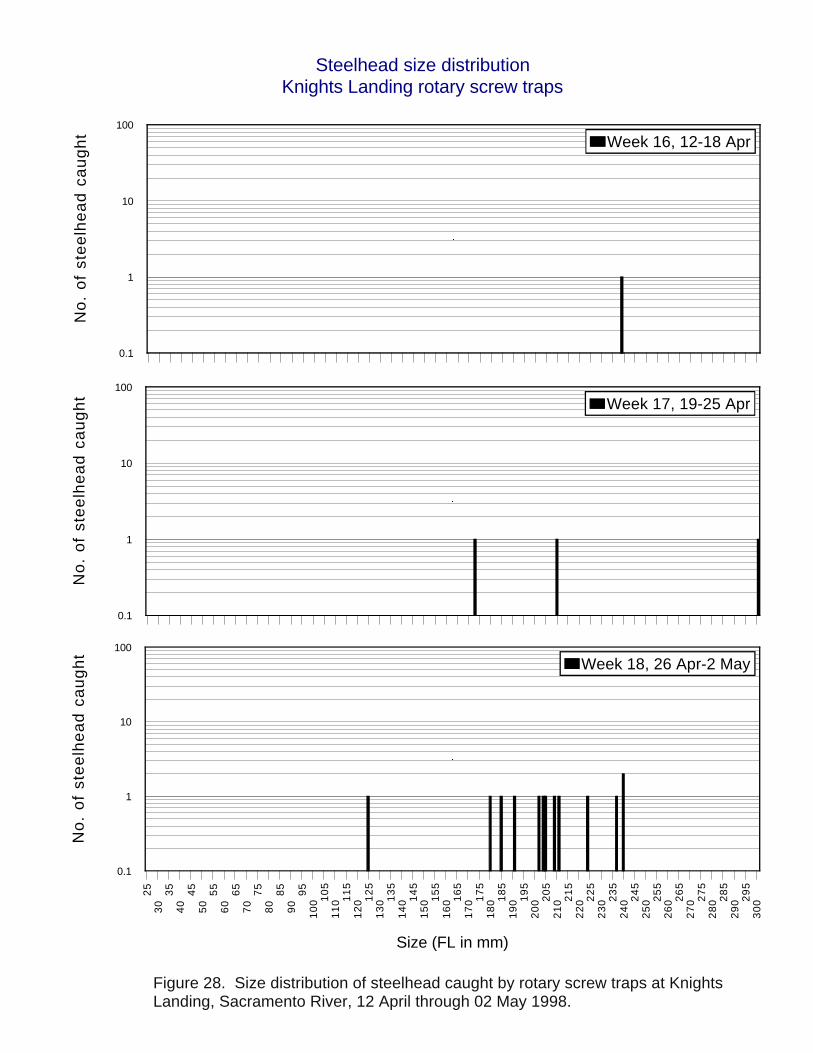
Figure 28. Size distribution of steelhead caught by rotary screw traps at Knights Landing, Sacramento River, 12 April through 02 May 1998.
25
30
35
40
45
50
55
60
65
70
75
80
85
90
95
10
0 10
51
10 1
15
12
0 12
51
30 1
35
14
0 14
51
50 1
55
16
0 16
51
70 1
75
18
0 18
51
90 1
95
20
0 20
52
10 2
15
22
0 22
52
30 2
35
24
0 24
52
50 2
55
26
0 26
52
70 2
75
28
0 28
52
90 2
95
30
0
Size (FL in mm)
0.1
1
10
100
No
. o
f st
ee
lhe
ad
ca
ug
ht
Week 18, 26 Apr-2 May
0.1
1
10
100
No
. o
f st
ee
lhe
ad
ca
ug
ht Week 17, 19-25 Apr
Steelhead size distributionKnights Landing rotary screw traps
0.1
1
10
100
No
. o
f st
ee
lhe
ad
ca
ug
ht Week 16, 12-18 Apr
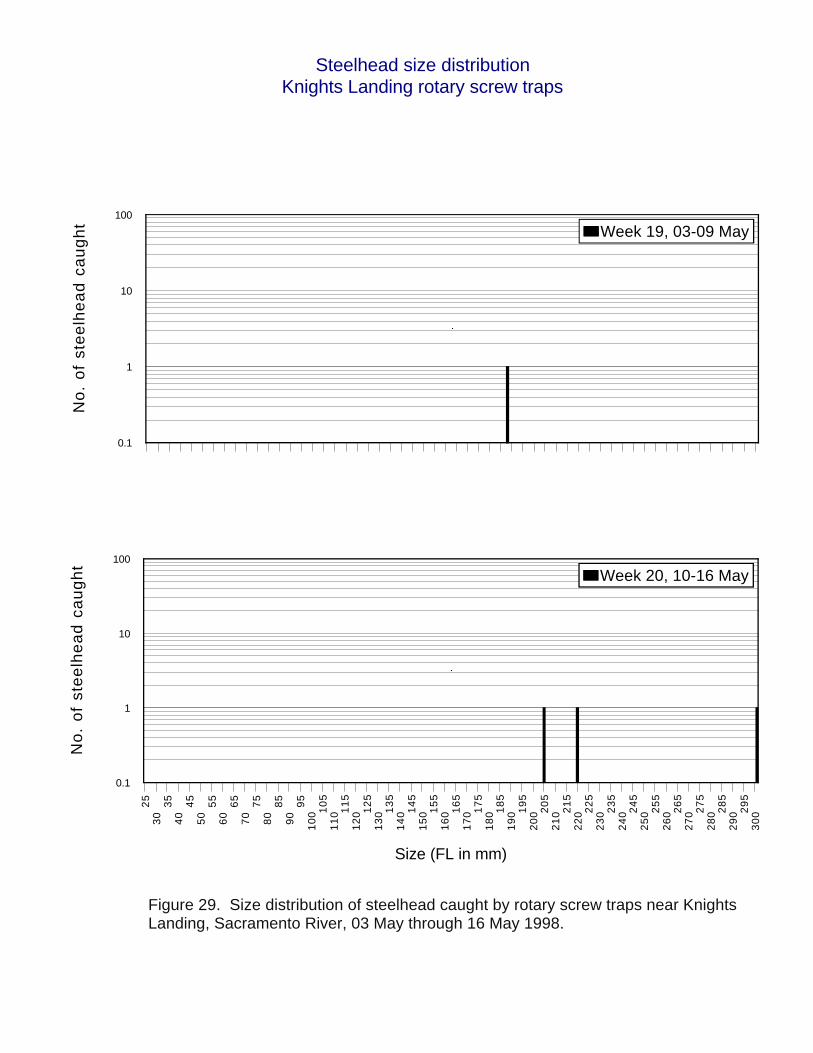
Figure 29. Size distribution of steelhead caught by rotary screw traps near Knights Landing, Sacramento River, 03 May through 16 May 1998.
25
30
35
40
45
50
55
60
65
70
75
80
85
90
95
10
0 10
51
10 1
15
12
0 12
51
30 1
35
14
0 14
51
50 1
55
16
0 16
51
70 1
75
18
0 18
51
90 1
95
20
0 20
52
10 2
15
22
0 22
52
30 2
35
24
0 24
52
50 2
55
26
0 26
52
70 2
75
28
0 28
52
90 2
95
30
0
Size (FL in mm)
0.1
1
10
100
No
. o
f st
ee
lhe
ad
ca
ug
ht
Week 20, 10-16 May
Steelhead size distributionKnights Landing rotary screw traps
0.1
1
10
100
No
. o
f st
ee
lhe
ad
ca
ug
ht Week 19, 03-09 May

APPENDIX

Comparison of water transparency and flow
Appendix Figure 1. Comparison of water transparency (ln of Secchi disk depth) versus flow measured on the Sacramento River near Knights Landing, 28 September 1997 - 3 October 1998.
+
+
+
+
+
+++
+
++
+
+
+
+
++
+
+
+
++
++
+
++
+
+
+++
+++++
+
+
+
+
+
+++
+
+
++
+
++
+
0 5,000 10,000 15,000 20,000 25,000 30,000 35,000
0
0.5
1
1.5
-0.5
-1
-1.5
Tra
nsp
are
ncy
(ln
)

Appendix Figure 2. Size distribution of chinook salmon collected in the Sacramento River near Knights Landing compared with size distribution of Coleman NFH salmon released during week 10 (4 - 6 March 1998).
25
30
35
40
45
50
55
60
65
70
75
80
85
90
95
10
0 10
5
11
0 11
5
12
0 12
5
13
0 13
5
14
0 14
5
15
0 15
5
16
0 16
5
17
0 17
5
18
0 18
5
19
0 19
5
20
0
Size (FL in mm)
0.1
1
10
100
1000
No
. o
f ch
ino
ok
salm
on
Hatchery Week 13
0.1
1
10
100
1000
No
. o
f ch
ino
ok
salm
on
Hatchery Week 12
0.1
1
10
100
1000
No
. o
f ch
ino
ok
salm
on
Hatchery Week 11
Size distribution of chinook salmon collected at Knights Landingversus salmon released from Coleman NFH
0.1
1
10
100
1000
No
. o
f ch
ino
ok
salm
on
Hatchery Week 10
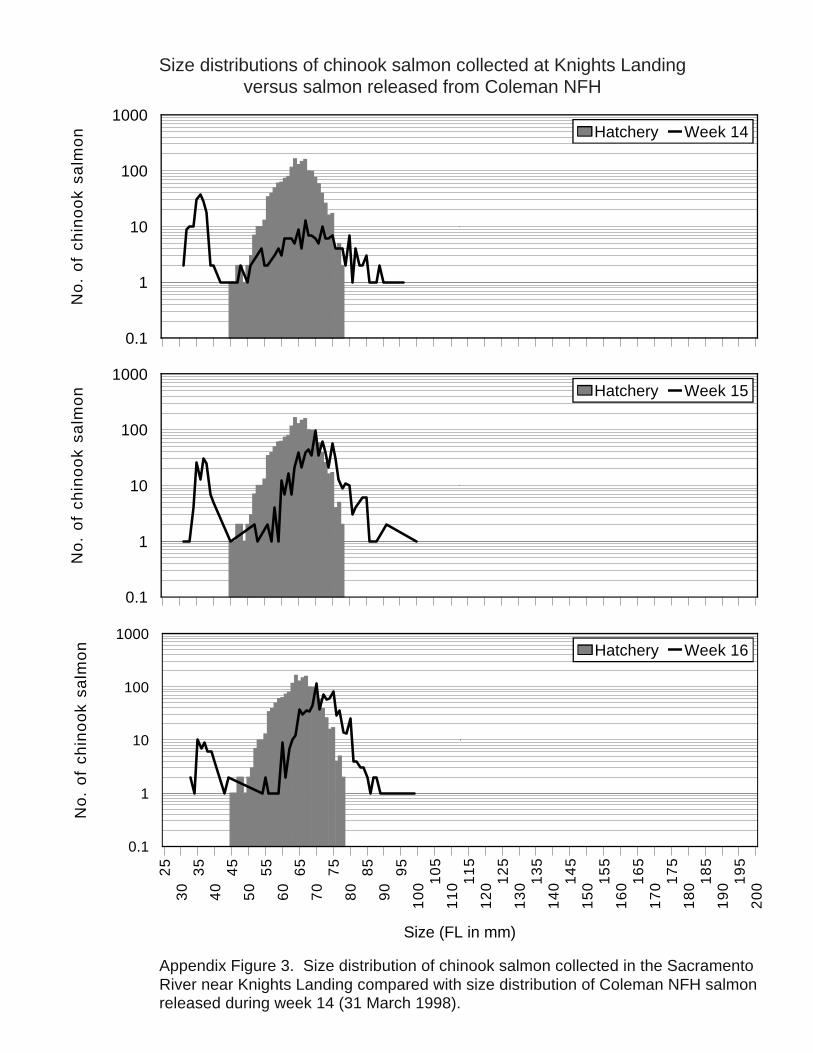
Appendix Figure 3. Size distribution of chinook salmon collected in the Sacramento River near Knights Landing compared with size distribution of Coleman NFH salmon released during week 14 (31 March 1998).
Size distributions of chinook salmon collected at Knights Landingversus salmon released from Coleman NFH
0.1
1
10
100
1000
No
. o
f ch
ino
ok
salm
on Hatchery Week 14
0.1
1
10
100
1000
No
. o
f ch
ino
ok
salm
on Hatchery Week 15
25
30
35
40
45
50
55
60
65
70
75
80
85
90
95
10
0 10
51
10 1
15
12
0 12
51
30 1
35
14
0 14
51
50 1
55
16
0 16
51
70 1
75
18
0 18
51
90 1
95
20
0
Size (FL in mm)
0.1
1
10
100
1000
No
. o
f ch
ino
ok
salm
on Hatchery Week 16
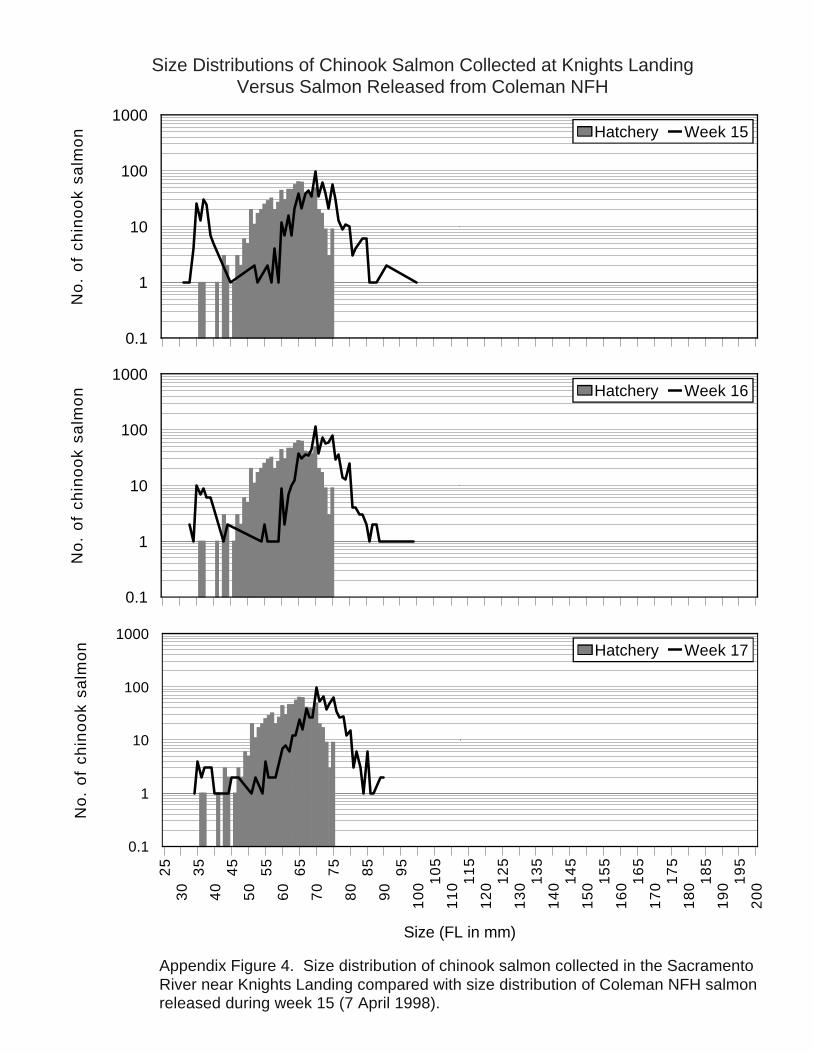
Appendix Figure 4. Size distribution of chinook salmon collected in the Sacramento River near Knights Landing compared with size distribution of Coleman NFH salmon released during week 15 (7 April 1998).
Size Distributions of Chinook Salmon Collected at Knights LandingVersus Salmon Released from Coleman NFH
0.1
1
10
100
1000
No
. o
f ch
ino
ok
salm
on Hatchery Week 15
0.1
1
10
100
1000
No
. o
f ch
ino
ok
salm
on Hatchery Week 16
25
30
35
40
45
50
55
60
65
70
75
80
85
90
95
10
0 10
51
10 1
15
12
0 12
51
30 1
35
14
0 14
51
50 1
55
16
0 16
51
70 1
75
18
0 18
51
90 1
95
20
0
Size (FL in mm)
0.1
1
10
100
1000
No
. o
f ch
ino
ok
salm
on Hatchery Week 17
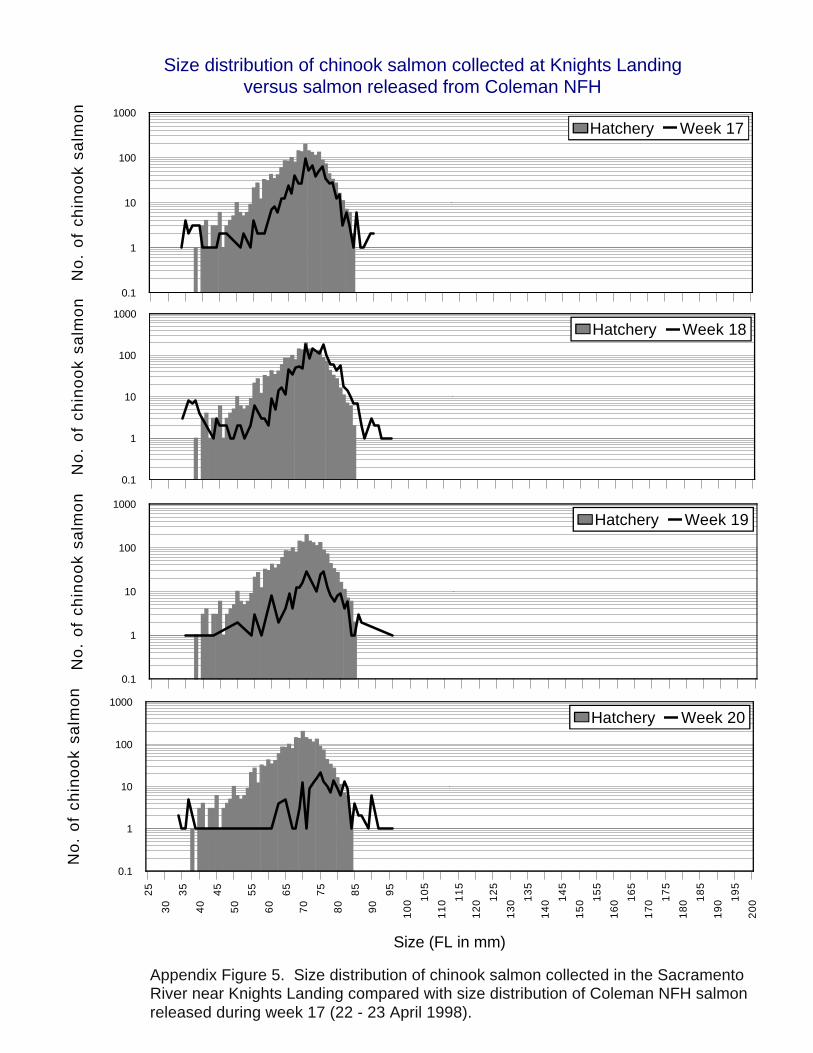
Appendix Figure 5. Size distribution of chinook salmon collected in the Sacramento River near Knights Landing compared with size distribution of Coleman NFH salmon released during week 17 (22 - 23 April 1998).
25
30
35
40
45
50
55
60
65
70
75
80
85
90
95
10
0 10
5
11
0 11
5
12
0 12
5
13
0 13
5
14
0 14
5
15
0 15
5
16
0 16
5
17
0 17
5
18
0 18
5
19
0 19
5
20
0
Size (FL in mm)
0.1
1
10
100
1000
No
. o
f ch
ino
ok
salm
on
Hatchery Week 20
0.1
1
10
100
1000
No
. o
f ch
ino
ok
salm
on
Hatchery Week 19
0.1
1
10
100
1000
No
. o
f ch
ino
ok
salm
on
Hatchery Week 18
Size distribution of chinook salmon collected at Knights Landingversus salmon released from Coleman NFH
0.1
1
10
100
1000
No
. o
f ch
ino
ok
salm
on
Hatchery Week 17